
The Shifting Geopolitics of Internet Access - Centre for ...
136
Research Volume Six Global Commission on Internet Governance The Shifting Geopolitics of Internet Access From Broadband and Net Neutrality to Zero-rating
-
Upload
khangminh22 -
Category
Documents
-
view
2 -
download
0
Transcript of The Shifting Geopolitics of Internet Access - Centre for ...
Research Volume Six
Global Commission on Internet Governance
The Shifting Geopolitics of Internet Access From Broadband and Net Neutrality to Zero-rating
67 Erb Street West Waterloo, Ontario N2L 6C2, Canada tel +1 519 885 2444 fax +1 519 885 5450 www.cigionline.org
10 St James’s Square London, England SW1Y 4LE United Kingdom tel +44 (0)20 7957 5700 fax +44 (0)20 7957 5710 www.chathamhouse.org
Research Volume Six The Shifting Geopolitics of Internet Access: From
Broadband and Net Neutrality to Zero-rating

Research Volume Six
Global Commission on Internet Governance
The Shifting Geopolitics of Internet Access From Broadband and Net Neutrality to Zero-rating

Published by the Centre for International Governance Innovation and the Royal Institute of International Affairs
The copyright in respect of each chapter is noted at the beginning of each chapter.
The opinions expressed in this publication are those of the authors and do not necessarily re�ect the views of the Centre for International Governance Innovation or its Board of Directors.
This work was carried out with the aid of a grant from the International Development Research Centre (IDRC), Ottawa, Canada.
The views expressed herein do not necessarily represent those of IDRC or its Board of Governors.
This work is licensed under a Creative Commons Attribution — Non-commercial — No Derivatives License. To view this licence, visit (www.creativecommons.org/licenses/ by-nc-nd/3.0/). For re-use or distribution, please include this copyright notice.
Centre for International Governance Innovation, CIGI and the CIGI globe are registered trademarks.
67 Erb Street West Waterloo, Ontario N2L 6C2 Canada tel +1 519 885 2444 fax +1 519 885 5450 www.cigionline.org
10 St James’s Square London, England SW1Y 4LE United Kingdom tel +44 (0)20 7957 5700 fax +44 (0)20 7957 5710 www.chathamhouse.org
TABLE OF CONTENTS
About the Global Commission on Internet Governance . . . . . . . . . . . . . . . . . . . . . . . . . . . . . . iv
Preface . . . . . . . . . . . . . . . . . . . . . . . . . . . . . . . . . . . . . . . . . . . . . . . . . . . . . vCarl Bildt
Introduction: The Shifting Geopolitics of Internet Access . . . . . . . . . . . . . . . . . . . . . . . . . . . . . . 1Laura DeNardis
Chapter One: How to Connect the Other Half: Evidence and Policy Insights from Household Surveys in Latin America . . . . . . . . . . . . . . . . . . . . . . . . . . . . . . . . . . . . . . . . . . . . . . . . 5Hernán Galperin
Chapter Two: Beyond Access: Addressing Digital Inequality in Africa . . . . . . . . . . . . . . . . . . . . . 37Alison Gillwald
Chapter Three: Unlocking Affordable Access in Sub-Saharan Africa . . . . . . . . . . . . . . . . . . . . . . . 55Steve Song
Chapter Four: Net Neutrality: Re�ections on the Current Debate . . . . . . . . . . . . . . . . . . . . . . . . . 61Pablo Bello and Juan Jung
Chapter Five: Landmark EU and US Net Neutrality Decisions: How Might Pending Decisions Impact Internet Fragmentation? . . . . . . . . . . . . . . . . . . . . . . . . . . . . . . . . . . . . . . . . . . . . 73Ben Scott, Stefan Heumann and Jan-Peter Kleinhans
Chapter Six: Zero-rating in Emerging Economies . . . . . . . . . . . . . . . . . . . . . . . . . . . . . . . . 87Helani Galpaya
Chapter Seven: Tipping the Scale: An Analysis of Global Swing States in the Internet Governance Debate . . . . .103Tim Maurer and Robert Morgus
About CIGI. . . . . . . . . . . . . . . . . . . . . . . . . . . . . . . . . . . . . . . . . . . . . . . . . .128
About Chatham House . . . . . . . . . . . . . . . . . . . . . . . . . . . . . . . . . . . . . . . . . . . .128
CIGI Masthead . . . . . . . . . . . . . . . . . . . . . . . . . . . . . . . . . . . . . . . . . . . . . . . .128
IV
ABOUT THE GLOBAL COMMISSION ON INTERNET GOVERNANCEThe Global Commission on Internet Governance was established in January 2014 to articulate and advance a strategic vision for the future of Internet governance. The two-year project conducted and supported independent research on Internet-related dimensions of global public policy, culminating in an of�cial commission report — One Internet, published in June 2016 — that articulated concrete policy recommendations for the future of Internet governance. These recommendations address concerns about the stability, interoperability, security and resilience of the Internet ecosystem.
Launched by two independent global think tanks, the Centre for International Governance Innovation (CIGI) and Chatham House, the Global Commission on Internet Governance will help educate the wider public on the most effective ways to promote Internet access, while simultaneously championing the principles of freedom of expression and the free �ow of ideas over the Internet.
The Global Commission on Internet Governance focuses on four key themes:
• enhancing governance legitimacy — including regulatory approaches and standards;
• stimulating economic innovation and growth — including critical Internet resources, infrastructure and competition policy;
• ensuring human rights online — including establishing the principle of technological neutrality for human rights, privacy and free expression; and
• avoiding systemic risk — including establishing norms regarding state conduct, cybercrime cooperation and non-proliferation, con�dence-building measures and disarmament issues.
The goal of the Global Commission on Internet Governance is two-fold. First, it will encourage globally inclusive public discussions on the future of Internet governance. Second, through its comprehensive policy-oriented report, and the subsequent promotion of this �nal report, the Global Commission on Internet Governance will communicate its �ndings with senior stakeholders at key Internet governance events.
www.ourinternet.org

V
PREFACEWhen I and my colleagues at the Centre for International Governance Innovation and Chatham House envisioned and launched the Global Commission on Internet Governance (GCIG) in 2014, we were determined to approach the work ahead strictly on the strength of evidence-based research. To make this possible, we commissioned nearly 50 research papers, which are now published online. We believe that this body of work represents the largest set of research materials on Internet governance to be currently available from any one source. We also believe that these materials, while they were essential to the GCIG’s discussions over these past months, will also be invaluable to policy development for many years to come.
The GCIG was fortunate to have Professor Laura DeNardis as its director of research, who, along with Eric Jardine and Samantha Bradshaw at CIGI, collaborated on identifying and commissioning authors, arranging for peer review and guiding the papers through the publication process.
Questions about the governance of the Internet will be with us long into the future. The papers now collected in these volumes aim to be forward looking and to have continuing relevance as the issues they examine evolve. Nothing would please me and my fellow Commissioners more than to receive comments and suggestions from other experts in the �eld whose own research has been stimulated by these volumes.
The chapters you are about to read were written for non-expert netizens as well as for subject experts. To all of you, the message I bring from all of us involved with the GCIG is simple — be engaged. If we fail to engage with these key governance questions, we risk a future for our Internet that is disturbingly distant from the one we want.
Carl Bildt
Chair, GCIG
November 2016


INTRODUCTION: THE SHIFTING GEOPOLITICS OF INTERNET ACCESS
LAURA DENARDIS • 1
INTRODUCTION:THE SHIFTING GEOPOLITICS OF INTERNET ACCESS
Laura DeNardis
Copyright © 2017 by Laura DeNardis
RESEARCH VOLUME SIX: THE SHIFTING GEOPOLITICS OF INTERNET ACCESS
2 • CENTRE FOR INTERNATIONAL GOVERNANCE INNOVATION • CHATHAM HOUSE
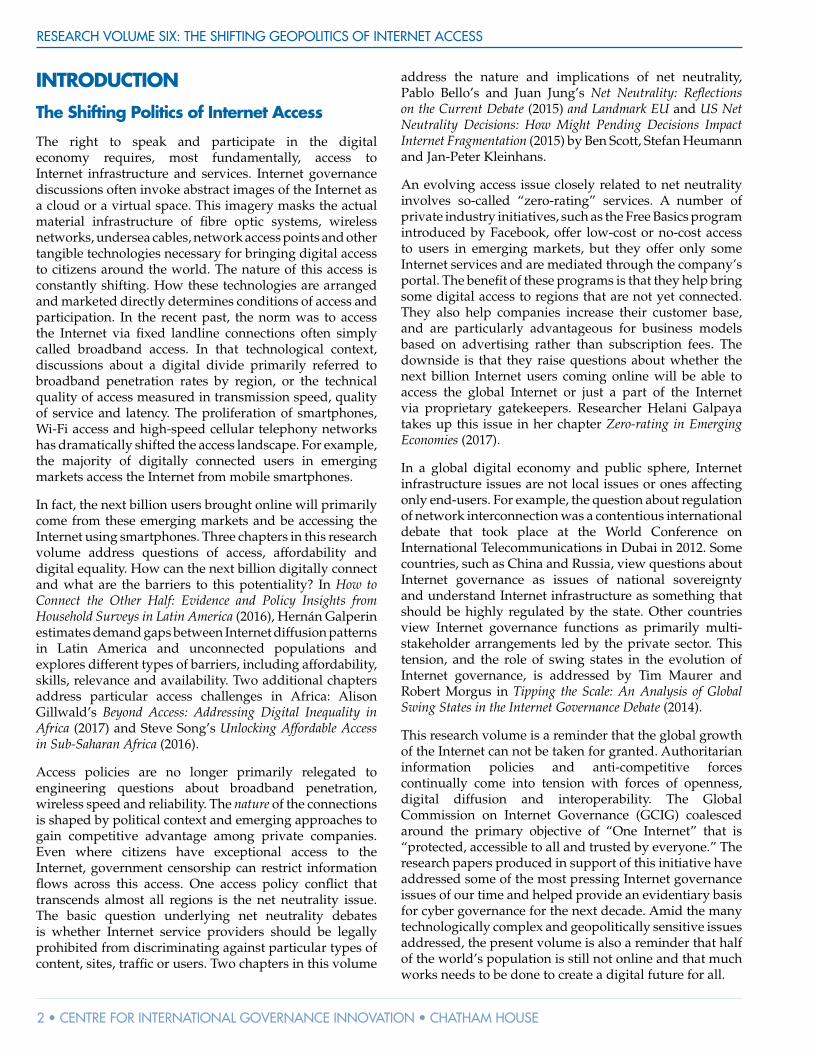
INTRODUCTION
The Shifting Politics of Internet Access
The right to speak and participate in the digital economy requires, most fundamentally, access to Internet infrastructure and services. Internet governance discussions often invoke abstract images of the Internet as a cloud or a virtual space. This imagery masks the actual material infrastructure of �bre optic systems, wireless networks, undersea cables, network access points and other tangible technologies necessary for bringing digital access to citizens around the world. The nature of this access is constantly shifting. How these technologies are arranged and marketed directly determines conditions of access and participation. In the recent past, the norm was to access the Internet via �xed landline connections often simply called broadband access. In that technological context, discussions about a digital divide primarily referred to broadband penetration rates by region, or the technical quality of access measured in transmission speed, quality of service and latency. The proliferation of smartphones, Wi-Fi access and high-speed cellular telephony networks has dramatically shifted the access landscape. For example, the majority of digitally connected users in emerging markets access the Internet from mobile smartphones.
In fact, the next billion users brought online will primarily come from these emerging markets and be accessing the Internet using smartphones. Three chapters in this research volume address questions of access, affordability and digital equality. How can the next billion digitally connect and what are the barriers to this potentiality? In How to Connect the Other Half: Evidence and Policy Insights from Household Surveys in Latin America (2016), Hernán Galperin estimates demand gaps between Internet diffusion patterns in Latin America and unconnected populations and explores different types of barriers, including affordability, skills, relevance and availability. Two additional chapters address particular access challenges in Africa: Alison Gillwald’s Beyond Access: Addressing Digital Inequality in Africa (2017) and Steve Song’s Unlocking Affordable Access in Sub-Saharan Africa (2016).
Access policies are no longer primarily relegated to engineering questions about broadband penetration, wireless speed and reliability. The nature of the connections is shaped by political context and emerging approaches to gain competitive advantage among private companies. Even where citizens have exceptional access to the Internet, government censorship can restrict information �ows across this access. One access policy con�ict that transcends almost all regions is the net neutrality issue. The basic question underlying net neutrality debates is whether Internet service providers should be legally prohibited from discriminating against particular types of content, sites, traf�c or users. Two chapters in this volume
address the nature and implications of net neutrality, Pablo Bello’s and Juan Jung’s Net Neutrality: Re�ections on the Current Debate (2015) and Landmark EU and US Net Neutrality Decisions: How Might Pending Decisions Impact Internet Fragmentation (2015) by Ben Scott, Stefan Heumann and Jan-Peter Kleinhans.
An evolving access issue closely related to net neutrality involves so-called “zero-rating” services. A number of private industry initiatives, such as the Free Basics program introduced by Facebook, offer low-cost or no-cost access to users in emerging markets, but they offer only some Internet services and are mediated through the company’s portal. The bene�t of these programs is that they help bring some digital access to regions that are not yet connected. They also help companies increase their customer base, and are particularly advantageous for business models based on advertising rather than subscription fees. The downside is that they raise questions about whether the next billion Internet users coming online will be able to access the global Internet or just a part of the Internet via proprietary gatekeepers. Researcher Helani Galpaya takes up this issue in her chapter Zero-rating in Emerging Economies (2017).
In a global digital economy and public sphere, Internet infrastructure issues are not local issues or ones affecting only end-users. For example, the question about regulation of network interconnection was a contentious international debate that took place at the World Conference on International Telecommunications in Dubai in 2012. Some countries, such as China and Russia, view questions about Internet governance as issues of national sovereignty and understand Internet infrastructure as something that should be highly regulated by the state. Other countries view Internet governance functions as primarily multi-stakeholder arrangements led by the private sector. This tension, and the role of swing states in the evolution of Internet governance, is addressed by Tim Maurer and Robert Morgus in Tipping the Scale: An Analysis of Global Swing States in the Internet Governance Debate (2014).
This research volume is a reminder that the global growth of the Internet can not be taken for granted. Authoritarian information policies and anti-competitive forces continually come into tension with forces of openness, digital diffusion and interoperability. The Global Commission on Internet Governance (GCIG) coalesced around the primary objective of “One Internet” that is “protected, accessible to all and trusted by everyone.” The research papers produced in support of this initiative have addressed some of the most pressing Internet governance issues of our time and helped provide an evidentiary basis for cyber governance for the next decade. Amid the many technologically complex and geopolitically sensitive issues addressed, the present volume is also a reminder that half of the world’s population is still not online and that much works needs to be done to create a digital future for all.
INTRODUCTION: THE SHIFTING GEOPOLITICS OF INTERNET ACCESS
LAURA DENARDIS • 3
WORKS CITEDBello, Pablo and Juan Jung. 2015. Net Neutrality: Re�ections
on the Current Debate. GCIG Paper Series No. 13. Waterloo, ON: CIGI.
Galpaya, Helani. 2017. Zero-rating in Emerging Economies. GCIG Paper Series No. 47. Waterloo, ON: CIGI.
Galperin, Hernan. 2016. How to Connect the Other Half: Evidence and Policy Insights from Household Surveys in Latin American. GCIG Paper Series No. 34. Waterloo, On: CIGI.
Gillwald, Alison. 2017. Beyond Access: Addressing Digital Inequality in Africa. GCIG Paper Series No. 48. Waterloo, ON: CIGI.
Maurer, Tim and Robert Morgus. 2014. Tipping the Scale: An Analysis of Global Swing States in the Internet Governance Debate. GCIG Paper Series No. 2. Waterloo, ON: CIGI.
Scott, Ben, Stefan Heumann and Jan-Peter Kleinhans. 2015. Landmark EU and US Net Neutrality Decisions: How Might Pending Decisions Impact Internet Fragmentation? GCIG Paper Series No. 18. Waterloo, ON: CIGI.
Song, Steve. 2016. Unlocking Affordable Access in Sub-Saharan Africa. GCIG Paper Series No. 43. Waterloo, ON: CIGI.
ABOUT THE AUTHORLaura DeNardis, CIGI senior fellow, is a scholar of Internet architecture and governance and professor in the School of Communication at American University in Washington, DC. The author of The Global War for Internet Governance (Yale University Press, 2014) and several other books, her expertise has been featured in numerous publications. She serves as the director of research for the GCIG and is an af�liated fellow of the Yale Law School Information Society Project, where she previously served as executive director. Laura holds an A.B. in engineering science from Dartmouth College, a master’s degree in engineering from Cornell University, a Ph.D. in science and technology studies from Virginia Tech, and was awarded a post-doctoral fellowship from Yale Law School.


CHAPTER ONE: HOW TO CONNECT THE OTHER HALF
HERNÁN GALPERIN • 5
CHAPTER ONE:HOW TO CONNECT THE OTHER HALF: EVIDENCE AND POLICY INSIGHTS
FROM HOUSEHOLD SURVEYS IN LATIN AMERICA
Hernán Galperin
Copyright © 2016 by Hernán Galperin

RESEARCH VOLUME SIX: THE SHIFTING GEOPOLITICS OF INTERNET ACCESS
6 • CENTRE FOR INTERNATIONAL GOVERNANCE INNOVATION • CHATHAM HOUSE
INTRODUCTIONIt is widely agreed that Internet access is a prerequisite for human development in the twenty-�rst century. Without connectivity, individuals and businesses face signi�cant barriers for participating in the economic and social networks that permeate modern societies (World Bank 2016). Universalizing access has therefore become a policy priority in many countries, and is a core pillar of the new UN sustainable development agenda. Several of the proposed sustainable development goal targets address inequalities in access to the Internet, most signi�cantly target 5.b (“enhance the use of enabling technologies, in particular ICT [information and communications technology], to promote women’s empowerment”) and target 9.c (“signi�cantly increase access to ICT and strive to provide universal and affordable access to Internet in less developed countries [LDCs] by 2020”).
Internet access became a full-�edged market around 1995. From then, it took fewer than 10 years for half of the population in developed countries to come online. Today, average penetration in rich countries exceeds 80 percent. By contrast, only about one in three people in the developing world uses the Internet on a regular basis (International Telecommunication Union [ITU] 2015). In Latin America, there are approximately 250 million people aged 15 and older who are not regular Internet users. The challenges are manifold, including de�cits in the legacy telecommunications infrastructure, low population density, lack of human capital, endemic poverty and an inadequate regulatory environment.
Further, the unconnected are fundamentally different than the online population: they are older, poorer, less educated and more likely to live outside the main urban centres. As a result, they represent a much less attractive market for network operators and content/application providers. Bringing the next billion users online therefore represents a far greater challenge, one that will require not only technological and commercial innovations but also a new compact between governments and the private sector.
This study seeks to advance the debate on how to connect the next billion Internet users in two fundamental ways. First, it analyzes Internet diffusion patterns in Latin America based on the most recently available household surveys. The use of large-scale household surveys (over 875,000 cases in total) has many advantages over the more commonly used industry data, the main one being the ability to analyze how socio-demographic characteristics affect Internet adoption. Second, the chapter examines the unconnected population through different lenses. It presents estimates on the demand gap, a concept that captures differences among Internet infrastructure coverage, subscriptions and individual use. As Raúl Katz and Hernán Galperin (2013) argue, identifying
the determinants and magnitude of the demand gap across different populations is critical for the design of cost-effective connectivity policies. Further, the chapter examines the reasons for non-use, distinguishing between four types of barriers for adoption: affordability, skills, relevance and availability. By modelling the probability that non-users cite each of these factors, the chapter provides a unique characterization of the non-user population that helps design appropriate commercial and policy responses.
The �ndings offer many important lessons for policy makers. First, demand-side factors are as important as supply-side factors in explaining non-adoption. While many rural areas still lack adequate connectivity infrastructure, the large majority of non-users in Latin America simply �nd Internet access either too expensive or irrelevant. Second, there is a large unmet demand for low-cost access services, particularly among households with school-age children. Third, gender gaps in Internet access remain signi�cant (particularly in the Andean region), with men between �ve and nine percent (depending on the country) more likely to be online than women. Fourth, language skills are found to be an important obstacle for adoption, suggesting the need to promote linguistic diversity in online content and services. Last, the presence of school-age children in the household has a strong spillover effect on Internet use by adults, although the effect on residential access is much weaker due to cost factors. Overall, the results suggest an opportunity to complement infrastructure-deployment initiatives and regulatory reforms with targeted programs aimed at addressing connectivity barriers related to demand factors.
LONG-TERM TRENDS IN INTERNET ADOPTION AND THE DEMAND GAPThere are different ways to measure Internet connectivity levels across countries or regions. The most common involves adding up the number of subscriptions to different access services (for example, mobile and �xed broadband) as reported by service operators, from which subscriptions per 100 inhabitants are calculated. Figure 1 presents subscription indicators for various ICT services in Latin America for the 1980–2014 period. This long-term perspective reveals a number of stylized facts. The �rst is the extraordinary growth in the adoption of mobile telephony, which presents a textbook case of a logistic (or S-shaped) diffusion curve. By contrast, �xed telephony presents a slow-growing trend that peaked in 2008 at 18.7 lines per 100 inhabitants surveyed and has been declining ever since.
Perhaps not surprisingly, the adoption curves for mobile and �xed broadband closely follow the pattern for mobile and �xed telephony respectively. The number of mobile

CHAPTER ONE: HOW TO CONNECT THE OTHER HALF
HERNÁN GALPERIN • 7
broadband subscriptions has been growing exponentially in recent years, following the pattern of mobile telephony in the early 2000s. By contrast, the rate of growth in �xed broadband is small and appears to be decelerating. Currently at slightly more than 10 subscriptions per 100 inhabitants, residential broadband in Latin America has struggled to grow beyond a niche market for wealthy urban households. Even considering that �xed broadband is best interpreted as a household asset, the scale of the market remains limited, with current penetration at just over half of �xed telephony.
A key fact from Figure 1 is the deceleration in the pace of growth of the Internet population in Latin America. This deceleration represents a major policy challenge for the region. However, penetration indicators based on industry data present a number of well-known problems, particularly in countries where most users do not subscribe to monthly services (as is the case in most developing regions). Further, these indicators are national averages that say little about the distribution of access within the population. The use of household-level survey data offers a more detailed representation of the existing access divides and the policy challenges for bridging these de�cits in the region.
Figures 2 and 3 present demand gap estimates for eight countries for which recent household-level survey data is available. In the case of mobile broadband (Figure 2), the demand gap is measured as one minus the ratio of mobile broadband users to population coverage.1 In other words, it estimates the fraction of potential users who do not utilize mobile broadband services. Results are presented by income decile, measured in total family income per capita.2
The analysis reveals that the magnitude of the demand gap in mobile broadband varies considerably by country and income group. In general terms, large infrastructure investments over the past decade have signi�cantly expanded coverage, making mobile Internet available to more than 80 percent of the population in the countries analyzed. With the possible exception of Bolivia, where geography and low population density create signi�cant challenges for network deployment, most Latin Americans can choose from a growing menu of mobile connectivity services.
The key determinant of the observed gaps is therefore weak demand for mobile broadband. Take the case of Peru: while mobile broadband reaches about 90 percent of the population, fewer than one in 10 Peruvians in the bottom third of the income distribution report using mobile
1 Mobile broadband demand gap =
2 Total family income per capita is de�ated using the Consumer Price Index for each country and adjusted by 2005 Purchasing Power Parity.
Internet services. The gap is similar in Ecuador and only slightly lower in Colombia and Paraguay. Interestingly, even at the top of the income distribution a sizable demand gap is observed. In Ecuador, less than half of the individuals in the top 20 percent of the income distribution report using mobile broadband (demand is somewhat stronger in Colombia and Paraguay). These results raise questions about the affordability and relevance of existing mobile broadband services for the poorest.
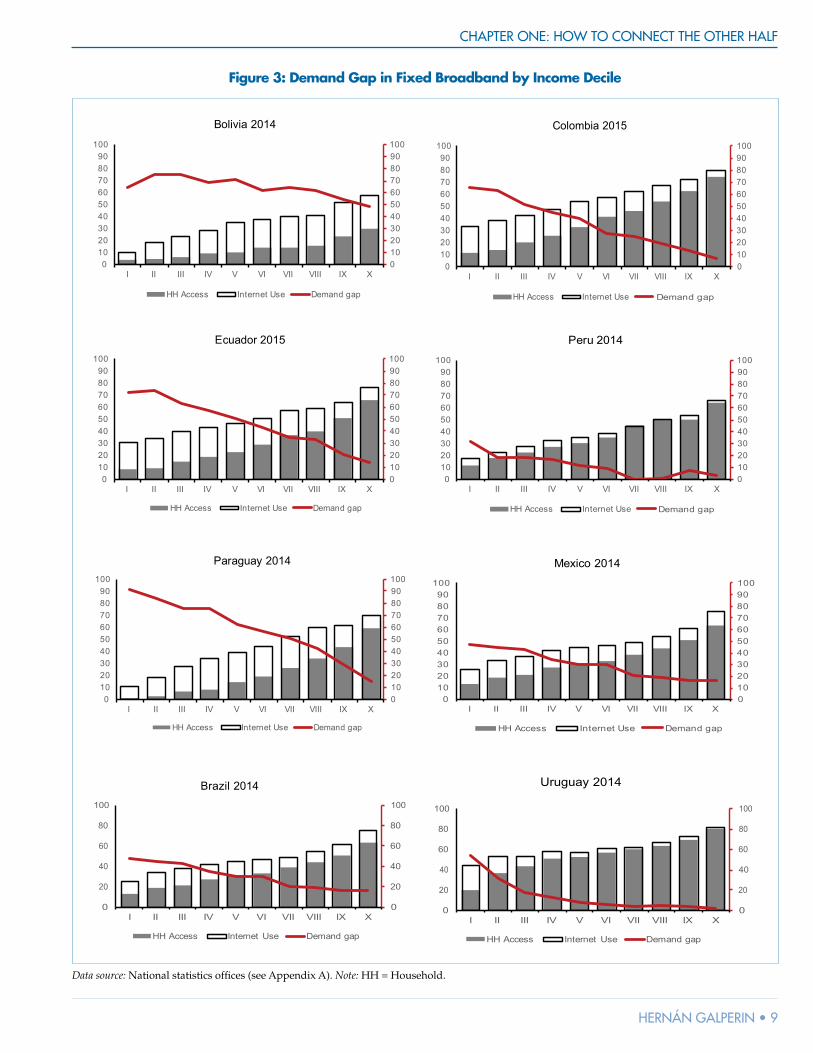
Unlike in developed countries, most Internet users in Latin America (and in other emerging regions) do not subscribe to residential services. Yet the very fact that these individuals are online (at work, in schools, at a cybercafé, on a mobile device and so on) suggests there is a latent demand for access within the household. Therefore, given the lack of reliable coverage estimates for �xed services, the demand gap for residential broadband is measured one minus the ratio of residential subscriptions (per 100) to Internet users (per 100).3 In other words, it estimates the fraction of Internet users who do not subscribe to residential access services. Results are presented by income decile, measured in total family income per capita (Figure 3).
The results reveal a reasonably consistent pattern in which the demand gap for residential broadband peaks in the bottom income quintile and declines (in some cases rapidly) thereafter. In other words, at the top end of the income distribution, the market for �xed broadband is approaching saturation. As shown in the next sections, lack of interest is the main factor that explains why a small share of the wealthiest households remains unconnected. The exceptions are countries with overall low penetration such as Bolivia, where lack of a legacy wired infrastructure limits residential broadband coverage even in relatively wealthy areas (Galperin, Alvarez-Hamelin and Viecens 2014).
By contrast, a combination of subsistence-level incomes and limited human capital explains weak Internet demand at the bottom of the distribution. Not only is connectivity unaffordable as a household asset, but individual household members have very limited Internet use experience. In Bolivia and Paraguay, only one in 10 individuals living in households in the lowest income decile is a regular Internet user. In wealthier countries such as Mexico, the fraction is closer to one in four. After the �rst income quintile, higher incomes result in more residential access, but the effect is smaller on use, thus reducing the demand gap.
3 Demand gap =
1 – ( )userspopulation coverage
1 – ( )subscriptions per 100users per 100

RESEARCH VOLUME SIX: THE SHIFTING GEOPOLITICS OF INTERNET ACCESS
8 • CENTRE FOR INTERNATIONAL GOVERNANCE INNOVATION • CHATHAM HOUSE
Figure 1: ICT Subscriptions per 100 Inhabitants and Internet Users in Latin America, 1980–2014
118
18.2
50.8
10.2
44.9
0
20
40
60
80
100
120
140
Mobile telephonyFixed telephonyMobile broadbandFixed broadbandInternet users
Data source: ITU Indicators Database 2015 (www.itu.int/en/ITU-D/Statistics/Pages/publications/wtid.aspx). Note: Latin America includes Argentina, Bolivia, Brazil, Chile, Colombia, Costa Rica, Dominican Republic, Ecuador, El Salvador, Guatemala, Honduras, Mexico, Nicaragua, Panama, Paraguay, Peru, Uruguay and Venezuela. Unweighted averages reported.
Figure 2: Demand Gap in Mobile Broadband by Income Decile
0
20
40
60
80
100
0
20
40
60
80
100
I II III IV V VI VII VIII IX X
Colombia 2015
Coverage Mobile broadband Gap
0
20
40
60
80
100
0
20
40
60
80
100
I II III IV V VI VII VIII IX X
Ecuador 2015
Coverage Mobile broadband Gap
0
20
40
60
80
100
0
20
40
60
80
100
I II III IV V VI VII VIII IX X
Peru 2014
Coverage Mobile broadband Gap
0
20
40
60
80
100
0
20
40
60
80
100
I II III IV V VI VII VIII IX X
Paraguay 2014
Coverage Mobile broadband Gap
Data source: National statistics of�ces (see Appendix A) and GSM Intelligence (www.gsmaintelligence.com/).
CHAPTER ONE: HOW TO CONNECT THE OTHER HALF
HERNÁN GALPERIN • 9
Figure 3: Demand Gap in Fixed Broadband by Income Decile
0102030405060708090100
0102030405060708090
100
I II III IV V VI VII VIII IX X
Bolivia 2014
HH Access Internet Use Demand gap
0102030405060708090100
0102030405060708090
100
I II III IV V VI VII VIII IX X
Colombia 2015
HH Access Internet Use
0102030405060708090100
0102030405060708090
100
I II III IV V VI VII VIII IX X
Ecuador 2015
HH Access Internet Use Demand gap
0102030405060708090100
0102030405060708090
100
I II III IV V VI VII VIII IX X
Peru 2014
HH Access Internet Use
0102030405060708090100
0102030405060708090
100
I II III IV V VI VII VIII IX X
Paraguay 2014
Brazil 2014
HH Access Internet Use Demand gap
0102030405060708090100
0102030405060708090
100
I II III IV V VI VII VIII IX X
Mexico 2014
HH Access Internet Use Demand gap
0
20
40
60
80
100
0
20
40
60
80
100
I II III IV V VI VII VIII IX X
Brazil 2014
HH Access Internet Use Demand gap
0
20
40
60
80
100
0
20
40
60
80
100
I II III IV V VI VII VIII IX X
Uruguay 2014
HH Access Internet Use Demand gap
Demand gap
Demand gap
Data source: National statistics of�ces (see Appendix A). Note: HH = Household.

RESEARCH VOLUME SIX: THE SHIFTING GEOPOLITICS OF INTERNET ACCESS
10 • CENTRE FOR INTERNATIONAL GOVERNANCE INNOVATION • CHATHAM HOUSE
THE DISTRIBUTION OF INTERNET ACCESSThere are multiple ways to measure differences in access to ICT resources within a population, which are sometimes con�ated in the term “digital divide.” One approach is to examine absolute levels of access to different technologies across different subpopulations. This approach emphasizes Internet access as an individual right, and calls for government policies that guarantee a minimum level of access opportunities to all regardless of income, location or other demographic factors. This is the principle that has guided universal service policies in telecommunications for many decades and, more recently, national broadband plans to extend Internet services to low-income households and remote populations.
Another approach is to examine relative levels of access to ICT within a population. In this approach, the emphasis is on between-group differences rather than absolute levels of access. The underlying principle is that disparities in access to ICT resources are likely to perpetuate or even exacerbate other social inequalities, further widening existing economic and social gaps (see, for example, Di Maggio et al. 2001). Among the most commonly used measures of inequality is the Gini coef�cient (and the associated Lorenz curve), which measures the extent to which the distribution of a resource (typically income) deviates from perfect equality. In Figures 4 and 5, the same principle is used to measure inequality in access to ICT resources.
Figure 4 presents Gini coef�cients for �xed and mobile Internet-access, mobile telephony use, and Internet use in selected Latin American countries for which recent data is available. The associated Lorenz curves are presented in Figure 5. As usual, the x axis represents the cumulative number of individuals or households from lowest to highest income, whereas the y axis represents the cumulative share of different ICT resources in the population.
The results reveal a number of interesting facts about inequalities in ICT adoption in the region. The largest disparities are consistently found in mobile broadband followed closely by residential access (see Figure 5a and Figure 5b), with Gini coef�cients in the 0.58 to 0.9 range (with the exception of Uruguay, discussed below). Inequality in residential access appears to be inversely related to country wealth, rising in poorer countries such as Bolivia and Paraguay while decreasing in richer countries such as Brazil and Uruguay. By contrast, the distribution of individual Internet use is signi�cantly less skewed, with Gini coef�cients in the 0.38 to 0.65 range. Further, overall country wealth seems to have little effect on the distribution of Internet use, with Lorenz curves for different countries tightly clustered (see Figure 5d).
At the other end of the spectrum is mobile telephony, with Gini coef�cients in the 0.22 to 0.42 range. Further, Lorenz curves for different countries are also tightly clustered (see Figure 5c), suggesting that overall country wealth is unrelated to the distribution of mobile telephony access within these populations. This �nding validates the strong equalizing effect that mobile telephony has had on ICT adoption in the region, as in much of the developing world (ITU 2015). By contrast, broadband (both �xed and mobile) remains highly skewed toward wealthier households and individuals, much like �xed telephony has been for the past century.
The case of Uruguay deserves special attention. Uruguay is among the better connected countries in the region. It also reveals the least inequality in access to ICT resources, as shown in Figures 4 and 5 below. There are several explanations for this �nding. The simplest are that Uruguay is the second-wealthiest country in the region (after Chile), and that it is a small country with low income inequality. Beyond that, the state-owned operator, Antel (which holds a near monopoly in residential services), has aggressively marketed entry-level Internet services to low-income households. As a result, the Gini coef�cient for �xed broadband in Uruguay is about a third lower of that in Mexico, a country of comparable wealth on a per capita basis. Another relevant factor is Plan Ceibal, a large-scale ICT-in-education program that distributes low-cost laptops to all students in public schools across the country, and also provides Internet connectivity to these schools through Antel. While the long-term impact of the program on educational achievement is yet to be seen, its effect on lowering barriers to ICT access and promoting ICT literacy has been extensively documented. (See Rivoir and Lamschtein 2012; de Melo et al. 2013.)
The political and demographic conditions that allowed Uruguay to signi�cantly reduce inequality in access to ICT resources, in particular to residential broadband, are dif�cult to replicate in other countries. However, the experience points to a combination of affordable Internet service packages targeted at low-income residents with extensive investments in human capital that promote demand for connectivity in the long term. This successful policy formula also highlights the need for coordination across policy actors, as well as for public-private partnerships in countries where, unlike Uruguay, private operators are the most relevant players in the Internet access market.
WHO IS NOT ONLINE?Numerous studies suggest that household demand for Internet services and individual adoption depend on a number of demographic factors (Chaudhuria and Flamm 2007; Cardona et al. 2009; Chinn and Fairlie 2010).

CHAPTER ONE: HOW TO CONNECT THE OTHER HALF
HERNÁN GALPERIN • 11
Among the most relevant are income, education, gender, geographical location (urban versus rural) and the presence of school-age children in the household. In order to corroborate these �ndings and determine how each of these factors affects Internet adoption in Latin America, various linear probability models (Ordinary Least Squares) are presented for the countries for which recent household-level data is available. The models estimate the likelihood that, conditional on a set of demographic characteristics, an individual:
• has Internet access at home;4
• is a regular Internet user (regardless of access location or device);5
• has an active mobile telephony line; and
• uses the mobile phone to access the Internet.
4 Because the decision to adopt residential broadband is typically with the head of household, residential access models use a reduced sample of heads of households.
5 Unfortunately, the wording of questions and time frame used to de�ne an Internet user varies across surveys in the different countries. Most countries de�ne users as individuals who have used the Internet in the past 12 months. Bolivia, Paraguay and Uruguay use a more restrictive de�nition based on use within the past three months.
The most recent national household surveys have been homogenized to maximize the comparability of results, following the methodology described in Centro de Estudios Distributivos, Laborales y Sociales (2009). Full results are presented in Appendix B (Tables 1 to 4). All marginal effects reported are calculated at the dependent variable’s mean.
Income
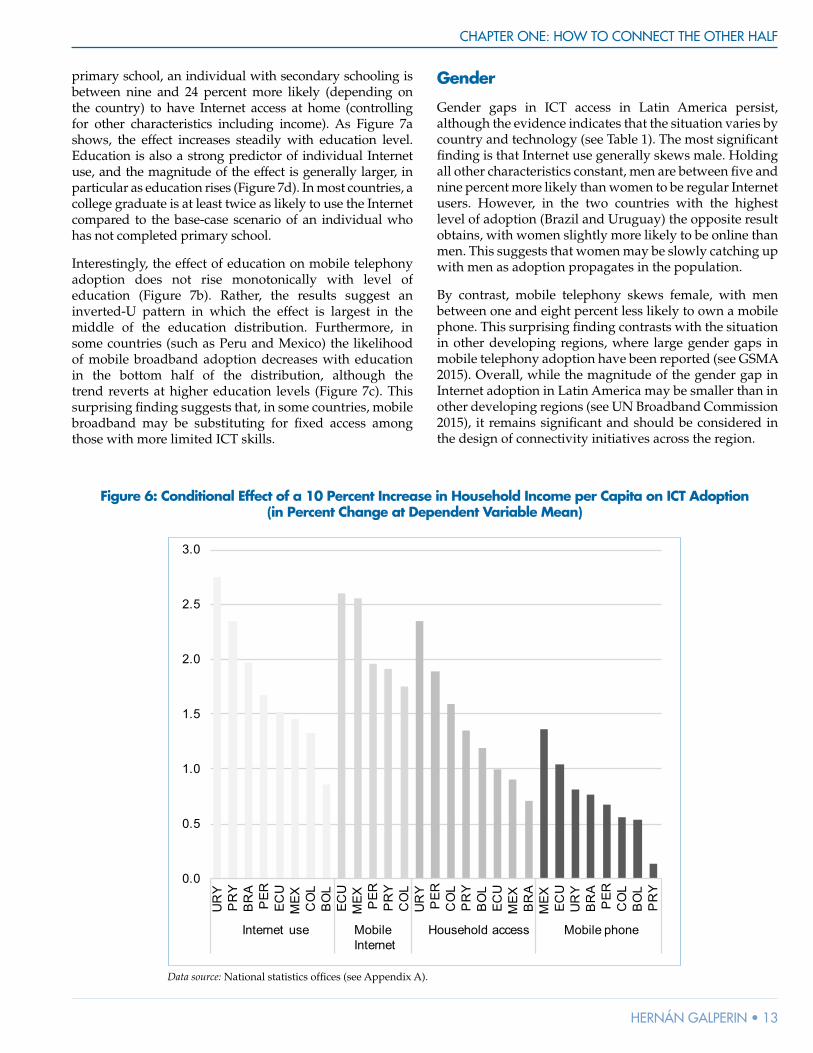
As expected, income is a strong predictor of ICT adoption in all models. The results show a consistent pattern whereby the effect of income is signi�cantly stronger for Internet access than for mobile telephony. For example, in the case of Peru a 10 percent increase in household income per capita results in a 1.9 percent increase in the likelihood of having residential access, but only a 0.7 percent increase in the likelihood of cellphone use. In other words, income elasticity is almost three times as large for residential access as for mobile phone. Interestingly, the effect is equally strong for residential and mobile access as for Internet use. While the results vary somewhat across countries, this general pattern holds across the region, as shown in Figure 6.
Age of User
The results suggest that the effect of a person’s age on ICT adoption varies depending on the technology examined.
Figure 4: Gini Coef�cient for Selected ICTs in Latin America (Selected Countries and Years)
0.0
0.1
0.2
0.3
0.4
0.5
0.6
0.7
0.8
0.9
1.0
MEX PER
ECU
CO
LP
RY
BO
LP
RY
ECU
MEX PER
CO
LB
RA
UR
YB
OL
PR
YM
EX PER
ECU
BR
AC
OL
UR
YEC
UB
OL
PER
CO
LU
RY
BR
A
Mobile Internet Household access Internet use Mobile phone
Data source: National statistics of�ces (see Appendix A).

RESEARCH VOLUME SIX: THE SHIFTING GEOPOLITICS OF INTERNET ACCESS
12 • CENTRE FOR INTERNATIONAL GOVERNANCE INNOVATION • CHATHAM HOUSE
In most countries, as age rises so does the likelihood of residential connectivity. This small but signi�cant effect is somewhat counterintuitive, though it needs to be interpreted in the context of a sample limited to heads of households. By contrast, age is — as expected — inversely related to Internet use, and the effect is particularly strong. For example, in the case of Mexico, every additional year reduces the likelihood of using the Internet by about 2.2 percent. The results vary slightly across countries but the pattern generally holds. Age is also inversely related to mobile phone adoption, but the effect is much weaker. Again, in Mexico, an additional year reduces the likelihood of using a cellphone by only 0.23 percent, an effect approximately 10 times weaker than for Internet use.
The effect of age is also found to be strong in the case of mobile broadband, with every additional year reducing the likelihood of adoption, from 1.2 percent in Ecuador to 3.1 percent in Peru. Part of the explanation may be a novelty effect, given that the young are more likely to be early technology adopters. This is, however, a pattern that deserves close monitoring, for it may indicate a widening generational gap in access to new digital services associated with mobile broadband.
Education
The data indicates that education is a strong determinant of Internet adoption in Latin America, and that the magnitude of the effect increases with education level. Compared to the base-case scenario of an individual who has not completed
Figure 5: Lorenz Curve for Selected ICTs in Latin America (Selected Countries and Years)
H='="8&0$%&$0"' 44$.."E- 19.$-1)2J " H=5="i15+)$"5%1'25'&2"E+&2+3+29')J"
"
H=4="i15+)$"*-1&$"E+&2+3+29')J" H=2="8&0$%&$0"9.$"E+&2+3+29')J"
"
0
.2
.4
.6
.8
1
0 .2 .4 .6 .8 1
BOL BRA COL ECU MEXPER PRY URY LPE
0
.2
.4
.6
.8
1
0 .2 .4 .6 .8 1
ECU COL PER PRYURY LPE
0
.2
.4
.6
.8
1
0 .2 .4 .6 .8 1
BOL BRA COL ECUPER URY LPE
0
.2
.4
.6
.8
1
0 .2 .4 .6 .8 1
BOL BRA COL ECUMEX PER PRY URYLPE
5a. Internet access (household) 5b. Mobile broadband (individual)
5c. Mobile phone (individual) 5d. Internet use (individual)
Data source: National statistics of�ces (see Appendix A). Note: LPE = line of perfect equality.
CHAPTER ONE: HOW TO CONNECT THE OTHER HALF
HERNÁN GALPERIN • 13
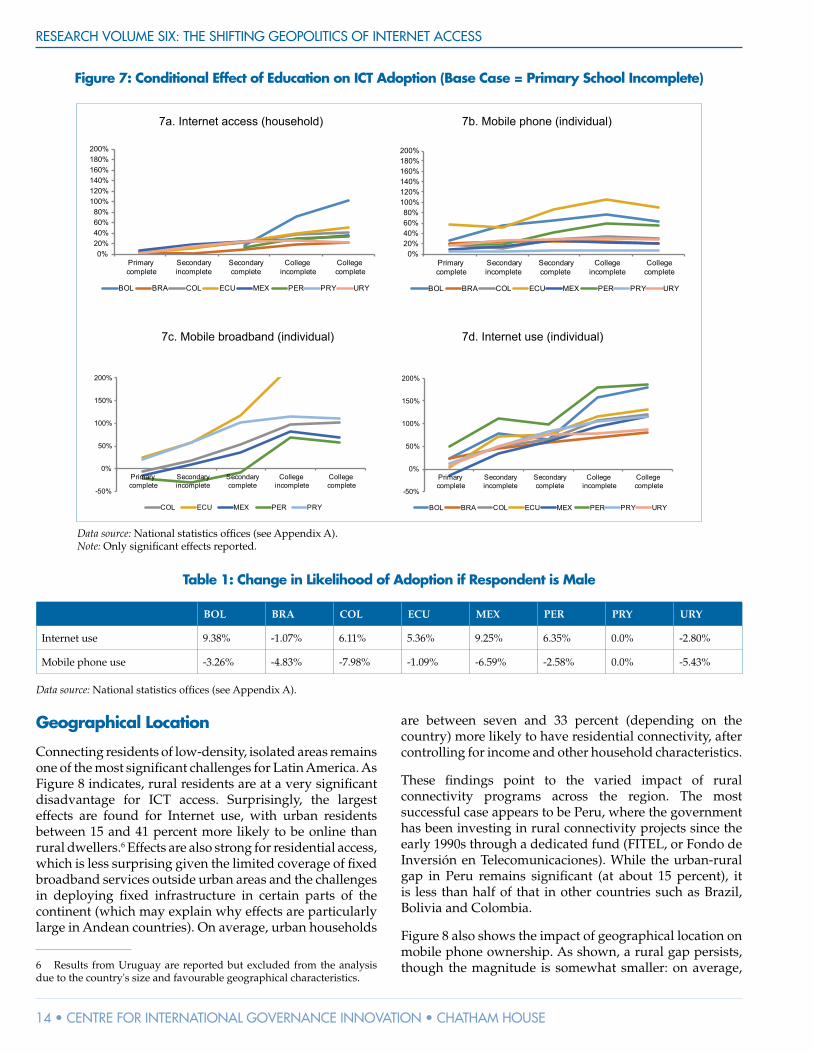
primary school, an individual with secondary schooling is between nine and 24 percent more likely (depending on the country) to have Internet access at home (controlling for other characteristics including income). As Figure 7a shows, the effect increases steadily with education level. Education is also a strong predictor of individual Internet use, and the magnitude of the effect is generally larger, in particular as education rises (Figure 7d). In most countries, a college graduate is at least twice as likely to use the Internet compared to the base-case scenario of an individual who has not completed primary school.
Interestingly, the effect of education on mobile telephony adoption does not rise monotonically with level of education (Figure 7b). Rather, the results suggest an inverted-U pattern in which the effect is largest in the middle of the education distribution. Furthermore, in some countries (such as Peru and Mexico) the likelihood of mobile broadband adoption decreases with education in the bottom half of the distribution, although the trend reverts at higher education levels (Figure 7c). This surprising �nding suggests that, in some countries, mobile broadband may be substituting for �xed access among those with more limited ICT skills.
Gender
Gender gaps in ICT access in Latin America persist, although the evidence indicates that the situation varies by country and technology (see Table 1). The most signi�cant �nding is that Internet use generally skews male. Holding all other characteristics constant, men are between �ve and nine percent more likely than women to be regular Internet users. However, in the two countries with the highest level of adoption (Brazil and Uruguay) the opposite result obtains, with women slightly more likely to be online than men. This suggests that women may be slowly catching up with men as adoption propagates in the population.
By contrast, mobile telephony skews female, with men between one and eight percent less likely to own a mobile phone. This surprising �nding contrasts with the situation in other developing regions, where large gender gaps in mobile telephony adoption have been reported (see GSMA 2015). Overall, while the magnitude of the gender gap in Internet adoption in Latin America may be smaller than in other developing regions (see UN Broadband Commission 2015), it remains signi�cant and should be considered in the design of connectivity initiatives across the region.
Figure 6: Conditional Effect of a 10 Percent Increase in Household Income per Capita on ICT Adoption (in Percent Change at Dependent Variable Mean)
0.0
0.5
1.0
1.5
2.0
2.5
3.0
UR
YP
RY
BR
AP
EREC
UM
EX CO
LB
OL
ECU
MEX PER
PR
YC
OL
UR
YP
ERC
OL
PR
YB
OL
ECU
MEX BR
AM
EX ECU
UR
YB
RA
PER
CO
LB
OL
PR
Y
Internet use Mobile Internet
Household access Mobile phone
Data source: National statistics of�ces (see Appendix A).
RESEARCH VOLUME SIX: THE SHIFTING GEOPOLITICS OF INTERNET ACCESS
14 • CENTRE FOR INTERNATIONAL GOVERNANCE INNOVATION • CHATHAM HOUSE
Geographical Location
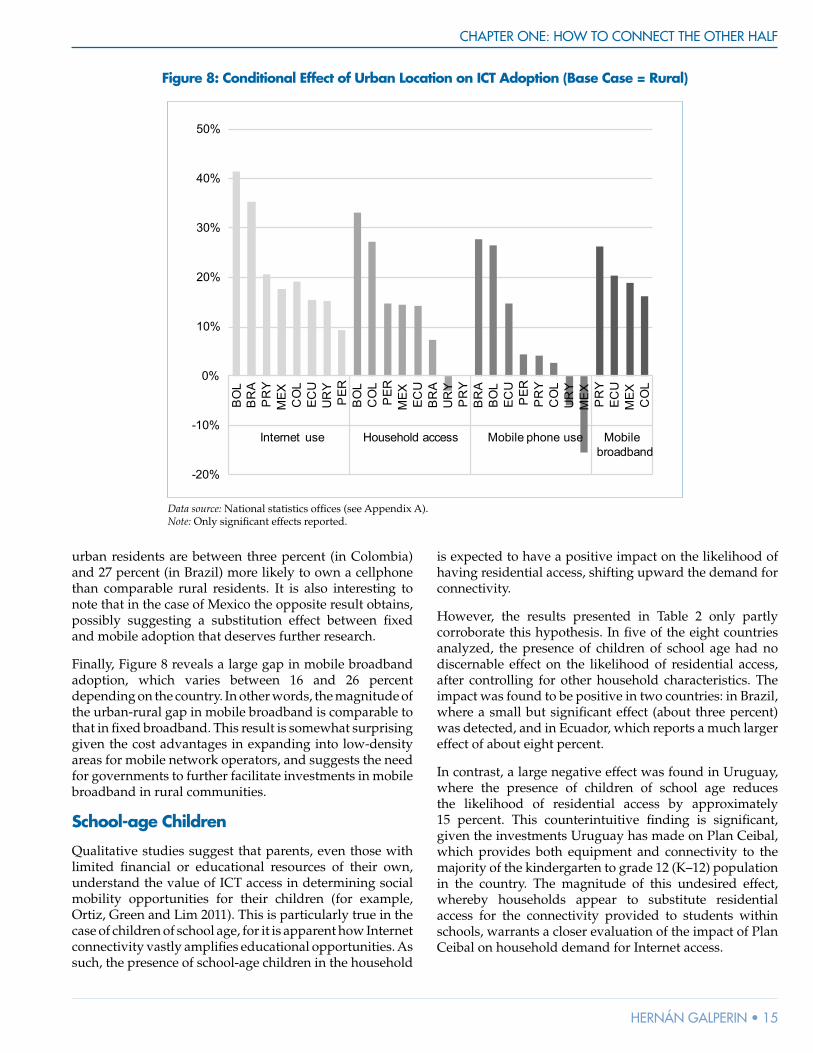
Connecting residents of low-density, isolated areas remains one of the most signi�cant challenges for Latin America. As Figure 8 indicates, rural residents are at a very signi�cant disadvantage for ICT access. Surprisingly, the largest effects are found for Internet use, with urban residents between 15 and 41 percent more likely to be online than rural dwellers.6 Effects are also strong for residential access, which is less surprising given the limited coverage of �xed broadband services outside urban areas and the challenges in deploying �xed infrastructure in certain parts of the continent (which may explain why effects are particularly large in Andean countries). On average, urban households
6 Results from Uruguay are reported but excluded from the analysis due to the country's size and favourable geographical characteristics.
are between seven and 33 percent (depending on the country) more likely to have residential connectivity, after controlling for income and other household characteristics.
These �ndings point to the varied impact of rural connectivity programs across the region. The most successful case appears to be Peru, where the government has been investing in rural connectivity projects since the early 1990s through a dedicated fund (FITEL, or Fondo de Inversión en Telecomunicaciones). While the urban-rural gap in Peru remains signi�cant (at about 15 percent), it is less than half of that in other countries such as Brazil, Bolivia and Colombia.
Figure 8 also shows the impact of geographical location on mobile phone ownership. As shown, a rural gap persists, though the magnitude is somewhat smaller: on average,
Figure 7: Conditional Effect of Education on ICT Adoption (Base Case = Primary School Incomplete)
7a. Internet access (household) 7b. Mobile phone (individual)
7c. Mobile broadband (individual) 7d. Internet use (individual)
0%20%40%60%80%
100%120%140%160%180%200%
Primary complete
Secondary incomplete
Secondary complete
College incomplete
College complete
BOL BRA COL ECU MEX PER PRY URY
0%20%40%60%80%
100%120%140%160%180%200%
Primary complete
Secondary incomplete
Secondary complete
College incomplete
College complete
BOL BRA COL ECU MEX PER PRY URY
-50%
0%
50%
100%
150%
200%
Primary complete
Secondary incomplete
Secondary complete
College incomplete
College complete
COL ECU MEX PER PRY
-50%
0%
50%
100%
150%
200%
Primary complete
Secondary incomplete
Secondary complete
College incomplete
College complete
BOL BRA COL ECU MEX PER PRY URY
Data source: National statistics of�ces (see Appendix A). Note: Only signi�cant effects reported.
Table 1: Change in Likelihood of Adoption if Respondent is Male
BOL BRA COL ECU MEX PER PRY URY
Internet use 9.38% -1.07% 6.11% 5.36% 9.25% 6.35% 0.0% -2.80%
Mobile phone use -3.26% -4.83% -7.98% -1.09% -6.59% -2.58% 0.0% -5.43%
Data source: National statistics of�ces (see Appendix A).
CHAPTER ONE: HOW TO CONNECT THE OTHER HALF
HERNÁN GALPERIN • 15
urban residents are between three percent (in Colombia) and 27 percent (in Brazil) more likely to own a cellphone than comparable rural residents. It is also interesting to note that in the case of Mexico the opposite result obtains, possibly suggesting a substitution effect between �xed and mobile adoption that deserves further research.
Finally, Figure 8 reveals a large gap in mobile broadband adoption, which varies between 16 and 26 percent depending on the country. In other words, the magnitude of the urban-rural gap in mobile broadband is comparable to that in �xed broadband. This result is somewhat surprising given the cost advantages in expanding into low-density areas for mobile network operators, and suggests the need for governments to further facilitate investments in mobile broadband in rural communities.
School-age Children
Qualitative studies suggest that parents, even those with limited �nancial or educational resources of their own, understand the value of ICT access in determining social mobility opportunities for their children (for example, Ortiz, Green and Lim 2011). This is particularly true in the case of children of school age, for it is apparent how Internet connectivity vastly ampli�es educational opportunities. As such, the presence of school-age children in the household
is expected to have a positive impact on the likelihood of having residential access, shifting upward the demand for connectivity.
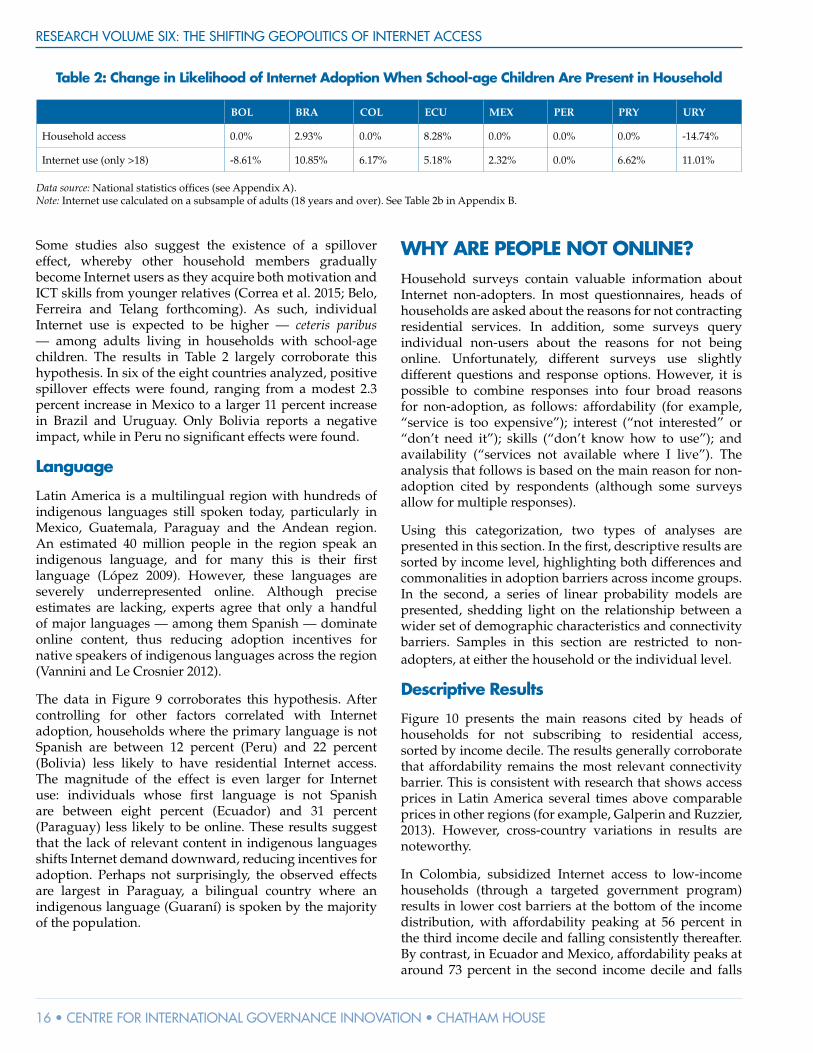
However, the results presented in Table 2 only partly corroborate this hypothesis. In �ve of the eight countries analyzed, the presence of children of school age had no discernable effect on the likelihood of residential access, after controlling for other household characteristics. The impact was found to be positive in two countries: in Brazil, where a small but signi�cant effect (about three percent) was detected, and in Ecuador, which reports a much larger effect of about eight percent.
In contrast, a large negative effect was found in Uruguay, where the presence of children of school age reduces the likelihood of residential access by approximately 15 percent. This counterintuitive �nding is signi�cant, given the investments Uruguay has made on Plan Ceibal, which provides both equipment and connectivity to the majority of the kindergarten to grade 12 (K–12) population in the country. The magnitude of this undesired effect, whereby households appear to substitute residential access for the connectivity provided to students within schools, warrants a closer evaluation of the impact of Plan Ceibal on household demand for Internet access.
Figure 8: Conditional Effect of Urban Location on ICT Adoption (Base Case = Rural)
-20%
-10%
0%
10%
20%
30%
40%
50%
BO
LB
RA
PR
YM
EX CO
LEC
UU
RY
PER
BO
LC
OL
PER
MEX EC
UB
RA
UR
YP
RY
BR
AB
OL
ECU
PER
PR
YC
OL
UR
YM
EX PR
YEC
UM
EX CO
L
Internet use Household access Mobile phone use Mobile broadband
Data source: National statistics of�ces (see Appendix A). Note: Only signi�cant effects reported.
RESEARCH VOLUME SIX: THE SHIFTING GEOPOLITICS OF INTERNET ACCESS
16 • CENTRE FOR INTERNATIONAL GOVERNANCE INNOVATION • CHATHAM HOUSE
Some studies also suggest the existence of a spillover effect, whereby other household members gradually become Internet users as they acquire both motivation and ICT skills from younger relatives (Correa et al. 2015; Belo, Ferreira and Telang forthcoming). As such, individual Internet use is expected to be higher — ceteris paribus — among adults living in households with school-age children. The results in Table 2 largely corroborate this hypothesis. In six of the eight countries analyzed, positive spillover effects were found, ranging from a modest 2.3 percent increase in Mexico to a larger 11 percent increase in Brazil and Uruguay. Only Bolivia reports a negative impact, while in Peru no signi�cant effects were found.
Language
Latin America is a multilingual region with hundreds of indigenous languages still spoken today, particularly in Mexico, Guatemala, Paraguay and the Andean region. An estimated 40 million people in the region speak an indigenous language, and for many this is their �rst language (López 2009). However, these languages are severely underrepresented online. Although precise estimates are lacking, experts agree that only a handful of major languages — among them Spanish — dominate online content, thus reducing adoption incentives for native speakers of indigenous languages across the region (Vannini and Le Crosnier 2012).
The data in Figure 9 corroborates this hypothesis. After controlling for other factors correlated with Internet adoption, households where the primary language is not Spanish are between 12 percent (Peru) and 22 percent (Bolivia) less likely to have residential Internet access. The magnitude of the effect is even larger for Internet use: individuals whose �rst language is not Spanish are between eight percent (Ecuador) and 31 percent (Paraguay) less likely to be online. These results suggest that the lack of relevant content in indigenous languages shifts Internet demand downward, reducing incentives for adoption. Perhaps not surprisingly, the observed effects are largest in Paraguay, a bilingual country where an indigenous language (Guaraní) is spoken by the majority of the population.
WHY ARE PEOPLE NOT ONLINE?Household surveys contain valuable information about Internet non-adopters. In most questionnaires, heads of households are asked about the reasons for not contracting residential services. In addition, some surveys query individual non-users about the reasons for not being online. Unfortunately, different surveys use slightly different questions and response options. However, it is possible to combine responses into four broad reasons for non-adoption, as follows: affordability (for example, “service is too expensive”); interest (“not interested” or “don’t need it”); skills (“don’t know how to use”); and availability (“services not available where I live”). The analysis that follows is based on the main reason for non-adoption cited by respondents (although some surveys allow for multiple responses).
Using this categorization, two types of analyses are presented in this section. In the �rst, descriptive results are sorted by income level, highlighting both differences and commonalities in adoption barriers across income groups. In the second, a series of linear probability models are presented, shedding light on the relationship between a wider set of demographic characteristics and connectivity barriers. Samples in this section are restricted to non-adopters, at either the household or the individual level.
Descriptive Results
Figure 10 presents the main reasons cited by heads of households for not subscribing to residential access, sorted by income decile. The results generally corroborate that affordability remains the most relevant connectivity barrier. This is consistent with research that shows access prices in Latin America several times above comparable prices in other regions (for example, Galperin and Ruzzier, 2013). However, cross-country variations in results are noteworthy.
In Colombia, subsidized Internet access to low-income households (through a targeted government program) results in lower cost barriers at the bottom of the income distribution, with affordability peaking at 56 percent in the third income decile and falling consistently thereafter. By contrast, in Ecuador and Mexico, affordability peaks at around 73 percent in the second income decile and falls
Table 2: Change in Likelihood of Internet Adoption When School-age Children Are Present in Household
BOL BRA COL ECU MEX PER PRY URY
Household access 0.0% 2.93% 0.0% 8.28% 0.0% 0.0% 0.0% -14.74%
Internet use (only >18) -8.61% 10.85% 6.17% 5.18% 2.32% 0.0% 6.62% 11.01%
Data source: National statistics of�ces (see Appendix A). Note: Internet use calculated on a subsample of adults (18 years and over). See Table 2b in Appendix B.

CHAPTER ONE: HOW TO CONNECT THE OTHER HALF
HERNÁN GALPERIN • 17
Figure 9: Conditional Effect of Indigenous Language on ICT Adoption (Base Case = Spanish)
-35%
-30%
-25%
-20%
-15%
-10%
-5%
0%BOL ECU PER PRY
Household access Internet use
Data source: National statistics of�ces (see Appendix A). Note: Only signi�cant effects reported.
Figure 10: Main Reason for Not Having Internet Access at Home, by Income Decile (%)
0
20
40
60
80
100
1 2 3 4 5 6 7 8 9 10
Colombia 2015
Cost Interest Skill Availability
0
20
40
60
80
100
1 2 3 4 5 6 7 8 9 10
Ecuador 2015
Cost Interest Skill Availability
0
20
40
60
80
100
1 2 3 4 5 6 7 8 9 10
Mexico 2014
Cost Interest Skill
0102030405060708090
100
1 2 3 4 5 6 7 8 9 10
Peru 2014
Cost Interest Skill Availability
Data source: National statistics of�ces (see Appendix A). Note: Sample restricted to non-adopter heads of households.

RESEARCH VOLUME SIX: THE SHIFTING GEOPOLITICS OF INTERNET ACCESS
18 • CENTRE FOR INTERNATIONAL GOVERNANCE INNOVATION • CHATHAM HOUSE
gradually, dipping below 50 percent only in the top income quintile. In Peru, somewhat surprisingly, affordability starts off below interest, peaking at around 33 percent in the fourth income decile and falling gradually thereafter.
As expected, affordability and interest move in opposite directions, the �rst falling and the second rising with income. The point at which these trends intersect is indicative of whether prices in the residential access market re�ect disposable household incomes. In Colombia, the curves intersect somewhere between the sixth and the seventh income decile; in Ecuador and Mexico, it is only at the very top of the income distribution that interest overtakes cost as the main reason for not being connected at home. This suggests a large latent demand for lower-cost services in both countries. In Peru, by contrast, weak residential demand is largely explained by motivational factors across income levels.
Results with respect to reasons for individual non-use are available only for Mexico and Peru (Figure 11). They indicate that, unlike in the case of residential access, affordability is of little relevance for explaining non-use. This �nding is consistent with research that points to the ubiquitous presence of affordable (or in some cases, no-cost) public access locations across the region (Sey et al. 2013). Further, hourly prices in public access locations are rapidly dropping as operators struggle to compete with mobile broadband services, in particular with daily prepaid packages that emulate the pay-as-you-go cybercafé model.
The results also suggest that lack of interest and lack of skills are about equally important as explanatory factors for non-use. There is surprising consistency in this pattern across income groups, particularly in the Mexico case, though this may re�ect underreporting of human capital de�cits, which is common in household surveys. In Peru, a more expected pattern is observed, whereby lack of interest rises with income, while lack of skill falls, from a peak of
54 percent in the �rst income decile to 42 percent in the top income group. In other words, while lower-income non-users are predominantly held back by skill-related factors, wealthier non-users perceive little value in being online.
Probability Models
In order to corroborate the descriptive results and examine the simultaneous effect of different demographic factors on Internet adoption, this section presents various linear probability models based on samples restricted to non-adopters. The models estimate the likelihood that non-adopters cite either of the four response categories as the main barrier for connectivity (affordability, lack of interest, lack of skills, and availability), conditional on a set of demographic characteristics. Full results are presented in Appendix B (see Tables 5 to 10). All marginal effects reported are calculated at the dependent variable’s mean.
As expected, income, age and education are associated with different connectivity barriers, although the �t of the models is generally low, suggesting that factors other than basic socio-economic characteristics are also at play.7 Among younger heads of household, cost is a critical barrier for residential connectivity; as age rises, affordability becomes less signi�cant, while lack of interest and skills grow in importance. Age is also an important factor for explaining non-use. Every additional year increases the probability of citing lack of skills by between 0.74 percent (Mexico) and 1.76 percent (Peru). This is a remarkably strong effect that indicates the need to attend ICT literacy de�cits among the elderly population.
The opposite is true for education: controlling for other factors, the more educated respondents are less likely
7 For example, Ellen J. Helsper and Bianca C. Reisdorf (2013) show psychological characteristics associated with different reasons for Internet non-use.
Figure 11: Main Reason for Not Using Internet, by Income Decile (%)
0102030405060708090
100
1 2 3 4 5 6 7 8 9 10
Mexico
Interest Skill Availability
0102030405060708090
100
1 2 3 4 5 6 7 8 9 10
Peru
Cost Interest Skill Availability
Data source: National statistics of�ces (see Appendix A). Note: Sample restricted to non-adopters.

CHAPTER ONE: HOW TO CONNECT THE OTHER HALF
HERNÁN GALPERIN • 19
to cite skills and more likely to cite interest as the main reason for not having access at home. As expected, income is negatively correlated with cost and positively correlated with interest as a connectivity barrier. Despite small differences, these patterns generally hold across the countries examined.
Interestingly, the results indicate systematic differences in connectivity barriers between genders. Conditional on other demographic factors, male heads of households are between 11 percent (Mexico) and 14 percent (Peru) less likely to cite affordability as the primary reason for not subscribing to residential access (see Figure 12). Conversely, men are signi�cantly more likely to cite lack of interest and, in particular, lack of skills as the primary barrier. These gender differences are reasonably consistent across countries, except in Peru where male and female heads of households are equally likely to cite interest and skills as main barriers.
Interestingly, a different gender pattern emerges when considering the reasons for individual non-use in the entire population (rather than among heads of households only). While data is only available for two countries (Mexico and Peru), the results suggest that skills de�cits are disproportionately relevant for women, with female respondents between �ve percent (Mexico) and 16 percent (Peru) more likely to cite lack of skills as the main connectivity barrier. This �nding corroborates the need to target ICT literacy efforts to ensure that women close
the small but signi�cant gender-use gap identi�ed in the previous section.
As noted, availability is cited by a small fraction of respondents as the main barrier for residential access. However, when households are sorted by geographical location, the evidence suggests that the urban/rural gap in service coverage remains signi�cant, and is an important determinant of observed differences in residential adoption. Rural heads of households are between two and three times more likely to cite availability as the main reason for not subscribing to Internet services. This result illustrates the continued need for policies that promote Internet infrastructure expansion into low-density areas.
The �ndings also corroborate the role of linguistic barriers for Internet adoption. In Ecuador, households in which the primary language is not Spanish are 18 percent less likely to cite affordability, but 17 percent more likely to cite lack of skills and 27 percent more likely to cite lack of relevance as the main barrier for residential adoption. Likewise in Peru, individuals whose primary language is not Spanish are 16 percent more likely to cite lack of skills as the main reason for not being online. This suggests that, ceteris paribus, indigenous-language speakers not only are less attracted to the content available online but also �nd it more dif�cult to acquire the necessary skills for effective use.
Finally, the results show that the presence of school-age children in the household strongly affects the barriers for adoption. Overall, having children in school increases the
Figure 12: Change in Likelihood of Citing Barrier for Residential Access When Respondent Is Male
-20%
-15%
-10%
-5%
0%
5%
10%
15%
20%
25%
30%
Mexico Ecuador Colombia Peru
Affordability Interest Skills
Data source: National statistics of�ces (see Appendix A). Note: Sample restricted to non-adopter heads of households.

RESEARCH VOLUME SIX: THE SHIFTING GEOPOLITICS OF INTERNET ACCESS
20 • CENTRE FOR INTERNATIONAL GOVERNANCE INNOVATION • CHATHAM HOUSE
likelihood of citing affordability as the main barrier for residential connectivity, by between 23 percent (Peru) and 37 percent (Mexico), while at the same time it signi�cantly reduces the likelihood of citing either lack of interest or skills (Figure 13). This is a remarkably strong and consistent effect, which validates the �nding that parents are aware of the value that residential access has for their children’s education, but to a large extent �nd services unaffordable. This �nding may also help explain the smaller than expected impact that the presence of children has on residential access, as reported above.
POLICY RECOMMENDATIONS FOR CONNECTING THE OTHER HALFIt is often argued that connecting the next billion users worldwide will require a novel set of policy and commercial strategies. The �ndings in this study clearly support this conclusion. The unconnected in Latin America are fundamentally different from the online population: as expected, they are poorer, older, less educated and more likely to live outside urban centres; perhaps less obvious is that they are disproportionately female and speak Spanish as a second language. Further, the large majority of non-users is within reach of existing networks, but considers Internet access either unaffordable or irrelevant.
In recent years, public policies have shifted away from the shared personal computer (PC) access model in favour of initiatives that build on the rapidly growing base of new
personal devices (smartphones, tablets and so forth). The cornerstone of the new generation of initiatives is mobile broadband, which has many desirable characteristics matching the demographics of the unconnected. Compared to �xed broadband, infrastructure deployment costs for mobile are signi�cantly lower (particularly in low-density areas); user interfaces typically require less in the way of ICT skills; and service operators have introduced commercial innovations, such as daily prepaid and zero-rating plans; that are well suited to the expenditure patterns of low-income groups. This shift also represents an attractive proposition for policy makers because public �nances have become tighter since the 2008-2009 crisis. Rather than subsidizing the build-out of costly infrastructure for shared access, governments can simply incentivize network rollout by private actors.
There is much to be praised about this policy shift, especially in Latin America, where traditional universal service policies have had, at best, a limited impact (see Clarke and Wallsten 2002). Yet the focus on mobile connectivity may result in neglected policy opportunities in other areas. Further, there is increased evidence pointing at differentiated uses for mobile and �xed broadband (Napoli and Obar 2014; Horrigan and Duggan 2015), which suggests complementarity rather than substitution. This is corroborated by the results of this analysis, which shows that, controlling for other factors including income, having residential access has a strong effect on the probability that an individual uses mobile broadband (see Table 4 in Appendix B).
Figure 13: Change in Likelihood of Citing Barrier for Residential Access if Children of School Age in Household
-80%
-60%
-40%
-20%
0%
20%
40%
60%
Mexico Ecuador Colombia Peru
Affordability Interest Skills
Data source: National statistics of�ces (see Appendix A). Note: Sample restricted to non-adopter heads of households.
CHAPTER ONE: HOW TO CONNECT THE OTHER HALF
HERNÁN GALPERIN • 21
The policy recommendations below seek to promote residential Internet access in Latin America, regardless of the underlying technology. They are based on three key premises: First, that the observed gaps in demand for Internet require policy initiatives that address two critical access barriers: affordability and relevance. Second, that regulatory initiatives aimed at strengthening competition in access markets throughout the region — while urgently necessary in many cases — will not suf�ce to close the observed gaps. This is because, as the �ndings show, Internet adoption is strongly associated with basic socio-demographic variables (age, education, native language, family composition and so on) that evolve much slower than market structures evolve. Third, that neither service operators nor individual households are able to fully capture the spillover bene�ts of increased Internet connectivity. Thus there is need for government initiatives and investments that help align consumer choices with public welfare.
Recommendation One: Promote Online Content and Services in Indigenous Languages
Given its origins and evolution, it should come as no surprise that English quickly emerged as the de facto language of the Internet, with other major languages growing gradually as the online population diversi�ed. The call for linguistic diversity in online content and services is almost as old as the Internet itself. These calls are often presented as necessary for preserving worldwide cultural diversity, given the migration of content to digital and the opportunities offered by online content archiving and delivery. However, the �ndings in this study point to a more fundamental result, which is that lack of online linguistic diversity reduces incentives for adoption and the acquisition of ICT skills among minority-language speakers, thus reinforcing social exclusion.
The results of this study suggest the need to promote online content and services in indigenous languages as part of digital inclusion policies. Government actors have an important part to play, given their role in the creation of content and the provision of online services associated with education, health and other basic public services. But incentives for private actors are also critical, particularly because of the enduring association between indigenous groups and poverty, which reduces market incentives to address this potential demand. At the same time, many countries in Latin America have a long-standing tradition of support for linguistic diversity in audiovisual content production. The lessons learned from these initiatives represent a natural springboard for designing policy instruments that promote a more linguistically diverse Internet in the region.
Recommendation Two: Connect Schools
In the past decade, there have been large investments in ICT-in-schools programs in Latin America (United Nations Educational, Scienti�c and Cultural Organization [UNESCO] 2013). These programs, which combine the provision of equipment, connectivity and teacher training in various ways, are premised on two key assumptions: �rst, that schools have an important role to play in promoting ICT literacy, and second, that the introduction of ICTs in schools can positively affect student performance, promoting learning as well as other desirable outcomes such as motivation and retention. While program details differ across countries, investments have generally supported the purchase of ICT equipment for students, with comparatively fewer resources invested in complementary connectivity programs. As a result, many initiatives have fallen below expectations, with both schools and individual students unable to maximize the learning potential of government-subsidized devices (Cristia, Czerwonko and Garofalo 2014).
There is considerable controversy about the long-term impact of these initiatives. In general terms, the empirical evidence supports the �rst assumption about positive impacts on ICT literacy (for example, Bet, Cristia and Ibarrarán 2014) but provides mixed results when it comes to gains in learning. More speci�cally, several studies have found Internet use at school (whether measured as a binary or continuous variable) to be essentially uncorrelated with student performance (Goolsbee and Guryan 2006; Muñoz and Ortega 2015). However, more recent studies suggest that, by focusing on school-level effects, these evaluations are underestimating the impact of school connectivity programs. In particular, it has been shown that connecting schools has considerable spillover effects on residential broadband adoption and Internet use by adults in neighbouring areas, although the latter effect is somewhat weaker (Tengtrakul and Peha 2013; Belo, Ferreira and Telang forthcoming; Correa et al. 2015).
The �ndings presented in this study validate the need to renew these efforts. Several countries in the region have made signi�cant progress in connecting schools in the past decade. Brazil alone has connected over 80,000 public schools since 2008 through a joint initiative with incumbent telecommunications operators, and similar initiatives exist in Chile and Uruguay. However, in much of the continent the situation is less promising. According to the most recent �gures available (UNESCO 2013), fewer than 10 percent of the schools in Paraguay, Nicaragua and other lower-income countries are connected to the Internet; even in wealthier countries such as Mexico and Argentina, only about one in three schools are connected.

RESEARCH VOLUME SIX: THE SHIFTING GEOPOLITICS OF INTERNET ACCESS
22 • CENTRE FOR INTERNATIONAL GOVERNANCE INNOVATION • CHATHAM HOUSE
Despite lack of evidence about short-term learning gains (as measured by standardized tests), returns to investments in human capital through school connectivity programs that promote ICT literacy are likely to be signi�cant in the long term. For example, there is evidence (Dodel 2015) that Uruguay’s Plan Ceibal has smoothed the education-to-work transition for high-school graduates, increasing the likelihood of landing a white-collar job regardless of socio-demographic characteristics as well as cognitive skills (as measured by Programme for International Student Assessment tests). While more research is needed, these results suggest that school connectivity may promote social mobility and help prepare children for the jobs of the future.
Recommendation Three: Subsidize Low-income Families with Children in School
One of the most signi�cant innovations in social policy in Latin America in recent decades has been the implementation of large-scale conditional cash transfer (CCT) programs. These programs aim at breaking intergenerational poverty by increasing present consumption among low-income households and inducing family investments in the health and education of their children. Numerous impact evaluation studies indicate that the programs have been particularly successful in promoting school enrolment and retention, although the evidence on longer term learning outcomes is mixed. A review of these programs concludes that “to maximize their potential effects on the accumulation of human capital, CCTs should be combined with other programs to improve the quality of the supply of health and education services, and should provide other supporting services” (Fiszbein and Schady 2009, 3).
This study provides evidence that the presence of school-age children in the household increases demand for residential broadband and has spillover effects on use by adults; however, it also shows that most families �nd current services unaffordable. These �ndings are very signi�cant, for they suggest an opportunity for governments to invest in human capital by providing targeted connectivity subsidies to low-income families as long as their children attend school, much like other government programs provide monetary support to families who meet educational requirements. While many initiatives in the region have focused on providing ICT devices for use within schools, these results suggest a latent demand for complementary programs that promote residential connectivity among low-income families with school-age children.
Residential connectivity subsidy programs for low-income families exist (in various forms) in several countries in the
regions.8 Yet several of these programs are neither targeted nor transparent, since there are no formal eligibility requirements and costs are often internalized by state-owned telecom operators. Linking Internet subsidies to schooling would greatly improve cost-effectiveness while promoting spillovers that remain unrealized due to affordability barriers.
CONCLUSIONIt is sometimes assumed that the diffusion of the Internet will resemble that of other technological innovations of the late nineteenth and early twentieth centuries such as electricity and broadcast radio. As coverage increased and prices dropped, these innovations became part of daily life for most Latin Americans. However, the �ndings in this chapter suggest that the drivers for Internet adoption are far more complex. While cost remains a signi�cant barrier for residential access, the results point to a combination of socio-economic and human capital factors that constrain Internet demand. Given that about half of the population remains unconnected, the current deceleration in the pace of growth of the online population represents a major policy challenge for the region.
At its most basic, the Internet is a general-purpose technology that allows individuals and �rms to share information in a vastly more ef�cient manner. As such, adoption is contingent on the acquisition of new skills and the availability of complementary products and services that make the underlying technology valuable. To date, public policies in Latin America have favoured supply-side initiatives, seeking policy reforms that promote competition and extend infrastructure coverage. The �ndings presented in this study con�rm that cost and availability continue to be important barriers for adoption; and yet they further suggest that targeted programs that also address motivational and skill-related factors will be necessary, and possibly more effective from a cost-bene�t perspective.
Overall, the results suggest an opportunity to complement infrastructure-deployment initiatives and regulatory reforms with targeted programs aimed at addressing connectivity barriers related to demand factors. Among the proposed programs are incentives for the creation of online content and services in indigenous languages, K–12 school connectivity initiatives, and a residential connectivity subsidy for low-income families linked to investments in human capital by recipients. Such programs can be expected to promote the acquisition of ICT skills and have signi�cant spillover effects to those who remain unconnected.
8 Most notably in Brazil (Programa Nacional de Banda Larga), Uruguay (Antel’s Universal Hogares) and Colombia (subsidy based on a household strati�cation system that determines eligibility for other utility subsidies).

CHAPTER ONE: HOW TO CONNECT THE OTHER HALF
HERNÁN GALPERIN • 23
WORKS CITEDBelo, Rodrigo, Pedro Ferreira and Rahul Telang.
Forthcoming. “Spillovers from Wiring Schools with Broadband: The Critical Role of Children.” Management Science.
Bet, Germán, Julián Cristia and Pablo Ibarrarán. 2014. “The Effects of Shared School Technology Access on Students’ Digital Skills in Peru.” IDB Working Paper Series No. 476. Washington, DC. Inter-American Development Bank.
Cardona, Mélisande, Anton Schwarz, Burcin Yurtoglu and Christine Zulehner. 2009. “Demand Estimation and Market De�nition for Broadband Internet Services.” Journal of Regulatory Economics 35: 70–95.
Centro de Estudios Distributivos, Laborales y Sociales. 2009. A Guide to the SEDLAC-Socio-Economic Database for Latin America and the Caribbean. Centro de Estudios Distributivos, Laborales y Sociales, Universidad Nacional de La Plata.
Chaudhuria, Anindya and Kenneth Flamm. 2007. “An Analysis of the Determinants of Broadband Access.” Telecommunications Policy 31: 312–26.
Chinn, Menzie and Robert Fairlie. 2010. “Use in the Developing World: An Analysis of Differences in Computer and Internet Penetration.” Review of International Economics 18: 153–67.
Clarke, George and Scott Wallsten. 2002. “Universal(ly Bad) Service: Providing Infrastructure Services to Rural and Poor Urban Consumers.” Policy Research Working Paper Series No. 2868. Washington, DC: World Bank.
Correa, Teresa, Joseph Straubhaar, Wenhong Chen and Jeremiah Spence. 2015. “Brokering New Technologies: The Role of Children in Their Parents’ Usage of the Internet.” New Media & Society 17 (4): 483–500.
Cristia, Julián, Alejo Czerwonko and Pablo Garofalo. 2014. “Does Technology in Schools Affect Repetition, Dropout and Enrollment? Evidence from Peru.” IDB Working Paper Series No. 477. Washington, DC: Inter-American Development Bank.
de Melo, Gioia, Alina Machado, Alfonso Miranda and Magdalena Viera. 2013. “Impacto del Plan Ceibal en el aprendizaje. Evidencia de la mayor experiencia OLPC.” Instituto de Economia DT 13/2013.
Di Maggio, Paul, Eszter Hargittai, Russell Neuman and John P. Robinson. 2001. “Social Implications of the Internet.” Annual Review of Sociology 27: 307–36.
Dodel, Matias. 2015. “E-skill’s Effect on Occupational Attainment: A PISA-Based Panel Study.” The Electronic Journal of Information Systems in Developing Countries 69 (3): 1–22.
Fiszbein, Ariel and Norbert Schady. 2009. Conditional Cash Transfers: Reducing Present and Future Poverty. World Bank Policy Research Report No. 47603. Washington, DC: World Bank.
Galperin, Hernán, Ignacio Alvarez-Hamelin and Fernanda Viecens. 2014. “Do Exchange Points Really Matter? Evidence from Bolivia.” Presented at the Telecommunication Policy Research Conference, Washington DC, September 12.
Galperin, Hernán and Christian Ruzzier. 2013. “Price Elasticity of Demand for Broadband: Evidence from Latin America and the Caribbean.” Telecommunications Policy 37: 429–38.
Goolsbee, Austan and Jonathan Guryan. 2006. “The Impact of Internet Subsidies in Public Schools.” The Review of Economics and Statistics 88 (2): 336–47.
GSMA Intelligence. 2015. Bridging the gender gap: Mobile access and usage in low- and middle-income countries. London: GSMA.
Helsper, Ellen and Bianca Reisdorf. 2013. “A Quantitative Examination of Explanations for Reasons for Internet Nonuse.” Cyberpsychology, Behavior, and Social Networking 16 (2): 94–99.
Horrigan, John B. and Maeve Duggan. 2015. “Home Broadband 2015.” Pew Research Center, December 21. www.pewinternet.org/2015/12/21/2015/Home-Broadband-2015.
ITU. 2015. Measuring the Information Society 2015. Geneva: ITU.
Katz, Raúl and Hernán Galperin. 2013. “The Demand Gap: Drivers and Public Policies.” In Broadband in Latin America: Beyond Connectivity, edited by Valeria Jordán, Hernán Galperin and Wilson Peres, 33–68. Santiago: United Nations.
López, Luis E. 2009. “Reaching the unreached: indigenous intercultural bilingual education in Latin America.” Background paper prepared for the Education for All Global Monitoring Report 2010. Paris: UNESCO.
Muñoz, Roberto and Juan Ortega. 2015. “¿Tienen la banda ancha y las TIC un impacto positivo sobre el rendimiento escolar? Evidencia para Chile.” El Trimestre Económico 82 (1): 53–87.
Napoli, Philip and Jonathan Obar. 2014. “The Emerging Mobile Internet Underclass: A Critique of Mobile Internet Access.” The Information Society 30 (5): 323–34.
Ortiz, Robert, Tim Green and HeeJeong Lim. 2011. “Families and Home Computer Use: Exploring Parent Perceptions of the Importance of Current Technology.” Urban Education 46(2): 202–15.
RESEARCH VOLUME SIX: THE SHIFTING GEOPOLITICS OF INTERNET ACCESS
24 • CENTRE FOR INTERNATIONAL GOVERNANCE INNOVATION • CHATHAM HOUSE
Rivoir, Ana L. and Susana Lamschtein. 2012. Cinco años del Plan Ceibal: Algo más que una computadora para cada niño. Montevideo: UNICEF.
Sey, Araba, Chis Coward, François Bar, George Sciadas, Chris Rothschild and Lucas Koepke. 2013. Connecting people for development: Why public access ICTs matter. Seattle: Technology & Social Change Group, University of Washington Information School.
Tengtrakul, Pitikorn and Jon M. Peha. 2013. “Does ICT in schools affect residential adoption and adult utilization outside schools?” Telecommunications Policy 37: 540–62.
UN Broadband Commission. 2015. The State of Broadband 2015. Geneva: ITU and UNESCO.
UNESCO. 2013. Uso de TIC en Educación en América Latina y el Caribe. Montreal: UNESCO.
Vannini, Laurent and Hervé Le Crosnier. 2012. Net.lang: Towards the Multicultural Cyberspace. Paris: C&F Editions.
World Bank. 2016. World Development Report 2016: Digital Dividends. Washington, DC: The World Bank Group.
ABOUT THE AUTHORHernán Galperin is a research associate professor at the Annenberg School for Communication at the University of Southern California. Previously, he was associate professor and director of the Center for Technology and Society at the Universidad de San Andrés (Argentina). He is also a steering committee member for Diálogo Regional sobre Sociedad de la Information, an information and communications technology policy research consortium in Latin America.
An expert on telecommunications policy and development, Hernán leads a number of research projects related to the regulation and impact of new information and communication technologies in Latin America, funded by a variety of foundations and international donors such as International Development Research Centre, Economic Commission for Latin America and the Caribbean, United States Agency for International Development and Inter-American Development Bank. He has published extensively in major journals such as Telecommunications Policy, Development Policy Review and Information Technologies & International Development. His most recent book is Information technologies for development: Opening the Internet black box (co-authored with Judith Mariscal).

CHAPTER ONE: HOW TO CONNECT THE OTHER HALF
HERNÁN GALPERIN • 25
Appendix A: Data Sources
Country Survey Source Sample size Year
Bolivia Encuesta de Hogares (EH) Instituto Nacional de Estadística (INE) 36,618 2014
Brazil Pesquisa Nacional por Amostra de Domicílio (PNAD)
Instituto Brasileiro de Geogra�a e Estatística (IBGE) 362,623 2014
Colombia Encuesta Nacional de Calidad de Vida (ENCV) Departamento Administrativo Nacional de Estadística (DANE) 76,026 2015
Ecuador Encuesta Nacional de Empleo, Desempleo y Subempleo (ENEMDU)
Instituto Nacional de Estadi�cas y Censos (INEC) 112,821 2015
Mexico Modulo Tecnología de Información en Hogares (MODUTIH)
Instituto Nacional de Estadística y Geografía (INEGI) 82,477 2014
Paraguay Encuesta Permanente de Hogares (EPH) Dirección General de Estadística, Encuestas y Censos (DGEEC) 20,272 2014
Peru Encuesta Residencial de Servicios de Telecomunicaciones (ERESTEL)
Organismo Supervisor de Inversión Privada en Telecomunicaciones (OSIPTEL) 53,203 2014
Uruguay Encuesta Continua de Hogares (ECH) Instituto Nacional de Estadística (INE) 131,857 2014

RESEARCH VOLUME SIX: THE SHIFTING GEOPOLITICS OF INTERNET ACCESS
26 • CENTRE FOR INTERNATIONAL GOVERNANCE INNOVATION • CHATHAM HOUSE
Appendix B: Probability Models Table 1: Likelihood of Having Residential Access (Yes = 1)
BOL BRA COL ECU MEX PER PRY URY
Age 0.001 0.000 -0.000 0.001 0.002 -0.001 0.000 0.001
(0.000)** (0.000)*** (0.000) (0.000)*** (0.000)*** (0.000)*** (0.000) (0.000)***
Gender (1 = male) -0.024 0.009 0.012 -0.000 -0.000 -0.034 -0.004 0.028
(0.008)*** (0.001)*** (0.005)** (0.004) (0.005) (0.008)*** (0.008) (0.003)***
Primary complete -0.004 0.012 0.014 0.010 0.024 0.009 0.008 0.009
(0.007) (0.003)*** (0.006)** (0.004)*** (0.006)*** (0.009) (0.010) (0.005)*
Secondary incomplete -0.003 0.007 0.038 0.032 0.067 -0.000 -0.009 0.084
(0.010) (0.004)** (0.007)*** (0.006)*** (0.006)*** (0.010) (0.011) (0.005)***
Secondary complete 0.025 0.036 0.065 0.072 0.091 0.037 -0.004 0.131
(0.009)*** (0.002)*** (0.008)*** (0.006)*** (0.008)*** (0.009)*** (0.016) (0.007)***
Tertiary incomplete 0.115 0.072 0.114 0.117 0.107 0.092 0.024 0.146
(0.016)*** (0.004)*** (0.014)*** (0.010)*** (0.015)*** (0.015)*** (0.019) (0.007)***
Tertiary complete 0.163 0.090 0.122 0.151 0.145 0.108 0.145 0.123
(0.016)*** (0.003)*** (0.010)*** (0.008)*** (0.008)*** (0.012)*** (0.019)*** (0.007)***
Household income p/c (log) 0.019 0.029 0.049 0.030 0.036 0.061 0.031 0.132
(0.004)*** (0.001)*** (0.003)*** (0.002)*** (0.003)*** (0.004)*** (0.005)*** (0.003)***
Household size 0.013 0.005 0.014 0.008 0.009 0.024 0.002 0.008
(0.002)*** (0.001)*** (0.001)*** (0.001)*** (0.001)*** (0.002)*** (0.002) (0.002)***
Location (1 = urban) 0.053 0.030 0.084 0.043 0.057 0.047 -0.005 -0.017
(0.006)*** (0.002)*** (0.005)*** (0.004)*** (0.004)*** (0.007)*** (0.008) (0.008)**
Inactive (1 = yes) -0.018 -0.009 0.029 -0.010 0.024 n/a 0.012 0.007
(0.031) (0.005)* (0.015)* (0.016) (0.018) n/a (0.024) (0.012)
Employed (1 = yes) -0.017 -0.013 0.006 -0.007 0.000 -0.014 0.010 0.037
(0.029) (0.005)*** (0.014) (0.015) (0.017) (0.010) (0.023) (0.012)***
PC or tablet in household (1 = yes)
0.225 0.806 0.548 0.640 0.656 0.511 0.689 0.735
(0.011)*** (0.002)*** (0.007)*** (0.006)*** (0.005)*** (0.009)*** (0.015)*** (0.004)***
Language (1 = not Spanish) -0.036 n/a n/a -0.002 n/a -0.038 -0.005 n/a
(0.006)*** n/a n/a (0.004) n/a (0.008)*** (0.008) n/a
Children (1 = yes) -0.012 0.012 -0.000 0.025 -0.000 -0.013 0.008 -0.083
(0.009) (0.002)*** (0.006) (0.005)*** (0.005) (0.008) (0.009) (0.004)***
Constant -0.152 -0.230 -0.298 -0.288 -0.293 -0.276 -0.187 -0.910
(0.038)*** (0.007)*** (0.020)*** (0.020)*** (0.023)*** (0.029)*** (0.034)*** (0.023)***
Observations 9,753 121,241 22,879 29,653 26,911 14,401 4,438 48,461
R-squared 0.214 0.770 0.504 0.615 0.560 0.411 0.692 0.606
Mean 0.160 0.410 0.308 0.302 0.397 0.322 0.229 0.563
Note: Standard errors in parentheses *** p<0.01, ** p<0.05, * p<0.1.
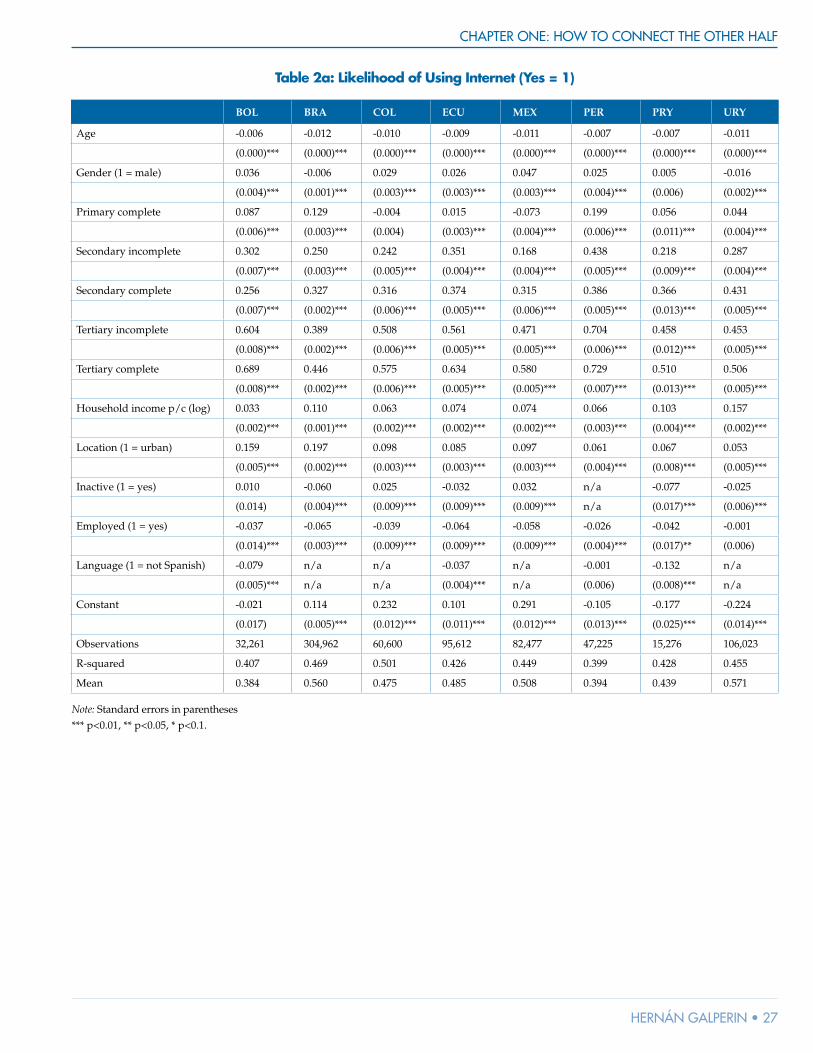
CHAPTER ONE: HOW TO CONNECT THE OTHER HALF
HERNÁN GALPERIN • 27
Table 2a: Likelihood of Using Internet (Yes = 1)
BOL BRA COL ECU MEX PER PRY URY
Age -0.006 -0.012 -0.010 -0.009 -0.011 -0.007 -0.007 -0.011
(0.000)*** (0.000)*** (0.000)*** (0.000)*** (0.000)*** (0.000)*** (0.000)*** (0.000)***
Gender (1 = male) 0.036 -0.006 0.029 0.026 0.047 0.025 0.005 -0.016
(0.004)*** (0.001)*** (0.003)*** (0.003)*** (0.003)*** (0.004)*** (0.006) (0.002)***
Primary complete 0.087 0.129 -0.004 0.015 -0.073 0.199 0.056 0.044
(0.006)*** (0.003)*** (0.004) (0.003)*** (0.004)*** (0.006)*** (0.011)*** (0.004)***
Secondary incomplete 0.302 0.250 0.242 0.351 0.168 0.438 0.218 0.287
(0.007)*** (0.003)*** (0.005)*** (0.004)*** (0.004)*** (0.005)*** (0.009)*** (0.004)***
Secondary complete 0.256 0.327 0.316 0.374 0.315 0.386 0.366 0.431
(0.007)*** (0.002)*** (0.006)*** (0.005)*** (0.006)*** (0.005)*** (0.013)*** (0.005)***
Tertiary incomplete 0.604 0.389 0.508 0.561 0.471 0.704 0.458 0.453
(0.008)*** (0.002)*** (0.006)*** (0.005)*** (0.005)*** (0.006)*** (0.012)*** (0.005)***
Tertiary complete 0.689 0.446 0.575 0.634 0.580 0.729 0.510 0.506
(0.008)*** (0.002)*** (0.006)*** (0.005)*** (0.005)*** (0.007)*** (0.013)*** (0.005)***
Household income p/c (log) 0.033 0.110 0.063 0.074 0.074 0.066 0.103 0.157
(0.002)*** (0.001)*** (0.002)*** (0.002)*** (0.002)*** (0.003)*** (0.004)*** (0.002)***
Location (1 = urban) 0.159 0.197 0.098 0.085 0.097 0.061 0.067 0.053
(0.005)*** (0.002)*** (0.003)*** (0.003)*** (0.003)*** (0.004)*** (0.008)*** (0.005)***
Inactive (1 = yes) 0.010 -0.060 0.025 -0.032 0.032 n/a -0.077 -0.025
(0.014) (0.004)*** (0.009)*** (0.009)*** (0.009)*** n/a (0.017)*** (0.006)***
Employed (1 = yes) -0.037 -0.065 -0.039 -0.064 -0.058 -0.026 -0.042 -0.001
(0.014)*** (0.003)*** (0.009)*** (0.009)*** (0.009)*** (0.004)*** (0.017)** (0.006)
Language (1 = not Spanish) -0.079 n/a n/a -0.037 n/a -0.001 -0.132 n/a
(0.005)*** n/a n/a (0.004)*** n/a (0.006) (0.008)*** n/a
Constant -0.021 0.114 0.232 0.101 0.291 -0.105 -0.177 -0.224
(0.017) (0.005)*** (0.012)*** (0.011)*** (0.012)*** (0.013)*** (0.025)*** (0.014)***
Observations 32,261 304,962 60,600 95,612 82,477 47,225 15,276 106,023
R-squared 0.407 0.469 0.501 0.426 0.449 0.399 0.428 0.455
Mean 0.384 0.560 0.475 0.485 0.508 0.394 0.439 0.571
Note: Standard errors in parentheses *** p<0.01, ** p<0.05, * p<0.1.
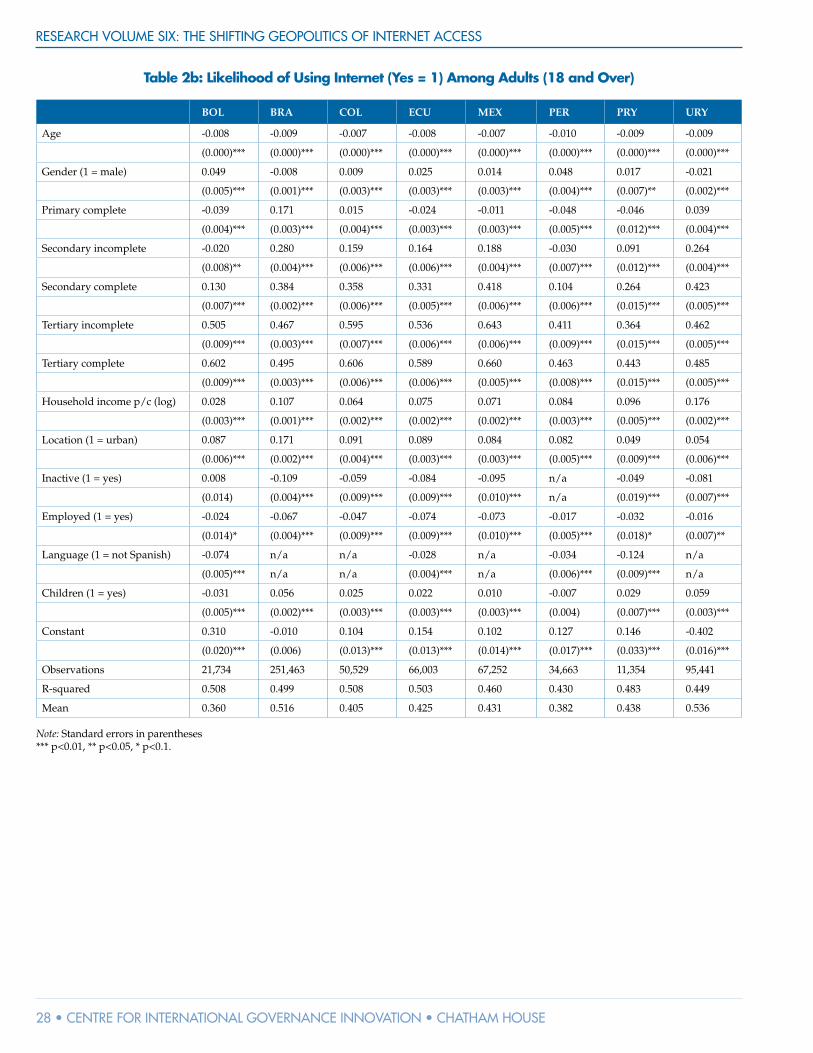
RESEARCH VOLUME SIX: THE SHIFTING GEOPOLITICS OF INTERNET ACCESS
28 • CENTRE FOR INTERNATIONAL GOVERNANCE INNOVATION • CHATHAM HOUSE
Table 2b: Likelihood of Using Internet (Yes = 1) Among Adults (18 and Over)
BOL BRA COL ECU MEX PER PRY URY
Age -0.008 -0.009 -0.007 -0.008 -0.007 -0.010 -0.009 -0.009
(0.000)*** (0.000)*** (0.000)*** (0.000)*** (0.000)*** (0.000)*** (0.000)*** (0.000)***
Gender (1 = male) 0.049 -0.008 0.009 0.025 0.014 0.048 0.017 -0.021
(0.005)*** (0.001)*** (0.003)*** (0.003)*** (0.003)*** (0.004)*** (0.007)** (0.002)***
Primary complete -0.039 0.171 0.015 -0.024 -0.011 -0.048 -0.046 0.039
(0.004)*** (0.003)*** (0.004)*** (0.003)*** (0.003)*** (0.005)*** (0.012)*** (0.004)***
Secondary incomplete -0.020 0.280 0.159 0.164 0.188 -0.030 0.091 0.264
(0.008)** (0.004)*** (0.006)*** (0.006)*** (0.004)*** (0.007)*** (0.012)*** (0.004)***
Secondary complete 0.130 0.384 0.358 0.331 0.418 0.104 0.264 0.423
(0.007)*** (0.002)*** (0.006)*** (0.005)*** (0.006)*** (0.006)*** (0.015)*** (0.005)***
Tertiary incomplete 0.505 0.467 0.595 0.536 0.643 0.411 0.364 0.462
(0.009)*** (0.003)*** (0.007)*** (0.006)*** (0.006)*** (0.009)*** (0.015)*** (0.005)***
Tertiary complete 0.602 0.495 0.606 0.589 0.660 0.463 0.443 0.485
(0.009)*** (0.003)*** (0.006)*** (0.006)*** (0.005)*** (0.008)*** (0.015)*** (0.005)***
Household income p/c (log) 0.028 0.107 0.064 0.075 0.071 0.084 0.096 0.176
(0.003)*** (0.001)*** (0.002)*** (0.002)*** (0.002)*** (0.003)*** (0.005)*** (0.002)***
Location (1 = urban) 0.087 0.171 0.091 0.089 0.084 0.082 0.049 0.054
(0.006)*** (0.002)*** (0.004)*** (0.003)*** (0.003)*** (0.005)*** (0.009)*** (0.006)***
Inactive (1 = yes) 0.008 -0.109 -0.059 -0.084 -0.095 n/a -0.049 -0.081
(0.014) (0.004)*** (0.009)*** (0.009)*** (0.010)*** n/a (0.019)*** (0.007)***
Employed (1 = yes) -0.024 -0.067 -0.047 -0.074 -0.073 -0.017 -0.032 -0.016
(0.014)* (0.004)*** (0.009)*** (0.009)*** (0.010)*** (0.005)*** (0.018)* (0.007)**
Language (1 = not Spanish) -0.074 n/a n/a -0.028 n/a -0.034 -0.124 n/a
(0.005)*** n/a n/a (0.004)*** n/a (0.006)*** (0.009)*** n/a
Children (1 = yes) -0.031 0.056 0.025 0.022 0.010 -0.007 0.029 0.059
(0.005)*** (0.002)*** (0.003)*** (0.003)*** (0.003)*** (0.004) (0.007)*** (0.003)***
Constant 0.310 -0.010 0.104 0.154 0.102 0.127 0.146 -0.402
(0.020)*** (0.006) (0.013)*** (0.013)*** (0.014)*** (0.017)*** (0.033)*** (0.016)***
Observations 21,734 251,463 50,529 66,003 67,252 34,663 11,354 95,441
R-squared 0.508 0.499 0.508 0.503 0.460 0.430 0.483 0.449
Mean 0.360 0.516 0.405 0.425 0.431 0.382 0.438 0.536
Note: Standard errors in parentheses *** p<0.01, ** p<0.05, * p<0.1.
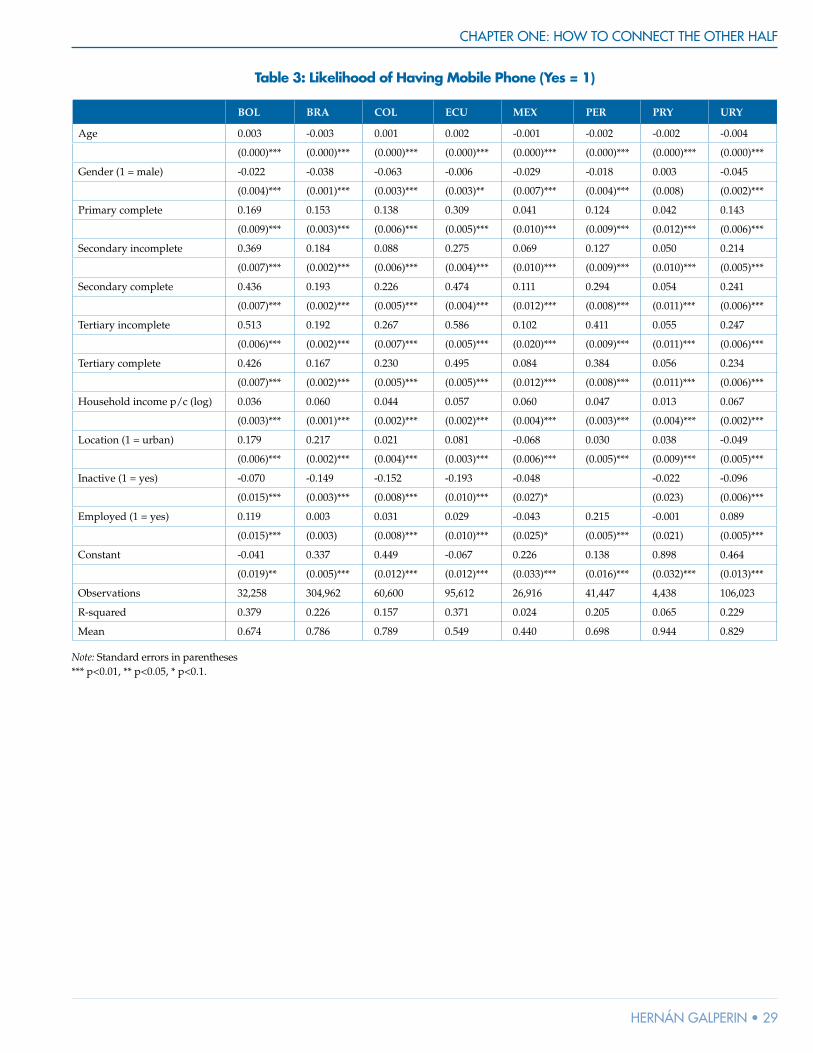
CHAPTER ONE: HOW TO CONNECT THE OTHER HALF
HERNÁN GALPERIN • 29
Table 3: Likelihood of Having Mobile Phone (Yes = 1)
BOL BRA COL ECU MEX PER PRY URY
Age 0.003 -0.003 0.001 0.002 -0.001 -0.002 -0.002 -0.004
(0.000)*** (0.000)*** (0.000)*** (0.000)*** (0.000)*** (0.000)*** (0.000)*** (0.000)***
Gender (1 = male) -0.022 -0.038 -0.063 -0.006 -0.029 -0.018 0.003 -0.045
(0.004)*** (0.001)*** (0.003)*** (0.003)** (0.007)*** (0.004)*** (0.008) (0.002)***
Primary complete 0.169 0.153 0.138 0.309 0.041 0.124 0.042 0.143
(0.009)*** (0.003)*** (0.006)*** (0.005)*** (0.010)*** (0.009)*** (0.012)*** (0.006)***
Secondary incomplete 0.369 0.184 0.088 0.275 0.069 0.127 0.050 0.214
(0.007)*** (0.002)*** (0.006)*** (0.004)*** (0.010)*** (0.009)*** (0.010)*** (0.005)***
Secondary complete 0.436 0.193 0.226 0.474 0.111 0.294 0.054 0.241
(0.007)*** (0.002)*** (0.005)*** (0.004)*** (0.012)*** (0.008)*** (0.011)*** (0.006)***
Tertiary incomplete 0.513 0.192 0.267 0.586 0.102 0.411 0.055 0.247
(0.006)*** (0.002)*** (0.007)*** (0.005)*** (0.020)*** (0.009)*** (0.011)*** (0.006)***
Tertiary complete 0.426 0.167 0.230 0.495 0.084 0.384 0.056 0.234
(0.007)*** (0.002)*** (0.005)*** (0.005)*** (0.012)*** (0.008)*** (0.011)*** (0.006)***
Household income p/c (log) 0.036 0.060 0.044 0.057 0.060 0.047 0.013 0.067
(0.003)*** (0.001)*** (0.002)*** (0.002)*** (0.004)*** (0.003)*** (0.004)*** (0.002)***
Location (1 = urban) 0.179 0.217 0.021 0.081 -0.068 0.030 0.038 -0.049
(0.006)*** (0.002)*** (0.004)*** (0.003)*** (0.006)*** (0.005)*** (0.009)*** (0.005)***
Inactive (1 = yes) -0.070 -0.149 -0.152 -0.193 -0.048 -0.022 -0.096
(0.015)*** (0.003)*** (0.008)*** (0.010)*** (0.027)* (0.023) (0.006)***
Employed (1 = yes) 0.119 0.003 0.031 0.029 -0.043 0.215 -0.001 0.089
(0.015)*** (0.003) (0.008)*** (0.010)*** (0.025)* (0.005)*** (0.021) (0.005)***
Constant -0.041 0.337 0.449 -0.067 0.226 0.138 0.898 0.464
(0.019)** (0.005)*** (0.012)*** (0.012)*** (0.033)*** (0.016)*** (0.032)*** (0.013)***
Observations 32,258 304,962 60,600 95,612 26,916 41,447 4,438 106,023
R-squared 0.379 0.226 0.157 0.371 0.024 0.205 0.065 0.229
Mean 0.674 0.786 0.789 0.549 0.440 0.698 0.944 0.829
Note: Standard errors in parentheses *** p<0.01, ** p<0.05, * p<0.1.

RESEARCH VOLUME SIX: THE SHIFTING GEOPOLITICS OF INTERNET ACCESS
30 • CENTRE FOR INTERNATIONAL GOVERNANCE INNOVATION • CHATHAM HOUSE
Table 4: Likelihood of Using Mobile Internet (Yes = 1)
COL ECU MEX PER PRY
Age -0.006 -0.002 -0.003 -0.004 -0.006
(0.000)*** (0.000)*** (0.000)*** (0.000)*** (0.000)***
Gender (1 = male) -0.013 0.004 -0.002 0.021 -0.008
(0.003)*** (0.002)** (0.002) (0.003)*** (0.007)
Primary complete -0.019 0.042 -0.021 -0.035 0.075
(0.003)*** (0.002)*** (0.002)*** (0.004)*** (0.011)***
Secondary incomplete 0.050 0.102 0.011 -0.046 0.223
(0.004)*** (0.002)*** (0.002)*** (0.004)*** (0.009)***
Secondary complete 0.155 0.201 0.048 -0.014 0.391
(0.005)*** (0.004)*** (0.004)*** (0.004)*** (0.013)***
Tertiary incomplete 0.289 0.389 0.109 0.106 0.446
(0.008)*** (0.006)*** (0.007)*** (0.007)*** (0.013)***
Tertiary complete 0.303 0.373 0.092 0.092 0.425
(0.007)*** (0.006)*** (0.005)*** (0.006)*** (0.015)***
Household income p/c (log) 0.052 0.045 0.034 0.031 0.074
(0.002)*** (0.001)*** (0.001)*** (0.002)*** (0.004)***
Location (1 = urban) 0.048 0.035 0.025 0.005 0.102
(0.003)*** (0.002)*** (0.002)*** (0.003) (0.007)***
Inactive (1 = yes) -0.053 -0.080 -0.047 -0.094
(0.009)*** (0.010)*** (0.009)*** (0.018)***
Employed (1 = yes) -0.020 -0.015 -0.017 0.028 -0.042
(0.009)** (0.010) (0.009)* (0.003)*** (0.018)**
Household access 0.233 0.120 0.135 0.282 0.074
(0.004)*** (0.003)*** (0.003)*** (0.004)*** (0.009)***
Constant 0.087 -0.124 0.017 0.013 -0.029
(0.012)*** (0.012)*** (0.011) (0.010) (0.026)
Observations 60,581 97,519 82,539 41,447 15,279
R-squared 0.353 0.274 0.136 0.270 0.343
Mean 0.296 0.173 0.133 0.158 0.388
Note: Standard errors in parentheses *** p<0.01, ** p<0.05, * p<0.1.

CHAPTER ONE: HOW TO CONNECT THE OTHER HALF
HERNÁN GALPERIN • 31
Table 5: Likelihood of Citing Barrier for Residential Adoption — Colombia (2015)
Cost Interest Skills Availability Other
Age -0.003 0.003 0.002 -0.001 -0.001
(0.000)*** (0.000)*** (0.000)*** (0.000)*** (0.000)***
Gender (1 = male) -0.053 0.031 0.010 0.007 0.001
(0.009)*** (0.008)*** (0.004)** (0.003)** (0.006)
Primary complete 0.014 0.003 -0.023 0.002 0.004
(0.011) (0.010) (0.006)*** (0.005) (0.007)
Secondary incomplete 0.003 0.001 -0.032 0.001 0.024
(0.012) (0.011) (0.006)*** (0.005) (0.008)***
Secondary complete -0.030 0.023 -0.045 0.006 0.039
(0.013)** (0.012)** (0.005)*** (0.006) (0.009)***
Tertiary incomplete -0.044 0.027 -0.050 0.021 0.039
(0.027) (0.025) (0.007)*** (0.014) (0.020)**
Tertiary complete -0.091 0.046 -0.051 0.021 0.051
(0.018)*** (0.017)*** (0.007)*** (0.009)** (0.013)***
Household income p/c (log) -0.047 0.035 -0.010 0.012 0.008
(0.005)*** (0.004)*** (0.003)*** (0.002)*** (0.003)***
Household size 0.032 -0.021 -0.017 0.003 0.004
(0.003)*** (0.002)*** (0.001)*** (0.001)** (0.002)**
Location (1 = urban) 0.059 -0.009 -0.010 -0.077 0.028
(0.008)*** (0.008) (0.004)** (0.004)*** (0.005)***
Inactive (1 = yes) -0.085 0.064 0.004 -0.002 0.022
(0.025)*** (0.021)*** (0.011) (0.010) (0.017)
Employed (1 = yes) -0.051 0.026 0.008 -0.003 0.023
(0.024)** (0.020) (0.010) (0.010) (0.016)
PC or tablet in household (1 = yes) 0.009 -0.068 -0.018 0.083 -0.039
(0.012) (0.010)*** (0.003)*** (0.007)*** (0.008)***
Children (1 = yes) 0.151 -0.144 -0.040 0.013 0.023
(0.010)*** (0.009)*** (0.004)*** (0.005)*** (0.007)***
Constant 0.718 0.080 0.110 0.026 0.061
(0.035)*** (0.032)** (0.017)*** (0.014)* (0.024)***
Observations 15,835 15,835 15,835 15,835 15,835
R-squared 0.111 0.094 0.076 0.057 0.017
Mean 0.440 0.316 0.0662 0.0476 0.110
Note: Standard errors in parentheses *** p<0.01, ** p<0.05, * p<0.1.
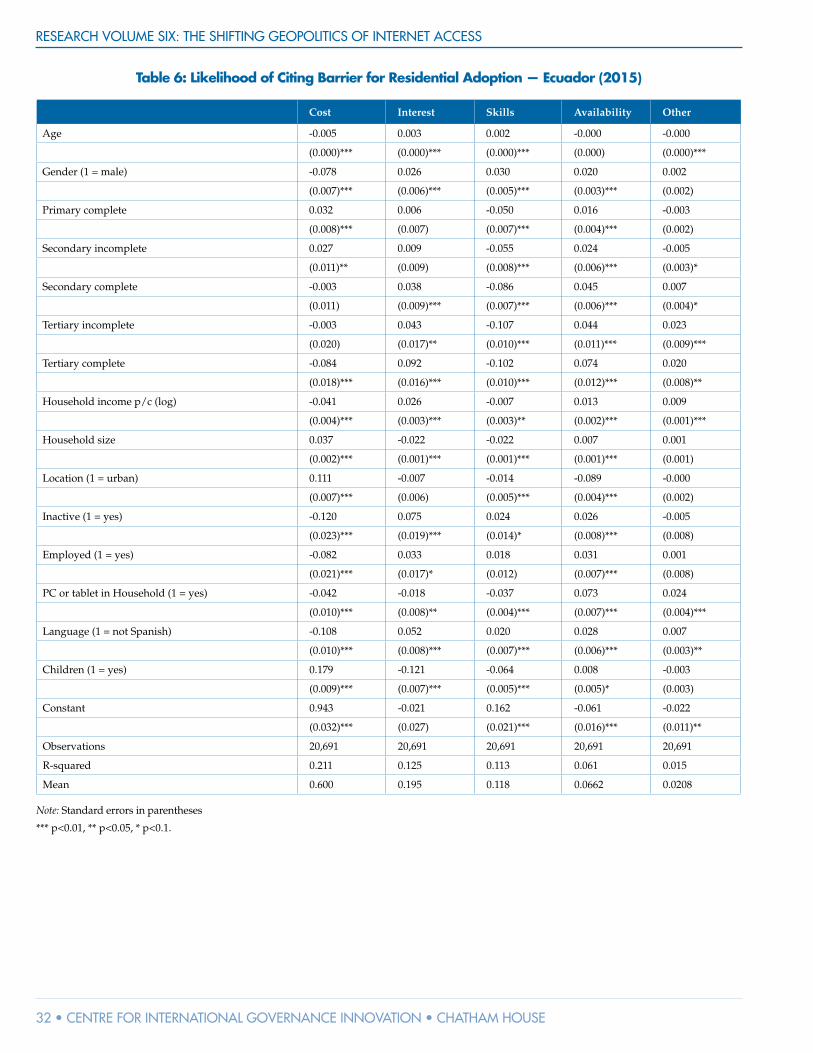
RESEARCH VOLUME SIX: THE SHIFTING GEOPOLITICS OF INTERNET ACCESS
32 • CENTRE FOR INTERNATIONAL GOVERNANCE INNOVATION • CHATHAM HOUSE
Table 6: Likelihood of Citing Barrier for Residential Adoption — Ecuador (2015)
Cost Interest Skills Availability Other
Age -0.005 0.003 0.002 -0.000 -0.000
(0.000)*** (0.000)*** (0.000)*** (0.000) (0.000)***
Gender (1 = male) -0.078 0.026 0.030 0.020 0.002
(0.007)*** (0.006)*** (0.005)*** (0.003)*** (0.002)
Primary complete 0.032 0.006 -0.050 0.016 -0.003
(0.008)*** (0.007) (0.007)*** (0.004)*** (0.002)
Secondary incomplete 0.027 0.009 -0.055 0.024 -0.005
(0.011)** (0.009) (0.008)*** (0.006)*** (0.003)*
Secondary complete -0.003 0.038 -0.086 0.045 0.007
(0.011) (0.009)*** (0.007)*** (0.006)*** (0.004)*
Tertiary incomplete -0.003 0.043 -0.107 0.044 0.023
(0.020) (0.017)** (0.010)*** (0.011)*** (0.009)***
Tertiary complete -0.084 0.092 -0.102 0.074 0.020
(0.018)*** (0.016)*** (0.010)*** (0.012)*** (0.008)**
Household income p/c (log) -0.041 0.026 -0.007 0.013 0.009
(0.004)*** (0.003)*** (0.003)** (0.002)*** (0.001)***
Household size 0.037 -0.022 -0.022 0.007 0.001
(0.002)*** (0.001)*** (0.001)*** (0.001)*** (0.001)
Location (1 = urban) 0.111 -0.007 -0.014 -0.089 -0.000
(0.007)*** (0.006) (0.005)*** (0.004)*** (0.002)
Inactive (1 = yes) -0.120 0.075 0.024 0.026 -0.005
(0.023)*** (0.019)*** (0.014)* (0.008)*** (0.008)
Employed (1 = yes) -0.082 0.033 0.018 0.031 0.001
(0.021)*** (0.017)* (0.012) (0.007)*** (0.008)
PC or tablet in Household (1 = yes) -0.042 -0.018 -0.037 0.073 0.024
(0.010)*** (0.008)** (0.004)*** (0.007)*** (0.004)***
Language (1 = not Spanish) -0.108 0.052 0.020 0.028 0.007
(0.010)*** (0.008)*** (0.007)*** (0.006)*** (0.003)**
Children (1 = yes) 0.179 -0.121 -0.064 0.008 -0.003
(0.009)*** (0.007)*** (0.005)*** (0.005)* (0.003)
Constant 0.943 -0.021 0.162 -0.061 -0.022
(0.032)*** (0.027) (0.021)*** (0.016)*** (0.011)**
Observations 20,691 20,691 20,691 20,691 20,691
R-squared 0.211 0.125 0.113 0.061 0.015
Mean 0.600 0.195 0.118 0.0662 0.0208
Note: Standard errors in parentheses
*** p<0.01, ** p<0.05, * p<0.1.
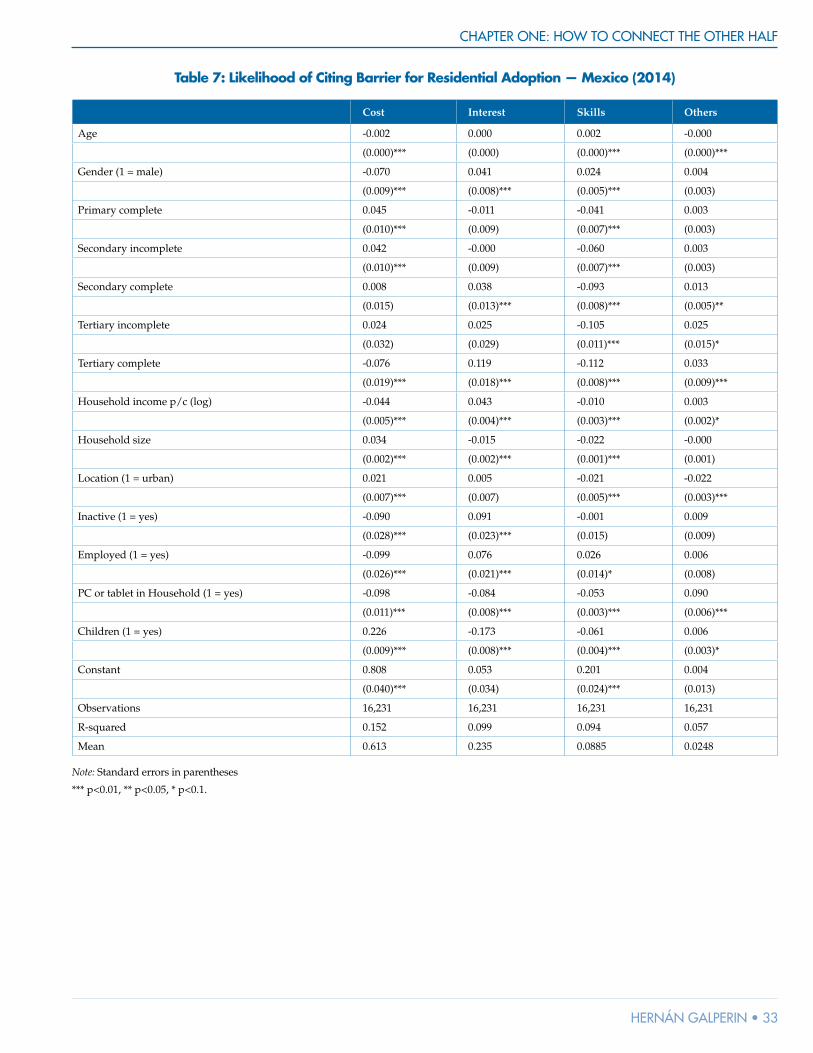
CHAPTER ONE: HOW TO CONNECT THE OTHER HALF
HERNÁN GALPERIN • 33
Table 7: Likelihood of Citing Barrier for Residential Adoption — Mexico (2014)
Cost Interest Skills Others
Age -0.002 0.000 0.002 -0.000
(0.000)*** (0.000) (0.000)*** (0.000)***
Gender (1 = male) -0.070 0.041 0.024 0.004
(0.009)*** (0.008)*** (0.005)*** (0.003)
Primary complete 0.045 -0.011 -0.041 0.003
(0.010)*** (0.009) (0.007)*** (0.003)
Secondary incomplete 0.042 -0.000 -0.060 0.003
(0.010)*** (0.009) (0.007)*** (0.003)
Secondary complete 0.008 0.038 -0.093 0.013
(0.015) (0.013)*** (0.008)*** (0.005)**
Tertiary incomplete 0.024 0.025 -0.105 0.025
(0.032) (0.029) (0.011)*** (0.015)*
Tertiary complete -0.076 0.119 -0.112 0.033
(0.019)*** (0.018)*** (0.008)*** (0.009)***
Household income p/c (log) -0.044 0.043 -0.010 0.003
(0.005)*** (0.004)*** (0.003)*** (0.002)*
Household size 0.034 -0.015 -0.022 -0.000
(0.002)*** (0.002)*** (0.001)*** (0.001)
Location (1 = urban) 0.021 0.005 -0.021 -0.022
(0.007)*** (0.007) (0.005)*** (0.003)***
Inactive (1 = yes) -0.090 0.091 -0.001 0.009
(0.028)*** (0.023)*** (0.015) (0.009)
Employed (1 = yes) -0.099 0.076 0.026 0.006
(0.026)*** (0.021)*** (0.014)* (0.008)
PC or tablet in Household (1 = yes) -0.098 -0.084 -0.053 0.090
(0.011)*** (0.008)*** (0.003)*** (0.006)***
Children (1 = yes) 0.226 -0.173 -0.061 0.006
(0.009)*** (0.008)*** (0.004)*** (0.003)*
Constant 0.808 0.053 0.201 0.004
(0.040)*** (0.034) (0.024)*** (0.013)
Observations 16,231 16,231 16,231 16,231
R-squared 0.152 0.099 0.094 0.057
Mean 0.613 0.235 0.0885 0.0248
Note: Standard errors in parentheses
*** p<0.01, ** p<0.05, * p<0.1.

RESEARCH VOLUME SIX: THE SHIFTING GEOPOLITICS OF INTERNET ACCESS
34 • CENTRE FOR INTERNATIONAL GOVERNANCE INNOVATION • CHATHAM HOUSE
Table 8: Likelihood of Citing Barrier for Residential Adoption — Peru (2014)
Cost Interest Skills Availability Other
Age -0.001 0.005 0.000 -0.001 -0.002
(0.000)*** (0.000)*** (0.000)*** (0.000)*** (0.000)***
Gender (1 = male) -0.033 0.018 -0.003 0.012 -0.010
(0.011)*** (0.012) (0.003) (0.006)** (0.009)
Primary complete 0.006 -0.038 -0.005 0.009 0.004
(0.014) (0.016)** (0.003) (0.009) (0.011)
Secondary incomplete 0.007 -0.017 -0.007 -0.006 0.015
(0.016) (0.017) (0.003)** (0.010) (0.013)
Secondary complete -0.010 -0.043 -0.005 -0.015 0.026
(0.014) (0.015)*** (0.003) (0.008)* (0.011)**
Tertiary incomplete -0.013 -0.066 -0.010 0.002 0.032
(0.022) (0.024)*** (0.003)*** (0.013) (0.019)*
Tertiary complete -0.037 -0.056 -0.007 -0.020 0.036
(0.018)** (0.020)*** (0.004)* (0.009)** (0.015)**
Household income p/c (log) -0.025 -0.020 0.001 0.004 0.018
(0.006)*** (0.007)*** (0.001) (0.004) (0.005)***
Household size 0.017 -0.038 -0.002 0.006 0.009
(0.003)*** (0.004)*** (0.001)*** (0.002)*** (0.003)***
Location (1 = urban) 0.084 0.034 -0.003 -0.154 0.044
(0.010)*** (0.011)*** (0.002) (0.007)*** (0.008)***
Employed (1 = yes) 0.012 -0.018 0.004 -0.008 -0.002
(0.014) (0.016) (0.004) (0.007) (0.011)
PC or tablet in household (1 = yes) 0.036 -0.104 -0.004 -0.011 -0.102
(0.013)*** (0.013)*** (0.001)*** (0.006)* (0.009)***
Language (1 = not Spanish) -0.043 0.012 0.001 -0.011 -0.020
(0.012)*** (0.013) (0.003) (0.008) (0.009)**
Children (1 = yes) 0.055 -0.125 0.000 0.007 0.000
(0.011)*** (0.012)*** (0.002) (0.007) (0.009)
Constant 0.301 0.469 0.001 0.206 0.091
(0.041)*** (0.047)*** (0.009) (0.026)*** (0.035)**
Observations 9,769 9,769 9,769 9,769 9,769
R-squared 0.034 0.112 0.010 0.095 0.023
Mean 0.240 0.395 0.00727 0.0712 0.150
Note: Standard errors in parentheses
*** p<0.01, ** p<0.05, * p<0.1.
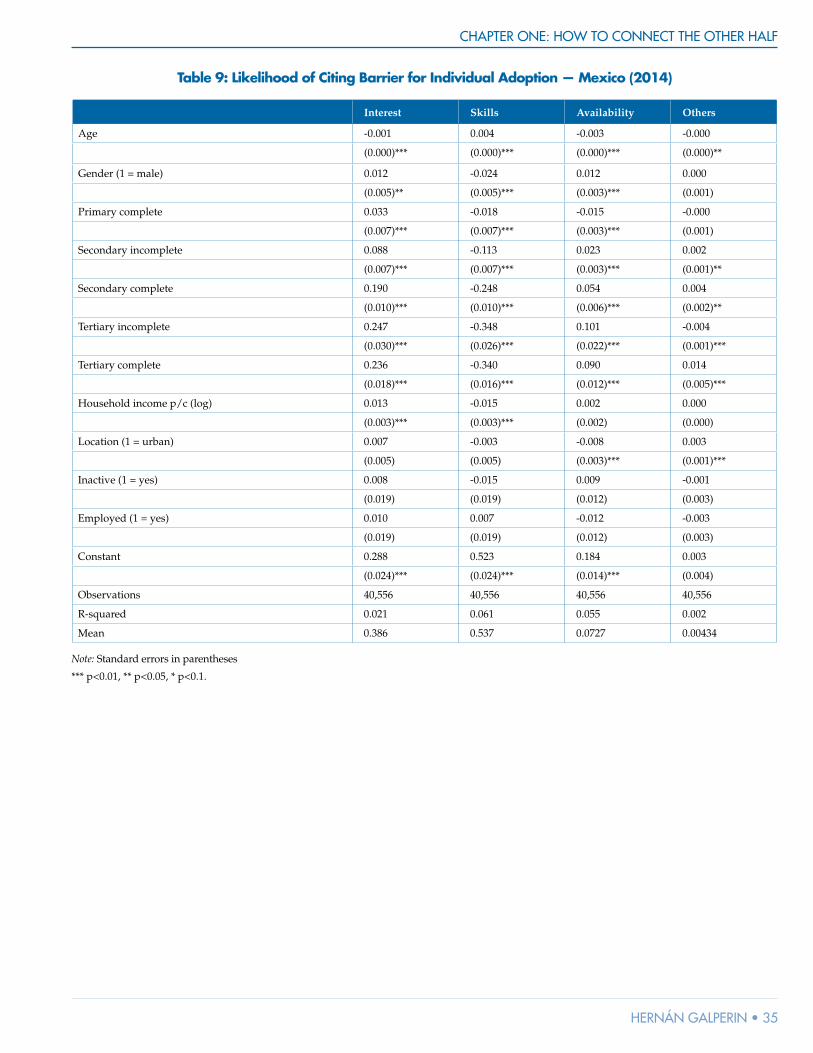
CHAPTER ONE: HOW TO CONNECT THE OTHER HALF
HERNÁN GALPERIN • 35
Table 9: Likelihood of Citing Barrier for Individual Adoption — Mexico (2014)
Interest Skills Availability Others
Age -0.001 0.004 -0.003 -0.000
(0.000)*** (0.000)*** (0.000)*** (0.000)**
Gender (1 = male) 0.012 -0.024 0.012 0.000
(0.005)** (0.005)*** (0.003)*** (0.001)
Primary complete 0.033 -0.018 -0.015 -0.000
(0.007)*** (0.007)*** (0.003)*** (0.001)
Secondary incomplete 0.088 -0.113 0.023 0.002
(0.007)*** (0.007)*** (0.003)*** (0.001)**
Secondary complete 0.190 -0.248 0.054 0.004
(0.010)*** (0.010)*** (0.006)*** (0.002)**
Tertiary incomplete 0.247 -0.348 0.101 -0.004
(0.030)*** (0.026)*** (0.022)*** (0.001)***
Tertiary complete 0.236 -0.340 0.090 0.014
(0.018)*** (0.016)*** (0.012)*** (0.005)***
Household income p/c (log) 0.013 -0.015 0.002 0.000
(0.003)*** (0.003)*** (0.002) (0.000)
Location (1 = urban) 0.007 -0.003 -0.008 0.003
(0.005) (0.005) (0.003)*** (0.001)***
Inactive (1 = yes) 0.008 -0.015 0.009 -0.001
(0.019) (0.019) (0.012) (0.003)
Employed (1 = yes) 0.010 0.007 -0.012 -0.003
(0.019) (0.019) (0.012) (0.003)
Constant 0.288 0.523 0.184 0.003
(0.024)*** (0.024)*** (0.014)*** (0.004)
Observations 40,556 40,556 40,556 40,556
R-squared 0.021 0.061 0.055 0.002
Mean 0.386 0.537 0.0727 0.00434
Note: Standard errors in parentheses
*** p<0.01, ** p<0.05, * p<0.1.
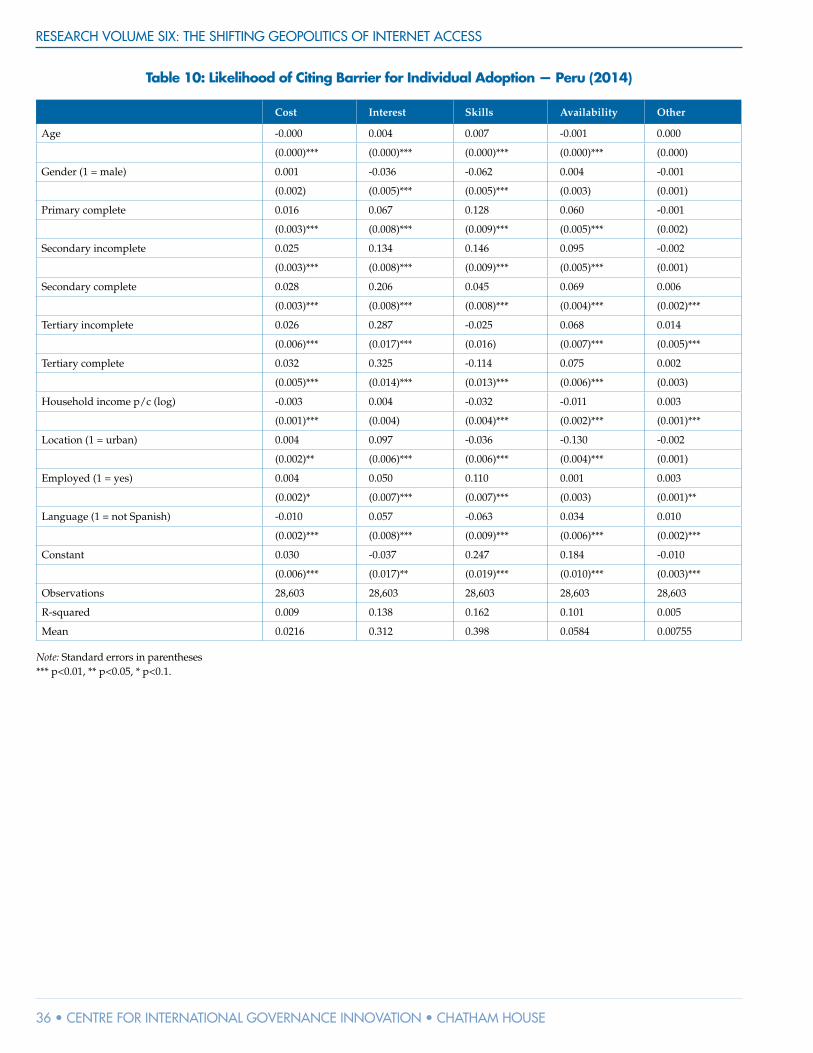
RESEARCH VOLUME SIX: THE SHIFTING GEOPOLITICS OF INTERNET ACCESS
36 • CENTRE FOR INTERNATIONAL GOVERNANCE INNOVATION • CHATHAM HOUSE
Table 10: Likelihood of Citing Barrier for Individual Adoption — Peru (2014)
Cost Interest Skills Availability Other
Age -0.000 0.004 0.007 -0.001 0.000
(0.000)*** (0.000)*** (0.000)*** (0.000)*** (0.000)
Gender (1 = male) 0.001 -0.036 -0.062 0.004 -0.001
(0.002) (0.005)*** (0.005)*** (0.003) (0.001)
Primary complete 0.016 0.067 0.128 0.060 -0.001
(0.003)*** (0.008)*** (0.009)*** (0.005)*** (0.002)
Secondary incomplete 0.025 0.134 0.146 0.095 -0.002
(0.003)*** (0.008)*** (0.009)*** (0.005)*** (0.001)
Secondary complete 0.028 0.206 0.045 0.069 0.006
(0.003)*** (0.008)*** (0.008)*** (0.004)*** (0.002)***
Tertiary incomplete 0.026 0.287 -0.025 0.068 0.014
(0.006)*** (0.017)*** (0.016) (0.007)*** (0.005)***
Tertiary complete 0.032 0.325 -0.114 0.075 0.002
(0.005)*** (0.014)*** (0.013)*** (0.006)*** (0.003)
Household income p/c (log) -0.003 0.004 -0.032 -0.011 0.003
(0.001)*** (0.004) (0.004)*** (0.002)*** (0.001)***
Location (1 = urban) 0.004 0.097 -0.036 -0.130 -0.002
(0.002)** (0.006)*** (0.006)*** (0.004)*** (0.001)
Employed (1 = yes) 0.004 0.050 0.110 0.001 0.003
(0.002)* (0.007)*** (0.007)*** (0.003) (0.001)**
Language (1 = not Spanish) -0.010 0.057 -0.063 0.034 0.010
(0.002)*** (0.008)*** (0.009)*** (0.006)*** (0.002)***
Constant 0.030 -0.037 0.247 0.184 -0.010
(0.006)*** (0.017)** (0.019)*** (0.010)*** (0.003)***
Observations 28,603 28,603 28,603 28,603 28,603
R-squared 0.009 0.138 0.162 0.101 0.005
Mean 0.0216 0.312 0.398 0.0584 0.00755
Note: Standard errors in parentheses *** p<0.01, ** p<0.05, * p<0.1.

CHAPTER TWO: BEYOND ACCESS: ADDRESSING DIGITAL INEQUALITY IN AFRICA
ALISON GILLWALD • 37
CHAPTER TWO:BEYOND ACCESS:
ADDRESSING DIGITAL INEQUALITY IN AFRICA
Alison Gillwald
Copyright © 2017 by Alison Gillwald
RESEARCH VOLUME SIX: THE SHIFTING GEOPOLITICS OF INTERNET ACCESS
38 • CENTRE FOR INTERNATIONAL GOVERNANCE INNOVATION • CHATHAM HOUSE
ACRONYMSARPU average revenue per user
BEREC Body of European Regulators for Electronic Communications
BoFiNet Botswana Fibre Networks
CRASA Communications Regulators’ Association of Southern Africa
DRC Democratic Republic of the Congo
ICT Information and communication technology
IP Internet Protocol
ISDN Integrated Services Digital Network
ISPs Internet service providers
ITU International Telecommunication Union
LTE Long-Term Evolution
Mbits megabits per second
MTC Mobile Telecommunications Ltd.
OECD Organisation for Economic Co-operation and Development
OTT over-the-top
RAMP Research ICT Africa Mobile Pricing
RIA Research ICT Africa
SADC Southern African Development Community
SAT-3 South Atlantic 3 submarine communications cable
SMS Short Message Service
INTRODUCTIONAfrica is undergoing rapid social and economic change as a result of the con�uence of mobile and broadband technologies on the continent. Increased availability of mobile broadband, declining smartphone prices and the appeal of social networking have contributed to the rapid increase in Internet use. Although Internet penetration in most countries is still very low, more than 70 percent of Ugandan and 67 percent of Ethiopian Internet users �rst used the Internet on a mobile phone. In Tanzania, Namibia and Nigeria, half of the populations �rst used the Internet on a mobile phone (Stork, Calandro and Gillwald 2013). Mobile Internet access requires fewer skills than computer-based access, does not require electricity at home and is prepaid — all important conditions for use by
low-income groups in Africa. While data is still expensive, sold in micro units, it provides access to “free” over-the-top (OTT) substitutes for costly voice and text services (Stork et al. 2016).
This much-vaunted, enabling mobile broadband environment that promises enhanced economic and social well-being and political participation within African nations is dependent upon prices becoming suf�ciently affordable for a critical mass of people — those with the rights and skills to be online for the time they need to be — to harness the potential of the Internet.
In the meantime, digital inequality between those with access to broadband services and the means to utilize them and those marginalized from them increases. Although people place great value on the improved access that mobile phones offer, the high cost of that access across the continent — often resulting from policy-induced constraints on competition and ineffectual regulation of operators — places a greater burden on low-income households. The 2007-2008 Research ICT Africa (RIA) demand-side survey across 14 African countries found that the bottom three-quarters of mobile phone users spent on average between 11 percent and 27 percent of their income on mobile communications, rather than the standard reference of two percent to three percent of income spent in developed economies (Gillwald, Moyo and Stork 2013; see also Box 1). A forthcoming World Bank sector performance review of Zambia undertaken by RIA demonstrates that while those working in the management and professional sectors spend two to three percent of their average income on 1 GB of data, trade and craft workers spend seven percent of their average income and agricultural, forestry and �shery workers spend on average 23 percent of their average income for 1 GB of data.1
While the advent of mobile broadband has driven Internet uptake in Africa, the representation of it as a panacea for underdevelopment masks the fact that six billion people do not have access to the Internet and their lives are largely untouched by this digital revolution (World Bank 2016, v).
More importantly, increased connectivity in itself does not correlate with reduced information inequality. For those connected people, the intensity of use within Africa is highly uneven, because it is between developed economies and developing economies.2 While this unevenness clearly has implications for the digital rights of individuals and the equality of citizenry and justice that democratic states have an obligation to uphold, from a policy perspective
1 See the RIA African Mobile Pricing (RAMP) data portal: www.data�rst.uct.ac.za/dataportal/index.php/catalog/535.
2 Mark Graham and Christopher Foster (2014, 5) have pointed out that there are more contributions to Wikipedia from Hong Kong than from all of Africa combined, despite the fact that Africa has 50 times more Internet users.

CHAPTER TWO: BEYOND ACCESS: ADDRESSING DIGITAL INEQUALITY IN AFRICA
ALISON GILLWALD • 39
the failure to address these informational asymmetries has wider social and economic implications.
Though broadband impact studies vary on the exact contribution that increases in broadband penetration make to economic growth, there is enough evidence to support claims that they correlate with increases in GDP, job creation, the broadening of educational opportunities, enhanced public service delivery and rural development.3 For countries to enjoy the network externalities associated with investment in broadband infrastructure, however, a critical mass has to be reached. And the network externalities compound as there are more network connections. Pantelis Koutrompis (2009), for example, found that a broadband penetration of between 20 percent and 30 percent is required to have a 0.8 percent increase in GDP. It is at this point that the improvement in ef�ciencies in the �ows of information and the reduction in transaction costs as a result of information and communication technology (ICT) diffusion result in systemic changes that can have transformative effects on economies.
Many developing countries have not yet reached this rate of connectivity, and further, it is becoming evident that unlike voice network services, data network services have effects linked not only to access but also to the intensity of use now re�ected in global ICT indices.4 The nature and extent of use relates not only to the affordability of services (although the high cost of communication in Africa makes this a primary constraint) but also to the capabilities of people to exercise their rights to use the information for certain political, social or economic ends (Sen 1999) — two conditions not ful�lled in most African countries. Without signi�cant progress toward universal access to affordable services, accompanied by signi�cant improvements in human development, these technological developments do not redress digital inequality — in fact, they amplify it.
BROADBAND IN THE ICT ECOSYSTEM To deal with these dynamic developments and the inequalities underlying them, broadband is understood less as a technical measurement of a network operating at a minimum transmission speed, as re�ected in traditional ITU standards de�nitions, and more as an integrated system of networks, the services that they carry, the
3 A high-level assessment undertaken by Raul Katz, Pantelis Koutrompis and Fernando Martin Callorda (2014) using a digitization index indicates that — if the necessary conditions were in place and the broadband targets of the South African broadband policy and plan “SA Connect” were met — a relatively conservative broadband investment �gure of R65 billion could result in more than 400,000 jobs being created and more than R130 billion being contributed to GDP in South Africa over 10 years.
4 See the International Telecommunication Union’s (ITU’s) ICT Development Index (ITU 2015) and Organisation for Economic Co-operation and Development (OECD) (2004).
Box 1: Less Use, for More Money
Evidence is growing that people in the developing world are spending on average considerably more on communications than the �ve percent of income used as the benchmark by the Broadband Commission for Digital Development (2015).
This is con�rmed in regional case studies conducted in Africa, Asia and Latin America reported in the book Information Lives of the Poor by Laurent Elder and colleagues (2014). They cite Roxana Barrantes and Hernán Galperin’s study (2008), which showed that in developing countries, mobile voice services were regarded more as a luxury good, with expenditures taking up as much as eight percent of household income, rather than the 2.5 percent spent on voice communications in developed countries. The evidence suggests the expenditure on broadband data communications is much higher.
For a public hearing on the cost of communications held by the Parliament of the Republic of South Africa (2016), a study was submitted by Carlos Rey-Morena on the community of Zenzeleni. Data collected on average expenditures and pricing data from the RAMP data portal indicated that in this remote village in the East Cape Province of South Africa, villagers (whose monthly income averaged R338, 55 percent of which was from government social grants) were spending 22 percent of their disposable income for a very limited basket of services. This service included only seven Short Message Service (SMS) messages and 77 minutes of calling time a month, which is considerably below the number of calls in the OECD’s low-usage basket (40 calls/month). The quantity of voice and data services and percentage of disposable income are also, respectively, far below and far above the Government of South Africa broadband policy targets, which are 90 minutes and 500 MB per month for �ve percent of disposable income. Further, “40% of the time the SIM cards do not have airtime[,] making it impossible to use those services. Factors, such as charging the phone’s battery and airtime costs added by resellers[,] account for about 23.24% of the total expenditure of household’s income. Regarding data, 22.2% of the poor people access Internet monthly, but are limited to 25–30 MB a month” (ibid.).
RESEARCH VOLUME SIX: THE SHIFTING GEOPOLITICS OF INTERNET ACCESS
40 • CENTRE FOR INTERNATIONAL GOVERNANCE INNOVATION • CHATHAM HOUSE
applications and services delivered on them and, centrally, the users.5 Each component of the ecosystem has been transformed by global technological, governance and market developments (Kim, Kelly and Raja 2010) with major implications for policy formulation at the national level. How nations respond to these changes determines their attractiveness to investors, the competitiveness of their markets and their digital inclusiveness. With such networks, services and content regarded as necessary conditions for the development of information societies and knowledge economies, the costs of not redressing digital inequality are high.
For the purposes of this chapter, broadband is conceptualized within an even wider ICT ecosystem that “encompasses the policies, strategies, processes, information, technologies, applications and stakeholders that together make up a technology environment for a country, government or an enterprise. Most importantly, an ICT ecosystem includes people — diverse individuals — who create, buy, sell, regulate, manage and use technology” (Kaplan 2005).6
This broader context not only allows for more speci�c points of policy and regulatory intervention across a wider governance framework, but, with the critical inclusion of users — as both consumers and producers — at the core of the ecosystem, it also compels a range of demand-side interventions, to ensure they have the capabilities to realize the potential of the Internet, in addition to the more classical supply-side approach to infrastructure developments.
The conceptual framework is used to examine the limited empirical evidence available in the public domain from Africa to identify the factors perpetuating digital inequality and to inform strategies for digital inclusion. Taking into account the political economy of the Internet in Africa, the next section assesses policy outcomes manifest in the institutional arrangements and market structure of many African countries by examining the supply-side factors — primarily access, costs and pricing — together
5 The World Bank moved to an understanding of broadband that included these elements in 1997, an expansion of the dominantinternational de�nition of broadband by the ITU, which is that “broadband combines connection capacity (bandwidth) and speed. Recommendation I.113 of the ITU Standardization Sector de�nes broadband as a ‘transmission capacity that is faster than primary rate Integrated Services Digital Network (ISDN) at 1.5 or 2.0 Megabits per second (Mbits)’” (ITU 2003).
6 Some authors have begun to re-conceptualize ICTs, and broadband in particular, as a more organic network than the hierarchical, layered models used to describe communication systems in the past (Kaplan 2005; Fransman 2006; Smith, Elder and Emdon 2011). This more organic, ecological approach captures the adaptive nature of the Internet Protocol (IP) environment with its properties of self-organization, scalability and sustainability in which new communication systems operate, but this conceptualization goes even further, moving beyond the infrastructural and usage realm to the wide political economy from which it emerges.
with demand-side constraints, in order to explain the poor access to and use of broadband levels on the continent. From this analysis, the third section examines a range of policies and regulatory strategies to stimulate broadband extension under the conditions of resource restraint with which African countries �nd themselves operating.
POLICY OUTCOMES
Institutional Arrangements
The failure of inadequately reformed markets and the dearth of institutional capacity to regulate them effectively are factors that can be shown to have undermined the �rst round of telecommunications reform initiatives across the Global South. These challenges of institutional reform for the telecommunications sector have been identi�ed by a number of authors (Levy and Spiller 1997; Singh 1999, Melody 1997; Samarajiva 1999, Gillwald 2005). Also, the policy and regulatory challenges in this specialized sector are ampli�ed through a wider crisis of limited statehood in many developing countries, speci�cally, the lack of institutional capacity to govern effectively (Acemoglu and Robinson 2012; Livingston and Walter-Drop 2014). This problem is compounded as ICT moves from being a sectoral policy issue to one cutting across all government sectors, from education and health to �nance and trade, and public and private sectors, formal and informal, and to the ensuring of fundamental rights of individuals in a modern economy.
Reform models proposed by multilateral agencies and donor organizations assume a functional ICT ecosystem with an enabling policy environment for investment, competition and innovation. To create these conditions requires a capable state with a national regulatory agency empowered to implement national policy, independently of state and industry in�uence, in ways that will optimize consumer welfare and safeguard citizens’ rights. For the policy and legal framework to meet the needs of the country, the executive needs to have suf�cient competency in policy making and use processes to consult the public and harness expertise outside of government, particularly in this fast-changing global environment. The translation of policy into practice requires transparent and accountable regulatory decision making and the resources and competencies to ful�ll its mandate in an increasingly complex global environment. Although these conditions do not exist in most developing countries — a situation unlikely to change in the short term (because of the conditions’ structural nature) — they underpin many of the broadband models proposed by multilateral agencies.
Rather than presenting such an environment as a prerequisite or solution, when it is known it cannot be achieved, an ICT ecosystem approach can instead be used as a diagnostic tool that enables the identi�cation of the weaknesses in the system, as well as their linkages to other
CHAPTER TWO: BEYOND ACCESS: ADDRESSING DIGITAL INEQUALITY IN AFRICA
ALISON GILLWALD • 41
elements of the system, how corrections in one part of the system might address others and the resources available to self-repair the system. In this way, the failure of current institutional arrangements between state and market, and their regulation independently of both state and market, can be linked to poor policy outcomes. Viewing the political economy of a country with this ICT ecosystem approach enables the identi�cation of alternative strategies for the realistic delivery of policy goals, within the institutional endowments and resources of the country.
Such an approach is critical to realizing the strategic policy objectives for Africa. In most countries, the current institutional arrangements and market structuring that produced the negative policy outcomes of poor extension of broadband networks beyond the major centres and the high price of communication constitute a problematic foundation on which to overlay new enabling policies and regulatory strategies for broadband developments.
The poor outcomes (in relation to the extension of broadband networks beyond the major centres and the high price of communication services), together with a greater understanding of the strategic importance of national broadband development, have resurrected debates on the role of the state in broadband infrastructure extension. In several African states the low levels of broadband penetration outside of the main metropolises are often attributed to market failure and as such provide the rationale for public investments, which few African governments can self-�nance.7 As discussed in the next section, these poor policy outcomes are often not a result of markets not working but of competitive markets not having been established, through either limitations on market entry or ineffectual regulation.
Though a strong case has been made for the developmental gains associated with investments in infrastructure industries and broadband in particular, there is no reason, as Robert and Charles Kenny have pointed out (2011), why these ventures have to be either operated or invested in by the state. Considerable evidence indicates that monopolies, whether public or private, are far less effective in meeting national objectives of affordable access than are well-regulated competitive markets. Little evidence exists that state-owned operators are able to compete successfully in open markets, despite years of protection in some cases.
7 This need underpins the decisions to establish state-owned broadband networks in Botswana (Botswana Fibre Networks [BoFiNet]; see www.bo�net.co.bw/) and Tanzania (National ICT Broadband Backbone; see www.nictbb.co.tz), both of which have resulted in lower wholesale prices but apparently not in lower prices passed on to end-users (Botswana Communications Regulatory Authority 2014) or in stimulating demand, because access and use remaining relatively low. In South Africa, this reality was the rationale for the introduction of a second state-owned, wholesale broadband carrier, Broadband Infraco, in 2007, and continues to be the rationale for the Department of Telecommunications and Postal Services wanting the 4G and digital dividend spectrum to be reserved for a state-owned public access network (see Roetter 2015).
However, the replication of certain network elements in small or under-resourced markets simply might not be economically feasible. For the same reasons, where broadband networks do not exist, provisioning might only be feasible through a regulated common carrier.
In most African countries, the scale of investment required to build out next-generation networks means that — even in developed countries, and particularly in developing economies — neither the state nor the private sector on its own can meet the broadband needs of countries in increasingly information-dependent economies. This reality calls for policy that understands the need for a new interplay between state and market, creating new access, service delivery, investments and business models. It will require even greater regulatory agility and insight to manage the tensions between the different policy objectives of competitiveness, innovation and consumer welfare, but much of the operational risk can be transferred to the private sector.
Market Developments and Costs
Market shifts — such as the dramatic reduction (20 percent) in international bandwidth prices since the introduction of competition to the South Atlantic 3 submarine communications cable (SAT-3) monopoly in 2006 by the entry into the market of Seacom, EASSy (Eastern Africa Submarine Cable System) and WASC (West Africa Submarine Cable) — have fundamentally changed the cost structure and operating dynamics for operators in the African broadband market (Gillwald and Calandro 2013). Wholesale international bandwidth is now priced at a fraction of what it was then (although these bene�ts have not always been passed on fully to end-users to stimulate adoption). Constantly reducing prices for smarter devices and for service, marketing and pricing innovation fuelled the uptake of broadband services (ibid.).
As a result, all over Africa mobile broadband has overtaken the limited �xed broadband that existed and historically was the mode of broadband delivery, winning more subscribers and providing better prices and speed of service. As with voice services, where massive pent-up demand was met by the wireless revolution that transformed communications on the African continent, demand for Internet by those unable to access or afford the limited ADSL (asymmetric digital subscriber line) services available on the continent is also being met through mobile services (ibid.). With no monthly line rental charges and installation fees, and with convenient prepaid charging options, along with the lower set-up costs of mobile data compared to �xed — particularly appealing for those with low data use and uneven consumption — the dominance of mobile is unsurprising.
The biggest barrier to access — and the reason for the limited time online, the shift to cost-saving OTT

RESEARCH VOLUME SIX: THE SHIFTING GEOPOLITICS OF INTERNET ACCESS
42 • CENTRE FOR INTERNATIONAL GOVERNANCE INNOVATION • CHATHAM HOUSE
services and the inability in most African countries to use broadband in the always-on way in which it was intended — is price (Stork, Calandro and Gillwald 2013). A key aspect of demand stimulation where penetration is low, or suboptimal, is price reduction. This aspect is intrinsically linked to the issues of market structure and the regulation of wholesale access discussed below. As indicated above, new bottlenecks appear to be emerging in traditional peering connectivity between Internet service providers (ISPs) and with the shift to cost-based IP transit. The high cost of domestic IP transit in many countries — several times greater than the international bandwidth price, once the major cause of high end-user prices — now makes up the the lion’s share of ISP input costs. Just as mobile termination rate regulation was needed to bring down retail prices dramatically in many of the leading jurisdictions in Africa, regulation of the wholesale market might be required to reduce the input costs for service providers and to reduce retail data prices. (See Figure 1.)
The vast difference in leased line prices demonstrates the extreme differences in the wholesale prices in the Southern African Development Community (SADC) region and is indicative of what is happening on the rest of the continent.8 It is interesting to observe that BoFiNet is ful�lling its mandate of providing low-cost bandwidth, having been structurally separated to form an open-access common carrier. However, if one examines the retail prices in Botswana in Figure 2, it appears that these wholesale price bene�ts are not being passed on to retail consumers, with Botswana’s rates among the more expensive for 1 GB of data.
Identifying the cost-drivers underlying high broadband prices is essential. While international bandwidth prices, once the major factor in African data prices, have plummeted, terrestrial and IP transit prices are now major cost factors. The impact of these factors on the cost of communications requires regulatory assessment. On the other hand, any policy and regulatory bottlenecks that constrain operators and potential players from responding dynamically to the changing nature of telecommunications require policy and regulatory attention. The challenges of implementing wholesale access are discussed below.
8 Obtaining wholesale prices from operators is extremely dif�cult, even through regulators empowered to do so. According to a recent study prepared for the Communications Regulators’ Association of Southern Africa (CRASA) and ITU (Coleago Consulting 2016) on open access, operators from all SADC countries see wholesale prices as opaque and either only available on request or individually negotiated. Of the dozens of operators in 14 countries in SADC requested by their national regulatory agencies to provide wholesale leased line prices across SADC using the modi�ed (2010) OECD basket methodology, only six operators did. The baskets are based on the same distance distributions as the OECD baskets but do not include the cost of local leads or end-user devices. The cost of a leased line is calculated as a wholesale input from one point of presence to another. As an alternative to the OECD baskets calculation, the wholesale price for a single domestic leased line with a length of 1,500 km was also calculated (ibid.).
Retail prices discussed in the next section are an excellent barometer of the effectiveness of competition or regulation of downstream networks.
Affordable Access
While broadband access is a necessary condition for social and economic inclusion, it is not a suf�cient condition. As services and devices become more sophisticated and knowledge more pervasive, issues of affordability and the ability to use services and devices optimally are likely to marginalize more users.
Figure 2 plots the ITU’s 2015 �gures for Internet penetration and the number of licensees in a market against the dominant operators’ prices per gigabyte as collected for the RAMP index.9 The data shows that, despite its low wholesale prices, Botswana is not among the cheapest countries when comparing retail prices. In fact, it only comes fourth to last, or 39th, out of 42 countries assessed. Although Botswana does not have particularly high penetration rates either, the rate is approaching the 30 percent critical mass level that should allow the middle-income economy to capitalize on network effects as connectivity and intensity of use increase.
Tanzania, on the other hand, has also built a state-owned backbone network, which appears to have driven down its prices to make them more affordable for consumers in this least-developed economy. Although the wholesale prices are not available for this analysis, clearly the low GDP per capita has compelled operators to pass on any bene�ts enjoyed from the open-access wholesale provider. Tanzania operators Airtel, Millicom (Tigo) and Vodacom also recently launched an infrastructure-sharing initiative to expand mobile broadband network coverage to underserved people in rural areas (TeleGeography 2016).
What is concerning about the Tanzanian case is that Internet penetration remains low at little over �ve percent, which raises the question of whether or not there are suf�cient surpluses in the network to reinvest in the extension of their broadband networks, or whether even at these low prices they are not affordable.
The countries with the highest penetration include Morocco, Mauritius, South Africa and Seychelles, all of which have more than 50 percent Internet penetration. Of these, Morocco has the lowest prices by a dominant operator, at US$5.20 for 1 GB, while Mauritius and South Africa are more mid range at US$8.80 and US$9.94, respectively, for 1 GB. Seychelles’ price is considerably more, at around US$20 for 1 GB (US$18.37, to be speci�c). These �gures suggest that the pricing in Mauritius and South Africa might be optimal for continued investment in
9 See the RAMP portal: www.data�rst.uct.ac.za/dataportal/index.php/catalog/535.
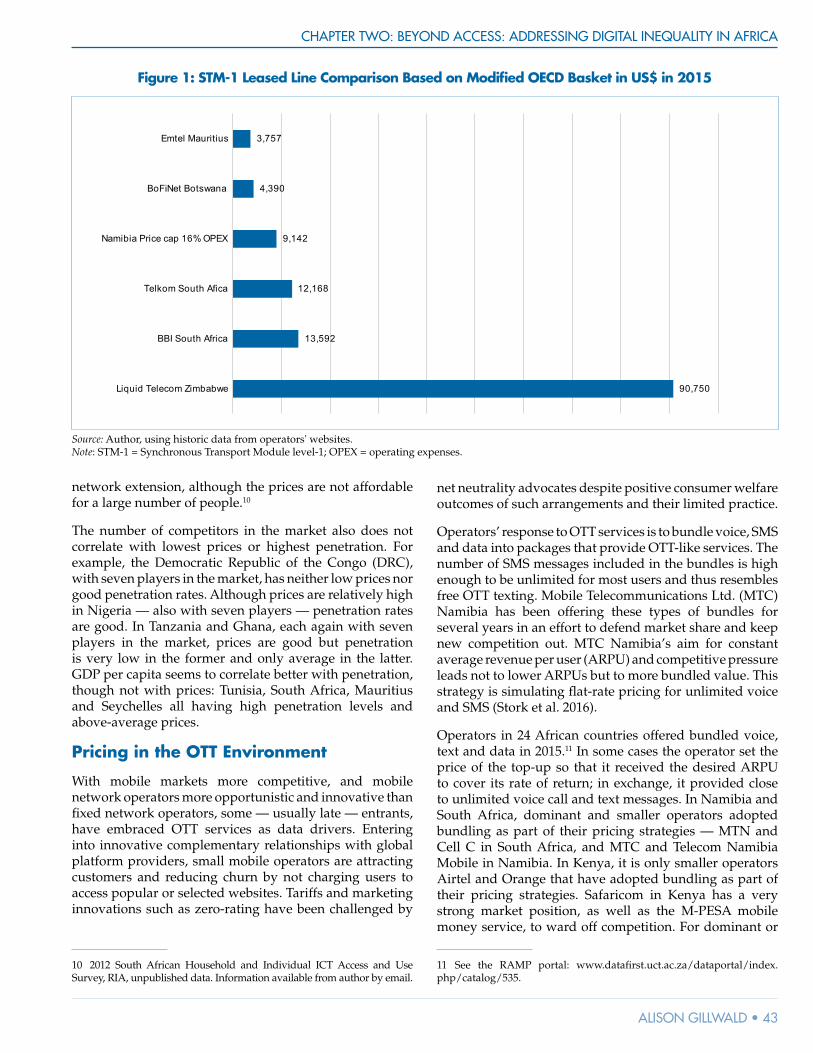
CHAPTER TWO: BEYOND ACCESS: ADDRESSING DIGITAL INEQUALITY IN AFRICA
ALISON GILLWALD • 43
network extension, although the prices are not affordable for a large number of people.10
The number of competitors in the market also does not correlate with lowest prices or highest penetration. For example, the Democratic Republic of the Congo (DRC), with seven players in the market, has neither low prices nor good penetration rates. Although prices are relatively high in Nigeria — also with seven players — penetration rates are good. In Tanzania and Ghana, each again with seven players in the market, prices are good but penetration is very low in the former and only average in the latter. GDP per capita seems to correlate better with penetration, though not with prices: Tunisia, South Africa, Mauritius and Seychelles all having high penetration levels and above-average prices.
Pricing in the OTT Environment
With mobile markets more competitive, and mobile network operators more opportunistic and innovative than �xed network operators, some — usually late — entrants, have embraced OTT services as data drivers. Entering into innovative complementary relationships with global platform providers, small mobile operators are attracting customers and reducing churn by not charging users to access popular or selected websites. Tariffs and marketing innovations such as zero-rating have been challenged by
10 2012 South African Household and Individual ICT Access and Use Survey, RIA, unpublished data. Information available from author by email.
net neutrality advocates despite positive consumer welfare outcomes of such arrangements and their limited practice.
Operators’ response to OTT services is to bundle voice, SMS and data into packages that provide OTT-like services. The number of SMS messages included in the bundles is high enough to be unlimited for most users and thus resembles free OTT texting. Mobile Telecommunications Ltd. (MTC) Namibia has been offering these types of bundles for several years in an effort to defend market share and keep new competition out. MTC Namibia’s aim for constant average revenue per user (ARPU) and competitive pressure leads not to lower ARPUs but to more bundled value. This strategy is simulating �at-rate pricing for unlimited voice and SMS (Stork et al. 2016).
Operators in 24 African countries offered bundled voice, text and data in 2015.11 In some cases the operator set the price of the top-up so that it received the desired ARPU to cover its rate of return; in exchange, it provided close to unlimited voice call and text messages. In Namibia and South Africa, dominant and smaller operators adopted bundling as part of their pricing strategies — MTN and Cell C in South Africa, and MTC and Telecom Namibia Mobile in Namibia. In Kenya, it is only smaller operators Airtel and Orange that have adopted bundling as part of their pricing strategies. Safaricom in Kenya has a very strong market position, as well as the M-PESA mobile money service, to ward off competition. For dominant or
11 See the RAMP portal: www.data�rst.uct.ac.za/dataportal/index.php/catalog/535.
Figure 1: STM-1 Leased Line Comparison Based on Modi�ed OECD Basket in US$ in 2015
90, 750
13, 592
12, 168
9, 142
4, 390
3, 757
Liq uid T elecom Z imbabw e
BBI South Af rica
T elkom South Af ica
N amibia Price cap 16% OPEX
BoF iN et Botsw ana
Emtel Mauritius
Source: Author, using historic data from operators' websites. Note: STM-1 = Synchronous Transport Module level-1; OPEX = operating expenses.
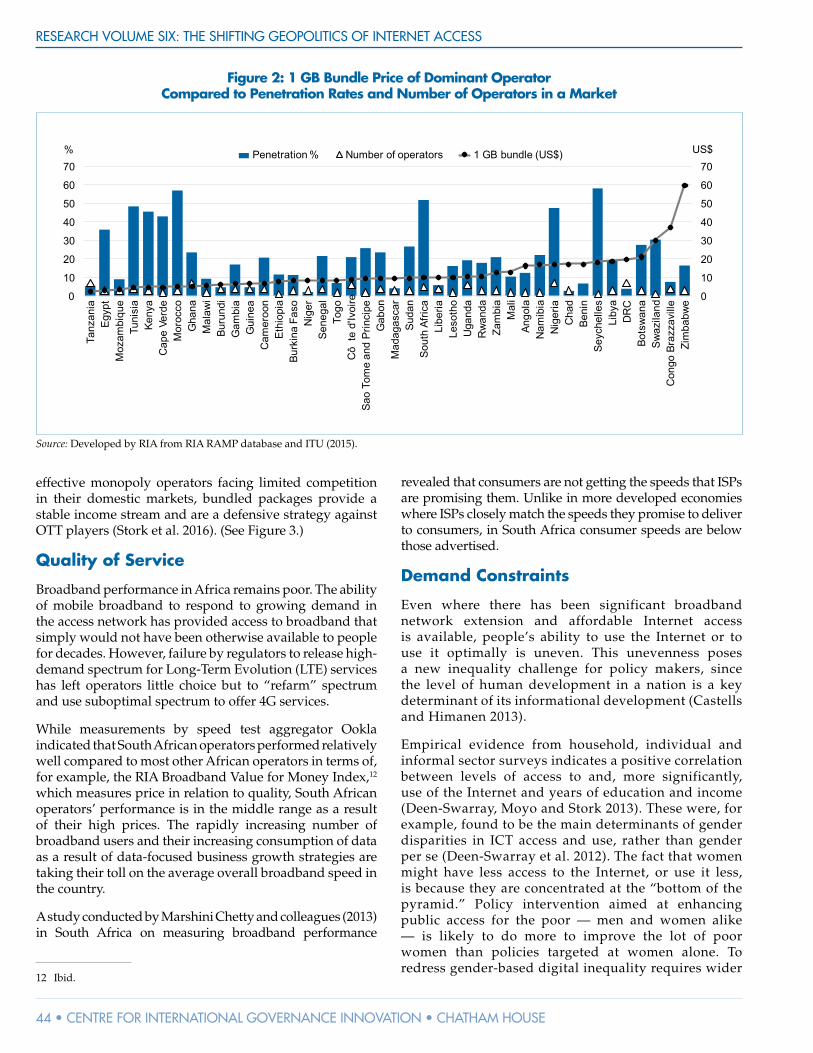
RESEARCH VOLUME SIX: THE SHIFTING GEOPOLITICS OF INTERNET ACCESS
44 • CENTRE FOR INTERNATIONAL GOVERNANCE INNOVATION • CHATHAM HOUSE
effective monopoly operators facing limited competition in their domestic markets, bundled packages provide a stable income stream and are a defensive strategy against OTT players (Stork et al. 2016). (See Figure 3.)
Quality of Service
Broadband performance in Africa remains poor. The ability of mobile broadband to respond to growing demand in the access network has provided access to broadband that simply would not have been otherwise available to people for decades. However, failure by regulators to release high-demand spectrum for Long-Term Evolution (LTE) services has left operators little choice but to “refarm” spectrum and use suboptimal spectrum to offer 4G services.
While measurements by speed test aggregator Ookla indicated that South African operators performed relatively well compared to most other African operators in terms of, for example, the RIA Broadband Value for Money Index,12 which measures price in relation to quality, South African operators’ performance is in the middle range as a result of their high prices. The rapidly increasing number of broadband users and their increasing consumption of data as a result of data-focused business growth strategies are taking their toll on the average overall broadband speed in the country.
A study conducted by Marshini Chetty and colleagues (2013) in South Africa on measuring broadband performance
12 Ibid.
revealed that consumers are not getting the speeds that ISPs are promising them. Unlike in more developed economies where ISPs closely match the speeds they promise to deliver to consumers, in South Africa consumer speeds are below those advertised.
Demand Constraints
Even where there has been significant broadband network extension and affordable Internet access is available, people’s ability to use the Internet or to use it optimally is uneven. This unevenness poses a new inequality challenge for policy makers, since the level of human development in a nation is a key determinant of its informational development (Castells and Himanen 2013).
Empirical evidence from household, individual and informal sector surveys indicates a positive correlation between levels of access to and, more significantly, use of the Internet and years of education and income (Deen-Swarray, Moyo and Stork 2013). These were, for example, found to be the main determinants of gender disparities in ICT access and use, rather than gender per se (Deen-Swarray et al. 2012). The fact that women might have less access to the Internet, or use it less, is because they are concentrated at the “bottom of the pyramid.” Policy intervention aimed at enhancing public access for the poor — men and women alike — is likely to do more to improve the lot of poor women than policies targeted at women alone. To redress gender-based digital inequality requires wider
Figure 2: 1 GB Bundle Price of Dominant Operator Compared to Penetration Rates and Number of Operators in a Market
Penetration % N umber of operators 1 GB bundle (US$ ) US$
0
10
20
30
40
50
60
70
0
10
20
30
40
50
60
70%
Tanz
ania
Egyp
tM
ozam
biqu
eTu
nisi
aKe
nya
Cap
e Ve
rde
Mor
occo
Gha
naM
alaw
iBu
rund
iG
ambi
aG
uine
aC
amer
oon
Ethi
opia
Burk
ina
Faso
Nig
erSe
nega
lTo
goC
ôte
d'Iv
oire
Sao
Tom
e an
d Pr
inci
peG
abon
Mad
agas
car
Suda
nSo
uth
Afric
aLi
beria
Leso
tho
Uga
nda
Rw
anda
Zam
bia
Mal
iAn
gola
Nam
ibia
Nig
eria
Cha
dBe
nin
Seyc
helle
sLi
bya
DR
CBo
tsw
ana
Swaz
iland
Con
go B
razz
avill
eZi
mba
bwe
Source: Developed by RIA from RIA RAMP database and ITU (2015).

CHAPTER TWO: BEYOND ACCESS: ADDRESSING DIGITAL INEQUALITY IN AFRICA
ALISON GILLWALD • 45
national policy interventions in the area of human development: getting girls to school and encouraging them to stay there long enough to acquire the skills to find employment or generate income. The level of human development of a nation has therefore become a key determinant of informational development and requires cross-cutting sectoral interventions far beyond the ICT sector alone.
APPROACHES TO NETWORK EXTENSIONFrom this perspective, the challenges of diminishing digital inequality are far greater than �lling gaps in infrastructure coverage. Nevertheless, infrastructural extension is a necessary, if not suf�cient, condition to realize digital rights. The high levels of investment required to build broadband networks, together with the complex legal, institutional and human resource requirements to give them effect, have challenged the realization of such rights in most developing countries.
The legacy challenges for broadband strategies are the interrelated problems of in�ated prices, the resulting reduced consumption of services, and insuf�cient investment and innovation. “The �rst two of these [in�ated prices and reduced consumption] can best be understood in terms of static economic effects (i.e., at a given point in time).…[T]he dynamic economic effects associated with the third of these (innovation and investment) is the most dif�cult to solve…” as it is highly dependent on the speci�c context and time. (CRASA 2015, 4).
Debates continue, on whether ubiquitous broadband is best achieved by facilities-based competition, or by avoiding infrastructure duplication through the consolidation or building of national open-access broadband networks on which service-based competition can be enabled. The �rst round of broadband extension strategies, popularized by epistemic communities operating through multilateral agency technical assistance and donor programs such as Open Access, sought to stimulate intramodal competition in the largely monopolistic providers of �xed broadband and, in the absence of intermodal competition
Figure 3: Bundled Value for Money Index 2016, Quarter Two
0.070.09
0.240.27
0.370.440.45
0.590.620.690.730.750.760.800.81
1.581.62
2.302.30
2.623.00
3.633.723.79
4.174.67
5.457.54
8.158.29
8.8310.32
0 2 4 6 8 10 12
LibyaZ imbabw e
ChadCô te d' Ivoire
BurundiDRC
GabonBenin
Botsw anaRw anda
Sierra LeoneZ ambia
MauritaniaMali
AngolaMozambiq ue
SenegalMauritius
MadagascarK enya
South Af ricaAlgeria
CameroonEgypt
LiberiaT anzania
GhanaN iger
N amibiaUganda
Cape VerdeMorocco
BVI MethodologyT he BVI adds the value of bundled voice minutes, SMSs and data and divides it by the price. T he value of bundled minutes is derived by multiplying the number of minutes w ith a f ixed US$ value, based on q uarterly average, inclusive of tax.
It is constructed f rom the perspective of smartphone / OT T use, placing more value on data.
T he higher the BVI the better the perf ormance.
Source: RIA RAMP BVI Index. Note: BVI = Bundle Value Index.
RESEARCH VOLUME SIX: THE SHIFTING GEOPOLITICS OF INTERNET ACCESS
46 • CENTRE FOR INTERNATIONAL GOVERNANCE INNOVATION • CHATHAM HOUSE
in Africa, between television cable companies and telecommunications companies that had driven broadband penetration and innovation in North America.
There is little empirical support for the link between local loop unbundling, bitstream access and new infrastructure, according to supporters of interplatform competition. They contend that there may in fact be adverse investment incentives (Coleago Consulting 2016). Although the evidence in favour of one or the other intervention is particular to the market it is introduced (Bauer and Bohlin 2008), “there is some empirical evidence to suggest that, while intra-modal network competition drove the �rst wave of broadband that was based on the upgrading of existing copper and cable systems, in the second phase of broadband, where new �bre networks had to be built, the bene�ts of intra-modal competition fell away or were masked by the impact of inter-platform competition” (CRASA 2016).
To balance the primary objectives of affordable access to high-speed bandwidth with other objectives of enhanced competition, investment and innovation requires sophisticated policy planning and regulatory execution seldom found in developing country institutions. These trade-offs need to be assessed not only by means of static ef�ciency measures such as price caps and instrumental competition models (market concentration and integration) but also through dynamic ef�ciency indicators (complementarity, infrastructure and revenue sharing).
Developed economies with far stronger institutional endowments than available in most developing countries have struggled to create the correct incentives and penalties to balance these policy tensions. The evidence suggests that until regulatory effects are clearer, regulators should forebear. Some experts — Yochai Benkler and colleagues (2010), for example — argue for a greater focus on the sharing of passive infrastructure and channelling of complementary investments. Similarly, Wolfgang Briglauer and Klaus Gugler (2013) and Briglauer, Gugler and Adhurim Haxhimusa (2015) argue for a move away from an asymmetric regulatory paradigm to a more symmetric one that focuses on an industry-coordinating role and enables cooperation models in the actual building and sharing of infrastructure.
A distillation of what needs to be contained in policy to create the conditions for investment and innovation includes:
• a realizable broadband plan with strategies and targets for implementation, monitoring and evaluation;
• open-access regime from data to networks to enable free �ows of information for content and applications development and the creation of opportunities for access and to promote competition;
• infrastructure sharing to avoid duplication; public-private interplays to harness all resources for public delivery; state incentives for delivery to underserviced areas, or state-funded subsidies on open-access investments; and
• assigning high-demand spectrum for mobile application and exploiting existing spectrum assignment through white space deployment.
On the demand side, measures include strategies to make broadband more affordable through some of these supply-side adjustments, but also strategies to improve e-literacy and e-skills and local content and applications development.
Infrastructure Sharing
In some countries, reform policies and licences prevented sharing of infrastructure other than for new entrants by way of roaming for limited periods in order to drive network extension. As regulation moves beyond access alone and operators start to distinguish themselves more by the services they offer, and as the avoidance of duplicating costly broadband services in developing countries becomes a key imperative, legal and licensing constraints on sharing need to be lifted.
While sharing around costly trenching might be worth mandating to avoid duplication of high-cost services, as well as for environmental reasons, operators are already increasingly moving toward not only passive13 but also active sharing of infrastructures.
Cost savings are driving such sharing to the bene�t of the operators. Sharing of “active infrastructure” such as base stations, antennas, routers and switches is already a phenomenon on the African continent, with operators saving around 40 percent in capital expenditure from base station sharing alone (Body of European Regulators for Electronic Communications [BEREC] 2011).
Strategic drivers and commercial needs are driving core network elements management and control systems business support and are enabling cost reduction and optimization in both capital and operational expenditure.
Infrastructure sharing is particularly driven by universal service obligations to extend services to rural areas that are uneconomic to service independently. However, sharing also facilitates market entry by enabling time-to-market and innovation agility, particularly for resellers and mobile virtual network operators, and also enables new revenue sources for incumbents facing challenges to traditional business models.
13 “Passive infrastructure” that can be shared includes towers and masts, trenches, ducts, �bre cables, sewers, water pipes and railway servitudes — and, importantly in Africa, power supply.

CHAPTER TWO: BEYOND ACCESS: ADDRESSING DIGITAL INEQUALITY IN AFRICA
ALISON GILLWALD • 47
Open Access and Enhanced Competition
The potential of open systems to support economic growth, development and innovation has been increasingly promoted by academic and multilateral agencies alike (Kaplan 2005; Benkler 2006; Smith, Elder and Emdon 2011). “Openness” in public policy has, however, become a catch-all term for various and, often, contradictory, policy objectives and regulatory practices. Perceived as inherently good, the term has been included in a range of policies with unintended outcomes — including inhibiting network investment, squeezing out private investment and creating dominant or monopoly market players (Gillwald, Rademan and Esselaar 2016).
In many African countries, �xed markets are stagnant and appear to offer fewer or the most costly opportunities for lowering barriers to entry, making the more successful mobile networks the focus of open-access strategies. While a competitive environment requires a regime that guarantees access to public networks at a cost-based price, there is seldom a rationale for mandatory open access of mobile markets that are either competitive or could be made so through open entry into the market.
Kenya and Mexico were among the early adopters of the mandatory open-access model, but have lost some traction as the practical challenges of ensuring its success have unspooled. In both cases, the decision to establish such a network was based on the extreme dominance of the incumbent mobile operator, which had resulted in high prices and a lack of wholesale engagement with smaller players or virtual mobile operators that could at least provide some competition. Though Kenya shares some similarities with those cases, regulatory intervention in Kenya had ensured that the dominant operator there, Safaricom, had nothing like the stranglehold of the dominant operator in Mexico, América Móvil. However, these cases make clear that unless dominant operators are centrally involved in these interventions, they fail, as the withdrawal of Safaricom and the collapse of the proposed open-access wireless network show.
The commercial model used by dark �bre companies underpins the open-access models adopted by many of the new undersea cable companies, which broke the monopoly provision of broadband by state incumbents that operated the original undersea cables through club consortia that excluded non-club members, such as SAT-3 along the African West coast from Europe to the East. National transmission prices too have come down as a result of commercial open-access companies in South Africa where the �bre market is competitive. Mobile operators have also provided alternatives to the incumbent operator, Telkom, on main intercity routes, and driven network extension into some secondary cities and regions that are poorly served by the incumbent (ibid.). While the metropolitan areas are covered with competing �bre networks, and
there is some duplication along the main intercity routes, beyond that there are complementary investments in green�eld builds and the use of competitor networks for redundancy purposes.
Public-Private Interplays
In many African states the public sector is the single largest collective user of ICTs. Commitments to connecting public institutions can leverage private sector investments to meet these public objectives. In South Africa, where there simply is not suf�cient state �nancing available to either �ll in the gaps in the backbone and access networks, or build a separate self-standing government network, South Africa’s broadband policy acknowledges the extensiveness of private and public networks. The policy proposed that rather than �nance a major capital expenditure, the public sector should pool demand for broadband in order to facilitate the competitive procurement of high-quality broadband for public sector institutions that are not connected. The government would invest in broadband infrastructure through the aggregation of public sector demand and smart procurement of high-capacity network facilities through competitive tender (Republic of South Africa 2013). Through this aggregated government demand, sustainable business cases would be enabled for network operators.
This model leverages much smaller state-operating expenditure, as opposed to large amounts of capital, while creating incentives for private sector investment. Already practised by commercially operated �bre companies in South Africa, the open-access logic of this commercial model is that the operator needs to get as much traf�c as possible on its network in order to maximize the return on its investment and reduce its debt in order to raise new �nancing (Gillwald, Rademan and Esselaar 2016).
A shift from capital expenditure to operating expenditure will optimize the limited budget available from the treasury for broadband. The aggregating of public sector demand can be used to smart-procure competitive tendered services for the public sector, enhancing the viability of public and private operators. In underserved areas, where there is not yet backbone, public sector demand (school clinics, municipalities and public Wi-Fi) can be offered as anchor tenancy to provide an incentive to invest into sub-economic areas. By guaranteeing the demand, private sector players are able to secure the commercial funding needed to roll out infrastructure. Open-access principles, in this context, make business sense because providing wholesale access increases revenues of operators, allowing them to realize their return on investments more quickly and recapitalize their business for further network development (ibid.).

RESEARCH VOLUME SIX: THE SHIFTING GEOPOLITICS OF INTERNET ACCESS
48 • CENTRE FOR INTERNATIONAL GOVERNANCE INNOVATION • CHATHAM HOUSE
Wholesale Regulation
Developing policies and strategies to overcome these barriers to deliver affordable access to reliable high-speed networks also requires identifying the cost drivers in developing market environment. While data prices are not effectively regulated and not cost-based, there are genuinely higher costs associated with network extension in developing countries, where investment in road and power infrastructure is necessary even before the importation of equipment, under conditions of currency volatility and poor exchange rates. Land masses are generally large, with low population density. Market challenges and infrastructure challenges are further compounded by the asymmetries of information and skills that exist between regulator and operators. National and regional efforts to introduce cost-based access regimes to enable competition or even to understand the need for regulatory forbearance on green�eld investments are notoriously dif�cult to undertake. Very often, governance systems that are not transparent are matched by the opacity of operators’ businesses and costs, and information essential for public policy or planning or regulation is withheld on competitive con�dentiality grounds.
However, there are policy tensions between, on the one hand, creating an environment conducive for investors to build out the largely green�eld backhaul and access networks required in most African countries, and, on the other hand, ensuring that the prices charged for services are cost-based along with effective regulation.
Public Wi-Fi as Part of an Integrated Universal Access Strategy
Universal access remains the primary policy challenge for African countries. Universal service strategies initially focused on the development of �xed networks through dedicated universal service levies, which proved to be largely unsuccessful. Efforts to aggregate demand through the creation of telecentres and other supply-side-driven initiatives either had short-lived success or failed. Some centres that were community-initiated and generally driven on some form of entrepreneurial or commercially sustainable model worked. But with the advent of mobile broadband and smart devices, the price and skills barriers that computer-based Internet access created were increasingly removed, undermining the logic of aggregating access around �xed devices (Stork, Calandro and Gillwald 2013).
Wi-Fi is an inherently disruptive technology that allows a new generation of telecommunications operators to compete with established incumbents in both the �xed and wireless markets. Although many analysts point to the exponential growth of mobile data consumption, Wi-Fi traf�c exceeds mobile traf�c in countries where
comparative studies have been undertaken, including in South Africa (Geerdts et al. 2016).
Studies conducted in South Africa on the effects of connection type on mobile data usage show that users might be wary of cellular data usage, preferring Wi-Fi connections for the top �ve most-used applications. This �nding might imply that South African users are cognizant of cellular data usage and take more active measures against using mobile data when not in a Wi-Fi area (Chen, Feamster and Calandro 2016). It seems that users adopt various strategies to optimize mobile data usage, including changing settings to disable automatic software updates and postponing use until connected to Wi-Fi (Mathur, Schlotfeldt and Chetty 2015). These observations all indicate a conscious effort among South African users to conserve data usage when on a cellular connection (Chen, Feamster and Calandro 2016).
Public access to Wi-Fi is emerging as a strategy in Africa to enhance the connectivity for the poor, among others, and enables greater intensity in their usage. This strategy has been applied with mixed results in many developed and some emerging economies over the past decade.
Exploiting the pervasiveness of the mobile broadband technologies and devices paid for by consumers arguably enables the state to subsidize just the usage portion and collaborate with the users on covering the cost of open-access public Wi-Fi. Certainly, qualitative research con�rms the demand and success of such networks, which are becoming innovative consumer strategies to affordably access bandwidth-intensive applications and upgrades (Geerdts et al. 2016).
Structural Separation
In the �xed-line market, restructuring has happened in some of the most developed markets. In 2012, a report by the OECD, which reviewed the experience of structural separation 10 years after the adoption of a council recommendation concerning structural separation in regulated industries, showed that structural separation remains a relevant remedy to advance the process of market liberalization and that the areas of application can include vertically integrated industries where only some activities are subject to competitive constraints (OECD 2012). Importantly, while highlighting the bene�ts of structural separation, the resulting revised recommendation also acknowledges that structural separation might not always bring the economic and public bene�ts that justify its implementation. Governments should therefore carefully assess the costs and bene�ts of structural versus behavioural measures, especially in the context of privatization, liberalization or regulatory reform.
CHAPTER TWO: BEYOND ACCESS: ADDRESSING DIGITAL INEQUALITY IN AFRICA
ALISON GILLWALD • 49
Market Restructuring — New Players: The Case of Mozambique14
Mozambique’s market restructuring provides an excellent case of overcoming the supply-side challenges of building out essential broadband infrastructure at the national level and, speci�cally, in more remote rural areas through conditional but supported market entry.
The winning licensee was required to serve the underserviced areas in the north of the country before being permitted to enter the lucrative, although already relatively saturated, metropolitan area. The low-cost roll-out and market strategy of the winning third entrant, Movitel, a joint venture between the Viettel Group of Vietnam and Mozambique’s SPI, a direct investment company, has led to dramatic competitive outcomes in the Mozambican mobile market.15
Movitel’s success as a late entrant into a duopoly market in the short time since it became operational is unprecedented. Despite stringent licensing requirements that it ful�lled during the rollout of its network in underserviced areas, Movitel’s low-margin, high-volume business model has been highly effective in Mozambique and a tremendous catalyst for competition.
Movitel launched in 2012 and has focused on its rural supply chain by rolling out 153 shops, 12,600 agents and points of sales, and nearly 4,000 direct-sales staff in the country’s rural villages. Movitel’s supply chain covers 85 percent of Mozambique’s rural population and more than 70 percent of the whole country’s population. Movitel nevertheless remains a vulnerable new entrant. Although it has the greatest market share by SIMs sold, it has the smallest ARPU in the country. Movitel’s low revenues (in comparison to incumbent mCel and, especially, Vodacom) and relatively high investment per subscriber means that it is not yet pro�table, and by no means dominant in the market. This position suggests that the positive effect it is having on the market in terms of enhanced access and pricing still needs to be safeguarded by the regulator (Khan and Rademan 2016).
Spectrum
In the meantime, the immediate relief provided by wireless and mobile services to bandwidth-starved consumers has resulted in a massive rise in data traf�c. Historically dimensioned for low bandwidth voice services, the current capacity of these networks is extremely strained.
14 The following section draws upon research conducted by the author for an unpublished report “Mozambique ICT Sector Performance Review,” commissioned by the African Development Bank.
15 Ibid.
And although operators have creatively refarmed existing spectrum in order to offer next-generation spectrum (LTE) access networks, access to this high-speed technology has also been stymied by the lack of access to optimal spectrum on many parts of the continent. The institutional challenges associated with the allocation of spectrum, and the migration of analog terrestrial broadcasting to digital, have meant that service innovation, tax revenues and potential job opportunities have been squandered.
Making ef�cient use of spectrum to meet the unprecedented demand is vital and the cost of not doing so is high. The negative economic impact of the failure to release high-demand spectrum — roughly assessed by doing a reverse application of the World Bank’s Digital Dividends study (2016) that links the extension of broadband by 10 percent to a 1.5 percent increase in GDP — has been equated to hundreds of billions of dollars over a 10-year period.
Complex Adaptive Regulation
New, innovative funding models, like their predecessors, remain dependent on the appropriate institutional arrangements, including well-resourced, capable national regulatory agencies that will both provide certainty to investors and regulate new “open” models. Until these structural conditions are created, the possibilities of broadband contributing to development and economic growth will remain limited.
But transparent accountable economic regulation of the sector — using standard static ef�ciency models that have been used to regulate the liberalized telecommunications sector for the last 30 years — will no longer suf�ce.
The clash of policy and regulatory cultures, re�ected in the defence by traditional telecommunications incumbents of the revenues from OTT platform operators, are in fact driving the demand for data and consequently new revenues for operators. Likewise, the calls for bans on zero-rating of data to access global OTT platforms by late mobile entrants highlight the clash of technical principles of net neutrality applied to the Internet and public policy issues of universality and equality (of access, not quality). When applied to zero-rating as a result of positive pricing discrimination, net neutrality (traditionally applied to ensuring equivalent quality of service to everyone who accesses the Internet, by preventing negative pricing discrimination) affects not only the technical quality of the Internet, but also entry to and use of it. In countries where affordable access is the main factor inhibiting Internet take-up, and where even cost-based prices might be unaffordable to many, zero-rated services may provide access to the Internet that would not otherwise be acquired (see Gillwald et al. 2016).
Caution should be exercised in inhibiting operator and user innovation arising from the very different conditions
RESEARCH VOLUME SIX: THE SHIFTING GEOPOLITICS OF INTERNET ACCESS
50 • CENTRE FOR INTERNATIONAL GOVERNANCE INNOVATION • CHATHAM HOUSE
that exist in developing countries. These systems are able to �nd ways around bottlenecks in the old infrastructures and institutions. They overcome the lack of coordination between the private sector and the state in terms of investment in infrastructure, demand stimulation and supply of services.
CONCLUSIONS AND RECOMMENDATIONSRealizing the potential of broadband to deliver on improved livelihoods, economic growth, job creation and innovation requires understanding the linkages between the different elements of the ICT ecosystem within the local political economy: from the structure of the market, to aligning strategies with the institutional endowments of a particular political economy, to mechanisms to stimulate the absorptive capacity of the citizenry, to the global systems of governance that impact on policies of countries and their ability to exercise their sovereignty. (See Table 1.)
Key challenges for African countries that wish to develop their societies and economies and become digitally inclusive and globally competitive are:
• gathering the necessary supply-and-demand data and analysis to enable evidence-based policy, planning and regulation;
• developing an enabling policy and regulatory framework conducive to investment with adequate institutional arrangements and capacity to effectively implement and oversee policy interventions and strategies;
• rationalizing existing state infrastructure on the basis of whether it is in fact an asset or a drain on the country and improving the coordination of infrastructure planning and network extension;
• leveraging private sector investments for public delivery;
• enhancing competition under conditions of constraint and enabling innovation; and
• ensuring affordable access to broadband networks to improve the intensity of use to build the critical mass necessary for broadband to have social and economic impact.
Within this context, there are six broad categories of policy-regulatory recommendations:
• Participatory policy formulation: With the dearth of public resources (�nancial, human, institutional) at the policy level, there is a need to harness local expertise outside of government through consultative public processes.
• Public-private interplays: For the same reason, policy makers need to create an enabling environment for the leveraging of private-sector investments that deliver public services and that will create the conditions for competition and innovation.
• Next-generation regulation: Future regulation must ensure an even playing �eld for competition (which can drive demand through pricing and product innovation that is responsive to local needs).
• Innovation: It is important to ensure that static regulation of markets on competition grounds does not inhibit positive innovation outcomes, which are best assessed through dynamic ef�ciency.
• Demand stimulation: Policy makers should apply a coordinated demand-stimulation strategy (including ensuring affordable access, reduced input cost for business, e-literacy extension, development of specialist tertiary-level skills and incentives for local content and app development) that will grow the local industry and markets to contribute not only to national economic growth, development and job creation, but also to making countries more globally competitive, both as investment destinations and as producers of products and solutions for global markets.
• Universal-access mechanisms: Policy makers need to review these mechanisms in the context of the increasing availability of Internet-enabled devices and multiple points of public access. A leveraging of these trends to provide citizens with access to public connectivity is suggested (for example, providing free public Wi-Fi access in municipalities, schools, clinics).
The complex, adaptive systems that have emerged very rapidly over the last few years present enormous challenges in mature economies and markets with strong institutions. These challenges are compounded in developing markets with the often fragile institutions found in most developing countries. These markets will only be able to rise to the challenge if the regulators governing their activity focus on core principles that provide investors with certainty but are adaptive to the dynamic environment in which they are operating. For the same reason they should exercise regulatory forbearance on market developments that might result in innovation. Rather than indiscriminately applying “best practices” designed for very different market and social conditions, policy makers and regulators need to develop alternative strategies that can feasibly be implemented within the context of resource constraint that characterizes African countries.

CHAPTER TWO: BEYOND ACCESS: ADDRESSING DIGITAL INEQUALITY IN AFRICA
ALISON GILLWALD • 51
AUTHOR’S NOTEThis chapter draws extensively on some of the only publicly available supply- and demand-side data gathered by Research ICT Africa (RIA) over the past decade. This research has been made possible through the support of the Canadian International Development Research Centre and the UK Department for International Development. The author thanks the Rockefeller Foundation for a writing residency in 2016, where this chapter gestated, and RIA researchers Enrico Calandro, Chenai Chair, Steve Esselaar, Sa�a Khan and Broc Rademan for their contributions to this chapter.
Table 1: Summary of Broadband Strategies to Enhance Digital Equality
STRATEGIES PURPOSE INDICATOR
State/Policy
Consultative policy process to deliver crosscutting multi-sectoral strategy to support digital inclusion
Create enabling environment for digital inclusion through competition, innovation and a secure and trusted digital environment
Policy clarity, timeliness, monitoring and evaluation of targets, including increased access; individual, public and private enterprise; informal sector use; increased electronic transactions and production of content and apps
Institutional Arrangements/Regulatory Framework
Flexible regulatory framework through assessing dynamic ef�ciency and online rights and cyber security framework
Enable innovation and competition for consumer welfare in secure and trusted online environment
Autonomy, accountability, transparency, effectiveness of processes, reduced prices, improved quality and greater intensity of use
Ownership/Operation/Interplays
Leverage private sector investment/skills/technology for public delivery
Fund networks extension, increase ef�ciency, reduce price
Delivery of services, network extension to uneconomic areas
Infrastructure/Services
Open access/infrastructure sharing/structural separation
Network extension, avoiding duplication of investments, cost reduction
Penetration up, costs and pricing down, quality up (targets)
Costs and Prices
Minimize regulatory transactions costs for operators and regulate wholesale pricing in dominant markets
Reduce any unnecessary costs that will be passed on to consumer, maximize market ef�ciencies
Input costs of operators decrease, retail prices come down
Universal Access
Install public Wi-Fi at every public sector building — schools, libraries, municipalities, public transport
Stimulate the intensity of use of Internet by providing limited free data to complement private services
Number of public Wi-Fi spots, number of users, bandwidth used, government/public information sites opened
Demand Stimulation
State provides �nancial and skills support for content and apps development
Localization and innovation Increase in development and use of local content in local languages, apps, innovation hubs
Human Development
Skills development: e-literacy, coders, computer science, engineering, policy and regulatory
Enable access and optimization of Internet for users for well-being and development
Targets for school, university and college throughput; public Wi-Fi champions; “each one teach one” campaigns
Source: Author.

RESEARCH VOLUME SIX: THE SHIFTING GEOPOLITICS OF INTERNET ACCESS
52 • CENTRE FOR INTERNATIONAL GOVERNANCE INNOVATION • CHATHAM HOUSE
WORKS CITEDAcemoglu, Daron and James Robinson. 2012. Why Nations
Fail: The Origins of Power, Prosperity and Poverty. London, UK: Pro�le Books.
Barrantes, R. and H. Galperin. 2008. “Can the poor afford mobile telephony? Evidence from Latin America.” Telecommunications Policy 32 (8): 521–30.
Bauer, Johannes M. and Erik Bohlin. 2008. “From static to dynamic regulation: Recent developments in US telecommunications policy.” Intereconomics 43 (1): 38–50. doi:10.1007/s10272-008-0240-4. http://hdl.handle.net/ 10419/42021.
Benkler, Yochai. 2006. The Wealth of Networks: How Social Production Transforms Markets and Freedom. New Haven, CT: Yale University Press.
Benkler, Yochai, Robert Faris, Urs Gasse, Laura Miyakawa and Stephen Schultze. 2010. Next Generation Connectivity: A review of broadband Internet transitions and policy from around the world. Boston, MA: Berkman Center for Internet & Society, Harvard University.
BEREC. 2011. BEREC-RSPG report on infrastructure and spectrum sharing in mobile/wireless networks. Document No. BoR (11) 26. http://berec.europa.eu/ eng/document_register/subject_matter/berec/reports/224-berec-rspg-report-on-infrastructure-and-spectrum-sharing-in-mobilewireless-networks.
Botswana Communications Regulatory Authority. 2014. “Public Notice – Telecomms and ICT Prices.” www.bocra.org.bw/sites/default/files/documents/Telecommunications%20and%20ICT%20Prices.pdf.
Briglauer, Wolfgang and Klaus Gugler. 2013. “The deployment and penetration of high-speed �ber networks and services: Why are EU member states lagging behind?” Telecommunications Policy 37 (10): 819–35. doi:10.1016/j.telpol.2013.05.003.
Briglauer, Wolfgang, Klaus Peter Gugler and Adhurim Haxhimusa. 2015. “Facility-and Service-Based Competition and Investment in Fixed Broadband Networks: Lessons from a Decade of Access Regulations in the European Union Member States.” ZEW Discussion Paper No. 15-048. Mannheim, Germany: Centre for European Economic Research. http://ftp.zew.de/pub/zew-docs/dp/dp15048.pdf.
Broadband Commission for Digital Development. 2015. The State of Broadband 2015. Geneva, Switzerland: ITU and United Nations Educational, Scienti�c and Cultural Organization. www.broadbandcommission.org/Documents/reports/bb-annualreport2015.pdf.
Castells, M. and P. Himanen. 2013. Reconceptualizing Development in the Global Information Age. London, UK: Oxford University Press.
Chen, A., N. Feamster and E. Calandro. 2016. “Exploring the Walled Garden Theory: An Empirical Framework to Assess Pricing Effects on Mobile Data Usage.” CPRSouth, Policy Brief. www.ietf.org/mail-archive/web/gaia/current/pdfubZ8TRpOvb.pdf.
Chetty, Marshini, Srikanth Sundaresan, Sachit Muckaden, Nick Feamster and Enrico Calandro. 2013. “Measuring Broadband Performance in South Africa.” Proceedings of the Fourth Annual Symposium on Computing for Development, Cape Town, South Africa, December 6-7.
Coleago Consulting. 2016. ICT and Broadcasting Infrastructure Sharing: Phase II Report. Prepared for CRASA and ITU. www.crasa.org/common_up/crasa-setup/13-05-2016_Infrastructure%20Sharing%20II%20Report%20INFRASTRUCTURE%20SHARING%20II%20REPORT.pdf.
CRASA. 2015. “Towards a de�nition of Open Access.” Gabarone, Botswana: CRASA.
Deen-Swarray, Mariama, Alison Gillwald, Ashleigh Morrell and Sa�a Khan. 2012. Lifting the veil on ICT gender indicators in Africa. RIA and University of Cape Town, Policy Paper 13. www.researchictafrica.net/publications/Evidence_for_ICT_Policy_Action/Policy_Paper_13_-_Lifting_the_veil_on_gender_ICT_indicators_in_Africa.pdf.
Deen-Swarray, Mariama, Mpho Moyo and Christoph Stork. 2013. “ICT access and usage among informal businesses in Africa.” Info Journal 15 (5): 52–68.
Elder, Laurent, Rohan Samarajiva, Alison Gillwald and Hernán Galperin. 2014. Information Lives of the Poor: Fighting Poverty with Technology. Ottawa, ON: International Development Research Centre. www.idrc.ca/en/book/infocus-information-lives-poor-�ghting-poverty-technology.
Fransman, Martin, ed. 2006. Global Broadband Battles: Why the U.S. and Europe Lag While Asia Leads.Palo Alto, CA: Stanford University Press.
Geerdts, C., Alison Gillwald, Enrico Calandro, Chenai Chair, Mpho Moyo and Broc Rademan. 2016. Developing Smart Public Wi-� in South Africa. RIA. http://researchictafrica.net/publications/Other_publications/2016_Public_Wi-Fi_Policy_Paper_-_Developing_Smart_Public_Wi-Fi_in_South_Africa.pdf.
Gillwald, A. 2005. “Good intentions, poor outcomes: Telecommunications reform in South Africa.” Telecommunications Policy 29 (4): 469–91.
Gillwald, A. and E. Calandro. 2013. “Policy considerations for mobile development in Africa.” In Mobile Development: Perspectives from Africa, edited by K. Skouby, A. Henten, P. Tobbin and I. Williams, 1–15. Distrup, Denmark: River Publishers.
CHAPTER TWO: BEYOND ACCESS: ADDRESSING DIGITAL INEQUALITY IN AFRICA
ALISON GILLWALD • 53
Gillwald, A., C. Chair, F. Odufuwa, K. Kweku and J. Walubengu. 2016. Much Ado About Nothing? Zero-Rating in the African Context. RIA. www.researchictafrica.net/publications/Other_publications/2016_RIA_Zero-Rating_Policy_Paper_-_Much_ado_about_nothing.pdf.
Gillwald, Alison, Broc Rademan and Steve Esselaar. 2016. “Open access networks: driver or inhibitor of affordable broadband in South Africa.” RIA, Working Paper 2. http://researchictafrica.net/publications/Other_publications/2016_Working_Paper_2_Open_Access_networks_in_South_Africa.pdf.
Gillwald, Alison, M. Moyo and Christoph Stork. 2013. “Understanding ICTs in South Africa: supply and demand side analysis.” RIA. www.researchICTafrica.net.
Graham, Mark and Christopher Foster. 2014. “Geographies of Information Inequality in Sub-Saharan Africa.” Oxford Internet Institute, University of Oxford. Network Inclusion Roundtable, Bangalore, India, October.
ITU. 2003. “The Birth of Broadband: Frequently Asked Questions.” Media Fact Sheet, September. www.itu.int/osg/spu/publications/birthofbroadband/faq.html.
———. 2015. Measuring the Information Society Report 2015. Geneva, Switzerland: ITU. www.itu.int/en/ITU-D/Statistics/Documents/publications/misr2015/MISR2015-w5.pdf.
Kaplan, Jeff. 2005. Roadmap for Open ICT Ecosystems. Cambridge, MA: Berkman Klein Center for Internet & Society, Harvard Law School. http://cyber.law.harvard.edu/epolicy/roadmap.pdf.
Katz, Raul, Pantelis Koutrompis and Fernando Martin Callorda. 2014. “Using a digitization index to measure the economic and social impact of digital agendas.” Info 16 (1): 32–44.
Kenny, Robert and Charles Kenny. 2011. “Superfast broadband: Is it really worth a subsidy?” Info 13 (4): 3–29.
Khan, S. and B. Rademan. 2016. “The Movitel Miracle — A Case Study.” Policy Brief no. 6. RIA. http://researchictafrica.net/polbrf/Research_ICT_Africa_Policy_Briefs/2016_Policy_Brief_6_The_Movitel_Miracle.pdf.
Kim, Yongsoo, Tim Kelly and Siddhartha Raja. 2010. Building broadband: Strategies and policies for the developing world. Washington, DC: Global Information and Communication Technologies Department, World Bank.
Koutrompis, Pantelis. 2009. “The economic impact of broadband on growth: A simultaneous approach.” Telecommunications Policy 33 (9): 471–85.
Levy, B. and P. Spiller, eds. 1997. Regulations, Institutions and Commitment: Comparative Studies of Telecommunications. Cambridge, UK: Cambridge University Press.
Livingston, S. and G. Walter-Drop, eds. 2014. Bits and Atoms: Information and Communication Technology in Areas of Limited Statehoood. New York, NY: Oxford University Press.
Mathur, A., B. Schlotfeldt and M. Chetty. 2015. “A mixed-methods study of mobile users’ data usage practices in South Africa.” In Proceedings of the 17th ACM International Conference on Ubiquitous Computing, UbiComp 2015, Osaka, Japan, 1209–20. http://dblp.uni-trier.de/db/conf/huc/ubicomp2015.html#MathurSC15.
Melody, William H., ed. 1997. Telecom Reform: Principles, Policies and Regulatory Practices. Lyngby, Denmark: Technical University of Denmark.
OECD. 2004. Economic Impact of ICT: Measurement Impact and Implications. Paris, France: OECD. www.ictliteracy.info/rf.pdf/The%20Economic%20Impact%20of%20ICT.pdf.
———. 2012. Report on Experiences with Structural Separation, Competition, Law and Policy. www.oecd.org/daf/competition/50056685.pdf.
Parliament of the Republic of South Africa. 2016. Announcements, Tablings and Committee Reports. No. 147 – 2016. Third Session, Fifth Parliament, November 17. www.parliament.gov.za/live/commonrepository/ Processed/20161122/616390_1.pdf.
Republic of South Africa. 2013. South Africa Connect: Creating Opportunities, Ensuring Inclusion — South Africa’s Broadband Policy. Government Gazette, No. 37119, December 6. www.gov.za/sites/www.gov.za/�les/37119_gon953.pdf.
RIA. 2015. Western Cape Digital Readiness Assessment 2015. Cape Town, South Africa: Western Cape Department of Economic Development and Tourism. www.westerncape.gov.za/assets/departments/economic-development-tourism/digital_readiness_full_report.pdf.
Roetter, Martyn. 2015. “Open-access wireless network: be careful, SA.” TechCentral, October 15. www.techcentral.co.za/open-access-wireless-network-be-careful-sa/60607/.
Samarajiva, R. 1999. “Key to Legitimacy: Key to Effective Regulation.” ITU. www.itu.int/TELECOM/ast2000/cfp/pap_4195.pdf.
Sen, Amartya. 1999. Development as Freedom. New York, NY: Oxford University Press.
Singh, J. 1999. Leapfrogging Development? The Political Economy of Telecommunications. New York, NY: State University of New York Press.
Smith, M. L., L. Elder and H. Emdon, eds. 2011. “Open Development: A New Theory for ICT4D.” Information Technologies and International Development 7 (1): 1–76.
RESEARCH VOLUME SIX: THE SHIFTING GEOPOLITICS OF INTERNET ACCESS
54 • CENTRE FOR INTERNATIONAL GOVERNANCE INNOVATION • CHATHAM HOUSE
Stork, C., E. Calandro and A. Gillwald. 2013. “Internet going mobile: internet access and use in 11 African countries.” Info 15 (5): 34–51.
Stork, C., S. Esselaar, C. Chair and S. Khan. 2016. “OTT — threat or opportunity for African Telcos?” Working Paper 1. RIA, March. www.researchictafrica.net/publications/Other_publications/2016%20_Working_paper_1_OTT-threat%20or%20opportunity%20for%20African%20Telcos.pdf.
TeleGeography. 2016. “GSMA teams with Tanzania MNOs to boost rural 3G coverage.” TeleGeography CommsUpdate, July 26. www.telegeography.com/ products/commsupdate/articles/2016/07/26/gsma-teams-with-tanzanian-mnos-to-boost-rural-3g-coverage/?utm_source=CommsUpdate&utm_campaign=66d215d6ed-CommsUpdate+26+July+2016&utm_medium=email&utm_term=0_0688983330-66d215d6ed-11639801.
World Bank. 2016. World Development Report 2016: Digital Dividends. Washington, DC: World Bank. http://documents.worldbank.org/curated/en/ 896971468194972881/pdf/102725-PUB-Replacement-PUBLIC.pdf.
ABOUT THE AUTHORAlison Gillwald (Ph.D.) is the executive director of Research ICT Africa and holds an adjunct professorship at the University of Cape Town Graduate School of Development, Policy and Practice, where she convenes a transdisciplinary Ph.D. program focusing on information and communication technology policy and regulation. A former regulator, she was appointed to the founding Council of the South African Telecommunications Regulatory Authority after having headed the policy department at the �rst broadcasting regulator, the Independent Broadcasting Authority, which was established in the wake of the �rst democratic elections in South Africa in 1994. Alison also served as chairperson of the South African National Digital Advisory Body, which reported on digital migration in 2001, and was appointed to the board of the public broadcaster, the South African Broadcasting Corporation; she is currently deputy chairperson of the South Africa National Broadband Advisory Council. She has provided technical assistance to several African countries and regional bodies, advising the Ministry of Communication on South Africa’s National Broadband Policy: South Africa Connect and the African Development Bank and Government of Mauritius on the i-Mauritius broadband policy. She has worked extensively with multilateral agencies such as the International Telecommunication Union and the World Bank and served on the Internet Corporation for Assigned Names and Numbers President’s Strategy Panel on Multistakeholder Innovation. She sits on the board of the Tertiary Education and Research Network of South Africa.
CHAPTER THREE: UNLOCKING AFFORDABLE ACCESS IN SUB-SAHARAN AFRICA
STEVE SONG • 55
CHAPTER THREE:UNLOCKING AFFORDABLE ACCESS IN SUB-SAHARAN AFRICA
Steve Song
Copyright © 2016 by Steve Song
RESEARCH VOLUME SIX: THE SHIFTING GEOPOLITICS OF INTERNET ACCESS
56 • CENTRE FOR INTERNATIONAL GOVERNANCE INNOVATION • CHATHAM HOUSE
INTRODUCTIONIt is hard to overstate the transformation in access to communications that mobile phone networks have brought to African countries. In 1995, in a speech to the Group of Seven, Deputy President of South Africa Thabo Mbeki pointed out that there were more phone lines in Manhattan (New York) than in all of Sub-Saharan Africa (M’Bayo 1997). Today, about two-thirds of the population in Sub-Saharan Africa has mobile phone reception (although not necessarily phones) and about one-quarter have access to 3G or better mobile data services (Ericsson 2015). There is a common perception that a linear increase in mobile access networks will eventually connect everyone on the planet. Yet, the reality is that a digital urban-rural divide is growing (International Telecommunication Union [ITU] 2014). Mobile network subscriber growth in Africa is slowing, as is revenue growth for mobile network operators (GSMA Intelligence 2016). This slowdown is linked to the fact that a signi�cant percentage of newer users come from lower income brackets living in regions that present challenges to operators, ranging from sparser population distributions to lack of effective power infrastructure. Meanwhile, operators are experiencing pressures in their existing markets, from increased competition, erosion of revenue from over-the-top (OTT) voice and data services such as WhatsApp, Skype, and so on, and insistence from regulators on network quality improvements (Locke et al. 2016). In terms of how to affordably connect everyone on the planet to communication networks, mobile networks will continue to play the dominant role, but new complementary strategies will also be required. Historically, the deployment of a communication network required millions of dollars of investment to create the international connections, national backhaul (long-distance, high-capacity infrastructure with massive data-carrying capacity) and last-mile infrastructure to deliver access; today, the access landscape is changing. Fibre optic networks have brought high-capacity, high-speed networks to the shores of African countries, and new low-cost wireless technologies are putting last-mile networks within the reach of start-ups and communities alike.
FUELLED BY FIBREThe real impact of technological innovation is often not felt until long after market introduction — in particular in emerging markets. Consider the launch of the �rst mobile networks in Sub-Saharan Africa in 1994, for example: the impact of affordable access granted by mobile technology was not felt until more than 10 years later (The Economist 2005). Fibre optic technology is at a similar juncture today. The �rst high-capacity open-access1 undersea cable to
1 Open-access policies ensure that access to essential communication infrastructure is available to all licensed operators on fair and reasonable terms and in a manner that is transparent and non-discriminatory.
reach countries in Sub-Saharan Africa was launched in July 2009 with little fanfare (Sinico 2009). In 2016, more than a dozen undersea cables encircle the continent, offering many terabits of digital capacity (see Figure 1). The arrival of high-capacity �bre on the shores of African countries, combined with market reforms and regulatory reforms, has triggered a wave of investment in terrestrial �bre optic infrastructure, to the point that virtually every African nation has at least one �bre optic backbone — and many have several — connected to those undersea cables.
Although much of the investment in �bre optic infrastructure has been spurred by the need to provide better, faster and cheaper backhaul for mobile networks, it has also created an enabling environment for complementary last-mile solutions — a positive side effect for all. Previously, the cost of building a communication access network involved solving an array of expensive problems — from international backhaul, to national network access, to middle- and last-mile challenges and the diffusion and maintenance of access devices. Now, with the advent of locally available open-access �bre networks in primary and secondary cities in Sub-Saharan Africa, new opportunities have opened up for access providers.
SPECTRUM ROADBLOCKWhile �bre optic infrastructure is transforming the underlying fabric of access models in Sub-Saharan Africa, wireless networks remain the dominant means of delivering access to the last mile. The traditional means for telecommunications operators to make wireless spectrum space available is through an exclusive licence for a particular frequency, usually over a period of 10 to 20 years. As demand for wireless spectrum has increased and begun to exceed its immediate availability, regulators have been challenged to �nd effective means of making frequencies available to operators in a timely and ef�cient manner.
An apt illustration of this is the transition from analog to digital terrestrial broadcasting in Africa, referred to as the digital switchover (DSO), which is intended to free up spectrum in the ultra-high frequency (UHF) bands. Digital broadcasting needs only a fraction of the amount of wireless spectrum required by analog broadcasting. In 2006, African countries agreed to participate in a DSO transition process that would, among other things, free up hundreds of megahertz of spectrum for telecommunications access (ITU 2006). The completion date was set for nine years into the future: 2015.
As of July 2016, few African countries have completed the transition, with economic leaders such as Nigeria and Ghana only committing to complete by 2017 (Ogundeji 2016). The reasons for this lag are bound up in a combination of technological and standards challenges, �nancing problems and power politics. As spectrum
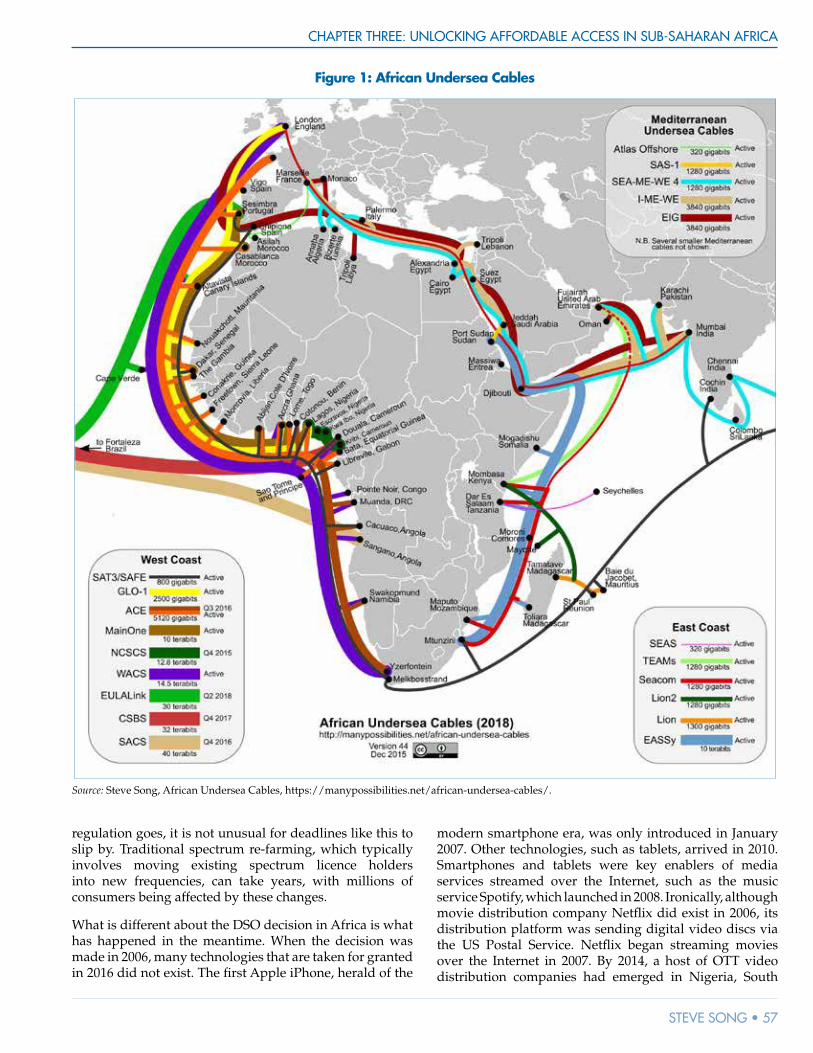
CHAPTER THREE: UNLOCKING AFFORDABLE ACCESS IN SUB-SAHARAN AFRICA
STEVE SONG • 57
regulation goes, it is not unusual for deadlines like this to slip by. Traditional spectrum re-farming, which typically involves moving existing spectrum licence holders into new frequencies, can take years, with millions of consumers being affected by these changes.
What is different about the DSO decision in Africa is what has happened in the meantime. When the decision was made in 2006, many technologies that are taken for granted in 2016 did not exist. The �rst Apple iPhone, herald of the
modern smartphone era, was only introduced in January 2007. Other technologies, such as tablets, arrived in 2010. Smartphones and tablets were key enablers of media services streamed over the Internet, such as the music service Spotify, which launched in 2008. Ironically, although movie distribution company Net�ix did exist in 2006, its distribution platform was sending digital video discs via the US Postal Service. Net�ix began streaming movies over the Internet in 2007. By 2014, a host of OTT video distribution companies had emerged in Nigeria, South
Figure 1: African Undersea Cables
Source: Steve Song, African Undersea Cables, https://manypossibilities.net/african-undersea-cables/.
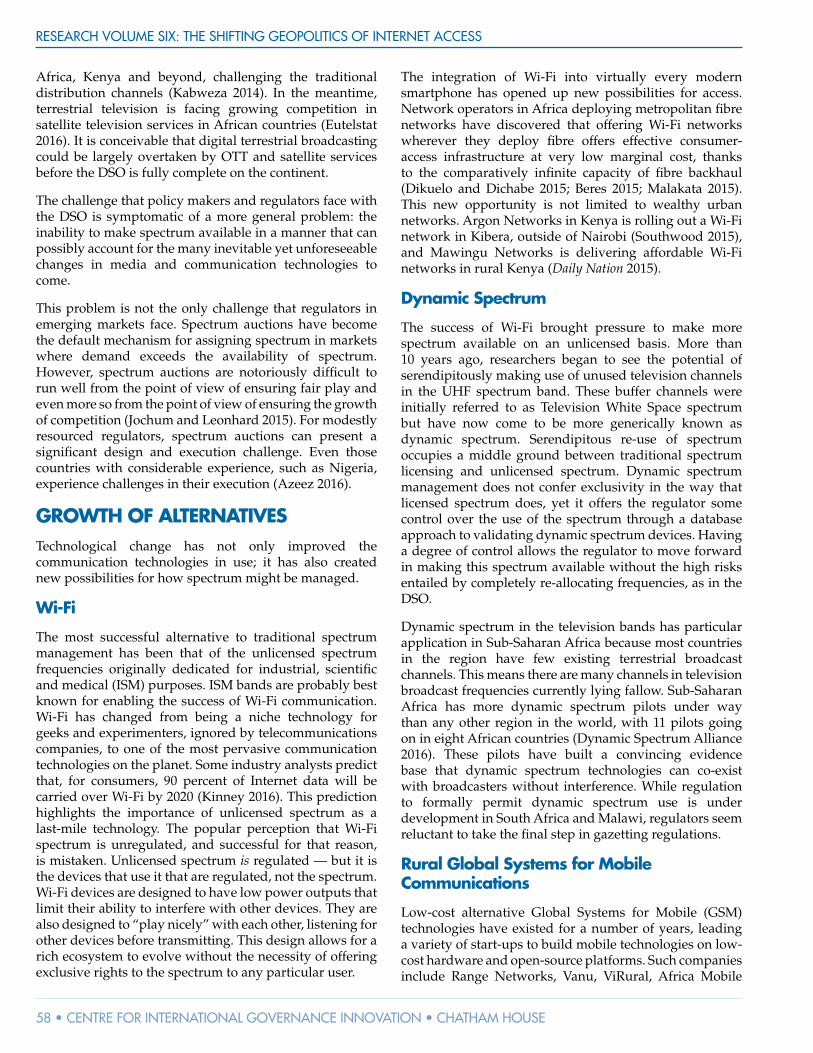
RESEARCH VOLUME SIX: THE SHIFTING GEOPOLITICS OF INTERNET ACCESS
58 • CENTRE FOR INTERNATIONAL GOVERNANCE INNOVATION • CHATHAM HOUSE
Africa, Kenya and beyond, challenging the traditional distribution channels (Kabweza 2014). In the meantime, terrestrial television is facing growing competition in satellite television services in African countries (Eutelstat 2016). It is conceivable that digital terrestrial broadcasting could be largely overtaken by OTT and satellite services before the DSO is fully complete on the continent.
The challenge that policy makers and regulators face with the DSO is symptomatic of a more general problem: the inability to make spectrum available in a manner that can possibly account for the many inevitable yet unforeseeable changes in media and communication technologies to come.
This problem is not the only challenge that regulators in emerging markets face. Spectrum auctions have become the default mechanism for assigning spectrum in markets where demand exceeds the availability of spectrum. However, spectrum auctions are notoriously dif�cult to run well from the point of view of ensuring fair play and even more so from the point of view of ensuring the growth of competition (Jochum and Leonhard 2015). For modestly resourced regulators, spectrum auctions can present a signi�cant design and execution challenge. Even those countries with considerable experience, such as Nigeria, experience challenges in their execution (Azeez 2016).
GROWTH OF ALTERNATIVESTechnological change has not only improved the communication technologies in use; it has also created new possibilities for how spectrum might be managed.
Wi-Fi
The most successful alternative to traditional spectrum management has been that of the unlicensed spectrum frequencies originally dedicated for industrial, scienti�c and medical (ISM) purposes. ISM bands are probably best known for enabling the success of Wi-Fi communication. Wi-Fi has changed from being a niche technology for geeks and experimenters, ignored by telecommunications companies, to one of the most pervasive communication technologies on the planet. Some industry analysts predict that, for consumers, 90 percent of Internet data will be carried over Wi-Fi by 2020 (Kinney 2016). This prediction highlights the importance of unlicensed spectrum as a last-mile technology. The popular perception that Wi-Fi spectrum is unregulated, and successful for that reason, is mistaken. Unlicensed spectrum is regulated — but it is the devices that use it that are regulated, not the spectrum. Wi-Fi devices are designed to have low power outputs that limit their ability to interfere with other devices. They are also designed to “play nicely” with each other, listening for other devices before transmitting. This design allows for a rich ecosystem to evolve without the necessity of offering exclusive rights to the spectrum to any particular user.
The integration of Wi-Fi into virtually every modern smartphone has opened up new possibilities for access. Network operators in Africa deploying metropolitan �bre networks have discovered that offering Wi-Fi networks wherever they deploy �bre offers effective consumer-access infrastructure at very low marginal cost, thanks to the comparatively in�nite capacity of �bre backhaul (Dikuelo and Dichabe 2015; Beres 2015; Malakata 2015). This new opportunity is not limited to wealthy urban networks. Argon Networks in Kenya is rolling out a Wi-Fi network in Kibera, outside of Nairobi (Southwood 2015), and Mawingu Networks is delivering affordable Wi-Fi networks in rural Kenya (Daily Nation 2015).
Dynamic Spectrum
The success of Wi-Fi brought pressure to make more spectrum available on an unlicensed basis. More than 10 years ago, researchers began to see the potential of serendipitously making use of unused television channels in the UHF spectrum band. These buffer channels were initially referred to as Television White Space spectrum but have now come to be more generically known as dynamic spectrum. Serendipitous re-use of spectrum occupies a middle ground between traditional spectrum licensing and unlicensed spectrum. Dynamic spectrum management does not confer exclusivity in the way that licensed spectrum does, yet it offers the regulator some control over the use of the spectrum through a database approach to validating dynamic spectrum devices. Having a degree of control allows the regulator to move forward in making this spectrum available without the high risks entailed by completely re-allocating frequencies, as in the DSO.
Dynamic spectrum in the television bands has particular application in Sub-Saharan Africa because most countries in the region have few existing terrestrial broadcast channels. This means there are many channels in television broadcast frequencies currently lying fallow. Sub-Saharan Africa has more dynamic spectrum pilots under way than any other region in the world, with 11 pilots going on in eight African countries (Dynamic Spectrum Alliance 2016). These pilots have built a convincing evidence base that dynamic spectrum technologies can co-exist with broadcasters without interference. While regulation to formally permit dynamic spectrum use is under development in South Africa and Malawi, regulators seem reluctant to take the �nal step in gazetting regulations.
Rural Global Systems for Mobile Communications
Low-cost alternative Global Systems for Mobile (GSM) technologies have existed for a number of years, leading a variety of start-ups to build mobile technologies on low-cost hardware and open-source platforms. Such companies include Range Networks, Vanu, ViRural, Africa Mobile

CHAPTER THREE: UNLOCKING AFFORDABLE ACCESS IN SUB-SAHARAN AFRICA
STEVE SONG • 59
Networks and Fairwaves. The result is that it is possible for anyone to erect a functioning GSM base station for a few thousand dollars. What holds these start-ups back, however, is the fact that the popular GSM spectrum bands have largely been assigned to existing mobile network operators. Low-cost GSM start-ups are left with the option of trying to sell their technology to incumbents, whose supply chains are often closely tied to large equipment suppliers.
In 2015, the Mexican communications regulator, Instituto Federal de Telecomunicaciones (IFETEL), published its new frequency plan (IFETEL 2015). IFETEL has set aside mobile spectrum in the 800MHz band to serve social good. The criteria for using this spectrum is that the population of communities being served must be less than 2,500 or the community must be designated as an indigenous region or priority zone. This regulatory decision builds on the success of a non-governmental organization that has been delivering GSM access to rural areas for several years. Rhizomatica is a non-pro�t organization that has been providing GSM services to indigenous communities around Oaxaca since 2012 (Salazar 2016). Until 2015, it operated under a special dispensation from IFETEL, but the allocation of spectrum to this purpose has now been made of�cial and any organization may apply for access to this spectrum under the conditions speci�ed. The amount of allocated spectrum is not large compared to what the big operators access, but it is more than enough for smaller communities.
Currently, Mexico remains unique in this groundbreaking regulation. Regulators in Sub-Saharan Africa could use the same strategy to ensure that sparsely populated rural areas have the potential to solve their own access challenges.
CONCLUSIONMobile networks are the most important last-mile access technology in Sub-Saharan Africa and that fact is unlikely to change in the near future. However, evidence is mounting that existing mobile network economic models may not lead to affordable access for all, especially in poorer regions outside of urban areas. Fibre optic networks in Africa, both undersea and terrestrial, combined with lower-cost wireless access technologies, offer new models for delivering affordable access. What is needed are policy makers and regulators who embrace the strategic importance of unlicensed and dynamic spectrum and lower the barriers to access innovation. Combined with open-access policies that democratize access to �bre optic backbones, the modernization of spectrum regulation to encourage unlicensed and dynamic spectrum regulation can not only encourage competition via new forms of access but also help to develop more resilient networks through technological and economic diversity in the last mile.
WORKS CITEDAzeez, Kunle. 2016. “Telecoms: 2.6Ghz Spectrum
Auction Fails For Third Time.” New Telegraph, May 20. http://newtelegraphonline.com/telecoms-2-6ghz-spectrum-auction-fails-third-time/.
Beres, Ela. 2015. “Bringing Better Wi-Fi to Kampala with Project Link.” Google Africa (blog), Google, December 3. https://africa.googleblog.com/2015/12/bringing-better-wi-�-to-kampala-with.html.
Daily Nation. 2015. “Kenya: Wireless Internet Provider Mawingu Networks Gets U.S. Funding.” Daily Nation, July 24. http://allafrica.com/stories/201507241463.html.
Dikuelo, Pauline and Amanda Dichabe. 2015. “BoFiNet rolls out 600 Wi-Fi hot spots.” MmegiOnline, March 10. www.mmegi.bw/index.php?aid=49764.
Dynamic Spectrum Alliance. 2016. “Worldwide Commercial Deployments, Pilots, and Trials.” January. Bristol, UK:Dynamic Spectrum Alliance. http://dynamicspectrumalliance.org/pilots/#africa.
Ericsson. 2015. “Sub-Saharan Africa Ericsson Mobility Report Nov 2015.” Ericsson Mobility Report, November. Stockholm, Sweden: Ericsson. www.ericsson.com/res/docs/2015/mobility-report/emr-nov-2015-regional-report-sub-saharan-africa.pdf.
Eutelstat. 2016. “Satellite TV One of the Fastest-growing Media in West Africa.” Eutelsat press release, February 3. http://news.eutelsat.com/pressreleases/satellite-tv-one-of-the-fastest-growing-media-in-west-africa-1307643.
GSMA Intelligence. 2016. The Mobile Economy: Africa 2016. GSMA. www.gsma.com/mobileeconomy/africa/.
IFETEL. 2015. “ACUERDO mediante el cual el Pleno del Instituto Federal de Telecomunicaciones modi�ca el Programa Anual de Uso y Aprovechamiento de bandas de frecuencias 2015.” Diario Of�cial de la Federación, IFETEL. www.dof.gob.mx/nota_detalle.php?codigo=5387867&fecha=06/04/2015.
ITU. 2006. “Digital broadcasting set to transform communication landscape by 2015.” International Telecommunication Union press release, June 16. www.itu.int/newsroom/press_releases/2006/11.html.
———. 2014. “Broadband Situations in Rural and Remote Areas.” International Telecommunication Union, April 4. www.itu.int/en/ITU-D/Technology/Documents/RuralCommunications/Broadband_Situations_in_Rural_and_Remote_Areas_Full.pdf.
RESEARCH VOLUME SIX: THE SHIFTING GEOPOLITICS OF INTERNET ACCESS
60 • CENTRE FOR INTERNATIONAL GOVERNANCE INNOVATION • CHATHAM HOUSE
ABOUT THE AUTHORSteve Song is a wireless researcher with the Network Startup Resource Center, where he works to develop strategies for expanding the utilization of wireless technologies through shared-spectrum strategies to enable greater Internet access in Africa and other emerging-market regions. Previously, Steve worked at the International Development Research Centre, where he led the organization’s information and communication technology for development program in Africa, funding research into the transformational potential of information and communication technologies across the continent.
Jochum, Jan and Matthias Leonhard. 2015. “Impact of Spectrum Auctions on the Consolidation of European Mobile Markets.” Opinion Paper, November 23. Cologne, Germany: Detecon Consulting. www.detecon.com/en/Publications/impact-spectrum-auctions.
Kabweza, L. S. M. 2014. “Here’s a list of Africa’s Video on Demand & pay TV providers.” TechZim, October 7. www.techzim.co.zw/2014/10/heres-a-list-of-africas-video-on-demand-pay-tv-providers/.
Kinney, Sean. 2016. “Mobile Experts predicts 90% of data will be transmitted over unlicensed spectrum by 2020.” RCR Wireless, July 7. www.rcrwireless.com/20160707/network-infrastructure/wi-�/analyst-wi-�-carriers-80-mobile-data-tag17.
Locke, Chris, Jonathan Donner, Bryan Pon, Savita Bailur, Francis Hook and Amba Kak. 2016. “Digital Access in Africa.” Caribou Digital, 2016. http://cariboudigital.net/new/wp-content/uploads/2016/08/Caribou-Digital-DFID-Digital-Access-in-Africa.pdf.
Malakata, Michael. 2015. “Kenyan counties eager to tap into Liquid.” ITWeb Africa, November 26. www.itwebafrica.com/network/262-kenya/235528-kenyan-counties-eager-to-tap-into-liquid.
M’Bayo, Ritchard. 1997. “Africa and the Global Information Infrastructure.” International Communication Gazette 59 (4): 345–64. doi:10.1177/0016549297059004007.
Ogundeji, Olusegun. 2016. “Nigeria, Ghana commit to digital broadcast transition by 2017.” ITWeb Africa, March 17. www.itwebafrica.com/ict-and-governance/523-africa/236013-nigeria-ghana-commit-to-digital-broadcast-transition-by-2017.
Salazar, Giovanna. 2016. “So Long, Phone Companies. Mexico’s Indigenous Groups Are Getting Their Own Telecoms.” Global Voices, translation posted July 26. https://globalvoices.org/2016/07/26/so-long-phone-companies-mexicos-indigenous-groups-are-getting-their-own-telecoms/.
Sinico, Sean. 2009. “Seacom project to increase affordable Internet access in Africa.” Deutsche Welle, July 22. www.dw.com/en/seacom-project-to-increase-affordable-internet-access-in-africa/a-4507743.
Southwood, Russell. 2015. “Argon Telecom wants to halve the cost of data for residents of Kenya’s Kibera using low-cost Wi-Fi roll-out.” Balancing Act, September 4. www.balancingact-africa.com/news/en/issue-no-793/top-story/argon-telecom-wants/en.
The Economist. 2005. “The Real Digital Divide.” The Economist, March 10. www.economist.com/node/ 3742817.

CHAPTER FOUR: NET NEUTRALITY: REFLECTIONS ON THE CURRENT DEBATE
PABLO BELLO AND JUAN JUNG • 61
CHAPTER FOUR:NET NEUTRALITY: REFLECTIONS ON THE CURRENT DEBATE
Pablo Bello and Juan Jung
Copyright © 2015 by Pablo Bello and Juan Jung
RESEARCH VOLUME SIX: THE SHIFTING GEOPOLITICS OF INTERNET ACCESS
62 • CENTRE FOR INTERNATIONAL GOVERNANCE INNOVATION • CHATHAM HOUSE
INTRODUCTIONNet neutrality is often associated with the principles that guide the handling of traf�c circulating over Internet networks. However, the lack of a precise and concrete de�nition has led to different interpretations by different agents. For some, net neutrality refers to the need to ensure the openness of the Internet, preserving users’ free and nondiscriminatory access to content, applications or services available on the Internet. For others, net neutrality instead implies that all data on the Internet should be treated equally.
The debate began in the late 1990s in the United States and has since gained momentum in academia, civil society, the technical community and the private sector linked to Internet and telecommunications. As summarized by Paul Njoroge et al. (2013), on the one hand, enterprises related to content usually state that departing from net neutrality could threaten content innovation. On the other hand, Internet Service Providers (ISPs) may argue that strict net neutrality regulations can harm the return on investments, weakening the economic incentives to invest and upgrade their infrastructures. One of the most important academic contributions to the net neutrality debate came from Tim Wu (2003), who referred to the importance of giving users the right to use non-harmful contents or applications, and to give innovators the corresponding freedom to supply them. Wu examined the concept of net neutrality and its importance in promoting innovation, focusing the analysis on three different approaches for regulation. Christopher S. Yoo (2005) expressed some concerns regarding the possibility of regulating net neutrality, as it may prove ineffective in such a dynamic framework, and may reduce incentives to invest in wider network capacity. He proposed an alternative approach, called “network diversity.” Later, Wu and Yoo (2007) became engaged in a popular debate in which they contrasted their respective points of view. Various authors continued to study this subject from different angles. While Daeho Lee and Yong-Hwa Kim (2014), for instance, focused the analysis on ISPs’ incentives to discriminate against application services, other authors, such as Gernot Pehnelt (2008), emphasized the welfare-loss problem caused by congestion problems, arguing in favour of the possibility of differentiation of data packets according to their quality sensitivity as a remedy. In any case, most fears of certain sectors come from the possibility that telecommunications operators could increase control over the content and applications that operate over the Internet, emphasizing the need to maintain end-to-end communication. Some of these fears have even led to proposals arguing against the diversity of commercial plans offered to users.
Over the last few years, debate has given way to regulations that have been implemented in various countries, and which have increased the intensity of the discussions in the
public sphere. In the United States, the Telecommunications Act of 1996 represented a major change in the previous telecommunication law, as it included references to the Internet for the �rst time; however — and this is a key aspect — ISPs were not classi�ed as common carriers.1
More recently, the Federal Communication Commission (FCC) promoted its principles for “open Internet” in 2005, which were followed by the 2010 Open Internet Order. The 2005 principles were mainly related to consumer rights, such as the ability to access any lawful contents, and to choose any legal devices, providers, applications and services. The 2010 order emphasized rules regarding transparency and having no blocking and no unreasonable discrimination. More recently, in January 2014, the DC Circuit Court stated that the FCC has no authority to enforce net neutrality rules and, as a result, in April 2014 the FCC announced a proposal that may allow ISPs to build special lanes for certain traf�c, provided that it does not harm consumers or decrease competition. In November 2014, US President Barack Obama issued a statement proposing the FCC classify broadband under Title II2 of the Telecommunications Act, a move that was recently approved by the FCC, and which implies that the Internet would be regulated as any other utility. Outside the United States, Chile and Colombia have approved �exible legislation on net neutrality. In the case of the European Union, former Vice-President and Commissioner for the Digital Agenda Neelie Kroes stressed on several occasions her stance in favour of freedom of choice for users, and the need for a commercially differentiated supply.
It is important to bear in mind that currently when aspects related to net neutrality are debated, fundamental freedoms and principles should not be at stake. In fact, in the countries in which net neutrality discussions have taken place, there is no evidence of ISPs aiming to block legal content. There seems to be consensus over the need to avoid arbitrary discrimination practices, the blocking of legal services and any practice leading to the degradation of service quality for arbitrary reasons. Any activity that distorts the market should be avoided, whether it comes from access providers or content providers. To the extent that it is accepted by all those who participate in the debate, it will surely contribute to bridging differences.
However, one characteristic of this current debate is the polarization of the arguments employed, without quali�cation or an adequate conceptualization of the problem. Some actors have little interest in understanding divergent points of view. This is the situation that has encouraged the authors to write this chapter in order to provide re�ection without dogmas.
1 The de�nition mainly refers to telephone services.
2 Title II refers to the classi�cation as common carriers as de�ned by the Telecommunications Act of 1934.

CHAPTER FOUR: NET NEUTRALITY: REFLECTIONS ON THE CURRENT DEBATE
PABLO BELLO AND JUAN JUNG • 63
From the authors’ point of view, net neutrality debates basically refer to competition, investment and innovation within the digital ecosystem. As pointed out by Yoo (in Wu and Yoo 2007, 589), the debate can be viewed as an “intramural �ght between large content providers (such as Google) and the large network providers (such as Verizon and Comcast).” In the last 10 years especially, the context of the debate has changed. In particular, important investments and deployment of wireless networks, and the development of advanced wired networks, have increased considerably the connectivity options for end-users, a fact that suggests that the role of access networks as gatekeepers of the Internet has decreased (and will probably continue to do so), while, on the other hand, there is an increasing concentration in the provision of services and contents over the network.
Ensuring that the Internet is maintained as a space that is open to innovation is a principle on which this re�ection can be based. In this sense, Wu (2003) has expressed the necessity of understanding net neutrality in terms of safeguarding competition and innovation. The capacity to develop new services, new solutions, new applications and new technology is what has enabled the considerable progress made in the development of the Internet globally. Openness to innovation is inherent to the Net, and surely every actor within the digital ecosystem will agree on the importance of preserving this. In fact, it is rare to hear voices in debates on the subject opposing innovation. The freedom of users to access content and services is also not in dispute.
A second essential aspect when approaching this discussion is related to the subject of analysis. In the pre-convergence era of telecommunications and information technology, the separation between physical infrastructure (networks or hardware) and services provided over that infrastructure (telephony, television or software) could be understood. With convergence, the layer/tier model has become much more porous and it makes increasingly less sense to refer to telecommunications networks as something dissociated from the Internet and the services offered over it.
This is a key aspect of the discussion. The “Internet’s openness” should be understood as a guiding principle that transcends each of the layers/tiers and extends throughout the digital ecosystem, and that each of the stakeholders of this ecosystem is essential to its development. This means that there needs to be innovation, competition and investment in the telecommunications networks, as well as in the intermediaries, services, content and operating systems.
This chapter is structured as follows: First, a description of the so-called digital ecosystem is presented. This is followed by a number of principles that are understood to be necessary to keep the Internet as a space that is open to innovation. Finally, the discussion around net neutrality is presented, along with some �nal thoughts.
THE DIGITAL ECOSYSTEMAs a result of the transformation experienced by telecommunications and information technologies over the last 20 years, and in particular in the last decade with the explosion of Internet and convergent services, a new space has been con�gured: the digital ecosystem, in which the networks and the services provided over the networks must necessarily coexist harmoniously and sustainably. In other words, without telecommunications networks there is no Internet, but without services and applications the Internet is pointless.
The basic issue, therefore, is to ensure the appropriate conditions to maximize the joint development of the two essential components of the ecosystem. This would contribute to maximizing general welfare, a goal that must be taken into account in discussions related to the digital ecosytem.
CURRENT TRENDSIn recent years, there has been an accelerated expansion of services provided over increasingly bandwith-intensive networks, in particular derivatives of multimedia services, mainly using voice and video. These trends are expected to intensify in the coming years. Figure 1 shows the foreseeable evolution of the expected residential traf�c for Internet networks, worldwide, until the year 2018. The graph shows the increasing levels of expected traf�c, which will generate signi�cant pressure on the capacity of current networks. This will require signi�cant investments to expand the networks’ capacity and ensure the quality of
Figure 1: Evolution of the Global Traf�c over Internet Networks
Source: CISCO (2014).
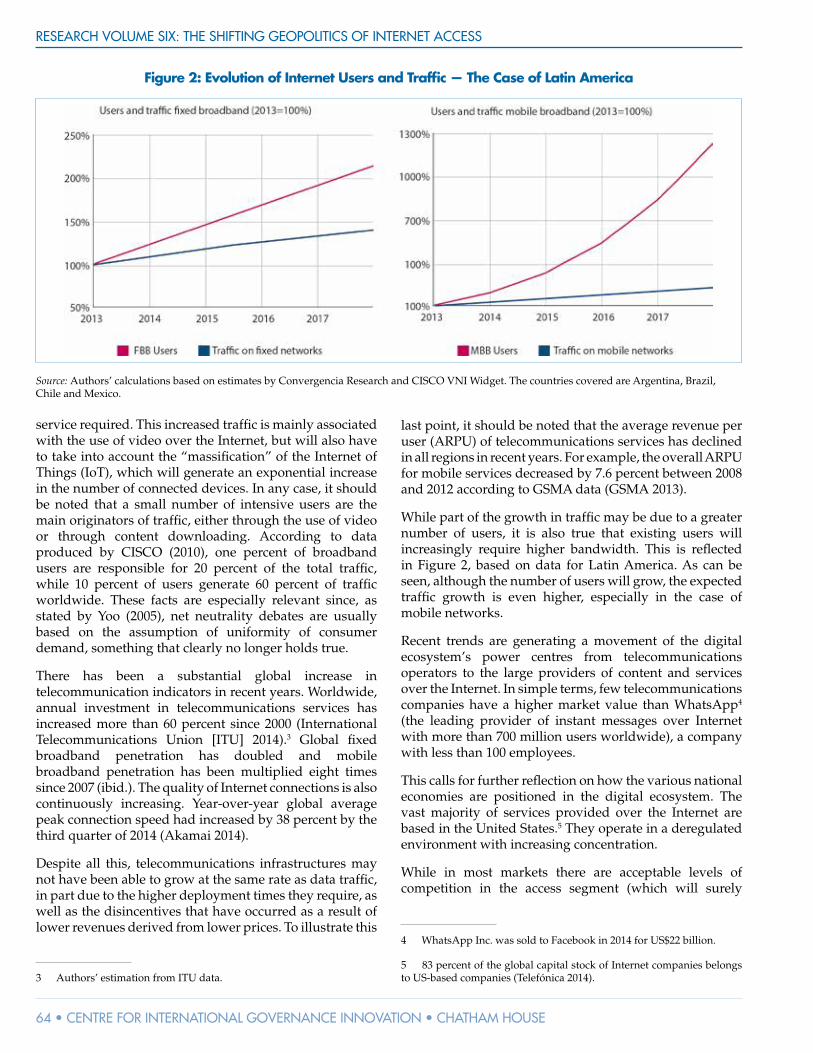
RESEARCH VOLUME SIX: THE SHIFTING GEOPOLITICS OF INTERNET ACCESS
64 • CENTRE FOR INTERNATIONAL GOVERNANCE INNOVATION • CHATHAM HOUSE
service required. This increased traf�c is mainly associated with the use of video over the Internet, but will also have to take into account the “massi�cation” of the Internet of Things (IoT), which will generate an exponential increase in the number of connected devices. In any case, it should be noted that a small number of intensive users are the main originators of traf�c, either through the use of video or through content downloading. According to data produced by CISCO (2010), one percent of broadband users are responsible for 20 percent of the total traf�c, while 10 percent of users generate 60 percent of traf�c worldwide. These facts are especially relevant since, as stated by Yoo (2005), net neutrality debates are usually based on the assumption of uniformity of consumer demand, something that clearly no longer holds true.
There has been a substantial global increase in telecommunication indicators in recent years. Worldwide, annual investment in telecommunications services has increased more than 60 percent since 2000 (International Telecommunications Union [ITU] 2014).3 Global �xed broadband penetration has doubled and mobile broadband penetration has been multiplied eight times since 2007 (ibid.). The quality of Internet connections is also continuously increasing. Year-over-year global average peak connection speed had increased by 38 percent by the third quarter of 2014 (Akamai 2014).
Despite all this, telecommunications infrastructures may not have been able to grow at the same rate as data traf�c, in part due to the higher deployment times they require, as well as the disincentives that have occurred as a result of lower revenues derived from lower prices. To illustrate this
3 Authors’ estimation from ITU data.
last point, it should be noted that the average revenue per user (ARPU) of telecommunications services has declined in all regions in recent years. For example, the overall ARPU for mobile services decreased by 7.6 percent between 2008 and 2012 according to GSMA data (GSMA 2013).
While part of the growth in traf�c may be due to a greater number of users, it is also true that existing users will increasingly require higher bandwidth. This is re�ected in Figure 2, based on data for Latin America. As can be seen, although the number of users will grow, the expected traf�c growth is even higher, especially in the case of mobile networks.
Recent trends are generating a movement of the digital ecosystem’s power centres from telecommunications operators to the large providers of content and services over the Internet. In simple terms, few telecommunications companies have a higher market value than WhatsApp4
(the leading provider of instant messages over Internet with more than 700 million users worldwide), a company with less than 100 employees.
This calls for further re�ection on how the various national economies are positioned in the digital ecosystem. The vast majority of services provided over the Internet are based in the United States.5 They operate in a deregulated environment with increasing concentration.
While in most markets there are acceptable levels of competition in the access segment (which will surely
4 WhatsApp Inc. was sold to Facebook in 2014 for US$22 billion.
5 83 percent of the global capital stock of Internet companies belongs to US-based companies (Telefónica 2014).
Figure 2: Evolution of Internet Users and Traf�c — The Case of Latin America
Source: Authors’ calculations based on estimates by Convergencia Research and CISCO VNI Widget. The countries covered are Argentina, Brazil, Chile and Mexico.

CHAPTER FOUR: NET NEUTRALITY: REFLECTIONS ON THE CURRENT DEBATE
PABLO BELLO AND JUAN JUNG • 65
increase with deployment of 4G and 5G technologies), the same cannot be said about the market of services provided over the networks. The oligopolistic tendencies of the Internet services market can be seen in Figures 3 and 4. Figure 5 summarizes the trends in the mobile operating systems market, which also approximates an oligopolistic framework. These trends toward concentration leave very little space for potential challengers. The fact that the Internet services market seems to present much higher concentration levels than the telecommunications industry should remove any concerns about gatekeeper control by the network owners.
Recent market trends also show another phenomenon: the increasing substitutability of traditional voice or message telecommunications services for similar applications provided by companies operating over the network. Due to this, the boundaries of markets become increasingly more diffuse and the relevant markets become broader, which generates the need to promote fair competition along the entire value chain. Contrary to conventional wisdom, in the case of some telecommunication services, widening the relevant markets can deteriorate competition levels, because of the entrance of global dominant players, which are out of the jurisdiction of local regulations.
As a result, when analyzing the competition within the digital ecosystem, this oligopolistic tendency of the Internet services market must be taken into account, in addition to the lack of interoperability between virtual platforms, the absence of portability mechanisms and the indiscriminate abuse of personal information for commercial purposes. Interoperability is essential to communicate or interact with any other user regardless of
who the service provider may be, while portability enables users to switch companies without incurring in a loss of value. Recent trends resulting from the increase in services provided over the Internet have gone in the opposite direction, generating adverse effects for the user because of the accentuation of a trend toward the creation of closed interaction spaces (monopolistic by nature), contrasting with what telecommunications networks are by nature: interoperable and portable.
THE BEST-EFFORT PRINCIPLE AND THE TREATMENT OF DATA PACKETSThe above, in particular the traf�c growth forecasts, shows that the management of traf�c over Internet networks should be put forward as an inherent element of the Internet’s sustainable development. Competition and measures against arbitrary discrimination should be protected.
Traf�c management refers to a number of techniques that can be carried out by telecommunications operators. Management practices can be divided into those of a technical nature (oriented toward avoiding congestion) and those of a more economic or legal nature (associated with the link to the �nal consumer) (Canadian Radio-television and Telecommunications Commission 2009).
While the Internet operates on the principle of “best effort,” the nature of the data packets is not the same in all cases. The fact that they should be treated in differentiated manners when appropriate may be relevant for and to the bene�t of all actors in the digital ecosystem.
Figure 3: Use of Social Networks (Top Seven Desktop, Tablet and Console Social Media Sites from
June 2013 to June 2014)
Source: Stat Counter Global Stats (2014).
Figure 4: Use of Search Engines on Internet (Top Five Desktop, Tablet and Console Search Engines from
June 2013 to June 2014)
Source: Stat Counter Global Stats (2014).
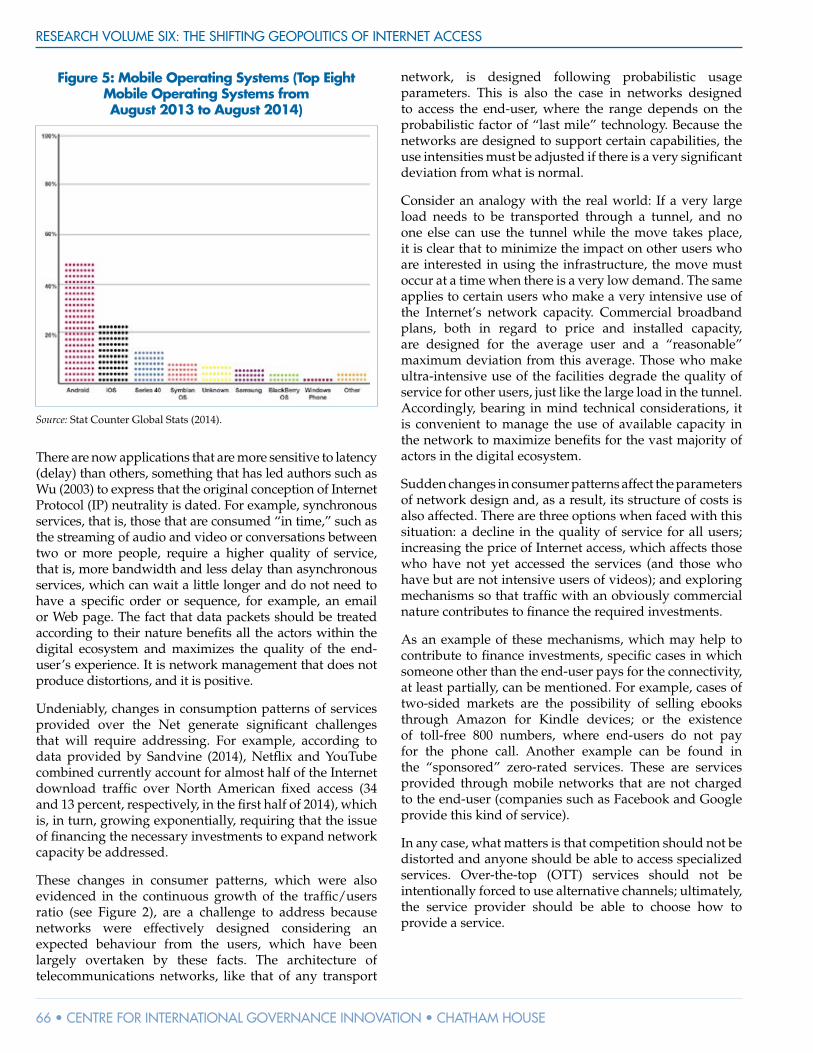
RESEARCH VOLUME SIX: THE SHIFTING GEOPOLITICS OF INTERNET ACCESS
66 • CENTRE FOR INTERNATIONAL GOVERNANCE INNOVATION • CHATHAM HOUSE
There are now applications that are more sensitive to latency (delay) than others, something that has led authors such as Wu (2003) to express that the original conception of Internet Protocol (IP) neutrality is dated. For example, synchronous services, that is, those that are consumed “in time,” such as the streaming of audio and video or conversations between two or more people, require a higher quality of service, that is, more bandwidth and less delay than asynchronous services, which can wait a little longer and do not need to have a speci�c order or sequence, for example, an email or Web page. The fact that data packets should be treated according to their nature bene�ts all the actors within the digital ecosystem and maximizes the quality of the end-user’s experience. It is network management that does not produce distortions, and it is positive.
Undeniably, changes in consumption patterns of services provided over the Net generate signi�cant challenges that will require addressing. For example, according to data provided by Sandvine (2014), Net�ix and YouTube combined currently account for almost half of the Internet download traf�c over North American �xed access (34 and 13 percent, respectively, in the �rst half of 2014), which is, in turn, growing exponentially, requiring that the issue of �nancing the necessary investments to expand network capacity be addressed.
These changes in consumer patterns, which were also evidenced in the continuous growth of the traf�c/users ratio (see Figure 2), are a challenge to address because networks were effectively designed considering an expected behaviour from the users, which have been largely overtaken by these facts. The architecture of telecommunications networks, like that of any transport
network, is designed following probabilistic usage parameters. This is also the case in networks designed to access the end-user, where the range depends on the probabilistic factor of “last mile” technology. Because the networks are designed to support certain capabilities, the use intensities must be adjusted if there is a very signi�cant deviation from what is normal.
Consider an analogy with the real world: If a very large load needs to be transported through a tunnel, and no one else can use the tunnel while the move takes place, it is clear that to minimize the impact on other users who are interested in using the infrastructure, the move must occur at a time when there is a very low demand. The same applies to certain users who make a very intensive use of the Internet’s network capacity. Commercial broadband plans, both in regard to price and installed capacity, are designed for the average user and a “reasonable” maximum deviation from this average. Those who make ultra-intensive use of the facilities degrade the quality of service for other users, just like the large load in the tunnel. Accordingly, bearing in mind technical considerations, it is convenient to manage the use of available capacity in the network to maximize bene�ts for the vast majority of actors in the digital ecosystem.
Sudden changes in consumer patterns affect the parameters of network design and, as a result, its structure of costs is also affected. There are three options when faced with this situation: a decline in the quality of service for all users; increasing the price of Internet access, which affects those who have not yet accessed the services (and those who have but are not intensive users of videos); and exploring mechanisms so that traf�c with an obviously commercial nature contributes to �nance the required investments.
As an example of these mechanisms, which may help to contribute to �nance investments, speci�c cases in which someone other than the end-user pays for the connectivity, at least partially, can be mentioned. For example, cases of two-sided markets are the possibility of selling ebooks through Amazon for Kindle devices; or the existence of toll-free 800 numbers, where end-users do not pay for the phone call. Another example can be found in the “sponsored” zero-rated services. These are services provided through mobile networks that are not charged to the end-user (companies such as Facebook and Google provide this kind of service).
In any case, what matters is that competition should not be distorted and anyone should be able to access specialized services. Over-the-top (OTT) services should not be intentionally forced to use alternative channels; ultimately, the service provider should be able to choose how to provide a service.
Figure 5: Mobile Operating Systems (Top Eight Mobile Operating Systems from August 2013 to August 2014)
Source: Stat Counter Global Stats (2014).
CHAPTER FOUR: NET NEUTRALITY: REFLECTIONS ON THE CURRENT DEBATE
PABLO BELLO AND JUAN JUNG • 67
THE FALSE PREMISE OF SINGLE-SPEED INTERNETThe possibility of having speci�c lanes for certain traf�c has led to some actors arguing against what has been called a “two-speed” Internet, as it would supposedly represent a departure from the “single-speed” model. However, this argument is based on the assumption that the Internet is currently of a single speed, when the reality is that the Internet is of n speeds.
In fact, because of the very nature of the Internet, to the extent that the content and/or applications servers are “further away” from the end-users, the quality as perceived by them (the “speed”) decreases. There is a single network and to be visible on the Net and be able to provide content, it is enough to have a PC converted into a server at home, connected to an asymmetric digital subscriber line (ADSL). A user who is thousands of kilometres away will require many international links and intermediate servers to access that content. If many users wanted to access the content, link and server capability would quickly collapse. And if they wanted to upload content requiring more bandwidth, the ADSL link may prove to be insuf�cient.
For example, on an old PC with Linux, far away from the �nal user, the content that it hosts will not be easily accessible — it will be “slow” and poor quality. If the provider of that content wants to improve the quality of service, they will have to increase the contracted bandwidth (pay) and buy a bigger server (pay). If things go well they will possibly then need to host content in a data centre (pay) and further increase the contracted bandwidth (pay). If the provider continues to grow, they will want to provide better service, so they will go to a content delivery network (pay). Each step will mean more capacity and more proximity between the content and the end-user. Each step taken will result in “more speed” from the end-user’s viewpoint. The quality of service can continue improving. The content provider can connect directly to the same Internet provider as the end-user (pay) and require a dedicated link to the nearest station (pay), or a transport service with guaranteed quality of service (IP, no Internet) within the network (pay). It is the content provider who decides where to connect in order to optimize the total cost of accessing the end-user and the quality of service offered.
It is clear that it is not one speed but n speeds. The possibility of getting closer to the end-user is certainly very valuable for many services over the Internet that require a higher quality of service and very high bandwidths, such as video streaming services. In a context in which the demand for data has grown exponentially, absorbing the networks’ capacities and therefore tending to degrade the quality perceived by the end-users, the option of having separate “high-speed” channels for services with very intensive
bandwidth requirements could be bene�cial to all users, including those who do not use those particular services. It would improve the customers’ experience of the services and could generate revenues to �nance the expansion of network capacities.
It is �tting to reiterate that, in essence, this service, which could be provided by a telecommunications company within its network, is no different conceptually than what content delivery networks or data centres connected to an Internet exchange point do. That the content and/or applications provider pays to improve the quality of service to the end-user is not new. In addition, it should be up to the service provider to decide where and how they connect to the network to offer services to the end-user. No actor in the production, transport and distribution chain can be allowed to arti�cially degrade the quality of Internet access to determine which particular connection mode providers use. The argument that innovation would be affected by the fact that one more opportunity exists to improve the quality perceived by the end-user does not seem tenable.
PRINCIPLES FOR AN OPEN INTERNETAs mentioned in the introduction, there seems to be consensus on the need to preserve the Internet as a space that is open for innovation, as well as on the importance of safeguarding the freedom of users to access content and services. In current debates, this is not in dispute. The express prohibition against blocking any kind of content or service that falls within the law is the most important guarantee to ensure that the Internet will remain open.6
The same freedom of choice guaranteed to users of applications and content over the Internet applies to their developers. Any service someone wants to offer over the network, to the extent that it meets the legal conditions that each country has established, may be offered to all network users, without restrictions and without prior demands of any kind. This is also a basic principle, inherent to the integrity of a global network that has been characterized as, and will continue to be, a space that is open to innovation and entrepreneurship. All the big actors who currently offer services over the network were, in their early days, projects conceived and developed by entrepreneurs with an innovative idea.
The above does not prevent certain malicious content, which affects the quality of Internet services and may generate harmful effects over the Net or on user devices,
6 In fact, evidence indicates that in most cases where content and/or services provided over the Internet globally have been blocked, the decision has not been made by telecommunications operators but by governments as an instrument of censorship or, what is worse, it has been the unilateral decision of Internet content and services aggregators at a global level.

RESEARCH VOLUME SIX: THE SHIFTING GEOPOLITICS OF INTERNET ACCESS
68 • CENTRE FOR INTERNATIONAL GOVERNANCE INNOVATION • CHATHAM HOUSE
from being restricted or limited by telecommunications operators. This also requires the possibility that the Net may be managed. There is consensus on the importance of minimizing spam, limiting the spread of viruses and protecting equipment on the local network from denial-of-service attacks. This kind of application ban seems clearly justi�ed, because, as expressed by Wu (2003), the intervention is related to solving a clear problem of a negative externality. Under national laws or existing authorizations, certain content can and should be blocked in the name of the greater good, for example, content related to child abuse. In other words, there are circumstances that reasonably legitimize blocking certain content, regarding those who would wish to offer it as much as end-users wishing to access it.
In order to maintain compliance with the above principles, network management must be based on the premise of transparency, both for end-users and for those who provide content and services over the Internet. The above examples show that it is not about discrimination itself, but if that discrimination is justi�ed or not (non-arbitrary discrimination), and its eventual impact in the market. Network management should be carried out based on commonly accepted technical criteria and principles of reasonableness. It is essential to ensure that network management does not generate negative effects on the digital ecosystem as a whole, including, undoubtedly, competition.7 Eventual concerns on anticompetitive effects, either from ISPs or from services over the Internet, must be mitigated with �exible and soft regulation, as well as through the competition authorities. Clearly, this implies that any arbitrary degradation in connectivity quality should be avoided, and it is important that interested parties are able to verify this through public information about the network parameters. Promoting transparency in the information will be key in this sense.
Irrespective of the above, technological and commercial innovation on the Internet, through the development of the telecommunications networks, is essential to maximize consumer welfare and the digital ecosystem as a whole in at least three ways: to allow the possibility of offering the consumers low price connectivity services with speci�c restrictions associated with content or services; to allow (or to not limit) the possibility of offering free access to some services or contents on the Internet (zero-rated services); and to allow agreements between ISPs and companies that provide contents or services over the Internet to provide higher-quality services. These modalities should be prevented from having a negative effect on competition within the digital ecosystem. For that reason, special conditions should be equally available to all concerned,
7 The proposal currently being debated in the United States and the regulations established in Chile, Colombia and Brazil, to name a few cases, consider these principles for reasonable network management.
through public offerings, which should be auditable, to ensure no special treatment for vertically integrated services, in particular in the case of those models that involve a quality standard in fast-lane access. This must be done without damaging the quality of normal “best effort” access. To prevent any harm to competition and innovation levels within the digital ecosystem, transparent conditions will be needed, as well as guarantees for its publicity and auditability. Flexible models for access will undoubtedly be bene�cial to end-users, but also to those service providers who may require special access. This will become even more relevant with the increased quality of multimedia content (ultra high de�nition) and the development of the IoT.
Ultimately, the principles that should be ensured can be translated into the following conditions for telecommunications companies:
• banning the blocking of content that can legally circulate;
• banning the arti�cial degradation of the quality of connectivity services;
• banning preferential and exclusive treatment for related companies;
• possibility of equal access of all stakeholders to special service conditions; and
• complete and adequate information about the conditions of service.
Similar criteria (non-arbitrary discrimination) must be applied to companies that provide services and/or content over the Internet, in particular those with intermediation roles in the digital ecosystem, which so far have not been subject to these criteria. According to an article published in The Wall Street Journal (Winkler 2015), it was known that some staffers at the US Federal Trade Commission (FTC) had recommended charging Google with violating antitrust laws. An FTC staff report dated from 2012 argued that Google incurred in the practice of altering search results to favour its own services, although the commission did not take any action at that time. More recently, the European Commission has sent a Statement of Objections to Google arguing that the company was abusing a dominant position, in breach of EU antitrust rules, by favouring its own comparison shopping product in its general search results pages.8
The criteria Google uses to prioritize searches and make those who pay stand out, as well as those used by Facebook to suspend an account or Instagram to delete photos, should be more transparent.
8 See http://europa.eu/rapid/press-release_MEMO-15-4781_en.htm.
CHAPTER FOUR: NET NEUTRALITY: REFLECTIONS ON THE CURRENT DEBATE
PABLO BELLO AND JUAN JUNG • 69
In order to have an open and transparent Internet, issues such as the implications of oligopolistic tendencies in the digital ecosystem and the need to implement interoperability between virtual platforms and portability between systems, as well as to ensure the adequate protection of personal data, should also be considered.
FINAL THOUGHTSIt is important to start building some consensus positions, which may help to guide those countries that may attempt to incorporate net neutrality norms within their jurisdictions. Currently, the countries that have already regulated net neutrality shared a vision of accepting reasonable traf�c management practices, recognizing the importance of restricting malicious contents, allowing differentiated commercial plans and highlighting the importance of transparency. These approaches may help to guide any future action in other countries.
An important part of the debate on net neutrality stems from the way of understanding the digital ecosystem and the technological and market trends present within it. As mentioned at the beginning of this chapter, the digital ecosystem is an evolving whole that must be understood comprehensively. The digital ecosystem cannot be analyzed based on the traditional structure of the telecommunications industry. Today users can choose between different Internet access providers and can access countless additional services that are not related either directly or indirectly with the provider. It is essential that freedoms exist that will enable the digital ecosystem to continue evolving in the same way in the future.
As mentioned previously, the digital ecosystem is upheld both by telecommunications networks and services and content providers over the Net, and it is essential that both can develop sustainably, with equivalent regulations and principles. In this context, beyond the previously stated, the misnamed principle of neutrality should necessarily translate as those conditions that maximize the development of the digital ecosystem and strengthen competition within it.
In this regard, there are two crucial considerations. First, regulatory principles (reasonable and where applicable) should be applied both to the telecommunications service providers and the providers of services over the Internet. This is very relevant. Issues such as the protection of privacy and data, tax obligations and sanction mechanisms, among others, should be established based on the characteristics of the services and not on the subject that provides them. An approximation of “neutral” public policy on the digital ecosystem should naturally result in the obligations of a Short Message Service provider over the mobile network and an instant messaging service over the Internet being essentially equivalent. Or that “telephone” services over the Internet, which are increasingly replacing traditional
telephony, should be taxed in a reasonably similar way. This is relevant because as is already evident, many of the services provided over the Internet are becoming de facto substitutes for those traditionally provided over telecommunications networks, which expands the options for users, but at the same time are receiving preferential treatment from governments and regulators, generating unfair competition that tends to discourage investment in the networks that support the Internet. This is not at all about limiting the users’ options, but about balancing the situation and establishing the right regulatory conditions so that the services provided by incumbent operators can compete with the new actors.
The second consideration is even more relevant: it is essential to prevent distortions of competition through the relationships produced within the digital ecosystem. The establishment of treatments that are arbitrarily discriminatory between the fundamental services of the digital ecosystem should therefore be avoided. From the perspective of operators, this means that network management, in those cases involving special treatment of certain data packets, must be based on the service and not on the provider, that any commercial offer made to the end-user that establishes certain special considerations for some services should be open to all those interested (for example, the “sponsored data” service offered by AT&T), that any special exclusive treatment for related companies that are in the content and/or applications market should be avoided and in no case should the quality of access to a provider or a particular service be “degraded.”
Recently the debate on zero-rated services has increased. They are speci�c applications, usually offered through sponsorship, that allow users (usually a lower cost or at an entry level) to use certain services, bene�tting from this “subsidized” access. Portraying these services as an infringement of net neutrality would amount to taking the de�nition to the extreme. Setting aside this extremism, the existence of these services in no way contradicts the spirit of net neutrality, insofar as there are not arbitrarily privileges to any provider, and the user’s freedom of choice is preserved, through transparent information, and without distortion of competition.
Similar criteria should be applied to providers of content and services over the Internet, in particular those that accumulate positions of dominance in certain markets (such as Google in search services, Facebook in social networks or Net�ix in video on demand) or that possess certain valuable content exclusively, to prevent them from distorting the market for Internet access. The principle that must be defended is that no actor who could eventually have signi�cant market power in any of the segments of the digital ecosystem should have the potential to distort competition, without having to renounce to maximize the options for users, telecommunications companies and content and/or applications providers.
RESEARCH VOLUME SIX: THE SHIFTING GEOPOLITICS OF INTERNET ACCESS
70 • CENTRE FOR INTERNATIONAL GOVERNANCE INNOVATION • CHATHAM HOUSE
The above measures and adequate transparency in the contractual relationship that may be established enable the harmonious development of the digital ecosystem to be suitably safeguarded.
To the extent that certain essential principles that favour competition and are against arbitrary discrimination are met, there should be no reason to assume ex ante that a �exible approach on net neutrality could affect the development of the digital ecosystem. On the contrary, to increase the regulatory burdens, as happened after Internet classi�cation under Title II of the US Telecommunications Act, would surely increase asymmetries inside the digital ecosystem, and this may have an impact on the future development of Internet. On the other hand, a model like the one described bene�ts all the actors in the digital ecosystem, in particular the users, encourages innovation, facilitates the supply of higher value-added services and promotes the deployment of additional transport and connectivity infrastructure, as the foundation of a digital ecosystem that still faces immense challenges regarding inclusion, in particular in Latin America, where two out of three households still do not have Internet access.
WORKS CITEDAkamai. 2014. “The State of Internet / Q3 2014.”
www.akamai.com/dl/akamai/akamai-soti-q314-exec-summary.pdf.
Canadian Radio-television and Telecommunications Commission. 2009. “Review of the Internet Traf�c Management Practices of Internet Service Providers.” October 21. File number: 8646-C12-200815400. www.crtc.gc.ca/eng/archive/2009/2009-657.htm#I.
CISCO. 2010. “Visual Networking Index: Usage Study 2010.” www.cisco.com/c/en/us/solutions/service-provider/visual-networking-index-vni/index.html.
———. 2014. “CISCO VNI Forecast Widget.” June. www.ciscovni.com/forecast-widget/index.html.
GSMA. 2013. The Mobile Economy 2013. GSMA and A.T. Kearney. www.gsmamobileeconomy.com/GSMA%20Mobile%20Economy%202013.pdf.
ITU. 2014. World Telecommunication/ICT Indicators Database Online. www.itu.int/pub/D-IND-WTID.OL-2014.
Lee, Daeho and Yong-Hwa Kim. 2014. “Empirical Evidence of Network Neutrality — The Incentives for Discrimination.” Information Economics and Policy 29: 1–9.
Njoroge, Paul, Asuman Ozdaglar, Nicolás E. Stier-Moses and Gabriel Y. Weintraub. 2013. “Investment in Two-Sided Markets and the Net Neutrality Debate.” Review of Network Economics 2013 12 (4): 355–402. doi: 10.1515/rne-2012-0017.
Pehnelt, Gernot. 2008. “The Economics of Net Neutrality Revisited.” Jena Economic Research Papers No. 2008, 080.
Sandvine. 2014. Global Internet Phenomena Report: 1H 2014. www.sandvine.com/downloads/general/global-internet-phenomena/2014/1h-2014-global-internet-phenomena-report.pdf.
Stat Counter Global Stats. 2014. http://gs.statcounter.com/.
Telefónica. 2014. A Digital Manifesto; An Open and Safe Internet Experience for All. www.digitalmanifesto.telefonica.com/manifesto/A_Digital_Manifesto.pdf.
Winkler, Rolfe. 2015. “Google Avoided FTC Probe but Others Loom.” The Wall Street Journal, March 20. www.wsj.com/articles/google-avoided-ftc-probe-but-others-loom-1426858302?tesla=y.
Wu, Tim. 2003. “Network Neutrality, Broadband Discrimination.” Journal of Telecommunications and High Technology Law 2: 141–76. www.jthtl.org/content/articles/V2I1/JTHTLv2i1_Wu.PDF.

CHAPTER FOUR: NET NEUTRALITY: REFLECTIONS ON THE CURRENT DEBATE
PABLO BELLO AND JUAN JUNG • 71
Wu, Tim and Christopher S. Yoo. 2007. “Keeping the Internet Neutral?: Tim Wu and Christopher Yoo Debate.” Federal Communications Law Journal 59 (3): 575–92.
Yoo, Christopher S. 2005. “Beyond Network Neutrality.” Harvard Journal of Law and Technology 19.
ABOUT THE AUTHORSPablo Bello is secretary general of the Association of Latin American Telecom Operators (AHCIET) since June 2011. He is an expert and lead policy adviser in telecommunications and economic regulation. He holds a degree in economics from the University of Chile and an M.B.A. from the ESADE Business School. He worked for the Chilean government from 1997 to 2010. From 2002 to 2006, Pablo held the position of regulatory policy director at the Subsecretariat of Telecommunications and during the presidency of Michelle Bachelet (2006–2010) he served as vice minister of telecommunications. At present he is a commissioner with the Global Commission on Internet Governance.
Juan Jung is coordinator of regulation and studies in AHCIET, and he is the coordinator of the Centre of Studies of Telecom of Latin America, AHCIET’s think tank for the region. From his position in AHCIET he has coordinated several studies related to economy and regulation of the industry. He is a member of the program committee of the Latin-American Congress of Telecommunications, and has participated in several seminars and conferences in the region. Juan is currently part of the Research Advisory Network of the Global Commission on Internet Governance. He holds a degree in economics from the University of the Republic (Uruguay) and a master’s in economics from the University of Barcelona (Spain). Currently he is doing research activities for Ph.D. studies at the University of Barcelona.


CHAPTER FIVE: LANDMARK EU AND US NET NEUTRALITY DECISIONS
BEN SCOTT, STEFAN HEUMANN AND JAN-PETER KLEINHANS • 73
CHAPTER FIVE:LANDMARK EU AND US NET NEUTRALITY DECISIONS:
HOW MIGHT PENDING DECISIONS IMPACT INTERNET FRAGMENTATION?
Ben Scott, Stefan Heumann and Jan-Peter Kleinhans
Copyright © 2015 by Ben Scott, Stefan Heumann and Jan-Peter Kleinhans

RESEARCH VOLUME SIX: THE SHIFTING GEOPOLITICS OF INTERNET ACCESS
74 • CENTRE FOR INTERNATIONAL GOVERNANCE INNOVATION • CHATHAM HOUSE
INTRODUCTION: CENTRAL ISSUES IN THE NET NEUTRALITY DEBATENet neutrality is a central regulatory issue in the debate over the future development of the Internet. At stake is the distribution of control over the Internet as a platform of communications and commerce. In the past, the decentralized nature of the Internet was determined by the code of its technical architecture (van Schewick 2012). In the future, it will be a policy choice. Depending on how governments choose to regulate information networks, billions will shift around the Internet’s enormous economic value chain. Moreover, control over the commercialization of the network is tied to both infrastructure development and power over what content and services are available to consumers. The political and economic implications of this decision are very broad and ripple out from national impact to international consequences. Net neutrality policies could either reduce or enhance the potential of fragmenting the global Internet marketplace. This is why a seemingly arcane technology policy issue has achieved such unlikely prominence in contemporary political debates.
This chapter speaks to these “big picture” issues. But in order to understand what is at stake, it is important to begin with the basic technical questions of what the Internet looks like with and without net neutrality. The logic of the policy choices �ows from the technical facts. From this perspective, the policy choice of net neutrality boils down to two competing technical architectures for information networks: a non-discriminatory infrastructure with innovation occurring at the edges and all content/service providers competing equally over the same networks; and an evolution toward “smart” networks that are permitted to develop new business models on the physical infrastructure that assert greater, centralized control over the content on their networks — monetizing points of network congestion by selling pay-for-play quality of service to content and services providers.1
In many ways, net neutrality regulations are not new laws. They codify the architectural “�rst principles” of the Internet — preserving in formal legal rules the technical features that enabled the Internet’s tremendous growth. The Internet was originally designed according to the best effort, or “end-to-end,” principle. This means that all data packets on the network are treated without discrimination and �ow according to the best available path from origin to end point. These features were engineered into the Internet’s basic technical protocols. The idea was to ensure that any new content, application or service could be designed with the same expectations of quality of service in
1 The European Telecommunications Network Operators Association has lobbied for the application of the “sending party network pays” to content delivered over the Internet (McCullagh and Downes 2012).
routing traf�c over the network (i.e., non-discrimination). The notion of discriminatory routing that would privilege certain senders of content over others was never seriously contemplated. Thus, during the early years of the Internet, technology for this type of selective gatekeeping was never deployed in the network (to the extent that it existed at all).
For most of the data paths on the global Internet at any given point in time, non-discrimination is a hypothetical non-issue because there is no congestion in the routers. Packets �ow over the network at the speed of light and are routed from one network to the next in the order they arrive. The issue becomes meaningful at points of network interconnection that are congested — meaning there is a line of packets waiting to get access to the physical infrastructure that will route the data to its �nal destination. Packets that wait too long are dropped. Signi�cant levels of “packet loss” degrade the quality of the user experience. High levels of packet loss result in non-functionality for many Internet services.
The net neutrality debate is technically a choice about how to respond to congestion and packet loss. One solution is to increase capacity in the network to accommodate an increase in traf�c �ow. If bandwidth in the physical infrastructure increases, congestion reduces, and packet loss is no longer a problem. This is how net neutrality is tied to infrastructure expansion — abundant capacity eliminates the relevance of monetizing congestion because it is no longer prevalent. The opposite answer to constraints on infrastructure is to monetize the congestion by selling priority access — “paid prioritization” — offering paying customers the chance to skip the queue at congested routers. This model requires discriminating between content, applications or services that have paid for prioritization and those that have not. It is the favoured option of network owners and strongly opposed by most other stakeholders in the Internet community.
Network operators view the massive increase in the Internet’s data �ow, number of users and number of connected devices as evidence that the business of traf�c management must change fundamentally. Today, more than three billion people use the Internet, an almost eightfold increase since 2000 (Internet World Stats 2015). The global network delivers huge amounts of traf�c to and from these billions of users. One study estimates that by 2016, the Internet will carry one billion gigabytes of data in a single month (CISCO 2015a). Much of this data will be sensitive to traf�c delays, especially when delivered to mobile devices. And an increasingly large percentage of the 15 billion online devices (growing to 25 billion by 2019) will be mobile (CISCO 2015b). This signi�cant growth of mobile devices is partly due to the growing number
CHAPTER FIVE: LANDMARK EU AND US NET NEUTRALITY DECISIONS
BEN SCOTT, STEFAN HEUMANN AND JAN-PETER KLEINHANS • 75
of machine-to-machine applications, such as sensor networks, in smart city and smart factory projects.2
Based on these statistics, it is easy to see why the imperative of abundant bandwidth has focused attention on the net neutrality debate — which, at its core, is about how to respond to scarce capacity in the Internet. The central argument against net neutrality is that to accommodate the ever-increasing requirements for capacity on the network with suf�cient pro�ts for investment, it is necessary to create new revenue streams from pay-for-play priority on the Internet. By contrast, supporters of net neutrality argue that Internet use has always been growing rapidly and that the only way to protect innovation in competitive markets is to meet demand for bandwidth with more supply. In this way, the net neutrality debate centres on a choice between two economic models.
In recent years, market developments led by major network operators appeared to be leading toward more business models of paid prioritization. However, a business model based on the prioritization of data — a guaranteed quality of service for certain data streams — would violate the Internet’s original principles. Consequently, advocates of net neutrality seek a regulatory framework to prohibit this practice by banning paid prioritization. Opponents believe that empowering network operators is a natural evolution of the technology. They argue that discrimination among packet streams is a pathway to innovative product development and ef�cient network management. Many network providers see the future of the Internet as a suite of differentiated “specialized services.” Specialized services would offer a guaranteed quality of data transmission (i.e., paid prioritization at congested routers) for speci�c content, services or applications. Advocates of net neutrality worry that specialized services lead to a two-tier Internet: fast lanes for those who can afford them, and slow lanes for all those who are not willing or able to buy prioritized access to consumers. The result, they argue, would be the disruption of fair competition between all content and services, and a reduction in innovation and consumer demand.
In order to highlight relevant trends and important consequences of the net neutrality debate with respect to Internet fragmentation, this chapter offers three focal points of analysis. The �rst is a summary and analysis of the recently adopted net neutrality rule in the United States. Because the Internet marketplace is further developed in the United States than in much of the world, Internet policy debates and decisions often happen in Washington �rst. Net neutrality is no exception. Many observers
2 In a smart city or smart factory project, a variety of different sensors are used to better observe and analyze the environment. In a typical smart city project, parking spaces are equipped with sensors and transmitters to lead a car to the closest available space. In smart factory projects, similar cases lead to increased ef�ciency.
believe the US net neutrality rule will strongly in�uence how other nations shape their own regulatory frameworks (Ammori 2014; Sepulveda 2015). The second section takes up the EU debate over net neutrality — summarizing the recent history, current status and possible reactions to the US decision. In both sections, the analysis concerns the key issues in the net neutrality debate, including regulatory theory of market development, treatment of paid prioritization, treatment of specialized services and interconnection. The chapter concludes with a discussion of potential consequences of divergent net neutrality decisions between the United States and the European Union and the possibility of global Internet fragmentation.
NET NEUTRALITY IN THE UNITED STATESThe United States has played a central role in the development of the Internet. The original architecture of the Internet and its underlying technical standards were shaped by US institutions. Most of the world’s leading Internet companies are based in the United States. For these reasons, regulatory policy making in the US market has global implications. The rules shape the behaviour of American tech titans and govern access to the lucrative US market. Many countries around the world follow US policies in the technology sector. For an issue as important as net neutrality, the choices made in Washington are certain to have a broad impact in global markets (Scola 2014).
Net neutrality has been debated in Congress and before the Federal Communications Commission (FCC) for more than a decade. The term “net neutrality” dates back to 2003, coined by Columbia University law professor Tim Wu (2003). The history of net neutrality policy making in Washington has many twists and turns — guided by politics, statutory arcana, litigation, market development and public participation (almost four million individuals �led comments at the FCC in the latest public proceeding [Shields 2015]). Much has been written on the history of this debate (van Schewick 2007; Ammori 2013; Hazlett and Wright 2011) and it need not be revisited here. The conclusion of this history is what matters most — and that is the FCC vote on February 26, 2015 to adopt strong net neutrality rules (FCC 2015a). The full text of the rules — published on March 12, 2015 — represent the most speci�c and strict net neutrality rules ever issued by any regulator (FCC 2015b). The new rules apply to all providers of broadband Internet access services, including mobile. These are the key provisions:
• The order prohibits providers of Internet access service from blocking or throttling (or engaging in any other “unreasonable interference” to) lawful content, applications, services or devices (subject to reasonable network management) (ibid., paragraphs 111–37).

RESEARCH VOLUME SIX: THE SHIFTING GEOPOLITICS OF INTERNET ACCESS
76 • CENTRE FOR INTERNATIONAL GOVERNANCE INNOVATION • CHATHAM HOUSE
• The order prohibits providers of Internet access service from engaging in “paid prioritization” practices that offer preferential treatment on the network to speci�c traf�c in exchange for money or other consideration (paragraphs 125–32).
• The order provides that all exemptions from the rules for “reasonable network management” must be suited to a technical purpose, not a commercial one, and enhanced transparency rules apply that require disclosure of network management practices to consumers (paragraphs 154–81, 214–24).
• The order extends the oversight of the regulator to include (for the �rst time) the points of interconnection between the Internet backbone and consumer Internet access providers. It does not apply the full net neutrality rules to these exchange points, but it does require exchange of traf�c to be “just and reasonable” and applies a case-by-case approach to adjudicating complaints against this standard (paragraphs 194–206).
• The order provides an exemption from the rules for all services that are not broadband Internet access services (i.e., “specialized services”), but are offered over the same infrastructure — including, for example, Voice over Internet Protocol, cable TV and health monitoring. The distinction in the de�nition is that these services are limited in purpose, do not provide broader access to the Internet, and do not have the effect of circumventing the ban on paid prioritization (paragraphs 207–13).
The analysis that accompanies and justi�es the rules adopts the logic of the original principles of non-discrimination built into the architecture of the Internet. The FCC rules clearly express that increased capacity, rather than monetized congestion, represents the best response to rising levels of traf�c in response to consumer demand. The new rules are premised on a theory of market development the FCC calls the “virtuous cycle” (FCC 2015b, paragraphs 77, 102). Under this concept, new applications and services are developed by innovative businesses that require ever more bandwidth and quality of service. In response, more and more consumers are attracted to the broadband provider’s Internet service to gain access to these new applications and services and buy connections at higher speeds. And these new revenues drive further investment in infrastructure to support the next generation of higher bandwidth applications. In this way, all participants in the value chain enjoy mutually bene�cial growth in the marketplace and the public service goals of building a robust information infrastructure and achieving higher levels of technology adoption are met.
The FCC’s net neutrality rules seek to set the market incentives for all participants in the Internet marketplace
to play their roles in the virtuous cycle. But the regulator concludes that without clear net neutrality rules, broadband network owners have a clear incentive to discriminate (ibid., paragraph 79), irrespective of whether they have market power over competitive service providers (paragraph 84). Each network operator has a monopoly over its own subscribers, and only rules requiring an open market will guarantee the persistence of the virtuous cycle. The explicit prohibition on blocking, throttling, paid prioritization or any other form of discrimination is intended to protect the most bene�cial market structure.
Notably, the FCC’s rules look beyond the problem of paid prioritization within the so-called “last mile” of the broadband Internet access provider’s network. The rule considers the possibility (citing examples of market abuses) that discrimination will begin to appear at the points of interconnection between local Internet access providers and the backbone of the Internet (paragraphs 194–206). This is a new development in the net neutrality debate, and it follows from recent market disputes between major content providers and network operators. For example, in 2013 and 2014, a dispute between Net�ix and the six largest Internet Service Providers (ISPs) in the United States resulted in broadband speeds for all traf�c delivered over the Cogent backbone network (approximately 10 percent of Internet addresses) dropping below one megabit per second and disrupting the functionality of many services (including streaming video) in tens of millions of households for nine months (MLAB 2014; Brodkin 2015; Crawford 2014; Higginbotham 2014). This discriminatory traf�c management was not a result of paid prioritization within the local access network. It was caused by congestion at the point of interconnection between a backbone provider (in this case Cogent, carrying traf�c from Net�ix, among many others) and the local access networks of cable and telecommunications companies.
The exchange of traf�c between network operators occurs under the terms of interconnection agreements — privately negotiated contractual arrangements that are usually con�dential and completely unregulated. Historically, the cost of moving traf�c across the Internet was divided between interested parties. Content companies and backbone providers paid the costs of taking traf�c from data centres to the nearest point of interconnection with the ISP (telecommunications or cable company) of the consumer requesting the content. And the local access network bore the costs of delivering the traf�c down the last mile to the consumer. Typically, the exchange of Internet traf�c between networks is handled under “settlement-free” terms — meaning no money is exchanged, as each side bene�ts from the relationship.
Changes in the marketplace of content delivery and mergers among consumer ISPs have begun to alter incentives. Two major trends are particularly relevant here. First, the ratio of the exchange of traf�c between

CHAPTER FIVE: LANDMARK EU AND US NET NEUTRALITY DECISIONS
BEN SCOTT, STEFAN HEUMANN AND JAN-PETER KLEINHANS • 77
the “upstream” transit network (bringing content to and from data centres) and the “downstream” ISP network (bringing content to and from end-users) has changed substantially. The era of mass-market video streaming services has resulted in higher ratios of content headed downstream than upstream. And although these streaming video services are also driving consumer demand for higher speed and more expensive access subscriptions, the changes in interconnection ratios have caused many ISPs to reconsider settlement-free peering. The second major trend is the consolidation among access ISPs in the US market. The �ve largest cable and telephone companies now control over 75 percent of the high-speed Internet subscriptions in the US market (Leichtman Research Group 2015). The scale of access network consolidation combined with their concerns over interconnection data ratios opened the door for an ISP to contest an interconnection agreement — betting that no content company would risk losing access to a large group of customers.
In the case of the so-called “Net�ix dispute,” six major network operators refused to honour a settlement-free interconnection agreement with Cogent because they argued Net�ix, which utilized the Cogent backbone to interconnect with ISPs, was pushing so much data to their customers that extra payments were in order. Indeed, by some estimates, Net�ix accounts for as much as 35 percent of all Internet traf�c in the United States during peak usage hours (Statista 2015). Net�ix and Cogent refused to pay fees beyond the reasonable costs of upgrading network capacity at exchange points. And so the ISPs refused to increase the capacity of the interconnection ports to accommodate increases in traf�c �ows. The result was major congestion at the interconnection points to these ISPs for all Cogent-delivered traf�c. Both sides of the business dispute dug in their heels for nine months and consumers, kept in the dark about why their Internet connections slowed to a trickle, suffered the consequences. Reluctantly, Net�ix ultimately relented and now pays for access (the rate of payment was never disclosed) (Ramachandran 2014).
The incident raised the attention of regulators. This was not a conventional net neutrality violation of paid prioritization through congested routers in the last mile of the local network. The Net�ix dispute did not involve prioritization at all. The interconnection ports were simply not upgraded to meet the capacity demands of inbound traf�c. This dispute offered regulators evidence for how intentional congestion and subsequent degradation at the interconnection point (in order to coerce greater payments) can harm consumer interests (Brodkin 2015) without any paid prioritization. As a direct result, the FCC has declared its intention to monitor these interconnection points and respond to complaints that traf�c exchange is not handled in a just and reasonable manner (FCC 2015b, paragraph 205).
The facts of this interconnection debate and the regulatory response of the FCC have broad implications at the international level. In the case of the Net�ix dispute, the core interest was large ISPs seeking a greater share of revenues from a successful content provider in exchange for access to subscribers. This is a very different practice than the conventionally debated question of paid prioritization through congested links — although it belongs in the same category of clashes between network operators and over-the-top (OTT) providers that result in consumer harm. However, the intentional creation of arti�cial congestion at points of interconnection in order to extract additional payments could become a practice informed by national interests — including economic protectionism, political censorship or anti-competitive practices. Consider a scenario in which the point of interconnection is an international gateway that is a high-volume path for foreign sources of traf�c to reach consumers in any given country. Any government or network operator that exerts control over that interconnection point could congest the exchange of traf�c with any particular backbone provider delivering any particular content such that content and services never reach consumers in functional form. The implications of this problem are not yet fully understood and involve a rapidly shifting marketplace of network operators that move traf�c across the backbone of the Internet. It will be an issue for national regulators and international policy makers to monitor carefully, irrespective of how they treat paid prioritization or specialized services.
Consumer advocates, public interest groups and large parts of the technology and media sectors have welcomed the new net neutrality rules adopted by the FCC. There is also very strong criticism. The focus of criticism is on the FCC’s decision to implement the new rules under a legal authority classifying broadband Internet access service as a public utility. For example, the National Cable & Telecommunications Association (NCTA) warns that this approach constitutes a “massive regulatory regime” that undermines innovations and investments by the telecommunications industry (NCTA 2015).3 The critique of the regulatory approach is grounded in the arguments that the new rules impose expensive new obligations and prohibit new revenue streams that would enable expanded investment in infrastructure (Wake�eld 2015). The rule is expected to be challenged in the courts by the major network owners (Puzzanghera 2015).
NET NEUTRALITY IN THE EUROPEAN UNIONThe future of net neutrality rules in the European Union is more complicated and the eventual outcome of the debate
3 The question of statutory authority is critical to the legal standing of the FCC’s rules, but its relevance is separate from the substance of the rules and therefore not of central importance to the international debate.
RESEARCH VOLUME SIX: THE SHIFTING GEOPOLITICS OF INTERNET ACCESS
78 • CENTRE FOR INTERNATIONAL GOVERNANCE INNOVATION • CHATHAM HOUSE
is still uncertain. Even after Brussels reaches a conclusion to the negotiations over a net neutrality policy this year, the signi�cant ambiguities of scope and de�nition will be interpreted by all of the member states. The differences between net neutrality in the European Union and the United States go beyond the problem of disparate national implementation. There are signi�cant differences in the market structure in Europe in two important ways. First, there is considerably more competition between consumer ISPs. This raises the possibility that incentives to violate net neutrality will be reduced by the threat of consumers switching ISPs, assuming at least one chooses not to engage in revenue-enhancing discrimination and switching costs are not a serious obstacle. Second, and more importantly, the largest and wealthiest content and services companies that might pay extra fees in a non-neutral Internet are mostly non-European companies (the digital market for OTT products in Europe is underdeveloped.) This brings a political orientation to the debate that is more about regional economic self-interest than it is about good technology policy.
The impending settlement in Brussels will be applied in an already crowded �eld of policy debate at the national level across the European Union. Some member states, such as Slovenia and the Netherlands, have already adopted laws to protect net neutrality — declining to wait for supranational regulation (Meyer 2015). Meanwhile, net neutrality is hotly debated in other member states either as a stand-alone issue or in response to debates on the EU level. Arguably, net neutrality practices have support from existing national telecommunications laws in some member states. But as long as the European Union is poised to set net neutrality policy for the regional bloc as part of its single digital market initiative, the ultimate outcome for Europe remains open. If the European Union �nalizes new policy this year (as seems likely), a new chapter in the European Union’s history of net neutrality will begin as member states begin to interpret the law through national regulators and apply it amid the speci�c conditions of particular markets.
A short history of this debate in the European Union offers useful insights as to where it may end up. The European Commission (EC) initiated formal discussions on net neutrality as early as 2006. In 2009, the EU telecom reform legislation recognized Internet access as a fundamental right, such as the freedom of expression and the freedom to access information (Of�cial Journal of the European Union 2009). The annex of the directive contains a declaration by the EC including the commitment to preserve “an open and neutral Internet” (ibid., L337/69). This declaration should be understood as a political expression, highlighting the importance of net neutrality (March 2011). It did not have any legally binding effect on the member states. However, it put net neutrality on the agenda of European telecommunication regulators and lawmakers. While the
2009 reform package included references to net neutrality, it left the mandate to promote an open and free Internet to member states. At the same time, the European Union recognized the need for coordination and supervision, creating the Board of European Regulators for Electronic Communications (BEREC).
BEREC launched consultations on net neutrality and published its own report on best practices and recommended approaches in October 2011 (BEREC 2011). While the report refrains from engaging the debate on how to de�ne net neutrality head on, it cites Tim Wu’s de�nition of net neutrality as a network design principle that a “maximally useful public information network aspires to treat all content, sites and platforms equally” (Wu n.d.). Referencing Wu, the report proposes a “literal” working de�nition for net neutrality as the principle that “all electronic communication passing through a network is treated equally” (BEREC 2011, 7). The main focus of the report discusses guidelines for national regulators on how transparency policies regarding net neutrality can enable consumers to make informed decisions regarding the choice of their ISP. BEREC also conducted consultations on quality of service in the scope of net neutrality and competition issues in the context of net neutrality (BEREC 2012a). Notably, BEREC also explored the potential net neutrality implications of interconnection disputes in a 2012 report (BEREC 2012b). The report found that net neutrality concerns were limited to the last mile network of ISPs, and interconnection agreements would not be implicated.
In 2013, then Commissioner for the Digital Agenda Neelie Kroes made net neutrality a part of her package on creating a single European telecommunications market. After years of debate in which the pendulum appeared to swing back and forth between supporters and opponents, the �nal proposal from the EC — published as a part of the “Telecoms Single Market: Regulation” — seemed to favour the opponents of net neutrality (EC 2013). Although the proposal supported an open Internet and banned blocking lawful content, net neutrality advocates criticized the imprecise language of the text and the many potential loopholes it would leave for discrimination (Ermert 2013). The EC’s provisions adopted the spirit of the FCC’s open Internet rules, but critics noted that the proposal made it possible for ISPs to charge for or discriminate between Internet services without any objective justi�cation (Horten 2013). The proposal did not include a provision on the general protection of the principles of net neutrality, and thus would have allowed “specialized services” without signi�cant restrictions against using specialized services to circumvent the net neutrality rule governing Internet access service.
In April 2014, the European Parliament (EP) began its �rst reading of the Telecoms Single Market proposal. After much debate and many amendments (Masse 2014), the

CHAPTER FIVE: LANDMARK EU AND US NET NEUTRALITY DECISIONS
BEN SCOTT, STEFAN HEUMANN AND JAN-PETER KLEINHANS • 79
EP voted to strengthen the protection of net neutrality principles (EP 2014). At the core of the legislation were speci�c restrictions on specialized services and a clear de�nition of net neutrality very similar to the ones proposed by Wu and BEREC: “‘net neutrality’ means the principle according to which all internet traf�c is treated equally, without discrimination, restriction or interference, independently of its sender, recipient, type, content, device, service or application” (ibid., article 2, paragraph 2, point 12a).
The strong net neutrality legislation passed by the EP stands in contrast to the commission’s initial proposal, setting up a dif�cult negotiation between the branches of European government. Taking up both the EC and the EP texts on net neutrality, the Council of the European Union began deliberations on a position on net neutrality in late 2014. The council adopted its �nal position on the Telecoms Single Market regulation in March 2015 — almost a year after the EP vote (Council of the European Union 2015a). The European Council’s text reintroduced “quality of service” differentiations into the regulation without speci�c restrictions on how specialized services would be prevented from weakening the overall rule. In the view of critics, the council’s language risked undermining a core principle of net neutrality (McNamee 2015): “End-users, including providers of content, applications and services should therefore remain free to conclude agreements with providers of electronic communications to the public, which require speci�c levels of quality of service” (Council of the European Union 2015a).
Unsurprisingly, civil society reacted strongly in opposition to the joint proposal (Access 2015). And in the wake of the FCC’s new rules, the European Council’s position did appear weak in comparison. It does not adopt the logic of the FCC’s “virtuous cycle” and opens the door to paid prioritization and specialized services, provided that they do not interfere with basic Internet services (Thomas, Crow and Robinson 2015). A series of negotiating rounds ensued in the spring and early summer of 2015 between the EC, the European Council and the EP. A �nal deal on a net neutrality text — heralded as a breakthrough by EC leaders (Bernau 2015) — was concluded in late June in a marathon negotiating session.
The near-�nal text of the agreement (at the time of this publication) appears to mirror many of the main provisions in the FCC rule — suggesting that the exhaustive analysis in the FCC decision may have had some in�uence on EU deliberation. Without question, the �nal settlement is considerably stronger than the proposals of either the EC or the council in the negotiations. The EU text includes a broad non-discrimination rule protecting all lawful content, applications and services on the Internet from blocking, throttling or other forms of discrimination. Paid prioritization is taken off the table. Reasonable network management is permitted, with relatively wide
latitude, provided it is undertaken for technical and not commercial purposes. The provisions on “specialized services” — the text now adopting a de�nition akin to the FCC’s, describing them as electronic communications services that are not Internet access services — remain the source of ambiguity. The provision has been substantially strengthened compared to earlier texts from the EC and the council — explicitly providing that these non-Internet access services may not be used to circumvent the net neutrality rule governing the Internet. However, the rule leaves the national regulators to interpret two key de�nitions: whether the enhanced quality of service requirements are “necessary” to provide the service; and whether there remains “suf�cient” bandwidth in the network to allow for Internet access service. The text reads as follows (Council of the European Union 2015b):
Providers of electronic communications to the public, including providers of internet access services, and providers of content, applications and services should therefore be free to offer services which are not internet access services and which are optimised for speci�c content, applications or services, or a combination thereof, where the optimisation is necessary in order to meet the requirements of the content, applications or services for a speci�c level of quality. The national regulatory authority should verify whether and to what extent such optimisation is objectively necessary to ensure one or more speci�c and key features of the content, application or service and to enable a corresponding quality assurance to be given to end-users, rather than simply granting general priority over comparable content, applications or services available via the internet access service and thereby circumventing the provisions regarding traf�c management applicable to the internet access service. (Paragraph 11, emphasis added to highlight key phrases)
In order to avoid a negative impact of the provision of such services on the availability or general quality of end-users’ internet access services, suf�cient capacity needs to be ensured. Providers of electronic communications to the public, including providers of internet access services, should, therefore, offer such other services, or conclude corresponding agreements with providers of content, services or applications facilitating such services, only if the network capacity is suf�cient to provide them in addition to
RESEARCH VOLUME SIX: THE SHIFTING GEOPOLITICS OF INTERNET ACCESS
80 • CENTRE FOR INTERNATIONAL GOVERNANCE INNOVATION • CHATHAM HOUSE
any internet access services provided. (Paragraph 11a, emphasis added to highlight key phrases.)
In the end, the core questions in the European debate are similar to the central challenges in the FCC’s new net neutrality rules. The difference is that the key issues will be adjudicated in 28 member states and important interpretation left up to national regulators. These separate threads may all tie back to a common outcome similar to what happens in the American market — or they may result in considerable divergence from one another and from the US regulatory praxis. Time will tell.
THREAT OF INTERNET FRAGMENTATIONDespite the convergence of approaches on net neutrality between the United States and the European Union, there remains a signi�cant chance that we will see some degree of divergence between how the rule is interpreted in Europe versus the United States. The political landscape in the European Union is quite different than in the United States. The vibrant community of technology companies that counterbalance the telecommunications industry in the United States is a much weaker political force in the European Union. Moreover, many opponents of net neutrality argue that empowering EU telecommunications operators is a method of undermining the market strength of America’s tech titans in Europe (der Standard 2013). Given the strong voices for market liberalism within the EC and the fractious views among member states, there is a reasonable chance that net neutrality in practice in the European Union will be weaker than in the United States. Hence, it is worth contemplating the potential results.
Will a US/EU split on net neutrality lead to digital market fragmentation? The answer is not straightforward. Given the similarities in the rules, it is unlikely that there will be dramatic consequences that quickly reach all corners of the Internet economy. If there is divergence, the most signi�cant consequences will be within the EU digital economy and in the relationship between EU and US technology companies. Some of these changes could be characterized as fragmentation at the regional level.
The full implications of technical or market balkanization would only be clear after many years. It is dif�cult to predict exactly how these changes might play out under real world market forces. However, in four broad areas, there is a potential case for fragmentation that we can analyze in possible scenarios. Developments in these areas should be monitored closely. The �rst two cases will directly shape markets in Europe (regional fragmentation). The third and fourth cases track market power asymmetry and fragmentation that could spill over beyond the United States and the European Union into the global market.
First, if the European Union allows pay-for-play business models on the Internet (for example, through a loose interpretation of the restrictions on specialized service offerings), it is very likely to strengthen the position of the incumbent telecommunications companies at the expense of the nascent European Internet industry. This result would exacerbate the comparative weakness of European technology companies compared to their global competitors. The structure of the EU market is already, by its nature, distributed among different languages, consumer cultures and national regulatory policies. A model of paid quality of service would establish market conditions in which it would be necessary for content and service providers to navigate these divisions and to negotiate separate business deals for quality of service across member states with dozens of network operators. Further, the monetization of congestion by local incumbent network operators could reduce incentives for expanding broadband capacity. If there is a lucrative business selling priority access to congested routers, the prospects of network operators eliminating that business by expanding capacity with an expensive �bre optic build-out will be questionable. Stagnation in network expansion would further depress outputs among innovative content and service providers, and, in turn, consumer demand would not increase. This is the inverse of the FCC’s virtuous cycle and the outcome the US regulator seeks to avoid by promulgating net neutrality rules.
Following the logic in such a scenario, the European Union’s top line goals on technology policy would be fractured by internal contradictions. On one hand, Brussels appears sympathetic with incumbent telecommunications network owners who seek deregulation, permission to consolidate and authorization to provide services that may undermine net neutrality. On the other hand, EU policy makers have demanded extensive expansion of network infrastructure, including higher speeds and wider availability (EC 2015). Further, Europe is very committed to growing its own Silicon Valley and cultivating an entrepreneurial ecosystem of innovators that create new business, win global market share and generate consumer demand for Europe’s online products. According to the FCC’s regulatory theory of the virtuous cycle, these goals are not compatible.
The FCC’s logic is that the basic assumption that drove innovation on the Internet from its inception was the expectation of non-discrimination and equal access to the digital market. This innovation in content, applications and service drove demand for ISP subscriptions and triggered further expansion of infrastructure to meet consumer expectations. This virtuous cycle was a practical reality until the early 2000s, based on limited technical capabilities to engage in discriminatory routing as well as regulatory restrictions. After deregulation in 2002, the law permitted (in theory) violations of non-discrimination, but a series of
CHAPTER FIVE: LANDMARK EU AND US NET NEUTRALITY DECISIONS
BEN SCOTT, STEFAN HEUMANN AND JAN-PETER KLEINHANS • 81
FCC decisions — including statements of principles and merger conditions, as well as a political debate over net neutrality with uncertain outcome — created an overhang of regulatory risk for any business model premised on pay-for-play. This effectively held the status quo of non-discrimination in place until the FCC’s formal rules were enacted.
The US net neutrality rule spends several thousand words explaining why regulatory practice cannot support both the maximization of OTT innovation and permit discriminatory pricing by network operators. The decision rejects the competing regulatory theory that innovation within the network holds promises for invention and investment that outweigh the risk of impeding innovation in OTT services. Perhaps the Americans are incorrect. However, if Europe attempts the path the FCC says is fraught with contradiction and Washington is proved correct, this scenario would be a disaster for the European Union. Europe’s policy agenda for achieving competitive parity with the United States in digital markets would instead lead counterproductively to an even greater imbalance in shares of the Internet value chain. This form of regional fragmentation would come in the form of an extended recession in European technology market share and enhanced dominance by US technology companies.
Second, a related scenario of fragmentation looks at the disadvantage to European content and services companies from another angle. Not only will European companies lose out from weakened incentives for robust infrastructure and high barriers to enter pay-for-play delivery markets, these trends will favour American companies with existing market power. The immediate pressure of current market forces in a pay-for-play digital market that includes a host of specialized services, forecasts an outcome that is highly unlikely to reverse the trend of monopolization in major market segments. The opponents of net neutrality in Brussels often make the case (explicitly or implicitly) that empowering European network owners to charge for quality of service will take Silicon Valley giants down a peg (der Standard 2013). On the contrary, a market that permits monetizing congestion is more likely to lock in the monopoly market shares of the current group of Internet mega-brands. In a market that requires large sums of liquid capital to buy prioritized treatment (and armies of lawyers to negotiate separate deals with dozens of network operators), the largest players in today’s market will have an enormous advantage.4 And the incentives for today’s monopolists will be to raise the barriers for entry to the
4 These companies already enjoy a signi�cant advantage that comes from enormous resource disparities. Many have built global content delivery networks that move cached stores of popular services and websites physically closer to their customers. This physical proximity increases download speeds relative to other services stored farther away. Paid quality of service would add a qualitatively new dimension to this existing advantage.
fast lane in order to further distance themselves from any potential competitors. The winners in this new market will be EU telecoms and American content and service providers — in other words, reinforcing current market power in adjacent sectors rather than creating conditions for competitive innovation in either (Fitchard 2014).
This thesis is supported by the conspicuous silence of many of Silicon Valley’s largest and most valuable companies in the FCC’s recent debate over net neutrality (Newmyer 2015). They did not actively support or oppose the rules because they win either way. Therefore, it follows in the European debate that opponents of net neutrality are correct that a pay-for-play business will extract revenue from American tech giants that will �ow to network owners. However, it also follows that this will lock in their monopolies at the expense of potential European competitors.
Third, a divergence in net neutrality rules and subsequent shifts in market trends could lead to further fragmentation scenarios that alter user experience of the Internet due to economic discrimination. If telecommunication providers can offer fast lanes for certain content or applications for those willing to pay, many content and service providers may opt to avoid offering products in markets where these fees are not justi�ed by the potential revenues from a local customer base. Very large national markets will not have this problem because the sheer size of revenue opportunities will outweigh any potential discrimination. But mid-size and small markets will not have this luxury. Over time, this could result in an additional layer of fragmentation for the user (Leva, Hammainen and Kilkki 2009). Certain content, services and applications will not be offered to populations that do not justify the expense, and the grand ideal of a global information commons accessible to everyone will fade. In short, the Internet will no longer be the Internet we know today, because depending on the country or ISP of the Internet user, the availability of content and the experience with certain applications will be profoundly different. This type of fragmentation would signi�cantly extend existing practices that fracture the Internet, including outright content censorship and uneven distribution rights for copyrighted content (MacKinnon et al. 2014). The recent developments in so-called “zero-rating” (offering access to Internet content that is not charged against a data subscription) foreshadow this trend. In some places, services are marketed as “Internet access” despite the fact that they offer only a few dozen websites (Bhaskar 2015).
Fourth, the possibility of widespread discrimination at points of interconnection holds the most potential for a fragmented Internet scenario, and yet its implications have not been fully explored by analysts and regulators. The FCC’s inclusion of interconnection and traf�c exchange as a part of the net neutrality rules marks a rare consideration of interconnection agreements in the net
RESEARCH VOLUME SIX: THE SHIFTING GEOPOLITICS OF INTERNET ACCESS
82 • CENTRE FOR INTERNATIONAL GOVERNANCE INNOVATION • CHATHAM HOUSE
neutrality debate. The reason interconnection policy issues have been underdeveloped is likely due to the complexity and opacity of the market. There are hundreds of network providers with international transport networks. And almost all of the agreements that govern traf�c exchange are con�dential. Conventional wisdom is that a very large share of Internet traf�c is exchanged through a settlement-free or “bill and keep” peering arrangement that involves no payments. This is a highly ef�cient system5 — it operates across borders and has no obvious regulatory jurisdiction; and because disruptions have been infrequent, regulators have usually been content to ignore it (BEREC 2012b, 61). However, consolidation in the ISP market and the rise of data-intensive online video services have begun to change market dynamics (see, for example, the earlier description of the Net�ix dispute).
The Net�ix dispute from 2013-2014 resulted in the most serious consumer harm to date from an interconnection dispute, but it is not unprecedented. In 2005, two large backbone providers (Level 3 and Cogent) had a dispute over traf�c exchange in the United States that blacked out chunks of the Internet for many customers for a few days (Cowley 2005). In 2013, the EC’s directorate-general for competition conducted unannounced inspections at the premises of Deutsche Telekom, Orange and Telefónica to investigate potential abuses of breaking traf�c exchange agreements (Godfroid and Hautbourg 2015). The directorate-general feared that these companies would abuse their dominant position by throttling and degrading traf�c from third-party networks. These suspicions were, among other things, based on the facts observed in a dispute between Orange and Cogent (Genna 2013).
Following the logic of these disputes, a national government or a major ISP could choose to make policy requiring payments for interconnection at international gateways, or simply for any access to local ISPs. Breaking a settlement-free peering agreement in favour of paid contracts for data exchange is not necessarily unreasonable or unjust. However, the potential for abuse is signi�cant (Florance 2015). If the prices for interconnection are unregulated, not transparent, and not related to the actual costs of carrying traf�c, the incentive to gouge other service providers will be clear and lucrative. These kinds of policies could easily take on the political purpose of economic protectionism or content censorship. And discrimination at the interconnection point does not require sophisticated technology or complex business agreements like paid prioritization does. Discriminatory
5 Indeed, it is so ef�cient that in the US market, major telecommunications network operators are arguing that the old system of “inter-carrier compensation” for telephone calls (a per minute fee for access and termination among networks) be phased down to a zero price that mirrors the settlement-free interconnection of the Internet. Ironically, they argue the opposite for interconnection on the Internet where their economic interests are differently situated.
interconnection is relatively simple to implement. If one country does it, it will distort the global market, but it will not break it. If many countries do this, it will yield a tragedy of the commons whereby the global market of information exchange breaks down and the Internet is fragmented into a complex of walled gardens.
CONCLUSIONThe net neutrality debate is much more than an arcane technology policy decision for communications regulators. The choices that nations make will determine not only the architecture and market structure of their own information systems (including mass media, digital commerce and personal communications), it will also determine whether the global Internet will remain an information commons or fracture into a set of national or regional political economies. For years, the United States and the European Union have discussed, studied and debated the issues involved in net neutrality. The United States began the process a decade ago with very weak intentions to protect net neutrality — but ended this year with a very strong net neutrality rule. The European Union began the process with strong intentions to protect net neutrality. After periods of debate that moved away from this standard, EU policy makers have concluded with a rule similar to the United States, but with some lingering ambiguity that may yet result in scenarios of divergence.
The implications for the transatlantic digital marketplace are signi�cant and could lead to different forms of regional fragmentation. Predominantly, this divergence will turn on whether the FCC’s regulatory theory is correct. The Americans argue that net neutrality is the catalyst for ensuring market incentives produce the best possible outcomes. The FCC’s theory of the virtuous cycle is to drive innovation in content, applications and services that in turn increase consumer demand for broadband access and push revenues to network operators for further investment in infrastructure. Consequently, the US market will prohibit business models that monetize congestion. By contrast, European regulators at the national level may interpret the new rule from Brussels as permissive for network operators to create discriminatory service offering. The rationale may be in part to create in its telecommunications sector an economic counterweight to Silicon Valley. The greater the difference between the implementation of the two net neutrality rules, the more likely the two markets will develop in signi�cantly different ways. Once these choices are made, they will be dif�cult to reverse.

CHAPTER FIVE: LANDMARK EU AND US NET NEUTRALITY DECISIONS
BEN SCOTT, STEFAN HEUMANN AND JAN-PETER KLEINHANS • 83
WORKS CITEDAccess. 2015. “Latest Net Neutrality Proposal in the EU:
A Wolf in Sheep’s Clothing?” Access Now Blog (blog), March 4. www.accessnow.org/blog/2015/03/04/latest- net-neutrality-proposal-in-the-eu-a-wolf-in-sheeps-clothing.
Ammori, Marvin. 2013. On Internet Freedom. Elkat Books.
———. 2014. “The Case for Net Neutrality: What’s Wrong with Obama’s Internet Policy.” Foreign Affairs, July/August. www.foreignaffairs.com/articles/141536/marvin-ammori/the-case-for-net-neutrality.
BEREC. 2011. “BEREC Guidelines on Net Neutrality and Transparency: Best Practices and Recommended Approaches.” BoR (11) 44. http://berec.europa.eu/�les/news/consultation_draft_guidelines.pdf.
———. 2012a. “BEREC Public Consultations on Net Neutrality: Explanatory Paper.” BoR (12) 34. http://berec.europa.eu/�les/news/bor_13_34_public_consultations.pdf.
———. 2012b. “BEREC Report: An Assessment of IP Interconnection in the Context of Net Neutrality.” BoR (12) 130. http://berec.europa.eu/eng/document_register/subject_matter/berec/download/0/1130-an-assessment-of-ip-interconnection-in-t_0.pdf.
Bernau, Verinia. 2015. “Falsch verbunden — Roaminggebühren und Netzneutralität.” Sueddeutsche.de, June 30. www.sueddeutsche.de/wirtschaft/roaminggebuehren-und-netzneutralitaet-falsch-verbunden-1.2544112.
Bhaskar, Anand. 2015. “Reliance-Internet.org Commercial (Vocals & VO: Anand Bhaskar).” YouTube video, March 16. www.youtube.com/watch?v=s390lZ5UXc4.
Brodkin, Jon. 2015. “Net�ix War Is over, but Money Disputes still Harm Internet Users.” Ars Technica, March 13. http://arstechnica.com/information-technology/2015/03/netflix-war-is-over-but-money-disputes-still-harm-internet-users/.
CISCO. 2015a. “Cisco Visual Networking Index: Forecast and Methodology, 2014–2019.” www.cisco.com/c/en/us/solutions/collateral/service-provider/ip-ngn-ip-next-generation-network/white_paper_c11-481360.html.
———. 2015b. “The Zettabyte Era — Trends and Analysis.” www.cisco.com/c/en/us/solutions/collateral/service-provider/visual-networking-index-vni/VNI_Hyperconnectivity_WP.html.
Council of the European Union. 2015a. “Proposal for a Regulation of the European Parliament and of the Council Laying Down Measures Concerning the European Single Market for Electronic Communications and to Achieve a Connected Continent.” 6710/15. http://data.consilium.europa.eu/doc/document/ST-6710-2015-INIT/en/pdf.
———. 2015b. “Proposal for a Regulation of the European Parliament and of the Council Laying Down Measures Concerning the European Single Market for Electronic Communications and to Achieve a Connected Continent… — Analysis of the Final Compromise Text with a View to Agreement.” 10409/1/15 REV1. http://data.consilium.europa.eu/doc/document/ST-10409-2015-REV-1/en/pdf.
Cowley, Stacey. 2005. “Level 3, Cogent Resolve Peering Spat, Renew Deal.” Network World, October 28. www.networkworld.com/article/2315404/system-management/level-3—cogent-resolve-peering-spat—renew-deal.html.
Crawford, Susan. 2014. “The Cliff and the Slope.” Backchannel, October 30. https://medium.com/backchannel/jammed-e474fc4925e4.
der Standard. 2013. “Deutsche Telekom-Chef kritisiert Freifahrtmentalität von Online-Firmen.” der Standard, February 26. http://derstandard.at/1361241161142/Deutsche-Telekom-Chef-kritisiert-Freifahrtmentalitaet-von-Online-Firmen.
Ermert, Monika. 2013. “Europe Pushes Rewind Button on Net Neutrality.” Internet Policy Review, September 23. http://policyreview.info/articles/news/europe-pushes-rewind-button-net-neutrality/197.
EC. 2013. “Proposal for a Regulation of the European Parliament and of the Council Laying Down Measures Concerning the European Single Market for Electronic Communications and to Achieve a Connected Continent.” COM(2013) 627 �nal. September 11. http://ec.europa.eu/information_society/newsroom/cf/dae/document.cfm?doc_id=2734.
———. 2015. “Digital Agenda for Europe: Broadband Strategy & Policy.” March 2. http://ec.europa.eu/digital-agenda/en/broadband-strategy-policy.
EP. 2014. “European Parliament Legislative Resolution of 3 April 2014 on the Proposal for a Regulation of the European Parliament and of the Council Laying Down Measures Concerning the European Single Market for Electronic Communications and to Achieve a Connected Continent.” Draft Legislative Resolution. (2014) 0281. www.europarl.europa.eu/sides/getDoc.do?type=TA&reference=P7-TA-2014-0281&language=EN.
FCC. 2015a. “February 2015 Open Commission Meeting.” www.fcc.gov/events/open-commission-meeting-february-2015.
———. 2015b. “In the Matter of Protecting and Promoting the Open Internet.” FCC 15-24. http://transition.fcc.gov/Daily_Releases/Daily_Business/2015/db0312/FCC-15-24A1.pdf.

RESEARCH VOLUME SIX: THE SHIFTING GEOPOLITICS OF INTERNET ACCESS
84 • CENTRE FOR INTERNATIONAL GOVERNANCE INNOVATION • CHATHAM HOUSE
Fitchard, Kevin. 2014. “AT&T Launches ‘Sponsored Data,’ Inviting Content Providers to Pay Consumers’ Mobile Data Bills.” Gigaom, January 6. https://gigaom.com/2014/01/06/att-launches-sponsored-data-inviting-content-providers-to-pay-consumers-mobile-data-bills/.
Florance, Ken. 2015. “The Misconception About Internet Fast Lanes.” Net�ix US & Canada Blog (blog), January 5. http://blog.net�ix.com/2015/01/the-misconception-about-internet-fast.html.
Genna, Innocenzo. 2013. “Net Neutrality and Competition: The European Commission Shakes the European Market.” Radiobruxelleslibera, July 13. https://radiobruxelleslibera.wordpress.com/2013/07/11/net-neutrality-and-competition-the-european-commission-shakes-the-european-market/.
Godfroid, Laurent and Stéphane Hautbourg. 2015. “The European Antitrust Review 2015 — Telecoms and Media.” Global Competition Review. http://globalcompetitionreview.com/reviews/62/sections/209/chapters/2466/telecoms-media/.
Hazlett, Thomas W. and Joshua D. Wright. 2011. “The Law and Economics of Network Neutrality.” George Mason Law & Economics Research Paper 11-36.
Higginbotham, Stacey. 2014. “In the Latest Battle to Pro�t from Control of the Internet, the Consumer Is Stuck in the Middle.” Gigaom, January 23. https://gigaom.com/2014/01/23/in-the-latest-battle-to-pro�t-from-control-of-the-internet-the-consumer-is-stuck-in-the-middle/.
Horten, Monica. 2013. “Permission to Stream — How New EU Telecoms Rules Violate Net Neutrality.” September 12. www.iptegrity.com/index.php/telecoms-package/net-neutrality/905-permission-to-stream-how-new-eu-telecoms-rules-violate-net-neutrality.
Internet World Stats. 2015. “World Internet Usage and Population Statistics.” www.internetworldstats.com/stats.htm.
Leichtman Research Group. 2015. “Nearly 1.2 Million Added Broadband in the First Quarter of 2015.” Press release, May 15. www.leichtmanresearch.com/press/051515release.html.
Leva, Tapio, Heikki Hammainen and Kalevi Kilkki. 2009. “Scenario Analysis on Future Internet.” In Evolving Internet: INTERNET’09: First International Conference On, IEEE, 52–59. www.leva. f i/wp-content/uploads/2013/01/Leva_ScenarioAnalysisOnFutureInternet_IARIA_INTERNET2009.pdf.
MacKinnon, Rebecca, Elonnai Hickok, Allon Bar and Hae-in Lim. 2014. “Fostering Freedom Online: The Role of Internet Intermediaries.” UNESCO Series on Internet Freedom. http://unesdoc.unesco.org/images/0023/002311/231162e.pdf.
March, Christina Cullel. 2011. “Net Neutrality and Net Freedoms under the European Unions Telecom Reform: Are they European Wide?” Paper presented at the 7th International Conference on Internet, Law and Politics. www.academia.edu/1048165/Net_Neutrality_and_Net_Freedoms_under_the_European_Union_Telecoms_Reform_are_they_European_wide.
Masse, Estelle. 2014. “The European Parliament Takes Important Step to Enshrine Net Neutrality into Law.” Access Now Blog (blog), April 3. www.accessnow.org/blog/2014/04/03/the-european-parliament-takes-important-step-to-enshrine-net-neutrality-int.
McCullagh, Declan and Larry Downes. 2012. “U.N. Could Tax U.S.-based Web Sites, Leaked Docs Show.” CNET, June 7. www.cnet.com/news/u-n-could-tax-u-s-based-web-sites-leaked-docs-show/.
McNamee, Joe. 2015. “EU Council Proposals on Protecting the Open Internet — Episode 1, The Phantom Neutrality.” EDRi, March 5. https://edri.org/eu-council-proposals-protecting-open-internet-episode-1-phantom-neutrality/.
Meyer, David. 2015. “Dutch and Slovenian Regulators Nail Carriers over Net Neutrality.” Gigaom, January 27. https://gigaom.com/2015/01/27/dutch-and-slovenian-regulators-nail-carriers-over-net-neutrality/.
MLAB. 2014. “ISP Interconnection and Its Impact on Consumer Internet Performance.” Measurement Lab Consortium Technical Report. www.measurementlab.net/static/observatory/M-Lab_Interconnection_Study_US.pdf.
NCTA. 2015. “No Public Utility Regulation of the Internet.” www.ncta.com/TitleII.
Newmyer, Tory. 2015. “Why Big Tech Isn’t Celebrating Its Big Victory on Net Neutrality.” Fortune.com, February 26. http://fortune.com/2015/02/26/big-tech-net-neutrality/.
Of�cial Journal of the European Union. 2009. Directive 2009/140/EC of the European Parliament and of the Council. November 25. http://eur-lex.europa.eu/legal-content/EN/TXT/PDF/?uri=CELEX:32009L0140&from=EN.
Puzzanghera, Jim. 2015. “FCC Releases Net Neutrality Regulations; Opponents Expected to Sue.” Los Angeles Times, March 12. www.latimes.com/business/la-�-net-neutrality-order-20150313-story.html.
Ramachandran, Shalini. 2014. “Net�ix to Pay Comcast for Smoother Streaming.” The Wall Street Journal, February 23. www.wsj.com/articles/SB10001424052702304834704579401071892041790.
Scola, Nancy. 2014. “ICANN Chief: ‘The Whole World is Watching’ the U.S.’s Net Neutrality Debate.” The Washington Post, October 7. www.washingtonpost.com/blogs/the-switch/wp/2014/10/07/internet-operations-chief-snowden-disclosures-make-my-job-easier/.

CHAPTER FIVE: LANDMARK EU AND US NET NEUTRALITY DECISIONS
BEN SCOTT, STEFAN HEUMANN AND JAN-PETER KLEINHANS • 85
Sepulveda, Daniel A. 2015. “The World Is Watching Our Net Neutrality Debate, So Let’s Get It Right.” Wired, January 21. www.wired.com/2015/01/on-net-nuetrality-internet-freedom/.
Shields, Todd. 2015. “It Took Four Million E-Mails to Get the FCC to Set Net-Neutrality Rules.” Bloomberg, February 3. www.bloomberg.com/news/articles/2015-02-03/a-rant-and-4-million-e-mails-later-fcc-to-set-web-traf�c-rules.
Statista. 2015. “Net�ix Online Traf�c Volume in the United States from 1H 2010 to 1H 2015, by Percentage of Peak Period Downstream Traf�c.” www.statista.com/statistics/245986/net�ixs-share-of-peak-period-downstream-traf�c/.
Thomas, Daniel, David Crow and Duncan Robinson. 2015. “Proposals on European Net Neutrality Open ‘Two-Speed’ Internet.” Financial Times, March 3. www.ft.com/cms/s/0/5688747c-c192-11e4-bd24-00144feab7de.html.
Van Schewick, Barbara. 2007. “Towards an Economic Framework for Network Neutrality Regulation.” Journal on Telecommunications and High Technology Law 5: 329–91.
———. 2012. Internet Architecture and Innovation. Cambridge, MA: MIT Press.
Wake�eld, Jane. 2015. “Net Neutrality Rules Passed by US Regulator.” BBC News, February 26. www.bbc.co.uk/news/technology-31638528.
Wu, Tim. n.d. “Network Neutrality FAQ.” Tim Wu.org. www.timwu.org/network_neutrality.html.
———. 2003. “Network Neutrality, Broadband Discrimination.” Journal of Telecommunications and High Technology Law 2: 141.
ABOUT THE AUTHORSBen Scott is managing director of the stiftung neue verantwortung (snv) in Berlin, and concurrently senior adviser to the Open Technology Institute at New America in Washington, DC. He was the policy adviser for innovation at the US Department of State, where he worked in a small team of advisers to Secretary of State Hillary Rodham Clinton. Prior to joining the State Department, he led the Washington of�ce of Free Press for six years. He holds a Ph.D. in communications from the University of Illinois.
Stefan Heumann is director of the European Digital Agenda program at snv. He is a member of the Freedom Online Coalition Working Group 3 on Privacy and Transparency Online. Before joining snv, he coordinated the Public Affairs department of the US Consulate General in Hamburg, and taught political science as assistant professor at the University of Northern Colorado. He holds a Ph.D. in political science from the University of Pennsylvania.
Jan-Peter Kleinhans is manager of the European Digital Agenda program at snv. Before joining snv, he worked as a journalist at netzpolitik.org, focusing on surveillance technology and Internet regulation. He holds a master’s degree in social sciences from Uppsala University in Sweden.

CHAPTER SIX: ZERO-RATING IN EMERGING ECONOMIES
HELANI GALPAYA • 87
CHAPTER SIX:ZERO-RATING IN EMERGING ECONOMIES
Helani Galpaya
Copyright © 2017 by Helani Galpaya

RESEARCH VOLUME SIX: THE SHIFTING GEOPOLITICS OF INTERNET ACCESS
88 • CENTRE FOR INTERNATIONAL GOVERNANCE INNOVATION • CHATHAM HOUSE
INTRODUCTION For decades, emerging countries in Asia, Sub-Saharan Africa and Latin America worried about connectivity: how to extend networks and how to make access affordable to citizens. During this time the issue of net neutrality was at most theoretical in these regions, its debate left to developed countries. Yet, since around 2014, it has emerged as a topic garnering attention in Asia, to a greater extent, and in Africa and Latin America, to a lesser extent. For the �rst time, emerging economies are not just debating how to get people connected to the Internet, but also what type of Internet people could and should be connecting to: an Internet that gives special advantage to certain content through differentiated pricing or differentiated quality, or an Internet that does not discriminate — positively or negatively, based on price, quality or other criteria — any content over another? Much of this recent interest in developing countries is a result of the availability of zero-rated content — broadly de�ned as content that doesn’t count toward the user’s data cap, and therefore is free to the user. The actions of one �rm brought the issues to the forefront. Facebook linked up with mobile network operators (MNOs) in developing countries and content providers across the world to introduce a platform called Free Basics (previously called Internet.org, since rebranded) which enabled any content accessed via the platform (including Facebook’s own popular social media network) to be free of charge to the users.
The debate had most people at one of two extremes: At one end was the argument that zero-rated content should be banned because it is a violation of net neutrality (because the free content is privileged over paid-for content, thereby giving an automatic advantage to the free content, possibly keeping users from exploring anything else in the rest of the Internet). At the other end was the argument that zero-rated content is a boon to the poor and unconnected populace in Asia, Africa and Latin America, the rationale being that having some connectivity, even with minimal content, was better than having no access at all. Between these two extremes is an emerging body of evidence that paints a mixed picture, showing that:
• not only the poor �nd zero-rating attractive;
• most users prefer to have the full Internet instead of limited content (such as that offered by Free Basics);
• a signi�cant number of people don’t stay inside the zero-rated platform but use the full Internet instead;
• a zero-rating strategy is one among many used by telecom operators to increase market share and could easily be a passing phenomenon;
• competition could be enhanced or reduced depending on how the zero-rated content is offered in a given market; and
• zero-rating strategies are very common, and when popular content such as Facebook is zero-rated, it enjoys signi�cant uptake.
It is a debate that touches upon issues of net neutrality, market power, privacy, security and social equity.
This chapter examines the spectrum of arguments for and against zero-rating and presents evidence, where available, supporting or contradicting such arguments. It analyzes each issue from the perspective of developing countries — countries with market conditions vastly different from those of Europe or the Americas in terms of connectivity, affordability, quality of service and availability of relevant content for users.
UNDERSTANDING ZERO-RATING AND NET NEUTRALITY
Zero-rated Content
Capped and Metered Use of Data
The most common MNO data plans in the developing world are capped or metered. That is, users pay a �xed amount per day, per week or per month, in return for being able to download/upload a speci�c (capped) amount of data, or users pay per number of units of data downloaded/uploaded. Uncapped (“all you can eat”) packages are available in some markets, but these are rare. By far, capped and metered packages are the norm. If the cap is reached before the validity period ends, the user can purchase an additional data quantity (thereby temporarily increasing the cap), or pay for what he or she uses additionally on a per-unit basis. Either way, the usage is metered in the sense that users pay for what they consume. It is not uncommon in emerging markets to �nd packages that are capped as low as 100 megabytes (MB), sometimes less, and valid for just a day or a few days. These types of “micro” data packages (small quantities consumed for low prices) allow even those on tight budgets to consume some data.
The advantage of caps generally is that they give price-sensitive users (the majority in any developing country) certainty about what they are spending on data, since they cannot continue to consume data after the (prepaid) cap is reached unless they consciously top up their mobile credit. Since many data networks follow something close to the 80:20 rule (where 80 percent of the bandwidth is used by 20 percent of users), metered use makes everyone pay for what they consume, thereby avoiding the majority (or the poor majority) subsidizing the limited number of high bandwidth consumers. This is important in the Global
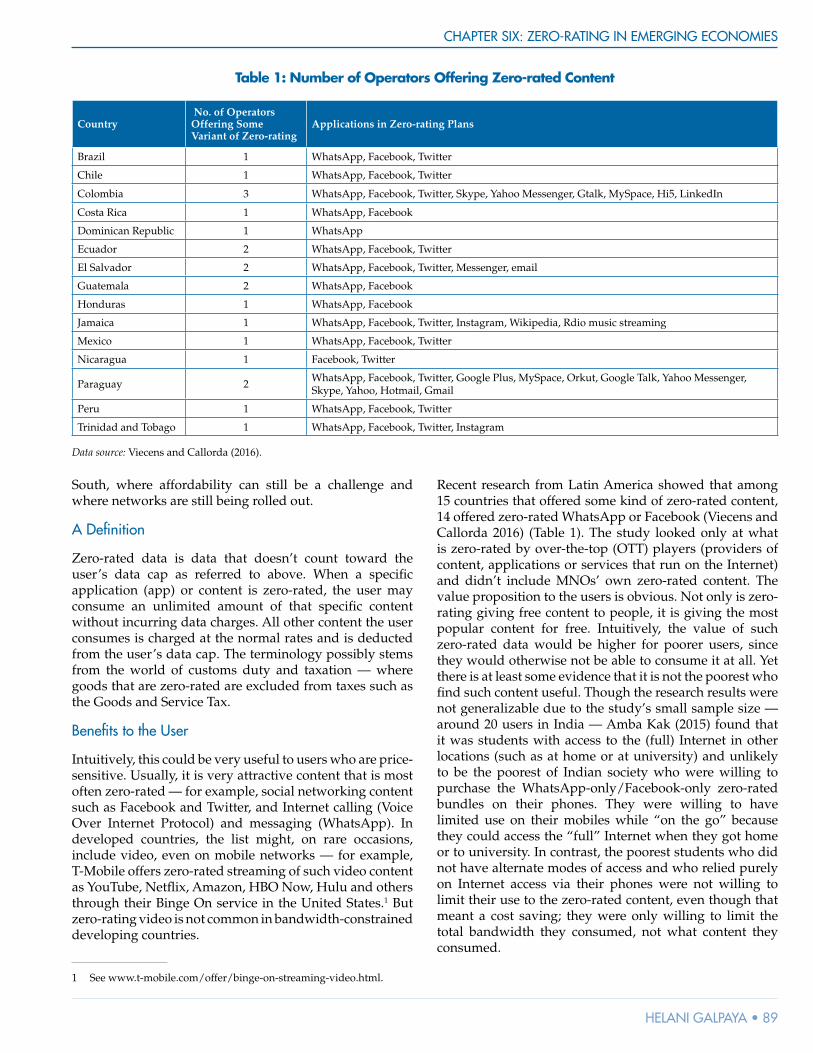
CHAPTER SIX: ZERO-RATING IN EMERGING ECONOMIES
HELANI GALPAYA • 89
South, where affordability can still be a challenge and where networks are still being rolled out.
A De�nition
Zero-rated data is data that doesn’t count toward the user’s data cap as referred to above. When a speci�c application (app) or content is zero-rated, the user may consume an unlimited amount of that speci�c content without incurring data charges. All other content the user consumes is charged at the normal rates and is deducted from the user’s data cap. The terminology possibly stems from the world of customs duty and taxation — where goods that are zero-rated are excluded from taxes such as the Goods and Service Tax.
Bene�ts to the User
Intuitively, this could be very useful to users who are price-sensitive. Usually, it is very attractive content that is most often zero-rated — for example, social networking content such as Facebook and Twitter, and Internet calling (Voice Over Internet Protocol) and messaging (WhatsApp). In developed countries, the list might, on rare occasions, include video, even on mobile networks — for example, T-Mobile offers zero-rated streaming of such video content as YouTube, Net�ix, Amazon, HBO Now, Hulu and others through their Binge On service in the United States.1 But zero-rating video is not common in bandwidth-constrained developing countries.
1 See www.t-mobile.com/offer/binge-on-streaming-video.html.
Recent research from Latin America showed that among 15 countries that offered some kind of zero-rated content, 14 offered zero-rated WhatsApp or Facebook (Viecens and Callorda 2016) (Table 1). The study looked only at what is zero-rated by over-the-top (OTT) players (providers of content, applications or services that run on the Internet) and didn’t include MNOs’ own zero-rated content. The value proposition to the users is obvious. Not only is zero-rating giving free content to people, it is giving the most popular content for free. Intuitively, the value of such zero-rated data would be higher for poorer users, since they would otherwise not be able to consume it at all. Yet there is at least some evidence that it is not the poorest who �nd such content useful. Though the research results were not generalizable due to the study’s small sample size — around 20 users in India — Amba Kak (2015) found that it was students with access to the (full) Internet in other locations (such as at home or at university) and unlikely to be the poorest of Indian society who were willing to purchase the WhatsApp-only/Facebook-only zero-rated bundles on their phones. They were willing to have limited use on their mobiles while “on the go” because they could access the “full” Internet when they got home or to university. In contrast, the poorest students who did not have alternate modes of access and who relied purely on Internet access via their phones were not willing to limit their use to the zero-rated content, even though that meant a cost saving; they were only willing to limit the total bandwidth they consumed, not what content they consumed.
Table 1: Number of Operators Offering Zero-rated Content
Country No. of Operators Offering Some Variant of Zero-rating
Applications in Zero-rating Plans
Brazil 1 WhatsApp, Facebook, Twitter
Chile 1 WhatsApp, Facebook, Twitter
Colombia 3 WhatsApp, Facebook, Twitter, Skype, Yahoo Messenger, Gtalk, MySpace, Hi5, LinkedIn
Costa Rica 1 WhatsApp, Facebook
Dominican Republic 1 WhatsApp
Ecuador 2 WhatsApp, Facebook, Twitter
El Salvador 2 WhatsApp, Facebook, Twitter, Messenger, email
Guatemala 2 WhatsApp, Facebook
Honduras 1 WhatsApp, Facebook
Jamaica 1 WhatsApp, Facebook, Twitter, Instagram, Wikipedia, Rdio music streaming
Mexico 1 WhatsApp, Facebook, Twitter
Nicaragua 1 Facebook, Twitter
Paraguay 2 WhatsApp, Facebook, Twitter, Google Plus, MySpace, Orkut, Google Talk, Yahoo Messenger, Skype, Yahoo, Hotmail, Gmail
Peru 1 WhatsApp, Facebook, Twitter
Trinidad and Tobago 1 WhatsApp, Facebook, Twitter, Instagram
Data source: Viecens and Callorda (2016).

RESEARCH VOLUME SIX: THE SHIFTING GEOPOLITICS OF INTERNET ACCESS
90 • CENTRE FOR INTERNATIONAL GOVERNANCE INNOVATION • CHATHAM HOUSE
BENEFITS TO THE OTT/CONTENT PROVIDER AND MNO
Just because the user does not pay does not mean that zero-rated data provision is costless. It means instead that some other entity in the Internet value chain bears the costs. Usually, it is the MNO or the OTT player (or both) who bears them. The cost of the user’s bandwidth to access the zero-rated content is borne by the MNO, or paid to the MNO by the OTT player, or shared between the MNO and OTT player, depending on how the speci�c business model is structured.
For the MNO and OTT, zero-rating could be part of a strategy to move users toward being fully paying consumers — initially attracting them by giving away some attractive content (but leaving some desirable content just beyond their reach), thereby nudging them toward paying. Alternatively, the speci�c content could be zero-rated for a limited introductory period to users. Having a taste of the content, some proportion of users would willingly convert to being paying consumers, to keep accessing the content after the promotional period ended. For the MNO, the customers’ conversion would mean increased data-use fees. For the OTT provider, it would mean direct revenues.
Zero-rating is a marketing strategy for the OTT provider and MNO. It is dif�cult to imagine a situation where the MNO keeps bearing the cost of zero-rated connectivity if the medium- or long-term payback is not suf�cient to cover the incurred costs — that is, the MNO’s revenue due to new consumers is higher than the combined cost of serving consumers who only use zero-rated content (and never “convert” and generate revenue) and the cost of previously paying consumers who downgraded to the zero-rated version of the content they previously paid to consume. For the OTT player, too, “converting” a user from a free version that offers partial functionality into a “full” version that offers all functions can be a direct revenue stream. But because the value of some content (such as that of social media platforms) can increase as a result of the number of users (for example, by increasing the value of advertising on that social media platform), it might make sense for the OTT provider to continue to zero-rate (and pay the MNO), even if no users buy the version with full functionality.
Jeffrey A. Eisenach (2015, 6) explains this most succinctly:
…Zero Rating is a means by which carriers create opportunities for distribution by content providers (by increasing the number of subscribers), while enhancing the value of the platform for subscribers (by increasing the amount of available content). To the extent content providers contribute �nancially to Zero Rating through sponsored data programs, they
do so in re�ection of the increased value (at least over the long run) of enhanced distribution. But carriers may (and do) choose to offer Zero Rating even without a �nancial payment from content providers simply because it increases the value of their platforms.
A second aspect of multi-sidedness relevant to Zero Rating relates to the dual nature of consumers in relation to platforms like Facebook, Twitter and Wikipedia, in which “consumers” are also content creators. Thus, by attracting additional participants onto the platforms of such services, Zero Rating increases both the number of content consumers and the amount of content available. This “double whammy” effect helps to explain why �rms like Facebook are taking the lead in encouraging Zero Rating programs.
Yet pro�t (direct or indirect) is not the only motive claimed by zero-rated providers. Mark Zuckerberg of Facebook has claimed that its zero-rated platform, Free Basics, is part of its plan to “connect the world,” and presents altruistic motives.2 This chapter will delve into a detailed discussion of Free Basics in later sections.
Prevalence of Zero-rated Offers
There are no clear statistics of the prevalence of zero-rated programs globally or by country, as such offers are constantly entering or leaving the market. However, as shown in Table 1, 15 out of 19 countries researched in Latin America had some kind of zero-rated product offered. And according to the same research, 21 of the 46 MNOs in the region offered some zero-rated product. Zero-rated plans were seen as post-paid plans as well as prepaid plans. Some countries had a handful of plans to choose from (across all MNOs) while others, such as Colombia, offered as many as 30 prepaid and 34 post-paid plans (Viecens and Callorda 2016).
In another study, the Alliance for Affordable Internet (A4AI) looked at the top three to �ve carriers by market share in eight countries in the Global South (India, Philippines, Bangladesh, Ghana, Nigeria, Kenya, Peru and Colombia) and found that zero-rated data plans exist in every country, although there is a great range in the frequency with which they are offered in each (A4AI 2015). Across the 181 plans examined in these eight countries, 13 percent were offering zero-rated services. However, the researchers found that 51 percent offered a “service speci�c” data bundle, which is de�ned as a package that allows users to purchase
2 See Mark Zuckerberg’s statement on Facebook on March 27, 2014, at https://en-gb.facebook.com/zuck/posts/10101322049893211.
CHAPTER SIX: ZERO-RATING IN EMERGING ECONOMIES
HELANI GALPAYA • 91
data that enables them to access certain sites or apps for a speci�c period of time (including unlimited use of that site or app during the period). The user paid a discounted rate for this data pack. And commonly offered packs included social media (Facebook, Twitter, others), email (Gmail, Yahoo mail) and other popular content (ibid.). While these packs were not free, they are highlighted here to show the importance of certain key social media content in generating data revenue for MNOs. As such, offering it free initially via a zero-rated program and then selling a subsidized, time-limited data bundle or pack is a viable strategy.
Another study covering Ghana, Kenya, Nigeria and South Africa by Alison Gillwald and her colleagues (2016) �nds Facebook’s Free Basics and Wikipedia Zero to be the most commonly zero-rated content. Gillwald et al. also mention Mozilla and Orange’s experiments in “equal rating” in the region (which are not commercial offerings yet and have only nominal presence), where the purchase of a particular phone (for around US$40) included unlimited talk, text and 500 MB of data per month for six months; the user can access any content, up to the data cap. This type of program, which doesn’t zero-rate just one speci�c content but zero-rates all content up to a speci�ed data cap, is usually called equal-rating and will be examined in coming sections.
No published study systematically looks at what content is zero-rated in the Asia-Paci�c region, but Facebook has claimed that Free Basics is available in 11 Asian countries (Bangladesh, Cambodia, Indonesia, Maldives, Mongolia, Myanmar, Pakistan, Philippines, Thailand, Timor-Leste and Vanuatu) and more than 23 African countries.3
Net Neutrality
Net neutrality is a principle about how traf�c is routed on the Internet. Tim Wu (2003), who is credited with coining the term, and others have talked about how the Internet serves as a platform for innovation, and state that the neutral nature of the Internet is what provides incentives to invest and enables competition among applications. They see network providers acting as neutral routers of information packets, without discrimination, with the exception of some speci�c situations (such as spam) that can harm the network or the users. Wu’s rules speci�cally ban the network operator from discriminating for or against any particular application. He uses the example of an online game that consumes large amounts of bandwidth (compared to, say, email) and thus creates incentives for the telecom operator to restrict usage in order to manage quality for other users and other applications. Instead of banning or restricting the game,
3 See https://info.internet.org/en/story/where-weve-launched/.
Wu proposes another solution: the network provider does not block, but polices usage, and allows users who are interested in a better gaming experience to buy more bandwidth. If these rules in Wu’s proposal are applied by each operator to the networks they own (“police what they own”), neutrality of the Internet is ensured. In other words, Wu’s solution is to move toward a “pay for what you consume” model that is already the most common across emerging Asia and Africa. These regions rarely offer the “all you can eat” data bundles that are common in some developed economies.
Most will summarize the principle of net neutrality as “all electronic communication passing through a network will be treated the same, independently of content, application, service, device, sender, receiver” (Global Symposium for Regulators [GSR] 2012).
In other words, the principles of net neutrality were predominantly about ensuring the technical quality of Internet access, not about issues of equity. A purist reading of network neutrality implies that no part of the network may engage in any type of traf�c management (traf�c management refers to a collection of techniques that Internet service providers [ISPs] could use to allocate network resources to obtain optimal performance). But most people see traf�c management as necessary under certain circumstances, and that it bene�ts OTT providers and users. An example would be prioritizing time-sensitive data such as a Skype transmission over a File Transfer Protocol action happening in the background. This management is all the more necessary in developing countries where bandwidth is constrained. According to a discussion paper from the GSR (ibid.), networks can use a range of techniques such as data caps, application-agnostic congestion management, prioritization, differential throttling (where capacity available for one type of content is throttled — for example, all video content), access tiering (selling access to a lane to OTTs who are able and willing to pay) and blocking.
The UK regulator Ofcom presents the traf�c management methods, from the least intrusive (therefore, least problematic for most people) to the most intrusive (therefore, highly likely to be seen as a violation of net neutrality) as shown in Figure 1.

RESEARCH VOLUME SIX: THE SHIFTING GEOPOLITICS OF INTERNET ACCESS
92 • CENTRE FOR INTERNATIONAL GOVERNANCE INNOVATION • CHATHAM HOUSE
Figure 1: ISP Traf�c Management Continuum
LEAST INTRUSIVE
No traf�c management
Traf�c managed during high-congestion periods only
Most vulnerable services given priority (voice, streaming, games)
Blocking content (spam and illegal website content)
Throttling or degrading of some types of traf�c (for example, peer-to-peer networks)
Some service providers or apps given priority (perhaps for fee, as revenue stream)
Rivals’ content or apps blocked
MOST INTRUSIVE
Source: Author, based on Ofcom (2010, 6).
It is worth noting that Wu’s discussion took place mainly in the �xed-network data world. A majority of his arguments are applicable in the case of mobile data too. But mobile networks possibly face more traf�c management implications due to the nature of technology and spectrum.
The big question is whether zero-rating violates net neutrality rules. In other words, does the act of an MNO offering some form of zero-rated package create the conditions or provide �nancial incentives under which certain forms of traf�c management become necessary?
It should be obvious from Figure 1 that the more intrusive forms of traf�c management (and therefore, to many, the more egregious violations of net neutrality) occur in relation to how an ISP treats someone else’s traf�c in relation to its own. That is, the violations are necessarily set in the competitive landscape. As such, an analysis of net neutrality violations cannot take place without analyzing the competitive dynamics of the speci�c market or market segment. Vishal Misra (2015) makes the need for analyzing the competitive dynamics clear in his look at the issue of neutrality using consumer surplus, which is the difference between the utility gained from using a good or service and the cost of consuming that good or service. He argues that the common understanding of net neutrality focuses only on the utility side and therefore limits only discrimination based on quality of service (utility is a function of the quality of service obtained for a speci�c application). By looking at the cost, he points out that, from a game theoretic model, zero-cost services create higher surpluses,
thereby providing a competitive advantage to the provider of the service.
Incentives for Non-neutrality
The incentives for each actor in a zero-rated arrangement can vary depending on the level of competition and the �ow of money. With the recognition that many more variations are possible, the scenarios below present three separate possibilities:
Scenario 1: MNO with Signi�cant Market Power
Consider a case where an MNO (call it “X”) has signi�cant market power and wants to adopt a zero-rate content strategy. Given X’s power, it has the ability to offer a very high number of viewers (or “eyeballs”) to any potential content provider. This makes being zero-rated by X very attractive to content providers, and therefore increases their willingness to pay X for carrying the content, if needed. X may, too, decide to carry the content without payment from the content provider, as long as the content is attractive enough to attract new users to X’s network, and the expected revenue from these users is larger than the cost of zero-rating the data. Because the zero-rated content is of high value (because X is receiving payments from the content provider, or because the content’s attractiveness is generating new consumers for X’s network, or both), traf�c management would result in all other traf�c being negatively discriminated, while the zero-rated content is positively discriminated. X could keep downgrading all other content, until other content providers feel compelled to join X’s zero-rating program in order to have their content reach X’s customers at reasonable quality levels.
There are other concerns beyond traf�c management. Due to its market size, X is in a position to ask for exclusivity — that is, to specify that the content that is zero-rated on its network cannot be zero-rated on a rival MNO’s network. The exclusivity would negatively impact the content diversity for consumers not on X’s network, and create further incentives for them to switch to X.
Scenario 2: Zero-rating of Dominant Content
A variation of Scenario 1 is when a particular content or app — call it “A” — dominates the market and has few competitors. In such a situation, A could demand that each MNO that zero-rates A not carry any competing content. Given A’s popularity, as traf�c increases, the MNOs might have incentives to negatively discriminate against other content. The concerns are the same as in Scenario 1 in terms of competition harms, content diversity and quality. Further, seeing that the particular content market (be it for streaming music, social networking or some other activity) is dominated by A, entrepreneurs who might have developed alternate content or apps will leave the market, or worse, never enter, since it is dif�cult to compete
CHAPTER SIX: ZERO-RATING IN EMERGING ECONOMIES
HELANI GALPAYA • 93
with the zero-rated A unless one has signi�cant resources (since price competition with A is no longer an option). Innovation and entrepreneurship could be harmed.
Scenario 3: Competitive Market of MNOs
In this scenario, there are a large number of MNOs in the market, none with signi�cant market power. In this situation, there is no reason for a content provider to try to be on one speci�c network provider over another because no one MNO offers a market share advantage. Content providers have incentives to be zero-rated with as many MNO networks as possible in order to reach the widest audience. Further, no single MNO can demand exclusivity from content providers. Therefore, there is no immediate danger to content diversity on competitive networks. And each MNO has incentives to include as much diverse content as possible on their zero-rating program, in order to cater to the diverse demands on a long-tail market.
We could consider many variations of the above scenarios. But it should be clear that the biggest concerns arise when actors with signi�cant market power — in content provision, or in service delivery (MNOs) — participate in zero-rating programs. The harms to competition, consumer content diversity and innovation are all issues that need to be examined in such situations.
The Case of Facebook Flex
Though no formal studies of market power were found at the time of writing, most writers agree that Facebook is one of the most dominant social media platforms. Even in the face of emerging data that shows younger users prefer SnapChat to Facebook (Beck 2016), Facebook still has nearly 1.8 billion users (Statista 2016) and is the social media platform with the highest number of registered users. It is certainly the most popular application used in many emerging markets. If Facebook were to be zero-rated exclusively via the dominant MNO in a given market (that is, if consumers on the dominant market could consume the dominant content for free), competition harms would be a signi�cant concern. Not only does Facebook provide its own content, but it also hosts third-party content (for example, games, map applications). Given Facebook’s popularity, other content providers have incentives to be inside Facebook, thereby further increasing Facebook’s power.
Facebook Flex is the video- and image-free version of Facebook that is zero-rated by various telcos across the world. Facebook Flex is commonly zero-rated in many emerging markets, as previously seen. It is clear Facebook being zero-rated causes concerns, particularly if it is zero-rated via the dominant operator. But does Facebook Flex being zero-rated also pose a concern? The question here is whether Facebook Flex is the same as Facebook. Does the
lack of video and pictures make it a different product, or do the dynamics above still apply?
One could argue that Facebook is Facebook, with or without pictures — it still connects one to the social network, allows posting on timelines and allows messages to be exchanged. There are no market de�nition studies to conclusively show whether the two versions are in the same market (that is, substitutes) or not. However, Myanmar provides a unique natural experiment where Facebook and Facebook Flex are both offered to users. Myanmar Posts and Telecommunications (MPT), the incumbent dominant operator, offers Facebook Flex within its Free Basics platform, and users can consume unlimited quantities of it. Telenor, the largest private-sector operator (although still smaller than MPT) offers Facebook (the “full” version, with pictures and video) to its users, but limits the free usage to 150 MB per day per SIM card. In July 2016, focus groups were conducted with 63 men and women aged 15 to 64 from all income levels to understand their data use. All but 16 of the respondents were users of zero-rated content. Many respondents had two SIM cards — one from MPT and one from Telenor. All of them stated a very clear preference for the “normal” or “full” version of Facebook, where they could consume pictures and video as well as text. They consumed Facebook Flex only because they could not afford the full version. They would start the day with their Telenor SIM card and access the full Facebook. When they reached their consumption limit (150 MB) they switched to the MPT SIM and used Facebook Flex without pictures and videos. They did so because they still wanted to stay connected to their friends and communicate via Facebook, but they were unhappy about being unable to see picture or videos. Many knew they would exceed their data cap while on their Telenor SIM, and therefore consumed only essential videos, bookmarking and saving the rest to consume if they came across a free Wi-Fi hotspot during the day. A subgroup of these respondents ended up reloading their prepaid data service in order to keep consuming pictures and videos, instead of switching to the free version. These types of consumption patterns and respondents’ stated preferences show that photos and videos are key components of Facebook, and suggest that Facebook Flex is a different product from Facebook, as far as it is perceived by the Myanmar users studied (Cihon and Galpaya, forthcoming 2017). Further, this speci�c implementation of Facebook caps the amount consumed per day at a level where even poor or entry-level consumers feel the need to purchase additional bandwidth, indicating that the two are not substitutes.
The Case of Free Basics
Free Basics is Facebook’s product that is not limited to Facebook Flex but offers a variety of other content from

RESEARCH VOLUME SIX: THE SHIFTING GEOPOLITICS OF INTERNET ACCESS
94 • CENTRE FOR INTERNATIONAL GOVERNANCE INNOVATION • CHATHAM HOUSE
third parties.4 Free Basics (previously called Internet.org) can be accessed via a browser or a downloadable app. Anyone with a mobile phone can use Free Basics as long as his or her MNO participates in the Free Basics program — that is, the MNO has an agreement with Facebook to offer Free Basics. According to Facebook, there is no payment made by Facebook to the MNO or by the third-party content providers to Facebook or the MNO. Therefore, the MNO bears the full cost of subsidizing Free Basics users. Any third-party content provider can offer its content via Free Basics, as long as the content meets certain technical speci�cations (such as absence of video, very high-resolution of images, use of JavaScript and iFrame elements), thereby enabling the use of Free Basics on feature phones (not just smartphones) and in low bandwidth connectivity. Given that smartphone penetration is low among the poor in Asia, Africa and Latin America, providing the service on basic or “feature” phones appears to �t in with Facebook’s stated goal of connecting the world. Implementations of Free Basics are found almost exclusively in developing countries in Latin America, Africa and Asia.5
While Facebook Flex is offered on every Free Basics implementation, the other (third-party) content that is offered on the platform varies based on the country, and can include content related to health, weather, education, jobs and entertainment. No two instances of Free Basics are the same. For example, Rijurekha Sen and colleagues (2016) have compared the implementations in Pakistan and South Africa, and found 74 and 101 services in each country respectively. Certain content (for example, global news sites such as the British Broadcasting Corporation) are common across the two countries, but much other content is country-speci�c. They have also analyzed the content on Free Basics in each country against the generally popular content accessed by that country in general. They found that although much of the popular content for the country (as revealed by the country’s Alexa Internet rankings) is also offered on Free Basics in that country, these sites only account for around 20 percent of what’s offered on Free Basics. The other services or content offered on Free Basics falls below the top 500 nationally popular services, indicating that not all popular content is offered on Free Basics. They even �nd a small handful of services that are dubious and categorize these as spam because they lead to unavailable links or to links that generate warnings. And Facebook is offered on Free Basics, but it is Facebook Flex that is offered, not the full version preferred by users. These researchers (ibid.) also performed tests to �nd that, on average, the data transfer quality of content on Free Basics is worse than the quality of the same content outside of Free Basics (on a normal “paid” data connection). This �nding is almost counter to popular expectation, since in Scenario 2
4 From here on, this chapter will refer to Free Basics as a platform, because of its ability to host other content.
5 See list of countries offering Free Basics at https://info.internet.org/en/story/where-weve-launched/.
above, the MNO has incentives to treat the zero-rated content better, and to downgrade other content. Since the MNO isn’t getting paid by Facebook, it appears to have set up the arrangement to give users just enough connectivity while nudging them toward becoming “full” users. Finally, most implementations of Free Basics are through a non-dominant operator, as part of its strategy to compete against a larger operator. In such cases, market concentration is likely too diffuse, and raises fewer concerns about zero-rated content.
ARGUMENTS FOR AND AGAINST ZERO-RATINGAs mentioned in the introductory section, the topic of zero-rating has garnered much attention in South Asia, with the Free Basics battle in India (see Box 1) being played out in other jurisdictions. Less polarized yet equally important debates have taken place in other countries. Much of the debate centres on the trade-off involved — the importance of giving citizens any type of connectivity (even limited access to certain content or platforms) to the Internet, versus the importance of giving them access to the full, free, open Internet. In this debate, poverty and rights are as important as economics and technology.
Some of the points made by opponents and proponents of the zero-rating debate are given below, along with supporting or countering evidence.
Zero-rating as Internet On-ramp
Emerging Asia has some of the lowest mobile voice and data prices in the world. Many have even met the affordability benchmark set by the UN Broadband Commission6 in 2015, requiring monthly access charges be less than 5 percent of monthly income. And yet, fewer than 20 percent of the population in these countries is online (Galpaya 2015, 11-12). So there is something beyond mere affordability keeping people of�ine. Could it be they don’t see the value of getting online by buying a data package? Might they be tempted to try some data if it were free? Might social media content, especially apps such as Facebook used by the users’ friends, entice users to get online, especially if it were free initially? After being exposed to the Internet (or a limited part of the Internet) in this manner, would these people later become consumers of the “full” Internet and buy a data bundle? And what about the masses in Asia, Africa and Latin America who still face a huge affordability challenge? Will they not welcome the chance to try consuming some select content on the Internet for free? And won’t that make the business case for lowering prices (because MNOs can see the pent-
6 In full, the UN Broadband Commission for Sustainable Development, formerly the UN Broadband Commission for Digital Development. See the 2015 benchmarks at www.broadbandcommission.org/Documents/Broadband_Targets.pdf.

CHAPTER SIX: ZERO-RATING IN EMERGING ECONOMIES
HELANI GALPAYA • 95
up demand)? This last point is the hope of many, and certainly the development/“pro-poor” narrative espoused by MNOs and content providers who offer zero-rating. Unfortunately, at the time of writing, very little systematic evidence is available to either support or disprove this narrative.
But the two data points that are available show that there is some “on-ramp” effect.
The data Facebook has publicly recited is that 50 percent of users who start using Free Basics buy a data package within 30 days (Internet.org 2015). But it is not known if, after purchasing the packages, these users continue to only browse Facebook (including videos and images, which were not available on the Free Basics version) or are consuming other content outside of Facebook.
Another study based on phone interviews with zero-rated data users in eight developing countries in Latin America, Africa and Asia shows that 28 percent of users of zero-rated services no longer use it and have become paying customers of the full Internet; another 35 percent continue to use the zero-rated services but also have a paid data subscription to the full Internet (A4AI 2016). It is not possible to establish if the effects are stronger for poorer people, because income (or a proxy for it) was not captured in the survey.
Box 1: The Free Basics Battle in India
In March 2015, the Telecom Regulatory Authority of India (TRAI) issued a Consultation Paper on Regulatory Framework for Over-the-top (OTT) Services. The document covered a range of questions on how OTT services should be regulated, as well as the pros and cons of various price or non-price discrimination methods (TRAI 2015a). In the six months leading up to this consultation, Airtel had announced its package Airtel Zero, and Reliance had launched Free Basics. A coalition of activists, private companies, academics and others came together under the “Savetheinternet.in” campaign and were successful in making the citizens of India, and indeed the world, aware of the issues of net neutrality involved in such zero-rated offerings. By using creative and entertaining videos, open letters to Mark Zuckerberg and much traditional publicity (such as op-ed pieces in newspapers) and making it easy for anyone with an Internet connection to send a standard response to TRAI with a simple click, the campaign was a triumph in getting the public to engage with regulatory decision making. More than one million people wrote emails to TRAI, the majority asking for Internet.org (later renamed Free Basics) to be banned
and for strict net neutrality rules to be enforced. Some questioned the relevance of asking people already online (and thus able to write emails to TRAI) about an issue that deeply affected the chances of the rest of the population getting online. The negative publicity against Internet.org was so signi�cant that in order to avoid controversy, Times of India (a leading news provider), Flipkart.com (a dominant Internet retailer, the Amazon.com of India) and others pulled out of the Internet.org platform in the period leading up to TRAI’s deadline for public input.
It is unclear how TRAI analyzed all the responses it received, but in December 2015, TRAI issued a temporary ban on Internet.org by asking Airtel to stop offering the program. It then issued another call for public comment, this time speci�cally about differential pricing, titled Consultation Paper on Differential Pricing for Data Services (TRAI 2015b). This time around, Facebook mounted its own campaign, and urged Facebook users to write to the regulator. According to TRAI, within the �rst three weeks, over two million responses were received, with more than 500,000 coming from the @facebook.com domain and one million coming from the @supportfreebasics.in domain (ibid.).
By February 2016, TRAI came out on the side of net neutrality by banning all differentially priced data (TRAI 2016a), thereby addressing the price discrimination but not the other forms of discrimination (for example, non-price discrimination methods related to traf�c blocking, throttling or quality of service). Facebook retreated, admitting defeat (see Bhatia [2016] for a summary of what happened inside Facebook during this campaign).
Yet it seems the matter doesn’t end there. In May 2016, TRAI called for another round of public comments through its Consultation Paper on Free Data (TRAI 2016b). This time, TRAI acknowledges both the possible positive effects of zero-rating, in getting people online, as well as the negative effects on net neutrality, and aims to “explore model(s) that could achieve the bene�ts of offering free data while avoiding the ingenuity that the Differential Tariff Regulation is meant to prevent. The model should facilitate the un-connected and under-connected consumer to become better connected and should not allow any TSP [telecom service provider] or large company playing a gatekeeper or biased role” (ibid., 4).
As of December 2016, activists claimed that a new (and �nal?) ruling was imminent.

RESEARCH VOLUME SIX: THE SHIFTING GEOPOLITICS OF INTERNET ACCESS
96 • CENTRE FOR INTERNATIONAL GOVERNANCE INNOVATION • CHATHAM HOUSE
These data points show that there is some “on-ramp to the Internet” effect. But in this study too, what the users did when they started paying for the “full Internet” is unknown. If users continue to use only Facebook even after paying, many would argue they aren’t on the “real” Internet. But then what is the “real” Internet? Instead of searching inside Facebook, people might be using Google or another search engine to search and then be clicking through to one of the links. Could that be considered using the “open” Internet, or is it just what the search engine algorithm put on the �rst page? And if so, can we say the users aren’t being nudged to particular content? Clearly there is a continuum of moving toward using the “open” Internet, and more research is needed to better understand it.
Facebook: The Poor People’s Internet?
One of the biggest threats pointed out by net neutrality advocates is that people who get online for the �rst time using Free Basics or Facebook Flex will simply assume that the whole Internet is Facebook, and never bene�t from the vast trove of content (and knowledge) beyond it on the Internet. The author’s own research from 2012 (cited in Mirani 2015), which observed respondents in Indonesia using Facebook on their phones, even though when surveyed they had said “I do not use the Internet” — has been used by some to highlight this threat. The author’s research was done before zero-rated packages were introduced in the countries she was researching, so that the relationship she observed between users’ misperception of Facebook as not “the Internet” and their never venturing beyond Facebook was not a phenomenon related to zero-rating. Since that research, there is suf�cient evidence7 to show that there are more Facebook users than Internet users in several East Asian countries, including Myanmar, Indonesia, Philippines and Thailand. However, this is not proof that people aren’t leaving the walled garden of Facebook and going outside, since these numbers do not show what people do outside Facebook, or whether they go outside Facebook in the �rst place.
As described in the previous section, the research by A4AI (2016) showed that 28 percent of users of zero-rated services went on to become paying customers of the full Internet and no longer used the zero-rated services; another 35 percent continued to use the zero-rated services but also acquired a paid-data subscription to the full Internet. Again, just paying for a data package does not indicate whether the customers wanted to access any content outside Facebook, or whether they wanted the video- and photo-�lled version of Facebook (instead of the text-only version that was zero-rated).
7 Based on the International Telecommunication Union’s “Internet users” individual country estimates and Facebook subscriber data and assuming that the users have identi�ed their home countries truthfully on their Facebook pro�les (see Galpaya 2015, 17).
Recent research from Myanmar (Cihon and Galpaya, forthcoming 2017) showed that a majority of the users that participated in the focus groups did primarily use Facebook when they consumed zero-rated data services, even though other content was also zero-rated. When asked if they searched for information, they responded that they do — but for many, this was a search on Facebook/Facebook Flex. Although there is other content besides Facebook offered for free on Free Basics, many were hard-pressed to identify or recognize the names of any of the other content, apart from one local news site. And those who did increase their daily data limit by paying for data also appeared to stay inside Facebook: the primary reason they bought more data was to be able to browse photos and watch videos on their Facebook feed. In Myanmar zero-rating implementations, users staying inside Facebook or Facebook Flex without venturing outside are a real and observable phenomenon.
But the bigger question is why this matters. Underlying the worry of many advocates is an assumption that being on Facebook (or some other popular zero-rated app) is somehow a frivolous activity, and that those people for whom the Internet is a precious commodity (that is, the “poor”) should be consuming “useful” content on the Internet (instead of funny cat videos, as the joke goes). There is no small amount of hypocrisy in this line of thinking — after all, one might ask how many rich people, especially youth, spend their online time on social media and never leave those apps to explore the “full” Internet? Yet when the poor (who deserve subsidies) do the same, many observers have a problem with it.
Equally relevant is the misunderstanding of the range of content people consume on or via social media platforms and the value of it to those users. In Myanmar, in the absence of anything else digital, whole political campaigns leading to the November 2015 parliamentary elections were conducted on Facebook (Regencia 2015). LIRNEasia’s �eld research in South and South East Asia (including Myanmar) found micro-entrepreneurs using Facebook as a learning platform to improve income — for example, hairdressers at the lower end of the socio-economic spectrum were looking at pictures of celebrity hairstyles on Facebook and offering to recreate the same for their clients. The author has colleagues who were unable to book a local tour bus in Myanmar via the bus company’s website but could transact all but the actual payment — for example, consulting schedules and negotiating the speci�c bus to take when they contacted the same bus company’s Facebook page, and exchanged messages with it via Facebook.
Finally, evidence from Africa shows that social media has been used as a means to contact, keep in touch and coordinate with friends, family and business partners (Stork, Calandro and Gillwald 2013). Consumers have used it as a substitute for the much more expensive voice
CHAPTER SIX: ZERO-RATING IN EMERGING ECONOMIES
HELANI GALPAYA • 97
or Short Message Service (SMS) products, thereby saving money and creating value to the user. The research from Myanmar agrees — zero-rated Facebook Flex and Facebook Messenger have become primary ways of communicating (Cihon and Galpaya, forthcoming 2017), and are replacing SMS and voice (Galpaya et al. 2016, 101). Unless SMS and voice prices fall signi�cantly, banning zero-rating would harm many consumers �nancially.
Clearly, those people with more education and wealth have an advantage in using the Internet. They know how to do research online and how to acquire new knowledge. They have credit cards that can be used for online payments in electronic commerce transactions, which in turn helps them save money by buying from a global market and provides them with other advantages. The capacities of the poor need to be enhanced in order for them to bene�t from digital technologies. Prices need to be lowered through the elimination of market power so that services are affordable to the poor. Without doing these things �rst, banning zero-rated services immediately might not help bridge the access gap.
Zero-rating Creates Fast and Slow Lanes on the Internet
The economic incentives for discriminatory treatment of content were discussed in detail in a previous section, viewed through three separate scenarios. Irrespective of the level of competition in the market (that is, in all scenarios discussed), the regulatory action must mandate making traf�c management practices transparent. Furthermore, the regulator must monitor data quality indicators by content type, and take action against those that discriminate against types of classes of content. In other situations (Scenarios 1, 2), additional measures such as banning exclusive contracts will be necessary if the operator has market power.
The level of competition in most South Asian retail MNO markets is suited for this type of minimal intervention, since it is not unusual to have six or even eight operators competing �ercely for market share. As Scenario 2 showed, in such a situation there is less concern about market distortions. And equally importantly, in many instances, the zero-rating is done by a non-dominant operator, as a strategy to gain market share. Therefore, a zero-rating strategy may actually reduce the market dominance of one operator, thereby making the overall market less concentrated.
A Marketing and Business Strategy for MNOs or OTTs
Many have questioned Facebook’s stated intents of giving Facebook and Free Basics away in order to “connect the world.” But this questioning, in some ways, misses the point. The point is that whoever is spending money on
zero-rated offerings (Facebook, other content providers and MNOs) is doing so with private sector capital — the type of capital that demands a return on investment. If the zero-rating program is not returning the kind of conversion rates (that is, if not enough consumers convert to paying consumers, or not enough new users are attracted to the network), it is highly unlikely the MNO will continue the program in the long term.
Highly competitive markets such as those in many South Asian countries have built-in checks and balances against such indulgences. As a prominent Indian journalist wrote at the height of India’s net neutrality debate last year,“the very strength of the parallel Internet for the poor is that it is corporate strategy. Mark Zuckerberg has tried his best to give it a humanitarian spin, which may not be wholly a lie, but I do hope the venture is not purely altruistic” (Joseph 2015).
Some Countries Banning Zero-rating
It is true that some countries have banned zero-rated services. It is also true that much of the anti-zero-rating battle started in developed countries, such as the United States, well before it percolated to developing countries. One of the earliest cases was MetroPCS, a very small MNO in the United States (with around three percent market share) that primarily sold prepaid connection (that is, served the poor) and was struggling to compete with the big, nationwide telecom companies. It struck a deal, where for a US$40 �at fee, customers received unlimited YouTube bundled with voice, SMS or data services or some combination. Additional bundles for other speci�c content were available on top. The service was technologically innovative in that it delivered video ef�ciently over a low-bandwidth network. Net neutrality advocates pointed out that the offerings were in violation of the newly drafted net neutrality rules from the Federal Communication Commission (FCC) (Free Press 2011; FCC 2010). MetroPCS could not survive the �nancial fallout and abandoned the program (Szoka 2015). The company was soon sold out to the fourth largest operator, T-Mobile (Skorup 2014). How the exit of a small competitor with no market power could possibly make the overall market (or consumers) better off is as unclear as how the company’s actions constituted a violation of the FCC’s rules — which in any case were later challenged in courts by the very big MNOs.
Even more famous was the case of Comcast and Net�ix, which has been much discussed, and was beautifully written up by Susan Crawford (2014), among others. But the Comcast/Net�ix battle took place in a market of low competition, in which Comcast had a regional monopoly on cable TV subscriptions and at most one other �xed substitute (in the form of ADSL data connectivity) and some distant mobile substitutes.
RESEARCH VOLUME SIX: THE SHIFTING GEOPOLITICS OF INTERNET ACCESS
98 • CENTRE FOR INTERNATIONAL GOVERNANCE INNOVATION • CHATHAM HOUSE
But in all these cases, it is important to understand how radically different the context in the developed world is from that of the developing countries. The level of connectivity is far higher, the problems of affordability are far lower, and bandwidth is much less constrained in the United States and other developed countries, in comparison to those in the Global South. Equally important, the level of competition in the United States is lower than in many of the East African and South Asian countries. Therefore, regulation warranted in one market cannot be applied to another market that is vastly different. While some regulatory action to outright ban zero-rating is justi�ed, other actions are not, especially if the market conditions are taken into account. India, a highly competitive market of MNOs, banned subsidized data — even though a much more nuanced approach might have suf�ced — tallowing the positive effects of zero-rating (that is, getting people online for the �rst time) to take place while also mitigating harms.
Gatekeepers Harm Freedom of Expression
In the initial incarnation of Free Basics (then called Internet.org), it was not possible to get on the platform without having a partnership with Facebook. It was unclear how Facebook decided which handful of apps it selected in each country to put inside Free Basics. In this instance, Facebook acting as gatekeeper for content was indeed a problem. After receiving very heavy criticism from activists, Facebook changed the policy, so that any content that met the basic technical requirements (that is, accessible on a basic feature phone, not just a smartphone) could get on Free Basics.
But, moving from the speci�c criticism about Facebook, the general criticism fails to take into account that in the market in question, as long as there is competition, all parties bene�t from economies of both scale (having more users) and scope (having a range of content). It is a two-sided market, with one side in�uencing the other. The actors, therefore, have economic incentive to be as diverse as possible in their content offerings, in order to attract the widest number of users (content markets have long-tail characteristics). As such, the purely theoretical argument of gatekeeping is countered with economic incentives.
Further, there is a group of users who are able to be online (even if only on Facebook) thanks to zero-rating. If it were banned, they might not be online at all — not to communicate, not to obtain news and information. As Eisenach (2015) states, “it is dif�cult to construct a scenario under which increasing access to online information and adoption of digital communications services would be harmful to online speech.”
REGULATORY RESPONSES
What Is the Appropriate Response?
As shown previously, the risk of discriminatory or anticompetitive behaviour by the actors involved in an Internet value chain that offers zero-rated content depends on the level of competition at various points in the value chain, and whether or not the actors have market power.
There is no concrete data about the prevalence of the scenarios (described earlier) across various countries. The zero-rated Free Basics plan in India that generated such huge controversy was offered by the country’s third- or fourth-largest MNO, Reliance. In Ghana, South Africa and Kenya, the MNOs that offer Free Basics (Airtel, Cell C, Airtel, respectively) are all non-dominant operators. And each is using zero-rated offers to compete with much larger operators with larger market share (and in some cases, signi�cant market power). In South Africa, Cell C’s zero-rated WhatsApp offer was hugely popular, with one million Cell C consumers using it over a seven-day period in July 2015. Cell C then converted this zero-rated offer to a service-speci�c top-up where the user paid for unlimited use of WhatsApp monthly (Gillwald et al. 2016). In Pakistan and Myanmar, too, it is offered by the operators that have second- or third-highest market share, not the dominant operator. In many markets, zero-rating is a pro-competitive strategy, used by smaller operators. In other words, the negative outcomes (to competition, service quality, innovation) identi�ed in Scenario 1 are not an immediate threat in such situations.
Of course, it is possible that in other markets zero-rated content, especially Free Basics, might be offered by the dominant operator. If this is the case, the regulator might have a range of reactions: at the strictest end, it could enforce an outright ban on any zero-rating by an MNO with signi�cant market power; or it could take other, lighter actions such as monitoring (and banning) some of the negative consequences. For example, in Scenario 1, where the MNO might have incentives to downgrade non-zero-rated traf�c, a regulator could have ex ante rules or regulations that mandate:
• advertising of minimum speeds by MNOs;
• a ban on speeds falling below this limit; and
• a ban on traf�c management that discriminates against speci�c content or classes of content.
Because the MNO in this scenario has market power, it is necessary to ban not only negative discrimination (that is, the downgrading of the non-zero-rated content) but also positive discrimination (where the MNO meets the minimum speed for all content but provides higher-than-advertised speeds for its zero-rated content). How could
CHAPTER SIX: ZERO-RATING IN EMERGING ECONOMIES
HELANI GALPAYA • 99
these bans be implemented? One idea is that users, if they had tools for monitoring the speeds they get, could report problems to the regulator (be it the competition regulator or the telecom regulator, depending on the context and country). But in practice this method is often insuf�cient, because it puts the onus of detecting ISPs’ problematic traf�c management practices on the user. The better approach would be for the regulator to monitor promised versus delivered quality of service for various applications and content. The regulator could then take action when violations (discriminatory traf�c management) were seen, ex post. Similarly, ex ante rules would be required regarding exclusive contracts, which might otherwise lead to arrangements between the walled garden and a particular application banning competing applications.
In Scenario 2, where the zero-rated content is dominated by a content provider that has market power, the incentives are similar. Therefore, the minimal regulatory response is the same as Scenario 1: ex ante banning of negative/positive traf�c management and other anticompetitive behaviour (such as exclusive contracts that discriminate against similar apps), monitoring of speeds and service quality parameters, ex post imposition of penalties in the case of violations and so on.
In Scenario 3, where there is competition in the market, less onerous regulatory action might be considered. Ex ante rules need to:
• mandate publishing of minimal data-quality standard (for example, minimum speeds) by MNOs; and
• mandate a ban on negative discrimination of any content or any class of content.
Some have argued that positive discrimination (where the MNO can give faster-than-promised speeds to zero-rated content, as long as all other content receives at least the minimal promised speeds) should be allowed (for example, Marda, Tiwari and Prakash 2015). In any case, as long as traf�c management patterns are made public, and the regulator monitors actual performance speeds (and other data-quality measures), consumers can switch between MNOs. A very competitive market provides incentives for walled gardens (by MNOs or OTTs) to differentiate themselves, while still leaving consumers with suf�cient choice and diversity of content.
What Is Possible in Emerging Economies?
The above-mentioned regulatory responses require some ex ante rules but also depend on ex post detection and action. To detect and act, regulators must be able to monitor the market, interpret data and patterns, analyze the trends and come to decisions based on the principles of economics, competition and regulation. In other words, they must have the ability to engage in some level of
principle-based regulation as opposed to rule-based regulation. On the one hand, rule-based decision making would mean simply taking an existing rule — for example, “zero-rating is banned under all conditions, and a �ne of X is imposed if an MNO is found in violation” — and applying it uniformly in all situations. On the other hand, principle-based regulation might lay out overall objectives of the regulation — such as to promote diversity of content, increase competition, disable anticompetitive behaviours — but let the speci�c details be determined on a case-by-case basis. This latter approach allows for discrimination by the regulators and more nuance and �ne-tuning of regulation, which might be desirable, given that regulation often is a blunt tool to begin with. But in countries with low institutional capacity, rule-based regulation is a lot easier to implement, since there is no discretion left to the regulators. In dealing with the challenges of new market developments, of which zero-rating is just one example, regulatory capacity is essential.
However, in emerging economies, regulators do need to balance the challenge of connectivity with all other concerns, including that of ensuring net neutrality. In fact, connectivity (getting citizens online) is a primary challenge. Given that there is evidence that zero-rated content helps users to stay connected, and even to get onto the full and open Internet for the �rst time, regulators could take an approach that enables them to both encourage these positive bene�ts and avoid the negative ones (or to be ready to act, when negative effects are observed).
Making Zero-rating More Palatable
Connecting people to the Internet has been, and will continue to be, a primary goal of policy makers and regulators in the developing countries. Yet, unless regulators are capable of monitoring evolving market conditions and taking the right action, allowing zero-rating as a way (albeit temporary) of giving people some form of affordable Internet access can be the start of a slippery slope that leads to market distortion, lack of content diversity and innovation harms. It thus requires regulatory capacity at a level that might not always be available in emerging economies.
In this context, it is worth exploring models of zero-rating that might be more likely to ensure net neutrality, easier to enforce and monitor for the regulator, and have lower potential for future harms while also helping achieve connectivity for the poor. Some models are already being trialled. Other ideas are being debated, for example:
• Time limit zero-rating offers: Under certain conditions, zero-rating partnerships between MNOs and content providers provide incentives to drive the competition out of the market through the signing of exclusive deals, downgrading of competitor content and so on. To avoid this, regulators could allow zero-
RESEARCH VOLUME SIX: THE SHIFTING GEOPOLITICS OF INTERNET ACCESS
100 • CENTRE FOR INTERNATIONAL GOVERNANCE INNOVATION • CHATHAM HOUSE
rating programs only on a time-limited basis (that is, a promotional basis). At the end of the period, the user would have to sign up for normal data or stop using the zero-rating package. The regulators might relax this condition (or allow longer promotional periods) for non-dominant (that is, smaller) MNOs with zero-rating programs. It is possible that users might “game” the system by constantly changing their SIM cards, each time obtaining a new promotional period. Therefore, this type of solution would have to be tied to the user’s identity, not to the SIM, which suggests it would only work in markets with relatively strong SIM registration procedures (where an MNO could identify unique users and all their SIM cards separately).
• Zero-rate 2G (or “low bit rate, generic zero-rating”): Steve Song (2015) proposes that Internet data be enabled, by default, for free, for all users, at the Global System for Mobile Communications standard 2G speeds of 9.6 kilobits per second. Doing so would not only give “something” to people who have no data connectivity but also spur innovation in delivering content and services over very low bandwidth. Song points out that T-Mobile already enables free 2G roaming for prepaid users. Therefore, as a social good, it is not unthinkable to do this for all users. The bandwidth demands would not spoil the experience for others who are willing to pay. Net neutrality concerns are avoided because users are not restricted to accessing only pre-speci�ed data for free.
• “One-click-away zero-rating”: This idea is aimed at addressing the supposed danger of users staying inside the walled garden and never consuming any content outside.8 In order to avoid this, it is suggested that any zero-rated application should also enable free access to the �rst link/URL the user clicks through to, outside of that application. That is, a user clicking on a news article that shows up on the Facebook Flex news feed should be able to click on it, go outside Facebook and read it for free; following any link from that point onward would require payment. At least, this idea could be implemented for content that requires less bandwidth (for example, text such as news articles), although perhaps not for pictures or videos.
• Equal rating: This idea refers to giving users a limited amount of data to consume (without restricting the type of data or websites the free content could count toward), in return for doing something — such as watching a speci�c number of minutes of advertisements on the mobile phone. This approach
8 The author �rst heard this idea discussed by Sunil Abraham of the Center for Internet Society (India) at the Internet Governance Forum in Istanbul in 2014.
is already being trialled in some African countries (by Mozilla and Orange) and in Bangladesh. In this trial, a speci�c (capped) amount of data is provided free to the users when they purchase a particular model of a cellular phone. These types of programs enable access to the “full Internet” on a limited basis, and also provide a subsidy (for those willing to watch ads, for example), and therefore should address most of the concerns of net neutrality advocates.
CONCLUSIONThe debate around zero-rating is intrinsically linked to the topic of net neutrality. Accordingly, it brings together issues of economic competition (what market practices should be allowed/banned), social equity (can the unconnected get online due to zero-rated services?) and rights (do the poor have the right to the full Internet or parts of it?). These are not simple matters to reconcile because the solution differs based on each individual society’s priorities.
However, given that no one really seems to know conclusively what the good or bad effects of zero-rating are (although it is possible to see what they could be), one has to take an options-theory approach to regulation and policy making. Is it possible for policy makers and regulators to take action to eliminate the worst known harms, but to be cautious and on the lookout for minor or unknown harms that might emerge, while also allowing some of the positive impacts to happen? Then, when negative effects are observed, is it possible to again take action? The answer is yes — certainly for a competent regulator. This chapter proposes scenarios in which the minimal regulatory actions allow for the market to develop and create social welfare while regulators observe and take action if harms do occur. In emerging economies struggling with issues of Internet price, relevance and content, such an approach trying to merge social equity concerns with economic and market realities might be called for.
Zero-rating is an imperfect solution to solve a problem created through policy and regulatory failure. But recognizing this does not mean that regulators, policy makers and other stakeholders can or should be allowed to stop striving for connectivity to the open/full Internet for their people through other means — by enabling high levels of competition (thereby driving down price, differentiating quality of service); increasing locally relevant content and services; and solving the barriers to getting people online.
CHAPTER SIX: ZERO-RATING IN EMERGING ECONOMIES
HELANI GALPAYA • 101
WORKS CITEDA4AI. 2015. “Models of Mobile Data Services in Developing
Countries.” The Impacts of Emerging Mobile Data Services in Developing Countries Series, Research Brief No. 1, November. Washington, DC: A4AI. http://a4ai.org/wp-content/uploads/2015/11/MeasuringImpactsofMobileDataServices_ResearchBrief1.pdf.
———. 2016. “Mobile Data Services: Exploring User Experiences and Perceived Bene�ts.” The Impacts of Emerging Mobile Data Services in Developing Countries, Research Brief No. 2, June. Washington, DC: A4AI. http://a4ai.org/wp-content/uploads/2016/05/MeasuringImpactsofMobileDataServices_ResearchBrief2.pdf.
Beck, Kellen. 2016. “Snapchat is now the most popular social network among teens, according to new study.” Mashable UK, April 14. http://mashable.com/2016/04/14/snapchat-teens-winner/#fe68Vb316iqm.
Bhatia, R. 2016. “The inside story of Facebook’s biggest setback.” The Guardian, May 12. www.theguardian.com/technology/2016/may/12/facebook-free-basics-india-zuckerberg.
Cihon, P. and H. Galpaya. Forthcoming 2017. “Navigating the Walled Garden: Free and Subsidised Data Use in Myanmar.” LIRNEasia.
Crawford, Susan. 2014. “The Cliff and the Slope.” Backchannel, October 30. https://backchannel.com/jammed-e474fc4925e4#.drplvbqmv.
Eisenach, Jeffrey A. 2015. “The Economics of Zero Rating.” NERA Economic Consulting, March. www.nera.com/content/dam/nera/publications/2015/EconomicsofZeroRating.pdf.
FCC. 2010. In the Matter of Preserving the Open Internet; Broadband Industry Practices, GN Docket No. 09-191 (Preserving the Open Internet), WC Docket No. 07-52, FCC 10-201 (Broadband Industry Practices). Retrieved from Association of Research Libraries: www.arl.org/storage/documents/publications/oic-nn-comments_�nal.pdf.
Free Press. 2011. M. Chris Riley to Chairman Julius Genachowski, FCC, re: Notice of Ex Parte Presentation: GN Docket No. 09-191 (Preserving the Open Internet); WC Docket No. 07-52 (Broadband Industry Practices), January 10. www.freepress.net/sites/default/�les/resources/MetroPCS_Letter_1_10_11.pdf.
Galpaya, H. 2015. “Reducing inequalities to universal & affordable access to ICTs.” Presentation, UN-DESA/International Telecommunication Union Expert Group Meeting on Advancing a Sustainable Information Society for All, New York, June 8-9. http://lirneasia.net/wp-content/uploads/2015/06/2015-05-UNDESA-Galpaya-FINAL.pdf.
Galpaya, H., A. Zainudeen, S. Perumpalam, G. Hurulle, H. Aung and P. Thi. 2016. “Mobile phones, internet, information, knowledge: Myanmar in 2016.” Presentation slides. http://lirneasia.net/2017/01/ict-use-in-myanmar-2016-survey-results-present-to-deputy-minister/.
Gillwald, A., C. Chair, A. Futter, K. Koranteng, F. Odufuwa and J. Walubengo. 2016. Much Ado About Nothing? Zero-Rating in the African Context. Research ICT Africa, September 12. www.researchictafrica.net/publications/Other_publications/2016_RIA_Zero-Rating_Policy_Paper_-_Much_ado_about_nothing.pdf.
GSR. 2012. Net neutrality: A regulatory perspective. Discussion paper. International Telecommunication Union.www.ictregulationtoolkit.org/en/toolkit/docs/Document/4029.
Internet.org. 2015. “Free Basics: Myths and Facts.” Internet.org (blog), November 19. https://info.internet.org/en/blog/2015/11/19/internet-org-myths-and-facts/.
Joseph, M. 2015. “Net neutrality debate: it’s Facebook vs the internet mullahs.” Hindustan Times, October 5. www.hindustantimes.com/columns/net-neutrality-war-is-not-just-facebook-versus-internet-mullahs/story-s9eZpZnomaaiz4De8fYfaK.html.
Kak, Amba. 2015. “The Internet Unbundled: Locating the user’s voice in the debate on zero-rating.” M.Sc. dissertation, University of Oxford, August. www.cprsouth.org/wp-content/uploads/2015/08/Amba-thesis-complete.pdf.
Marda, V., U. Tiwari, and P. Prakash. 2015. Counter-comments by the Centre for Internet and Society to TRAI Consultation on Regulatory Framework for Over-the-top (OTT) Services. www.trai.gov.in/Comments/cc/Pranesh-Prakash.pdf.
Mirani, Leo. 2015. “Millions of Facebook users have no idea they’re using the internet.” Quartz, February 9. http://qz.com/333313/milliions-of-facebook-users-have-no-idea-theyre-using-the-internet/.
Misra, Vishal. 2015. “Half the equation and half the de�nition.” Peer Unreviewed (blog), December 29. http://peerunreviewed.blogspot.co.uk/2015/12/what-is-de�nition-of-net-neutrality.html.
Ofcom. 2010. Traf�c Management and ‘Net Neutrality’: A Discussion Document. Ofcom, June 24. http://stakeholders.ofcom.org.uk/binaries/consultations/net-neutrality/summary/netneutrality.pdf.
Regencia, T. 2015. “In Myanmar campaign, face-to-face still beats Facebook.” Aljazeera, November 6. www.aljazeera.com/news/2015/10/myanmar-election-campaign-151029114144682.html.

RESEARCH VOLUME SIX: THE SHIFTING GEOPOLITICS OF INTERNET ACCESS
102 • CENTRE FOR INTERNATIONAL GOVERNANCE INNOVATION • CHATHAM HOUSE
ABOUT THE AUTHORHelani Galpaya is CEO of LIRNEasia, a pro-poor, pro-market think tank working across the emerging Asia-Paci�c on infrastructure policy and regulatory issues.
Helani researches, does consulting work and engages in public discourse on issues related to policy and regulatory barriers in Internet access, net neutrality, impact of information communication technologies (ICTs), e-government, broadband quality of service, how the Internet impacts the way people work and how information disseminated via ICTs can improve inclusion of small, medium and micro enterprises in global agriculture value chains.
Sen, Rijurekha, Hasnain Ali Pirzada, Amreesh Phokeer, Zaid Ahmed Farooq, Satadal Sengupta, David Choffnes and Krishna P. Gummadi. 2016. “On the Free Bridge Across the Digital Divide: Assessing the Quality of Facebook’s Free Basic Service.” Proceedings of the 2016 ACM on Internet Measurement Conference. Santa Monica, November 14–16.
Skorup, B. 2014. “If You’re Reliant On the Internet, You Loathe Net Neutrality.” Real Clear Markets, February 12. www.realclearmarkets.com/articles/2014/02/12/if_youre_reliant_on_the_internet_you_loathe_net_neutrality_100893.html.
Song, S. 2015. “Zero-Rating: A Modest Proposal.” Many Possibilities (blog), November 25. https://manypossibilities.net/2015/11/zero-rating-a-modest-proposal/.
Statista. 2016. “Number of monthly active Facebook users worldwide as of 3rd quarter 2016 (in millions).” The Statistical Portal. www.statista.com/statistics/264810/number-of-monthly-active-facebook-users-worldwide/.
Stork, C., E. Calandro and A. Gillwald. 2013. “Internet going mobile: Internet access and use in 11 African countries.” Info 15 (5): 34–51.
Szoka, B. 2015. “Net Neutrality Absolutism Hampers Efforts to Connect the Developing World.” Tech Freedom media statement, April 15. http://techfreedom.org/post/116507428524/net-neutrality-absolutism-hampers-efforts-to.
TRAI. 2015a. Consultation Paper on Regulatory Framework for Over-the-top (OTT) Services. Consultation Paper No. 2/2015. New Delhi, India: TRAI. www.trai.gov.in/sites/default/�les/OTT-CP-27032015.pdf.
———. 2015b. Consultation Paper on Differential Pricing for Data Services. Consultation Paper No. 8/2015. New Delhi, India: TRAI. www.trai.gov.in/consultation-paper-differential-pricing-data-services.
———. 2016a. “Prohibition of Discriminatory Tariffs for Data Services Regulation, 2016 (No. 2 of 2016).” TRAI noti�cation, February 8. www.trai.gov.in/sites/default/�les/Regulation_Data_Service.pdf.
———. 2016b. Consultation Paper on Free Data. Consultation Paper No. 7/2016. New Delhi, India: TRAI. www.trai.gov.in/consultation-paper-free-data.
Viecens, M. F. and F. Callorda. 2016. The Digital Divide in Latin America: Broadband Price, Quality and Affordability in the Region. Lima, Peru: Regional Dialogue on the Information Society. http://dirsi.net/web/web/es/publicaciones/detalle/the-digital-divide-in-latin-america--broadband-price--quality-and-affordability-in-the-region.
Wu, Tim. 2003. Network Neutrality, Broadband Discrimination. Journal of Telecommunications and High Technology Law 2 (1): 141–76. www.jthtl.org/content/articles/V2I1/JTHTLv2i1_Wu.PDF.
CHAPTER SEVEN: TIPPING THE SCALE: AN ANALYSIS OF GLOBAL SWING STATES IN THE INTERNET GOVERNANCE DEBATE
TIM MAURER AND ROBERT MORGUS • 103
CHAPTER SEVEN:TIPPING THE SCALE: AN ANALYSIS OF GLOBAL
SWING STATES IN THE INTERNET GOVERNANCE DEBATE
Tim Maurer and Robert Morgus
Copyright © 2014 by the Centre for International Governance Innovation and the Royal Institute of International Affairs
RESEARCH VOLUME SIX: THE SHIFTING GEOPOLITICS OF INTERNET ACCESS
104 • CENTRE FOR INTERNATIONAL GOVERNANCE INNOVATION • CHATHAM HOUSE
ACRONYMSBTI Bertelsmann Stiftung’s Transformation Index
CSO civil society organization
EU European Union
FOC Freedom Online Coalition
HDI human development index
IBSA India, Brazil and South Africa
ICT information and communications technology
ITRs International Telecommunications Regulations
ITU International Telecommunication Union
LDCs least developed countries
OECD Organisation for Economic Co-operation and Development
UN United Nations
UN GGEs UN Group of Governmental Experts
WCIT World Conference on International Telecommunications
WEF World Economic Forum
WSIS+10 World Summit on the Information Society
RISING TO HIGH POLITICS: THE INTERNET GOVERNANCE DEBATENumerous news outlets reported on the debate over Internet governance that took place at the World Conference on International Telecommunications (WCIT) in Dubai in December 2012. It was the �rst time in nearly a decade that the topic attracted major international media attention. States convened to renegotiate the 1988 treaty governing international telecommunications, but the conference ended in a diplomatic éclat with 89 states signing the new International Telecommunications Regulations (ITRs) and 55 publicly opposing them (see Annex II).1
Usually states operate by consensus in this policy area, without formal votes, negotiating language until it is acceptable to all actors involved. At the WCIT, however, the deliberations took an unexpected turn. The main issue — to what extent the Internet would be part of the new agreement — remained unresolved until the end of the
1 For more details see Maurer (2012).
conference, when, long after midnight on the second-to-last day, the chairman suddenly asked for a “feel in the room,” and member states used their name plates to show their agreement or not. Whether the chairman’s action counted as a vote was hotly disputed and a point of contention on the �nal day of the conference. Ultimately, the differences could not be bridged and the conference ended with the international community split and in open discord.
As Internet governance continues to rise from low to high politics, the stakes will increase and similar tensions and disagreements will become more likely. According to Mark Raymond and Gordon Smith (2013), the WCIT “con�rmed the existence of complex fault lines in the international community. A broad coalition led by Russia and China engineered the adoption of updated ITRs as well as International Telecommunication Union (ITU) resolutions af�rming an expanded state role in Internet governance, and empowering the ITU to further debate and discuss Internet issues.”
This debate will continue in the near future with major events already scheduled. The ITU’s plenipotentiary and the selection of a new ITU Secretary-General will take place from October 20 to November 7, 2014, and the review of the World Summit on the Information Society (WSIS+10) will culminate in 2015. The WCIT demonstrated considerable state support for two different visions for Internet governance: on the one hand, a bottom-up model driven by various stakeholders including civil society, private companies and governments; and on the other, a top-down model driven primarily by governments and with central role for the ITU. The role of non-governmental actors in Internet governance is therefore reminiscent of many similar debates in other policy areas and the push for non-governmental actors to have a greater role in global governance generally.
A key aspect of the post-WCIT discussion has centred on the role of “swing states” in this global debate (Ebert and Maurer 2013; Clemente 2013). So far, most of this work has been based on prede�ned groups of countries such as India, Brazil and South Africa (the “IBSA” group) or focused on countries based on anecdotal evidence of a vibrant tech community or existing relationships, for example, Kenya or Ghana (Kleinwächter 2013). This study applies a more systematic approach using the voting record at the WCIT. This type of data is rare in this �eld. The WCIT offered a unique glimpse at countries’ positions and revealed some interesting patterns among certain groups of states. Based on this analysis, the chapter identi�es a core group of potential swing states, providing a road map for future research and a list that can be compared to current and future efforts and priorities (see Table 1).

CHAPTER SEVEN: TIPPING THE SCALE: AN ANALYSIS OF GLOBAL SWING STATES IN THE INTERNET GOVERNANCE DEBATE
TIM MAURER AND ROBERT MORGUS • 105
TIPPING THE SCALE: INTERNET GOVERNANCE AND GLOBAL SWING STATESThe research on swing states in the Internet governance debate builds on previous work on global swing states in the changing international system more broadly. According to Daniel Kliman and Richard Fontaine (2012):
In the American political context, swing states are those whose mixed political orientation gives them a greater impact than their population or economic output might warrant. Such states promise the greatest return on investment for U.S. presidential campaigns deciding where to allocate scarce time and resources. Likewise, in U.S. foreign policy, a focus on Brazil, India, Indonesia and Turkey can deliver a large geopolitical payoff, because their approach to the international order is more �uid and open than those of China or Russia. In addition, the choices that these four countries make — about whether to take on new global responsibilities, free ride on the efforts of established powers or complicate the solving of key challenges — may, together, decisively in�uence the trajectory of the current international order. The concept of global swing states offers a new framework for thinking about these four powers. It describes their position in the international system; however, it does not suggest an emerging bloc.
We adopt this conceptualization of swing states for this chapter but move beyond a prede�ned small group of countries and examine a large group of countries using a range of indicators to identify a subset of potential swing states. Our de�nition also builds on Kliman and Fontaine but generalizes the terminology, especially by including capacity — “who have the resources to” — as a necessary condition for a swing state to be able to wield in�uence.
Table 1: Top 30 Swing States
Albania Malaysia
Argentina Mexico
Armenia Moldova
Belarus* Mongolia
Botswana Namibia
Brazil Panama
Colombia Peru
Costa Rica Philippines
Dominican Republic Serbia
Georgia Singapore
Ghana South Africa
India South Korea
Indonesia Tunisia
Jamaica Turkey
Kenya Uruguay
* Belarus is an outlier in this list as further explained below.
We therefore de�ne a swing state in foreign policy as a state whose mixed political orientation gives it a greater impact than its population or economic output might warrant and that has the resources that enable it to decisively in�uence the trajectory of an international process. The analysis explained in further detail below suggests the following group of top 30 global swing states (see Table 1). It essentially marries the voting record on the ITRs with a series of other indicators to identify patterns and the group of countries likely to act as swing states in the global Internet governance debate in the future due to path dependence, logic of appropriate behaviour and state interests.
This study focuses on the 193 member states of the United Nations (UN) whose status allows them to vote in the General Assembly and in conferences hosted by organizations that belong to the UN system such as the ITU (as long as their memberships overlap).2 This status also includes the power to enter into international agreements that are considered binding under international law. The following section outlines the process used to narrow the list of potential swing states (see Annex I for a colour-coded graphic display).
2 The ITU predates the creation of the United Nations and became part of the UN system as a specialized agency of the UN system as outlined in articles 57 and 63 of the UN Charter. The main forum for the coordination of the UN system is the UN System Chief Executives Board for Coordination chaired by the UN Secretary-General and consisting of the heads of the various UN agencies. See http://unsceb.org/.
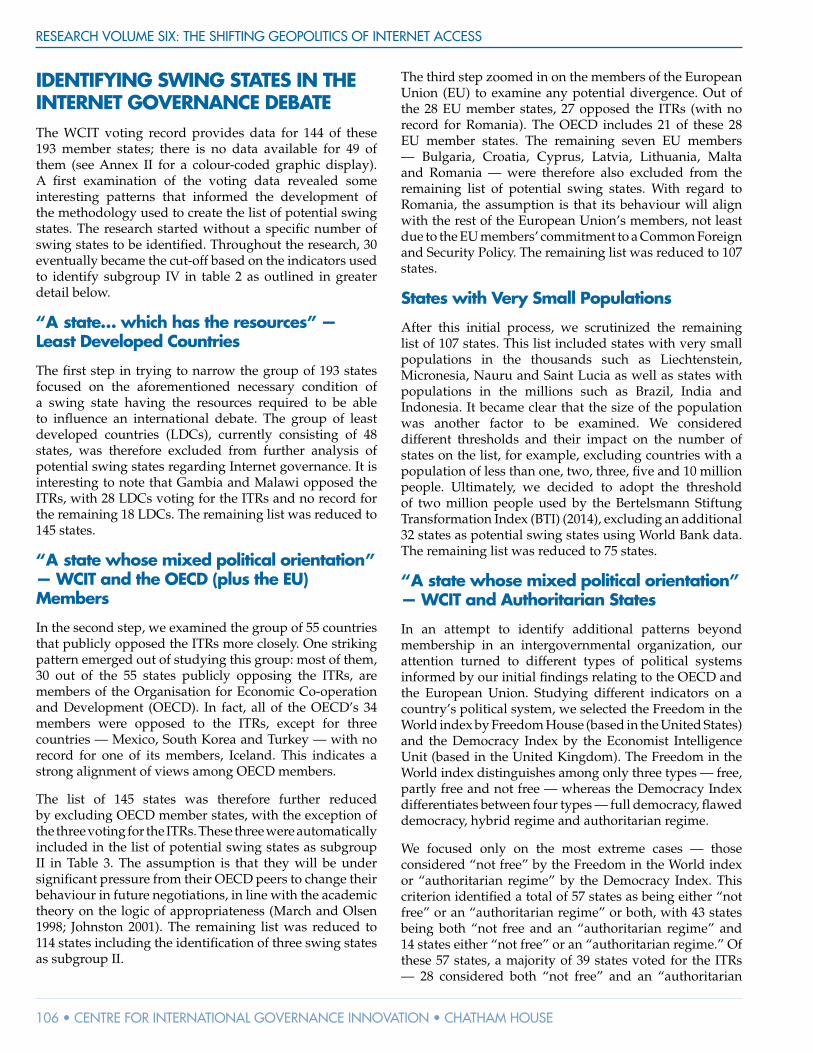
RESEARCH VOLUME SIX: THE SHIFTING GEOPOLITICS OF INTERNET ACCESS
106 • CENTRE FOR INTERNATIONAL GOVERNANCE INNOVATION • CHATHAM HOUSE
IDENTIFYING SWING STATES IN THE INTERNET GOVERNANCE DEBATE The WCIT voting record provides data for 144 of these 193 member states; there is no data available for 49 of them (see Annex II for a colour-coded graphic display). A �rst examination of the voting data revealed some interesting patterns that informed the development of the methodology used to create the list of potential swing states. The research started without a speci�c number of swing states to be identi�ed. Throughout the research, 30 eventually became the cut-off based on the indicators used to identify subgroup IV in table 2 as outlined in greater detail below.
“A state… which has the resources” — Least Developed Countries
The �rst step in trying to narrow the group of 193 states focused on the aforementioned necessary condition of a swing state having the resources required to be able to in�uence an international debate. The group of least developed countries (LDCs), currently consisting of 48 states, was therefore excluded from further analysis of potential swing states regarding Internet governance. It is interesting to note that Gambia and Malawi opposed the ITRs, with 28 LDCs voting for the ITRs and no record for the remaining 18 LDCs. The remaining list was reduced to 145 states.
“A state whose mixed political orientation” — WCIT and the OECD (plus the EU) Members
In the second step, we examined the group of 55 countries that publicly opposed the ITRs more closely. One striking pattern emerged out of studying this group: most of them, 30 out of the 55 states publicly opposing the ITRs, are members of the Organisation for Economic Co-operation and Development (OECD). In fact, all of the OECD’s 34 members were opposed to the ITRs, except for three countries — Mexico, South Korea and Turkey — with no record for one of its members, Iceland. This indicates a strong alignment of views among OECD members.
The list of 145 states was therefore further reduced by excluding OECD member states, with the exception of the three voting for the ITRs. These three were automatically included in the list of potential swing states as subgroup II in Table 3. The assumption is that they will be under signi�cant pressure from their OECD peers to change their behaviour in future negotiations, in line with the academic theory on the logic of appropriateness (March and Olsen 1998; Johnston 2001). The remaining list was reduced to 114 states including the identi�cation of three swing states as subgroup II.
The third step zoomed in on the members of the European Union (EU) to examine any potential divergence. Out of the 28 EU member states, 27 opposed the ITRs (with no record for Romania). The OECD includes 21 of these 28 EU member states. The remaining seven EU members — Bulgaria, Croatia, Cyprus, Latvia, Lithuania, Malta and Romania — were therefore also excluded from the remaining list of potential swing states. With regard to Romania, the assumption is that its behaviour will align with the rest of the European Union’s members, not least due to the EU members’ commitment to a Common Foreign and Security Policy. The remaining list was reduced to 107 states.
States with Very Small Populations
After this initial process, we scrutinized the remaining list of 107 states. This list included states with very small populations in the thousands such as Liechtenstein, Micronesia, Nauru and Saint Lucia as well as states with populations in the millions such as Brazil, India and Indonesia. It became clear that the size of the population was another factor to be examined. We considered different thresholds and their impact on the number of states on the list, for example, excluding countries with a population of less than one, two, three, �ve and 10 million people. Ultimately, we decided to adopt the threshold of two million people used by the Bertelsmann Stiftung Transformation Index (BTI) (2014), excluding an additional 32 states as potential swing states using World Bank data. The remaining list was reduced to 75 states.
“A state whose mixed political orientation” — WCIT and Authoritarian States
In an attempt to identify additional patterns beyond membership in an intergovernmental organization, our attention turned to different types of political systems informed by our initial �ndings relating to the OECD and the European Union. Studying different indicators on a country’s political system, we selected the Freedom in the World index by Freedom House (based in the United States) and the Democracy Index by the Economist Intelligence Unit (based in the United Kingdom). The Freedom in the World index distinguishes among only three types — free, partly free and not free — whereas the Democracy Index differentiates between four types — full democracy, �awed democracy, hybrid regime and authoritarian regime.
We focused only on the most extreme cases — those considered “not free” by the Freedom in the World index or “authoritarian regime” by the Democracy Index. This criterion identi�ed a total of 57 states as being either “not free” or an “authoritarian regime” or both, with 43 states being both “not free and an “authoritarian regime” and 14 states either “not free” or an “authoritarian regime.” Of these 57 states, a majority of 39 states voted for the ITRs — 28 considered both “not free” and an “authoritarian

CHAPTER SEVEN: TIPPING THE SCALE: AN ANALYSIS OF GLOBAL SWING STATES IN THE INTERNET GOVERNANCE DEBATE
TIM MAURER AND ROBERT MORGUS • 107
regime” and 11 considered either one of the two. There is no record for 16 states, including 13 meeting both criteria and three meeting one of the two.
Only two of the 57 states classi�ed as either “not free” or an “authoritarian regime” opposed the ITRs, both are considered “not free” and an “authoritarian regime”: Belarus and Gambia. Since Gambia is part of the LDCs and is therefore excluded, only Belarus is included in the list of the top 30 potential swing states in Table 1. Belarus is an obvious outlier compared to the other swing states (emphasized by the * in Table 1 and 3). Were it not for its voting behaviour at the WCIT, which warrants further analysis, Belarus would have normally been excluded based on its political system.
Based on these �ndings on the type of political system, we decided to include this variable in our analysis. At the same time, we opted for a conservative approach, only excluding those meeting both criteria and considered both “not free” and an “authoritarian regime,” which resulted in a list of 22 states. The list of 75 states therefore shrunk to 54 states (53 states plus the identi�cation of an additional potential swing state, Belarus, in subgroup I).
TAKING A CLOSER LOOK AT 54 STATESThe �rst phase of the study focused on identifying the group of swing states among the 193 UN member states. Narrowing the list to 54 countries was based on an analysis using the following indicators:
• status as a LDC;
• member of the OECD and the European Union;
• population of less than two million people; and
• status being “not free” and “authoritarian regime.”
This process identi�ed several groups of countries that are unlikely to be swing states in the future. LDCs do not have the resources, for example, and members of the OECD and the European Union overwhelmingly voted against the ITRs while countries considered “not free” and authoritarian regimes” voted for them, suggesting similar behaviour in the future. At the same time, a few states emerged as swing states, namely Mexico, South Korea, Turkey and Belarus. These four are part of one of the former groups — with Mexico, South Korea and Turkey being members of the OECD and Berlarus considered “not free” and “authoritarian regime” — but behaved differently than their peers.
States Voting against the ITRS
The �rst step in examining the remaining 54 countries focused on identifying those states that publicly
opposed the ITRs. In addition to Belarus, there were 12 other states: Albania, Armenia, Colombia, Costa Rica, Georgia, India, Kenya, Moldova, Mongolia, Peru, Philippines, and Serbia. These are automatically considered to be swing states — subgroup I of Table 3 — assuming that since these states have already publicly opposed the ITRs, they might take similar positions in the future. At least, their WCIT voting behaviour established path dependence, increasing the cost to change future behaviour and a public record other actors can use to in�uence these 12 countries. Together with the other four swing states, subtracting these 12 additional swing states creates a reduced list of 38 states requiring further analysis.
Freedom Online Coalition Members
An additional step was informed by a 2012 assessment of the WCIT in The Economist:
The main issue was to what extent the internet should feature in the treaty. America and its allies wanted to keep it from being so much as mentioned — mainly out of fear that any reference to it whatsoever would embolden governments to censor the internet and meddle with its infrastructure. For some time a compromise among the more the 600 delegates, who were con�ned to an oppressive convention hall, seemed possible: the binding ITR would indeed hardly make any mention of the internet, but China, Russia and many Arab countries would get a non-binding resolution on the internet…. Yet this package did not �y. (The Economist 2012)
In light of these concerns over the ITRs’ implications for human rights, we compared the list of countries voting for the ITRs with the membership of the Freedom Online Coalition (FOC), which currently includes 22 countries. This coalition de�nes itself as “an intergovernmental coalition committed to advancing Internet freedom — free expression, association, assembly, and privacy online — worldwide. In its founding document, the ‘Hague Declaration,’ the FOC declared that the same rights apply online as well as of�ine” (FOC 2014). FOC membership was not included in the �rst phase of the research because the FOC is still very young and not a full-�edged organization such as the OECD and European Union; peer pressure effects are therefore assumed to be weaker.
Ghana and Tunisia were the only FOC members voting for the ITRs. They form subgroup III in Table 3. Similar to the OECD member states, the assumption is that these two countries will be under signi�cant pressure moving forward from their coalition peers to change

RESEARCH VOLUME SIX: THE SHIFTING GEOPOLITICS OF INTERNET ACCESS
108 • CENTRE FOR INTERNATIONAL GOVERNANCE INNOVATION • CHATHAM HOUSE
their behaviour to be appropriate vis-à-vis the declaration they made and are therefore part of the list of potential swing states. To be comprehensive, the two countries are included in Annex IV among the 38 states that were ranked based on the various indicators to show how they relate to the other states examined for this phase of the study.
Potential Swing States Based on Indicators
We examined a variety of different indicators to analyze the remaining 38 states, with the assumption that a subset of countries from this group constitute additional swing states. Compared to the 16 swing states already identi�ed, these countries are described as potential swing states because the data associated with them and the patterns differ in important aspects, such as the correlation of ITRs voting behaviour and organizational membership.
The indicators ultimately selected to be relevant and robust were grouped into six categories: international cooperation, political system, civil society pro�le, Internet access, tech economy and active government interest in the Internet policy area. A list of indicators initially considered but eventually discarded during the research process can be found in Annex III. These six categories include 12 indicators; six consist of general indicators relevant for this study and the other six consist of speci�c indicatorsdirectly
relevant for the Internet policy area. Table 2 shows the 12 indicators and their sources.
These indicators were selected because we consider them relevant to our inquiry, methodologically sound and comprehensive to offer suf�cient information for the countries examined. The rationale and assumptions underlying the selection of categories varied. With regard to the general indicators, the �rst category — international cooperation — was included because this study focuses on identifying swing states in an international negotiation process. General propensity to cooperate is, therefore, an inherent element and necessary variable to include for this research. Indicators for the type of political system were included based on the initial review of WCIT voting behaviour and the pattern that emerged relating to OECD and EU membership, as well as the correlation between states considered not free or authoritarian regimes. The indicator “effective power to govern” was included in this category to capture the general strength or weakness of a state in a given country, assuming that a weak state is less likely to be able to adhere to previously made commitments and to act as a swing state in a sustainable manner over time. The category civil society pro�le was included as a separate category for two reasons. First, previous analysis shows the importance of civil society in in�uencing a government’s
Table 2: Indicators Used to Analyze Potential Swing States
Categories
General Indicators Indicator Source
International cooperation International Cooperation (BTI Q17) BTI (2014)
Political system Democracy Index: Score Economist Intelligence Unit (2012)
Freedom in the World Index (Free) Freedom House (2014)
Effective power to govern (BTI Q2.2) BTI (2014)
Civil society pro�le Civicus Enabling Environment Index Civicus (2013)
Civil society participation (BTI Q16.4) BTI (2014)
Speci�c Indicators Indicator Source
Internet access Internet penetration rate (users per 100 people) World Bank (2012a)
Tech economy Information and communications technology (ICT) goods exports (as a % of total) World Bank (2012b)
ICT services exports (as a % of total) World Bank (2012c)
ICT goods imports (as a % of total)* World Bank (2012d)
Active government interest in the Internet policy area WCIT participation ITU (2012)
Membership in one of the three UN Group of Governmental Experts (UN GGEs)** Compiled by the authors
* The World Bank does not provide data on ICT services imports. ** The UN GGEs were created in the context of the deliberations in the UN General Assembly’s First Committee on Developments in the Field of Information and Telecommunications in the Context of International Security.

CHAPTER SEVEN: TIPPING THE SCALE: AN ANALYSIS OF GLOBAL SWING STATES IN THE INTERNET GOVERNANCE DEBATE
TIM MAURER AND ROBERT MORGUS • 109
position on these issues (Ebert and Maurer 2013). Second, the current model of Internet governance is based on a “multi-stakeholder” governance model, with civil society being one of the key stakeholders.
The other six indicators were selected because they are directly relevant for Internet governance. This includes Internet access using Internet penetration rates as an indicator for the importance of the Internet for a country and its population. The tech economy category tries to capture the economic dimension and business interests. The World Bank’s data on the share of ICT exports and imports emerged as good indicators for this purpose. Ideally, information on competition for each country’s telecommunications market would be included, but such data could not be found. Last but not least, these indicators also try to incorporate if a government has already shown an active interest in the Internet policy area. This is based on the assumption that an existing active government interest in this area creates path dependence, increasing the likelihood of such a government remaining actively interested in this area and acting as a swing state in the future.
Using these categories, we then ranked the 38 states for each indicator, with the top-ranked state listed �rst (see Annex IV). Having already identi�ed a total of 18 potential swing states in subgroups I, II and III, we estimated that we would identify an additional seven to 17 potential swing states among the remaining 38 countries to develop a meaningful group of potential swing states overall. We therefore set a general threshold of the top 15 states. Moreover, an analysis of the data (see Annex V) suggested the creation of speci�c thresholds for the rankings, namely with regard to Internet penetration rates, ICT goods exports, ICT services exports and ICT goods imports, which showed signi�cant differences among states. For the Internet penetration rates, we only ranked states with an Internet penetration rate of more than one-third. For
ICT goods exports, we only ranked states where those exports constitute more than one percent of the total; for ICT services exports, the threshold is over 10 percent; and for ICT goods imports, the threshold is over �ve percent. The assumption is that these levels are signi�cant enough to convince the respective government that these numbers matter, in�uencing its behaviour.
After creating a ranking for each individual indicator, we aggregated the number of occurrences of each state in the top 15 across the 12 indicators. Participation in the WCIT counted as “+1,” irrespective of voting behavior. The indicator “WCIT participation” is coloured inversely because it lists only those countries among the 38 states whose governments were not at the WCIT, therefore not counting “+1.”
The aggregate numbers reveal a wide range among the 38 states, ranging from as low as one occurrence to as high as 11 occurrences out of the 12 indicators. This is summarized in Annex IV in the column “Swing states ranked based on aggregate occurrences in top 15 of 12 selected indicators.” Only 13 of the 38 states appeared in the top 15 six or more times. These were identi�ed as additional potential swing states — subgroup IV — with the exception of El Salvador. El Salvador’s occurrences are limited to non-Internet policy speci�c indicators, except for participation in the WCIT, so it is therefore excluded from the top 30 potential swing states list (see Table 3).
The result of this analysis identi�ed a group of 12 potential additional swing states — subgroup IV — that were added to the 18 states already identi�ed as swing states — subgroups I, II and III. The resulting top 30 global swing states and the breakdown are shown in Table 3.
Table 3: Top 30 Global Swing States
Against the ITRs For the ITRs but...
I
II III IV
OECD Member FOC MemberPotential Swing States Based on Indicators
Albania Armenia Belarus* Colombia Costa Rica Georgia India Kenya Moldova Mongolia Peru Philippines Serbia
Mexico South Korea Turkey
Ghana Tunisia
Argentina Botswana Brazil Dominican Republic Indonesia Jamaica Malaysia Namibia Panama Singapore South Africa Uruguay
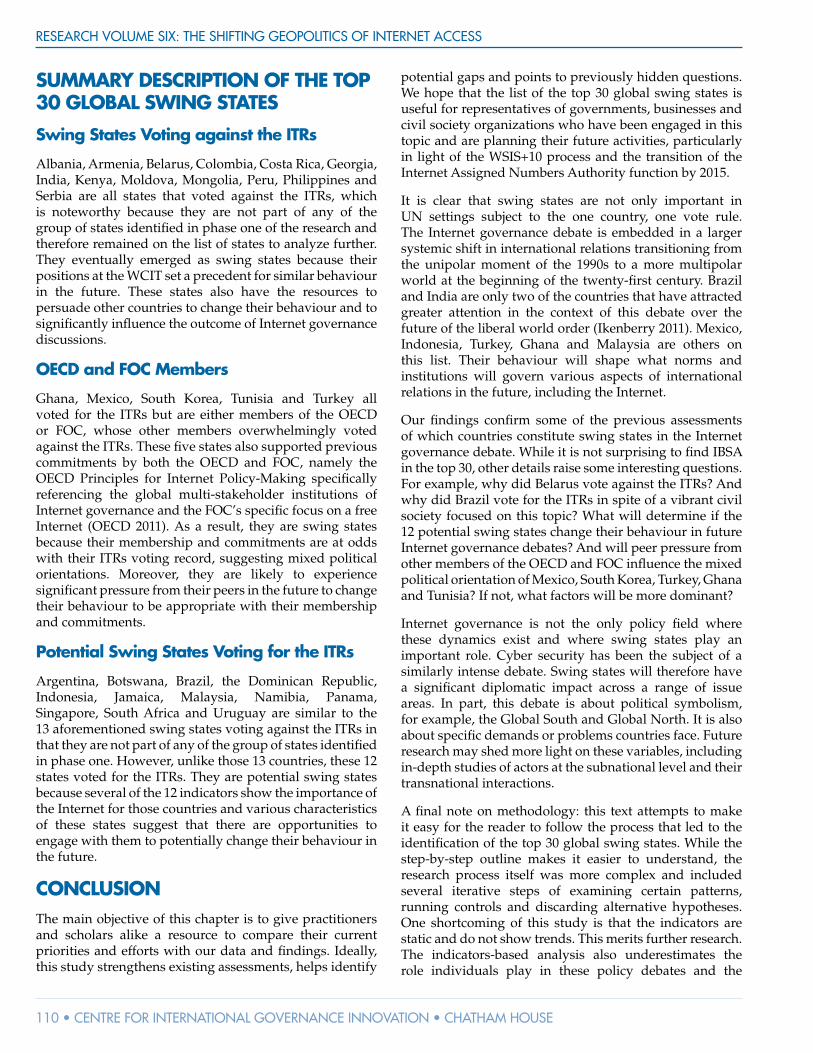
RESEARCH VOLUME SIX: THE SHIFTING GEOPOLITICS OF INTERNET ACCESS
110 • CENTRE FOR INTERNATIONAL GOVERNANCE INNOVATION • CHATHAM HOUSE
SUMMARY DESCRIPTION OF THE TOP 30 GLOBAL SWING STATES
Swing States Voting against the ITRs
Albania, Armenia, Belarus, Colombia, Costa Rica, Georgia, India, Kenya, Moldova, Mongolia, Peru, Philippines and Serbia are all states that voted against the ITRs, which is noteworthy because they are not part of any of the group of states identi�ed in phase one of the research and therefore remained on the list of states to analyze further. They eventually emerged as swing states because their positions at the WCIT set a precedent for similar behaviour in the future. These states also have the resources to persuade other countries to change their behaviour and to signi�cantly in�uence the outcome of Internet governance discussions.
OECD and FOC Members
Ghana, Mexico, South Korea, Tunisia and Turkey all voted for the ITRs but are either members of the OECD or FOC, whose other members overwhelmingly voted against the ITRs. These �ve states also supported previous commitments by both the OECD and FOC, namely the OECD Principles for Internet Policy-Making speci�cally referencing the global multi-stakeholder institutions of Internet governance and the FOC’s speci�c focus on a free Internet (OECD 2011). As a result, they are swing states because their membership and commitments are at odds with their ITRs voting record, suggesting mixed political orientations. Moreover, they are likely to experience signi�cant pressure from their peers in the future to change their behaviour to be appropriate with their membership and commitments.
Potential Swing States Voting for the ITRs
Argentina, Botswana, Brazil, the Dominican Republic, Indonesia, Jamaica, Malaysia, Namibia, Panama, Singapore, South Africa and Uruguay are similar to the 13 aforementioned swing states voting against the ITRs in that they are not part of any of the group of states identi�ed in phase one. However, unlike those 13 countries, these 12 states voted for the ITRs. They are potential swing states because several of the 12 indicators show the importance of the Internet for those countries and various characteristics of these states suggest that there are opportunities to engage with them to potentially change their behaviour in the future.
CONCLUSIONThe main objective of this chapter is to give practitioners and scholars alike a resource to compare their current priorities and efforts with our data and �ndings. Ideally, this study strengthens existing assessments, helps identify
potential gaps and points to previously hidden questions. We hope that the list of the top 30 global swing states is useful for representatives of governments, businesses and civil society organizations who have been engaged in this topic and are planning their future activities, particularly in light of the WSIS+10 process and the transition of the Internet Assigned Numbers Authority function by 2015.
It is clear that swing states are not only important in UN settings subject to the one country, one vote rule. The Internet governance debate is embedded in a larger systemic shift in international relations transitioning from the unipolar moment of the 1990s to a more multipolar world at the beginning of the twenty-�rst century. Brazil and India are only two of the countries that have attracted greater attention in the context of this debate over the future of the liberal world order (Ikenberry 2011). Mexico, Indonesia, Turkey, Ghana and Malaysia are others on this list. Their behaviour will shape what norms and institutions will govern various aspects of international relations in the future, including the Internet.
Our �ndings con�rm some of the previous assessments of which countries constitute swing states in the Internet governance debate. While it is not surprising to �nd IBSA in the top 30, other details raise some interesting questions. For example, why did Belarus vote against the ITRs? And why did Brazil vote for the ITRs in spite of a vibrant civil society focused on this topic? What will determine if the 12 potential swing states change their behaviour in future Internet governance debates? And will peer pressure from other members of the OECD and FOC in�uence the mixed political orientation of Mexico, South Korea, Turkey, Ghana and Tunisia? If not, what factors will be more dominant?
Internet governance is not the only policy �eld where these dynamics exist and where swing states play an important role. Cyber security has been the subject of a similarly intense debate. Swing states will therefore have a signi�cant diplomatic impact across a range of issue areas. In part, this debate is about political symbolism, for example, the Global South and Global North. It is also about speci�c demands or problems countries face. Future research may shed more light on these variables, including in-depth studies of actors at the subnational level and their transnational interactions.
A �nal note on methodology: this text attempts to make it easy for the reader to follow the process that led to the identi�cation of the top 30 global swing states. While the step-by-step outline makes it easier to understand, the research process itself was more complex and included several iterative steps of examining certain patterns, running controls and discarding alternative hypotheses. One shortcoming of this study is that the indicators are static and do not show trends. This merits further research. The indicators-based analysis also underestimates the role individuals play in these policy debates and the
CHAPTER SEVEN: TIPPING THE SCALE: AN ANALYSIS OF GLOBAL SWING STATES IN THE INTERNET GOVERNANCE DEBATE
TIM MAURER AND ROBERT MORGUS • 111
relationships and networks among people that are often a decisive factor in a state’s foreign policy. These individuals tend to rotate among jobs and a state’s position can, therefore, change within the span of a few years depending on the individual’s stature within his or her government. This is an additional important aspect that requires further study.
Previous efforts to create indexes and rankings have shown how dif�cult they are to develop and how easy it is to criticize them (as our own Annex III partly demonstrates). Our effort to identify potential swing states is no exception and includes several shortcomings and important caveats. One of the few means to address this reality is to be as transparent as possible regarding data collection (both in terms of selection and elimination), data analysis, underlying assumptions and conclusions. We have therefore tried to make our assumptions and rationale as explicit as possible. Moreover, we consider this chapter to be only a piece of the broader research debate on this topic, not the end. Other scholars will, it is hoped, engage in similar exercises, selecting other indicators and drawing independent conclusions that will help advance this effort further.
WORKS CITEDBTI. 2014. “Methodology.” www.bti-project.org/index/
methodology/.
Civicus. 2013. “The Civicus Enabling Environment Index.” http://civicus.org/images/Civicus_EEI%20REPORT%202013_WEB_FINAL.pdf.
Clemente, Dave. 2013. Adaptive Internet Governance: Persuading the Swing States. CIGI Internet Governance Papers No. 5. October. www.cigionline.org/publications/2013/10/adaptive-internet-governance-persuading-swing-states.
Ebert, Hannes and Tim Maurer. 2013. “Contested Cyberspace and Rising Powers.” Third World Quarterly 34 (6): 1054–74.
Economist Intelligence Unit. 2012. “Democracy Index 2012: Democracy at a Standstill.” www.eiu.com/public/topical_report.aspx?campaignid=democracyindex12.
Freedom House. 2014. “Freedom in the World 2014.” www.freedomhouse.org/report/freedom-world/freedom-world-2014#.Ux4OzoWhbhc.
FOC. 2014. “Member States.” www.freedomonline.ee/about-us/member-states.
Ikenberry, John G. 2011. “The Future of the Liberal World Order.” Foreign Affairs (May/June). www.foreignaffairs.com/articles/67730/g-john-ikenberry/the-future-of-the-liberal-world-order.
ITU. 2012. “Signatories of the Final Acts.” www.itu.int/osg/wcit-12/highlights/signatories.html.
Johnston, Alastair Iain. 2001. “Treating International Institutions as Social Environments.” International Studies Quarterly 45 (4): 487–515.
Kleinwächter, Wolfgang. 2013. “Internet Governance Outlook 2013: ‘Cold Internet War’ or ‘Peaceful Internet Coexistence’?” Blog. www.circleid.com/posts/20130103_internet_governance_outlook_2013/.
Kliman, Daniel M. and Richard Fontaine. 2012. “Global Swing States: Brazil, India, Indonesia, Turkey, and the Future of International Order.” The German Marshall Fund, November 27. www.gmfus.org/archives/global-swing-states-brazil-india-indonesia-turkey-and-the-future-of-international-order/.
March, James G. and Johan P. Olsen. 1998. “The Institutional Dynamics of International Political Orders.” International Organization 52 (4): 943–69.

RESEARCH VOLUME SIX: THE SHIFTING GEOPOLITICS OF INTERNET ACCESS
112 • CENTRE FOR INTERNATIONAL GOVERNANCE INNOVATION • CHATHAM HOUSE
Maurer, Tim. 2012. “What’s at Stake at WCIT?” New America Foundation. December 5. http://newamerica.net/publications/policy/whats_at_stake_at_wcit.
OECD. 2011. “Communiqué on Principles for Internet Policy-Making.” June. Paris: OECD. www.oecd.org/internet/innovation/48289796.pdf.
Raymond, Mark and Gordon Smith. 2013. Reimagining the Internet: The Need for a High-level Strategic Vision for Internet Governance. CIGI Internet Governance Papers No. 1. July. www.cigionline.org/publications/2013/7/reimagining-internet-need-high-level-strategic-vision-internet-governance.
The Economist. 2012. “A Digital Cold War?” The Economist, December 14. www.economist.com/blogs/babbage/2012/12/internet-regulation.
World Bank. 2012a. “Internet users (per 100 people).” World Bank Indicators — Data. http://data.worldbank.org/indicator/IT.NET.USER.P2.
———. 2012b. “ICT Goods Exports.” World Bank Indicators — Data. http://data.worldbank.org/indicator/TX.VAL.ICTG.ZS.UN.
———. 2012c. “ICT Service Exports.” World Bank Indicators — Data. http://data.worldbank.org/indicator/BX.GSR.CCIS.ZS.
———. 2012d. “ICT Goods Imports.” World Bank Indicators — Data. http://data.worldbank.org/indicator/TM.VAL.ICTG.ZS.UN.
ABOUT THE AUTHORSTim Maurer is a research fellow at New America Foundation’s Open Technology Institute focusing on cyberspace and international affairs. His research has been published by Harvard University, Foreign Policy, CNN and Slate among others. In October 2013 and February 2014, he spoke about cyber security at the United Nations, and his work has been featured by print, radio and television media, including National Public Radio’s Kojo Nnamdi Show, Public Radio International’s The World, Al Jazeera, the Los Angeles Times, the Russian newspaper Kommersant and the German newspaper Die Zeit. His current projects centre on the international cyber security norm process, information technology in the context of sanctions and export controls, and swing states in the global Internet policy debate. Prior to joining New America, he worked at the Center for Strategic and International Studies and gained experience with the United Nations in Rwanda, Geneva and New York. He conducts his academic research as a non-resident research fellow at the Citizen Lab.
Robert Morgus is a research assistant at New America’s Open Technology Institute, where he works on Internet governance, international cyber security and human rights online, speci�cally sanctions and export controls. He has written on a wide range of topics revolving around international security, con�ict and development, including the interaction of economic shocks and violent unrest, civil society and postwar reconstruction in Bosnia and Herzegovina. He has spent signi�cant time in the Balkans researching the region’s history, con�icts and politics. He holds a B.A. in diplomacy and world affairs from Occidental College.

CHAPTER SEVEN: TIPPING THE SCALE: AN ANALYSIS OF GLOBAL SWING STATES IN THE INTERNET GOVERNANCE DEBATE
TIM MAURER AND ROBERT MORGUS • 113
ANNEX I: IDENTIFYING POTENTIAL SWING STATES
COUNTRY WCIT LDC OECD EU 2 million Not Free AuthoritarianNot Free + Authoritarian
1 Afghanistan 1 1 1 1 2
2 Albania 0
3 Algeria 1 1 1 2
4 Andorra 0 1
5 Angola 1 1 1 1 2
6 Antigua and Barbuda 1
7 Argentina 1
8 Armenia 0
9 Australia 0 1
10 Austria 0 1 1
11 Azerbaijan 1 1 1 2
12 Bahamas 1
13 Bahrain 1 1 1 1 2
14 Bangladesh 1 1
15 Barbados 1 1
16 Belarus* 0 1 1 2
17 Belgium 0 1 1
18 Belize 1 1
19 Benin 1 1
20 Bhutan 1 1 1
21 Bolivia
22 Bosnia and Herzegovina
23 Botswana 1
24 Brazil 1
25 Brunei Darussalam 1 1 1 1 2
26 Bulgaria 0 1
27 Burkina Faso 1 1 1 1
28 Burundi 1 1 1 1
29 Cambodia 1 1 1 1
30 Cameroon 1 1 2
31 Canada 0 1
32 Cape Verde 1 1
33 Central African Republic 1 1 1 1 2
34 Chad 1 1 1 2
35 Chile 0 1
36 China 1 1 1 2
37 Colombia 0
38 Comoros 1 1 1 1 1
39 Congo, Democratic Republic of the 1 1 1 2
40 Congo, Republic of the 1 1 1 2
41 Costa Rica 0
42 Côte d’Ivoire 1 1 1
43 Croatia 0 1
44 Cuba 1 1 1 2
45 Cyprus 0 1 1
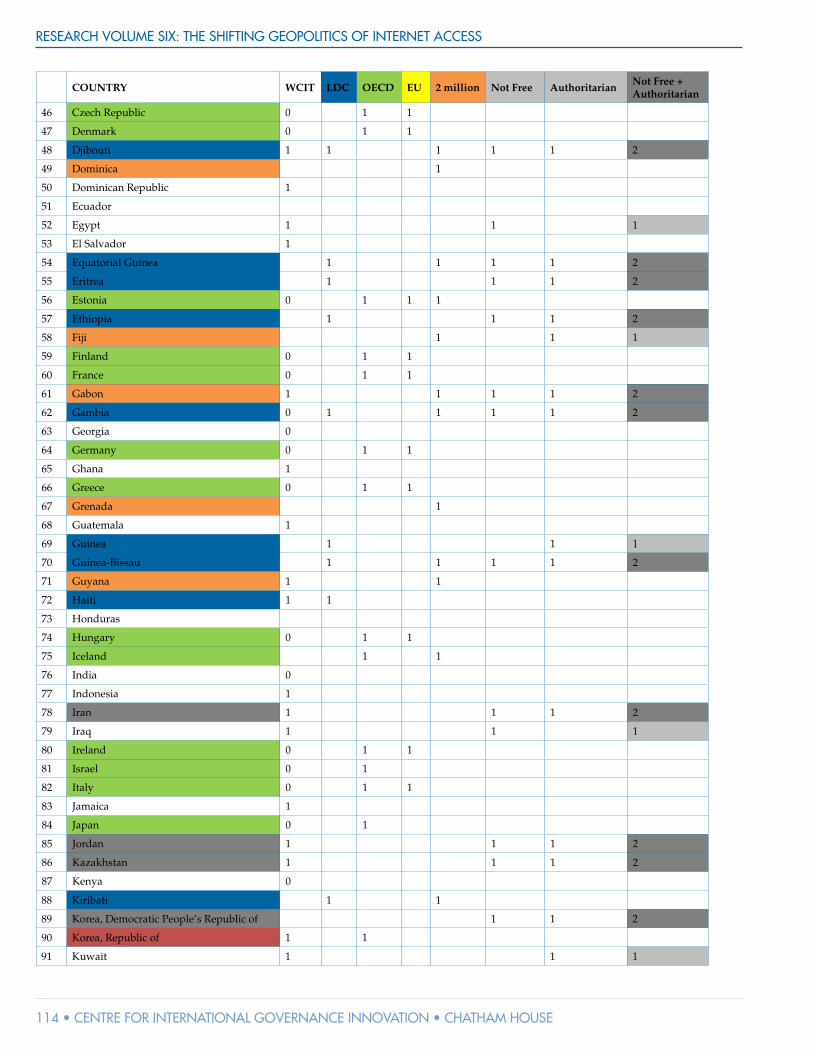
RESEARCH VOLUME SIX: THE SHIFTING GEOPOLITICS OF INTERNET ACCESS
114 • CENTRE FOR INTERNATIONAL GOVERNANCE INNOVATION • CHATHAM HOUSE
COUNTRY WCIT LDC OECD EU 2 million Not Free AuthoritarianNot Free + Authoritarian
46 Czech Republic 0 1 1
47 Denmark 0 1 1
48 Djibouti 1 1 1 1 1 2
49 Dominica 1
50 Dominican Republic 1
51 Ecuador
52 Egypt 1 1 1
53 El Salvador 1
54 Equatorial Guinea 1 1 1 1 2
55 Eritrea 1 1 1 2
56 Estonia 0 1 1 1
57 Ethiopia 1 1 1 2
58 Fiji 1 1 1
59 Finland 0 1 1
60 France 0 1 1
61 Gabon 1 1 1 1 2
62 Gambia 0 1 1 1 1 2
63 Georgia 0
64 Germany 0 1 1
65 Ghana 1
66 Greece 0 1 1
67 Grenada 1
68 Guatemala 1
69 Guinea 1 1 1
70 Guinea-Bissau 1 1 1 1 2
71 Guyana 1 1
72 Haiti 1 1
73 Honduras
74 Hungary 0 1 1
75 Iceland 1 1
76 India 0
77 Indonesia 1
78 Iran 1 1 1 2
79 Iraq 1 1 1
80 Ireland 0 1 1
81 Israel 0 1
82 Italy 0 1 1
83 Jamaica 1
84 Japan 0 1
85 Jordan 1 1 1 2
86 Kazakhstan 1 1 1 2
87 Kenya 0
88 Kiribati 1 1
89 Korea, Democratic People’s Republic of 1 1 2
90 Korea, Republic of 1 1
91 Kuwait 1 1 1

CHAPTER SEVEN: TIPPING THE SCALE: AN ANALYSIS OF GLOBAL SWING STATES IN THE INTERNET GOVERNANCE DEBATE
TIM MAURER AND ROBERT MORGUS • 115
COUNTRY WCIT LDC OECD EU 2 million Not Free AuthoritarianNot Free + Authoritarian
92 Kyrgyzstan 1
93 Lao People’s Democratic Republic 1 1 1 2
94 Latvia 0 1
95 Lebanon 1
96 Lesotho 1 1 1
97 Liberia 1 1
98 Libya 1
99 Liechtenstein 0 1
100 Lithuania 0 1
101 Luxembourg 0 1 1 1
102 Macedonia
103 Madagascar 1 1 1
104 Malawi 0 1
105 Malaysia 1
106 Maldives 1
107 Mali 1 1
108 Malta 0 1 1
109 Marshall Islands 0 1
110 Mauritania 1
111 Mauritius 1 1
112 Mexico 1 1
113 Micronesia 1
114 Moldova 0
115 Monaco 1
116 Mongolia 0
117 Montenegro 0 1
118 Morocco 1
119 Mozambique 1 1
120 Myanmar 1 1 1 2
121 Namibia 1
122 Nauru 1
123 Nepal 1 1
124 Netherlands 0 1 1
125 New Zealand 0 1
126 Nicaragua
127 Niger 1 1
128 Nigeria 1 1 1
129 Norway 0 1
130 Oman 1 1 1 2
131 Pakistan
132 Palau 1
133 Panama 1
134 Papua New Guinea 1
135 Paraguay 1
136 Peru 0
137 Philippines 0

RESEARCH VOLUME SIX: THE SHIFTING GEOPOLITICS OF INTERNET ACCESS
116 • CENTRE FOR INTERNATIONAL GOVERNANCE INNOVATION • CHATHAM HOUSE
COUNTRY WCIT LDC OECD EU 2 million Not Free AuthoritarianNot Free + Authoritarian
138 Poland 0 1 1
139 Portugal 0 1 1
140 Qatar 1 1 1 2
141 Romania 1
142 Russia 1 1 1 2
143 Rwanda 1 1 1 1 2
144 Saint Kitts and Nevis 1
145 Saint Lucia 1 1
146 Saint Vincent and the Grenadines 1
147 Samoa 1
148 San Marino 1
149 Sao Tome and Principe 1 1
150 Saudi Arabia 1 1 1 2
151 Senegal 1 1
152 Serbia 0
153 Seychelles 1
154 Sierra Leone 1 1
155 Singapore 1
156 Slovakia 0 1 1
157 Slovenia 0 1 1
158 Solomon Islands 1
159 Somalia 1 1 1 1 2
160 South Africa 1
161 South Sudan 1 1 1 1
162 Spain 0 1 1
163 Sri Lanka 1
164 Sudan 1 1 1 1 2
165 Suriname 1
166 Swaziland 1 1 1 1 2
167 Sweden 0 1 1
168 Switzerland 0 1
169 Syria 1 1 2
170 Tajikistan 1 1 2
171 Tanzania 1 1
172 Thailand 1
173 Timor Leste 1 1
174 Togo 1 1 1 1
175 Tonga 1
176 Trinidad and Tobago 1 1
177 Tunisia 1
178 Turkey 1 1
179 Turkmenistan 1 1 2
180 Tuvalu 1 1
181 Uganda 1 1
182 Ukraine 1
183 United Arab Emirates 1 1 1 2
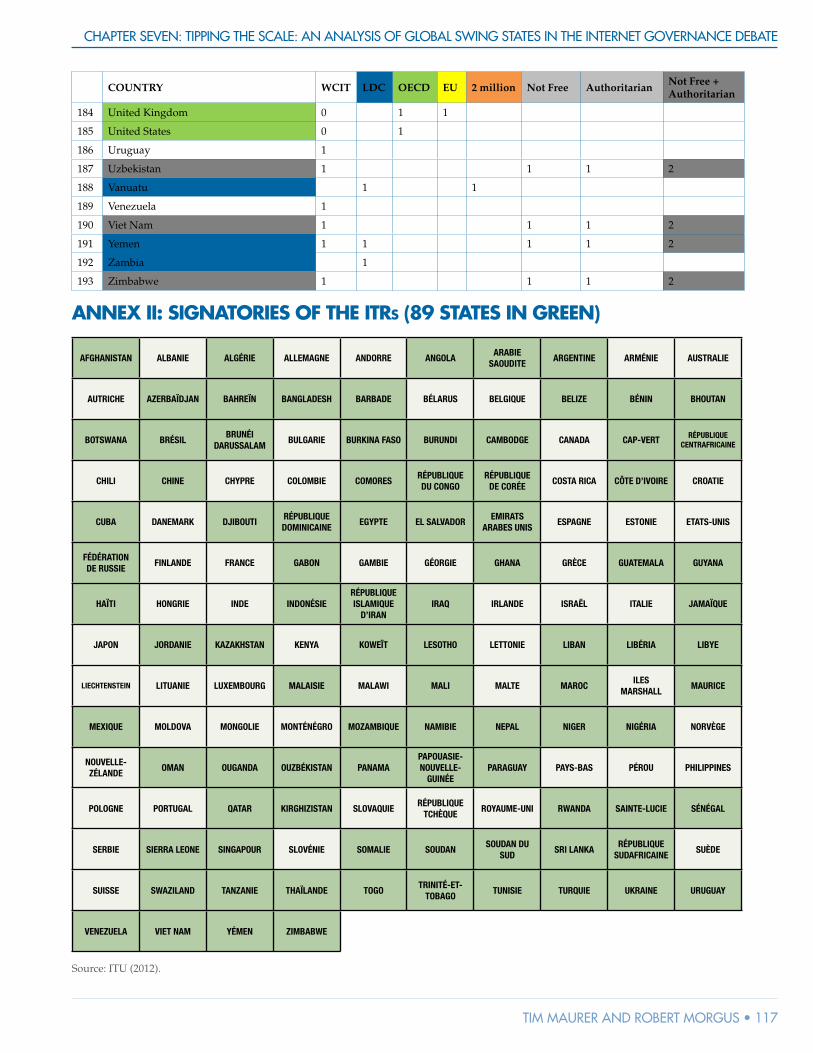
CHAPTER SEVEN: TIPPING THE SCALE: AN ANALYSIS OF GLOBAL SWING STATES IN THE INTERNET GOVERNANCE DEBATE
TIM MAURER AND ROBERT MORGUS • 117
COUNTRY WCIT LDC OECD EU 2 million Not Free AuthoritarianNot Free + Authoritarian
184 United Kingdom 0 1 1
185 United States 0 1
186 Uruguay 1
187 Uzbekistan 1 1 1 2
188 Vanuatu 1 1
189 Venezuela 1
190 Viet Nam 1 1 1 2
191 Yemen 1 1 1 1 2
192 Zambia 1
193 Zimbabwe 1 1 1 2
ANNEX II: SIGNATORIES OF THE ITRS (89 STATES IN GREEN)
AFGHANISTAN ALBANIE ALGÉRIE ALLEMAGNE ANDORRE ANGOLAARABIE
SAOUDITEARGENTINE ARMÉNIE AUSTRALIE
AUTRICHE AZERBAÏDJAN BAHREÏN BANGLADESH BARBADE BÉLARUS BELGIQUE BELIZE BÉNIN BHOUTAN
BOTSWANA BRÉSILBRUNÉI
DARUSSALAMBULGARIE BURKINA FASO BURUNDI CAMBODGE CANADA CAP-VERT RÉPUBLIQUE
CENTRAFRICAINE
CHILI CHINE CHYPRE COLOMBIE COMORESRÉPUBLIQUE DU CONGO
RÉPUBLIQUE DE CORÉE
COSTA RICA CÔTE D’IVOIRE CROATIE
CUBA DANEMARK DJIBOUTIRÉPUBLIQUE DOMINICAINE
EGYPTE EL SALVADOREMIRATS
ARABES UNISESPAGNE ESTONIE ETATS-UNIS
FÉDÉRATION DE RUSSIE
FINLANDE FRANCE GABON GAMBIE GÉORGIE GHANA GRÈCE GUATEMALA GUYANA
HAÏTI HONGRIE INDE INDONÉSIERÉPUBLIQUE ISLAMIQUE
D’IRANIRAQ IRLANDE ISRAËL ITALIE JAMAÏQUE
JAPON JORDANIE KAZAKHSTAN KENYA KOWEÏT LESOTHO LETTONIE LIBAN LIBÉRIA LIBYE
LIECHTENSTEIN LITUANIE LUXEMBOURG MALAISIE MALAWI MALI MALTE MAROCILES
MARSHALLMAURICE
MEXIQUE MOLDOVA MONGOLIE MONTÉNÉGRO MOZAMBIQUE NAMIBIE NEPAL NIGER NIGÉRIA NORVÈGE
NOUVELLE-ZÉLANDE
OMAN OUGANDA OUZBÉKISTAN PANAMAPAPOUASIE-NOUVELLE-
GUINÉEPARAGUAY PAYS-BAS PÉROU PHILIPPINES
POLOGNE PORTUGAL QATAR KIRGHIZISTAN SLOVAQUIERÉPUBLIQUE
TCHÈQUEROYAUME-UNI RWANDA SAINTE-LUCIE SÉNÉGAL
SERBIE SIERRA LEONE SINGAPOUR SLOVÉNIE SOMALIE SOUDANSOUDAN DU
SUDSRI LANKA
RÉPUBLIQUE SUDAFRICAINE
SUÈDE
SUISSE SWAZILAND TANZANIE THAÏLANDE TOGOTRINITÉ-ET-
TOBAGOTUNISIE TURQUIE UKRAINE URUGUAY
VENEZUELA VIET NAM YÉMEN ZIMBABWE
Source: ITU (2012).
RESEARCH VOLUME SIX: THE SHIFTING GEOPOLITICS OF INTERNET ACCESS
118 • CENTRE FOR INTERNATIONAL GOVERNANCE INNOVATION • CHATHAM HOUSE
ANNEX III: INDICATORS INITIALLY CONSIDERED BUT ULTIMATELY DISCARDED
National Replies
National Replies refers to the submission of documents by UN member states in the context of the deliberations in the UN General Assembly’s First Committee on Developments in the Field of Information and Telecommunications in the Context of International Security. This was initially considered as a potential indicator for active government interest in cyber policy, but was discarded in favour of membership in one of the three UN GGEs. We consider the latter to be a more accurate indicator because becoming a member of a GGE requires a more signi�cant diplomatic effort and indicates active government interest in this policy area more directly.
Sponsors of UN Resolutions
This variable examined the list of sponsors of the UN resolutions titled “Developments in the Field of Information and Telecommunications in the Context of International Security.” Like National Replies, this indicator was initially considered as an indicator for active government interest in cyber policy, but was discarded in favour of the UN GGE membership variable for the same reasons as outlined above.
G20 Membership
The G20 is a group consisting of the world’s 20 leading economies. This indicator was initially considered as an indicator assuming that a global leadership role will lead to indirect government interest in cyber policy as the latter continues to rise from low to high politics. This indicator was discarded because we ultimately decided that this link is too indirect to be meaningful for the research question underlying this study.
UN Security Council Membership (+/– 5 years)
The list of the non-permanent members of the UN Security Council from the past �ve years and the next �ve years was initially considered as an indicator assuming that a global leadership role will lead to indirect government interest in cyber policy as the latter continues to rise from low to high politics. This indicator was discarded because we ultimately decided that this link is too indirect to be meaningful for the research question underlying this study.
Economist Intelligence Unit’s Cyber Power Index
The Cyber Power Index is a model developed by The Economist measuring attributes of the cyber environment. This index was initially considered as an indicator of
indirect government interest in cyber policy but was discarded because the countries were preselected based on G20 membership.
World Economic Forum: Network Readiness Index
The World Economic Forum’s (WEF’s) Networked Readiness Index measures the propensity for countries to use the opportunities offered by information and communications technology. The Network Readiness Index was initially considered as a potentially useful indicator. However, after a thorough review of the methodology it was found to be largely survey based and a lacked a clear description of the methodological approach for these surveys. We were therefore unable to scrutinize the methodology used and to assess the indicator’s quality.
WEF: Use of Virtual Social Networks
This indicator is a component of the WEF’s Network Readiness Index. It is based on polling asking “How widely used are virtual social networks (e.g., Facebook, Twitter, LinkedIn) for professional and personal communications in your country? [1 = not used at all; 7 = used widely].” This indicator was initially considered as an indicator of a country’s individual tech pro�le. It was discarded primarily because we were unable to �nd suf�cient information about the method of surveying people and thus the method of compiling each individual country’s rating. We were therefore unable to scrutinize the methodology used and to assess the indicator’s quality.
WEF: Access to Digital Content
This indicator is a component of the WEF’s Network Readiness Index. It is based on polling asking: “In your country, how accessible is digital content (e.g., text and audiovisual content, software products) via multiple platforms (e.g., �xed-line Internet, wireless Internet, mobile network, satellite)? [1 = not accessible at all; 7 = widely accessible].” This indicator was initially considered as an indicator of a country’s individual tech pro�le. It was discarded primarily because we were unable to �nd suf�cient information about the method of surveying people and thus the method of compiling each individual country’s rating. We were therefore unable to scrutinize the methodology used and to assess the indicator’s quality.
WEF: Capacity for Innovation
This indicator is a component of the WEF’s Network Readiness Index. It is based on polling asking: “In your country, how do companies obtain technology? [1 =

CHAPTER SEVEN: TIPPING THE SCALE: AN ANALYSIS OF GLOBAL SWING STATES IN THE INTERNET GOVERNANCE DEBATE
TIM MAURER AND ROBERT MORGUS • 119
exclusively from licensing or imitating foreign companies; 7 = by conducting formal research and pioneering their own new products and processes].” This indicator was initially considered as an indicator of a country’s individual economic tech pro�le. It was discarded primarily because we were unable to �nd suf�cient information about the method of surveying people and thus the method of compiling each individual country’s rating. We were therefore unable to scrutinize the methodology used and to assess the indicator’s quality.
Web Index: Political Party Use of Web for Mobilization
This indicator is a component of the Web Foundation’s Web Index. It is based on polling asking: “To what extent do political parties use the Web to mobilize members or other citizens to take action, such as attend a political rally or vote?” We were unable to scrutinize the methodology used in detail and to assess the indicator’s quality. We therefore did not use data based on the Web Index.
BTI Status Score
The Bertelsmann Stiftung’s Transformation Index (BTI) analyzes and evaluates whether and how developing countries and countries in transition are steering social change toward democracy and a market economy. We initially considered the index itself as an indicator but opted to use speci�c indicators of the index that were more speci�c and relevant for our research question instead. In order to not double count certain indicators, we eliminated the overall index.
BTI: Interest Groups
For this BTI indicator, experts rate “interest groups” on a 1–10 scale. This indicator was initially considered as a proxy for a state’s propensity to cooperate internationally. It was ultimately discarded on the basis that “government as a credible partner” is a better indicator of a country’s propensity to cooperate internationally.
BTI: CSO Traditions
In this BTI indicator, experts rate “Civil Society Organizations (CSO) Traditions” on a 1–10 scale. We consider civil society participation, which is part of the 12 indicators selected to identify the top 30 potential swing states, to be a better indicator of the civil society environment overall than CSO Traditions. We therefore discarded the latter.
US Agency for International Development: USAID NGO Index — NGO Sustainability
The USAID NGO Index measures the sustainability of each country’s CSO sector based on seven dimensions:
legal environment, organizational capacity, �nancial viability, advocacy, service provision, infrastructure and public image. The data is based on regions, but did not cover enough countries to provide additional meaningful information for this study.
Reporters Without Borders: Press Freedom Index
The Press Freedom Index, published annually by Reporters Without Borders, measures the level of freedom of information in 179 countries. It is based partly on a questionnaire that is sent to a network of partner organizations, correspondents and journalists, researchers, jurists and human rights activists. Choosing among the various indexes relating to political systems and freedom, we selected the Freedom in the World index by Freedom House and the Democracy Index by the Economist Intelligence Unit instead as more relevant indicators.
Freedom House: Freedom of the Net Index
The 2013 Freedom of the Net report ranks 60 countries based on the level of Internet and digital media freedom. It builds on the Freedom House index used in this chapter but is limited to only 60 countries, which is why we did not include the Freedom of the Net Index in our methodology even though its focus more directly relates to the topic of this study.
World Bank: Fixed Broadband Internet Subscribers
Fixed broadband Internet subscribers are the number of broadband subscribers with a digital subscriber line, cable modem, or other high-speed technology. Initially considered as an indicator of a country’s individual tech pro�le, it was discarded in favour of Internet penetration rate. We consider the latter to be a more useful indicator for this study’s research question and scope.
World Bank: International Internet Bandwidth
International Internet bandwidth (kb/s) per Internet user was initially considered as an indicator of a country’s individual tech pro�le. We discarded this indicator because we consider Internet penetration rate to be a more relevant indicator of a country’s tech pro�le.
World Bank: Mobile Phone Penetration Rates
Initially considered as an indicator of a country’s individual tech pro�le, this indicator was discarded because Internet penetration rate was deemed a more relevant indicator of a country’s Internet capacity. Mobile phone penetration rates also face the methodological challenge of individuals
RESEARCH VOLUME SIX: THE SHIFTING GEOPOLITICS OF INTERNET ACCESS
120 • CENTRE FOR INTERNATIONAL GOVERNANCE INNOVATION • CHATHAM HOUSE
having multiple subscriptions and aggregate data to provide meaningful information.
World Bank: Worldwide Governance Indicators — Political Stability and Absence of Violence
Political Stability and Absence of Violence/Terrorism measures perceptions of the likelihood that the government will be destabilized or overthrown by unconstitutional or violent means, including politically motivated violence and terrorism. This table lists the individual variables from each data source used to construct this measure in the Worldwide Governance Indicators. We initially considered these indicators as a component of a country’s human capacity pro�le, but eliminated it along with all other human capacity pro�le indicators once we established that human capacity was not directly relevant for the research question.
US Census Bureau: Percentage of Population Aged 15–29
This indicator was eliminated with all other human capacity pro�le indicators once we established that human capacity was not directly relevant for the research question.
World Bank: Literacy Rate
The literacy rate is the percentage of the population age 15 and above who can, with understanding, read and write a short, simple statement on their everyday life. Generally, “literacy” also encompasses “numeracy,” the ability to make simple arithmetic calculations. This indicator was initially considered as a component of a country’s human capacity pro�le, but was discarded because the data was insuf�cient, as it only covered a small portion of the states on the list, and we established that human capacity was not directly relevant for the research question.
Human Development Index
The �rst Human Development Report introduced a new way of measuring countries’ development in addition to the traditional GDP indicators. It combines indicators of life expectancy, educational attainment and income into a composite human development index, the HDI. We ultimately decided that the HDI does not provide information directly relevant to the research question and therefore discarded it.
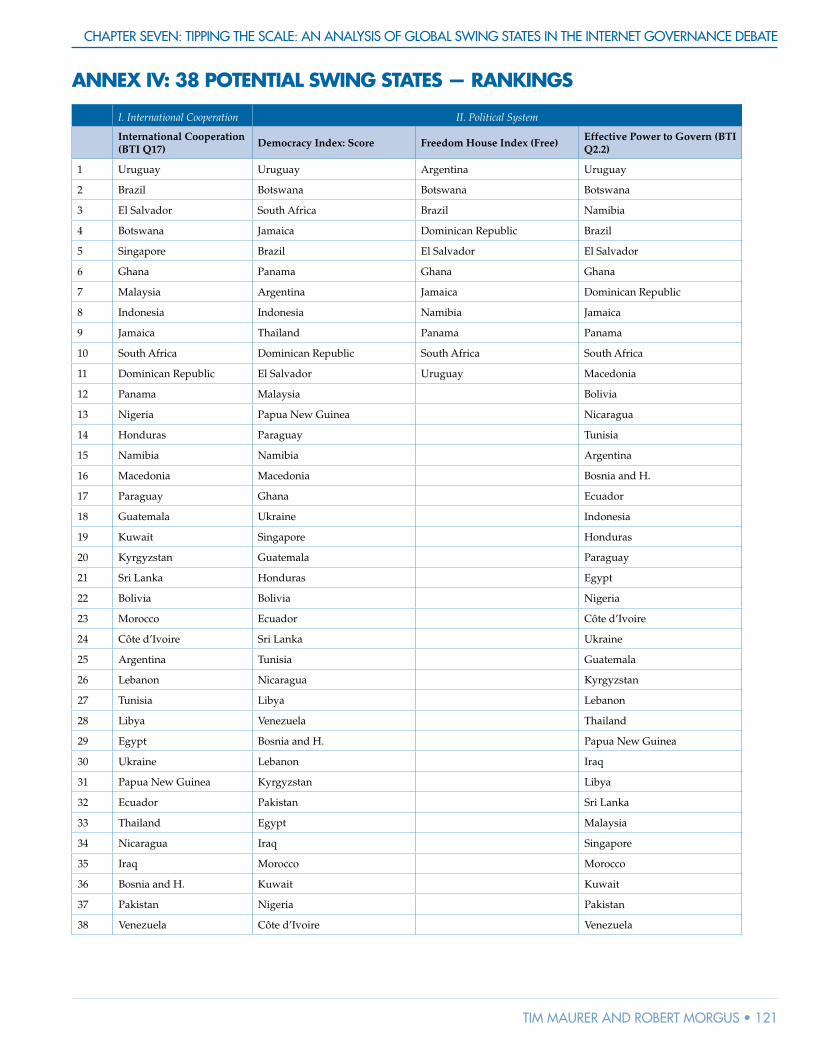
CHAPTER SEVEN: TIPPING THE SCALE: AN ANALYSIS OF GLOBAL SWING STATES IN THE INTERNET GOVERNANCE DEBATE
TIM MAURER AND ROBERT MORGUS • 121
ANNEX IV: 38 POTENTIAL SWING STATES — RANKINGS
I. International Cooperation II. Political System
International Cooperation (BTI Q17)
Democracy Index: Score Freedom House Index (Free)Effective Power to Govern (BTI Q2.2)
1 Uruguay Uruguay Argentina Uruguay
2 Brazil Botswana Botswana Botswana
3 El Salvador South Africa Brazil Namibia
4 Botswana Jamaica Dominican Republic Brazil
5 Singapore Brazil El Salvador El Salvador
6 Ghana Panama Ghana Ghana
7 Malaysia Argentina Jamaica Dominican Republic
8 Indonesia Indonesia Namibia Jamaica
9 Jamaica Thailand Panama Panama
10 South Africa Dominican Republic South Africa South Africa
11 Dominican Republic El Salvador Uruguay Macedonia
12 Panama Malaysia Bolivia
13 Nigeria Papua New Guinea Nicaragua
14 Honduras Paraguay Tunisia
15 Namibia Namibia Argentina
16 Macedonia Macedonia Bosnia and H.
17 Paraguay Ghana Ecuador
18 Guatemala Ukraine Indonesia
19 Kuwait Singapore Honduras
20 Kyrgyzstan Guatemala Paraguay
21 Sri Lanka Honduras Egypt
22 Bolivia Bolivia Nigeria
23 Morocco Ecuador Côte d’Ivoire
24 Côte d’Ivoire Sri Lanka Ukraine
25 Argentina Tunisia Guatemala
26 Lebanon Nicaragua Kyrgyzstan
27 Tunisia Libya Lebanon
28 Libya Venezuela Thailand
29 Egypt Bosnia and H. Papua New Guinea
30 Ukraine Lebanon Iraq
31 Papua New Guinea Kyrgyzstan Libya
32 Ecuador Pakistan Sri Lanka
33 Thailand Egypt Malaysia
34 Nicaragua Iraq Singapore
35 Iraq Morocco Morocco
36 Bosnia and H. Kuwait Kuwait
37 Pakistan Nigeria Pakistan
38 Venezuela Côte d’Ivoire Venezuela

RESEARCH VOLUME SIX: THE SHIFTING GEOPOLITICS OF INTERNET ACCESS
122 • CENTRE FOR INTERNATIONAL GOVERNANCE INNOVATION • CHATHAM HOUSE
III. Civil Society Pro�le IV. Internet Access
Civicus Enabling Environment IndexCivil Society Participation (BTI Q16.4)
Internet Penetration Rate (users per 100 people)
Threshold: over 1/3
1 Uruguay Uruguay Kuwait
2 Argentina Brazil Singapore
3 Brazil Bolivia Malaysia
4 South Africa Botswana Bosnia and H.
5 Botswana El Salvador Macedonia
6 Panama Ghana Lebanon
7 El Salvador Indonesia Argentina
8 Ghana Kyrgyzstan Uruguay
9 Ukraine Jamaica Morocco
10 Macedonia South Africa Brazil
11 Guatemala Macedonia Jamaica
12 Namibia Argentina Panama
13 Bolivia Honduras Dominican Republic
14 Bosnia and H. Paraguay Egypt
15 Indonesia Lebanon Venezuela
16 Dominican Republic Namibia Tunisia
17 Thailand Tunisia South Africa
18 Malaysia Bosnia and H. Ecuador
19 Ecuador Ecuador Bolivia
20 Honduras Guatemala Ukraine
21 Nicaragua Thailand
22 Kyrgyzstan Libya
23 Venezuela Malaysia
24 Morocco Singapore
25 Iraq Morocco
26 Egypt Kuwait
27 Nigeria Dominican Republic
28 Panama
29 Nicaragua
30 Egypt
31 Nigeria
32 Côte d’Ivoire
33 Ukraine
34 Papua New Guinea
35 Iraq
36 Sri Lanka
37 Pakistan
38 Venezuela

CHAPTER SEVEN: TIPPING THE SCALE: AN ANALYSIS OF GLOBAL SWING STATES IN THE INTERNET GOVERNANCE DEBATE
TIM MAURER AND ROBERT MORGUS • 123
V. Tech Economy
ICT Goods exports (as a % of total)ICT Services Exports (as a % of total)
ICT Goods imports (as a % of total)
Threshold: over 1% Threshold: over 10% Threshold: over 5%
1 Singapore Lebanon Singapore
2 Malaysia Brazil Malaysia
3 Thailand Argentina Paraguay
4 Panama Botswana Thailand
5 Tunisia Indonesia Brazil
6 Indonesia Kuwait Argentina
7 Morocco Malaysia Panama
8 Ukraine Namibia South Africa
9 South Africa Sri Lanka Indonesia
10 Macedonia Tunisia
11 Singapore Ecuador
12 Guatemala Venezuela
13 Morocco Guatemala
14 Pakistan Uruguay
15 Ukraine Nigeria
16 Nicaragua El Salvador
17 Thailand Honduras
18 Kyrgyzstan
19 Uruguay
20 Iraq
21 Venezuela
22 Bolivia
23 El Salvador
24 Honduras
25 South Africa
26
27
28
29
30
31
32
33
34
35
36
37
38

RESEARCH VOLUME SIX: THE SHIFTING GEOPOLITICS OF INTERNET ACCESS
124 • CENTRE FOR INTERNATIONAL GOVERNANCE INNOVATION • CHATHAM HOUSE
VI. Active Government InterestSwing states in alphabetical order: aggregate occurrences in top 15 of 12 selected indicators
Swing states ranked based on aggregate occurrences in top 15 of 12 selected indicators WCIT
participation**UN GGEs
1 Bolivia Argentina Argentina 10 Brazil 11
2 Bosnia and H. Brazil Bolivia 2 Argentina 10
3 Ecuador Egypt Bosnia and H. 2 South Africa 10
4 Honduras Indonesia Botswana 8 Panama 9
5 Macedonia Malaysia Brazil 11 Uruguay 9
6 Nicaragua South Africa Cote d'Ivoire 1 Botswana 8
7 Pakistan Dominican Republic 6 Indonesia 8
8 Ecuador 1 El Salvador*** 7
9 Egypt 3 Jamaica 7
10 El Salvador*** 7 Malaysia 7
11 Ghana 6 Namibia 7
12 Guatemala 4 Dominican Republic 6
13 Honduras 2 Ghana 6
14 Indonesia 8 Singapore 6
15 Iraq 1 Macedonia 5
16 Jamaica 7 Guatemala 4
17 Kuwait 3 Lebanon 4
18 Kyrgyzstan 2 Morocco 4
19 Lebanon 4 Paraguay 4
20 Libya 1 Thailand 4
21 Macedonia 5 Tunisia 4
22 Malaysia 7 Ukraine 4
23 Morocco 4 Egypt 3
24 Namibia 7 Kuwait 3
25 Nicaragua 1 Nigeria 3
26 Nigeria 3 Venezuela 3
27 Pakistan 1 Bolivia 2
28 Panama 9 Bosnia and H. 2
29 Papua New Guinea 2 Honduras 2
30 Paraguay 4 Kyrgyzstan 2
31 Singapore 6 Papua New Guinea 2
32 South Africa 10 Sri Lanka 2
33 Sri Lanka 2 Cote d'Ivoire 1
34 Thailand 4 Ecuador 1
35 Tunisia 4 Iraq 1
36 Ukraine 4 Libya 1
37 Uruguay 9 Nicaragua 1
38 Venezuela 3 Pakistan 1
** The countries listed in this column do not appear in the ITU’s WCIT outcome table (see Annex II) indicating a lack of active government interest incorporated accordingly in the overall weighting. *** El Salvador is not included in the top 30 potential swing states list because it only appears in the top 15 of non-Internet policy speci�c indicators except for WCIT participation.
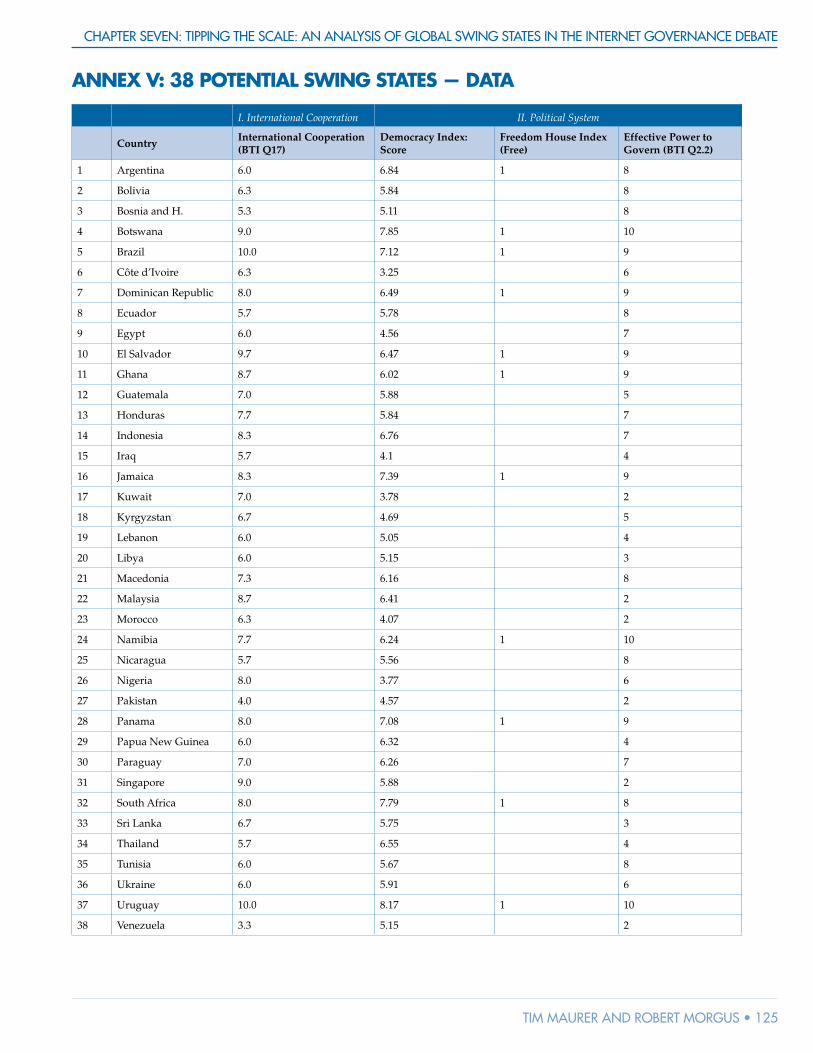
CHAPTER SEVEN: TIPPING THE SCALE: AN ANALYSIS OF GLOBAL SWING STATES IN THE INTERNET GOVERNANCE DEBATE
TIM MAURER AND ROBERT MORGUS • 125
ANNEX V: 38 POTENTIAL SWING STATES — DATA
I. International Cooperation II. Political System
CountryInternational Cooperation (BTI Q17)
Democracy Index: Score
Freedom House Index (Free)
Effective Power to Govern (BTI Q2.2)
1 Argentina 6.0 6.84 1 8
2 Bolivia 6.3 5.84 8
3 Bosnia and H. 5.3 5.11 8
4 Botswana 9.0 7.85 1 10
5 Brazil 10.0 7.12 1 9
6 Côte d’Ivoire 6.3 3.25 6
7 Dominican Republic 8.0 6.49 1 9
8 Ecuador 5.7 5.78 8
9 Egypt 6.0 4.56 7
10 El Salvador 9.7 6.47 1 9
11 Ghana 8.7 6.02 1 9
12 Guatemala 7.0 5.88 5
13 Honduras 7.7 5.84 7
14 Indonesia 8.3 6.76 7
15 Iraq 5.7 4.1 4
16 Jamaica 8.3 7.39 1 9
17 Kuwait 7.0 3.78 2
18 Kyrgyzstan 6.7 4.69 5
19 Lebanon 6.0 5.05 4
20 Libya 6.0 5.15 3
21 Macedonia 7.3 6.16 8
22 Malaysia 8.7 6.41 2
23 Morocco 6.3 4.07 2
24 Namibia 7.7 6.24 1 10
25 Nicaragua 5.7 5.56 8
26 Nigeria 8.0 3.77 6
27 Pakistan 4.0 4.57 2
28 Panama 8.0 7.08 1 9
29 Papua New Guinea 6.0 6.32 4
30 Paraguay 7.0 6.26 7
31 Singapore 9.0 5.88 2
32 South Africa 8.0 7.79 1 8
33 Sri Lanka 6.7 5.75 3
34 Thailand 5.7 6.55 4
35 Tunisia 6.0 5.67 8
36 Ukraine 6.0 5.91 6
37 Uruguay 10.0 8.17 1 10
38 Venezuela 3.3 5.15 2
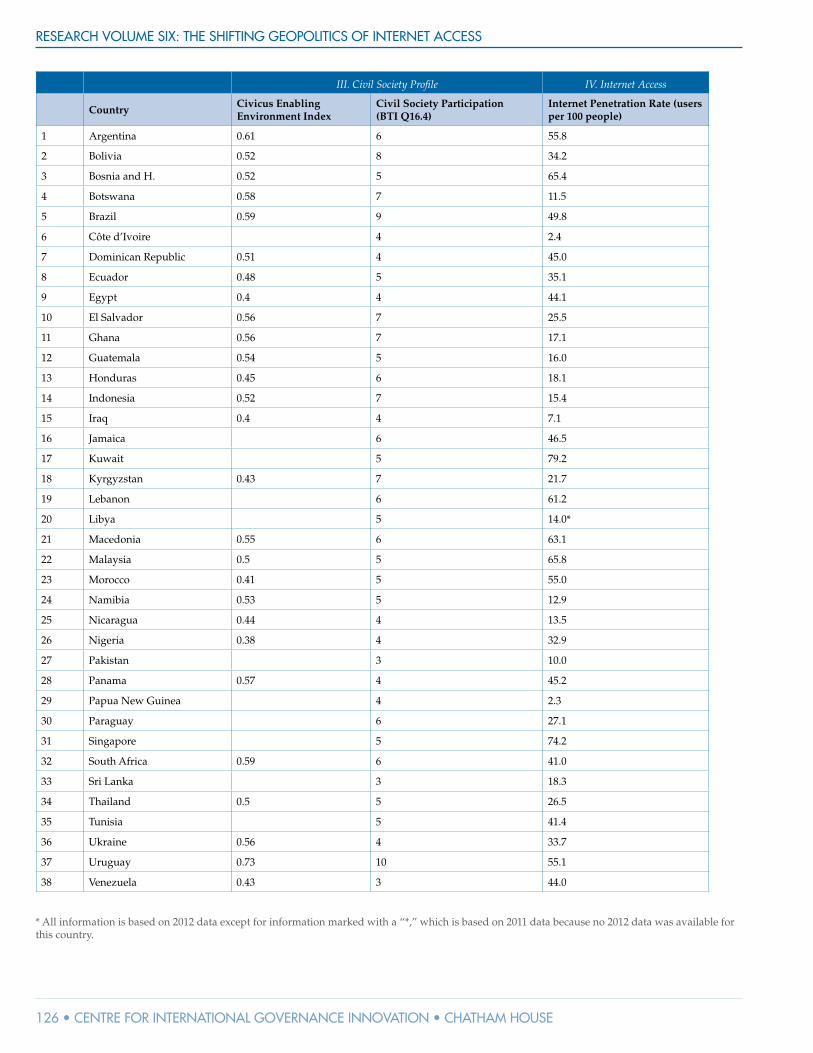
RESEARCH VOLUME SIX: THE SHIFTING GEOPOLITICS OF INTERNET ACCESS
126 • CENTRE FOR INTERNATIONAL GOVERNANCE INNOVATION • CHATHAM HOUSE
III. Civil Society Pro�le IV. Internet Access
CountryCivicus Enabling Environment Index
Civil Society Participation (BTI Q16.4)
Internet Penetration Rate (users per 100 people)
1 Argentina 0.61 6 55.8
2 Bolivia 0.52 8 34.2
3 Bosnia and H. 0.52 5 65.4
4 Botswana 0.58 7 11.5
5 Brazil 0.59 9 49.8
6 Côte d’Ivoire 4 2.4
7 Dominican Republic 0.51 4 45.0
8 Ecuador 0.48 5 35.1
9 Egypt 0.4 4 44.1
10 El Salvador 0.56 7 25.5
11 Ghana 0.56 7 17.1
12 Guatemala 0.54 5 16.0
13 Honduras 0.45 6 18.1
14 Indonesia 0.52 7 15.4
15 Iraq 0.4 4 7.1
16 Jamaica 6 46.5
17 Kuwait 5 79.2
18 Kyrgyzstan 0.43 7 21.7
19 Lebanon 6 61.2
20 Libya 5 14.0*
21 Macedonia 0.55 6 63.1
22 Malaysia 0.5 5 65.8
23 Morocco 0.41 5 55.0
24 Namibia 0.53 5 12.9
25 Nicaragua 0.44 4 13.5
26 Nigeria 0.38 4 32.9
27 Pakistan 3 10.0
28 Panama 0.57 4 45.2
29 Papua New Guinea 4 2.3
30 Paraguay 6 27.1
31 Singapore 5 74.2
32 South Africa 0.59 6 41.0
33 Sri Lanka 3 18.3
34 Thailand 0.5 5 26.5
35 Tunisia 5 41.4
36 Ukraine 0.56 4 33.7
37 Uruguay 0.73 10 55.1
38 Venezuela 0.43 3 44.0
* All information is based on 2012 data except for information marked with a “*,” which is based on 2011 data because no 2012 data was available for this country.

CHAPTER SEVEN: TIPPING THE SCALE: AN ANALYSIS OF GLOBAL SWING STATES IN THE INTERNET GOVERNANCE DEBATE
TIM MAURER AND ROBERT MORGUS • 127
V. Tech Economy VI. Active Government Interest
CountryICT Goods Imports (as a % of total)
ICT Services Exports (as a % of total)
ICT Goods Imports (as a % of total)
WCIT Participation
UN GGEsFreedom Online Coalition
1 Argentina 0.10 46.01 8.29 1 1
2 Bolivia 0.00 11.79 3.24
3 Bosnia 0.19 5.55 2.68
4 Botswana 0.19 40.89 2.45 1
5 Brazil 0.55 55.75 8.82 1 1
6 Côte d’Ivoire 0.05* 3.08* 1
7 Dominican Republic 0.93 4.35 3.24 1
8 Ecuador 0.07 6.43
9 Egypt 0.24 7.28 3.43 1 1
10 El Salvador 0.37 11.47 5.01 1
11 Ghana 0.05 4.42 1 1
12 Guatemala 0.32 21.88 5.65 1
13 Honduras 0.29 11.19 5.00
14 Indonesia 4.06 38.23 7.08 1 1
15 Iraq 11.97 1
16 Jamaica 0.39 9.45 2.50 1
17 Kuwait 34.46 1
18 Kyrgyzstan 0.08 15.90 2.34 1
19 Lebanon 0.65 56.76 2.18 1
20 Libya 1
21 Macedonia 0.31 23.99 4.01
22 Malaysia 27.92 27.86 23.09 1 1
23 Morocco 3.08 21.80 3.51 1
24 Namibia 0.65 26.99* 3.10 1
25 Nicaragua 0.18 18.65 4.13
26 Nigeria 0.00 4.39 5.54 1
27 Pakistan 0.24 20.06 4.36
28 Panama 7.87* 8.08 8.08* 1
29 Papua New Guinea 0.01 2.21 1
30 Paraguay 0.09 1.94 19.11 1
31 Singapore 28.40 23.96 23.41 1
32 South Africa 1.05 10.56 7.64 1 1
33 Sri Lanka 0.50 24.62 3.72 1
34 Thailand 16.04 16.19 11.82 1
35 Tunisia 7.38* 9.56 6.63* 1 1
36 Ukraine 1.10 19.21 3.77 1
37 Uruguay 0.09 15.87 5.64 1
38 Venezuela 0.01* 11.91 6.39* 1
* All information is based on 2012 data except for information marked with a “*,” which is based on 2011 data because no 2012 data was available for this country.

ABOUT CIGIWe are the Centre for International Governance Innovation: an independent, non-partisan think tank with an objective and uniquely global perspective. Our research, opinions and public voice make a difference in today’s world by bringing clarity and innovative thinking to global policy making. By working across disciplines and in partnership with the best peers and experts, we are the benchmark for in�uential research and trusted analysis.
Our research programs focus on governance of the global economy, global security and politics, and international law in collaboration with a range of strategic partners and support from the Government of Canada, the Government of Ontario, as well as founder Jim Balsillie.
Au Centre pour l’innovation dans la gouvernance internationale (CIGI), nous formons un groupe de ré�exion indépendant et non partisan qui formule des points de vue objectifs dont la portée est notamment mondiale. Nos recherches, nos avis et l’opinion publique ont des effets réels sur le monde d’aujourd’hui en apportant autant de la clarté qu’une ré�exion novatrice dans l’élaboration des politiques à l’échelle internationale. En raison des travaux accomplis en collaboration et en partenariat avec des pairs et des spécialistes interdisciplinaires des plus compétents, nous sommes devenus une référence grâce à l’in�uence de nos recherches et à la �abilité de nos analyses.
Nos programmes de recherche ont trait à la gouvernance dans les domaines suivants : l’économie mondiale, la sécurité et les politiques mondiales, et le droit international, et nous les exécutons avec la collaboration de nombreux partenaires stratégiques et le soutien des gouvernements du Canada et de l’Ontario ainsi que du fondateur du CIGI, Jim Balsillie.
For more information, please visit www.cigionline.org.
ABOUT CHATHAM HOUSEChatham House, the Royal Institute of International Affairs, is based in London. Chatham House’s mission is to be a world-leading source of independent analysis, informed debate and in�uential ideas on how to build a prosperous and secure world for all. The institute: engages governments, the private sector, civil society and its members in open debates and con�dential discussions about signi�cant developments in international affairs; produces independent and rigorous analysis of critical global, regional and country-speci�c challenges and opportunities; and offers new ideas to decision-makers and -shapers on how these could best be tackled from the near- to the long-term. For more information, please visit: www.chathamhouse.org.
CIGI MASTHEAD
ExecutivePresident Rohinton P. Medhora
Director of Finance Shelley Boettger
Director of the International Law Research Program Oonagh Fitzgerald
Director of the Global Security & Politics Program Fen Osler Hampson
Director of Human Resources Susan Hirst
Director of the Global Economy Program Domenico Lombardi
Chief Operating Of�cer and General Counsel Aaron Shull
Director of Communications and Digital Media Spencer Tripp
PublicationsPublisher Carol Bonnett
Senior Publications Editor Jennifer Goyder
Publications Editor Patricia Holmes
Publications Editor Nicole Langlois
Publications Editor Sharon McCartney
Publications Editor Lynn Schellenberg
Graphic Designer Melodie Wake�eld
For publications enquiries, please contact [email protected].
CommunicationsFor media enquiries, please contact [email protected].

Research Volume Six
Global Commission on Internet Governance
The Shifting Geopolitics of Internet Access From Broadband and Net Neutrality to Zero-rating
67 Erb Street West Waterloo, Ontario N2L 6C2, Canada tel +1 519 885 2444 fax +1 519 885 5450 www.cigionline.org
10 St James’s Square London, England SW1Y 4LE United Kingdom tel +44 (0)20 7957 5700 fax +44 (0)20 7957 5710 www.chathamhouse.org
Research Volume Six The Shifting Geopolitics of Internet Access: From
Broadband and Net Neutrality to Zero-rating


![GÉOPOLITIQUE ET POPULATIONS AU TCHAD [Geopolitics and populations in Chad]](https://static.fdokumen.com/doc/165x107/631378e5fc260b71020f1c3f/geopolitique-et-populations-au-tchad-geopolitics-and-populations-in-chad.jpg)

