The Shake Out Scenario: A Hypothetical M7.8 Earthquake on the Southern San Andreas Fault
24
CREATE Research Archive Non-published Research Reports 2010 e Shake Out Scenario: A Hypothetical M7.8 Earthquake on the Southern San Andreas Fault Keith Porter University of Colorado, Boulder Lucille Jones Dale Cox James Goltz Ken Hudnut See next page for additional authors Follow this and additional works at: hp://research.create.usc.edu/nonpublished_reports is Article is brought to you for free and open access by CREATE Research Archive. It has been accepted for inclusion in Non-published Research Reports by an authorized administrator of CREATE Research Archive. For more information, please contact [email protected]. Recommended Citation Porter, Keith; Jones, Lucille; Cox, Dale; Goltz, James; Hudnut, Ken; Mileti, Dennis; Perry, Sue; Ponti, Daniel; Reichle, Michael; Rose, Adam Z.; Scawthorn, Charles; Seligson, Hope A.; Shoaf, Kimberly I.; Treiman, Jerry; and Wein, Anne, "e Shake Out Scenario: A Hypothetical M7.8 Earthquake on the Southern San Andreas Fault" (2010). Non-published Research Reports. Paper 79. hp://research.create.usc.edu/nonpublished_reports/79
-
Upload
independent -
Category
Documents
-
view
0 -
download
0
Transcript of The Shake Out Scenario: A Hypothetical M7.8 Earthquake on the Southern San Andreas Fault
CREATE Research Archive
Non-published Research Reports
2010
The Shake Out Scenario: A Hypothetical M7.8Earthquake on the Southern San Andreas FaultKeith PorterUniversity of Colorado, Boulder
Lucille Jones
Dale Cox
James Goltz
Ken Hudnut
See next page for additional authors
Follow this and additional works at: http://research.create.usc.edu/nonpublished_reports
This Article is brought to you for free and open access by CREATE Research Archive. It has been accepted for inclusion in Non-published ResearchReports by an authorized administrator of CREATE Research Archive. For more information, please contact [email protected].
Recommended CitationPorter, Keith; Jones, Lucille; Cox, Dale; Goltz, James; Hudnut, Ken; Mileti, Dennis; Perry, Sue; Ponti, Daniel; Reichle, Michael; Rose,Adam Z.; Scawthorn, Charles; Seligson, Hope A.; Shoaf, Kimberly I.; Treiman, Jerry; and Wein, Anne, "The Shake Out Scenario: AHypothetical M7.8 Earthquake on the Southern San Andreas Fault" (2010). Non-published Research Reports. Paper 79.http://research.create.usc.edu/nonpublished_reports/79

AuthorsKeith Porter, Lucille Jones, Dale Cox, James Goltz, Ken Hudnut, Dennis Mileti, Sue Perry, Daniel Ponti,Michael Reichle, Adam Z. Rose, Charles Scawthorn, Hope A. Seligson, Kimberly I. Shoaf, Jerry Treiman, andAnne Wein
This article is available at CREATE Research Archive: http://research.create.usc.edu/nonpublished_reports/79
Revision submitted to Earthquake Spectra 12 Mar 2009
The ShakeOut Scenario: a Hypothetical MW7.8 Earthquake on the Southern San Andreas Fault
Keith Portera
ABSTRACT
) M.EERI, Lucile Jonesb) M.EERI, Dale Coxb), James Goltzc) M.EERI, Ken Hudnutb), Dennis Miletid) M.EERI, Sue Perryb), Daniel Pontib), Michael Reichlee), Adam Z. Rosef) M.EERI, Charles R. Scawthorna) M.EERI, Hope A. Seligsong) M.EERI, Kimberley I. Shoafh) M.EERI, Jerry Treimane), and Anne Weinb)
An earthquake planning scenario document was recently released by the
USGS and California Geological Survey that hypothesizes the occurrence and
effects of a MW7.8 earthquake on the southern San Andreas Fault. It was created
by more than 300 scientists and engineers. Fault offsets reach 13m, and up to 8m
at lifeline crossings. Physics-based modeling was used to generate maps of
shaking intensity, with peak ground velocities of 3 m/sec near the fault and
exceeding 0.5 m/sec over 10,000 km2. A custom HAZUS®MH analysis and 18
special studies were performed to characterize the effects of the earthquake on the
built environment. The scenario posits 1,800 deaths and 53,000 injuries requiring
emergency-room care. Approximately 1,600 fires are ignited, resulting in the
destruction of 200 million square feet of the building stock, the equivalent of
133,000 single-family homes. Fire contributes $87 billion in property and
business interruption loss, out of the total $213 billion in economic loss, with
most of the rest coming from shake-related building and content damage ($46
billion) and business interruption loss from water outages ($53 billion).
Emergency response activities are depicted in detail, in an innovative grid
showing activities versus time, a new format introduced in this study.
a SPA Risk LLC, Denver CO, and Kyoto Japan, [email protected] b US Geological Survey, Pasadena, Menlo Park, and Sacramento CA c California Governor’s Office of Emergency Services, Pasadena CA d University of Colorado at Boulder, ret. e California Geological Survey, Sacramento CA f. University of Southern California, Los Angeles, CA g MMI Engineering, Huntington Beach CA h University of California at Los Angeles

2
INTRODUCTION
Many earthquake planning scenarios have been prepared for California and elsewhere.
The National Oceanic and Atmospheric Administration and the California Geological Survey
have produced planning scenarios for several large California earthquakes (e.g., Algermissen
et al. 1972 and 1973, Steinbrugge et al. 1987, Toppozada et al. 1988). The Earthquake
Engineering Research Institute supported earthquake planning scenarios for the New Madrid
Seismic Zone, the Hayward Fault, the Seattle Fault, and the northern San Andreas and
developed guidelines on creating such scenarios (Preuss and Godfrey 2006). The present
effort, like previous ones, aims to inform preparedness planning. It examines a M7.8
earthquake on the southern San Andreas Fault. It is novel in several ways.
First, like some other studies, physical impacts were estimated using software such as
HAZUS®MH, but unlike prior work, model estimates were in parts supplemented or replaced
by the findings of 18 focus studies, panel discussions, or a combination. Panel participants
included approximately 100 operators, engineers, and other experts from the public utilities
and lifeline agencies whose damages are estimated, thus engaging the people most intimately
familiar with and responsible for lifeline risk, preparedness, and mitigation. They probably
took the scenario more seriously having developed it themselves than had outsiders done it.
Second, the scenario was coupled with emergency response and recovery exercises, seminars,
and an extensive outreach effort that ultimately involved 5.5 million people—nearly 1 in 7
Californians.
Third, the scenario employs cutting-edge research. Ground-motion estimates were
developed from physics-based modeling, i.e., by calculating wave propagation from the
rupture through the earth’s crust to a grid of points on the earth’s surface, rather than through
seismic attenuation relationships (although results were compared with attenuation results).
Fourth, the scenario goes beyond describing outcomes: in almost every topic, it notes
research needs and more importantly offers two or three practical measures to prepare for or
physically mitigate the negative impacts of the scenario earthquake. Finally, the authors of
many sections and special studies are the world’s leading figures in the field under
consideration, as opposed to competent people applying principles developed by others.
In total, more than 300 practitioners, academics, and government technical experts from
more than 50 organizations prepared the most extensive earthquake planning scenario ever
created for California. It was led by the U.S. Geological Survey, California Geological

3
Survey, and others among the present authors. It was desired that the scenario event occur in
southern California; be scientifically realistic and consistent with current knowledge; be large
enough and close enough to population centers to have regional, long-term consequences
worth planning for; be likely enough not to be dismissed as a rare or extreme event; and that
it comprise a single, specific outcome, as opposed to a probabilistic range. That is, it
represents one rupture and one outcome in terms of shaking intensity and ground failure,
building damage, casualties, and other consequences. This overview summarizes the work of
those 300 experts, whose names are listed in an appendix. The reader is referred to Jones et
al. (2008) for the full ShakeOut scenario, and other supporting studies cited later, for more
detail. Note that since the scenario is documented in an open file report whose contents are
subject to change, this manuscript summarizes the scenario as of initial publication. Note also
that the ShakeOut scenario was used as the basis for California’s official Golden Guardian
statewide emergency response exercise and the broader Great Southern California ShakeOut
public exercise on 13 Nov 2008. The exercise writers modified and expanded on the
ShakeOut scenario, so details of the exercises may differ from those presented here.
SETTING
Southern California is home to 6 million households of 20 million people. One in 14
Americans live within the reach of a single great earthquake examined here, one that has
struck before and will again, with perhaps a 1 in 6 chance during the next 30 years. The
setting embraces eight southern California counties: Imperial, Kern Los Angeles, Orange,
Riverside, San Bernardino, San Diego, and Ventura. Upon them operate 725,000 business
establishments with 8 million employees earning $360 billion in annual payroll (exclusive of
benefits; http://www.calmis.ca.gov/file/es202/cew-select.htm). Roughly half of the totals are
in Los Angeles County.
EARTH SCIENCE ASPECTS
The scenario begins with a MW7.8 event on a 300-km segment of the Southern San
Andreas Fault, beginning at the Salton Sea in southern Riverside County (right edge of
Figure 1) and rupturing north across San Bernardino County to Lake Hughes (left side of
Figure 1) in Los Angeles County near Interstate 5 (Hudnut et al. 2008). The Southern San
Andreas is known to have generated earthquakes of approximately this size on average every
150 years (e.g., Weldon et al. 1995). The mean probability of an MW7.75 or greater

4
earthquake on the southern San Andreas within the next 30 years is 16% (min. 8%, max.
34%), based on the latest seismic hazard assessment (Field et al. 2008). The fault segment
where the rupture initiates (from Bombay Beach to the San Gorgonio Pass) last ruptured in
1680, the middle segment (around the San Gorgonio Pass) in 1812, and the northernmost
segment was part of the 1857 Ft Tejon earthquake (e.g., Weldon et al. 1995 or Field et al.
2008). Details of the rupture source, such as slip variation (shown in Figure 1) and rupture
speed variation, were defined based on empirical relations and earthquake source physics
using the recent work of the 2nd Uniform California Earthquake Rupture Forecast (UCERF
2, Hudnut et al. 2008, Graves et al. 2008). Average slip is approximately 6m, and reaches
13m at its greatest. Rupture speed is high (sustained supershear) between Bombay Beach and
San Gorgonio Pass in the ShakeOut, generating especially large ground motions in the Los
Angeles area (Graves et al. 2008).
Figure 1. Scenario fault rupture. Height of the red fence indicates the fault offset at the surface. Near Bombay Beach, modeled surface slip reaches a maximum of 13m (40 ft).
Four independent finite-element models were created to model the propagation of seismic
energy from the rupture surface through the earth’s crust and up to the earth’s surface,
resulting in 3-component ground-motion time histories throughout the affected region.
Measures of shaking in various forms were extracted from these models: peak ground
acceleration (PGA), peak ground velocity (PGV), and 5%-damped spectral acceleration
response (Sa) at several periods, and generally agreed (Figure 2). As recently as several years
ago, such a level of agreement between the main simulation groups had not been attained. In
part, the success in achieving agreement in this case resulted from all groups using an
identical source kinematic rupture description, whereas in the past different groups had each
employed their own source models. Three of the four groups used the same velocity
structure, whereas the fourth group used a newer one with higher resolution. Despite

5
concerns that results might diverge because of this strong difference, even this fourth
simulation showed strong similarities to the other three, which lent considerable strength and
confidence to the results, especially for ground motions with periods longer than 2 to 3
seconds (which of course strongly affect taller structures).
Figure 2. Snapshot of ground velocity 90 seconds after the rupture begins, according to three independent physics-based models (courtesy of G. Ely, R. Graves, J. Bielak and K. Olsen; Southern California Earthquake Center).
The URS model (Graves et al. 2008) was used for the final maps of shaking (e.g., Figure
3). Such physics-based modeling of ground motion contrasts with the use of empirical
attenuation relationships. Though attenuation relationships are probabilistically accurate on
average—and generally agree with the physics-based modeling employed by the scenario—
they tend to ignore directionality in the fault rupture and details of path by which the ground
motion propagates from the fault to various points on the earth’s surface. Directionality
matters here: even the latest attenuation relationships would fail to capture the strong, long-
period motion affecting downtown Los Angeles (e.g., Figure 3, right). Also importantly, even
those attenuation relationships that attempt to account for basin effects did not generate
median motions in the basins as large as did all of the physics-based models.
Ground motions for the scenario were combined with newly developed susceptibility
maps compiled from digital geologic sources to produce maps that show the regional
likelihood of liquefaction and landslide effects produced by the event (Ponti et al. 2008). A
more detailed, deterministic evaluation of landslide and liquefaction effects was also

6
conducted within several mountain passes where numerous lifelines (highways, pipelines,
etc.) are concentrated (Treiman et al. 2008). Ground failure due to liquefaction and landslides
has significant impact on lifelines in these regions. Regionally, between 10,000 and 100,000
landslides, the vast majority of which will be shallow-seated rock falls and soil slides, are
anticipated. Most will occur on steep slopes within the Transverse Ranges, primarily in the
eastern San Gabriel Mountains. Because ground-water levels are typically deep in the interior
of southern California, significant liquefaction is only anticipated north of the Salton Sea, but
localized liquefaction adjacent to perennial stream and river channels, such as in the upper Santa
Ana and Santa Clara river basins, is realistic.
Figure 3. 5%-damped spectral acceleration response at 0.3-sec (left), 1.0-sec (middle) and 3.0-sec (right) periods. Maps were also created of PGA, PGV, Modified Mercalli Intensity, liquefaction, and landsliding. 3-component accelerograms were also used in some subsequent analyses (Graves et al. 2008).
PHYSICAL DAMAGES, DEATHS, AND NONFATAL INJURIES
HAZUS®MH analysis and special studies. FEMA’s HAZUS®MH software, supplemented
with local data, was used to characterize overall damage to the building stock, and some
lifeline damage (Seligson 2008). Eighteen additional studies were performed to examine
physical damage to various aspects of the built environment in more detail. Each was
performed by a small research team, an expert panel, or both. These included 10 lifeline
studies: telecommunications, highways, ports, wastewater and debris disposal, surface streets,
oil and gas pipelines, rail, mass transit, water supply, dams, electric power, and hospitals.
Four building types were examined in detail (unreinforced masonry, older concrete buildings,
highrise steelframe construction, and woodframe buildings). Finally, special studies were
performed to consider elevators, hazardous material release, critical facilities in Palm Springs
(a particularly strongly shaken community), and most notably, fire following earthquake.
HAZUS®MH analysis. HAZUS®MH is FEMA’s loss-estimation tool for emergency
planning. Developed in the 1990s and early 2000s for FEMA by the National Institute of
Building Sciences and a large number of technical experts in a wide variety of disciplines,

7
HAZUS®MH produces societal-level estimates of human and economic consequences of
earthquakes, hurricanes, and floods. To understand how the HAZUS®MH earthquake module
works in general, see Kircher et al. (1997), Kircher and Whitman (1997) or NIBS and FEMA
(2003). The accuracy of a HAZUS®MH analysis can potentially be increased by augmenting
its default inventory databases and by replacing the outputs of its built-in hazard model with
externally derived maps of shaking and ground failure. Both enhancements were undertaken.
First, maps of shaking intensity developed for the project were substituted for the maps
that HAZUS®MH produces. HAZUS®MH considers four parameters: PGA, PGV, Sa(0.3 sec)
and Sa(1.0 sec). The team generated maps of these at the census-tract level, which were
weighted to account for the building-inventory distribution at the census-block level, and
adjusted to account for shaking amplification produced by soil near the ground surface.
Liquefaction and landslide probability maps were also imported to HAZUS®MH, but the loss
estimates were judged to be unreliable and were not used in the final loss totals. Although
locally significant, ground failure is not deemed to significantly add to the regional loss.
Second, the default inventory data and models within HAZUS®MH were enhanced to
reflect 2008 replacement costs and incorporate a detailed database of buildings in Los
Angeles County derived from tax assessor’s data, and calibrated in all counties to reflect
available information on unreinforced masonry buildings tabulated by the California Seismic
Safety Commission. (Similar tax-assessor data for other Southern California counties could
not be acquired in time for this scenario.) The inventory model was also enhanced by
revisiting the construction type mapping schemes to reflect building density concentrations in
urban core areas and construction pattern changes over time throughout the eight counties.
Southern California structural engineering experts provided the local judgment to revisit
these mapping schemes. With these enhancements, HAZUS®MH generated estimates of
damage and economic loss. Results are discussed later.
Scope of work for special studies. As noted earlier, special studies were undertaken to
supplement or replace HAZUS®MH analysis. In general, each special study was charged with
the following tasks:
1. Acquire from scenario leaders the GIS data and imagery of the regional study area,
including maps of scenario ground shaking intensity, fault offset along the rupture, and
landsliding and liquefaction. The study area includes the 8 counties mentioned earlier.

8
2. Acquire from scenario leaders or elsewhere any relevant data about the locations and
features of the aspect of the built environment to be studied. We provided researchers with
the locations and relevant, available features of highrise buildings, the routing of oil and gas
pipelines, fiber optic lines, etc. In many cases, authors were selected who already had
relevant information about the assets they were examining.
3. Summarize the findings of one or two key studies or past reconnaissance efforts that
addressed the physical and operational impacts of earthquakes on the facility type of interest.
4. To the extent practical, characterize the extent, age, structural characteristics, or other
relevant features of the facility type of interest in the strongly shaken area.
5. Summarize how vulnerable are the facilities of interest to earthquake effects, i.e., to
what extent are they damaged or become inoperative as a function of seismic excitation?
6. Without attempting a probabilistic risk analysis, depict a realistic scenario of damage
to the facilities of interest in the study area. What form would the damage take? To the extent
practical, describe roughly how long it would take to restore their functionality. Note that
authors and panels were repeatedly instructed to depict a single, realistic scenario, neither
best nor worst case, but with no particular probability associated with the outcome.
7. What impact does the failure of other lifelines examined during the scenario effort
have on the damage or restoration to the facility type of interest? (E.g., electric power and
water were examined early in the study; these results were offered whenever relevant.) If the
special study was of a lifeline (e.g., oil and gas pipelines), what impact might damage to the
lifeline of interest have on the damage or restoration to other lifelines?
8. Suggest one or two key mitigation efforts that would be most highly cost effective in
reducing the negative effects of the scenario earthquake in terms of repair cost, life safety, or
restoration time (dollars, deaths, and downtime), on the facility type of interest. Emphasize
immediate, low-cost opportunities and the possible use of earthquake early warning.
In some cases the special-study authors used computer models to generate their scenario
outcomes. For example, highway bridge damage and highway transportation delays were
modeled first using REDARS-2 (http://mceer.buffalo.edu/research/redars/). However, the
authors and panels always applied their experience and engineering judgment to arrive at a
final result. In the case of panel studies (power, water, dams, roads, mass transit, wastewater
and debris), all 8 tasks were undertaken in a single 4-hour panel discussion. The discussion
9
began with items 1-3 addressed in 60-90 minutes of presentations by ShakeOut leaders. The
rest of the time was dedicated to answering questions 4-8 through structured discussion.
Notes were taken that were used to write the scenario text. In the case of research studies,
research teams were generally asked to spend no more than 24 labor hours on the task, and
provide a brief written report.
The reason for such short panel discussions and limited research studies is twofold: First,
since the work was undertaken for an emergency planning scenario, this was an appropriate
degree of effort; it was not necessary to develop probabilistic outcomes with more
engineering accuracy. Second, the resources available to carry out these studies were limited.
For the most part panelists were uncompensated, and for the special studies by research
teams, only $30,000 in total was available.
With this background on the scope and general charge to damage studies in mind, we turn
to some of the study outcomes. Space does not permit providing details of all these studies,
but a brief summary of a few such studies may be of interest. Complete summaries can be
found in Jones et al. (2008). Several of the studies are permanently available online; see
http://urbanearth.gps.caltech.edu/scenario08/ or http://www.colorado.edu/hazards/shakeout.html.
SPECIAL STUDIES
Highrise buildings. First, note that steelframe buildings are posited to perform much
better than unreinforced masonry buildings, older concrete buildings, and some other types.
The highrise study is summarized here primarily because readers may be interested in the
sophisticated modeling employed. A study by researchers at the California Institute of
Technology replaced the HAZUS®MH loss estimates for these buildings. The Caltech
researchers created 3-D nonlinear finite element models of 3 highrise steelframe buildings
(Figure 4): an 18-story roughly rectangular building designed to meet the 1982 UBC, the
same building designed to meet the 1997 UBC, and a 19-story L-shaped building designed to
meet the 1997 UBC. All three were analyzed using FRAME3D (Krishnan 2003), a finite
element analysis program created at Caltech that treats material and geometric (P-delta)
nonlinearities. The models were subjected to the 3-component waveforms described above, at
each of 784 points on an approximately 2-km grid.
Each building was analyzed at each point, in two orientations, with and without brittle
(pre-Northridge) moment-frame connections, for a total of 9,408 nonlinear dynamic analyses.

10
Figure 4. Steeframe buildings modeled by Krishnan and Muto (2008) Maps were created showing peak transient interstory drift (PTD) at each gridpoint and each
model. Figure 5 shows the drift value averaged over the 3 buildings, 2 orientations, and 2
connection susceptibilities. In the figure, yellow means PTD of 2.5-5.0%, red refers to 5.0-
7.5%, and dark pink to drift in excess of 7.5%. Consistent with FEMA 356 (ASCE 2000),
drift in excess of 5% is deemed likely to result in red tagging, and drift in excess of 7.5% is
associated with collapse. The existing stock of steelframe buildings in the study area was
identified in part using the Emporis database (www.emporis.com); Emporis is one of the
world’s leading providers of building-related information. Considering the locations of these
buildings, the Caltech authors considered 8 collapses to be realistic for a planning scenario. A
panel of structural engineers who were involved in the SAC Steel Project (1997, e.g.)
reviewed the Caltech study and performed some simple calculations for comparison
purposes. They deemed it realistic that at least one highrise steel building would collapse. For
planning purposes, the scenario therefore posits five collapses in Los Angeles, San
Bernardino, and Orange Counties; four of which are shown in Figure 5. In each location,
there are pre-1994 highrise buildings within 500m of the selected site.
Figure 5. Locations of 4 out of the 5 hypothetical steelframe building collapses. Color overlay from Krishnan and Muto (2008).
11
Fire following earthquake. Scawthorn (2008) has developed a stochastic computer
model of fire ignition, discovery, reporting, response, and suppression (Scawthorn et al.
2005). He applied it to the available scenario data, assuming breezy conditions (10 mph) and
relatively low humidity, and considering the effects of enhancements to firefighting
capability such as recent efforts to strengthen fire stations and ongoing efforts to develop
Community Emergency Response Teams. It is estimated that 200 million square feet of
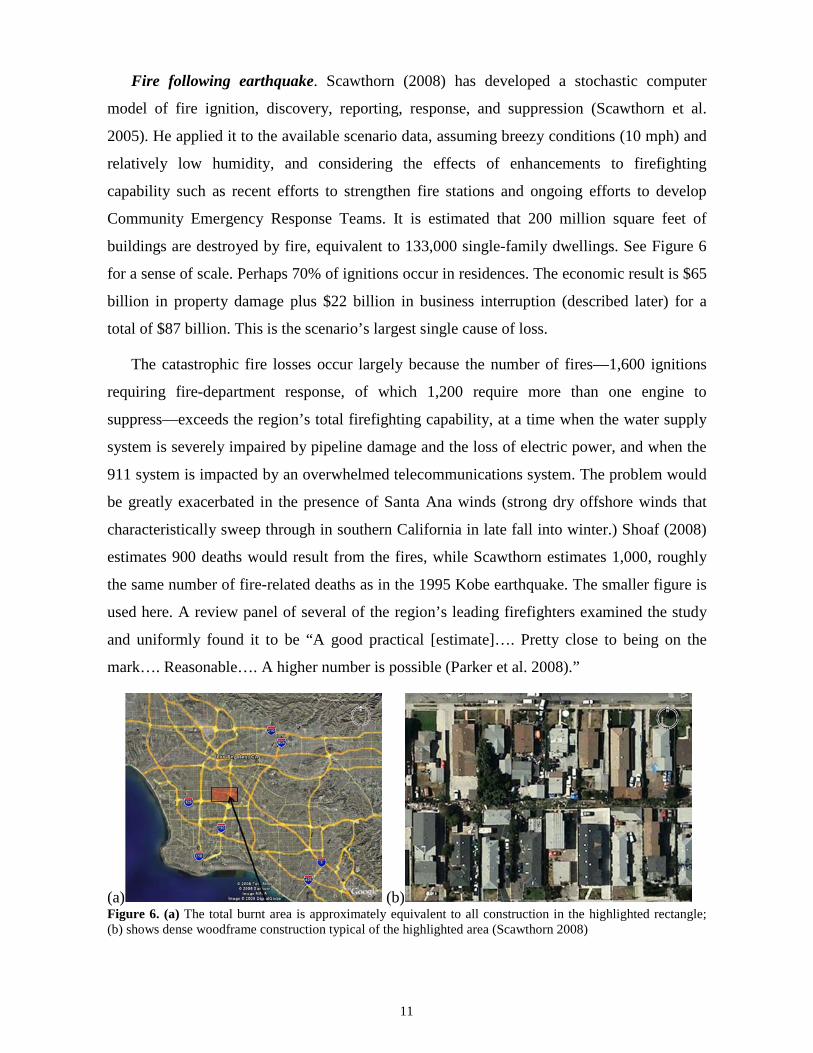
buildings are destroyed by fire, equivalent to 133,000 single-family dwellings. See Figure 6
for a sense of scale. Perhaps 70% of ignitions occur in residences. The economic result is $65
billion in property damage plus $22 billion in business interruption (described later) for a
total of $87 billion. This is the scenario’s largest single cause of loss.
The catastrophic fire losses occur largely because the number of fires—1,600 ignitions
requiring fire-department response, of which 1,200 require more than one engine to
suppress—exceeds the region’s total firefighting capability, at a time when the water supply
system is severely impaired by pipeline damage and the loss of electric power, and when the
911 system is impacted by an overwhelmed telecommunications system. The problem would
be greatly exacerbated in the presence of Santa Ana winds (strong dry offshore winds that
characteristically sweep through in southern California in late fall into winter.) Shoaf (2008)
estimates 900 deaths would result from the fires, while Scawthorn estimates 1,000, roughly
the same number of fire-related deaths as in the 1995 Kobe earthquake. The smaller figure is
used here. A review panel of several of the region’s leading firefighters examined the study
and uniformly found it to be “A good practical [estimate]…. Pretty close to being on the
mark…. Reasonable…. A higher number is possible (Parker et al. 2008).”
(a) (b) Figure 6. (a) The total burnt area is approximately equivalent to all construction in the highlighted rectangle; (b) shows dense woodframe construction typical of the highlighted area (Scawthorn 2008)

12
Several opportunities exist to mitigate these losses: address challenges of reporting
ignitions (e.g., establish a system for text messaging to 911 and develop unmanned aerial
vehicles for fire department reconnaissance); enhance water services such as alternative
water supply systems and create a hardened, highly reliable “backbone” pipeline system; and
enhance energy systems such as wider use of gas shutoff valves and careful review of
petroleum refineries, tank farms, and related facilities near Long Beach, which are of
particular concern.
OTHER IMPACTS
Other notable aspects of scenario physical damages and injury consequences include:
• 1,800 deaths (including 900 resulting from fire) and 53,000 injuries requiring emergency-
room treatment. For a sense of scale, Hurricane Katrina killed in excess of 1,300 people
(NIST 2006). The 8 counties in the strongly shaken area are home to 20 million people,
which means that approximately 1 in 10,000 residents is killed and 1 in 400 is injured to
the extent of needing emergency-room care (Shoaf 2008).
• Hospital damage results in losing 2/3rds of hospital beds in some counties (Pickett 2008).
• Total economic loss of more than 45,000 buildings (1% of the region’s total) from
shaking-related effects, with 260,000 more (1 in 19 buildings) requiring repairs in excess
of 10% of the building’s replacement cost (Seligson 2008).
• Complete economic loss of more than 900 unreinforced masonry buildings (Hess 2008).
• Collapse of 50 older concrete buildings (Taciroglu and Khalili-Tehrani 2008).
• Collapse of 5 highrise (10+ story) steel buildings, resulting in 439 deaths (Shoaf 2008).
There are approximately 800 buildings in the area of 10 stories or greater.
• Temporary loss of electric power throughout Southern California, lasting hours to days.
• Nearly 300,000 sewer leaks or breaks.
• Loss of water supply in the strongest-shaken areas lasting from a few days to several
weeks, partly because of 350,000 water pipeline leaks and breaks, partly from the loss of
electric power to operate pumps, and partly from physical damage to equipment.
• Damage to water supply aqueducts and canals at 32 places where they cross the fault.
• Oil and gas pipelines rupture and explode at fault crossings, hampering repair efforts for
other nearby lifelines (Ballantyne 2008).

13
• Widespread damage to highway abutments and bridges taking up to 7 months to repair,
and damage to two major interstates (I-15 and I-10) where they cross the fault or are
disrupted by landslides or liquefaction.
• Damage to 3 dams serious enough to warrant emergency evacuations.
• Three train derailments, 10-20 rail breaks at fault crossings, and loss of freight rail service
for up to 2 weeks, followed by periodic rail damage due to afterslip (Byers 2008).
• Perhaps hundreds of people trapped in elevators for several hours or more (Schiff 2008).
• Four hazardous material releases (1 ammonia and 3 chlorine gas releases) affecting
315,000 people in Los Angeles, San Bernardino, and Riverside counties (Eguchi and
Ghosh 2008).
• Widespread impairment of telecommunications, largely because call volume overwhelms
service capacity, and from damage to fiber optic lines and other equipment (Tang 2008).
• Practical preparedness and mitigation measures are recommended for many of the
damages discussed here. The reader is referred to Jones et al. (2008) for detail.
ECONOMIC LOSSES
An economic analysis was performed using an input-output (I-O) model to estimate much
of the direct and all the quantified indirect business interruption losses across 20 economic
sectors from major sources of disruption. Wein and Rose (2008) detail their analysis of the
economic impacts of shaking and fire damage to buildings; damage to water, power, gas, and
highway network systems; and the limiting effect of railway network damage on the Ports of
Los Angeles and Long Beach. For each source of disruption, the I-O analysis required
specifying loss of building function, lifeline service outages and transportation capacity
losses over time and space. The analysis recognizes economic resilience such that a portion
of lost productivity is recaptured appropriately for each sector. The eight-county regional
economic loss totals $213 billion, or about perhaps twice the $70 to $130 billion loss
estimated by the Congressional Budget Office (2005) for Hurricane Katrina. The figure
reflects enhancements or replacements to the HAZUS®MH loss estimates, with analyses
ofsuch as the highrise steelframe buildings study and traffic delays. As illustrated in Figure
7, these comprise:

14
• Shaking-induced building damage ($35 billion) and damaged contents and business
inventories ($11 billion). For reference, the building inventory in the 8 affected counties
has a replacement cost of approximately $2 trillion.
• Fire damage to buildings ($40 billion) and contents ($25 billion).
• Lifeline repairs ($2 billion).
• Business interruption ($96 billion), largely from impaired water supply ($53 billion) and
fire following earthquake ($22 billion). This corresponds to 6% of the annual gross
regional output.
• Traffic delays ($4 billion) and other lesser costs.
The scenario does not examine that portion of losses that were commercially insured loss
or the increase in repair costs that has been historically observed to occur in the aftermath of
widespread catastrophes such as Hurricane Andrew or the 1994 Northridge earthquake,
sometimes called demand surge.
Property Damage: $113 billion
Fire-Damaged Contents ($25b)
Highway ($0.4b)
Pipeline (water, sewer, gas;
$1.1b)
Shake-Damaged Buildings
($32.7 billion)
Shake-Damaged Contents ($10.6b)
High-Rise ($2.2b)
High-Rise Content ($0.7b
Fire-Damaged Buildings
($40b)
Business Interruption: $96 billionNon-High-Rise Buildings ($8
billion)
Fire ($22.4b)
Transportation ($0.5b)
Power ($7.3b)
Water ($53b)
Gas ($0.8b)
Ports ($1b) High-Rise Buildings ($3.2b)
Figure 7. Property damage and business-interruption losses
EMERGENCY RESPONSE
Two of us (Mileti and Goltz 2008) characterized the emergency response and
communication activities that take place at 6 different time periods after the earthquake in
each of 17 response functions, which can be generally categorized in 8 groups: crisis
information (by news media, scientific organizations, emergency response organizations,
etc.); search and rescue; victim services (shelter, food and water, etc.); traffic and law
enforcement; emergency operations centers; fire suppression; emergency medical services;
and lifeline restoration. For each response function, we describe in a matrix the activities in
the minutes after the earthquake; 30 minutes later; 2 hours after the earthquake; and 1, 3, and
7 days after the earthquake. Table 1 presents as an example the emergency-response matrix

15
for firefighting. The table is novel: it is the first time emergency response activities have been
depicted in this way. The complete table also includes public policy reactions, again a first.
EXAMPLE USES OF THE SCENARIO
The scenario was recently used as the basis of the 2008 Great Southern California
ShakeOut, the largest ever earthquake response and recovery exercise, involving 5.5 million
people, held in conjunction the largest-ever Golden Guardian exercise led by the State of
California, which involved 5,340 professional responders. It was used by lifeline agencies
(e.g., utility districts), governments, emergency responders, school districts, and others to
prepare for or promote emergency planning and risk mitigation. A few examples follow.
The Los Angeles Unified School District (LAUSD) used the Great Southern California
ShakeOut to initiate a seismic inventory of its 13,800 schools using a smartphone-enabled
version of FEMA 154 (Applied Technology Council 1988, 2002), a method for rapid visual
screening of buildings for potential seismic risk. The system is called Rapid Observation of
Vulnerability and Estimation of Risk (ROVER). LAUSD plans to use the data it collects with
ROVER to estimate likely damage to its buildings in the event of strong earthquakes using
USGS’s ShakeCast system, and then to perform post-earthquake safety evaluation using a
component of ROVER that implements the ATC-20 method (Applied Technology Council
2006) on the same smartphones.
In the Bank of America, more than 20,000 bank associates participated in readiness
exercises. The bank piloted its Emergency Notification and Associate Communication Tool
to quickly assemble leaders, and tested the Core-to-Mission database, a single repository
listing details of critical service-delivery resources. Other bank activities included: an
Earthquake Emergency Preparedness Exposition for 3,200 associates at its Brea call center;
six preparedness seminars with guest speakers from the U.S. Geological Survey and
California Institute of Technology; a drop, cover, and hold drill in eight call and data centers
and a dozen offices; internal communications drills; dissemination of educational materials to
its associates in retail branches; and the use of response playbooks, which set standards for
rapid assembly, escalation and response decisions, and external engagement.
The California Governor’s Office of Emergency Services ran its first-ever exercise for
infrastructure recovery and debris removal. Earlier, more extensive plans were scaled back
largely because of the (real) southern California wildfires of late fall 2008.

16
The scenario raised a number of important research questions that warrant investigation.
For example, since fire is such a large contributor to losses, and fire loss estimates were
based on limited analysis, a more extensive study of fire loss under as-is and mitigated
conditions might help to inform and motivate mitigation decisions.

Table 1. Sample emergency response matrix: firefighting (Mileti and Goltz 2008) Organized and Spontaneous Response Summarized for Five Time Periods After ShakeOut Earthquake
Impact (2-5 Minutes) 30 Minutes 2 Hours 24 Hours 72 Hours 1 Week Organized Spontaneous Organized Spontaneous Organized Spontaneous Organized Spontaneous Organized Spontaneous Organized Spontaneous None. Escape fire. Begin to
locate fires. Priorities being considered.
Localized fires being fought with any available resources such as fire extinguishers.
Western Region
: Fire departments responding to ignitions within jurisdictional boundaries.
Eastern Region
: Fire departments are working to suppress fires on a prioritized basis while requesting mutual aid to fight additional fires.
Problems in fire suppression due to low water pressure (water system damage) and transportation. (Fire departments cannot get equipment across fault rupture or disrupted roads.)
Small fires that were discovered early have been extinguished. Larger fires are either being fought by local fire departments or are burning out of control. While some neighborhood residents are assisting organized fire fighters, local emergent response is currently focused on other response needs (such as transport of injured).
First wave of fire mutual aid equipment and personnel arrive at some accessible locations of critical incident. Other areas that have been seriously damaged and have fires are inaccessible.
Emergent groups continue to fight smaller fires ignited due to aftershocks and accidents. Larger fires are now mainly being fought by organized fire services.
Most fire mutual aid in place. Most of the major fires in the impacted areas are either being fought or have been extinguished.
Groups of residents are monitoring their immediate areas for fires. They suppress the small fires themselves but report the larger ones to local fire departments.
Most major fires in the region have been extinguished. Fire departments and mutual aid responders are available if needed.
Groups of residents are still monitoring their areas for the eruption of fires.
18
County fire officials read the scenario as a warning to prepare for post-earthquake
conflagrations. Several fire agencies are looking into training more members of the
community to be first responders, learning such skills as basic first aid and turning off gas
lines. Los Angeles County Fire Chief Michael Freeman said the county is also looking into
ways to better draw water from other sources during a disaster, such as pools or storm drains
that are collecting runoff from broken pipes.
To deal with the potential for widespread pipeline breakage described in the ShakeOut
scenario, the East Valley Water District (EVWD) in San Bernardino County initiated plans to
stock more replacement pipe parts in repair sheds near areas with more-brittle pipe, and to
store more bottled water for employees, families, and customers. Also, they rallied their
suppliers, exercised with the California Water/Wastewater Agency Response Network
(CalWARN; www.calwarn.org), and coordinated with numerous utilities in the region. These
activities highlighted for EVWD the importance of developing plans in coordination with fire
departments regarding firefighting water supplies, and the importance of having
representatives of water districts in the emergency operations centers of the operational area.
SUMMARY AND CONCLUSIONS
A hypothetical MW7.8 earthquake on the Southern San Andreas Fault was studied by
more than 300 leading academics, professionals, and government experts, for purposes of
creating a realistic, not-worst-case, earthquake emergency planning scenario. The research
team found it to be realistic that such an event kills 1,800 people, seriously injures 53,000,
and produces losses of $213 billion (6% of the annual gross regional product), of which the
largest contributor is fire following earthquake ($40 billion in building damage, $25 billion in
content loss, and $22 billion in business interruption loss). Business interruption other than
from fire following earthquake is the second-largest contributor to the total, amounting to $74
billion, of which $53 billion results from impaired water supply.
Despite the size of these losses, they would be much greater were it not for steadily
improving buildings codes, widespread mitigation efforts for buildings, and extensive efforts
by highway and roadway departments and various utilities to prepare for and reduce the
impacts of future earthquakes, a process that was assisted by this scenario. Two of the most
useful features of the scenario document for mitigation seem to have been (a) its high level of
detail and (b) the way the ShakeOut developers, Southern California Earthquake Center, and

19
other local and state leaders engaged in the scenario’s development and dissemination. The
examples of LAUSD, the Bank of America, the East Valley Water District, and others show
that Californians do not need to be convinced an earthquake can happen; rather they need
concrete and detailed statements about its consequences so they know what to do about it.
REFERENCES CITED
Algermissen, S.T., W.A. Rinehart, and D. James, 1972. A Study of Earthquake Losses in the San Francisco Bay Area: Data and Analysis. Prepared for the Office of Emergency Preparedness, U.S. Dept. of Commerce, National Oceanic & Atmospheric Administration
Algermissen, S.T., W.A. Rinehart, and D. James, 1973. A Study of Earthquake Losses in the Los Angeles, California, Area: Data and Analysis. Prepared for the Office of Emergency Preparedness, U.S. Dept. of Commerce, National Oceanic & Atmospheric Administration, Environmental Research Laboratories.
(ASCE) American Society of Civil Engineers, 2000. FEMA-356: Prestandard and Commentary for the Seismic Rehabilitation of Buildings, Washington, DC, 490 pp.
(ATC) Applied Technology Council, 1988, 2002. FEMA 154: Rapid Visual Screening of Buildings for Potential Seismic Hazards: A Handbook, Federal Emergency Management Agency, Washington, DC.
(ATC) Applied Technology Council, 1996. ATC-20: Procedures for Postearthquake Safety Evaluation of Buildings, Redwood City, CA, 144 pp.
Ballantyne, D., 2008. The ShakeOut Scenario Supplemental Study: Oil and Gas Pipelines. SPA Risk LLC, Denver CO
Byers, W.G., 2008. The ShakeOut Scenario Supplemental Study: Railway Network. SPA Risk LLC, Denver CO
Congressional Budget Office, 2005. Testimony by CBO Director Douglas Holtz-Eakin to House Budget Committee, October 6, 2005.
Eguchi, R.T. and S. Ghosh, 2008. The ShakeOut Scenario Supplemental Study: Hazardous Materials. SPA Risk LLC, Denver CO
Field, E.H., T.E. Dawson, K.R. Felzer, A.D. Frankel, V. Gupta, T.H. Jordan, T. Parsons, M.D. Petersen, R.S. Stein, R.J. Weldon II, and C.J. Wills, 2007. Working Group on California Earthquake Probabilities, 2008, The Uniform California Earthquake Rupture Forecast, Version 2 (UCERF 2). U.S. Geological Survey Open-File Report 2007-1437 and California Geological Survey Special Report 203, http://pubs.usgs.gov/of/2007/1437/ [02 Jul 2008]
Graves, R.W., B.T. Aagaard, K.W. Hudnut, L.M. Star, J.P. Stewart, and T.H. Jordan, 2008. Broadband simulations for Mw 7.8 southern San Andreas earthquakes: Ground motion sensitivity to rupture speed. Geophys. Res. Lett., 35, L22302
Hess, R.L., 2008. The ShakeOut Scenario Supplemental Study: Unreinforced Masonry (URM) Buildings. SPA Risk LLC, Denver CO
Hudnut, K.W., B. Aagaard, R. Graves and T.H. Jordan, 2008. Constructing the Scenario Event: The Earthquake Source. (pp. 27-47) In Jones et al., The ShakeOut Scenario, U.S. Geological Survey Open-File Report 2008-1150 and California Geological Survey Preliminary Report 25
Jones, L.M., R. Bernknopf, D. Cox, J. Goltz, K. Hudnut, D. Mileti, S. Perry, D. Ponti, K. Porter, M. Reichle, H. Seligson, K. Shoaf, J. Treiman, and A. Wein, 2008. The ShakeOut Scenario. U.S. Geological Survey Open-File Report 2008-1150 and California Geological Survey Preliminary Report 25, http://pubs.usgs.gov/of/2008/1150/ [22 May 2008]
Kircher, C.A., A.A., Nassar, O. Kustu, and W.T. Holmes, 1997. Development of building damage functions for earthquake loss estimation. Earthquake Spectra, 13 (4) 663-682
Kircher, C.A. and R.V. Whitman, 1997. Estimation of earthquake losses to buildings. Earthquake Spectra, 13 (4) 703-720
20
Krishnan, S., 2003. FRAME3D – A program for three-dimensional nonlinear time-history analysis of steel buildings: User guide. Technical Report EERL 2003-03, Earthquake Engineering Research Laboratory, California Institute of Technology, Pasadena, California, USA.
Krishnan, A., and M. Muto, 2008. SHAKEOUT 2008: Tall Steel Moment Frame Building Response. California Institute of Technology, Pasadena CA, 23 pp.
Mileti, D. and J. Goltz, 2008. Emergency Response and Communications. In Jones et al., 2008, The ShakeOut Scenario. U.S. Geological Survey Open-File Report 2008-1150 and California Geological Survey Preliminary Report 25, http://pubs.usgs.gov/of/2008/1150/ [22 May 2008]
(NIBS and FEMA) National Institute of Building Sciences and Federal Emergency Management Agency, 2003. Multi-hazard Loss Estimation Methodology, Earthquake Model, HAZUS®MH Technical Manual. Federal Emergency Management Agency, Washington, DC, 690 pp.
(NIST) National Institute of Standards and Technology, 2006. Performance of Physical Structures in Hurricane Katrina and Hurricane Rita: A Reconnaissance Report. NIST TN-1476. Gaithersburg
Parker, D., D. Manning, G. Malais, F. Pratt, L. Collins, L. Jones, S. Perry, D. Cox, J. Parrish, and M. Reichle, 2008. Personal communication, 29 Feb 2008 ShakeOut FFE briefing
Pickett, M.A., 2008. The ShakeOut Scenario Supplemental Study: Hospitals. SPA Risk LLC, Denver Ponti, D.J., J.C. Tinsley III, J.A. Treiman and H.A. Seligson, 2008. Constructing the Scenario Event:
Ground Deformation. (pp. 48-87) In Jones et al., The ShakeOut Scenario, U.S. Geological Survey Open-File Report 2008-1150 and California Geological Survey Preliminary Report 25
Preuss, J., and J. Godfrey, 2006. Guidelines for Developing an Earthquake Scenario. Earthquake Engineering Research Institute, Oakland, CA.
SAC Steel Project. 1997. Proc Workshop on Social Economic Policy and Political Issues. Clarion Hotel Millbrae CA Oct 27-28 1997
Seligson, H.A., 2008. The ShakeOut Scenario Supplemental Study: HAZUS-MH. MMI Engineering, Huntington Beach, CA
Scawthorn, C.R., 2008. The ShakeOut Scenario Supplemental Study: Fire Following Earthquake. SPA Risk LLC, Berkeley CA, http://www.sparisk.com/
Scawthorn, C., J.M. Eidinger, and A.J. Schiff, eds., 2005. Fire Following Earthquake. American Society of Civil Engineers, Reston, VA.
Schiff, A., 2008. The ShakeOut Scenario Supplemental Study: Elevators. SPA Risk LLC, Denver CO Shoaf, K., 2008. Casualties. In Jones et al., 2008, The ShakeOut Scenario. U.S. Geological Survey
Open-File Report 2008-1150 and California Geological Survey Preliminary Report 25 Steinbrugge K.V., J. Bennett, H. Lagorio, J. Davis, G. Borchardt, and T. Toppozada, 1987.
Earthquake Planning Scenario for a Magnitude 7.5 Earthquake on the Hayward Fault in the San Francisco Bay Area, CDMG Special Publication 78, 1987.
Taciroglu, E. and P. Khalili-Tehrani, 2008. The ShakeOut Scenario Supplemental Study: Older Reinforced Concrete Buildings. SPA Risk LLC, Denver CO
Tang, A., 2008. The ShakeOut Scenario Supplemental Study: Telecommunications. SPA Risk LLC, Denver CO
Toppozada, T.R., J.H. Bennett, G. Borchardt, R. Saul, J.F. Davis, C.B. Johnson, H.J. Lagorio, and K.V. Steinbrugge, 1988. Special Publication 99, Planning Scenario for a Major Earthquake on the Newport-Inglewood Fault Zone. California Department of Conservation Division of Mines and Geology. 100 pp.
Treiman, J.A., C.R. Real, R.I. Wilson, M.A. Silva, C.I. Pridmore, T.P. McCrink, R.C. Loyd, and M.S. Reichle, 2008. Physical Damages: Ground Deformation Impacts to Lifeline Corridors. In Jones et al., The ShakeOut Scenario, U.S. Geological Survey Open-File Report 2008-1150 and California Geological Survey Preliminary Report 25, 95-108
Wein, A. and A. Rose, 2008. Regional economic consequences. In Jones et al., 2008, The ShakeOut Scenario. U.S. Geological Survey Open-File Report 2008-1150 and California Geological Survey Preliminary Report 25, http://pubs.usgs.gov/of/2008/1150/ [22 May 2008]
Weldon II, R.J., T.E. Fumal, G.P. Biasi, and K.M. Scharer, 2005. Past and future earthquakes on the San Andreas fault. Science, 308, 966.

21
APPENDIX: CONTRIBUTORS TO THE SHAKEOUT
Brad Aagaard, USGS, Corey Abbott, USGS, Marty Adams, LA Dept. of Water and Power, Sinan Akciz, UC Irvine, Roman Alarcon, Metrolink, Greg Albright, Caltrans, Patrick Allen, BNP Paribas, Richard Almanzan, Caltrans, Mariana Amatullo, Art Center College of Design, Naresh Amatya, Southern Calif. Association of Governments, John Amrhein, San Bernardino County Sheriff’s Dept., Michael Armstrong, Southern Calif. Association of Governments, D. J. “Joe” Andrews, USGS, Ramon Arrowsmith, Arizona State Univ., Arul Arulmoli, Earth Mechanics, Inc., Donald Ballantyne, MMI Engineering, Frances Banerjee, Banerjee & Associates (retired LA Dept. of Transportation), Larry Banks, Caltrans, George Barber, Metropolitan Water District, Eric Batman, LA County Public Works, Whitney Behr, USC, Linda Bell, LA County Public Works, Denise Benson, County of San Bernardino, Mark Benthien, SCEC, Marc Bentojova, Sacramento Fire Dept., Tracy Berge, Metrolink, Richard Bernknopf, USGS, Mike Bevis, Ohio State Univ., Jacobo Bielak, Carnegie-Mellon Univ., Don Boland, Calif. Utilities Emergency Association, Adrian Borsa, USGS, Peggy Brutsche, American Red Cross, Bill Bryant, Calif. Geological Survey, Monica Buchanan, State Farm Insurance, Dai Bui, LA County Public Works, John Bwarie, Office of LA City Councilmember Greig Smith, William Byers, Burlington Northern & Santa Fe Railway, retired, Scott Callaghan, USC, Larry Caminiti, Southern California Edison, Ken Campbell, EQECAT Inc., Robert Castanon, LA County Metropolitan Transportation Authority, Robert Cavaglieri, NBC-Universal, Richard Champion, USGS, Ping Chang, Southern Calif. Association of Governments, Shane Chapman, Metropolitan Water District, Winston Chai, Metropolitan Water District, Mohan Char, Lim & Nascimento Engineering, Sungbin Cho, ImageCat, Inc. and Southern Calif. Association of Governments, Amit Chourasia, San Diego Supercomputer Center, 18, Mandy Chu, Caltrans, Bruce Clark, Calif. Seismic Safety Commission, Larry Collins, LA County Fire Dept., Don Conner, Southern Calif. Edison, Joel Conte, UC San Diego, Pauline Cotelle, Université Paul Valéry, Montpellier III, Tom Cotter, LA County Public Works, Larry Cotrill, Port of Long Beach, Dale Cox, USGS, Ron Cox, City of Riverside, Yifeng Cui, San Diego Supercomputer Center, Joseph Crisologo, Calif. State Dept. of Health, Luis Dalguer, San Diego State Univ., Julie Davenport, Wells Fargo Bank, Craig Davis, LA Dept. of Water and Power, James Davis, Caltrans, Tim Dawson, USGS, Steve Day, San Diego State Univ., Greg Deierlein, Stanford Univ., Lori Dinitz, USGS, Barry Edelman, Zenith Insurance Company, Ronald Eguchi, ImageCat, Inc., Geoff Ely, UC San Diego, San Diego Supercomputer Center, Thomas Eng, Metropolitan Transit Authority, Raul Escandon, County of LA Public Works, Doug Failing, Caltrans, Karen Felzer, USGS, Yuri Fialko, UC San Diego, Ned Field, USGS, Eric Fielding, Jet Propulsion Laboratory, Laure Fossorier, Ecole Nationale des Travaux Publics de L’Etat, Dan Freeman, Caltrans, Gary Fuis, USGS, Tom Fumal, USGS, Rick Gailing, Southern Calif. Gas Company, Kevin Garrity, LA Dept. of Water and Power, Leonard Gaydos, USGS, Eric Geist, USGS, Shubharoop Ghosh, ImageCat, Inc., Katy Gibson, Metropolitan Water District, Fay Glass, Riverside Fire Dept., Jim Goltz, Governor’s Office of Emergency Services, Bob Gorham, Office of the State Fire Marshall, William Graf, URS Corporation, Rob Graves, URS Corporation, Vladimir Grazer, Calif. Geological Survey, Michael Griffin, LA Dept. of Transportation, Hector Guerrero, LA County Metropolitan Transportation Authority, Ron Guss, Intermodal West, Inc., Calif. Trucking Association, Ron Hamburger, SGH, Inc., John Hardcastle, Palm Springs Fire Dept., Bruce Hamer, LA Dept. of Water and Power, Christopher Harris, Caltrans, Ruth Harris, USGS, Douglas Headrick, San Bernardino Valley Municipal Water District, Steve Hennessee, LA County Public Works, Caroline Hermans, USGS, Mike Herrera, Coachella Valley Water District, 19, Lu Hersh, Alameda Corridor Engineering Team, Richard Hess, Hess Engineering Inc., Dave Hester, USGS, Gill Hicks, Gill V. Hicks and Associates, Inc., Chris Hill, Metropolitan Water District, Mark Hoffman, Infragard, Chris Holbrook, Office of Homeland Security, Richard Holden, Bureau of Labor Statistics, Wesley Hong, Southern Calif. Association of Governments, Hsi Hwa Hu, Southern Calif. Association of Governments, Guoxiong Huang, Southern Calif. Association of Governments, Robert Huddy, Southern Calif. Association of Governments, Ken Hudnut, USGS, Joe Hull, Caltrans, Eugenia Hyung, USGS, Hasan Ikhrata, Southern Calif. Association of Governments, Tom Jasmin, LA County Metropolitan Transportation Authority, Mike Jenkinson, Caltrans, Chen Ji, UC Santa Barbara, Jeff Johnson, Caltrans, Ted Johnson, Water Replenishment District Of Southern Calif., Laurie Johnson, Laurie Johnson Consulting, Martin Johnson, ABS Consulting, Lucy Jones, USGS, Tom Jordan, USC, Gideon Juve, USC, Timothy Kaiser, San Diego Supercomputer Center, Robert Kamm, Los Angeles Unified School District, Erdem Karaca, Swiss Re Insurance, Michael Keever, Caltrans, Stephanie Kelly, USGS, Katherine Kendrick, USGS, Payman Khalili-Tehrani, UCLA, Keith Killough, Southern Calif. Association of Governments, Richard Koshalek, Art Center College of Design, Swaminathan Krishnan, Caltech, Ryan Kuo, Southern Calif. Association of Governments, Sue Lai, Port of Los Angeles, Kwan Lam, Caltrans, Molly Latham, Southern California Edison, Homa Lee, USGS, Keith Lee, LA County Public Works, Robert Lee, Dept. of Homeland Security, Robert Leeper, USGS, Peter Lent, Riverside County Fire Dept., K. Eric Leung, Long Beach Water Dept., Steve Levy, Center for Continuing Study of the Calif. Economy, Marshall Lew, MACTEC Engineering, J Leyva, City of San Bernardino Public Services, Wan Lin, USGS, William Lloyd, City National Bank, Julio Lopez, Carnegie-Mellon Univ., Kate Long, Governor’s Office of Emergency Services, Roberto Lugo, USGS, Ralph Loyd, Calif. Geological Survey, Lisa Grant Ludwig, UC Irvine, Kai Lui, LA County Sanitation, Dave Luker, Desert Water Agency, 20, Le Val Lund, LA Dept. of Water and Power, Paul Lundgren, Jet Propulsion Laboratory, Jeff Lusk, FEMA, Phil Maechling, USC, Michael Mahoney, FEMA, Gerry Malais, LA City Fire Dept., Pam Malam, USGS, Jim Malley, Degenkolb Engineering, Steve Maloney, Office of Homeland Security, Don Manning, LA City Fire Dept., retired, Kaolyn Mannino, Southern Calif. Edison, Peter Martin, USGS, Enrique Martinez, LA Dept. of Water and Power, Dawn Matthews, Cal National Bank, Jon Matti, USGS, Darrell Maxey, Southern Calif. Regional Rail Authority, Richard McCarthy, California Seismic Safety Commission, Timothy McCrink, Calif. Geological Survey, Sally McGill, Calif. State Univ., San Bernardino, Richard McKenna, Marine Exchange, Mike McManus, Caltrans, John Megreff, City of Torrance, Mike Mehrain, URS Corporation, Martha Merriam, Caltrans, Mutaz Mihyar, Dept. of Water and Power, Division of Safety of Dams, Dennis Mileti, Calif. Seismic Safety Commission, Javier Minjares, Calif. Association of Governments, Philip Mo, Southern California Edison, Reagan Moore, San Diego Supercomputer Center, Phil Moores, Riverside Transit, Mike Morel, Metropolitan Water District, Mary Moreland, Riverside County Office of Emergency Management, Basam Muallem, Caltrans, K. Murthy, Metropolitan Transportation Authority, Matthew Muto, Caltech, William Nascimento, Lim & Nascimento Engineering, Charles Nestle, LA County Public Works, Craig Nicholson, UC Santa Barbara, Jerry Nickelsburg, UCLA, David O’Hallaron, Carnegie-Mellon Univ., David Okaya, USC, Kim Olsen, San Diego State Univ., Gustavo Ortega, Caltrans, Dennis Ostrom, Southern Calif. Railroad, Frank Paczona, LBS Financial Credit Union, Louis Palm, Office of Homeland Security, Don Parker, Calif. Seismic Safety Commission, John Parrish, Calif. Geological Survey, Naresh Patel, Metrolink, Mark Pickett, Univ. of Toledo, Ines Pearce, Pearce Global Partners, Gilbert Pedroza, LA County Public Works, Michael Perovich, Caltrans, Sue Perry, USGS, David Phillips, UNAVCO, Inc., Belle Philobosian, Univ. of Oregon, Alen Pijuan, LA City Emergency Preparedness Dept., 21, Cliff Plumb, LA Dept. of Water and Power, Dan Ponti, USGS, Jack Popejoy, KFWB Radio, Keith Porter, Univ. of Colorado, Erik Pounders, USGS, Ren Powers, City National Bank, Cynthia Pridmore, Calif. Geological Survey, James Province, Caltrans, David Quirk, Metrolink, Vince Quitoriano, USGS, Frank Quon, Caltrans, David Raleigh, Ohio State Univ., Leonardo Ramirez-Guzman, Carnegie-Mellon Univ., Sved Raza, Caltrans, Charles Real, Calif. Geological Survey, Eric Reichard, USGS, Michael Reichle, Calif. Geological Survey, Tim Richison, Calif. Earthquake Authority, Ralph Ricketson, Caltrans, Mike Ripley, NBC-Universal, Steve Robbins, Coachella Valley Water District, Marlene Roberts, Federal Deposit Insurance Corporation, Tom Rockwell, San Diego State Univ., Chris Rojahn, Applied Technology Council, Adam Rose, USC, Marco Ruano, Caltrans, Aram Sahakian, LA Dept. of Transportation, Richard Sanchez, Dept. of Water Resources State Water Project, David Sandwell, UC San Diego, Rosie

22
Santilena, USGS, Victoria Saylor, Countrywide Bank, Charles Scawthorn, Kyoto Univ. / SPA Risk LLC, Katherine Scharer, Appalachian State Univ., Anshel Schiff, Precision Measurement Instruments, Merritt Schreiber, UC Los Angeles, David Schwartz, USGS, Caz Scislowicz, Caltech, Gordon Seitz, San Diego State Univ., Hope Seligson, MMI Engineering, Stephen Sellers, Governor’s Office of Emergency Services, Tom Shantz, Caltrans, Ben Sherrouse, USGS, Kimberley Shoaf, UCLA, Richard Shapall, Metropolitan Water District, Michael Shulters, USGS, Kerry Sieh, Caltech, Armand Silva, Caltrans, Michael Silva, Calif. Geological Survey, Mark Simons, Caltech, Michael Smith, Surface Transportation Board, Bridget Smith-Konter, UC San Diego, Bob Spears, LA Unified School District, Ellis Stanley, City of LA, Lisa Star, UCLA, Judith Steele, Judith Steele Consultant Services, Jonathan Stewart, UCLA, Phil Stolarski, Caltrans, David Strong, USGS, 22, Mark Stuart, Dept. of Water Resources, Henry Stultz, Caltrans, Gary Sturdivan, East Valley Water District, Ricardo Taborda, Carnegie-Mellon University, Ertugrul Taciroglu, UCLA, Alex Tang, L & T Engineering, Doug Thiessen, Port of Long Beach, Alan Thompson, Southern Calif. Association of Governments, Kevin Thompson, Caltrans, John Tinsley III, USGS, Ron Tognazzini, Tognazzini and Associates, Jerry Treiman, Calif. Geological Survey, Jeroen Tromp, Caltech, Loren Turner, Caltrans, John Urbanic – Pittsburgh Supercomputing Center, Randy Van Gelder, San Bernardino Valley Municipal Water District, John Vaughn, Calif. State Employment Development Dept., Margaret Vinci, Caltech, David Wald, USGS, Richard Walker, Metrolink, Zhongren Wang, Caltrans, Kathleen Webb, Office of Governor Schwarzenegger, Dan Wei, USC, Monique Weiland, Calif. Independent System Operator, Anne Wein, USGS, Deborah Weiser, USGS, Ray Weldon, Univ. of Oregon, Frank Wen, Southern Calif. Association of Governments, Stu Werner, Seismic Systems & Engineering Consultants, Gedion Werrede, Caltrans, Troy Whitman, Southern California Edison, Pat Williams, San Diego State Univ., Chris Wills, Calif. Geological Survey, Rick Wilson, Calif. Geological Survey, Bill Winter, LA County Public Works, Liz Wojdak, Southern Calif. Association of Governments, Ray Wolfe, Caltrans, John Yang, Caltrans, Mark Yashinsky, Caltrans, Bill Yearsley, Univ. of Colorado, Bolder, Peter Yin, Port of Los Angeles, Doug Yule, Calif. State Univ., Northridge, Jing Zhu, San Diego Supercomputer Center