The SAS® Add-In for Microsoft Office: A Beginner's Guide
105
-
Upload
khangminh22 -
Category
Documents
-
view
0 -
download
0
Transcript of The SAS® Add-In for Microsoft Office: A Beginner's Guide


The SAS® Add-In for Microsoft Office: A Beginner's Guide
SAS INSTITUTE
SAS Institute, Inc. Cary, NC

The correct bibliographic citation for this manual is as follows: SAS Institute. 2021. The SAS® Add-In for Microsoft Office: A Beginner’s Guide. Cary, NC: SAS Institute Inc.
Introduction to Statistical and Machine Learning Methods for Data Science
Copyright © 2021, SAS Institute Inc., Cary, NC, USA
ISBN 978-1-955977-76-0 (Web PDF)
All Rights Reserved. Produced in the United States of America.
For a hard copy book: No part of this publication may be reproduced, stored in a retrieval system, or transmitted, in any form or by any means, electronic, mechanical, photocopying, or otherwise, without the prior written permission of the publisher, SAS Institute Inc.
For a web download or e-book: Your use of this publication shall be governed by the terms established by the vendor at the time you acquire this publication.
The scanning, uploading, and distribution of this book via the Internet or any other means without the permission of the publisher is illegal and punishable by law. Please purchase only authorized electronic editions and do not participate in or encourage electronic piracy of copyrighted materials. Your support of others’ rights is appreciated.
U.S. Government License Rights; Restricted Rights: The Software and its documentation is commercial computer software developed at private expense and is provided with RESTRICTED RIGHTS to the United States Government. Use, duplication, or disclosure of the Software by the United States Government is subject to the license terms of this Agreement pursuant to, as applicable, FAR 12.212, DFAR 227.7202-1(a), DFAR 227.7202-3(a), and DFAR 227.7202-4, and, to the extent required under U.S. federal law, the minimum restricted rights as set out in FAR 52.227-19 (DEC 2007). If FAR 52.227-19 is applicable, this provision serves as notice under clause (c) thereof and no other notice is required to be affixed to the Software or documentation. The Government’s rights in Software and documentation shall be only those set forth in this Agreement.
SAS Institute Inc., SAS Campus Drive, Cary, NC 27513-2414
October 2021
SAS® and all other SAS Institute Inc. product or service names are registered trademarks or trademarks of SAS Institute Inc. in the USA and other countries. ® indicates USA registration.
Other brand and product names are trademarks of their respective companies.
SAS software may be provided with certain third-party software, including but not limited to open-source software, which is licensed under its applicable third-party software license agreement. For license information about third-party software distributed with SAS software, refer to http://support.sas.com/thirdpartylicenses.

Contents
About This Book vii
1. Getting Started 1
2. Working with Data in Excel 15
3. Working with Tasks 33
4. Working with Stored Processes 54
5. Customizing Results 71
6. Advanced Features 79


About This Book
WHAT DOES THIS BOOK COVER?
The SAS® Add-In for Microsoft Office taps into the power of SAS for data exploration, reporting, and analytics directly from Microsoft Office via integrated menus and toolbars. SAS provides two add-ins for Microsoft Office: the SAS Add-In for Microsoft Office and SAS Visual Analytics Add-In for Office.
With the SAS Add-In for Microsoft Office, you can explore data or insert SAS tables and charts into a spreadsheet or document to work with them in Office – all with no programming skills required! Seamless integration makes it easy to collaborate and share analytics-driven reports, visualizations, KPIs, and dashboards with the rest of your team.
This book shows you how to use the SAS add-in’s dynamic features to create customized results in various applications including Excel, Outlook, PowerPoint, and Word. This book explains the features of the SAS add-in and shows you how to get the most out of the integration between SAS and Microsoft Office. This book covers how to do the following:
• Create a connection profile to connect the SAS desktop application to your metadata server
• Use the SAS tab and the SAS panel
• Manage favorites
• View and edit data in Excel
• Use SAS tasks to create charts and tables
• Run a stored process vii

• Apply and customize styles to your reports
• Submit SAS code
• Automate basic actions and tasks
• Use the SAS Visual Analytics Add-In for Office to interact with SAS Visual Analytics reports
• And more!
WHAT MATERIALS WERE USED TO DEVELOP THIS BOOK?
This book is based on the series of how-to tutorial videos on the SAS Add-In for Microsoft Office Version 8 available at https://video.sas.com/category/videos/version-8. Other resources used to develop this book include the documentation for the SAS Add-In 8.3 for Microsoft Office available at https://go.documentation.sas.com/doc/en/amodoccdc/8.3/amoug/titlepage.htm.
IS THIS BOOK FOR YOU?
This book is for anyone who wants to learn more about the SAS Add-In for Microsoft Office. The SAS Add-In for Microsoft Office and SAS Visual Analytics Add-In for Office are designed for people with limited SAS knowledge and experience. The SAS add-in allows for point-and-click exploration of data and easy generation of reports with zero programming skills required. However, if you have programming experience, you can write and submit SAS code in the add-in as well. You might even be able to write and submit code in Python and R, depending on your SAS installation.
WHAT SHOULD YOU KNOW ABOUT THE EXAMPLES?
This book includes examples for you to follow to gain hands-on experience with the SAS add-in. Your version of the SAS add-in might differ based on the features available in your installation of SAS Office Analytics.
viii ABOUT THIS BOOK

SOFTWARE USED TO DEVELOP THE BOOK’S CONTENT
The SAS Add-In for Microsoft Office is part of SAS® Office Analytics, SAS® Enterprise BI Server, and SAS® Enterprise Miner™. The SAS Add-In 8.3 for Microsoft Office was used to develop the book’s content.
You might notice a few changes from version 7. The following list explains some of the new features that you might notice as you make the transition to this release.
• SAS Tab: New to the SAS add-in in version 8 are the icons for Currently Open and Recent. You can also access those items using the Home tab in the SAS panel.
• Opening a Table: The process of opening a table in version 8 is no different from what you are accustomed to in previous releases. Only the name of the icon has changed. The name of the icon is now “Data” instead of “SAS Data”.
• Inserting Results: You are no longer prompted where to insert results. One of the changes is that the results now appear in a separate panel. This is the SAS panel, which is new for the SAS Add-In 8.3 for Microsoft Office. The Results tab in the SAS panel is like a more flexible Preview window.
To insert results, select the table or chart, and then click the icon to insert the selected results.
WE WANT TO HEAR FROM YOU
SAS Press books are written by SAS Users for SAS Users. We welcome your participation in their development and your feedback on SAS Press books that you are using. Please visit sas.com/books to do the following:
• Sign up to review a book
• Recommend a topic
• Request information about how to become a SAS Press author
• Provide feedback on a book
ABOUT THIS BOOK ix

x ABOUT THIS BOOK

CHAPTER 1
INTRODUCTION
The SAS Add-In for Microsoft Office provides transparent access to the power of SAS for data access, reporting, and analytics directly from Microsoft Office via integrated menus and toolbars. SAS provides two add-ins for Microsoft Office: SAS Add-In for Microsoft Office and SAS Visual Analytics Add-In for Office.
In this chapter, you will learn how to start using the SAS Add-In for Microsoft Office version 8. (See Chapter 6 for information about the SAS Visual Analytics Add-In for Office.)
Note: To determine which SAS add-in you are running, on the SAS tab click Help → About SAS Add-In for Microsoft Office.
The SAS add-in is part of the SAS Enterprise BI Server and SAS Office Analytics solutions. The add-in extends Office functionality by enabling you to use the power of SAS analytics and access data directly from Microsoft Excel, Word, PowerPoint, and Outlook.
The main benefit of the add-in is that even if you have limited SAS knowledge and are more comfortable in Excel, you can still access the
1

powerful analytical and statistical tools available in SAS. There is no need to do a separate dump into Excel. Another benefit is that SAS does not have the same row limitations as Excel, so large data sets can also be brought into Excel because the data is being processed through the SAS server. Perhaps the best benefit to using the add-in is that the file can refresh the source data without requiring the data be completely brought in new or the file needing to be re-created.[1]
The functionality that is available for the SAS add-in varies among Microsoft Office applications. (See Table 1.1.) In Excel, PowerPoint, and Word, you can run analyses, generate reports, and share SAS content with other users at your site. In Excel, you can open and edit data sources. In Outlook, you can monitor reports and share reports with other users. However, you cannot create new reports or run a SAS task in Outlook.
Table 1.1: Microsoft Office Features Comparison
Open Data Source
Edit Data Source
Run Analyses
Generate Reports
Share SAS Content
Excel X X X X X
Outlook X
PowerPoint X X X
Word X X X
CONNECTION PROFILE
In this section, you will learn how to create and manage connection profiles in the SAS Add-In for Microsoft Office. A connection profile is a small file stored on the local machine that contains the information necessary to connect the SAS desktop application to your metadata server.
2 SAS INSTITUTE

Note: Your SAS administrator might have already completed this step for you.
CREATE A CONNECTION PROFILE
To create a new connection, you need to access the SAS Connections window. There are several ways to access the Connections window. In a Microsoft Office application, click Home in the SAS tab to open the SAS panel. In the SAS panel, click Reports. This lets you see all of your server connections and their status.
To create a new connection, click Manage Connections. This opens the SAS Connections window as shown in Figure 1.1.
Figure 1.1: SAS Connections Window
Alternatively, you can access Connections from the SAS tab in Excel, Word, and PowerPoint by clicking Tools → Connections. In Outlook, select
CHAPTER 1: GETTING STARTED 3

Connections. You can also access Connections in SAS Enterprise Guide by clicking My Server in the lower right corner of the window or selecting Tools → Options → Administration.
Note: If you have installed the SAS add-in but do not see the SAS tab in your Office application, you might need to enable the SAS Add-In for Microsoft Office. In your Office application, go to File → Options → Add-Ins. From the Manage Add-Ins drop-down menu, select COM Add-Ins, and then click Go. Select the SAS check box if it is unchecked. Then click OK.
The SAS Connections window displays a list of existing connections that you could use to designate the active SAS9 metadata profile. To create a new profile, click Manage, and then in the Connections window, click Add.
In the Create Profile window, you can name the profile and specify the machine and port information. Your SAS9 administrator will have the machine and port information for your organization. Enter the user name and password. There are a few other settings available in the Create Profile window.
• The Save login in profile option enables the user to be automatically connected when using this profile.
• The Use Integrated Windows Authentication option enables the user’s Windows credentials to also be used to connect to the server.
• Authentication domain lets you specify the authentication domain for the profile to enable resource use without prompting. If the domain of the resource matches the value specified in the profile, the user is not prompted to enter credentials.
When all the settings are ready, click Save. In the Connections window,
4 SAS INSTITUTE

make this new connection the active connection by clicking Set Active. Any specifications that you make in the Connections window are valid for your current and future Microsoft Office sessions. In the SAS Connections window, you can see that the new profile that you’ve added appears as the active SAS9 metadata profile. If you had forgotten to make the new profile the active profile, you can also set that in this window.
When you return to the Reports tab, it displays the new profile as the active connection. Click the profile to see a list of folders available to the user and make sure everything is working as expected.
Note: If you use the SAS add-in without a profile, you can access a SAS server installed on your local machine only. You cannot define libraries or share SAS resources with other SAS applications.
THE SAS TAB
The SAS Add-In for Microsoft Office places a new tab on the ribbon that surfaces SAS functionality. Figure 1.2 shows the ribbon in Excel.
Figure 1.2: SAS Tab in Excel
In Microsoft Excel, Word, and PowerPoint, there are three groups on the SAS tab:
• General
• Selection
• Tools
CHAPTER 1: GETTING STARTED 5

In Outlook, there are only two groups because there is no Selection section.
GENERAL
Let’s look first at the General group. Notice in Figure 1.2 that there are icons for the following:
• Home – Clicking Home opens the SAS Panel. From the SAS Panel, you can quickly access reports, tasks, and programs, as well as any available results. The SAS Panel will be discussed in more detail in the next section.
• Data – The Data option is only available in Excel. It enables you to open a data source into a worksheet.
• Reports – Use this option to access reports.
• Tasks – Use this option to access tasks. (Not included in Outlook.)
• Programs – Use this option to access SAS programs. (Not included in Outlook.)
• Currently Open – This option shows a list of currently open content. There is also a selection to open the Manage Content window in which you can perform a variety of tasks such as deleting SAS content, refreshing analyses and data sources, and sending the results from an analysis to another Microsoft Office application.
• Recent – This option provides a list of recently opened items. You can specify the number of items to include in this list. The default value is 25.
• Favorites – These are the items that you access frequently and are shared between Excel, Word, PowerPoint, and Outlook with access determined by the functionality available in the application. If a favorite cannot run in your current Microsoft Office application, then it is dimmed.
6 SAS INSTITUTE

SELECTION
The Selection group enables you to refresh or modify SAS content or change the properties associated with the content type. Items are dimmed until content is open and selected.
TOOLS
In the Tools group, there are two choices: Tools and Help. The Tools item enables you to perform actions such as viewing the
status of processes, accessing the Style Manager, and opening the Options window. The Tools item also enables you to manage the connection to your metadata server. This menu is much shorter in Outlook than in the other Office applications. In Outlook, there are only three choices: Connections, Status, and Options.
The Help item gives you access to the Help facility for the SAS add-in. Additional groups and options become available when you select SAS
content or work with data sources. For example, if you open a SAS table in a worksheet in Excel, you will notice two new groups on the SAS tab: Navigate and External Data. The options that you find in these groups are specific to working with a data source.
CUSTOMIZING THE SAS TAB
You can customize the icons that are show on the SAS tab by going to Tools → Options → Customize. In the Customize category, clear the check boxes for any items that you do not want to show on the ribbon.
SAS PANEL
The SAS panel consolidates all of the SAS add-in functionality so that you can quickly access everything in one place. Many of the same features in the SAS tab are also available in the SAS panel. The SAS panel is fairly similar in all Office applications with the exception of Outlook. In Outlook, you cannot run tasks or submit SAS code.
CHAPTER 1: GETTING STARTED 7

To open the SAS panel, click Home on the SAS tab. The Home tab appears first in the panel on the right side of your screen, as shown in Figure 1.3. The other tabs are Reports, Tasks, Programs, and Search. When a report, task, stored process, or program has been run, a new tab, Results, becomes available.
Figure 1.3: SAS Panel in Excel
Let’s look at each of the different tabs within the SAS panel and learn about what they do.
HOME
Initially in the Home tab, a list of currently open items is displayed. Clicking the down arrow enables you to change the view. In addition to the Currently Open view, you can see Samples, Recent, and Favorites. The Recent view shows tables, reports, stored processes, and tasks that you have worked with.
To open any of these items, simply click on the icon. If you open a table, the View SAS Data window appears. You can accept all the defaults and click OK to open. The table is then opened into the current worksheet on the left side of your screen. Now, if you change the view to Currently Open in the SAS panel, you will see the table.
8 SAS INSTITUTE
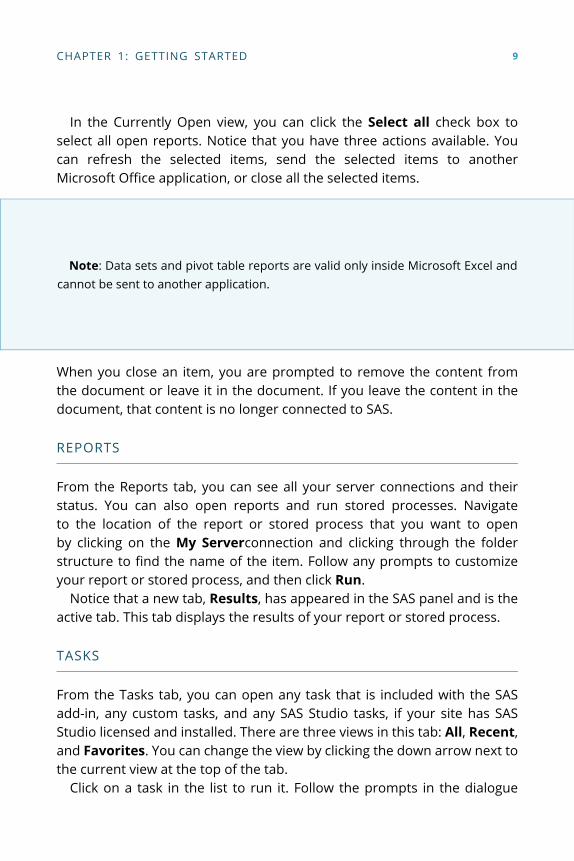
In the Currently Open view, you can click the Select all check box to select all open reports. Notice that you have three actions available. You can refresh the selected items, send the selected items to another Microsoft Office application, or close all the selected items.
Note: Data sets and pivot table reports are valid only inside Microsoft Excel and cannot be sent to another application.
When you close an item, you are prompted to remove the content from the document or leave it in the document. If you leave the content in the document, that content is no longer connected to SAS.
REPORTS
From the Reports tab, you can see all your server connections and their status. You can also open reports and run stored processes. Navigate to the location of the report or stored process that you want to open by clicking on the My Serverconnection and clicking through the folder structure to find the name of the item. Follow any prompts to customize your report or stored process, and then click Run.
Notice that a new tab, Results, has appeared in the SAS panel and is the active tab. This tab displays the results of your report or stored process.
TASKS
From the Tasks tab, you can open any task that is included with the SAS add-in, any custom tasks, and any SAS Studio tasks, if your site has SAS Studio licensed and installed. There are three views in this tab: All, Recent, and Favorites. You can change the view by clicking the down arrow next to the current view at the top of the tab.
Click on a task in the list to run it. Follow the prompts in the dialogue
CHAPTER 1: GETTING STARTED 9

windows to customize your task, and then click Run. When a task is run, the report is displayed on the Results tab.
RESULTS
The Results tab shows all the reports that are open. Clicking the down arrow next to the name of a report in the top of the panel shows the complete list of results. To the right of the result list, you will see a row of six icons. These icons enable you to perform the following actions:
• Insert results into document or remove results
• Insert selected results into document or remove selected results
• Search for a selection in the results
• Refresh the results
• View detailed information about the results
• More options
If a report contains multiple elements such as a table and a chart, you can select the report elements to include in the Microsoft Office application. When you insert a result in Excel, the action is to place those results in the active cell. If you don’t want the results to override the information you might already have in your workbook, first open a new worksheet.
You can insert all the results or only the selected results using the icons at the top of the panel. To insert all results, click the Insert report into document icon. To insert select results, click on the element(s) that you want, including any titles. Then click the Insert selected results into document icon. (See Figure 1.4.) Your results will now appear in the worksheet.
10 SAS INSTITUTE

Figure 1.4: Insert Selected Results
Click the More options icon to modify, export to PDF, email, send to, add to favorites, close, and close all.
PROGRAMS
This tab includes a code editor that you can use to write and run SAS programs. The language editor includes a wide variety of features, including autocompletion, automatic formatting, pop-up help, and parenthesis matching.
You can customize many of the settings for this editor. In the Programs tab, click the More options (⋮) icon and select Import program to open any existing SAS program saved on your server. When you have the final code ready in the editor, click the running man icon in the top right to run
CHAPTER 1: GETTING STARTED 11

the program. Notice that there are now three tabs: Code, Log, and Results, as shown in Figure 1.5.
Figure 1.5: Programs Tab
The Results tab displays the program output. You can insert all the results or just a selected portion. To view any warnings, errors, or notes, click the Log tab. To return to the program, click the Code tab.
SEARCH
Use the Search tab to search all available servers for a report. Enter a term into the search bar to search for any reports with that term in the title. Click on the search results to run the report that you want.
12 SAS INSTITUTE

MANAGE FAVORITES
Before we end this chapter, let’s discuss one feature in more depth. SAS Favorites enable you to quickly run tasks and stored processes or create reports in Microsoft Office applications. Let’s look at how to add and remove SAS Favorites. There are two locations where you can view Favorites:
• The Favorites icon on the SAS tab
• The Favorites view in the Home tab of the SAS panel
The quickest way to view your favorites is by clicking the Favorites icon on the SAS tab. A drop-down menu with all favorited items will appear. Any items or tasks that cannot be run in your current Microsoft Office application will not be displayed. When you select any item from this list, the results will appear in the SAS panel. From there, it is a simple step to insert the results into your document.
The other way to view your favorites is by clicking the Home tab in the SAS panel. From the drop-down Views menu, select Favorites. This view will show all items that you have added as a favorite.
To add an item to your favorites, you will first need to run it. Using the Results tab in the SAS panel, you can add any open report, task, or wizard to your favorites. Select More Options and Add to Favorites.
If you decide that you no longer want to mark a report or task as a favorite, it is easy to remove. Click the Home tab in the SAS panel and make sure the view is set to Favorites. Notice in Figure 1.6 that there is a filled star icon in the bottom right corner of each favorited item. Click that star icon and the item is removed as a favorite. Be careful to click the star icon. If you click elsewhere, you will open the item.
CHAPTER 1: GETTING STARTED 13

Figure 1.6: Favorites
In this chapter, you learned what features are available in each Microsoft Office application and how to create a connection profile. You should now be familiar with the options in the SAS tab and the SAS panel. In the next chapter, you will learn how to work with data in Excel so that you can create reports and tasks that can be used in other applications.
[1] Davies, Jennifer (2013). “The Basics of Using SAS® Excel Add-In.” NESUG 2013, Burlington, VT. Available at https://www.lexjansen.com/nesug/nesug13/78_Final_Paper.pdf.
14 SAS INSTITUTE
CHAPTER 2
Working with Data in Excel
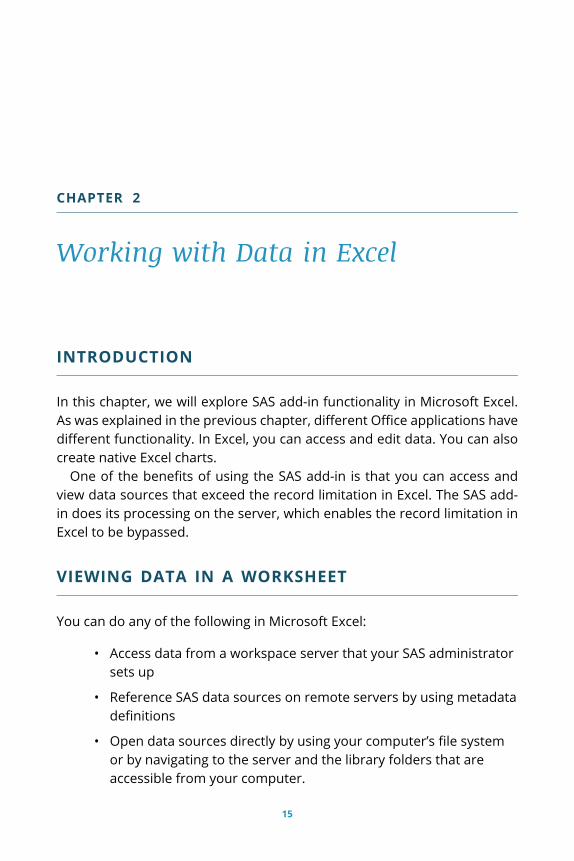
INTRODUCTION
In this chapter, we will explore SAS add-in functionality in Microsoft Excel. As was explained in the previous chapter, different Office applications have different functionality. In Excel, you can access and edit data. You can also create native Excel charts.
One of the benefits of using the SAS add-in is that you can access and view data sources that exceed the record limitation in Excel. The SAS add-in does its processing on the server, which enables the record limitation in Excel to be bypassed.
VIEWING DATA IN A WORKSHEET
You can do any of the following in Microsoft Excel:
• Access data from a workspace server that your SAS administrator sets up
• Reference SAS data sources on remote servers by using metadata definitions
• Open data sources directly by using your computer’s file system or by navigating to the server and the library folders that are accessible from your computer.
15

OPENING DATA
To open a data source, click the Data icon in the SAS Tab. This opens the View SAS Data window. If you have worked with a data set recently, it will appear in the Data drop-down menu at the top of the window. If the table that you need is not in the list, simply click Browse and navigate to the location where the file is stored.
To see information about any applied filter, how the data is sorted, and how many columns will appear in the worksheet, click the arrow next to Details to expand the section as shown in Figure 2.1.
Figure 2.1: View SAS Data Window
To filter and sort the data before inserting it, click the Filter & Sort button. The Modify Data Source window appears where you can select which variables you want to include from the data set. Use the left and right arrows to select individual variables or use the double left and right arrows to move all variables into the Available or Selected areas. (See Figure 2.2.)
16 SAS INSTITUTE
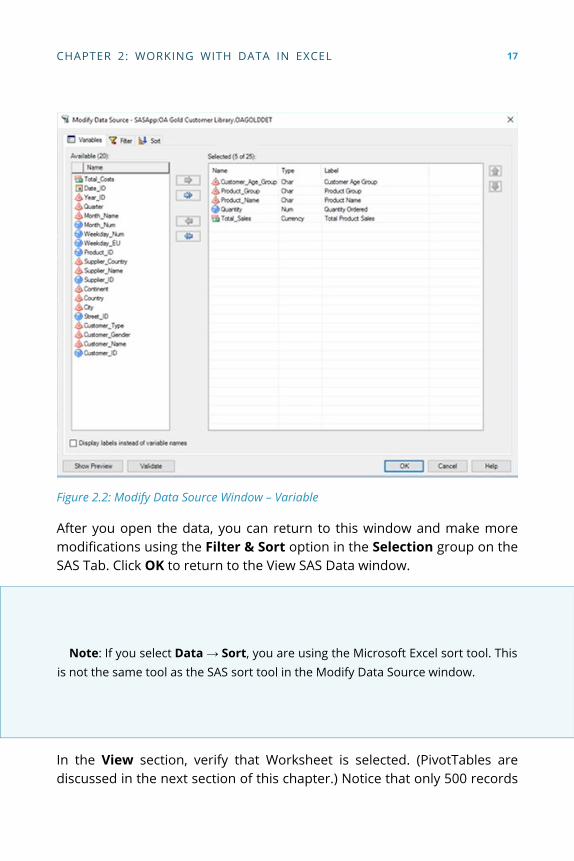
Figure 2.2: Modify Data Source Window – Variable
After you open the data, you can return to this window and make more modifications using the Filter & Sort option in the Selection group on the SAS Tab. Click OK to return to the View SAS Data window.
Note: If you select Data → Sort, you are using the Microsoft Excel sort tool. This is not the same tool as the SAS sort tool in the Modify Data Source window.
In the View section, verify that Worksheet is selected. (PivotTables are discussed in the next section of this chapter.) Notice that only 500 records
CHAPTER 2: WORKING WITH DATA IN EXCEL 17

(or rows) are displayed at a time. You can change that number or display all of the records in the table (not recommended for large data sets). You can choose to insert record numbers in the first column as well as display the data source and filter information in the worksheet. Depending on how you set your default options, those boxes might be selected. By default, the data is placed into the existing worksheet. However, you can change this location in the Location section. When you are done making your selection, click OK. The SAS table is now added to the worksheet location that you have selected.
NAVIGATING DATA
On the SAS Tab, two new groups have been added: Navigate and External Data. (See Figure 2.3.)
Figure 2.3: SAS Tab
Use the Navigate group to move through your data. By clicking the Go to the end of your data icon (⇥) you can see how many rows of data you have.
FILTERING DATA
If you want to further subset your data now, go to the Selection group on the SAS tab and click Filter & Sort to open the Modify Data Source window. This is the same window that you are able to access when adding the data. (See Figure 2.2.) Click the Filter tab at the top of the window. You will need to supply three pieces of information to create a simple filter:
• the variable that you want to subset
• the value(s) to which you want to subset the data
• and how you want to compare the two items.
The value must match the values in the data set in name and case. If you
18 SAS INSTITUTE

are unfamiliar with the values in your data set, click on the ellipsis button (…) next to the third field. This action displays a list of values that you can select for the value of the variable as shown in Figure 2.4.
Figure 2.4: Modify Data Source Window – Filter
Click OK to apply the filter and return to the worksheet. Notice that the filter information is displayed at the bottom of the Excel
window beneath the worksheet tab. Displaying that information is the default setting. If you don’t like that functionality, use the Options window to change it.
You can always sort the data, adjust or remove the filter, as well as change the columns that are displayed. Remember that if you choose not to display a column in the worksheet, it does not prevent you from using it in an analysis.
CHAPTER 2: WORKING WITH DATA IN EXCEL 19

VIEWING DATA IN A PIVOTTABLE
In this section, we will explore how the SAS add-in’s functionality enables SAS data to be viewed in an Excel PivotTable.
First, click Data to open the View SAS Data window. Select the data that you want to view from the recently accessed list or click Browse to navigate to the storage location. In the View section, select PivotTable as the way to view the data. Choose the location where you want the data to open, and then click OK.
Initially, no data is displayed in the report. Use the PivotTable Fields panel to select the items to be displayed. (See Figure 2.5.)
Figure 2.5: PivotTable Fields Panel
This panel displays two sections: a field section at the top for adding and removing fields, and a layout section at the bottom for rearranging and repositioning fields. Select the check boxes next to the fields that you want to add. These will appear as columns in the table on the left as you add them. If you no longer need a column, simply uncheck the field in the panel.
20 SAS INSTITUTE

Note: To change the design of the table, click the Design tab in the ribbon to locate and apply a different PivotTable style.
You can use the PivotTable functionality to interact with your SAS data. Right-click on a column heading to see the actions that are available.
EDITING SAS DATA IN A WORKSHEET
The data writeback feature is available only in Microsoft Excel. It enables users with the appropriate permissions to perform the following actions:
• Edit data values and write the changes back to the original data set
• Edit data set column properties
• Specify the number of minutes of inactivity before the Edit mode is automatically closed
EDIT DATA VALUES
To edit data values in an Excel worksheet, first you need to open the data set as you normally would. Next, we will need to open Edit mode. To do this, look at the External Data group on the SAS tab. Notice that there are two selections available: Begin Edit and View Column Properties. Click Begin Edit. A message window appears and indicates that you are switching to Edit mode. Click Switch to Edit Mode to confirm. Notice that the selections in the External Data group changed as shown in Figure 2.6. The Begin Edit icon is now End Edit. In addition, these options are undimmed and can be selected: Edit Column Properties, Create New Records, and Delete Records.
CHAPTER 2: WORKING WITH DATA IN EXCEL 21

Figure 2.6: External Data Group
Double-click the cell that you want to edit. For example, let’s say you want to change the name of an employee’s job title from “Trainee” to “Sales Rep”. Double-click the cell containing the job title, then type in the new job title. Press Enter to update the cell value.
After the cell value is updated, the SAS table is still not updated yet. Click Commit in the External Data group on the SAS tab. When you have finished making edits, click End Edit in the External Data group.
VERIFY CHANGES
You can verify that your corrections have been made by closing and reopening the SAS table. Go to the General group in the SAS table and click Currently Open. From the drop-down menu, select Manage Content to open the Manage Content window as shown in Figure 2.7.
Figure 2.7: Manage Content Window
Select the table that you have modified by clicking the check box next to its name. Next, click the black X Delete icon at the top of the window. You
22 SAS INSTITUTE

will be prompted to confirm the deletion in a new window. Click Delete. The SAS content is then removed from the worksheet. Close the Manage Content window.
To reopen the table, click Data in the SAS tab. Verify the name of the table that you want to open and that the Worksheet radio button is selected under View. Click OK to open the table. In the worksheet, verify that that updated values appear wherever you have made changes.
CREATING NATIVE EXCEL CHARTS
When working with the SAS add-in 8, you have three choices for a format for graph output:
• An image generated by SAS
• An ActiveX control
• Native Excel format
In this section, you will learn how to produce a native Excel chart from a SAS data source. First, open your SAS table in an Excel worksheet.
ENABLE EXCEL INTEGRATION
To create Microsoft Excel charts, you need to enable a SAS option. On the SAS tab, select Tools → Options to open the SAS Add-In for Microsoft Office Options window. In the Results category, at the bottom of the list of options, find the Excel Integration options. (See Figure 2.8.)
CHAPTER 2: WORKING WITH DATA IN EXCEL 23

Figure 2.8: SAS Add-In for Microsoft Office Options Window
The Create Microsoft Excel charts when possible option displays the results using the charts in Microsoft Excel. By default, this option is not selected, and the charts in the results use the value that is selected in the Graph Format field, which in this example is ActiveX. Select the Create Microsoft Excel charts when possible check box. To use native charts, your results format must be SAS Report. Scroll up in the window to the SAS Results section and make sure SAS Report is selected in the Results Format field. In the General section, make sure the option to Automatically insert results into the Office document when opening a report is checked. Click OK to save the changes.
24 SAS INSTITUTE

CREATE CHART
Microsoft Excel charts can be created for these types of graphs:
• Bar Charts
• Bubble Plots
• Line Plots
• Pie Charts
Let’s look at an example of how to create a pie chart. Create a new, blank worksheet and then from the SAS tab, select Tasks → Graph → Pie Chart. Before the task appears, you are asked to choose your data and specify the result location. When you have done so, click OK. The Pie Chart window appears. (See Figure 2.9.)
Figure 2.9: Pie Chart Window
CHAPTER 2: WORKING WITH DATA IN EXCEL 25

The only type of Excel chart that can be created for a pie chart is a simple pie. Because that is the default, we do not need to change anything in the Pie Chart section in the selection pane. Next, specify what data you will use for the various pie chart roles in the Data section. Select the columns on the left and drag them onto the task roles on the right to assign them.
When a Microsoft Excel chart is created, any appearance options that you specify are ignored. Instead, the defaults for the Microsoft Excel charts are used. Because you know that your output will be an Excel chart, we will not specify any Appearance options.
If you want to add a title or a footnote, select Titles in the selection pane. With Graph as the selected section, clear the Use default text check box and remove the default text. Type in the text that you want to use or leave the area empty and use Excel to establish a title for the chart. Repeat the same process for a footnote.
Click Run when you have finished changing your settings. SAS runs the code and generates the Excel chart shown in Figure 2.10. Because we selected the option to insert the results automatically, the pie chart appears in the worksheet without having to insert it separately from the SAS panel.
Figure 2.10: Pie Chart in Worksheet
26 SAS INSTITUTE

EDIT CHART
You can edit certain aspects of the chart by clicking on the elements. For example, you can change the title by clicking in that area of the chart and then replacing the text. To quickly change the color or style of the chart, use the Chart Styles icon that looks like a paintbrush located next the chart in the upper right corner.
Remember that the chart was generated using a SAS task. Therefore, you can make modifications to the chart by modifying the task settings. On the SAS tab, click Modify in the Selection group. This opens the Pie Chart window again where you can make edits to the data and other options. Click Run when you are done editing. Notice that the customizations that you made on the previous version of the chart were retained. Sometimes modifications are retained, and sometimes modifications are removed. This action depends on what changes are made when you modify the task and whether the SAS add-in needs to replace the current chart with a new chart.
CREATING A CHART USING A SAS TASK
Let’s say that you have a table with orders from a single state and you want to view that data in a map. Although Excel can create many types of charts, a map is not available. In this section, you will learn how to create a chart using a SAS Task. For more information about Tasks, see the next chapter.
Table 2.1 shows the available tasks for creating charts and graphs along with the SAS license required to access the task.
CHAPTER 2: WORKING WITH DATA IN EXCEL 27

Table 2.1: Built-in Tasks for Creating Charts and Graphs
Built-in Task SAS Procedures Used SAS License Required
Area Plot GPLOT Base SAS, SAS/GRAPH
Bar Chart GCHART Base SAS, SAS/GRAPH
Bar Chart Wizard GCHART Base SAS, SAS/GRAPH
Bar-Line Chart GBARLINE Base SAS, SAS/GRAPH
Box Chart SHEWHART Base SAS, SAS/QC
Box Plot GPLOT Base SAS, SAS/GRAPH
Bubble Plot GPLOT Base SAS, SAS/GRAPH
c Chart SHEWHART Base SAS, SAS/QC
CDF Plots CAPABILITY Base SAS, SAS/QC
Contour Plot GCONTOUR, G3GRID Base SAS, SAS/GRAPH
Donut Chart GCHART Base SAS, SAS/GRAPH
Histograms CAPABILITY Base SAS, SAS/QC
Individual Measurements Chart SHEWHART Base SAS, SAS/QC
Line Plot GPLOT Base SAS, SAS/GRAPH
Line Plot Wizard GPLOT Base SAS, SAS/GRAPH
Map Chart GMAP Base SAS, SAS/GRAPH
Mean and Range Chart SHEWHART Base SAS, SAS/QC
Mean and Standard Deviation Chart SHEWHART Base SAS, SAS/QC
np Chart SHEWHART Base SAS, SAS/QC
p Chart SHEWHART Base SAS, SAS/QC
Pareto Chart PARETO Base SAS, SAS/QC
Pie Chart GCHART Base SAS, SAS/GRAPH
Pie Chart Wizard GCHART Base SAS, SAS/GRAPH
P-P Plots CAPABILITY Base SAS, SAS/QC
Probability Plots CAPABILITY Base SAS, SAS/QC
Q-Q Plots CAPABILITY Base SAS, SAS/QC
Radar Chart GRADAR Base SAS, SAS/GRAPH
Scatter Plot GPLOT, G3D Base SAS, SAS/GRAPH
Scatter Plot Matrix SGSCATTER Base SAS, SAS/GRAPH
Show ODS Statistical Graph SGDESIGN Base SAS
28 SAS INSTITUTE

Surface Plot G3D Base SAS, SAS/GRAPH
Tile Chart GTILE Base SAS, SAS/GRAPH
u Chart SHEWHART Base SAS, SAS/QC
Let’s look at an example of how to use the Map Chart task to create a
map. When your data has columns that correspond to locations, such as City, County, State, or Country, you can use those columns to help generate a map. On the SAS Tab, click Tasks → Graph → Map Chart. The Choose Data window opens. Verify that the data being used is your Excel data. In the Location for Results section, you can choose where you want the results to be inserted. Choose New Worksheet and then change the name of the worksheet to correspond to the map as shown in Figure 2.11. Click OK to start the task.
Figure 2.11: Choose Data Window
In the task window, verify that the type of map that you want is selected. In this example, we choose a 2-D Choropleth Map as shown in Figure 2.12.
CHAPTER 2: WORKING WITH DATA IN EXCEL 29

Figure 2.12: Map Chart Task
Next, specify the data that you will use. Select Data on the left side of the selection pane. In this example, you will need two data sources to generate the map: the map data source and the response data source. The response data source is specified for you and refers to the Excel worksheet. You need to select the map data source. Click Edit to the right of Map Data Source. SAS Documentation has all the details about the map data sets. Navigate to the one you want. In this example, we will go to Servers → SASApp → MAPS and select the USCOUNTY data set. Click Open to return the selection to the task. Verify that STATE and COUNTY are automatically assigned to the ID variable role as shown in Figure 2.13. Assign COUNTY to the response variable.
30 SAS INSTITUTE

Figure 2.13: Map Chart Task – Data
Under Appearance, select Legend from the selection pane to set the options for the map legend. If you want to display a legend, click the Show legend check box. Enter Number of Orders as the label text.
To customize report titles, select Titles from the selection pane. Uncheck the Use default text check box and change the default title to your own text.
When you are done making your selections, click Run to product the map. Once the map is generated, it will be inserted into the new worksheet that you specified earlier. (See Figure 2.14.)
CHAPTER 2: WORKING WITH DATA IN EXCEL 31

Figure 2.14: Map Chart in New Worksheet
SUMMARY
In this chapter, you learned how easy it is to view and manipulate your data in Excel. The SAS add-in has additional capabilities, such as using the OLAP Analyzer to view data in an OLAP cube or creating a PivotTable report. For more information, see “Working with Microsoft Excel Data and SAS Data Sources” in the SAS Add-In 8.3 for Microsoft Office Documentation.
In the next chapter, you will learn how to use the built-in tasks available in the SAS add-in and even create your own custom tasks.
32 SAS INSTITUTE

CHAPTER 3
Working with Tasks
INTRODUCTION
A task provides a point-and-click interface to a specific type of analysis or report that you can perform against data. Certain tasks also have wizards that prompt you for the information that you need to execute the task. In this chapter, we will learn how to use tasks and wizards in the SAS add-in.
SAS Enterprise Guide and SAS Add-In for Microsoft Office are shipped with many built-in SAS tasks. You can access these tasks from the Tasks pane. Table 3.1 shows the list of tasks and wizards available in the SAS add-in and SAS Enterprise Guide for users with a Base SAS license. However, you can also add custom tasks, and you might have access to SAS Studio tasks. Tables 3.2 and 3.3 show the additional tasks that are available with SAS/GRAPH and SAS/STAT license.
33

Table 3.1: Built-in Tasks Available with Base SAS
Built-in Tasks with Base SAS SAS Procedures Used
Append Table SQL
Assign Project Library LIBNAME
Characterize Data CONTENTS, UNIVARIATE, FREQ
Compare Data COMPARE
Correlations CORR
Create Format FORMAT
Create Format from Data Set FORMAT
Data Set Attributes DATASETS
Delete Data Sets and Formats SQL, CATALOG
Distribution Analysis UNIVARIATE
Download Data Files to PC SQL
Filter and Sort (Enterprise Guide only) SQL
List Data PRINT
List Report Wizard REPORT
One-Way Frequencies FREQ
Query Builder (Enterprise Guide only) SQL
Rank Data RANK
Recency, Frequency, and Monetary Analysis SAS Macro
Show ODS Statistical Graph SGDESIGN
Sort Data SORT
Split Columns TRANSPOSE
Stack Columns TRANSPOSE
Standardize Data STANDARD
Summary Statistics MEANS
Summary Statistics Wizard MEANS
Summary Tables TRANSPOSE
Summary Tables Wizard TRANSPOSE
Table Analysis FREQ
Transpose TRANSPOSE
Update Library Metadata (Enterprise Guide only) METALIB
34 SAS INSTITUTE

Built-in Tasks with Base SAS SAS Procedures Used
Upload Data Files to Server (Enterprise Guide only) SQL
Table 3.2: Additional Tasks Available with SAS/GRAPH
Built-in Tasks with SAS/GRAPH SAS Procedures Used
Area Plot GPLOT
Bar Chart GCHART
Bar Chart Wizard GCHART
Bar-Line Chart GBARLINE
Box Plot GPLOT
Bubble Plot GPLOT
Contour Plot GCONTOUR, G3GRID
Create Map Feature Table GPROJECT
Donut Chart GCHART
Line Plot GPLOT
Line Plot Wizard GPLOT
Map Chart GMAP
Pie Chart GCHART
Pie Chart Wizard GCHART
Radar Chart GRADAR
Scatter Plot GPLOT, G3D
Scatter Plot Matrix SGSCATTER
Surface Plot G3D
Tile Chart GTILE
CHAPTER 3: WORKING WITH TASKS 35

Table 3.3: Additional Tasks Available with SAS/STAT
Built-in Tasks with SAS/STAT SAS Procedures Used Additional SAS License Required
Canonical Correlation CANCORR
Cluster Analysis CLUSTER, FASTCLUS, TREE
Discriminant Analysis DISCRIM
Factor Analysis FACTOR
Generalized Linear Models GENMOD
High-Performance Linear Regression HPREG SAS High-Performance Analysis
Server
High-Performance Logistic Regression HPLOGISTIC SAS High-Performance Analysis
Server
Linear Models GLM
Linear Regression REG
Logistic Regression LOGISTIC
Mixed Models MIXED
Nonlinear Regression NLIN
Nonparametric One-Way ANOVA NPAR1WAY
One-Way ANOVA ANOVA
Principal Components PRINCOMP
Proportional Hazards PHREG
Random Sample SURVEYSELECT
t Test TTEST
Additional tasks are also available with a JMP, ODS Graphics Designer, SAS/ACCESS, SAS/ETS, SAS/QC, SAS Forecast Server, or Enterprise Miner license. For more information and to view the complete list of tasks, see SAS® Tasks in SAS® Enterprise Guide 8.3 and SAS Add-In 8.3 for Microsoft Office.[1] [1]
TASKS
You can view your available tasks from the Tasks tab in the SAS panel. (See Figure 3.1.)
36 SAS INSTITUTE
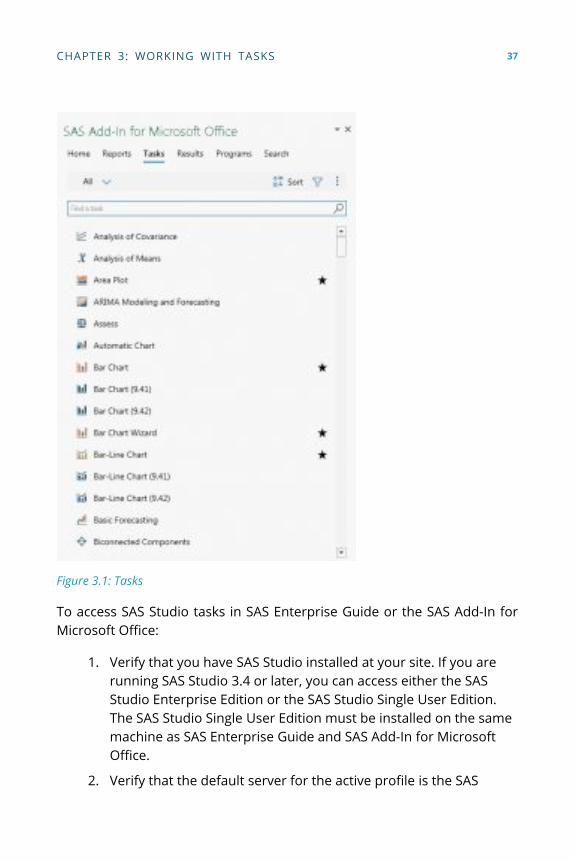
Figure 3.1: Tasks
To access SAS Studio tasks in SAS Enterprise Guide or the SAS Add-In for Microsoft Office:
1. Verify that you have SAS Studio installed at your site. If you are running SAS Studio 3.4 or later, you can access either the SAS Studio Enterprise Edition or the SAS Studio Single User Edition. The SAS Studio Single User Edition must be installed on the same machine as SAS Enterprise Guide and SAS Add-In for Microsoft Office.
2. Verify that the default server for the active profile is the SAS
CHAPTER 3: WORKING WITH TASKS 37

Studio server.
3. In the settings for SAS Enterprise Guide or SAS Add-In for Microsoft Office, select the Display SAS Studio tasks option.
SELECTING A DATA SOURCE
You can run SAS tasks in Microsoft Excel, Word, and PowerPoint. However, before you can run a task, you must specify an input data source. You select this data source from the Choose Data dialog window that appears after you select a task.
If you are running the SAS add-in in Word or PowerPoint, you can specify only an external data source. You cannot open data sources in Word or PowerPoint. If you are running the SAS add-in in Excel, you can specify the following input data sources:
• A range of data in an Excel worksheet
• A SAS data source that is open in the Excel workbook
• An external data source
If you select a SAS data set as the input data source, all of the variables in the data set are available to the task, and the task runs against all the variables in the data set. If you select an information map as the input data source, you are prompted to select the variables to use.
EXAMPLE
In this section, you will learn how to use a task to produce a summary statistics report. In the SAS add-in, task windows have a common format, so when you are familiar with running one task, running other tasks is easy. First, open a new document in Word, a new slide in PowerPoint, or a new or existing workbook in Excel and open the SAS tab.
Let’s say you need a report that shows the average, minimum, and maximum number of products ordered from a specific product line. To start the task, click Tasks → Describe → Summary Statistics. Note that both a task and a wizard are available to create a summary statistics report. Make sure to select the correct one to use the task.
38 SAS INSTITUTE

Choose Data
Before starting a task, it is necessary to choose the data that you want to use. In the Choose Data window, select your data set from the drop-down menu of recent items or click Browse to locate a table. Click OK and the Summary Statistics task window appears.
All tasks have a Data area where you assign variables to roles as shown in Figure 3.2. By default, the data source that you selected before opening the task is the input data source for the task.
Note: Different options are available for different tasks. When you use a Graph task, you must first select the type of graph that you want to create. You will also have options to customize the Appearance of the graph.
CHAPTER 3: WORKING WITH TASKS 39
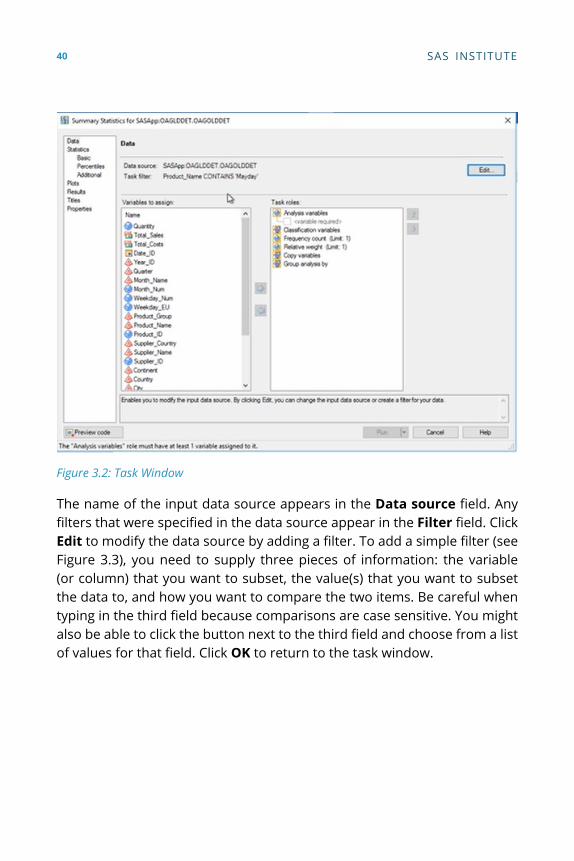
Figure 3.2: Task Window
The name of the input data source appears in the Data source field. Any filters that were specified in the data source appear in the Filter field. Click Edit to modify the data source by adding a filter. To add a simple filter (see Figure 3.3), you need to supply three pieces of information: the variable (or column) that you want to subset, the value(s) that you want to subset the data to, and how you want to compare the two items. Be careful when typing in the third field because comparisons are case sensitive. You might also be able to click the button next to the third field and choose from a list of values for that field. Click OK to return to the task window.
40 SAS INSTITUTE

Figure 3.3: Edit Data and Filter
Assign Variables
How you make variable assignments is similar for most tasks. On the left side of the task window is the Columns to assign or Variables to assign, which lists the columns (or variables) in the table. (See the orange outlined box in Figure 3.4.) The icon next to each variable represents the variable’s type. For example, in the figure you can see that Quantity is a numeric variable. Total_Sales and Total_Costs are numeric variables in currency format. Date_ID is a numeric variable in date format. Product_name is a character variable.
CHAPTER 3: WORKING WITH TASKS 41

Figure 3.4: Variables to Assign
The Task roles box lists the ways that the variables can be used in the task. To run the Summary Statistics task and create a simple vertical summary statistics report, one column is required in the Analysis variables role. The icon next to each task role indicates the type of variable that you can assign to the role. For example, the Analysis variables role accepts only numeric variables, but the Classification variable role accepts all variable types. Some roles limit the number of variables that can be assigned to them. If there is a limit, it is always noted beside the role name, as with the Frequency count role in this example, which accepts only one variable.
In this example, we want to calculate the average, minimum, and maximum products that were ordered in the Mayday line. Select Quantity in the Variables to assign list and drag it to the Analysis variables role.
If you want the analysis to be by product name, you will use the Classification variables role. The variables that are assigned to this role are character or discrete numeric variables that are used to divide the input data into categories or subgroups. The statistics will be calculated on all
42 SAS INSTITUTE

selected analysis variables for each unique combination of classification variables. Select Product_Name from the variables to assign it and drag it to the Classification variables role.
Use the Copy variables role to include additional variables. Select Product_ID and drag it to the Copy variables role.
Set Options
Every task also has options that you can set. Some tasks have many options, which are grouped into categories under the main headings in the selection pane. In Graph tasks, the options might be mostly appearance-related. In the case of the Summary Statistics task, the options include Statistics, Plots, and Results. The statistics options are grouped into three subcategories: Basic, Percentiles, and Additional. In this example, we want the mean, minimum, and maximum statistics. Because these are basic statistics, click Basic in the selection pane. (See Figure 3.5.)
Figure 3.5: Basic Statistics
CHAPTER 3: WORKING WITH TASKS 43

Note: If you need assistance in determining how to make changes in the options, click Help in the lower right corner of the task.
By default, the mean, standard deviation, minimum, maximum, and number of observations are included. Uncheck any statistics that you don’t want. In this case, we will clear the Standard deviation and Number of observations check boxes. Select 0 as the Maximum decimal pl option for the maximum number of decimal places to use for the calculated statistics.
Specify Titles and Footnotes
Most tasks also enable you to specify titles and footnotes for your results. Click Titles in the selection pane to establish both titles and footnotes. (See Figure 3.6.) With Analysis selected, clear the Use default text check box and change the default title or remove the text to leave it blank. You can do the same process for Footnote.
44 SAS INSTITUTE

Figure 3.6: Titles and Footnote
View SAS Code
As you assign variables to roles and select options in the task window, the SAS add-in generates SAS code behind the scenes. You can see this code by clicking Preview code at the bottom left of any task window.
Run the Task
When you have finished selecting options for your task, click Run to submit the code and run the task. The output for the task is placed in the SAS panel on the Results tab.
Although the task window closes when you run the task, your selections are saved. A simple way to reopen the task is to click on inserted results to make them the active selection, and then click Modify on the SAS tab.
CHAPTER 3: WORKING WITH TASKS 45
WIZARDS
In the previous section, we learned how to use a task to generate a summary statistics report. In this section, we will look at how to use a wizard to accomplish the same thing. A wizard provides a quick step-by-step mechanism for accessing several of the SAS tasks by surfacing a limited number of options.
To use the Summary Statistics Wizard, on the SAS tab select Tasks → Describe → Summary Statistics Wizard.
CHOOSE DATA
Just like with a task, before you start the wizard, it is necessary to choose the data in the Choose Data window. Click Browse to navigate through folders to locate the table that you want to use or if it is a table that you use frequently, it might be available in the drop-down menu. Click OK and the Summary Statistics Wizard window appears.
There are four steps for creating the summary report. The first step is to verify the data (Figure 3.7). By default, the wizard uses the data that you selected before you opened the wizard.
46 SAS INSTITUTE

Figure 3.7: Wizard Step 1
In the SAS add-in, you can create additional filters for the input data from the task window. Click Edit to modify the data source by adding a filter. This process is the same as explained earlier in the task. There are three pieces of information that you need to supply to create a simple filter: the variable (or column) that you want to subset, the value(s) that you want to subset the data to, and how you want to compare the two items. Click OK to return to the wizard after you have added any filters you want. Click Next to move to step 2 of the wizard.
ASSIGN VARIABLES
In step 2 of the wizard, you will assign variables to roles. In the Summary Statistics wizard, you drag and drop available variables to different roles. You must assign at least one variable to the Summary Statistics of (Analysis variable) role. The Available variables box lists the variables in the table. The icon next to each variable represents the variable’s type.
CHAPTER 3: WORKING WITH TASKS 47

As you can see in Figure 3.8, the wizard gives you guidance on what type of variables can be assigned to each role. For example, in the first box, in addition to showing you an icon of which variables can be used, the box also instructs you to “Drop numeric variables here.”
Figure 3.8: Wizard Step 2
After you have assigned all variables needed for your analysis, click Next to move to step 3.
SPECIFY RESULTS
In step 3, you will specify statistics and results. By default, the mean, standard deviation, minimum, maximum, and number of observations are included. This information is shown at the top of the window. (See Figure 3.9.)
48 SAS INSTITUTE

Figure 3.9: Wizard Step 3
To change the statistics that are included in the results, click Edit. In the Edit Statistics window, you can select the statistics that you want to include or exclude from the report. Click OK to return to the wizard. Notice that if you made any changes to the statistics, the new statistics will be displayed at the top of the window.
Click Next to move to the next step.
SPECIFY TITLES AND FOOTNOTES
In the fourth and final step of this wizard, you can change the default title and footnotes.
CHAPTER 3: WORKING WITH TASKS 49

Figure 3.10: Wizard Step 4
After you have made any changes to the title and footnotes that you want, click Finish to create the report. The output from the task is placed in the SAS panel on the Results tab. From there, it is a single step to insert the results into your document.
Although the wizard closes when you run the task, your selections are saved. You can easily reopen the wizard by clicking Modify on the SAS tab when the results are the active selection.
TASK TEMPLATES
When you run a task, you might want to frequently use the same settings. Instead of opening the task multiple times to specify these settings for different input data sources, task templates enable you to save your settings for a specific task to a template. You can then run that template with any input data source.
50 SAS INSTITUTE

For example, you might have a custom bar chart with a title, footnote, legend, three-dimensional cylinder bar style, and custom colors to meet your department’s requirements.
CREATING A TASK TEMPLATE
The most direct way to create a template is after you have run a task and inserted the results. In Excel, click the graph or report to make it the active selection. Then, in the SAS tab, click Modify in the Selection section.
In the Task window, click the down arrow next to Run. Select Create Template as shown in Figure 3.11.
Figure 3.11: Create Template
The Create Task Template window opens. (See Figure 3.12.) Add a name in the Name field. You can also provide a brief description to help other users better understand the purpose of the template.
Next, select where to add the new template. Remember that when working with task templates, settings that depend on the data source are not saved in the task template. Click Create, and you are done!
CHAPTER 3: WORKING WITH TASKS 51

Figure 3.12: Create Task Template
The new task template is now available.
USING A TASK TEMPLATE
To use a task template, select Tasks → Task Templates in the SAS tab of Microsoft Word, Excel, or PowerPoint. You should see a list of all task templates, and you can click on the one that you want to use. The task will then open.
Proceed through the steps of using the task. First, select the data source that you want to use and click OK. The Task window appears. Here, the only things you will usually worry about specifying are any of the data-related settings. All other selections including appearance, titles, and footnotes will be already made by the template.
To specify the data settings, click Data in the left selection pane. Drag and drop the variables that you want to use into the Task roles. If you want to change any of the other settings such as the title, use the left selection pane to navigate to that section and make the changes.
When you are done, click Run to generate your results. The results
52 SAS INSTITUTE

are displayed in the SAS panel, and you can then insert them into your document.
Using task templates can simplify creating reports and save you time from the tedious process of selecting custom colors and other options.
CUSTOM TASKS
You can extend the functionality of SAS Add-In for Microsoft Office by creating custom tasks. The SAS add-in can run tasks that were created for use with SAS Enterprise Guide 3.0 or later. To add a custom task, create a directory for the custom tasks. After you add a custom task, it is listed with the SAS tasks that are shipped with SAS Add-In for Microsoft Office.
Custom tasks are integrated with the SAS tasks that are shipped with SAS Add-In for Microsoft Office. Custom tasks can be in new task groups that are created by the custom task or in an existing task group. To run a custom task, double-click the task name on the Tasks tab in the SAS panel or select the task name from the Tasks menu.
SUMMARY
The SAS add-in offers many built-in tasks that make it easy to create the analysis or report that you need. With just a few clicks, you can create meaningful tables and charts to help others understand data.
In the next chapter, you will learn about another feature that you can use to produce custom reports using prompts – stored processes.
[1] SAS Institute Inc. 2020. SAS® Tasks in SAS® Enterprise Guide® 8.3 and SAS® Add-In 8.3 for Microsoft Office. Cary, NC: SAS Institute Inc. Available at https://go.documentation.sas.com/doc/en/amodoccdc/8.3/egamotasks/titlepage.htm.
CHAPTER 3: WORKING WITH TASKS 53
CHAPTER 4
Working with Stored Processes
INTRODUCTION
A stored process is a SAS program that is stored on a server and defined in metadata, and which can be executed as requested by client applications. Stored processes can access any SAS data source or external file and create new data sets, files, or other data targets that are supported by SAS.
Stored processes are important because the ability to store your SAS programs on the server provides an effective method for change control management. For example, instead of embedding the SAS code into client applications, you can centrally maintain and manage this code from the server. This gives you the ability to change your SAS programs and at the same time ensure that every client that invokes a stored process always gets the latest version available. Using stored processes also enhances security and application integrity because the programs that access your sensitive data are contained on the server instead of being widely distributed.
The SAS Add-In for Microsoft Office enables you to dynamically execute stored processes and embed the results in Microsoft Word documents, Microsoft Excel spreadsheets, and Microsoft PowerPoint presentations. Also, within Excel, you can use the SAS add-in to access and view SAS data sources or any data source that is available from your SAS server, and analyze SAS or Excel data by using analytic tasks.
54

WRITING A SAS STORED PROCESS
A stored process is a SAS program that is hosted on a server and described by metadata. Stored processes can be written by anyone who is familiar with the SAS programming language or with the aid of a SAS code generator such as SAS Enterprise Guide. The basic steps for creating a stored process are as follows:
1. Write the stored process.
2. Choose or define a server.
3. Register the stored process metadata.
WRITE THE STORED PROCESS
Almost any SAS program can be a stored process. A stored process can be written using the SAS Program Editor, SAS Enterprise Guide, or any text editor. The following program is an example of a stored process: %stpbegin;
title “Product Sales for &MONTH, &YEAR”; proc printproc print data=sales; where Month eq “&MONTH” and Year eq &YEAR; var productid product sales salesgoal; runrun; %stpend; This code generates a table. The %STPBEGIN and %STPEND
macros initialize the Output Delivery System (ODS) and deliver the output to the client. This stored process is capable of generating multiple output formats, including HTML, XML, PDF, CSV, and custom tagsets and then delivering the output through packages or streaming output.
Most stored processes require information from the client to perform their intended function. This information can be in the form of presentation options for a report, selection criteria for data to be analyzed, names of data tables to be used or created, or an unlimited number of other possibilities. Input parameters are the most common way to deliver information from a client to a stored process.
CHAPTER 4: WORKING WITH STORED PROCESSES 55

Input parameters are defined as name/value pairs. They appear in a stored process program as global macro variables. For example, the stored process above analyzes monthly sales data and accepts MONTH and YEAR as input parameters.
CHOOSE OR DEFINE A SERVER
You must choose a server (for stored processes that are compatible with SAS 9.2) or application server context to host your stored process. Servers are defined in metadata and are actually logical server definitions that can represent one or more physical server processes. There are many options, including pre-started servers, servers that are started on demand, and servers that are distributed across multiple hardware systems. You can use the Server Manager in SAS Management Console to create or modify server definitions. For more information about server configurations, see the SAS Intelligence Platform: Application Server Administration Guide.
Stored processes can be hosted by two types of servers: SAS Stored Process Servers and SAS Workspace Servers. The two servers are similar, but they have slightly different capabilities and are targeted at different use cases.
• The SAS Stored Process Server is a multi-user server. A single server process can be shared by many clients. Because the same server handles requests from multiple users, it cannot easily impersonate a user to perform security checks.
• The SAS Workspace Server is a single-user server. A new server process is started for each client, then terminated after the stored process completes execution.
REGISTER THE METADATA
After you write the stored process and define or choose a server, you must register the metadata by using the New Stored Process wizard in SAS Management Console. (SAS Enterprise Guide users can perform the same steps within the SAS Enterprise Guide application.) The New Stored Process wizard can be used to create new stored processes, or you can use the
56 SAS INSTITUTE

Stored Process Properties dialog window in SAS Management Console to modify existing stored processes.
Starting with SAS 9.2, you can register and modify the metadata for stored processes programmatically by using a Java API. For more information about using the New Stored Process wizard or the Stored Process Properties dialog window to create and maintain the metadata defining a stored process, see the Help in SAS Management Console.
EXAMPLE
In this example, you will learn how to take an existing SAS program in SAS Enterprise Guide and create a stored process. The program creates a ranking report for the top five products based on sales. (See Figure 4.1.) You want to make this report available to others in your department in Microsoft Office applications. A stored process is perfect for this because it enables you to run a SAS program and view the results in a variety of SAS applications.
Figure 4.1: Code in SAS Enterprise Guide
Select Run to submit the SAS code for execution. The generated results include a table listing the top five products and
CHAPTER 4: WORKING WITH STORED PROCESSES 57

their total sales as well as a chart depicting the same information. (See Figure 4.2.)
Figure 4.2: Results in SAS Enterprise Guide
Save the Program
It is not necessary to save the program before you create your stored process; however, it is always a best practice to ensure that you have a working and saved copy of a program before you create the stored process. Click the Program tab to display the code. Then select Save →Save As from the Workspace toolbar. In the Save window, navigate to the folder where you want to save your stored process. Enter a descriptive file name and make sure the file is being saved as a .sas file. Click Save.
Create the Stored Process
To create the stored process, right-click the program in the project tree and select Create Stored Process as shown in Figure 4.3.
58 SAS INSTITUTE

Figure 4.3: Create Stored Process
The Create New Stored Process Wizard appears.
Step 1 Step 1
In the first step of the wizard, you provide general information about the stored process, such as the name and description.
CHAPTER 4: WORKING WITH STORED PROCESSES 59

Figure 4.4: Create New Stored Process Wizard – Step 1
You must provide a Name and a Location in which to save the stored process on the metadata server. The location is the metadata folder where the stored process is saved. When specifying this field, keep in mind that this is where individuals will navigate to in order to locate the stored process. You will want to be aware of issues such as security when selecting your folder location. Click Browse to specify the SAS folders location. Navigate to the folder where you want to save your stored process. Click Save to accept the location specification and return to the wizard.
60 SAS INSTITUTE

The Description and Keywords fields assist people in locating the stored process. However, you can leave them blank.
The Responsibilities area is where you specify one or more users who are responsible for the stored process or can be contacted with questions. By default, the name of the person who is creating the stored process is added as the owner.
Click Next to continue creating the stored process.
Step 2 Step 2
Because the stored process is created from a SAS program, the SAS code is added in this step. If you had not entered the wizard by making selecting the program in the project tree, you can select Replace with code from and then select the location to find the code.
CHAPTER 4: WORKING WITH STORED PROCESSES 61

Figure 4.5: Create New Stored Process Wizard – Step 2
When creating a stored process in SAS Enterprise Guide, you can specify whether SAS Enterprise Guide includes the code for stored process macros, global macro variables, or LIBNAME references. To view the selections made for this stored process, select the Include code for option.
Click the Preview Code icon in the lower left corner to view the stored process code. In addition to the code added from your program, you will also see code elements added by SAS Enterprise Guide. The code that is displayed depends on the code options that you specified. For example, %STPBEGIN and %STPEND statements are added by the stored process
62 SAS INSTITUTE

macros option. Close the Preview window to return to the wizard. Click Next to continue.
Step 3 Step 3
This step is where you specify the options for execution of the stored process. (See Figure 4.6.)
Figure 4.6: Create New Stored Process Wizard – Step 3
The first execution option is the application server. The application server context defines the environment in which the stored process executes. If
CHAPTER 4: WORKING WITH STORED PROCESSES 63

you have multiple server selections available at your site, check with your SAS platform administrator to determine the correct selection.
The Server type area specifies the type of server that will run the stored process. The default selection is Default server, which is selected here. When you select this option, the client application chooses the best server to use when running the stored process.
You must also specify the source code location and execution. If you store the SAS code within the metadata rather than a separate .sas file, it can be extremely beneficial when allowing the stored process to run on multiple application servers. It also could be useful for production environments where the code can be completely locked by the metadata and is not dependent on file system access and security levels.
By default, SAS Enterprise Guide selects the result types that are supported by the stored process. In general, you will want to verify that both Stream and Package output are selected when using the wizard.
If you need further details about the execution options, you can click the More (F1) link in the lower right corner of the window or press F1. Click Next to move to Step 4 of the wizard.
Step 4 Step 4
Step 4 is where you create prompts and output parameters. Including prompts in your code increases your ability to reuse code and also enables the code to be customized when the stored process is run.
64 SAS INSTITUTE
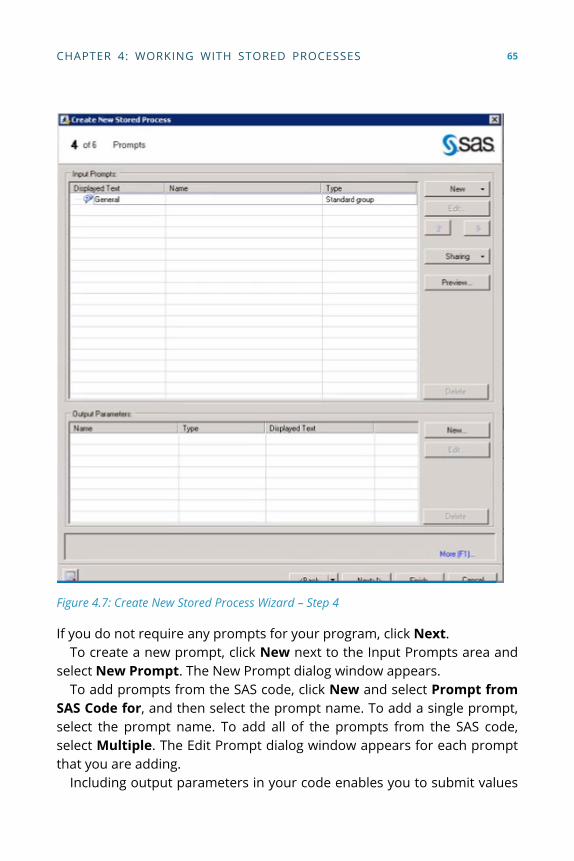
Figure 4.7: Create New Stored Process Wizard – Step 4
If you do not require any prompts for your program, click Next. To create a new prompt, click New next to the Input Prompts area and
select New Prompt. The New Prompt dialog window appears. To add prompts from the SAS code, click New and select Prompt from
SAS Code for, and then select the prompt name. To add a single prompt, select the prompt name. To add all of the prompts from the SAS code, select Multiple. The Edit Prompt dialog window appears for each prompt that you are adding.
Including output parameters in your code enables you to submit values
CHAPTER 4: WORKING WITH STORED PROCESSES 65

to the client application when a stored process runs successfully. Output parameters are used mainly with SAS BI Web Services. The name of the output parameter is the name of the SAS macro variable that is associated with the output parameter. The output parameter can be any of the following types: Date, Double, Integer, Time, TimeStamp, or String.
To add output parameters, click New next to the Output Parameters area. Specify a name for the SAS macro variable that holds the value of the output parameter and select the type for the output parameter.
When you are ready to move on to the next step, click Next.
Step 5 Step 5
In Step 5, you specify any data sources and targets that your stored process requires. Using input or output data sources is a fairly specialized thing. But you should know that you can define any data sources that you want to use as input when the stored process runs. You can also specify any data targets where you want to send output when the stored process runs.
66 SAS INSTITUTE

Figure 4.8: Create New Stored Process Wizard – Step 5
Click Next to go to the final step of the wizard.
Step 6 Step 6
This step provides a summary of the specified information. (See Figure 4.9.)
CHAPTER 4: WORKING WITH STORED PROCESSES 67

Figure 4.9: Create New Stored Process Wizard – Step 6
Verify that the Run stored process when finished check box is selected. With this option selected, SAS Enterprise Guide runs the stored process when you click Finish. Running the stored process is good validation that the stored process results are what you expect.
Click Finish. The stored process is created and executed. The stored process results are returned to the workspace.
68 SAS INSTITUTE

Check Process Flow Check Process Flow
In SAS Enterprise Guide, click Process Flow. Notice that the stored process and its results appear in your process flow. With your code saved and the stored process created, you no longer need this project. You can close the project by selecting File → Close Project. You are prompted to save the project. Click No.
Closing the project does not delete the stored process. You can open the stored process again by clicking File → Open → Stored Process and navigating to the metadata location that you specified for the stored process earlier.
RUN A STORED PROCESS
In this section, you will learn how to run a stored process in the SAS add-in. By running a stored process, you can produce custom reports that were developed by other users at your company. Stored processes can contain prompts that enable you to customize your report. These prompts appear when you run the stored process. Examples of prompts include selecting the type of chart to include in the results or selecting an input data source for the stored process.
Click the Reports icon on the SAS tab to navigate through the folders, locate, and open the stored process that you need. (See Figure 4.10)
Figure 4.10: SAS Tab
If the stored process has no parameters, it runs immediately. But if the stored process has parameters, you will be prompted to select the items that you want to use. When you have selected all the values for your report, click Run to run the stored process. The results automatically appear in the SAS panel.
Insert all the results by clicking the Insert all icon in the SAS panel or you
CHAPTER 4: WORKING WITH STORED PROCESSES 69

can select specific items to insert. In Excel, you might be further prompted to specify the worksheet where you want the results to be inserted.
If you want to run the stored process again using the same parameter values, click the Refresh report icon located on the ribbon, SAS panel, or Results tab.
To run the stored process again and change the parameter values, you can modify the results either by selecting Modify on the SAS tab or selecting More options (⋮) and then Modify Report in the SAS panel. The prompt window appears where you can make different selections for your data. Run the stored process to update your report with the new results. The SAS add-in updates both the report displayed in the SAS panel and the inserted results in your document.
SUMMARY
SAS stored processes have many benefits because of their ability to centrally maintain, manage, and store code. The SAS add-in enables you to dynamically execute stored processes and embed the results in Microsoft Word documents, Excel spreadsheets, and PowerPoint presentations. For more information about how to write and manage stored processes, see SAS® 9.4 Stored Processes: Developer’s Guide, Third Edition.
Now that you have learned several ways to generate reports through tasks and stored processes, in the next chapter you will learn how to customize those reports to look exactly how you want through the use of styles.
70 SAS INSTITUTE

CHAPTER 5
Customizing Results
INTRODUCTION
In this chapter, we will learn how to customize your results to make them look exactly how you want. Maybe you need to make sure the colors and font match your company’s brand guidelines. Or maybe you want to call attention to certain elements of your report. Whatever the reason, you can use the Style Manager to easily modify the appearance of every element of a report to suit your needs. Even better, those preferences can be saved so that you can use them over and over without going through the process every time.
CUSTOMIZE RESULTS
In this section, you learn how to customize SAS results in a Word document by applying a SAS style and selecting the results that are inserted into the document. Elements that can be customized include color, font, size, justification, and labels.
SELECT A SAS STYLE
When the colors of a report don’t match the appearance of the rest of your presentation, you can change them by applying a SAS style to your results.
71

To set a SAS style before you insert results, select Tools → Options on the SAS tab. Go to the Results pane, as shown in Figure 5.1.
Figure 5.1: Results Pane Options Window
In the Results pane, you can specify a style that is used by default when the results format is SAS Report. For the Results Format option, select SAS Report. Three options are available for when to Apply the SAS style to the results:
• Never (default)
• When inserting content only (not available in all Office applications)
• When inserting and refreshing content
To ensure that you can maintain any customizations that you make to
72 SAS INSTITUTE

the results in the worksheet, such as highlighting a value, select When inserting content only. Next, select the Style that you want to apply from the list of available styles. Click OK to close the window when you are done.
If you want to apply a SAS style after you have already inserted content, highlight the content that you want to change by clicking on it. In the SAS tab go to Properties. In the Properties window, click on the Appearance tab. Select Always apply the SAS style to the results and then select the style that best matches how you want the results to look. Close the window and refresh the results if the changes do not apply immediately.
CREATE AND CUSTOMIZE OUTPUT STYLES FOR SAS RESULTS
When creating SAS results in the SAS Add-In for Microsoft Office, you can use styles to control the appearance of those results. Styles are based on cascading style sheets and are a set of specifications that control the appearance of your HTML or SAS Report output. You can use the Style Manager to modify an existing style or create a new style.
To open the Style Manager:
1. Verify that the SAS content is active by clicking on it to make it the active selection.
2. Select Properties on the SAS tab.
3. In the Properties window, click the Appearance tab.
4. Choose a style that has settings similar to what you need.
5. Select the Always apply the SAS style to the results check box.
6. To create a custom style, click Manage Styles.
7. The Style Manager appears.
CHAPTER 5: CUSTOMIZING RESULTS 73
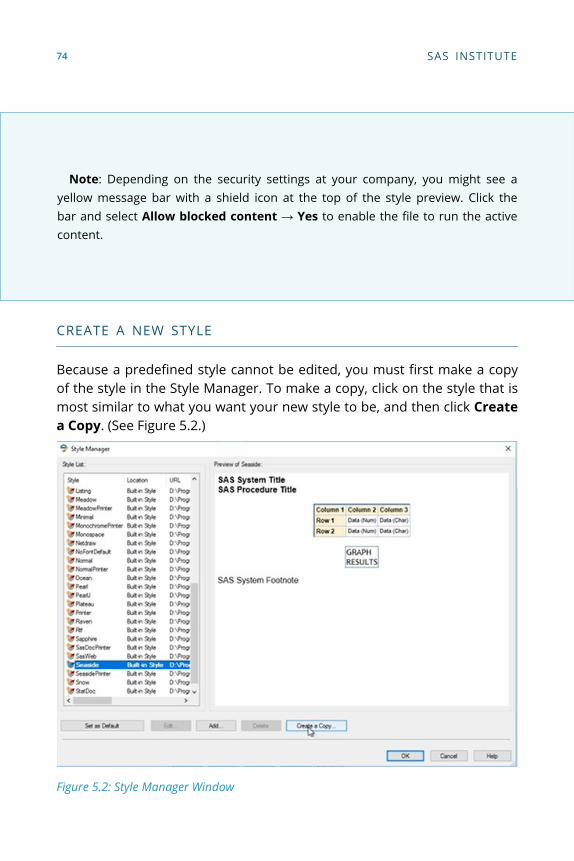
Note: Depending on the security settings at your company, you might see a yellow message bar with a shield icon at the top of the style preview. Click the bar and select Allow blocked content → Yes to enable the file to run the active content.
CREATE A NEW STYLE
Because a predefined style cannot be edited, you must first make a copy of the style in the Style Manager. To make a copy, click on the style that is most similar to what you want your new style to be, and then click Create a Copy. (See Figure 5.2.)
Figure 5.2: Style Manager Window
74 SAS INSTITUTE

In the Save Style As window, enter a new name for the style in the File Name field. When you name the style sheet, make sure to follow these best practices that follow the SAS naming convention:
• Names should be between 1 to 32 characters.
• Names must start with a letter or underscore and continue with any combination of letters, numbers, and underscores.
• If the name consists of multiple words, do not use spaces (for example, RetailSales or Retail_Sales, not Retail Sales).
Click Save to save your style with a new name.
MODIFY A STYLE
To make modifications to a new or existing style, select the name of the style in the style list in the Style Manager. Click Edit. The Style Editor window appears. (See Figure 5.3.)
Figure 5.3: Style Editor Window
On the left of the Style Editor window, there is a preview of the style
CHAPTER 5: CUSTOMIZING RESULTS 75

elements. On the bottom left is a drop-down menu where you can change the selected element. On the right are the attributes for the selected element. Using the tabs in the attributes section, you can edit the font and style of the text, border attributes, background and banner images, and custom style attributes.
Select the element that you want to change by either clicking on any element in the preview area or selecting an element in the Selected element drop-down list.
For example, click the title in the preview area to modify that element. Next, simply select the attributes that you want from the Attributes area. As you make changes, they will appear in the preview area.
If you make a change to one attribute (for example, a custom background color) and want to use it for other elements, you do not have to make each change individually. Once you have the attributes set for one element, click Apply to Other Elements. This opens the Apply to Other Elements window (Figure 5.4).
Figure 5.4: Apply to Other Elements Window
When you use the Apply to Other Elements window, you need to know the element name. Scroll down the list of Style Elements and select the check box next to the name of each element that you want to change. Notice that
76 SAS INSTITUTE

the preview area on the right side of the window is changed to reflect the modifications. Click OK to close the window.
When you have finished making changes to the elements, click OK to close the Style Manager. Notice that your new style is now the applied format in the Properties window. Select the Refresh check box to ensure that your results are refreshed with the updated style and click OK.
The style that you created will be available in the SAS add-in as well as in SAS Enterprise Guide.
REPLICATE RESULTS
Let’s say you have a bar chart that displays sales results for North America but you need to make a chart for a different continent. How can you keep the same appearance and data options, but make slight adjustments? In this section, you’ll learn how to replicate results to easily make slight tweaks without re-doing the entire task.
To start, click on the inserted SAS content that you want to replicate. You can click anywhere in the content. On the SAS tab, select Tools → Replicate SAS Content. The results appear in the SAS panel. Notice that in the upper left of the SAS panel, the task name is shown with a (2) next to it.
Now you can make modifications to the results before you insert them into your document. Click the More Options button (⋮) in the upper right of the SAS panel then select Modify. Make any changes that you want from the task options. For example, you could change the filter in the Data to a different region. Click Edit in the Data section to modify that setting. You will probably also want to change the title.
When you have finished making your changes, click Run to regenerate the chart. Insert the results in your document or on a new slide in a PowerPoint presentation.
SUMMARY
In this chapter you have learned how to customize results to suit your needs. Don’t settle for boring when you can make your reports stand out.
Now that you have mastered the basics of using the SAS add-in, the next
CHAPTER 5: CUSTOMIZING RESULTS 77

chapter will focus on advanced features that you might find helpful if you work with the same task a lot or if you need to send content between different applications.
78 SAS INSTITUTE

CHAPTER 6
Advanced Features
INTRODUCTION
In this final chapter, you will learn how to do more with the SAS Add-In for Microsoft Office. The SAS Add-In for Microsoft Office has several advanced features that you might find useful including the following:
• SAS Program Editor: write and submit code directly in the SAS panel
• Manage Content window: work with multiple items at the same time
• Send to Microsoft Office window: send results to other Microsoft Office applications
• Automation: write Visual Basic Script to automate certain tasks
Finally, the last section in this chapter discusses the SAS Visual Analytics Add-In for Office. This add-in enables you to embed SAS Visual Analytics reports into your document while retaining all of the interactivity from the original report.
SUBMIT A SAS PROGRAM
SAS code can be submitted directly from a Microsoft Office application by
79

using the SAS Program Editor. The SAS Program Editor is available in Excel, PowerPoint, and Word.
There are two ways to open the SAS Program Editor. On the SAS tab on the ribbon, click Programs. This gives you two choices: Add New Program and Import Program. On the SAS panel, click the Programs tab, then More Options. The first two options are to add a new program or import a program.
If your program is already written, click Import Program. In the Open window, navigate to the location where your program is saved. Click Open. Your program opens in the Program Editor in the SAS panel. (See Figure 6.1.)
Figure 6.1: Program Editor
You can see in Figure 6.1 that the SAS add-in provides a color-coded, syntax-checking SAS language editor as just one assistive feature. Other features include autocompletion, automatic formatting, pop-up help, and
80 SAS INSTITUTE

parenthesis matching. You can also use the same keyboard shortcuts and hotkeys.
When the program is complete, click the running man icon to run the code. When the program finishes executing, the results are displayed on the Results tab. Notice that there are three tabs: Code, Log, and Results. You can use the Log tab to review notes about the program execution.
Click the More Options icon to continue working with the SAS program. (See Figure 6.2.) From this menu, you can perform any of these tasks:
• create a program or open a program from the file system
• save a program, log, or results to the file system
• send the program by email
• rename an existing program
• close the current program or all programs that are currently open
• manage connections so that you can add additional workspace servers
Figure 6.2: More Options
CHAPTER 6: ADVANCED FEATURES 81
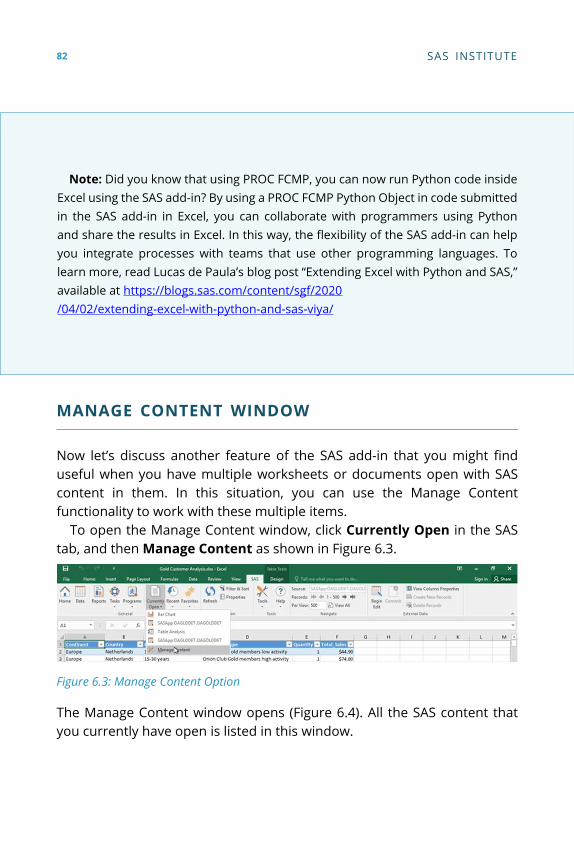
Note: Did you know that using PROC FCMP, you can now run Python code inside Excel using the SAS add-in? By using a PROC FCMP Python Object in code submitted in the SAS add-in in Excel, you can collaborate with programmers using Python and share the results in Excel. In this way, the flexibility of the SAS add-in can help you integrate processes with teams that use other programming languages. To learn more, read Lucas de Paula’s blog post “Extending Excel with Python and SAS,” available at https://blogs.sas.com/content/sgf/2020 /04/02/extending-excel-with-python-and-sas-viya/
MANAGE CONTENT WINDOW
Now let’s discuss another feature of the SAS add-in that you might find useful when you have multiple worksheets or documents open with SAS content in them. In this situation, you can use the Manage Content functionality to work with these multiple items.
To open the Manage Content window, click Currently Open in the SAS tab, and then Manage Content as shown in Figure 6.3.
Figure 6.3: Manage Content Option
The Manage Content window opens (Figure 6.4). All the SAS content that you currently have open is listed in this window.
82 SAS INSTITUTE

Figure 6.4: Manage Content Window
There is a series of icons at the top of the Manage Content window. These icons enable you to perform the following actions:
• expand or collapse the listed items
• delete content
• remove any links in the SAS content
• find SAS content
• view SAS content properties
Notice in Figure 6.4 that the Table Analysis and Bar Chart tasks appear before the OAGOLDDET table that is on the Gold Customers worksheet. That’s because that particular table is the data source for both tasks.
You can change the order or width of the columns in the window. To display the worksheet name after the item name, right-click in the window and select Column Details. In the Column Details window, you can reposition the column order and change the column width. Click OK to accept your changes and close the window. These changes will be saved.
REFRESH CONTENT
You can also use the Manage Content window to refresh content. There
CHAPTER 6: ADVANCED FEATURES 83

are two options to consider when refreshing content. First is the Refresh checked items in order option. When selected, this option specifies that the SAS add-in should refresh the selected SAS content in the order in which it appears in the window. If this option is not selected, then the SAS add-in might run several tasks or open data sources simultaneously. You can change the order by using the up and down arrows located on the right side of the window.
Note that you cannot deselect the Refresh checked items in order option when you select all content. To refresh all items, it is imperative that data set is refreshed before any tasks. Otherwise, the results might not contain the latest data.
The second option to consider when refreshing content is Modify items before refreshing. This option enables you to change the values for a SAS task, stored process, or report.
When you have finished making your selections, click Refresh.
VIEW RESULTS
Double-click the name of any task to view the results. The selected content is displayed. In addition, the SAS panel displays the same results.
APPLY A STYLE
Click the check box next to the results that you want to change. Click the Properties icon to open the Table Analysis Properties window. On the Appearance tab, select Always apply the SAS style to the results, and then choose a style from the drop-down menu. (See Figure 6.5.) Click OK to close the window.
84 SAS INSTITUTE

Figure 6.5: Table Analysis Properties Window
Because you set the style, the content needs to be refreshed to use it. Click the check box next to the results that were changed, and then click Refresh. The results are refreshed, and the style is applied.
SEND TO
The final bit of functionality that we will discuss in the Manage Content window is the Send to button. Clicking that button opens the Send to Microsoft Office window and enables you to send the results from an analysis to another Microsoft Office application. This feature will be discussed more in the next section.
SEND CONTENT BETWEEN MICROSOFT APPLICATIONS
In this section, you will learn how to send content between different Microsoft applications. For example, you might have an analysis in Excel and you want to see the exact same information in Word. Or you might want that analysis in a PowerPoint slide.
CHAPTER 6: ADVANCED FEATURES 85
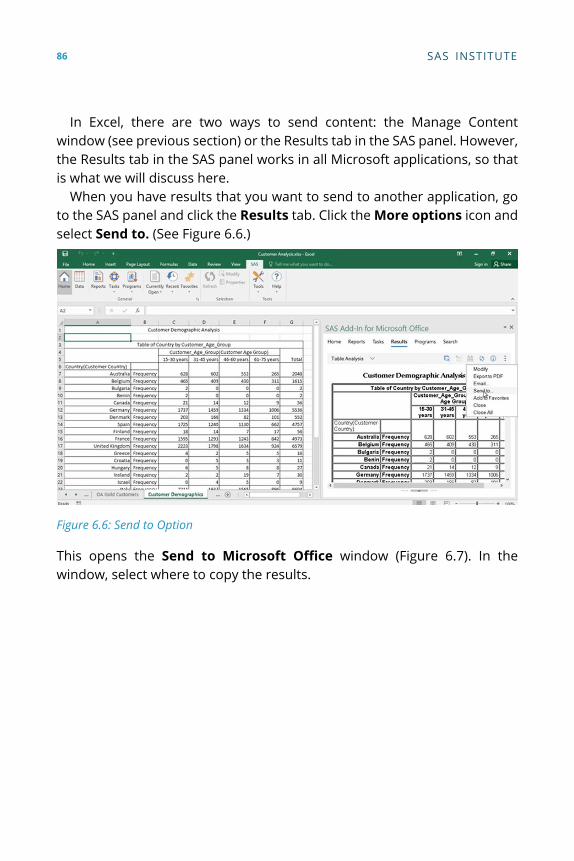
In Excel, there are two ways to send content: the Manage Content window (see previous section) or the Results tab in the SAS panel. However, the Results tab in the SAS panel works in all Microsoft applications, so that is what we will discuss here.
When you have results that you want to send to another application, go to the SAS panel and click the Results tab. Click the More options icon and select Send to. (See Figure 6.6.)
Figure 6.6: Send to Option
This opens the Send to Microsoft Office window (Figure 6.7). In the window, select where to copy the results.
86 SAS INSTITUTE

Figure 6.7: Send to Microsoft Office Window
From Excel, you can send a copy to PowerPoint or Word. Use the check boxes to select where you want to send the results. This window will remember where you last sent content. If you have an open document or presentation, you can send the results there as well.
At the bottom of the window, verify that the Allow results to be refreshed in Microsoft Office box is selected. This ensures that you can refresh or modify the analysis if you want. Click OK to send the results to the applications(s) that you selected.
In the other application, the analysis will appear on the Results tab in the SAS panel. From there, you can work with the content just like any other set of results.
AUTOMATION
The final advanced feature available in the SAS add-in that we will discuss in this chapter is how to use automation. You can write Visual Basic scripts to automate the functionality in the SAS Add-In for Microsoft Office. Scripts
CHAPTER 6: ADVANCED FEATURES 87

enable you to record and replay actions that you do often. By using the automation interface, you can perform tasks such as
• insert a stored process, report, data view, or PivotTable into your Microsoft Office document
• refresh any SAS content in your Microsoft Office document
• change your server connection
• publish a document to a central repository
To use the automation interface, use the Developer tab on the ribbon. In this example, we will insert a button that refreshes content.
INSERT ACTIVEX CONTROL
To add a button, select Insert and choose the Button ActiveX Control as shown in Figure 6.8.
Figure 6.8: Insert Button ActiveX Control
To place the button, click somewhere in the spreadsheet and drag the cursor to create a button in whatever size you want. To change the caption on the button, select Properties on the Developer tab. In the Caption field, change the name to display the text that you want. Close the Properties window and confirm that the caption on the button was changed. Insert ActiveX Control
88 SAS INSTITUTE

WRITE VISUAL BASIC SCRIPT
Before you can write Visual Basic scripts for the SAS add-in, you must add a reference to the SAS add-in version 8 for Microsoft Office from Microsoft Visual Basic.
Select Tools → References. In the list of available references, scroll down and select the SAS Add-In 8 for Microsoft Office check box. (See Figure 6.9)
Figure 6.9: References
Notice that the Location field displays the directory where the SAS add-in is installed. Click OK to save the change
Double-click the button to open the Microsoft Visual Basic Editor (Figure 6.10). Notice that the CommandButton1 procedure was created for you.
CHAPTER 6: ADVANCED FEATURES 89

Figure 6.10: Microsoft Visual Basic Editor
The first part of the code that you will add is used to access the automation interface. To save yourself some typing, you can use the online Help for the SAS add-in.
Return to your document and click the SAS tab. From the Help menu, select Help for the SAS Add-In for Microsoft Office. In the Contents pane, navigate to Automating the SAS Add-In with Visual Basic Code → Using the Automation Interface → Getting Started → Accessing theautomation interface.
Copy the following lines of code in the Sub procedure: Dim sas As objectName
Set sas = Application.COMAddIns.Item("name-of-COM-add-
in").Object However, the code lacks the specifics of pointing to the
Microsoft application that you are using. In the DIM statement, you need to replace objectname. In the SET statement, replace name-of-COM-add-in. The Help article includes a table that lists the parameter values to use for each application. For this example, we will use Excel, so the objectName is SASExcelAddin and the name of the COM add-in is SAS.ExcelAddin.
Return to the Visual Basic Editor and paste the copied code. Then modify the code to reference the COM add-in information. The code should now read:
90 SAS INSTITUTE

Private Sub Commandbutton1_Click() Dim sas As SASExcelAddIn Set sas = Application.COMAddINs.Item (“SAS.ExcelAddIn”).Object End Sub
The next statement that we will add to is to access the Refresh method of the SASExcelAddIn class. On a new line, enter the following code: Sas.Refresh(“ After the open quotation mark, you will put the name of the chart that
you want to refresh. To determine the name of the chart, return to the worksheet and click the SAS content to make it active. Then select Properties in the Selection group on the SAS tab. Copy the Object name from the properties window. In this example, the name of the chart is Bar_Line_Chart. This is what you will use in the Refresh method. Click Cancel to close the Properties window. Return to the Visual Basic Editor, add the object name, and close the method by entering “).
The final code should now read:
Private Sub Commandbutton1_Click() Dim sas As SASExcelAddIn Set sas = Application.COMAddINs.Item (“SAS.ExcelAddIn”).Object
sas.Refresh(“Bar_Line_Chart”) End Sub
To leave the Visual Basic Editor, select File → Close and Return to Microsoft Excel.
You will also need to exit Design Mode now that you have created your button. Otherwise, you cannot test it. Click the Design Mode icon on the Developer tab to deactivate Design Mode.
To test the button, enter a new value in the data that feeds into the chart. Click the button that you created and make sure that the new value is updated on the chart.
For more information about how to use Visual Basic scripts, see “Getting Started with the Automation Interface” in SAS® Add-In 8.3 for Microsoft Office: Developer’s Guide.
CHAPTER 6: ADVANCED FEATURES 91

SAS VISUAL ANALYTICS ADD-IN FOR OFFICE
The SAS Visual Analytics add-in enables you to
• view and interact with reports created in SAS Visual Analytics
• embed SAS Visual Analytics results into spreadsheets and presentations
• refresh content
The SAS Visual Analytics Add-In for Office is only available in Microsoft Excel or PowerPoint. It does not include any functionality for working with SAS data or SAS tasks. For this functionality, you must use the SAS Add-In for Microsoft Office.
Note that your installation might use the same metadata server for both the SAS add-in and the SAS Visual Analytics add-in. However, if your installation of Visual Analytics uses a separate metadata server, then use the SAS Connections window to create a connection to that server.
INTERACTING WITH A SAS VISUAL ANALYTICS REPORT
To open an existing SAS Visual Analytics report, use the Reports tab in the SAS panel. Navigate to the location by clicking My Server and drilling down to the folder location where the report is stored. Click the name of the report to open it.
Notice that a new tab, Results, has appeared in the SAS panel, and it is the active tab. (See Figure 6.11.)
92 SAS INSTITUTE
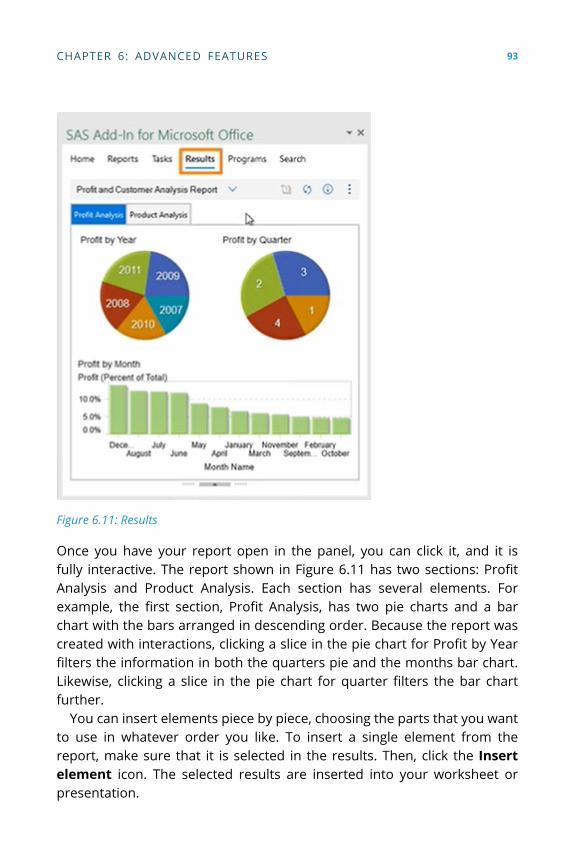
Figure 6.11: Results
Once you have your report open in the panel, you can click it, and it is fully interactive. The report shown in Figure 6.11 has two sections: Profit Analysis and Product Analysis. Each section has several elements. For example, the first section, Profit Analysis, has two pie charts and a bar chart with the bars arranged in descending order. Because the report was created with interactions, clicking a slice in the pie chart for Profit by Year filters the information in both the quarters pie and the months bar chart. Likewise, clicking a slice in the pie chart for quarter filters the bar chart further.
You can insert elements piece by piece, choosing the parts that you want to use in whatever order you like. To insert a single element from the report, make sure that it is selected in the results. Then, click the Insert element icon. The selected results are inserted into your worksheet or presentation.
CHAPTER 6: ADVANCED FEATURES 93
After a table has been inserted into Excel, you can use the features in Excel such as the Quick Analysis functionality to manipulate the data by changing quantity to percentage or adding colors, for example.
Changing the data in the Excel worksheet does not change the SAS Visual Analytics report. It affects only what is displayed in the worksheet. You can always go back to the original information if you need to.
REFRESHING A SAS VISUAL ANALYTICS REPORT
If you have made changes to the data in a report and want to go back to the original, you can refresh the report. Select the report, then on the SAS tab, click Refresh. The data in the cells will be refreshed, but some formatting such as colors will not.
When you make changes to a report in SAS Visual Analytics and refresh the results in Excel or PowerPoint, it displays any changes that were made to the report in Visual Analytics.
SUMMARY
In this chapter, you learned about other features that you can use to make your job easier including how to write and submit programs in the SAS add-in, send content to other Microsoft Office applications, use the SAS Visual Analytics add-in, and more! With the SAS Add-In for Microsoft Office, you get the best of both worlds: the powerful analytics of SAS and the familiar Microsoft Office applications that you know and love.
94 SAS INSTITUTE

SAS and all other SAS Institute Inc. product or service names are registered trademarks or trademarks of SAS Institute Inc. in the USA and other countries. ® indicates USA registration. Other brand and product names are trademarks of their respective companies. © 2020 SAS Institute Inc. All rights reserved. M2063821 US.1120
Be among the first to know about new books, special events, and exclusive discounts.
support.sas.com/newbooks
Share your expertise. Write a book with SAS. support.sas.com/publish
Continue your skills development with free online learning. www.sas.com/free-training
sas.com/booksfor additional books and resources.
Ready to take your SAS® and JMP®skills up a notch?