THE ROLE OF THE SALES PROCESS AT TRADE SHOWS
392
THE ROLE OF THE SALES PROCESS AT TRADE SHOWS by GERT ANTONIE PETRUS DROTSKY Submitted in partial fulfilment of the requirements for the PhD in Marketing in the Faculty of Economic and Management Sciences UNIVERSITY OF PRETORIA SUPERVISOR: PROF. M WIESE NOVEMBER 2016 © University of Pretoria
-
Upload
khangminh22 -
Category
Documents
-
view
8 -
download
0
Transcript of THE ROLE OF THE SALES PROCESS AT TRADE SHOWS

THE ROLE OF THE SALES PROCESS AT TRADE SHOWS
by
GERT ANTONIE PETRUS DROTSKY
Submitted in partial fulfilment of the requirements for the PhD in Marketing in the Faculty of Economic and Management Sciences
UNIVERSITY OF PRETORIA
SUPERVISOR: PROF. M WIESE
NOVEMBER 2016
© University of Pretoria

ACKNOWLEDGMENTS
I want to thank the following people for their contribution to my thesis:
• My supervisor, Prof. Melanie Wiese, for her guidance, support, patience and friendship.
• Dr Tonie Drotsky for his advice, inspiration and motivation.
• Dr Dion van Zyl for his statistical advice and guidance.
• My family for their support, love and patience.
• I would like to thank all my colleagues who have showed an interest in my studies.
• The Tshwane University of Technology, for their financial and work support.
This thesis is dedicated to my father and mother that always believed in me.
© University of Pretoria
i
ABSTRACT
THE ROLE OF THE SALES PROCESS AT TRADE SHOWS
Business-to-business (B2B) marketing is one of the most underestimated and
under-researched fields in marketing. Due to the unique characteristics of B2B
markets, the emphasis has always been on one-on-one communication between
the seller and the buyer. This means that in the communication mix, elements –
such as personal selling and trade shows – play an important role in the selling
and marketing of a business product and the accompanying services.
There is an indication that there will be a growth in the trade-show industry, as well
as in B2B marketing. There is also an element of uncertainty on the role of
personal selling, and more specifically, the sales process at trade shows. Previous
studies focused on the general activities at trade shows; but none focused on the
sales process that is interlinked with trade shows. Therefore, an explorative study
was done to determine the role of the sales process at trade shows; so as to guide
exhibitors on what to do when exhibiting.
A number of studies (Godar & O`Conner, 2007; Gopalakrishna & Lilian, 1992 and
Sharland & Balogh, 1996) pointed to the role that trade shows plays in the buying
task and buying stages of attendees at trade shows. In these studies the findings
indicated that trade shows do not play such an important role throughout the whole
of the buying process of attendees. However, studies by Bresler (2009) and
Keswell (2010) pointed to the importance of trade shows in South Africa. Smith,
Gopalakrishna and Smith (1999) indicated that trade shows play a major role in
attendees moving through the buying process and therefore relates to the faster
completion of the sales process resulting in better personal selling efficiency. This
study contributes to the before mentioned studies by indicating specific actions in
the selling process this can help exhibitors to improve the buying process. The
findings of this study can assist the trade show industry to provide guidelines for
exhibitors.
© University of Pretoria

ii
A multi-stage sample plan was followed; and a self-administered questionnaire
was used to gather the data for the study from exhibitors at trade shows. To
establish the factors of the stages of the sales process at trade shows, a Principal
factor analysis with Varimax rotation that is explorative in nature was done. A
further investigation was done for the sales process on the differences regarding
(a) salespeople versus non-salespeople; (b) the type of trade show and (c) the
business operations of exhibitors were assessed by means of an ANOVA, t-test,
and MANOVA.
The findings depict the various factors that make up the different stages of the
sales process during the pre- and at-show stage of a trade show. Firstly, the
business actions of exhibitors were investigated that included a number of
elements such as: trade-show marketing; written objectives; trade-show evaluation
and plan, staff improvement, new product and non-financial success to name a
few. Thereafter, the stages of sales process at trade shows were investigated. The
first stage dealt with pre-show marketing activities used to attract attendees to the
trade show indicated two factors: direct communication and promotional elements.
The second stage on the at-show marketing activities used to attract attendees to
the business exhibit stand at the trade show comprised two factors: trade-show
sponsorship and promotional tools. The third stage deals with the sales
presentation at a trade show; and it had four factors that were identified, namely:
presentation methods; presentation actions; approach method and questions
approach. The fourth stage dealt with objections experienced; and two factors
were indentified: manifested objections, and latent objections. The fifth stage deals
with dealing with objections; the factors identified included standard-objection
solutions and product-objection solutions. The last stage dealt with the closing
methods; and two factors were identified: typical closing and product closing.
Differences were identified between sales and non-sales persons for “presentation
methods”, “presentation actions” and “question approach”. All of these factors deal
with actions during the sales presentation. Non-sales exhibit staff in many cases
does not have the experience that sales persons of the business have, especially
on how to communicate during the sales presentation. Sales staff will also be
more aware of the different sales methods and how to use these methods in
© University of Pretoria

iii
different sales situations. From the findings what is of concern is that both sales
and non-sales staff indicate that they do not really make use of closing methods to
close the sale.
Regarding the type of trade shows (international, national or regional) there were
no differences for pre-show marketing activities, at-show marketing activities, the
sales presentation and closing method used for the stages of the sales process
there were no differences. These findings are very interesting; since for elements,
such as the marketing activities before and at the trade show, one would assume
that different approaches would be applied. International trade shows would, for
example, rely more on electronic and mass-promotional mix elements; since it is
not possible for their sales staff to visit all the possible prospects.
Concerning the business operations (sales of goods or service
industry/professionals or construction/manufacturing or other) of exhibitors and
how they implement the stages of the sales process there were no significant
differences evident. That means that the operations of a business have no impact
on the sales process at trade shows.
The findings of this study also provides an encouraging outcome for trade show
role players in that there are not major differences for sales versus non-sales
persons, type of trade show or business operations of the exhibitors. This provides
an opportunity for general sales guidelines to be developed to improve the
effectiveness of the sales process. Furthermore, the training of exhibit staff can be
done more effectively and efficiently since there are no specialised requirements.
Trade show organisers will benefit since material developed can be standardised
for all types of trade shows.
This study provides an interesting starting point for future research to combine the
findings of this study with other studies that focus on the procurement needs of
attendees of trade shows, such as Brelser (2009) and Smith et al. (1999). One of
the main contributions of this study is that it provides a comprehensive sales
process for trade shows with insights into the various sub-stages. Finally, in
Chapter 7 a comprehensive figure illustrates the interconnectedness between the
© University of Pretoria

iv
various stages of the sale process with trade show activities and the attendees’
decision-making buying process. With this holistic overview conceptualisation is
provided on how the sales process can be integrated into the buying process and
stages of a trade show. The identification of the different actions can be an
invaluable tool for researchers that want to expand on/or link the sales process
and buying process at trade shows.
© University of Pretoria

v
TABLE OF CONTENTS
CHAPTER 1 INTRODUCTION TO THE STUDY
1.1 INTRODUCTION AND BACKGROUND TO STUDY 1
1.2 PROBLEM STATEMENT 3
1.3 RESEARCH OBJECTIVES 5
1.4 DEFINITION OF KEY TERMS 8
1.5 LITERATURE REVIEW 10
1.5.1 Business-to-business marketing 10
1.5.2 Trade shows 12
1.5.3 Personal selling 14
1.6 RESEARCH DESIGN AND METHODS 18
1.6.1 Description of inquiry strategy and broad research design 18
1.6.2 Sampling 20
1.6.3 Sample size 20
1.6.4 Data collection 21
1.6.5 Data analysis 21
1.7 ASSESSING AND DEMONSTRATING THE QUALITY AND
RIGOUR THE PROPOSED RESEARCH DESIGN 23
1.8 CONTRIBUTION OF STUDY 24
1.9 LAYOUT OF THE STUDY 26
© University of Pretoria

vi
CHAPTER 2 BUSINESS-TO BUSINESS MARKETING
2.1 INTRODUCTION 27
2.2 DEFINITION OF BUSINESS-TO-BUSINESS MARKETING 28
2.3 DIFFERENCE BETWEEN CONSUMER AND BUSINESS
MARKETS 30
2.4 TYPES OF BUSINESS-TO-BUSINESS MARKETS 33
2.5 THE NATURE OF BUSINESS TO BUSINESS BUYING
BEHAVIOUR 35
2.5.1 Overview 35
2.5.2 Stages in buying process 36
2.5.3 Buying situation 41
2.5.4 Buying Centre 42
2.6 SEGMENTATION OF BUSINESS-TO-BUSINESS MARKETS 45
2.7 MARKETING MIX 47
2.7.1 Product and service elements in B2B marketing mix 47
2.7.1.1 New product development 47
2.7.1.2 Classification of products in business-to-business markets 50
2.7.2 Pricing element in B2B marketing mix 51
2.7.2.1 Definition of Pricing 51
2.7.2.2 Pricing strategies 53
2.7.3 Distribution in B2B marketing mix 53
2.7.4 Customer relationship in B2B marketing 57
2.7.5 Promotion element in B2B marketing mix – An integrated
marketing communication approach 59
2.7.5.1 Advertising 61
2.7.5.2 Publicity and public relations 62
© University of Pretoria
vii
2.7.5.3 Direct Marketing 65
2.7.5.4 Internet marketing and social media 66
2.7.5.5 Trade sales promotions 68
2.7.5.6 Trade shows 70
2.7.5.7 Personal Selling 71
2.8 SUMMARY 72
CHAPTER 3 NATURE OF TRADE SHOWS
3.1 INTRODUCTION 75
3.2 HISTORICAL OVERVIEW OF TRADE SHOWS 78
3.3 DEFINITION OF TRADE SHOWS 79
3.4 TYPES OF TRADE SHOWS 81
3.4.1 Geographical scope 82
3.4.2 Scope of industry 84
3.4.3 Goods displayed 85
3.4.4 Other classification of trade shows 86
3.5 ROLE PLAYERS AT TRADE SHOWS 87
3.5.1 Trade show organisers 91
3.5.2 Trade show attendees 93
3.5.3 Trade show exhibitors 95
3.6 STAGES OF TRADE SHOWS 97
3.6.1 Pre-show activities 101
3.6.1.1 Objectives 101
3.6.1.2 Budget 103
3.6.1.3 Pre-show promotion 103
3.6.1.4 Design of exhibit stands 105
© University of Pretoria

viii
3.6.1.5 Training exhibit staff 107
3.6.2 At-show activities 108
3.6.2.1 At-show promotion 108
3.6.2.2 Exhibit stands at-show 110
3.6.2.3 Communication 110
3.6.2.4 Sales activities 112
3.6.2.5 Information gathering 114
3.6.3 Post-show 114
3.6.3.1 Measurement of performance 114
3.6.3.2 Follow-up 116
3.7 SUMMARY 117
CHAPTER 4 THE NATURE OF PERSONAL SELLING
4.1 INTRODUCTION 119
4.2 DEFINING PERSONAL SELLING 120
4.3 HISTORY AND DEVELOPMENT OF PERSONAL SELLING 123
4.4 SELLING CAREERS 124
4.5 PERSONAL SELLING AS MARKETING TOOL IN
BUSINESS MARKETS 126
4.6 THE SALES PROCESS 130
4.6.1 Prospecting 135
4.6.2 Pre-approach 137
4.6.3 Approach 139
4.6.4 Sales presentation 142
4.6.5 Determining objections 148
4.6.6 Dealing with objections 149
© University of Pretoria

ix
4.6.7 Trail close 151
4.6.8 Closing sale 151
4.6.9 Follow-up 154
4.7 SUMMARY 154
CHAPTER 5 RESEARCH METHODOLOGY 5.1 INTRODUCTION 157
5.2 MARKETING RESEARCH DEFINED 158
5.3 RESEARCH PROBLEM STATEMENT 159
5.4 INFORMATION SOURCES 164
5.5 RESEARCH OBJECTIVES AND HYPOTHESES 165
5.5.1 To determine if sales persons and non-sales persons
differ regarding the sales process followed at trade shows 167
5.5.2 To determine if the various types of trade shows influence
the sales process 171
5.5.3 To determine if the type of business operations of an exhibitor
influence the sales process followed at trade shows 174
5.6 RESEARCH DESIGN 176
5.6.1 Sampling 178
5.6.1.1 Defining the population 180
5.6.1.2 The sampling frame 180
5.6.1.3 The sampling method 180
5.6.1.4 Calculation of the sample size 185
5.6.1.5 Selecting sample elements 186
5.6.1.6 Gathering data from designated elements 186
© University of Pretoria

x
5.7 RESEARCH METHODS TO COLLECT DATA 187
5.8 QUESTIONNAIRE DESIGN 189
5.8.1 Survey objectives, resources and constraints 191
5.8.2 Determining the data-collection method 192
5.8.3 Determining the question response format 192
5.8.4 Deciding on the question wording 196
5.8.5 Establishing the questionnaire flow and layout 197
5.8.6 Evaluating the questionnaire 198
5.8.7 Obtaining the approval of all relevant parties 202
5.8.8 Pre-testing and revision 203
5.8.9 Preparing final copies of questionnaire 203
5.8.10 Implementing the survey 204
5.9 EDITING, CODING, DATA CAPTURING 205
5.9.1 Editing 205
5.9.2 Coding 206
5.9.3 Data capturing 206
5.10 STATISTICAL PROCEDURES AND TECHNIQUES 207
5.11 SUMMARY 215
CHAPTER 6 DATA ANALYSIS AND FINDINGS
6.1 INTRODUCTION 216
6.2 DEMOGRAPHIC ANALYSIS OF THE POPULATION 217
6.3 PROFILE OF BUSINESSES THAT EXHIBIT AT TRADE SHOWS 221
6.4 DESCRIPTIVE STATISTICS FOR EACH SECTION OF
QUESTIONNAIRE 225
© University of Pretoria

xi
6.4.1 Business actions taken regarding trade show 225
6.4.2 Pre-show marketing activities 228
6.4.3 At-show marketing activities 229
6.4.4 The Sales presentation 231
6.4.5 Objections experienced 233
6.4.6 Dealing with objections 234
6.4.7 Closing methods 234
6.5 FACTOR ANALYSIS AS WELL AS THE RELIABILITY AND
VALIDITY OF THE MEASURING INSTRUMENT 237
6.5.1 Business actions taken regarding the trade show 238
6.5.2 Pre-show marketing activities 239
6.5.3 At-show marketing activities 240
6.5.4 The sales presentation 240
6.5.5 Objections experienced 241
6.5.6 Dealing with objections 242
6.5.7 Closing methods 243
6.6 RESEARCH OBJECTIVES AND HYPOTHESES RESULTS 244
6.6.1 Objective: To determine if sales persons and non-sales persons
differ regarding the sales process followed at trade shows 246
6.6.2 Summary of hypotheses for sales and non-sales persons for
the sales process at trade shows 257
6.6.3 Objective: To determine if the various types of trade shows
influence the sales process 258
6.6.4 Summary of hypotheses for the type of trade shows role on
the sales process 268
6.6.5 Objective: To determine if the type of business operations of
an exhibitor influence the sales process followed at trade shows 269
6.6.6 Summary for hypotheses business operations of an exhibitor role
on the sales process for trade shows 280
6.7 SUMMARY 281
© University of Pretoria

xii
CHAPTER 7 CONCLUSIONS, IMPLICATIONS AND RECOMMENDATIONS FOR FUTURE RESEARCH
7.1 INTRODUCTION 282
7.2 IMPORTANCE OF STUDY 282
7.3 MAIN FINDINGS RELATING TO BUSINESS ACTIONS AT
TRADE SHOWS 283
7.3.1 Conclusions of and implications regarding the main findings
of the business actions for trade shows 283
7.3.2 Recommendations regarding business actions for trade shows 285
7.4 MAIN FINDINGS RELATING THE SUB=STAGES IN THE STAGES
OF THE SALES PROCESS AT TRADE SHOWS 289
7.4.1 Conclusions of and implications regarding the main findings for
the sub-stages in the stages of the sales process at trade shows 289
7.4.2 Recommendations based on main findings for the sub-stages in the
sales process at trade shows 295
7.4.2.1 Recommendations for the sub-stages for pre-show marketing 295
7.4.2.2 Recommendations for at-show marketing 296
7.4.2.3 Recommendations for the sales-presentation 298
7.4.2.4 Recommendations for the objections experienced 301
7.4.2.5 Recommendations on dealing with objections 302
7.4.2.6 Recommendations for closing methods 303
7.5 MAIN FINDINGS RELATING TO THE DIFFERENCES BETWEEN
SALES AND NON-SALES PERSONS REGARDING THE SALES
PROCESS USED AT TRADE SHOWS 304
7.5.1 Conclusions of and implications regarding findings on the
differences between salespersons and non-salespersons
regarding the sales process at trade shows 305
7.5.2 Recommendations for findings on the differences between
© University of Pretoria

xiii
salespersons and non-salespersons regarding the sale process
at trade shows 309
7.6 MAIN FINDINGS RELATING TO THE DIFFERENCES BETWEEN
THE TYPE OF TRADE SHOW AND THE SALES PROCESS
USED 311
7.6.1 Conclusions of and implications regarding the main findings for
the differences between the type of trade show for the sales
process 311
7.6.2 Recommendations regarding the main findings for the
differences between the type of trade show for the sales process 312
7.7 MAIN FINDINGS FOR THE DIFFERENCES BETWEEN
BUSINESS OPERATIONS AND THE SALES PROCESS USED 314
7.7.1 Conclusions of and implications regarding the main
findings for the differences between the business operations
for the sales process 314
7.7.2 Recommendations for main findings on differences between
the business actions for the sales process 315
7.8 LIMITATIONS 317
7.8.1 Literature review 317
7.8.2 Empirical study 318
7.9 RECOMMENDATIONS FOR FUTURE RESEARCH 318
7.10 ACADEMIC CONTRIBUTION OF THIS STUDY 319
7.11 EVALUATION OF THE OBJECTIVES AND HYPOTHESES
SET VS THE RESEARCH RESULTS 323
7.12 SUMMARY 324
© University of Pretoria

xiv
LIST OF REFERENCES 326
APPENDIX A: QUESTIONNAIRE 353
APPENDIX B: TYPES OF CLASSIFICATION OF ATTENDEES
AT TRADE SHOWS 361
APPENDIX C: EXHIBIT STAND DESIGN 364
APPENDIX D: INTERVIEW AGENDA 366
APPENDIX E: PILOT STUDY 367
© University of Pretoria

xv
LIST OF TABLES
Table 1.1 Views on the importance and role of trade shows 13
Table 3.1 Reasons why attendees attend trade shows 94
Table 3.2 Classification of attendees that attend trade shows 95
Table 3.3 Comparison of different authors on activities in the
stages of a trade shows 98
Table 4.1 Characteristics of professional sales person 130
Table 5.1 List of Exhibition Organisers Obtained from EXSA 183
Table 5.2 Exhibition organisers that arrange trade shows 184
Table 5.3 Study objectives related to sections, questions and
statements used in the questionnaire 199
Table 5.4 Objectives, hypotheses, sections and statistical test 213
Table 6.1 Trade shows that businesses exhibit at majority of times 221
Table 6.2 Economic sector that the business operates in 222
Table 6.3 Business operations of exhibitor 222
Table 6.4 Number of products or service lines exhibited 223
Table 6.5 Number of exhibit staff working during the full duration
of the trade show 223
Table 6.6 Estimated annual turnover for the past financial year 224
© University of Pretoria

xvi
Table 6.7 Number of times exhibited at trade shows in the last
three years including this show 224
Table 6.8 Business actions taken regarding trade show 225
Table 6.9 Pre-show marketing activities 228
Table 6.10 At-show marketing activities 229
Table 6.11 Sales presentation 231
Table 6.12 Objections experienced 233
Table 6.13 Dealing with objections 234
Table 6.14 Closing methods 235
Table 6.15 Factors pre-show marketing activities 239
Table 6.16 Factors at-show marketing activities 241
Table 6.17 Factors for the sales presentation activities 241
Table 6.18 Factors objections experienced 242
Table 6.19 Factors dealing with objections 243
Table 6.20 Factors closing methods 244
Table 6.21 Mean values and t-test results for direct communication
for sales and non-sales persons 248
Table 6.22 Mean values and t-test results for promotional elements
for sales and non-sales persons 249
© University of Pretoria
xvii
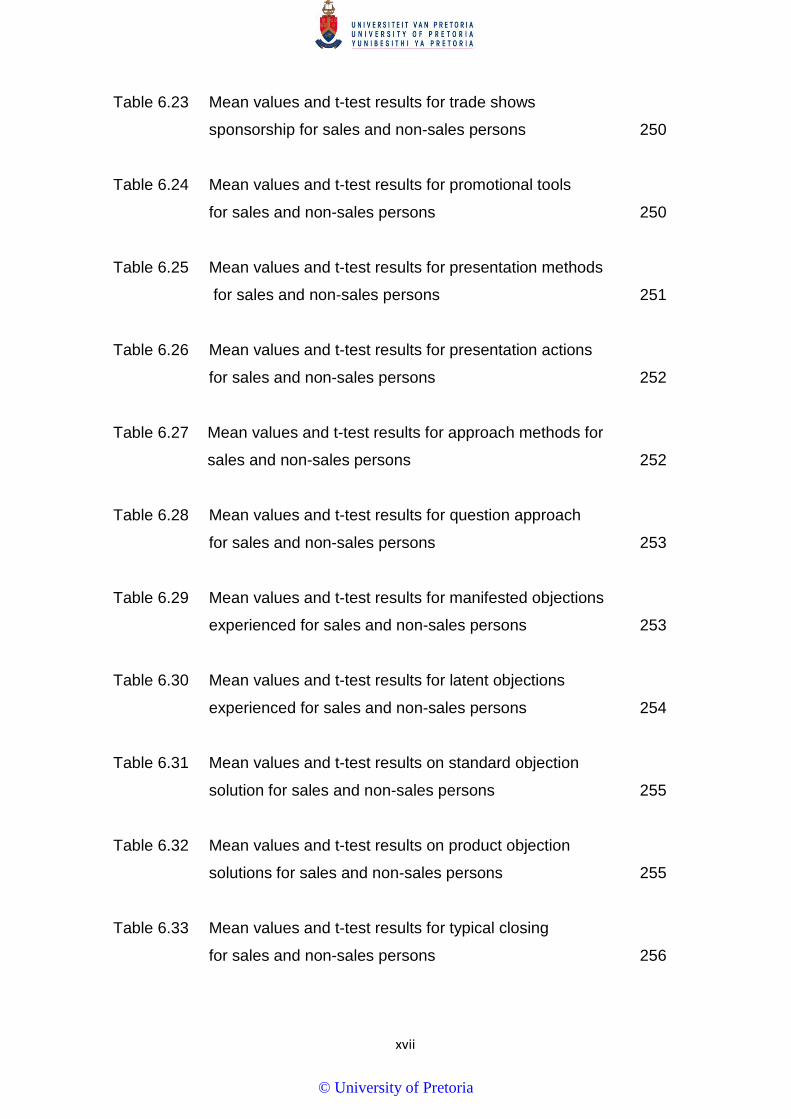
Table 6.23 Mean values and t-test results for trade shows
sponsorship for sales and non-sales persons 250
Table 6.24 Mean values and t-test results for promotional tools
for sales and non-sales persons 250
Table 6.25 Mean values and t-test results for presentation methods
for sales and non-sales persons 251
Table 6.26 Mean values and t-test results for presentation actions
for sales and non-sales persons 252
Table 6.27 Mean values and t-test results for approach methods for
sales and non-sales persons 252
Table 6.28 Mean values and t-test results for question approach
for sales and non-sales persons 253
Table 6.29 Mean values and t-test results for manifested objections
experienced for sales and non-sales persons 253
Table 6.30 Mean values and t-test results for latent objections
experienced for sales and non-sales persons 254
Table 6.31 Mean values and t-test results on standard objection
solution for sales and non-sales persons 255
Table 6.32 Mean values and t-test results on product objection
solutions for sales and non-sales persons 255
Table 6.33 Mean values and t-test results for typical closing
for sales and non-sales persons 256
© University of Pretoria
xviii
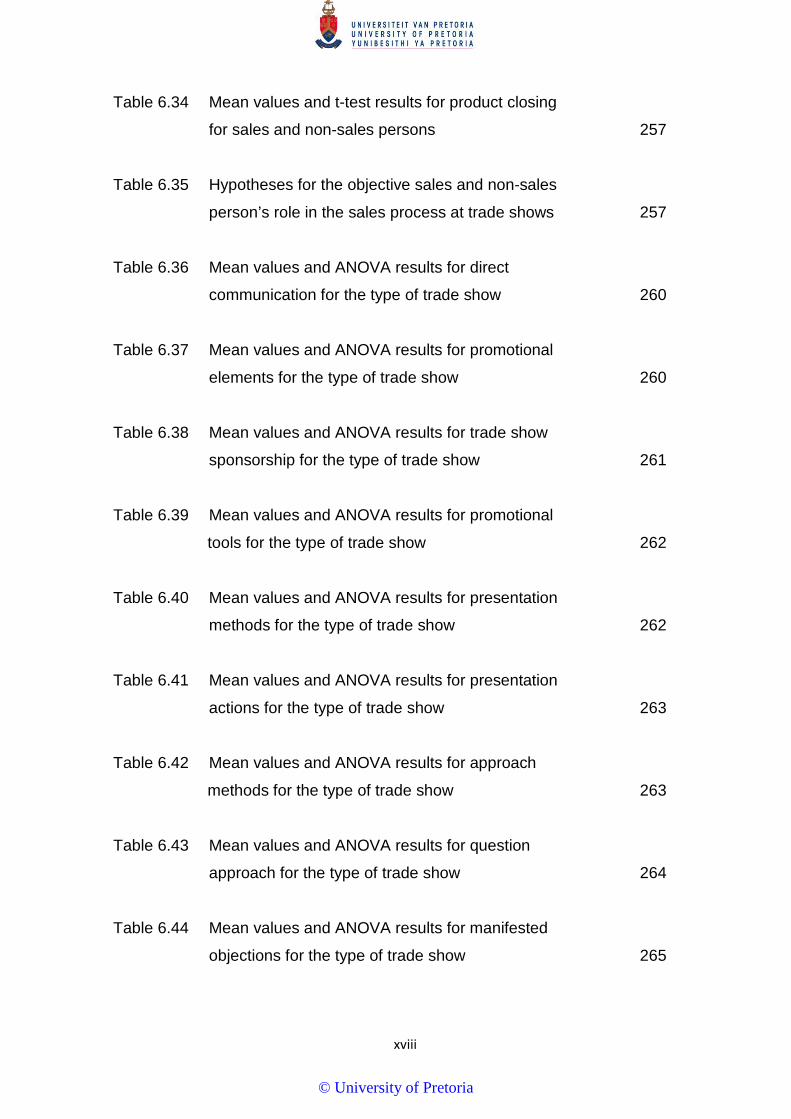
Table 6.34 Mean values and t-test results for product closing
for sales and non-sales persons 257
Table 6.35 Hypotheses for the objective sales and non-sales
person’s role in the sales process at trade shows 257
Table 6.36 Mean values and ANOVA results for direct
communication for the type of trade show 260
Table 6.37 Mean values and ANOVA results for promotional
elements for the type of trade show 260
Table 6.38 Mean values and ANOVA results for trade show
sponsorship for the type of trade show 261
Table 6.39 Mean values and ANOVA results for promotional
tools for the type of trade show 262
Table 6.40 Mean values and ANOVA results for presentation
methods for the type of trade show 262
Table 6.41 Mean values and ANOVA results for presentation
actions for the type of trade show 263
Table 6.42 Mean values and ANOVA results for approach
methods for the type of trade show 263
Table 6.43 Mean values and ANOVA results for question
approach for the type of trade show 264
Table 6.44 Mean values and ANOVA results for manifested
objections for the type of trade show 265
© University of Pretoria
xix
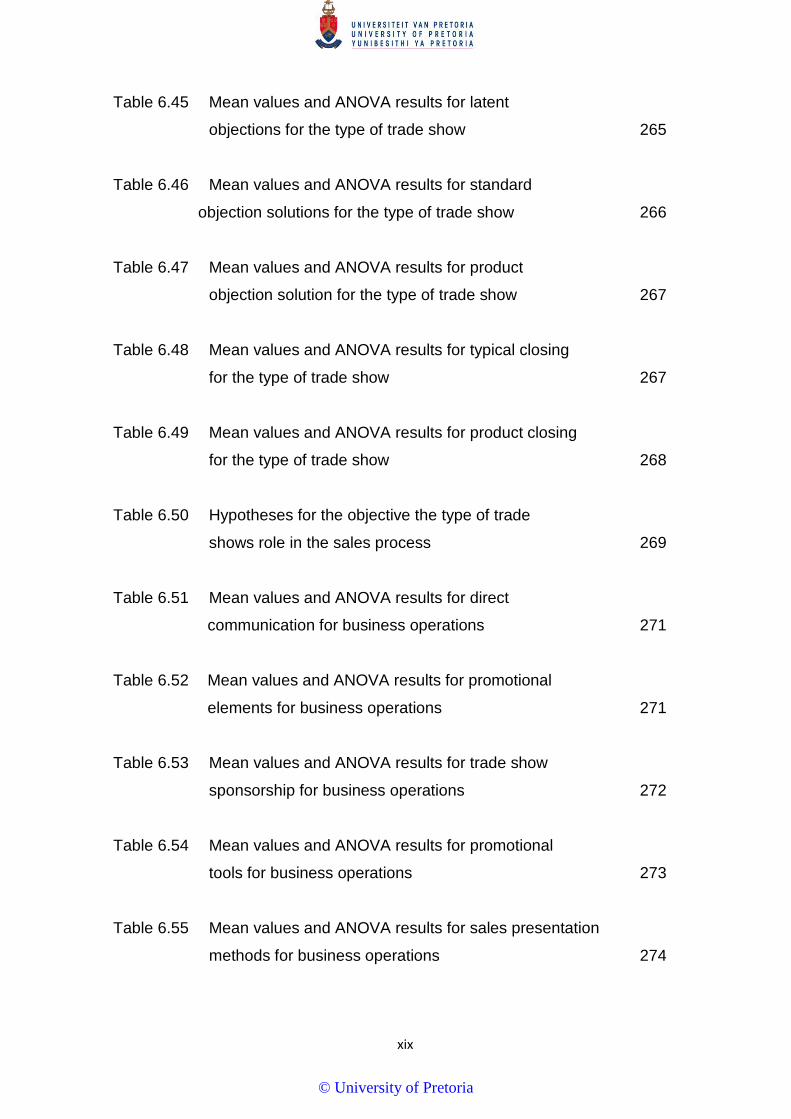
Table 6.45 Mean values and ANOVA results for latent
objections for the type of trade show 265
Table 6.46 Mean values and ANOVA results for standard
objection solutions for the type of trade show 266
Table 6.47 Mean values and ANOVA results for product
objection solution for the type of trade show 267
Table 6.48 Mean values and ANOVA results for typical closing
for the type of trade show 267
Table 6.49 Mean values and ANOVA results for product closing
for the type of trade show 268
Table 6.50 Hypotheses for the objective the type of trade
shows role in the sales process 269
Table 6.51 Mean values and ANOVA results for direct
communication for business operations 271
Table 6.52 Mean values and ANOVA results for promotional
elements for business operations 271
Table 6.53 Mean values and ANOVA results for trade show
sponsorship for business operations 272
Table 6.54 Mean values and ANOVA results for promotional
tools for business operations 273
Table 6.55 Mean values and ANOVA results for sales presentation
methods for business operations 274
© University of Pretoria
xx
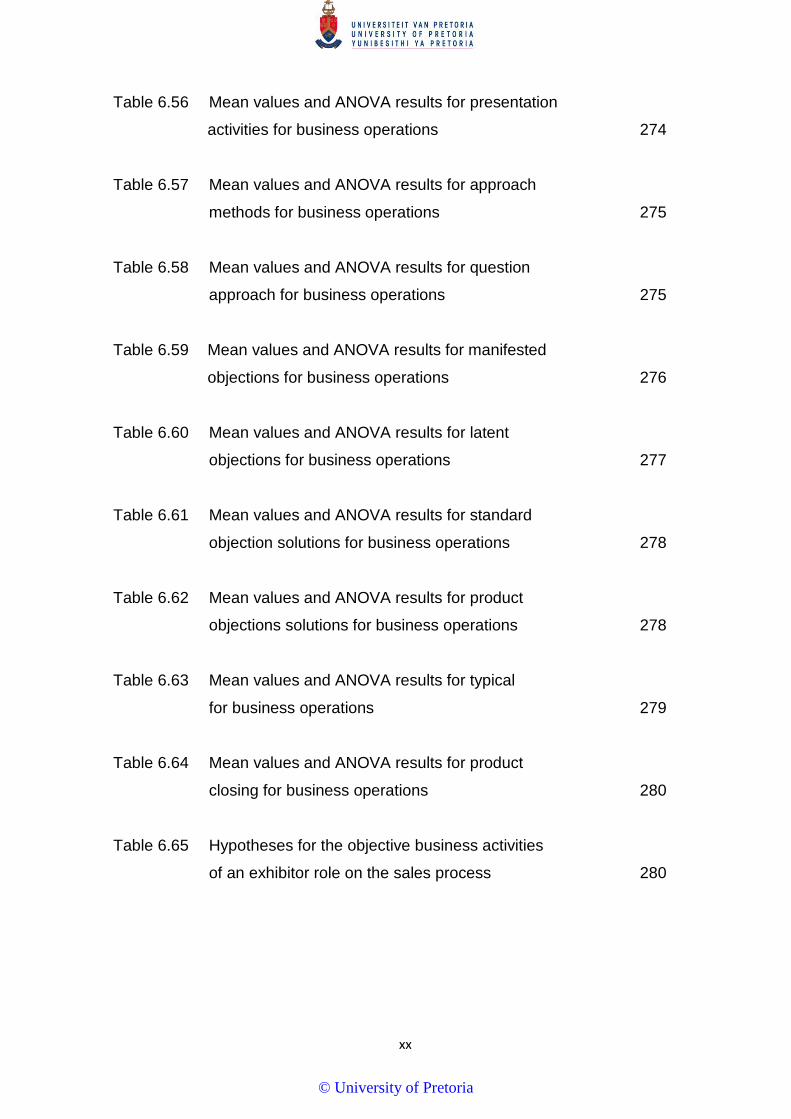
Table 6.56 Mean values and ANOVA results for presentation
activities for business operations 274
Table 6.57 Mean values and ANOVA results for approach
methods for business operations 275
Table 6.58 Mean values and ANOVA results for question
approach for business operations 275
Table 6.59 Mean values and ANOVA results for manifested
objections for business operations 276
Table 6.60 Mean values and ANOVA results for latent
objections for business operations 277
Table 6.61 Mean values and ANOVA results for standard
objection solutions for business operations 278
Table 6.62 Mean values and ANOVA results for product
objections solutions for business operations 278
Table 6.63 Mean values and ANOVA results for typical
for business operations 279
Table 6.64 Mean values and ANOVA results for product
closing for business operations 280
Table 6.65 Hypotheses for the objective business activities
of an exhibitor role on the sales process 280
© University of Pretoria

xxi
LIST OF FIGURES
Figure 1.1 Integrated marketing communication in B2B 11
Figure 2.1 Layout of chapter 2 28
Figure 2.2 Elements of modern marketing system 29
Figure 2.3 Distribution channels for business products 55
Figure 2.4 Structure of business marketing channels 56
Figure 2.5 Theoretical model of relationship quality 58
Figure 2.6 Interconnection between communication elements 60
Figure 2.7 Publicity, Public Relations and Press relations 63
Figure 3.1 Layout of chapter 3 77
Figure 3.2 Exhibitors and attendees strategies and tactics 89
Figure 3.3 Stages of trade show 100
Figure 3.4 Dimensions of trade show specific objectives
of trade show participation 102
Figure 4.1 Layout of chapter 4 120
Figure 4.2 The function of selling 121
Figure 4.3 Marketers view of the role of personal selling 127
Figure 4.4 Sales person model of relationship between
marketing and selling 128
Figure 4.5 Impact of selling foundation and strategy on sales process 132
Figure 4.6 The selling process 133
© University of Pretoria

xxii
Figure 4.7 Possible trades show selling process 134
Figure 5.1 Layout of chapter 5 158
Figure 5.2 Basic sampling concepts 178
Figure 5.3 The steps in the sampling process 179
Figure 5.4 Types of probability and non-probability sampling methods 181
Figure 5.5 The questionnaire design process 190
Figure 6.1 Gender of exhibit staff 217
Figure 6.2 The business department that staff work 218
Figure 6.3 Employed as a salesperson 218
Figure 6.4 Age of exhibit staff 219
Figure 6.5 Highest educational qualification of exhibit staff that 220
Figure 6.6 Years of service at businesses that exhibit 220
Figure 7.1 Academic contribution of the study 322
© University of Pretoria

1
CHAPTER 1
INTRODUCTION TO THE STUDY 1.1 INTRODUCTION AND BACKGROUND TO THE STUDY
“Virtually all experts surveyed confirmed that personal contact between decision-
makers, companies and customers in attractive, emotionalised setting will still be
highly valued in 2020”.- Kirchgeorg et al. (2010b:310) on trade shows
In today’s competitive business-to-business markets, companies must make use
of all possible methods, in order to gain a competitive advantage. Business
markets are unique to consumer markets; therefore marketing plans must be
developed specifically for the requirements of business-to-business selling (Lilien
& Grewal, 2012:3). An important facet of business marketing is the integrated
marketing communication mix (IMC) used to communicate with the selected target
markets. The IMC mix provides a multitude of methods whereby a business can
communicate with its target audience, which would include: trade shows,
advertising, sales promotions, personal selling, direct marketing and the internet
(Ellis, 2011:301; Dwyer & Tanner, 2009:296-299). Kellizi (2013:265) point out that
trade shows is an integral part of the IMC strategy to ensure that business reach
their customers. However, the cost involved with the IMC mix in business-to-
business marketing has forced organisations to take a new look at the methods
used to market products and to provide services to customers.
Business markets have unique characteristics, such as: fewer buyers, quantity
purchased, larger volume buyers, geographically concentrated buyers, more direct
distribution, professional buyers and numerous buying influences (Lilien & Grewal,
2012:3). The specific characteristics of business markets lead to communication
channels being shorter; and an emphasis being placed on direct selling. Due to
the differences in business-to-business markets, organisations select IMC
elements that are more direct and personal in nature (Ellis, 2011:97). One of the
marketing communication tools used in business-to-business markets is trade
shows. These are an essential part of the sales and marketing process providing
© University of Pretoria

2
an opportunity for direct communication with customers, and better potential
customers (Clow & Baack, 2014:358; Stevens, 2005:1).
The effectiveness of trade shows, however, depends on whether they are
accepted as a marketing tool by the marketing and sales departments of
businesses and, how effectively the sales process is utilised at trade shows.
Marketing managers in business-to-business markets have ignored the important
role of trade shows in the IMC mix. Pitta, Weisgal and Lynagh, (2006:159) note
that trade shows are not clearly understood by industrial organisations; although
they are the most cost-effective means of reaching customers and for providing
them with the necessary hands-on knowledge and information. As noted by
Andreae, Hsu and Norcliffe (2014:200) trade shows is seen as a space where
attendees are wooed and seduced by the performance of actors (exhibit stand
staff) and, products out of existing customer relationships into new trading
relationships.
Tafesse (2013:1009-1010) and Bello and Barczak (1990:43) agree with Pitta et al.
(2006:159) that trade shows are a major promotional tool for industrial firms; and
these authors add that many businesses fail to exploit their full marketing potential
as a marketing communication medium. The sales force of an organisation uses
trade shows to find sales leads, to inform and educate the customers, to
demonstrate their products, and/or sell products and services (Manning, Ahearne
& Reece, 2014:210). Semenik (2002:404) confirms that trade shows are a major
promotional tool – by indicating that they form a significant resource to reach
potential wholesalers and distributors for an organisation’s brand in business-to-
business markets.
Although trade shows form an important promotional tool, they have received little
attention from academics in terms of their evolution and theoretical development
(Gottlieb, Brown & Drennan, 2011:1642; Wilkinson & Brouthers, 2006:238).
Even with the trade shows not being used to their full marketing potential, sales
people do apply them to a certain extent (Smith et al., 1999). The sales force of an
© University of Pretoria

3
organisation uses trade shows to find sales leads, to inform and educate their
customers, and to demonstrate their products, and/or sell products and services
(Yuksel & Voola, 2010:293). Previous research has addressed a number of
theories on the role of personal selling at trade shows. These aspects include:
what sales actions are taken by sales people before, at, and after, a trade show.
Elements, on the pre-, at- and post-show activities such as how attendees are
invited to trade shows; what sales methods are used; how exhibitors follow up
after the show were investigated (Adcock, Halborg & Ross, 2001:345; Manning &
Reece, 2001:172, Naudi, 2006:11, Valero, 2006:3, Pitta et al., 2006:159, Drohan,
2007:32; Ling-Yee, 2008:35; van Eck, 2008:11; Gopalakrishna, Roster &
Sridhar,2010:245; Rinallo, Borghini & Golfetto, 2010:255; Blyth, 2010:57; Yuksel &
Voola, 2010:293).
The above-mentioned research, however, focused on general selling – and not on
the sales process as such – at trade shows. It must also be noted that little or no
research were done up to 2014 before data gathering was done for this study in
the South African context. Two South African studies were found. The first study
focused on the financial contribution of trade shows and the second on what
attracts attendees to trade shows. In the literature chapters of this study, the
previous local as well as international research on selling at trade shows will be
discussed in more detail.
1.2 PROBLEM STATEMENT
According to Pitta et al. (2006:159), 70 percent of trade show attendees plan to
buy products that is offered by exhibitors at trade shows, 75 percent actually make
a purchase, and 90 percent indicated that a trade show influence their purchases
decision. Furthermore, Gopalakrishna et al. (1995:79) indicate that trade shows
move possible buyers through the buying process and reduce the need for
marketing communication activities after the show. In a study in Germany by
Kirchgeorge, Springer and Kästner (2010a:67) the findings was similar that trade
shows is an effective instrument in building customer relationships and move
customers through the phases of purchasing of a brand. In a study done by
© University of Pretoria
4
Bresler (2009) that focused on attendees’ procurement needs when attending a
trade show in South Africa found contradictions regarding buying at the show.
Besler (2009:6) indicate in a study done in 2004 and the follow-up study in 2006
that there was a decrease of 52.2 percent in the buying intent of attendees at trade
shows. It must however, be noted that although there was a decrease in
purchasing, some attendees still planned to buy capital items exhibited at the trade
show (Bresler, 2009:10). The concern still remains that there is a decrease in the
purchasing intent of buyers. This trend of not selling at trade shows is nothing new
with earlier research also referring to this problem (Hansen, 1996:41). To ensure
that attendees purchase, exhibitors have to sell at a trade show. Ling-Yee
(2007:35) states that at trade shows attendees goes through a buying process,
while exhibitors on the other hand is involve in a multi-stage selling process.
There is therefore a link between the buying phases of attendees and the sales
process (Smith et al., 1999). The question however is how applicable is the sales
process at trade shows? Åge (2011:19) indicate that due to the dynamic nature of
B2B selling the so called “seven stages of selling” must be adapted. The seven
stages was later adapted to the ten stage selling process due to stronger focus on
customer relationship building and the integration of technology in sales (Futrell,
2011:228; Long, Tellefsen & Lichtenthal, 2007:667).
A conceptual frame work was developed by Gopalakrishna and Lilein (1995:25)
that included the sales process at trade shows with six stages namely:
prospecting; opening relationship and qualifying attendee; presenting the sales
message; closing the sale and account service. A study by Ling-Yee (2008:43-44)
found that the Gopalakrishna and Lilein (1995:25) sales process oversimplifies the
relationship between exhibitors inputs, process and outputs. It is therefore
advisable to adapt the sales process for trade shows that is part of B2B markets
(Sirias, Krupp & Biskup, 2013:9).
According to Parvinen, Aspara, Kajalo and Hietanen (2013:242), in B2B markets
researchers should study the sales process to enhance their sales activities. This
is supported by Borg and Young (2014:550) that the sales process should be
© University of Pretoria
5
expanded to include the nature and purpose of selling activities in B2B markets. In
South Africa context little research could be found investigating the sales process
and trade shows. This lack of research, competitive B2B markets and growth of
trade shows as a marketing communication tool as pointed out in Chapter 3,
requires the investigation of the role of the sales process within trade shows in a
B2B context.
Once literature was investigated pertaining to trade shows and the sales process
and a gap was evident (Step one), the second step was to establish an industry
perspective on the problem identified. Malhotra (2010:72) states that one of the
ways to help formulate the research problem is to interview industry experts. In
Chapter 5 a synopsis of an interview held with Mr. Gary Corin is included on the
topic of the role of selling at trade shows. Mr. Corin is the Managing Director of
Specialised Exhibitions Montgomery the largest B2B exhibition organiser in South
Africa (Tassiopoulos, 2010). Some of the main concerns evolved around the lack
of knowledge on the sales process at tradeshows and some more specific
concerns identified in the interview were that: exhibitors do not set objectives
especially for sales and the obtaining of sales leads, and that exhibit staff lack
sales knowledge and skills to sell effectively at trade show.
Research on the role of the sales process will assist exhibitors to enhance their
selling activities at trade shows and provide industry with sales guidelines that can
be provided to exhibit staff to improve value.
1.3 RESEARCH OBJECTIVES AND HYPOTHESES
As stated above, there is no clear indication of the role that of the sales process
plays at trade shows and exhibitors are unclear on what sales activities takes
place. To achieve the objectives of the study four South African trade shows was
used that operates in the business-to-business sector.
The main objective of this study is, therefore, to explore the stages of the sales
process and its sub-stages at trade shows.
© University of Pretoria
6
Through focusing on selected trade shows in South Africa, the following research
objectives and hypotheses were set for this study:
• To determine the profile of exhibitors at trade shows and exhibit staff.
• To determine if sub-stages exists within each of the stages of the sales
process at trade shows.
• To determine if sales persons and non-sales persons differ regarding the
sales process followed at trade shows.
Ho1 There exist no significant differences between sales persons and non-sales
persons regarding business actions used.
Ho2 There exist no significant differences between sales persons and non-sales
persons regarding pre-show marketing activities.
Ho3 There exist no significant differences between sales persons and non-sales
persons regarding at-show marketing activities.
Ho4 There exist no significant differences between sales persons and non-sales
persons regarding the sales presentation.
Ho5 There exist no significant differences between sales persons and non-sales
persons regarding objections experienced.
Ho6 There exist no significant differences between sales persons and non-sales
persons regarding dealing with objections.
Ho7 There exist no significant differences between sales persons and non-sales
persons regarding closing methods.
• To determine if the various types of trade shows influence the sales
process followed.
Ho9 There exist no significant differences for the type of trade show regarding
pre-show marketing activities.
Ho10 There exist no significant differences for the type of trade show regarding
at-show marketing activities.
Ho11 There exist no significant differences for the type of trade show regarding
the sales presentation.
Ho12 There exist no significant differences for the type of trade show regarding
objections experienced.
© University of Pretoria
7
Ho13 There exist no significant differences for the type of trade show regarding
dealing with objections.
Ho14 There exist no significant differences for the type of trade show regarding
closing methods.
• To determine if the type of business operations of an exhibitor influence the
sales process followed at trade shows.
Ho15 There is no significant differences for business operations of an exhibitor
regarding business actions used.
Ho16 There is no significant differences for business operations of an exhibitor
regarding pre-show marketing activities.
Ho17 There is no significant differences for business operations of an exhibitor
regarding at-show marketing activities.
Ho18 There is no significant differences for business operations of an exhibitor
regarding the sales presentation.
Ho19 There is no significant differences for business operations of an exhibitor
regarding objections experienced.
Ho20 There is no significant differences for business operations of an exhibitor
regarding dealing with objections.
Ho21 There is no significant differences for business operations of an exhibitor
regarding closing methods.
The above objectives and hypothesis was set to endeavour to contribute to
academia and industry. In Section 1.8 the contribution of the study as a result of
investigating the objectives and hypotheses, is indicated.
The rest of this chapter consists of, firstly, a definition of the key terms, followed by
a short background with the literature review on business-to-business (B2B)
marketing, trade shows and personal selling. Then, the research design and
methods that were followed are discussed. Finally, the outline of the thesis is
provided.
© University of Pretoria
8
1.4 DEFINITION OF KEY TERMS
Before the literature review is discussed, it is necessary to clarify the meaning of
certain key concepts used in this study, as well as the context in which they are
used. The following concepts are explained:
Business-to-business marketing: Organisation-to-organisation marketing,
industrial marketing, and organisational marketing. These are all synonyms for
business-to-business marketing, as used in the literature. Business-to-business
marketing is the marketing of products or services to other companies,
government, institutions (hospitals, universities) and other organisations
(Halvadar, 2014:1;Dwyer & Tanner, 2002:6). Pride and Ferrel (2011:3) point out
that B2B marketing is the marketing of goods and/or services in industries, which
comprises those markets essentially for the production process or the provision of
services, as well as marketing to organisational buyers and users. Sarin (2013:4)
indicates that business marketing is the activities of building mutually value
generating relationships between organisations.
Business-to-business marketing takes place whenever a product or service is sold
for any other purpose than personal consumption. Therefore, business-to-
business marketing involves different channel members who do not only include
industrial organisations, but also wholesalers, retailers and organisations of
different sizes. In this proposal, business-to-business marketing will be used
throughout; and it will be discussed in Chapter Two.
Integrated marketing communication: Clow and Baack (2014:20) defines IMC
as “the coordination and integration of all marketing communication tools,
avenues, and sources in a company into a seamless program to maximize the
impact on customers and other stakeholders”. Kotler and Keller (2006:558) point
out that IMC is the creation of a comprehensive plan for all the elements that make
up marketing communication. Semenik (2002:8) defines IMC as follows “…the
process of using promotional tools in a unified way, so that a synergistic
communication effect is created”. Lamb, Hair, McDaniel, Boshoff and Terblanche
(2015:315) refer to the IMC mix as the promotional mix; and they indicate that it
© University of Pretoria
9
consists of numerous elements, which include advertising, public relationships,
publicity, personal selling and sales promotion. It may, therefore, be concluded
that the IMC mix is the process of combining all the elements of marketing
communication, in order to give a unified message to the customer. This would
include trade shows and personal selling. The IMC mix is discussed in Chapter Two as a part of business-to-business marketing.
Trade shows: Exhibitions can be divided into three categories, namely: trade and
consumer exhibitions, agricultural shows and private events. To exhibit is to
display something to the public; while an exhibition is a public display or
demonstration of art, products, skills and activities (Oxford English Dictionary,
2006:499). It must, however, be noted that in South Africa consumer exhibitions
are done for the consumer market; and they differ from trade shows. Trade fairs,
trade exhibitions, trade expositions and trade expos are used as synonyms for
trade shows. The focus of this study is on trade shows in South Africa that takes
place in a business (B2B) context.
For the purpose of this study, trade shows will be used as the terminology. Weitz,
Catleberry and Tanner (2007:180) define trade shows as follows “… short
(usually less than a week), temporary exhibitions of products by manufacturers
and retailers”. Trade shows can comprise a conference, convention or gathering
arranged and managed by a company or organisation that brings multiple sellers
and buyers together; where sellers display their products in some type of
exhibition hall (Stevens, 2005:5). The definition that is used for this study for trade
shows will be given in Chapter Three.
Exhibit staff: For the purpose of this study is any person that mans an exhibit
stand be it a sales person or any other employee (marketing, production,
engineering etc.) of the exhibiting business.
Personal selling: According to Manning, et al. (2014:37), personal selling
happens when the representative of a business directly interact with a customer or
prospective customer to present information about their product offering. Futrell
(2011:7) defines personal selling as “… the personal communication of information
© University of Pretoria

10
to unselfishly persuade a prospective customer to buy something – a good,
service, an idea, or something else – that satisfies that individual’s needs”.
Personal selling is the process, whereby a salesperson examines a customer’s
situation and needs, provides information and advice, and seeks to gain a
commitment from the customer that would be of continuous benefit to both the
customer and seller (Rix, 2006:10). The definition that is used in this context, for
the purpose of this study, is defined in Chapter Four. Different names are used to
define personal selling; therefore, for the purpose of this study that deals with
sales at trade shows, the terms sales person, salesman, saleswoman, sales people, sales force, sales representative and professional sales representative are used as synonyms. Some organisations call salespeople in
business markets, business-to-business or industrial sales’ representatives.
For the purpose of this study, the term salespeople or sales persons will be used.
Sales process: The sales process is the stages that a sales person will go
through and consist of seven to ten stages that consist of: prospecting, pre-
approach, approach, presentation, trail close, determining objections, dealing with
objections, trail close, close and follow-up (Sheth & Sharma, 2008:7; Donaldson,
2007:68-71; Futrell, 2011:228). In Chapter Four the sales process is discussed in
detail. Research on the sales process at trade shows is however limited as found
in the research of Rodriguez, Dixon and Peltier (2014:302).
1.5 THE LITERATURE REVIEW
In this section of the introduction, the literature review will be conducted. In Section
1.5.1, B2B marketing is discussed and the focus is placed on the IMC mix followed
in business marketing. Section 1.5.2 investigates trade shows and the various
stages that have been identified, namely: pre-, at- and post-show. Personal selling
will be discussed in Section 1.5.3; and the sales process will be highlighted.
1.5.1 Business-to-business marketing
According to Dwyer and Tanner (2002:6), marketers started to realise the
important role that business marketing plays in the economy in the beginning of
© University of Pretoria
11
twenty-first century, and that marketers are placing more emphasis on improving
the effectiveness of business-to-business marketing. The function of B2B
marketing is to bring about an exchange, in which a product or service is sold for
any use other than personal consumption (Zikmund & d’Amico, 2001:186).
Business marketing is, therefore, the marketing of products and services to
business enterprises, such as manufacturing companies, the government, the
private sector, educational institutions, hospitals, distributors and dealers
(Halvadar, 2014:1).
Business markets have specific characteristics that differ significantly from those
of the consumer markets. Therefore, to better understand business markets, the
differences that exist between business markets and consumer markets are
described. It is important to note these differences; since they have an impact on
how marketing is implemented in the context of business marketing.
In B2B marketing, the IMC is a two-way communication targeted to specific
customers and their needs, all co-ordinated through a variety of media (Dwyer &
Tanner, 2002:306). According to Russell and Lane (2002:27) and Semenik
(2002:8), the B2B IMC mix consists of personal selling, sales promotions, trade
shows, public relations, advertising, Internet marketing and social media, and
direct marketing. It may, therefore, be surmised that the IMC mix consists of a
multitude of different elements that can be used to promote the different business
brands.
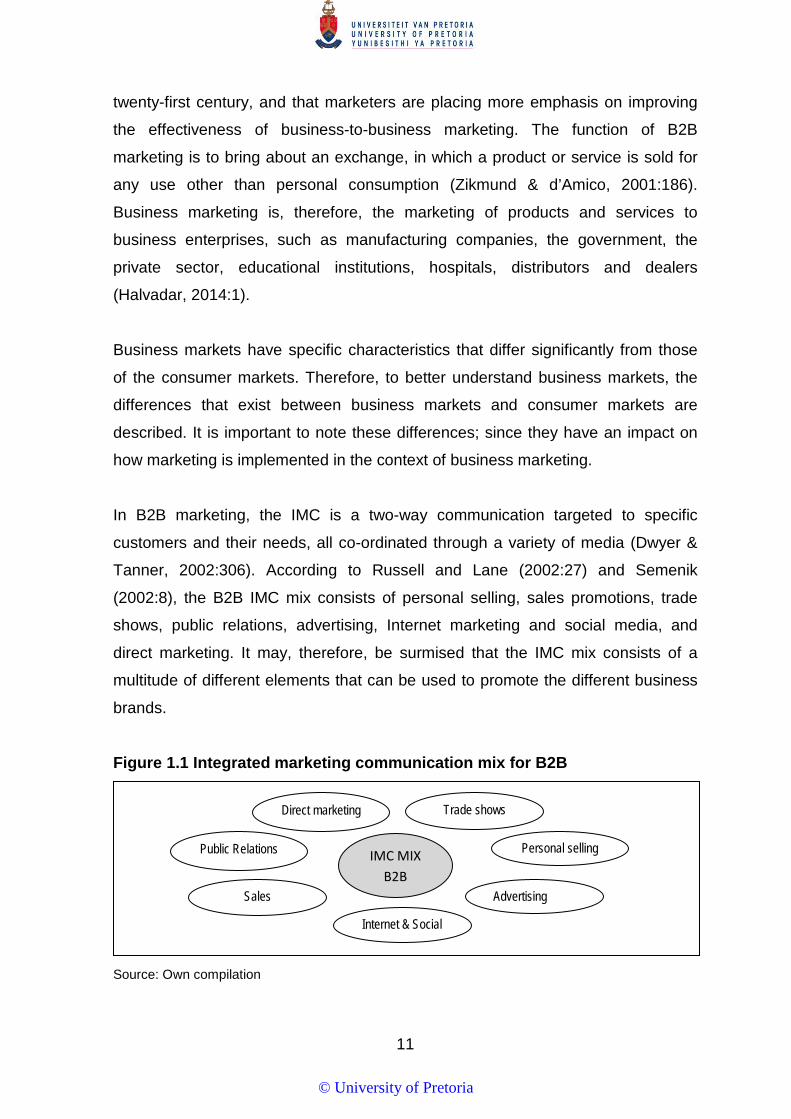
Figure 1.1 Integrated marketing communication mix for B2B
Source: Own compilation
Advertising
Public Relations Personal selling
Trade shows
Internet & Social
Sales
Direct marketing
IMC MIX B2B
© University of Pretoria
12
In Figure 1.1 the elements that make up the B2B IMC is illustrated. In Section
2.7.5 the IMC is discussed in more detail and in Figure 2.6 the interconnection
between the different elements is illustrated. Blyth (2006:273) points out that a
number of elements of the IMC mix are interconnected with one another. Kellezi
(2013:265) further indicates that trade shows is an integral part of the marketing
communication strategy to improve customer relationships. Figure 2.6 provides an
indication where this interconnectedness occurs between sales promotion,
personal selling and trade shows and the other elements of the IMC mix.
As pointed out in B2B markets, the emphasis is more on direct communication;
and therefore, advertising does play a major role in business markets (Dwyer &
Tanner, 2002:313; Hutt & Speh, 2007:292-294). In the IMC mix of B2B markets,
public relations are, however, done – frequently with the help of trade shows; since
a large number of trade show attendees are usually journalists who inform the
public about new developments (Kirchgeorg, Dornscheidt, Giese & Stoeck,
2005:367-369). This is an example of the interconnection between IMC mix
elements, trade shows and public relations.
In B2B markets, direct marketing is also used; and its role is to produce sales from
current customers, to create leads or actions, such as visiting a website or trade
show (Dwyer & Tanner, 2009:296). Internet marketing has also become important
in B2B marketing as part of direct marketing that includes the company’s website
and electronic mail (Ellis, 2011:303).
As pointed out above, in B2B marketing, IMC is used to market one’s products or
services to potential clients. It was also pointed out that communication is direct in
nature. Two ways in which direct communication can be facilitated is through trade
shows and personal selling.
1.5.2 Trade shows
The first reference to trade shows in human history is in the Bible in the book of
Ezekiel, written in 588 BC (before Christ), where reference is made to merchants
trading in silver, iron, tin and lead (Cavanaugh, 1976:100; Simons, 1955:186).
© University of Pretoria

13
However, the first official international industrial exhibition opened in the Crystal
Palace, Hyde Park on the first of August 1851 (Northrup, 2005:351).
In the following millennium, trade shows grew; and by 1955, the 100th international
trade show was held. Over the next three decades, it expanded to 8000 trade
shows in 1983, with 91 000 firms participating and 31 million visitors attending
such shows (Kerin & Cron, 1987:87). The trade show bureau indicated that in
1994 alone, 1.3 million organisations exhibited from the United States and
Canada, which was attended by 85 million business people (Hansen, 2004:1).
The first trade show held in South Africa was called “Electra”; and it was arranged
by an engineer from Wits University in 1966. After that a number of other trade
shows had been held that included the “Crinkle Paper Show” and the “Business
equipment Show” in 1967. By 1968, the first exhibition’s organisers were
established in Cape Town (Gannon, 2012:24-25). Today, the average trade show
in South Africa attracts 7 500 visitors and the economic impact per visitor is
R546.64 (van Eyk, 2008:10). It is estimated that in South Africa, trade shows
revenues should reach R4 billion by 2017 (Viviers, 2013:210). Indicating that trade
shows is growing as a business communication element. In Section 3.5 of this
study the three main role players at trade shows are explained. It is clear from Table 1.1 that trade shows provide a number of important benefits
for businesses that wish to exhibit. A number of the activities are part of the sales
process that occurs at a trade show. However, most organisations only participate
in trade shows; since their competitors in the industry do likewise (Pitta et al.,
2006:159). At present, there is some uncertainty about the role that trade shows
play in their marketing and communication mixes and what their exhibiting
activities should be (Blythe, 2002:627). Godar and O'Connor (2001:77), however,
point out that trade shows are becoming more important to both sellers and
buyers. Bathelt, Golfetto and Rinallo (2014:165-166) points out that trade shows
provide exhibitors an opportunity to meet new customers and build relationships
with existing customers.
© University of Pretoria

14
Table 1.1 Views on the importance and role of trade shows Author Activities of trade show
Kerin & Cron (1987:88) Indentifying prospects, servicing current customers, introducing new or modified products, improving the company’s image, testing new products, improving business moral, gathering information about competitors and selling at the show
Seringhaus & Rosson (1998:398) Trade shows provide business with the opportunity to compete and succeed in the fast-growing global business market
Dwyer & Tanner (2002:347-349) Buying departments in organisations depends on trade shows to provide information and to see new products that is on the market, it creates dialogue between buyers and sellers, buyers can see demonstrations and the offerings, provide the opportunity to attain new prospects, builds customer relations, provide attendees with the opportunity to meet upper-level management and that provide them with strategic information about the organisation and exhibiting organisations are provided a chance to build relationships with trade press.
Rinallo & Golfetto (2006:865) Trade shows provide attendees the opportunity to experience geographical and culturally distant markets in a central location
Burgess & Bothma (2007:349)
Gathering information about competitors and new developments, research benefits in which accompany can gather in-depth information from customers, promotional benefit and selling benefit where new customer can be recruited and current customers maintained
Tafesse & Korneliussen (2011:47) Trade shows are multidimensional marketing tool in. Bettis-Outland, Johnston & Wilson (2012:390)
Trade shows are an ideal way for new business relationships to start, for current relationships to grow, and for the obtainment of new information that would positively influence organisations.
Trade shows consist of three stages and is discussed in Section 3.6 of this study.
The pre-show stage consists of activities such as promotions, staff training,
communication with possible attendees and setting objectives (Søilen, 2013:4).
After the pre-show stage the at-show stage occurs. At this stage all at-show
activities take place such as demonstrations, presentations, attendee tracking, on-
site promotions and selling. Once the trade show is concluded the post-show
activities take place. Post-show activities include following-up and measurement or
evaluation of the show. The three trade show stages will be discussed using the
activities identified by Tanner (2002:231), Seringhaus and Rosson (2004:153-
154), and Lee and Kim (2008:785). Although the focus of this study is at-show
activities, reference will also be made to pre-and post-show activities as these
three activities do not take place in isolation. Next, personal selling will be
discussed with the emphasis on the sales process.
1.5.3 Personal selling
Personal selling forms an integral part of the marketing-communication strategy of
an organisation. The role of personal selling is especially important in business
markets, where organisations rely on direct communication with the customers,
© University of Pretoria

15
due to the unique characteristics found in these markets. The salesperson,
therefore, has numerous functions, which would include prospecting for new
customers, building long-term relationships with current or potential customers,
helping implement marketing programmes, as well as gathering information for
organisations (Cant & van Heerden, 2004:20-21).
The elements of the integrated marketing communication mix assist the
salesperson to be more productive and effective in the execution of his/her selling
functions (Futrell, 2001:61). Trade shows are seen as an effective medium for
personal selling; since these two communication elements complement one
another (Ling-Yee, 2008:35). Metcalf (as quoted by van Eck, 2008:11) noted that
trade show provide personal interaction between the consumer and the
organisations that provide the seller with the opportunity to demonstrate and show
the customers the products they are about to purchase, which could close the
sale. It is, therefore, necessary to study the nature of personal selling, in order to
understand its interaction with trade shows.
The primary role of trade shows in the communication strategy is that of selling.
According to Kerin and Cron (1987:87), trade shows are more than just selling
tools; and they can complement or expand other elements of the marketing mix.
This can be divided into selling and non-selling activities. Selling activities include
prospecting, closing the sale and qualifying leads. Non-selling activities might
include building goodwill with current customers, public relations, market research,
meeting new intermediaries, introducing new products and improving the staff
morale (Blyth, 2001:627).
Trade shows assist in selling activities by providing certain advantages to
organisations, such as: face-to-face interaction with the customers in a central
location. They also attract active buyers; they support buyers in their purchase
decision by supplying information; they accelerate the selling process; they help
identify new prospects; they combine sales with marketing; they are attended by
hard-to-reach decision-makers and influencers; and they are also attended by
qualified leads and other exhibitors, who could be potential customers (Stevens,
2005:14-16).
© University of Pretoria
16
From the above it is clear that selling makes up an important function of trade
shows.
According to McCormack (1996:1-2), management theories and concepts have
been through numerous fads in the past few decades; but personal selling has
remained the same in its main functions: to identify, reach and persuade
customers to buy. Ingram, LaForge, Avila, Schwepker and Williams (2001:2),
however, disagree with McCormack. And these authors state that selling has
changed over the last few decades – becoming more sophisticated, due to lengthy
and complex sales processes. Ingram et al. (2001:3) have pointed out that one of
the key distinctions of personal selling in the current era is professionalism; in
which the emphasis is placed on customer-orientation in the sales process.
Johnston and Marshall (2005:5) agree with Ingram et al. By indicating that
personal selling has become more than just the selling of products with a focus on
building long-term relationships that are beneficial to both sellers and buyers.
Jones, Stevens and Chonko (2005:5) refer to professional selling as an
interpersonal communication process, in which the salesperson not only discovers
the customer’s needs and wants, but they satisfy it – to the long-term benefit of
both parties. Weitz et al. (2007:4) have gone further; and they state that personal
selling has become customer-centric, in which the buyer has become the centre of
the sales process. Blyth (2010:57) argues that one of the main problems with trade
shows is that the focuses is too much on selling and not enough on relationship
building. One reason for this could be, as pointed out by Blythe and Rayner
(1996:21-22), that the trade show objectives of the organisation are not
communicated to the exhibit staff. It is estimated that 80 to 85 per cent of trade-
shows attendees never interact with a salesperson (Cateora & Graham,
1999:394).
Consequently, the question regarding the success of personal selling in building
long-term relationships with customers at trade shows can be debated.
Organisations that exhibit at trade shows would, therefore, have to look at the
selling process that is followed, and ensure that it builds long-term relationships
with potential and current consumers. Rix, Buss and Herford (2006:10) agree with
© University of Pretoria
17
the above-mentioned authors and indicate that the sales person must acquire a
measure of commitment from the customer in the sales process.
According to Manning and Reece (2007:5), the sales process includes the
developing of relationships, discovering prospect needs, matching the
organisation’s products with these needs and communicating benefits through
informing, reminding, or persuading. It is therefore clear that sales goes through
different stages and activities. Ling-Yee (2008:35) indicates that this is also true for
trade shows, where an exhibitor-seller faces a multistage sales process.
Cant and van Heerden (2004:20-21) assert that the sales process in personal
selling consists of ten stages, namely: prospecting, pre-approach, approach,
presentation of a trial, determining objections, dealing with objections, trial close,
close and follow-up. In this study the role of the sales process at trade shows is
researched using the ten stages sales process of Futrell (2011:228). The reason
for using the ten stages as set out by Futrell (2011:228) is that it provides a very
comprehensive outline of the sales process. In Section 4.6 the ten stages of the
sales process is discussed in greater detail. The sales process and its activities in
trade shows is not clear; and it can be questioned whether it is the same as other
B2B selling situation.
According to Drohan (2007:32), trade-show exhibitors must do three things to
maximize their return-on-investment at trade shows: firstly, the marketing team
must have the skills to motivate prospects to begin the sales process; secondly, an
inside sales team must be put in place to deal with the follow-up from trade shows;
and lastly, the trade-show lead-qualification specialist should be partnered, in
order to improve the quality of the leads obtained from such trade shows. Tanner
(2002:229) indicates that trade shows give organisations the opportunity to sell
one-on-one to customers at a lower cost than an industrial sales call.
It may therefore be argued that the salesperson at a trade show must have the
same characteristics, such as good communication skills and sales knowledge, to
ensure success in the sales process.
© University of Pretoria
18
According to Goldblatt (2005:11) trade shows can be seen as one of the most
cost-effective ways to achieve sales; since attendees are more likely to purchase
than a prospect that is encountered in industry. Brennan et al. (2014:195) point out
that the best person to man the exhibit stand is a sales person since they have the
necessary skills and knowledge to move through the sales process. According to
Whitefield and Webber (2011:446), at trade shows sales persons need to be able
to communicate technical aspects of products. Golpalakrishna et al. (2010:245)
further point out that closing the sales at a trade show is less costly - this is due to
trade shows moving the sales process further. Yuksel and Voola (2010:295) refer
to the importance of highly qualified and knowledgeable staff manning travel trade
shows because of the complex nature of selling a service. Gottlieb, Brown and
Ferrier (2014:103) and Rinallo, Borghini and Golfetto (2010:255) agree that exhibit
staff must be highly competent personnel that that have product knowledge. It may
then be argued that highly competent personnel are not just of importance at trade
shows of services – such as travelling trade shows – but at all types of trade
shows.
It is, therefore, imperative when planning the trade show exhibit that organisations
must ensure that exhibit staff is highly trained and knowledgeable person (Li et al.,
2011:442). If this is not done, exhibitors make the mistake of selling the features of
the product, rather than focusing on the benefits (Naudi, 2006:11). The product’s
advantages and features must be related to the benefits since attendees are
buying benefits and not only features. Incorporating benefits into the sales
presentation is part of the sales process (du Toit, 2011: 149-150). In Chapter 4 the
differences between features, advantages and benefits is discussed in more detail.
This study has researched the role of the sales process at trade shows, in order to
provide exhibitors with an indication of what activities should be employed. This
information should help trade-show exhibitors to plan better for their activities
during the show.
© University of Pretoria
19
1.6 RESEARCH DESIGN AND METHODS
1.6.1 Description of the inquiry strategy and the broad research design
According to Zikmund (2003:58), research design is the plan that specifies the
methods and procedures for collecting and analysing the required information. The
research design is, therefore, the blueprint that needs to be followed to ensure that
the research was completed properly, and that the research objectives have been
achieved (Churchill & Iacobucci, 2005:74). The choice of a specific research
design depends on how much is known about the problem to be investigated; the
purpose of the research; the research questions; the accuracy of the hypotheses
formed; and the data-collection methods that are to be used.
The research design that was used for the purpose of this study is both
exploratory and descriptive research. Hair, Wolfinbarger, Ortinau and Bush
(2010:36) maintain that the function of exploratory research is twofold: firstly, it
provides the researcher with the necessary information to define the problem; and
secondly, it deepens the understanding of consumer behaviour. In this study, the
researcher consulted with the trade show industry, in order to get a better
understanding of the research problem.
From the explorative research done, the researcher formulated the research
problem and set out the objectives. In this study, the role of the sales process at
trade shows was established. Consequently, a descriptive research method was
followed.
1.6.2 Sampling
Sampling is any procedure that uses a small number of items, or a portion of the
population, to draw conclusions applicable to the whole population (Zikmund,
2003:62-63). According to Hays (1997:84), sampling is the method of selecting a
sample from the larger population. Sampling implies that the researcher cannot
interview each and everyone in a large population; therefore, it is necessary to
survey only a relatively small sample that is representative of the larger population.
© University of Pretoria
20
The target populations in this study comprise the exhibition staff. The researcher
made use of multi-stage sampling; that is a probability-sampling method.
Multistage sampling involves a number of steps that combine certain of the
probability methods (Zikmund & Babin, 2010:431). The multistage sample consists
of the researcher dividing the population into various groups or clusters, and then
drawing a representative sample by using a random-selection method (Wiid &
Diggines, 2015:205).
The researcher obtained a list of 32 trade-show organisers from Exhibition
Association of Southern Africa (EXSA), which is part of their association. From this
list, every trade show organiser was contacted to obtain permission to conduct
interviews at the trade show, which was managed by them. Once permission was
obtained, the questionnaires were distributed at the trade shows, for which
approval had been given.
1.6.3 Sample size
The researcher attempted to ensure that a large sample was obtained, in order to
ensure that the study becomes more accurate (Zikmund & Babin, 2010:459). The
occurrence of random sampling varies with samples of different sizes. By
increasing the sample size, one decreases the width of the confidence interval at a
given confidence level. It must, however, be noted that there are a number of
generalisations regarding sampling size, including that an increase in sample size
means an increase in accuracy (Wiid and Diggines, 2015:198; Burns and Bush,
2010:401; Housden, 2007:200).
If the research sample is classified as being homogeneous, the researcher does
not need to make use of a large sample to get sufficient data (Tustin, et al.,
2009:359). In this study, the respondents can be viewed as being homogeneous;
since the exhibitors who exhibit at trade shows and sell to other businesses were
questioned.
© University of Pretoria
21
1.6.4 Data collection
A self-administered pre-coded structured questionnaire was used and distributed
by trained interviewers, so as to satisfy the objectives of the study and the testing
of the hypotheses (McDaniel & Gates, 2010:66). The questionnaire consisted of
nine sections. Section A of the questionnaire consisted of the demographic profile
of the exhibitor’s business and exhibit information. Sections B, C and D made
used of scaled questions to determine business actions, marketing activities,
before and at the trade show. These questions were obtained from previews
research and insights obtained from industry. Sections E, F, G and I obtained
information on the use of the sales process in regard to the sales presentation, the
type of objections, dealing with objections, and closing the sale. The scales of
Jaramillo and Marshall (2004:9-25) were used extensively in these sections.
Lastly, in section J, multiple-choice questions were asked to obtain the
demographic profile exhibit staff.
The questionnaires were tested in a pilot study with members of the defined
populations, in order to ensure that all the questions and statements were clearly
understood; to avoid biased questions; and to ensure that the questionnaire meets
the objectives and hypotheses of the study. Inputs were also obtained from
Specialised Exhibitions and from the Exhibition Association of Southern Africa
(EXSA) – for comments and recommendations – before the pilot study were done.
In addition to the layout of the questionnaire, another aspect of importance is the
covering letter. Hair et al. (2010:192) and Zikmund (2003:227) maintain that a
covering letter is a letter that accompanies a questionnaire to induce the reader to
complete and return the questionnaire. In this study, a covering letter was included
as one the requirements set out by the University’s ethical guidelines in conducting
the research and to motivate the respondents to participate in the research.
1.6.5 Data analysis
For data to be useful, they have to be presented in a format that the researcher
can use. The researcher applied a structured data-capturing method, so as not to
© University of Pretoria

22
have any data-capturing errors. Zikmund (2003:531) refers to data transformation
as the process of transforming the data from their original form to a suitable format
for analysis – with the aim of achieving the research objectives. The data captured
in Excel were transformed and analysed using SPSS (Statistical Package for the
Social Sciences) statistical software packages. In the study, both descriptive and
inferential statistics are applied; and therefore, the specific statistical analysis used
with these two statistical methods, are discussed.
Descriptive statistics is used extensively to analyse the demographic information
of the respondents. Demographics include characteristics, such as age, education,
occupation, marital status, gender, income and social class. The data gathered on
the demographic characteristics of the respondents was combined with other
variables that were researched, in order to gain greater insight into the subject
under investigation. The demographic data serve as the background of the
population that were sampled for the analysis and interpretation of the findings
(Malhorta, 2010:106; Churchill, 2001:238).
McDaniel and Gates (2010:406) indicate to descriptive statistics as arranging,
summarising and presenting a dataset in such a way that the meaningful
essentials of the data can easily be extracted and interpreted. Simply put,
descriptive statistics is the collection, organisation, summarising and presentation
of the data; and therefore, they can only describe a dataset that was obtained
(Bluman, 2004:5). Descriptive statistics use graphic techniques and numerical
descriptive measures to summarise and present the data; therefore, in this study
inferential statics is used.
Bluman (2004:7) indicates that inferential statistics generalise from samples to
populations, perform estimations, test hypotheses, determine relationships
between variables and make predictions. Keller and Warrack (1997:4) stated that
inferential statistics are the methods used to draw conclusions or inferences about
the characteristics of populations, based on the sample data. Zikmund (2003:446)
agrees that inference statistics are used to make a judgment about the population
from which the researcher seeks information. Tebachnick and Fidell (2013:7) state
that multivariate statistics are necessary for inference.
© University of Pretoria
23
In this study, multivariate statistics is briefly discussed. According to Hair et al.
(2000:586), multivariate analysis is concerned with the simultaneous
relationships between two or more phenomena; and it is used to group those
phenomena that show a relationship between one another. With multivariate
analysis, either of two techniques can be used, namely: the dependent technique,
or the independent technique. The dependent technique is used when one or
more variables are dependent on one another; and the independent technique is
used where a whole set of independent relationships are examined.
In this study, the independent technique is used; and a factor analysis applied to
group the variables into factors (Hair et al., 2000:587-589; Tustin et al., 2009:647-
648). To meet the objectives and hypotheses of the study Analysis of Variance
(ANOVA), Multivariate analysis of variance (MANOVA) and t-test was done.
1.7 ASSESSING AND DEMONSTRATING THE QUALITY AND RIGOUR OF THE PROPOSED RESEARCH DESIGN
According to Saunders, Lewis and Thornhill (2009:326), three types of data quality
issues can be identified in using semi-structured interviews, namely: reliability,
form of bias, and validity and generalisability. In this study, a questionnaire was
applied for the exhibit staff. To overcome any reliability problems of the
questionnaire, a pilot study was done and is discussed in chapter 5 in greater
detail. After the pilot study, in which a limited number of respondents were asked
to complete the questionnaires, a Cronbach’s Alpha was conducted to determine
the reliability of the questionnaires. Cronbach’s Alpha coefficient is a technique
employed by taking the average of all possible split-half coefficients to measure
the internal consistency of multidimensional or summated scales.
In this study, a questionnaire consisting of a Likert scale was used; and therefore,
the Cronbach Alpha is of importance. Scale reliability is the extent to which a scale
can produce the same measurement results in repeated trials (Hair et al.,
2000:390-391).
© University of Pretoria

24
According to Malhotra, et al. (2012:433), reliability analysis allows the researcher
to study the properties of measurement scales and the items that comprise them.
The reliability analysis procedure calculates a number of commonly used
measures of scale reliability; and it also provides information on the relationships
between the individual items in the scale. Individual indicators or items of a scale
measuring the same construct should be highly inter-correlated. Cronbach’s Alpha
coefficient is the measurement of reliability that ranges from 0 to 1, with values of
0.60 to 0.70 deemed to be the lower limit of acceptability (Hair et al., 2010b:89 &
118).
Once reliability testing had been done, the research was also validated. Validation
is the process of ensuring that the interviews were conducted as specified by the
researcher (Malhotra et al., 2012:574). According to Hair et al. (2000:480),
validation is done to ensure that the research was conducted correctly, and no
bias has occurred. In this study, there was no interview bias – due the training of
the interviewers before the questionnaires were distributed. Validation is discussed
in more detail in the research methodology chapter of this study.
1.8 CONTRIBUTION OF STUDY
A number of studies point to the limited research regarding trade shows as a
business to business marketing communication tool (Gottlieb, et al., 2011:1642;
Wilkinson & Brouthers, 2006:238; Pitta, et al., 2006:160). This study expands on
current research regarding trade shows in academia and furthermore provides the
industry with guidelines on the sales process for trade shows.
The findings in this study provide exhibitors with practical guidelines on what,
activities focus, should be placed on in the sales process at trade shows.
Although, the stages or steps of sales process have been established for a
multitude of different industries there is no clear indication of its role at trade
shows. This study contributes to the expansion of the sales process at trade
shows by identifying the sub-stages that makes up each of its stages.
Furthermore, the study contributes on existing models that deals with buyer
decision-making and the stages (pre-,at- and post-show) of trade shows. This
© University of Pretoria

25
information will add to the field of trade shows and personal selling research, and
can assist in future research that will be done.
In the study the pre-, at- and post-show stages of a trade show is linked with the
sales process ten stages to provide a better understanding of the linkage between
the various stages. The identified factors at each stage are linked not only to the
sales process, but also that of the stages of a trade show. This provides a better
understanding of how the sales process fits in at each stage of a trade show. In
Chapter 7 a figure is provided that indicates the link between the sales process
and the stages of a trade show.
The information obtained on the sales process at trade shows can also be applied
practically by the main role players namely, exhibitors, organisers and attendees.
Firstly, the study provides exhibitors with a guide regarding the sales process that
should be followed at trade shows to help them plan their show activities. More
specifically exhibitors will be able to plan what sales actions should be taken at
each stage of the sales process when exhibiting. The information furthermore can
guide exhibitors on training staff and the setting of objectives to improve their
participation at trade shows.
Secondly, the research can be used by trade show organisers to improve service
delivered to both exhibitors and attendees. It was pointed out in Section 1.2 of this
chapter that one of the main problems experienced by trade show organisers is
that exhibitors do not exhibit effectively. Due to ineffective exhibiting exhibitor’s
experience of trade show are not positive. Trade show organisers can use the
information from this study to set general exhibiting guidelines and develop
training material for exhibitors. Lastly, attendees will benefit since a standard
format of sales information will be provided from trained exhibit staff to guide them
through the buying decision-making process and therefore improving customer
relationship.
In the last section of this chapter the layout of this study will be discussed to
provide an overview to the reader.
© University of Pretoria
26
1.9 LAYOUT OF THE STUDY
This study consists of seven chapters. Chapter One is an introduction to the study
and provides the background. The reason for the study is defined; and the
objectives are set, in order to answer the questions in the research problem
discussed.
Chapter Two consists of a theoretical discussion on business-to-business
marketing. That provides a background to B2B marketing, and the four Ps. The
IMC for B2B marketing is also discussed to provide insight on where personal
selling and trade shows fit in.
In Chapter Three, the trade show, as an IMC element, is expanded on and
discussed in more detail. The types of trade shows, the role players and the
stages in trade show are also discussed here.
Personal selling is discussed in Chapter Four. The role of personal selling within
a business and marketing are discussed, with the emphasis in this chapter on the
selling process.
The research problem, the objectives and the hypotheses set for the study are
discussed in Chapter Five. Also the research methodology to be used is covered.
Chapter Six contains the statistical analysis, the findings and the interpretation of
the data.
Chapter Seven deals with the conclusions and the recommendations of the study.
© University of Pretoria

27
CHAPTER 2
BUSINESS-TO-BUSINESS MARKETING
2.1 INTRODUCTION
To understand the role of personal selling and trade shows, as part of the
business-to-business (B2B) Integrated Marketing Communication (IMC) mix, it is
necessary for this study to discuss the nature of B2B marketing. Business-to
business marketing is unique, in that the distribution and communication channels
are more direct than in conventional consumer marketing. Business markets also
have a complex buying process between the buyer and the seller that places the
emphasis on personal selling and negotiation, which, in turn, result in a more
unique communication strategy (Hutt & Speh, 2007:391).
With the emphasis being on more direct communication, the relationship that is
created between buyer and seller plays an important role in B2B marketing. This
direct communication process is reflected in the communication at trade shows
between the salesperson and the attendees.
In Figure 2.1, a layout of Chapter 2 is provided. This chapter deals with the nature
of B2B marketing. Firstly, a definition will be provided of business-to-business
marketing. Secondly, the difference between consumer markets and business
markets is explained. Thirdly, business buying behaviour will be discussed; and
lastly, the B2B marketing mix that consists of the product, price, distribution and
the IMC mix are described. The emphasis will be placed on the IMC mix in B2B
marketing, in order to provide context to the study.
© University of Pretoria
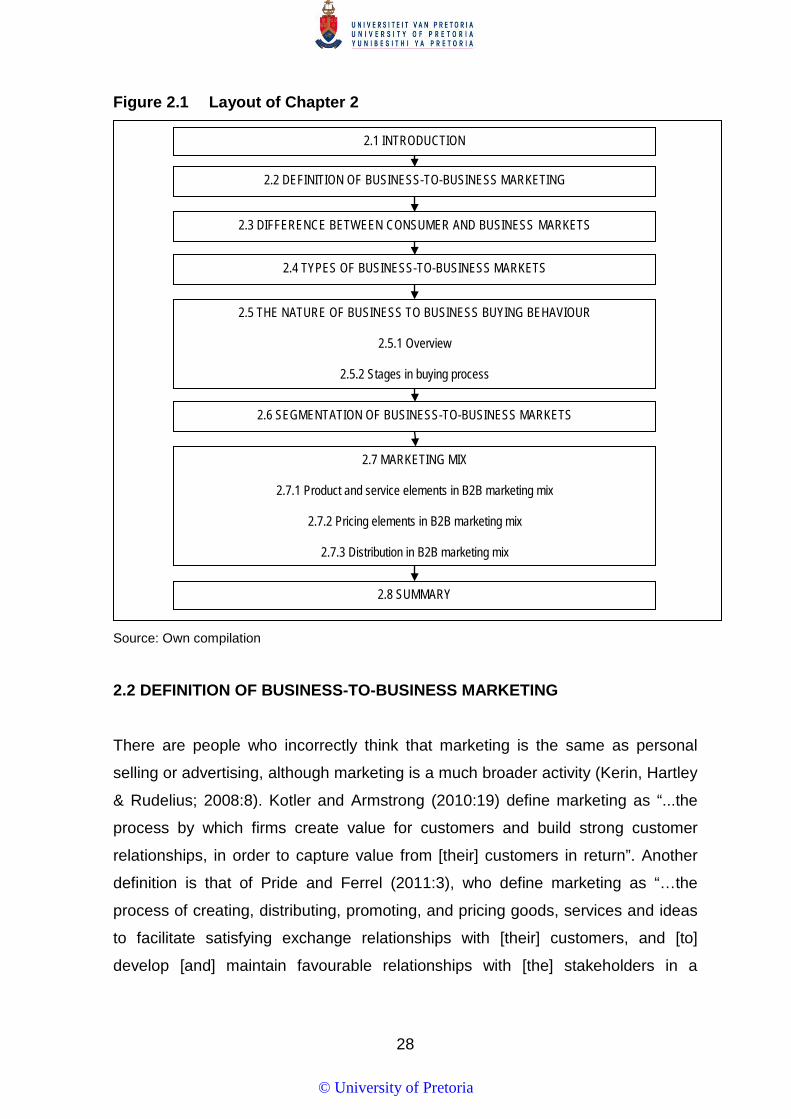
28
Figure 2.1 Layout of Chapter 2
Source: Own compilation
2.2 DEFINITION OF BUSINESS-TO-BUSINESS MARKETING
There are people who incorrectly think that marketing is the same as personal
selling or advertising, although marketing is a much broader activity (Kerin, Hartley
& Rudelius; 2008:8). Kotler and Armstrong (2010:19) define marketing as “...the
process by which firms create value for customers and build strong customer
relationships, in order to capture value from [their] customers in return”. Another
definition is that of Pride and Ferrel (2011:3), who define marketing as “…the
process of creating, distributing, promoting, and pricing goods, services and ideas
to facilitate satisfying exchange relationships with [their] customers, and [to]
develop [and] maintain favourable relationships with [the] stakeholders in a
2.1 INTRODUCTION
2.2 DEFINITION OF BUSINESS-TO-BUSINESS MARKETING
2.3 DIFFERENCE BETWEEN CONSUMER AND BUSINESS MARKETS
2.4 TYPES OF BUSINESS-TO-BUSINESS MARKETS
2.5 THE NATURE OF BUSINESS TO BUSINESS BUYING BEHAVIOUR
2.5.1 Overview
2.5.2 Stages in buying process
2.6 SEGMENTATION OF BUSINESS-TO-BUSINESS MARKETS
2.7 MARKETING MIX
2.7.1 Product and service elements in B2B marketing mix
2.7.2 Pricing elements in B2B marketing mix
2.7.3 Distribution in B2B marketing mix
2.8 SUMMARY
© University of Pretoria
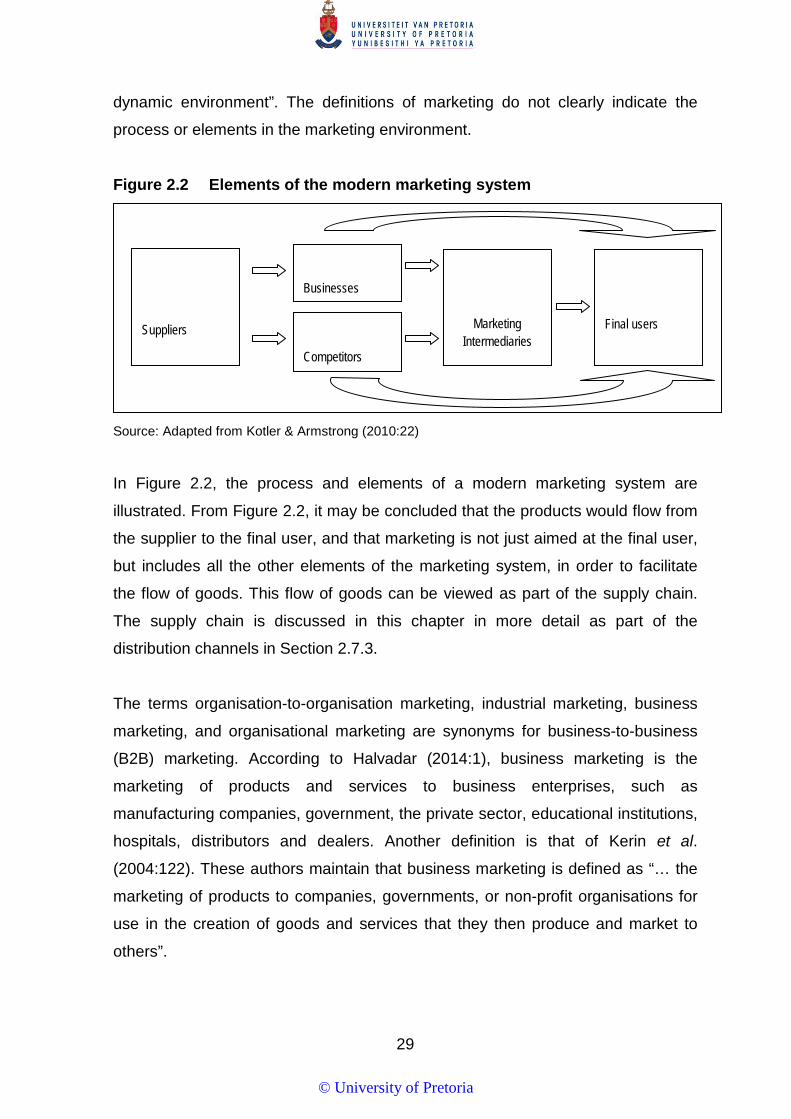
29
dynamic environment”. The definitions of marketing do not clearly indicate the
process or elements in the marketing environment.
Figure 2.2 Elements of the modern marketing system
Source: Adapted from Kotler & Armstrong (2010:22)
In Figure 2.2, the process and elements of a modern marketing system are
illustrated. From Figure 2.2, it may be concluded that the products would flow from
the supplier to the final user, and that marketing is not just aimed at the final user,
but includes all the other elements of the marketing system, in order to facilitate
the flow of goods. This flow of goods can be viewed as part of the supply chain.
The supply chain is discussed in this chapter in more detail as part of the
distribution channels in Section 2.7.3.
The terms organisation-to-organisation marketing, industrial marketing, business
marketing, and organisational marketing are synonyms for business-to-business
(B2B) marketing. According to Halvadar (2014:1), business marketing is the
marketing of products and services to business enterprises, such as
manufacturing companies, government, the private sector, educational institutions,
hospitals, distributors and dealers. Another definition is that of Kerin et al.
(2004:122). These authors maintain that business marketing is defined as “… the
marketing of products to companies, governments, or non-profit organisations for
use in the creation of goods and services that they then produce and market to
others”.
Suppliers
Marketing Intermediaries
Final users
Businesses
Competitors
© University of Pretoria

30
Dwyer and Tanner (2009:6) provide a very similar definition; and they define B2B
marketing as the marketing of products or services to other companies,
government, institutions (hospitals and universities) and other organisations.
Lamb, Hair, McDaniel, Boshoff and Terblanche (2015:484) define business-to-
business marketing as “… the marketing of goods and services to individuals and
organisations for purposes other than personal consumption”.
A definition given by Căescu and Dumitri (2011:275) focuses more on the delivery
of value; and they define B2B marketing as “… a set of processes used for
creating, communicating and delivering value to other organisations, in such a way
as to benefit both the organisation and stakeholders”.
From the definitions, the key concepts and the various elements arise. Taking all
of the definitions into consideration, B2B marketing – for the purpose of this study
– is defined as the marketing of products and services to other companies,
government, non-profit institutions, dealers and other business organisations for
re-sale, or for use in the production of goods and services, while adding value.
From the definitions, it is clear that differences exist between business-to-
consumer (B2C) and business-to-business (B2B) marketing. Cova and Salle
(2008:3-11) point out that there exists cross-fertilisation between B2B and B2C
marketing; and that the comparisons between the two are based on out-of-date
criteria that are no longer relevant. Although the afore-mentioned definitions might
hold true; there are still key differences between them. The differences between
B2B and B2C will be discussed – in order to provide a better understanding of why
personal selling and trade shows are important for business marketing.
2.3 THE DIFFERENCE BETWEEN CONSUMER AND BUSINESS MARKETS
Business markets have specific characteristics that differ significantly from those
of the consumer markets. This study focuses on trade shows, and not on
consumer exhibitions; and therefore, it deals with business markets. To better
understand business markets, the differences that exist between business and
consumer markets will be described. According to Lilien and Grewal (2012:3),
© University of Pretoria
31
Lamb et al. (2015:155) and Kotler and Keller (2006:211-212), the following
differences can be identified between business and consumer markets:
• The sales volume in business markets is greater; although there are fewer
buyers than in consumer markets; and the total amount of sales is larger.
For example at trade shows where moulding equipment is sold one
machine can be millions of Rands, while at an expo aimed at consumers
buying baby goods, individual sales will be less.
• Business markets have fewer buyers than in consumer markets, which
means that it is easier to identify prospective customers and analyse their
needs. With fewer buyers in business markets, more personal attention can
be given to the customers, due to the importance that each customer plays
in the business organisation’s success. Because there are fewer buyers,
more direct communication, rather than mass communication, can be used,
such as personal selling and trade shows. The Afrimold trade show, for
example, focuses only on the industrial moulding industry, where the
numbers of users is limited, which means that there are only a few buyers.
This is in contrast with the huge number of consumers attending an expo
that exhibits crafts, for example.
• The location of buyers in business markets is usually geographically concentrated to specific areas; whereas consumers are found virtually
everywhere. With business markets in centralised locations, producers
have lower selling costs. Trade shows provide sellers with a central
location; where all the different buyers from across a region – be it a
province, country or continent – can gather to see what products are on the
market. In South Africa B2B trade shows mainly takes place in
Johannesburg that is seen as the economic and business hub, while
consumer shows takes place in most of the big cities.
• The supplier-customer relationship is closer in business markets than in
consumer markets, due to the smaller customer base, the customisation of
purchases, the greater volume and the average cost of a sale, and the
power that larger customers have over suppliers. In business markets,
personal selling plays an important role in building and maintaining
customer relationships. At trade shows large amount of products are
purchased that cost millions of Rands and therefore the relationship
© University of Pretoria

32
between buyer and seller is closer. At expos where consumer products are
sold the relationship only last while the person is at the exhibit stand.
• In consumer markets, the distribution channels are more complex than in
business markets, where more direct channels of distribution are found.
The afore-mentioned characteristics contribute to direct channels of
distribution being more common in business markets. At trade shows, the
buyer makes direct contact with the seller, thereby facilitating not only the
flow of products, but also the dissemination of information. Exhibitors at
consumer expos often sell through retail, wholesale and/or electronic
outlets that makes the channels of distribution more complex.
• The majority of business organisations buy products and services, in order
to produce other products and services. Therefore, the demand for products
and services is derived from the demand for the consumer and other
markets. Derived demand gives rise to the importance for business
marketers to monitor the buying patterns of consumer markets.
• Price changes in business markets do not have much effect on demand;
therefore, in business markets inelastic demand is found. The demand for
a product category does not easily change, because of the set production
methods and the price of the product used in the production. The final
product is often a small part of the final production cost.
• The fluctuating demand for business-to-business products tends to be
more unstable than the demand in consumer markets. The acceleration
principle, where a small increase or decrease in the demand for consumer
products can lead to a larger increase or decrease in the demand for plants
and equipment to produce the output required, contributes to the fluctuating
demand.
• Joint demand in business markets is more common; where a combination
of products is frequently used in the production of products and services.
• In business markets, goods are purchased by well-trained professional purchasing agents who must stay within their organisation’s policies,
constraints and requirements, when acquiring products and services. Trade
shows play a role; since purchasing agents can view a number of products
at a central location.
© University of Pretoria

33
• Business markets use direct marketing communication with a greater
emphasis on personal selling and trade shows – as a marketing-
communication tool over consumer markets preference for mass media
advertising.
From the discussions, regarding the differences between business and consumer
markets, the importance of personal selling and trade shows becomes apparent.
Consumers mainly buy products and services for their own personal use or
household consumption; whereas business markets, on the other hand, buy
products and services for production purposes, for the use in production
operations, or for the resale to other customers (Pride & Ferrel, 2011:154).
In B2B marketing, there is more rationale in making decisions. It also takes longer
and more information is gathered before decisions are made (Coviello & Brodie,
2001:395). A company that, for example, wants to purchase new equipment that
costs millions of Rands can get information from sales people and trade shows,
before making a decision.
Now that the uniqueness of business markets has been pointed out, the different
types of business markets that can be categorised. This will shortly be discussed.
This is important for this study; since many industries arrange trade shows,
according to the type of business market in which they trade.
2.4 TYPES OF BUSINESS-TO-BUSINESS MARKETS
According to Halvadar (2014:12), and Dwyer and Tanner (2009:12-14), B2B
markets can be categorised into three groups, namely: government customers,
institutional customers and commercial enterprises (markets). It must be
noted that many trade shows focus on specific B2B markets. Each of the different
B2B markets will now be discussed.
The central, provincial and local government departments, such as defence,
schools and municipalities, purchase all kind of business products. Boone and
Kurtz (2012:188) mention that B2B marketers must be aware of the distinct
© University of Pretoria
34
challenges of selling to the various government departments. These challenges
include: (1) The government’s compliance policy to maintain affirmative programs
for specific groups, such as the handicapped and women; (2) set-aside programs;
where a certain percentage of a contract is set aside for Black Economic
Empowerment (BEE); and (3) subcontracting that may require major contractors to
allocate a certain percentage of the given government contract to the previously
disadvantage groups (Hutt & Speh, 2007:47). Although the afore-mentioned
challenges exist, many business rely on trade shows to sell their products to
government.
In South Africa there are trade shows, such as IFSEC South Africa, Rail Africa and
Road Trans Africa that focus on government departments from different countries.
Institutions (public and private), such as universities or hospitals, require
industrial marketers to understand the purchasing process and the procedures of
each of the different institutions. Lamb et al. (2015:485) describe an institution as
any business that seeks to accomplish goals different from everyday business
goals, for instance, such as profit, market share, and returns on investment. Some
of the institutions use purchasing procedures similar to those used by government
departments (Dwyer & Tanner, 2009:14). Businesses that want to market and sell
to the institutional market must be aware of the diversity of this market, such as
different goals and fewer resources (Dwyer & Tanner, 2009:14; Pride & Ferrell,
2008:227).
Therefore, it may be assumed that businesses that sell to institutions would have
to tailor their personal selling and trade show strategies to meet the particular
needs of the customers. The afore-mentioned tailoring provides businesses that
exhibit at trade shows with the opportunity to select specific shows to best promote
their products; for example, Lab Africa that focuses on hospitals and other
medically related institutions.
Commercial enterprises consist of three different groups: namely resellers;
Original Equipment Manufacturers (OEMs) and users. Resellers consist of
retailers and wholesalers that buy products without re-processing them, and then
© University of Pretoria
35
re-sell them to the commercial, governmental or institutional markets at a profit
(Lamb et al., 2015:484). In South Africa trade shows such as Markex focuses on
re-selling market promotions. OEMs are businesses that buy products, which they
incorporate into the products that they produce, and then sell them to the business
or consumer market (Halvadar, 2014:12). An example of this is the Afrimold trade
show that focuses on moulding equipment that is mostly used in the manufacturing
industries. Users buy products to support a manufacturing enterprise. The
products or equipment are used to produce parts that will be incorporated into the
products they produce.
These purchases do not necessarily become part of the final product; they only
assist them in producing of the final product.
Many of the trade shows in South Africa cover all three segments. The IFSEC
trade show, for example, sells to government, institutions and commercial
enterprise, because of the nature of the products that are exhibited. Therefore, in
this study all three segments will be dealt with.
As indicated, there are differences in each of the markets as regards their buying
behaviour. The differences in buying behaviour influence both the selling and the
type of trade show at which a business decides to exhibit.
2.5 THE NATURE OF BUSINESS-TO-BUSINESS BUYING BEHAVIOUR
2.5.1 Overview
According to Boone and Kurtz (2012:185), B2B buying behaviour is the decision-
making and other activities of organisations as buyers, that include the selection of
suppliers, sources or vendors. The buying behaviour in B2B markets can be
viewed as a process, and not just as an isolated act (Hutt & Speh, 2007:63-64). As
stated before, B2B buying is a process that consists of a number of stages; and
each of these leads to a decision. Trade shows and selling facilitate this
movement between the stages, by providing information to the customers (Ling-
© University of Pretoria
36
Yee, 2006:173). The buying process is normally initiated by someone in the
organisation who recognises a problem that must be solved.
The problem could be triggered by both internal and/or external factors. An
example of an external factor would be a person from a business attending a trade
show and seeing a new product on exhibition. There is no specific sequence to
follow in the stages; and these may differ, according to the complexity of the
buying situation; where some of the stages can be combined or bypassed. The
different stages are also influenced by buying centres that consist of a number of
individuals or departments within a business. Three aspects influence business
buying behaviour: The stages of the buying process; the buying situation; and the
buying centre (Hutt & Speh, 2007:64; Dwyer & Tanner, 2009:71).
2.5.2 Stages in the buying process
According to Boone and Kurtz (2012:185), the buying process starts when a
problem is recognised within an organisation; and the realisation that it can take
place anywhere within the organisation. In the business-buying process, more
focus is placed on need awareness – right up to the selection of a supplier
(Ghingold & Wilson, 1998:97-99). At each stage of the buying process, decisions
are made to eliminate products and vendors (Morris, Pitt & Honeycutt, 2001:82;
Hutt & Speh, 2007:63). Trade shows can play a role at each stage – be it from
making a customer aware, to providing information on vendors and products to the
potential buyers.
Unlike the normal consumer buying process; where mental steps cannot be
observed, the buying process of organisations can; since there are different
individuals participating at each stage (Reeder, Brierty & Reeder, 1991:76). The
business-buying process is much more complicated than normal consumer
decision-making – due to the large number of individuals involved in the process
(Hawkins, Mothersbough & Mookerjee, 2010:752). Business-buying processes are
also influenced by both internal and external stimuli (Kotler & Armstrong,
2010:177-178).
© University of Pretoria
37
Factors that influence the buying process include: the nature of the product; the
cost involved; and the experience of the organisation in buying the needed
products (Zikmund & d`Amico, 2001:189).
According to Sarin (2013:13), Ellis (2011:47-48), Phadtare (2008:26), Hutt and
Speh (2007:63) and Havaldar (2010:42-43), the business-buying process is more
complicated than consumer decision-making due to the number of factors that
have an influence namely:
• Buying centres. A buying centre consists of a number of individuals or
groups that are involved in the process of making a decision to purchase.
Unlike personal selling, trade shows, for example, provide an opportunity
for every member of the buying centre to see a product demonstrated at an
exhibition stand. This means that trade shows facilitate the selling process.
• Environmental concerns. The company will base its purchasing decisions
on what it anticipates demand will be for its own products. In stable
markets, this is a comparatively easier task than in turbulent markets
(where demand is uncertain). It can also be easier in the case of straight re-
buys, and, in some cases, modified re-buys, where the demand is more
certain. For example, attendees can get information from trade shows to
assist in making decisions when buying.
• The purchasing situation. Whether it is a straight re-buy, a modified re-
buy, or a new task, this would determine the level of involvement required in
orchestrating the purchase. With new task buying, for example, trade shows
can provide a buyer the opportunity to observe a number of possible
products that might satisfy their needs. If a buyer from the mining industry,
for example, attends Electra Mining, they can see hundreds of different
mining-related products such as drilling machines and earth moving
equipment.
• Access to information. The greater the buying organisations access to
information, the greater their ability to search for more favourable buying
situations. Both personal selling and trade shows are the sources of
information for buyers.
© University of Pretoria

38
• Relationship with the supplier. The closer the organisation is to its
suppliers, the less likely they would be to search for other suppliers. This
closeness does necessitate higher up-front costs to the buying
organisation; however, a greater capacity to generate profits between both
organisations could be the result of close inter-organisational collaboration.
Businesses use trade shows as a way to interact with suppliers, and to
build business relationships.
• Position within the supply chain. If the company is further upstream in
the supply chain, its inputs would mostly be raw materials. This determines
the organisation’s buying structure. That is, the organisation would be
geared to be more able to buy large quantities for lower prices, than for a
company further downstream in the supply chain, whose inputs are usually
finished or near-finished goods.
• Organisation size. The size of the organisation will determine its power
within the marketplace (in most situations). Trade shows, for example, can
provide smaller organisations with the opportunity to find a number of
buyers within their industry in its central location.
• Organisational orientation. The more customer-centric an organisation is,
the greater the influence of customer requirements would be on its
purchasing habits.
The business-buying process has a number of stages that consist of the following
stages: need recognition, characteristics and quantity of needed item (product
definition), the identification of alternatives (product specification), search for
qualified supplier, analysis of products, selection of supplier, order placement,
product inspection and product review (Lamb, et al., 2015:551). Some of the
stages in the selling process at trade shows can mesh in with the stages of the
business-decision process. The stages in the decision-making process for
business will be briefly discussed:
Stage 1: Anticipation or recognition of a problem or need
Problem- or need-recognition in the buying organisation can be the result of
internal or external stimuli. Internally, the company may decide to launch a new
© University of Pretoria

39
product that requires new production equipment to replace outdated equipment, or
an equipment breakdown. External stimuli could be a selling organisation that
initiates the decision process or creates a demand for products by identifying a
new capability or a higher quality product. From the selling organisation’s point-of-
view, the identification of where the first step of the decision-making process
starts, is of importance, as well as to understand and satisfy the needs and
problems of the buying organisation better (Halvadar, 2014:36-37).
Trade shows could be possible external stimuli, since an attendee can be exposed
to a new product or services that cause them to recognise a need or a problem.
Stage 2: Determination of the characteristics and quantity of a needed item
The buying organisation will try and determine the possible solutions to the
problems or needs that were identified. In the determination of possible solutions,
a number of members inside the buying organisation may be consulted. These
would include engineers, users or buyers. External sources consulted in this
phase include, suppliers, salespersons or marketers from selling organisation that
can help the buyers define their needs and provide information about the different
product characteristics. In this stage, the sales person and the trade shows can
provide valuable information (Phadtare 2008:16).
Stage 3: Product specification
In this stage, a formulation of the exact specifications or the characteristics of the
product that would solve the problem is done. The buying organisation would
obtain the advice from technical personnel inside the organisation, or the advice
from outside sales personnel. In this stage, the selling organisation has the
opportunity to get involved in developing the product specifications, which give an
advantage to ensure that the company’s product characteristics and specifications
are included in the product that will solve the problem or need (Sarin, 2013: 38;
Hutt & Speh, 2007:64). Trade shows, for example, provide a buyer with an
opportunity to see a number of different products. If a company is, for example,
looking at safety equipment, the Organisational Health and Safety (OSH) trade
© University of Pretoria

40
show each year might have over a hundred exhibitors, with a number of products
that could meet the business-product specifications.
Stage 4: Supplier search
In this stage, the buying organisation firstly searches for suitable suppliers; and
secondly, selects a supplier. In searching for potential suppliers, various sources
are consulted, such as trade shows, sales calls, catalogues, the internet and trade
journals (Ellis, 2011:52; Morris et al., 2001:76). Trade shows can, for example, be
an easy way for a business to search for suppliers, because of the concentration
of a large number of suppliers that exhibit in a specific industry.
Stage 5: Obtaining proposals and the analysis thereof
At this stage, the qualified suppliers are requested to provide detailed proposals.
Proposals include product specifications, prices, taxes and duties, packaging
charges, insurance, cost freight, conditions, warranties and delivery schedule
(Ellis, 2011:52). Trade shows, for example, could be a good place for
salespersons to start the process of gathering information, in order to develop
proposals for possible buyers.
Stage 6: Supplier selection
The received proposals are evaluated, and additional information if required, is
obtained. Further negotiations might take place on price, delivery and payment.
The buyer organisation brings all the suppliers down to the same level, to make a
comparison. Each possible supplier is evaluated on a set of agreed-upon
attributes or factors (Phadtare, 2008:17; Halvadar, 2014:36-37). Trade shows can
assist a business in selecting suppliers, due to the number of different
organisations exhibiting their products or services in one central place, and in
many cases demonstrating them, as well.
© University of Pretoria

41
Stage 7: Selection of order routine
The buying organisation reconfirms the content of the proposal with the supplier
and negotiates various factors, including price, commercial terms and delivery
schedule. After negations are completed with all suppliers that submitted a
proposal, a final decision is taken; and the order is placed with the selected
supplier (Ellis, 2011:52).
Stage 8: Performance review
In the final stage, the whole decision process is evaluated; and three possible
outcomes are possible: either the buying organisation can continue, modify or
cancel the agreement. The selling organisations need to ensure that the
customer’s needs have been satisfied; and failure to follow through would leave
the marketers at risk of losing the customer (Hutt & Speh, 2007:64).
It must be noted that the stages of the decision-making process may vary with the
complexity and the buying situation. If an organisation is, for example, looking for a
new product compared to a straight re-buy, their intentions for visiting a trade
show would differ greatly. Due to the impact that the buying situation can have on
both the sales process and the reasons for visiting a trade show, the different
buying situations will be discussed next.
2.5.3 Buying situations
According to Ellis (2011:49-51) and Havaldar (2010:41), there are three types of
buying situations, namely: new tasks; modified re-buys and straight re-buys. The
type of buying situations (buy-classes) are determined in three ways: firstly,
whether it is a new purchase, and the business has had some experience with the
product or service; secondly, the amount of information required by the those who
influence the buying decision; and lastly, the number of alternatives that are being
considered (Morris et al., 2001:79). Next, each of the buying situations will be
briefly discussed.
© University of Pretoria
42
In a new purchase situation, the buying decision is different from previous
buying decisions, due to the internal and external factors that may have caused
the new problem. The buyers have limited knowledge of the new purchase; and
they lack previous experience. Therefore, they need large amounts of information
in making the purchase decision, and a number of potential suppliers to solve the
new problem (Sarin, 2013:30). The afore-mentioned information might, for
example, be obtained from a trade show.
A business looking for a new industrial moulding machine might then, for example,
visit a trade show in that industry to see what new products they could purchase
by demonstrating how they can solve the organisation’s problems.
In the majority of cases, a modified re-buy occurs, when the company is
dissatisfied with their existing suppliers. This could be due to post-sales service,
changing business needs or technology. If it is a simple modified re-buy, then the
information search can be limited; while with a complex modified re-buy, large
amounts of information are needed (Sarin, 2013:30). Trade shows, for example,
could be an opportunity for an organisation to convince business to switch or its
change suppliers.
Straight re-buy (repeat purchase) occurs when a business buys the same
products that were bought in the past. It is a routine decision with low risk, and
less information is needed. Elements, such as the product, the delivery, price and
payment terms remain unchanged, according to an original purchase order (Ellis,
2011:51). Trade shows, for example, can be used to maintain relationships with
current customers to ensure that they buy again. At trade shows, for example,
different customers or buying centre members would visit the exhibit stand where
their purchase decisions of the past can be reconfirmed.
2.5.4 Buying Centre
The buying decision in an organisation is normally made by a buying centre; and
only a few purchases decisions are made by managers only. To market a product
successfully to a business, marketing (specifically the sales department) requires
© University of Pretoria

43
knowledge of each member in a customer organisation, and the role they play in
the decision-making process. These members are known as purchase
participants, or buying-centre members. The members of a buying centre usually
consists of the purchasing department and people at all levels within the
organisation, who have individual objectives, but share the common risks, and
participate in the buying decision (Phadtare, 2008:26; Havaldar, 2010: 42-43;
Brennan, Canning & McDowell, 2014:43; Morris et al., 2001:67-73).
As stated, trade shows provide a great opportunity to get all the members of a
buying centre together in one central place.
According to Havaldar, (2010: 42-43), buying centres can be influenced by four
dimensions, namely: the time dimension, vertical and horizontal dimensions, and
the formalisation dimension. The time dimension is the period of time that
different members have been involved in the decision-making process. The
decision time can be lengthened, when the buying centre consists of many
personnel, and/or is composed of inexperienced members. A shorter time
dimension benefits the salesperson; since more prospects can be contacted. The
sales process at trade shows can, for example, make this time dimension shorter
– by persuading and providing information to buying centre members. The vertical dimension refers to the number of managers that are involved; and the
horizontal dimension indicates the number of departments that will participate in
the decision-making process (Dwyer & Tanner, 2009:99-103).
In the promotion of trade shows, the salesperson or the exhibiting business must
ensure that the correct members of the buying centre are invited to the show. The
formalisation dimension comprises the processes and policies describing the
task and roles of the buying-centre members (Dwyer & Tanner, 2009:99-103).
According to Boone and Kurtz (2012:191) and Morris et al. (2001:67), the
personnel in the buying organisation can influence the decision-making process in
one way or another. Their influences can be positive or negative, depending on
the product and/or the buying firm. The buying influences may be described by the
role the personnel play in the buying centre (Havaldar & Cavale, 2007:43-44;
© University of Pretoria

44
Brennan et al., 2014:43). It may, therefore, be assumed that each of the buying-
centre members’ roles would influence their decision-making when visiting a trade
show. Next, the different roles that the members play will be briefly discussed.
Initiators are those individuals who first recognise or anticipate a problem, a need
or an opportunity. The initiator can be any person within the organisation, who
defines the buying situation. At a trade show, an attendee might be influenced by
the booth staff, through a sales presentation, to recognise a problem; and s/he
might start the process of looking for more information (Boone & Kurtz, 2012:191).
For example, an engineer visiting the Electra Mining trade show might see a new
drilling machine, and initiate the process of the organisation possibly buying it.
Buyers’ main responsibility is to send enquires; obtain quotations (proposals);
evaluate, compare and select suppliers; negotiate with vendors; process the
purchase orders expediting deliveries; and implementing the purchasing policies of
the organisation. A number of the afore-mentioned actions can take place at a
trade show, such as comparing suppliers, selecting suppliers and negotiating with
vendors (Ellis, 2011:48).
Users are the department or individuals who initiate the purchase and actually use
the product (Ellis, 2011: 48). For example, exhibitors at trade shows can invite
users that work within the business to attend; and in doing so, make them aware
of what products are available through demonstrations.
Influencers are individuals within the organisation that make the choice, but
influence the buying process. Influencers can include mangers; and it would,
therefore, be advisable to invite them to such trade shows (Munuera & Ruiz,
1999:21).
Deciders are those individuals who make the final decision, but do not always
have formal authority, but have considerable influence. They are individuals in
senior positions within the organisation, and who approve the recommendations of
buyers. The deciders are the most difficult role to identify for marketers in a buying
centre (Ellis, 2011: 48).
© University of Pretoria
45
Gatekeepers have power over the flow of information regarding products or
suppliers between the different members of the buying centre, when making a
specific buying decision. By providing information to salespeople and other
representatives, the gatekeeper can decide which marketing material or product
information reaches the key influencers (Sarin, 2013:33). Gatekeepers can decide
whether salespeople must be given access to the right buying-centre members.
The advantage of trade shows is that it is usually the user, influencer, decider or
buyer that attends; and there is no gatekeeper between them and the exhibitor
(Bettis-Outland, Johnston & Wilson, 2012:390).
At trade shows, for example, through the sales process, users, influencers and
deciders can be influenced to purchase from an exhibiting firm. The sales process
used at trade shows must be adapted to each member; as some members might
only need information, such as the users; while others might be intent on buying,
such as the buyers. In this study, the exhibitor’s interaction with each of the
different buying centre members will be examined. Many businesses not only
classify their customers, according to a buying centre; but they go even further and
segment their customers. Trade show organisers often use segmentation to
classify different types of trade shows (Kirchgeorg et al., 2005:48-49).
2.6 SEGMENTATION OF BUSINESS-TO-BUSINESS MARKETS
Segmentation, targeting and positioning can be viewed as part of a single process
in B2B marketing (Zimmerman & Blyth, 2013:106; Ellis, 2011:173-176). The first
step in the process is to group customers together along common variables; this is
followed by choosing the most attractive segment for the market effort; and lastly,
there is a need to develop a position that attempts to place the marketing firm
uniquely in the minds of the buyers (Lilien & Grewal, 2012:22). Trade shows, for
example, are mostly established, according to the interests of industry – be this
safety, health, mining, or moulding or any other.
According to Bingham, Gomes and Knowles (2005:196), businesses have different
needs and wants, different structures within the procurement function; and they
© University of Pretoria
46
engage in different types of economic activities. Due to the afore-mentioned
issues, B2B marketing managers need to do market segmentation. A common
error that business marketers make in segmentation is viewing an entire industry
as one segment (Zimmerman & Blyth, 2013:95). Morris et al. (2001:124) define a
market segment as “…a group of existing or potential customers sharing some
common characteristic that is relevant in explaining their response to a company’s
marketing programs”. Business market segmentation involves the division of the
market into meaningful groupings or segments that are homogeneous with respect
to their response to a marketing mix (Brennan et al., 2014:147). Trade-show
organisers recognise this; and they have industry- or product-specific shows to
cater to the needs and wants of specific industries.
The targeting of selected segments assists management to have diverse and
unique marketing mixes for each particular segment to benefit efficiently in the use
of business-marketing resources (Lilien & Grewal, 2012:3; Zimmerman & Blyth,
2013:95). Marketing segmentation can benefit an organisation by enabling the
marketer to be more efficient, to identify specific client prospects, and to identify
and make the most of the limitations of its relevant competitors. An organisation,
for example, that sells water purification systems can target only the Water Utilities
Africa trade show to sell their equipment, and thereby using their marketing effort
more effectively.
Market segmentation also enables the business-marketing manager to select a
specific trade show to exhibit the products. Kirchgeorg et al. (2010b:290) explain
that the exhibitors and their characteristics help the trade-show management to
understand market developments; and that the exhibitors’ typology is determined
by their corresponding market position, their targets and their expectations of a
trade show. The afore-mentioned issue will impact the business-marketing mix;
and it will, therefore, be discussed next.
© University of Pretoria

47
2.7 THE MARKETING MIX
In Section 2.2, a definition of business marketing was given, in which different
elements of the marketing mix were identified, namely: product, price, distribution
and communication. In this section, each of the elements will be discussed.
2.7.1 Product and service elements in the B2B marketing mix
According to Halvadar (2014:115-116), a product in a B2B situation is more than
just the physical product. Products are more complex in B2B markets, with
different elements, such as: economic, legal, technical and the personal interaction
between buyer and seller. A product, therefore, is more than just the physical
aspects; but it rather includes all the benefits obtained (Dwyer & Tanner,
2009:224). It is suggested that the generic term “product” must be replaced by
“product offering” that includes the physical product and all the accompanying
services and benefits (Brennan et al., 2014:268-269). This must be applied at
trade shows, where the exhibitor sells the benefits of the products, and not merely
focuses on the physical aspects of the product (Pitta et al., 2006: 160).
Trade shows are not only used to sell products, but also for new product
development, as well (Ling-Yee, 2008:37; Hanchett, 2007:11) In this section, the
new product-development process in B2B markets and the classification of B2B
products will be discussed – due to its importance in trade shows. It was indicated
in Chapter 1 of this study that trade shows are used for testing new product
developments and therefore are important in new product development.
2.7.1.1 New product development
According to Judson, Schoenblacher, Gordon, Ridnour and Weilbacher (2006:196-
197), the salesperson is useful as an information source in the early stages of new
product development. Ling-Yee (2008:37), Hanchett (2007:11), Pitta et al.
(2006:160) and Herbig, O`Hara and Palumbo (1998:427) all point out that trade
shows are used by organisations to assist them with new product development
and fresh ideas.
© University of Pretoria

48
According to Ellis (2011:224), the development of new products is becoming more
difficult, due to shorter product-life cycles and the need for more products because
of customer demand. New products are launched more rapidly than in the past;
and old ones are removed more quickly, rendering product development more
important (Dwyer & Tanner, 2009:230). Trade shows assist businesses in this
process to determine customer demand; and they can then develop product
offerings that the customer wants due to the interaction that takes place at shows
between buyers and exhibitors (Pitta et al., 2006:160).
Zimmerman and Blyth (2013:180), Ellis (2011:225), Brennan et al. (2014:285) and
Halvadar (2014:128) indicate that in business markets, new product development
is made up of a number of steps.
Step 1 - Idea generation
New ideas for products can come from a number of different sources these
include salespeople, customers, service staff, market research, the
Research and Development (R&D) department, and engineers. Businesses
often make use of trade shows to do market research on customers’ needs
to assist in the development of new products (Pitta et al., 2006:160). Trade
shows are also used by businesses to see what their competitors’ newest
developments are to help in product-idea generation (Ling-Yee, 2008:37;
Hanchett, 2007:11). In this study, these issues will be investigated.
Step 2 - Idea screening The purpose of this stage is to select those ideas that would have the best
chance of succeeding. Ellis (2011:226) and Dwyer and Tanner (2009:233)
indicate that in the idea-screening stage, a business must have
predetermined criteria for the selection of the best ideas. The business
should screen any new idea on: whether it fits in with the company goals;
whether it satisfies customers’ needs; its market potential; the competitive
advantage that would be achieved; and whether the business can produce
the new product. Trade shows can be used at this step by having attendees
indicating which of the product ideas they would consider as feasible.
© University of Pretoria

49
Step 3 - Business analysis and planning The purpose of a business analysis is: to predict sales patterns; to estimate
the profitability by doing a demand analysis; to establish the market
segments; to discern competitors’ reactions; the costs of product
development; manufacturing and marketing. Furthermore, the investment in
plant, equipment, the additional capital required and market development
must be calculated as part of the analysis (Ellis, 2011:226).
Step 4 - Product development Prototypes of the product concept are developed and tested. The prototype
is tested in terms of design, functional performance and manufacturing
requirements. In today’s competitive market, the concept “concurrent
engineering” is practised, to ensure that new products are launched in the
market before those of the competitors (Ellis, 2011:226).
Step 5 – Test marketing In a B2B context, market testing is done by using methods, such as: alpha
and beta testing. Alpha testing is done within the business to test the
product’s performance and the working cost. When in-company testing is
satisfactory, the business will go for the beta testing. Marketing and
salespeople can also identify the potential user that would permit
confidential testing at their factories (Halvadar, 2014:132). Another method
used, is to introduce the product at trade shows, where any potential buyers
are exposed to the new product; and their reactions, intentions or
placement of orders can be evaluated (Hansen, 1996:47).
It must, however, be noted that by placing the product at trade shows, the
business should be ready to launch the new product as soon as possible,
due to the exposure to the competitors (Halvadar, 2014:132).
Step 6 – Product launching The launch of the product occurs when it is introduced to the target market.
With the introduction of the product, the marketing activities of the business
must be kept in mind. The production and that marketing activities must be
© University of Pretoria

50
synchronised, in order to ensure that the market entry timing and the needs
of stakeholders, distributors and advertising agencies are considered.
Trade shows are used by many businesses to introduce new products
(Tafesse & Korneliussen, 2011:44-46).
In this study it will be investigated whether exhibitors employ new product
launching at trade shows.
The products developed can be classified into different categories, according to
the purpose for which they will be used.
2.7.1.2 Classification of products in business-to-business markets
B2B products can be classified into: installation, accessories, raw materials,
manufactured materials, components, spare parts, supplies and business services
(Ellis, 2011:215; van Rensburg, 2008:132; Cant, Strydom, Jooste & du Plessis,
2006:206-208). The classification of B2B products is done on the basis of what
businesses are buying the product for, and the purpose for which they will be used
(Dwyer & Tanner, 2009:15).
Many trade shows are categorised, according to the classification of products that
are being exhibited at the show (Hanchett, 2007:1-2). A short description of each
of the different classifications will therefore be given (Cant et al., 2006:206-208;
Dwyer &Tanner, 2009:15; Lamb et al., 2015:489-490):
• Installation products are seen as major purchases; and they consist of
long-term investment items.
• Accessories are any moveable products that have a wide range of
applications in the business, and do not become part of the finished
product.
• Raw materials are untreated or agricultural products that are still in their
natural state.
• Manufactured materials consist of all the raw materials that have been
transformed before being used in the manufacturing process.
© University of Pretoria

51
• Components are products that need very little or no transformation before
they are used in the manufacturing of a product.
• Parts are installed directly in the product, in order to make the finished
product.
• Supplies comprise those operating products that do not become part of the
final offering; and they are used in maintenance and repairs.
• Business services comprise those maintenance and repair services
provided by outside providers. The services provided do not become part of
the final product.
In this study, all of the products will be looked at, with the exception of raw
materials. Due to the specialised nature of raw materials trade shows for these are
limited and they are not usually combined with other products or services
mentioned above and are therefore excluded for the purposes of this study. At
trade shows, exhibitors not only exhibit different types of products but they also
need to consider how they should price their products.
2.7.2 Pricing element in the B2B marketing mix
According to Indounas (2009:86-88), in B2B price strategies are important;
because they provide the direction when setting prices. Prices can be either
quantitative (be measured in terms of money or profits) or qualitative in nature
(relationship between customer and the business) depending on the business
objectives (Indounas & Avlonitis, 2011:27). The researcher established that there
is no literature that deals with price-setting at trade shows, or on how it influences
pricing strategies (Zimmerman & Blyth, 2013:232). For the completeness of the
study, pricing will, however, be discussed shortly.
2.7.2.1 Definition of Pricing Cant et al. (2006:323) define price as the value that one puts on the utility one
receives from products and services; whereas Dwyer and Tanner (2009:401)
define price as the amount of money paid by a buyer to a seller for a particular
product or service. Pricing in B2B has an economical impact on a business.
© University of Pretoria
52
Businesses might, for example, see trade shows as a way to access different
sellers, in order to get the most economical price.
According to Mèndez, Oubiña and Rubio (2006:402), price is a central marketing
factor; since price is present in all purchasing situations. Price represents the
lowest possible amount of financial cost; and it is the only changeable factor that
generates instant profits. A price has a different meaning and value for consumers
than it has for a business. Price is an exchange between benefits and sacrifices
(Hutt & Speh, 2007:367-371). Core benefits and add-on benefits contribute to the
value in business markets. Add-on benefits are the joint working relationships that
include supplier flexibility and commitment.
On the other hand, sacrifices in the business markets are a broad perspective.
Business buyers place the emphasis on the total cost in use; and they consider
three different types of costs, namely: acquisition costs, possession costs and
usage costs in pricing products.
Kotler, Keller, Ang, Leong and Tan (2009:422) mentioned that prices are not just a
number on a label or tag; but that throughout history, price have been set by
bargaining or via negotiations between the buyers and sellers. Cant et al.
(2006:321) agree with Kotler et al. (2009:422) that historically, prices have been
set by negotiations between buyers and sellers; and the bargaining process is still
important in determining the prices of industrial products in the B2B marketing
process. Trade shows, for example, can be used as a place where price negations
take place, or competitive talks start between the buyers and sellers.
In modern days, businesses set the prices of their products or services in different
ways. The price of a product contributes to the profits of a business; and it can be
established by an individual, or by a department, depending on the size of the
business. The risk estimates in B2B pricing, as perceived by management, would
inevitably influence their pricing strategy.
© University of Pretoria
53
2.7.2.2 Pricing strategies There are different pricing strategies that can be followed in B2B marketing. B2B
organisations frequently adopt dynamic price strategies; and there are factors that
play a role in dynamic pricing (Zimmerman & Blyth 2013:234). Lee, Illia and
Lawson-Body (2011:531-533) refer to the price fairness of dynamic pricing, as a
price strategy providing consumers or customers with different prices. Dynamic
pricing can be divided from a seller’s point of view into analytical and systematic
pricing. The analytical approach to pricing is based on the demand curve and
optimal inventory level; while systematic pricing is determined by expanding tools
for decisive improved pricing policies for sellers (Levin, McGill & Nediak, 2010:40-
44).
B2B organisations adopt policies that are influenced by factors, such as: the speed
price can be changed; that it is easier to gather and analyse customers’ data for
making price decisions; and that it is more convenient to segment customers to
provide custom pricing (Elmaghraby & Keskinocak, 2003:213-215). Trade shows
can, for example, be used as a place where sellers get an indication from a large
number of possible buyers on the pricing of their products.
2.7.3 Distribution in B2B marketing mix
Distribution in the marketing mix is part of the supply chain management. Supply
chain management focuses on the relationship perspective in business marketing,
when considering the chain of suppliers involved in the creation of a product (Hutt
& Speh, 2007:16). Cant et al. (2005:45) define a supply chain as … “all those
upstream linkages (sources of supply), the internal linkages inside the
organisation, and [the] downstream linkages (distribution and ultimate consumer)”.
Supply-chain management, therefore, is the integration of business processes
from the end-user through to the original suppliers to provide products, services
and information that adds value for the customers (Blyth, 2006:661). From the
definitions it is clear that supply chain management is a process where different
businesses work with one another to get products and services through the
distribution channels, from producer to final consumer (Widd, 2013:20).
© University of Pretoria

54
According to Blyth (2006:642), distribution is an important element of the
marketing mix. Distribution provides four utilities to a product, namely: place; time;
ownership and information (Zimmerman & Blyth, 2013:285). The main function of
B2B marketing channels is to shorten the gaps between the producers and the
users of products (Dwyer & Tanner, 2009:252). Trade shows, for example, can
help overcome a number of these gaps by bringing the buyer and the seller to a
central point. In B2B markets, the products would move between different
channels members to get to the final user of the product (Ellis, 2011:95). Within a
business-distribution channel, a number of tasks are performed that include:
contacting possible buyers; negotiating; contracting; transferring ownership;
communicating; financing; after-sales service; transportation; and storage (Hutt &
Speh, 2007:292).
In Figure 2.3, Cant et al. (2005:409) indicate that distribution channels for B2B
products can be either direct, indirect, two-link channels, or three-link channels. In
a direct channel, the manufacturers sell directly to the customer or user. With an
indirect channel, the manufacturer makes use of B2B distributors to sell products
across a wide geographical area. A two-link channel is used by small
manufacturers that do not have the necessary resources to develop their own
distribution network; and so they appoint agents to distribute their products and
provide after-sales services. In a three-link channel, small manufacturers make
use of agents to establish their products to B2B distributors. Trade shows can be a
very useful distribution method in the one-link channel, where the manufacture can
have direct contact with their customers. Trade show for example that focus on
retail products can be a place of where agents are used extensively as a link
between the manufacturer and the customers.
© University of Pretoria

55
Figure 2.3 Distribution channels for business products
Source: Adapted from Cant et al. (2006:410)
The approach of Hutt and Speh (2007:292-293) to distribution channels differs
from that of Cant et al. (2005:409), indicated in Figure 2.4 below. According to Hutt
and Speh (2007:292-294), distribution channels consist only of direct channels
and indirect channels. Direct channels have no intermediaries; and the
manufacturer deals directly with the customers through direct sales, online
marketing or telemarketing. The method of dealing directly with customers is
viable, when: customers are large in size and well-defined; and where the
customer prefers direct sales, and negotiations are needed. Trade shows can be
useful in direct channels; where there is direct selling to the buyers.
Indirect channels consist of at least one type of intermediary between the
manufacturer and the customer. Where markets are fragmented and widely
dispersed, low sales volumes are common; and buyers purchase a variety of
brands; and indirect channels is used. In indirect channels, the majority of sales
are done by either the manufacturer’s representative or by business distributors.
Manufacturer
Customer
Manufacturer
Customer Customer
Manufacturer
Agents
Direct channel Indirect channel Two-link channel Three-link channel
Manufacturer
B2B distributors
Agents
B2B distributors
Customers
© University of Pretoria

56
Figure 2.4 Structure of business marketing channels
Source: Adapted from Hutt and Speh (2007:293)
As indicated in Figure 2.3 and Figure 2.4, distribution channels consist of different
intermediaries and distributors. Distribution channels consist of both direct selling
and the use of different intermediaries and facilitators (Ellis, 2011:97-98). Each of
the channel members will now be briefly discussed.
According to Dwyer and Tanner (2009:255-260) and Ellis (2011:256),
wholesalers sell to other intermediaries; and they take little of the products.
Different types of wholesalers can be identified in B2B markets, depending on the
functions they perform. These consist of full-service and selective-service
wholesalers. Full-service wholesalers provide a wide variety of services to both
their suppliers and the customers. These would include: re-grouping products;
providing information; providing credit; selling; as well as storing and risk
management.
Selective service wholesalers comprise limited-function wholesalers, single-line
wholesalers, specialty wholesalers, cash-and-carry distributors, drop-shippers,
desk jobbers, truck jobbers and catalogue wholesalers. Each of the afore-
mentioned wholesalers takes on specific functions and specialises in specific
Manufacturer
Direct channels Indirect channels
Customer Segments
Direct
Online
Telemarketing Manufacturers
Industrial
Distributors
© University of Pretoria
57
aspects of the distribution of the products between the suppliers and the
customers.
Ellis (2011:98) indicates that retailers or dealers sell directly to the end-users,
usually business. Noad and Rogers (2008:1002) argue that there are numerous
products and business-customer types, which are appropriate for B2B retailing,
where the number of transactions is low; and the buyers want to try out a variety of
products.
In B2B distribution channels, the customer relationship must be managed;
because their customers spend large amounts of money in their purchases.
2.7.4 Customer relationship in B2B marketing B2B and B2C marketing are both part of the same marketing context
(Gummesson & Polese, 2009:337-343). Customer relationships in marketing are
direct in B2B markets and indirect in B2C markets, and far more personal in B2B
markets. Hansen (2009:227-234) points out that the buyer-supplier relationships
have changed over the years; and that businesses have changed from
information-sharing to integrated value chains that lead to specifying the value-
chain customer and the changing roles of sellers’ sales force.
Customer-relation management (CRM) can be used by marketers in B2B
marketing to secure co-operation in loyalty programs, and to increase customer
life-time value through quality relationships, perceived service quality,
commitment, trust, satisfaction and the willingness to remain committed, by
sharing information that could assist in building relationships and attitudinal loyalty
(Lacey & Morgan, 2009:3-5).
© University of Pretoria
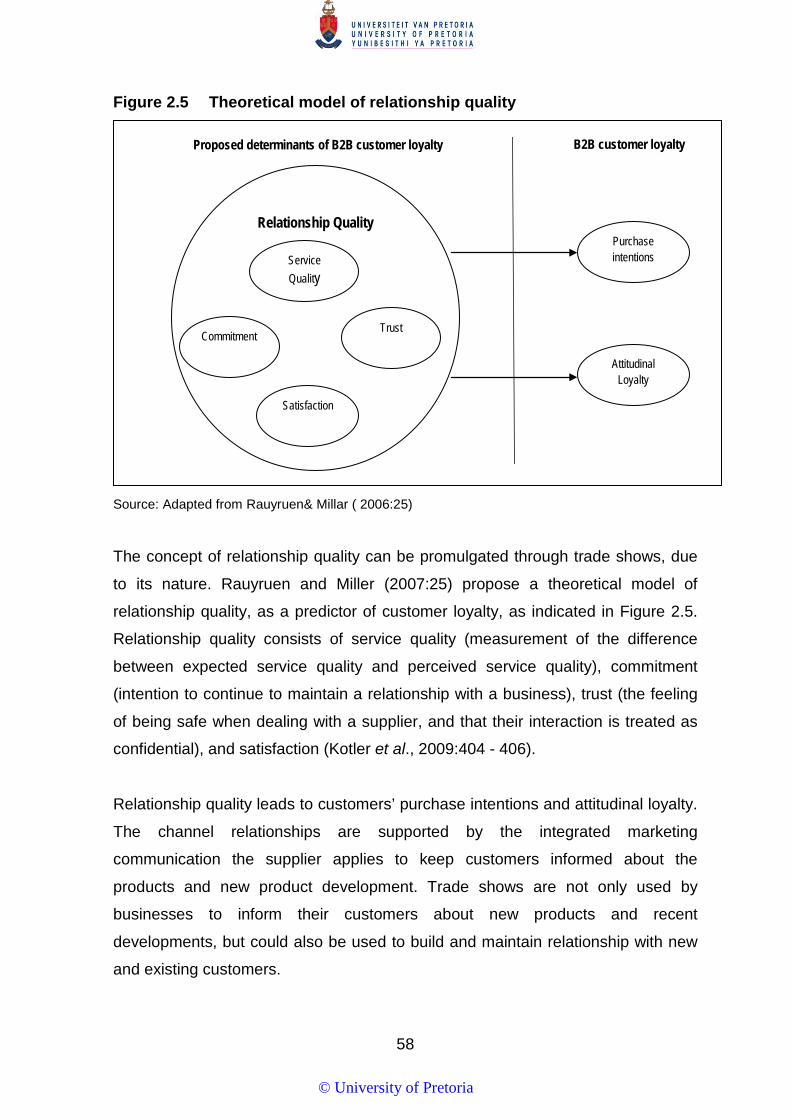
58
Figure 2.5 Theoretical model of relationship quality
Source: Adapted from Rauyruen& Millar ( 2006:25)
The concept of relationship quality can be promulgated through trade shows, due
to its nature. Rauyruen and Miller (2007:25) propose a theoretical model of
relationship quality, as a predictor of customer loyalty, as indicated in Figure 2.5.
Relationship quality consists of service quality (measurement of the difference
between expected service quality and perceived service quality), commitment
(intention to continue to maintain a relationship with a business), trust (the feeling
of being safe when dealing with a supplier, and that their interaction is treated as
confidential), and satisfaction (Kotler et al., 2009:404 - 406).
Relationship quality leads to customers’ purchase intentions and attitudinal loyalty.
The channel relationships are supported by the integrated marketing
communication the supplier applies to keep customers informed about the
products and new product development. Trade shows are not only used by
businesses to inform their customers about new products and recent
developments, but could also be used to build and maintain relationship with new
and existing customers.
Relationship Quality
Service Quality
Trust Commitment
Satisfaction
Attitudinal Loyalty
Purchase intentions
Proposed determinants of B2B customer loyalty B2B customer loyalty
© University of Pretoria

59
2.7.5 B2B integrated marketing communication mix
The communication process consists of three basic elements: firstly, the source of
the message; secondly, the message that provides the information; and lastly, the
receiver (Yeshin, 2006:57). According to Brennan et al. (2014:171-172), business
marketers send regular messages to their buyers, in order to achieve their
communication objectives. Marketing communication is the process of transferring
information and ideas, or the process of finding common ground between a sender
and a receiver (Belch & Belch, 2007:139).
The following elements can be identified for B2B integrated marketing
communication (IMC): advertising, direct marketing, public relations, the internet
and websites, trade shows, telemarketing and personal selling (Dwyer & Tanner,
2009:296-299; Ellis, 2011:301). Pride, Hughes and Kapoor (2012:432) indicate
that in B2B markets, the IMC mix used would be influenced by the type of product
being sold and the business target market.
IMC in B2B markets consist of a mixture of different methods and communication
instruments, both personal and impersonal, aimed at communicating with the
business buyer (Căescu & Dumitri, 2011:283). There is, however, the problem of
boundary-spanning; because some of the communication elements go beyond
communication into the distribution and product realms (Blyth, 2006:271-272). To
illustrate the interconnections, the elements can be seen as an arrangement of
marketing communication methods (as in Figure 2.6).
The communication message can be sent by applying different methods, as
illustrated in Figure 2.6, which then make up the IMC mix. Jensen (2008:203) is of
the opinion that the planning and selection of the IMC elements in B2B marketing
is determined by the audience of the message. Căescu and Dumitri (2011:283)
support the view of Jensen (2008:203); and they add that there must be interaction
and synergy between the IMC elements, in order to ensure a congruent
communication process.
© University of Pretoria

60
Figure 2.6 Interconnection between communication elements
Source: Adapted from Blythe (2006:273)
Advertising and sales promotions are seldom done alone in B2B marketing; but
they can be used with other communication elements, such as personal selling, or
trade shows (Hutt & Speh, 2007:292-294). For small businesses, personal selling
and trade shows are the only IMC elements available in many industries (Pitta et
al., 2006:158). Lichtenthal, Yadav and Donthu (2006:236) support this view; and
they add that although personal selling is the main means of communicating in
B2B markets, other non-personal communication methods play a unique role.
Trade shows, for example, are playing a bigger role; and they have become one of
the most important elements of the IMC – for buyers to gain purchasing
information on B2B markets (Pitta et al., 2006:159).
The discussion has addressed the communication elements of IMC in B2B
marketing communication. For the purpose of this study, only those elements
applicable to B2B marketing communication will be discussed.
Personal selling Advertising
Ambient ads
Press ads
TV ads
Outdoor ads
Radio ads
Transport advertising
Public Relations Sales promotion
Inside transport
Corporate identity
Outside transport
Internet marketing
Database marketing
Trade shows
Telemarketing
Telesales
Sales calls Press releases
© University of Pretoria
61
2.7.5.1 Advertising
Advertising is a paid form of communication used by businesses. The business
pay for different media (vide Figure 2.6) to transmit the communication message to
the target audience. It is used to inform prospective buyers about the product and
its benefits, in order to arouse awareness and evoke needs. Lamb et al.
(2015:339) define advertising as …“any form of paid communication, in which the
sponsor or firm is identified”. Semenik (2002:9-10) provides another definition, and
defines advertising as…“a paid, mass-media attempt to persuade”. Pride et al.
(2012:432) agree with Lamb et al. (2015:339) and Semenik (2002:9-10); and they
add that advertising is a form of non-personal communication. Advertising in B2B
markets is also non-personal; and it comprises a one-way communication between
a buyer and the seller (Dwyer & Tanner, 2009:296).
For the purpose of this study, B2B advertising will be defined as paid non-personal
one-way communication from an identifiable sponsor, in order to persuade
prospective buyers.
According to Ellis (2011:300) and Zimmerman and Blyth, (2013:211), advertising is
not as effective in B2B marketing as it is in B2C marketing, due the unemotional
and technical nature of business products. Zimmerman and Blyth, (2013:211-212)
point out that advertising plays different roles in B2B marketing, namely:
• To create a positive environment for personal selling.
• To research those inaccessible decision-makers that influence the buying
decision, and which the salesperson cannot contact.
• To reach those unknown influencers in the buying decision, of which the
salesperson is not aware.
• To generate leads, and to allow the salesperson to spend more time on live
prospects, and less on cold calling.
• To communicate with customers in between sales calls.
• To inform the channel intermediaries of new products, or to remind them of
the business and current products.
• To create and stimulate derived demand.
© University of Pretoria

62
• To develop a positive corporate image.
• To provide the most economical promotional mix.
B2B communication advertising adds two more functions, namely: creating
awareness for new products or brands and building brand image (Shimp, 2007:35-
36). Advertising is, however, not as important as personal selling in B2B marketing
(Hollensen, 2010:499). Marketing managers in B2B markets must be aware that
their marketing communication, such as advertising, may receive little attention
from the prospects (Jensen & Jepsen, 2007:347). The afore-mentioned aspects
emphasise the importance of selling and trade shows as B2B communication
elements.
B2B marketers mostly use advertising to advertise in trade, industry, or
professional publications (Dwyer & Tanner, 2009:296). Business publications used
in B2B advertising can be either horizontal or vertical (Hutt & Speh, 2007:400).
Horizontal publications are directed at a specific task, technology or function,
wherever the industry might be; whereas vertical publications are aimed at a
broader market and include every possible reader. Other media used by B2B
marketers are the Web, radio and billboards. Advertising in B2B marketing
provides support for the salesperson, by creating a favourable climate to make an
appointment to visit a prospect; and it creates awareness to strengthen the
business image.
B2B advertising is almost always used by organisations to promote trade shows,
in which they plan to exhibit. Businesses can also make use of publicity and public
relations; therefore, these issues will be discussed next.
2.7.5.2 Publicity and public relations
Dwyer and Tanner (2009:297) define public relations as “the management function
that focuses on the relationships and communication with individuals and groups,
in order to create mutual goodwill”. Publicity differs from public relations; and the
terms are not synonymous; but they are often used interchangeably, although they
have different meanings (Duncan, 2005:10). Publicity is described as “stories and
© University of Pretoria

63
brands mentioned and delivered by the mass media, without any payment”; while
public relations are “communication activities that help a business and its public
adapt mutually to each other, in order to gain the support and co-operation of the
public and the stakeholders” (Duncan, 2005:10).
Figure 2.7 Publicity, Public Relations and Press relations
Source: Adapted from Zimmerman & Blyth & Zimmerman (2013:276)
As indicated in Figure 2.7, public relations comprise the maintenance and the
creation of a favourable image of a business. Public relations can be used to
influence publicity and press relations. Publicity is the creations of news stories
about the business, such as new products being realised, event sponsorship, or
issue sponsorship. This is frequently done at and for trade shows. Press relations,
on the other hand, comprise the maintenance and creation of a favourable image
with the media.
In B2B markets, a business have a wide array of public-relation options available
(Ellis, 2011:303). Lamb et al. (2015:385) and Zimmerman and Blyth, (2013:278)
state that the public-relations methods that a business can use include:
• A press release is a story about a business that is designed to place them
in a good light, and keep the organisation in the public’s view. Businesses,
for example, would do a press release if they intend to be exhibiting at a
trade show.
• Product publicity is the introduction of new products that provide
information about the product’s features and benefits, and how more
Strategy Public relations; creating and maintaining a
favourable reputation with organisations publics
Tactics Press relations; creating and
maintaining a favourable image with news media
Tactics Publicity: Creating favourable
news stories about the organisation and its products and
activities
© University of Pretoria
64
information can be gained. Shimp (2007:580) noted that product releases
are regularly published in trade magazines that cater for specific industries.
A number of businesses make use of trade shows to introduce products. In
this study product publicity at trade shows will be investigated.
• Corporate communication can be used to provide an understanding of
the business via internal and external communication. Corporate
communication is aimed at improving the image of the business, and is not
just to sell products (Zimmerman & Blyth & Zimmerman, 2013:278).
• Publicity stunts are when a business stages an event with the aim to
create a news story.
• Lobbying is communication with government, legislators, or politicians, in
order to either promote or oppose regulations and legislation.
• Employee and investor relations comprise communication aimed at the
internal stakeholders of the business. Employee relations focus on the
establishment and maintenance of a system of communication with the
workforce of a business. Investor relations include the development or
collaboration in developing communication directed at investors, analysts,
stockbrokers and the financial media (Duncan 2005:562).
• Crisis management deals with setting and maintaining a response system
for when a disaster hits a business.
• Sponsorship can be done for an individual, event, cause or organisation.
Event sponsorship is one of the fastest-growing sponsorship methods;
since it provides an organisation with the opportunity to segment their
markets – in order to reach specific customers (Hollenson, 2010:504).
Businesses will co-sponsor a trade show as part of their publicity, such as
NEC that sponsored the 2014 IFSEC show. This includes sponsoring
events, hand-outs – such as bags and pens.
Public relations can use the internet as a medium to communicate with individuals
or groups, and thereby to create goodwill. Customers can obtain information by
visiting a website or a trade-show booth that gives them direct access to the
sellers (Dwyer & Tanner, 2009:296).
© University of Pretoria

65
2.7.5.3 Direct Marketing
O`Guinn, Allen and Semenik (2003:671) define direct marketing as… “an
interactive system of marketing, through which organisations use one or more of
the advertising media to communicate directly with target customers, [in order] to
generate a response or transaction”. Duncan (2005:573) defines direct marketing
as…“an interactive data-driven marketing communication process that uses a
range of media to motivate a response from customers and prospects”. In B2B,
the markets direct marketing role is to produce sales from current customers, and
to create leads, or actions, such as visiting a website or a trade show (Dwyer &
Tanner, 2009:296).
According to Blyth (2006:617-627), businesses can use the following marketing
tools, namely: direct mail, telemarketing, mobile marketing, direct-response
advertising and radio and catalogues.
According to Hollensen (2010:507), for direct mail to be effective in B2B a market,
an accurate customer profile needs to be prepared that includes: industry
classification, size of the target company, who to approach in each business,
industry-buying procedures and the purchasing motives. An advantage of direct
mail is that it is cheaper in comparison with other communication methods. Direct
mail supports the salesperson by providing leads; and it can be used to notify your
prospective clients about the distribution outlets. Business and exhibition
organisers make use of direct mail to inform customers about up-and-coming trade
shows (Hutt & Speh, 2007:402).
Telemarketing can be divided into “inbound telemarketing” and “outbound
telemarketing”. Inbound telemarketing is used when the customer calls to the
organisation, when responding to some marketing communication or advertising
effort (Cant et al., 2006:474). In B2B, inbound telemarketing is used to collect
orders, supply technical support, and to provide new product information to the
customers (Ellis, 2011:303). Outbound telemarketing occurs, when the business
initiates the call; and it is useful for the following activities: direct selling, supporting
© University of Pretoria
66
the sales force, generating and screening leads, and creating or updating the
marketing database (Blyth, 2006:621).
Telemarketing can be used in B2B marketing to inform possible attendees about
any up-and-coming trade shows.
Hollensen (2010:507) defines mobile marketing as … “the application of
marketing [techniques] to the mobile environment of smartphones, cellular phones,
personal digital assistants (PDAs) and telematics”. An element of mobile
marketing is short-message services (SMS) and the multimedia message system
(MMS), whereby customers receive text or multimedia messages about
organisations’ products (Cant et al., 2006:478; Blyth, 2006:623). A number of
exhibition organisers and exhibitors use mobile marketing to keep their customers
updated about future trade shows.
Direct-response advertising refers to advertising, where the product is offered;
and a direct response is solicited through one direct marketing tool, or more (Belch
& Belch, 2007:475). Direct-response advertising differs from normal advertising;
since it induces a direct response from the customer; it provides a channel for
response; and it is a strong call-to-action advertising (Blyth, 2006:624). Direct-
response radio is similar to direct-response advertising, except radio is used to get
a response from customers.
Business can send catalogues to customers in print, on compact discs (CDs),
videos and/or online formatting. Catalogues can be combined by direct marketers
with the internet, in order to be more effective (Kotler et al., 2009:604). A number
of businesses exhibiting at trade shows use electronic catalogues, such as DVDs
that are handed out to attendees as a promotional tool.
2.7.5.4 Internet marketing and social media
According to Belch and Belch (2007:489), B2B organisations see the internet as a
necessity, and not just as a ‘nice-to-have’ add-on. The internet forms an important
part of direct marketing in B2B; and it includes the company’s website and
© University of Pretoria

67
electronic mail (Ellis, 2011:303). Virtsonis and Harridge-March (2008:702) refer to
website communication elements in B2B that can be defined as … “any of the
components of a website that are used to convey meaning, information or
messages through them”.
Three website components can be identified: they are structural elements – web
page titles, paragraph headings, and hyperlink titles; technological elements – e-
mail links, discussion forums, scroll bars, images and video streaming; and
communication elements – corporate themes; atmospheric, aesthetic, graphic
imagery and multimedia, ergonomics, access and interaction, customisable
elements, links, community, marketing-communication integration, online
demonstration, online price quoting, online service delivery/integration platforms,
value-adding elements, and online-data collection.
These elements can serve as a checklist to help improve web performance as a
communication medium (Virtsonis & Harridge-March, 2008:707-708). Weitz and
Rosenthal (2010:63-64), however, found that there is no indication that if web
traffic increases it results in an increase in sales; and they conclude that B2B
customers only purchase when there is a contract at hand.
Electronic-mail (e-mail) marketing can be developed in four formats, depending on
the communication objectives of the organisation. Firstly, electronic-mail advertising includes plain text or rich media (e-mail that features audio and/or
video). Secondly, a discussion list that can include hundreds or thousands of
people and markets, to which marketing messages can be added at the bottom,
and sent out to selected markets. Thirdly, newsletters that are mass e-mails sent
on product-related topics, where customers can respond directly back to the
marketers. Lastly, publicity in which news releases can be distributed online to
people of interest regarding business announcements (Duncan, 2005:395-396).
Ellis (2011:308-309) notes that e-mail lists must be sent to the right persons in the
organisation, in order to not become “junk mail”. This is something that businesses
could make use of to promote their trade shows. However, they need to make sure
that the email gets to the correct person.
© University of Pretoria
68
The internet is a very useful instrument for disseminating sales-promotion
information to customers (Belch & Belch, 2007:498-499).
In the last few years the use of social media by business to connect directly with
their customers has grown and includes for example popular social media sites
such as: Facebook, YouTube, Twitter, Digg, MySpace, StumbleUpon, Delicious,
Scribd and Flickr (Neti, 2011:3). In a study by Brennan and Croft (2011:17) on the
use of social media in technological business markets they found that media such
as Facebook, Twitter and blogging is used to build relationships with customers by
business.
In business markets social media such as Facebook and twitter is used for;
networking and creating relationships with other businesses, increases brand
exposure; focusing more on relationships than sales, increases sales; interesting
content promotes interaction (Cox, 2012:30). Social media is viewed as of the best
ways to in creating and sustaining communication with an entirely new segment of
customers that the business is not selling to yet (Columbus, 2013:1). Social media
are also used by exhibitors at trade shows in B2B markets since it provide benefits
such as increased booth traffic, increased brand awareness, improved
relationships with clients, increased event attendance, additional press coverage,
and increased sales as a direct result of their social media campaigns (Han,
2014:242).
2.7.5.5 Trade-sales promotions
According to Shimp (2007:490) and Pride and Ferrel (2008:566), sales promotions
refer to any incentive applied by a producer to encourage or motivate the trade
(wholesalers, retailers or other channel members) to purchase a brand. And, they
encourage the sales force to sell it aggressively. Belch and Belch (2007:513)
define sales promotions as … “a directed inducement that offers an extra value or
incentive for the product to the sales force, distributors or the ultimate consumer,
with the primary objective of creating an immediate sale”. Sales promotions are
marketing or sales efforts that do not include advertising, personal selling and
public relations to stimulate sales (Gitman & McDaniel, 2009:333).
© University of Pretoria
69
Trade promotions have four main objectives, namely: obtaining initial distribution,
increasing the order size, encouraging co-operation with consumer-market sales
promotions, and increasing store traffic (O`Guinn et al., 2009:576). Other
objectives include balancing the demand for products, and responding to
competitors’ marketing efforts (Duncan, 2005:495). It is clear that trade sales
promotions have different functions; and that in order to achieve these, businesses
have to use different methods. The different methods for accomplishing trade-
sales promotions will be discussed next.
Incentives Dealer contest is used by manufacturers to motivate dealers and their sales staff
to reach a specific sales volume or percentage; and that contest is incentivised in
the form of gifts or prizes (Duncan, 2005:499). Incentives are given to
intermediaries for reaching a specific sales volume, or to encourage additional
attention to a manufacturer’s brand (Semenik, 2002:402).
Trade allowances According to O`Guinn et al. (2009:577), different types of allowances can be
offerred for the purpose of increasing the attention given to their brand. Pride and
Ferrel (2008:566) and Shimp (2010:462-464) identify different types of trade
allowances that can be used by businesses: buying or off-invoice allowances; buy-
back allowances; scan-back allowances; merchandise or bill-back allowances, and
slotting allowances.
Displays and point-of-purchase materials Shah and D`Souza (2009:592) state that manufacturers provide the reseller with
attractive point-of-purchase material that displays the business’s products. Point-
of-purchase displays are an essential part of manufacturer promotional tools for in-
store merchandising (Belch & Belch, 2007:550).
Co-operative advertising According to Shah and D`Souza (2009:592), co-operative advertising involves the
sharing of local advertising costs between the dealer and the company. In co-
operative advertising, the cost is shared by more than one party (Belch & Belch,
© University of Pretoria

70
2007:552). Cooperative advertising can be done in different media (newspapers,
magazines or local radio), where either one brand or more are advertised, and are
being sold by a reseller (Percy & Elliot, 2005:276).
Sales-training programmes Personnel at the resellers of manufacturers’ products require knowledge on the
features, advantages and benefits of these products – in order to provide
consumers with the information (Belch & Belch, 2007:551). The training of
intermediaries can be complex – due to the nature of certain products (Lamb et al.,
2015:390). Semenik (2002:402) supports the view of Lamb et al. (2015:390), and
adds that proper accurate information and persuasive themes must get to
consumers at the point-of-purchase.
Sales training can be done via training sessions, or by providing the sales staff
with product educational materials (Duncan, 2005:499). Trade shows can be a
possible place to train or educate sales personnel about business products.
2.7.5.6 Trade shows
A trade show is as an event that is held for a specific period of time at regular
intervals, where a number of organisations exhibit their products to one or more
industries – with the aim to inform and sell. Due to the absence of shopping malls,
as with consumer markets, trade shows can be used as a method to promote
products and services in business markets (Dwyer & Tanner, 2002:11).
Kirchgeorg et al. (2005:IX) define a trade show as … “a temporary market event,
where a large number of buyers (attendees) and sellers (exhibitors) interact, for
the purpose of purchasing displayed goods and services: either at the time of
presentation, or in the future”. Belch and Belch (2007:551) further support the
viewpoint of Kirchgeorg et al. (2005:IX) that trade shows have additional functions.
These include: demonstrating products, gathering information on competitors, and
customers, identifying new prospects, and acquiring sales.
© University of Pretoria
71
Trade shows serve as a marketing communication tool; and they offer the
advantage of personal interaction with the attendees (Dwyer & Tanner, 2009:298).
The interaction can be both verbal and non-verbal. Here, salespeople have the
opportunity to observe the non-verbal communication; while at the same time
listening to the verbal communication that can help to establish the needs of the
attendees. Trade shows bring prospective buyers into contact with salespeople;
and they offer the opportunity to the salespeople to demonstrate the product to the
attendees in a cost-effective way.
This emphasises the importance of the salesperson’s role at the trade show, both
as the representative of the exhibitor and the buyers (attendees) during the
tradeshow. Tradeshows will be discussed in detail in Chapter 3.
2.7.5.7 Personal Selling
Blythe (2006:546) states that personal selling differs from the other elements of
IMC; in that it offers a two-way communication; whereas the other elements only
offer one-way communication. Zimmerman and Blyth, (2013:227) argue that it
provides a personal touch and establishes a dialogue between the salesperson
and the prospect. Lamb et al. (2015:390) indicate that personal selling offers a
number of advantages over other elements of the communication mix, namely:
• Personal selling provides an opportunity for comprehensive explanation and
demonstration of the products.
• The communication message can be adapted to the specific needs or
interests of the prospect.
• Personal selling saves money and time; since the message can only be
directed towards genuine prospects.
• Cost can be controlled, by changing the size of the salesforce in individual
increments.
• Personal selling is more effective in achieving the sale, and obtaining
satisfied customers.
© University of Pretoria
72
Futtrel (2006:5) express the view that personal selling refers to … “the personal
communication of information to unselfishly persuade a prospective customer to
buy something – a good, a service, an idea, or something else – that satisfies the
individual’s needs. This implies that the salespeople must treat their customers
unselfishly and deliver an ethical service. It is important to treat the prospect and
customers unselfishly and to tell the truth about the product characteristics, price
and delivery time.
The type of selling used at trade show booths is creative selling, seeing that
tradeshows display a vast number of products. Creative selling needs technical
advice, information and service knowledge from the business salespeople
(Semenik, 2002:481-482). Personal selling is also important in B2B, due to higher
priced orders, complex products, and fewer buyers (Ellis, 2011:318).
The promotional mix is an important part of B2B marketing, as is also the building
of a relationship with customers via the sales process. The IMC mix ensures that
all the different stakeholders of a business are reached with a congruent message.
Trade shows and personal selling are both important elements of the IMC in B2B
markets; and they have to be integrated with the other elements, such as
advertising, direct marketing, public relations and sales promotions. From the
discussions, it is clear that personal selling plays a role within trade shows; and it
is viewed as an important element in B2B communication and will be discussed in
Chapter 3 and Chapter 4 in more detail.
The sales process and personal selling will be discussed in detail in Chapter 4 of
this study.
2.8 SUMMARY
In this chapter, there was firstly a distinction made between the characteristics of
business markets and consumer markets. Business markets differ; since the sales
volumes in business markets are greater; there are fewer buyers than in consumer
markets; these are usually geographically concentrated to specific areas; supplier-
customer relationships are closer; there are more direct channels of distribution;
© University of Pretoria

73
derived demand; inelastic demand; fluctuating demand; joint demand; trained
professional purchasing agents; and direct-marketing communication can be used
with a greater emphasis on personal selling at trade shows.
Secondly, B2B markets were categorised into three groups, namely; government
customers, institutional customers, and commercial enterprises (markets). This
was followed by a discussion on the influences on the business-buying process.
The stages in the business decision-making process, that comprise anticipation or
recognition of a problem or need; determination of the characteristics and quantity
of any needed item; product specification; supplier search; obtaining and analysis
of proposals; supplier selection; selection of order routine; and performance
review: these issues were all highlighted.
Thirdly, it was stated that three types of buying situations exist in B2B markets,
namely: new tasks; modified re-buy and straight re-buy. The buying decision in an
organisation is normally made by a buying centre; and each member in a
customer organisation plays a role in the decision-making process. These
members are known as purchase participants, or buying-centre members that
consist of initiators, buyers, users, influencers, deciders and gatekeepers.
In B2B marketing segmentation, targeting and positioning are both part of a single
process.
Fourthly, new product development was discussed. New product development in
business markets consists of a number of steps, namely: idea generation; idea
screening; business analysis and planning; product development; test marketing;
and product launching. B2B products can be classified into installation,
accessories, raw materials, manufactured materials, components, spare parts,
supplies and business services. The product in B2B marketing is more than just
the physical product; and it is more complex with different elements, such as
economic, legal, technical and personal interaction between the buyer and the
seller.
© University of Pretoria

74
Next, the different elements of the marketing mix were identified, namely: product,
price, distribution and communication. Each of the elements was briefly discussed,
with the emphasis on personal selling and trade shows. The elements of the
marketing communication integrate all the messages sent out to the stakeholders
– irrespective of the media used.
In this study, the integration of personal selling and trade shows are important
elements in the IMC; because personal selling is used to communicate with the
attendees at tradeshows.
Chapter 3 will focus on tradeshows and the different role-players. A discussion will
be presented on trade-show organisers and the impact they have on exhibitors.
The role of attendees will also be examined; since they have a direct impact on
how exhibitors exhibit and communicate with them. Lastly, the exhibitors and the
stages in tradeshows will be discussed. This will be done to provide a link between
the sales process and the tradeshows.
© University of Pretoria
75
CHAPTER 3
NATURE OF TRADE SHOWS
3.1 INTRODUCTION Trade shows are some of the oldest business-to-business marketing
communication tools that provide organisations with the opportunity to display and
exhibit their products and services to customers via face-to-face interaction
(Robbe, 2006:11-12). Organisations not only use trade shows to sell products and
services, but to gather information about competitors and build long-term
relationships with customers. For businesses to make a return on their investment
by exhibiting at trade shows; they must combine this with other marketing
communication elements, such as personal selling to maximise its effectiveness.
However, trade shows should not just be seen as another communication tool; but
they must have their own objectives – to ensure that they add value to sales and
the marketing outcomes of a business. Studies by Kirchgeorg et al. (2010a:68);
Whitfield and Webber (2011:446), Pitta et al. (2006:162); Johansson and
Bengtsson (2011:73), Alessandra et al. (2009:69) Goldblatt (2005:11),
Golpalakrishna et al. (2010:245) and Gottlieb et al, (2011:1642) have been
identified to have been done on trade shows in the last decade; these indicate that
in the future, trade shows will continue to be an integral part of the business-to-
business (B2B) IMC mix of organisations (Kirchgeorg, Jung & Klant, 2010b:309).
In South Africa, trade shows are an important platform for face-to-face business,
with revenues of as much as R2.6 billion in 2012; and these are predicted to reach
R4 billion in 2017 (Viviers, 2013:210).
Organisations take part in trade shows, in order to display their products to a
qualified target market; so that attendees can examine their products and services
for possible purchasing (Brennan, Canning & McDowell, 2014:188). A trade show,
however, can be more than just a selling tool; it can complement and/or expand on
other marketing communication mix methods (Kerin & Cron, 1987:87). The
© University of Pretoria

76
marketing functions of a trade show can, therefore, be divided into selling and non-
selling activities. Selling activities include aspects, such as prospecting, closing the
sale and following up on leads; while non-selling activities can include: building
goodwill with customers, public relations, market research, meeting new
intermediaries, introducing new products and improving staff morale (Blythe,
2001:627).
In this study, the focus will be on selling activities – although elements such as
setting objectives, planning and other of the non-selling activities will be
investigated if they relate, in any way, to the sales process.
Due the diverse nature of trade shows, they provide a number of advantages to
business. In the first place, trade shows provide businesses with an opportunity for
face-to-face interaction with active buyers in a central location; and, furthermore,
they support attendees in their purchasing decisions via the information supplied
by the exhibition staff. Secondly, the selling process is accelerated; and it speeds
up the identification of possible prospects. Trade shows also help businesses to
reach hard to-get-at decision-makers and influencers; since they are likely to
attend. Lastly, trade shows are frequently attended by qualified pre-selected leads
and other exhibitors at the show, who could be potential customers (Stevens,
2005:14-16). It is clear that trade shows play an important role in the dissemination
of information and in the selling process.
With a clear indication of the importance of trade shows in the selling activities and
in the B2B marketing mix of B2B markets, the assumption can be made that a lot
of research has been done in this field. Gottlieb et al, (2011:1642), Wilkinson and
Brouthers, (2006:238), Pitta, Weisgal and Lynagh (2006:160), however, state that
trade shows have not been researched much in the new millennium; although they
play an important role in B2B marketing. Their research, however, identified a
number of studies that have been done on trade shows in the beginning of this
century as indicated in Chapter 1. This could be an indication of a renewed
interest in trade shows by academia.
© University of Pretoria

77
The researcher of this study also found a limited number of new studies that have
been done on trade shows. Consequently, older studies will also be perused in
this study, in order to ensure the completeness of this chapter and thesis.
Figure 3.1 Layout of Chapter 3
Source: Own compilation
In Figure 3.1, the layout of Chapter 3 is provided. In this chapter, a number of
elements relating to trade shows will be discussed – starting with a very short
historical overview of trade shows – to provide an understanding of their role in
B2B marketing. Secondly, the concept of trade shows is defined, and a definition
for this study formulated. Thereafter, the different types of trade shows that can be
categorised and used will be briefly discussed. Once the various types of trade
shows have been discussed; it will be necessary to look at the main role-players,
which comprise exhibitors, attendees and trade show organisers. In the last
section of this chapter, the various stages of a trade show will be discussed by
way of Figure 3.3: examining in greater detail each stage, namely: the pre-show,
at-show, and post show activities. For the purpose of this study, the three stages
3.1 INTRODUCTION
3.2 HISTORICAL OVERVIEW OF TRADE SHOWS
3.3 DEFINITION OF TRADE SHOWS
3.4 TYPES OF TRADE SHOWS 3.4.1 Geographical scope
3.4.2 Scope of industry 3.4.3 Goods display
3.4.4 Other classification of trade shows
3.5 ROLE PLAYER IN TRADE SHOWS 3.5.1 Trade show organisers 3.5.2 Trade show attendees 3.5.3 Trade show exhibitors
3.6 STAGES OF TRADE SHOW 3.6.1 Pre-show activities 3.6.2 At-show activities
3.6.3 Post-show activities
3.7 SUMMARY
© University of Pretoria

78
are of vital importance due to their impact on the sales process (Ling-Yee,
2008:40).
As stated, trade shows are one of the oldest business-to-business marketing tools;
and therefore, a short historical overview will be given next.
3.2 HISTORICAL OVERVIEW OF TRADE SHOWS The first reference to trade shows in human history is in the Bible in the book of
Ezekiel (written in 588 BC before Christ), where reference is made to merchants
trading in silver, iron, tin and lead. By 247 Anno Domini (AD), trade shows were
already being held in France in the Champagne and Brue regions on a regular
basis, and the Frankfurt trade show in Germany; which has been going for over
600 years (Simons, 1955:186). However, the first official international industrial
exhibition only opened in the Crystal Palace, Hyde Park on the first of August 1851
(Robbe, 2006:11).
From Europe, trade shows started to spread across the world. The earliest trade
shows in the United States, for example, were nothing like today’s big events; and
before 1928, trade shows were held in hotel ballrooms, where sales people could
sell their goods. But in time, these venues became too small for the number of
participants (Robbe, 2006:11-12). In the following decades after the Second World
War, trade shows grew in number and size; and by 1955, 100 international trade
shows were being held on a global scale. An example of this growth is the Milan
international trade show of 1955 in Italy, which attracted 3585 exhibitors and four
million attendees from 109 countries (Simons, 1955:187).
Over the subsequent three decades, trade shows expanded to 8000 trade shows,
comprising 91 000 firms participating, and 31 million visitors in 1983 (Kerin & Cron,
1987:87); and by 1994, in North America alone, 1.3 million organisations exhibited
in the United States, and Canada. These were attended by 85 million business
people (Hansen, 2004: 1). Countries like Germany had 150 international trade
shows that attracted as many as 170 000 exhibitors, and were attend by between
nine and ten million visitors a year (Kirchgeorg, 2010a:63).
© University of Pretoria
79
In Germany, trade shows have become so important to their economy, that high
school students take part in simulated shows as part of their study syllabus (Otto,
1983:267-273). Trade shows were not only held in the Americas and Europe, but
also in the rest of the world, including South Africa.
Trade shows started in South Africa in 1966; and the first show was called
“Electra”; and it was arranged by an engineer from Wits University in 1966.
Thereafter, a number of other trade shows were held that included the “Crinkle
Paper Show” and the “Business equipment Show” in 1967. By 1968, the first
exhibition organisers were established in Cape Town (EXSA, 2012:24-25).
According to van Eyk (2008:10), the average trade show in South Africa attracts 7
500 visitors and the economic impact per visitor is R546.64. In South Africa, the
estimated total spending directly on trade shows was around R2,96 billion in 2006,
according to a study by the Exhibition and Events Association of South Africa
(EXSA).
South Africa has approximately 180 000 m2 of indoor exhibition space; and it will
be the third fastest-growing country as regards trade shows, according to the
Compound Annual Growth Rate percentage and revenue by 2017 (Viviers,
2013:217). It is therefore, clear that trade shows play an important role in the
South African economy; and that they are a growing B2B marketing tool.
With the above in mind, it is important to understand the concept of trade show.
Therefore, the different definitions of trade shows will be discussed; and a
definition that will be used for the purpose of this study will be provided.
3.3 DEFINITION OF TRADE SHOWS
A number of different definitions of trade shows exist – with many similarities in
regard to the viewpoints held on: the time period of a show; what is to be
displayed; and who participates. Trade shows are seen as a way for organisations
to meet a large number of potential suppliers and customers in a cost-effective
manner (Ling-Yee, 2008:35). They can, therefore, be seen as places that provide
© University of Pretoria

80
opportunities for businesses to interact with their customers. Trade shows are
periodic events, at which producers, suppliers and distributors in a particular
industry or associated industries come together to build relationships by
exchanging information or knowledge and to increase sales, in order to enhance
mutual adoption, and relationship value (Geigenmüller, 2010:285, Bathelt, 2014:5).
More simply put, trade shows are events that bring sellers and buyers together to
view and/or sell offerings from specific industries, and to build mutually beneficial
relationships (Berridge, 2007:12).
Another aspect of trade shows is that they comprise an exposition in which
retailers can connect with wholesalers or suppliers, in order to introduce offerings
that they want to sell (Goldblatt, 2005:11). Trade shows can, therefore, be viewed
as temporary shopping centres; where potential buyers meet prospective sellers,
with most of the attendees having plans to buy or influence the future buying
decisions for particular products (Brennan et al., 2014:189). Yet another view of
trade shows is that they are a conference, convention or gathering arranged and
managed by a company or organisation that brings multiple sellers and buyers
together – where sellers can display their products in some type of exhibition hall
(Stevens, 2005:5; Belch & Belch, 2001:413).
In a definition provided by Duncan (2005:611), the emphasis is placed on training
sessions at trade shows. According to Duncan (2005:611) and Søilen (2013:2-5);
trade shows are events, where customers in a particular industry gather to attend
training sessions and to meet with suppliers and vendors – in order to review their
product offerings and innovations. An example is the medical industry; where trade
shows are seen as educational tools with well-known medical experts giving
seminars at the shows for the attendees.
A number of authors who have defined trade shows place the emphasis on the
time-frame, pointing out that trade shows are a one-of-a kind situation; where
exhibitors and attendees can collaborate in a limited time and space, and in a
unique manner (Reychav, 2011:230). As Weitz, Catleberry and Tanner (2007:180)
state, trade shows are “… short, usually less than a week, temporary exhibitions of
products by manufactures and resellers”. A similar definition provided by Shimp
© University of Pretoria
81
(2003:514) defines a trade show as “a temporary forum for [the] sellers of a
product category to exhibit and demonstrate their products or services to present
and prospective customers.
Kirchgeorg et al. (2010a:63) state that the Global Association of the Exhibition
Industry (UFI) defines a trade show as..."market events of a specific duration, held
at intervals, at which a large number of companies present the main product range
of one or more industry sectors, and mainly sell on the basis of samples”. From
these three definitions, it can be postulated that the time-frame is a vital
component in the definition of a trade show.
In synopsis, from the definitions, it may be concluded that trade shows provide an
opportunity for B2B organisations to communicate with their customers or
prospects in a central location within a specific time-frame to inform or sell in
related or diverse industries. For the purpose of this study, trade shows can,
therefore, be defined as events that last for a specific period of time, in which
businesses from either similar of different industries exhibit, with the purpose of
communicating with their customers to either sell and/or build relationships by
demonstrating and displaying their products and services in a central location.
As indicated in the definition, similar or different industries and products are
exhibited at trade shows, such as ElectraMining that focuses on mining products,
IFSEC that focuses on safety and security, or OSH that exhibits health and safety
products. Different types of trade shows focus on different industries, regions or
type of exhibitors. Consequently, these varieties will be discussed next.
3.4 TYPES OF TRADE SHOWS With the definitions in mind, it must be noted that trade shows are becoming more
important to both sellers and buyers – due to the unique characteristics they
provide for interaction between the two parties (Godar & O`Connor, 2001:77).
There is an increase in the number of trade shows that are held each year; and
with this abundance, it makes it difficult for exhibitors and participants, to decide in
which shows to participate, or which to attend (Berne & García-Uceda, 2008:565).
© University of Pretoria
82
Viviers (2013:210) states that trade shows are predicted to grow to R4 billion in
2017 from R2.6 in 2012 in South Africa. In South Africa, this hold true with
businesses like the Bearing Man Group, for example, taking part in mining,
packaging, agriculture, industrial and holding their own trade shows based on the
range of products that they sell. While the opposite is true for some businesses,
such as medical companies that specialise in disability products to exhibit at one
trade show, such as the ACSA Disability Expo and Conference.
To improve trade shows, they are categorised for four reasons (Kirchgeorg,
2005:47). Firstly, this assists in the grouping of trade shows into similar categories.
Secondly, it provides data on the different types of trade shows; so that the
industry can compare the statistical data between shows. Thirdly, they are
important, so that governing bodies and associations can take action against
unfair practices in the trade-show industry. In South Africa, for example, such
classification could help EXSA to see that all their members comply with their
policies and guidelines for good practices. Lastly, trade-show organisers can set
up guidelines for dealing with specific types of show.
The categories are, therefore, a useful tool for the trade show industry, in order to
manage shows and to improve their effectiveness.
By matching the supply market with the target audience, trade shows can show off
the expertise of a specific industry sector (Brennan et al., 2014:189). The afore-
mentioned statement indicates that trade shows can be either regional in a
country, or for a specific type of industry. Trade shows, however, are not only
classified, according to regional offerings or industries; and they can be classified
in different ways as indicated below (Kirchgeorg, 2005:48-49). In this study, the
researcher will classify trade shows, according to their geographical scope, the
type of industry, type of goods displayed and other methods of classification.
3.4.1 Geographical scope Geographical scope refers to the region that is covered by a trade show. Three
types of geographical trade shows can be identified: international, national and
© University of Pretoria
83
regional. In this study, the researcher will determine the geographical scope of the
trade show.
International trade shows can be defined as “shows that draw at least 10% of
the total number of exhibitors, or at least 5% of the total number of visitors from
abroad” (Global Association of the Exhibition Industry, 2012). International trade
shows typically also last longer than other trade shows; and this provides
exhibiting organisations with the opportunity to meet buyers directly, to investigate
the markets and products, to observe their competitors; and they are a way to
gather marketing research data (Robbe, 2000:14-15; O’Hara, Palumbo & Herbig,
1993:234).
Furthermore, international trade shows can be used to establish relationships with
agents, distributors, and suppliers from different countries (Cateora & Graham,
1999:394). International trades shows are also used to generate sales, to provide
sales leads, to build staff morale, to test new product ideas, and to maintain or
enhance customer morale (Gibson, 2011:11). In South Africa, there are a number
of international trade shows, such as ElectraMining that attracts both exhibitors
and attendees from across the world. Not all trade shows, however, are
international; since many takes place locally inside a country.
A national trade show is a trade show that is not international; and the visitors
attending the trade show are only from one country or from the surrounding areas
extending beyond a given region. In many cases, trade shows only focus on one
country. An example of this is the SA Cheese Festival that attracts South African
cheese producers and distributors.
Regional trade shows visitors come from a specific area or country. Dwyer and
Tanner (2009:329) state that regional trade shows are held at various locations
around a country; and they can attract regional exhibitors and attendees. Regional
trade shows are smaller than other shows, and smaller in size. An example of this
is Decorex Durban or Decorex Cape Town that is held in different cities in South
Africa, or the Sign Africa Cape Town Regional Expo that only focuses on one
region.
© University of Pretoria

84
3.4.2 The scope of the industry The scope of the industry refers to those who are the targeted exhibitors and
attendees for a specific show. Four types of trade shows can be identified:
General trade shows have exhibits that consist of all aspects of life; and they are
aimed at the broad consumer market and public. Gosztonyi (1997:9) states that
general trade shows consist of a combination of industrial and consumer products;
and in many cases they focus on agricultural goods. An example of this is the
NAMPO trade show that focuses on the agricultural market, and attracts both
trade and consumers due to the products that are exhibited there.
With specialised trade shows, or vertical trade shows, the attention is on a
specific theme (Robbe, 2000:14); and the focus is on a single or associated
industry segment, and is by invitation only in the majority of cases (Hanchett,
2007:1-2). Vertical trade shows attract visitors from different levels in the same
industry; and they provide exhibitors with better prospects – due to the narrow
industrial base of the attendees (Dwyer & Tanner, 2009:330; Shoham, 1992:337).
An example of this is the annual packing trade show, Propak, in South Africa,
which only focuses on that specific industry.
Multi-industry trade shows or horizontal trade shows exhibit products and
services from more than one industry sector. This makes them more appealing to
exhibitors, and attendees (Robbe, 2000:14; Hanchett, 2007:1-2). Horizontal trade
shows are also more likely to occur if attendees have lower selling/buying
tendencies, and/or a wider breadth of product interests, or if the industry is more
inventive in terms of technological developments (Wu, Lilien & Dasgupta, 2008:
416). An example of this is the Cape Town industrial trade show that attracts
different exhibitors. This show displays a multitude of different products from
heavy machinery to general supplies, such as hand-held tools.
Corporate trade shows exhibit offerings from only one manufacturer, one
wholesaler, or one purchasing group (Kirchgeorg, 2005:48-49). The Bearing Man
© University of Pretoria
85
Group, for example, has a trade show at their warehouse, where all the different
product lines that they sell are exhibited.
3.4.3 Goods displayed In B2B markets, different goods exist, depending on the purpose for which they
are to be used. Three types of trade shows can be classified, according to the
goods displayed: capital trade shows, consumer trade shows, or a mix that
includes both.
Trade shows for capital goods exhibit equipment and related services that are
required in the manufacturing industry. Exhibitors are usually manufacturers or
distributors of business offerings. The attendees are mostly end-users in the
relevant industrial segment (Kirchgeorg, 2005:48-49). In this study, the researcher
will focus on Afrimold that sells moulding machines to a number of different
manufactures. These are used in their production processes.
Trade shows for consumer goods exhibit offerings aimed for the broad
consumer market and public. The exhibitors are mostly retailers or manufacturers.
One of the main problems experienced by retailers that exhibit at trade shows is at
which to exhibit, because of the large number of such shows each year (Molofsky,
2003:4). Attendees at these trade shows are also mostly end-users. An example
of this is Hostex, which exhibits products for the hospitality and catering industry,
such as guest houses.
Mixed trade shows (Consolidated shows) are a combination of trade shows for
capital goods and consumer goods. These trade shows are aimed at both the end-
consumer market and business-to-business market. Robbe (2000:14) states that
at a mixed trade show, the time allowed to the general public on the exhibition
floor is restricted; and that the business attendees are not present at the exhibition
floor at the same time. A South African example of this is Markex, where the trade
show is divided; and one section of the show is only open to consumer attendees
for a short period of time on the last day of the exhibits; while both sections are
open to business customers.
© University of Pretoria

86
3.4.4 Other classifications of trade shows Three other classifications of trade shows can be used, namely: importance,
principal sales direction and trade-show medium. In this study, the afore-
mentioned types of classification were not used by the researcher; and they will
therefore only be discussed briefly. This types of trade shows was not used due to
the classifications methods used in South Africa.
The importance of a trade show as a classification method can be divided into
two types of trade shows: premier and secondary (Kirchgeorg, 2005:50). The most
important international trade shows in a specific industry segment or multi-industry
segments are known as premier trade shows; while secondary trade shows can
co-exist together with a premier trade show and focus on a national or regional
market.
The principal sales direction of a trade shows depends on whether the show
focuses on exporting or importing (Kirchgeorg, 2005:52). The main aim of export
trade shows is to start import and export relationships, and to deal with exhibitors
and attendees. Wilkinson and Brouthers (2006:246) maintain that organisations
participating in export trade shows that are sponsored by governments are likely to
have positive outcomes.
The last type of classification of trade shows is dependent on the medium used. These comprise traditional and virtual-trade shows. Traditional trade shows are
held at a particular exhibition ground that includes halls and outdoor areas. The
attendees and exhibitors have to attend in person. Virtual-trade shows are those
where the offerings are displayed online and permanently. With virtual-trade
shows, the attendees visit virtual exhibition halls; and they stand to gain
information on an exhibitor’s profile, product offerings, and interaction. This takes
place in a multimedia environment (Geigenmüller, 2010:286).
Communication between the exhibitors and the attendees occurs in chat rooms, or
video conferences, and/or online diaries or blogs. Lee-Kelly, Gilbert and Al-
Shehabi (2004:641), however, point out that many industries do not feel that
© University of Pretoria
87
virtual-trade shows would work for them’ since there is no face-to-face contact that
makes such trade shows relevant. This study will focus on traditional trade shows;
and it does not include virtual-trade shows; since the focus of the study is on the
selling process.
With each of the types of trade shows discussed, the role-players in these shows
need to be identified.
3.5 ROLE-PLAYERS AT TRADE SHOWS Trade shows consist of a number of different role-players, namely: exhibitors that
exhibit their products, attendees who visit the trade show to obtain product
information, and the trade-show organisers who arrange the show. Exhibitors and
attendees will be discussed at the hand of Figure 3.2 in the introduction of this
section – to provide a better understanding of the tactics and strategies of each.
Thereafter, exhibitors will be discussed, and in more detail, at the hand of Figure
3.3 in Section 3.6 of this chapter; since they are the main focus of this study.
According to Gosztonyi (1997:110-111), trade shows have become one of the
most essential methods whereby organisations can reach global markets and
break down spatial barriers between geographically separated firms. Through
trade shows, the attendees have the opportunity to experience geographical and
culturally distant markets in a central location (Rinallo & Golfetto, 2006:865), while
providing business with the opportunity to compete and succeed in the fast-
growing global business market (Seringhaus & Rosson, 1998:398). It is, therefore,
clear that trade shows are not a one-dimensional marketing tool; but they are
multidimensional in their application in marketing (Tafesse & Korneliussen,
2011:47).
For example, there is the ElectraMining trade show held in South Africa every two
years that attracts exhibitors and attendees from across the world to
Johannesburg – to see what the newest developments are in the mining industry.
The ElectraMining trade show is, therefore, used by organisations in the mining
© University of Pretoria
88
industry as a marketing tool to make direct contact with both local and international
attendees in one central location.
Trade shows are an ideal way for new business relationships to start, for current
relationships to grow, and for the obtainment of new information that would
positively influence organisations (Bettis-Outland, Johnston & Wilson, 2012:390).
Therefore, in the future, trade shows will continue to play an integral part for
personal contact between decision-makers, organisations and customers
(Kirchgeorg et al., 2010b:310); and they will do this by providing people with more
compelling experiences, and better human connections than those to be found in
other marketing situations (Genoist, 2007:14). At trade shows, the attendees get a
chance to socialise with their suppliers, to build relationships, and to exchange
information with those businesses that exhibit (Reychav, 2009:155; Ling-Yee
,2006:173).
It is clear that trade shows impact the business relationships of both exhibitors and
attendees.
From Figure 3.2, it is clear that the strategies and tactics of exhibitors and
attendees differ when attending trade shows. The three main strategies of
exhibitors are those of selling, inbound communication, and outbound
communication. Selling, as indicated in Figure 3.2, is not just getting orders and
generating sales; but it includes making contact with possible customers. For
example, the exhibitor’s salespeople might not sell at a trade show; but they can
get leads or establish future prospects for their companies.
Outbound communications deal in providing the attendee with information on the
product, or simply making them aware that the product is available. Part of the
outbound communication is to improve on the overall image of the exhibiting
business.
© University of Pretoria

89
Figure 3.2 Exhibitors’ and attendees’ strategies and tactics
Source: Adapted from Zimmerman & Blythe (2013:258) and Blythe (2010:60)
Inbound communication tactics for exhibitors, as indicated in Figure 3.2, include
meeting current customers, doing prospecting, and observing their competitors.
Trade shows have a number of benefits for exhibitors. These include seeing what
competitors are doing, observing the newest trends, observing the research
customers, doing promotions and selling (Burgess & Bothma, 2007:349); and all of
these can improve an organisation’s innovativeness through their interaction with
the customers (Gosztonyi, 1997:111).
Figure 3.2 further indicates that attendees have three strategies, when attending a
trade show (Blythe, 2010:60). Firstly, trade shows are seen as a source of supply,
in which orders can be placed, brochures gathered, and appointments made with
possible suppliers. Secondly, trade shows are viewed as a place to obtain
information, where the attendees can gather brochures on different products and
EXHIBITORS ATTENDEES
Strategy Tactics Tactics Strategy
Selling
Communicating
(outbound)
Communicating
(inbound)
Entertainment
Information sources
Source of
supply Take orders
Generate sales
Make useful contacts
Image enhancing
Establishing a product / company presence
Product information
Place orders
Meeting existing customers
Identifying new customers
Observing the new competition
Make appointments
Gather brochures
Unsought information
Sought information
Gather brochures
Gather brochures
Gather free gifts
Analyse offers
Demonstrations
Displays
© University of Pretoria

90
analyse the different offers of the exhibitors. Trade shows are frequently seen as
effective information sources by attendees; since the exhibition stands are
frequently staffed by experts in specific product lines (Joseph, 2004:78). At trade
shows, like IFSEC for example, security companies have their staff that install and
maintain the products at their exhibit stands – to provide the attendees with
technical information. Lastly, trade shows are a form of entertainment for
attendees, where free gifts can be obtained, brochures obtained, and
demonstrations, as well as displays viewed.
With all the strategies associated with the attendees; they need to plan their visits
(Tӓger & Penzkofer, 2005:131); and they would have to select which trade shows
to attend with their available resources (Smith, Hama & Smith, 2003:415).
Exhibitors’ and attendees’ perspective of trade shows can be either that of selling
and/or non-selling motives (Hansen, 1996:47). For selling activities, the most
important motive for exhibitors is that of enhancing and maintaining the company’s
profile. In Europe, however, many trade shows attract high-level decision-makers
who are there to make a purchase, and not merely to gather information about
products (Cateora & Graham, 1999:394). In this study, it will be established
through gathering the data from the exhibit staff, whether in South Africa attendees
make purchases at trade shows.
The non-selling motives for exhibitors include the introduction of new products,
and to get information on new products (Hansen, 1996:47). In this study, it will be
investigated whether exhibitors use trade shows to introduce new products, or not.
To facilitate the afore-mentioned interaction between exhibitors and attendees,
trade show organisers need to arrange the shows properly. According to Fayos-
Solá, Marin and Meffert (1994:14), trade-show organisers should not just see
themselves as sellers of floor space to exhibitors; but rather as a service business,
aimed at enhancing competitiveness by becoming information brokers who assist
in interaction and networking between the exhibitors and the attendees
(Kirchgeorg et al., 2010b:302; Robbe, 2000:22). The organisers of trade shows
© University of Pretoria

91
are not just there to attract new exhibitors, but also professional attendees and the
general public, depending on the type of trade show (Munuera & Ruiz, 1999:18).
3.5.1 Trade-show organisers According to Kirchgeorg et al. (2010b:310), future success for trade show
organisers would depend on their ability to set industry-relevant trade shows; and
this is best done by carefully selecting the type of shows for each specific industry
(Wu et al., 2008:417). Trade-show organisers must also select the most
appropriate exhibitors and distributors for their show (Rinallo et al., 2010:253); and
they should ensure that highly motivated and qualified attendees visit the show
(Robbe, 2000:42); and this can best be done by doing an evaluation on the
reasons for attendance to bring the objectives of both exhibitors and the attendees
in-line (Lee et al., 2010:205). The afore-mentioned statement is due to the selling
objectives that exhibitors set compared with the information-seeking objectives of
the attendees (Blythe, 1999:106).
Organisers can attract attendees by designing their experience of the trade show
at the macro-level, by creating the right atmosphere, by making compelling
exhibition areas, and having the right type of exhibitors present (Borghini et al.,
2006:1157; Tafesse, 2013:1021). Trade-show organisers must take note that
attendees find elements, such as the hotel quality, the meeting facilities,
destination, exhibition image, venue image, price of parking, food services,
directional signals and seating are all important factors in any decision to attend a
show (Breiter & Milman, 2006:1369-1370, Lu & Cai, 2009:6; DiPietro et al.,
2008:273; Zhang, Qu & Ma, 2010:108).
As with attendees, the trade-show organisers need to do marketing and build
relationships with the exhibitors. There are four factors, on which trade-show
organisers can focus to increase the satisfaction of exhibitors, and get them to
return to a show. Firstly, the nature of the exhibition that includes the promotion
mix, the communication atmosphere, the quantity of buyers, the quality of buyers,
trading opportunities, transaction volume, and the number of sales leads that were
established (Kang, 2007:54-56).
© University of Pretoria
92
Secondly, onsite services that include onsite order and security, consistency of
service, and the expertise, attitude and efficiency of the trade-show organisers’
personnel. Thirdly, the conditions of the venue comprising: the layout, equipment,
ventilation, lighting, neatness, aisles set-up and the signage in the venue. The last
factor is that of all the ancillary services consisting of traffic, accommodation,
shopping, recreation facilities and services, dinners and social nights that provide
emotional value (Gu et al., 2010:3028; Kang, 2007: 54-54).
The role of the trade-show organisers is to build relationships with their customers,
with the exhibitors, and to attract the right type, and number of attendees to the
right type of shows by using the newest technology. Today’s trade-show
organisers make use of sales management software to increase their efficiency;
since they need to establish the marketing needs of the exhibitors and to build
more in-depth relationships with them, as well as the markets to which they sell
(McCall, 2004:18). Another reason why technology is used by the organisers is to
save costs, and to be more effective in delivering service to the exhibitors
(Gregory & Breiter, 2001:75). An example of this is using websites to do the
registration of the attendees and the exhibitors in trade shows (Gregory & Breiter,
2001:74).
Trade-show organisers, such as Specialised Exhibitions, for example, promote
trade shows like IFSEC or ElectraMining through their website, and provide them
with the opportunity to book an exhibit stand, or to provide possible lists of
attendees who can be invited to the show. Through the use of websites, planned
visits can also increase; since the attendees can see who is exhibiting at a trade
show (Johansson & Bengtsson, 2011:74).
As indicated, trade show organisers assist the exhibitors to attract the best
possible attendees by helping them in their promotional activities. The organisers
of trade shows must make use of the different types of marketing strategies to
attract attendees (Chizzoli, Pace & Rinallo, 2007:9). One option available to
organisers of trade shows is to provide attendees lists to exhibitors to assist them
in their promotional activities (Robbe, 2000:44; Hanlon, 1982:193). Trade-show
organisers can also get permission from previous attendees to include their
© University of Pretoria
93
companies in the brochures and documents used for future marketing purposes, in
order to attract other visitors to the show (Lin, 2010:3932).
Once the attendees are at the trade show, the promotional support must continue
– by conducting at-show promotions and advertising (Robbe, 2000:43). At-show
promotions and advertising include things, such as: programs of events, talks,
entertainment, guides, floor plans, list of exhibitors and trade magazines. An
example is the promotional bags that are given out at the gates of a trade show,
which contain all the relevant brochures, such as floor plans and an exhibitors’ list.
With this, the attendees would then know where everything is at the trade show.
Next, the attendees who attend the trade shows and visit the exhibit stands will be
discussed.
3.5.2 Trade-show attendees Trade shows are generally not open to the public; and they consist of attendees
and members of the press. In this study, trade-show attendees are company
representatives attending the trade show; and, as indicated in Chapter 2, they
focus on business-to-business marketing, and selling. The reasons for attendees
attending a trade shows differ from those that visit consumer exhibitions. In Table
3.1, the different authors’ reasons on why attendees attend trade shows are
presented.
As indicated in Table 3.1, many attendees attend trade shows to gather
information, which can take place both formally and informally. Formal information
can, for example, be obtained at exhibitor’s exhibition stands, through
demonstrations, press reviews, and talks. While informal information can be
obtained, for example, by talking to the exhibitors at lunches or dinner discussions
(Bettis-Outland et al., 2010:269). This is not just true for individual attendees, but
also for groups of buyers, as Borghini et al. (2006:1154) state. They also maintain
that buying centres (vide. Section 2.5.4) should be called learning centres for trade
shows; since they are there to gather information, and are not really interested in
making purchases. Buying centres are, however, important at trade shows; since
the majority of trade show attendees are consistent buying-centre members (Bello
© University of Pretoria
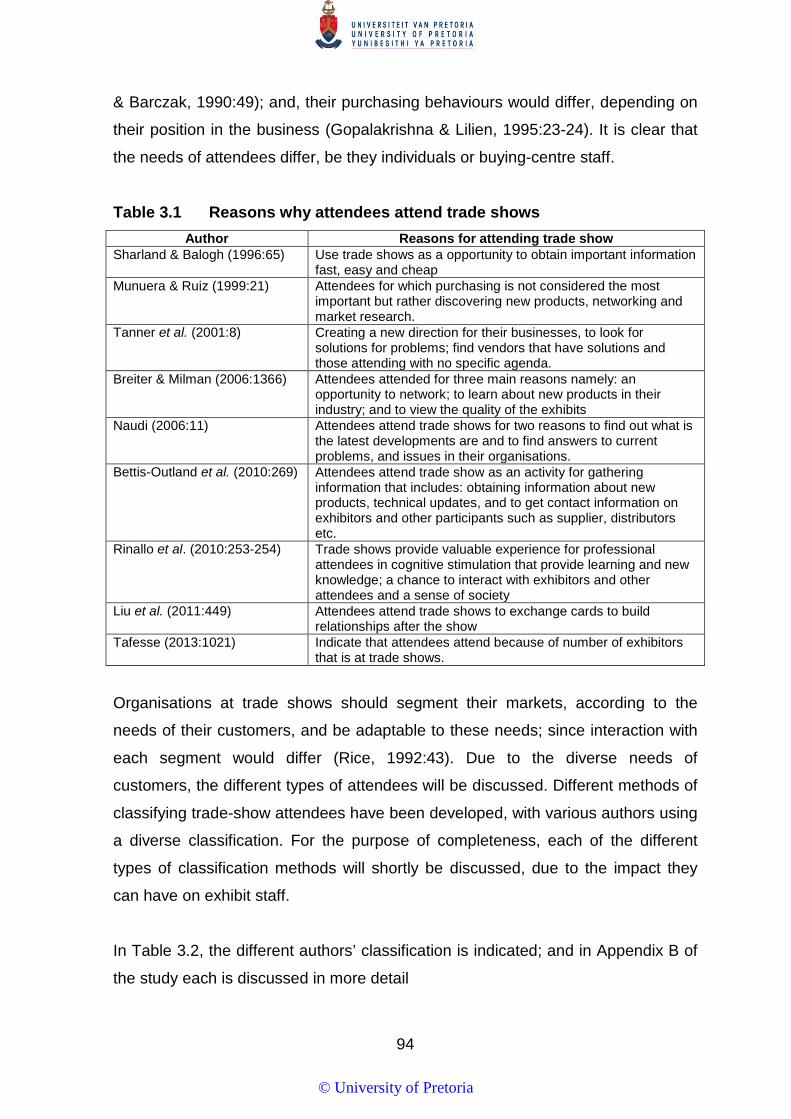
94
& Barczak, 1990:49); and, their purchasing behaviours would differ, depending on
their position in the business (Gopalakrishna & Lilien, 1995:23-24). It is clear that
the needs of attendees differ, be they individuals or buying-centre staff.
Table 3.1 Reasons why attendees attend trade shows Author Reasons for attending trade show
Sharland & Balogh (1996:65) Use trade shows as a opportunity to obtain important information fast, easy and cheap
Munuera & Ruiz (1999:21) Attendees for which purchasing is not considered the most important but rather discovering new products, networking and market research.
Tanner et al. (2001:8) Creating a new direction for their businesses, to look for solutions for problems; find vendors that have solutions and those attending with no specific agenda.
Breiter & Milman (2006:1366) Attendees attended for three main reasons namely: an opportunity to network; to learn about new products in their industry; and to view the quality of the exhibits
Naudi (2006:11) Attendees attend trade shows for two reasons to find out what is the latest developments are and to find answers to current problems, and issues in their organisations.
Bettis-Outland et al. (2010:269) Attendees attend trade show as an activity for gathering information that includes: obtaining information about new products, technical updates, and to get contact information on exhibitors and other participants such as supplier, distributors etc.
Rinallo et al. (2010:253-254) Trade shows provide valuable experience for professional attendees in cognitive stimulation that provide learning and new knowledge; a chance to interact with exhibitors and other attendees and a sense of society
Liu et al. (2011:449) Attendees attend trade shows to exchange cards to build relationships after the show
Tafesse (2013:1021) Indicate that attendees attend because of number of exhibitors that is at trade shows.
Organisations at trade shows should segment their markets, according to the
needs of their customers, and be adaptable to these needs; since interaction with
each segment would differ (Rice, 1992:43). Due to the diverse needs of
customers, the different types of attendees will be discussed. Different methods of
classifying trade-show attendees have been developed, with various authors using
a diverse classification. For the purpose of completeness, each of the different
types of classification methods will shortly be discussed, due to the impact they
can have on exhibit staff.
In Table 3.2, the different authors’ classification is indicated; and in Appendix B of
the study each is discussed in more detail
© University of Pretoria
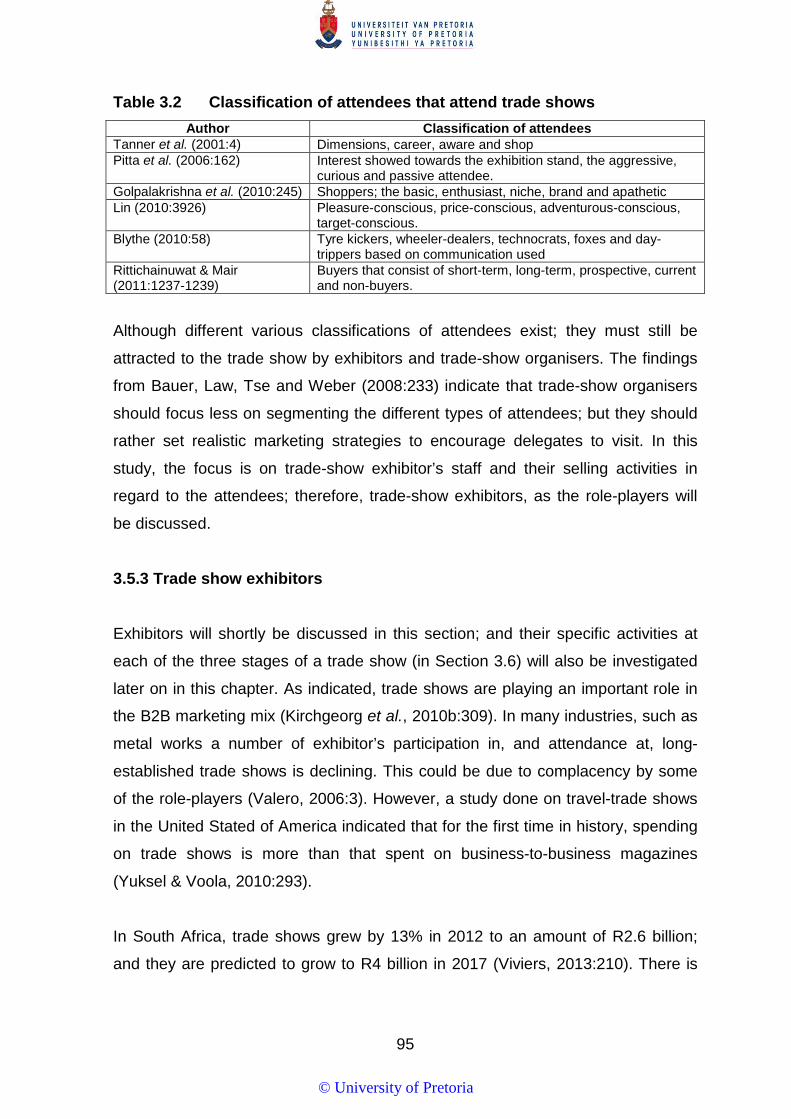
95
Table 3.2 Classification of attendees that attend trade shows Author Classification of attendees
Tanner et al. (2001:4) Dimensions, career, aware and shop Pitta et al. (2006:162) Interest showed towards the exhibition stand, the aggressive,
curious and passive attendee. Golpalakrishna et al. (2010:245) Shoppers; the basic, enthusiast, niche, brand and apathetic Lin (2010:3926) Pleasure-conscious, price-conscious, adventurous-conscious,
target-conscious. Blythe (2010:58) Tyre kickers, wheeler-dealers, technocrats, foxes and day-
trippers based on communication used Rittichainuwat & Mair (2011:1237-1239)
Buyers that consist of short-term, long-term, prospective, current and non-buyers.
Although different various classifications of attendees exist; they must still be
attracted to the trade show by exhibitors and trade-show organisers. The findings
from Bauer, Law, Tse and Weber (2008:233) indicate that trade-show organisers
should focus less on segmenting the different types of attendees; but they should
rather set realistic marketing strategies to encourage delegates to visit. In this
study, the focus is on trade-show exhibitor’s staff and their selling activities in
regard to the attendees; therefore, trade-show exhibitors, as the role-players will
be discussed.
3.5.3 Trade show exhibitors Exhibitors will shortly be discussed in this section; and their specific activities at
each of the three stages of a trade show (in Section 3.6) will also be investigated
later on in this chapter. As indicated, trade shows are playing an important role in
the B2B marketing mix (Kirchgeorg et al., 2010b:309). In many industries, such as
metal works a number of exhibitor’s participation in, and attendance at, long-
established trade shows is declining. This could be due to complacency by some
of the role-players (Valero, 2006:3). However, a study done on travel-trade shows
in the United Stated of America indicated that for the first time in history, spending
on trade shows is more than that spent on business-to-business magazines
(Yuksel & Voola, 2010:293).
In South Africa, trade shows grew by 13% in 2012 to an amount of R2.6 billion;
and they are predicted to grow to R4 billion in 2017 (Viviers, 2013:210). There is
© University of Pretoria

96
an indication of growth in exhibiting at trade shows; but, in order to be successful,
exhibitors must select the best shows at which to exhibit.
In deciding to exhibit at a trade show, the exhibitors must determine whether the
trade shows are in line with their current marketing activities; what would be their
level of exposure achieved; do the attendees match their business-target market;
what are their financial resources; are their human resources sufficient; and what
is the timing of the event (Van der Wagen, 2005:193-194, Dwyer & Tanner,
2009:328).
According to Kaplan (2004:33), exhibitors need to take a further three actions to
be successful at trade shows. Firstly, exhibitors need to select trade shows that
will attract the target market they want to reach. Secondly, exhibitors need to
develop integrated marketing material that is not just for the one event, but can be
used with other promotional campaigns; and lastly, the exhibitors need to follow up
on those leads that were obtained at the trade show. At medical-trade shows,
exhibit staff, for example, make appointments with doctors and then go and visit
them after the show, at a specific pre-scheduled time.
With the money exhibitors are spending on trade shows, they want to make a
need to follow a plan to ensure a return on their investment. Tanner and Chonko
(1995:262) suggest the following guidelines, based on their research findings, for
exhibitors in managing a trade show:
• Trade-show objectives must be in line with the corporate marketing
objectives of the organisation.
• Strategies and practices must be developed to achieve the objectives of the
trade show.
• One employee must be responsible for arranging the trade show.
• The marketing staff must be involved in setting goals and strategies.
• Maintain the same message across the IMC.
• Staff the exhibit stand with relevant employees, such as sales personnel,
sales managers and engineers.
© University of Pretoria
97
• The staff working in the exhibit stand must be formally trained in
communicating at an exhibit’s stand.
• Exhibitors should ensure that enough staff are available to ensure that the
exhibit stand is manned at all times, including break times.
In this study, the guidelines will be investigated with the sales process to establish
whether it is followed by exhibitors. The aim of exhibitors is to make sure that they
get the best possible attendees at their exhibit stands, or to interact with them at
the trade show. As stated before, trade shows are used by exhibitors for
competitive-intelligence, market-scanning, image-building and relational-sales with
existing, and with new customers (Tafesse & Korneliussen, 2011:47).
This interaction takes place at three different stages of the trade show. And next,
each of these will be discussed in more detail.
3.6 THE STAGES OF TRADE SHOWS According to Tanner (2002:231), Seringhaus and Rosson (2004:153-154), and
Lee and Kim (2008:785), a trade show consist of three stages, with each stage
comprising a number of activities, through which that an exhibitor would need to
go. For the purpose of this study, the stages, as stated by Lee and Kim
(2008:785), will serve as the guideline for the discussion, as indicated in Figure
3.3. Although the layout of Lee and Kim (2008:785) is used, different authors have
different viewpoints in regard to the activities at each stage of a trade show. In
Table 3.3, a comparison is provided between the approaches of the three authors
on the activities that take place at each of the stages of a trade show. This study
focuses mainly on the pre-show and the at-show activities of the exhibitors at trade
shows.
© University of Pretoria

98
Table 3.3 Comparison of different authors on activities in the stages of a trade show
Tanner (2002) Seringhaus & Rosson (2004)
Lee & Kim (2008)
Pre-show activities
1. Promotion (mail, telephone calls)
1. Communication 2. Staff training 3. Visitor attraction 4. Exhibit services
1. Quantifying objectives 2. Pre-show promotion 3. Exhibit staff training
At-show activities
1. Demonstrations 2. Press-conferences 3. Presentations 4. Premiums / contest
1. Exhibit event 2. Visitor contact procedure 3. Visitor tracking 4. Visitor interest 5. Buying information
1. Exhibit stand size 2. Exhibit stand location 3. On-site promotion 4. Exhibit staff density
Post-show activities
1. Follow-up 2. Measurement & evaluation
1. Prompt follow-up 2. Delayed follow-up 3. Participation cost
1. Follow-up 2. Measurement
From Table 3.3, it is evident that the majority of activities in the pre-show stage of
the different authors correspond with each other, with the exception of minor
differences – due to the adding of more detail. In the pre-show stage, Tanner
(2002:231) only refers to promotion; while Seringhaus and Rosson (2004:156)
refer to communication of the staff-training vision, visitor attraction and exhibition
services; while Lee and Kim (2008:786) identify quantifying objectives, pre-show
promotion and exhibit staff training. Woolard (2007:34) points out that pre-show
planning must be done to determine how the attendees would be attracted to the
exhibit; and how to target the best prospects.
Johansson and Bengtsson (2011:73) emphasise that the exhibiting stand design
must provide for sufficient space, the where the exhibiting staff (sales
representatives) can consult with the attendees.
The at-show stage takes place during the trade show, where the attendees visit
the show and call on the stand of a specific exhibitor to gather information, interact
with the exhibiting staff and place orders. In Table 3.3, the at-show activities, as
pointed out by Tanner (2002:231), comprise demonstrations, press-conferences,
presentations and premiums, or contests. Seringhaus and Rosson (2004:156) add
exhibit events, visitor-contact procedure, visitor tracking, visitor interest and buying
information; while Lee and Kim (2008:786) classify exhibit stand size, exhibit
location, on-site promotion and exhibiting staff density as part of this stage.
© University of Pretoria

99
After the trade show has concluded, the post-show activities take place. The post-
show activities include the following up of leads obtained during the show; and the
success of the trade show is evaluated. From Table 3.3, the post-show activities,
as identified by Tanner (2002:231) are: the follow-up, measurement and
evaluation; while Seringhaus and Rosson (2004:156) include a prompt follow-up, a
delayed follow-up and participation; and Lee and Kim (2008:786) refer to follow-up
and measurement. Ling-Yee (2008:36) further contends that the post-show follow-
up refers to the exhibitor manager’s attempts to analyse the attendee roles in
buying decisions, product knowledge, as well as extra information required by
other role-players in those buying centres that visited the exhibit stand.
As indicated in Table 3.3, different viewpoints are held regarding the activities at
each stage of a trade show. To provide the reader with a better understanding of
the activities at the different stages of a trade show, a visual representation will be
constructed. The model of Lee and Kim (2008:786) and Hansen (2004:4) will be
used as a guideline; and the rest of the chapter will be discussed at the hand of a
new figure constructed by the researcher. From Figure 3.3, two aspects can be
distinguished: the determinants, which comprise the stages and activities, and the
trade-show performances, which comprise the measures used to determine the
success of the trade show. Performances will next be discussed briefly; and the
determinants throughout the rest of the chapter will also be highlighted.
In Figure 3.3, it is indicated that the exhibitors at trade shows have five measures
of performance that can be distinguished from the three stages at a trade show,
namely: image-building, sales-related activities, information-gathering,
relationship-improvement and motivation. Image-building consists of: getting
publicity in the media; demonstrating what the business can do through product
demonstrations; and meeting with the key decision-makers visiting the trade show.
The sales-related activities include all those aspects related to on-site sales, and
the sales after the trade show.
© University of Pretoria

100
Figure 3.3 Stages of trade show
Source: Adapted from Lee & Kim (2008:786) & Hansen (2004:4)
In this study, the focus will be on sales-related activities, more specifically on how
exhibit staff go through the sale process at trade shows. Information-gathering
deals with compiling the information on new product ideas, market opportunities in
new areas, introducing new products, and looking for the possibility of export
opportunities. Relationship-building has to do with the maintenance and
development of relationships with current customers, and creating new ones; and
lastly, motivation deals with maintaining and enhancing the motivation of the
customers, the company and the staff (Hansen, 2002:3-4; Lee & Kim, 2008:786-
787: Tafesse & Korneliussen, 2011:44-46). In this study some of these
performance measures will be researched if they relate to the sales process.
Activities
Pre-Show Activity (3.6.1)
At-Show Activity (3.6.2)
Post –Show Activity (3.6.3)
Objectives
Pre-show promotion
Exhibit staff training
Exhibit stand at-show
At-show promotion
Communication
Sales activities
Follow-up
Measurement
Trade Show Performance
Image-building performance
Sales-related performance
Information gathering
Relationship improvement
Motivation activities
Budget
Exhibit stand design
Information gathering
© University of Pretoria
101
3.6.1 Pre-show activities 3.6.1.1 Objectives For all promotional efforts, including trade shows, the marketing objectives need to
be specified before a plan can be developed (Bellizzi & Lipps, 1984:52). Exhibitors
need to start with their marketing objectives; and from there set trade-show
objectives, so that they can measure their success at the show. The activities at
trade shows cannot be measured if the objectives have not been set out in detail
beforehand (Kirchgeorg et al., 2010a:64). A trade show can be a powerful and
highly flexible business tool to use, however, to exhibit an organisation’s need to
do an in-depth plan, in order to get maximum returns on their inputs (Livera,
2003:2). It is not just good enough to set broad objectives; but specific objectives
need to be set, such as lead quotas, sales, number of demonstrations etc. (Miller,
1999:44). Exhibitors, therefore, set two types of objectives: those that can be
measured, such as number of sales, new prospects etc.; and those, which cannot
be measured, such as image-building, market research etc. (Shoham, 1992:340).
According to Siskind (2005:10-15), there are three objectives, and not just two,
that an exhibitor would have for a trade show. Firstly, there are those corporate
objectives that include elements, such as branding, awareness and the image of
the organisation. Secondly, individual departmental objectives that deal with
specific products or services inside the organisation; and lastly, individual
objectives, in which exhibit staff might see a trade show as an opportunity for
personal growth. An even more in-depth list of objectives is provided by Kirchgeorg et al.
(2005:1003), as indicated in Figure 3.4, which comprises the main objectives and
the sub-objectives. The main objectives include: contact objectives, sales
objectives, information objectives, motivation objectives, target-group-related
influence objectives, and market-related influence objectives. In this study, the
researcher will investigate whether and what type of objectives exhibitors set for
trade shows. Kirchgeorg et al. (2010a:64) asserts that, although a number of
objectives are important, the main strategic objective at a trade show is that of the
© University of Pretoria
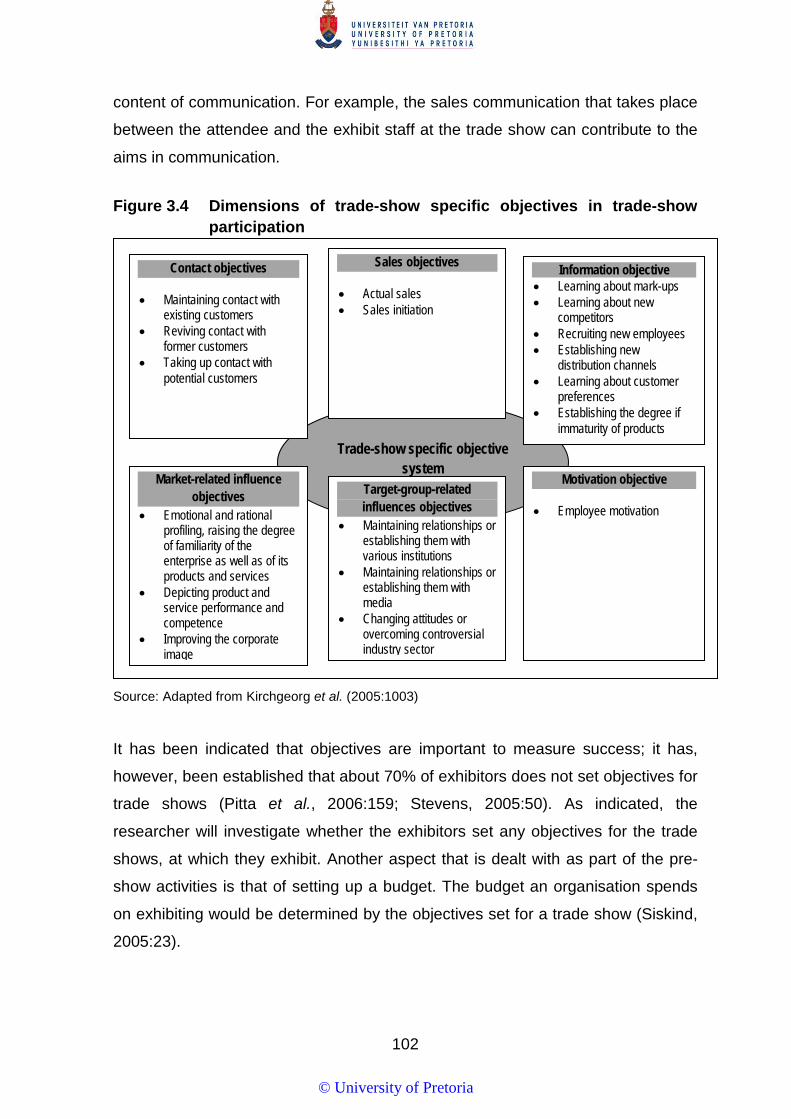
102
content of communication. For example, the sales communication that takes place
between the attendee and the exhibit staff at the trade show can contribute to the
aims in communication.
Figure 3.4 Dimensions of trade-show specific objectives in trade-show
participation
Source: Adapted from Kirchgeorg et al. (2005:1003)
It has been indicated that objectives are important to measure success; it has,
however, been established that about 70% of exhibitors does not set objectives for
trade shows (Pitta et al., 2006:159; Stevens, 2005:50). As indicated, the
researcher will investigate whether the exhibitors set any objectives for the trade
shows, at which they exhibit. Another aspect that is dealt with as part of the pre-
show activities is that of setting up a budget. The budget an organisation spends
on exhibiting would be determined by the objectives set for a trade show (Siskind,
2005:23).
Trade-show specific objective
system Target-group-related influences objectives
• Maintaining relationships or establishing them with various institutions
• Maintaining relationships or establishing them with media
• Changing attitudes or overcoming controversial industry sector
Market-related influence objectives
• Emotional and rational profiling, raising the degree of familiarity of the enterprise as well as of its products and services
• Depicting product and service performance and competence
• Improving the corporate image
Information objective • Learning about mark-ups • Learning about new
competitors • Recruiting new employees • Establishing new
distribution channels • Learning about customer
preferences • Establishing the degree if
immaturity of products
Contact objectives
• Maintaining contact with existing customers
• Reviving contact with former customers
• Taking up contact with potential customers
Motivation objective
• Employee motivation
Sales objectives
• Actual sales • Sales initiation
© University of Pretoria

103
3.6.1.2 Budget The budget for a trade show relates to the resources that an exhibitor will spend
on exhibiting. There is a direct correlation between the allocation of resources and
the performance of the organisation at a trade show (Seringhaus & Rosson,
2004:161). This makes the allocation of resources important for exhibitors at trade
shows who have to budget for items, such as rent of exhibit stand space; on-floor
costs (paying exhibit staff etc.); display, graphics and accessories; freight and
cartage; cost of time; travel and entertainment expenses; promotion before the
show; and promotion after the show (O`Connor, 2001:185-189).
Tӓger and Penzkofer (2005:132) expand on the list of O`Connor (2001:185-189);
and they include stand construction, personnel costs, arrival and departure costs,
trade-show personnel expenses, business entertainment, and other costs such as
phones, fax, holiday costs and advertising.
A number of different resources are allocated for trade shows. As indicated,
budget spending includes promotional and advertising costs that are done before
and during the show, in order to attract attendees (O`Connor, 2001:185-189;
Tӓger & Penzkofer, 2005:132). In this study, the different promotional efforts of
exhibitors will be investigated; and these will be discussed next.
3.6.1.3 Pre-show promotion An interesting study done on United States trade shows found that exhibitors that
spend more on pre-show promotion, have larger exhibit stands, staff their exhibit
stands with more personnel, and participate in vertical trade shows (vide. Section
3.4.2), in order to attract more of their target audience (Dekimpe et al., 1997:60).
According to Bathelt and Schuldt (2008:860), through their studies done in
Germany, on the architecture and meat industries, it was determined that
organisations systematically inform their current and potential customers about
their presence; or they invite them to a trade show to improve their results.
Effective pre-show promotion is important; since it can increase the exhibit traffic
© University of Pretoria
104
(Tufel, 2004:8) and attract the most profitable attendees prior to the show
(Alessandra, Underation & Zimmerman, 2008:67).
It should also be noted that promotional activities of trade shows have changed
from being limited to small numbers of attendees to where large numbers of
professionals are attracted by exhibitors through various Integrated Marketing
Communication (IMC) tools (Munuera & Ruiz, 1999:18).
To attract attendees, exhibitors embrace integrated-marketing communication; and
they may choose to employ any combination of advertising, personal selling, word-
of-mouth, promotion, or any other tool to gain attention and create awareness for a
trade show, where they exhibit (Pitta et al., 2006:156, Livera, 2003:4). More
specifically, pre-show promotional activities can include direct mail, advertising,
and invitations from salespeople, and to a lesser extent telemarketing (Dwyer &
Tanner, 2009:330, Herbig et al., 1997:377). Another pre-show promotional tool
used by exhibitors is the use of competitions to attract attendees to trade shows –
due to the infectiveness of direct mail (Summers, 1992:46; O’Hara et al.,
1993:234).
Exhibitors can also make use of the internet to attract attendees to the trade
shows at which they are exhibiting (Ling-Yee, 2010:272); and this not only assists
in attracting attendees; but it also increases awareness and helps to capture more
leads (Wimberly, 2007:17). One of the newer ways exhibitors are using to promote
attendees is through the use of mobile marketing (Brennan et al., 2014:195).
Exhibitors can, therefore, use a number of promotional activities – be they free
entrance tickets, prospect lists, calls on prospects and key customers, placing the
event dates online, and in the print media, and to provide salespeople with a
qualified prospect list of potential attendees on which to call (McIntosh, 2008:19).
In this study, the pre-show promotional activities of exhibitors will be explored;
since they have an impact on the sales process; and this can be viewed as being
part of the prospecting. The Markex trade show, for example, makes use of the
internet, direct mail, electronic mail, mobile marketing, trade magazines and bill-
boards to do its promotions.
© University of Pretoria

105
It must, however, be noted that that many of the pre-show promotions lack
personalisation, target segmentation; or they focus on the unique value proposition
for an attendee to come to the trade show (Huges, 2007:22). Once the exhibitor
has attracted attendees to the trade show, the next step is to get the attendees to
enter their stand by designing an attractive exhibit. Attendee’s visits to exhibits’
stands are frequently pre-planned; but a large number are visited; because the
attendees thought an exhibit stand might look interesting (Milner, 2009:7).
Therefore, the pre-show design of the exhibit stand is important to exhibitors, in
order to attract as many attendees as possible to visit their exhibition.
3.6.1.4 Design of exhibit stands Exhibit stand design deal with all aspects related to the layout and content of the
stand (Whitfield & Webber, 2011:440, Søilen, 2013:97). Exhibit stands have three
main functions: to display products, to facilitate professional interaction, and to
promote socialisation (Rinallo, Borghini & Golfetto, 2010: 251). An exhibit stand
must, therefore, be designed to facilitate the sales process and to assist in building
the image of the exhibiting organisation (Summers, 1992:46).
Differences exist between the type of product exhibited and the space allocated to
it at trade shows. With consumer products, the majority of space is allocated to the
display of products; while with intermediated goods, a large part of the exhibition
area is dedicated to professional interaction, with capital products delegated to
social interaction and relaxation (Rinallo et al., 2010:251). This study only focuses
on intermediate and capital products; since the focus is on trade shows. Part of the
design of the exhibit stand is to allow for enough space to do product
demonstrations, as well as the space to discuss products further, to ensure that
the attendees spend more time at the exhibit (Whitfield & Webber, 2011:440;
Golpalakrishna, Roster & Sridhar, 2010:246).
In the creation of an exhibit stand, components, such as: colour, graphics, lighting,
display counters, maintenance, photos, audio-visuals, demonstrations,
transportability, carpet, signage, product displays, sales literature etc. must reflect
the aims and characteristics of the attendees, in order to attract them to the stand
© University of Pretoria

106
(Whitfield & Webber, 2011:440; Ling-Yee, 2008:35; Miller, 1999:44). A wide variety
of interesting products would attract attendees to an exhibitor’s exhibit stand as
well (Golpalakrishna et al., 2010:247; Borghini et al., 2006:1156). In their research,
at a travel trade show in the USA, Yuksel and Voola (2010:298) found that
exhibitors see an efficient and effective display of products, as the most important
element to success for the exhibitors.
According to Zimmerman and Blyth, (2013:264), in organising an exhibit stand,
exhibitors should: ensure that the displays are accessible and informative;
exhibiting staff have a clear brief; that they have objectives in place, with specific
targets for exhibition staff; that they have an area, where the exhibition staff can
take prospects for private conversations; have enough refreshments; set up a plan
to provide staff with breaks; have a record-keeping system in place for leads and
contacts; have a feedback system for attendees; and some activities for staff. The
design of the exhibit stand focuses on creating a space, where there can be
interaction between the staff and the attendees. Exhibit stands should have space
for the sales representatives who man the stand; so that they can talk to the
attendees – either individually or in groups (Johansson & Bengtsson, 2011:73). An
exhibit stand must further provide space and events, such as demonstrations, to
promote interaction between the exhibitors and the attendees (Lin, 2010:3932). At
Afrimold, exhibitors have their moulding machinery at the exhibit stand, where they
can be demonstrated, and salespeople can explain their uses.
Although space is important, exhibit stands must also be accessible and devoid of
any psychological barriers that might discourage the attendees from visiting
(Livera, 2003:4). Different exhibit stands design elements; and these, can
therefore, be considered by exhibitors. Exhibit stand designs include: standard or
inline exhibit stand, a perimeter-wall exhibit stand, a peninsula exhibit stand, an
island exhibit stand, a cross-aisle exhibit stand, a double-decker exhibit stand, a
demonstration area, and tower displays (Robb, 2000:72-73; O`Conner, 2001:117-
120; Stevens, 2005: 89-90). The afore-mentioned stand designs will not be
investigated in this study; a short discussion is, however, included in Annexure C
for the completeness of the study.
© University of Pretoria

107
The exhibit stand design must be comfortable for exhibit staff to work in as well;
since they are the main contacts with the attendees and possible prospects
(Robbe, 2000:73-74). Once the business has designed their exhibit stand, the next
step is to make sure that it is manned by well-trained staff. Rinallo et al.
(2010:254-255) point out that attendees appreciate those exhibitors that display
their products and have competent exhibit staff. The training of exhibit staff will
therefore be discussed next.
3.6.1.5 Training exhibit staff To make sure that the objectives set by the exhibitors are achieved; the exhibit
staff who are appointed must have the appropriate interpersonal skills; knowledge
and communication capabilities, to provide for positive trade show (Li et al.,
2011:442). From the afore-mentioned, it is clear that the behaviour and expertise
of exhibit staff have a direct impact on the outcome of the interaction that take
place at a trade show (Søilen, 2013:118, Seringhaus & Rosson, 2004:161).
Therefore the training received and the quality of the exhibit staff would contributes
to sales and follow-up after the trade show (Ling-Yee, 2008:42). For exhibitors to
get the full benefits of a trade show, they should make their exhibit staff aware of
their organisations long-term objectives for the show; train them to ask the right
questions; how to help attendees quickly when entering the exhibit stand;
schedule them into shifts to prevent fatigue; and be divided in such a manner that
the exhibit stand is not overcrowded (Robbe, 2000:78).
Exhibit staff should furthermore know general data as well as hours, days, and set-
up time of the exhibit; show objectives; and pre- and, at-show promotions (Pitta et
al., 2006:163). The exhibit staff should also be trained on: product or service
solutions provided by the exhibiting business; how to demonstrate the product; to
be able to make presentations; to perform competitive analysis; know how to
generate leads; determine who is the attendee (decision-maker, buyer, influencer
etc.); how to close a sale; and what to do if the purpose is to follow-up after the
trade show (Pitta et al., 2006:163; Hanlon, 1982:99).
© University of Pretoria

108
In this study, it will be researched to discover whether the exhibit staff received
any training; since this can have an impact on their success in selling to attendees.
Johnston and Marshall (2013b:345-346) point out that for trade shows sales
people need training since they deal with more and larger groups of customers.
After an organisation has done all their pre-show activities, the next step is to
prepare all the at-show activities. That includes promotion at the show,
communication, sales or preparation for sales, and stand activities.
3.6.2 At-show activities 3.6.2.1 At-show promotion Exhibitors at trade shows can apply different promotional tools, such as brochures;
electronic communication; give-aways; information kits; sponsorships of events; or
they can apply a combination of the different promotional tools to attract attendees
to their exhibit stand. Other methods of promoting the exhibitor at a trade show
include: creating moving billboards, making exhibits interactive, qualifying leads
immediately, creating a presence on the exhibit floor, using ambush marketing,
planning before-hand and making the organisation visible to to the attendees
(Brewer, 1996:39). Summers (1992:46) pointed out that almost 75 per cent of
exhibitors make use of promotional giveaways; and that all the promotional
material given away at trade shows should be used with current IMC efforts, in
order to be successful at the show.
Exhibitors are, however, moving away from handing out brochures; since most of
these are thrown away by the attendees (Alessandra et al., 2009:94). In research
done by Pitta et al. (2006:158), it was established that 60%-85% of brochures
handed out at trade shows are never looked at again, or are thrown away by the
attendees. Therefore, exhibitors started using other methods to promote their
exhibit stands at trade shows. One of the newest developments is where an
internet kiosk is set up; so that the attendees can go on the internet, check e-
mails, or download show information (Suh, Love & Bai, 2004: 28). Another method
of promoting the exhibit stand is through press kits that contain information on new
© University of Pretoria

109
products and technology of which the exhibitor would like to make the attendee
aware (O’Hara et al., 1993:234). Exhibitors should provide more product-specific
information, rather than merely relying on promotional gifts (Milner, 2009:9).
At trade shows like Afrimold, for example, the exhibitors make small moulds at the
exhibit stand; and they hand these out as their promotional gifts.
Another method that can be used by exhibitor’s to make their exhibit stand visible
is through sponsorships at the trade show (Suh et al., 2004:32). Sponsorship at
trade shows can include refreshment, meals, events, speeches, bags and badges.
Yuksel and Voola (2010:298) point out through their research on travel trade
shows that promotional items, such as pens and bag, as promotional tools, were
not perceived as that important in achieving success. One of the reasons could be
that, although free gifts and other attention-getters attract attendees to the exhibit
stand; not all of them are interested in the products of the exhibitor (Dwyer &
Tanner, 2009:331). The afore-mentioned method is confirmed by Suh (2003:47-
49). This indicates that organisations that sponsor more entertainment types of
events, such as speakers, massage stations, complementary ice cream, and
suchlike would get more value for money than sponsoring items, such as tote
bags, badge holders etc. Entertainment can also be a useful method of
sponsorship; because not all contacts take place during trade show hours; but at
other functions, such as dinners and seminars, where they can assist in the
exchange of information (Bathelt & Schuldt, 2008:861).
The promotional methods discussed can be used in combination with each other;
and they are not the only promotional tools to promote business at the trade show.
In this study, the promotional methods applied at trade shows will be investigated.
In Section 3.6.1.4, exhibit stand design that takes place as part of the pre-show
activities was discussed. It must be noted that during the trade show – as part of
the at-show activities – exhibitors should maintain the exhibit stand in such a way,
as to attract attendees.
© University of Pretoria
110
3.6.2.2 Exhibit stands at-show Exhibit stand design at trade shows must be done in such a manner that
attendees find it attractive and are keen to visit. Through elements, such as
products on display and staff appearance can assist in attracting attendees.
According to Whitfield and Webber (2011:440), exhibitors create competitive
attractiveness through the size of their exhibit stand and the number of personnel
compared to that of the competitors. Another aspect that exhibitors must focus on
is the message they convey through their exhibit stand. Elements, such as
samples of products, models, demonstrations and printed material must be visible
in the exhibit stand, in order to convey the message of the exhibitor (Brennan et
al., 2014:195).
Another method attract attendees to the exhibit stand is to increase the number of
products available for immediate purchase (Whitfield & Webber, 2011:446). Miller
(1999:61) identified six factors that influence attendees’ willingness to visit an
exhibit stand at a trade show, namely: interesting product demonstrations, exhibit
location, exhibit presentation, exhibit size, advice from fellow attendees, and sales
representatives’ communicated recommendation.
3.6.2.3 Communication
According to Kirchgeorg et al. (2010a:68), trade shows are excellent
communication tools to develop and maintain customer loyalty, because of the live
face-to-face interaction with customers. Since attendees are voluntarily at trade
shows, they would be more likely to be interested and open to receive the exhibit
staff message (Gosztonyi, 1997:13). Trade shows provide a number of
advantages in the communication process, namely: one-on-one contact between
buyers and sellers; they would take place in a neutral location that has less
interruptions; where there is an opportunity to meet the right person from the
buying centres; and where the attendees arrives at trade shows with a positive
attitude – due to less sales pressure (Shoham, 1992:336).
© University of Pretoria
111
For the afore-mentioned to be successful, capable exhibit staff should be at the
trade show.
Exhibitors have to staff their exhibit stands with staff that have the ability to
communicate on the technical nature of the products; and they should be able to
demonstrate or display new products – to ensure repeat visits by the attendees
(Whitfield & Webber, 2011:446). The type of trade show can have an impact on
the exhibit staff that would be needed (Bathelt & Schuldt, 2008:859). At specific
types of trade shows, a specialist might be needed to discuss the technical
aspects of the products with the attendees (Whitfield & Webber, 2011:446). At
trade shows, like Afrimold for example, expert exhibit staff is needed to explain the
technical aspects of the moulding machines that are exhibited there.
In many industries, not only are specialised experts needed; but different exhibit
staff is required to perform specific activities. Exhibit staff might include: general
managers that can assist in image-building; production mangers who can help with
technical aspects; and salespeople that can generate sales and build relationships
(Tafesse & Korneliussen, 2011:47). A number of exhibit stands at trade shows,
like the IFSEC for example, include security personnel explaining the technical
aspects, managers who can socialise with the attendees, and salespeople who
can inform the attendees on how the product may be purchased.
Both exhibitors and attendees should be in a collaborative commitment for sharing
information at trade shows, so as to increase the knowledge of both parties (Ling-
Yee, 2006:173). Furthermore, trade shows are an excellent place for feedback on
products from customers; and this flow of information could then be used to guide
other marketing activities (Shimp, 2003:514). Attendees view the information
obtained at trade shows as useful in decision-making, when purchasing products
(Bettis-Outland et al., 2012:389).
The view of Bettis-Outland et al. (2012:389) is supported by Reychav (2011:238).
These authors point out that not only are attendees collecting information, or
making contacts for sales; but they are also sharing knowledge.
© University of Pretoria

112
According to Bathelt and Schuldt (2008:860), trade show exhibitor’s
communication interaction with potential and current customers differs. In the case
of potential customers; they pass by the exhibit and gather general information
about product offerings, or specific information, or solutions to a current or future
problem that occurs – due to changes in production. With existing customers,
discussion takes the form of negotiations; and it takes place in separate facilities;
or common information about markets and industrial innovations within the trade
can be exchanged. The afore-mentioned can assist in the buying and selling
activities that take place.
3.6.2.4 Sales activities According to Alessandra et al. (2009:69), trade shows promote communication
between organisations and possible prospects; since they move the sales process
further. Trade shows can be seen as one of the most cost-effective ways to
achieve sales; since people entering the exhibit stand are more likely to purchase
than a prospect who is encountered in industry (Goldblatt, 2005:11). Purchasing
professionals, for example, prefer trade shows to seeing many vendors; since they
do not have time for sales calls in their office (Tanner, 2002:229). With the afore-
mentioned in mind, it may be assumed that in exhibitors’ logical choice of trade
shows, the stand personnel must then be sales-people (Brennan et al., 2014:195).
Dwyer and Tanner (2009:332) agree with the afore-mentioned statement; and
these authors postulate that salespeople must be involved with trade shows; since
it is personal; and it results in sales leads.
In this study, the researcher will look at the difference between salespeople and
non-sales people that man the exhibit stand, and their application of the sales
process.
Trade shows shorten the sales process, or the selling cycle; and they can assist in
exhibiting organisations to reach unknown buyers (Saget, 2006:113-114). The
sales cycle at a trade shows is shorter; since the attendees who attend are
interested in the products and services exhibited. Salespeople who therefore man
the exhibit stand must know their organisation and product to help the attendees in
© University of Pretoria
113
their decision-making (O`Connor, 2001:152-154). Miller (1999:89-91) contends
that when it comes to products, the exhibitor has control over the four main
elements relating to the product, namely: product knowledge; product
demonstrations; comparison of your product to that of the competitions; and
product enthusiasm.
The lack of product knowledge is one of the main complaints that attendees have
about exhibit staff. Therefore, it may be assumed that sales personnel would be
the best people to staff an exhibit stand – due to their knowledge of the products.
Salespeople would most probably be more capable of demonstrating and showing
enthusiasm towards their own products (Miller, 1999:89-91).
Although sales people might be the best to man the exhibit stand; in a study done
by Liu et al. (2011:449) on Chinese trade shows, it was established that most
exhibitors were at the show as public relations officers, and not for selling or
signing contracts. This could raise the question regarding the impact of
salespeople in the sales process at trade shows; since selling is not the main
focus of the exhibitors. However, Chonko and Ponzurick (2001:4) disagree with
Liu et al. (2011:449); and they point out that 26 per cent of attendees sign a
purchase order at a trade show; and 50 per cent buy, as a result of the show.
Trade shows are, therefore, an important element in the sales process – to sell or
generate leads for the organisation (Pitta et al., 2006:159).
According to Blyth and Rayner (1996:21), trade shows provide the opportunity to
create a large number of sales leads. The effectiveness of the exhibit staff is an
important factor in the efficiency of lead generation; and this shortens the lead
conversion after a trade show that carries over into cost savings for exhibitors
(Seringhaus & Rosson, 2004:161; Gopalakrishna & Williams, 1992:220).
Exhibitors must, therefore, focus on attendees, and not on volume; since excellent
trade-show leads can complement the selling effort that reduces the cost of
closing the sale (Golpalakrishna et al., 2010:245).
As Munuera and Ruiz (1999:22-23) point out, most of the purchases take place
after the trade show, once the attendees have evaluated the market information
© University of Pretoria

114
obtained at the show. The salesperson’s role at the exhibit stand is to engage the
attention of the attendee, and to gather information on attendees; so that follow-up
can occur after the trade show (Dwyer & Tanner, 2009:332). Exhibitors do not only
use trade shows to disseminate information to possible prospects through their
sales representatives; but they also use them to obtain information as well
(Tafesse & Korneliussen, 2011:47).
3.6.2.5 Information-gathering Trade shows have become one of the most important ways in which knowledge is
acquired by both sellers and buyers – due to their unique nature (Reychav,
2011:238). According to Bathelt and Schuldt (2008:862), exhibitors use trade
shows to gather information on competitors – through making observations and
comparisons with the product offerings on display. Trade shows should be viewed
as a strategic marketing tool, where information about the market and competitors
can be gathered (Tafesse & Korneliussen, 2011:47); and more specifically,
information on new competitive products and programmes can be obtained (Dwyer
& Tanner, 2009:333).
The information gathered at the trade show can be used to develop sales and
marketing plans for the organisation.
With the at-show activities, the exhibitor did promotions, communicated with
attendees, generated leads or sales, and gathered information. Once the trade
shows are over, the post-show activities will take place. Be they to measure the
success of the trade show, or to follow up on leads that were obtained at the show.
3.6.3 Post-show 3.6.3.1 Measurement of performance According to Bettis-Outland et al. (2012:389), exhibiting organisations must
measure their performance after a trade show, in order to determine their success;
and so that all possible elements can be assessed. Exhibitors need to provide
© University of Pretoria

115
feedback to management to see whether the objectives set were met, and to
evaluate their future involvement with the trade show (Pitta et al., 2006:164). Since
trade shows are part of the IMC mix, they must be measured just like advertising
or other marketing efforts (Summers, 1992:46). About a third of exhibitors at trade
shows do not measure their return on investments (Wills, 2005:9). This could be
due to many organisations marketing departments using outdated marketing tools,
which make it difficult to quantify the results of a trade show (Podmolik, 2007:29).
The sales from the trade show are a good measure; however, qualitative post-
show sales force feedback must also be evaluated (Herbig et al., 1997:377).
Trade shows must be analysed on the impact they have on the creation and
development of relationships, and not only on selling (Geigenmüller, 2010:289). It
is, therefore, clear that it is not easy to measure Return-On-Investment (ROI) at
trade shows – due to the diverse objectives that are both quantitative and
qualitative in nature (Sanders, 2006:15).
ROI for trade shows can be done in two ways: either on outcome-based or
behaviour-based dimensions (Sanders, 2006:15). Outcome-based dimensions
include sales-related activities and all immediate post-show sales. Behaviour-
based dimensions consist of information-gathering, image-building, motivation and
relationship activities. Customer satisfaction that is behaviour-based on the
attendees’ experience with exhibit staff, can be an indication of success at a trade
show (Genoist, 2005:4). Another way of looking at what exhibitors get out of a
trade show could be that of the benefits obtained, as stated by Bettis-Outland et al.
(2012:386). The benefits from exhibiting at the trade show can either be tangible
or intangible. Tangible benefits include: new customers; more sales from current
customers and/or the buying of new products; technical training and updates to
improve the customer support.
Intangible benefits, on the other hand, include the enhancement in strategic
planning; enhancement in policy development; new product development ideas,
and a better corporate image. At a trade show, the tangible benefits could include
getting a list of new customers; and the intangible benefits could be the
identification of new markets for products.
© University of Pretoria
116
Exhibitors can take three steps to maximize ROI at trade shows: firstly, the
marketing team must have the skills to motivate prospects to begin the sales
process; secondly, an inside sales team must be in place to deal with any follow-
up; and lastly, lead-qualification specialists should be partnered with, to improve
the quality of the leads obtained (Drohan, 2007:32). Although exhibitors obtain
leads at trade shows; frequently, the attendees do not want to provide specific
information; or, they close the sales at the trade show; so that the exhibitors need
to follow-up after the show (Bettis-Outland et al., 2012:389).
3.6.3.2 Follow-up According to Pitta et al. (2006:163), the trade show is not finished until the follow-
up is done. Many exhibitors’ main challenge is the following up after the trade
show (Yuksel & Voola, 2010:298); and it has been established through trade show
experts that an estimated 80 to 85 per cent of the attendees never have a
salesperson call on them after a show (Cateora & Graham, 1999:394). It is,
therefore, necessary for exhibitors to do post-show planning, in order to give them
a strategic means to deal with leads generated during the trade show (Woolard,
2007:34). This can assist in the buyer-seller relationships started to improve and
add to an ongoing business relationship after the trade show (Reychav, 2009:154).
To do the afore-mentioned, exhibitors must have systems in place to deal with the
follow-up.
According to Dwyer and Tanner (2009:332-333) and Alessandra et al. (2009:199-
120), exhibitors must either have customer-relationship management (CRM) skills,
or lead-management systems in place to facilitate the follow-up process after a
trade show. Experienced exhibitors create customised lead forms and train staff
on using them, before the show, in order to assist in making these systems work
(Pitta et al., 2006:163). Once the information has been captured, the exhibitor
must selectively provide the list of leads to the salespeople; since a large number
of prospects might need more attention before they are ready to purchase
(Alessandra et al., 2009:69).
© University of Pretoria

117
Exhibitors can also send attendees emails with the requested information from the
trade show, and follow that up with a sales call or a follow-up email (Herbig et al.,
1997:377). In this study, the follow-up activities of exhibitors will not be
researched; since the data-gathering will be done at the trade shows themselves.
In this chapter, trade shows have been discussed that make part of B2B
marketing, and more specifically, the B2B IMC mix (vide Chapter 2). Trade shows
are still one of the most important one-on-one B2B marketing communication
tools; and they will still be in South Africa in the future (Viviers, 2013:210). A
discussion was presented on the three stages of a trade show that enable
businesses to integrate with their B2B IMC mix (vide Chapter 2), and to enable
them to align their sales processes (vide Chapter 4).
3.7 SUMMARY The chapter started off by providing a short historical overview of trade shows.
Thereafter, the different definitions of trade shows were examined; and a definition
for the purpose of this study was compiled. Due to the nature of trade shows, the
different types that are categorised that are applicable to this study were also
looked at.
Secondly, the three role-players in trade shows, namely: the exhibitors, the
attendees and the trade-show organisers were described. Exhibitors’ and
attendees’ strategies and tactics were discussed at the hand of Figure 3.2 firstly. Thereafter, the exhibitors were briefly discussed, followed by the attendees.
Various aspects, such as attendees’ reasons for attending, and the different types
of attendees at trade shows were looked at. Thirdly, in this chapter, trade-show
organisers and their interaction with the attendees and the exhibitors were
discussed.
Lastly, the various stages of trade shows were highlighted. The activities at each
of the stages were defined. The stages and activities at each stage were
represented in Figure 3.3, and then discussed further. The pre-show stage
consists of setting objectives, budget, pre-show promotions, stand design and
© University of Pretoria

118
training exhibit staff. In the at-show stage, the activities include at-show promotion,
stand at-show, communication, sales activities and information gathering. The last
stage is post-show, where the exhibitors follow up and measure their trade show’s
ROI.
The role of personal selling in trade shows cannot be denied before, during and
after the show. Trade shows in many cases prepare prospects to buy products.
Exhibit Surveys Inc., as quoted by Dwyer and Tanner (2009:333) found that up to
80 per cent of trade show attendees purchase soon after a trade show; and in
most cases, it is first-time buyers from the exhibiting organisation. In Chapter 4,
personal selling and the sales process will be discussed in more detail.
© University of Pretoria

119
CHAPTER 4
THE NATURE OF PERSONAL SELLING 4.1 INTRODUCTION
Personal selling forms an integral part of any organisational marketing
communication strategy, and also in any trade show. The role of the salesperson
is especially important in B2B markets; where organisations rely on direct
communication with their customers, due to the unique characteristics found in
these markets, as was indicated in Chapter 2 of this study. The salesperson has
numerous functions within a B2B organisation. These include prospecting for new
customers, building long-term relationships with current or potential customers,
helping implement marketing programmes, and to gather information for the
organisation.
As indicated in Chapter 2, personal selling is an element of the B2B integrated
marketing communication mix and trade shows, which is seen as an element in
the IMC mix (Ling-Yee, 2008:35). It is, therefore, necessary to study the nature of
personal selling and the selling process, in order to understand its interaction with
trade shows. As indicated in Chapter 3, there are three stages during a trade
show; and at each of these, a different step in the sales process occurs. For the
purpose of this study, the word steps and stages for the sales process will be used
interchangeably.
In this chapter, personal selling and the sales process will be discussed. As
illustrated in Figure 4.1, personal selling will firstly be defined. Secondly, the
history and development of personal selling will be discussed. Thirdly, selling
careers will be looked at; and thereafter, personal selling as a IMC element will be
described. Lastly, the stages of the selling process will also be discussed.
© University of Pretoria
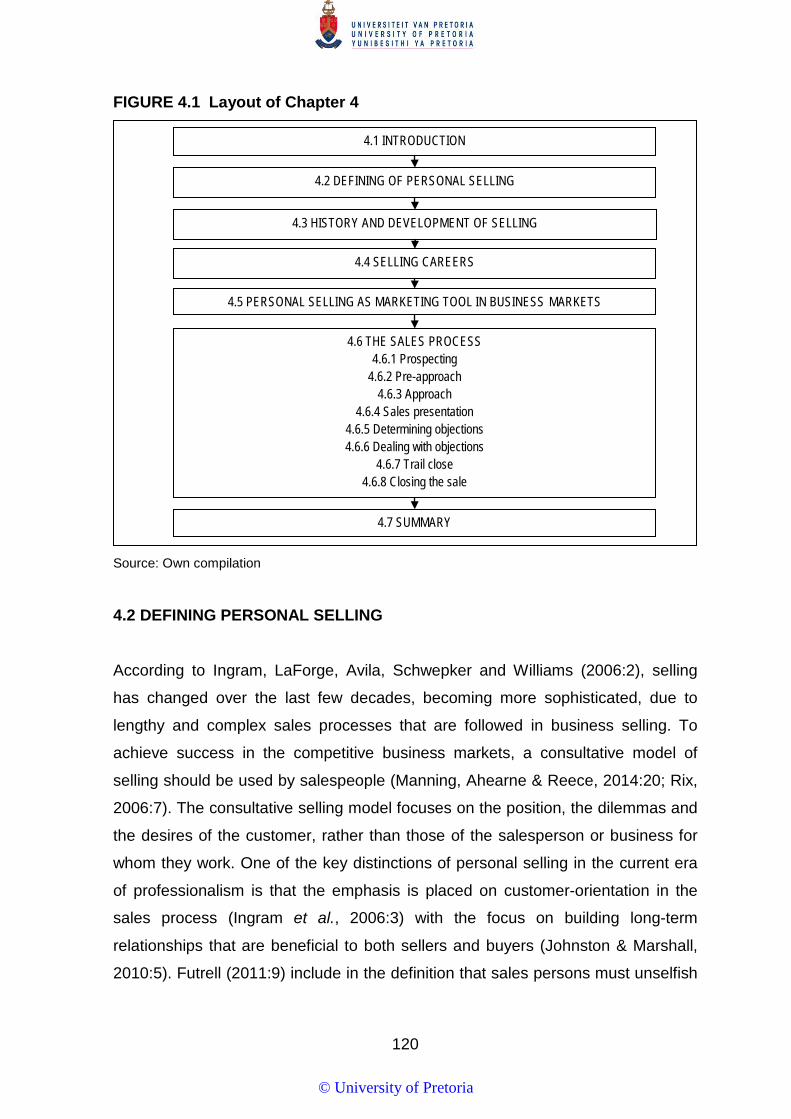
120
FIGURE 4.1 Layout of Chapter 4
Source: Own compilation
4.2 DEFINING PERSONAL SELLING
According to Ingram, LaForge, Avila, Schwepker and Williams (2006:2), selling
has changed over the last few decades, becoming more sophisticated, due to
lengthy and complex sales processes that are followed in business selling. To
achieve success in the competitive business markets, a consultative model of
selling should be used by salespeople (Manning, Ahearne & Reece, 2014:20; Rix,
2006:7). The consultative selling model focuses on the position, the dilemmas and
the desires of the customer, rather than those of the salesperson or business for
whom they work. One of the key distinctions of personal selling in the current era
of professionalism is that the emphasis is placed on customer-orientation in the
sales process (Ingram et al., 2006:3) with the focus on building long-term
relationships that are beneficial to both sellers and buyers (Johnston & Marshall,
2010:5). Futrell (2011:9) include in the definition that sales persons must unselfish
4.1 INTRODUCTION
4.2 DEFINING OF PERSONAL SELLING
4.3 HISTORY AND DEVELOPMENT OF SELLING
4.4 SELLING CAREERS
4.5 PERSONAL SELLING AS MARKETING TOOL IN BUSINESS MARKETS
4.6 THE SALES PROCESS 4.6.1 Prospecting
4.6.2 Pre-approach 4.6.3 Approach
4.6.4 Sales presentation 4.6.5 Determining objections 4.6.6 Dealing with objections
4.6.7 Trail close 4.6.8 Closing the sale
4.7 SUMMARY
© University of Pretoria
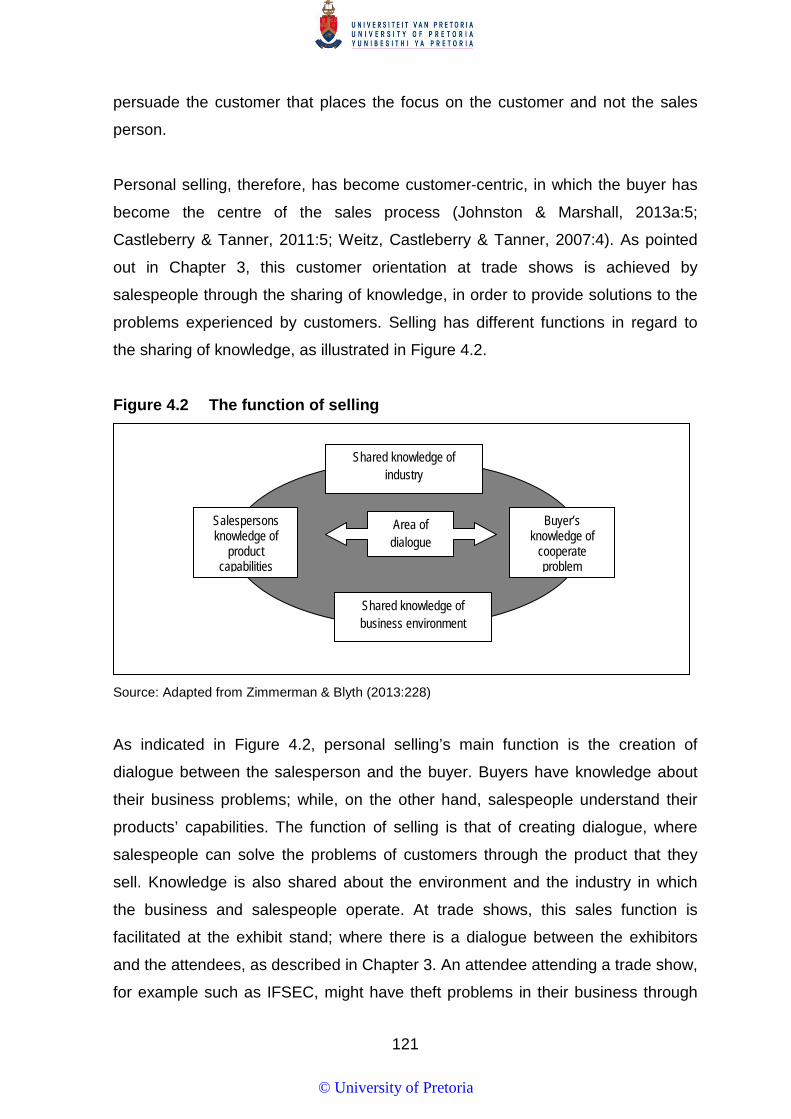
121
persuade the customer that places the focus on the customer and not the sales
person.
Personal selling, therefore, has become customer-centric, in which the buyer has
become the centre of the sales process (Johnston & Marshall, 2013a:5;
Castleberry & Tanner, 2011:5; Weitz, Castleberry & Tanner, 2007:4). As pointed
out in Chapter 3, this customer orientation at trade shows is achieved by
salespeople through the sharing of knowledge, in order to provide solutions to the
problems experienced by customers. Selling has different functions in regard to
the sharing of knowledge, as illustrated in Figure 4.2.
Figure 4.2 The function of selling
Source: Adapted from Zimmerman & Blyth (2013:228)
As indicated in Figure 4.2, personal selling’s main function is the creation of
dialogue between the salesperson and the buyer. Buyers have knowledge about
their business problems; while, on the other hand, salespeople understand their
products’ capabilities. The function of selling is that of creating dialogue, where
salespeople can solve the problems of customers through the product that they
sell. Knowledge is also shared about the environment and the industry in which
the business and salespeople operate. At trade shows, this sales function is
facilitated at the exhibit stand; where there is a dialogue between the exhibitors
and the attendees, as described in Chapter 3. An attendee attending a trade show,
for example such as IFSEC, might have theft problems in their business through
Area of dialogue
Shared knowledge of industry
Shared knowledge of business environment
Salespersons knowledge of
product capabilities
Buyer’s knowledge of
cooperate problem
© University of Pretoria

122
dialogue with one of the exhibiting staff’ however, while explaining their products
they might find a solution. Sales people at trade shows are involved in a number of
activities – not just explaining products.
Salespersons in B2B markets generate more than just sales (Ellis, 2011:318); and
they do more in identifying the customer’s needs, and providing solutions that add
value; since the nature of the products in B2B markets is unique (Dwyer & Tanner,
2009:366). Because of this uniqueness of B2B markets salespeople need
intensive product knowledge (Blem, 2007:224); and they are regularly exposed to
new, and often complex problems that require fast responses to provide solutions
for their customers (Lopez & McMillan-Capehart, 2009:98).
Selling is, therefore, an interpersonal communication process in which the sales
person not only discovers the customer’s needs and wants; but satisfies it – to the
long-term benefit of both parties, as pointed out (Jones, Stevens & Chonko, 2005:
5). The task of the salesperson is to get commitment from the customer; while they
are moving through the different stages in the sales process (Rix, 2006:10). This
happens at trade shows; where salespeople go through a multistage sales
process to share knowledge and build long-term relationships with their customers
(Ling-Yee, 2008:35).
As indicated, there are different viewpoints regarding personal selling. To
construct a definition that could be used for the purpose of this study, different
definitions will be discussed. Futrell (2011:7), for example, defines personal selling
as... “The personal communication of information to unselfishly persuade a
prospective customer to buy something – a good, a service, an idea, or something
else – that satisfies that individual’s needs”. Another definition is that of Weitz et al.
(2007:4). They define personal selling as a person-to-person business activity, in
which a salesperson discovers and satisfies the needs of a buyer to the mutual,
long-term benefit of both parties.
Rix (2006:10), on the other hand, defines personal selling as a process, whereby a
salesperson examines a customer’s situation and needs, provides information and
© University of Pretoria

123
advice, and seeks to gain a commitment from the customer that would be of
continuous benefit to both the customer and the salesperson.
From the definitions of personal selling, it is clear that personal selling is a process
or activity where one-on-one persuasive communication takes place between a
buyer and salesperson, with the aim of building a long-term relationship by selling
products or services that would satisfy their needs and is beneficial to both parties.
For the purpose of this study, personal selling at trade shows is defined as a
process where person-to-person communication takes place; and where
salespeople persuade and add value to the interaction with attendees at a trade
show – with the intention to prospect, sell or/and inform them; and in doing so, to
build long-term relationships to the benefit of both parties.
According to Manning, et al. (2014:62-64) personal selling has been an important
IMC mix elements for the last fifty years; and therefore, a brief history of the
development of selling will be provided next.
4.3 HISTORY AND DEVELOPMENT OF PERSONAL SELLING
Early salespeople were peddlers, hawkers, traders, itinerants that sold out of
caravans, where products were pushed and peddled to consumers and sales
people, who were seen as flamboyant product “pitchmen”, without any emphasis
on partnering (Lambert & Kerkhoff, 2005:23). Since then, sales have evolved to
where salespeople today build long-term partnerships with their customers.
In the beginning, only four eras in the origin of personal selling could be identified,
namely: the industrial revolution, post-industrial revolution, war and depression,
and professionalism or the modern era (Ingram et al., 2006:20-22); thereafter four
more eras were added, namely: marketing, consultative selling, strategic selling
and the partnering era (Manning & Reece, 2007:9). Yet another view is that sales
have moved through the four businesses-orientation cycles, namely: production
orientation, sales orientation, marketing orientation and relationship orientation
(Spiro, Stanton & Rich, 2007: 39).
© University of Pretoria
124
Manning and Reece (2007:9), Blem (2007:2-3) and Futrell (2011:45-47) link the
evolution of personal selling to the evolution of marketing; while Ingram et al.
(2006:21-23) discuss it from the perspective of personal selling and evolution, as
the viewpoint. Taking all the mentioned authors’ viewpoints into consideration;
there are minor differences between the development of personal selling and the
evolution of marketing; because marketing and selling developed simultaneously.
From each of the named eras different sales careers evolved. An example of this
is the medical trade shows, where the focus is more on informing attendees than
the selling of products. Next, a brief definition of the different types of sales
careers will be given.
4.4 SELLING CAREERS Selling careers can be classified in several ways. As with trade shows, selling
careers can be classified, according to industry types, such as consumer markets,
business markets and service markets (Rix, 2006:20-22). Another classification of
selling divides sales careers, according to channel members who sold to service
selling, retail selling, wholesale selling, and selling for a manufacturer (Blem,
2007:15; Futrell, 2011:10-14; Manning & Reece 2007:38-43). In this study, it will
be determined from which industry the exhibit staff are coming; therefore, the
different types of sales careers are discussed in more detail next.
Service market selling entails any business that sells any type of services. The
selling of services can include: financial services, radio, TV and Internet
advertising, newspapers and magazines, hotel, motel and convention centre
services, real estate, insurance, banking or business services (Manning & Reece,
2007:38 -39). A number of trade shows focus on the service industry. Trade
shows, such as Conversations on Architecture, or the Facilities Show Africa, for
example, focus on the selling of services, such as design programming and facility
services to attendees.
In manufacturing selling, different types of salespeople can be identified,
namely: outside and inside sales staff (Manning & Reece; 2007:42). Outside sales
© University of Pretoria

125
people include: field-sales people; sales engineers; and detail-sales people. Field
sales people sell to both new and existing customers that identify their needs and
prescribe the best products to satisfy or solve their problems (Manning & Reece,
2007:42). Sales engineers are sales people, who are trained engineers that are
experts on the know-how and have the ability to discuss, and assist customers in
solving technical problems (Blem, 2007:15; Wilson & Hunt, 2011:131); while detail
sales people primarily concentrate on promoting products, and not selling as such
(Futrell, 2011:13 & Blem, 2007:16). They are found in the pharmaceutical industry;
and their task is to specify a pharmaceutical company brand, and to persuade the
doctor to prescribe it to patients.
The second type of salespeople in manufacturing sales include inside salespeople
who make calls to smaller customers, to take orders and to support the field
salespeople. In sales at trade shows, all of the types of manufacturing salespeople
are to be found due to the nature of selling in B2B markets (vide. Section 3.4.2 &
3.4.3).
According to Manning and Reece (2007:40-41), and Futrell (2011:10) and Blem
(2007:15), retail salespeople sell goods and services to consumers for personal
use. There are three types of sellers in retailing, namely: inside or in-store
salespeople, direct seller to home or door-to-door salespeople and telephone
salespeople or telesales persons, as they are called. Inside or in-store salespeople are employed in hardware, clothing, gifts and many other businesses selling
automobiles, recreational vehicles, musical instruments, photographic equipment,
fashion apparel, furniture, TV’s and radios, computers and related accessories.
Direct to home, or door-to-door salespeople sell face-to-face to consumers in their
homes (Futrell; 2011:11); while telephone salespeople or telesales persons
contact buyers by telephone; and the calls can be either inbound or outbound.
Inbound calls are responding to customer queries or enquiries generated by
advertising or trade shows (Rix; 2006:23). Retail salespeople are not found at
trade shows; since the focus there is on B2B markets.
Wholesaler’s salespeople are also known as distributors or wholesaling
middlemen, who sell goods to other members in the supply chain (Jones, et al.,
© University of Pretoria

126
2005:23). They sell goods for resale; use in other production processes, and for
operational purposes (e.g. University buying supplies). A number of wholesalers
sell at trade shows, such as Markex, IFSEC, OSH or Africa Health; where the
wholesalers are the link between the manufacturers or the distributors from
overseas companies.
Personal selling is playing an increasingly important role in B2B markets. In many
business- marketing situations, trade shows in combination with personal selling
are used to sell and communicate on a number of different products and services
(Manning, et al., 2014:46). Therefore, personal selling as an IMC element in
business markets will be discussed.
4.5 PERSONAL SELLING AS A MARKETING TOOL IN BUSINESS MARKETS
Personal selling is now playing a far bigger role in the marketing mix of
businesses, with the spending of resources on selling activities increasing, and the
number of sales people employed (Manning, et al., 2014:42, Donaldson, 2007:4-
5). The reason for the afore-mentioned is that business markets are now operating
in more complex and competitive markets than in the past. And this has led to a
cross-functional relationship between sales and marketing (Dawes & Massey,
2006:346). As indicated in Figure 4.3, personal selling not only forms part of the
IMC mix of the organisation that communicates with customers; but it relates
directly back to the marketing department. Personal selling not only plays a role as
an element in the IMC mix of a business; but it provide a valuable tool for
marketing intelligence in the marketing department.
As indicated in Chapter, 3 salespeople obtain marketing intelligence at trade
shows by observing other exhibitors and in their own interactions with the
attendees.
From Figure 4.3, it is clear that personal selling is combined with other promotional
elements in communicating with customers; and it also influences other IMC
elements, in order to achieve successful results (Rix, 2006:14). Both personal
© University of Pretoria
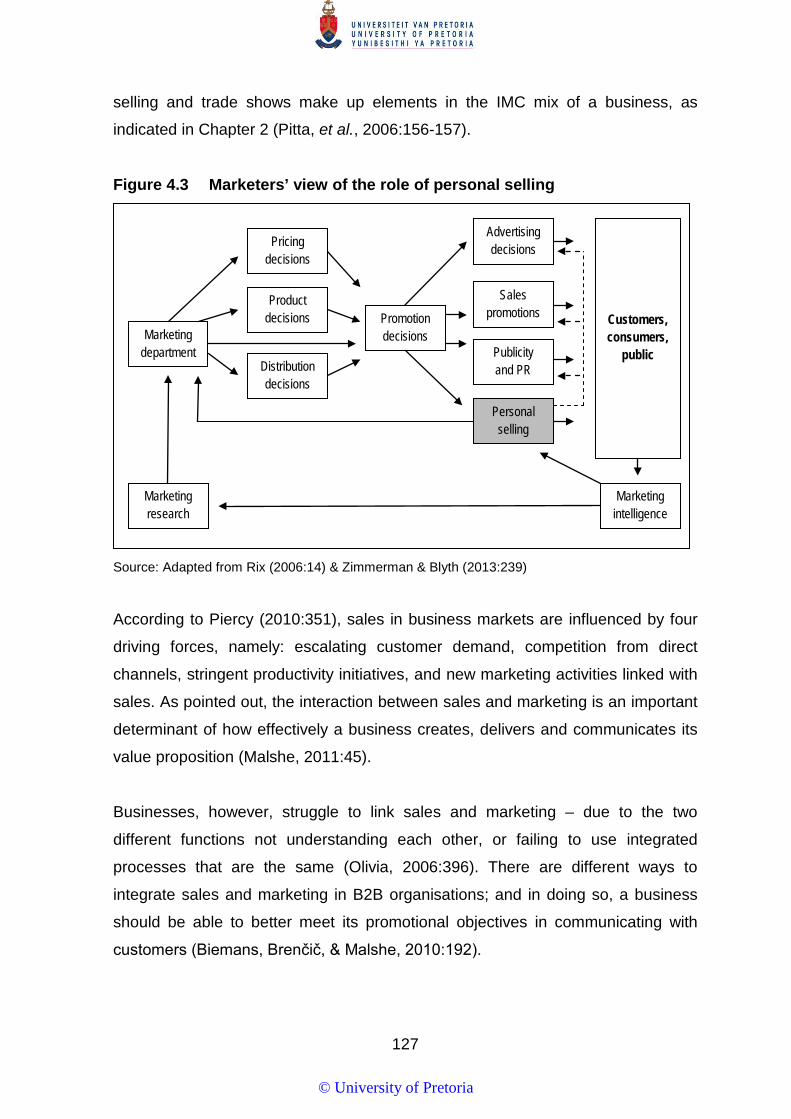
127
selling and trade shows make up elements in the IMC mix of a business, as
indicated in Chapter 2 (Pitta, et al., 2006:156-157).
Figure 4.3 Marketers’ view of the role of personal selling
Source: Adapted from Rix (2006:14) & Zimmerman & Blyth (2013:239)
According to Piercy (2010:351), sales in business markets are influenced by four
driving forces, namely: escalating customer demand, competition from direct
channels, stringent productivity initiatives, and new marketing activities linked with
sales. As pointed out, the interaction between sales and marketing is an important
determinant of how effectively a business creates, delivers and communicates its
value proposition (Malshe, 2011:45).
Businesses, however, struggle to link sales and marketing – due to the two
different functions not understanding each other, or failing to use integrated
processes that are the same (Olivia, 2006:396). There are different ways to
integrate sales and marketing in B2B organisations; and in doing so, a business
should be able to better meet its promotional objectives in communicating with
customers (Biemans, Brenčič, & Malshe, 2010:192).
Product decisions
Distribution decisions
Marketing research
Pricing decisions
Promotion decisions
Marketing intelligence
Personal selling
Publicity and PR
Sales promotions
Advertising decisions
Customers, consumers,
public Marketing
department
© University of Pretoria
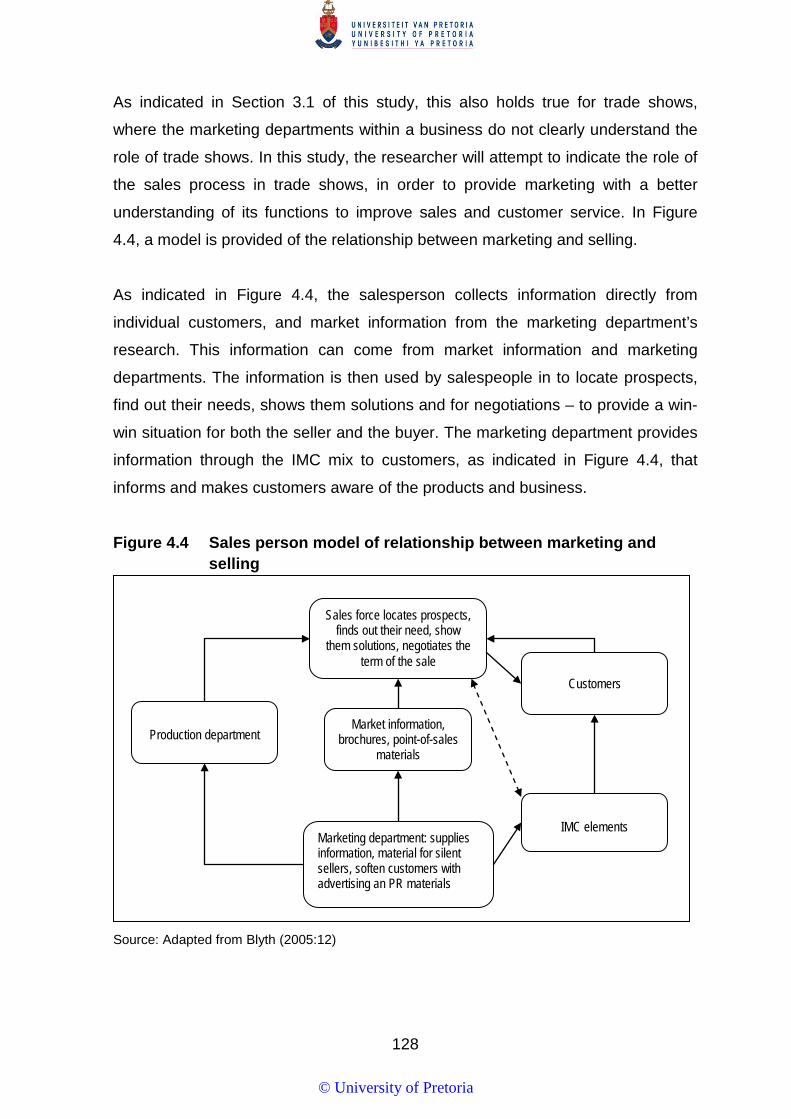
128
As indicated in Section 3.1 of this study, this also holds true for trade shows,
where the marketing departments within a business do not clearly understand the
role of trade shows. In this study, the researcher will attempt to indicate the role of
the sales process in trade shows, in order to provide marketing with a better
understanding of its functions to improve sales and customer service. In Figure
4.4, a model is provided of the relationship between marketing and selling.
As indicated in Figure 4.4, the salesperson collects information directly from
individual customers, and market information from the marketing department’s
research. This information can come from market information and marketing
departments. The information is then used by salespeople in to locate prospects,
find out their needs, shows them solutions and for negotiations – to provide a win-
win situation for both the seller and the buyer. The marketing department provides
information through the IMC mix to customers, as indicated in Figure 4.4, that
informs and makes customers aware of the products and business.
Figure 4.4 Sales person model of relationship between marketing and selling
Source: Adapted from Blyth (2005:12)
Sales force locates prospects, finds out their need, show
them solutions, negotiates the term of the sale
Market information, brochures, point-of-sales
materials
Customers
IMC elements
Production department
Marketing department: supplies information, material for silent sellers, soften customers with advertising an PR materials
© University of Pretoria

129
From the viewpoint of Figure 4.4, the marketing department’s role is that of a
support function, providing product offerings for customers from which to choose,
a pricing platform for salespeople from which to negotiate, and a distribution
system, as well as a way to generate promotions through advertising and publicity.
Trade shows, as indicated in Chapter 2, are one of the IMC elements in the B2B
marketing mix. For the purpose of this study, it is important to note that trade
shows can be arranged by either the sales or marketing department within an
organisation. The marketing or the sales department, therefore, provides the
salesperson all the support functions, as discussed in Figure 4.4.
As indicated in Chapter 3, promotional materials, social functions, the planning of
the exhibit stand, as well as the training of exhibit staff need to be done. In this
study, the researcher will determine whether the exhibit stand is manned by sales,
or marketing, or by other personnel from the exhibiting business – in order to
establish whether there are differences in how they use the sales process at trade
shows.
Although the integration of marketing and selling is important to an organisation, it
is personal selling that provides several advantages over other marketing
communication elements. Personal selling brings the human element into
marketing; it provides instant feedback to the customers; and it only sells to
qualified customers, thereby increasing sales (Van Heerden & Drotsky, 2011:31-
32).
As indicated in Table 4.1, salespeople in business markets have unique
characteristics. In Table 4.1, different authors’ views on the characteristics of
salespeople are indicated.
© University of Pretoria
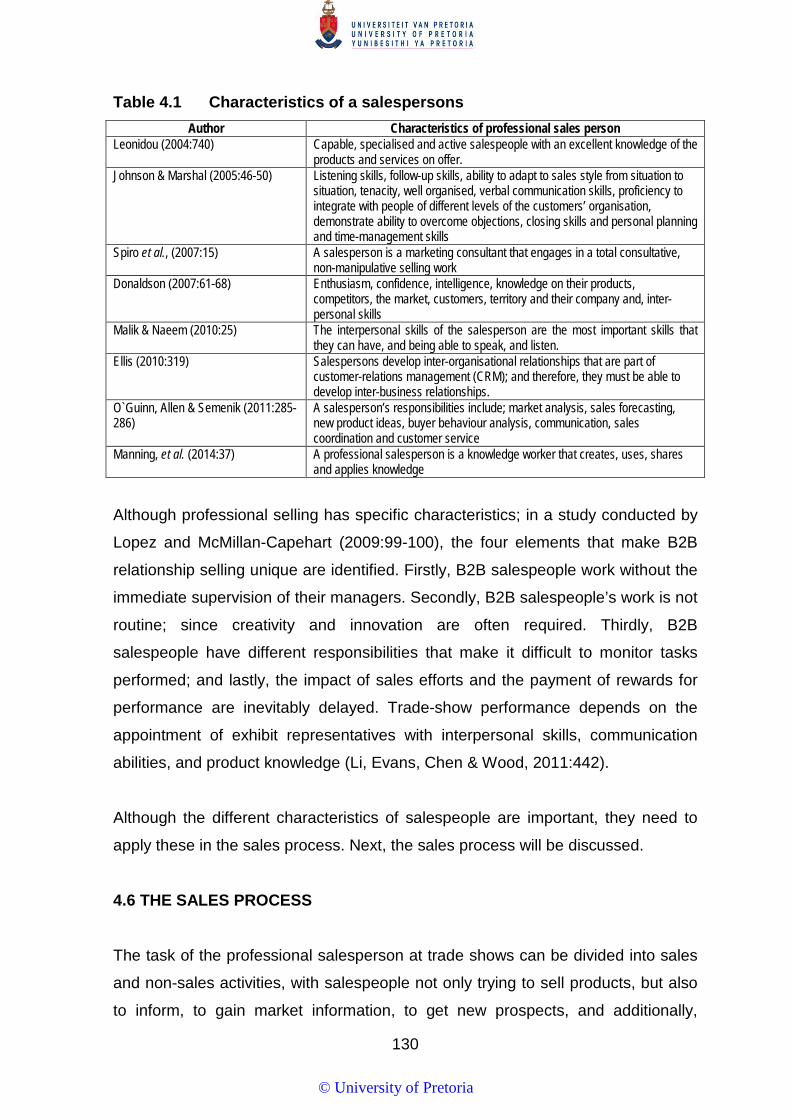
130
Table 4.1 Characteristics of a salespersons Author Characteristics of professional sales person
Leonidou (2004:740) Capable, specialised and active salespeople with an excellent knowledge of the products and services on offer.
Johnson & Marshal (2005:46-50) Listening skills, follow-up skills, ability to adapt to sales style from situation to situation, tenacity, well organised, verbal communication skills, proficiency to integrate with people of different levels of the customers’ organisation, demonstrate ability to overcome objections, closing skills and personal planning and time-management skills
Spiro et al., (2007:15) A salesperson is a marketing consultant that engages in a total consultative, non-manipulative selling work
Donaldson (2007:61-68) Enthusiasm, confidence, intelligence, knowledge on their products, competitors, the market, customers, territory and their company and, inter-personal skills
Malik & Naeem (2010:25) The interpersonal skills of the salesperson are the most important skills that they can have, and being able to speak, and listen.
Ellis (2010:319) Salespersons develop inter-organisational relationships that are part of customer-relations management (CRM); and therefore, they must be able to develop inter-business relationships.
O`Guinn, Allen & Semenik (2011:285-286)
A salesperson’s responsibilities include; market analysis, sales forecasting, new product ideas, buyer behaviour analysis, communication, sales coordination and customer service
Manning, et al. (2014:37) A professional salesperson is a knowledge worker that creates, uses, shares and applies knowledge
Although professional selling has specific characteristics; in a study conducted by
Lopez and McMillan-Capehart (2009:99-100), the four elements that make B2B
relationship selling unique are identified. Firstly, B2B salespeople work without the
immediate supervision of their managers. Secondly, B2B salespeople’s work is not
routine; since creativity and innovation are often required. Thirdly, B2B
salespeople have different responsibilities that make it difficult to monitor tasks
performed; and lastly, the impact of sales efforts and the payment of rewards for
performance are inevitably delayed. Trade-show performance depends on the
appointment of exhibit representatives with interpersonal skills, communication
abilities, and product knowledge (Li, Evans, Chen & Wood, 2011:442).
Although the different characteristics of salespeople are important, they need to
apply these in the sales process. Next, the sales process will be discussed.
4.6 THE SALES PROCESS
The task of the professional salesperson at trade shows can be divided into sales
and non-sales activities, with salespeople not only trying to sell products, but also
to inform, to gain market information, to get new prospects, and additionally,
© University of Pretoria

131
demonstrating goods to customers (Smith, Goplakrishna & Smith, 2004:61-75).
Selling is, therefore, a process in which to develop relationships, discovering
prospects’ needs, matching the organisation’s products with these needs, and
communicating benefits through informing, reminding, or persuading (Manning et
al., 2010:4-5). The sales process, however, is a complex phenomenon in B2B
markets; since that more than one individual is involved in negations; and the extra
dimension of complexity caused by the service element added to traditional B2B
selling, and the fact that collaborative relationships have increased between the
buyer and the seller (Åge, 2011:3).
Salespeople in business markets, therefore, have a number of activities that they
need to perform at trade shows. In this study, these activities will researched.
According to Ellis (2010:319:-320), a number of activities makes up the role of a
B2B salesperson at trade shows, namely: selling, prospecting, pre-sale service,
post-sale service, CRM, inbound-information handling, outbound-information
handling, market research, and sales teamwork. Zimmerman and Blyth,
(2013:228-229) provide a similar list of a B2B salesperson’s activities at trade
shows that include: identifying possible customers; identifying the problems of the
customers; establishing dialogue with prospects, refining the view of the problem
by taking dialogue into account, identifying solutions in the supply of business
capabilities, explaining solutions, representing the customers’ views of supplying
the company, ensuring a smooth process of supply that meets the customers’
needs and solving any after-sales problems, which might arise. All of these afore-
mentioned activities take place during the sales process.
It is suggested by Ingram et al. (2006:31), as indicated in Figure 4.5, that the
selling foundation and selling strategy would influence the sales process; and this
links up with the above, by pointing out the characteristics needed by a
salesperson. Figure 4.5 points out that the sales process falls into three broad
categories, namely: initiating customer relationships, developing customer
relationships, and enhancing customer relationships. The afore-mentioned
categories are the result of the salesperson’s non-selling activities; and the role
that customer relationships play in the selling process. Shannahan, Bush, Moncrief
© University of Pretoria
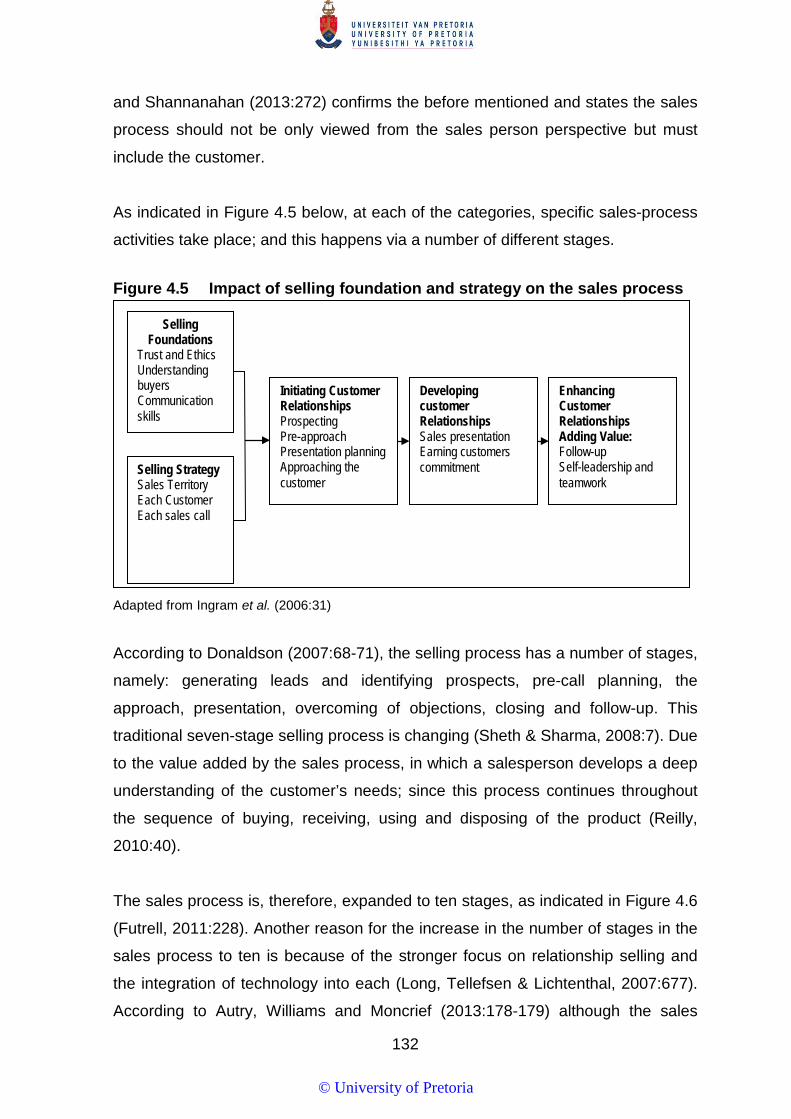
132
and Shannanahan (2013:272) confirms the before mentioned and states the sales
process should not be only viewed from the sales person perspective but must
include the customer.
As indicated in Figure 4.5 below, at each of the categories, specific sales-process
activities take place; and this happens via a number of different stages.
Figure 4.5 Impact of selling foundation and strategy on the sales process
Adapted from Ingram et al. (2006:31)
According to Donaldson (2007:68-71), the selling process has a number of stages,
namely: generating leads and identifying prospects, pre-call planning, the
approach, presentation, overcoming of objections, closing and follow-up. This
traditional seven-stage selling process is changing (Sheth & Sharma, 2008:7). Due
to the value added by the sales process, in which a salesperson develops a deep
understanding of the customer’s needs; since this process continues throughout
the sequence of buying, receiving, using and disposing of the product (Reilly,
2010:40).
The sales process is, therefore, expanded to ten stages, as indicated in Figure 4.6
(Futrell, 2011:228). Another reason for the increase in the number of stages in the
sales process to ten is because of the stronger focus on relationship selling and
the integration of technology into each (Long, Tellefsen & Lichtenthal, 2007:677).
According to Autry, Williams and Moncrief (2013:178-179) although the sales
Selling Foundations
Trust and Ethics Understanding buyers Communication skills
Selling Strategy Sales Territory Each Customer Each sales call
Initiating Customer Relationships Prospecting Pre-approach Presentation planning Approaching the customer
Developing customer Relationships Sales presentation Earning customers commitment
Enhancing Customer Relationships Adding Value: Follow-up Self-leadership and teamwork
© University of Pretoria
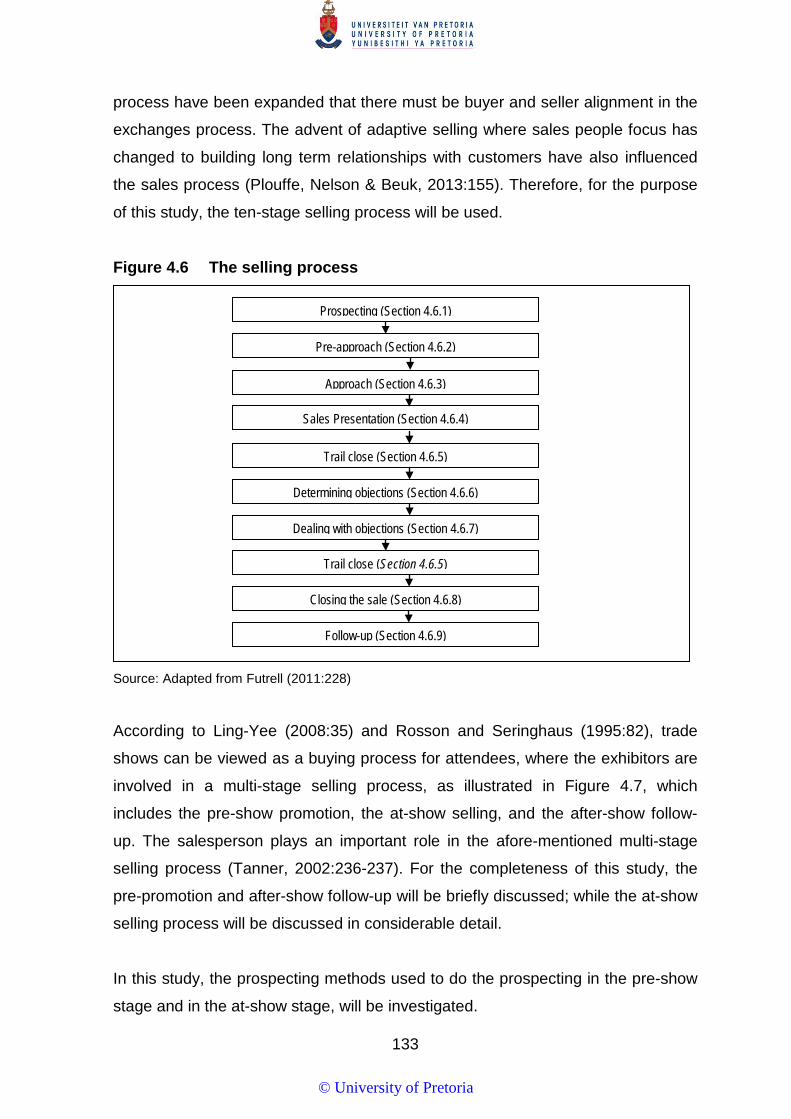
133
process have been expanded that there must be buyer and seller alignment in the
exchanges process. The advent of adaptive selling where sales people focus has
changed to building long term relationships with customers have also influenced
the sales process (Plouffe, Nelson & Beuk, 2013:155). Therefore, for the purpose
of this study, the ten-stage selling process will be used.
Figure 4.6 The selling process
Source: Adapted from Futrell (2011:228)
According to Ling-Yee (2008:35) and Rosson and Seringhaus (1995:82), trade
shows can be viewed as a buying process for attendees, where the exhibitors are
involved in a multi-stage selling process, as illustrated in Figure 4.7, which
includes the pre-show promotion, the at-show selling, and the after-show follow-
up. The salesperson plays an important role in the afore-mentioned multi-stage
selling process (Tanner, 2002:236-237). For the completeness of this study, the
pre-promotion and after-show follow-up will be briefly discussed; while the at-show
selling process will be discussed in considerable detail.
In this study, the prospecting methods used to do the prospecting in the pre-show
stage and in the at-show stage, will be investigated.
Pre-approach (Section 4.6.2)
Approach (Section 4.6.3)
Sales Presentation (Section 4.6.4)
Prospecting (Section 4.6.1)
Trail close (Section 4.6.5)
Determining objections (Section 4.6.6)
Dealing with objections (Section 4.6.7)
Trail close (Section 4.6.5)
Closing the sale (Section 4.6.8)
Follow-up (Section 4.6.9)
© University of Pretoria

134
The customer, the prospect, or the attendee at the trade show must be the starting
point for the pre-show promotion (Willis, 2004:12). Pre-show promotion is where
exhibitors invite customers to visit their exhibit stand by phone, direct mail and
advertising in trade magazines (Ling-Yee, 2008:36). Exhibitors can make use of
the so- called “traditional-acquisition instruments” to attract the customers to a
trade show that is made up of the elements of the IMC mix, such as posters,
flyers, telephone, special marketing campaigns, television, direct mail and radio,
etc. (Kirchgeorg, et al., 2010b:683). Figure 4.7 Possible trade-show selling process
Source: Own compilation.
Electronic communication, such as the internet and electronic mail, are also being
used more by exhibitors to attract customers to trade shows; since this is more
cost-effective (Kirchgeorg et al., 2010b:683). New IMC mix elements, such as
virtual pre-show internet websites are also used, where the invited attendees can
look at video clips of salespeople from different companies that would be at a
trade show, and so gain pre-show information (Wimberly, 2007:4).
Salespeople are, however, still the most important pre-show promotional IMC mix
element; since the attendees invited by salespeople are more likely to attend a
trade show (Tanner, 2002:236; Kirchgeorg et al., 2010b:683-684). As indicated in
Figure 4.7, prospecting is done before the trade show by the salespeople to
promote the trade shows to possible attendees, and at the show also. As pointed
Pre-show promotion
IMC elements
At-show selling process
• Prospecting • Pre-approach • Approach • Presentation • Trail Close • Objections • Dealing with
objections • Trail close • Close
After show follow-up
Lead follow-up Evaluating trade show Disseminating information
Prospecting for trade
show
© University of Pretoria
135
out, in this study, both prospecting before and at a trade show will be researched.
Due to the nature of this study, the researcher will not look at the after-show
follow-up. The after-show follow-up includes: following-up on leads obtained at
trade shows, and the information gathered being disseminated (Dwyer & Tanner,
2009:332-333).
The focus of this study is on the sales process at trade shows; therefore, the
stages of the sales process will be discussed.
4.6.1 Prospecting
According to Rix (2006:183), three concepts, namely: lead; prospect and
qualifying, must first be understood before prospecting can be defined. A lead is a
person or business, whose contact details are available; but who may, or may not
have a need for a salesperson’s product or service (Blem, 2007:65). A qualified
individual or business that has the potential to purchase sellers’ products or
services is a prospect (Futrell, 2011:229); and qualifying is the process of
evaluating a lead to see whether they meet the criteria to become a prospect
(Johnston & Marshall, 2010:137).
To qualify a lead as a prospect, it must have the following: money, authority, and
the desire to buy (Futrell, 2011:229). Another aspect is whether the prospect can
obtain extra value from the business offering, in the way the seller delivers
(Johnston & Marshall, 2010:137-138). For a lead to qualify as a prospect at a trade
show, it must have the following: budget or money, authority, need, timeframe, or
readiness to purchase, the potential sales volume, and account characteristics that
include: the type of business, the number of employees, turn-over per year; the
size of business, and who is the parent company (Stevens, 2005:134-135).
Prospecting is, therefore, the entire process of generating and qualifying leads
(Rix, 2006:183) until they become a qualified prospect (Johnston & Marshall,
2010:137; Blem, 2007:65). The process of prospecting is not just the identification
of prospects; but it includes the development of possible customers (Talloo,
© University of Pretoria
136
2007:202). Different methods can be used in prospecting; and the method used is
determined by the industry in which it operates (Weitz et al., 2007:174).
One method is to make use of trade shows, of which many are industry-related, as
pointed out in Section 3.4. Trade shows, such as IFSEC only focus on the safety
industry. So, it is easier for sales people to identify good prospects and close sales
at trade shows (Manning et al., 2010:186; Stevens, 2005:37).
According to Weitz et al. (2007:180), trade-show generated leads are three times
faster than other methods. At a trade show, the salespeople can make contact
with the same number of prospects in one day than are normally seen in one week
in the field – due to the number of prospects that visit an exhibition (Blem,
2007:299). Trade shows allow for salespeople to reach possible leads that would
have never been identified as prospects – due to the geographical or financial
constraints (Zimmerman & Blyth, 2013:256). It is important to note, however, that
due to the nature of trade shows, as discussed in Section 3.3, salespeople only
have a short period of time at the exhibit stand with attendees; and they must
recognise any possible prospects as quickly as possible (Lee & Kim, 2008:787;
Rix, 2006: 195).
As pointed out, and in Section 3.6.2.5 , salespeople gather intelligence at a trade
show of those attendees showing interest and follow-up after the show (Jones et
al., 2005:186). Trade shows can provide leads in several ways, namely: a list of
the attendees could be a source of prospects; networks can be developed or
improved; and sales can be made to customers visiting the exhibit stand (Johnston
& Marshall, 2010:146). Attendees at trade shows are evaluated on the basis of
their degree of interest; and if the salesperson does not have time to assist them,
another appointment later at the exhibit stand, or somewhere else should be made
(Blem, 2007:299). This can be done by lead generation, where qualified attendees’
contact details are captured; and a follow-up plan is developed for after the trade
show (Rix, 2006:195).
To assist in the follow-up and the information-gathering, salespeople must keep a
record of their prospects.
© University of Pretoria
137
According to Manning et al. (2010:186), the information of a trade-show attendee
must be carefully recorded, once a visitor has been identified as a qualified
prospect. New technology is used in many trade shows, in which the attendee’s
information is electronically captured; as the attendee visits the exhibit booth by
means of a visitor’s card (Rix, 2006:195). At trade shows, such as Markex for
example, each attendee’s visitor card has a bar code on it. This is scanned at the
exhibit stands that are visited. Many organisations still make use of the business
card-in-a-bowl method to obtain leads.
At trade shows, such as Afrimold, card-in-a-bowl is still used; since the number of
attendees and exhibitors is limited. The business cards-in-a-bowl method, is
however, viewed as being outdated; and that only qualified prospects’ information
must be captured electronically at the show, directly after interacting with the
attendees at the exhibit stand (Woolard, 2007:34). Another method is to make use
of lead forms. This can be used to get information from the attendees, and to
determine whether they qualify as prospects, and where they are in the buying
cycle (Alessandra et al., 2009:95).
Lead forms are forms created by exhibitors, on which information of the attendees
who visit the exhibit stand is captured. To start the process of interaction in the
sales process, the salesperson needs to plan; and this takes place in the pre-
approach stage.
4.6.2 Pre-approach
According to Donaldson (2007:69), preparation for a sales call is in direct
correlation with the success of the salesperson. It is, therefore, necessary for the
salesperson to learn everything they can about the prospects’ business and relate
that back to their benefit (Lodato, 2006:60). The pre-approach, however, also
includes a number of other activities, such as: planning the sales call; determining
the sales’ call objectives, developing a customer profile, developing customer
benefits, and developing a sales presentation (Futrell, 2011:264; Weitz et al.,
2007:198). In the planning for trade shows, however, many exhibitors make the
© University of Pretoria
138
mistake of not communicating with the exhibit personnel what their plan is for the
show (Blythe & Rayner, 1996:21-22).
According to Dwyer and Tanner (2009:328), objectives at trade shows must not
only include the acquisition of new customers, but also the planning for current
customers who might attend the trade show as well. Selling objectives for sales
people at trade shows are more than just the selling of products (Kirchgeorg,
Springer and Kästner, 2010a:66-68); and they can include: learning the attendees’
needs, product line, which are the important competitors, and key contacts (Pitta
et al., 2006:161). Salespeople can also establish information from prospects on
their buying process, current suppliers and future plans in the initial stages of the
sales interview (Donaldson, 2007:69).
It must also be established who would be the main decision-maker within an
organisation, and how long the decision would take (Ladato, 2006:61). Once
information has been gathered on the attendees, the salesperson needs to set up
a customer-benefit plan, where exhibitors can sell to the wholesalers and the
retailers.
Trade shows, such as Interbuild Africa focus on the retailers and wholesalers
(EXSA, 2012:35). Businesses that sell to retailers or wholesalers need to develop
customer-benefit plans, as part of their selling activities. According to Futrell
(2044:264-266), a customer-benefit plan is a four-step process. Firstly, the
features, advantages and benefits that the salesperson’s business will provide the
prospect are selected. Secondly, a marketing plan is developed. Thirdly, a
business proposition is developed beforehand that would include pricing,
discounts and mark-up; and lastly, a suggested purchase order is planned.
In the case of trade shows this would probably be done in the follow-up after the
show.
The final step in the sales-planning process is the development of the presentation
that will be used at the exhibit stand. In developing the presentation, salespeople
decide on the type of presentation; and they must decide on how much technology
© University of Pretoria
139
should be used, how formal the presentation should be, how long the presentation
must be, what material should be sent to the prospects; and these facts are used
as part of the presentation (Johnston & Marshall, 2010:153-154). The afore-
mentioned issues are of importance in a sales presentation at a trade show, as
indicated in Section 3.6.
Exhibitors need to decide what technology will be used at the exhibit stand, how
long the presentation would be – due to the time constraints faced at a trade show;
and what type of promotional material will be handed out at the trade show. Once
the sales call has been planned, the next step is the actual contact with the
prospect (Talloo, 2007:202).
In this study, the researcher will determine whether exhibitors have set up
objectives and plans before the trade show, and whether the exhibit staff is aware
of the objectives.
4.6.3 Approach
According to Havaldar and Cavale (2007:2.12), the first impression that the
salesperson makes is based on their appearance, attitude and opening line; since
a prospect will form an opinion within a few seconds of meeting the salesperson;
and they will decide whether they want to do business with the salesperson or not
(Koekemoer, 2005:250). A salesperson must introduce himself and attract the
attention of the prospect, in order to create interest (Jain, 2010:403). This must be
done with body language that is polite and casual; since this is the first element
whereby the attendees evaluate exhibit stand staff (Johansson & Bengtsson,
2011:73).
At this first stage, the salesperson either engages or disengages from the sales
process (Stevens, 2005:131-137). If the attendee qualifies as a prospect, the
salesperson will engage and then discuss or demonstrate the product. If the
attendee does not qualify as a prospect, the salesperson disengages. If the
salesperson identifies the attendee as a qualified prospect, a process would need
to be followed, in order to get the customer to take action.
© University of Pretoria

140
To get the attendee to take action, the salesperson can follow the AIDA model
(Rix, 2006:212-213). The salesperson must, firstly, get the attention of the
prospect; thereafter s/he must generate an interest in the sales message, and then
stimulate a desire for the product; and lastly, get the prospect to move into action.
The first two elements of the AIDA model are to get attention and create interest.
In order to do this, the prospect must be approached in a manner that would
facilitate the afore-mentioned. Manning et al. (2010:223-226), Johnston and
Marshall (2010:173-174), Jain (2010:403), Havaldar and Cavale (2007:2.12),
Weitz et al. (2007:226), Rix (2006:200) and Koekemoer (2005:251) identify
different methods of approaching the prospect; each of which can be used at trade
shows; so, all of these methods would need to be discussed in detail:
• The introductory approach – is used when meeting a prospect for the first
time. In this approach, the salesperson states his/her name, the company’s,
name, and the reasons for the approach. This approach is used at trade
shows extensively; since most attendees are interacted with, for the first
time at the trade show.
• The referral opener – in this approach, the salesperson tells the prospect
who referred them to the purchaser. This approach would most probably
not be used at a trade show; since the salesperson would most probably
not know the attendee who is visiting the exhibit stand.
• Benefit approach – with this approach, the salesperson opens the
presentation with the benefit that their product could provide to the
prospect. In starting with solving at least one of the prospect’s problems,
immediate mutual trust is built by the salesperson. The salespersons at a
trade show would start with a demonstration of their product, what it can do;
and then, they would start with their presentation.
• Product approach – is used when the salesperson has the product
available to show to the customer. This approach is useful if the product is
new, different or colourful. The product approach is used at trade shows
extensively; where products are usually displayed and then used to move
into a demonstration in the sales presentation. At trade shows, such as
Afrimold, for example, the exhibitors would demonstrate their machinery by
making promotional moulds at the exhibit stand to attract the attendees.
© University of Pretoria

141
• Complimentary approach – the salesperson compliments the prospect on
their business or work ethic. In using this approach, the salesperson must
ensure that they are sincere, so as not to offend the prospect. At trade
shows this approach might be difficult; since the staff manning the exhibit
stand do not know the attendee – until they start talking to them.
• Premium approach – involves giving the prospect a free sample or
promotional material. The premium approach is very useful to get the
customer’s attention; and it is used at trade shows; where the attendees are
given materials, such as brochures and catalogues. Free gifts are
frequently used at trade shows, on which the name of the exhibiting
company appears. This should help to attract prospects to the exhibit stand
(Dwyer & Tanner 2009:331). At the Markex trade show, this approach is
used by many exhibitors; who give away samples of the product they
produce.
• Shock approach – is used by making the prospect think seriously about a
certain reality related to the product sold by the salesperson; and they can
then play on the emotions of the attendees at the trade show. At trade
shows, such as IFSEC and OSH, many of the exhibitors make use of
graphic displays of disease, or work-related injuries, for example, in order to
attract attendees to their exhibit stand.
• Question approach – in this approach, the salesperson asks the prospect
a question with aim of getting a reply that would then lead into the sales
presentation. This approach allows the prospect to think about how the
salesperson can solve their problem and get the prospect interested in the
sales presentation. The question approach is used at trade shows by
salespersons to get the prospect involved, to determine the attendees’
buying role, and what type of business the prospect is involved in.
In this study, the researcher will investigate which of the introductory methods
salespeople use at trade shows – to open their sales presentation.
According to O`Guinn et al. (2011:293), the initial contact with the prospect must
be professional, well-planned; and the sales person must have clear-set goals to
establish themselves as an important source of information. In the study of
© University of Pretoria
142
Jaramillo and Marshall (2004:22), critical success factors were identified in selling
that relate to the presentation, namely: the salesperson must approach the
customer with an opening statement about themselves, use non-technical words,
clarify benefits via demonstrations, use comparisons and testimonials, and follow
up after the sale. Once the salesperson has approached the attendee at the
exhibition exhibit stand; the next step is to sell the product; and this is done in the
sales presentation.
4.6.4 Sales presentation
According to Blem (2007:82), the sales presentation is the method used by the
salesperson to convey the message to the client through words; or it can appeal to
the other senses of the prospect. A salesperson can use different sales
presentation methods, depending on the situation or the type of product that is
sold (Havaldar & Cavale, 2007:2.13), and the amount of talking that is done
(Futrell, 2011:280). Geiger and Kelly (2014:229) indicate that although sales
presentations are using more technology than in the past personal interaction still
important in building relationships. Sales presentations that can be used include
structured or semi-structured presentations; where the salesperson does the
majority of the talking. For a structured presentation, the salesperson uses
memorised or canned selling; and this is also done with semi-structured formula
selling.
In unstructured or customised presentations, there is greater degree of interaction
between the buyer and seller – who does the same amount of talking.
Unstructured presentations make use of need-satisfaction selling and customised
presentations incorporating problem-solution selling (Futrell, 201:280). At trade
shows selling is more unstructured and will be adapted to each customer (Søilen,
2013:125). In unstructured sales presentation the sales person follow a scripted
outlay of what have to be said, while in customized the presentation is done by
asking questions. Next, each of the selling methods will be discussed, including
the group presentation. In this study, the research will investigate what type of
sales presentation is employed by the salespeople who man the exhibit stand.
© University of Pretoria

143
The memorised-sales presentation
With the memorised sales presentation, the salesperson presents all the product
features, and then asks the prospect to buy (Havaldar & Cavale, 2007:2.14). This
means the salesperson is given a prepared speech about the company’s products;
and that this is then repeated in the same format to all the customers (Koekemoer,
2005:252). The memorised sales presentations are very effective; where there are
not a lot of differences between the customers’ needs, and the product is
straightforward (Dwyer & Tanner, 2009:331). The advantages of the memorised
sales presentation include: that the salesperson can be trained quickly; all the
customers are receiving the same sales message; and the sales presentation can
be written to closely resemble other marketing communication (Zimmerman &
Blyth, 2013:237).
For example, at trade shows, such as OSH; where a number of products are
standardised, such as safety gloves or glasses, exhibitors can train their exhibit
staff to make use of the memorised-sales presentation. By doing this, they save
time, and provide all the attendees with the same information on the products that
are being sold.
As indicated in Chapter 3, at trade shows the salespeople have limited time to sell
or build relationships with the attendees (Lee & Kim, 2008:787). The memorised
sales presentation can be used; since it is an effective sales method, especially
when the available selling time is short (Futrell, 2011:280). However, Lambert and
Kerkhoff (2005:29) contend that the buying process in B2B is more complex; and
the salesperson must establish the key buying role of the buyers. To establish the
key buying role and the needs of the prospect, the salesperson might need to ask
more questions; and a less-structured presentation would have to be used
(Zimmerman & Blyth, 2013:227). In cases where some information is needed from
the attendees, the salesperson can make use of the formula-sales presentation.
© University of Pretoria

144
The formula-sales presentation
According to Havaldar and Cavale (2007:2.14) and Blem (2007:84), the formula or
semi-structured sales presentation is structured on the AIDA model, as discussed
in Section 4.6.3. A simpler view of the formula-sales presentation is that the
salesperson gets the prospect’s attention, talks about the product’s features, its
advantages and benefits; and then starts asking questions (Futrell, 2011:284-285).
The formula-presentation method is less structured and allows for the salesperson
to adapt the sales call once the prospect’s needs have been identified. The
formula-presentation method would be the most useful for salespeople at trade
shows; since they can follow a semi-structured presentation; but, if necessary
adapt it to the customer’s needs.
Successful salespeople use semi-structured presentations when selling (Weitz et
al., 2007:180); and one of the skills that salespeople must be re-trained on is how
to close a sale (Johlke, 2006:315). At trade shows, such as the Cape Town
International Industrial show, companies that sell small hand-held tools make use
of formula selling. Each attendee is given a similar presentation; and the
presentation is only slightly adapted, depending on what the hand-held tool will be
used for. Although the formula selling works for many exhibitors with certain types
of products and services; salespeople need more information, before doing a
presentation; and they must be able to use a need-satisfaction presentation.
The need-satisfaction presentation
With the need-satisfaction presentation method the salesperson firstly determines
the customer’s needs by asking questions (Havaldar & Cavale, 2007:2.15); and
this is, therefore, seen as the most difficult and creative form of selling (Futrell,
2011:287). Dwyer and Tanner (2009:371) states that in need-satisfaction,
presentation is a twofold process: firstly, determining the prospect’s needs, and
then making the sales presentation. Futrell (2011:284) disagrees with Dwyer and
Tanner (2009:371); and s/he asserts that the need-satisfaction presentation
consists of three stages, namely: need development; need awareness; and need
satisfaction. In the need-development stage, the customer does the majority of
© University of Pretoria
145
talking; and the discussions focus on the prospect’s needs. The need-awareness
stage occurs when the salesperson takes over the situation by re-stating the
customer’s need, in order to shed light on the situation. Lastly, in the need
satisfaction stage, the salesperson provides the prospect with solutions to the
needs that could be beneficial for both parties.
An example of this is at IFSEC trade show; where the exhibitors selling security
fencing would first ask the attendee what they would be using the fence for; then
they re-state the purpose or use; and lastly, they provide the attendee with a
solution by acquiring one of the fences that they sell. In many B2B markets, the
salesperson first needs to do an analysis of the customer’s specific problems, and
then make use of the problem-solution prescribed by the presentation.
The problem-solution presentation The problem-solution presentation is best suited for highly technical or complex
products; where the possible solutions need to be adapted to the specific
customer requirements (Van Heerden & Drotsky, 2010:183). In the problem-
solution presentation, the salesperson’s first task is to get permission from the
customer to do an analysis of the business needs (Koekemoer, 2005:254).
According to Futrell (2011:287) and Blem (2007:86), the analysis that is done for
the problem-solution presentation comprises six steps:
1) The prospect must be persuaded to allow the salesperson to do the
analysis.
2) The actual analysis is implemented.
3) Agreement is reached between the prospect and the salesperson on the
problem; and the prospect wants to solve it.
4) A proposal is prepared for the solution of the prospect’s problem.
5) The sales presentation is prepared by using the analysis and the proposal.
6) The salesperson does the sales presentation.
The problem-solution presentation would most probably not be done at trade
shows, due to time constraints and the nature of trade shows, as discussed.
However, at trade shows, like Afrimold for example, the exhibit staff of many
© University of Pretoria
146
exhibitors makes follow-up appointments with the attendees, in order to do an
analysis of their specific business.
At many trade shows, the exhibitors do group presentations. These are done to
save time and communicate with as many attendees as possible.
The group presentation
In group presentations, a number of different people can be present; the
salesperson must determine the needs of each individual, who will attend, in order
to prepare for the presentation (Manning et al., 2010:273; Weitz et al., 2007:241).
At trade shows, the salesperson must determine whether the prospect is part of a
buying team; and if so, set up a private demonstration at the show for the whole
group (Stevens, 2005:135). This is done because buying professionals play
different roles within an organisation’s decision-making forum (Lambert & Kerkhoff,
2005:29).
According to Halvadar (2014:260-261) and Futrell (2011:289), six guidelines must
be followed when selling to groups. Firstly, the salesperson starts with an
introduction, stating his/her name, the company’s name, and the purpose of the
presentation. Secondly, the salesperson must establish credibility by giving a
background to the business, and to whom they have sold in the past. Thirdly, they
must hand out a list of the businesses to which they have sold in the past, and
how their problems were solved. Fourthly, state a benefit or advantage of the
business; and how this is better than their competitors. Fifthly, provide the seller
with a quality assurance, such as what guarantees are given and the qualifications
of the business in the specific field.
Lastly, the sales presentation must be adapted to fit all types of buying-
behavioural styles. Many of the guidelines can be applied in trade shows. This is
one way that an exhibitor can show the attendees how they can solve their
problems – through demonstrations.
© University of Pretoria
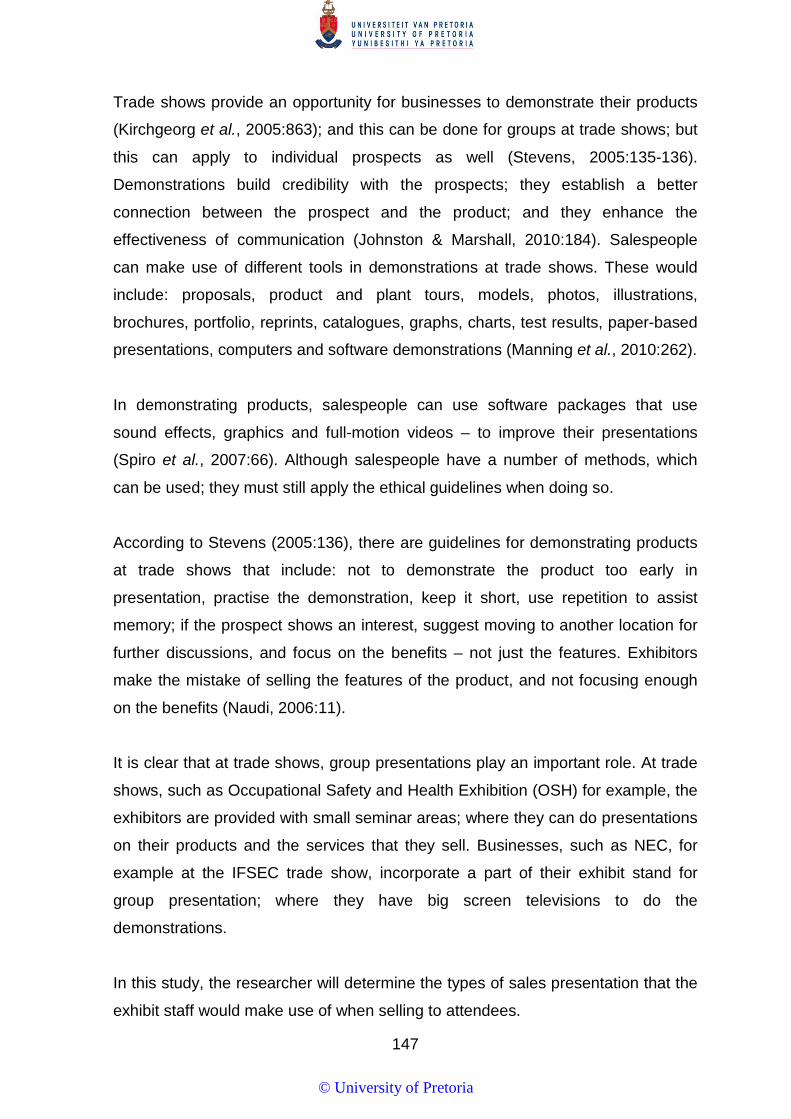
147
Trade shows provide an opportunity for businesses to demonstrate their products
(Kirchgeorg et al., 2005:863); and this can be done for groups at trade shows; but
this can apply to individual prospects as well (Stevens, 2005:135-136).
Demonstrations build credibility with the prospects; they establish a better
connection between the prospect and the product; and they enhance the
effectiveness of communication (Johnston & Marshall, 2010:184). Salespeople
can make use of different tools in demonstrations at trade shows. These would
include: proposals, product and plant tours, models, photos, illustrations,
brochures, portfolio, reprints, catalogues, graphs, charts, test results, paper-based
presentations, computers and software demonstrations (Manning et al., 2010:262).
In demonstrating products, salespeople can use software packages that use
sound effects, graphics and full-motion videos – to improve their presentations
(Spiro et al., 2007:66). Although salespeople have a number of methods, which
can be used; they must still apply the ethical guidelines when doing so.
According to Stevens (2005:136), there are guidelines for demonstrating products
at trade shows that include: not to demonstrate the product too early in
presentation, practise the demonstration, keep it short, use repetition to assist
memory; if the prospect shows an interest, suggest moving to another location for
further discussions, and focus on the benefits – not just the features. Exhibitors
make the mistake of selling the features of the product, and not focusing enough
on the benefits (Naudi, 2006:11).
It is clear that at trade shows, group presentations play an important role. At trade
shows, such as Occupational Safety and Health Exhibition (OSH) for example, the
exhibitors are provided with small seminar areas; where they can do presentations
on their products and the services that they sell. Businesses, such as NEC, for
example at the IFSEC trade show, incorporate a part of their exhibit stand for
group presentation; where they have big screen televisions to do the
demonstrations.
In this study, the researcher will determine the types of sales presentation that the
exhibit staff would make use of when selling to attendees.
© University of Pretoria
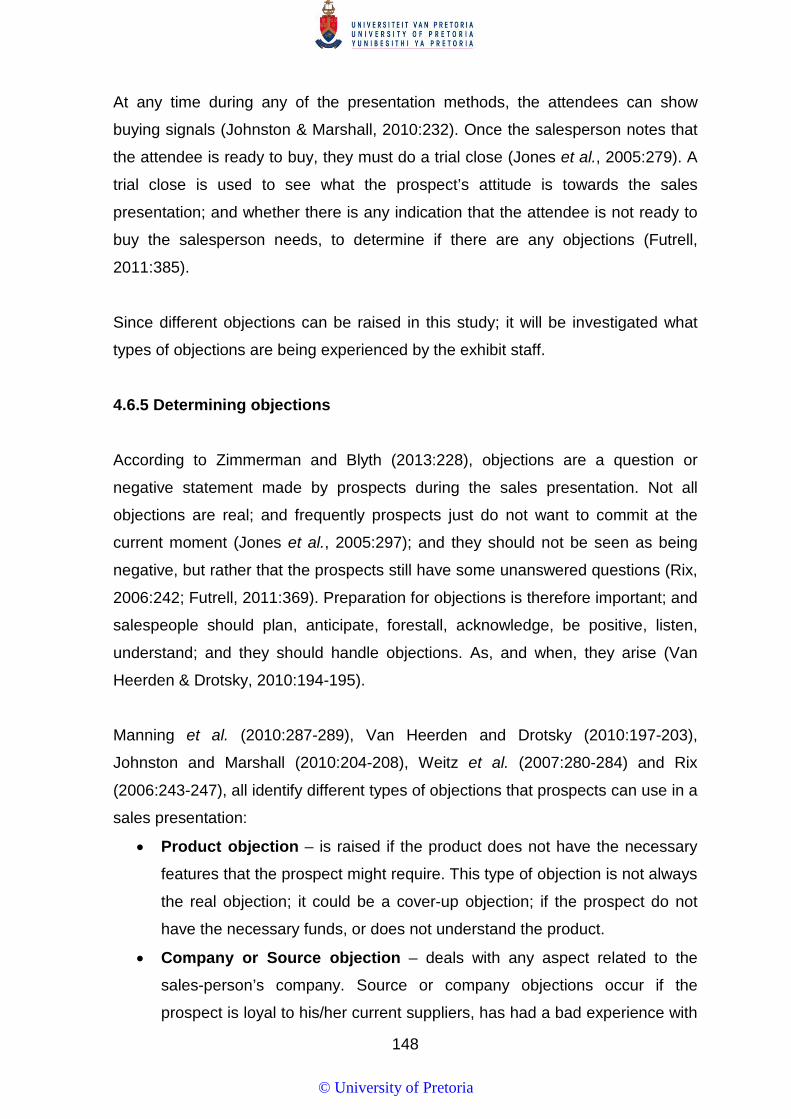
148
At any time during any of the presentation methods, the attendees can show
buying signals (Johnston & Marshall, 2010:232). Once the salesperson notes that
the attendee is ready to buy, they must do a trial close (Jones et al., 2005:279). A
trial close is used to see what the prospect’s attitude is towards the sales
presentation; and whether there is any indication that the attendee is not ready to
buy the salesperson needs, to determine if there are any objections (Futrell,
2011:385).
Since different objections can be raised in this study; it will be investigated what
types of objections are being experienced by the exhibit staff.
4.6.5 Determining objections
According to Zimmerman and Blyth (2013:228), objections are a question or
negative statement made by prospects during the sales presentation. Not all
objections are real; and frequently prospects just do not want to commit at the
current moment (Jones et al., 2005:297); and they should not be seen as being
negative, but rather that the prospects still have some unanswered questions (Rix,
2006:242; Futrell, 2011:369). Preparation for objections is therefore important; and
salespeople should plan, anticipate, forestall, acknowledge, be positive, listen,
understand; and they should handle objections. As, and when, they arise (Van
Heerden & Drotsky, 2010:194-195).
Manning et al. (2010:287-289), Van Heerden and Drotsky (2010:197-203),
Johnston and Marshall (2010:204-208), Weitz et al. (2007:280-284) and Rix
(2006:243-247), all identify different types of objections that prospects can use in a
sales presentation:
• Product objection – is raised if the product does not have the necessary
features that the prospect might require. This type of objection is not always
the real objection; it could be a cover-up objection; if the prospect do not
have the necessary funds, or does not understand the product.
• Company or Source objection – deals with any aspect related to the
sales-person’s company. Source or company objections occur if the
prospect is loyal to his/her current suppliers, has had a bad experience with
© University of Pretoria

149
the salesperson’s company in the past; or the prospect is concerned about
the company’s ability to deliver.
• No-need objection – This occurs, when the prospect feels that s/he does
not need the sales-person’s product; this could be due to not wanting to
change or a way to get rid of the salesperson. In certain cases, it could be
caused by the salespeople not doing their homework, or giving poor sales
presentations.
• The stalling objection – is raised by the prospect if s/he wants to postpone
or decides not to make an immediate decision. This objection can, in many
cases, be a smokescreen objection if the customer does not see the
benefits of buying the salesperson’s product.
• Hidden objection – in this objection, the prospect uses small and
unimportant objections to hide the real reason why they are objecting.
• Financial or price objection – this is the most common objection in sales.
There are different reasons for the price objection. Firstly, the prospect
might not have the money to buy; s/he might want to get a better price; s/he
can get the product more cheaply somewhere else; or s/he does not see
the product as being value for money.
As pointed out in this study, the objections will be investigated to determine which
objections occur at trade shows. Once an objection has been raised; the next step
is for the salesperson to deal with the objections.
4.6.6 Dealing with objections
According to Manning et al. (2010:290), after the prospect’s objections have been
disclosed, the salesperson must deal with the objections. Salespeople must clearly
determine the prospect’s objection by asking questions, and then overcome or
deal with it in an effective manner (Talloo, 2007:203) by handling objections with
confidence, intelligence, enthusiasm and patience (Jain, 2010:404). In dealing with
objections, salespeople can use a number of different methods. In this study, the
different methods that salespeople use when manning the exhibit stand will be
researched; therefore, next the different methods will be discussed.
© University of Pretoria

150
Manning et al. (2010:290-294), Johnston and Marshall (2010:173-174), Blem
(2007:131-136), Havaldar and Cavale (2007:2.12), Weitz et al. (2007:288-296),
Rix (2006:251-253) and Koekemoer (2005:256-258) identify the following methods
to overcome objections:
• Direct denial: This type of technique is used when the prospect makes an
incomplete or incorrect objection; then, the salesperson denies it directly. In
using direct denial, the salesperson must take care not to offend; since the
prospect that might see the denial as an attack.
• Indirect denial: The salesperson agrees with the prospect in the beginning;
and the salesperson makes the objection seem to be important; but and
then denies the objection. This technique is more courteous and tactful than
a direct denial.
• Pass it by: If the prospect makes an objection that does not need to be
answered; the salesperson just lets it go. The objection might be due to
frustration, anger or fear; and, as such, it does not need to be answered.
• Compensation: Certain objections can be valid ones. The salesperson
then points to a feature of their product that offsets the stated defect in the
product.
• Boomerang: In this technique, an objection given by the prospect, and the
decision not to buy – can be turned into a reason to buy.
• Third party: The prospect’s objection is answered by someone else – be it
an expert, past customers, a proven statement, or a reliable source. This
technique must only be used if the source of the information is correct and
can be validated. As indicated in Chapter 3, many exhibitors at trade shows
place engineers at their exhibit stand; because they might be able to help
answer technical questions in regard to the products or services.
• Postponing: Many objections are made before the salesperson has
finished the sales presentation; and the prospect would still provide an
answer for the objection. In such cases, the salesperson should hesitate in
answering the objection.
In this study, the different methods applied to deal with objections by exhibit staff
will be investigated. Once the objections have been dealt with, the salesperson
© University of Pretoria
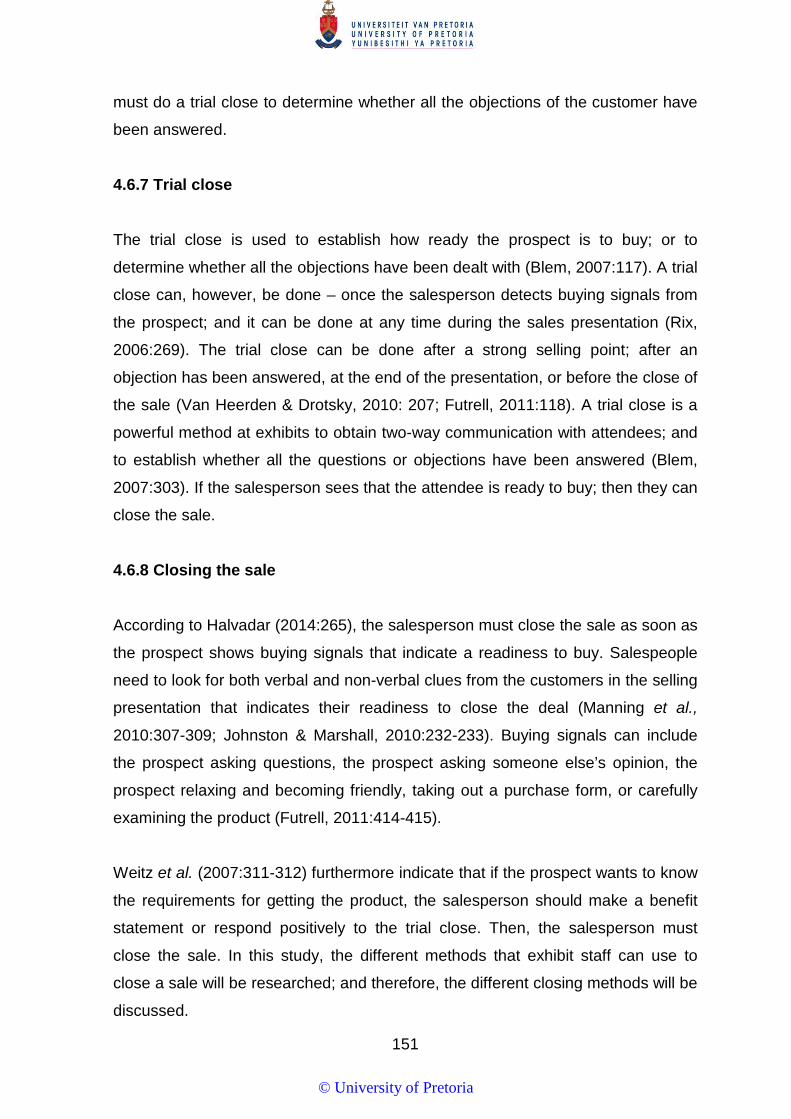
151
must do a trial close to determine whether all the objections of the customer have
been answered.
4.6.7 Trial close
The trial close is used to establish how ready the prospect is to buy; or to
determine whether all the objections have been dealt with (Blem, 2007:117). A trial
close can, however, be done – once the salesperson detects buying signals from
the prospect; and it can be done at any time during the sales presentation (Rix,
2006:269). The trial close can be done after a strong selling point; after an
objection has been answered, at the end of the presentation, or before the close of
the sale (Van Heerden & Drotsky, 2010: 207; Futrell, 2011:118). A trial close is a
powerful method at exhibits to obtain two-way communication with attendees; and
to establish whether all the questions or objections have been answered (Blem,
2007:303). If the salesperson sees that the attendee is ready to buy; then they can
close the sale.
4.6.8 Closing the sale
According to Halvadar (2014:265), the salesperson must close the sale as soon as
the prospect shows buying signals that indicate a readiness to buy. Salespeople
need to look for both verbal and non-verbal clues from the customers in the selling
presentation that indicates their readiness to close the deal (Manning et al.,
2010:307-309; Johnston & Marshall, 2010:232-233). Buying signals can include
the prospect asking questions, the prospect asking someone else’s opinion, the
prospect relaxing and becoming friendly, taking out a purchase form, or carefully
examining the product (Futrell, 2011:414-415).
Weitz et al. (2007:311-312) furthermore indicate that if the prospect wants to know
the requirements for getting the product, the salesperson should make a benefit
statement or respond positively to the trial close. Then, the salesperson must
close the sale. In this study, the different methods that exhibit staff can use to
close a sale will be researched; and therefore, the different closing methods will be
discussed.
© University of Pretoria

152
According to Manning et al. (2010:290-294), Johnston and Marshall (2010:227-
229), Blem (2007:131-136), Havaldar and Cavale (2007:2.12), Weitz et al.
(2007:288-296), Rix (2006:251-253) and Koekemoer (2005:259-260), it is
important to identify the different types of closing techniques that can be used by
salespeople:
• Direct close: This closing technique is the most straightforward – with the
salesperson asking the prospect to buy. For example, the salesperson can
ask the attendee at the exhibit stand whether they are ready to purchase or
not.
• Assumptive close: After the salesperson has asked a number of questions
and established that the prospect wants, to buy and closes the sale; then
this is done by taking action that is directed at closing the sale. For
example, at the trade show table, the salesperson can start filling in a
purchase form for the attendee to sign, in order to close the sale.
• Alternative choice close: In this closing technique, the salesperson does
not give the prospect an option to buy, or not to buy. The prospect is
provided with two options – such as colour or model – and then has to
choose one. At a trade show, the salesperson might point two of their
products that are on display, and ask the attendee if that is the one that
they are going to buy.
• Compliment close: When a prospect is a self-styled expert, or in a bad
frame of mind, this technique is very useful. The salesperson gives the
prospect a compliment to boost his/her ego. For example, the salesperson
says to a buying manager at the exhibit stand that they can see that they
know their products – and then close the sale.
• Summary of Benefit close: The benefits to which the prospect reacted
positively in the sales presentation are then re-stated; and the prospect’s
confirmation established on each of these. After the prospect’s
acknowledgment has been received on each benefit, the sale is closed. At
the exhibit stand, the salesperson can point out to the attendee the benefits
of each of the products and get their confirmation; once this has been done,
they can close the sale.
© University of Pretoria
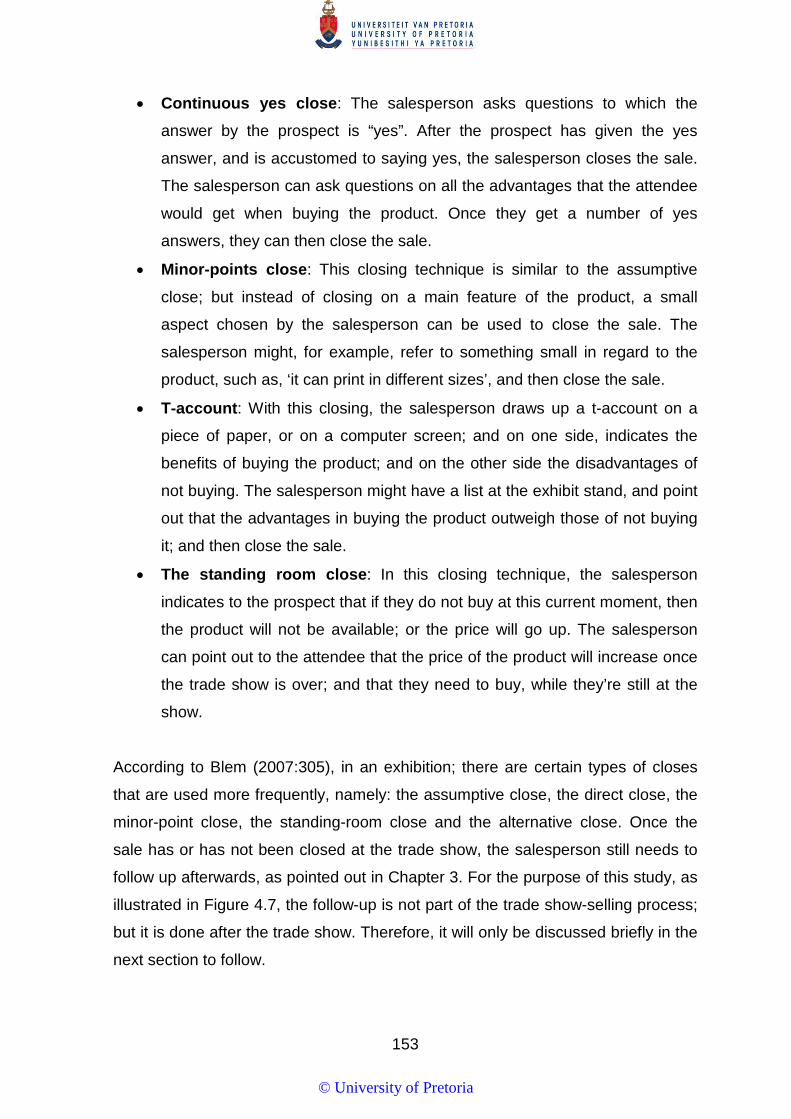
153
• Continuous yes close: The salesperson asks questions to which the
answer by the prospect is “yes”. After the prospect has given the yes
answer, and is accustomed to saying yes, the salesperson closes the sale.
The salesperson can ask questions on all the advantages that the attendee
would get when buying the product. Once they get a number of yes
answers, they can then close the sale.
• Minor-points close: This closing technique is similar to the assumptive
close; but instead of closing on a main feature of the product, a small
aspect chosen by the salesperson can be used to close the sale. The
salesperson might, for example, refer to something small in regard to the
product, such as, ‘it can print in different sizes’, and then close the sale.
• T-account: With this closing, the salesperson draws up a t-account on a
piece of paper, or on a computer screen; and on one side, indicates the
benefits of buying the product; and on the other side the disadvantages of
not buying. The salesperson might have a list at the exhibit stand, and point
out that the advantages in buying the product outweigh those of not buying
it; and then close the sale.
• The standing room close: In this closing technique, the salesperson
indicates to the prospect that if they do not buy at this current moment, then
the product will not be available; or the price will go up. The salesperson
can point out to the attendee that the price of the product will increase once
the trade show is over; and that they need to buy, while they’re still at the
show. According to Blem (2007:305), in an exhibition; there are certain types of closes
that are used more frequently, namely: the assumptive close, the direct close, the
minor-point close, the standing-room close and the alternative close. Once the
sale has or has not been closed at the trade show, the salesperson still needs to
follow up afterwards, as pointed out in Chapter 3. For the purpose of this study, as
illustrated in Figure 4.7, the follow-up is not part of the trade show-selling process;
but it is done after the trade show. Therefore, it will only be discussed briefly in the
next section to follow.
© University of Pretoria
154
4.6.9 Follow-up
In Chapter 3, the follow-up after a trade show was discussed. According to Drohan
(2007:32), the follow-up is one of the most important stage in the process of
generating sales for all the trade-show exhibitors. Due to inefficient follow-up
sales, opportunities are missed; and the return-on-investment dramatically
decreases, as pointed out in Chapter 3. After the show, all sales leads must be
followed up: either by telephone, email, or in person. Trade shows provide
exhibitors with a database for future leads to follow up (Blem, 2007:305-306).
As indicated in this study, the follow-up will not be investigated; since the data
gathering would take place at the trade shows.
4.7 SUMMARY
In this chapter, personal selling was defined by indicating that selling has changed
over the last few decades, becoming more sophisticated – due to lengthy and
complex sales processes. It was stated that the main function in selling is the
creation of dialogue between the salesperson and the buyer. This was defined as
person-to-person communication, in which professional sales people apply a set of
skills, strategies, and processes to unselfishly persuade and add value to the
interaction with the attendees at the trade show – with the intention to propose,
sell and/or inform; and in doing so, to build long-term relationships – to the benefit
of both parties.
Secondly, a historical background was provided. In the historical background,
selling was discussed, according to the different eras, including the industrial
revolution era, the post-industrial era, or the production era, war and depression
eras, and the sales-orientation era, professionalism, the modern era or marketing,
the consultative selling era, the strategic selling era, and the partnering era.
Thirdly, the different types of selling careers were classified, namely: selling a
service, selling in retail, wholesale and manufacturing. Service selling comprises
selling financial services, radio, TV and Internet advertising, newspaper and
© University of Pretoria
155
Magazine page space, hotel, motel and convention-centre services, real estate,
insurance, banking and business services. Retail selling, which has inside or in-
store salespeople, direct seller to home, or door-to-door salespeople, and
telephone-sales people, or telesales persons. Wholesale can be very similar to
retailing and manufacturing. This can then be broadly classified into outside-
salespeople and inside-salespeople.
Fourthly, the role of personal selling in the marketing mix of B2B organisations
was discussed. There were reasons for this, namely: that business markets are
operating in more complex and competitive markets than they did in the past,
which leads to cross-functional relationships between sales and marketing. It was
indicated that personal selling plays a role as a valuable tool for marketing
intelligence in the marketing department. The advantage that personal selling
provides over other marketing communication elements was also emphasised.
Fifthly, the characteristics of a professional salesperson were given. It was
indicated that professional salespersons are seen as marketing consultants that
engage in a total consultative, non-manipulative selling work. The responsibilities
include: market analysis, sales forecasting, new product ideas, buyer behaviour
analysis, communication, sales co-ordination and customer service. The ten
characteristics of a professional salesperson are, namely: listening skills, follow-up
skills, the ability to adapt to different sales styles from one situation to another
situation, tenacity, well-organised, verbal-communication skills, proficiency to
integrate with people of different levels in the customer’s organisation,
demonstrate the ability to overcome objections, closing skills, and personal
planning, in addition to time-management skills.
Lastly, the task of the professional salesperson at trade shows was discussed.
Three different viewpoints of the sales process were discussed, followed by the
construction of Figure 4.7 for the purpose of this study. The pre-show, at-show and
follow-up were discussed from Figure 4.7. Thereafter, the sales process for trade
shows was discussed in more detail. The elements of importance to this study,
namely: prospecting, pre-approach, approach, presentation, trial close, objections
and close were discussed in considerable detail.
© University of Pretoria

156
In Chapter 5, the research methodology that was scientific as to achieve the
objectives of the study will be discussed.
© University of Pretoria

157
CHAPTER 5
THE RESEARCH METHODOLOGY 5.1 INTRODUCTION
Business-to-business marketing was discussed in Chapter 2 of this study. In
Chapter 3, the trade shows were discussed, by first looking at the different role
players that comprise the attendees, organisers and exhibitors. This is followed by
a discussion on the three stages (pre-, at- and after-) of a trade show. Chapter 4
focused on personal selling, and more specifically on the sales process that
consists of the different stages. The afore-mentioned chapters formed the
background to the development of the methodology and analysis that is done in
this study. This chapter examine the research design and the methodologies used
to conduct the empirical part of the study.
In this study, the research methodology mainly focuses on the sales process and
its stages that are used by exhibit staff. The research methodology applied in a
study must be applied in a scientific manner (Welman, Kruger & Mitchell, 2005: 2).
Therefore, a scientific and structured research methodology approach was
followed, to ensure that the information obtained was valid, and sufficiently reliable
to support the objectives.
This chapter starts off by providing an introduction to the chapter, followed by a
definition of marketing research and a brief reference to the research-problem
statement. A short description on the sources of information provided; and
thereafter, the research objectives and the hypotheses set for the study, as guided
by the literature, are discussed. A more in-depth description is provided on the
research design that includes: the sample framework, the sampling method, the
sample size, and the selection of the sampling units. The steps in the designing of
the questionnaire are also explained.
© University of Pretoria

158
Thereafter, there are discussions on the coding, validation; editing and statistical
procedures used. In Figure 5.1 a layout of Chapter 5 is given that serve as a visual
guide for the chapter.
Figure 5.1 Layout of Chapter 5
Source: Own compilation
5.2 MARKETING RESEARCH DEFINED For research to be valid, it must make use of a scientific and systematic method to
prove or disprove the assumptions and hypotheses that the researcher has made.
Marketing research is, therefore, the systematic collection, analysis and
interpretation of information about all marketing problems – by means of
recognised scientific methods – to provide information that can be used in
decision-making (Wiid & Diggines, 2015:5). Thus, marketing research is the use of
5.1 Introduction
5.6 Research design
5.2 Marketing research defined
5.4 Information sources
5.5 Research objectives and Hypotheses
5.7 Research methods to collect data
5.8 Questionnaire design
5.3 Research problem and statement
5.9 Editing, Coding and Data capturing
5.10 Statistical procedures and techniques
5.11 Summary
© University of Pretoria
159
a scientific method in searching for the truth about a marketing phenomenon
(Zikmund & Babin, 2010:5). Research, therefore, has to be conducted
systematically, in order to examine the assumptions and hypotheses – before
accepting or rejecting them to make it scientific (Ghauri & Grønhaug, 2010:3).
The systematic gathering of information means that research has to follow specific
steps and processes – in order to be accepted as scientific. According to Churchill,
Brown and Suter (2010:5-6), marketing research involves a number of stages of
information-gathering: starting with determining what information is needed; the
collection and analysis of the information; and lastly, the interpretation of the
information in regard to the objectives of the study. Another view is that research
consists of four stages, namely: stating the purpose of the study (why it is being
done); the population under investigation; the procedure that are followed; and
lastly, the publication that is the reporting of the findings from the study (Bradley,
2010:35-41).
This study started off in Chapter 1 by pointing out the research problem that
indicated the reason why the research was done. In Chapter 2, Chapter 3 and
Chapter 4, a literature review was conducted to assist in the development of the
research objectives, hypotheses, research design and questionnaire development.
In this chapter, the research methodology used in this study is discussed; and in
the last two chapters of this study, the findings and conclusion of the study are
provided.
5.3 RESEARCH PROBLEM STATEMENT
According to Berndt and Petzer (2011:11), the research problem is the core issue
that the researcher wants to investigate. The problem-statement process involves
the narrowing down of a broad interest in a research topic by focusing on a
specific research problem that is manageable in size, and can then be investigated
(Welman et al., 2005:13). A problem statement can be seen as the process of
developing and defining a decision statement, and the use of such statements in
creating more precise research terminology, such as the research objectives
(Zikmund & Babin, 2010:106).
© University of Pretoria

160
Problem definition assists in determining the purpose of the research (Arora &
Mahankale, 2013:13). At the end of this section, the problem statement for this
study is described.
This study was motivated by the importance of trade shows in B2B markets, due
to the advantages they bring for personal communication with customers, and
through dialogue, which the researcher had with the trade show exhibitors and
organisers. A number of studies by Kirchgeorg et al. (2010a:68); Whitfield and
Webber (2011:446), Dwyer and Tanner (2009:332), Blyth and Rayner (1996:21),
Pitta et al. (2006:162), Johansson and Bengtsson (2011:73), Alessandra et al.
(2009:69), Goldblatt (2005:11) and Golpalakrishna et al. (2010:245) done on trade
shows in the last decade indicate that in the future, trade shows will continue to be
an integral part of the B2B marketing mix of businesses.
In South Africa, trade shows provide an important platform for “person-to-person”
business, with revenues of R2.6 billion in 2012, which is predicated to reach R4
billion by 2017 (Viviers, 2013:210). Due to this predicate growth, and the
importance of trade shows in B2B marketing communication, it is important to
determine the success factors for those businesses that exhibit. The sales process
especially plays a significant role in trade shows, due to the “person-to-person”
communication that takes place. This is due to the emphasis business markets
place on personal selling, as the result of a unique communication strategy (Hutt &
Speh, 2007:391).
Furthermore, trade shows serve as a marketing communication tool that offers
personal interaction with the customers and the prospects (Dwyer & Tanner,
2009:298).
Businesses that are capable of becoming more competitive and adaptive in their
strategies in exhibiting would achieve greater success at trade shows (Kirchgeorg,
Jung & Klant, 2010b:310). As indicated before, trade shows and personal selling
are interlinked with one another (vide Section 1.2, Chapter 3 & Chapter 4).
Therefore, exhibitors who are capable of applying the selling process and its
different stages should be able to increase their sales from trade shows
© University of Pretoria

161
(Seringhaus & Rosssen, 2004:161). To achieve success, business therefore
needs to determine the best practices, when exhibiting at trade shows through the
use of the sales process.
These practices or factors for success guide businesses on how they should apply
their different resources, in order to achieve their marketing and sales objectives.
A number of studies have been done on the role of selling at trade shows (Smith
et al., 1999, Kirchgeorg et al., 2010a:68; Whitfield & Webber, 2011:446; Dwyer &
Tanner, 2009:332; Blyth & Rayner, 1996:21, Pitta et al., 2006:162; Johansson &
Bengtsson, 2011:73; Alessandra et al., 2009:69; Goldblatt, 2005:11;
Golpalakrishna et al., 2010:245). The authors looked at a number of different
aspects related to sales; but none of them focused on the sales process, and its
stages, thus leaving a gap in the field of personal selling at trade shows. The
researcher could find two local studies (Bresler, 2008 & Keswell, 2010) on trade
shows that relate to the sales process – but only on the general nature, such as
attendee expenditure and the anticipated growth rate (Viviers, 2013:210; van Eyk,
2008:10).
To understand the research problem better an interview was done with an industry
expert to gain better insight. An interview agenda (vide. Appendix D) was used to
guide the interview. The interview was conducted in Midrand at the offices of
Specialised Exhibitions Montgomery with Mr. Gary Corin (2009), the managing
director of Specialised Exhibitions Montgomery, that is the largest B2B exhibition
organisers in South Africa (Tassiopoulos, 2010:x). Specialised Exhibitions
Montgomery have been organising B2B exhibitions since 1968 for a multitude of
different fields such as building materials, mining, engineering, packaging and
printing, transport, education and fishing equipment.
The first topic that was discussed was the role that trade shows play in business
marketing. According to Corin (2009), the most important role of trade shows as a
marketing medium “is that it provides face-to-face interaction and it engages al the
sense of the attendees”. However, he indicated that exhibitors at trade shows tend
to only come to exhibits “because their competitors is there” and that many have
© University of Pretoria

162
no clear objectives for the show. Corin (2009) also stated that this creates a
perception that trade shows is “just something we do because others do it”.
The second issue that was discussed was that of the importance of setting
objectives for a trade show. The two objectives that must be set but are by
exhibitors at a trade show is that of making sales and creating sales leads (Corin,
2009). Corin (2009) indicate to the research findings of Bresler (2009) regarding
Electra Mining trade show one of the biggest mining shows in the southern Africa
arranged by Specialised Exhibitions Montgomery. It was pointed out that one the
main concerns is that there is a decrease in the number of sales at trade shows
and this is influencing business perception of shows.
Corin (2009) further, indicated this as a concern since “all research that I have
read indicate that trade shows improves sales and double the success of selling to
leads obtained at the show”. The findings could have repercussions for the
exhibition organisers since business that exhibit “do not see trade shows as being
a medium that provides value for money” (Corin, 2009). Corin (2009) indicated that
trade shows provide business with the opportunity to have “face-to-face interaction
and demonstrate products to customers”. Furthermore, it was stated that trade
shows in all sense should “provide the exhibitor a way to build rapport with their
customers but it seems they don’t know how to sell and obtain sales leads”.
According to Corin (2009) one of the main reasons for the findings is that
exhibitors do not establish who they are dealing with at the exhibit stand and the
establishing the needs of the attendees. “Exhibitors need to engage with
attendees to ensure that the interaction is not a wasted opportunity to get business
or sales” Corin (2009). In many cases the behaviour and lack of experience of
exhibitors in dealing with different types of attendees at the trade shows is the
cause of not having a positive one-on-one interaction at the show. Exhibit stand
staff in many cases do not follow basic effective communication by focusing on
what they say and how they talk to attendees (Corin, 2009). A phrase used a
number of times by Corin (2009) “they just do not see trade shows as selling
opportunity, but rather as a social outing”. Corin (2009) further indicated that there
© University of Pretoria

163
seems to be a lack of knowledge and selling skills by the exhibit stand staff and
that this is a feeling shared by many in the exhibition industry.
On the aspect of who should man the trade show exhibition there was no clear
answer. Corin (2009) however pointed out that “the type of trade shows will
determine the exhibit staff, but it must be someone with experience in dealing with
customers that have the right knowledge”. It was also indicated that many
companies send anybody while sales people or senior managers would have been
the best option for manning the exhibit stand (Corin, 2009).
One other aspect touched on was that trade shows provide a business the change
to bench mark themselves against their competitors to see what they are offering
to the market (Corin, 2009). According to Corin (2009), trade shows provide
exhibitors a wealth of knowledge on their industry and what are the latest
developments and is a great tool to educate staff.
The interview provided the following insights:
• Trade shows as a marketing medium provides business with face-to-face
opportunity with their customers or potential customers.
• Exhibitors do not set objectives especially sales objectives that leads to a
perception that trade shows do not provide value for money spend.
• That exhibit staff lack the knowledge and skills to sell at a trade show.
• Trade show exhibit staff should be sales people or senior managers.
• Business can use trade shows to train staff.
• A lack on a clear picture of the sale process at tradeshows
In conclusion, the research problem in this study is to determine the sales process
used at trade shows and to expand on research as well as to assist on the
practical needs expressed by industry. This lack of understanding limit exhibitors
and non-exhibitors of effectively making and using this growing marketing
opportunity as it is evident that tradeshow is an excellent platform to sell, build
relationships, gather information and becoming more competitive. This,
information can assist exhibitors at trade shows to utilise the sales process to
© University of Pretoria
164
improve their success. Each of the stages of the sales process consists of a
number of different factors that exhibitors can, or cannot, apply when selling at
trade shows.
In this study, the stages, together with the sub-stages applied by exhibitor’s exhibit
staff have been researched.
To establish the different stages of the sales process, the researcher relied on
different information sources. The information sources also guided the researcher
in the setting of objectives, hypotheses and the questionnaire for the study.
5.4 INFORMATION SOURCES
In this study, both primary and secondary data sources were used to achieve the
objectives set out. The data were needed to conduct the research process of the
study; therefore, both sources of data were applied. Two types of information can
be identified the primary data that consist of information that is collected for the
problem at hand, and secondary data information that has already been collected
(Burns & Bush, 2010:57). Bradley (2010:76), however, points out that secondary
data might be outdated, or not relevant; or they might only cover a small aspect of
the study under investigation. With the afore-mentioned in mind, it must however
be noted that the secondary data can be invaluable in setting up the research
methodology of a study. They can assist greatly in the construction of the
measuring instrument (Kolb, 2008:88). For this study, a literature review was
conducted – using the secondary sources to establish related research that was
done before.
External secondary sources, such as text books, academic journal articles, media
articles and trade journals were applied in this study.
As indicated in Chapter 1, one of the aims of this study was to do an investigation
on secondary sources relating to business-to-business marketing, trade shows
and personal selling – in order to support the research methodology. Firstly, an
investigation was done on the secondary data relating to business-to-business
© University of Pretoria

165
marketing; in order to establish what role trade shows and personal selling play in
the marketing mix. Secondly, trade shows were looked at, including the three main
role-players, namely: organisers, attendees and exhibitors. With regard to trade
shows, specific attention was paid to the exhibitors; since this makes up the focus
of the study. Lastly, personal selling was investigated to establish the stages of the
sales process; and how each of these stages relates to trade shows.
The literature available on trade shows and personal selling came mostly from the
United States, the United Kingdom, China and Germany. The researcher could
only find a few literature sources on trade shows in South Africa by Bresler (2008)
and Keswell (2010), and the only personal selling study found was done by
Drotsky (2005) that researched sales in the pharmaceutical industry. A number of
textbooks describing the sales process were found and journal articles where
limited in number. The secondary information sources found on sales at trade
shows was Lee and Kim (2008), Ling-yee (2008), Sharland and Balogh (1996),
Smith, Gopalakrishna and Smith (2004) and Woolard (2007). Thus a major
contribution of this study lays in the value it adds to personal selling at trade
shows. Although numerous aspects relating to trade shows were discussed,
specific emphasis was given to the stages of the trade show, and the functions
and the exhibitor’s staff at each.
In the realm of personal selling, each of the stages of the sales process was
looked at in detail. The secondary research guided in setting the research
objectives and hypotheses, as well as the research design.
5.5 RESEARCH OBJECTIVES AND HYPOTHESES
According to Wiid and Diggines (2015:48), the research objectives must be in line
with the information that the research requires, in order to solve the problem or
opportunity that was set forth. The research objectives are, therefore, the goals to
be achieved in conducting the research (Zikmund & Babin, 2010:64); and these
are, in many cases, stated in the form of a hypothesis (McDaniel & Gates,
2010:49). For the purpose of this study, a number of research objectives were set
out, in order to explore the research problem.
© University of Pretoria
166
It was indicated that a number of studies (vide. Section 5.3) had been conducted
on selling at trade shows as such; but no study could be found on the specific role
of the sales process that is followed at trade shows. This information could be
useful to businesses that exhibit at trade shows, in order to develop sales plans
that would enable them to achieve greater success and be more effective when
exhibiting. Trade show organisers can also make use of this information to guide
or provide exhibitors with best practices when exhibiting. The main objective of this study is therefore to explore the stages of the sales process at trade shows. Through focusing on selected trade shows in South Africa, the following
secondary research objectives were set out for this study:
• To determine the profile of exhibitors at trade shows and exhibit staff.
• To determine if sub-stages exist within each of the stages of the sales
process at trade shows.
• To determine if sales persons and non-sales persons differ regarding the
sales process followed at trade shows.
• To determine if the various types of trade shows influence the sales
process followed.
• To determine if the type of business operations of an exhibitor influence the
sales process followed at trade shows.
From the objectives and the literature review done, various hypotheses resulted. A
hypothesis is a tentatively accepted statement about the formulated problem; and
it defines the area of the research, and indicates its direction (Wiid & Diggines,
2015:49). Hair et al. (2010:67) define a hypothesis as an empirical testable,
though yet unproven statement developed, in order to explain phenomena. A
hypothesis is nothing more than a proposition statement; but if it is correct, it
should be supported or accepted; and if it is wrong, it must be rejected (Bradley,
2010:37). Therefore, hypothetical statements are how two or more measurable
variables are related; and they are based on an assumption about some
characteristics of the population under investigation (Churchill et al., 2010:81;
McDaniel & Gates, 2010:410).
© University of Pretoria
167
Hypotheses are stated using two forms, namely: the null hypothesis (Ho), and the
alternative hypothesis (Ha). The goal is to reject Ho in favour of Ha. Examples of
the two forms of hypotheses are: Ho: “Sales and non-sales persons that man the
exhibit stand do not differ significantly regarding business actions used”. Ha:
“Sales and non-sales persons that man the exhibit stand differ significantly
regarding business actions used”. By applying statistical and analytical methods,
the hypothesis is tested; and the hypothesis is rejected when the significance level
indicates a p value =<0.05; and it is supported or accepted with a p value =>0.05.
In this study different hypotheses were formulated, in order to assist in the analysis
of the objectives.
In order to gain a better understanding of the role of the sales process at trade
shows it was deemed necessary to approach this from various viewpoints as
previous research (vide. Section 3.5 & Section 3.6) indicated and literature
suggested that the type of person manning the exhibit (sales vs. non-sales), the
type of trade show (regional, national, international) as well as the business
operations (sales of goods, service industry / professionals, construction /
manufacturing or other) of the exhibitor could suggest a different approach to the
sales process.
This information is not only useful for exhibitors; but it could be used by trade-
show organisers to provide training or manuals to exhibit staff on the
implementation of the sales process. Next, each of the objectives and the
hypotheses formulated to test the stages and the sub-factors of the sales process
are discussed.
5.5.1 To determine if sales persons and non-sales persons differ regarding the sales process followed at trade shows
Bathelt and Schuldt (2008:859) point out that the type of trade show has an impact
on the exhibit staff; but they do not indicate whether this should be sales or non-
sales people. Rinallo, Borghini and Golfetto (2010:251) also only point to the
© University of Pretoria

168
exhibit staff functions that include: to display the products, to facilitate professional
interaction, and to promote socialisation without stating whether this applies to
sales or non-sales people. It is, however, pointed out that attendees appreciate
those exhibitors that display their products and have competent exhibit staff
(Rinallo et al., 2010:254-255).
However, according to Ellis (2010:319-320) and Zimmerman and Blyth (2013:227-
228), a number of activities make up the role of a B2B salesperson at trade shows,
namely: selling, prospecting, pre-sale service, post-sale service, Customer
Relationship Management (CRM), inbound information handling, outbound
information handling, market research and sales teamwork. All of the afore-
mentioned activities take place during the sales process.
Lee and Kim (2008:792-793) found that pre-show promotions have a significant
positive influence on the image building of a business exhibiting at a trade show
and that training of exhibit staff have a positive effective on pre-show promotions.
Blyth (2002:630) points out in his research that exhibitors rate selling objectives
above non-selling objectives at trade shows while Lee and Kim (2008) report that
quantifying the show objectives had an important influence on the sales related
performance of exhibitors. Trade show objectives and training is part of the
business actions of an exhibitor as indicated in Section 3.6 and there are
differences between sales and non-sales persons for example in regards to
training. Lee and Kim (2008:793) further found that training of exhibit staff have an
influence on image-building at trade shows. This indicates to the importance of
exhibit staff to be able to communicate effectively. Hanchette (2007:112) indicate
that exhibitors that emphasize pre-show activities do make more contact at the
show than business which does not.
Bathelt and Schudt (2008:861) found that the entertainment provided at trade
shows is more useful that other at-show promotional material with the most
preferred method of interacting dinners with special customers (Herbig & O’Hara,
1998:431). Exhibit stand staff resources also enhance the at-show selling
activities. Ling-yee (2008:40) further indicate that trade show performances (pre-
show, promotions, at-show selling & post-show follow-up) were significant related
© University of Pretoria
169
to the achievement of sales goals set. Hanchette (2007:112) point out that
business that emphasize at-show activities have more sales leads from the show
than business that does not.
It is evident from the discussion above that exhibit staff needs to fulfil many roles
and activities at tradeshow as they move through the sales process. Emphasising
the importance of using the most appropriate staff to man the exhibit. Bathelt and
Schuldt (2008:859) point out that the type of trade show has an impact on the
exhibit staff; but they do not indicate whether this should be sales or non-sales
people. Other authors argue for and against sales or non-sales people as the most
appropriate exhibit staff.
Ling-yee (2007:367) argues that internal knowledge such as sales knowledge,
contribute to superior trade show performance, making salespeople the obvious
choice to man the exhibit stand. However, Blyth (2010:60) indicate that one of the
mistakes of exhibitors is to man exhibit stand with salespeople and this results on
only focusing on closing deals and selling. Ling-yee (2008:39) furthermore, states
that sales people is better trained and could use their sales skills to determine if an
attendee is a possible prospect and ensure more sales. In Section 3.6.2.3 it was
also indicated that due to the experience of sales staff and ability to facilitate
information exchange they will be able to communicate more effectively with
attendees.
With the afore-mentioned issues in mind, the logical choice of exhibit staff should
be salespeople (Brennan et al., 2014:195). Dwyer and Tanner (2009:332) agree
with this statement and they postulate that salespeople must be involved with
trade shows since they are personal and they provide sales leads due to the
nature of B2B markets (Ellis, 2011:318). Although salespeople might be the best
exhibit staff, in a study done by Liu et al. (2011:449), on Chinese trade shows, it
was established that most exhibitors were at the show as part of public relations
and not for selling or getting contracts and thus make more use of non-
salespeople.
© University of Pretoria
170
In conclusion, it is evident that authors differ on who should man the exhibit stand
at trade shows. In Section 3.6.1, Section 3.6.2 and Section 4.6, the different roles
played by both sales and non-sales persons at trade shows in the sales process
are discussed. If the arguments of the various authors for and against salespeople
to man exhibit stands are true, there should be differences in the various activities,
methods and actions that sales vs non-sales exhibit stand staff encounter and
make use moving through the sales process based on their specialised work
experience, training and goals. Thus, seven hypotheses were therefore formulated
reflecting the various stages of the sales process at trade shows and these
differences. It must be noted that all hypotheses are set for the sales process at
trade shows.
Ho1 There exist no significant differences between sales persons and non-sales
persons regarding business actions used.
Ho2 There exist no significant differences between sales persons and non-sales
persons regarding pre-show marketing activities.
Ho3 There exist no significant differences between sales persons and non-sales
persons regarding at-show marketing activities.
Ho4 There exist no significant differences between sales persons and non-sales
persons regarding the sales presentation.
Ho5 There exist no significant differences between sales persons and non-sales
persons regarding objections experienced.
Ho6 There exist no significant differences between sales persons and non-sales
persons regarding dealing with objections.
Ho7 There exist no significant differences between sales persons and non-sales
persons regarding closing methods.
Two-tailed hypotheses were set for the first seven hypotheses that dealt with sales
and non-sales persons. It was determined whether exhibit staff is employed as a
salesperson and was measured using a dichotomous question (vide Appendix A,
Question 23). As indicated in Section 4.6 of the study, a small number of research
articles are available on the sales process at trade shows. Exploratory hypotheses
were, therefore, formulated due to the limited literature available on the stages of
the sales process at trade shows. Therefore, the stages of the sales process at a
© University of Pretoria
171
trade show can be seen as being explorative; and this is discussed in the
limitations section of this study. This has also been discussed in Section 4.6.
The explorative stages for the sales process was measured, using a Likert scale
(vide Appendix A, Sections B to I).
Through the literature review, it was also established that the type of trade show
can impact the stages of the sales process. Therefore, in the next section this
objective is discussed.
5.5.2 To determine if the various types of trade shows influence the sales process
The different types of trade shows and how the sales process can be implemented
by exhibit staff (as discussed in Section 3.4, Section 3.5.3 and Section 3.6.2.4)
often differ. In Section 2.6, the reasons why business markets are segmented is
also indicated. By classifying trade shows, the organisers can provide guidelines
on how to deal with a specific type of show to the exhibitor’s exhibit staff. This
could include how to implement the sales process (Kirchgeorg, 2005:47). It has
also been established (in Section 3.6.2.4) that trade shows and the stages within
the trade show are frequently viewed differently by the various types of exhibitors.
Trade shows provide attendees with the opportunity to experience geographical
and culturally distant markets in a central location (Rinallo & Golfetto, 2006:865);
and they provide businesses with the opportunity to compete and succeed in the
fast-growing global business market (Seringhaus & Rosson, 1998:398). One of the
main ways to classify trade shows is according to their geographical scope. This
refers to the region that is covered by a trade show. Three types of geographical
trade shows can be identified: international shows, national shows, and regional
show
The type of trade shows that an exhibitor displays at can impact the way in which
they apply the different stages of the sales process (Kirchgeorg, 2005:47). Ling-
yee (2007:365-366) found that the knowledge and skill needed for at-show selling
differed between the various types of trade shows and had a significant influence
© University of Pretoria

172
on the achievement of trade show objectives. Furthermore Kijewski, Yoon and
Young (1993:291-292) point out that there is different objectives depending on the
type of trade show, for example with national shows focusing more on new product
and market segments, regional shows supporting sales activities and international
shows on identifying new distributors. Furthermore, Hansen (2004:9) argues that
trade show performance (sales, information-gathering, relationship building, image
building & motivation activities) are often better at global or international trade
shows. A possible explanation could be that international trade shows typically last
longer than other trade shows; and this provides exhibiting organisations with the
opportunity to meet buyers directly, to investigate the markets, the products, to
observe the competitors; and this is a way to gather marketing research data
(Robbe, 2000:14-15; O’Hara et al., 1993:234). Herbig et al. (1997:373) points out
that businesses that exhibit at international tradeshows is more globally driven and
have more customers and more product lines and hence a more complex sales
process might be followed.
National trade shows comprise those trade shows that are not international but still
relatively large in size and the visitors attending the trade show are only from one
country or from areas extending beyond a given region. This, therefore, limits the
number of contacts and how contact is made (Kirchgeorg, 2005:47), suggesting a
less complex sales process with limited activities in each stage.
Regional trade shows are even smaller in size than national trade shows and they
are held in a specific area of a country at various locations attracting regional
attendees (Dwyer & Tanner, 2009:329). Godar and O`Conner (2001:82) point out
that regional trade shows attract a higher portion of low level operating attendees
compared to national and international trade shows. It can therefore be assumed
that sales strategies and actions employed during the sales process might be
different based on the fact that they sell to a different type of attendee. Shoham
(1992:337) also indicate that the type of trade show can influence the type of
attendee and resulting in a different type of sales process followed. Even the
attendee contact differ at the various tradeshows as large international trade
shows often have organised evenings were socialising takes place whereas at
smaller regional trade shows exhibitors make more use of spontaneous social
© University of Pretoria
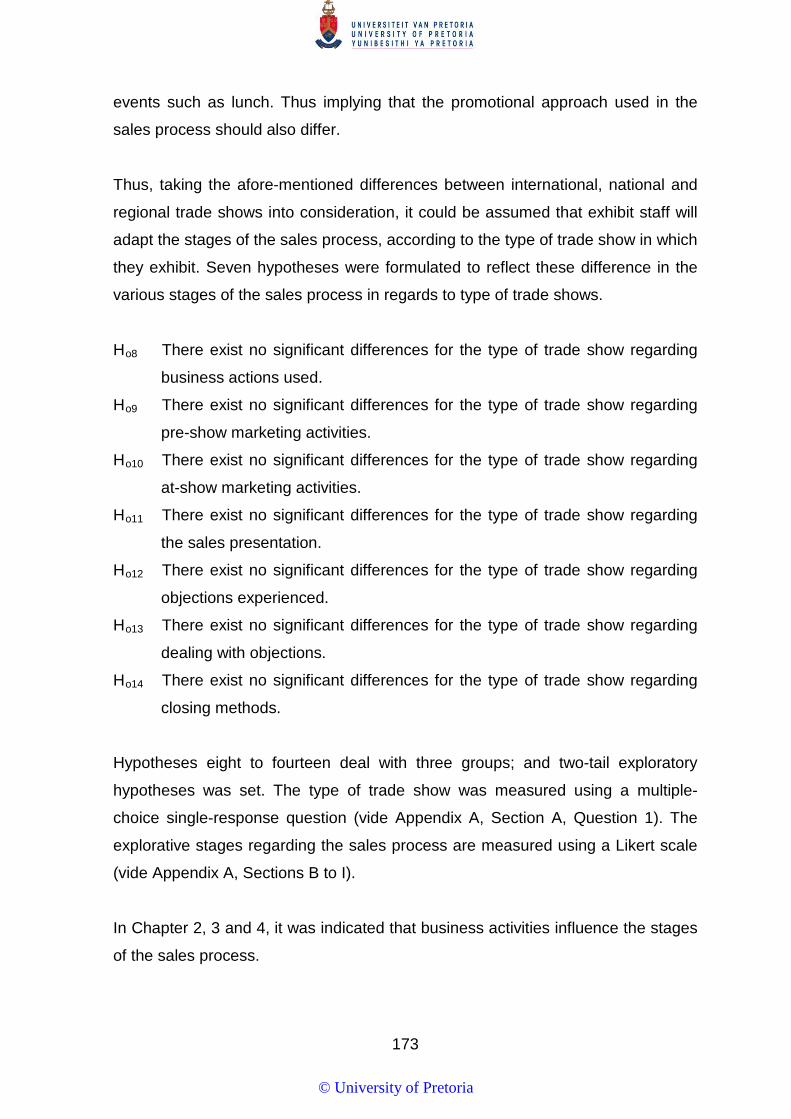
173
events such as lunch. Thus implying that the promotional approach used in the
sales process should also differ.
Thus, taking the afore-mentioned differences between international, national and
regional trade shows into consideration, it could be assumed that exhibit staff will
adapt the stages of the sales process, according to the type of trade show in which
they exhibit. Seven hypotheses were formulated to reflect these difference in the
various stages of the sales process in regards to type of trade shows.
Ho8 There exist no significant differences for the type of trade show regarding
business actions used.
Ho9 There exist no significant differences for the type of trade show regarding
pre-show marketing activities.
Ho10 There exist no significant differences for the type of trade show regarding
at-show marketing activities.
Ho11 There exist no significant differences for the type of trade show regarding
the sales presentation.
Ho12 There exist no significant differences for the type of trade show regarding
objections experienced.
Ho13 There exist no significant differences for the type of trade show regarding
dealing with objections.
Ho14 There exist no significant differences for the type of trade show regarding
closing methods.
Hypotheses eight to fourteen deal with three groups; and two-tail exploratory
hypotheses was set. The type of trade show was measured using a multiple-
choice single-response question (vide Appendix A, Section A, Question 1). The
explorative stages regarding the sales process are measured using a Likert scale
(vide Appendix A, Sections B to I).
In Chapter 2, 3 and 4, it was indicated that business activities influence the stages
of the sales process.
© University of Pretoria
174
5.5.3 To determine if the type of business operations of an exhibitor influence the sales process followed at trade shows
Trade shows are events that bring sellers and buyers together – to view and/or sell
offerings from specific industries and build mutually beneficial relationships
(Berridge, 2007:12). By matching the supply market with the target audience, trade
shows can demonstrate the expertise of a specific industrial sector (Brennan et al.,
2014:189).
Various types of B2B businesses can be identified based on their operations as
indicated in Section 2.4 (Ellis, 2011:215; van Rensburg, 2008:132; Cant, Strydom,
Jooste & du Plessis, 2006:206-208). Exhibitors can be classified according their
business operations and the main types include sales of goods, service industry /
professionals and construction or manufacturing (See Section 3.3). In Section
3.5.1, it was stated that exhibitors and attendees must be matched to ensure
success for a trade show and it was also pointed out that trade-show exhibitors
must select shows that are in line with their current business operations. Even the
design of the trade show exhibit stand is influenced by the business operations of
the business exhibiting, to provide the exhibit staff with the best opportunity to sell
to the attendees (as indicated in Section 3.1.6.4).
A number of studies have been done on the importance of business operations
and their influence on trade shows and selling (Munuera & Ruiz, 1999:18;
Borghini, et al., 2006:1157; Bathelt & Schuldt, 2008:859; Wu et al., 2008:417;
Rinallo et al., 2010:253; Kirchgeorg et al., 2010b:310).
Herbig et al. (1997:374) state that the business operations of a firm can impact
whether they exhibit at trade shows or not as well as the frequency of exhibiting,
with service firms rarely exhibiting. Kellezi (2014:469) found that the marketing and
communication strategy used for and at trade shows is also influenced by
business operations. Munuera and Ruiz (1999:18) argue that the nature of the
business operation of the exhibitor will influence the type of attendee visiting the
trade show as well as the objectives of the attendees. Furthermore, the authors
argue that the products or services exhibited at the trade shows differ in regards to
© University of Pretoria

175
complexity and tangibility due to different business operations. At industrial or
manufacturing trade shows buyers are more focused on gathering market in
information while Borghini et al., (2006:1157) found that firms selling of goods
exhibits attract more atypical attendees than manufactures. An atypical attendee is
someone that does not belong to a buying centre and are not interested in
purchasing but only browsing, implying a shorter and less complex sales process.
Furthermore, Bathelt and Schuldt (2008:859) report that manufactures view
tradeshows as much more than the normal marketing event that firms in other
industries (e.g. retailers and professional services) often do. For them trade shows
are more complex as the focus is more on interactive learning and knowledge
creating, implying a more comprehensive sales process. Wu et al., (2008:417)
also report that selling and buying activities are more evident in specialised
tradeshow, such as construction than horizontal tradeshows such as exhibitors
selling a variety of goods. Rinallo et al., (2010:253) argue that even the exhibit
stand displays differ as to reflect the focus of firms in different business operations.
For example, manufacturing firms dedicate a larger space of the stand for relaxing
and socialising, while professional services firms allocate the largest space to
professional interaction while firms selling goods use the biggest part of the stand
for product displays.
From the above it is evident that the various business operations (manufacturing
or construction, selling of goods and the services industry) of firms exhibiting at
trade shows lead to differences in the frequency of exhibiting, the type of attendee,
type of marketing and communication used, exhibit stand display, trade show
objectives as well as the type of product/service exhibited. These difference in turn
influence the amount, type of activities, complexity as well as the length of the
sales process. Therefore, the following seven two-tailed hypotheses were
formulated for business operations in sales process used at trade shows.
Ho15 There is no significant differences for business operations of an exhibitor
regarding business actions used.
Ho16 There is no significant differences for business operations of an exhibitor
regarding pre-show marketing activities.
© University of Pretoria

176
Ho17 There is no significant differences for business operations of an exhibitor
regarding at-show marketing activities.
Ho18 There is no significant differences for business operations of an exhibitor
regarding the sales presentation.
Ho19 There is no significant differences for business operations of an exhibitor
regarding objections experienced.
Ho20 There is no significant differences for business operations of an exhibitor
regarding dealing with objections.
Ho21 There is no significant differences for business operations of an exhibitor
regarding closing methods.
Two-tailed hypotheses were set for business operations of exhibitors. Businesses
operations were measured by using a multiple-choice single-response question
(vide Appendix A, Section A, Question 5). The explorative stages regarding the
sales process is measured using a Likert scale (vide Appendix A, Sections B to I).
Also, explorative hypotheses were set out; and these are discussed as part of the
limitations of the study (in the last chapter and in Section 4.6).
The different research objectives and the hypotheses needed to solve the
research problem or opportunity therefore it is necessary to do research.
5.6 THE RESEARCH DESIGN
According to Zikmund and Babin (2010:64), after the researcher has established
the research problem, a research design must be developed that would be the
masterplan on the methods and processes to be used for collecting and analysing
the information needed. The research design is the plan that is followed to answer
a study’s research questions (Saunders, Lewis & Thornhill, 2009: 136). The
research design is implemented at the stage when the researcher plans the
process and methods to be used to analyse the data obtained. This must be done;
so that the researcher can find answers to the objectives that were set for the
study at hand.
© University of Pretoria
177
The research design contribute to the overall research; and therefore, it has to be
selected very carefully (Berndt & Petzer, 2011:31). To be able to answer the
research objectives of this study, a research design was developed to acquire the
primary data needed.
Three types of marketing research designs can be identified, namely: exploratory,
causal and descriptive (Ghauri & Grønhaug, 2010:56). Exploratory research is
done to clarify or explore unknown situations. In doing an exploratory study, the
researcher can gain a better understanding of the problem. An exploratory study
includes looking at the literature, talking to experts in the subject investigated, or
doing focus-group interviews (Saunders et al., 2009:140). In this study, exploratory
research was not used.
Causal research is done to establish the cause-and-effect relationship; and it is
mostly done in the form of experiments. Ghauri and Grønhaug (2010:57) state that
in causal research, the researcher tries to determine whether the cause results in
an effect. Causal research can be used to confirm that an event causes another to
happen (Zikmund & Babin, 2010:53); and it is therefore, used to ascertain whether
the research question indicates a cause-and-effect between events (Kolb,
2008:27; Churchill et al., 2010:116). In this study, causal research was not used
since this study was explorative to establish the stages of the sales process.
Descriptive research answers the questions: Who, what, when, where and why
(McDaniel & Gates, 2010:49). Descriptive research describes the characteristics of
objects, people, groups, organisations or environments (Zikmund & Babin,
2010:51); and it can be used where the emphasis is on determining the frequency
with which something occurs, or whether there is a relationship between two
variables (Churchill et al., 2010:79). According to Kolb (2008:25), descriptive
research is done when statistical data are needed on a fact; and almost always,
they are done through surveys.
In this study, descriptive research was used; as it provides quantitative data to the
answer research questions (Hair et al., 2010:36), as the researcher wanted to
survey the stages of the sales process for trade shows.
© University of Pretoria

178
Once the type of research design has been decided on, a sampling plan needs to
be developed, to ensure that the data gathered would answer the research
problem or the research questions. Next, the sampling used in this study is
discussed; and thereafter, the rest of the research design is looked at. This will
include the research method used, the data-collection method and the design of
the data-collection instrument.
5.6.1 SAMPLING
There are a number of reasons why sampling is used. In this study, a sample was
used because of the restricted time and limited financial resources available.. The
researcher, therefore, selected specific sampling units to obtain the required
information. The sample statistics, which are a characteristic of the measures of a
sample, can be used to make inferences about the population (Churchill et al.,
2010:330).
In sampling, there are a number of basic concepts, as illustrated in Figure 5.2. The
basic concepts in sampling include: sampling, the sample, census, population,
sample unit, sample frame, sample-frame error, and the sample error (Burns &
Bush, 2010:364).
Figure 5.2 Basic Sampling concepts
Source: Adapted from Burns & Bush (2010:364)
Sample Frame
Sample
Sample Unit
Sample Error
Sample Error
© University of Pretoria
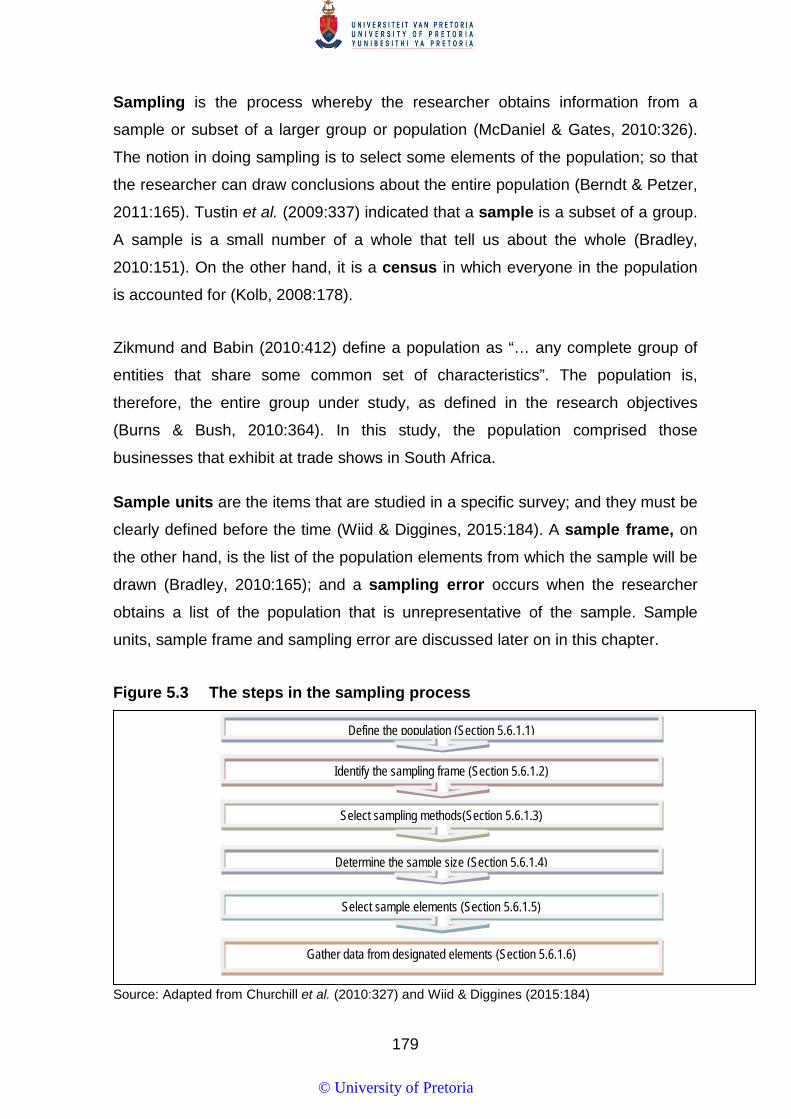
179
Sampling is the process whereby the researcher obtains information from a
sample or subset of a larger group or population (McDaniel & Gates, 2010:326).
The notion in doing sampling is to select some elements of the population; so that
the researcher can draw conclusions about the entire population (Berndt & Petzer,
2011:165). Tustin et al. (2009:337) indicated that a sample is a subset of a group.
A sample is a small number of a whole that tell us about the whole (Bradley,
2010:151). On the other hand, it is a census in which everyone in the population
is accounted for (Kolb, 2008:178).
Zikmund and Babin (2010:412) define a population as “… any complete group of
entities that share some common set of characteristics”. The population is,
therefore, the entire group under study, as defined in the research objectives
(Burns & Bush, 2010:364). In this study, the population comprised those
businesses that exhibit at trade shows in South Africa. Sample units are the items that are studied in a specific survey; and they must be
clearly defined before the time (Wiid & Diggines, 2015:184). A sample frame, on
the other hand, is the list of the population elements from which the sample will be
drawn (Bradley, 2010:165); and a sampling error occurs when the researcher
obtains a list of the population that is unrepresentative of the sample. Sample
units, sample frame and sampling error are discussed later on in this chapter.
Figure 5.3 The steps in the sampling process
Source: Adapted from Churchill et al. (2010:327) and Wiid & Diggines (2015:184)
Define the population (Section 5.6.1.1)
Identify the sampling frame (Section 5.6.1.2)
Select sampling methods(Section 5.6.1.3)
Determine the sample size (Section 5.6.1.4)
Select sample elements (Section 5.6.1.5)
Gather data from designated elements (Section 5.6.1.6)
© University of Pretoria
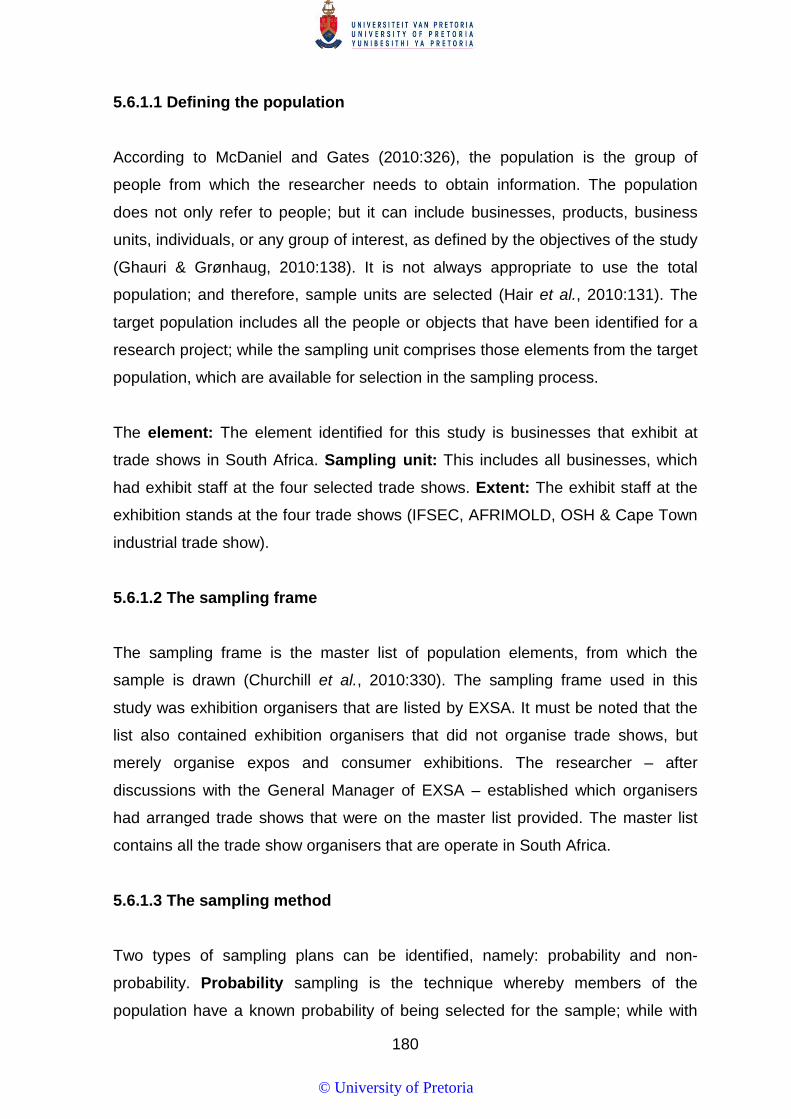
180
5.6.1.1 Defining the population
According to McDaniel and Gates (2010:326), the population is the group of
people from which the researcher needs to obtain information. The population
does not only refer to people; but it can include businesses, products, business
units, individuals, or any group of interest, as defined by the objectives of the study
(Ghauri & Grønhaug, 2010:138). It is not always appropriate to use the total
population; and therefore, sample units are selected (Hair et al., 2010:131). The
target population includes all the people or objects that have been identified for a
research project; while the sampling unit comprises those elements from the target
population, which are available for selection in the sampling process.
The element: The element identified for this study is businesses that exhibit at
trade shows in South Africa. Sampling unit: This includes all businesses, which
had exhibit staff at the four selected trade shows. Extent: The exhibit staff at the
exhibition stands at the four trade shows (IFSEC, AFRIMOLD, OSH & Cape Town
industrial trade show).
5.6.1.2 The sampling frame
The sampling frame is the master list of population elements, from which the
sample is drawn (Churchill et al., 2010:330). The sampling frame used in this
study was exhibition organisers that are listed by EXSA. It must be noted that the
list also contained exhibition organisers that did not organise trade shows, but
merely organise expos and consumer exhibitions. The researcher – after
discussions with the General Manager of EXSA – established which organisers
had arranged trade shows that were on the master list provided. The master list
contains all the trade show organisers that are operate in South Africa.
5.6.1.3 The sampling method
Two types of sampling plans can be identified, namely: probability and non-
probability. Probability sampling is the technique whereby members of the
population have a known probability of being selected for the sample; while with
© University of Pretoria
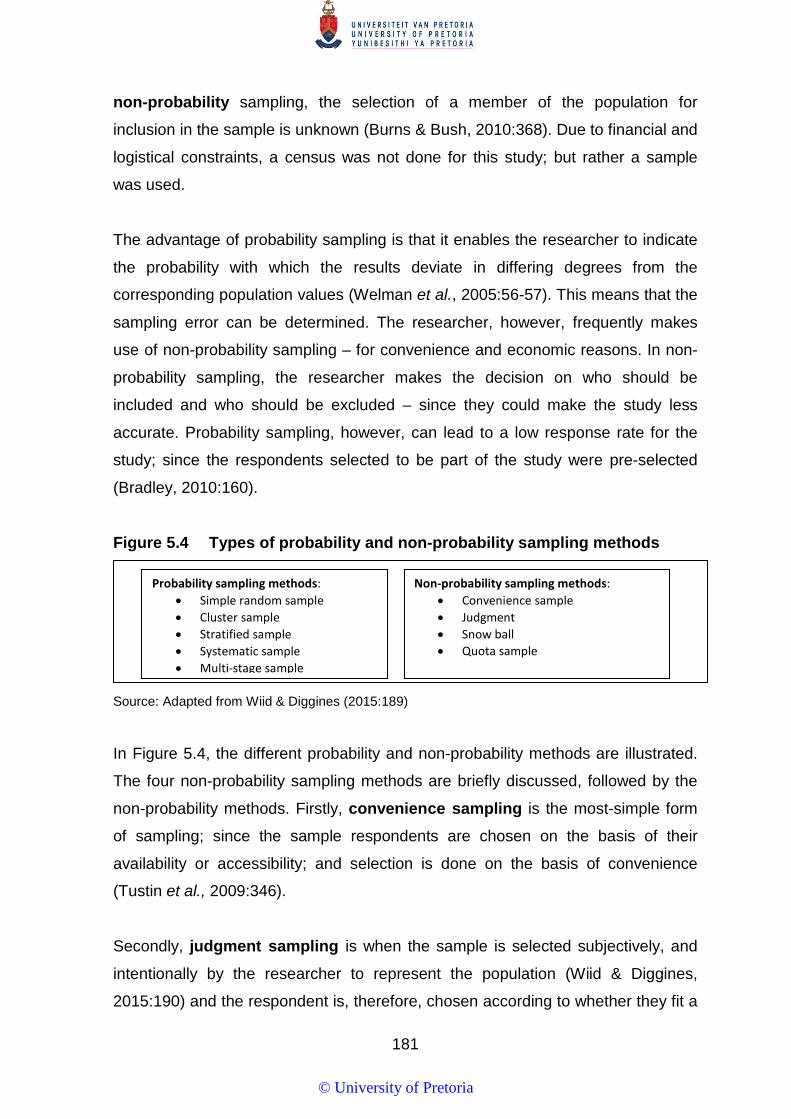
181
non-probability sampling, the selection of a member of the population for
inclusion in the sample is unknown (Burns & Bush, 2010:368). Due to financial and
logistical constraints, a census was not done for this study; but rather a sample
was used.
The advantage of probability sampling is that it enables the researcher to indicate
the probability with which the results deviate in differing degrees from the
corresponding population values (Welman et al., 2005:56-57). This means that the
sampling error can be determined. The researcher, however, frequently makes
use of non-probability sampling – for convenience and economic reasons. In non-
probability sampling, the researcher makes the decision on who should be
included and who should be excluded – since they could make the study less
accurate. Probability sampling, however, can lead to a low response rate for the
study; since the respondents selected to be part of the study were pre-selected
(Bradley, 2010:160).
Figure 5.4 Types of probability and non-probability sampling methods
Source: Adapted from Wiid & Diggines (2015:189)
In Figure 5.4, the different probability and non-probability methods are illustrated.
The four non-probability sampling methods are briefly discussed, followed by the
non-probability methods. Firstly, convenience sampling is the most-simple form
of sampling; since the sample respondents are chosen on the basis of their
availability or accessibility; and selection is done on the basis of convenience
(Tustin et al., 2009:346).
Secondly, judgment sampling is when the sample is selected subjectively, and
intentionally by the researcher to represent the population (Wiid & Diggines,
2015:190) and the respondent is, therefore, chosen according to whether they fit a
Probability sampling methods: • Simple random sample • Cluster sample • Stratified sample • Systematic sample • Multi-stage sample
Non-probability sampling methods: • Convenience sample • Judgment • Snow ball • Quota sample
© University of Pretoria
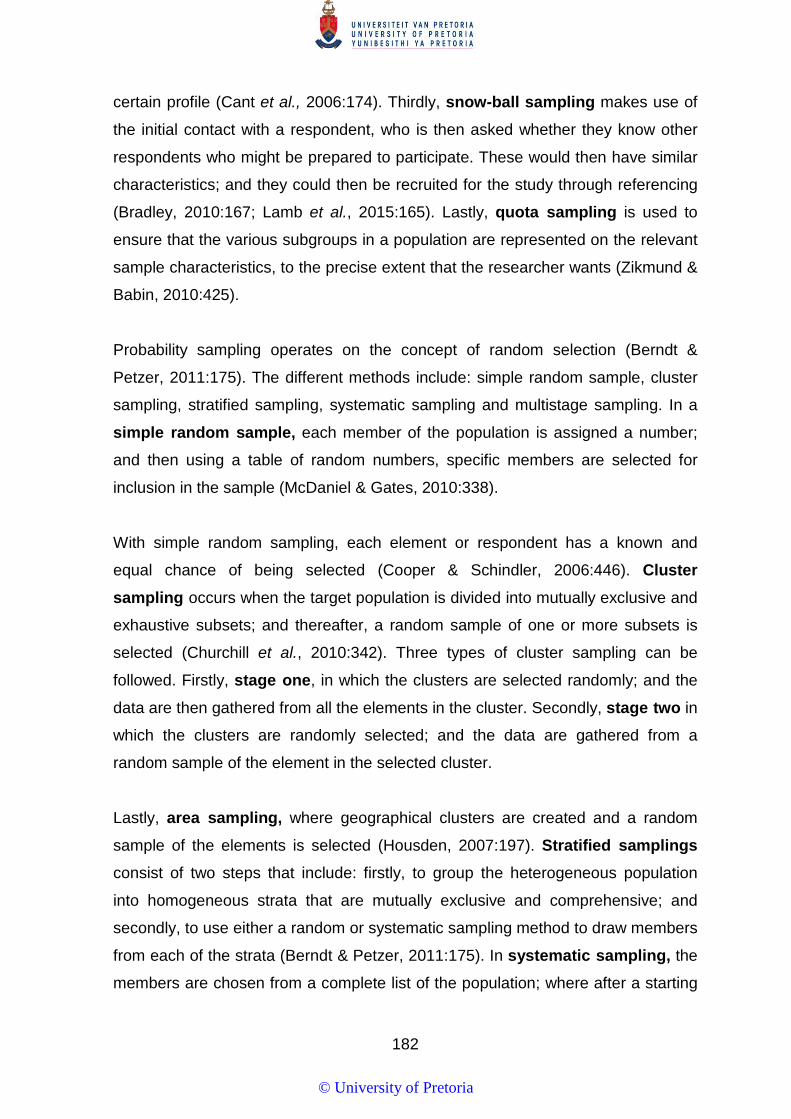
182
certain profile (Cant et al., 2006:174). Thirdly, snow-ball sampling makes use of
the initial contact with a respondent, who is then asked whether they know other
respondents who might be prepared to participate. These would then have similar
characteristics; and they could then be recruited for the study through referencing
(Bradley, 2010:167; Lamb et al., 2015:165). Lastly, quota sampling is used to
ensure that the various subgroups in a population are represented on the relevant
sample characteristics, to the precise extent that the researcher wants (Zikmund &
Babin, 2010:425).
Probability sampling operates on the concept of random selection (Berndt &
Petzer, 2011:175). The different methods include: simple random sample, cluster
sampling, stratified sampling, systematic sampling and multistage sampling. In a
simple random sample, each member of the population is assigned a number;
and then using a table of random numbers, specific members are selected for
inclusion in the sample (McDaniel & Gates, 2010:338).
With simple random sampling, each element or respondent has a known and
equal chance of being selected (Cooper & Schindler, 2006:446). Cluster sampling occurs when the target population is divided into mutually exclusive and
exhaustive subsets; and thereafter, a random sample of one or more subsets is
selected (Churchill et al., 2010:342). Three types of cluster sampling can be
followed. Firstly, stage one, in which the clusters are selected randomly; and the
data are then gathered from all the elements in the cluster. Secondly, stage two in
which the clusters are randomly selected; and the data are gathered from a
random sample of the element in the selected cluster.
Lastly, area sampling, where geographical clusters are created and a random
sample of the elements is selected (Housden, 2007:197). Stratified samplings consist of two steps that include: firstly, to group the heterogeneous population
into homogeneous strata that are mutually exclusive and comprehensive; and
secondly, to use either a random or systematic sampling method to draw members
from each of the strata (Berndt & Petzer, 2011:175). In systematic sampling, the
members are chosen from a complete list of the population; where after a starting
© University of Pretoria

183
point is selected randomly; and then, every nth number on the list is chosen for
inclusion in the list (Wiid & Diggines, 2015:205).
The last method is a multistage sample which is a cluster-sampling approach
involving multiple steps that combine some of the probability methods (Zikmund &
Babin, 2010:431). The multistage sample consists of the researcher dividing the
population into various groups or clusters, and then drawing a representative
sample, using a random-selection method (Wiid & Diggines, 2015:205). In this
study, a multistage sample was used.
In the first step of the multistage sample, a list of the exhibition organisers was
obtained from EXSA. The list of expo and trade show organisers is presented in
Table 5.1.
Table 5.1 List of Exhibition Organisers Obtained from EXSA Afrimold Homemakers Fair Port Elizabeth Professional Exhibition Solutions Agri Expo Hypenica Scan on Show Complete Exhibitions IHOP World Ltd. Specialised Exhibitions Montgomery Conker Exhibitions IIR South Africa BV Spintelligent Dogan Exhibition and Events Ltd Ikhono Communications The Wedding Expo Event Guru Impact Exhibitions Three City Events Ltd. Expo Trends Informa UK Trade Show Training Exposure Marketing & Communication
Inkanyezi Event Organisers Ltd. Witch & Wizards
Extra Dimensions 1261 cc Legendary Events World Wide Exhibitions Services Fair consultants SA cc LTE South Africa Zimbabwe International Trade Fair
Company Gauteng Homemakers Expo Ltd. Moshate Media CC Homemakers Durban Practical Publishing The second stage determined which of the exhibition organisers on the list
obtained from the EXSA arranged trade shows, would be approached. This was
done; since it was established that a large number of the exhibition organisers only
arrange consumer expos and not trade shows. According to the list provided to the
researcher by EXSA of expo and trade-show organisers, there were 23
organisers. In discussions with EXSA, it was established that only 13 of the
exhibition organisers arranged trade shows; while eight organisers focus only on
consumer expos. The names of the Trade-Show Training group were also
excluded; since they are only a training company; and so were the Zimbabwe
© University of Pretoria

184
International Trade Fair Company; since they arrange trade shows in Zimbabwe
only.
The research used stratified sampling at this stage by listing only the exhibition
organisers that arrange trade shows. The list of exhibition organisers that arrange
trade shows is listed in Table 5.2.
Table 5.2 Exhibition organisers that arrange trade shows Afrimold IIR South Africa BV Scan on Show Agri Expo Impact Exhibitions Specialised Exhibitions Montgomery Dogan Exhibition and Events Ltd LTE South Africa Spintelligent Fair consultants SA cc Moshate Media CC Hypenica Practical Publishing
The researcher contacted all 13 trade-show organisers; but only three gave their
consent and were willing to participate in the study. In contacting the 13 trade
show organisers the researcher pointed out to them the importance of the study
for their industry to try and motivate them to participate. A number of trade show
organisers did not want to participate. Possible reasons for not participating
included: fear of exhibitors being hassled and researcher compiling list of
exhibitors, and distributing it to other organisers. From the three trade-show
organisers, two gave permission for one trade show each; and the Specialised
Exhibitions Montgomery organiser gave permission for two of their trade shows to
be used. As indicated, the researcher obtained permission for four trade shows,
namely: International Safety and Security (IFSEC) that focuses on the security
industry, Occupational Safety and Health (OSH) that focuses on health and safety,
Afrimold that deals with the moulding industry, and the Cape Town Industrial trade
show that deals with a number of different types of industrial products and
services.
In the third and last stage of the sampling method, the researcher distributed
questionnaires at each of the trade shows to each of the exhibitor’s stands. It
must, however, be noted that the researcher did establish that many exhibitors
exhibit at more than one trade show, and was careful to avoid duplication in doing
the fieldwork. This is discussed in more detail in the next section on sample size.
© University of Pretoria

185
5.6.1.4 Calculation of the sample size
According to Wiid and Diggines (2015:198), there are a number of generalisations
regarding sampling size, including that an increase in sample size means an
increase in accuracy. Burns and Bush (2010:401) and Housden (2007:200) agree
with Wiid and Diggines (2015:198); and they point out that there is no relationship
between sample size and repetition. If the research sample is classified as being
homogeneous, the researcher does not need to make use of a large sample to get
sufficient data (Tustin et al., 2009:359). In this study, the respondents can be
viewed as being homogeneous; since only exhibitors that exhibit at trade shows,
and who sell to other businesses, were questioned.
The researcher obtained lists of those exhibitors from the trade-show organisers
who gave their consent, and were willing to participate in the study as indicated in
Section 5.6.1.3. This limited the access that the researcher had to potential
respondents. It was established that there would be 423 exhibitors at the four
trade shows. Although two of the trade shows, namely: IFSEC and OSH had a
large number of exhibitors, the researcher found that a number of the exhibitors
had exhibited at Afrimold as well. The same happened at the Cape Town Industrial
trade show; where the exhibitors had already completed the questionnaire at
Afrimold, IFSEC or OSH. It was established that 64 of the exhibitors had already
exhibited at more than one trade show; and they had, therefore, only completed
one questionnaire. This made the sample population much smaller than the
researcher expected. A further 118 exhibitors did not give their consent to
participate in the study.
In this study the confidence level of 95% is used and all exhibitors that exhibited at
the four trade shows was included. Using the law of numbers the sample required
for this study would be 217 if there was 500 in the sample (Saunders et al.,
2009:213). The sample size is also in line with other trade show studies such as
Keswell (2010); Tafesse and Korneliussen (2011); Lee and Kim (2008);
Seringhaus and Rosson (2004); Yuksel and Voola (2010); Plouffe et al. (2013);
Blyth (2002); Smith et al. (2004) and Hanchette (2007). The researcher obtained
241 questionnaires; and of these, nine questionnaires were rejected – giving a
© University of Pretoria
186
total of 232 questionnaires. Therefore, the required number sample size was
achieved.
5.6.1.5 Selecting sample elements
In this step of the sampling process, the researcher must select the specific
respondents to be included in the research. This is done to indicate to the
fieldworkers who will be included in the research. The fieldworkers were instructed
to only hand out the questionnaires to one exhibit staff member at each exhibition.
The selected respondents also needed to indicate that they interact with the
attendees, while manning the exhibit stand.
The fieldworkers were instructed to each take a row of exhibition stands, and to
move down their indicated row, and hand out the questionnaires. This was done to
ensure that all the exhibition stands were included in the study. The interviewers
were also provided with a list of respondents who had previously completed a
questionnaire at previous trade shows – so as to not duplicate the data.
5.6.1.6 Gathering data from designated elements
In the last step of the sampling process, the researcher gathered the data from
respondents. A number of things can happen at this stage, such as unwillingness
from the respondents to participate, respondents not being available, interviewers
not following procedures, or other sampling-related errors (Wiid & Diggines,
2015:204). The researcher took note of all the possible problems that can happen
in this stage; and he placed checks in place to ensure that the interviewers
followed their instructions. In this step, the researcher was also available at each
of the trade shows, to monitor and assist the fieldworkers. It must be noted that a
number of the respondents were unwilling to participate in the study.
If there is a sampling error, it would mean that there is a difference between the
results obtained from a sample and the results that a researcher would have
gathered – if the whole population had been used (Churchill et al., 2010:330). This
can occur when the researcher does not have the right size of sample, or failed to
© University of Pretoria

187
include the right sample unit (Bradley, 2010:151). Consequently, the researcher in
this study made use of the Exhibition and Event Association of Southern Africa
(EXSA) official members’ list. Furthermore, a clear sampling process was followed
in this study, to ensure that no sampling errors occurred. A clear process
consisting of six steps, as indicated in Figure 5.3, was applied in this study.
The research method used in this study is discussed in the next section.
5.7 RESEARCH METHODS TO COLLECT THE DATA
After the sampling has been done the next process the researcher needs to
consider is the data-collection method that would be used to gather the required
information, in order to achieve the objectives of the study. A researcher has to
choose between qualitative and quantitative research – taking into consideration
the differences between the two methods. Qualitative research can be seen as
unstructured research that is exploratory in nature based on a small sample to
provide insight. Quantitative research quantifies the data and asks the questions:
What? Where? When? How many? and How often? (Malhotra & Birks, 2007:133).
In this study, both qualitative and quantitative data were used. According to Wiid
and Diggines (2015:87), the qualitative approach is defined as the collection,
analysis, and interpretation of that data that cannot be meaningfully quantified,
which are summarised in the form of numbers. Qualitative research reveals the
behaviour and perception that influence a target population in regard to a topic or
issue (Burns & Bush, 2010:233). Qualitative research also provides a research
with insight into the specific behaviours of people. In many research studies,
qualitative research is done before quantitative research is undertaken, in order to
provide the researchers with a better understanding to the background of the
research problem (Berndt & Petzer, 2011:45).
In this study, the researcher conducted the qualitative research by talking to the
trade-show organisers, EXSA and the exhibitors, in order to gain a better
understanding of the role of selling in trade shows. It must be noted that the
interviews were not done in a structured manner; and they were done to guide the
© University of Pretoria

188
researcher, rather than to provide specific facts. The information gathered with
other information sources, such as previous research studies, was used as a
guide to assist in the construction of the data-collection instrument that was also
used in this study.
Quantitative research makes use of structured questions, in which the response
options have been pre-set; and a large number of respondents are involved (Burns
& Bush, 2010:235); and where mathematical analysis can be done, which can be
used to find the statistically significant differences (McDaniel & Gates, 2010:91).
According to Berndt and Petzer (2011:47), quantitative research methods are
either descriptive in nature, or can be used to determine the causal relationships
between variables. Quantitative research therefore, aims to determine the
relations between the independent variable and dependent variable in a population
– by means of statistical, mathematical or computational techniques (Wiid &
Diggines, 2015:59).
It was indicated that in this study, both primary and secondary data are to be used.
The data-collection method used in this study comprised primary data that could
be done by means of a survey, observation or experiment (McDaniel & Gates,
2010:72). A survey is a method, in which the information is gathered by
communicating with a representative sample of people in the population (Wiid &
Diggines, 2015:109); while observation research, on the other hand, is the
process of observing people by using systematically planned and carefully
recorded methods (Churchill et al., 2010:223); and lastly, experimental research
is the process of changing one variable, and then observing whether there is a
change in another variable (Bradley, 2010:267).
One of the most popular primary methods used is the survey method, in which the
fieldworkers interact with the respondents to gather opinions, attitudes and
behaviours. Survey methods include: personal interviews, telephone interviews,
mail surveys, internet surveys, executive interviews, mall-intercept interviews and
self-administered questionnaires (Wiid & Diggines, 2015:112; McDaniel & Gates,
2010:129). Surveys are mostly done through interviews with a number of
respondents – by way of a designed questionnaire (Burns & Bush, 2010:266).
© University of Pretoria
189
The survey method used for this study was a self-administered questionnaire.
Self-administered questionnaires were used; since the respondents were in a
central location, where the researcher had access to a captive audience (McDaniel
& Gates, 2010:134).
The respondents were all at the trade-show venue, for a specific period of time, in
a central location; and the researcher therefore, had access to them. Another
reason for making use of a self-administered survey method was that the
respondents could complete the questionnaire at their own pace and select the
place, and time to complete it (Burns & Bush, 2010:266).
The exhibition organisers requested the researcher not to interfere with the
exhibitors; while they were busy with the attendees. A self-administered
questionnaire was used to allow the respondents to complete the questionnaire
unhindered by the researcher. The questionnaire was dropped off at an exhibition
stand, and then later picked-up by the interviewers (Zikmund & Babin, 2010:431).
With a self-administered questionnaire, the researcher needed to take great care
in designing the questionnaire; since the interviewers were not available to assist
the respondents. The design of the self-administered questionnaires was of the
upmost importance – to ensure that the correct data were obtained. Next, the
questionnaire-design process used in this study is discussed.
5.8 THE QUESTIONNAIRE DESIGN
Questionnaire design must be done in a constructed manner; since it impacts how
the respondents view the questions’ meaning; and how they respond to each
question (ESOMAR, 2007:85). Questionnaires provide the advantage that all the
respondents answer the same questions. A questionnaire can be called a
schedule, an interview form, or a measuring instrument; since it comprises a
formalised set of questions for obtaining information from the respondents
(Malhotra & Birks, 2007:326). A questionnaire is a set of questions that is
designed to generate the data necessary for accomplishing the objectives of the
research study (McDaniel & Gates, 2010:287).
© University of Pretoria

190
According to Burns and Bush (2010:330), a questionnaire serves six key functions:
namely:
• It converts the research objectives into specific questions that are asked of
the respondents;
• It standardises the questions and the response groupings, so that all the
respondents react in the same way;
• The wording, question flow, and the appearance of a questionnaire can
encourage and motivate the respondents to co-operate during the interview;
• Questionnaires provide a permanent record of the research;
• The type of questionnaire used can speed up the process of the data
analysis; and
• The questionnaire contains information on which reliability assessments
can be conducted; and the validation of the respondent’s participation can
be followed up on.
Figure 5.5 The questionnaire design process
Source: Adapted from McDaniel and Gates (2010:292)
To make sure that the questionnaire achieves the objectives of the research study,
the researcher must make use of a process to construct the questionnaire. The
process of constructing the questionnaire must be seen as being just as important
as getting the correct sample (Churchill et al., 2010:287). Therefore, in this study,
a structured process was used to design the questionnaire, in order to achieve the
Step 1: Determine survey objectives, resources and constraints (Section 5.8.1, Chapter 1, Chapter 5)
Step 2: Determine the data collection method (Section 5.8.2)
Step 3: Determine the question response format (Section 5.8.3)
Step 4: Decide on the question wording (Section 5.8.4)
Step 5: Establish questionnaire flow and layout (Section 5.8.5)
Step 6: Evaluate the questionnaire (Section 5.8.6)
Step 7: Obtain approval of all relevant parties (Section 5.8.7)
Step 8: Pre-test and revise (Section 5.8.8)
Step 9: Prepare final copy (Section 5.8.9)
Step 10: Implement the survey (Section 5.8.10)
© University of Pretoria

191
objectives of this study. The questionnaire design process, as set out by McDaniel
and Gates (2010:292), and illustrated in Figure 5.5, was used for this study.
In this study, a questionnaire design process was followed; since no previous
study that focused on the sales process at trade shows and all its stages had been
done. The researcher, therefore, made use of the variables obtained from
numerous journal articles and discussions with exhibitors. Not a lot of previous
tested scales existed for the sales process at trade shows therefore this study was
exploratory in nature and is one of the possible limitations of this study. A number
of other studies needed to be adapted with literature and discussions with
organisers to make it relevant for the South African market. Studies done by
Weinrauch, Stephens-Friesen and Carlson (2001:186-188), Guenzi (2001:715)
and the scale of the Bureau for Market Research (BMR) was used to assist in
setting up the questions relating to the profile of a business. For the main variables
of the questionnaire, a study done by Jaramillo and Marshall (2004:9-25) was
used. This was done on the critical success factors in the selling process in the
banking industry. The afore-mentioned article provided the researcher with a pre-
tested set of questions relating to the sales process; although it was somewhat
adapted for the purpose of this study.
The researcher also relied on a number of studies that relate to trade shows, in
order to guide the construct of the questionnaire on issues relating to pre-show
activities (Blyth & Rayner, 1996:20-24; Herbig et al.,1998: 425–435; Hansen
1996:47; Kirchgeorg et al., 2010a:63-72).
5.8.1 Survey objectives, resources and constraints
The objectives of this study were stated in this chapter in Section 5.4 and also in
Chapter 1. The research objectives guided the research in determining, which
questions should be used in the questionnaire. A number of resource constraints
were experienced in the study. Travel, printing costs for the questionnaires, and
payment of the field workers had to be accounted for. Travelling to Cape Town to
gather data from the Cape Town Industrial trade show, and the transport of
fieldworkers, were some of the resource issues that had to be considered in this
© University of Pretoria

192
study. The cost per questionnaire was extremely high due to the afore-mentioned
expenses.
5.8.2 Determining the data-collection method
In this study, survey research was used, with a self-administered questionnaire. In
selecting a self-administrated questionnaire, the researcher looked at a number of
different issues relating to the selection; since this impacted the rest of the design
process (Wiid & Diggines, 2015:115; McDaniel & Gates, 2010:293). The main
reason for the selection of self-administered questionnaires was the nature of
trade shows. In discussions the researcher had with both the organisers and the
exhibitors, it came to light that the exhibitors had no control on when attendees
would visit their exhibit stands. It was pointed out to the researcher that exhibit
staff would be able and more willing to complete the questionnaires if they could
do so on their own time at the trade show.
The format of the questionnaire was important; since it was a self-administered
questionnaire. The questionnaire in this study consisted of a number of different
types of questions.
5.8.3 Determining the question-response format
A researcher must carefully select the format of the questionnaire, so as to limit
response-order bias. Response-order bias is an error that arises when the
response to questions is influenced by the order in which they are asked (Brown &
Suter, 2013:102). In this study, the questionnaire response format was especially
important due to the self-administered questionnaire. This meant that the
researcher was not present to assist the respondents; while they completed the
questionnaire.
Two basic types of questions can be used in setting up a questionnaire: an open-
ended or a fixed-alternative, also known as a closed-ended question (Churchill &
Iacobucci, 2005:242). Open-ended questions state a specific problem; and the
respondent then answers in his or her own words. While closed-ended questions
© University of Pretoria
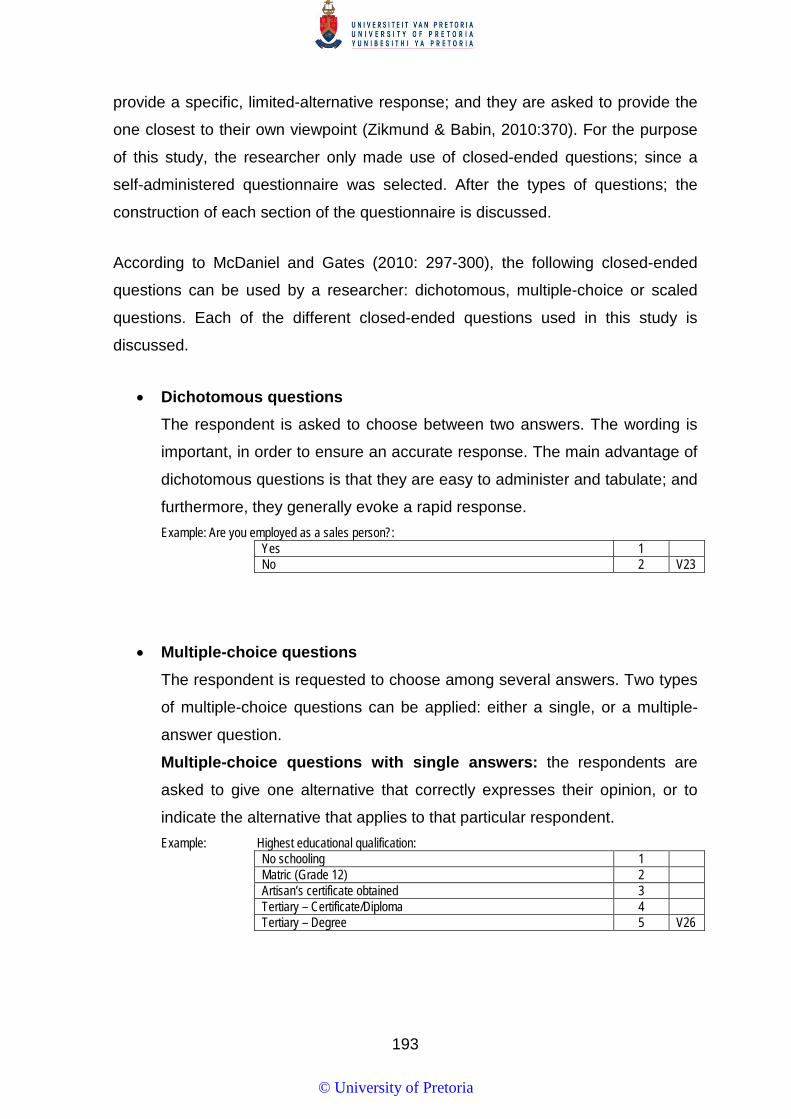
193
provide a specific, limited-alternative response; and they are asked to provide the
one closest to their own viewpoint (Zikmund & Babin, 2010:370). For the purpose
of this study, the researcher only made use of closed-ended questions; since a
self-administered questionnaire was selected. After the types of questions; the
construction of each section of the questionnaire is discussed.
According to McDaniel and Gates (2010: 297-300), the following closed-ended
questions can be used by a researcher: dichotomous, multiple-choice or scaled
questions. Each of the different closed-ended questions used in this study is
discussed.
• Dichotomous questions
The respondent is asked to choose between two answers. The wording is
important, in order to ensure an accurate response. The main advantage of
dichotomous questions is that they are easy to administer and tabulate; and
furthermore, they generally evoke a rapid response. Example: Are you employed as a sales person?:
Yes 1 No 2 V23
• Multiple-choice questions
The respondent is requested to choose among several answers. Two types
of multiple-choice questions can be applied: either a single, or a multiple-
answer question.
Multiple-choice questions with single answers: the respondents are
asked to give one alternative that correctly expresses their opinion, or to
indicate the alternative that applies to that particular respondent. Example: Highest educational qualification:
No schooling 1 Matric (Grade 12) 2 Artisan’s certificate obtained 3 Tertiary – Certificate/Diploma 4 Tertiary – Degree 5 V26
© University of Pretoria
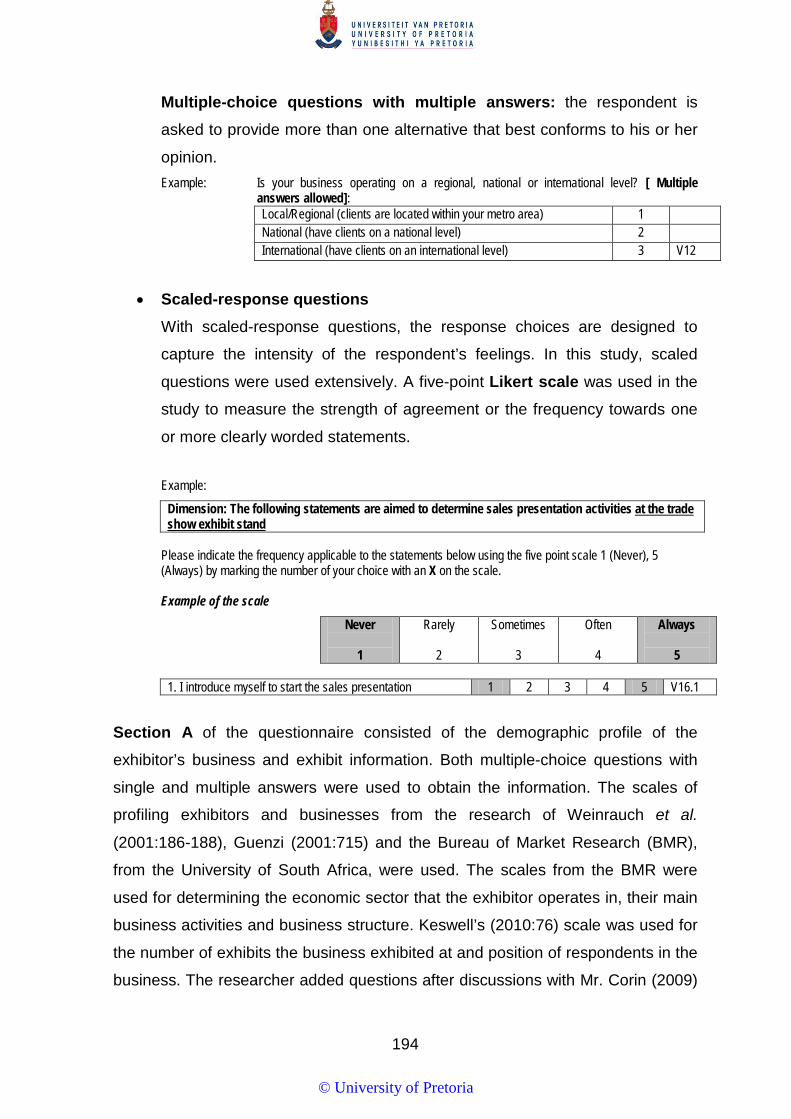
194
Multiple-choice questions with multiple answers: the respondent is
asked to provide more than one alternative that best conforms to his or her
opinion. Example: Is your business operating on a regional, national or international level? [ Multiple
answers allowed]: Local/Regional (clients are located within your metro area) 1 National (have clients on a national level) 2 International (have clients on an international level) 3 V12
• Scaled-response questions
With scaled-response questions, the response choices are designed to
capture the intensity of the respondent’s feelings. In this study, scaled
questions were used extensively. A five-point Likert scale was used in the
study to measure the strength of agreement or the frequency towards one
or more clearly worded statements. Example:
Dimension: The following statements are aimed to determine sales presentation activities at the trade show exhibit stand
Please indicate the frequency applicable to the statements below using the five point scale 1 (Never), 5 (Always) by marking the number of your choice with an X on the scale.
Example of the scale
Never
1
Rarely
2
Sometimes
3
Often
4
Always
5
1. I introduce myself to start the sales presentation 1 2 3 4 5 V16.1 Section A of the questionnaire consisted of the demographic profile of the
exhibitor’s business and exhibit information. Both multiple-choice questions with
single and multiple answers were used to obtain the information. The scales of
profiling exhibitors and businesses from the research of Weinrauch et al.
(2001:186-188), Guenzi (2001:715) and the Bureau of Market Research (BMR),
from the University of South Africa, were used. The scales from the BMR were
used for determining the economic sector that the exhibitor operates in, their main
business activities and business structure. Keswell’s (2010:76) scale was used for
the number of exhibits the business exhibited at and position of respondents in the
business. The researcher added questions after discussions with Mr. Corin (2009)
© University of Pretoria
195
such as the number of product, turn-over and how many staff members participate
in the trade show.
Sections B, of the questionnaire dealt with business actions in regards to trade
shows. Business actions include elements, such as: marketing; the setting of
objectives; evaluation and planning; staff at trade shows; training of exhibit staff,
the introduction of products, and the measurement of success. Here the scales of
Hanchett (2007:146-150) was used pertaining to exhibit staff and objectives.
Furthermore, Seringhaus and Rosson (2004:164) scales for communication used
to attract attendees, staff training, prospecting and exhibit service were used. Ling-
yee (2007:378) questions on trade shows performance was used for different
objectives. Questions on pre-show sales activities was added after decisions with
Corin (2009).
Section C of the questionnaire the pre-show marketing activities used to attract
attendees to a trade show. Seringhaus and Rosson (2004:164), and Hanchett
(2007:146-150) questions on the different methods used to invite attendees such
as mass media, personal interview and the different types of business media was
used.
Section D focused on the marketing activities used to attract attended to the
exhibit stand at the show. Hanchett (2007:146-150) questions pertaining to
attracting attendees to the exhibit stand was mainly utilised while Herbig and
O’Hara (1998:431) was consulted to construct the questions on the use of social
activities by exhibitors.
Sections E, F, G and I obtained information on the use of the sales process in
regard to the sales presentation, the type of objections, dealing with objections,
and closing the sale. Scaled questions were used to measure the respondents’
level of agreement or frequency regarding specific stages in the sales process.
Here, the scales of Jaramillo and Marshall (2004:9-25) were used extensively; and
only a minor adjustment was made to change the focus on the selling process for
trade shows. Furthermore, Ling-yee (2008:41), Tanner (2002:234) and Hansen
(2004:11) was used to construct questions related to what is done during the
© University of Pretoria
196
presentation and closing the sale. A number of the before mentioned authors refer
to the closing and getting sales leads therefore, questions was asked in this
regard. A number of questions were also constructed by the researcher based on
the discussions with Mr. Corin from specialised exhibitions. Questions on the use
of technology during the presentation, dealing with objections and close was
added since it play an important role in trade show sales.
For section G of the questionnaire a number of questions was adapted since the
terminology from this section of Jaramillo and Marshall (2004:9-25) might have not
been familiar to South African sales persons. Wording such as non-disputing
method was replaced with simpler terminology such as ‘direct denial’. Section I
was also expanded to include not only the closing methods of Jaramillo and
Marshall (2004:9-25) since their study focused only on the selling of banking
products, while at trade shows a much wider variety of products is being offered to
attendees. Questions reflecting negotiations or leaving the close of the deal for
after the trade show was also added as to reflect the current practices in industry.
In this study, a number of questions was used and adapted from the afore-
mentioned authors – due to the limited number of studies that deal with the sales
process (vide Section 4.6). The changes made to the questions were done after
consultation with the industry experts and a statistician. This was done to make it
applicable for obtaining the data required for this study.
Lastly, in section J, multiple-choice questions were asked to obtain the
demographic profile exhibit staff. In this section, the researcher made use of
scales developed by Weinrauch et al. (2001:186-188) and Guenzi (2001:715) as
well as more general questions related to the position (sales vs non-sales) and the
age of the respondents.
5.8.4 Deciding on the question wording
The wording of questions is a critical step in the questionnaire design; since it
must be done in such a manner that the respondent can clearly and easily
understand it (Malhotra & Birks, 2007:338). It must be noted that better-worded
© University of Pretoria

197
questions give the respondents the opportunity to respond in degrees, such as:
never, rarely, sometimes, often and always. This makes the questions more
consistent with the respondent’s actual deliberations or actions, rather than any
the absolute versions (Burns & Bush, 2010:333). Zikmund and Babin (2010:373)
point out that the type of data-collection method would influence the wording
format and phrasing in a questionnaire. As indicated in this study, a self-
administered questionnaire was used; and the interviewers not present to explain
any questions or concepts to the respondents. The researcher followed guidelines
to ensure that the respondents would be able to answer all the questions in the
questionnaire.
Wiid and Diggines (2015:169) provide guidelines in formulating questions:
• Use simple words that are familiar to the respondents;
• Avoid ambiguous words and questions;
• Do not use leading questions that indicate the answer;
• Avoid presumptions and assumptions;
• Keep away from using generalisations;
• Avoid double-barrelled questions that ask two questions at the same time;
• Avoid any questions that the respondent might find awkward.
The guidelines, as stated, in wording questions were followed by the researcher to
ensure that exhibit staff, could answer all the questions that were asked in the
questionnaire. The data-collection method also influences the structure of the
questionnaire.
5.8.5 Establishing the questionnaire flow and layout
According to Churchill et al. (2010:306), the order in which questions are
presented can be crucial to the success of the research study. The layout is
important; since the arrangement of the questions and the ease with which the
respondents can complete the questions could have the potential to affect the
quality of the information gathered (Burns & Bush, 2010:341). In this study, the
questionnaire started with a covering letter that informed the respondent on the
© University of Pretoria
198
purpose of the research; and what the data that would be used for. As part of the
covering letter, the respondent also provided his/her consent to participate in the
study. Any self-administered survey qualifies for anonymity, provided the
respondent does not reveal his/her identity (Burns & Bush, 2010:343). To motivate
the respondents to complete the questionnaire honestly; it was indicated in the
covering letter that the respondents would not be identified.
Easy-to-answer questions and positive questions should be placed at the
beginning of a questionnaire – to motive the respondents to complete the
questions (Ghauri & Grønhaug, 2010:125). Section A of the questionnaire dealt
with the business profiles of the exhibitors and exhibit information; these questions
were placed first, to motivate the respondents to complete the questions; since
they were short and easy to answer. Thereafter, in section B, more in-depth
questions were asked. These sections consisted of a banner stating what the
respondent would be questioned on in each section, and an example of the scale
that would be used. An example of the scale was provided to make it easier for the
respondent to complete the questions within the section.
In section J, the demographic questions of the exhibit staff were asked.
As part of the layout, the researcher made sure that the questionnaire was
presentable by ensuring that it looked neat and professional (Berndt & Petzer,
2011:47). The researcher, therefore, looked at the font size, the table layout, and
how the different sections had been laid out in the questionnaire. In this study, the
questionnaire was printed on white paper; and black ink was used – to make it
easy for the respondents to read the questions (Bradley, 2010:210).
5.8.6 Evaluating the questionnaire
After the completion of the initial questionnaire, the researcher must re-examine
each question, and pay specific attention to the questions’ content, phrasing, the
required answer, and the logical flow of the questions (Wiid & Diggines, 2015:171).
The researcher took a critical look at the questionnaire on completion. The
researcher consulted a statistician, a trade-show exhibitor and EXSA to help with
© University of Pretoria
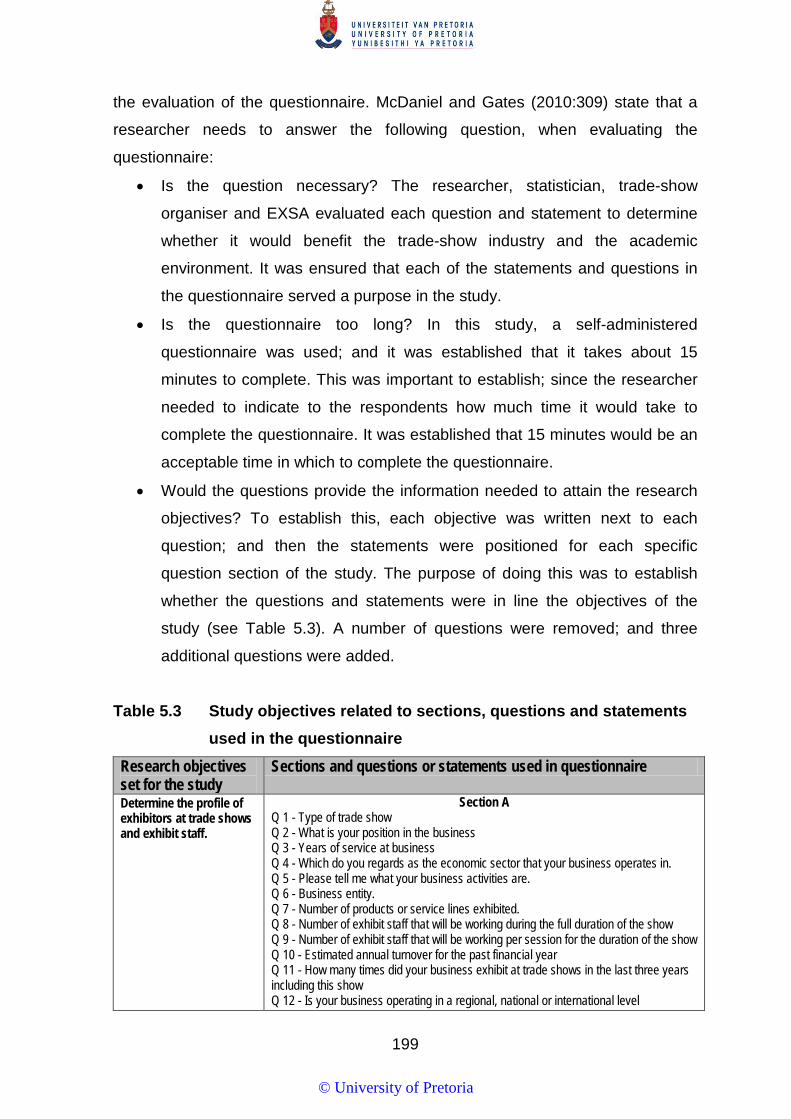
199
the evaluation of the questionnaire. McDaniel and Gates (2010:309) state that a
researcher needs to answer the following question, when evaluating the
questionnaire:
• Is the question necessary? The researcher, statistician, trade-show
organiser and EXSA evaluated each question and statement to determine
whether it would benefit the trade-show industry and the academic
environment. It was ensured that each of the statements and questions in
the questionnaire served a purpose in the study.
• Is the questionnaire too long? In this study, a self-administered
questionnaire was used; and it was established that it takes about 15
minutes to complete. This was important to establish; since the researcher
needed to indicate to the respondents how much time it would take to
complete the questionnaire. It was established that 15 minutes would be an
acceptable time in which to complete the questionnaire.
• Would the questions provide the information needed to attain the research
objectives? To establish this, each objective was written next to each
question; and then the statements were positioned for each specific
question section of the study. The purpose of doing this was to establish
whether the questions and statements were in line the objectives of the
study (see Table 5.3). A number of questions were removed; and three
additional questions were added.
Table 5.3 Study objectives related to sections, questions and statements used in the questionnaire
Research objectives set for the study
Sections and questions or statements used in questionnaire
Determine the profile of exhibitors at trade shows and exhibit staff.
Section A Q 1 - Type of trade show Q 2 - What is your position in the business Q 3 - Years of service at business Q 4 - Which do you regards as the economic sector that your business operates in. Q 5 - Please tell me what your business activities are. Q 6 - Business entity. Q 7 - Number of products or service lines exhibited. Q 8 - Number of exhibit staff that will be working during the full duration of the show Q 9 - Number of exhibit staff that will be working per session for the duration of the show Q 10 - Estimated annual turnover for the past financial year Q 11 - How many times did your business exhibit at trade shows in the last three years including this show Q 12 - Is your business operating in a regional, national or international level
© University of Pretoria

200
Table 5.3 continue…
Research objectives set for the study
Sections and questions or statements used in questionnaire
Section J Q 21 – Gender Q 22 – Indicate the department you work in Q 23 – Are you employed as a sales person Q 24 – Age of respondent Q 25 – Highest educational qualification
• To determine if sub-stages exist within each of the stages of the sales process at trade shows.
• To determine if sales persons and non-sales persons differ regarding the sales process followed at trade shows.
• To determine if the various types of trade shows influence the sales process.
• To determine if the type of business operations of an exhibitor influence the sales process followed at trade shows.
Section B Q 13.1 Our business have written financial objectives for the trade show Q 13.2 Our business have written promotional objectives for the trade show Q 13.3 Our business have written sales objectives for the trade show Q 13.4 Our business exhibit at trade shows to get sales Q 13.5 Our business planned before the trade show to exhibit to specific target customers Q 13.6 Our business measures success at the trade show in terms of financial gains Q 13.7 Our business measure trade show success by the number of new prospects Q 13.8 Non-financial aspects are used to measure trade show success Q 13.9 Our business use trade shows to introduce new products Q 13.10 Trade shows are used to as a platform to test new product concepts Q 13.11 Trade shows provide our business with information on my industry Q 13.12 Trade shows are used to maintain contact with existing customers Q 13.13 Trade shows are applied to develop new customer contacts Q 13.14 Trade shows are used to get a competitive advantage over non-exhibiting competitors Q 13.15 Trade shows are applied to enhance the business image Q 13.16 Trade shows assist our business with other marketing communication functions Q 13.17 Trade shows assist our business in the training of staff Q 13.18 Trade shows assist our business to motivate staff Q 13.19 Our business has a tracking system to keep information on attendees that visited our exhibit stand
Section C Q 14.1 Invitations to attend the trade show are personally delivered to customers Q 14.2 Our business apply electronic communication e.g. internet, e-mail to inform customer about a trade show Q 14.3 I personally invite customers to a trade show Q 14.4 Our business apply electronic communication e.g. internet, e-mail to inform customer about a trade show Q 14.5 Sending direct mail gets attendees to visit a trade show Q 14.6 Our business provide customers with free entry vouchers to attract them to trade shows
Section D Q 15.1 Our business use video screens to attract attendees to our exhibit stand Q 15.2 Our business hand out free promotional material to attendees to attract them to our exhibit stand Q 15.3 Our business use competitions to attract attendees to our exhibit stand Q 15.4 Our booth staff move around the trade show to attract attendees Q 15.5 Our business co-sponsor coffee courts, luncheons etc. to attract attendees to our exhibit stand Q 15.6 Our exhibit staff invite attendees at social activities (luncheons, gala diners etc.) at the trade show to visit our exhibit stand
© University of Pretoria

201
Table 5.3 continue…
Research objectives set for the study
Sections and questions or statements used in questionnaire
Section E Q 16. 1 I use a benefit of the product or service to start the sales presentation Q 16.2 I start the sales presentation with a statement Q 16.3 I use a compliment to start the sales presentation Q 16. 4 I start the sales presentation by asking questions to the attendees Q 16. 5 I express an opinion to begin the sales presentation Q 16. 6 I use a memorised sales presentation at the trade show Q 16 7 I use a sales presentation that follows a general outline to determine attendees’ needs Q 16.8 I start the sales presentation with questions to determine attendees’ needs Q 16. 9 I use an in-depth analysis of attendees’ needs during the sales presentation Q 16.10 I use the group sales presentations Q 16.11 I ask questions during the sales presentation to establish the customers’ interest in the product/service Q 16.12 I use product/service demonstrations during the sales presentation Q 16.13 I use information technology (e.g. a computer, tablet, PDA etc.) to demonstrate the product/service features Q 16. 14 I keep a note of the attendees’ interest in the product/service during the sales presentation Q 16.15I keep a record of attendee’s names that visit our exhibit stand
Section F Q 17.1 Attendees do not openly state reasons for not being interested in the product/service Q 17.2 Attendees stall decision-making at trade shows Q 17.3 Attendees indicate that they do not need the product/service, as a way to stop the sales presentation Q 17.4 Money objections occur during the sales presentation Q 17.5 Product/service related objections occur during the sales presentation Q 17.6 Objections about our business occur during the sales presentation
Section G Q18.1 I deal with an objection by directly denying it Q 18.2 I deal with objections by indirectly denying it Q 18.3 If there is an objection I let it go and continue with the sales presentation Q 18.4 I compensate with another benefit of the product/service to overcome an objection during the sales presentation Q 18.5 I use a disadvantage of my product/service as an advantage to overcome the objections Q 18.6 If there is an objection, I let another staff member present, answer it
Section I Q 20.1 I ask directly for a sale during the sales presentation Q 20.2 I list the benefits of the product/service to close the sales presentation Q 20.3 I list the advantages of the product against the disadvantages to close the sale Q 20.4 Once I assume a customer will buy I start closing the sales presentation Q 20.5 I provide the attendee with two options regarding the product/service and then close the sales presentation Q 20.6 I close the sales presentation on a minor point Q 20.7I compliment the attendee and close the sales presentation Q 20.8 I get the attendee to say yes all the time and then close the sales presentation Q 20.9 I indicate to the attendee to act now otherwise something in the sale will change (e.g. price, availability) to close the sales presentation Q 20.10 I use the negotiations to close the sales presentation
© University of Pretoria

202
In evaluating a questionnaire there needs to be looked at the validity of the
measuring instrument. Validity is the extent to which differences in observed scale
scores reflect true differences among objects on the characteristics being
measured rather than systematic or random error (Malhotra, 2007:226). There are
three ways to establish validity: face, criterion and construct validity. Face validity
is when professionals agree that a scale logical reflects the concept being
measured. In this study the questionnaire was evaluated by the researcher,
promoter, statistician and the trade show organisers and governing body. Criterion
validity deals with the degree to which a measurement instrument can predict a
variable that is designated a criterion. In this study criterion validity was important
since the study was explorative in nature and a combination of literature was used
to construct the questionnaire. Construct validity exist when a measure reliably
measures and truthfully represent a unique concept. In this study there need to be
looked at how the construct of the stages of the sales process at trade shows are
related to one another (McDaniel & Gates, 2010:255-256; Zikmund & Babin,
2010:335-336).
Reliability is the degree to which the measure is free from random error and
therefore provides consistent data. To have reliability there must be consistency in
the measuring instrument (McDaniel & Gates, 2010:251). To determine the
reliability of constructs the Cronbach’s Alpha coefficient technique can be used
and is discussed in this chapter.
5.8.7 Obtaining the approval of all the relevant parties
Once the questionnaire had been evaluated, copies were distributed to all parties
that had any direct authority over the project (McDaniel & Gates, 2010:310).
Firstly, ethical clearance was obtained from the University of Pretoria. Secondly,
permission was obtained from EXSA to approach the different members of trade-
show organisers to assist the researcher. Thirdly, permission was obtained from
the trade-show organisers for the researcher to distribute the questionnaires to the
different exhibition stands at their trade shows. Lastly, informed consent was
obtained from each of the respondents at the exhibit stands. It must be noted that
the researcher did not make use of any incentives in this study.
© University of Pretoria
203
Once approval had been received from all the parties involved, the researcher
proceeded to continue to pre-test the questionnaire.
5.8.8 Pre-testing and revision
According to Churchill et al. (2010:311), a pre-test is when the questionnaire is
used on a trial basis in a small pilot study, in order to determine how well the
questionnaire works. The pilot test would also provide answers on the validity and
reliability of the data that would be collected (Saunders et al., 2009:394). The
questionnaire was pre-tested before any actual fieldwork started on the study.
Once the questionnaire was constructed it was discussed with Specialised
Exhibitions and Exhibition Association of Southern Africa (EXSA) to provide inputs
before the pilot study was done. Permission was obtained by the researcher to
pre-test the questionnaire at Afrimold; where the exhibit staff at the exhibit
completed the questionnaire. The Afrimold trade show was chosen, because of its
small size; and so that the researcher would have access to most of the
respondents.
At the trade show, the researcher was able to obtain 42 completed questionnaires.
A factor analysis and a Cronbach`s alpha were done after the data had been
collected, in order to test the reliability and validity of the data. The tests indicated
that the questionnaire was valid and reliable; and that it was ready for the final
copy. At the end of this study in Appendix E, the pilot study is discussed in more
detail.
5.8.9 Preparing final copies of the questionnaire
McDaniel and Gates (2010:310) point out that in preparing final copies, the skip
patterns, numbering and pre-coding must be done; and the results must be
proofread. In this study, the questionnaire, that included the cover lettering, was
proofread; before it was sent for printing. A language editor and a statistician
approved the questionnaire by looking at the typing, the numbering, the pre-coding
and the covering letter.
© University of Pretoria
204
5.8.10 Implementing the survey
In the final stage, the researcher has to make use of the constructed questionnaire
to gain access to the sample and get an optimal response rate (Saunders et al.,
2009:395). For the purpose of this study, the researcher made use of fieldworkers
to assist in gathering the necessary data.
Berndt and Petzer (2011:206) indicate that the data-collection process consists of
five steps; and in this study, such a process was followed. In the first step, the
researcher selected the fieldworkers to assist in the data collection. The
researcher selected two part-time lecturers and a student assistant to assist with
the data gathering. This was done; since they had already assisted another
doctoral student, and had the correct attributes. Secondly, the field workers were
trained by the researcher on how to approach and qualify the respondents for the
study. The fieldworkers were already knowledgeable – due to their participation in
previous studies.
Thirdly, the supervision was done by the researcher himself who did the quality
control, the provisional editing and the sampling control. Fourthly, the validation of
the fieldwork was done to ensure that the correct procedures had been followed
and the completeness of the questionnaires was checked. Lastly, the evaluation of
the fieldworkers was done.
The function of the fieldworkers was to approach each exhibit stand, and drop off
one questionnaire at each. The fieldworkers qualified the respondents by only
giving questionnaires to exhibit staff that manned the exhibit; and they had not
completed the questionnaire at another trade show. The respondents were asked
to complete the questionnaire; and it was indicated that it would be collected at the
end of the day.
If the respondents did not complete the questionnaire, they were once again asked
to complete it; and they were told that it would be collected the next day. On the
last day of the trade show, the fieldworkers made three attempts throughout the
day to get the questionnaires from the exhibit staff. If the exhibit staff that had not
© University of Pretoria
205
completed the questionnaire, this was regarded as a refusal to participate in the
study.
Once the completed questionnaires were received, the next step was to edit the
questionnaires.
5.9 EDITING, CODING, DATA-CAPTURING
5.9.1 Editing
Editing involves the inspection of the questionnaires, and if needed, the correction
thereof. This process is done to ensure that the answers are complete, accurate
and suitable for further processing (Bradley, 2010:314). Editing is done in two
stages: in the field edit, and in the central-office edit (Churchill et al., 2010:401). In
this study, the fieldworkers checked each questionnaire, as it was collected at
each of the exhibit stands from the respondents. The fieldworkers checked that
there were no omissions in the questionnaire, and that the respondents had filled
in all the required questions. Central-office editing was done by the researcher
who checked each of the questionnaires; this was done once again before the
data were captured for correctness and completion.
The researcher could take specific action if questionnaires had not been
completed. They could be returned to the field, assigned missing values, or the
questionnaire could be discarded (Malhotra & Birks, 2007:423). In this study, the
researcher could not return the questionnaire; since the researcher did not record
any personal contact data of the respondents – in order to maintain confidentiality.
Where the researcher did find that the respondents left out one or two questions,
the average of the other respondents’ answers was used to assign a value. The
researcher discarded nine questionnaires; but this was not due to incompleteness;
but it was clear that the respondents had not taken the research seriously.
Ghauri and Grønhaug (2010:150) point out that if respondents only chose one
option per answer right through the questionnaire; then this is an indication that
they did not take it seriously. Nine of the questionnaires were discarded for this
© University of Pretoria
206
reason – where the respondents only chose one response continuously. Once the
editing of the questionnaires had been done; the coding was considered to be
complete.
5.9.2 Coding
According to McDaniel and Gates (2010:388), coding is the process of grouping
and assigning numeric codes to the various codes for the different responses to
the questions. The process of categorising, recording and transferring the data to
a data-storage medium is named coding (Arora & Mahankale, 2013:15). In this
study, only closed-ended questions were used; and this made the process of
coding easier than with open-ended question. To facilitate the process of statistical
analysis and the data capturing, the researcher made use of numbers to code the
questions (Ghauri & Grønhaug, 2010:151). In this study, the questions that only
had one possible answer; for example, gender only received one code number;
while those questions that had more than one answer received more than one
code (Churchill et al., 2010:403).
A researcher had two options in doing the coding; it could be done either before
the time, or after the questionnaire had been completed. Pre-coding is the process
of assigning predetermined categories, into which the answers must be placed,
when the questionnaire is designed (Wiid & Diggines, 2015:223). In this study,
pre-coding was done; since the questionnaire consisted of closed-ended, multiple-
choice and scaled questions; where the answers could be anticipated by the
researcher. Pre-coding meant that the researcher did not need to set-up a code
book to capture the data in the computer file. Due to the afore-mentioned data,
which were directly available from the questionnaire; this saved time and money;
while also limiting the chances of making any coding errors.
5.9.3 Data capturing
Data capturing is the process of creating a computer file that holds the raw data
taken from all of the questionnaires judged suitable for analysis (Burns & Bush,
2010:459). For the purpose of this study, a spreadsheet was created, using
© University of Pretoria

207
Microsoft Excel. The data were entered directly into MS Excel by the researcher of
the study. All the questionnaire data were entered by the researcher to provide a
better understanding of the data, and the possible statistical analysis that would be
done. Once the data had been entered into the MS Excel spreadsheet, the
researcher checked them again to ensure that there were no missing codes
(Zikmund & Babin, 2010:503). If any codes were found to be missing, the
researcher went back to the original questionnaire to correct any problems. Once
the data had been gathered, the statistical analysis was done.
5.10 STATISTICAL PROCEDURES AND TECHNIQUES
In the study, both descriptive and inferential statics are/were/used to either confirm
or reject the hypotheses formulated for the study; therefore, the analysis of the
data utilised a multi-step approach. Firstly, descriptive statistics were done that
included calculation of the means, the standard deviation and frequency. In
Chapter 6, the relevant results are presented in the form of graphs and summary
tables. In the second step of the analysis, more advance statistical techniques
were employed, starting with an exploratory factor analysis, as a data-reduction
method and as a reliability analysis to establish the internal consistency and the
reliability.
As stated before, the descriptive statistics used the means, the standard deviation
and the frequency to represent the data. The mean is a common measure of
central tendency (Zikmund 2003:447); and it is the number obtained by adding
together all the elements in a set, and then dividing them by the number of
elements (Bluman, 2004:98). The mean will be used to measure he central
tendency; because a Likert scale was used in the questionnaires to gather the
required data; and the mean fits the purpose of measuring the central distribution
of levels used on the scale regarding the statements. The standard deviation is a
quantitative index of a distribution’s spread (Zikmund, 2003:452); and it is the
positive square root of the variance (Howell, 2010: 79). It is basically a measure of
the average of the deviations of each score from the mean.
© University of Pretoria

208
The frequency distribution is a summary of how many times each possible
question in a scale was recorded by the entire group of respondents (Hair et al.,
2000:394); and it entails the construction of a table that shows in absolute and
relative terms how often the different values of the variable are encountered in the
sample (Tusten et al., 2005:523). The key results can be presented efficiently
through graphs (McDaniel & Gates, 2005:431). In this study, the exhibitor’s profile
and the demographic information of the respondents will be presented in the
graphics and tables in Chapter 6.
In the second phase of the study, an inferential statistical analysis was done.
Inferential statistics allow the researcher to make claims about a population based
on a sample of the data from that population (Donnelly, 2007:6). The process of
inferential statistics is to generalise the sample results to the population results.
Burns and Bush (2010:495) state that the statistical inference provides steps for
estimating the population parameter, based on the evidence of the sample
statistics, and taking into account the sample error, based on the sample size. In
this study, the hypotheses were formulated to make inferences about the
population; and consequently, inferential statistics were used (Tustin et al.,
2009:584). The first analysis done was a factor analysis.
The first analysis conducted was a factor analysis to establish whether the
variables developed from the literature review and from the preliminary qualitative
research could, in fact, be grouped into meaningful factors at each stage in the
sales process for trade shows. According to Hair et al., (2010:94) the purpose of a
factor analysis is to define underlying structure among variables in the analysis. A
factor analysis allows a researcher to reduce a large set of scaled items down a
manageable number of factors (Pallant, 2013:104). Therefore, a factor analysis is
a method for finding relationships in multivariate data – with the intention of
reducing the factors – without the loss of any information. A factor analysis uses
the multi-variability between items to derive a new set of independent construct
measures, which can account for some of the variability found in the original set of
items (Hair et al., 1998:95-96).
© University of Pretoria
209
Before a factor analysis was done the suitability of the data for a factor analysis
needed to be assessed. The ideal sample size is more than a 150, therefore the
sample size of 232 was deemed sufficient (Pallant, 2013:187). The Bartlett’s test
was used to test overall significance of all correlation within the correlation matrix.
Barlett’test is used to evaluate all factors and each of the factors is evaluated
separately against the hypothesis that there are no factors. The Kaiser-Meyer-
Olkin (KMO) measure of sampling will be used to determine if the patterns of
correlations are relatively compact and that the factor analysis will yield distinct
and reliable factors (Field & Miles, 2010:560). The closer to 1 the KMO is the more
suitable the data is for factor analysis although a it should at least be more than
0.6 (Pallant, 2013:187).
According to Hair et al., (2010:117), factor loadings of 0.3 is acceptable. In this
study therefore factor loadings of 0.3 will be considered part of the group variables
and those less than 0.3 will be omitted. It must however be noted that factor
loadings do depend on sample size. The higher the sample size the more reliable
the correlation will be (Field & Miles, 2010:557). The cut-off of variable loading can
be determined by homogeneity of scores where, if homogeneity is suspected,
interpretation of lower loading is warranted (Tabachnick & Fidel, 2013:625).
Eiegenvalues for the factor are equal to the sum of squared loadings for all
variables on that factor. The first factor usually load the highest eigenvalue
followed by the second factor with the second highest. Eigenvalues are a measure
of the percentage of variance in the variable contained in a factor that is explained
by the factor. The sum of the eiegenvalues is a representation of the total amount
of variance to be explained by the analysis and the ratio of each of the
eigenvalues to the sum indicates the percentage of variance explained by the
relevant factor. Hair et al., (2010:109) state that factors with a eigenvalue larger
than 1 is kept while those that is lower than 1 are seen as explaining less than one
variables worth of variance.
Factors are dealt with as new variables representing combinations of original
variable therefore the value of each are calculated and are known as a factor
score. In certain cases item will be discarded if: there are low communality
© University of Pretoria

210
estimated within a chosen factor grouping, variables load strongly on more than
one factor and there is poor internal consistency among the variables in terms of
Cronbach’s alpha (Hair et al., 2010:119)
In this study Principal Axis factoring was done to determine latent factors
represented in the variables. In Principal Axis factoring the first factor extracted
produces the highest correlation between the variables and the factor. The
remaining factors are extracted using remaining matrices that have been adjusted
to account for variance of the factors that have already been isolated. The first
factor therefore account for the greatest amount of variance amongst variables
(Malhotra et al., 2012:782; Hair et al., 2010:16). The rotation of the factors
attempts to ensure that all variables have high loadings on only one factor. In this
study a varimax rotation was used to ensure that each factor has a small number
of large loadings and a large number of small loadings. This simplifies the
interpretation because, after a varimax rotation, each original variable tends to be
associated with a small number of factors, and each factor represents only a small
number of variables. In addition, the factors can often be interpreted from the
opposition of few variables with positive loadings to few variables with negative
loadings (Lewis-Beck, Bryman & Futing, 2003:978-982)
Cronbach’s Alpha coefficient is a technique of taking the average of all possible
split-half coefficients, to measure the internal consistency of multidimensional or
summated scales. If a researcher makes use of summated scale, it should be
analysed for reliability, to ensure its appropriateness. Scale reliability is the extent
to which a scale can produce the same measurement results in repeated trials
(DeVellis, 2012:28-29; Hair et al., 2000: 390-391). Reliability analysis measures
the extent to which a scale produces consistent results; if repeated measurements
are made on a characteristic (Malhotra, 2015:227). Cronbach’s alpha coefficient is
the measurement of reliability that ranges from 0 to 1, with values of 0.6 to 0.7
deemed to be the lower limit of acceptability (Hair et al., 1998: 118). Pallant
(2013:100), however, points out that values above 0.7 are acceptable; while
values above 0.8 are preferable.
© University of Pretoria

211
In this study, a Likert scale was used in the questionnaire to gather the required
information; and therefore, the reliability of the scales was tested. In Chapter 6, the Cronbach’s Alpha coefficient values will be reported as part of the factor
analysis.
T-tests were used to provide the inferences for making statements on the means
of the parent population (Malhotra & Birks, 2003:469). The independent t-test is,
therefore, used to establish whether two groups differ on some characteristics
assessed on a continuous measure (Churchill et al., 2010:460). In this study, the
independent t-test is used to compare the mean scores of two groups of exhibit
staff, namely: sales and non-sales persons (Pallant, 2013:239). ). For the t-test,
five assumptions must be met namely level of measurement, random sampling,
independence of observations, normal distribution and homogeneity of variance
(Howell, 2010:180-181; Robert & Russo, 1999:70-73). If the assumptions are not
met, the no-parametric alternative Mann-Withney test is used.
Secondly, one-way ANOVA’s were done that tested the r samples from two or
more groups come from populations with equal means (Wiid & Diggines,
2015:277). The ANOVA is an extension of the t-test that enables a researcher to
compare the means that result from three or more groups (Churchill & Iacobucci,
2005:467). An ANOVA analysis is, therefore, a variance test; and the F statistic
represents the differences (Saunders et al., 2009:458). The ANOVA is also a
hypothesis-testing technique to determine whether statistically significant
differences in means occur between two or more groups (Zikmund & Babin,
2010:573). To ensure a sufficient sample size for the t test and ANOVA, the
research also did an eta squared and Cohen’s d analysis. For the researcher to
use the ANOVA specific assumptions need to be addressed; the level
measurement for the dependent variable was used, random sampling was used,
the observations was independent, the population sample was normally distributed
and there was homogeneity of variance (Hair, et al., 2010:348-349; Pallant,
2013:205-207, Malhotra et al., 2012:675).
MANOVA testing was also done. The statistical test used for the afore-mentioned
hypotheses was the MANOVA, which assesses the differences between groups
© University of Pretoria

212
collectively rather than individually, using univariate tests. The objective of
MANOVA is to test for differences in the mean values of several dependent
variables A MANOVA test has to have three assumptions, which need to be met,
namely: the observation must be independent; the dependent variables must
follow a multivariate normal distribution; and the variance covariance matrices
must be equal for all the treatment groups (Hair et al., 2010:347).
For some questions a MANOVA was performed instead of a ANOVA. Although the
Kaiser-Meyer-Olkin (KMO) measure and Bartlett’s Test of Sphericity indicated that
the data is suitable for factor analysis, on the Eigenvalues some factors only had
one item. Through further inspection of the screen plot is was also evident that
there were some sections or stages that only had one or highly two factors that
loaded. This is likely due to the use of a Principal axis factor analysis and therefore
it was decided to make use of an MANOVA. The Wilks’ Lambda was used to test
the significance differences. If there is a significant difference, the null hypothesis
is rejected; and if there is not, then the null hypothesis is accepted (Pallant,
2013:294). Once the Wilks’ Lambda results find a significant difference, a Scheffè
post hoc test was done to determine whether there were more specific differences
between the groups on each of the identified variables.
In this study, parametric statistics were used to test for any significant differences.
Pallant (2013:205) state to do parametric test certain assumptions need to be met
namely: the level of measurement must be assessed, it must be random sampling,
and there must be independence of observations, normal distribution and
homogeneity of variance. Asthena and Bhushan (2007:5) indicate that parametric
statics are more reliable than non-parametric statistics; and it is more important to
establish the significance of effects and the differences among variables. As
indicated in Section 5.11.3, the data obtained were captured on an MS Excell;
thereafter, they were transferred to a Statistical Package for the Social Sciences
(SPSS) Version 21.0 for Windows, to do the analysis for the descriptive and
hypothesis testing. In doing the analysis, a significance level of 95 per cent (α =
0.05) was used. Hair et al. (2010: 327) indicate that the significance level must be
small, to limit the possibility of making a Type I error, which is to reject the null
hypothesis; when it should be accepted. Therefore, the alpha value (α) indicates
© University of Pretoria

213
the amount of risk a researcher will take concerning the rejection of the null
hypothesis that is true (Wiid & Diggines 2015:260-261). In Table 5.4, a summary
of possible statistical analysis used to test the set of hypotheses, including the
objectives and the research questions from the questionnaire.
Table 5.4 Objectives, hypotheses, sections and statistical test
OBJECTIVE HYPOTHESIS / RESEARCH QUESTION SECTION POSSIBLE TEST
/ STATS
To determine the profile of exhibitors at trade shows and exhibit staff.
What is the profile of exhibitors at trade shows and exhibit staff?.
A & J Descriptive statistics
To determine if sub-stages exist within each of the stages of the sales process at trade shows.
B, C, D, E, F, G & I
Factor analysis
To determine if sales persons and non-sales persons differ regarding the sales process followed at trade shows.
Ho1 There exist no significant differences between sales persons and non-sales persons regarding business actions used.
Ho2 There exist no significant differences between sales persons and non-sales persons regarding pre-show marketing activities used.
Ho3 There exist no significant differences between sales persons and non-sales persons regarding at-show marketing activities used.
Ho4 There exist no significant differences between sales persons and non-sales persons regarding sales presentation used.
Ho5 There exist no significant differences between sales persons and non-sales persons regarding objections experienced.
Ho6 There exist no significant differences between sales persons and non-sales persons regarding dealing with objections.
Ho7 There exist no significant differences between sales persons and non-sales persons regarding closing used.
B, C, D, E, F, G & I
Independent t-test or MANOVA
© University of Pretoria
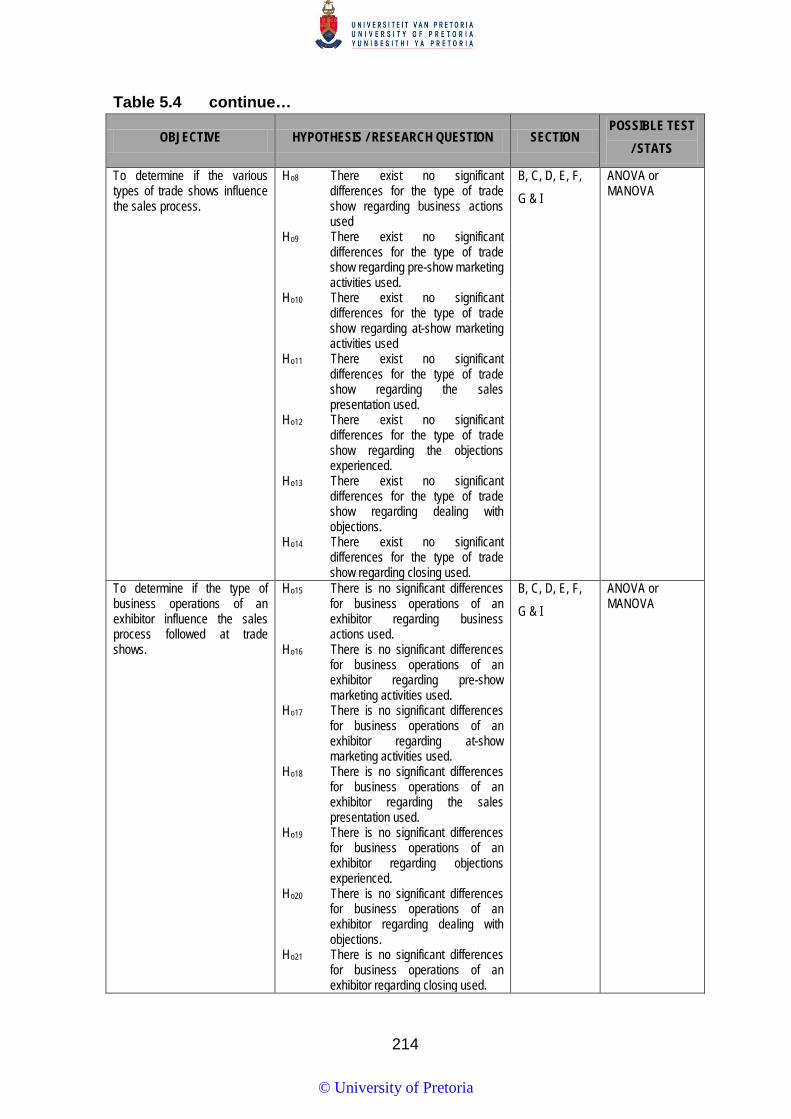
214
Table 5.4 continue…
OBJECTIVE HYPOTHESIS / RESEARCH QUESTION SECTION POSSIBLE TEST
/ STATS
To determine if the various types of trade shows influence the sales process.
Ho8 There exist no significant differences for the type of trade show regarding business actions used
Ho9 There exist no significant differences for the type of trade show regarding pre-show marketing activities used.
Ho10 There exist no significant differences for the type of trade show regarding at-show marketing activities used
Ho11 There exist no significant differences for the type of trade show regarding the sales presentation used.
Ho12 There exist no significant differences for the type of trade show regarding the objections experienced.
Ho13 There exist no significant differences for the type of trade show regarding dealing with objections.
Ho14 There exist no significant differences for the type of trade show regarding closing used.
B, C, D, E, F, G & I
ANOVA or MANOVA
To determine if the type of business operations of an exhibitor influence the sales process followed at trade shows.
Ho15 There is no significant differences for business operations of an exhibitor regarding business actions used.
Ho16 There is no significant differences for business operations of an exhibitor regarding pre-show marketing activities used.
Ho17 There is no significant differences for business operations of an exhibitor regarding at-show marketing activities used.
Ho18 There is no significant differences for business operations of an exhibitor regarding the sales presentation used.
Ho19 There is no significant differences for business operations of an exhibitor regarding objections experienced.
Ho20 There is no significant differences for business operations of an exhibitor regarding dealing with objections.
Ho21 There is no significant differences for business operations of an exhibitor regarding closing used.
B, C, D, E, F, G & I
ANOVA or MANOVA
© University of Pretoria
215
5.11 Summary
At the beginning of this chapter, marketing research was defined; and the research
problem – and how it relates to the literature – was explained. The link between
the research objectives and the question statements used in the questionnaire
was discussed. The 21 hypotheses that were proposed for the study were defined
and related back to the research objectives. In this chapter, the research design
and the sampling methods used in the study were also discussed.
The three data-collection methods: experiments, observations and survey
research, were explained. It was also indicated in this chapter why the researcher
used survey research to collect the required data from the population. The
researcher selected a self-administered questionnaire, as the method to collect the
data due to the nature of trade shows. Experienced and well-trained fieldworkers
under the supervision of the researcher approached the different exhibition stands
and dropped off the self-administered questionnaires.
The self-administered questionnaires were constructed by using specific
guidelines to ensure their correctness. Emphasis was placed on the covering
letter; since the researcher would not be present to explain to the respondents
how to complete the self-administered questionnaire. The questionnaire was also
pre-coded; since the data were captured in Microsoft Excel. Each questionnaire
was edited and screened by the researcher for quality control.
In this study, both descriptive and inferential statics were used – to either accept or
reject the hypotheses set for the study. Inferential statistics allows the researcher
to make claims about a population based on a sample of the data from that
population. The researcher also made use of the descriptive statics to provide a
better understanding of the characteristics of trade-show exhibitors and exhibit
staff in this study. The results and findings of the study are presented in Chapter 6
and Chapter 7.
© University of Pretoria
216
CHAPTER 6 DATA ANALYSIS AND FINDINGS
6.1 INTRODUCTION
In Chapter 6 the results obtained from the analyses of the empirical data collected
to address the objectives of this study as set out in Chapters 1 and Chapter 5 are
reported. The first part of the chapter provides a demographic profile of exhibit
staff and exhibitors. As indicated in Chapter 5 this was done using data from IBM
SPSS Version 21 and the tables and graphs was set-up using Microsoft Excel.
The second part of the chapter reports on the inferential statistics. As indicated in
Chapter 5 a Principal axis factor analysis with varimax rotation was done to
identify any underlying hypothetical factors for different sections of the
questionnaire as guided by the literature on the sales process. However for
question 13 a MANOVA was performed. Although the Kaiser-Meyer-Olkin (KMO)
measure and Barletett’s Test of Sphericity indicated that the data is suitable for
factor analysis, on the Eigenvalues six factors was indicated of which one only had
one item. Through further inspection of the screen plot is was also evident that
there were only one or highly two factors that were not theoretical or practical
supported The before mentioned is likely due to the use of a Principal axis factor
analysis and therefore it was decided to make use of an MANOVA. Lastly, t-tests
and ANOVAS were done on the different factors identified for sales and non-sales
persons, types of trade show and business activities to test the various
hypotheses.
From the four trade shows that it was established there were 423 exhibitors the
response rate was 241 questionnaires; and of these, nine questionnaires were
rejected – giving a total of 232 questionnaires. It must be noted that a number of
the exhibitors exhibited at more than one trade show; and they had, therefore, only
completed one questionnaire. This made the sample population much smaller than
expected (vide. Section 5.6.1.4).
© University of Pretoria

217
6.2 DEMOGRAPHIC ANALYSIS OF THE POPULATION
The demographics of the population of interest serve as background for the
analysis and interpretations of the findings. The demographic data gathered on the
exhibit staff included their gender (Figure 6.1); the business department they work
in (Figure 6.2); employed as sales person or non-sales personal (Figure 6.3); age
(Figure 6.4); highest educational qualification (Figure 6.5) and years of service at
business (Figure 6.6).
Figure 6.1 Gender of exhibit staff
Figure 6.1 indicates that of the 232 respondents, 30 percent (69) were female and
70 percent (163) male. The reason for more male respondents could be due to the
nature of business-to-business (B2B) markets, which is more likely viewed as
being male dominated.
In Figure 6.2 it is indicated if the exhibit staff works in sale / marketing or other
departments.
Male (70%)
Female (30%)
N=232
© University of Pretoria

218
Figure 6.2 The business department exhibit staff works in
From Figure 6.2 it is evident that the majority namely 70 percent (163) of
respondents is from the sales or marketing department, while only 30 percent (69)
is from other departments such as production, research and development etc. This
is congruent with the literature review (vide. Chapter 3 and 4) that pointed out that
it is mostly the responsibility of the sales and marketing department to organise
trade show activities.
However it is important to note that although 70 percent of the staff is employed in
the sales or marketing department, not all are employed as sales people.
Figure 6.3 indicate whether the exhibit staff is employed as a sales person or not.
Figure 6.3 Employed as a sales person
Sales / Marketing department
Other department
0% 20% 40% 60%
80%
70%
30%
N=232
Yes (53%)
No (47%)
N=232
© University of Pretoria

219
The number of respondents employed as sales persons 53 percent (124) versus
those that are not at 47 percent (108) accounts almost for an equal distribution as
indicated in Figure 6.3.
Figure 6.4 indicates the age of the respondents.
Figure 6.4 Age of exhibit staff
It is evident in Figure 6.4 that 44 percent (101) of the respondents are 35 years
and younger, while 56 percent (131) are 36 years and older. The number of
respondents 36 years and older are important to the B2B industry due to their
experience. The aging of personnel in B2B markets is negatively affecting sales
people in that their experience, credibility, dependability and overall ability to
support the needs of customers are being questioned (Pullins et al., 2011:443-
451).
The highest educational qualification of exhibit staff is reflected in Figure 6.5. The
number of respondents is indicated and not the percentages due to the small
number of respondents in certain categories that rounds of to zero percentage.
This is done to provide a better representation of the results.
35 years and younger (44%)
36 years and older (56%)
N=232
© University of Pretoria

220
Figure 6.5 Highest educational qualification of exhibit staff
From Figure 6.5 it is evident the majority of respondents have a tertiary education,
88 (39.9%) with a tertiary degree and 67 (28.9%) with tertiary certificate or
diploma. This is in line with the literature as indicated in Section 4.4 of the study
where it is pointed out that in B2B for example sales people are engineers or
qualified technical people (Blem, 2007:15; Wilson & Hunt, 2011:131). Furthermore
39 (16.8%) of the respondents had a grade 12 and 10 (4.3%) an artisan certificate.
Only one (0.4%) of respondents had no schooling and 17 (7%) refused to answer
the question.
In Figure 6.6 the years of service at business is illustrated.
Figure 6.6 Years of service at business that exhibit
No schooling
Some high school completed
Matric (Grade 12)
Artisans certificate obtained
Tertiary -Certificate/Diploman
Tertiary - Degree
Refused
1 (0.4%)
10 (4.3%)
39 (16.8&)
10 (4.3%)
67 (28.9%)
88 (39.9%)
17 (7%)
N=232
Up to 15 years (75%)
15 years and more (25%)
N=232
© University of Pretoria
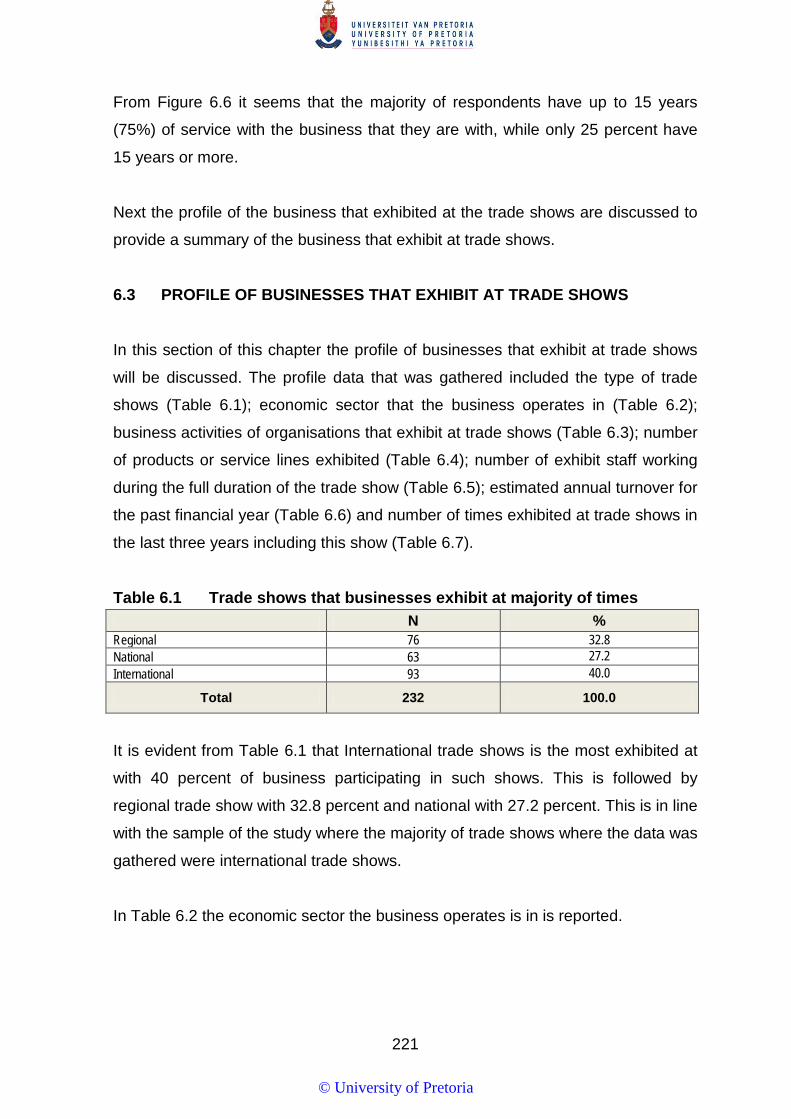
221
From Figure 6.6 it seems that the majority of respondents have up to 15 years
(75%) of service with the business that they are with, while only 25 percent have
15 years or more.
Next the profile of the business that exhibited at the trade shows are discussed to
provide a summary of the business that exhibit at trade shows.
6.3 PROFILE OF BUSINESSES THAT EXHIBIT AT TRADE SHOWS
In this section of this chapter the profile of businesses that exhibit at trade shows
will be discussed. The profile data that was gathered included the type of trade
shows (Table 6.1); economic sector that the business operates in (Table 6.2);
business activities of organisations that exhibit at trade shows (Table 6.3); number
of products or service lines exhibited (Table 6.4); number of exhibit staff working
during the full duration of the trade show (Table 6.5); estimated annual turnover for
the past financial year (Table 6.6) and number of times exhibited at trade shows in
the last three years including this show (Table 6.7).
Table 6.1 Trade shows that businesses exhibit at majority of times N %
Regional 76 32.8 National 63 27.2 International 93 40.0
Total 232 100.0
It is evident from Table 6.1 that International trade shows is the most exhibited at
with 40 percent of business participating in such shows. This is followed by
regional trade show with 32.8 percent and national with 27.2 percent. This is in line
with the sample of the study where the majority of trade shows where the data was
gathered were international trade shows.
In Table 6.2 the economic sector the business operates is in is reported.
© University of Pretoria
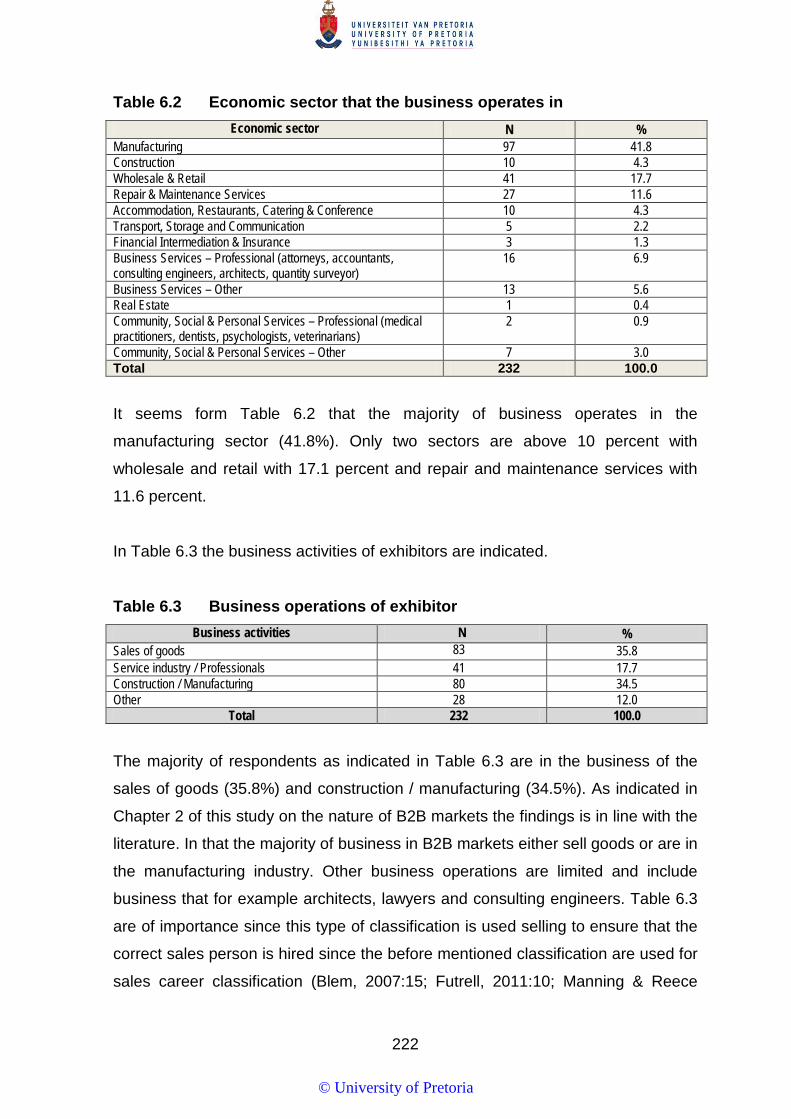
222
Table 6.2 Economic sector that the business operates in Economic sector N %
Manufacturing 97 41.8 Construction 10 4.3 Wholesale & Retail 41 17.7 Repair & Maintenance Services 27 11.6 Accommodation, Restaurants, Catering & Conference 10 4.3 Transport, Storage and Communication 5 2.2 Financial Intermediation & Insurance 3 1.3 Business Services – Professional (attorneys, accountants, consulting engineers, architects, quantity surveyor)
16 6.9
Business Services – Other 13 5.6 Real Estate 1 0.4 Community, Social & Personal Services – Professional (medical practitioners, dentists, psychologists, veterinarians)
2 0.9
Community, Social & Personal Services – Other 7 3.0 Total 232 100.0
It seems form Table 6.2 that the majority of business operates in the
manufacturing sector (41.8%). Only two sectors are above 10 percent with
wholesale and retail with 17.1 percent and repair and maintenance services with
11.6 percent.
In Table 6.3 the business activities of exhibitors are indicated.
Table 6.3 Business operations of exhibitor Business activities N %
Sales of goods 83 35.8 Service industry / Professionals 41 17.7 Construction / Manufacturing 80 34.5 Other 28 12.0
Total 232 100.0
The majority of respondents as indicated in Table 6.3 are in the business of the
sales of goods (35.8%) and construction / manufacturing (34.5%). As indicated in
Chapter 2 of this study on the nature of B2B markets the findings is in line with the
literature. In that the majority of business in B2B markets either sell goods or are in
the manufacturing industry. Other business operations are limited and include
business that for example architects, lawyers and consulting engineers. Table 6.3
are of importance since this type of classification is used selling to ensure that the
correct sales person is hired since the before mentioned classification are used for
sales career classification (Blem, 2007:15; Futrell, 2011:10; Manning & Reece
© University of Pretoria

223
2007:38-43). Exhibitors need to make sure that the sales exhibit staff is the correct
person for the type of trade show that they are exhibiting at.
In Table 6.4 the number of product or service lines exhibited by exhibitors is
indicated.
Table 6.4 Number of products or service lines exhibited Number of product/service lines N %
1 – 3 86 37.0 4 – 7 57 24.6 8 + 89 38.4
Total 232 100.0
Table 6.4 provide an interesting representation of the number of products that is
exhibited. Exhibitors either exhibit one to three (37%) or more than 8 (38.4%)
products at a trade show. It must be noted that at a number of trade shows
exhibitors only exhibit one product such as at Afrimold while at IFSEC many
companies have a number of products. This is due to the differences in the two
industries where the nature of the products that they sell differ (vide. Chapter 2). At
trade shows such as Afrimold the products are much bigger and technical in
nature and business are specialised in their offering and therefore only have one
or two products. Trade shows such as IFSEC on the other hand provide a number
of different security products that are not that technical and industry specific.
In Table 6.5 the number of exhibit staff working during the full duration of the trade
show is indicated.
Table 6.5 Number of exhibit staff working during the full duration of the trade show
Number of exhibit staff (full duration) N % 1-2 75 32.3 3-4 83 35.8 5-6 28 12.1 7-8 26 11.2 9+ 20 8.6
Total 232 100.0
It is evident in Table 6.5 that the majority of exhibitors have one to two (32.3%) or
three to four (35.8%) exhibit staff members working during a trade show. Only a
© University of Pretoria

224
small number had five or more staff members working during a trade show. The
before mentioned trend could be due to the nature of B2B products that is
specialised. That means exhibitors only have a few selected product experts at the
trade show.
Table 6.6 reflects the estimated turnover of business for the last financial year that
exhibit at trade shows.
Table 6.6 Estimated annual turnover for the past financial year Turnover per year N % Less than R1 million 52 22.4
R1 million – R20 million 63 27.2 R20 million + 49 21.1
Don’t know/ Refused 68 29.3 Total 232 100.0
From Table 6.6 it seems that there is an even spread of the estimated turnover of
exhibitors in the past financial year. A number of respondents did not know or
refused to answer the question (29.3%). This could be due to them not knowing or
the exhibit staff was afraid to provide confidential information about their business.
In a discussion during the pilot study the researcher was informed that many
businesses do not make this information available to all staff members.
Question 11 in the questionnaire dealt with the number of times an organisation
exhibited in the last three years including this show where they were interviewed.
Table 6.7 Number of times exhibited at trade shows in the last three years Number of times exhibited N %
1-2 73 31.5 3-4 55 23.7 5-6 50 21.6 7-8 16 6.9 9+ 38 16.4
Do not know 0 0.0 Total 232 100.0
It is evident that most exhibitors exhibited one to two times in the last three years
(31.5%), while a number exhibited three to four times (23.7%) and five to six
(21.6%) times. It seems from Table 6.7 that a number of exhibitors are exhibiting
© University of Pretoria

225
at more than three trade shows every three years. It is therefore interesting to note
that trade shows are utilised by business in their B2B marketing with almost 50%
exhibiting 3-6 times in the last three years. This study can therefore be a valuable
tool to provide guidelines and strategies to make sure that they take full advantage
of trade shows as a selling tool.
In Section 6.3 the descriptive statistics as indicated by mean and standard
deviation of each section of the questionnaire is discussed.
6.4 DESCRIPTIVE STATISTICS FOR EACH SECTION OF QUESTIONNAIRE
In this part of the study the mean score (M) and standard deviation (SD) of the
variables in the different sections of the questionnaire is discussed to provide an
overview of exhibit staff agreement or opinion regarding the different stages in the
sales process. The mean score is the average scores calculated on each of the
different variables. Standard deviation indicates the spread of the responses. If the
standard deviation is high it indicates that there is a wide spread of the data and
not a lot of agreement regarding a variable.
6.4.1 Business actions taken regarding trade show
In Table 6.8 the first section of the questionnaire will be discussed that deals with
the different business actions taken regarding trade shows. A five point Likert
scale was used to measure the level of agreement of the exhibit staff and their
business action of the organisation before the trade show. The scale ranged from
one to five with the scale points labelled strongly disagrees to strongly agree. The
results are presented in descending order based on their mean value.
Table 6.8 Business actions taken regarding trade show Business actions taken regarding trade show M SD
1 V13.16 Trade shows are applied to develop new customer contacts 4.19 0.859
2 V13.18 Trade shows are applied to enhance the business image 4.08 0.908
3 V13.2 Our business provided booth staff with product/service material to prepare themselves for the trade show
4.03 0.949
© University of Pretoria

226
Table 6.8 continue...
Business actions taken regarding trade show M SD
4 V13.9 Our business measure trade show success by the number of new prospects 3.99 0.897
5 V13.6 Our business exhibit at trade shows to get sales 3.86 1.147
6 V13.1 Our business train and brief booth staff before the trade show 3.83 1.034
7 V13.19 Trade shows assist our business with other marketing communication functions 3.82 0.948
8 V13.11 Our business use trade shows to introduce new products 3.72 1.106
9 V13.7 Our business planned before the trade show to exhibit to specific target customers 3.69 1.018
10 V13.4 Our business have written promotional objectives for the trade show 3.67 1.107
11 V13.15 Trade shows are used to maintain contact with existing customers 3.66 1.073
12 V13.17 Trade shows are used to get a competitive advantage over non-exhibiting competitors
3.64 1.107
13 V13.14 Trade shows provide our business with information on my industry 3.63 1.065
14 V13.22 Our business has a tracking system to keep information on attendees that visited our exhibit stand
3.62 1.186
15 V13.10 Non-financial aspects are used to measure trade show success 3.52 0.971
16 V13.8 Our business measures success at the trade show in terms of financial gains 3.46 1.611
17 V13.5 Our business have written sales objectives for the trade show 3.41 1.147
18 V13.3 Our business have written financial objectives for the trade show 3.25 1.155
19 V13.12 Trade shows are used to as a platform to test new product concepts 3.25 1.182
20 V13.21 Trade shows assist our business to motivate staff 3.09 1.129
21 V13.13. The business I work for use trade shows to collect information about competitors 3.07 1.182
22 V13.20 Trade shows assist our business in the training of staff 3.01 1.160
From Table 6.8 the following deductions can be made on the levels of agreement
regarding the business activities utilised at trade shows:
• The top five business activities utilised before a trade show is “Trade shows
are applied to develop new customer contacts” (M=4.19, SD=0.859), “Trade
shows are applied to enhance the business image” (M=4.08, SD=0.908),
“Our business provided exhibit staff with product/service material to prepare
themselves for the trade show” (M=4.03, SD=0.949), “Our business
measure trade show success by the number of new prospects” (M=3.99,
SD=0.897) and “Our business exhibit at trade shows to get sales”
© University of Pretoria

227
(M=3.86,SD=1.147). Three of the exhibitor’s strategies as indicated in Table
3.2 are present in the top five namely selling, inbound and outbound
communication. Business image building is also higher than sales that are
in line with research done in China (Liu et al., 2011:449). Thus, it is clear
that trade shows are viewed as playing a role in the image building
strategies for many businesses.
• The last variable that deals with getting sales at a trade show however
loaded a SD=1.147 that indicate that there is not agreement between the
exhibit staff and that their responses were heterogeneous
• The variable “Our business train and brief booth staff before the trade
show” (M=3.83, SD=1.034) only loaded sixth and almost agreed. It must be
noted that a number of studies indicated a lot of focused is placed on
training of exhibit staff before a show (Seringhaus & Rosson 2004:156; Lee
& Kim; 2008:786; Ling-yee, 2008:42; Pitta et al., 2006:163; Hanlon,
1982:99). However it is interesting that in this study it was not one of the
most important actions and that image building for example is viewed as
more important.
• One of the least used business activities was “Our business have written
financial objectives for the trade show” (M=3.25, SD=1.155), “Trade shows
are used to as a platform to test new product concepts” (M=3.25,
SD=1.182), “Trade shows assist our business to motivate staff” (M=3.09,
SD=1.129), “The business I work for use trade shows to collect information
about competitors” (M=3.07, SD=1.182) and “Trade shows assist our
business in the training of staff” (M=3.01, SD=1.160). Although the mean
values indicated agreement it seems it does have the same importance for
exhibitors as other business actions do.
The high mean value for the activity develop new customer contacts are in line
with a number of previous studies (Burgess & Bothma, 2007:349; Bettis-Outland et
al., 2012:386; Saget, 2006:113-114). It must also be noted that a number of
previous studies point to the setting of sales objectives for a trade show and its
importance (Bellizzi & Lipps, 1984:52; Kirchgeorg et al., 2010a:64; Miller, 1999:44;
Shoham, 1992:340; Kirchgeorg et al., 2005:1003). In this study however setting
© University of Pretoria

228
sales objectives had a low mean value (M=3.41) meaning that it is not used often
that can have an impact on measuring their success at trade shows.
6.4.2 Pre-show marketing activities
In the sales process the organisation engage in pre-show marketing to attract the
attendees to the trade show. In this section the seven variables will be discussed.
Table 6.9 Pre-show marketing activities Marketing activities used to attract attendees to attend the trade show M SD
1 V14.2. Our business apply electronic communication e.g. internet, e-mail to inform customer about a trade show
3.85 1.107
2 V14.3. I personally invite customers to a trade show 3.58 1.218
3 V14.7. Our business provide customers with free entry vouchers to attract them to trade shows 3.44 1.251
4 V.14.5. Sending direct mail gets attendees to visit a trade show 3.42 1.106
5 V14.6. Trade journals are used to attract customers to trade shows 3.13 1.119
6 V.14.1. Invitations to attend the trade show is personally delivered to customers 3.06 1.255
7 V.14.4. Our business use mass media to attract attendees 3.02 1.175
The following conclusions can be made from Table 6.9 on the levels of agreement
for marketing activities used to attract attendees to attend the trade show:
• Most of the exhibit staff are in agreement (M=3.85) that their business apply
electronic communication such as the internet, e-mail etc. to inform their
customers about trade shows. Electronic communication is becoming more
popular and is being used more by exhibitors to attract customers to trade
shows since it is more cost effective (Kirchgeorg et al., 2010b:683).
• The pre-marketing activity that had the second highest mean score is that
they personally invite customers to a trade show (M=3.58). The relatively
high standard deviation suggests that response were varied for this activity.
• Exhibit staff are also in agreement that they provide customers with free
entry vouchers to attract them to trade shows (M=3.44). This agreement
with the use of free entry vouchers means that it plays an important part of
pre-show marketing for exhibitors.
© University of Pretoria

229
• The two variables that loaded the lowest was “Invitations to attend the trade
show is personally delivered to customers” (M=3.06, SD=1.255) and “Our
business use mass media to attract attendees” (M=3.02, SD=1.175).
Although exhibit staff is still in agreement that personally deliver invitations
and use mass media the before mentioned lower level of agreement is most
likely due to the nature of trade shows and business to business marketing
as discussed in Chapter 2 of this study.
Kirchgeorg et al. (2010b:683) and Ling-yee, (2010:272) refers to the importance of
electronic communication in promoting trade shows due to its cost effectiveness.
This could be the reasons why electronic communication is used by business to
promote trade shows. It must however be noted that the second highest is still the
use of personally inviting customers to a trade show as Tanner, (2002:236) and
Kirchgeorg et al. (2010b:683-684) also point out. A number of business also make
use of free entry vouchers in South Africa trade shows such as Afrimold provide
the exhibitors a number of free tickets to give to their customers (McIntosh,
2008:19). Direct mail loaded fourth and this could be a future risk to exhibitors
since a number of studies have found it to be ineffective (Summers, 1992:46;
O’Hara et al., 1993:234).
6.4.3 At-show marketing activities
Once the exhibiting businesses have attracted the customer to attend the trade
show the next step is to market their exhibit stand to ensure that the attendees
visit it.
Table 6.10 At-show marketing activities Marketing activities used to attract attendees to the business exhibit stand at the show M SD
1 V15.2. Our business hand out free promotional material to attendees to attract them to our exhibit stand
3.72 1.181
2 V15.1. Our business use video screens to attract attendees to our exhibit stand 3.34 1.348
3 V15.3. Our booth staff move around the trade show to attract attendees 3.04 1.244
4 V15.4. Our business use competitions to attract attendees to our exhibit stand 2.59 1.319 5 V15.6. Our exhibit staff invite attendees at social activities (luncheons, gala diners etc.) at the
trade show to visit our exhibit stand 2.50 1.306
6 V15.5. Our business co-sponsor coffee courts, luncheons etc. to attract attendees to our exhibit stand
2.28 1.239
© University of Pretoria
230
From Table 6.10 the following is evident regarding the at-show marketing activities
used to attract attendees to the business exhibit stand is indicated and discussed
below:
• The exhibit staff agree that their business hand out free promotional
material to attendees to attract them to the exhibit stand (M=3.72). This
indicates that the handing out free promotional material is still used
extensively by exhibit staff.
• The staff also slightly agree that that they use video screens (M=3.34,
SD=1.348) and that stand staff move around to attract attendees (M=3.04,
SD=1.244).
• What is interesting is that “Our exhibit staff invite attendees at social
activities (luncheons, gala diners etc.) at the trade show to visit our exhibit
stand” (M=2.50, SD=1.306) and “Our business co-sponsor coffee courts,
luncheons etc. to attract attendees to our exhibit stand” (M=2.28,
SD=1.239) loaded the lowest mean values meaning there is disagreement
regarding the use of social activities. This could also be an indication that
exhibitors do not place a high emphasis on social interaction away from the
exhibit stand.
• The standard deviation for all the variables in Table 6.10 loaded above 1
which indicates that there are heterogeneous opinions between the
exhibitors in all of the listed variables.
The findings of Table 6.10 links up with the findings of other studies that point out
that 75 percent of exhibitors make use of free promotional material at trade shows
and it plays an important role (Summers 1992:46; Yuksel & Voola, 2010:298). Suh
(2003:47-49) and, Bathelt and Schuldt, (2008:861) point to the important role that
sponsorships play at trade shows however in this study it was indicated by
exhibitors that they do not really make use of sponsorships. The reasons why
sponsorship is not used could be that business for example due to not having the
financial capability or that trade show organisers are not making its advantages
known to exhibitors.
© University of Pretoria
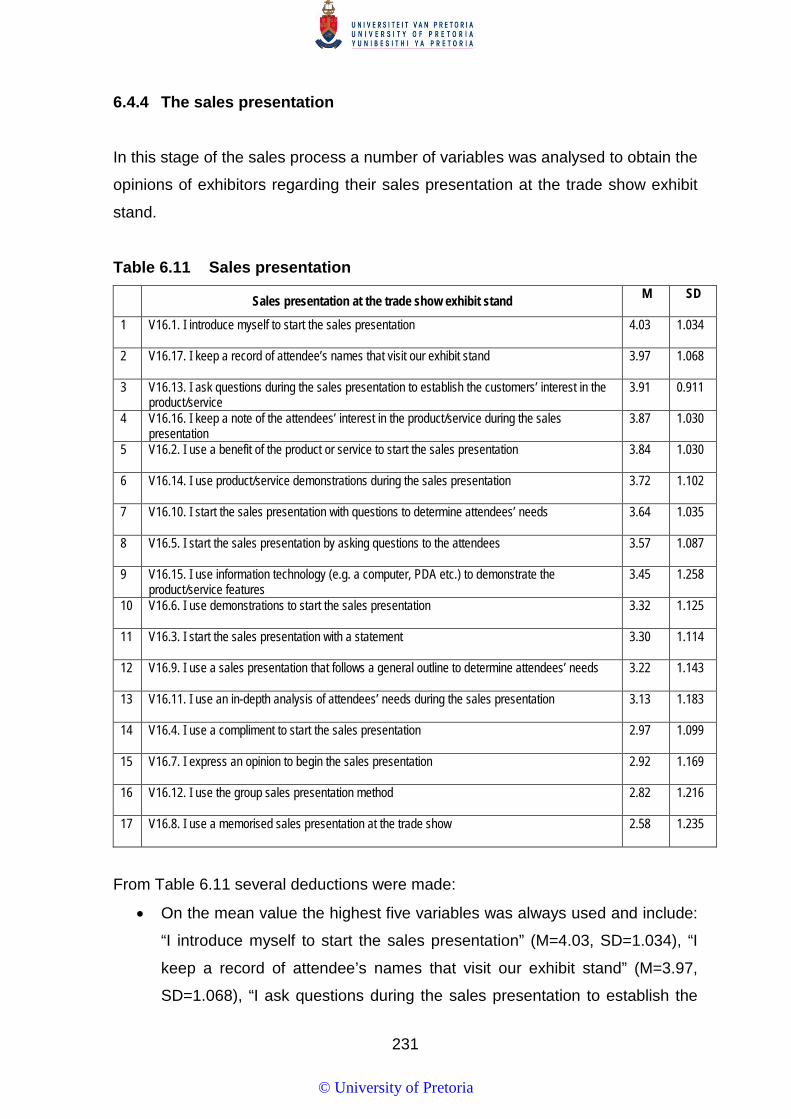
231
6.4.4 The sales presentation
In this stage of the sales process a number of variables was analysed to obtain the
opinions of exhibitors regarding their sales presentation at the trade show exhibit
stand.
Table 6.11 Sales presentation Sales presentation at the trade show exhibit stand M SD
1 V16.1. I introduce myself to start the sales presentation 4.03 1.034
2 V16.17. I keep a record of attendee’s names that visit our exhibit stand 3.97 1.068
3 V16.13. I ask questions during the sales presentation to establish the customers’ interest in the product/service
3.91 0.911
4 V16.16. I keep a note of the attendees’ interest in the product/service during the sales presentation
3.87 1.030
5 V16.2. I use a benefit of the product or service to start the sales presentation 3.84 1.030
6 V16.14. I use product/service demonstrations during the sales presentation 3.72 1.102
7 V16.10. I start the sales presentation with questions to determine attendees’ needs 3.64 1.035
8 V16.5. I start the sales presentation by asking questions to the attendees 3.57 1.087
9 V16.15. I use information technology (e.g. a computer, PDA etc.) to demonstrate the product/service features
3.45 1.258
10 V16.6. I use demonstrations to start the sales presentation 3.32 1.125
11 V16.3. I start the sales presentation with a statement 3.30 1.114
12 V16.9. I use a sales presentation that follows a general outline to determine attendees’ needs 3.22 1.143
13 V16.11. I use an in-depth analysis of attendees’ needs during the sales presentation 3.13 1.183
14 V16.4. I use a compliment to start the sales presentation 2.97 1.099
15 V16.7. I express an opinion to begin the sales presentation 2.92 1.169
16 V16.12. I use the group sales presentation method 2.82 1.216
17 V16.8. I use a memorised sales presentation at the trade show 2.58 1.235
From Table 6.11 several deductions were made:
• On the mean value the highest five variables was always used and include:
“I introduce myself to start the sales presentation” (M=4.03, SD=1.034), “I
keep a record of attendee’s names that visit our exhibit stand” (M=3.97,
SD=1.068), “I ask questions during the sales presentation to establish the
© University of Pretoria
232
customers Interest in the product/service” (M=3.91, SD=0.911), “I keep a
note of the attendees’ interest in the product/service during the sales
presentation” (M=3.87, SD=1.030) and “I use a benefit of the product or
service to start the sales presentation” (M=3.84, SD=1.030). Two variables
relating to the approach in the sales presentation loaded in the top five
meaning that these activities is of importance to exhibit staff.
• Interestingly two of the variables that loaded close to one another is the
seventh “I start the sales presentation with questions to determine
attendees’ needs” (M=3.64, SD=1.035) and the eight “I start the sales
presentation by asking questions to the attendees” (M=3.57, SD=1.087)
that indicated they often occur. This could be an indication that the asking
of questions play considerable role in how exhibit staff sell at the exhibit
stand.
• “I use information technology (e.g. a computer, PDA etc.) to demonstrate
the product/service features” (M=3.45, 1.087) also show that it often used
and only loaded ninth this could be due to the use of real life demonstration
at many of the exhibit stands.
• “I use a memorised sales presentation at the trade show” (M=2.58,
SD=1.235) loaded the lowest and showed that it is rarely used although
using it at trade shows has its advantages due to time constraints
experienced at the exhibit stand.
Since attendees will decide to give their attention to exhibit staff on how they
introduce themselves this is an important element in the sales presentation
(Johansson & Bengtsson, 2011:73). Jain (2010:403) point out that exhibit staff
must introduce themselves to attract attention and as indicated in Table 6.11 this
is how the majority of staff does it. Whitfield and Webber (2011:446) indicate to the
importance of demonstrations in the sales presentation and from Table 6.11 it is
apparent that it is sometimes applied by exhibit staff. It must also be noted that the
best persons to do this demonstrations will be sales people due to their product
knowledge (Miller, 1999:89-91). The reason why many exhibit staff does not make
use of memorised sales presentations is due to the nature of trade shows that is
business-to-business focused (Lambert & Kerkhoff, 2005:29) and therefore
requires questions to be asked to get to customers’ needs (Halvadar & Cavale,
© University of Pretoria

233
2007:15; Zimmerman & Blyth, 2013:227). However, as, pointed out memorised
sales presentations can be useful in getting the relevant information to attendees
in a short time period.
6.4.5 Objections experienced
During a sales presentation the exhibit staff can experience a number of different
objections and reasons why an attendee are not interested in their product that
they are selling to them. The identification of how frequently objections occur is
useful to exhibitors since this information can be used to train exhibit staff on what
to expect and how to deal with them.
Table 6.12 Objections experienced Objections experienced M SD
1 V17.2. Attendees stall decision-making at trade shows 3.25 0.914
2 V17.1. Attendees do not openly state reasons for not being interested in the product/service 3.00 0.928
3 V17.3. Attendees indicate that they do not need the product/service, as a way to stop the sales presentation
2.90 0.991
4 V17.5. Product/service related objections occur during the sales presentation 2.87 0.976
5 V17.4. Money objections occur during the sales presentation 2.69 0.988
6 V17.6. Objections about our business occur during the sales presentation 2.53 1.116
From Table 6.12 the following deductions can be made regarding the variable
means and their order of importance:
• Only two variables loaded a mean score above 3.00 indicating that
objections experienced at trade shows is possibly low.
• “Attendees stall decision-making at trade shows” (M=3.25, SD=0.914) and
“Attendees do not openly state reasons for not being interested in the
product/service” (M=3.00, SD=0.928) are experienced sometimes, and it
seems that these objections happens during the sales presentation.
• “Money objections occur during the sales presentation” (M=2.39,
SD=0.988) and “Objections about our business occur during the sales
presentation” (M=2.53, SD=1.116) that had the lowest mean value
indicating these objections are rarely experienced.
© University of Pretoria

234
A number of the exhibit staff indicated that attendees stall decision-making at trade
shows. Stalling decision-making could be due to not visiting all the exhibit stands
and/or still wanting to evaluate all possible suppliers. Another reason for stalling
the decision-making is not to indicate the real reason such as money objections. It
must be however be taken in context that most attendees only purchase after the
trade show (Munuera & Ruiz, 1999:22-23) and this could be a possible reason
why they stall the decision-making. There is limited objections about the business
of the exhibit staff and this is most likely due to the nature of trade shows that is
specialised in what is exhibited (Brennan, Canning & McDowell, 2014:188).
6.4.6 Dealing with objections
Once the objections of attendees have been established the next step is for the
exhibit staff to deal with the objections. In dealing with objections the exhibit staff
has a number of different options. In Table 6.13 the frequency of use is indicated
in regards to the mean when dealing with objections.
Table 6.13 Dealing with objections Dealing with objections M SD
1 V18.4. I compensate with another benefit of the product/service to overcome an objection during the sales presentation
3.19 1.215
2 V18.5. I use a disadvantage of my product/service as an advantage to overcome the objections 2.76 1.279
3 V18.3. If there is an objection I let it go and continue with the sales presentation 2.49 1.120
4 V18.6. If there is an objection, I let another staff member present, answer it 2.17 1.167
5 V18.2. I deal with objections by indirectly denying it 2.06 1.019
6 V18.1. I deal with objection by directly denying it 1.87 1.046
The following is evident from Table 6.13 for means on how exhibit staff deals with
objections:
• The variable that loaded the highest mean indicating that it occurred
sometimes was “I compensate with another benefit of the product/service to
overcome an objection during the sales presentation” (M=3.19, SD=1.125)
which is an indication that the using of the product benefits is seen as an
effective way of dealing with objections.
© University of Pretoria

235
• “I deal with objection by directly denying it” (M=1.87, SD=1.046) which did
not happen a lot was encouraging since it seems that that staff rarely
directly deny objections.
• The mean values in Table 6.13 is low over all indicating that the exhibit staff
does not often rely on different methods to overcome objections. This is in
line with Table 6.12 that indicated that not a lot of objections is usually not
experienced during trade shows
Several studies indicated it is necessary for exhibitors to have technical or
engineering staff to help with answering questions that attendees might have at
trade shows (Whitfield & Webber, 2011:446; Tafesse & Korneliussen, 2011:47).
However on the mean values the use of another staff member to answer questions
is rarely used. This could mean that exhibit staff is not using other staff from the
exhibitors business to help them answer questions. This could be due to that there
is not an expert available and this point to the value of sales training for trade
shows. Encouraging is that exhibit staff does not rely on direct denials when
dealing with objections and prefer to use other methods. This is in line with
literature on sales where direct denial is only used when a prospect makes an
incorrect or false claim (Manning et al., 2010:290).
6.4.7 Closing methods
Once the exhibit staff dealt with objections the last step at trade shows is to close
the sale. In the closing exhibit staff has a number options that they can apply to
get the sale.
Table 6.14 Closing methods Closing methods M SD
1 V20.2. I list the benefits of the product/service to close the sales presentation 3.75 1.102
2 V20.3. I list the advantages of the product against the disadvantages and to close the sales presentation
3.58 1.178
3 V20.7. I compliment the attendee and close the sales presentation 3.26 1.190
4 V20.4. Once I assume a customer will buy I start closing the sales presentation 3.19 1.243
© University of Pretoria

236
Table 6.4 continue...
Closing methods M SD
5 V20.10. I use the negotiation technique to close the sales presentation 3.10 1.211
6 V20.11. I leave the close of the sale until after the trade show in the follow-up visit 3.08 1.204
7 V20.5. I provide the attendee with two options regarding the product/service and then close the sales presentation
2.98 1.138
8 V20.8. I get the attendee to say yes all the time and then close the sales presentation 2.81 1.273
9 V20.6. I close the sales presentation on a minor point 2.59 1.145
10 V20.1. I ask directly for a sale during the sales presentation 2.58 1.234
11 V20.9. I indicate to the attendee to act now otherwise something in the sale will change (e.g. price, availability) to close the sales presentation
2.49 1.236
From Table 6.14 the following deductions can be made regarding the means
values for closing:
• The exhibit staff often make use of the product benefits and advantages to
close the sale with the top two variables being “I list the benefits of the
product/service to close the sales presentation” (M=3.75, SD=1.102) and “I
list the advantages of the product against the disadvantages and to close
the sales presentation” (M=3.58, SD=1.178). It therefore seems that the use
of the product in closing is popular in closing the sale and is used by exhibit
staff to try and, get the sale.
• Three closing techniques rarely to only sometimes used is “I close the sales
presentation on a minor point” (M=2.59, SD=1.145), “I ask directly for a sale
during the sales presentation” (M=2.58, SD=1.234) and “I indicate to the
attendee to act now otherwise something in the sale will change (e.g. price,
availability) to close the sales presentation” (M=2.49, SD=1.236).
• It must be noted that a number of the standard deviations loaded high
indicating heterogonous opinions for the variables type of close techniques
used at a trade show between exhibitors.
Although certain business close the sale at a trade show a number of exhibitors do
not close the sales at the exhibit stand but rather do it in the follow-up after the
show (Blyth & Rayner, 1996:21; Seringhaus & Rosson, 2004:161; Gopalakrishna
& Williams, 1992:220). In trade shows certain types of closes are used more
© University of Pretoria
237
frequently namely: the assumptive close, direct close, minor point close, standing
room close and alternative close (Blem, 2007:305). It is evident that these closing
techniques are not used very often by exhibit staff. However it is clear that the
comparison techniques are the most popular.
In this study a factor analysis was preferred to reduce the number of items on
each stages of the sales process. Next the factor analysis for this study will be is
discussed.
6.5 FACTOR ANALYSIS AS WELL AS THE RELIABILITY AND VALIDITY OF THE MEASURING INSTRUMENT
As indicated in Chapter 5 Principal axis factoring with varimax rotation was used
that is a type of exploratory factor analysis and was done to provide structure to
the different stages of the sales process. As discussed in Chapter 5 Principal axis
factoring with varimax rotation analyse common variances. This method also
assists in identifying items that do not measure a specific factor or measure
multiple factors. Therefore items were disregarded when: there were low
communality estimates within the chosen factor grouping (less than 0.3); variables
loaded strongly on more than one factor and there was poor internal consistency
among the variables in terms of Cronbach’s alpha. In doing Principal axis factoring
with varimax rotation a more accurate computer-generated test was provided
taking the before mentioned into account (DeVellis, 2003: 132-133). A factor
analysis was done for each of the sections of the questionnaire that made up the
stages of the sales process that was developed for this study.
The literature study refers to different stages that exist in the sales process of
trade shows. These stages was incorporated in the questionnaire (vide. Annexure
A). The list of statements developed to measure each stage was based on
extensive literature research and preliminary discussions with the trade show
participants that included organisers and exhibitors. As indicated in Chapter 5 a
self-administrated questionnaire was developed using literature reviews of
previous studies done on the sales process and trade shows (vide. Chapter 2,
Chapter 3, Chapter 4 & Chapter 5)
© University of Pretoria
238
For each of the seven sections ordinal measurements were applied by using a
Likert scale. In Section 5.12 the Cronbach alpha coefficient was discussed and it
was indicated that the preferred measure should be 0.70 or higher in exploratory
research. However, a number of authors point out that in scales where the number
of items is less than 10 a lower Cronbach alpha coefficient can be acceptable
although it is not suggested (Pallant, 2013:100; Hair et al., 1998:118). In such
instances the inter-item correlation could be used in conjunction to establish
internal consistency reliability.
It should however be noted that in some instance although several factors maybe
indentified it should still be theoretical and practical relevant. Therefore since there
are no clear expectations or relative incomplete Principal axis factoring with
varimax rotation analysis was done (Fabrigar & Wegner, 2012:5).
Next the factor analysis for each stage of the sales process in the questionnaire
will be discussed.
Objective: To determine if sub-stages exist in the various stages of the sales process at trade shows.
6.5.1 Business actions taken regarding the trade show
Business actions taken for trade shows were measured by 22-items on a 5 point
Likert scale ranging from “strongly disagree” to “strongly agree”.
The 22-items that were included in this stage were subjected to a factor analysis
with the aim to determine underlying factors in each of the stages of the sales
process at trade shows. To determine if the data was suitable for a factor analysis
the Kaiser-Meyer-Olkin was calculated (Pallant, 2013:183). Furthermore the
Bartlett’s Test of Sphericity indicated statistical significance (p = 0.000) supporting
the factorability of the correlation matrix. However on the Eigenvalues six factors
were presented of which one only had one item. On further inspection of the
screen plot is was clear that there were only two factors and these factors were
not theoretical or practical supported. MANOVA testing was used since it reveals
© University of Pretoria

239
the differences not shown in ANOVA’s and it protects against Type I error when
there are several dependant variables.
6.5.2 Pre-show marketing activities
In this stage of the sales process the focus is on exhibit staff’s level of agreement
in regards to pre-show marketing activities that is used to attract attendees to a
trade show. The before mentioned was measured by seven-items on a 5 point
Likert scale ranging from “strongly disagree” to “strongly agree”. The factor
loadings for the levels of agreement regarding the marketing activities in attracting
attendees to a trade show are indicated in Table 6.15.
The seven items included in this stage were subjected to a Principal axis factoring
with Varimax rotation. The Kaiser-Meyer-Olkin value was 0.802 and the Bartlett’s
Test of Sphericity indicated statistical significance (p = 0.000) supporting the
factorability of the correlation matrix. The Cronbach’s alpha coefficient values
where acceptable since it was 0.802 above 0.7 required.
Table 6.15 Factors pre-show marketing activities
Variables Sub-stages 1 2
14.2 Our business apply electronic communication eg internet, e-mail to inform customer about a trade show 14.3 I personally invite customers to a trade show 14.5 Sending direct mail gets attendees to visit a trade show 14.1 Invitations to attend the trade show are personally delivered to customers 14.6 Trade journals are used to attract customers to trade shows 14.4 Our business uses mass media to attract attendees 14.7 Our business provide customers with free entry vouchers to attract them to trade shows
0.730 0.697 0.515 0.491
0.804 0.598 0.487
No. of items 4 3 % of Variance explained 45.83 16.12 Cronbach’s Alpha 0.802
For marketing activities used to attract attendees to attend the trade show two
factors was identified direct communication (Factor 1) and promotional elements
(Factor 2). The two factors extracted explained 61.95% of variance.
© University of Pretoria

240
6.5.3 At-show marketing activities
At-show marketing activities to attract attendees to the exhibit at trade show was
measured by six items on a 5 point Likert scale ranging from “strongly disagree” to
“strongly agree”. The factor loadings for at-show marketing activities used to
attract attendees to the exhibit stand are shown in Table 6.16.
The six items that were included in this stage of the sales process on marketing
activities at trade show were subjected to a Principal axis factoring with Varimax
rotation. The Kaiser-Meyer-Olkin value was 0.771 that exceeds the recommended
value of 0.5 and the Bartlett’s Test of Sphericity indicated statistical significance (p
= 0.000) supporting the factorability of the correlation matrix. The Cronbach’s
alpha coefficient value was 0.761 exceeding the required 0.7.
Table 6.16 Factors for at-show marketing activities
Variables Sub-stages 1 2
15.5 Our business co-sponsor coffee courts, luncheons etc to attract attendees to our exhibit stand 15.6 Our exhibit staff invite attendees at social activities (luncheons, gala diners etc) at the trade show to visit our exhibit stand 15.4 Our business use competitions to attract attendees to our exhibit stand 15.3 Our booth staff move around the trade show to attract attendees 15.2 Our business hand out free promotional material to attendees to attract them to our exhibit stand 15.1 Our business use video screens to attract attendees to our exhibit stand
0.830 0.796 0.609 0.466
0.821 0.392
No. of items 4 2 % of Variance explained 46.74 18.49 Cronbach’s Alpha 0.761
Two factors loaded for marketing activities used to attract attendees to the
business exhibit stand at the trade show namely trade show sponsorship (Factor
1) and promotional tools (Factor 2) explaining at 65.23% variance.
6.5.4 The sales presentation
The use of the sales presentation by the exhibit staff was measured by 15 items
on a 5 point Likert scale ranging from “never” to “always”. The factor loadings for
the sales presentation at the exhibit stand are indicated in Table 6.17.
© University of Pretoria

241
The 15 items that were included in this section, of the use of sales presentations
by staff at the trade show, were subjected to a Principal axis factoring with
Varimax rotation. The Kaiser-Meyer-Olkin value was 0.860 and the Bartlett’s Test
of Sphericity indicated statistical significance (p = 0.000) supporting the
factorability of the correlation matrix. The Cronbach’s alpha coefficient value was
0.883 that exceeded the required 0.7.
Table 6.17 Factors for the sales presentation Variables Sub-stages
1 2 3 4 16.12 I use the group sales presentations 16.8 I use a memorised sales presentation at the trade show 16.9 I use a sales presentation that follows a general outline to determine attendees’ needs 16.11 I use an in-depth analysis of attendees’ needs during the sales presentation 16.16 I keep a note of the attendees’ interest in the product/service during the sales presentation 16.15 I use information technology (eg a computer, tablet, PDA etc) to demonstrate the product/service features 16.13 I ask questions during the sales presentation to establish the customers’ interest in the product/service 16.17 I keep a record of attendee’s names that visit our exhibit stand 16.14 I use product/service demonstrations during the sales presentation 16.3 I start the sales presentation with a statement 16.4 I use a compliment to start the sales presentation 16.7 I express an opinion to begin the sales presentation 16.2 I use a benefit of the product or service to start the sales presentation 16.10 I start the sales presentation with questions to determine attendees’ needs 16.5 I start the sales presentation by asking questions to the attendees
0.762 0.726 0.559 0.486
0.690 0.590 0.583 0.579 0.515
0.774 0.626 0.493 0.478
0.683 0.669
No. of items 4 5 4 2 % of Variance explained 35.23 13.52 8.31 7.18 Cronbach’s Alpha 0.883
For the sales presentation at trade show four factors were indentified: presentation
methods (Factor 1), presentation actions (Factor 2), approach methods (Factor 3)
and question approach (Factor 4). The four factors explained 64.24% variance.
6.5.5 Objections experienced
The types of objections that are experienced during the sales presentation by
exhibit staff was measured by six items on a 5 point Likert scale ranging from
“never” to “always”. The factor loadings for objections experienced during the
sales presentation by exhibit staff are indicated in Table 6.18.
© University of Pretoria
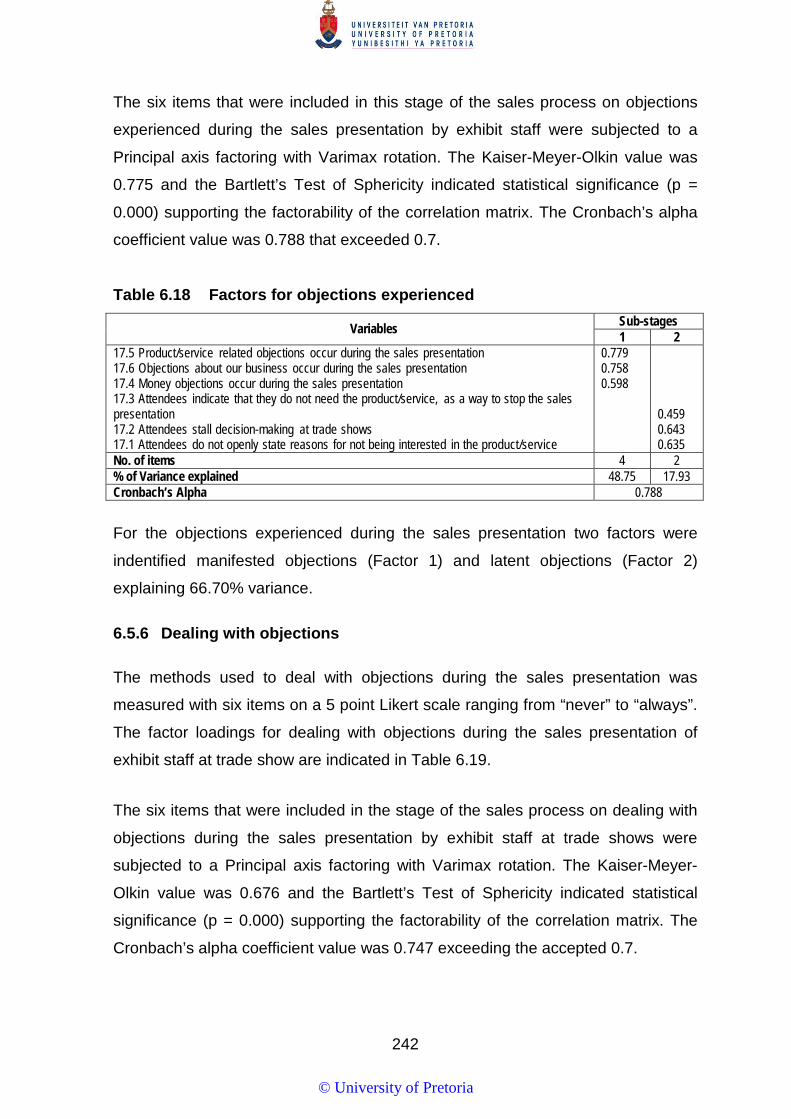
242
The six items that were included in this stage of the sales process on objections
experienced during the sales presentation by exhibit staff were subjected to a
Principal axis factoring with Varimax rotation. The Kaiser-Meyer-Olkin value was
0.775 and the Bartlett’s Test of Sphericity indicated statistical significance (p =
0.000) supporting the factorability of the correlation matrix. The Cronbach’s alpha
coefficient value was 0.788 that exceeded 0.7.
Table 6.18 Factors for objections experienced
Variables Sub-stages 1 2
17.5 Product/service related objections occur during the sales presentation 17.6 Objections about our business occur during the sales presentation 17.4 Money objections occur during the sales presentation 17.3 Attendees indicate that they do not need the product/service, as a way to stop the sales presentation 17.2 Attendees stall decision-making at trade shows 17.1 Attendees do not openly state reasons for not being interested in the product/service
0.779 0.758 0.598
0.459 0.643 0.635
No. of items 4 2 % of Variance explained 48.75 17.93 Cronbach’s Alpha 0.788
For the objections experienced during the sales presentation two factors were
indentified manifested objections (Factor 1) and latent objections (Factor 2)
explaining 66.70% variance. 6.5.6 Dealing with objections
The methods used to deal with objections during the sales presentation was
measured with six items on a 5 point Likert scale ranging from “never” to “always”.
The factor loadings for dealing with objections during the sales presentation of
exhibit staff at trade show are indicated in Table 6.19.
The six items that were included in the stage of the sales process on dealing with
objections during the sales presentation by exhibit staff at trade shows were
subjected to a Principal axis factoring with Varimax rotation. The Kaiser-Meyer-
Olkin value was 0.676 and the Bartlett’s Test of Sphericity indicated statistical
significance (p = 0.000) supporting the factorability of the correlation matrix. The
Cronbach’s alpha coefficient value was 0.747 exceeding the accepted 0.7.
© University of Pretoria
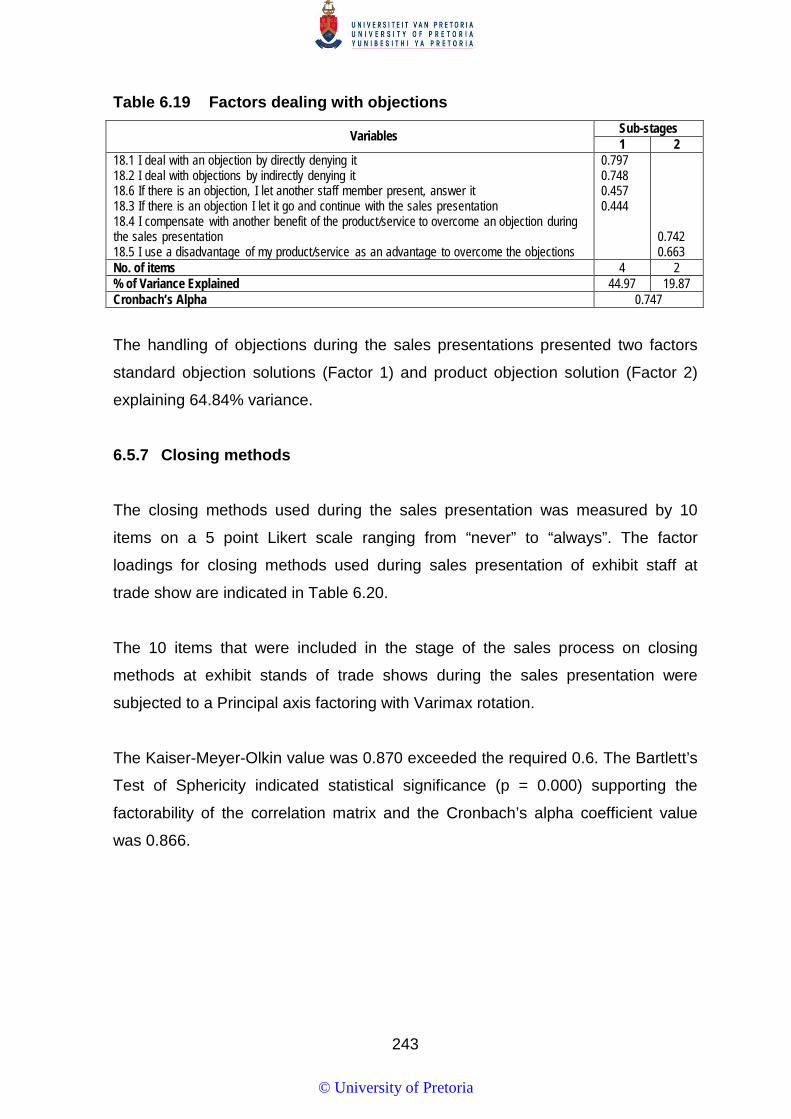
243
Table 6.19 Factors dealing with objections
Variables Sub-stages 1 2
18.1 I deal with an objection by directly denying it 18.2 I deal with objections by indirectly denying it 18.6 If there is an objection, I let another staff member present, answer it 18.3 If there is an objection I let it go and continue with the sales presentation 18.4 I compensate with another benefit of the product/service to overcome an objection during the sales presentation 18.5 I use a disadvantage of my product/service as an advantage to overcome the objections
0.797 0.748 0.457 0.444
0.742 0.663
No. of items 4 2 % of Variance Explained 44.97 19.87 Cronbach’s Alpha 0.747
The handling of objections during the sales presentations presented two factors
standard objection solutions (Factor 1) and product objection solution (Factor 2)
explaining 64.84% variance.
6.5.7 Closing methods
The closing methods used during the sales presentation was measured by 10
items on a 5 point Likert scale ranging from “never” to “always”. The factor
loadings for closing methods used during sales presentation of exhibit staff at
trade show are indicated in Table 6.20.
The 10 items that were included in the stage of the sales process on closing
methods at exhibit stands of trade shows during the sales presentation were
subjected to a Principal axis factoring with Varimax rotation.
The Kaiser-Meyer-Olkin value was 0.870 exceeded the required 0.6. The Bartlett’s
Test of Sphericity indicated statistical significance (p = 0.000) supporting the
factorability of the correlation matrix and the Cronbach’s alpha coefficient value
was 0.866.
© University of Pretoria
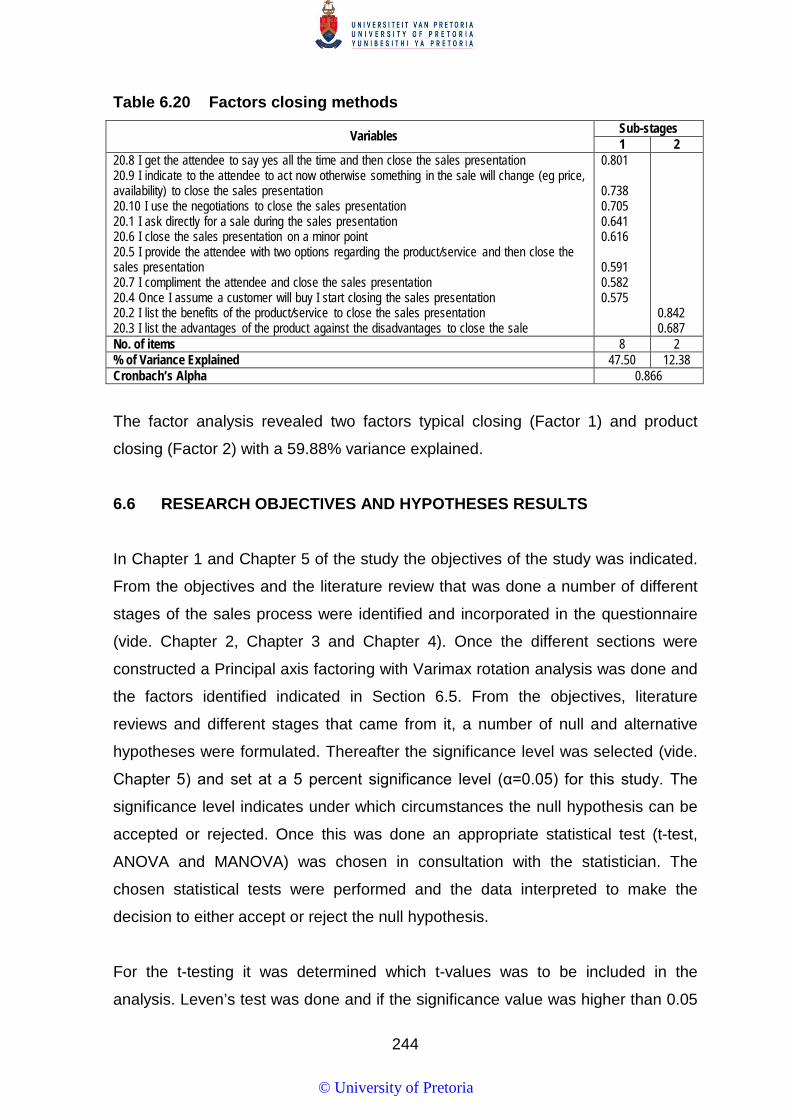
244
Table 6.20 Factors closing methods
Variables Sub-stages 1 2
20.8 I get the attendee to say yes all the time and then close the sales presentation 20.9 I indicate to the attendee to act now otherwise something in the sale will change (eg price, availability) to close the sales presentation 20.10 I use the negotiations to close the sales presentation 20.1 I ask directly for a sale during the sales presentation 20.6 I close the sales presentation on a minor point 20.5 I provide the attendee with two options regarding the product/service and then close the sales presentation 20.7 I compliment the attendee and close the sales presentation 20.4 Once I assume a customer will buy I start closing the sales presentation 20.2 I list the benefits of the product/service to close the sales presentation 20.3 I list the advantages of the product against the disadvantages to close the sale
0.801 0.738 0.705 0.641 0.616 0.591 0.582 0.575
0.842 0.687
No. of items 8 2 % of Variance Explained 47.50 12.38 Cronbach’s Alpha 0.866
The factor analysis revealed two factors typical closing (Factor 1) and product
closing (Factor 2) with a 59.88% variance explained.
6.6 RESEARCH OBJECTIVES AND HYPOTHESES RESULTS
In Chapter 1 and Chapter 5 of the study the objectives of the study was indicated.
From the objectives and the literature review that was done a number of different
stages of the sales process were identified and incorporated in the questionnaire
(vide. Chapter 2, Chapter 3 and Chapter 4). Once the different sections were
constructed a Principal axis factoring with Varimax rotation analysis was done and
the factors identified indicated in Section 6.5. From the objectives, literature
reviews and different stages that came from it, a number of null and alternative
hypotheses were formulated. Thereafter the significance level was selected (vide.
Chapter 5) and set at a 5 percent significance level (α=0.05) for this study. The
significance level indicates under which circumstances the null hypothesis can be
accepted or rejected. Once this was done an appropriate statistical test (t-test,
ANOVA and MANOVA) was chosen in consultation with the statistician. The
chosen statistical tests were performed and the data interpreted to make the
decision to either accept or reject the null hypothesis.
For the t-testing it was determined which t-values was to be included in the
analysis. Leven’s test was done and if the significance value was higher than 0.05
© University of Pretoria
245
equal variance was assumed. In cases where Leven’s test value was 0.05 or less
the alternative t-value provides by the SPSS output was used referred to as equal
variances not assumed. This means that although the assumption of equal
variance was violated the alternative t-test can be used. Secondly, the differences
between groups were assed using the significant 2-tailed results. If the significant
2-tailed test was equal or less than 0.05 it was accepted that there is significant
differences between the groups. On the other hand if the value was above 0.05 it
is assumed that there is no significant differences between the groups (Pallant,
2013:241-242; Wiid & Diggines, 2015:282). For the t-test the five assumptions of
doing parametric test was met namely level of measurement, random sampling,
independence of observations, normal distribution and homogeneity of variance
(Howell, 2010:180-181; Robert & Russo, 1999:70-73).
The second type of test applied was a one-way variance analysis (ANOVA)
between groups. An ANOVA test was used since there were one independent
grouping of variables with three or more groups and one dependent continuous
variable. For the researcher to use the ANOVA specific assumptions need to be
addressed; the level measurement for the dependent variable was used, random
sampling was used, the observations was independent, the population sample
was normally distributed and there was homogeneity of variance (Hair, et al.,
1998:348-349; Pallant, 2013:205-207). It must be noted that only one of the
variables did not meet homogeneity of variance. However the ANOVA test is a
robust enough when it comes to moderate departures from underlying
homogeneity of variance assumptions that if groups are largely equally distributed
it can be assessed on lower values such as 0.03 (Hair, et al., 1998:349; Salkind,
2010:579).
In Chapter 5 it was indicated that a Principal axis factoring with varimax rotation
was done to indentify underlining factors as to reduce the data. For the stages of
the sales process were no theoretical and practical factors was identified using
Principal axis factoring with varimax rotation it was decided to rather apply a
MANOVA. In statistics MANOVA is applied to examine the values of the
dependent variable across the groups of two or more independent variables that
share similar characteristics. The MANOVA protects against Type I error when
© University of Pretoria
246
there are a number of dependent variables and indicates differences that an
ANOVA does not (Tabachnik & Fidell, 2013:323). According to Pallant (2013:285)
and Hair et al. (1998:347), three assumptions needs to be addressed before an
MANOVA can be conducted: the observations must be independent; there must
be normality for the set of dependent variables and the covariance matrices must
be equal for all treatment groups. This study had no major ovulations of normality
due to the large sample size and due to a MANOVA being robust to modes
violations.
The overall significance of the MANOVA was assessed by the Wilks’ Lambda
since it is immune to violations of the assumptions underlining the MANOVA
without compromising on power (Hair et al., 1998:35). In using the Wilks’ Lambda
the significant value for differences is p<0.05 and no significant differences
p>0.05.
In the rest of the chapter the objectives and the related hypothesis will be
discussed.
6.6.1 Objective: To determine if sales persons and non-sales persons differ regarding the sales process followed at trade shows
It was indicate in Chapter 3 and Chapter 5 that there are differences in opinions on
who should exhibit staff. This was also indicated to the researcher through
discussions with trade show exhibitors. Trade shows are seen as a place to gather
sales leads so the logical choice would be sales persons (vide. Chapter 3).
However many exhibitors see trade shows as a place to do public relations and
not sales. In Figure 6.3 it was indicated that the number respondents that was in
sales was almost equal to those who were not, therefore it is necessary to
determine if they use the sales process the same. Salespeople who therefore man
the exhibit stand must know their organisation and product to help the attendees in
their decision-making (O`Connor, 2001:152-154). Miller (1999:89-91) contends
that when it comes to products, the exhibitor has control over the four main
elements relating to the product, namely: product knowledge; product
© University of Pretoria

247
demonstrations; comparison of your product to that of the competitions; and
product enthusiasm.
The lack of product knowledge is one of the main complaints that attendees have
about stand personnel. Therefore, it may be assumed that sales personnel would
be the best exhibit staff – due to their knowledge of the products. Salespeople
would most probably be more capable of demonstrating and showing enthusiasm
towards their own products (Miller, 1999:89-91).
The seven hypotheses tested below will provide an indication if sales persons and
non-sales persons use these stages in the sales process to the same extent. The
first hypothesis will be analysed by means of a MANOVA and the rest of the
hypotheses by means of a t-test or ANOVA.
As stated in Chapter 5 all hypotheses are set regarding the sales process for trade
shows.
Hypothesis 1
The first hypothesis deal with exhibitors planning of trade show activities MANOVA
testing was used to assess the differences between the groups.
Ho1 There exist no significant differences between sales persons and non-sales
persons regarding business actions used.
MANOVA testing, which assess the difference between groups collectively rather
than individually, was used to test hypothesis one. The researcher relied on a 95
% level of confidence, and a subsequent significance level of 5% (p-value ≤ 0.05)
to interpret the results of the hypothesis testing. Preliminary assumptions testing
was conducted to check for normality, linearity, univariate and multivariate
outliners, and homogeneity of variance and no serious violations were noted.
© University of Pretoria

248
The Wilks’Lambda value indicates that there is no significant differences between
sales and non-sales person exhibit staff regarding business actions used
F(22.208)=1.501, p=0.076; Wilks’Lambda=0.863; partial Eta Squared=0.137.
The null hypothesis Ho1 was thus accepted, as there are no support that there
is a significant difference between sales and non-sales persons regarding
business actions used.
Hypothesis 2 Ho2 There exist no significant differences between sales persons and non-sales
persons regarding pre-show marketing activities.
The factor analysis identified two factors for pre-show marketing activities namely
direct communications and promotional tools, the following two sub-hypotheses
flowed.
Ho2a There exist no significant differences between sales persons and non-sales
persons regarding direct communication used in pre-show marketing
activities.
Table 6.21 Mean values and t-test results for direct communication for sales and non-sales persons
Factor Sales person Non-sales person
Total Sample (Sales & non-sales personal)
Mean n Mean n Direct communication 3.58 124 3.37 108 MD 0.21087
t 1.829 df 212.543 Sig. 0.069 p-value = > 0.05 Ho Accepted
For the factor “Direct communication”, sales people (mean = 3.58) agree while
non-sales people (mean = 3.37) neither agree nor disagree regarding direct
communication used to attract attendees to a trade show. From the findings it is
evident that there are no significant differences between sales or non-sales
© University of Pretoria

249
persons regarding the use of direct communication that they utilise. Therefore, the null hypothesis Ho2a was accepted.
Ho2b There exist no significant differences between sales persons and non-sales
persons regarding promotional elements used in pre-show marketing
activities.
Table 6.22 Mean values and t-test results for promotional elements for sales and non-sales persons
Factor Sales person Non-sales person
Total Sample (Sales & non-sales personal)
Mean n Mean n Promotional elements 3.20 124 3.11 108 MD 0.8204
t 0.668 df 210.441 Sig. 0.505 p-value = > 0.05 Ho Accepted
For the factor “Promotional elements”, both sales people (mean = 3.20) and non-
sales (mean = 3.11) neither agree nor disagree that promotional tools are used to
attract attendees to a trade show. From the Table 6.22, it can be seen that there is
no significant differences between sales and non-sales personal and promotional
tools used for marketing. Therefore, the null hypothesis Ho2b is accepted.
Hypothesis 3 Ho3 There exist no significant differences between sales persons and non-sales
persons regarding at-show marketing activities.
The factor analysis identified two factors trade show sponsorship and promotional
tools therefore, two sub-hypotheses followed from the at-show marketing activities
hypothesis.
Ho3a There exist no significant differences between sales persons and non-sales
persons regarding trade show sponsorship used as at-show marketing
activity.
© University of Pretoria
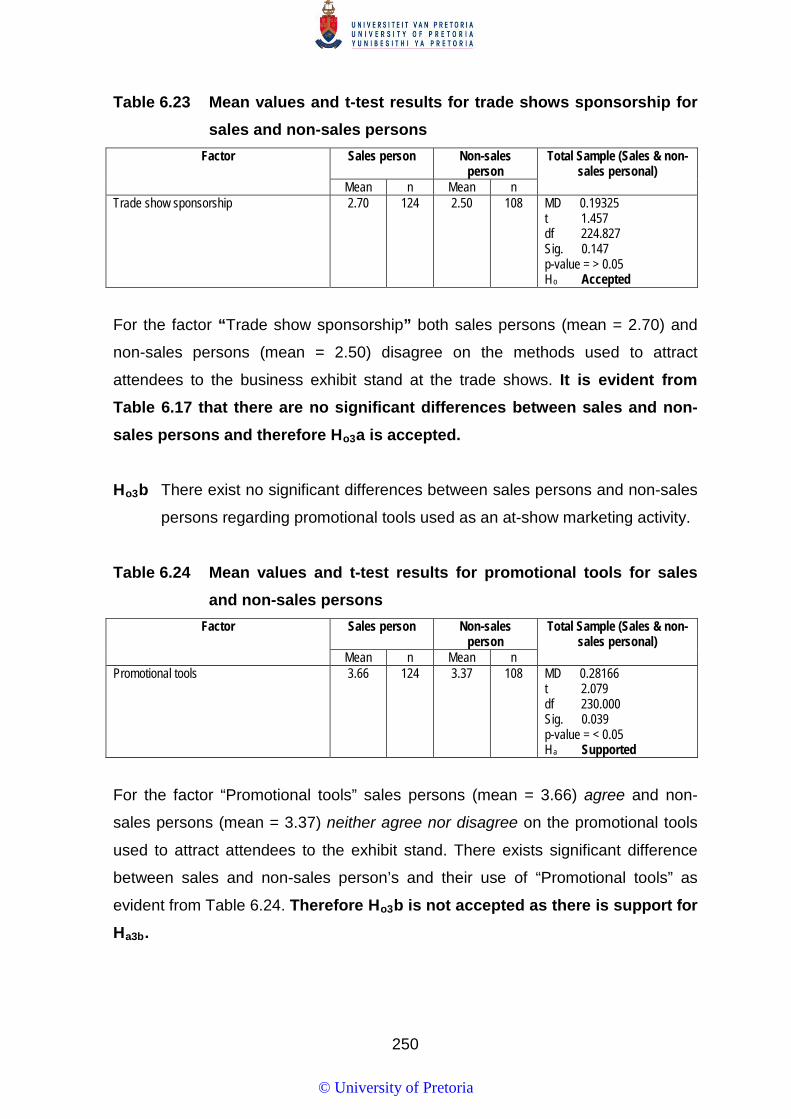
250
Table 6.23 Mean values and t-test results for trade shows sponsorship for sales and non-sales persons
Factor Sales person Non-sales person
Total Sample (Sales & non-sales personal)
Mean n Mean n Trade show sponsorship 2.70 124 2.50 108 MD 0.19325
t 1.457 df 224.827 Sig. 0.147 p-value = > 0.05 Ho Accepted
For the factor “Trade show sponsorship” both sales persons (mean = 2.70) and
non-sales persons (mean = 2.50) disagree on the methods used to attract
attendees to the business exhibit stand at the trade shows. It is evident from
Table 6.17 that there are no significant differences between sales and non-sales persons and therefore Ho3a is accepted.
Ho3b There exist no significant differences between sales persons and non-sales
persons regarding promotional tools used as an at-show marketing activity.
Table 6.24 Mean values and t-test results for promotional tools for sales and non-sales persons
Factor Sales person Non-sales person
Total Sample (Sales & non-sales personal)
Mean n Mean n Promotional tools 3.66 124 3.37 108 MD 0.28166
t 2.079 df 230.000 Sig. 0.039 p-value = < 0.05 Ha Supported
For the factor “Promotional tools” sales persons (mean = 3.66) agree and non-
sales persons (mean = 3.37) neither agree nor disagree on the promotional tools
used to attract attendees to the exhibit stand. There exists significant difference
between sales and non-sales person’s and their use of “Promotional tools” as
evident from Table 6.24. Therefore Ho3b is not accepted as there is support for Ha3b.
© University of Pretoria
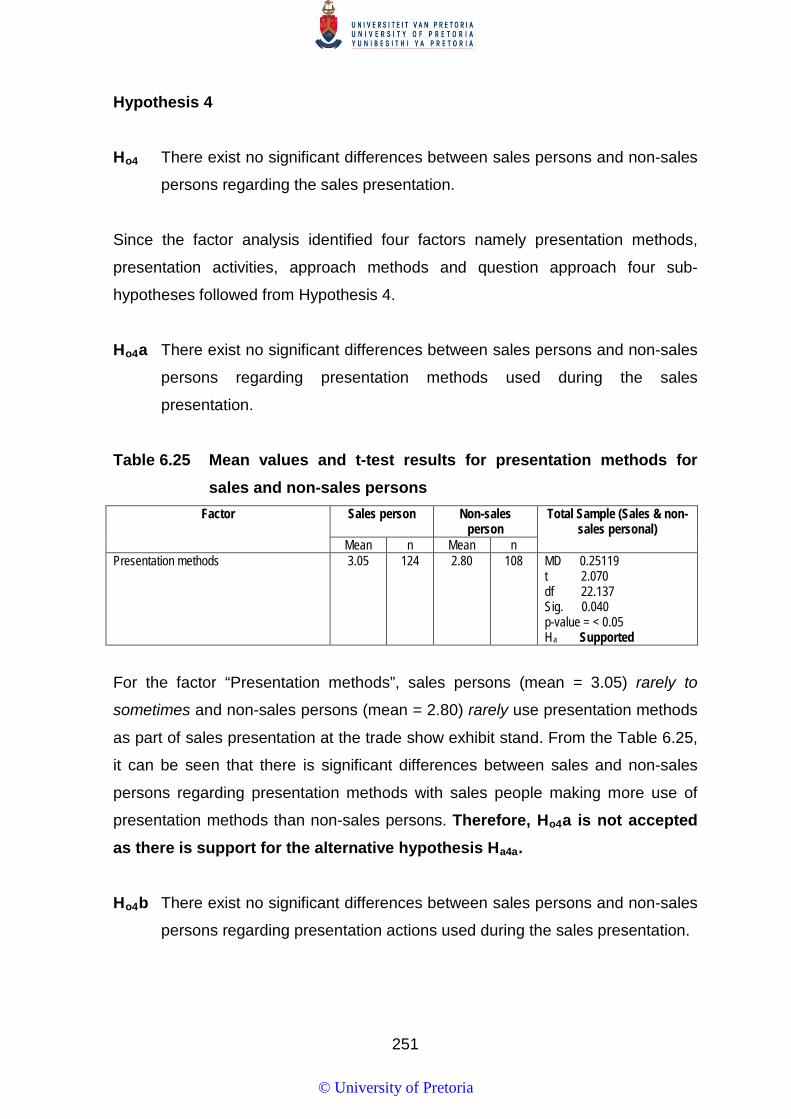
251
Hypothesis 4
Ho4 There exist no significant differences between sales persons and non-sales
persons regarding the sales presentation.
Since the factor analysis identified four factors namely presentation methods,
presentation activities, approach methods and question approach four sub-
hypotheses followed from Hypothesis 4.
Ho4a There exist no significant differences between sales persons and non-sales
persons regarding presentation methods used during the sales
presentation.
Table 6.25 Mean values and t-test results for presentation methods for sales and non-sales persons
Factor Sales person Non-sales person
Total Sample (Sales & non-sales personal)
Mean n Mean n Presentation methods 3.05 124 2.80 108 MD 0.25119
t 2.070 df 22.137 Sig. 0.040 p-value = < 0.05 Ha Supported
For the factor “Presentation methods”, sales persons (mean = 3.05) rarely to
sometimes and non-sales persons (mean = 2.80) rarely use presentation methods
as part of sales presentation at the trade show exhibit stand. From the Table 6.25,
it can be seen that there is significant differences between sales and non-sales
persons regarding presentation methods with sales people making more use of
presentation methods than non-sales persons. Therefore, Ho4a is not accepted as there is support for the alternative hypothesis Ha4a.
Ho4b There exist no significant differences between sales persons and non-sales
persons regarding presentation actions used during the sales presentation.
© University of Pretoria
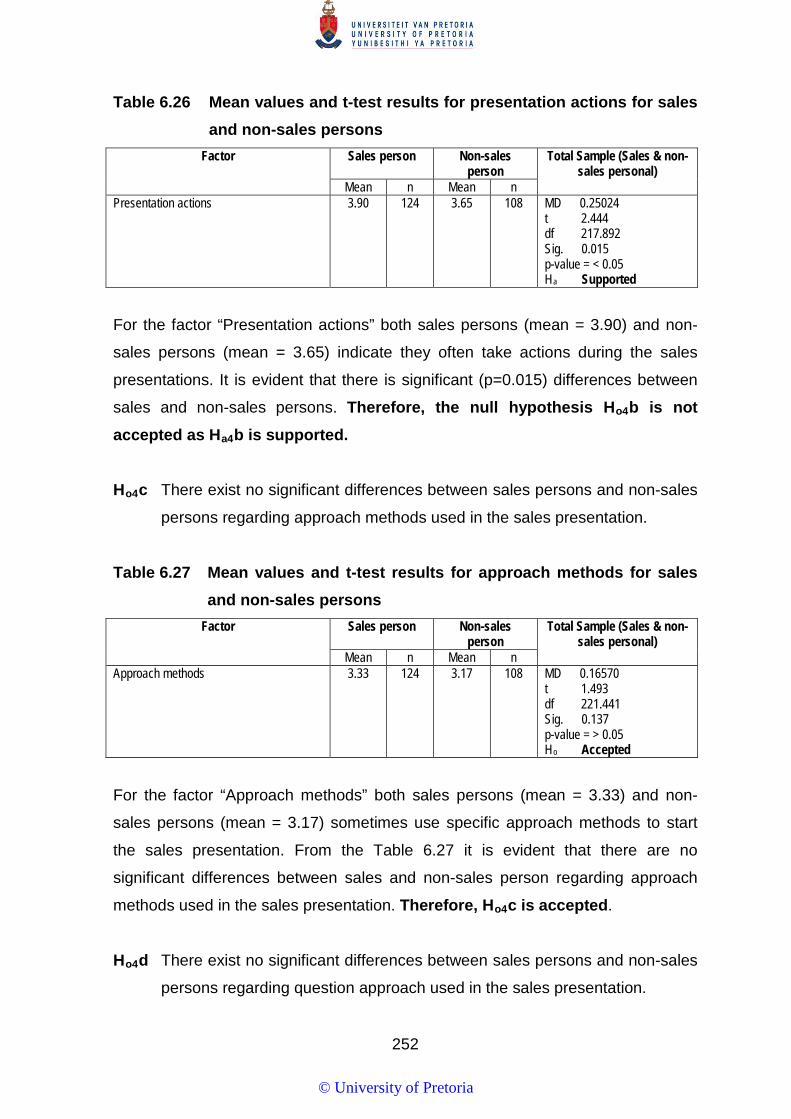
252
Table 6.26 Mean values and t-test results for presentation actions for sales and non-sales persons
Factor Sales person Non-sales person
Total Sample (Sales & non-sales personal)
Mean n Mean n Presentation actions 3.90 124 3.65 108 MD 0.25024
t 2.444 df 217.892 Sig. 0.015 p-value = < 0.05 Ha Supported
For the factor “Presentation actions” both sales persons (mean = 3.90) and non-
sales persons (mean = 3.65) indicate they often take actions during the sales
presentations. It is evident that there is significant (p=0.015) differences between
sales and non-sales persons. Therefore, the null hypothesis Ho4b is not accepted as Ha4b is supported. Ho4c There exist no significant differences between sales persons and non-sales
persons regarding approach methods used in the sales presentation.
Table 6.27 Mean values and t-test results for approach methods for sales and non-sales persons
Factor Sales person Non-sales person
Total Sample (Sales & non-sales personal)
Mean n Mean n Approach methods 3.33 124 3.17 108 MD 0.16570
t 1.493 df 221.441 Sig. 0.137 p-value = > 0.05 Ho Accepted
For the factor “Approach methods” both sales persons (mean = 3.33) and non-
sales persons (mean = 3.17) sometimes use specific approach methods to start
the sales presentation. From the Table 6.27 it is evident that there are no
significant differences between sales and non-sales person regarding approach
methods used in the sales presentation. Therefore, Ho4c is accepted.
Ho4d There exist no significant differences between sales persons and non-sales
persons regarding question approach used in the sales presentation.
© University of Pretoria
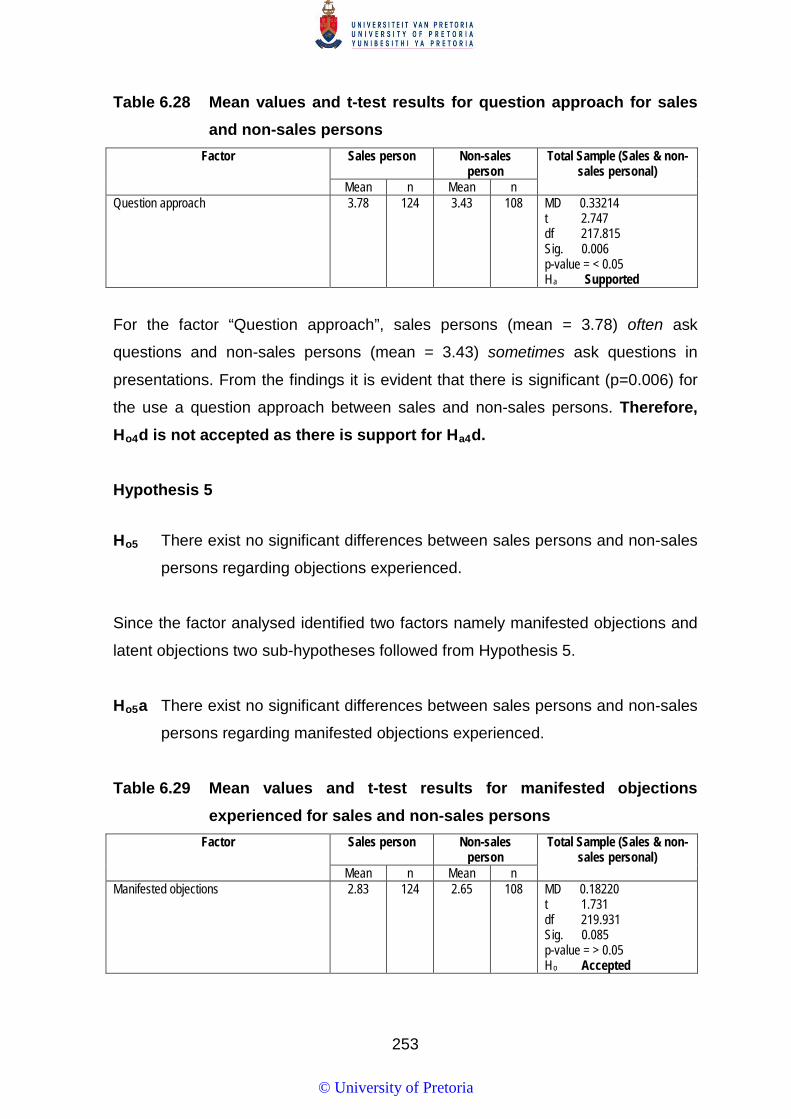
253
Table 6.28 Mean values and t-test results for question approach for sales and non-sales persons
Factor Sales person Non-sales person
Total Sample (Sales & non-sales personal)
Mean n Mean n Question approach 3.78 124 3.43 108 MD 0.33214
t 2.747 df 217.815 Sig. 0.006 p-value = < 0.05 Ha Supported
For the factor “Question approach”, sales persons (mean = 3.78) often ask
questions and non-sales persons (mean = 3.43) sometimes ask questions in
presentations. From the findings it is evident that there is significant (p=0.006) for
the use a question approach between sales and non-sales persons. Therefore, Ho4d is not accepted as there is support for Ha4d.
Hypothesis 5
Ho5 There exist no significant differences between sales persons and non-sales
persons regarding objections experienced.
Since the factor analysed identified two factors namely manifested objections and
latent objections two sub-hypotheses followed from Hypothesis 5.
Ho5a There exist no significant differences between sales persons and non-sales
persons regarding manifested objections experienced.
Table 6.29 Mean values and t-test results for manifested objections experienced for sales and non-sales persons
Factor Sales person Non-sales person
Total Sample (Sales & non-sales personal)
Mean n Mean n Manifested objections 2.83 124 2.65 108 MD 0.18220
t 1.731 df 219.931 Sig. 0.085 p-value = > 0.05 Ho Accepted
© University of Pretoria
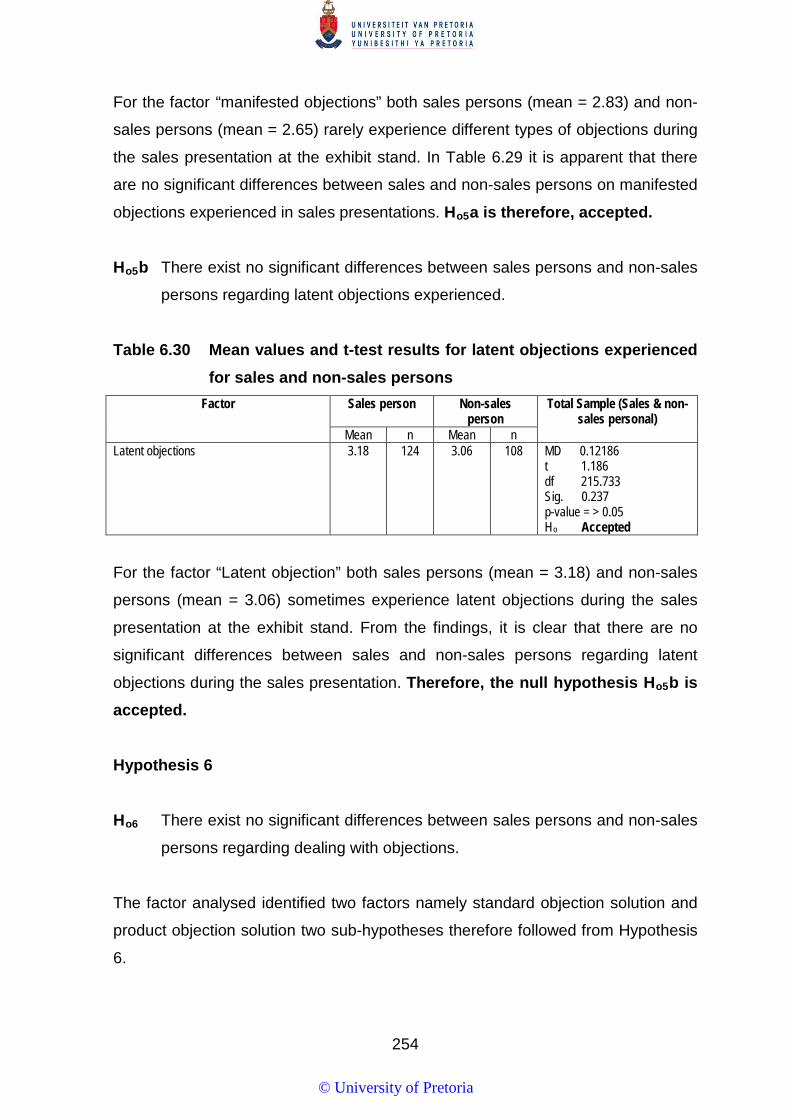
254
For the factor “manifested objections” both sales persons (mean = 2.83) and non-
sales persons (mean = 2.65) rarely experience different types of objections during
the sales presentation at the exhibit stand. In Table 6.29 it is apparent that there
are no significant differences between sales and non-sales persons on manifested
objections experienced in sales presentations. Ho5a is therefore, accepted.
Ho5b There exist no significant differences between sales persons and non-sales
persons regarding latent objections experienced.
Table 6.30 Mean values and t-test results for latent objections experienced for sales and non-sales persons
Factor Sales person Non-sales person
Total Sample (Sales & non-sales personal)
Mean n Mean n Latent objections 3.18 124 3.06 108 MD 0.12186
t 1.186 df 215.733 Sig. 0.237 p-value = > 0.05 Ho Accepted
For the factor “Latent objection” both sales persons (mean = 3.18) and non-sales
persons (mean = 3.06) sometimes experience latent objections during the sales
presentation at the exhibit stand. From the findings, it is clear that there are no
significant differences between sales and non-sales persons regarding latent
objections during the sales presentation. Therefore, the null hypothesis Ho5b is accepted.
Hypothesis 6
Ho6 There exist no significant differences between sales persons and non-sales
persons regarding dealing with objections.
The factor analysed identified two factors namely standard objection solution and
product objection solution two sub-hypotheses therefore followed from Hypothesis
6.
© University of Pretoria

255
Ho6a There exist no significant differences between sales persons and non-sales
persons regarding standard objection solutions.
Table 6.31 Mean values and t-test results on standard objection solution for sales and non-sales persons
Factor Sales person Non-sales person
Total Sample (Sales & non-sales personal)
Mean n Mean n Standard objection solutions 2.18 124 2.11 108 MD 0.06785
t 0.630 df 22.993 Sig. 0.530 p-value = > 0.05 Ho Accepted
For the factor “Standard objection solutions” both sales persons (mean = 2.18) and
non-sales persons (mean = 2.11) rarely use methods to deal with objections
during the sales presentation at the exhibit stand. Form Table 6.31 it is evident
that there is no significant differences between sales and non-sales persons in
standard objection solutions during the sales presentation. Ho6a is therefore, accepted.
Ho6b There exist no significant differences between sales persons and non-sales
persons regarding product objection.
Table 6.32 Mean values and t-test results on product objection solutions for sales and non-sales persons
Factor Sales person Non-sales person
Total Sample (Sales & non-sales personal)
Mean n Mean n Product objection solution 3.04 124 2.90 108 MD 0.14217
t 0.989 df 223.778 Sig. 0.324 p-value = > 0.05 Ho Accepted
For the factor “Product objection solution”, sales persons (mean = 3.04)
sometimes and non-sales persons (mean = 2.90) rarely to sometimes use product
characteristics to overcome an objection during the sales presentation at the
exhibit stand. From the finding it is evident that that sales and non-sales persons
© University of Pretoria

256
do not differ for product objection solutions during the sales presentation.
Therefore, the null hypothesis is accepted.
Hypothesis 7
Ho7 There exist no significant differences between sales persons and non-sales
persons regarding closing methods.
The factor analysis identified two factors namely typical closing and product
closing for this factor therefore for the hypothesis regarding closing methods two
sub-hypothesis was established.
Ho7a There exist no significant differences between sales persons and non-sales
persons regarding typical closing.
Table 6.33 Mean values and t-test results for typical closing for sales and non-sales persons
Factor Sales person Non-sales person
Total Sample (Sales & non-sales personal)
Mean n Mean n Typical closing 2.96 59 2.77 47 MD 0.18847
t 1.087 df 93.016 Sig. 0.279 p-value = > 0.05 Ho Accepted
For the factor “Typical closing” both sales persons (mean = 2.96) and non-sales
persons (mean = 2.77) rarely to sometimes use different methods to close the sale
during the sales presentation at trade shows. Form Table 6.33 it is clear that there
are no significant differences between sales and non-sales persons in typical
closing used during the sales presentation. Therefore, Ho7a is accepted.
Ho7b There exist no significant differences between sales persons and non-sales
persons regarding product closing.
© University of Pretoria

257
Table 6.34 Mean values and t-test results for product closing for sales and non-sales persons
Factor Sales person Non-sales person
Total Sample (Sales & non-sales personal)
Mean n Mean n Product closing 3.90 59 3.40 47 MD 0.49405
t 2.518 df 89.856 Sig. 0.013 p-value = < 0.05 Ha Supported
For the factor “Product closing” sales persons (mean = 3.90) often close the sale
using product characteristics and non-sales persons (mean = 3.40) sometimes
close the sale using product characteristics during the sales presentation at trade
shows. Table 6.34 indicate that there exist significant differences (p=0.013)
between sales and non-sales persons regarding the use of “product closing”.
Sales persons make use of product closing more than non-sales persons.
Therefore, the null hypothesis is not accepted since there is support for Ha7b. 6.6.2 Summary of hypotheses for sales and non-sales persons for the sales
process at trade shows.
Table 6.35 is a summary of hypotheses one to seven. The conclusions for each of
the findings will be discussed in chapter 7 and recommendations will be provided.
Table 6.35 Hypotheses for the objective sales and non-sales person’s role in the sales process at trade shows
Alternative Hypotheses Not supported
or supported
Ha1 There exist significant differences between sales persons and non-sales persons regarding business actions used.
Not supported
Ha2a There exist significant differences between sales persons and non-sales persons regarding direct communication used in pre-show marketing activities.
Not supported
Ha2b There exist significant differences between sales persons and non-sales persons regarding promotional elements used in pre-show marketing activities.
Not supported
Ha3a There exist significant differences between sales persons and non-sales persons regarding trade show sponsorship used as at-show marketing activity.
Not supported
Ha3b There exist significant differences between sales persons and non-sales persons regarding promotional tools used as an at-show marketing activity.
Supported
Ha4a There exist significant differences between sales persons and non-sales persons regarding presentation methods used during the sales presentation.
Supported
© University of Pretoria

258
Table 6.35 cont….
Alternative Hypotheses Not supported
or supported
Ha4b There exist significant differences between sales persons and non-sales persons regarding presentation actions used during the sales presentation.
Supported
Ha4c There exist significant differences between sales persons and non-sales persons regarding approach methods used in the sales presentation.
Not supported
Ha4d There exist significant differences between sales persons and non-sales persons regarding question approach used in the sales presentation.
Supported
Ha5a There exist significant differences between sales persons and non-sales persons regarding manifested objections experienced.
Not supported
Ha5b There exist significant differences between sales persons and non-sales persons regarding latent objections experienced.
Not supported
Ha6a There exist significant differences between sales persons and non-sales persons regarding standard objection solutions.
Not supported
Ha6b There exist significant differences between sales persons and non-sales persons regarding product objection.
Not supported
Ha7a There exist significant differences between sales persons and non-sales persons regarding typical closing.
Not supported
Ha7b There exist significant differences between sales persons and non-sales persons regarding product closing.
Supported
Next the type of trade shows and the role it plays in the sales process of trade
shows will be discussed.
6.6.3 Objective: To determine if the various types of trade shows influence the sales process
Hypotheses 8 to 14 were analysed to determine if there exist significant
differences between the types of trade show, whether it is regional, nationally or
internationally regarding the selling process that is followed. As indicated in
Chapter 3 and Chapter 5 of this study there are differences between how
businesses approach the different types of trade shows. Hypotheses Ho8 to Ho14
were formulated for this objective. Each hypothesis will be looked at individually
and in Chapter 7 an interpretation of objective will be provided. Hypothesis 8 will
be analysed using a MANOVA test as motivated in Section 6.5.1 of this chapter.
Hypotheses 9 to 14 will be tested using ANOVA test due to three groups being
compared.
© University of Pretoria

259
Hypothesis 8
Ho8 There exist no significant differences for the type of trade show regarding
business actions used.
As indicated MANOVA testing assess the difference between groups collectively
rather than individually and was used to test hypothesis Ho8. The researcher relied
on a 95 % level of confidence, and a subsequent significance level of 5% (p-value
≤ 0.05) to interpret the results of the hypothesis testing. Preliminary assumptions
testing was conducted to check for normality, linearity, univariate and multivariate
outliners, and homogeneity of variance and no serious violations were noted.
The Wilks’Lambda value indicates that there is no significant differences between
the different types of trade shows regarding business actions used
F(44.414)=0.863, p=0.720; Wilks’Lambda=0.839; partial Eta Squared=0.084.
The null hypothesis Ho8 was accepted as there is no support that there is a
significant difference between the different types of trade shows regarding
business actions used.
Hypothesis 9
Ho9 There exist no significant differences for the type of trade show regarding
pre-show marketing activities.
The factor analysis regarding pre-show marketing activities identified two factors
therefore two sub-hypotheses followed.
Ho9a There exist no significant differences for the type of trade show regarding
the use of direct communication as a pre-show marketing activity.
© University of Pretoria

260
Table 6.36 Mean values and ANOVA results for direct communication for the type of trade show
Factor Mean and n values type of trade show ANOVA Regional Nationally International Total
Mean n Mean n Mean n Mean n Direct communication 3.50 76 3.48 63 3.46 93 3.48 232 DF = 2
F value = 0.051 P-value = 0.950 Ho Accepted
For the factor “Direct communication”, regional (mean = 3.50) neither agree nor
disagree to agree while nationally (mean = 3.48) and international (mean = 3.46)
neither agree nor disagree that direct communication is used to attract attendees
to the trade show. There are no significant differences between the different types
of trade shows regarding the use of direct communication as a marketing activity
to attract attendees to a trade show. Therefore, the null hypothesis Ho9a is accepted. Ho9b There exist no significant differences for the type of trade show regarding
the use of promotional elements.
Table 6.37 Mean values and ANOVA results for promotional elements for
the type of trade show Factor Mean and n values type of trade show
ANOVA Regional Nationally International Total Mean n Mean n Mean n Mean n
Promotional elements 3.07 76 3.23 63 3.18 93 3.16 232 DF = 2 F value = 0.521 P-value = 0.594 Ho Accepted
For the factor “Promotional elements”, regional (mean = 3.07), nationally (mean =
3.27) and international (mean = 3.18) neither agree nor disagree that promotional
tools are used to attract attendees to the trade show. From the findings it is
evident that there are no significant differences regarding promotional elements as
pre-show marketing activity Therefore, the null hypothesis is accepted.
© University of Pretoria

261
Hypothesis 10
Ho10 There exist no significant differences for the type of trade show regarding
at-show marketing activities.
As the factor analysis identified two factors therefore for Hypothesis 10 two sub-
hypotheses was established.
Ho10a There exist no significant differences for the type of trade show regarding
trade show sponsorship.
Table 6.38 Mean values and ANOVA results for trade show sponsorship for the type of trade show
Factor Mean and n values type of trade show ANOVA Regional Nationally International Total
Mean n Mean n Mean n Mean n Trade show sponsorship
2.60 76 2.66 63 2.58 93 2.61 232 DF = 2 F value = 0.521 P-value = 0.883 Ho Accepted
For the factor “Trade show sponsorship” the types of trade shows regional (mean
= 2.60), nationally (mean = 2.66) and international (mean = 2.58) disagree
regarding the methods used to attract attendees to the exhibit stand at the trade
shows. There are no significant differences for the type of trade show regarding
trade show sponsorship as an at-show marketing activity. Therefore, the null hypothesis Ho10a is accepted. Ho10b There exist no significant differences regarding the type of trade show
regarding promotional tools used.
© University of Pretoria
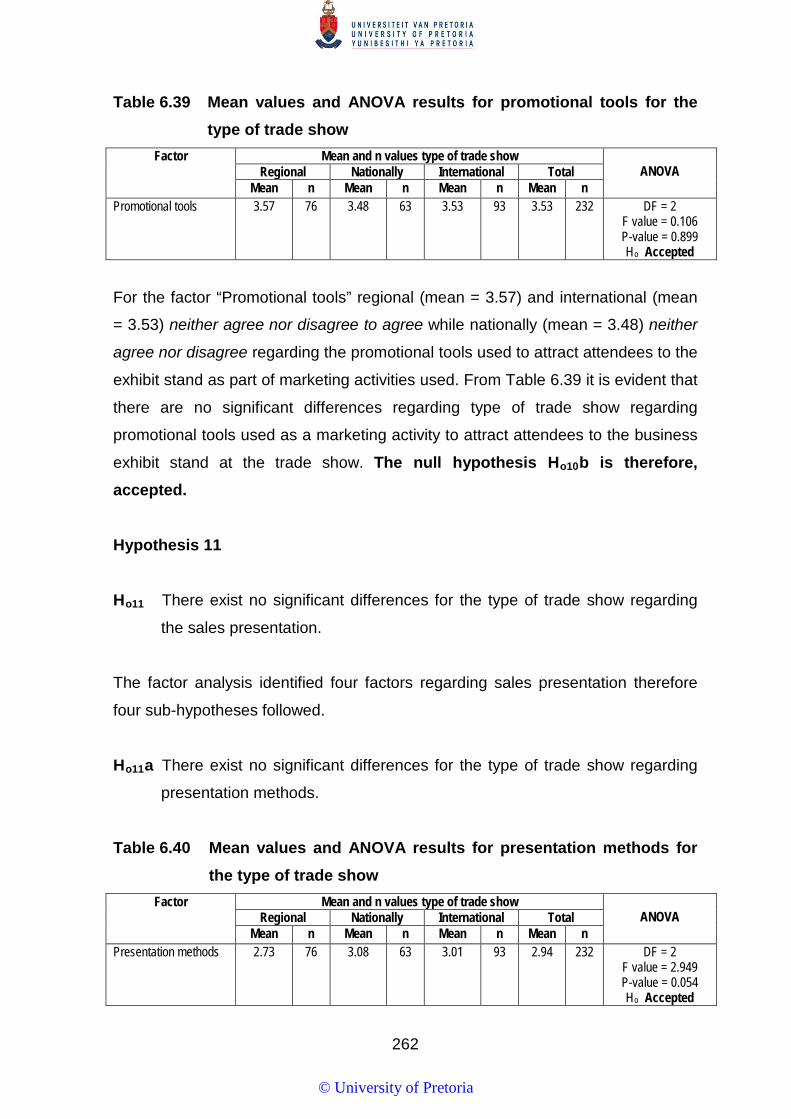
262
Table 6.39 Mean values and ANOVA results for promotional tools for the type of trade show
Factor Mean and n values type of trade show ANOVA Regional Nationally International Total
Mean n Mean n Mean n Mean n Promotional tools 3.57 76 3.48 63 3.53 93 3.53 232 DF = 2
F value = 0.106 P-value = 0.899 Ho Accepted
For the factor “Promotional tools” regional (mean = 3.57) and international (mean
= 3.53) neither agree nor disagree to agree while nationally (mean = 3.48) neither
agree nor disagree regarding the promotional tools used to attract attendees to the
exhibit stand as part of marketing activities used. From Table 6.39 it is evident that
there are no significant differences regarding type of trade show regarding
promotional tools used as a marketing activity to attract attendees to the business
exhibit stand at the trade show. The null hypothesis Ho10b is therefore, accepted.
Hypothesis 11
Ho11 There exist no significant differences for the type of trade show regarding
the sales presentation.
The factor analysis identified four factors regarding sales presentation therefore
four sub-hypotheses followed.
Ho11a There exist no significant differences for the type of trade show regarding
presentation methods.
Table 6.40 Mean values and ANOVA results for presentation methods for the type of trade show
Factor Mean and n values type of trade show ANOVA Regional Nationally International Total
Mean n Mean n Mean n Mean n Presentation methods 2.73 76 3.08 63 3.01 93 2.94 232 DF = 2
F value = 2.949 P-value = 0.054 Ho Accepted
© University of Pretoria

263
For the factor “Presentation methods”, regional (mean = 2.73) rarely while
nationally (mean = 3.08) and international (mean = 3.01) sometimes to rarely used
presentation methods at the trade show exhibit stand. There are no significant
differences regarding type of trade shows regarding presentation methods used.
With a p-value=0.054 of, the null hypothesis Ho11a is accepted. Ho11b There exist no significant differences for the type of trade show regarding
the presentation actions.
Table 6.41 Mean values and ANOVA results for presentation actions for the
type of trade show Factor Mean and n values type of trade show
ANOVA Regional Nationally International Total Mean n Mean n Mean n Mean n
Presentation actions 3.78 76 3.74 63 3.82 93 3.78 232 DF = 2 F value = 0.174 P-value = 0.840 Ho Accepted
For the factor “Presentation actions” all types of trade shows, regional (mean =
3.78), nationally (mean = 3.74) and international (mean = 3.82) often take actions
in the sales presentation. In Table 6.41 it can be seen that there were no
significant differences for the type of trade show regarding presentation actions.
Therefore, the null hypothesis Ho11b, is accepted.
Ho11c There exist no significant differences for the type of trade show regarding
approach methods.
Table 6.42 Mean values and ANOVA results for approach methods for the type of trade show
Factor Mean and n values type of trade show ANOVA
Regional Nationally International Total
Mean n Mean n Mean n Mean n
Approach methods 3.25 76 3.31 63 3.23 93 3.26 232 DF = 2 F value = 0.169 P-value = 0.844 Ho Accepted
© University of Pretoria
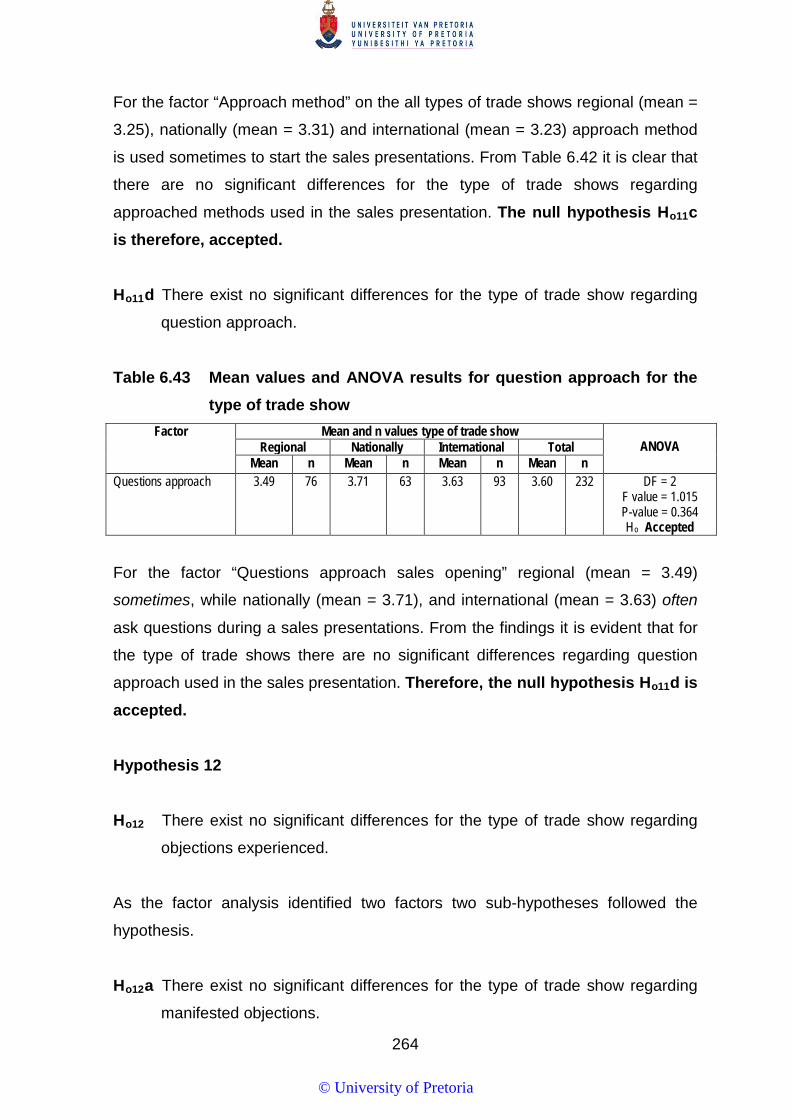
264
For the factor “Approach method” on the all types of trade shows regional (mean =
3.25), nationally (mean = 3.31) and international (mean = 3.23) approach method
is used sometimes to start the sales presentations. From Table 6.42 it is clear that
there are no significant differences for the type of trade shows regarding
approached methods used in the sales presentation. The null hypothesis Ho11c is therefore, accepted. Ho11d There exist no significant differences for the type of trade show regarding
question approach.
Table 6.43 Mean values and ANOVA results for question approach for the type of trade show
Factor Mean and n values type of trade show ANOVA Regional Nationally International Total
Mean n Mean n Mean n Mean n Questions approach 3.49 76 3.71 63 3.63 93 3.60 232 DF = 2
F value = 1.015 P-value = 0.364 Ho Accepted
For the factor “Questions approach sales opening” regional (mean = 3.49)
sometimes, while nationally (mean = 3.71), and international (mean = 3.63) often
ask questions during a sales presentations. From the findings it is evident that for
the type of trade shows there are no significant differences regarding question
approach used in the sales presentation. Therefore, the null hypothesis Ho11d is accepted.
Hypothesis 12 Ho12 There exist no significant differences for the type of trade show regarding
objections experienced.
As the factor analysis identified two factors two sub-hypotheses followed the
hypothesis.
Ho12a There exist no significant differences for the type of trade show regarding
manifested objections.
© University of Pretoria

265
Table 6.44 Mean values and ANOVA results for manifested objections for the type of trade show
Factor Mean and n values type of trade show ANOVA Regional Nationally International Total
Mean n Mean n Mean n Mean n Manifested objections 2.66 76 2.75 63 2.81 93 2.75 232 DF = 2
F value = 0.763 P-value = 0.467 Ho Accepted
For the factor “Manifested objections” all types of trade shows regional (mean =
2.66), nationally (mean = 2.75) and international (mean = 2.81) rarely experience
different types of objections during the sales presentation. From Table 6.44 it is
evident that there are no significant differences for the type of trade show
regarding manifested objections. The null hypothesis Ho12a is therefore accepted.
Ho12b There exist no significant differences for the type of trade show regarding
latent objections.
Table 6.45 Mean values and ANOVA results for latent objections for the type of trade show
Factor Mean and n values type of trade show ANOVA Regional Nationally International Total
Mean n Mean N Mean n Mean n Latent objection 3.21 76 3.06 63 3.09 93 3.12 232 DF = 2
F value = 0.761 P-value = 0.469 Ho Accepted
For the factor “Latent objections”, regional (mean = 3.21) sometimes, while
nationally (mean = 3.06) and international (mean = 3.09) rarely to sometimes
experience latent objections during the sales presentation at the exhibit stand. It is
evident in Table 6.45 that there are no significant differences for the type of trade
show regarding latent objection. Therefore, the null hypothesis Ho12b is accepted.
© University of Pretoria
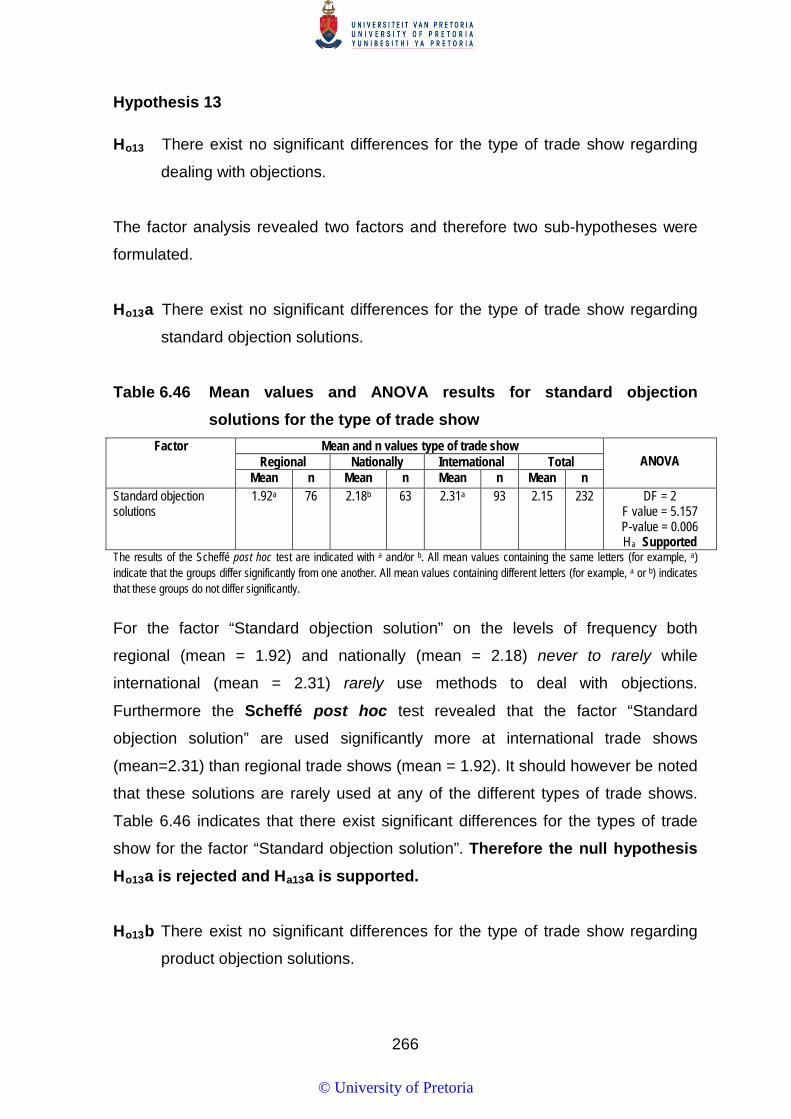
266
Hypothesis 13 Ho13 There exist no significant differences for the type of trade show regarding
dealing with objections.
The factor analysis revealed two factors and therefore two sub-hypotheses were
formulated.
Ho13a There exist no significant differences for the type of trade show regarding
standard objection solutions.
Table 6.46 Mean values and ANOVA results for standard objection solutions for the type of trade show
Factor Mean and n values type of trade show ANOVA Regional Nationally International Total
Mean n Mean n Mean n Mean n Standard objection solutions
1.92a 76 2.18b 63 2.31a 93 2.15 232 DF = 2 F value = 5.157 P-value = 0.006 Ha Supported
The results of the Scheffé post hoc test are indicated with a and/or b. All mean values containing the same letters (for example, a) indicate that the groups differ significantly from one another. All mean values containing different letters (for example, a or b) indicates that these groups do not differ significantly. For the factor “Standard objection solution” on the levels of frequency both
regional (mean = 1.92) and nationally (mean = 2.18) never to rarely while
international (mean = 2.31) rarely use methods to deal with objections.
Furthermore the Scheffé post hoc test revealed that the factor “Standard
objection solution” are used significantly more at international trade shows
(mean=2.31) than regional trade shows (mean = 1.92). It should however be noted
that these solutions are rarely used at any of the different types of trade shows.
Table 6.46 indicates that there exist significant differences for the types of trade
show for the factor “Standard objection solution”. Therefore the null hypothesis Ho13a is rejected and Ha13a is supported. Ho13b There exist no significant differences for the type of trade show regarding
product objection solutions.
© University of Pretoria
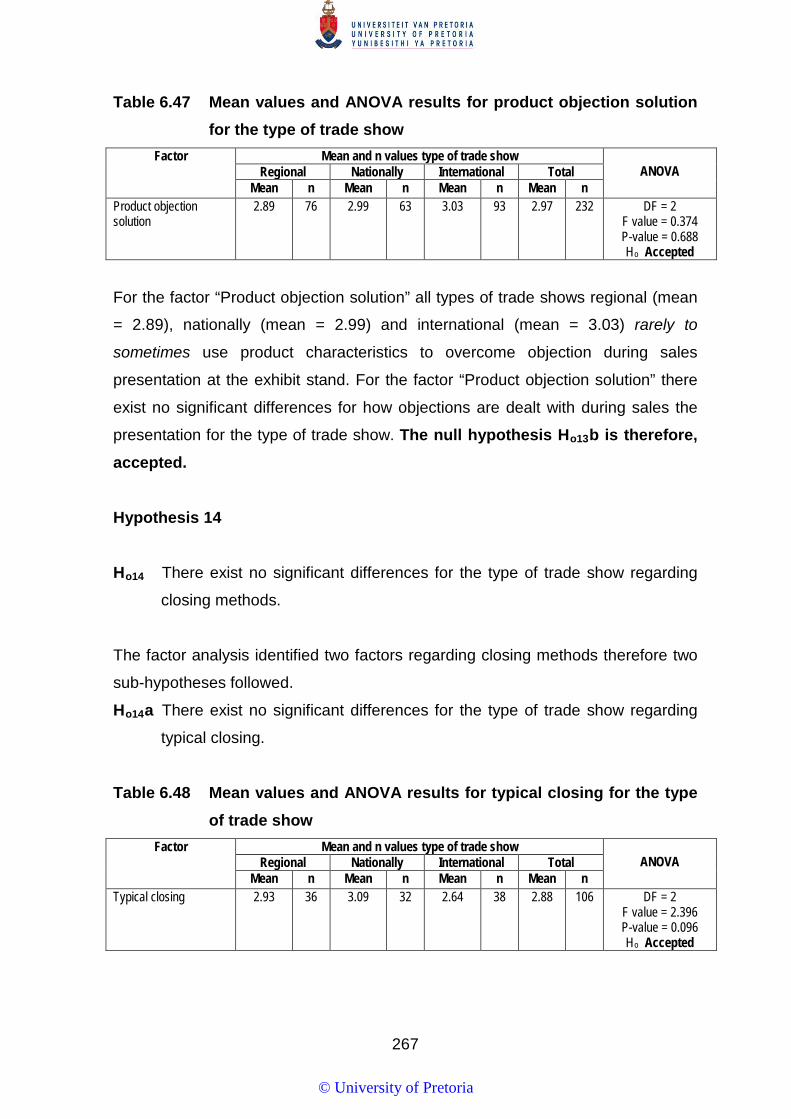
267
Table 6.47 Mean values and ANOVA results for product objection solution for the type of trade show
Factor Mean and n values type of trade show ANOVA Regional Nationally International Total
Mean n Mean n Mean n Mean n Product objection solution
2.89 76 2.99 63 3.03 93 2.97 232 DF = 2 F value = 0.374 P-value = 0.688 Ho Accepted
For the factor “Product objection solution” all types of trade shows regional (mean
= 2.89), nationally (mean = 2.99) and international (mean = 3.03) rarely to
sometimes use product characteristics to overcome objection during sales
presentation at the exhibit stand. For the factor “Product objection solution” there
exist no significant differences for how objections are dealt with during sales the
presentation for the type of trade show. The null hypothesis Ho13b is therefore, accepted.
Hypothesis 14
Ho14 There exist no significant differences for the type of trade show regarding
closing methods.
The factor analysis identified two factors regarding closing methods therefore two
sub-hypotheses followed.
Ho14a There exist no significant differences for the type of trade show regarding
typical closing.
Table 6.48 Mean values and ANOVA results for typical closing for the type of trade show
Factor Mean and n values type of trade show ANOVA Regional Nationally International Total
Mean n Mean n Mean n Mean n Typical closing 2.93 36 3.09 32 2.64 38 2.88 106 DF = 2
F value = 2.396 P-value = 0.096 Ho Accepted
© University of Pretoria

268
For the factor “Typical closing” regional (mean = 2.93) and nationally (mean =
3.09) rarely to sometimes, while for international (mean = 2.64) rarely use typical
closing methods during the sales presentation. From Table 6.48 it is evident that
there are no significant differences for the type of trade show regarding the use of
typical closing in the sales presentation. Therefore, the null hypothesis Ho14a is accepted. Ho14b There exist no significant differences for the type of trade show regarding
product closing.
Table 6.49 Mean values and ANOVA results for product closing for the type of trade show
Factor Mean and n values type of trade show ANOVA Regional Nationally International Total
Mean n Mean n Mean n Mean n Product closing 3.72 36 3.67 32 3.64 38 3.68 106 DF = 2
F value = 0.053 P-value = 0.949 Ho Accepted
For the factor “Product closing” all types of trade shows regional (mean = 3.72),
nationally (mean = 3.67) and international (mean = 3.64) sometimes use product
characteristics when closing the sales presentation at trade shows. As indicated in
Table 6.49 the factor “Product closing” used during sales presentation there exist
no significant differences for types of trade shows. The null hypothesis Ho14b is therefore, accepted.
6.6.4 Summary of hypotheses for the type of trade shows role on the sales
process In the table below is a summary for the hypotheses for the objective the type of
trade shows role on sales process. The conclusions and recommendations that
that came from the findings in the table below will be discussed in Chapter 7.
© University of Pretoria
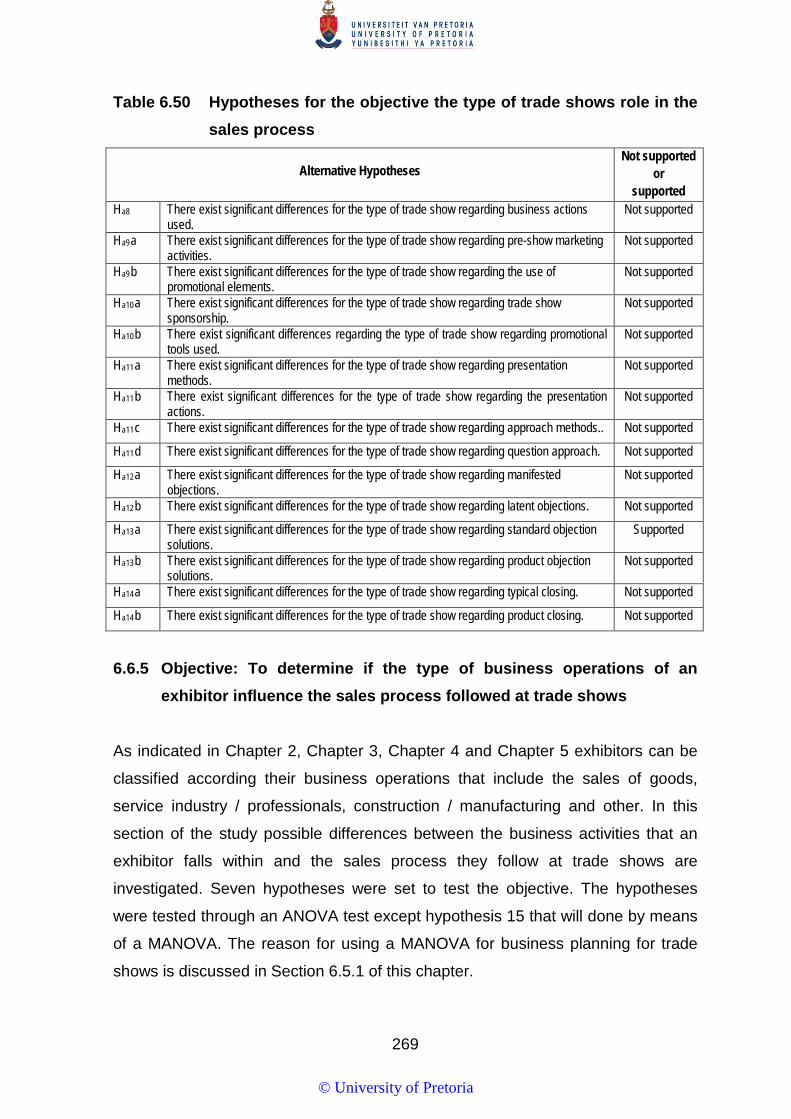
269
Table 6.50 Hypotheses for the objective the type of trade shows role in the sales process
Alternative Hypotheses Not supported
or supported
Ha8 There exist significant differences for the type of trade show regarding business actions used.
Not supported
Ha9a There exist significant differences for the type of trade show regarding pre-show marketing activities.
Not supported
Ha9b There exist significant differences for the type of trade show regarding the use of promotional elements.
Not supported
Ha10a There exist significant differences for the type of trade show regarding trade show sponsorship.
Not supported
Ha10b There exist significant differences regarding the type of trade show regarding promotional tools used.
Not supported
Ha11a There exist significant differences for the type of trade show regarding presentation methods.
Not supported
Ha11b There exist significant differences for the type of trade show regarding the presentation actions.
Not supported
Ha11c There exist significant differences for the type of trade show regarding approach methods.. Not supported
Ha11d There exist significant differences for the type of trade show regarding question approach. Not supported
Ha12a There exist significant differences for the type of trade show regarding manifested objections.
Not supported
Ha12b There exist significant differences for the type of trade show regarding latent objections. Not supported
Ha13a There exist significant differences for the type of trade show regarding standard objection solutions.
Supported
Ha13b There exist significant differences for the type of trade show regarding product objection solutions.
Not supported
Ha14a There exist significant differences for the type of trade show regarding typical closing. Not supported
Ha14b There exist significant differences for the type of trade show regarding product closing. Not supported
6.6.5 Objective: To determine if the type of business operations of an
exhibitor influence the sales process followed at trade shows
As indicated in Chapter 2, Chapter 3, Chapter 4 and Chapter 5 exhibitors can be
classified according their business operations that include the sales of goods,
service industry / professionals, construction / manufacturing and other. In this
section of the study possible differences between the business activities that an
exhibitor falls within and the sales process they follow at trade shows are
investigated. Seven hypotheses were set to test the objective. The hypotheses
were tested through an ANOVA test except hypothesis 15 that will done by means
of a MANOVA. The reason for using a MANOVA for business planning for trade
shows is discussed in Section 6.5.1 of this chapter.
© University of Pretoria
270
Hypothesis 15
Ho15 There is no significant differences for business operations of an exhibitor
regarding business actions used.
As indicated MANOVA testing assess the difference between groups collectively
rather than individually and was used to test hypothesis 8. The researcher relied
on a 95 % level of confidence, and a subsequent significance level of 5% (p-value
≤ 0.05) to interpret the results of the hypothesis testing. Preliminary assumptions
testing was conducted to check for normality, linearity, univariate and multivariate
outliners, and homogeneity of variance and no serious violations were noted.
The Wilks’Lambda value indicates that there is no significant differences between
the different business activities regarding business actions used
F(110.100)=1.110, p=0.217; Wilks’Lambda=0.570; partial Eta Squared=0.106.
The null hypothesis Ho15 was accepted as there is no support that there is a
significant difference between the business operations of exhibitors regarding
business actions used.
Hypothesis 16
Ho16 There is no significant differences for business operations of an exhibitor
regarding pre-show marketing activities.
As two factors were identified by the factor analysis therefore two sub-hypotheses
were formulated for Hypothesis 16.
Ho16a There is no significant differences for business operations of an exhibitor
regarding direct communication used as a pre-show marketing activity.
© University of Pretoria
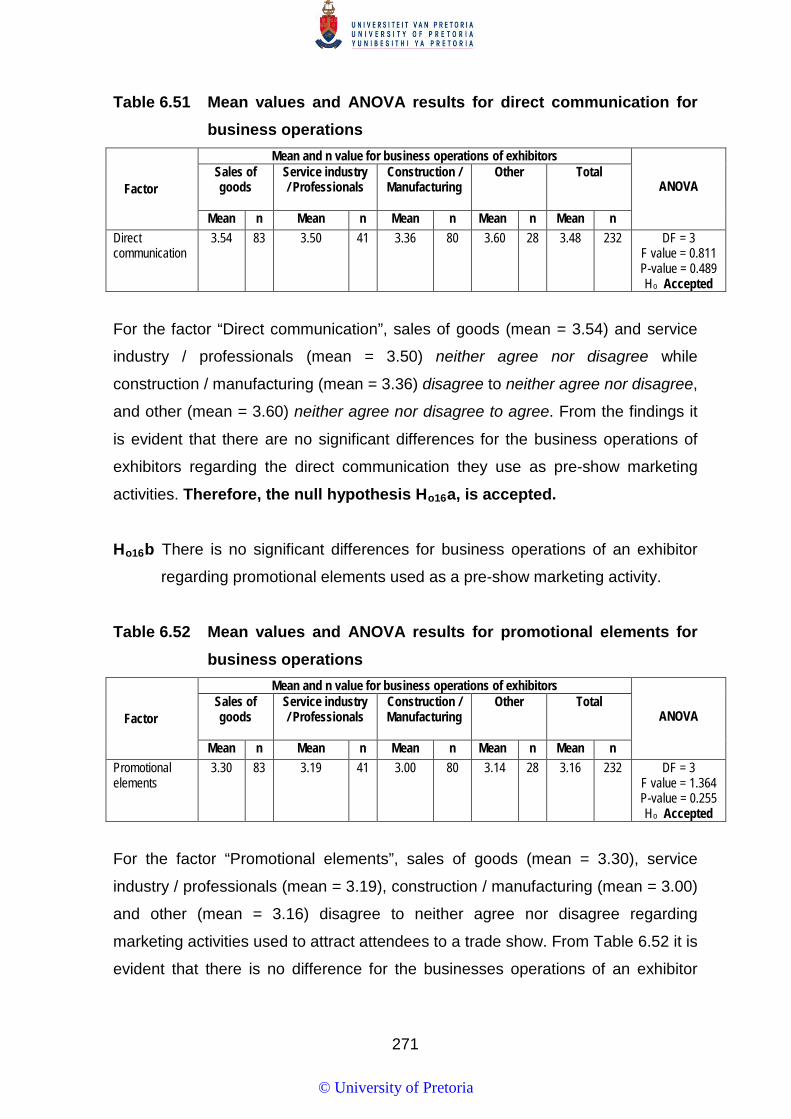
271
Table 6.51 Mean values and ANOVA results for direct communication for business operations
Factor
Mean and n value for business operations of exhibitors
ANOVA Sales of goods
Service industry / Professionals
Construction / Manufacturing
Other Total
Mean n Mean n Mean n Mean n Mean n Direct communication
3.54 83 3.50 41 3.36 80 3.60 28 3.48 232 DF = 3 F value = 0.811 P-value = 0.489 Ho Accepted
For the factor “Direct communication”, sales of goods (mean = 3.54) and service
industry / professionals (mean = 3.50) neither agree nor disagree while
construction / manufacturing (mean = 3.36) disagree to neither agree nor disagree,
and other (mean = 3.60) neither agree nor disagree to agree. From the findings it
is evident that there are no significant differences for the business operations of
exhibitors regarding the direct communication they use as pre-show marketing
activities. Therefore, the null hypothesis Ho16a, is accepted.
Ho16b There is no significant differences for business operations of an exhibitor
regarding promotional elements used as a pre-show marketing activity.
Table 6.52 Mean values and ANOVA results for promotional elements for business operations
Factor
Mean and n value for business operations of exhibitors
ANOVA Sales of goods
Service industry / Professionals
Construction / Manufacturing
Other Total
Mean n Mean n Mean n Mean n Mean n Promotional elements
3.30 83 3.19 41 3.00 80 3.14 28 3.16 232 DF = 3 F value = 1.364 P-value = 0.255 Ho Accepted
For the factor “Promotional elements”, sales of goods (mean = 3.30), service
industry / professionals (mean = 3.19), construction / manufacturing (mean = 3.00)
and other (mean = 3.16) disagree to neither agree nor disagree regarding
marketing activities used to attract attendees to a trade show. From Table 6.52 it is
evident that there is no difference for the businesses operations of an exhibitor
© University of Pretoria
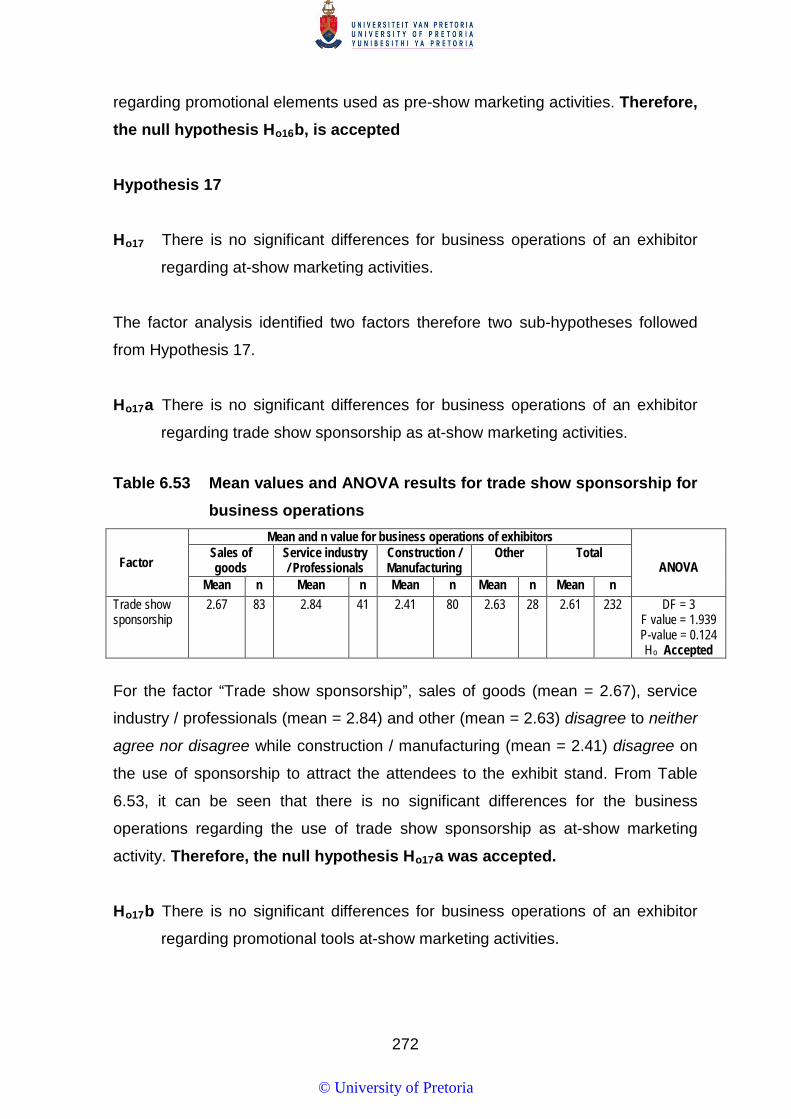
272
regarding promotional elements used as pre-show marketing activities. Therefore, the null hypothesis Ho16b, is accepted
Hypothesis 17
Ho17 There is no significant differences for business operations of an exhibitor
regarding at-show marketing activities.
The factor analysis identified two factors therefore two sub-hypotheses followed
from Hypothesis 17.
Ho17a There is no significant differences for business operations of an exhibitor
regarding trade show sponsorship as at-show marketing activities.
Table 6.53 Mean values and ANOVA results for trade show sponsorship for business operations
Factor
Mean and n value for business operations of exhibitors
ANOVA Sales of goods
Service industry / Professionals
Construction / Manufacturing
Other Total
Mean n Mean n Mean n Mean n Mean n Trade show sponsorship
2.67 83 2.84 41 2.41 80 2.63 28 2.61 232 DF = 3 F value = 1.939 P-value = 0.124 Ho Accepted
For the factor “Trade show sponsorship”, sales of goods (mean = 2.67), service
industry / professionals (mean = 2.84) and other (mean = 2.63) disagree to neither
agree nor disagree while construction / manufacturing (mean = 2.41) disagree on
the use of sponsorship to attract the attendees to the exhibit stand. From Table
6.53, it can be seen that there is no significant differences for the business
operations regarding the use of trade show sponsorship as at-show marketing
activity. Therefore, the null hypothesis Ho17a was accepted. Ho17b There is no significant differences for business operations of an exhibitor
regarding promotional tools at-show marketing activities.
© University of Pretoria
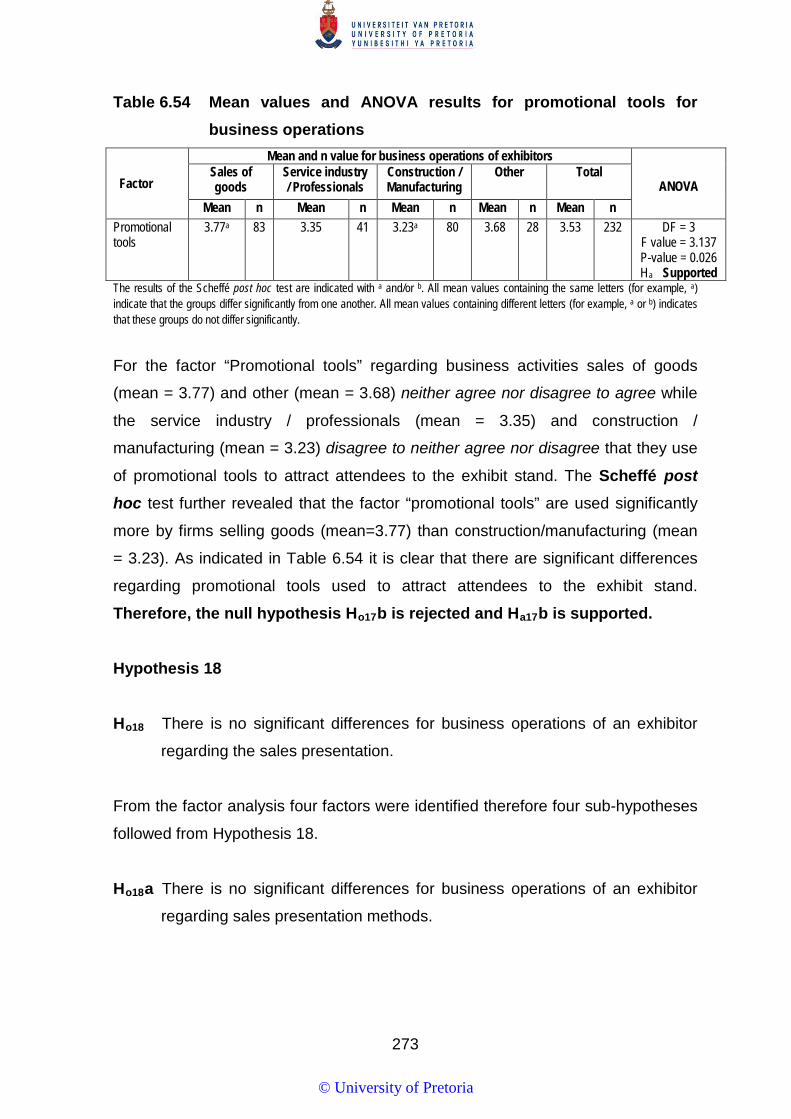
273
Table 6.54 Mean values and ANOVA results for promotional tools for business operations
Factor
Mean and n value for business operations of exhibitors
ANOVA Sales of goods
Service industry / Professionals
Construction / Manufacturing
Other Total
Mean n Mean n Mean n Mean n Mean n Promotional tools
3.77a 83 3.35 41 3.23a 80 3.68 28 3.53 232 DF = 3 F value = 3.137 P-value = 0.026 Ha Supported
The results of the Scheffé post hoc test are indicated with a and/or b. All mean values containing the same letters (for example, a) indicate that the groups differ significantly from one another. All mean values containing different letters (for example, a or b) indicates that these groups do not differ significantly.
For the factor “Promotional tools” regarding business activities sales of goods
(mean = 3.77) and other (mean = 3.68) neither agree nor disagree to agree while
the service industry / professionals (mean = 3.35) and construction /
manufacturing (mean = 3.23) disagree to neither agree nor disagree that they use
of promotional tools to attract attendees to the exhibit stand. The Scheffé post hoc test further revealed that the factor “promotional tools” are used significantly
more by firms selling goods (mean=3.77) than construction/manufacturing (mean
= 3.23). As indicated in Table 6.54 it is clear that there are significant differences
regarding promotional tools used to attract attendees to the exhibit stand.
Therefore, the null hypothesis Ho17b is rejected and Ha17b is supported.
Hypothesis 18
Ho18 There is no significant differences for business operations of an exhibitor
regarding the sales presentation.
From the factor analysis four factors were identified therefore four sub-hypotheses
followed from Hypothesis 18.
Ho18a There is no significant differences for business operations of an exhibitor
regarding sales presentation methods.
© University of Pretoria

274
Table 6.55 Mean values and ANOVA results for sales presentation methods for business operations
Factor
Mean and n value for business operations of exhibitors
ANOVA Sales of goods
Service industry / Professionals
Construction / Manufacturing
Other Total
Mean n Mean n Mean n Mean n Mean n Presentation methods
2.98 83 3.18 41 2.78 80 2.90 28 2.94 232 DF = 3 F value = 1.718 P-value = 0.164 Ho Accepted
For the factor “Presentation methods”, goods (mean = 2.98), service industry /
professionals (mean = 3.18), construction / manufacturing (mean = 2.78) and other
(mean = 2.90) rarely to sometimes make use of presentation methods. As
indicated in Table 6.55 there is no significant differences for the business
operations regarding the sales presentation methods used. Therefore, the null hypothesis Ho18a is accepted
Ho18b There is no significant differences for business operations of an exhibitor
regarding presentation activities.
Table 6.56 Mean values and ANOVA results for presentation activities for
business operations
Factor
Mean and n value for business operations of exhibitors
ANOVA Sales of goods
Service industry / Professionals
Construction / Manufacturing
Other Total
Mean n Mean n Mean n Mean n Mean n Presentation activities
3.90 83 3.76 41 3.68 80 3.75 28 3.78 232 DF = 3 F value = 1.143 P-value = 0.333 Ho Accepted
For the factor “Presentation activities”, sales of goods (mean = 3.90), service
industry / professionals (mean = 3.76), construction / manufacturing (mean = 3.68)
and other (mean = 3.75) sometimes too often make use of specific actions during
the presentation. From the findings it is evident that for business operations there
are no significant differences regarding presentation activities. Therefore, the null hypothesis Ho18b is accepted.
© University of Pretoria
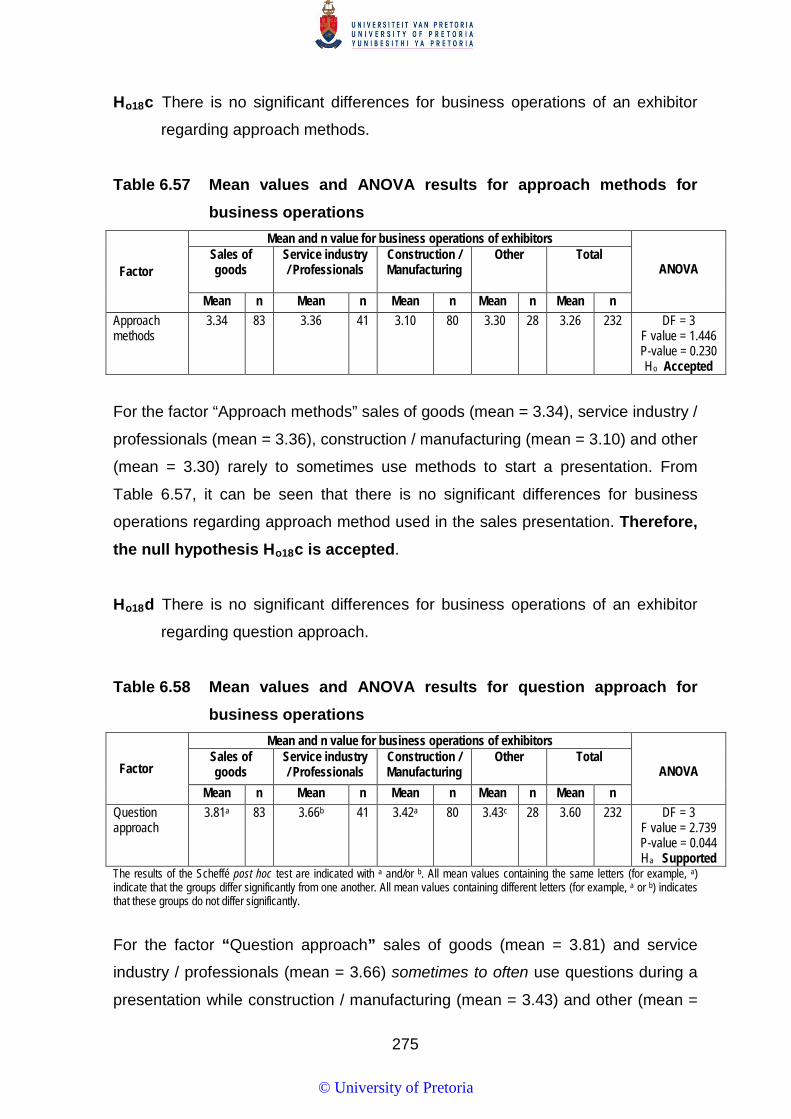
275
Ho18c There is no significant differences for business operations of an exhibitor
regarding approach methods.
Table 6.57 Mean values and ANOVA results for approach methods for business operations
Factor
Mean and n value for business operations of exhibitors
ANOVA Sales of goods
Service industry / Professionals
Construction / Manufacturing
Other Total
Mean n Mean n Mean n Mean n Mean n Approach methods
3.34 83 3.36 41 3.10 80 3.30 28 3.26 232 DF = 3 F value = 1.446 P-value = 0.230 Ho Accepted
For the factor “Approach methods” sales of goods (mean = 3.34), service industry /
professionals (mean = 3.36), construction / manufacturing (mean = 3.10) and other
(mean = 3.30) rarely to sometimes use methods to start a presentation. From
Table 6.57, it can be seen that there is no significant differences for business
operations regarding approach method used in the sales presentation. Therefore, the null hypothesis Ho18c is accepted.
Ho18d There is no significant differences for business operations of an exhibitor
regarding question approach.
Table 6.58 Mean values and ANOVA results for question approach for business operations
Factor
Mean and n value for business operations of exhibitors
ANOVA Sales of goods
Service industry / Professionals
Construction / Manufacturing
Other Total
Mean n Mean n Mean n Mean n Mean n Question approach
3.81a 83 3.66b 41 3.42a 80 3.43c 28 3.60 232 DF = 3 F value = 2.739 P-value = 0.044 Ha Supported
The results of the Scheffé post hoc test are indicated with a and/or b. All mean values containing the same letters (for example, a) indicate that the groups differ significantly from one another. All mean values containing different letters (for example, a or b) indicates that these groups do not differ significantly.
For the factor “Question approach” sales of goods (mean = 3.81) and service
industry / professionals (mean = 3.66) sometimes to often use questions during a
presentation while construction / manufacturing (mean = 3.43) and other (mean =
© University of Pretoria
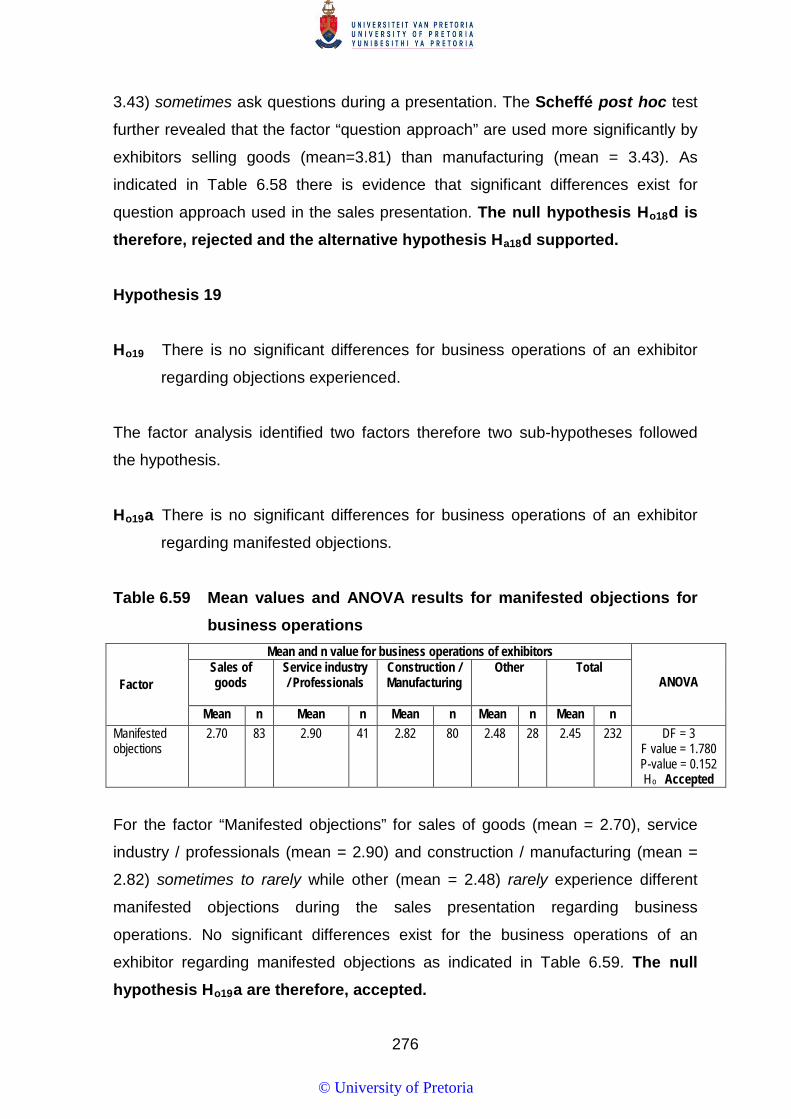
276
3.43) sometimes ask questions during a presentation. The Scheffé post hoc test
further revealed that the factor “question approach” are used more significantly by
exhibitors selling goods (mean=3.81) than manufacturing (mean = 3.43). As
indicated in Table 6.58 there is evidence that significant differences exist for
question approach used in the sales presentation. The null hypothesis Ho18d is therefore, rejected and the alternative hypothesis Ha18d supported.
Hypothesis 19
Ho19 There is no significant differences for business operations of an exhibitor
regarding objections experienced.
The factor analysis identified two factors therefore two sub-hypotheses followed
the hypothesis.
Ho19a There is no significant differences for business operations of an exhibitor
regarding manifested objections.
Table 6.59 Mean values and ANOVA results for manifested objections for business operations
Factor
Mean and n value for business operations of exhibitors
ANOVA Sales of goods
Service industry / Professionals
Construction / Manufacturing
Other Total
Mean n Mean n Mean n Mean n Mean n Manifested objections
2.70 83 2.90 41 2.82 80 2.48 28 2.45 232 DF = 3 F value = 1.780 P-value = 0.152 Ho Accepted
For the factor “Manifested objections” for sales of goods (mean = 2.70), service
industry / professionals (mean = 2.90) and construction / manufacturing (mean =
2.82) sometimes to rarely while other (mean = 2.48) rarely experience different
manifested objections during the sales presentation regarding business
operations. No significant differences exist for the business operations of an
exhibitor regarding manifested objections as indicated in Table 6.59. The null hypothesis Ho19a are therefore, accepted.
© University of Pretoria
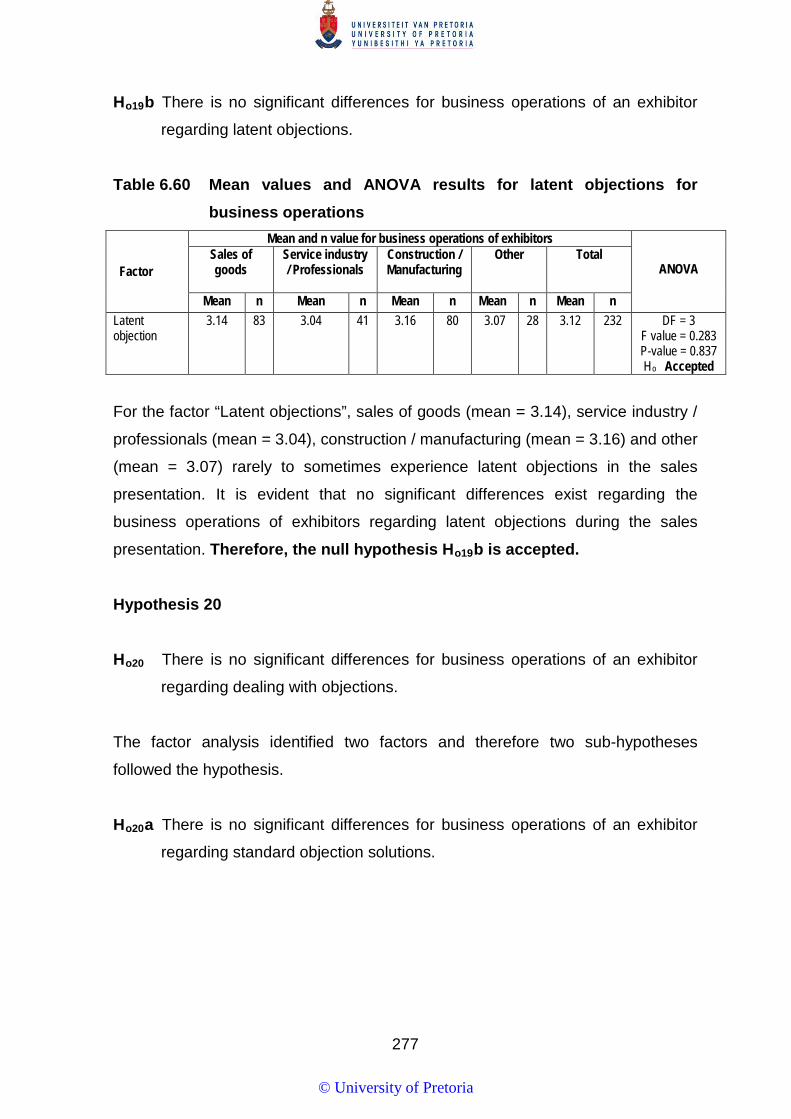
277
Ho19b There is no significant differences for business operations of an exhibitor
regarding latent objections.
Table 6.60 Mean values and ANOVA results for latent objections for business operations
Factor
Mean and n value for business operations of exhibitors
ANOVA Sales of goods
Service industry / Professionals
Construction / Manufacturing
Other Total
Mean n Mean n Mean n Mean n Mean n Latent objection
3.14 83 3.04 41 3.16 80 3.07 28 3.12 232 DF = 3 F value = 0.283 P-value = 0.837 Ho Accepted
For the factor “Latent objections”, sales of goods (mean = 3.14), service industry /
professionals (mean = 3.04), construction / manufacturing (mean = 3.16) and other
(mean = 3.07) rarely to sometimes experience latent objections in the sales
presentation. It is evident that no significant differences exist regarding the
business operations of exhibitors regarding latent objections during the sales
presentation. Therefore, the null hypothesis Ho19b is accepted. Hypothesis 20 Ho20 There is no significant differences for business operations of an exhibitor
regarding dealing with objections.
The factor analysis identified two factors and therefore two sub-hypotheses
followed the hypothesis.
Ho20a There is no significant differences for business operations of an exhibitor
regarding standard objection solutions.
© University of Pretoria
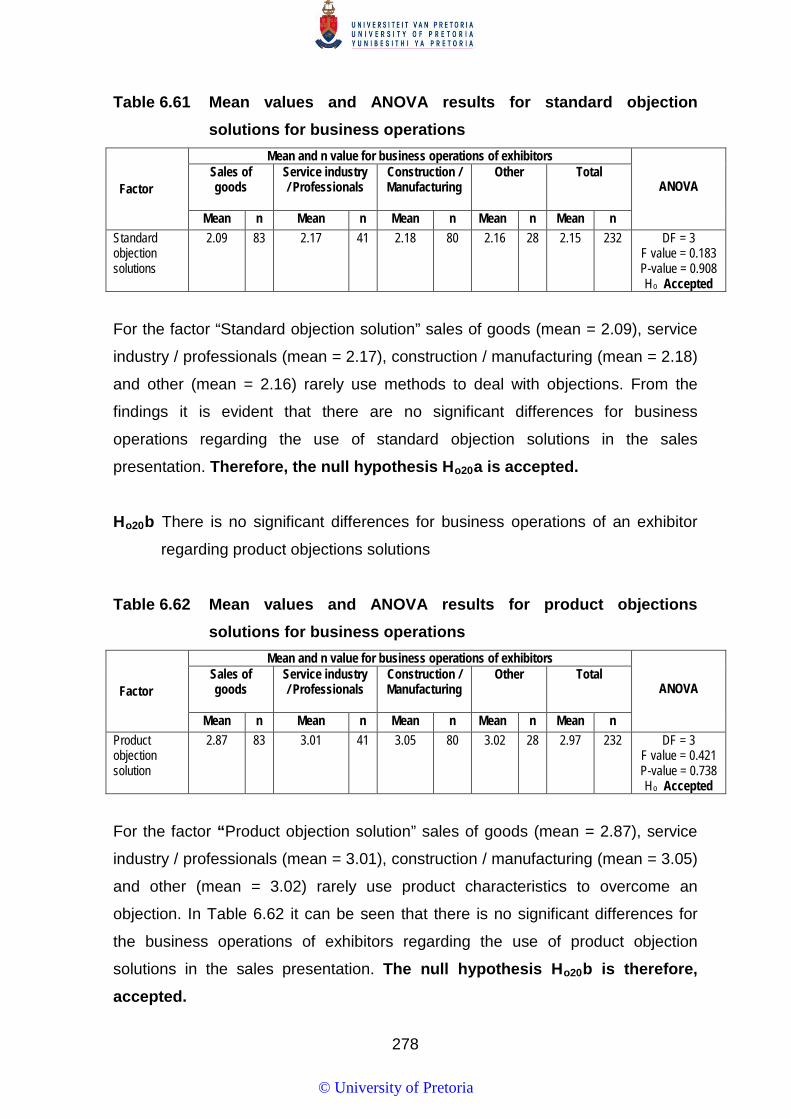
278
Table 6.61 Mean values and ANOVA results for standard objection solutions for business operations
Factor
Mean and n value for business operations of exhibitors
ANOVA Sales of goods
Service industry / Professionals
Construction / Manufacturing
Other Total
Mean n Mean n Mean n Mean n Mean n Standard objection solutions
2.09 83 2.17 41 2.18 80 2.16 28 2.15 232 DF = 3 F value = 0.183 P-value = 0.908 Ho Accepted
For the factor “Standard objection solution” sales of goods (mean = 2.09), service
industry / professionals (mean = 2.17), construction / manufacturing (mean = 2.18)
and other (mean = 2.16) rarely use methods to deal with objections. From the
findings it is evident that there are no significant differences for business
operations regarding the use of standard objection solutions in the sales
presentation. Therefore, the null hypothesis Ho20a is accepted.
Ho20b There is no significant differences for business operations of an exhibitor
regarding product objections solutions
Table 6.62 Mean values and ANOVA results for product objections solutions for business operations
Factor
Mean and n value for business operations of exhibitors
ANOVA Sales of goods
Service industry / Professionals
Construction / Manufacturing
Other Total
Mean n Mean n Mean n Mean n Mean n Product objection solution
2.87 83 3.01 41 3.05 80 3.02 28 2.97 232 DF = 3 F value = 0.421 P-value = 0.738 Ho Accepted
For the factor “Product objection solution” sales of goods (mean = 2.87), service
industry / professionals (mean = 3.01), construction / manufacturing (mean = 3.05)
and other (mean = 3.02) rarely use product characteristics to overcome an
objection. In Table 6.62 it can be seen that there is no significant differences for
the business operations of exhibitors regarding the use of product objection
solutions in the sales presentation. The null hypothesis Ho20b is therefore, accepted.
© University of Pretoria
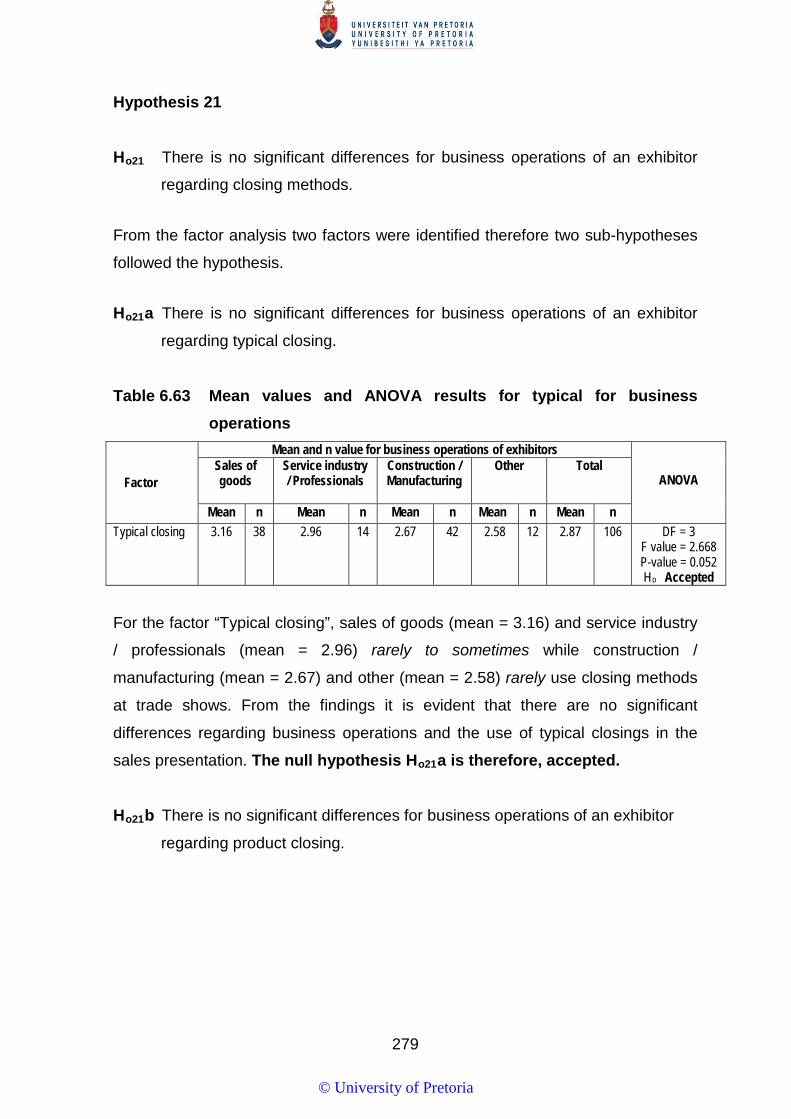
279
Hypothesis 21 Ho21 There is no significant differences for business operations of an exhibitor
regarding closing methods.
From the factor analysis two factors were identified therefore two sub-hypotheses
followed the hypothesis.
Ho21a There is no significant differences for business operations of an exhibitor
regarding typical closing.
Table 6.63 Mean values and ANOVA results for typical for business operations
Factor
Mean and n value for business operations of exhibitors
ANOVA Sales of goods
Service industry / Professionals
Construction / Manufacturing
Other Total
Mean n Mean n Mean n Mean n Mean n Typical closing 3.16 38 2.96 14 2.67 42 2.58 12 2.87 106 DF = 3
F value = 2.668 P-value = 0.052 Ho Accepted
For the factor “Typical closing”, sales of goods (mean = 3.16) and service industry
/ professionals (mean = 2.96) rarely to sometimes while construction /
manufacturing (mean = 2.67) and other (mean = 2.58) rarely use closing methods
at trade shows. From the findings it is evident that there are no significant
differences regarding business operations and the use of typical closings in the
sales presentation. The null hypothesis Ho21a is therefore, accepted.
Ho21b There is no significant differences for business operations of an exhibitor
regarding product closing.
© University of Pretoria

280
Table 6.64 Mean values and ANOVA results for product closing for business operations
Factor
Mean and n value for business operations of exhibitors
ANOVA Sales of goods
Service industry / Professionals
Construction / Manufacturing
Other Total
Mean n Mean n Mean n Mean n Mean n Product closing 3.75 38 3.68 14 3.68 42 3.46 12 3.68 106 DF = 3
F value = 0.239 P-value = 0.869 Ho Accepted
For the factor “Product closing”, business operations sales of goods (mean = 3.16)
and service industry / professionals (mean = 2.96) rarely to sometimes while
construction / manufacturing (mean = 2.67) and other (mean = 2.58) rarely use
closing methods at trade shows. From the findings it is evident that there is no
significant differences for the business operations of exhibitors regarding the use
of product closing used in the sales presentation. Therefore, the null hypothesis Ho21b is accepted.
6.6.6 Summary for hypotheses business operations of an exhibitor role on the sales process for trade shows
In the Table 6.55 is a summary for the hypotheses for the objective business
operations of an exhibitor role on the sales process of trade shows. The findings of
this section as indicated in the table will be used to form conclusions and
recommendations in Chapter 7.
Table 6.65 Hypotheses for the objective business activities of an exhibitor
role on the sales process
Alternative hypotheses Not supported
or supported
Ha15 There is significant differences for business operations of an exhibitor regarding business actions used.
Not Supported
Ha16a There is significant differences for business operations of an exhibitor regarding direct communication used as a pre-show marketing activity.
Not Supported
Ha16b There is significant differences for business operations of an exhibitor regarding promotional elements used as a pre-show marketing activity.
Not Supported
Ha17a There is significant differences for business operations of an exhibitor regarding trade show sponsorship as at-show marketing activities.
Not Supported
© University of Pretoria

281
Table 6.65 cont.…
Alternative hypotheses Not supported
or supported
Ha17b There is significant differences for business operations of an exhibitor regarding promotional tools at-show marketing activities.
Supported
Ha18a There is significant differences for business operations of an exhibitor regarding sales presentation methods.
Not Supported
Ha18b There is significant differences for business operations of an exhibitor regarding presentation activities.
Not Supported
Ha18c There is significant differences for business operations of an exhibitor regarding approach methods.
Not Supported
Ha18d There is significant differences for business operations of an exhibitor regarding question approach.
Supported
Ha19a There is significant differences for business operations of an exhibitor regarding manifested objections.
Not Supported
Ha19b There is significant differences for business operations of an exhibitor regarding latent objections.
Not Supported
Ha20a There is significant differences for business operations of an exhibitor regarding standard objection solutions.
Not Supported
Ha20b There is significant differences for business operations of an exhibitor regarding product objections solutions.
Not Supported
Ha21a There is significant differences for business operations of an exhibitor regarding typical closing.
Not Supported
Ha21b There is significant differences for business operations of an exhibitor regarding product closing.
Not Supported
6.7 SUMMARY
This chapter reported the findings of the primary data gathered from the
respondents. In the first two sections of this chapter descriptive statics was used to
provide a profile of the respondents and the business that they work for. Secondly,
a factor analysis was done to find the underlying factors for each section of the
questionnaire that was constructed through the literature review.
After the factor analysis t-tests, ANOVAS and MANOVAS were done to address
the formulated objectives and hypotheses. Each section that dealt with an
objective concluded with a summary of the outcome of each hypothesis. The
results from this chapter may be of importance to exhibitors in their planning of
their pre and at show sales strategies. Chapter 6 can also provide trade show
organisers with sales guidelines that can be provided to exhibitors. In the Chapter
7 conclusions and recommendations based on the main findings of this chapter
will be given.
© University of Pretoria
282
CHAPTER 7
CONCLUSIONS, IMPLICATIONS AND RECOMMENDATIONS FOR FUTURE RESEARCH
7.1 INTRODUCTION
In Chapter 5, a layout of the methodology followed in this study was provided; and
in Chapter 6, the results were discussed. As indicated in the previous chapters of
this study, there is limited research in the field of the sales process, and more
specifically at trade shows. Therefore, this study was explorative in nature. In this
chapter, the main findings from Chapter 6 will be used to draw the various
conclusions. The implications of these conclusions will be discussed; and some
recommendations will be made. The limitations of the study, and some possible
future research areas, are also looked at – in addition to the academic
contribution. The chapter ends with an evaluation of the research results obtained
for each of the objectives formulated in Chapter 1.
7.2 IMPORTANCE OF THE STUDY
Although a number of books exist on personal selling (vide section 4.2) and the
sales process (vide. Section 46), there is a limited amount of academic research
(vide. Section 5.4) that has been done on this topic. It was also indicated in
Chapter 3 of this study that trade shows are also under-researched. This study is
explorative in nature; and it aims to contribute to the field of the sales process at
trade shows. In previous chapters, the important role that trade shows – and in
particular that sales play in business-to-business (B2B) marketing – was
highlighted.
This study could be a useful guide for research into other fields, such as business
personal selling; B2B IMC; overall business-marketing strategies and business
staff training – where sales play an important role in the success of business
marketing.
© University of Pretoria
283
Businesses could make use of the data gathered to evaluate each stage of the
sales process, and to provide them with a better understanding of the role of trade
shows and sales in their marketing mix.
In the first part of this chapter, the findings regarding business actions for trade
shows will be discussed. Secondly, the factors that make up the different stages of
the sales process will be looked at. Thereafter, there will be a discussion on sales
versus non-sales persons, types of trade show, and the role of business
operations in the sales process for trade shows.
7.3 MAIN FINDINGS RELATING TO BUSINESS ACTIONS FOR TRADE SHOWS
As mentioned in Chapter 3 of this study, a number of business actions are part of
a trade show. Although a number of the business actions relate to sales, they do
not make up part of the sales process per se. Business actions will, therefore, be
discussed separately from the other sections; although they were included in
Chapter 6 as part of the sales process. This was done, in order to maintain the
continuity of the findings – and also to provide a better overview of the business
actions for trade shows.
These business actions consist of both sales and non-sales actions of an exhibitor
who exhibits at a trade show.
7.3.1 Conclusions and implications of the main findings of the business actions for trade shows
The section on business actions for trade show dealt with a number of aspects
that included elements, such as: marketing; the setting of objectives; evaluation
and planning; staff at trade shows; the introduction of products, the measurement
of success, and more of such issues (vide. Section 3.6.1).
Trade shows as indicated in Figure 6.8 assist in image-building and exhibitors
agreed that the business image was enhanced through trade shows (m=4.08).
© University of Pretoria
284
There were also sales-related activities, such as acquiring sales (m=3.86) at the
trade show. Furthermore, information-gathering can be done by using trade shows
as a place to provide the businesses with information on their industry (m=3.62);
and they can also be used to acquire information on competitors (m=3.07).
The afore-mentioned information-gathering done demonstrates that trades shows
can be seen as a strategic marketing tool (Tafesse & Korneliussen, 2011:47).
Trade shows also assist in relationship-improvement by developing new customer
contacts (m=4.19) – and also to maintain contact with the existing customers
(m=3.66). Exhibitors can also make use of trade shows to motivate their staff
(m=3.09); although this is not as important as creating new contacts or image-
building (vide. Section 3.6.1.1). This is in line with other research (as indicated in
Chapter 3) that one of the selling motives for exhibiting was to enhance or
maintain the businesses profile (Hansen, 1996:47).
Another activity is that of the non-selling actions, as stated in Chapter 3. This
includes aspects, such as the introduction of new products. In this study’s findings,
it was evident that the exhibitors agree that the introduction of new products (m
=3.72) and the testing of new product ideas (m=3.25) can also be done at trade
shows (vide. Section 3.6.1.1).
In Chapter 3, it was suggested that exhibitors take three actions to be successful
at trade shows (vide Section 3.5.3). From the findings in this study, it was evident
that exhibitors agreed that they implement these three actions. Firstly, it was
indicated that they plan to exhibit to a specific target customer (m=3.69). Secondly,
they agree that trade shows assist with other marketing communication (m =3.82);
and lastly, it was agreed that trade shows are used to acquire new customers
(m=4.19), and that tracking systems are used to determine those who visited the
exhibit stand (m=3.62).
Exhibitors not only have to market the trade show; but they also need to set
objectives, in order to measure their success (Kirchgeorg et al., 2010a:64). In
Chapter 3, it was indicated that objectives are important for measuring success.
From the findings in this study, it was evident that exhibitors agreed that their
© University of Pretoria
285
businesses have both written sales objectives (m=3.41) and written financial
objectives (m=3.25); although these were not considered to be as important as the
promotional objectives (vide. Figure 3.4 & Section 3.6.1.1).
Staff improvement was another factor, in line with other studies, where staff
training is a part of the pre-show activities (Seringhause & Rossen, 2004:156; Lee
& Kim, 2008:786). In this study, it was established that businesses do emphasise
the training of staff (m= 3.83), and of providing them with product material to
prepare themselves for the trade show (m=4.03).
As indicated in Figure 3.3 of this study, at each stage of a trade show, the
exhibitors have specific actions that they need to take. The different business
actions include both sales and non-sales activities that provide exhibitors with
aspects that are important to be successful in exhibiting. By establishing the
importance of these elements, the exhibitors should be able to plan for trade
shows. Through better planning, exhibitors can link their actions to sales and non-
sales outcomes and better satisfy their customers.
The added advantages are that the focus can be placed on those trade-show
actions on which the staff need further training. It should also provide trade-show
organisers with guidelines for their exhibitors when planning to exhibit.
7.3.2 Recommendations on business actions for trade shows
The business actions that take place for trade shows are numerous. It is evident
from the results that trade shows are used for both sales and non-sales activities
by the exhibitors. The statement that loaded the highest mean value for this
section did not focus on direct sales – but rather on building customer contacts. It
was also clear from the findings, that trade shows can be used to maintain contact
with their current customers. Exhibitors need to invest in their staff by making sure
that qualified and trained staff, man the exhibit stand.
Interaction between the attendees and the exhibit staff need to be monitored and
encouraged by exhibition managers. Exhibitors should consider investing in exhibit
© University of Pretoria
286
stands that assist in building relationships, such as creating seating areas and
private discussion rooms, in order to build customer contacts.
From the findings, it was also clear that the exhibiting staff view the building of the
business image as a contribution of trade shows. Another element that goes with
the building of the business image was that trade shows also benefit other
marketing communication functions. Exhibitors need to look at elements, such as
the ‘look and feel’ of the exhibition stand; and they need to make use of high-
quality displays and furniture for the exhibit. Smaller elements, such as staff
clothing and behaviour, need to be kept at a high standard, in order to create a
good image of the exhibitor’s business.
It is suggested that the business should provide all the exhibiting staff with
corporate clothing, so that the same image is projected at the trade show. Trade
shows can also be used for public relations by writing articles for trade journals on
what was achieved at the show.
The findings of this study are in line with those of Pitta et al. (2006:163) and
Hanlon (1982:99). These studies indicate that exhibiting staff need to be well
trained. The statement dealing with providing staff with product material to prepare
them and business briefs, and the training of staff both had high mean values.
Businesses need to consider doing training before the trade show – training that
focuses on those specific products that are to be exhibited at the show. The staff
also need to be shown how demonstrations work, how to deal with attendees that
visit the exhibition stand, and who need to know what the exhibiting objectives are
of the business.
Exhibitors also need to get sales personal and technical persons involved with the
training, in order to assist the exhibiting staff in acquiring the correct information.
An interesting finding was that written promotional objectives had a higher mean
value than written sales and financial objectives. In other studies on the setting of
objectives, it was established that about 70% of exhibitors do not set any
objectives for trade shows (Pitta et al., 2006:159; Stevens, 2005:50). It may be
assumed that sales objectives would be an integral part of the planning process of
© University of Pretoria

287
trade shows. Exhibitors need to establish specific objectives for sales, and more
importantly on how many leads they want to generate from the trade show. This
information needs to then be disseminated to the exhibit staff through training and
manuals, in order to prepare them for the trade show. This is an important aspect;
since the findings also indicate that the success of a trade show is measured by
the number of new prospects gained at the trade show.
Exhibitors should consider the implementation of daily briefings to indicate to the
exhibiting staff whether they are on-track regarding the objectives that were set for
the trade show.
What is concerning is that when looking at the findings, for tracking those
attendees that visited the exhibit stand the mean value was not high. Business
must make use of technology, such as scanners that scan attendees’ visiting
cards to get information on who visited the exhibit stand, so that they can follow-up
after the trade show. Exhibitors can also make use of competitions that motivate
attendees to fill in visitor books, or leave their business cards.
It must, however, be kept in mind that the measurement of success is not just
sales at the trade show, but the conversion that leads into sales after the show
(Herbig et al., 1997:377). Although sales are important, other studies indicate that
to measure a trade show’s success, one should also look at the relationships that
have been established (Geigenmüller, 2010:289). Exhibitors should consider
including other measuring elements in their pre-show activities, in order to include
other aspects, such as relationship-building.
It must, however, be noted that it is difficult to measure non-financial or non-sales
related activities at trade shows. Exhibitors should think about looking at other
aspects, such as the number of attendees at the exhibition stand, or the interaction
with current customers that might not lead to more sales, but could possibly
improve relationships.
It was also found that trade shows provide an exhibitor with a great opportunity to
introduce and test product concepts with the clients. Exhibitors should make use of
© University of Pretoria
288
trade shows for new product testing; since the attendees are frequently from those
industries, where the products would most probably be used. Through the
interaction with the attendees, exhibitors would be able to determine whether their
products are likely to be successful or not.
Many trade shows also allow for discussion sessions, where the exhibitors can
test and discuss new developments from their products. It is suggested that
marketing research be done at the trade shows; since most of the attendees are
from a specific industry and can provide valuable information. Businesses should
make use of trade shows to introduce new products, because of the possible
publicity of opportunities that are available. Trade shows are in the majority of
cases covered by industrial journals and other media outlets that provide a
business with valuable media coverage.
Exhibitors should also consider writing articles for the social media or magazines
in their industry.
The trade show can also be used as a method to gather information on
competitors in the market; and it is, therefore, advisable that staff not only man the
exhibition stand, but also move around the show to gain knowledge.
Businesses that exhibit at trade shows should not only focus on the financial or
sales aspect in measuring their success at trade shows; but they should include
non-financial measuring. In this study, it was indicated that although businesses
make use of other measuring elements; they should also make use of non-
financial aspects to measure their trade shows. Businesses that exhibit should
include other elements, such as relationship-building; since many of the attendees
at a trade show are not there to buy, but merely to gain knowledge of those who
could be their future customers.
With the current customers, trade shows can be a good place to socialise in a
more informal way.
© University of Pretoria

289
The majority of trade shows have coffee areas, as well as luncheons that provide
a place, where customers and exhibitors can talk and further expand their
business relationships. These areas can also be used for publicity and image-
building. Business should consider exhibiting their branding coffee mugs, banners
and other promotional material.
7.4 MAIN FINDINGS RELATING THE SUB-STAGES IN THE STAGES OF THE SALES PROCESS AT TRADE SHOWS
As indicated in Chapter 1 and Chapter 3 of this study trade, shows and sales play
an important part in B2B marketing. All the indications are that the amount of
money spent on trade shows will increase in the next few years (Viviers,
2013:210). For B2B enterprises to remain competitive, they would have to re-
evaluate their participation in trade shows – in order to gain an edge over their
competitors. At trade shows, the exhibitor goes through a number of stages in the
sales process when exhibiting.
The main findings of the Principal axis factor analysis that is an explorative factor
analysis on the sales process provide useful information to assist business in B2B
markets, and in developing strategies for exhibiting at trade shows. Exhibiting
strategies for exhibitors is based on a better understanding of the role of the sales
process at trade shows.
7.4.1 Conclusions and implications of the main findings for the sub-stages in the stages of the sales process at trade shows
The objective of this study was to determine the role of the sales process at trade
shows. Through the literature review in this study, a number of elements were
identified, which together comprise the stages of the sales process at a trade
show, as discussed in Chapter 3 and Chapter 4 of this study. Seven sections were
identified: the first section was general in nature dealing with the business actions
taken regarding trade shows. This section was discussed separate from the
stages; since it consists of sales and non-sales activities.
© University of Pretoria
290
The following six sections dealt with the sub-stages in each of the stages in the
sales process for trade shows. It was, however, not clear what the different sub-
stages are in each of the sections; therefore, a Principal-axis factor analysis with
varimax rotation, which is explorative in nature, was done. For each of the
sections, sub-stages were identified through the factor analysis, as discussed in
Chapter 6.
The first stage dealt with the pre-show marketing activities used to attract
attendees; and here two factors were identified: direct communication and
promotional elements. This is in line with other research, which indicates that
communication is important in the pre-show stage of trade shows (Seringhause &
Rossen, 2004:156). In this study, one of the facets found to be part of pre-show
marketing was direct communication. Exhibitors mostly make use of direct
communication; since they are in direct contact with their clients; and the
attendees invited by them personally (m=3.58) would be more likely to attend a
trade show (Tanner, 2002:236; Kirchgeorg et al., 2010b:683-684).
The other sub-stages at the first stage comprised the promotional elements. This
finding on promotional elements is supported by other research done by Tanner
(2002:231), and Lee and Kim (2008:786). This included a combination of
advertising in trade journals (m=3.13), personal selling, word-of-mouth, or any
other tool, in order to gain attention and create awareness (Pitta et al., 2006:156;
Livera, 2003:4). Other promotional elements included that mass media (m=3.02)
that are being used. This is interesting to see; since it is not associated with B2B
marketing that relies more on direct communication methods.
Two sub-stages were identified for the second stage of at-show marketing
activities. The two factors were trade-show sponsorship and promotional tools.
Sponsorship at trade shows can include refreshment, meals, events, luncheons,
speeches etc. It is, however, interesting to see that exhibitors indicate that they
disagree that they use the sponsorship of social activities (m=2.50) and the co-
sponsorship of coffee courts, luncheons etc. (m=2.28).
© University of Pretoria

291
It is concerning to see that sponsorships are not used; since they could provide
exhibitors with more exposure at a trade show; and this could help with image-
building.
Some of the promotional tools include: brochures; electronic communication; give-
aways; information kits – or a combination of all the different promotional elements
(Summers, 1992:46; Brewer, 1996:39). Promotional elements include the use of
video or computer screens at the exhibit stand (m=3.34). These are positive to
see; since it has been found that these are a good way to attract attendees (Spiro
et al., 2007:66). It was found in other studies that although exhibitors make use of
promotional tools, they are starting to rely more on sponsorship; since it provides
better value for money (Suh, 2003:47-49).
However in this study, there was disagreement on the use of co-sponsorship of
events at trade shows (m=2.28). This provides an interesting perspective on South
African exhibitors, who are not placing the emphasis on sponsorship as part of
their trade show strategies; but their emphasis is rather on the promotional
elements.
The third stage deals with the sales-presentation at trade shows; and here, four
sub-stages were identified, namely: presentation methods; presentation activities;
approach method; and question approach. The sales presentations play an
important role at trade shows; since they provide the exhibitor with the opportunity
to communicate one-on-one with the qualified prospects (Gosztonyi, 1997:13;
Kirchgeorg et al., 2010a:68).
Different presentation methods can be applied by the exhibiting staff to sell their
products to their customers (as indicated in Table 6.11). It seems that most of the
exhibitors’ preferences were to use the formula-selling (m=3.22.) method, followed
by the need-analysis (m=3.13), group presentations (m=2.82); and lastly,
memorised presentation (m=2.58). It is interesting that the memorised method is
not more frequently used; due to the time constraints for interaction; and that it is
easy to train the exhibiting staff in this method.
© University of Pretoria

292
During the sales presentation exhibition, the exhibit staff undertake certain
activities. In Chapter 3, it was pointed out that finding sales leads is one of the
main aims of exhibiting at a trade show. It is a good sign to see that exhibitors in
this study indicated that they keep a record (m=3.97); since this information is
used in the follow-up after a trade show (Pitta et al., 2006:159). Another activity is
that of using demonstrations (m=3.72). This is seen as an integral part of
exhibiting (Brennan et al., 2014:195).
It is also encouraging to see that demonstrations are used as part of the
presentation activities at trade shows – to promote and sell products – since they
improve the interaction between the buyer and the seller (Kirchgeorg et al.,
2005:863).
In approaching the attendees, the exhibiting staff can make use of different
methods. Although different approach methods can be used – starting with a
statement (m=3.30) was the preferred option. Other methods, such as using a
compliment (m= 2.97) or giving an opinion (m=2.92) were not necessarily
preferred by the exhibiting staff. This is most likely due to attendees meeting the
exhibiting staff for the first time at the trade show; and because there is not yet any
personal connection.
Another useful approach is to make use of questions. Questions can be used to
start the presentation (m=3.57), or to help in finding out what the attendees needs
are (m=3.64). It is encouraging to see that questions are used; since they could
guide the exhibiting staff on what the next step should be in the sales presentation
– or whether there are any objections that still need to be answered.
The fourth stage dealt with the objections experienced during the sales
presentation; and two sub-stages were identified: manifested objections; and
latent objections. A number of the objections are experienced; since many
attendees would not want to commit; while they are at the trade show (Jones et
al., 2005:297). Unfortunately, the actions of the exhibiting staff during the sales
presentation can also impact the types of objections experienced.
© University of Pretoria

293
In this study, it was found that the manifested objections for product/service
(m=2.87), about the business (m=2.53), and money (m=2.69), are not experienced
to any extent by the exhibiting staff. The reason for this is that many attendees do
not make buying decisions at the trade shows – due to the extended decision-
making process that takes place in businesses. It could, therefore, be possible that
the manifested objections are only discussed in post-show follow-up negotiations
(vide Section 2.5.2); and this is positive – since it provides more time to deal with
it.
The attendees might also object; because they want to stall decision-making
(m=3.25); or they are possibly not willing to buy at the trade show. Latent
objections occur because the attendees are unwilling to indicate to the exhibiting
staff why they do not want to buy (m=3.00). This is the most experienced type of
objection; and it means that the exhibitors can take positive actions by preparing
for it by training the exhibiting staff.
The exhibiting staff can, for example, be trained on what questions to ask to
determine any latent objections, and how to deal with them.
The fifth stage deals with how objections are dealt with in sales presentations.
The sub-stages identified included standard-objection solutions and product-
objection solutions. What is a matter of concern is that standard-objection
solutions are not used by the exhibiting staff. A method, such as letting other staff
answer any objections (m=2.17) is not necessarily used; although a number of
studies have indicated that experts at trade shows are the best people to assist in
such situations (Tafesse & Korneliussen, 2011:47; Whitfield & Webber, 2011:446).
The exhibiting staff also do not directly (m=1.87) or indirectly (m=2.06) deny any
objections. There is a concern that the exhibiting staff might not know how to deal
with objections.
What is interesting is illustrated in Table 6.13. It is clear here that product-objection
solutions loaded the highest mean values. The use of product benefits (m=3.19) or
advantages (m=2.76) to overcome objections can be used by the exhibiting staff.
© University of Pretoria

294
This is encouraging to see; since the nature of B2B markets makes product
features important in any decision to buy or not.
The sixth stage dealt with the methods used to close the sale. Here, two sub-
stages were identified: typical closing and product closing. Typical closing includes
a number of closing methods. What is noteworthy is that the exhibiting staff
compliment (m=3.26) the attendees, before closing the sale; while compliments
are not used when opening the sale. It is also worthwhile for exhibitors to take note
that negotiation (m=3.10) takes place to close the sale; but this is not expected to
happen at trade shows.
However, it is excellent to see many exhibiting staff only close the sale in the
follow-up (m=3.08); and that helps in building a long-term relationship with the
customers (Reychav, 2009:154). It is also interesting that a number of exhibiting
staff indicated that they do not use a direct close (m=2.58), or a standing-room
close (m=2.49).
What is positive is that similar to dealing with objections in closing the sale, the
preferred method is the use of the product features. The benefit (m=3.75) and T-
account (m=3.58) closure are the preferred closing methods used by the exhibiting
staff.
In the beginning of the study, it was pointed out to the researcher by the trade
show organisers that exhibitors do not always know what to do; and the stages in
the sales process could help them improve their service. The identified stages and
their factors for trade shows provide exhibitors with guidelines on what to do –
since the function of trade shows is to provide exhibitors with the opportunity to
improve their sales and to get more sales leads.
By also linking the stages of the sales process and their factors to the stages of
the trade show, the exhibitors should be able to establish what their actions should
be at the pre-, at- and post-show stages of the trade show. This means that
exhibitors can look at the sales presentation activities, and the objections
© University of Pretoria

295
experienced, how they are dealt with, and the method of closure, in order to help
the exhibiting staff.
The findings of this study also contribute to the expansions of the current
knowledge on the sales process and that of trade shows.
7.4.2 Recommendations based on the main findings for the sub-stages in the sales process at trade shows
The purpose of this study was to establish the role of the sales-process at trade
shows. Selling plays an important part in B2B markets – due to its nature. At each
of the stages, clear activities were identified. This means that training can be
developed for the exhibiting staff. Almost half (47%) of the exhibiting staff are not
in sales, as indicated; and they may lack the requisite skill or knowledge to move
through the sales process at the trade show.
Taking the above into consideration on the sales process, the following
recommendations can be made for the stages of the sales process at trade shows.
7.4.2.1 Recommendations for the sub-stages for pre-show marketing
activities
• Direct communication
The exhibiting staff identified the different types of direct communication used to
attract attendees to the trade show. Direct communication includes the different
methods that a business can use to get the attendees to come to a trade show.
This includes inviting them, direct mail, invitation or electronic communication,
such as electronic mails. It must be noted that not all direct communication
methods are successful, and that direct mail is slowly being replaced by electronic
communication methods. Exhibitors should focus more on personal invitation and
on long-term awareness programs, such as regular electronic communication.
In this study, it was indicated that exhibitors ranked electronic communication as
their top choice for communicating. Electronic communication should be used,
© University of Pretoria
296
because of its advantages, such as cost-effectiveness and being able to
communicate with a large number of customers. Exhibitors should also consider
expanding their links to the trade shows official website in their electronic
communications that allow their customers to pre-register. With the growth of the
social media, exhibitors should consider using Facebook pages to promote their
exhibits at a trade show. They can also consider creating a Twitter account for the
specific trade shows; so that they can “tweet” about what is happing at the show.
• Promotional elements
Exhibitors can also make use of other promotional-mix elements to attract
attendees to trade shows at which they are exhibiting. Mass media, trade journals
and free entry are ways whereby attendees can be attracted. It must, however, be
noted that in this study, mass media had the lowest mean value for the section
dealing with pre-show marketing. Exhibitors should rather rely on promotional
elements that fit in with their industry, such as advertising their presence at trade
shows in trade journals, and handing out free entry vouchers to possible
prospects. Trade shows occur in the domain of B2B marketing that lends itself to
more one-on-one promotional activities. It is, therefore, advisable for exhibitors to
move away from the mass media.
7.4.2.2 Recommendations for at-show marketing activities
• Trade-show sponsorship
Once the attendees are at the trade shows, an exhibitor would have to attract
them to their exhibit stand, and make them aware of their presence. This can be
done through sponsorships. An example of this is companies like NEC, which was
a major sponsor for the 2014 IFSEC trade show. However, not all businesses that
exhibit have the financial capacity to sponsor a whole trade show; and they can,
therefore, make use of other methods. Exhibitors could, for example, sponsor
luncheons, coffee courts etc. as part of their marketing at trade shows.
It was earlier indicated in this study that exhibitors do not make use of co-
sponsoring informal events often – in which information can be shared with the
© University of Pretoria

297
attendees. This is an opportunity for exhibitors to use sponsorship as away to build
publicity and create awareness with possible customers. It is, therefore,
recommended that exhibitors should consider informal functions as a way to
distribute information to attendees by sponsoring such events and getting their
exhibiting staff to attend them.
Another method that is used with success is competitions, which could also be
used by the exhibitors to get information on when they complete their entry cards.
Exhibitors should consider making sure that their exhibiting staff are dressed in
corporate clothing; and that they then move around the trade show – to invite
possible customers to their stand.
Exhibiting staff can also provide attendees with free vouchers for coffee, food etc.
at the trade show.
• Promotional tools
Numerous studies point to promotional attractions at trade shows, and specifically
at the handing out of promotional material (Alessandra et al., 2009:94; Pitta et al.,
2006:158; Milner, 2009:9). In the last few years, more and more research has
been done pointing out the ineffectiveness of free promotional material at trade
shows. In the majority of cases, free promotional material is thrown away by
attendees at trade shows – and especially brochures. What is of a concern is that
the findings of this study found that the majority of the attendees indicated that
they still make use of handing out free promotional material. This means that
exhibitors would have to come up with better ways to attract attendees through
their promotional attractions.
Exhibitors should consider having more high-priced branded promotional material,
such as coffee mugs, calculators, and electronics, such as memory sticks that are
given to prospects that show any real interest in the business offerings.
Exhibitors should, therefore, develop more creative ways to attract attendees to
their stand that do not include the traditional promotional methods. Newer
© University of Pretoria
298
methods, such as an interactive kiosk at stands, should be developed to get the
attention of the attendees, and to ensure that they attend a business-exhibit stand.
The use of more visual methods, such as screens that demonstrate products,
should also be considered. Using screens has the additional benefit that the
exhibiting staff can use them for their sales presentations.
7.4.2.3 Recommendations for the sales-presentation
• Presentation methods
At trade shows, time is limited; and the number of attendees at an exhibition stand
can turn out to be more than the staff can handle. Keeping this in mind, what was
interesting in this study is that although the best presentation method would be
group or memorised presentations, the exhibiting staff ranked questions and in-
depth analysis, as methods that are used more frequently. It is recommended that
memorised and group presentations are used, in order to improve their interaction
with attendees. Although memorised presentation is not much used; it provides the
advantage that it can be taught quickly; all customers receive the same message;
and it can be aligned with other marketing communication.
Exhibitors need to consider looking at the training that they provide and the
manuals that are given to their staff. Exhibit-stand lay-outs are also something that
can be improved to facilitate sales-presentation methods – with the use of
technology to guide the attendees through the presentation – such as computer
screens or television screens.
It must also be remembered that exhibitors can control the knowledge of the
exhibiting staff. Exhibitors should consider using salespeople at the exhibition
stand, in order to improve the presentation methods; since they would probably
have more product knowledge than other staff members. Since salespeople’s work
is to interact with customers on a daily basis; they are more likely to have worked
out routines of presentations; since they know what information the customers
need.
© University of Pretoria
299
• Presentation actions
In this section, the findings are in line with what was established by Seringhaus
and Rosson (2004:161) and Gopalakrishna and Williams (1992:220). These
authors found that the exhibiting staff gathers information from attendees as part
of lead generation. Therefore, exhibiting staff should take note of their interest in
the product by asking questions. Exhibitors can use different methods to keep a
record of who has visited their exhibition stand – by using methods, such as
business cards, or more updated methods, like scanning their attendance passes.
Another option is to install a self-service kiosk that can capture information on the
attendees, as they move through the exhibition stand.
Exhibitors should also make use of demonstrations in their sales activities, and
make the products available at the trade show. Innovative methods, such as
interactive computers that show the different stages in the production of the
products that are sold could be applied. From the findings, it is evident that
information technology is not used to its full potential with the exhibitors still
indicating that product demonstrations are generally preferred. Exhibitors should
consider using laptops and tablets; since detailed information can be provided: for
example, on how machinery work internally, or on how the production process
works etc.
• The approach method
It is encouraging that most exhibiting staff indicated that they start the sales
presentation by introducing themselves; and this is followed by using a product
benefit. It is important that exhibitors should use product benefits to a greater
extent; since attendees at trade shows are in many cases knowledgeable of the
products on the market. Exhibiting staff would have to make sure that their method
of starting their presentation would lead them to use the available resources, such
as demonstration material, hand-outs etc.
© University of Pretoria
300
The use of compliments to start a presentation is not recommended or preferred
by the exhibiting staff – as indicated in the findings. At trade shows, compliments
are not always possible for a sales presentation; since the exhibiting staff have no
prior knowledge of the attendees.
If the exhibiting staff use compliments, these might come across as being false. In
starting the sales presentation, expressing an opinion might not be as effective as
indicating what the product can do – unless a question is asked by the attendee.
As pointed out in Chapter 2 of this study, the decision-makers attending trade
shows are in many cases professional buyers that want products that will solve
their problems; and they want to see as many suppliers as possible. Exhibitors
should instruct their exhibiting staff to provide the attendees with the most
important information – right from the start of the presentation. It is, therefore,
advisable that the exhibiting staff should be trained on using the features, the
advantages and the benefits of the product in the sales presentation.
• Question approach
There is an important link in B2B markets between what the customers want and
how the exhibiting business could solve their problems. By starting the sales
presentation at the exhibit stand by asking the correct questions, the staff member
should be able to identify whether the attendee is a possible prospect for their
products. Staff should be trained to ask questions that would help establish the
attendee’s needs; so that they can move them into a sales-presentation method
and suggest possible solutions for their problems through the advantages and
benefits of the product. By asking the correct questions, the exhibiting staff can
also determine who at the exhibit stand would be the best person to talk to the
attendee.
The information that an engineer requires would, for example, differ from that of a
person who is only interested in procurement.
© University of Pretoria
301
By asking questions, the role of the person in the buying team can be established;
and this can then be catered for at the exhibition stand by having different staff
members available to continue the sales presentation.
7.4.2.4 Recommendations for the objections experienced
• Manifested objections
The best way for exhibitors to deal with objections is to plan for them, and then to
overcome them before they arise. In the sales presentation at a trade show, a
number of objections can be expected, such as product, financial, the need to
know, or the exhibiting business. The best way in which exhibitors can deal with
manifested objections is to try and move the sales presentation to the final stage;
where they follow up after the trade show by varying their techniques. If the
exhibiting staff anticipate that the attendee would have any of the afore-mentioned
objections, they should try and move the sales presentation along, and get a
follow-up sales meeting, where more time would be available to explain the
product to the customer.
The researcher established that there is no literature that deals with price-setting
at trade shows, or on how it influences pricing strategies (Zimmerman & Blyth,
2013:232). Exhibitors should, however, consider consulting with sales and
marketing staff to determine what price objections occur in normal B2B selling.
This could be used to plan for possible price objections that might occur.
• Latent objections
Since latent objections are difficult to establish, this is the most difficult type of
objection to deal with; and unfortunately this is the most frequently occurring type
of objection at trade shows. The only option available to the exhibiting staff is to
ask as many questions as possible, to establish the reasons why the attendee is
not interested. It was indicated in the findings that attendees often stall decision-
making at trade shows. This could be due to time constraints at trade shows; but
the exhibiting staff still need to develop questions that can be asked during the
© University of Pretoria

302
sales presentation, in order to determine these types of objections. Exhibiting staff
should also, in this case, try and get a follow-up meeting with the attendees.
Another method is to move the discussion to a social event at the trade show,
such as a coffee court or other type of function at the trade show; where more time
would be available to explain the product. This again points to the importance of
trade-show sponsorship and its optional benefit in interacting with the attendees to
gather more information from them. Sales presentations should also be evaluated,
in order to determine whether they can provide information that makes the
products more attractive to the attendees, thereby by-passing any possible
objections.
7.4.2.5 Recommendations for dealing with objections
• Standard objection solution
Although standard objection solutions are indicated as not being as frequently
used as product-objection solutions, they can still help the exhibiting staff to
overcome any sales resistance. Exhibitors should try and stay away from either
directly or indirectly denying any objections. The exhibiting staff should find more
creative ways for dealing with objections, such as letting other staff members
answer any questions, or indicating that this will be dealt with in the follow-up. As
pointed out, time is of the essence at trade shows. Exhibiting staff, in many cases,
move through the sales presentation to get as much of the information across as
quickly as possible; and they should rather stop at the objections, in order to deal
with them.
Since a number of objections are not outspoken, this makes it difficult to handle;
but methods such as, asking questions, keeping quiet or re-phrasing a sentence,
could be prove to be valuable.
© University of Pretoria
303
• Product-objection solutions
The most-used objection solutions are to state the benefits of the product, in order
to overcome any objections during the sales presentation. Exhibiting staff also
indicated that they use the advantages of the product or service to overcome any
objections. The best method, therefore, is to use both the advantages and benefits
of the product to overcome the objections. This is a very valuable technique.
Exhibitors should train the exhibiting staff on all the advantages and benefits of the
product. Exhibiting staff should also receive product literature to gain all the
knowledge on the benefits that the product can provide. A positive aspect from the
findings of this study is that exhibitors provide their exhibiting staff with material on
the products that they sell as part of their preparation. It would, however, be a
good idea to work through the material with the exhibiting staff, or to do role-
playing activities to emphasise the information. Furthermore, demonstration
methods that indicate how the product works could also be used by the exhibiting
staff. Similar to knowing the material regarding the products, it is suggested that
demonstrations should be rehearsed with the exhibiting staff to ensure that they
know how the product works.
7.4.2.6 Recommendations closing methods
• Typical closing
Exhibitors have a number of methods that they can apply to close a sale. It must
be noted that not all the exhibitors aim to sell at trade shows; and they frequently
focus on lead generation. The exhibiting staff should build their closure into their
sales presentation; so that they know when to close the sale. If the attendee is not
ready to close, the exhibiting staff must get the follow-up details. Due to the nature
of trade shows, exhibitors need to develop closing techniques that would allow
them to close the sale in a short space of time. At international trade shows, this
becomes even more important; since the time that attendees and exhibitors have
with one another is limited to the duration of the trade show.
© University of Pretoria

304
If failures ensue, the exhibitors should consider reconstructing their exhibiting
stand, to allow for a place that is more private, for discussions to take place. It is
encouraging to see that the staff make use of a number of typical closing methods.
Unfortunately, directly asking for the sale is not generally used; although it could
save time and determine whether the attendee has any objections.
• Product closing
Using the product’s benefits or advantages is a preferred method used by trade
show exhibiting staff; and it links with the information that attendees want and the
way in which the exhibiting staff present it. Exhibitors can provide the exhibiting
staff with the necessary product information, such as the features; and then they
could train them on how to switch to the advantages and benefits. It is important
that the exhibiting staff be well-trained on how to turn product features into benefits
and advantages. It is advisable that in the product-training literature, the exhibiting
staff should be equipped with this information. The product closure can also be
combined with a demonstration of the product, and then closing the sale.
Or, it can be used with asking the customer directly if s/he want to purchase the
product.
7.5 MAIN FINDINGS RELATING TO THE DIFFERENCES BETWEEN SALES AND NON-SALES PERSONS REGARDING THE SALES PROCESS USED AT TRADE SHOWS
It was indicated in Section 3.6.2.4 that the persons who should man the exhibition
stands should be salespersons. Trade shows are seen as a place where buyer
and seller meet in a central location, in order to have one-on-one interaction with
one another. In this study, salespersons made up just more than half (53%) of the
exhibiting staff. Many exhibitors see trade shows as a place to do public relations,
rather than selling (Liu et al., 2011:449). However, salespeople are still in the
majority; this gives an indication that salespeople do play an important role in trade
shows. It is, however, interesting that there are no major differences between how
© University of Pretoria
305
exhibiting staff move through the sales process: be they employed as
salespersons, or not.
It would be assumed that salespeople would have different approaches to the
sales process: for example, how they present, how they deal with objections, or
how they close the sale. Dwyer and Tanner (2009:332) agree with the afore-
mentioned statement; and these authors postulate that salespeople must be
involved with trade shows; since they are personal; and they can result in sales
leads.
In this study a few, differences were established; although in the majority of the
stages, there were no differences between the salespeople and the non-
salespeople in regard to the sales process at trade shows. This needs to be
further investigated; although it could be speculated that non-sales staff through
training are just as well-equipped to man the exhibit stand. Another reason could
be that the same staff members are used by the exhibitor for a number of trade
shows – where they gained the necessary knowledge.
It should also be noted that a number of the non-salespersons have a marketing
background; and that could be another reason.
Next, the main conclusions, implications and recommendations will be discussed
for salespersons and non-salespersons on the stages of the sales process at trade
shows.
7.5.1 Conclusions of and implications on the findings of the differences between salespersons and non-salespersons regarding the sales process at trade shows
In selecting exhibiting staff, the exhibitor must ensure that they have the
interpersonal skills, knowledge and communication capabilities (Li et al.,
2011:442); since they would have a direct impact on the success of the trade show
(Seringhaus & Rosson, 2004:161). Due to the nature of the capabilities required of
© University of Pretoria

306
exhibiting staff, one would assume that the logical choice for such a person would
be in sales (vide Section 3.6.2.3).
In this study, 53% of the exhibiting staff interviewed were in sales; while 47% were
not employed as salespeople. Although most of the exhibiting staff are
salespeople, they are not much more than non-salespeople; and it must be stated
that they make up more than half of the respondents. Salespeople attend trade
shows to promote communication between the organisation and the clients
(Alessandra et al., 2009:69; Dwyer & Tanner, 2009:332). Therefore, seven
hypotheses was proposed in this study to determine whether there are any
differences between salespeople and non-salespeople, as they move through the
stages of the sales process at trade shows.
It was established that there exist no differences between sales and non-sales
people regarding business actions used. It could be speculated that due to the
various business actions included that did not all strictly relate to sales, could be
the reason that no differences exist between sales and non-sales people.
Research by Lee and Kim (2008:793) that concluded that exhibit stand staff
training did not have a significant influence on sales-related performance, could
also be an possible explanation of our results. This is also in contradiction to Blyth
(2002:630) findings pointing to selling objectives as being more important than
non-selling objectives at trade shows.
The reasons for the similarities could be due to staff training; since the majority of
the respondents indicated the importance of the different variables. This is in line
with the research done by Pitta et al. (2006:163) and Hanlon (1982:99), which
pointed to the importance of staff training before a trade show.
No significant differences between sales persons and non-sales persons regarding
direct communication and promotional elements used in pre-show marketing
activities were found. This is an interesting finding since, Ling-yee (2008:39) found
that the training of exhibit staff to have a positive effective on pre-show
promotions. It would be assumed that since not only sales staff gets training - both
sales and non-sales will be able to be effective in direct communications. It is also
© University of Pretoria
307
be assumed that sales people make use of direct communication like inviting
customers due to the nature of selling were they have direct contact with
customers (Kirchgeorg et al., 2010b:683-684, Herbig & O’Hara, 1998:431)..
For at-show marketing activities to attract attendees to the exhibition stand and
closing, there were both similarities and a few differences between salespeople
and non-salespeople. On the activities used to attract the attendees to the
exhibition stand for the factor “trade-show sponsorship” salespeople (m=2.70) and
non-salespeople (m=2.50), there were no differences. The reason is that,
generally, all staff could be involved in social activities, such as going to
luncheons, coffee courts or moving around at the trade show. Therefore, there
were no clear differences between salespeople and non-salespeople. There were,
however, differences in the “promotional tools” used between salespeople
(m=3.66) and non-sales staff (m=3.37).
Promotional tools include the use of technology, such as video screens; but this
mostly falls under the planning done by salespeople (Johnston & Marshall,
2010:153-154); and this could be the reason why there is a difference.
There were differences between sales and non-sales persons for “presentation
methods”, “presentation actions” and “question approaches”. As pointed out before
in this study (vide Chapter 3 & Chapter 4), salespeople have unique
communication skills; and are more likely to differ in the way that they interact with
the attendees. Due to these differences in communication and experience in
dealing with customers, salespeople who man the exhibition stand are more likely
to be able to adapt their interaction with the attendees. Salespeople are, for
example, more aware of the AIDA and FAB models (Johnston & Marshall,
2013:171;Rix, 2006:212; Futrell, 2011:285) that they need to apply in their sales
presentations to ensure such.
It could be argued that non-salespeople are unaware of the different methods.
There are also different sales-presentation methods that can be applied,
depending on the sales situation; and salespeople would probably be aware of
which method to use (Havaldar & Cavale, 2007:213).
© University of Pretoria
308
There were no differences between the type of objections experienced at trade
shows by salespeople and non-sales staff. Objections can occur for a number of
different reasons; and frequently, they are not real; since the person does not want
to commit at that moment. Sales staff that deal with objections in their sales
presentations on a daily basis and prepare for them, would most probably be able
to deal with such objections – before they even arise. Liu et al. (2011:449), also
indicate that at Chinese trade shows that most exhibitors were at the show as part
of public relations and not for selling or getting contracts – thus the lack of
experiencing objections could be a possible explanation for the lack of any
differences.
Although in this study, the findings indicated that there were no differences
between sales and non-sales persons in the objections experienced, or in dealing
with them. As indicated, a number of exhibiting staff come from the
sales\marketing (70%) department, which means that they know their products
that are on the exhibition; and they would most probably be able to deal with such
objections.
In regard to closing the sale for the factor “typical closing”, there were no
differences between salespeople (m=2.96) and non-salespeople (m=2.77).
“Typical closing” includes a number of closing methods, such as direct closure,
assumptive closure, alternative closure, complimentary closure, minor-point
closure, or standing-room closure. What is of concern is that none of these
methods are used by sales or non-sales persons; although they could be an
effective way to close the sale.
Salespeople are more likely (m=3.90) to use product closing – due to their
knowledge and the sales experience that they have (Miller, 1999:89-91; O`Connor,
2001:152-154). Typical closing methods do not rely on product knowledge; and
they are more general in nature; therefore, it is more likely that both salespeople
and non-salespeople would apply this knowledge when closing a sale.
© University of Pretoria

309
7.5.2 Recommendations for findings on the differences between salespersons and non-salespersons regarding the sale process at trade shows
The role that sales play at a trade show is very important, with salespeople having
the knowledge and skills in many sale situations. Exhibitors need to take note that
there are differences in certain stages. For the business actions of the show, it is
important that for both salespeople and non-sales staff, the written objectives are
provided; they are instructed on how the show will be assessed; and what the non-
financial aims of the organisation are. It might be necessary to provide non-sales
staff with more sales training; since they do not have the same level of product
knowledge as do salespeople.
For new products, both salespeople and non-sales staff need to be instructed on
how they should be introduced, and on how product-testing would take place at
the trade show.
For promotional tools as a marketing activity to attract attendees to the trade
show, there are differences between salespeople and non-salespeople. Exhibitors
should rely more on salespeople, when it comes to personally delivering the
invitations to attendees. This is due to the existing relationship that many
salespeople would have with the customers. Many non-salespeople do not interact
with customers or prospects on a daily basis; and more traditional promotional mix
elements, such as electronic communication, trade journals, and suchlike, should
be used to attract the attendees.
In attracting attendees to the exhibition stand, both salespeople and non-
salespeople need to move around the trade shows and interact with the
customers. Due to their training and the nature of personal selling, it could be
assumed that salespeople would be the better choice in dealing with attendees in
social situations, such as luncheons, talks etc. For non-salespeople, promotional
material could help to get the attendees to the exhibit stand; since this can be
handed out by any staff member.
© University of Pretoria

310
It is essential that non-sales staff receive training on the presentation of sales
activities in which they are to participate at the trade show. For non-salespeople,
business must provide more standardised sales methods, such as formula-selling
or memorised selling techniques. In many cases, non-sales staff are not involved
in demonstrations; and they would have to be shown how to utilise these. Both
salespeople and non-salespeople would have to be instructed on how the
company wants to keep a record of the attendees who visit the exhibition stand.
Non-sales staff would also have to be shown on what and how to ask questions
from attendees; since the sales staff would probably do it out of habit. Non-sales
staff might need to be provided with a list of questions to ask the attendees.
Non-sales staff would have to be trained on how to identify objections. This is
important; since they might also need to deal with objections as part of the sales
presentation. Exhibition staff members that are not from the sales department
might need to hand the sales presentation over to an experienced person, in order
to deal with any objections. Sales staff would have to be made aware that at trade
shows different objections might arise; and they should keep the impact of time
constraints in mind.
In the training that is provided, non-sales staff might need to be instructed on how
to overcome objections. Exhibitors should also consider having salespeople or
technical experts at the exhibition stand, to assist non-sales people when dealing
with objections. It might also be true that non-salespeople that need to be at the
exhibition stand might be engineers that would be able to specify the advantages
and benefits of the product better than salespeople can.
With the standard closing, salespeople and non-sales staff would most probably
be similar on how they close. On the other hand, non-sales staff might need more
training and better guidelines on how to finalise a product closure. Sales staff deal
with the exhibition of business products – not just at the trade shows; and they
would probably know better how to achieve product closure. The exhibitor should
use sales staff and product literature to train non-sales staff on how to close the
sale, making use of the product’s advantages and benefits.
© University of Pretoria
311
7.6 MAIN FINDINGS RELATING TO THE DIFFERENCES BETWEEN THE
TYPE OF TRADE SHOW AND THE SALES PROCESS USED
In Chapter 3 of this study, it was indicated that trade shows can be divided into
different types of shows (international, national or regional). The approach
followed in many of the different types of trade shows is very similar; only for
international trade shows, this might differ. In this section, the main findings on the
type of trade show, and how exhibiting staff implement the stages of the sales
process, will be discussed.
7.6.1 Conclusions and implications of the main findings for the different types of trade show for the sales process
Seven hypotheses were set to determine whether there are any differences
regarding the type of trade show. There were no significant differences in the
business actions of the trade show. This is an interesting finding since the type of
trade shows will influence the objectives, for example with national shows focusing
more on new product and market segments, regional shows supporting sales
activities and international shows on identifying new distributors (Kijewski, et al.,
(1993:291-292). It may be that in the South African context regardless of the type
of trade show businesses exhibit at, they follow a more standardised approach.
Furthermore, for the pre-show marketing activities, at-show marketing activities,
the sales presentation and the closing method used for the stages of the sales
process, there were no differences. These issues are very interesting; since for
elements, such as the marketing activities before and at the trade show, one
would assume that different approaches would be applied. International trade
shows would, for example, rely more on electronic and mass-promotional mix
elements; since it is not possible for their sales staff to visit all the possible
prospects. It was also strange that closure was not different; since the decision-
makers who attend trade shows differ. For example, one would expect that for
international trade shows that attract high-level decision-makers, the focus would
© University of Pretoria

312
be more on selling; since they are more inclined to do this (Cateora & Graham,
1999:394).
For the various types of trade shows, there were differences in the objections
experienced during the sales presentation for both manifested and latent
objections. One of the reasons for these differences in objections experienced
could be that the objectives of the trade shows differ. For example, with
international trade shows, the aim is not focused specifically on selling, but rather
on building relationships (Robbe, 2000:14-15; O’Hara, Palumbo & Herbig,
1993:234).
If an exhibitor is not focused on selling per se they might not experience any
objections. At international trade shows, the focus is on building partnerships that
are not necessarily getting sales; and therefore, they might not experience any
objections. Another reason could be that the exhibition staff in regional and
national trade shows rely on different staff members; whereas with international
trade shows, the top management is usually present.
Exhibitors are more likely to send experienced and higher-ranking staff to
international trade shows. On how objections are dealt with, there is no difference
in using solutions for product objections; since the staff are trained on their
products; and it would not matter what type of trade show it is.
7.6.2 Recommendations on the main findings for the different types of trade show for the sales process
For business actions, the exhibitors of international trade shows would have to
focus more on marketing and the introduction of new products. In marketing, the
trade-show international exhibitors would have to follow a different approach; if
they have not yet been established in a country. The products introduced might be
new to the market; and more emphasis would have to be placed on how they
work, and what they can do. For the testing of new products, international
exhibitors could determine whether there is a market for their product in a country
at the trade show. Exhibitors would also have to select their exhibiting staff very
© University of Pretoria
313
carefully; since they might use part-time staff members that need to be educated
on the products of the organisation.
It seems that the majority of stages in the sales process are implemented similarly
in the different types of trade shows. This is good news; as this means that
exhibitors exhibiting at regional trade shows can easily move to national or
international shows without any major adjustment to their sales strategy. This
could streamline the process, and lead to cost reduction in, for example, staff
training etc.
In the marketing of the trade show for businesses participating in regional or
national trade shows, direct marketing can be applied. When dealing with
international trade shows, more promotional mix elements should be applied, such
as electronic communication that can be sent to prospective customers anywhere
in the world – without any additional cost to the exhibitor.
Exhibitors who participate in international trade shows should make use of
sponsorships as a way to create brand awareness. Because of a large amount of
promotional material being discarded, new innovative ways of succeeding at trade
shows must be used. Exhibitors at international trade shows can make
sponsorship material that relates back to their country.
Regarding sales presentation methods, there should not be many differences.
Exhibitors at international trade shows, however, should familiarise themselves
with the local culture of the country. In the data-gathering stage of this study, the
researcher observed that exhibiting staff from countries, such as China, do not
interact with all the attendees; and they expect them to start the sales
presentations. It is, therefore, essential that the presentation methods and
activities be adapted, in order to have greater success.
Exhibitors at international trade shows would have to establish possible objections
more quickly than at other types of trade shows. At international trade shows, the
exhibitors might not see the attendee after the show; and they would have to deal
with objections as speedily as possible. International trade shows might also have
© University of Pretoria

314
more product and business objections; since the attendees are not familiar with
the business or their product offerings. Exhibitors at international trade shows
would have to establish their companies’ reputation via testimonials and product
research – and by demonstrating what they can do.
At international trade shows, the exhibitors would have to try and close the sales
at the trade show; since follow-up might not be possible. Also, with objections at
international trade shows, this would have to be done in many cases at the trade
show, in order to ensure that they get the deal.
7.7 MAIN FINDINGS FOR THE DIFFERENCES BETWEEN BUSINESS
OPERATIONS AND THE SALES PROCESS USED
The findings on business operations – and whether there are any differences in
how they move through the stages of the sales process – must be briefly
discussed. A number of the recommendations might link up with the discussions
above that deal with sales and non-salespersons and the type of trade shows.
However, there are differences for certain aspects of the business operations as
they relate to the sales process.
7.7.1 Conclusions and implications of the main findings for the different business operations for the sales process
To determine whether there are any differences between business operations
(sales of goods or service industry/professionals or construction/manufacturing or
others) of exhibitors, and how they implement the stages of the sales process,
seven hypotheses were set. For the business actions for the trade show, there
were no significant differences evident.
In the first stage of the sales process for the pre-show marketing activities, there
were also no differences. For the second stage at-show marketing activities, the
trade show sponsorship had no differences; while for promotional tools, there were
differences identified. It was found that firms selling goods (m=3.77) use
promotional tools more than does the construction/manufacturing (m=3.23)
© University of Pretoria

315
business. These differences are most likely due to the nature of the products that
are being sold, with firms being able to hand out samples of their products, and
being able to demonstrate the workings of the product on video screens.
In the sales presentation, there are no differences regarding the business
operations of the exhibitors, except for the factor-question approach. An
interesting part of the findings is that exhibitors who sell goods (m=3.81) use the
question approach more frequently than do construction/manufacturers (m=3.42).
Since goods are sold to a wide variety of business markets, be they government,
initiations or commercial enterprises; it might be easier to create questions on
where they would use the product being sold. Manufacturers are more technical in
nature; and they would rather rely on an in-depth analysis of the attendees’ needs,
or rather dealing with their requirements by means of setting up a sales proposal.
For the objections experienced, and how they were dealt with, there were no
differences in the business operations of the exhibitors. There were also no
differences for the closure used in the sales process. From the above, it is evident
that there are not many differences in the sales process for the business
operations of the different exhibitors. This is good news for exhibitors and trade
shows organisers; since a standard framework can be developed when training
the exhibiting staff.
7.7.2 Recommendations for the main findings on the differences between the business actions for the sales process
Construction businesses might need to revisit their promotional tools that are used
at trade shows. They could consider making use of branded material that can be
related back to their business – for example, the construction company making a
key ring or memory stick that looks like a bridge. Construction businesses can also
make video recordings of bridges, roads or buildings constructed and show these
in video screens at the exhibition stand.
© University of Pretoria

316
Manufacturers need to develop questions to start the presentation. By asking
questions, manufacturers can get more detailed information from the attendees.
This can assist them in planning their presentation, in order to provide product-
specific solutions for attendees, and to get more sales and leads.
Exhibitors that sell a service would have to train their staff better in the planning of
trade show activities. Such services are unique; since they cannot be shown to the
attendees. This means that exhibitors should have their staff trained on how to
deal with the tangible aspects. When it comes to promotional-material services
that are exhibited, they would have to spend more on promoting their brand name;
since there is no physical product that can be associated with the business.
Service exhibitors can make use of visual material to attract the attendees to the
trade show.
Exhibitors should plan their sales presentations carefully; since asking question is
important to build rapport with the attendees and establish their needs. Exhibitors
of products should rely on demonstrations where possible, to show what products
they have. Exhibitors that are in the service industry must have video clips, visuals
etc. for illustrating their services to the attendees.
Service-industry exhibitors should prepare for financial objections; since these are
more likely to occur; and by pointing to what their services can do, they would be
able to handle any objections. Unlike product services, they cannot easily make
use of product solutions. They can, however, illustrate the benefits and the
advantages that attendees would receive by emphasising what they do well.
In the closing of the sale, exhibitors must note that for industries, such as
manufacturing, negotiations might need to be undertaken. Exhibitors should,
therefore, ensure that a good relationship exists through their interactions at the
trade show. Exhibitors from product industries can rely more on standing room and
the double-bind close were two or more small points of the product is used to
close the sale.
© University of Pretoria
317
7.8 LIMITATIONS
This study has attempted to contribute to the body of knowledge on trade shows
and the sales process. While doing the study, specific limitations were evident in
both the literature review and the empirical phase of the study; and these will be
discussed below.
7.8.1 The literature review In this study, a number of limitations, based on the review of the literature, were
identified:
• It was noted in Chapter 3 of this study that a limited amount of new and
relevant literature is available on trade shows (Pitta et al., 2006:160).
Academic research literature on personal selling and the selling process
was even more limited; and the research had to rely on textbooks. This
resulted in dependence on older sources in this study.
• It was the aim in this study to include all the relevant literature on the topics
covered. It is, however, possible that some important empirical research,
which has not yet been documented, was not accessible; and this was,
therefore, inevitably excluded.
• The literature on sales at trade shows was extremely limited; and it only
focused on certain stages of the sales process. Trade-show literature
focuses broadly on the individual stages, and not the sales process per se,
which means that the research had to use a combination of different
information sources.
• Due to the lack of information on the sales process and trade shows in
South Africa, the researcher had to rely largely on the literature from other
countries.
© University of Pretoria

318
7.8.2 Empirical study A number of limitations should be highlighted, following the empirical research part
of this study.
• The study was only done in two provinces in South Africa, namely Gauteng
and the Western Cape – due to cost constraints in gathering the data from
a trade show.
• The study was limited to trade shows that were organised by members of
EXSA; and it did not include those of other organisations.
• A number of the trade shows were international, which meant that regional
and national trade shows accounted for a small number of trade shows
investigated.
• Due to an extremely limited number of previous studies on the sales
process at trade shows, the questionnaire was constructed using multiple
sources; and therefore, it was explorative in nature, which limited the
statistical analysis that could be applied.
Despite the limitations, the study has provided a layout of a possible sales process
that can be applied at trade shows. The research could also be used to build on
the current models of trade shows, in order to provide a sales perspective to the
exhibitors. Next, some recommendations will be made for future research.
7.9 RECOMMENDATIONS FOR FUTURE RESEARCH
The following recommendations are made for future research:
• This study could be used to conduct research on specific parts of the sales
process at various trade shows.
© University of Pretoria
319
• The most important part of this research – due to its explorative nature –
could be used to test the different factors that have been identified for each
of the stages in the sales process.
• It would be of value to expand the research of this study to other countries,
in order to establish whether the factors would remain the same as in South
Africa.
• Other issues, such as the cultural differences of the exhibiting staff might
bring new insights, when dealing with international trade shows.
• Research on exhibit stands and their impact on the sales process might
also provide clues on what sales presentation methods would be the most
applicable for use in different situations.
• Future studies should include determining the main buyer, in order to
correlate between the exhibitors and the attendees of trade shows.
• Sales could be included as a measure of effectiveness – instead of just
obtaining opinions and agreements.
7.10 ACADEMIC CONTRIBUTIONS OF THIS STUDY
In Figure 7.1, an illustration is provided of the contributions that this study has
made to the field of trade shows. The figure was divided into three groupings that
consisted of pre-, at- and post-show that make up the three stages of a trade
show. Furthermore, four columns were added that consisted of the business
decision-making process, the sales process at trade shows, trade-show
performance and trade-show activities.
This study investigated the second column that deals with the role of the sales
process at trade shows. The section on business actions was not included in the
stages of the sales process; since it measures overall trade show aspects, and not
any specific stage. However, certain elements in the business action section relate
© University of Pretoria
320
to the post-show stage; and these are therefore included, as part of the follow-up
in the sales process of trade shows. It was established that there are six sections
before and at a show. Each of the three stages of a trade show is indicated on the
far right-hand side of Figure 7.1. In the pre-show stage, pre-show marketing
activities (direct communication and promotional elements) are done.
In the at-show stage, there are five sections, namely: at-show marketing activities
(trade show sponsorship and promotional tools); sales presentations (presentation
methods, presentation actions, approach methods and question approach);
objections experienced (manifested and latent objections); dealing with objections
(standard-objection solution and product-objection solutions); and lastly, closing
methods (typical closing and product closing).
The last stage, namely, the post-show stage, was not directly investigated;
however, certain of the business actions were identified for this stage. It was
established that exhibitors measure their show success both in terms of financial
and non-financial gains; and that they have a tracking system in place to follow up
after the trade show.
Each of these identified sections links up the stages in a normal sales process.
The pre-show marketing activities and the at-show marketing activities comprise
the prospecting step; while during the at-show marketing sections, the pre-approach step is found. The approach and sales presentation stages take place
in the sales presentation section. The stage for determining the objections takes
place in the objections-experienced section; while the section dealing with the objections takes place thereafter. The closing stage in the sales process takes
place in the sales section; and lastly, there is the follow-up stage in the post-show
business action section.
It is apparent from Figure 7.1, that the stages in the sales process and the
sections in the sales process at trade shows overlap in certain aspects. For
example, prospecting, as well as the approach and sales presentation are
distributed in two sections; or they can be combined into one. Therefore, it is clear
that the sales process that is applied at trade shows differs from the normal
© University of Pretoria
321
business-sales process. Exhibitors at trade shows must take note of this and
implement it in their sales strategies for exhibiting at trade shows.
Also included in the figure below is the model of Lee and Kim (2008:786) and
Hansen (2004:4) that includes the trade show performance and trade show
activities. Trade show performance includes five measures, namely: image-
building, sales-related activities, information-gathering, relationship-improvement
and motivation. These activities not only relate to the trade show activities, but
also to the sales process. Trade show activities include the different show
activities that take place in each stage (pre-, at- and post-show). These were
included in the figure to show that trade show activities are not only focused on
sales, but are more general in nature. This indicates the differences between trade
show activities and the sales process.
This information can be used to see where the two are the same, and where an
exhibitor might need to expand on their sales process at trade shows.
In the figure, it was also pointed out that the sales process at trade shows
enhances and contributes to the trade-show performance; since many of the sales
activities help with image-building, information-gathering, relationship-
improvement etc.
The column on the left indicates the decision-making process that trade show
attendees go through. Each stage of the attendee’s decision-making process links
up with the stages of a trade show, and therefore indirectly with the sales process.
Due to the nature of trade shows, it is important to note that there are multiple
stages compared with the normal consumer decision-making process. By using
the decision-making process together with the sales process at trade shows, it is
possible to determine what stages would have to be dealt with at each stage.
This study not only contributes to the sales process at trade shows; but it indicates
how it can be used with current trade show activities and business decision-
making.
© University of Pretoria
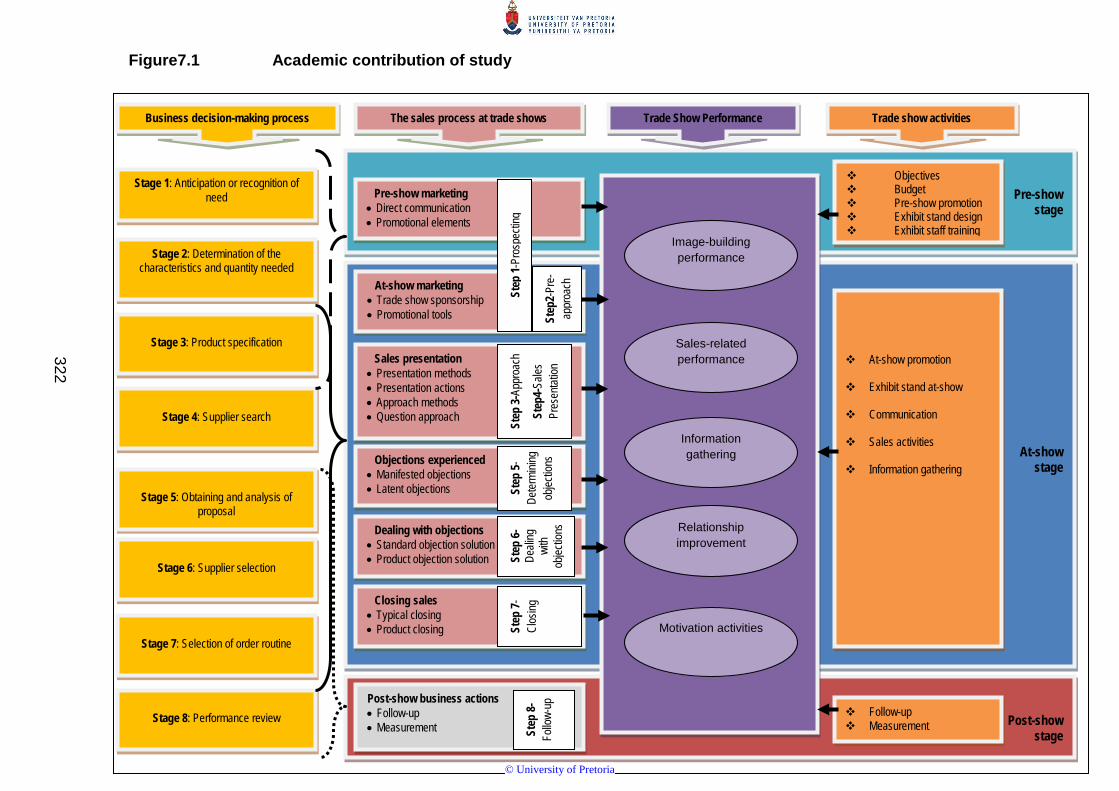
261
Pre-show stage
At-show stage
Pre-show marketing • Direct communication • Promotional elements
At-show marketing • Trade show sponsorship • Promotional tools
Sales presentation • Presentation methods • Presentation actions • Approach methods • Question approach
Objections experienced • Manifested objections • Latent objections
Dealing with objections • Standard objection solution • Product objection solution
Closing sales • Typical closing • Product closing
The sales process at trade shows
Post-show stage
Image-building performance
Sales-related performance
Information gathering
Relationship improvement
Motivation activities
Objectives Budget Pre-show promotion Exhibit stand design Exhibit staff training
At-show promotion
Exhibit stand at-show
Communication
Sales activities
Information gathering
Follow-up Measurement
Trade show activities
Stage 1: Anticipation or recognition of need
Stage 2: Determination of the characteristics and quantity needed
Stage 3: Product specification
Stage 4: Supplier search
Stage 5: Obtaining and analysis of
proposal
Stage 6: Supplier selection
Stage 7: Selection of order routine
Stage 8: Performance review
Business decision-making process Trade Show Performance
Step
1-Pr
ospe
cting
Step
2-Pr
e-ap
proa
ch
Step
3-Ap
proa
ch
Step
4-Sa
les
Pres
entat
ion
Step
5-De
termi
ning
objec
tions
Step
6-De
aling
wi
th ob
jectio
ns
Step
7-Cl
osing
Post-show business actions • Follow-up • Measurement St
ep 8-
Follo
w-up
Figure7.1 Academic contribution of study
322
© University of Pretoria

323
7.11 EVALUATION OF THE OBJECTIVES AND HYPOTHESES SET VERSUS THE RESEARCH RESULTS
In Chapter 6 of this study, the research results were presented; and this allowed
the researcher to address the objectives and hypotheses. In this section, the five
objectives that were set for this study are compared with the outcomes of the
research findings. The objectives, as set out in Chapter 1 and Section 5.5, will be
stated, after which the research results are summarised – to indicate whether the
objectives have been met, or not.
The main objective of this study was to explore the sales process at trade shows;
and it was established through an explorative analysis that at each of the stages of
the sales process, different activities had occurred. As indicated in Figure 7.1,
each section has specific activities that are implemented in the sales process.
Therefore, the main objectives of this study have been met by identifying these
activities.
The second objective was to determine the profile of the exhibitors at trade shows
and the exhibit staff. In Section 6.2 and Section 6.3 of this study, a profile is
provided of the exhibitors that exhibit at trade shows. This information was
important; since it was used in the future analysis of the data. This objective has
also been met.
The third objective determined whether there are any differences between the
salespersons and the non-salespersons who man the exhibition stand, regarding
the stages in the sales process for trade shows. It was indicated in Chapter 3 and
Chapter 5, that there should, according to the literature, be differences why
salespeople are the better choice for the exhibition staff. Through the hypothesis
testing, it was revealed that there are both differences – and no differences – for
certain factors that make up the stages of the sales process at trade shows. In
Section 7.5 of this chapter, the differences were discussed; and this objective has
therefore also been met.
© University of Pretoria
324
The fourth objective was to determine whether there exist any differences between
the type of trade show and the way in which the exhibition staff implement the
different stages of the sales process for trade shows. In Section 7.6, the
differences that exist and those that do not exist are discussed and highlighted.
For each of these objectives, seven hypotheses were set. These objectives have,
consequently, also been met.
The fifth objective was to determine whether the business actions of an exhibitor
have any significant influence on the stages of the sales process for trade shows
in regard to the exhibition staff. It was established that there are almost no
differences between the different business actions and the sales process that
exhibition staff implement. In Section 7.7, the differences that were identified are
discussed. The fifth objective has, therefore, also been met.
7.12 SUMMARY
The findings of this study have contributed to the amplification of the sales process
at trade shows – by highlighting the sales activities that occur at each of the
stages identified. Exhibitors and trade-show organisers can use the information
obtained to guide them in what sales activities should take place at the exhibit
stand. From the findings, training material can be developed to assist in the
training of exhibition staff, to ensure greater success at trade shows. The study
has also contributed to the amplification of the research done by Lee and Kim
(2008:786), and Hansen (2004:4) on the various activities at trade shows.
It was established that there are not many differences regarding sales versus non-
sales staff, the type of trade show, and the business actions of the exhibitors. This
indicates that the sales process at trade shows has a tendency to be standardised.
This means that trade-show organisers can develop standardised instructional
material for exhibitors to assist them in exhibiting. This is a great benefit for
businesses that decide to exhibit at trade; shows since they now have an
opportunity to exhibit at different types of trade shows, and not only to make use of
salespersons when exhibiting.
© University of Pretoria

325
The research findings are also valuable for trade-show organisers; and they could
provide exhibitors with standardised information that does not have to be adapted
to training material, or to provide different information for different exhibitors.
© University of Pretoria
326
LIST OF REFERENCES
Adcock, D., Halborg, A. & Ross, C. 2001. Marketing principles and practice. 4th
ed. Essex: Pearson.
Åge, L.J. 2011. Business Manoeuvring: A Model of B2B Selling Process.
Management Decisions, 49(9):1-33.
Alessandra, T., Underation, S. & Zimmerman, S. M. 2009. The platinum rule for
trade show mastery. Garden City: Platinum Rule Press.
Andreae, M., Hsu, J. & Norcliffe, G. 2013. Performing the trade show: The case of
the Taipei international cycle show. Geoforum, 49:193-201.
Arora, R. & Mahankale, N. R. 2013. Marketing research. New Delhi: PHI Learning.
Asthena, H. S. & Bhushan, B. 2005. Statistics for social sciences. New Delhi:
Prentice-Hall.
Autry, C. W., Wiliams, M. R. & Moncrief, W. C. 2013. Improving professional
selling effectiveness through the alignment of buyer and seller exchange
approaches. Journal of Personal Selling & Sales Management, 33(2):165-184.
Bathelt, H. & Schuldt, N. 2008. Between luminaries and meat grinders:
International trade fairs as temporary clusters. Regional Studies, 42(6):853-568.
Bathelt, H., Golfetto, F. & Rinallo, D. 2014. Trade shows in globalizing economies.
Oxford: Oxford.
Bauer, T., Law, R., Tse, T. & Weber, K. 2008. Motivation and satisfaction of mega-
business event attendees. International Journal of Contemporary Hospitality
Management, 20(2):228-234.
© University of Pretoria
327
Belch, G.E. & Belch, M.A. 2007. Advertising and promotion. 7th ed. Boston:
McGraw-Hill.
Bellizzi, J. A. & Lipps, D. J. 1984. Managerial guidelines for trade show
effectiveness. Industrial Marketing Management, 13:49-52.
Bello, D. C. & Barczak, G. J. 1990. Using industrial trade shows to improve new
product development. The Journal of Business & Industrial Marketing, 5(2):43-56.
Berndt, A. & Petzer, D. 2011. Marketing research. Pinelands: Pearson Education.
Berne, C. & García-Uceda, M. 2008. Criteria involved in evaluation of trade shows
to visit. Industrial Marketing Management, 37(5):565-579.
Berridge,G. 2007. Event Design and Experience. Burlington: Elsevier.
Bettis-Outland, H., Johnston, W. J. & Wilson, R. D. 2012. Using trade show
information to enhance company success: an empirical investigation. Journal of
Business & Industrial Marketing, 27(5):384–391.
Biemans, W. G., Brenčič, M. M. & Malshe, A. 2010. Marketing-sales interface
configuration in B2B firms. Industrial Marketing Management, 39:183-194.
Bingham, F. G., Gomes, R. & Knowles, P. A. 2005. Business marketing. 3rd ed.
Boston: McGraw-Hill / Irwin.
Blem, N. 2007. Achieving excellence in selling. 3rd ed. Cape Town: Oxford
University Press.
Blyth, J. 2005. Sales and key account management. London: Thomson learning.
Blyth, J. 2006. Principles and practice of marketing. London: Thomson Learning.
© University of Pretoria
328
Blythe, J. & Rayner, T. 1996. The evaluation of non-selling activities at British
trade exhibitions: an exploratory study. Marketing Intelligence & Planning,
14(5):20-24.
Blythe, J. 2002. Using trade fairs in key account management. Industrial Marketing
Management, 31(7):627.
Blythe, J. 2010. Trade fairs as communication: a new model. Journal of Business
& Industrial Marketing, 25(1):57-62.
Bluman, A. G. 2004. Elementary statistics. 5th ed. New York: McGraww-Hill
Education.
Boone, L. E. & Kurtz, D. L. 2012. Contemporary marketing. 15th ed. Mason:
South-Western.
Borg, S. W. & Young, L. 2014. Continuing the evaluation of the selling process: a
multi-level perspective. Industrial Marketing Management, 43:543-552.
Borghini, S., Golfetto, F. & Rinallo, D. 2006. Ongoing search among industrial
buyers. Journal of Business Research, 59:1151-1159.
Bradley, N. 2010. Marketing research tools & techniques. 2nd ed. Oxford: Oxford.
Breiter, D. & Milman, A. 2006. Attendees needs and service priorities in a large
convention center: Application of the importance-performance theory. Tourism
Management, 27:1364-1370.
Brennan, R., Canning, L. & McDowell, R. 2014. Business-to-Business marketing.
3rd ed. London: Sage Publication.
Brewer, G. 1996. Shout it. Sales and marketing management, 148(2):30-42.
Brown, T. J. & Suter, T. A. 2012. MR. 2nd ed. Mason: South-Western.
© University of Pretoria
329
Burgess, S. M. & Bothma, C. H. 2007. International marketing. Cape Town:
Oxford.
Burns, A. C. & Bush, R. F. 2010. Marketing research. 6th ed. Upper Saddle River:
Pearson.
Căescu, S. C. & Dumitri, I. 2011. Particularities of the competitive environment in
the Business to Business field. Management & Marketing, 6(2):273-284.
Cant, M. C, Strydom, J. W., Jooste, C. J. & du Plessis, P. J. 2006. Marketing
management. 5th ed. Cape Town: Juta.
Cant, M.C. & van Heerden, C.H. 2004. Personal selling. Lansdowne: Juta.
Casteleberry, S. B. & Tanner, J. F. 2011. Selling building partnerships. 8th ed.
New York: McGraw-Hill.
Cateora, P. R. & Graham, J. L. 1999. International marketing. 10th ed. Burr Ridge:
McGraw-Hill.
Cavanaugh, S. 1976. Setting Objectives and Evaluating the Effectiveness of Trade
Show Exhibits. The Journal of Marketing, 40(4):100-103.
Chizzoli, C., Pace, S. & Rinallo, D. 2007. The relative impact of demand proximity
and supply aggregation on exhibitor evaluation of international trade fairs:
proceedings of 6th International Conference Marketing Trends, held in Paris,
France on 26-27 January, 2007.
Churchill, G. A., Brown, T. J. & Suter, T. A. 2010. Basic marketing research. 7th
ed. Canada: South-Western Cengage Learning.
Churchill, G.A. & Iacobucci, D. 2005. Marketing research: Methodological
foundation. 9th ed. Mason: Thomson South-Western.
© University of Pretoria
330
Churchill, G.A. 2001. Basic marketing research. 4th ed. Mason: South-Western.
Cicala, J. E., Smith, R. K. & Bush, A. J. 2012. What makes sales presentations
effective- a buyer-seller perspective. Journal of Business & Industrial Marketing,
27(2):78-88.
Çonbanoğlu, E. & Turaeva, V. 2014. Effects of the pre-show, at-show and post-
show firm activities on trade show performance measurement. Procedia-Social
and Behavioural Sciences, 150:762-771.
Clow, K. E. & Baack, D. 2014. Integrated advertising, promotion and marketing
communications. 6th ed. Essex: Pearson.
Cooper, D. R. & Schindler, P. S. 2006. Marketing research. New York: McGraw-
Hill.
Corin, G. 2008. Verbal communication on 8 May. Ormonde (Digital recording in
possession of author).
Cova, B. & Salle, R. 2008. The industrial/consumer marketing dichotomy revisited:
a case of outdated justification? Journal of Business & Industrial Marketing,
23(1):3-11.
Coviello, N. E. & Brodie, R. J. 2001. Contemporary marketing practices of
consumer nd business-to-business firms: how different are they? Journal of
Business & Industrial Marketing, 16(5):382-400.
Dawes, P. L. & Massey, G. R. 2006. A study of relationship effectiveness between
marketing and sales managers in business markets. Journal of Business &
Industrial Marketing, 21(6):346-360.
Demkimpe, M. G., François, P., Gopalakrishna, S., Lilien, G. L. & van den Bult, G.
1997. Generalizing about trade show effectiveness: A cross-national comparison.
Journal of Marketing, 61(4):55-64.
© University of Pretoria

331
DeVellis, R. F. 2012. Scale development. 3rd ed. Chappell Hill. Sage.
DiPietro, R. B., Breiter, D., Rompf, P. & Godlewska, M. 2008. An exploratory study
of differences among meeting and exhibition planners in their destination selection
criteria. Journal of Convention & Event Tourism, 9(4):258-276.
Donaldson, B. 2007. Sales Management: principles, process and practice. 3rd ed.
New York: Palgrave MacMillan.
Donnelly, R. A. 2004. Statistics. 2nd ed. New York: Alpha Books.
Drohan, M. 2007. Following leads critical to trades show success. B to B, 92(9):32.
Duncan, T. 2005. Principals of advertising and IMC. 2nd ed. New York: McGraw-
Hill.
Du Toit, M. 2011. Fundamentals of sales and marketing. Landsdown: Juta.
Dwyer, F. R. & Tanner, J. F. 2002. Business marketing: connecting strategy,
relationships, and learning. 2nd ed. New York: McGraw-Hill.
Dwyer, F. R. & Tanner, J. F. 2009. Business Marketing. 4th ed. New York:
McGraw-Hill.
Ellis, N. 2011. Business-To-Business marketing: relationships, networks and
strategies. London: Oxford Press.
Elmaghraby, W. & Keskinocak, P. 2003. Dynamic pricing in the presence of
inventory considerations: research overview, current practices, and future
directions. Management Science, 49 (10):287-309.
ESOMAR. 2007. Market research handbook. West Sussex: John Wiley & Sons
Ltd.
© University of Pretoria
332
EXHIBIT. 2006. In: Oxford English Dictionary. 11th ed. Oxford: Oxford press.
EXHIBITION. 1964. In: Readers Digest great encyclopaedic dictionary. London:
Oxford University press.
Fabrigar, L. R. & Wegner, D. T. 2012. Exploratory factor analysis. New York:
Oxford.
Fayos-Solá, E., Narín, A. & Meffert, C. 1994. The strategic role of tourism trade
fairs in the new age of tourism. Tourism Management, 15(1):9-16.
Field, A. & Miles, J. 2010. Discovering statistics using SAS. London: Sage
Futrell, C.M. 2001. Sales management: teamwork, leadership, and technology. 6th
ed. New York: Harcourt College Publishers.
Futrell, C.M. 2011. Fundamentals of selling. 12th ed. Boston: McGraw-Hill/Irwin.
Gannon, S. 2012. The ultimate resource guide to the exhibition and events
industry 2012. Midrand: EXSA.
Geiger, S. & Kelly, S. 2014. Sales-as-practice: an introduction and methodological
outline. Journal of Personal Selling & Sales Management, 34(3):223-231.
Geigenmüller, A. 2010. The role of virtual trade fairs in relationship value creation.
Journal of Business & Industrial Marketing, 25(4):284-292.
Genoist, H. 2007. How enthusiastic are you?. Tradeshow Week, 37(47):14.
Ghauri, P. & Grønhaug, K. 2010. Research methods in business studies. 4th ed.
Dorchester: Pearson Education Limited.
© University of Pretoria
333
Ghingold, M. & Wilson, D. T. 1998. Buying center research and business
marketing practice: meeting the challenge of dynamic marketing. Journal of
Business & Industrial Marketing, 13(2):96-108.
Gibson, R. 2011. International trade fairs in the global political environment: An
empirical analysis of inter-firm interaction across capitalist systems. In: Annual
Meeting of the Canadian Political Association, held in Ontario Canada on 16-18
May 2011.
Gitman, L. J. & McDaniel, C. 2009. The future of business: the essential. 4th ed.
Mason: South-Western.
Goldbatt, J. 2005. Special Events. 4th ed. New Jersey: Wiley & Sons Inc.
Gopalakrishna, S. & Lilien, G.L. 1995. A three-stage model of industrial trade show
performance, Marketing Science, 14(1):22-42.
Gopalakrishna, S., Roster, C.A. & Sridhar, S. 2010. An exploratory study of
attendee activities at a business trade show. Journal of Business & Industrial
Marketing, 25(4):241-248.
Gopalakrishna, S. & Williams, J. D. 1992. Planning and performance assessment
of industrial trade shows: An exploratory study. International Journal of Research
in Marketing, 9:207-224.
Gosztonyi, A. 1997. Industrial trade shows: Their role and spatial dimensions in
industrial restructuring. M. A. thesis, University of Waterloo.
Gottlieb, U., Brown, M. & Ferrier, L. 2014. Consumer perceptions of trade show
effectiveness. European Journal of Marketing, 48(1/2):89-107.
Gottlieb, U., Brown, M. & Drennan. 2011. The influence of service quality and
trade show effectiveness on post-show purchase intention. European Journal of
Marketing, 45(11/12):1642-1659.
© University of Pretoria
334
Gregory, S. & Breiter, D. 2001. Trade show managers: profile in technology usage.
Journal of Conventions & Exhibition Management, 3(3):63-76.
Gu, Y., Yang, J. & Tang, X. 2010. Determinant of Chinese exhibitor satisfaction
and re-attend intention. In: IEEE: 10th International Conference on E-business and
E-government, held in Guangzhou China on 7 May, 2009.
Guenzi, P. 2001. Antecedents and consequences of a firm’s selling orientation.
European Journal of Marketing, 37(5/6):706-727.
Gummesson, E. & Polese, F. 2009. B2B is not an island. Journal of Business &
Industrial Marketing, 24 (5/6):337–350.
Hair, J.F., Bush, R.P. & Ortinau, D. J. 2000. Marketing research – a practical
approach for the new millennium. 7th ed. Boston: Irwin & McGraw-Hill.
Hair,J.F., Wolfinbarger, M. F., Ortinau, D. J. & Bush, R. P. 2010a. Essentials of
marketing research. 2nd ed. New York: McGraw-Hill Irwin.
Hair, J.F., Black, W.C., Babin, B.J., & Anderson, R.E. 2010b. Multivariate Data
Analysis. 7 th ed. New Jersey: Prentice Hall.
Halvadar, K. K. & Cavale, V.M. 2007. Sales and distribution management. New
Delhi: Tata McGraw-Hill.
Halvadar, K. K. 2014. Business marketing. 4th ed. New Delhi: Tata McGraw-Hill.
Hanchett, J. S. 2007. An Evaluation of the Performance of Trade Shows: An
Exploratory Study as Applied to the Aerospace Industry. PhDAB dissertation,
Touro University International.
Hanlon, A. 1982. Trade show in the marketing mix. Shrewsbury: Wordsworth
Publishers.
© University of Pretoria

335
Hansen, K. 1996. The dual motives of participants at international trade shows.
International Marketing Review, 13(2):39-59.
Hansen, K. 2004. Measuring performance at trade shows: scale development and
validation. Journal of Business Research, 57(1):1-13.
Hansen, J. M. 2009 The evolution of buyer-supplier relationships: an historical
industry approach. Journal of Business & Industrial Marketing, 23 (3/4):227-236.
Hawkins, D. I., Mothersbough, D. L. & Mookerjee, A. 2010. Consumer Behavior.
11th ed. New York: McGraw-Hill.
Hays, B. E. 1997. Measuring customer satisfaction: survey design, use, and
statistical analysis methods. 2nd ed. Milwaukee: ASQ Quality Press.
Herbig, P., O`Hara, B. & Palumbo, F. A. 1998. Trade shows: who, what, why.
Marketing Intelligence & Planning, 16(7):425-435.
Hollensen, S. 2010. Marketing management: a relationship approach. 2nd ed.
London: Pearson.
Housden, M. 2007. Marketing research and information. Oxford: Butterworth-
Heinemann.
Howell, D. 2010. Statistical methods for psychology. 7th ed. Bellmont: Cengage
Huges, M. 2007. What`s in you brochure?. Tradeshow week, 37(37):22.
Hutt, M. D. & Speh, T. W. 2007. Business marketing management: B2B. Student
ed. Mason: Thomson South-Western.
Indounas, K. & Avlonitis, G. 2011. New industrial service pricing strategies and
their antecedents: empirical evidence from two industrial sectors. Journal of
Business & Industrial Marketing, 26(1):26-33.
© University of Pretoria
336
Indounas, K. 2009. Successful industrial service pricing. Journal of Business &
Industrial Marketing, 24(2):86-92.
Ingram, T. N., LaForge, R. W., Avila, R. A., Schwepker, C. H., Williams, M. R.,
2001. Professional selling: a trust-based approach. Orlando: Harcourt College
Publishers.
Ingram, T.N., LaForge, R. W., Avila, R. A., Schwepker, C. H. & Williams, M. R.
2006. Sales management: analysis and decision making. 6th ed. Mason: Thomson
South Western.
Jain, R. 2010. Principles of marketing. Darya Ganji: V.K Enterprises.
Jaramillo, F. & Marshal, W. G. 2004. Critical success factors in the personal selling
process. The International Journal of Bank Marketing, 22(1):9-25.
Jensen, M. B. & Jepsen, A. L. 2007. Low attention advertising processing in B2B
markets. Journal of Business & Industrial Marketing, 22(5):342-348.
Jensen, M. B. 2008. Planning of online and offline B2B promotion with conjoint
analysis. Journal of Targeting, Measurement and Analysis for Marketing,
16(3):203-213.
Johansson, D. & Bengtsson, N. 2011. The silence at trade shows: A case study in
nonverbal communication at Hannover Messe. MBA. Thesis, Jönköping
University.
Johlke, M. C. 2006. Sales presentation skills and salesperson job performance.
Journal of Business & Industrial Marketing, 21(5):311-319.
Johnston, M. W. & Marshall, G. W. 2010. Relationship selling. 3rd ed. New York:
McGraw-Hill Irwin.
© University of Pretoria

337
Johnston, M. W. & Marshall, G. W. 2013a. Contemporary selling. 4th ed.
Abingdon: Routledge.
Johnston, M. W. & Marshall, G. W. 2013b. Sales force management. 11th ed.
Abingdon: Routledge.
Johnston, M. W. & Marshall, G.W. 2005. Relationship selling and sales
management. Boston: McGraw-Hill Irwin.
Jones, E. J., Stevens, C. & Chonko, L. 2005. Selling ASAP: art, sciences, agility,
performance. Mason: South-Western.
Joseph, R. 2004. Tradeshow strategies from a pro. Metal finishing, 102(6):76-79.
Judson, K., Schoenblacher, D.D., Gorden, G.L., Ridnour, R.E. & Weilbaker, D.C.
2006. The new product development process: let the voice of the salesperson be
heard. Journal of Product & Brand Management, 15(3):194-202.
Kellezi, J. 2013. The effectiveness of trade shows in global competition. European
Academic Research, 1(3):265-274.
Kang, J. 2007. The impacts of cognitive and affective values on tradeshow
exhibitor`s overall satisfaction and future behaviors. M.Sc. thesis, Las Vegas,
University of Nevada.
Kaplan, J. 2004. The failure of trade shows. Network World, 21(29):33.
Keller, G. & Warrack, B. 1997. Statistics for management and economics. 4th ed.
Pacific Grove: Duxbury
Kerin, R. A. & Cron, W., L. 1987. Assessing trade show functions and
performance: an exploratory study. Journal of Marketing, 51(July): 7-94.
© University of Pretoria

338
Kerin, R. A., Hartley, S. W. & Rudelius, W. 2008. Marketing: the core. 3rd ed.
Boston :McGraw-Hill.
Kijewski, V., Yoon, E. & Young, G. 1993. How exhibitors select trade shows.
Industrial Marketing Management, 22(4): 287-298.
Kirchgeorg, M., Dornscheidt, W. M., Giese, W. & Stoeck, N. 2005. Trade show
management. Wiesbaden:Gabler.
Kirchgeorg, M., Springer, C. & Kästner, E. 2010a. Objectives of successfully
participating in trade shows. Journal of Business & Industrial Marketing, 25(1):63-
72.
Kirchgeorg, M., Klante, O. & Jung, K. 2010b. The future of trade shows: insights
from a scenario analysis. Journal of Business and Industrial Marketing, 4(25):290-
312.
Koekemoer, L. 2005. Marketing communications. Lansdown: Juta and Co.
Kolb, B. 2008. Marketing research: a practical approach. London: SAGE.
Kotler, P. & Armstrong, G. 2010. Principles of marketing. Cape Town: Pearson
Education.
Kotler, P. & Keller, K. L. 2006. Marketing management. 12th ed. Upper Saddle
River: Pearson.
Kotler, P., Keller, K. L., Ang, S. H., Leong, S. M. & Tan, C. T. 2009. Marketing
management: an Asian perspective. 5th ed. Singapore: Prentice Hall / Pearson.
Lacey, R. & Morgan, R. M. 2009. Customer advocacy and the impact of B2B
loyalty programs. Journal of Business & Industrial Marketing, 24(1):3-13.
© University of Pretoria

339
Ladato, M. W. 2006. Integrated sales process management. Bloomington:
AuthorHouse.
Lamb, C.W., Hair, J.F., McDaniel, C., Boshoff, C. & Terblanché, N.S.C. 2015.
Marketing. 5th ed. Cape Town: Oxford University Press.
Lambert, B. W. & Kerkhoff, E. 2005. Sales pro success secrets: an insiders guide
to professional selling. San Francisco: Wiley and Sons.
Lancioni, R. 2005. Pricing issues in industrial marketing. Industrial marketing
management, 34:111-114.
Lee-Kelly, L., Gilbert, D. & Al-Shehabi, N, F. 2004. Virtual exhibitions: an
exploratory study of Middle East exhibitors` dispositions. International Marketing
Review, 21(6):634-644.
Lee, C. H. & Kim, S. Y. 2008. Differential effects of determinates on multi-
dimesions of trade show performance: By three stages of pre-show, at-show, and
post-show activities. Industrial Marketing Management, 37(2008):784-796.
Lee, S., Illia, A. & Lawson-Body, A. 2011. Perceived price fairness of dynamic
pricing. Industrial Management & Data Systems, 111(40):531-550.
Lee, M. J., Yeung, S. & Dewald, B. 2010. An Exploratory study examining the
determinants of attendance motivations as perceived by attendees at Hong Kong
exhibitions. Journal of Convention & Event Tourism, 11:195-208.
Leonidou, L.C. 2004. Industrial manufacturer – customer relationships: The
discriminating role of the buying situation. Industrial Marketing Management,
33:731-742.
Levin, Y., McGill, J. & Nediak, M. 2010. Optimal dynamic pricing of perishable
items by a monopolist facing strategic consumers. Production and Operations
Management, 19(1):40-60.
© University of Pretoria

340
Lewis-Beck, M., Bryman, A. & Futing, T. 2003. Encyclopaedia for research
methods for the social sciences. Thousand Oaks: Sage.
Li, P., Evans, K.R., Chen, Y. & Wood, C.M. 2011. Resource commitment
behaviour of industrial exhibitors: an exploratory study. Journal of business &
Industrial Marketing, 26(6):430-442.
Lichtenthal, J. H., Yadav, V. & Donthu, N. 2006. Outdoor advertising for business
markets. Industrial Marketing Management, 35:236-247.
Lilien, G. L. & Grewal, R. 2012. Handbook of business-to-business marketing.
Northampton: Edward Elgar Publishing Inc.
Lin, L. 2010. A perceptual measure of trade shows using fuzzy deployment
development. Expert Systems with Application, 37:3921-3933.
Ling-yee, L. 2006. Relationship learning at trade shows: Its antecedents and
consequences. Industrial Marketing Management, 35:166-177.
Ling-yee, L. 2007. Marketing resources and performance of exhibitor firms in trade
shows: A contingent resource perspective. Industrial Marketing Management,
26:360-370.
Ling-Yee, L. 2008. The effects of firm resources on trade show performance: how
do trade show marketing processes matter? Journal of Business & Industrial
Marketing, 23(1):35-47.
Ling-yee, L. 2010. Antecedents and effect of internet implementation for trade
shows. Journal of Business & Industrial Marketing, 25(4):272-283.
Livera, C. 2003. Why exhibiting is an essential part of the marketing mix. Technical
Textiles International, 12(2):2-4.
© University of Pretoria
341
Liu, L., Zeng, G., Teng, T. & Xin, X. 2011. An analysis of enterprise network
formation mechanism on the perspective of temporary cluster: A case study of
Shanghai and Chengdu trade fairs. In: IEEE: 18th International Conference, held
in Changchun China on 3-5 September, 2011.
Lopez, T. & McMillan-Capehart, A. 2009. Elements of salesperson control: an
organization theory perspective. Journal of Business & Industrial Marketing,
24(2):98-107.
Lu, Y. & Cai, L. A. 2009. Analysis of Image and Loyalty for Exhibitions and Host
Destinations. Paper presented at the 2009 International CHRIE Conference,
Amherst, 29 July – 1 August.
Malhotra, N.K. 2004. Marketing Research: an applied orientation. 4th ed. New
Jersey: Pearson Education International.
Malhotra, N. K. & Birks, D. F. 2007. Marketing research: an applied approach. 3rd
ed. Essex: Pearson Education Limited.
Malhotra, N. K., Birks, D. F. & Wills, P. A. 2012. Marketing research. 4th ed. New
Jersey: Pearson.
Malik, M. E. & Naeem, B. 2010. Commentary on role receptive and expressive
influence tactics and behaviours in personal selling process. Pakistan Economic
and Social Review, 48(1):21-38.
Malshe, A. 2011. An exploration of key connections within sales-marketing
interface. Journal of Business & Industrial Marketing, 26(1):45-57.
Manning ,G. L. & Reece, B. L. 2007. Selling today building quality partnerships.
10th ed. New Jersey: Prentice Hall.
Manning, G. L., Reece, B. L. & Ahearne, M. 2010. Selling today: creating customer
value. New Jersey: Pearson.
© University of Pretoria
342
Manning, G. L., Ahearne, M. & Reece, B. L. 2014. Selling today: partnering to
create value. 13th ed. New Jersey: Pearson
McCall, M. 2004. Selling relationships, not space. Tradeshow week, 34(33):18.
McCormack, M. H. 1996. Mark H. McCormack on selling. London: Arrow Business
Books.
McDaniel, C. & Gates, R. 2010. Marketing research essentials. 7th ed. Hoboken:
John Wiley & Sons.
McIntosh, M. H. 2008. Showstopper. Print Professional, 46(1):19.
Mèndez, J. L., Oubiña, J. & Rubio, N. 2006. Explanatory factors regarding
manufacturer brand price consistency. Journal of Product & Brand Management,
15(6):402-411.
Miller, S. 1999. How to get the most out of trade shows. 3rd ed. Lincolnwood: NTC
Business Books.
Miller, K. E. & Layton, R. A. 2000. Fundamentals of marketing. 4th ed. Sydney:
McGraw-Hill.
Milner, L. M. 2009. Consumer behavior at an industrial trade show. Tourism
Review, 64(4):4-11.
Molofsky, R. 2003. The trick of the trade shows. National Jeweller, 97(7):4.
Morris, M. H., Pitt, L. & Honeycutt, E. D. 2001. Business-to-business marketing.
Thousand Oaks: Sage Publications.
Munuera, J. L. & Ruiz, L. 1999. Trade fairs as services: a look at visitors’
objectives in Spain. Journal of Business Research, 44(1):17-24.
© University of Pretoria
343
Naudi, S. 2006. Sell benefits, not just features. Event, Jan:11.
Nazionale, L. 2010. The personal in selling. Pittsburgh: Dorrance Publishing Co.
Noad, J. & Rogers, B. 2008. The importance of retail atmospherics in B2B
retailing: the case of BOC. International Journal of Retail & Distribution
Management, 36(12):1002-1014.
Northrup, C.C. 2005. Encyclopaedia of World Trade: From Ancient Times to the
Present. Milton Park: Routledge.
O`Conner, J. 2001. Trade show reader volume 1. Richmond: TST Publishing.
O`Guinn, T. C., Allen, C. T. & Semenik, R. J. 2006. Advertising and Integrated
Brand Promotion. 4th ed. Mason: Thomson Higher Education.
O`Guinn, T. C., Allen, C. T. & Semenik, R. J. 2011. Promo. Mason: South-
Western.
O’Hara, B., Palumbo, F. & Herbig, P. 1993. Industrial trade shows abroad.
Industrial Marketing Management, 22:233-237.
Olivia, R. A. 2006. The three key linkages: improving the connections between
marketing and sales. Journal of Business & Industrial Marketing, 21(6):395-398.
Otto, K. F. 1983. Simulated trade fairs for high school students. Die
Unterrichtpraxis, 16 (2):267-273.
Pallant, J. 2013. SPSS survival manual. 5th ed. Crows Nest: Allen & Unwin.
Parvinen, P., Aspara, J., Hietanen, J. & Kajalo, S. 2013. Sales activity
systematization and performance: differences between product and service firms.
Journal of Business & Industrial Marketing, 28 (6): 494-505
© University of Pretoria

344
Peetz, S. 2008. Verbal communication on 2 June. Sandton. (Digital recording in
possession of author).
Percy, L. & Elliott, R. H. 2005. Strategic advertising management. 2nd ed. New
York: Oxford.
Phadtare, M. T. 2008. Industrial marketing. New Delhi: Prentice-Hall.
Piercy, N. F. 2010. Evolution of strategic sales organizations in business-to-
business marketing. Journal of Business and Industrial Marketing, 25(5):349-359.
Pitta, D. A., Weisgal, M. & Lynagh, P. 2006. Integrating exhibit marketing into
integrated marketing communications. The Journal of Consumer Marketing,
23(3):156.
Plouffe, C. R., Nelson, Y. H. & Beuk, F. 2013. Testing an enhanced, process-
based view of the sales process. Journal of Personal Selling & Sales
Management, 33(2):141-163.
Pride, W. M. & Ferrel, O. C. 2008. Marketing. 14de ed. Boston: Cengage Learning.
Pride, W. M. & Ferrel, O. C. 2011. Marketing Express. 2nd ed. Mason: South-
Western.
Pride, W. M., Hughes, R. J. & Kapoor, J. R. 2012. Business. 11th ed. Mason:
South-Western.
Pullins, E. B., Mallin, M. L., Buehrer, R. E., Jones, D. E. 2011. How salespeople
deal with intergenerational relationship selling. Journal of Business & Industrial
Marketing, 26(6):443-455.
Rauyruen, P, & Miller, K. E. 2006. Relationship quality as a predictor of B2B
customer loyalty. Journal of Business research, 60:21-31.
© University of Pretoria
345
Reeder, R. R, Brierty, E. G, & Reeder, B. H. 1991. Industrial marketing analysis,
planning and control. 2nd ed. Englewood: Prentice Hall.
Reilly, T. P. 2010. Value-added selling. 3rd ed. Boston: McGraw-Hill.
Reychav, I. 2011. Antecedents to acquisition of knowledge in trade shows.
Knowledge and Process Management, 18(4):230-240.
Rice, G. 1992. Using the interaction approach to understand international trade
shows. International Marketing Review, 9(4):32-45.
Rinallo, D., Borghini, S. & Golfetto, F. 2010. Exploring visitor experiences at trade
shows. Journal of Business & Industrial Marketing, 25(4):249-258.
Rinallo, D. & Golfetto, F. 2006. Representing markets: The shaping of fashion
trends by French and Italian fabric companies. Industrial Marketing Management,
35:856-869.
Rittichainuwat, B. & Mair, J. 2011. Visitors attendance motivations at consumer
travel exhibitions. Tourism Management, 33(5):236-1244.
Rix, P. 2006. Selling: managing customer relationships. 3rd ed. North Ryde:
McGraw-Hill.
Rix, P., Buss, J. & Herford, G. 2006. Selling: a consultative approach. 3rd edition.
Sydney: McGraw-Hill.
Robbe, D. B. 2000. Expositions and Trade Shows. New York: John Wiley & Sons.
Roberts, M. J. & Russo, R. 1999. A students guide to analysis of variance.
London: Routledge.
© University of Pretoria

346
Rodriguez, M., Dixon, A. L. & Peltier, J. W. 2014. A review of the interactive
marketing literature in the context of personal selling and sales management.
Journal of Research in Interactive Marketing, 8(4):294-308.
Rosson, P. J. & Seringhaus, F.H. 1995. Visitor and Exhibitor Interaction at
Industrial Trade Fairs, Journal of Business Research, 32(1):81–90.
Russell, J. T. & Lane, R. W. 2002. Advertising procedure. 15th ed. Upper Saddle
River: Prentice Hall.
Saget, A. 2006. The event marketing handbook. Chicago: Kaplan Publishing.
Salkind, N. J. 2010. Statistics for people who (think they) hate statistics. 4th ed.
Thousand Oaks: Sage.
Sarin, S. 2013. Business marketing: concepts and cases. Dilshad Garden:
McGraw Hill.
Saunders, M., Lewis, P. & Thornhill, A. 2009. Research methods for business
students. 5th ed. Harlow: Pearson Education.
Seminik, R. J. 2002. Promotion and integrated marketing communication.
Cincinnati: South-Western.
Seringhaus, F. H. R. & Rosson, P. J. 1998. Management and performance of
international trade fair exhibitors: government stands vs independent stands.
International Marketing Review, 15(5):398-412.
Seringhaus, F. H. R. & Rosson, P. J. 2004. An analysis for performance
measurement of international trade fair exhibitors. Problems and Perspectives in
Management, 4:152-165.
Shah, K. & D`Souza, A. 2009. Advertising and promotions: an IMC perspective.
Delhi: Tata McGraw-Hill.
© University of Pretoria
347
Shannanhan, R. J., Bush, A. J., Moncrief, W. C. & Shannahan, K. L. 2013. Making
sense of the customers role in the personal selling process: a theory of organizing
and sensemaking perspective. Journal of Personal Selling & Sales Management,
33(3):261-275.
Sharland, A. & Balogh, P. 1996. The value of nonselling activities at international
trade shows. Industrial Marketing Management, 25:59-66.
Sheth, J.N. & Sharma, A. 2008. The impact of product to service shift in industrial
markets and evolution of the sales organization. Industrial Marketing Management,
37(3):260-269.
Shimp, T. A. 2003. Advertising, promotion & supplemental aspects of integrated
marketing communication. 6th ed. Mason: South-Western.
Shimp, T. A. 2007. Integrated marketing communications in advertising and
promotion. 7th ed. Mason: Thomson/South-Western.
Shoham, A. 1992. Selecting and evaluating trade shows. Industrial Marketing
Management, 21:335-341.
Simons, H. 1955. World goes to fair. The Science News-Letter, 12:186-187.
Siskind, B. 2005. Powerful exhibit marketing. Mississauga: John Wiley & Sons.
Sirias, D., Krupp, S. & Biskup, M. 2013. Better buy case: Managing the sales
process. International Journal of Business and Social Science, 4(15):1-9.
Skallerud, K. 2010. Structure, strategy and performance of exhibitors at individual
booths versus joint booths. Journal of Business & Industrial Marketing, 25(4):259-
267.
© University of Pretoria

348
Smith, T. M., Gopalakrishna, S. & Smith, P. M. 2004. The complementary effect of
trade show on personal selling. International Journal of Research in Marketing,
21(2004):61-76.
Smith, T. M., Hama, K. & Smith, P. M. 2003. The effect of successful trade show
attendance on future show interest: exploring Japanese attendee perspectives of
domestic and offshore international events. Journal of Business & Industrial
Marketing, 18(4/5):403-418.
Søilen, K. S. 2013. Exhibit marketing and trade show intelligence. Heildeberg:
Springer.
Spiro, R.L., Stanton W.J. & Rich, G.A. 2007. Management of a sales force.
12th ed. Boston: McGraw-Hill Irwin.
Stevens, R. P. 2005. Trade show and event marketing. Mason: Thomson Higher
Education.
Suh, E. 2003. Maximizing the impact of sponsorship: An examination of
sponsorship on attendees recognition of sponsorship and their attitudes toward
corporate sponsorship. MS Thesis, Las Vegas: University of Nevada.
Suh, E., Love, C. & Bai, B. 2004. An examination of the impact of sponsorship on
attendees’ recognition of sponsors. Journal of Convention & Event Tourism,
6(4):27-46.
Summers, P. 1992. How to get the most from your trade show exhibit.
Telemarketing, 10(11):46.
Tafesse, W. & Korneliussen, T. 2011. The dimensionality of trade shows
performance in an emerging market. International Journal of Emerging Markets,
6(1):38-49.
© University of Pretoria
349
Tafesse, W. 2013. Understanding how resource deployment strategies influence
trade show organizers performance effectiveness. European Journal of Marketing,
48 (5/6): 1009-1025.
Täger, U. W. & Penzkofer, H. 2005. Production and employment effects of trade
fairs and exhibitions. In: Kirchgeorg, M., Dornscheidt, W. M., Giese, W. & Stoeck,
N. (Eds). Trade Show Management. Wiesbaden:Gabler:127-142.
Talloo, T. J. 2007. Business organisation and management. New Delhi: Tata
McGraw-Hill.
Tanner, J. F. & Chonko, L. B. 1995. Trade show objectives, management, and
staffing practices. Industrial Marketing Management, 24:257-264.
Tanner, J. F., Chonko, L. B. & Ponzurick, T. V. 2001. A learning model of trade
show attendance. Journal of Convention & Exhibition Management, 3(3):3-26.
Tanner, J.F. 2002. Levelling the playing field: factors influencing trade show
success for small companies. Industrial Marketing Management, 31(3):229-239.
Tassiopoulos, D. 2010. Events management: A development and managerial
approach. 3rd ed. Claremont: Juta
Tebachnick, B. G. & Fidell, L. S. 2013. Using multivariate statistics. 6th ed. New
York: Pearson.
Tufel, G. 2004. Casting a perfect attendee lure. Tradeshow Week, March:8.
Tustin, D. H., Lighthelm, A. A., Martins, J. H. & van Wyk, H. 2009. Marketing
research in practice. Pretoria: Unisa Press.
Valero, G. 2006. Looking for answers? Find them at trade shows. Metal-powder,
September:3.
© University of Pretoria
350
Van der Wagen, L. 2005. Event Management for tourism, culture, business and
sporting events. 2nd ed. Frenchs Forest: Pearson.
Van Eck, R. 2008. Capitalizing on consumers. Journal of Marketing,
February/March:10-11.
Van Rensburg, D. B. 2008. Directional marketing. Pretoria: Consulter.
Van Veijeren, C. F. 1994. Industrial marketing. Kenwyn: Juta & Co.
Virtsonis, N. & Harridge-March, S. 2008. Website elements in B2B online
communications: a case from the UK print industry. Marketing Intelligence &
Planning, 26(7):669-718.
Viviers, T. 2013. South African entertainment and media outlook: 2013 -2017. 4th
ed. Sunninghill: PricewaterhouseCoopers Inc.
Weinrauch, J. D., Stephens-Friesen, M., & Carlson, R. 2001. Improving the
viability of manufacturers' representatives with industry-based sales training
initiatives. The Journal of Business and Industrial Marketing, 16(3):183-198.
Weitz, B. A., Castelberry, S. B. & Tanner, J. F. 2007. Selling building partnerships.
6th ed. New York: McGraw-Hill.
Weitz, R. & Rosenthal, D. 2010. Valuing a B2B Website: A Case Study Of An
Industrial Product Supplier. Journal of Business Case Studies, 6(5):59-64.
Welman, C., Kruger, F. & Mitchell, B. 2005. Research methodology. 3rd ed.
Goodwood: Oxford.
Whitfield, J. & Webber, D. J. 2011. Which exhibition attributes create repeat
visitation. International Journal of Hospitality Management, 30:439-447.
Wiid, J. 2013. Distribution management. Landsdown: Juta.
© University of Pretoria
351
Wiid, J. & Diggines, C. 2015. Marketing research. 3rd ed. Landsdowne: Juta and
Company Ltd.
Wilkinson, T. & Brouthers, L.E. 2006. Trade promotion and SME export
performance. International Business Review, 15(3):233-252.
Wills, A. 2004. In the beginning is the audience. Event, October:12.
Wills, A. 2005. Most exhibitors plan to treble their investment. Event, April:9
Wilson, J.M. & Hunt, C.S. 2011. The impact of Sales Engineers on Salesperson
Effectiveness. Journal of Marketing Development and Competitiveness, 5(2):130-
138.
Wimberly, R. 2007. The Message Gets Personal. Tradeshow week, 37(27):4-10.
Whitfield, J. & Webber, D. J. 2011. Which exhibition attributes create repeat
visitation. International Journal of Hospitality Management, 30:439-447.
Woolard, C. 2007. "The importance of pre- and post- event planning", B to B,
92(3):34.
Woolard, C. 2007. The importance of pre- and post-event planning. B to B,
92(3):34.
Wu, J., Lilien, G. L. & Dasgupta, A. 2008. An exploratory study of trade shows
formation and diversity. Journal of Business-to-Business Marketing, 15 (4):397-
424.
Yeshin, T. 2006. Advertising. London: Thomson learning.
Yuksel, U. & Voola, R. 2010. Travel trade shows: exploratory study of exhibitors’
perceptions. Journal of Business & Industrial Marketing, 25(4):293-300.
© University of Pretoria
352
Zhang, L., Qu, H. & Ma, J. E. 2010. Examining the relationship of exhibition
attendees satisfaction and expenditure: The case of two major exhibitions in
China. Journal of Convention & Event Tourism, 11(2):100-118.
Zikmund, W. G. & Babin, B. J. 2010. Exploring marketing research. 10th ed.
Canada: South-Western Cengage Learning.
Zikmund, W. G. & d`Amico, M. 2001. Marketing. 7th ed. Cincinnati: South-Western
College Publishing.
Zikmund, W.G. 2003. Exploring marketing research. 8th ed. Mason: South-
Western College Publishing.
Zimmerman, A. & Blyth, J. 2013. Business-to-business marketing management.
2nd ed. New York: Thomson Learning.
© University of Pretoria
353
APPENDIX A QUESTIONNAIRE
Faculty of Economic and Management Sciences
Informed consent for participation in an academic
research study
Dept. of Marketing and Communication Management
THE SALES PROCESS AT TRADE SHOWS
Research conducted by: Mr. G.A.P. Drotsky (10676555)
Cell: 082 4714 973 Dear Respondent You are invited to participate in an academic research study conducted by Antonie Drotsky, a Doctoral student from the Department Marketing and Communication Management at the University of Pretoria. The purpose of the study is to establish the role of the selling process at trade show. Please note the following: This study involves an anonymous survey. Your name will not appear on the questionnaire and
the answers you give will be treated as strictly confidential. You cannot be identified in person based on the answers you give.
Your participation in this study is very important to us. You may, however, choose not to participate and you may also stop participating at any time without any negative consequences.
Please answer the questions in the attached questionnaire as completely and honestly as possible. This should not take more than 15 minutes of your time.
The results of the study will be used for academic purposes only and may be published in an academic journal. We will provide you with a summary of our findings on request.
Please contact my supervisor, Dr. M Wiese at [email protected] if you have any questions or comments regarding the study.
Please sign the form to indicate that: You have read and understand the information provided above. You give your consent to participate in the study on a voluntary basis. ___________________________ ___________________ Respondent’s signature Date
© University of Pretoria

354
SECTION A
1. Type of trade of trade show your business exhibit at the majority of times:
Regional 1 Nationally 2 International 3 V2
2. What is your position in the business? [Only select one]: Owner, Partner/ Member/ Managing Member 1 Director/MD – Non-owner/partner/member 2 Marketing 3 Trade show coordinator 4 Sales 5 Purchasing 6 Brand manager 7 Other Specify
8 V3
3. Years of service at business:
Up to 15 1 15 years or more 2 V4
4. Which do you regard as the (a) primary economic sector that your business operates in? (Select only one) (b) In what other economic sector do you operate (secondary)? (Select only one)
(a) Primary (b) Secondary Manufacturing 1 1 Construction 2 2 Wholesale & Retail 3 3 Repair & Maintenance Services 4 4 Accommodation, Restaurants, Catering & Conference 5 5 Transport, Storage and Communication 6 6 Financial Intermediation & Insurance 7 7 Business Services – Professional (attorneys, accountants, consulting engineers, architects, quantity surveyor)
8 8
Business Services – Other 9 9 Real Estate 10 10 Community, Social & Personal Services – Professional (medical practitioners, dentists, psychologists, veterinarians)
11 11
Community, Social & Personal Services – Other 12 12 V5
5. Please tell me what your (a) primary (select only one) and (b) secondary business operations are. (a) Primary (b) Secondary Sales of goods (e.g. street trader, general dealer, car dealership, tavern or shebeen, butchery, supermarket, IT consulting firms, etc.)
1 1
Service industry (e.g. transport - taxi, repair services, dry cleaners, panel beater, bookkeepers, computer repair companies, etc.)
2 2
Construction (e.g. builder, painter, plumber, electrician, etc.) 3 3 Manufacturing (food & beverage, furniture, car assembly, chemicals, engineering, etc.)
4 4
Professionals with own consulting practice (eg medical practitioners, lawyers, occupational therapists, dentists, consulting engineers, architects)
5 5
Other (specify) 6 6 V6
© University of Pretoria

355
6. Number of products or service lines exhibited: 1 1 2 2 3 3 4 4 5 5 6 6 7 7 8 or more 8 V7
7. Number of exhibit staff that will be working during the full duration of the show: 1-2 1 3-4 2 5-6 3 7-8 4 9+ 5 V8
8. Number of exhibit staff that will be working per session for duration of the show: 1-2 1 3-4 2 5-6 3 7-8 4 9+ 5 V9
9. Estimated annual turnover for the past financial year: Less than R12 000 1 R12 001 – R25 000 2 R25 001 – R100 000 3 R100 001 – R250 000 4 R250 001 – R400 000 5 R400 001 – R600 000 6 R600 001 – R1 million 7 R1 million – R2 million 8 R2 million – R4 million 9 R4 million – R10 million 10 R10 million – R20 million 11 R20 million – R40 million 12 R40 million – R200 million 13 R200 million – R400 million 14 R400+ million 15 Don’t know/ Refused 99 V10
10. How many times did your business exhibit at trade shows in the last three years including this show: 1-2 1 3-4 2 5-6 3 7-8 4 9+ 5 Do not know 6 V11
11. Is your business operating on a regional, national or international level? [INTERVIEWER: Multiple answers allowed]:
Local/Regional (clients are located within your metro area) 1 National (have clients on a national level) 2 International (have clients on an international level) 3 V12
© University of Pretoria

356
SECTION B
The following statements are aimed to determine businesses` actions with regard to trade shows
Please indicate to what extent you agree or disagree with the statements below, using the five point scale 1 (Strongly disagree), 5 (Strongly agree) by marking the number of your choice with an X on the scale. Example of the scale
Strongly disagree
1
Disagree
2
Neither disagree nor agree
3
Agree
4
Strongly agree
5 1. Our business train and brief booth staff before the trade show
1 2 3 4 5 V13.1
2. Our business provided booth staff with product/service material to prepare them self for the trade show
1 2 3 4 5 V13.2
3. Our business have written financial objectives for the trade show
1 2 3 4 5 V13.3
4. Our business have written promotional objectives for the trade show
1 2 3 4 5 V13.4
5. Our business have written sales objectives for the trade show
1 2 3 4 5 V13.5
6. Our business exhibit at trade shows to get sales
1 2 3 4 5 V13.6
7. Our business planned before the trade show to exhibit to specific target customers
1 2 3 4 5 V13.7
8. Our business measures success at the trade show in terms of financial gains
1 2 3 4 5 V13.8
9. Our business measure trade show success by the number of new prospects
1 2 3 4 5 V13.9
10. Non-financial aspects is used to measure trade show success
1 2 3 4 5 V13.10
11. Our business use trade shows to introduce new products
1 2 3 4 5 V13.11
12. Trade shows are used to as platform to test new product concepts
1 2 3 4 5 V13.12
13. The business I work for use trade shows to collect information about competitors
1 2 3 4 5 V13.13
14. Trade shows provide our business with information on my industry
1 2 3 4 5 V13.14
15. Trade shows are used to maintain contact with exciting customers
1 2 3 4 5 V13.15
16. Trade shows are applied to develop new customer contacts
1 2 3 4 5 V13.16
17. Trade shows are used to get a competitive advantage over non-exhibiting competitors
1 2 3 4 5 V13.17
18. Trade shows are applied to enhance the business image
1 2 3 4 5 V13.18
19. Trade shows assist our business with other marketing communication functions
1 2 3 4 5 V13.19
20. Trade shows assist our business in the training of staff
1 2 3 4 5 V13.20
21. Trade shows assist our business to motivate staff
1 2 3 4 5 V13.21
22. Our business have a tracking system to keep information on attendees that visited our exhibit stand
1 2 3 4 5 V13.22
© University of Pretoria
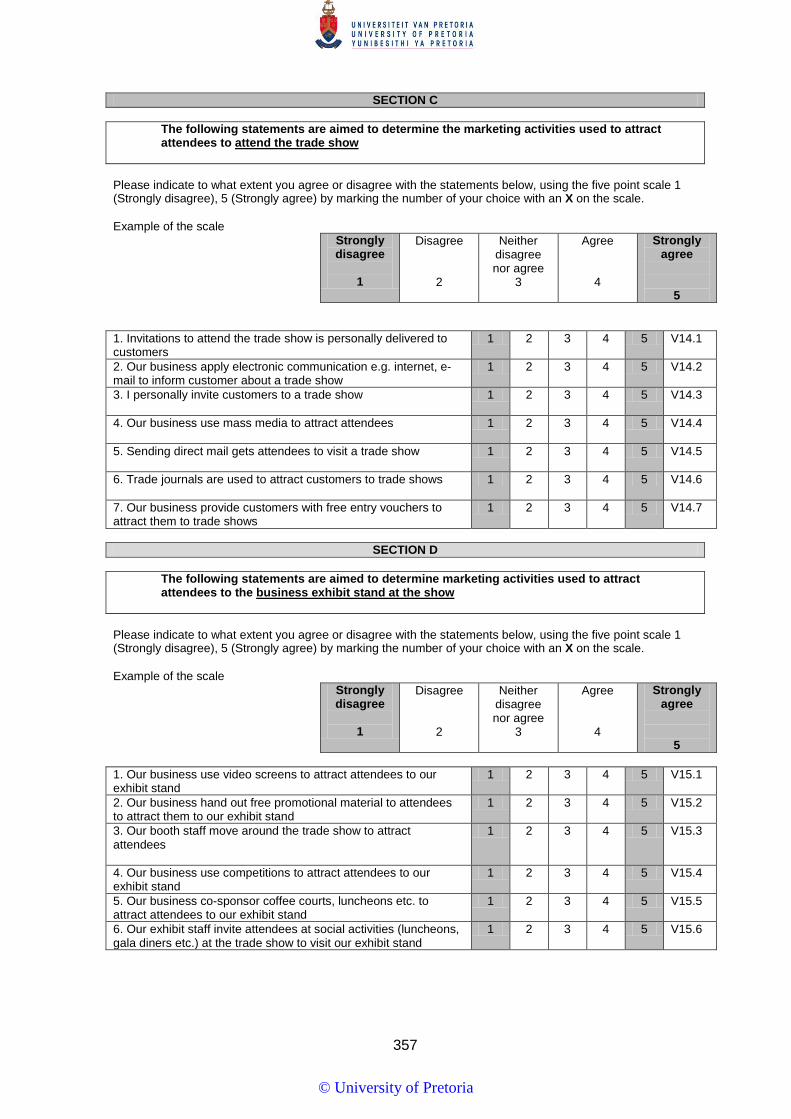
357
SECTION C
The following statements are aimed to determine the marketing activities used to attract attendees to attend the trade show
Please indicate to what extent you agree or disagree with the statements below, using the five point scale 1 (Strongly disagree), 5 (Strongly agree) by marking the number of your choice with an X on the scale. Example of the scale
Strongly disagree
1
Disagree
2
Neither disagree nor agree
3
Agree
4
Strongly agree
5 1. Invitations to attend the trade show is personally delivered to customers
1 2 3 4 5 V14.1
2. Our business apply electronic communication e.g. internet, e-mail to inform customer about a trade show
1 2 3 4 5 V14.2
3. I personally invite customers to a trade show
1 2 3 4 5 V14.3
4. Our business use mass media to attract attendees
1 2 3 4 5 V14.4
5. Sending direct mail gets attendees to visit a trade show
1 2 3 4 5 V14.5
6. Trade journals are used to attract customers to trade shows
1 2 3 4 5 V14.6
7. Our business provide customers with free entry vouchers to attract them to trade shows
1 2 3 4 5 V14.7
SECTION D
The following statements are aimed to determine marketing activities used to attract attendees to the business exhibit stand at the show
Please indicate to what extent you agree or disagree with the statements below, using the five point scale 1 (Strongly disagree), 5 (Strongly agree) by marking the number of your choice with an X on the scale. Example of the scale
Strongly disagree
1
Disagree
2
Neither disagree nor agree
3
Agree
4
Strongly agree
5 1. Our business use video screens to attract attendees to our exhibit stand
1 2 3 4 5 V15.1
2. Our business hand out free promotional material to attendees to attract them to our exhibit stand
1 2 3 4 5 V15.2
3. Our booth staff move around the trade show to attract attendees
1 2 3 4 5 V15.3
4. Our business use competitions to attract attendees to our exhibit stand
1 2 3 4 5 V15.4
5. Our business co-sponsor coffee courts, luncheons etc. to attract attendees to our exhibit stand
1 2 3 4 5 V15.5
6. Our exhibit staff invite attendees at social activities (luncheons, gala diners etc.) at the trade show to visit our exhibit stand
1 2 3 4 5 V15.6
© University of Pretoria

358
SECTION E
The following statements are aimed to determine sales presentation activities at the trade show exhibit stand
Please indicate the frequency applicable to the statements below using the five point scale 1 (Never), 5 (Always) by marking the number of your choice with an X on the scale. Example of the scale
Never
1
Rarely
2
Sometimes
3
Often
4
Always
5 1. I introduce myself to start the sales presentation
1 2 3 4 5 V16.1
2. I use a benefit of the product or service to start the sales presentation
1 2 3 4 5 V16.2
3. I start the sales presentation with a statement
1 2 3 4 5 V16.3
4. I use a compliment to start the sales presentation
1 2 3 4 5 V16.4
5. I start the sales presentation by asking questions to the attendees
1 2 3 4 5 V16.5
6. I use demonstrations to start the sales presentation
1 2 3 4 5 V16.6
7. I express an opinion to begin the sales presentation
1 2 3 4 5 V16.7
8. I use a memorised sales presentation at the trade show
1 2 3 4 5 V16.8
9. I use a sales presentation that follows a general outline to determine attendees’ needs
1 2 3 4 5 V16.9
10. I start the sales presentation with questions to determine attendees’ needs
1 2 3 4 5 V16.10
11. I use an in-depth analysis of attendees’ needs during the sales presentation
1 2 3 4 5 V16.11
12. I use the group sales presentation method
1 2 3 4 5 V16.12
13. I ask questions during the sales presentation to establish the customers’ interest in the product/service
1 2 3 4 5 V16.13
14. I use product/service demonstrations during the sales presentation
1 2 3 4 5 V16.14
15. I use information technology (e.g. a computer, PDA etc.) to demonstrate the product/service features
1 2 3 4 5 V16.15
16. I keep a note of the attendees’ interest in the product/service during the sales presentation
1 2 3 4 5 V16.16
17. I keep a record of attendee’s names that visit our exhibit stand
1 2 3 4 5 V16.17
SECTION F
The following statements are aimed to determine the type of objections that are raised during the sales presentation
Please indicate the frequency applicable to the statements below using the five point scale 1 (Never), 5 (Always) by marking the number of your choice with an X on the scale. Example of the scale
Never
1
Rarely
2
Sometimes
3
Often
4
Always
5
© University of Pretoria
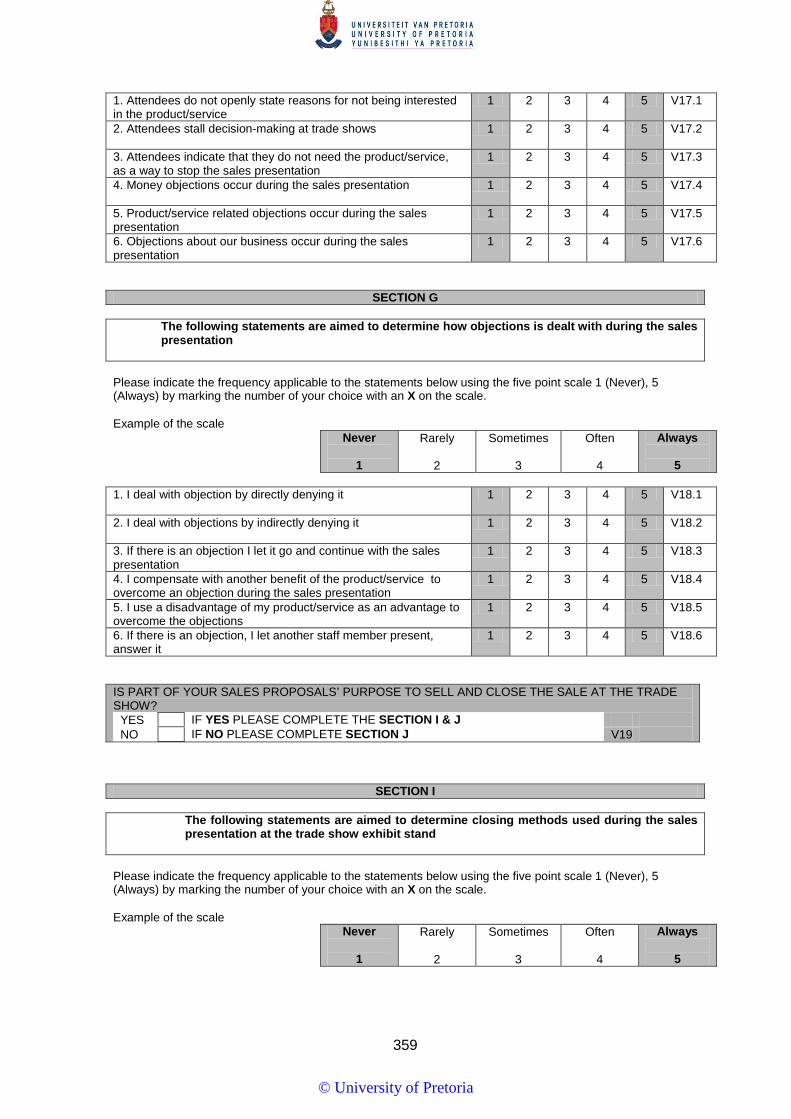
359
1. Attendees do not openly state reasons for not being interested in the product/service
1 2 3 4 5 V17.1
2. Attendees stall decision-making at trade shows
1 2 3 4 5 V17.2
3. Attendees indicate that they do not need the product/service, as a way to stop the sales presentation
1 2 3 4 5 V17.3
4. Money objections occur during the sales presentation
1 2 3 4 5 V17.4
5. Product/service related objections occur during the sales presentation
1 2 3 4 5 V17.5
6. Objections about our business occur during the sales presentation
1 2 3 4 5 V17.6
SECTION G
The following statements are aimed to determine how objections is dealt with during the sales presentation
Please indicate the frequency applicable to the statements below using the five point scale 1 (Never), 5 (Always) by marking the number of your choice with an X on the scale. Example of the scale
Never
1
Rarely
2
Sometimes
3
Often
4
Always
5 1. I deal with objection by directly denying it
1 2 3 4 5 V18.1
2. I deal with objections by indirectly denying it
1 2 3 4 5 V18.2
3. If there is an objection I let it go and continue with the sales presentation
1 2 3 4 5 V18.3
4. I compensate with another benefit of the product/service to overcome an objection during the sales presentation
1 2 3 4 5 V18.4
5. I use a disadvantage of my product/service as an advantage to overcome the objections
1 2 3 4 5 V18.5
6. If there is an objection, I let another staff member present, answer it
1 2 3 4 5 V18.6
IS PART OF YOUR SALES PROPOSALS’ PURPOSE TO SELL AND CLOSE THE SALE AT THE TRADE SHOW?
YES IF YES PLEASE COMPLETE THE SECTION I & J NO IF NO PLEASE COMPLETE SECTION J V19
SECTION I
The following statements are aimed to determine closing methods used during the sales presentation at the trade show exhibit stand
Please indicate the frequency applicable to the statements below using the five point scale 1 (Never), 5 (Always) by marking the number of your choice with an X on the scale. Example of the scale
Never
1
Rarely
2
Sometimes
3
Often
4
Always
5
© University of Pretoria
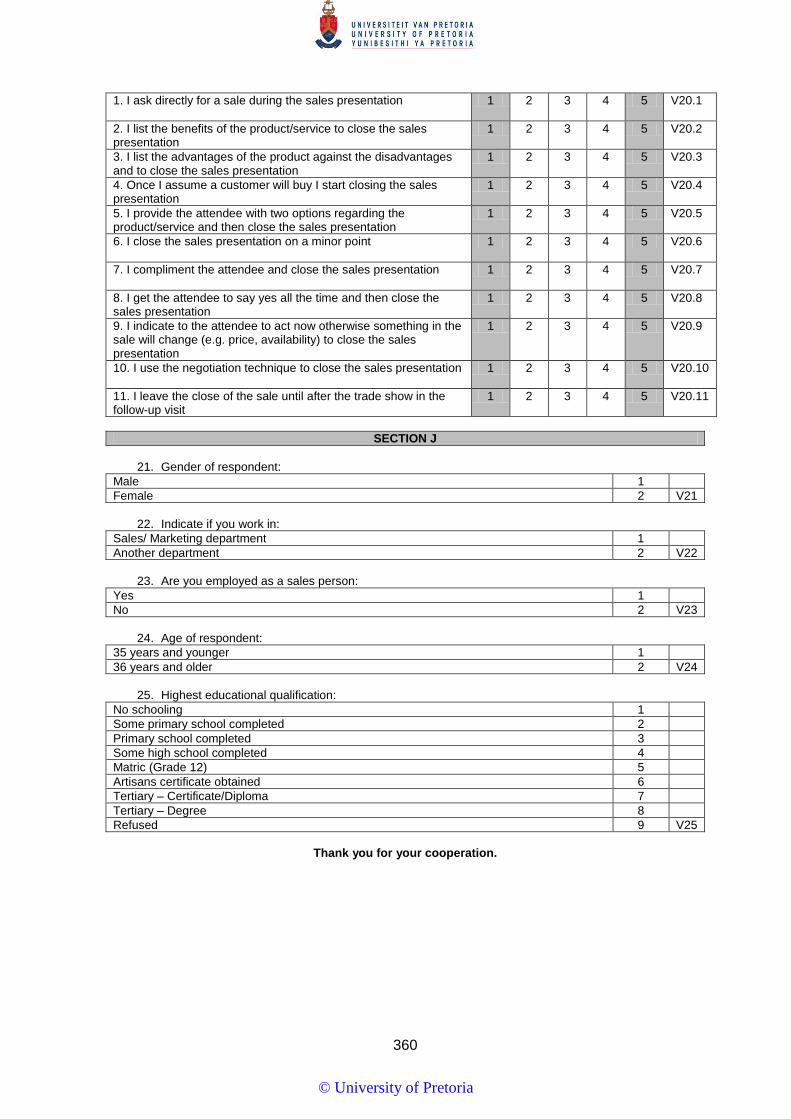
360
1. I ask directly for a sale during the sales presentation
1 2 3 4 5 V20.1
2. I list the benefits of the product/service to close the sales presentation
1 2 3 4 5 V20.2
3. I list the advantages of the product against the disadvantages and to close the sales presentation
1 2 3 4 5 V20.3
4. Once I assume a customer will buy I start closing the sales presentation
1 2 3 4 5 V20.4
5. I provide the attendee with two options regarding the product/service and then close the sales presentation
1 2 3 4 5 V20.5
6. I close the sales presentation on a minor point
1 2 3 4 5 V20.6
7. I compliment the attendee and close the sales presentation
1 2 3 4 5 V20.7
8. I get the attendee to say yes all the time and then close the sales presentation
1 2 3 4 5 V20.8
9. I indicate to the attendee to act now otherwise something in the sale will change (e.g. price, availability) to close the sales presentation
1 2 3 4 5 V20.9
10. I use the negotiation technique to close the sales presentation
1 2 3 4 5 V20.10
11. I leave the close of the sale until after the trade show in the follow-up visit
1 2 3 4 5 V20.11
SECTION J
21. Gender of respondent:
Male 1 Female 2 V21
22. Indicate if you work in: Sales/ Marketing department 1 Another department 2 V22
23. Are you employed as a sales person: Yes 1 No 2 V23
24. Age of respondent: 35 years and younger 1 36 years and older 2 V24
25. Highest educational qualification: No schooling 1 Some primary school completed 2 Primary school completed 3 Some high school completed 4 Matric (Grade 12) 5 Artisans certificate obtained 6 Tertiary – Certificate/Diploma 7 Tertiary – Degree 8 Refused 9 V25
Thank you for your cooperation.
© University of Pretoria
361
APPENDIX B TYPES OF CLASSIFICATION OF ATTENDEES AT TRADE SHOWS
In Chapter 3 of this study the different types of attendees that attend trade shows
are illustrated in Table 3.2. In this study attendees are not investigated but to
provide the reader with a better understanding each is discussed in greater detail
in this appendix due to the impact it may have on the sales process at trade
shows.
According to Tanner et al. (2001:4), the classification of attendees consists of
three dimensions namely: career, aware and shop. Each of the dimensions will
impact on the buying behaviour of the attendees and therefore influence how sales
people will sell to them.
• The career dimension includes attendees that attends seminars and do
most of their buying from the seminar content at a trade show and
secondary the trade floor. Seminars at trade shows are mostly done by
experts in specific field or exhibiting business demonstrating or launching
new products. Elements that is important to attendees that fall within the
career dimension is new technology, hands on experience, networking with
other users and to observe what other organisations are doing.
• The aware dimension focuses on long-term relationships that attendees
want to build with exhibiting organisations. In the aware dimension key
relationships is develop for the future.
• The shop dimension is product oriented. With the shop dimension
elements such as new products, examination of products and brand
comparison is the main focus.
Pitta et al. (2006:162) provide another way to classify attendees according to their
interest showed towards the exhibition booth:
• Aggressive attendees that is really interested in the products and made the
effort to get to the exhibit booth.
• Curious attendees that stand on the outside of booth but show interest.
© University of Pretoria
362
• Passive attendees that stays in the ails and sort of stopped and looked.
Golpalakrishna et al. (2010:245) make use of retail classification of shoppers to
classify attendees at trade shows and divide them into five segments:
• The basic shopper that makes about seven “serious” visits to different
exhibits while at a trades show. A basic shopper prefers larger and open plan
exhibits that can be accessed from all sides where they can meet their
objectives of attending the trade show while geting exposure to new goods.
• The enthusiast makes an average of 24 visits to different exhibits while at a
trade show. The majority of the enthusiast visits is related to their objectives
for visiting the trade show and they have high involvement with the product
categories. Enthusiast tends to move where there is a lot of movement and
therefore prefer larger exhibits where there is a variety of products.
• The niche shopper makes an average of 9.2 visits to different exhibits. What
makes the niche shopper different than the basic shopper and enthusiast is
that 40 percent of their visits are to smaller size exhibit. The niche shopper
are not influenced by the size or limited access to exhibits and are willing to
seek out speciality vendors that will meet their objectives of visiting the trade
show.
• The brand shopper makes an average of ten visits to different exhibits.
Brand shoppers prefer to visit larger, more popular exhibits and focus on
booths that they are interested.
• The apathetic shopper visits an average of seven exhibits and tends to
have no clear objectives when visiting a trade show. Apathetic shopper tends
to visit open booths that is open on three sides (peninsula booths) which is
situated to the sides of an exhibition hall indicating a preference toward easy
movement between exhibits. The apathetic shopper is attendees that find it
difficult to navigate the trade show floor or newcomers or someone that does
not know the trade show environment.
According to Lin (2010:3926), attendees at trade shows can be clustered into four
different groups regarding what they are aware of when attending a show.
© University of Pretoria
363
• The pleasure-conscious attendee that focus the enjoyment that they will
receive from a trade show. In dealing with this type of attendee elements
such as catering and merchandise is important.
• The price-conscious this type of attendee seeks self esteem and
decisions is the majority of time influenced by price considerations.
• The adventurous-conscious attendees that want to have experiences at
the trade show. This is expressed in the impulsive course of buying and
adventurous-conscious attendees make a lot of social contacts at a trade
show. In dealing with this type of attendee adequate catering services is
important.
• The target-conscious attendees want to gain new information and
knowledge. This attendee pursue their professional goals and it is important
for them to work while trade show shopping. In dealing with this the target-
conscious attendee new and diversified products must be offered.
Blythe (2010:58) provides yet another classification of trade show attendees based
on their communication:
• Tyre kickers. These attendees have no buying power although they will act
if they do. Tyre kickers do not have any intentions on buying and is more
focused on entertainment or information seeking.
• Wheeler-dealers. Are attendees that have the authority to make purchases
and are intend on buying. They will however negotiate for the best deals
and visit more than one supplier.
• Techocrats. This is attendees that are seeking information on the products
and are often engineers or technicians. They are interested in the technical
aspects of the product.
• Foxes. Are attendees that are at the trade show with ulterior motives this
can include selling to exhibitors, meet customers, or to seek information.
They can be either exhibitor or attendee.
• Day-trippers. They attend the trade show for entertainment purposes or to
gain information. This is mostly attendees that have an interest in the
industry and/or are there to enjoy a day out.
© University of Pretoria
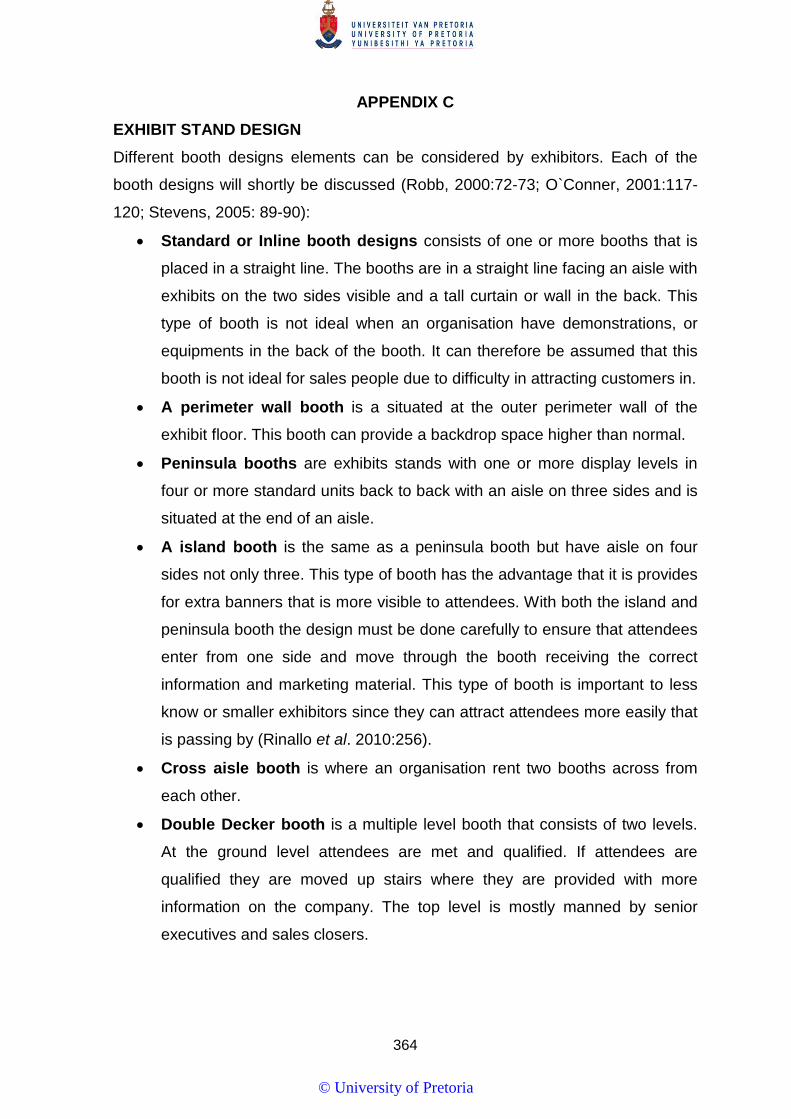
364
APPENDIX C EXHIBIT STAND DESIGN Different booth designs elements can be considered by exhibitors. Each of the
booth designs will shortly be discussed (Robb, 2000:72-73; O`Conner, 2001:117-
120; Stevens, 2005: 89-90):
• Standard or Inline booth designs consists of one or more booths that is
placed in a straight line. The booths are in a straight line facing an aisle with
exhibits on the two sides visible and a tall curtain or wall in the back. This
type of booth is not ideal when an organisation have demonstrations, or
equipments in the back of the booth. It can therefore be assumed that this
booth is not ideal for sales people due to difficulty in attracting customers in.
• A perimeter wall booth is a situated at the outer perimeter wall of the
exhibit floor. This booth can provide a backdrop space higher than normal.
• Peninsula booths are exhibits stands with one or more display levels in
four or more standard units back to back with an aisle on three sides and is
situated at the end of an aisle.
• A island booth is the same as a peninsula booth but have aisle on four
sides not only three. This type of booth has the advantage that it is provides
for extra banners that is more visible to attendees. With both the island and
peninsula booth the design must be done carefully to ensure that attendees
enter from one side and move through the booth receiving the correct
information and marketing material. This type of booth is important to less
know or smaller exhibitors since they can attract attendees more easily that
is passing by (Rinallo et al. 2010:256).
• Cross aisle booth is where an organisation rent two booths across from
each other.
• Double Decker booth is a multiple level booth that consists of two levels.
At the ground level attendees are met and qualified. If attendees are
qualified they are moved up stairs where they are provided with more
information on the company. The top level is mostly manned by senior
executives and sales closers.
© University of Pretoria
365
• Demonstration area is the space in which product demonstrations and
presentations take place between exhibit staff and attendees interacts any
tables and samples should not be places to close to the aisle.
• Tower displays that consist of detached exhibit components set apart from
the main exhibit and used for recognition and display purposes only.
Another aspect that can influence the layout of the exhibit space is whether an
organisation decided to use a joint or individual booth. Skallerud (2010:264)
argues that organisations that have individual boots provide more resources, plan
better and have more support from top management. Individual boots are manned
by more staff than joint boots that increases the interaction between the exhibitors
and the visitors at the trade show. As part of the before mentioned, Robb
(2000:73) indicates that is of the up importance that the sales and marketing
departments is consulted before a booth is designed for a trade show this will
ensure congruency with the cooperate vision. Rice (1992:43) further indicates that
an organisations resources and previous experience can have an impact on the
type of exhibition booth selected.
© University of Pretoria
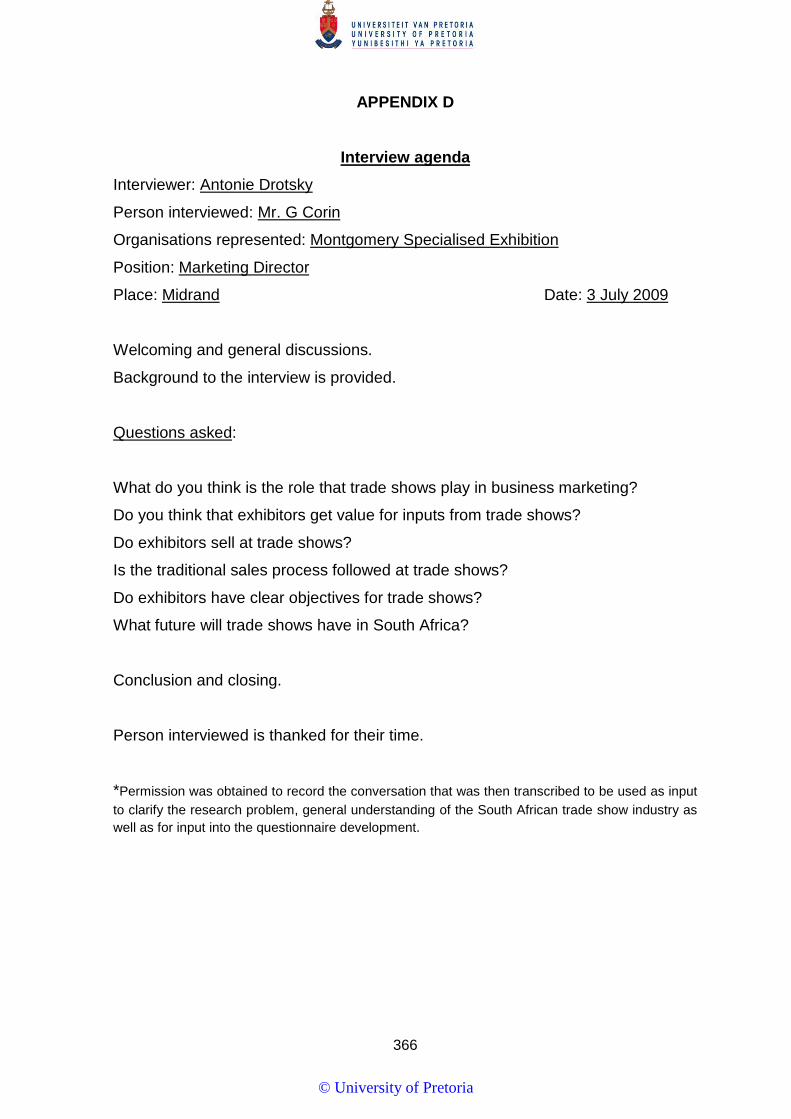
366
APPENDIX D
Interview agenda Interviewer: Antonie Drotsky
Person interviewed: Mr. G Corin
Organisations represented: Montgomery Specialised Exhibition
Position: Marketing Director
Place: Midrand Date: 3 July 2009
Welcoming and general discussions.
Background to the interview is provided.
Questions asked:
What do you think is the role that trade shows play in business marketing?
Do you think that exhibitors get value for inputs from trade shows?
Do exhibitors sell at trade shows?
Is the traditional sales process followed at trade shows?
Do exhibitors have clear objectives for trade shows?
What future will trade shows have in South Africa?
Conclusion and closing.
Person interviewed is thanked for their time.
*Permission was obtained to record the conversation that was then transcribed to be used as input to clarify the research problem, general understanding of the South African trade show industry as well as for input into the questionnaire development.
© University of Pretoria

367
APPENDIX E PILOT STUDY
According to Malhotra et al. (2012:476) pilot testing is the process of testing a
questionnaire on a small sample of participants to identify and eliminate potential
problems. It is suggested that a sample size of 10-20% of the actual study is a
reasonable number of respondents to enrol in the pilot study (Simon, 2011). The
pilot study for this study was done at the Afrimold trade show. Afrimold was
selected since it provided a smaller trade show that made access to the
respondents easier, while still reflecting the typical tradeshow identified for the
main study. A total of 42 respondents participated in the pilot study that is deemed
sufficient according to Malholtra et al. (2012:476).
Saunders et al. (2009:394) indicate that the starting point for a pilot study is to talk
to experts to comment on the representativeness and suitability of the questions
asked. In this study the questionnaire was discussed with the promoter of the
study Prof. M Wiese, Mr. Corin from Montgomary Specialised exhibitions a trade
show organiser, EXSA and the organiser of the Afrimold organisers. The
comments from the experts were used to make corrections and changes before
the pilot testing was done.
Through the use of the pilot study a number of factors that can have an impact on
the data gathering can be established (Saunders et al., 2009:394):
• How long does it take to complete the questionnaire;
• Is the instructions clear on completing the questionnaire;
• Was there unclear or ambiguous questions;
• Which questions was respondents not comfortable in answering;
• Did the respondents indicate that there is any omissions in the
questionnaire;
• Is the layout correct;
• Was there any other comments regarding the questionnaire.
© University of Pretoria

368
As indicated above the pilot study was done at the Afrimold trade show. The
researcher and two trained fieldworkers did the pilot study. The researcher was
present to conduct the pilot study. This was done to get a feel of possible
problems and get an idea of what data will be obtained from the questionnaire
(Malhotra et al., 2012:477). The researcher also observed the trained fieldworkers
to determine if they needed any more training or assistance before commencing
the fieldwork of the main study. At the trade show 42 questionnaires was
completed as part of the pilot study.
It was established in the pilot that the average time to complete the questionnaire
was between 14 and 20 minutes, with the majority of the respondents completing it
within 15 minutes. There was no other indication that the respondents experienced
any difficult in completing or understanding the questionnaire.
Saunders et al. (2009:394) postulate that part of the pilot study is to also test the
reliability of the data that will be obtained. Scale reliability is the extent to which a
scale can produce the same measurement results in repeated trials (Hair et al.,
2000:390-391). Once the questionnaires were inspected to ensure that they were
complete and useable, the data was captured in a Microsoft Excel spread sheet
and the reliability tested using the Cronbach’s Alpha coefficient. Cronbach’s Alpha
coefficient is the measurement of reliability that ranges from 0 to 1, with values of
0.60 to 0.70 deemed to be acceptable (Hair et al., 2010b:89 & 118). All the
Cronbach’s Alpha values were above 0.60, with the majority being above 0.70,
thus indicating acceptable reliability. The factor analysis indicated that the
individual questions items did indeed load onto various factors resembling the
proposed sales process. Once the pilot study was completed and the
questionnaire finalised, it was decided to continue with the data collection for the
final study.
© University of Pretoria