The role of diagrams in collaborative argumentation-based learning
19
International Journal of Educational Research 39 (2003) 113–131 Chapter 6 The role of diagrams in collaborative argumentation-based learning Lisette Munneke, Marije van Amelsvoort*, Jerry Andriessen Department of Educational Sciences, Utrecht University, Heidelberglaan 2, Utrecht CS 3584, The Netherlands Abstract In this article two studies on the use of diagrams in computer-supported collaborative learning are compared. Focus is on the way argumentative diagrams can be used during collaborative learning tasks, more specifically how diagrams support argumentative interaction between students when they discuss ill-defined topics. The main goal is to discover how diagram construction before discussion, and diagram construction during discussion, influence the way students explore the space of debate during discussion. Twenty pairs of 16/ 17-year-old students were randomly selected from 126 pairs. Ten pairs worked with a diagram before discussion and ten during discussion. The research showed that students use diagrams in very different ways, ranging from a means for talking to just a notebook. Our expectation that using a diagram during discussion leads to more depth in discussion than using one before discussion, was not confirmed. Possible explanations for this finding are structure of the task, and the way students interpreted the goal of the task. r 2003 Elsevier Ltd. All rights reserved. Keywords: Computer-supported collaborative learning; Representational tools; Argumentative interaction 1. Introduction Mike: I am against GMOs, because they can disturb the natural ecosystem. Bob: Yes, you are right. Mike: But, it is very handy to adapt those plants. ARTICLE IN PRESS *Corresponding author. E-mail address: [email protected] (M. van Amelsvoort). 0883-0355/$ - see front matter r 2003 Elsevier Ltd. All rights reserved. doi:10.1016/S0883-0355(03)00076-4
-
Upload
independent -
Category
Documents
-
view
0 -
download
0
Transcript of The role of diagrams in collaborative argumentation-based learning
International Journal of
Educational Research 39 (2003) 113–131
Chapter 6
The role of diagrams in collaborativeargumentation-based learning
Lisette Munneke, Marije van Amelsvoort*, Jerry Andriessen
Department of Educational Sciences, Utrecht University, Heidelberglaan 2, Utrecht CS 3584,
The Netherlands
Abstract
In this article two studies on the use of diagrams in computer-supported collaborative
learning are compared. Focus is on the way argumentative diagrams can be used during
collaborative learning tasks, more specifically how diagrams support argumentative
interaction between students when they discuss ill-defined topics. The main goal is to discover
how diagram construction before discussion, and diagram construction during discussion,
influence the way students explore the space of debate during discussion. Twenty pairs of 16/
17-year-old students were randomly selected from 126 pairs. Ten pairs worked with a diagram
before discussion and ten during discussion. The research showed that students use diagrams
in very different ways, ranging from a means for talking to just a notebook. Our expectation
that using a diagram during discussion leads to more depth in discussion than using one before
discussion, was not confirmed. Possible explanations for this finding are structure of the task,
and the way students interpreted the goal of the task.
r 2003 Elsevier Ltd. All rights reserved.
Keywords: Computer-supported collaborative learning; Representational tools; Argumentative
interaction
1. Introduction
Mike: I am against GMOs, because they can disturb the natural ecosystem.
Bob: Yes, you are right.
Mike: But, it is very handy to adapt those plants.
ARTICLE IN PRESS
*Corresponding author.
E-mail address: [email protected] (M. van Amelsvoort).
0883-0355/$ - see front matter r 2003 Elsevier Ltd. All rights reserved.
doi:10.1016/S0883-0355(03)00076-4

Bob: But what about evil people? They can misuse those GMOs.
Mike: You mean for biological weapons?
Bob: No not really, I mean for example that they change plants in such a way thatpeople get sick from eating them.
Mike: That is what I meant with biological weapons.
Bob: Ok, that is clear.
This fragment is part of an electronic interaction between two secondary schoolstudents in a computer-supported collaborative learning environment. They chatabout the topic of genetically modified organisms (GMOs). One may ask questionsabout the quality of the fragment: is this a ‘good’ discussion? Do these students learnsomething here? What support is needed to make this a valuable learning experiencein everyday classroom practice? In this paper, we zoom in on a specific kind ofcollaborative interaction: argumentative interaction. We describe argumentativeinteractions, and how to support these with a specific tool: a computer-basedargumentative diagram. Two ways of constructing diagrams, before and during thediscussion, are compared with respect to how well students explore the space ofdebate in the domain of GMOs.
2. Theoretical background
2.1. Collaborative learning and ICT in the Dutch classroom
The focus in research on collaborative learning has shifted from products andindividual participants to the social interaction during the collaborative process(Dillenbourg, Baker, Blaye, & O’Malley, 1996). In focusing on the interaction,researchers try to understand what happens during the collaboration in order todesign learning tasks and tools to support the interaction between students.It is not always clear what collaborative learning is. Andriessen and Sandberg
(1999) define three types of educational contexts in which collaborative learningplays different roles: the transmission scenario, the studio scenario, and thenegotiation scenario. In the transmission scenario emphasis is put on knowledge aschunks of information that are more or less directly transmittable from an expertteacher to a novice student. Collaboration is mainly considered to be useful forlearning and practicing skills (Luttik, 1998). If students collaborate, they do this bydividing rather than sharing tasks. In the studio scenario the focus is on knowledgeas actively processed by learners instead of learning ‘set’ knowledge. Theresponsibility for learning resides more with the students. Collaborative learning isa goal in itself in this scenario, because collaboration requires active learningand thinking by the individual student. In the negotiation scenario, the emphasis isput on knowledge building as a process of collective interaction. The goalis not knowledge acquisition per se, but learning to participate in the discourses
ARTICLE IN PRESSL. Munneke et al. / Int. J. Educ. Res. 39 (2003) 113–131114

of knowledge domains. Collaborative learning is a natural and essentialcharacteristic of learning in this scenario, because students need to communicateand negotiate with others to understand and develop knowledge within thediscourse community.The innovation that secondary education in the Netherlands went through since
1999, can be described as a transition from transmission to negotiation scenario.Currently all upper secondary education schools have introduced the ‘Study House’,in which active acquisition and collaborative construction of knowledge in project-based settings is emphasized (Stuurgroep Profiel Tweede Fase Voortgezet Onderwijs,1994). An essential part of the Study House is the use of ICT; one of its goals is forall students to be able to work with ICT applications individually andcollaboratively. Students do not only need to learn to work with computers as agoal in itself, but computers can also be used as a means to reach the neweducational goals (Stichting ICT op school, 2001). A short survey on teachers’ ideason ICT and collaborative learning (Deliverable 8, SCALE-team, 2002a, b) showedthat they are very interested in learning more about collaboration and thepossibilities of using computer tools to implement the educational innovations.They also were very eager to see and use our computer tool because they indicatedthere was a shortage of educational software.
2.2. Argumentative interaction in collaborative learning
The focus on collaborative processes is entirely in line with the new view onclassroom practice. One characteristic of this educational innovation is that theproblems students encounter in classroom practice are linked to the problems ofdaily life. These types of problems have been called wicked (Rittel & Webber, 1984;Van Bruggen & Kirschner, 2003), implying that there are many acceptable solutions,and many stakeholders whose views on the problem may vary even during theprocess.Collaboration in such cases is often not guided by scripts or clear-cut solution
criteria, since solving wicked problems requires many skills, such as negotiationabout possible solutions. We see argumentation as one of the important activities fornegotiation (Baker, 1994; Andriessen, Erkens, Peters, van de Laak, & Coirier, 2003).Argumentation in this context is the production of opinions accompanied by reasonsin favor or against, in combination with questioning, clarification, explanation andacknowledgement. It is not a mere confrontation of points of view (Baker, 2003),because in some cases a strict dialectic argumentation could be inefficient forlearning. Clear defined opinions and indisputable attitudes towards a position mayform an epistemological obstacle for students (Baker, 1999). Stein, Bernas andCalicchia (1997) confirmed this idea in an experiment where they asked students todiscuss two real life conflicts. It appeared that when students ended a discussion in acompromise, they gathered more knowledge of the content of arguments and hadmore balanced knowledge of both sides of a position. We also need to be aware ofthe fact that good argumentation does not necessarily imply a good learning process.Hence, ‘bad’ arguments can be a more important trigger for learning than good ones,
ARTICLE IN PRESSL. Munneke et al. / Int. J. Educ. Res. 39 (2003) 113–131 115
because they require activities that play an important role in learning, such asredefining concepts.In our research, the pedagogical objective is to create collaborative situations for
argumentation-based learning (CABLE, deliverables 1&2, SCALE-team, 2002a, b).Students do not need to learn factual information, but rather the type of knowledgethat is necessary to discuss a wicked topic. We want students to collaborativelyacquire, refine, and restructure knowledge of a space of debate. Students might do soin a number of ways, e.g. enumerate arguments, or elaborate upon one or morearguments. The best imaginable situation is one in which students co-construct anunderstanding of the space of debate by exploring it thoroughly in breadth and indepth. Broadening the space of debate is defined as students using differentepistemological and societal views with associated arguments. Deepening the spaceof debate is defined as students using many related concepts and modes of reasoningwhen exploring an argument or point of view.
2.3. Support of argumentative interaction
Recent research showed that students have problems with exploring the space ofdebate. Veerman, Andriessen, and Kanselaar (2002) showed that students, whenpresented with assignments in which argumentation is needed to arrive at a solution,tend to focus on the solutions instead of arguing the space of debate.One way to support the exploration of the space of debate is to provide
representational tools. With these tools users can construct, research and manipulatetheir own representation of knowledge. Van Bruggen, Boshuizen, and Kirschner(2002) mention several possible advantages of representations for argumentation.Firstly, the use of a representation forces students to make their opinions andarguments explicit. This sharing can stimulate students to negotiate and elaborate tocome to a shared understanding of the space of debate (see also Suthers, 2003).Secondly, representations can help students to maintain focus on the task, by makingthe argumentation visible. Thirdly, representations can support the maintaining ofconsistency, accuracy, and plausibility of the argumentation, since a visible structureclearly shows which arguments, relations and backing information are missing.There are different ways to represent and support argumentation. Van Bruggen
and Kirschner (2003) distinguish discussion-based tools and knowledge representa-tion tools. In discussion-based tools like CSILE (Scardamalia, Bereiter, & Lamon,1994) and the Collaborative Notebook (Edelson, O’Neill, Gomez, & D’Amico, 1995)the environment offers students the opportunity to exchange arguments, but thestructure of argumentation is not explicitly represented. In knowledge representationtools like Belv!ed"ere (Paolucci, Suthers, & Weiner, 1995) and the KnowledgeIntegration Environment (Bell, 1997) the structure of argumentation is explicitlyrepresented, offering students an overview.The ways in which representations can support argumentation are based on
relatively scarce empirical research. Veerman (2000) found some evidence thatBelv!ed"ere helps students to maintain focus, and stimulates constructive activitiessuch as explaining and summarizing information. Suthers (2001) compared three
ARTICLE IN PRESSL. Munneke et al. / Int. J. Educ. Res. 39 (2003) 113–131116
kinds of representations—texts, diagrams, and matrices—on the way students talkabout concepts, how much they elaborate, and how much the representations triggersearching for missing information. He found that diagrams are best in supporting theontology of users and the amount of elaboration, and that matrices are best intriggering search for missing information.These advantages of representations will not emerge automatically; other
variables, such as the type of task used, also play an important role. Besidesknowing what the tool supports, it is also important knowing when a tool is used inthe task sequence. Baker (2003) used a representational tool to display an individualpoint of view before discussing an issue. Collaborating students were individuallyasked to give their opinions about a topic and both opinions were represented onscreen to be compared. This task was based on the premise that students will arguemore when they clearly see the things in which they differ. Baker found that studentstalk a lot about their opinions but quickly change their opinions without muchargumentation. In contrast to Baker, Suthers (2003) used representational tools forcollaborative construction during discussion. He found that students using diagramsand matrices talked more about evidential relations between arguments thanstudents using a plain text representation. Comparing these results is difficult,because the researchers used different representations, tasks and variables. There isneed for more systematic research to find out if this indication is true.
2.4. Two experiments: SCALE and Twins
In this paper, two similar experiments are discussed in which an argumentativediagram is either used before or during discussion. The first study is part of theSCALE project1 and the second study is part of Twins.2 As stated earlier thepedagogical objective of the two projects is to create collaborative situations forargumentation-based learning. Both projects carried out a first experiment in whichthe same argumentative diagram is used; in the SCALE experiment students had toconstruct a diagram individually before engaging in the discussion, while in the Twinsexperiment students had to construct a diagram together, during discussion.Context in both studies was a collaborative writing task. In this paper, we focus on
the diagrams and the chat discussions in the two studies, but it may be assumed thatthe presence of a text window has an effect on discussion as well. The space of debateis extended to the text window; students might use the text to interact about conceptsas well. Although the text production may cause argumentative interaction to servethe purpose of content generation, we decided to add the writing task to the
ARTICLE IN PRESS
1The research reported here was carried out within the SCALE project (Internet-based intelligent tool to
Support Collaborative Argumentation-based LEarning in secondary schools, March 2001–February 2004)
funded by the European Community under the ‘Information Societies Technology’ (IST) Programme. The
project is studying the effects of diagram tools on the quality of interaction in computer-supported
collaborative argumentation-based learning. More Information on the project can be found at: http://
www.euroscale.net/.2Twins is a Ph.D. project started in 2000, studying the effect of different collaborative tasks and
communication tools on the quality of interaction in computer-supported collaborative learning.
L. Munneke et al. / Int. J. Educ. Res. 39 (2003) 113–131 117

experiment because the text gives students a reason for discussion. Also, theargumentative text gives us the possibility to compare chat and text to see whattopics are discussed and which ones end up being put in the text, and shows us whathas been put in the text that has not been discussed.
2.5. The scope of research
With SCALE and Twins, we want to find out which conditions in computer-supported collaborative learning lead to argumentative interaction, i.e. broad anddeep understanding of the space of debate. More specifically we want to knowwhether there is a difference in argumentative interaction when using argumentativediagrams individually before discussion or collaboratively during discussion. Thus, themain research questions are:
1. How are argumentative diagrams used during electronic argumentative interac-tion, in particular:
(a) An individual diagram constructed before the debate?(b) A collaborative diagram constructed during debate?
2. To what extent do students collaboratively explore the space of debate in depthand breadth using these two kinds of diagrams?
We expect the role of the diagrams to be different before or during the task.Following the research of Baker (2003) and Suthers (2003), using representationsbefore collaboration stimulates students to talk about their opinions and reflect ontheir own point of view, but does not stimulate elaboration on arguments, conceptsand relations. Using a representation during collaboration helps students toelaborate on arguments and relations in depth and breadth of the space of debate,but does not help them to see the differences between their different opinions andarguments.
3. Method
3.1. Participants
In total, 126 pairs of 16/17-year-old students participated in the experiments, fromfive different schools for upper secondary education in the Netherlands. Theseschools volunteered to participate after a survey answered by 77 schools (Deliverable8, SCALE-team, 2002a, b). Pairs were formed within classes, but worked at theirown computer during the experimental sessions and, when possible, worked indifferent classrooms. For this article, we randomly selected 10 pairs from eachexperiment (N ¼ 20).
ARTICLE IN PRESSL. Munneke et al. / Int. J. Educ. Res. 39 (2003) 113–131118

3.2. CSCL tool
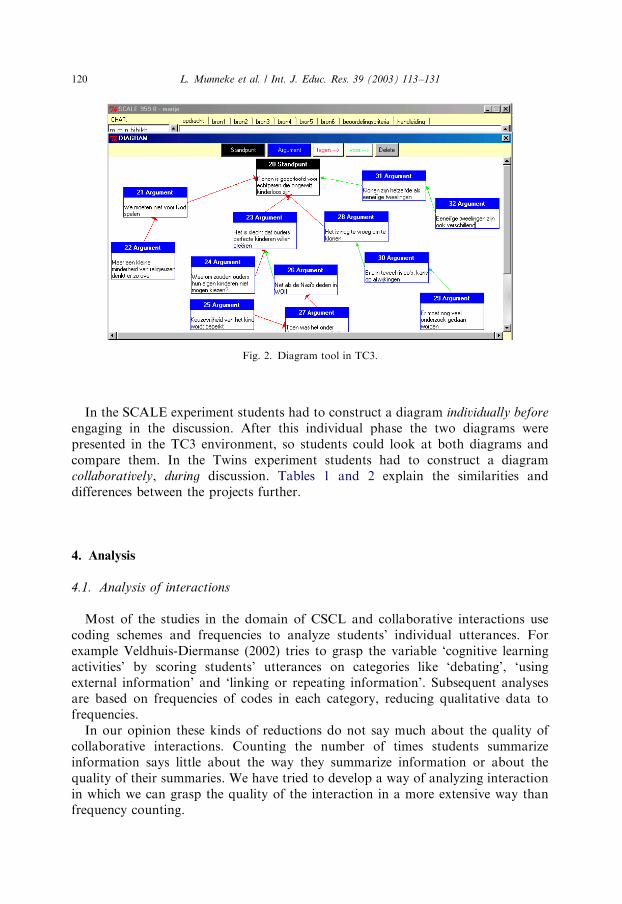
Both studies used the tool TC3 (Text Composer, Computer-supported, andCollaborative). TC3 supports collaborative argumentative writing in dyads (Jaspers& Erkens, 2000). It consists of three main windows; the left one is for communicationby chat, the upper-right window for information about the topic and aim of the task,and the lower-right window for collaborative writing of a text (Fig. 1.)Fig. 2 shows the diagram tool in TC3. This is a representational tool in which
students can construct an argumentative representation of the topic. There are twokinds of boxes and two kinds of arrows. One box is for representing opinions, theother for representing arguments to support or rebut the opinion. The arrows aregreen and red, respectively, for indicating a positive relation (‘in favor’) and anegative relation (‘against’) between boxes. The diagram is kept simple, becauseSuthers (2002) found that a complex tool might distract students from the content ofdiscussion.
3.3. Task and procedure
Both experiments consisted of six sessions of 50min. Students were asked todiscuss and write about the topic of genetically modified organisms (GMOs). Thetopic is part of the curriculum in upper secondary education, so the experimentscould be conducted during regular hours in classes of Dutch language, GeneralSciences, or Biology.
ARTICLE IN PRESS
Fig. 1. TC3.
L. Munneke et al. / Int. J. Educ. Res. 39 (2003) 113–131 119
In the SCALE experiment students had to construct a diagram individually before
engaging in the discussion. After this individual phase the two diagrams werepresented in the TC3 environment, so students could look at both diagrams andcompare them. In the Twins experiment students had to construct a diagramcollaboratively, during discussion. Tables 1 and 2 explain the similarities anddifferences between the projects further.
4. Analysis
4.1. Analysis of interactions
Most of the studies in the domain of CSCL and collaborative interactions usecoding schemes and frequencies to analyze students’ individual utterances. Forexample Veldhuis-Diermanse (2002) tries to grasp the variable ‘cognitive learningactivities’ by scoring students’ utterances on categories like ‘debating’, ‘usingexternal information’ and ‘linking or repeating information’. Subsequent analysesare based on frequencies of codes in each category, reducing qualitative data tofrequencies.In our opinion these kinds of reductions do not say much about the quality of
collaborative interactions. Counting the number of times students summarizeinformation says little about the way they summarize information or about thequality of their summaries. We have tried to develop a way of analyzing interactionin which we can grasp the quality of the interaction in a more extensive way thanfrequency counting.
ARTICLE IN PRESS
Fig. 2. Diagram tool in TC3.
L. Munneke et al. / Int. J. Educ. Res. 39 (2003) 113–131120
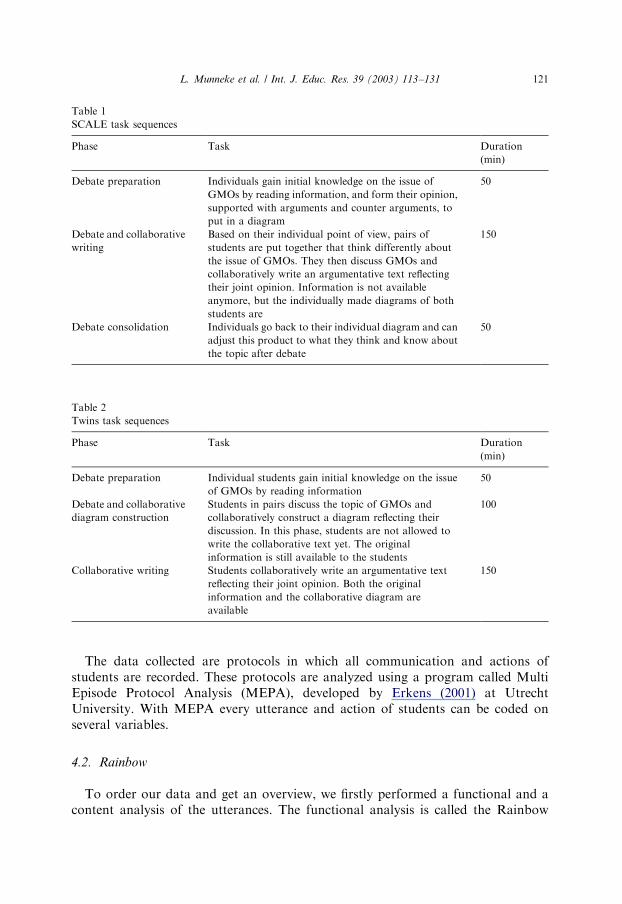
The data collected are protocols in which all communication and actions ofstudents are recorded. These protocols are analyzed using a program called MultiEpisode Protocol Analysis (MEPA), developed by Erkens (2001) at UtrechtUniversity. With MEPA every utterance and action of students can be coded onseveral variables.
4.2. Rainbow
To order our data and get an overview, we firstly performed a functional and acontent analysis of the utterances. The functional analysis is called the Rainbow
ARTICLE IN PRESS
Table 1
SCALE task sequences
Phase Task Duration
(min)
Debate preparation Individuals gain initial knowledge on the issue of
GMOs by reading information, and form their opinion,
supported with arguments and counter arguments, to
put in a diagram
50
Debate and collaborative
writing
Based on their individual point of view, pairs of
students are put together that think differently about
the issue of GMOs. They then discuss GMOs and
collaboratively write an argumentative text reflecting
their joint opinion. Information is not available
anymore, but the individually made diagrams of both
students are
150
Debate consolidation Individuals go back to their individual diagram and can
adjust this product to what they think and know about
the topic after debate
50
Table 2
Twins task sequences
Phase Task Duration
(min)
Debate preparation Individual students gain initial knowledge on the issue
of GMOs by reading information
50
Debate and collaborative
diagram construction
Students in pairs discuss the topic of GMOs and
collaboratively construct a diagram reflecting their
discussion. In this phase, students are not allowed to
write the collaborative text yet. The original
information is still available to the students
100
Collaborative writing Students collaboratively write an argumentative text
reflecting their joint opinion. Both the original
information and the collaborative diagram are
available
150
L. Munneke et al. / Int. J. Educ. Res. 39 (2003) 113–131 121

framework3 and consists of seven principal categories, each represented by a color ofthe rainbow. These categories are shown in Table 3.Some categories have subcategories. Task management, for example, consists of
the subcategories ‘management of the task in general’, ‘management of thediscussion’, ‘management of the tool’, and ‘management of the information’. Thesesubcategories are useful in the development of other variables, but beyond the scopeof this article.In the content analysis, we distinguish topics and subtopics of the GMOs issue.
The five main topics are worldview, health, environment, affluence, and other. Thesemain topics are divided in 14 subtopics, for example affluence—hunger/food oraffluence—costs/benefits. All actions of students in categories five to seven (thecontent-related categories), and some in category four, were screened for thesetopics. The Rainbow and content analyses constitute the basis for further analyseson variables such as ‘depth and breadth of the space of debate’.
4.3. Depth and breadth of the space of debate
The breadth of the space of debate is defined as the amount of topics andsubtopics a pair mentions in the collaborative task. The breadth of the debate iscalculated for the whole task as well as for the different parts of the task separately,so we can distinguish between topics taken up in the chat and topics actually put inthe argumentative text students wrote collaboratively.When students talk in depth about the space of debate, they relate different
concepts, and elaborate upon their arguments. For the analysis of the depth of thedebate, we developed a scoring system in which all content-related utterances areanalyzed in their immediate context. Every utterance was rated 1, 2, 4, or 8. Therating of 1 is used for students stating an argument, 2 for giving an example orexplanation of an argument, 4 for stating a support or rebuttal, and 8 for the explicitexplanation of a relation between different arguments. Table 4 gives an example of ascored protocol. We look at episodes of content-related activities, e.g. a support orrebuttal can only be scores if an argument is scored first. Because the rating ofutterances depends on their context, we are able to calculate averages to talk aboutthe quality of the depth of the space of debate instead of only talking about quantityof arguments, rebuttals, examples and relations.To obtain the absolute depth of the space of debate, all scored utterances on depth
are added. This absolute score is obtained for every pair, and for every student andsubtask separately. However, since some pairs worked longer than others theabsolute depth might be distorting. To solve this problem, we converted the absolutenumbers to relative numbers by dividing the absolute numbers by the total number
ARTICLE IN PRESS
3The Rainbow framework is collaboratively developed by researchers from four different countries
(most of them involved in the SCALE project): Michael Baker, Jerry Andriessen, Matthieu Quignard,
Marije van Amelsvoort, Kristine Lund, Timo Salminen, Lia Litosseliti, and Lisette Munneke. An article
on this framework is in preparation.
L. Munneke et al. / Int. J. Educ. Res. 39 (2003) 113–131122
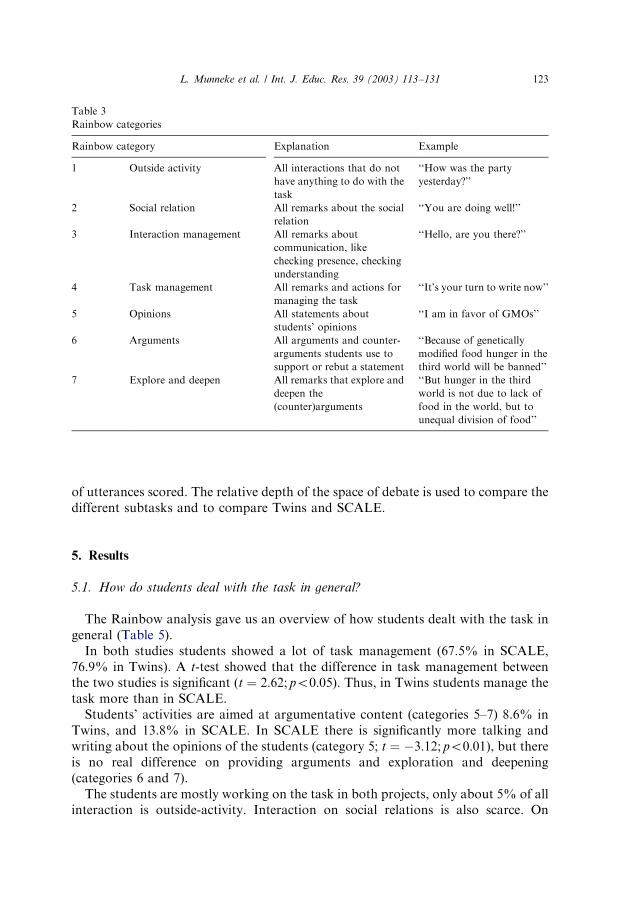
of utterances scored. The relative depth of the space of debate is used to compare thedifferent subtasks and to compare Twins and SCALE.
5. Results
5.1. How do students deal with the task in general?
The Rainbow analysis gave us an overview of how students dealt with the task ingeneral (Table 5).In both studies students showed a lot of task management (67.5% in SCALE,
76.9% in Twins). A t-test showed that the difference in task management betweenthe two studies is significant (t ¼ 2:62; po0:05). Thus, in Twins students manage thetask more than in SCALE.Students’ activities are aimed at argumentative content (categories 5–7) 8.6% in
Twins, and 13.8% in SCALE. In SCALE there is significantly more talking andwriting about the opinions of the students (category 5; t ¼ �3:12; po0:01), but thereis no real difference on providing arguments and exploration and deepening(categories 6 and 7).The students are mostly working on the task in both projects, only about 5% of all
interaction is outside-activity. Interaction on social relations is also scarce. On
ARTICLE IN PRESS
Table 3
Rainbow categories
Rainbow category Explanation Example
1 Outside activity All interactions that do not
have anything to do with the
task
‘‘How was the party
yesterday?’’
2 Social relation All remarks about the social
relation
‘‘You are doing well!’’
3 Interaction management All remarks about
communication, like
checking presence, checking
understanding
‘‘Hello, are you there?’’
4 Task management All remarks and actions for
managing the task
‘‘It’s your turn to write now’’
5 Opinions All statements about
students’ opinions
‘‘I am in favor of GMOs’’
6 Arguments All arguments and counter-
arguments students use to
support or rebut a statement
‘‘Because of genetically
modified food hunger in the
third world will be banned’’
7 Explore and deepen All remarks that explore and
deepen the
(counter)arguments
‘‘But hunger in the third
world is not due to lack of
food in the world, but to
unequal division of food’’
L. Munneke et al. / Int. J. Educ. Res. 39 (2003) 113–131 123
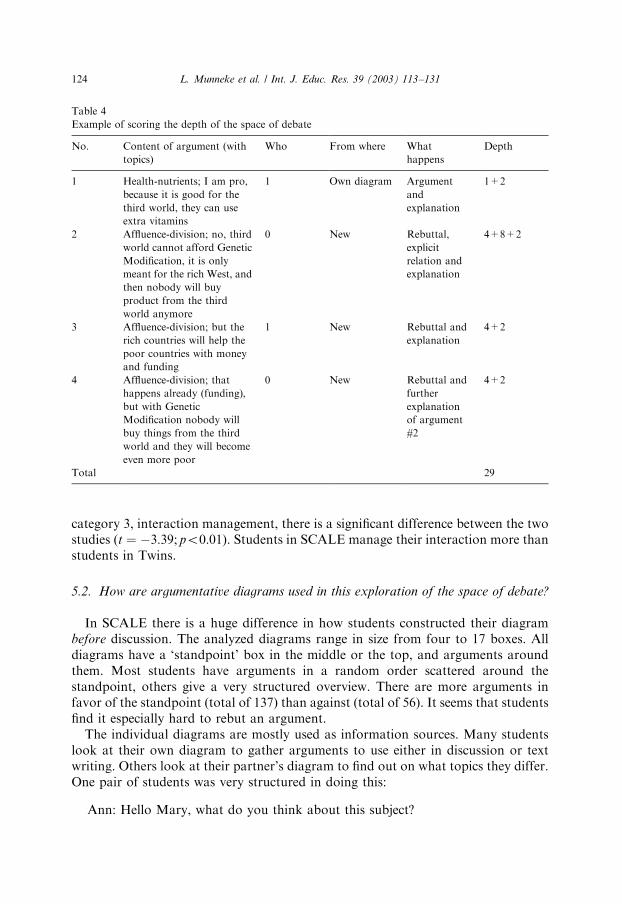
category 3, interaction management, there is a significant difference between the twostudies (t ¼ �3:39; po0:01). Students in SCALE manage their interaction more thanstudents in Twins.
5.2. How are argumentative diagrams used in this exploration of the space of debate?
In SCALE there is a huge difference in how students constructed their diagrambefore discussion. The analyzed diagrams range in size from four to 17 boxes. Alldiagrams have a ‘standpoint’ box in the middle or the top, and arguments aroundthem. Most students have arguments in a random order scattered around thestandpoint, others give a very structured overview. There are more arguments infavor of the standpoint (total of 137) than against (total of 56). It seems that studentsfind it especially hard to rebut an argument.The individual diagrams are mostly used as information sources. Many students
look at their own diagram to gather arguments to use either in discussion or textwriting. Others look at their partner’s diagram to find out on what topics they differ.One pair of students was very structured in doing this:
Ann: Hello Mary, what do you think about this subject?
ARTICLE IN PRESS
Table 4
Example of scoring the depth of the space of debate
No. Content of argument (with
topics)
Who From where What
happens
Depth
1 Health-nutrients; I am pro,
because it is good for the
third world, they can use
extra vitamins
1 Own diagram Argument
and
explanation
1+2
2 Affluence-division; no, third
world cannot afford Genetic
Modification, it is only
meant for the rich West, and
then nobody will buy
product from the third
world anymore
0 New Rebuttal,
explicit
relation and
explanation
4+8+2
3 Affluence-division; but the
rich countries will help the
poor countries with money
and funding
1 New Rebuttal and
explanation
4+2
4 Affluence-division; that
happens already (funding),
but with Genetic
Modification nobody will
buy things from the third
world and they will become
even more poor
0 New Rebuttal and
further
explanation
of argument
#2
4+2
Total 29
L. Munneke et al. / Int. J. Educ. Res. 39 (2003) 113–131124

Mary: Wait a minute ok? Because you can see what you have made and what theother has made
Ann: Ok, I’ll look at your diagram first
Mary: Ok
Ann: The one about antibiotics is a good one, I agree with that
Mary: Yes, and I agree with your opinion on scarce products
Ann: Hunger can be banned that way, and that is necessary in the Third World
y
Although the diagrams are mostly used as ‘given’ information, they can also giverise to an exploration of the space of debate that goes beyond the argumentspresented in the individual diagrams. Oftentimes students start the discussion withan argument from their own diagram but discuss this argument with ‘new’ ones, notmentioned before (see also Table 4).
ARTICLE IN PRESS
Table 5
Mean frequencies and percentages of functional Rainbow categories in SCALE and Twins
SCALE
frequencies (with
standard
deviations)
SCALE
percentages (with
standard
deviations)
Twins frequencies
(with standard
deviations)
Twins percentages
(with standard
deviations)
Off-task 23.1 4.6 51.7 5.3
(35.8) (6.1) (55.5) (5.3)
Social relation 18.2 4.0 29.7 3.2
(11.3) (2.8) (21.5) (2.1)
Interaction
management
47.7 10.1 52.7 5.9
(20.4) (3.3) (22.5) (2.0)
Task management 318.1 67.5 680.4 76.9
(93.5) (10.4) (128.1) (4.7)
Opinions 18.0 3.9 18.1 2.2
(7.2) (1.7) (7.2) (0.6)
Arguments 20.0 4.2 26.6 3.1
(10.9) (2.0) (10.2) (1.3)
Explore and
deepen
25.1 5.74 29.5 3.4
(13.3) (4.0) (14.1) (1.8)
L. Munneke et al. / Int. J. Educ. Res. 39 (2003) 113–131 125
In Twins the diagrams were constructed during the discussion. The number ofboxes varies from 9 to 16 boxes, so there was less variation in the number of boxesthan in SCALE. Most diagrams were very chaotic. It often happened that argumentsthat belonged together were not linked. Some diagrams were very structured but inthat case just one student was in control of the diagram. As in SCALE, students usemore arguments in favor (72) of their point of view than against (32).Lisa and Gwen’s fragment shows a special way of using the diagram. Lisa is
communicating by chat, but oftentimes Gwen reacts on Lisa’s arguments by puttinga new box in the diagram (dia) with her counterargument or further elaboration.
Lisa: When there is too much genetic modification certain plants and animals canbecome extinct.
Gwen (dia): Some people say that GMO causes extinction of some plants andanimals.
Gwen (dia): But if we keep GMO under control, the consequences will beminimal.
Gwen (dia): And solving the problem of hunger is more important than forexample a specific kind of ants.
Three other functions of the diagram are showed in the discussion between Boband Mike.
Bob (dia): GMO has advantages for the production of food. You get food that fitsthe demands of the consumers or you can produce food that you can keep longer,so less food is wasted.
Mike: Shall I give the counter argumentation?
Bob: Ok.
Mike (dia): You can also get the desirable properties by crossing plants instead ofmanipulating genes.
Bob: You wrote that nicely
Mike: Shall I type another argument pro?
Bob: I think we first have to rebut your argument: Crossing plants takes muchmore time than using GM, or not?
Mike: Oh yes you are right, with crossing it is much more difficult to get thedesired properties.
First the construction of the diagram creates input for further discussion. Mikeputs something in the diagram and this causes a new discussion about crossingversus genetic modification. Secondly, the diagram is used as a notebook tosummarize the communication. After the discussion Mikes puts the conclusion in thediagram. Finally, Mike and Bob use the diagram as a way to discuss relationsbetween arguments.
ARTICLE IN PRESSL. Munneke et al. / Int. J. Educ. Res. 39 (2003) 113–131126

5.3. To what extent do students explore the space of debate in breadth and in depth?
5.3.1. Breadth of the space of debate
Almost all pairs in both SCALE and Twins discuss the five main topics wedistinguish in the debate on GMOs. Most pairs have a preference for certain topicsin the debate that they discuss extensively, and only touch on other topics lightly. Ofthe 18 subtopics possible, students in SCALE discuss a mean of 11.9 subtopics(SD ¼ 1:3), and students in Twins 9.7 subtopics (SD ¼ 1:8). The tasks are toodifferent to really compare these actual means so we calculated the percentages ofevents in which topics were mentioned. In SCALE this was a mean of 11% of allevents, and in Twins a mean of 7%. A t-test showed this was a significant difference(t ¼ 2:71; po0:05). This means students in SCALE talk and write more in breadthabout the topic.
5.3.2. Depth of the space of debate
For depth of the space of debate in diagrams and discussion, we calculatedabsolute and relative depths. In SCALE, students deepen the individual diagrambefore discussion with an average of 25.1 points, compared with 58.2 in the chat.This difference is significant (t ¼ �2:475; po0:05). However, the significantdifference disappears when correcting for size of the diagram and chat (2.5. versus2.8). So, students say more about GMOs in chat, but relatively the depth is the sameas in the average diagram. This means that students talk a lot about arguments andexamples in the chat, but do not deepen these with rebuttals, supports or links. In theindividual diagrams they do this more.In Twins the collaborative diagram constructed during discussion is deepened with
an average of 30.5, compared to 29.6 in the discussion. This was not a significantdifference. In relative depth, we neither found significant differences between chat(M ¼ 2:3) and diagram (M ¼ 2:6). Overall, students in Twins mostly give argumentsand explanations, but do not rebut, support or relate arguments much. The diagramshows the same picture.In comparing SCALE and Twins, the difference in the absolute depth of the
diagrams (M ¼ 30:5 for Twins, M ¼ 25:1 for SCALE) was not significant. Theabsolute depth of the discussion (chat) differed much more: 58.2 versus 29.6.However, because there was much more variation in the discussion of SCALE(SD ¼ 39:75 versus SD ¼ 29:7), this difference was not significant. The same resultsare obtained when comparing the relative depths of Twins and SCALE in diagramsand chat.Finally, we looked at the depth of the text students had to produce in comparison
with the diagrams they produced. In SCALE the average absolute depth of the textswas 64.6. This was significantly higher (t ¼ �11:49; po0:01) than the depth of thediagrams. This difference remains significant (t ¼ �3:36; po0:01) when correctingfor size. Twins shows the same picture. The absolute depth of the texts was 64.7 anddiffered significantly (t ¼ �5:81; po0:01) from the depth of diagrams. The relativedepth of the texts was 3.3 and also differed significantly from the relative depths ofthe diagrams (t ¼ �2:60; po0:05). These numbers show that in both SCALE and
ARTICLE IN PRESSL. Munneke et al. / Int. J. Educ. Res. 39 (2003) 113–131 127
Twins students rebutted, supported, and related their arguments more in the textthan in the diagrams.
6. Discussion
6.1. Supporting argumentative interactions with diagrams
In the theoretical background three possible advantages of supporting argumen-tative interactions during discussion with diagrams were mentioned: (1) Forcing tomake opinions and arguments explicit and initiating negotiation, (2) maintainingfocus, and (3) maintaining consistency, accuracy and plausibility of the argumenta-tions. The results will be discussed according to these points.Looking at the breadth of the space of debate, we found that both in SCALE and
Twins students talk about a lot of different topics, but that students in SCALEtalked more about opinions than those in Twins. This is in line with Baker’s (inpress) results and our predictions that an individual preparation stimulates talkabout opinions. The individual representations provoke utterances such as ‘I agree’or ‘I don’t agree’. When making a collaborative diagram these utterances areprovoked less, because all arguments are new for both students. However, in bothSCALE and Twins it appeared that students easily take over each other’s opinionsand arguments. This was different from what we expected. As shown in the absoluteand relative depth of the space of debate students talk about possible arguments andexplain these arguments, but support and rebuttals are less frequently seen.Agreement and even disagreement are often followed by a quick acceptation of theother’s ideas instead of negotiation. The task might be responsible for this behavior;many students just want to construct the diagram or write the text. In SCALE thediagrams were mostly seen as a source of information in which arguments for thetext could be gathered, and not as a representation of the other student’s opinionthat could be discussed. In Twins we found similar results. Many students saw thediscussion phase as a phase of gathering content, and they used the diagram as anotebook in which all ideas for the text were gathered instead of discussed. Thismight also explain why the text is deeper than the diagrams. Students extent theirideas, that were put forward in diagram and discussion, in the text.The second advantage, maintaining focus, is confirmed by the Rainbow analysis.
In both studies we found little social talk. Students are mostly focused on managingthe task, and on content. An explanation for this is that the task was complex andstudents had to look at information sources, compare each other’s diagrams orconstruct a collaborative diagram, write the collaborative text, and discuss content.The question arises whether it is wise to let students write an argumentative text ifdiscussing the domain is the main goal. It appears that writing and managing thewriting of the text distracts students from discussing the content. In SCALE theindividual diagrams helped to focus on content at the start of discussion, but thediagrams were quickly reduced to sources of information for writing the text. InTwins it is difficult to say in what way the diagram helps students to focus on the
ARTICLE IN PRESSL. Munneke et al. / Int. J. Educ. Res. 39 (2003) 113–131128
discussion, because a lot of the discussion happens through the diagram. In Section 5we saw an example in which one student chats her arguments and the other reacts inthe diagram. Thus, comparing the depth of chat and diagram does not say muchabout the way the diagram stimulated the discussion. Veerman (2000) also found inher Belv!ed"ere-study that a part of the focus on discussion is maintained in thediagram. However, it appeared that the focus on discussion disappeared as soon asstudents started writing the text.Looking at maintaining consistency, accuracy and plausibility it was found that
students do talk about what argumentation should look like. The fragment of Boband Mike showed in which way the diagram stimulated looking at rebuttals andrelations between arguments, but most diagrams were very unbalanced in the proand counter arguments. The diagrams were very chaotic and many relations betweenarguments were missing or not accurate. It can be concluded that students know howto set up an argumentation, but they did not succeed in accomplishing this. In thetext, we found many more relations between arguments, but the balance ofargumentation was still poor. Thus, the diagram provokes talk about how to argue,but does not support the right use of rebuttals, support and relations betweenarguments. Suthers’ (2003) finding that Belv!ed"ere stimulated talk about relationsbetween arguments was not confirmed in our studies. Students sometimes talk aboutthe arrows they put in the diagram, but not about the meaning of these arrows. Theyjust enumerate arguments and counter arguments without discussing their relations.
6.2. Classroom practice
In general, students really enjoyed the task. The Rainbow analysis showed theywere indeed focused on the task. In a post-questionnaire not discussed here, wefound that students especially liked the use of computers in this task, thecollaboration with a classmate, and the chat function. Students are used to chatoutside school, but they hardly ever use it for school tasks.How and when to use computer-supported collaborative argumentation tasks
such as the ones described in this article, largely depends on the goals and desiredoutcomes. When the main goal is to get students to discuss their opinions andarguments, an individual preparation with a diagram is helpful. When students needto learn to collaborate and negotiate, a collaborative diagram during discussion ismore helpful. When the main goal for students is to collaboratively write anargumentative text, a diagram might be supportive in eliciting discussion onarguments and relations to be put in the text. In our studies, the text was indeeddeeper than the diagrams. However, writing a collaborative argumentative text alsointerferes with discussing a topic, because the students are focused on the textproduct.Even though students did interact argumentatively, and the diagrams were
supportive, the discussions and diagrams are, in our opinion, not of very highquality. Using argumentation is very difficult for students, although they do seem toknow how it should be done. Supporting and rebutting arguments is especiallydifficult, students merely exchange arguments instead of relating them. Content
ARTICLE IN PRESSL. Munneke et al. / Int. J. Educ. Res. 39 (2003) 113–131 129

related sequences mainly consist of what students want to put in the text, andexploring what the other person means to say (Andriessen et al., 2003). Thisbehavior could be explained by current classroom practice. At this momenteducation puts emphasis on learning argumentation, and there is less attention forargumentation as a mean to learn. Also, products are often still the things studentsare graded for, so students focus on products, instead of really exploring the space ofdebate.For classroom practice it might be interesting to combine both kinds of diagrams
in a task. In forcing students to collaboratively reach consensus on a shared diagram,discussion might be triggered more because both students have constructed theirindividual diagram before. On the other hand, the task might be too complicated, orstudents might just combine the two individual representations into one. Studentscould also be forced to put only the most important arguments and relations in thediagram, so students really have to negotiate on what they consider really importantand what not. Finally, the teacher could play a more supportive role in constructingdiagrams or guiding discussion by emphasizing more the content of discussioninstead the form of logical argumentation. SCALE and Twins will examine thesesuggestions further in future research.
References
Andriessen, J., Erkens, G., Laak, C.Vande, Peters, N., Coirier, P. (2003). Argumentation as negotiation in
electronic collaborative writing. In: J. Andriessen, M. Baker, D. Suthers (Eds.), Confronting
cognitions: Arguing to learn. Netherlands: Kluwer Academic Publishers.
Andriessen, J., & Sandberg, J. (1999). Where is education heading and how about AI? International
Journal of Artificial Intelligence in Education, 10, 130–150.
Baker, M. J. (1994). A model for negotiation in teaching–learning dialogues. Journal of Artificial
Intelligence in Education, 5(2), 199–254.
Baker, M. J. (1999). Argumentative interactions and cooperative learning. Escritos.
Baker, M. J. (2003). Computer-mediated argumentative interactions for the co-elaboration of scientific
notions. In: J. Andriessen, M. Baker, D. Suthers (Eds.), Confronting cognitions: Arguing to learn.
Netherlands: Kluwer Academic Publishers.
Bell, P. (1997). Using argument representations to make thinking visible for individuals and groups. In R.
Hall, N. Miyake, & N. Enyedy (Eds.), Proceedings of CSCL’97: The Second International Conference
on Computer Support for Collaborative Learning (pp. 10–19). Toronto: University of Toronto Press.
Dillenbourg, P., Baker, M., Blaye, A., O’Malley, C. O. (1996). The evolution of research on collaborative
learning. In: E. Spada, P. Reiman (Eds.), Learning in humans and machine: Towards an interdisciplinary
learning science. Oxford: Elsevier.
Edelson, D. C., O’Neill, D. K., Gomez, L. M., D’Amico, L. (1995). A design for effective support of
inquiry and collaboration. In: J. L. Schnase, E. L. Cunnius (Eds.), Proceedings of CSCL ‘95: The first
international conference on computer support for collaborative learning, October 1995. Indiana
University, Bloomington, Indiana, USA, Nahwah, NJ: Lawrence Erlbaum.
Erkens, G. (2001). MEPA. Multiple episode protocol analysis (version 4.7) [computer software]. Utrecht.
The Netherlands: Utrecht University.
Jaspers, J. G. M., & Erkens, G. (2000). TC3. Text composer, computer supported & collaborative (version
1.4) [computer software]. Utrecht. The Netherlands: Utrecht University.
Luttik, B. A. J. (1998). Samen leren een huis te bouwen; een studiehuis, Een onderzoek naarsamenwerkend
leren in het Studiehuis. [Learning to build a house together: A study house. Research on collaborative
learning in the study house] literature study. Utrecht: Utrecht University.
ARTICLE IN PRESSL. Munneke et al. / Int. J. Educ. Res. 39 (2003) 113–131130
Paolucci, M., Suthers, D., Weiner, A. (1995). Belv!ed"ere: stimulating students’ critical discussion. CHI95
conference companion, interactive posters, May 7–11, Denver, CO (pp. 123–124).
Rittel, H. W. J., Webber, M. M. (1984). Planning problems are wicked problems. In: N. Cross (Ed.),
Developments in design methodology. Chichester: Wiley.
SCALE-team. (2002a). Teaching materials and task design for collaborative argumentation-based learning
with intelligent internet tools, Deliverable 1&2, SCALE Project, IST-1999-10664.
SCALE-team. (2002b). Test instruments for assessing the quality of students’ argumentation, and results on
school experiments for teaching collaborative argumentation in secondary schools, Deliverable 8, SCALE
Project, IST-1999-10664.
Scardamalia, M., Bereiter, C., Lamon, M. (1994). The CSILE project: trying to bring the classroom in
world three. In: K. McGilly (Ed.), Classroom lessons, integrating cognitive theory and classroom
practice. Cambridge, MA: MIT.
Stein, N.L., Bernas, R.S., Calicchia, D. (1997). Conflict talk: understanding and resolving arguments. In:
T.Giron (Ed.), Conversation: Cognitive, communicative and social perspectives (Typological Studies in
Language, Vol. 34). Amsterdam: John Benjamins.
Stuurgroep Profiel Tweede Fase Voortgezet Onderwijs. (1994). De Tweede Fase vernieuwt. Scharnier tussen
basisvorming en hoger onderwijs, deel 2. [The second phase is innovating. Hinge between lower
secondary education and higher education]. Den Haag: Stuurgroep Profiel Tweede Fase Voortgezet
Onderwijs.
Stichting ICT op school. (2001). Vier in balans: verkenning van zaken met het oog op effectief en efficient
gebruik van ICT in het onderwijs. [Four in balance: Exploration with focus on effective and efficient use
of ICT in education]. Den Haag: Stichting ICT op school.
Suthers, D. D. (2001). Towards a systematic study of representational guidance for collaborative learning
discourse. Journal of Universal Computer Science, 7(3), 254–277.
Suthers, D. D. (2003). Representational guidance for collaborative inquiry. In: J. Andriessen, M. Baker,
D. Suthers (Eds.), Confronting cognitions: Arguing to learn (pp. 1–17). Kluwer Academic Publisher:
Netherlands.
Van Bruggen, J. M., Boshuizen, H. P. A., Kirschner, P. A. (2002). A cognitive framework for cooperative
problem solving with argument visualization. In: P. A. Kirschner, S. J. Buckingham Shum, C. S. Carr
(Eds.), Visualizing Argumentation: Software Tools for Collaborative and Educational Sense-Making.
Springer: London.
Van Bruggen, J. M., Kirschner, P. (2003). Designing external representations to support solving wicked
problems. In: J. Andriessen, M. Baker, D. Suthers (Eds.), Confronting cognitions: Arguing to learn.
Netherlands: Kluwer Academic Publishers.
Veerman, A. J., Andriessen, J., & Kanselaar, G. (2002). Collaborative argumentation in academic
education. Instructional Science, 30(3), 155–186.
Veerman, A. L. (2000). Computer-supported collaborative learning through argumentation. Doctoral
dissertation. Utrecht: Utrecht University.
ARTICLE IN PRESSL. Munneke et al. / Int. J. Educ. Res. 39 (2003) 113–131 131