The role of ambiguity in the evaluation of the net benefits of the MOSE system in the Venice lagoon
27
The Role of Ambiguity in the Evaluation of the Net Benets of the MOSE System in the Venice Lagoon Fulvio Fontini y Georg Umgiesser z Lucia Vergano x August 2009 Department of Economics, University of Padua, Italy y Corresponding Author. Address: DSE, University of Padua. Via del Santo 33, 35125 Padua, Italy. E-mail: [email protected] z ISMAR-CNR, Venice, Italy x European Commission, JRC, Institute for Prospective Technological Studies, Seville, Spain. At the time the paper was written, Economics Department, University of Padua, Padua, Italy 1
-
Upload
independent -
Category
Documents
-
view
1 -
download
0
Transcript of The role of ambiguity in the evaluation of the net benefits of the MOSE system in the Venice lagoon

The Role of Ambiguity in the Evaluation of
the Net Bene�ts of the MOSE System in the
Venice Lagoon
Fulvio Fontini�y Georg Umgiesserz Lucia Verganox
August 2009
�Department of Economics, University of Padua, ItalyyCorresponding Author. Address: DSE, University of Padua. Via del Santo 33, 35125
Padua, Italy. E-mail: [email protected], Venice, ItalyxEuropean Commission, JRC, Institute for Prospective Technological Studies, Seville,
Spain. At the time the paper was written, Economics Department, University of Padua,
Padua, Italy
1

Abstract
In this paper we apply the NEO-capacity framework of Chateauneuf et
al. (Chateauneuf A., Eichberger J., and Grant S. (2007), Choice under
uncertainty with the best and worst in mind: Neo-additive capacities, J.
Econom. Theory, 137, 538-567) to assess the role of ambiguity in a speci�c
decision making problem. We �rst describe the framework and propose a
graphical representation of the decision making functional. Then we apply
it to a speci�c problem, namely, the role of ambiguity in the evaluation
of the net bene�ts of the MOSE, the mobile barriers aimed to protect the
Venice Lagoon from the periodic �ooding (acqua alta). We show that the
estimated impacts crucially depend on the level of optimism and pessimism
of the decision maker and they substantially di¤er from the one calculated
on the basis of the expected value. We also calculate the implicit ambiguity
attitude of the decision maker.
Keywords: Decision making under ambiguity, NEO-Capacity, MOSE, ac-
qua alta.
JEL classi�cation: D81; Q51; Q54.
2
1 Introduction
Many policy decisions impacting on the environment are surrounded by a
consistent level of ambiguity, which arises whenever the analysis of future
occurrences depicts several scenarios whose likelihood cannot be inferred on
the basis of any (either subjective or objective) probability distribution. This
happens if there is no clear de�nition of the problem, so that the description
of the states of the world is known to be incomplete (Mukerji, 1997) or when
there is no justi�cation of the use of any a priori distribution (Chichilnisky,
2000). Several possible criteria for decision making have been proposed to
solve this problem, starting with the well-known Max-Min criterion (Wald,
1950) which has been advocated, at least since Rawls seminal paper (Rawls,
1971), as the proper guideline to be followed under situations of complete
ignorance. Hurwicz (1951a, 1951b) and Arrow and Hurwicz (1972) have
augmented it, proposing to evaluate a linear combination of the best and
worst consequences. Other scholars (Schmeidler, 1989, Sarin and Wakker,
1992) have gone further in developing a unifying framework within the Cho-
quet Expected Utility (CEU) model, based on capacities, i.e. normalized
monotone (not necessarily additive) measures of ambiguity. It has recently
been proposed in the literature (Chateauneuf et al., 2007) to adopt a peculiar
capacity, named NEO-additive, which is additive on non extreme events. A
speci�c CEU functional is derived that can be expressed as a linear combi-
nation of the expected value, the best and the worst consequence of a given
decision, where the weights depend on the speci�c ambiguity attitude of the
decision maker, namely, optimism or pessimism. This approach can be used
to deal with environmental decision making problems under ambiguity, such
as, for instance, the analysis of some speci�c economic consequences of cli-
3

mate change. This is the framework of our work. We show that the CEU
functional that derives from NEO-additive capacities can be usefully applied
to the assessment of the economic impact on the city of Venice of the MOSE
mobile barriers system that has been aimed at protecting the Venice lagoon
from the periodic rise in the tide level (acqua alta). Given the ambiguity
that a¤ects the possible forecasts of both the environmental parameters (the
average sea level rise and the frequency of the acqua alta phenomenon) and
the instrumental ones (the safeguarding level beyond which the system will
be operated), its economic impact cannot be uniquely determined. More
precisely, several scenarios can be depicted depending on the combination
of various parameters that determine the frequency and the length of the
operation of the MOSE. We propose to evaluate the economic impact of the
MOSE on the city of Venice using data referring to all possible scenarios, and
not just the worst (or the best) one. Doing so, we show that the CEU pro-
vides a viable tool for decision making problems under ambiguity. Moreover,
we highlight that decisions taken as if there was no ambiguity can indeed be
interpreted as decisions taken in ambiguous frameworks by decision makers
who hold implicitly a speci�c ambiguity attitude.
The paper is structured as follows. In section 2 we brie�y summarize
the NEO-additive capacities framework and propose a graphical representa-
tion of the decision making functional. Section 3 describes the acqua alta
phenomenon in the Venice lagoon and the engineering solution adopted to
protect the city, i.e. the MOSE system. In section 4 we calculate the net
bene�ts that derive from the use of the MOSE, analyzing the twelve pos-
sible scenarios that arise and applying the decision making rule introduced
in section 2. Conclusions, acknowledgments and references follow. The �nal
appendix describes in greater details the methodology and the data used for
4
our calculations.
2 The framework: CEU and NEO-capacities
The capacity notion is at the core of the Choquet expected utility theory
(CEU) (Schmeidler, 1989), which generalizes the subjective utility theory as
a criterion of choice through the Choquet integral (Choquet, 1954). We follow
here the axiomatization of CEU proposed by Chateauneuf et al. (2007).
Let us reviewing it brie�y in order to describe the main elements that are
necessary for our analysis and present a new, graphical representation of
the CEU that helps understanding it, yet without providing a complete
description of the original model.1 Chateauneuf et al. (2007) introduce
the NEO-additive capacity, namely, a speci�c type of capacity which is a
linear combination, given a weight � 2 [0; 1]; of an additive capacity, i.e., aprobability, and a "special capacity that only distinguishes between whether
an event is impossible, possible or certain" (Chateauneuf et al., 2007, p. 540),
named "Hurwicz capacity" after Hurwicz�s criterion (Arrow and Hurwicz,
1972). The Hurwicz capacity gives a zero measure to events that are null,
one to events that are universal and a measure that equals � 2 [0; 1] to
essential events, i.e. events that are neither null nor universal. They prove
that the CEU calculated w.r.t. to the NEO-additive capacity assumes the
following representation:
CEU = �C1 + C2 + (1� � �)E� (1)
where � = �(1 � a); = �a; represent the decision maker�s pessimism
1Readers are advised to refer to the original paper for a complete description and
interpretation of the model.
5

and optimism, respectively (Chateauneuf et al., 2007, p. 544); E� is the
expected value calculated w.r.t. a probability �; C1, C2 are the minimum
and the maximum over the state space. Several decision making criteria may
be interpreted as special cases of the Choquet integral in Equation 1, given
the values that pessimistic and optimist parameters can assume:
� = 0 Expected Value
� > 0; � = 0 Pure Pessimism
� = 1; � = 0 Max-Min
� > 0; � = 1 Pure Optimism
� = 1; � = 1 Max-Max
� = 1; � 2 (0; 1) Hurwicz criterion
(2)
The functional form displayed in Equation 1 can be represented in a three
dimensional space as shown in Figure 1. Let� := f( ; �) j > 0; � > 0; + � 6 1gbe the simplex in R2 which constraints the set of the admissible ranges for
and �.
[Figure 1 about here]
It is easy to identify the side of the triangle that represents the space
of CEU taking into account its linearity in ; �; and setting = 0, � = 0
and + � = 1; respectively. The expected utility evaluation corresponds
to the point for which = � = 0. The set of pure pessimistic (optimistic)
evaluations is given by the side of the triangle depicted in Figure 1, call it
CEUp (CEUo), for which = 0 (� = 0). It is given by the following equation:
CEUp = �(C1 � E�) + E�; 0 � � 1 (CEU o = (C2 � E�) + E�; 0 � � �1): The Hurwicz criterion corresponds to the side of the triangle for which
�+ = 1, that is: CEUH = (C2 � C1) + C1:
6

Let us denote as ̂; �̂, those values of and � for which the CEU exactly
equals the expected value and that are compatible with the Hurwicz criterion,
(i.e. that lie along the hypotenuse of the CEU triangle). Call this pair the
Expected Value Equivalent point, and denote the set of points equivalent to
the Expected Value as the Expected Value Equivalent (EVE) set:
EV E := f� 2 [0:1]; 2 [0:1]j�C1 + C2 + (1� �� )E� = E�; �+ 6 1g(3)
This is the set of values of the parameters that give exactly the same
evaluation of the ambiguous-free expected value. In other words, it de�nes
the implicit values of the ambiguity attitude that a decision maker has un-
consciously in mind when taking the decision on the basis of the expected
value only. In Figure 1, EV E is represented as the dotted straight line that
originates at CEU = E�: See that it intersects the Hurwicz set (i.e., the set
of CEU values for which � + = 1) at �̂ = C2�E�C2�C1 ̂ =
E��C1C2�C1 :Therefore,
just one of the following three couples is true: eithern�̂ < 1=2; ̂ > 1=2
o; orn
�̂ > 1=2; ̂ < 1=2o; or
n ̂ = �̂ = 1=2
o: In the �rst case, the decision maker
who decides without taking into account the ambiguity of the problem (i.e.,
relying only on the expected value) shows an implicit optimistic ambiguity
attitude; in the second case the opposite would be true; in the latter case a
decision maker who assumes a neutral attitude towards ambiguity implicitly
balances pessimism and optimism.
3 The MOSE system
The lagoon of Venice is characterized by the phenomenon of acqua alta, i.e.
the periodical high water event causing (partial) �ooding of the historical
7
centre of Venice.2 Data3 show that such a phenomenon is increasing both
in its frequency and intensity. Global warming will induce a rise in the
average worldwide sea level (IPCC, 2001, 2007), which will further worsen
the phenomenon over the next century. Both mitigation and prevention
measures have been implemented in order to reduce the high water impacts
on architectural, artistic and cultural heritage and the economic damages to
the population and its visitors. These include, inter alia, the much debated
mobile barriers system, MOSE, which provides an engineering solution to
the problem of high water through a system of mobile gates installed on the
sea �oor of the inlets (Chioggia, Lido and Malamocco). This system has
been planned to separate from a hydraulic point of view the lagoon from the
Adriatic Sea every time the water level exceeds a certain safeguarding level.
There has been a long debate about its optimal threshold level. Clearly,
there is a trade o¤ between �xing it at a low level which would force the
system to be operated a large number of times with higher bene�ts, and
setting it at a high level, which would minimize its costs but with more
frequent and high �ooding episodes of the city. The higher the functioning
frequency, the higher the bene�ts for both Venetians and tourists, in terms
of both displacements expenses within the city and protection expenses of
2Acqua alta is usually de�ned as a tidal event reaching quota of 80 cm above the
�Punta della Salute�Tidal Datum, which is the Venetian main reference tide gauge. At
this quota, problems of displacements arise in the lowest parts of the city, but it is at
+100 cm that these problems become relevant for most of the city. A tide of +140 cm
identi�es an exceptional high water episode, causing the �ooding of about 90% of the city.
Autumn and winter are the critical periods during which the interaction of astronomical
and meteorological factors typically favours an increase in �ood occurrence (Canestrelli,
1998).3See www.comune.venezia.it/�ex/cm/pages/ServeBLOB.php/L/IT/IDPagina/3045
8

the cultural and artistic heritage, but at the same time, the higher the costs
in terms of interferences with Venice harbour activities, still a relevant sector
for the whole economy of the city.4 For this reason, the de�nition of the
safeguarding level is extremely important. Analyzing the technical project
of MOSE it is possible to envisage two main reference levels for the threshold
level: +100 cm or +110 cm above the �Punta della Salute� tidal datum.5
When a tide over +100 cm or +110 cm is forecasted, it is expected that the
mobile barriers will be raised and emerge from the water, stopping the tidal
�ow and temporarily separating the lagoon from the Adriatic Sea. Given
the frequency of the acqua alta phenomenon, the mobile barriers closures are
indeed more frequent if the safeguarding level is set at the lower boundary
rather than at the higher one and if an increase of the sea level is going to
occur.
If we want to analyze (ex ante) the economic impact of MOSE we need
to make conjecture on the safeguarding levels and possible lea level rises;
however the likelihood of these parameter cannot be inferred on the basis of
4Even though the MOSE project was elaborated in order to minimize the negative con-
sequences for the navigation, interferences of the mobile barriers operational functioning
with port activities cannot be completely avoided. The building of navigation basins at
the inlets may indeed reduce the delay in ship tra¢ c due to the mobile barriers closure;
however, its impact at present cannot be quanti�ed.5Indeed, it seems that there is a more general consensus about +110 cm as the proper
safeguarding level. Notice that this is the limit that is referred to by the consortium that
is building the infrastructures (Consorzio Venezia Nuova, see www.salve.it). However,
the +100 cm limit has often been appealed by the "Magistrato delle Acque" (the public
regulating authority of the venetian lagoon) as a precautionary threshold level that should
be considered (Magistrato delle Acque, 1997). Therefore, it is not possible to be certain
now about what will be exactly the safeguarding level that will be e¤ectively implemented
when the system will be operated.
9
any probability distribution.6 For this reason we apply the speci�c decision
making tool discussed in the previous section to study this problem.
The simulation of MOSE activity is carried out through a model describ-
ing the hydrodynamics of the Venice lagoon and developed at the ISDGM-
CNR (Umgiesser and Bergamasco, 1993, 1995, Umgiesser et al. 2004, Umgiesser
and Maticchio, 2006). Given the water level at the inlets and wind over all
the lagoon, at every time step (5 minutes) this model computes the wa-
ter level, simulating the propagation of the tide inside the lagoon, and the
barotropic current in all nodes of the numeric grid. Output variables of the
simulation model include also the frequency of how often the water level
exceeds the safeguarding level and the time of mobile barriers closure. For
the considered period, we can simulate the water level inside the lagoon for
twelve di¤erent scenarios, resulting from the hypotheses we assume about
the relevant variables. In particular, we consider three possible di¤erent sea
level increases (0, +30 cm, + 50 cm).7 We take into account the two di¤erent
safeguarding levels at which the mobile barriers procedure of closing can be
activated (+100 cm, +110 cm). Finally, we include also a security increment
(0, +10 cm) that can be set to compensate possible tide daily forecast errors
of the sea level within the lagoon, according to the following rationale: the
6In the sense that there are no reliable (either subjective or objective) probability
distribution over the state space. This is such, for the sea level rise, because of the
complexity of forecasting the local impacts of global warming; for the safeguarding level,
ambiguity stems from human behavior, i.e., there is ambiguity (ex ante) about the choices
of those who will have to operate the MOSE, once activated.7In absence of speci�c forecasts for the Upper Adriatic Sea and Venice Lagoon, we
consider three di¤erent scenarios re�ecting IPCC surveys on sea level rise (IPCC 2001,
2007). 50 cm is the highest level, the null hypothesis corresponds to the status quo, i.e.,
no impact, while the 30 cm assumption is the intermediate one.
10

closure steering of the mobile barriers follows a precise procedure based on
tidal and meteorological forecasts (as described in Magistrato delle Acque,
1997). In particular, the closing procedure is activated whenever a forecast
of the water level (with a four hours delay) reaches the safeguarding level.
The security increment can thus be used (and indeed has been included as
a working hypothesis within the ISDGM-CNR hydrodynamic model) as a
tool to reducing the impact of erroneous forecasts on the prevention of acqua
alta episodes, since it increases the forecasted water levels used to alert the
system.
4 The economic assessment of the MOSE net
bene�ts
Our analysis of net bene�ts from MOSE functioning is based on the impacts
of acqua alta identi�ed by Cellerino (1998). We focus on buildings (and his-
torical buildings protected by speci�c laws) repairing average avoided costs,
old people and students displacements average avoided costs and tourists
average avoided expenses.8 Data reported by Cellerino (1998) on the con-
sequences of �ooding for people and buildings and the tide level forecasts
obtained through the previously mentioned hydrodynamic model allow us
to compute the quota of the city involved by the most serious episodes of
8We do not include avoided costs for business activities due to the lack of information,
except for costs due to reduced expenditure of tourists. Breil et al. (2005) provide an
estimate of business costs, but their analysis is not consistent with our framework. In
particular, they only assume a 10 cm sea level rise, while in our valuation exercise we
consider di¤erent sea level scenarios.
11

�ooding and the frequency of �oods (see the Appendix for details).
Costs include two components: the operational and maintenance costs
(Collegio di Esperti di Livello Internazionale, 1998) and the estimate of the
direct costs induced by MOSE functioning on the Venice harbour (Nunes et
al., 2009).9 The latter, in particular, are due to the longer period ships wait
in roadstead and/or stay in wharf/quay when the mobile barriers are raised
and inlets closed (see the Appendix for details).
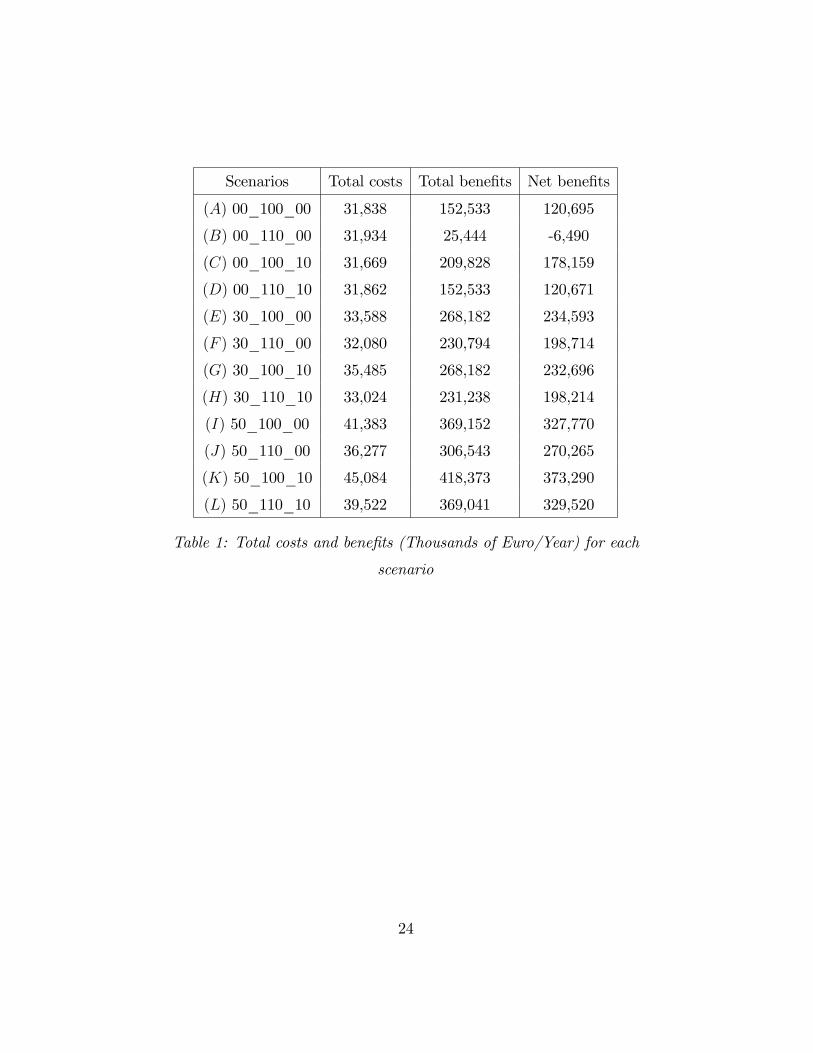
The estimated costs, bene�ts and net bene�ts for each scenario are shown
in Table 1, where each scenario is described by three entries: the possible
sea level rise (00 cm, 30 cm or 50 cm), the safeguarding level (100 cm or
110 cm) and the security increment (00 cm or 10 cm). The twelve possible
combinations are indexed by a letter tag, from A to L.
[Table 1 about here]
We can see that net bene�ts increase if sea level rises, as expected, since
the acqua alta episodes become more frequent. Similarly, MOSE operates
more frequently when the security increment is added, which explains why
bene�ts improve too. Finally, notice that the minimum level of net bene�ts
(negative amount) corresponds to scenario B. Such a result derives from a
partial failure of the mobile barriers�closing procedure: the system is not
alerted due to a forecast error and therefore the tide reaches a high level (+
144 cm w.r.t. Punta della Salute Tidal Datum).
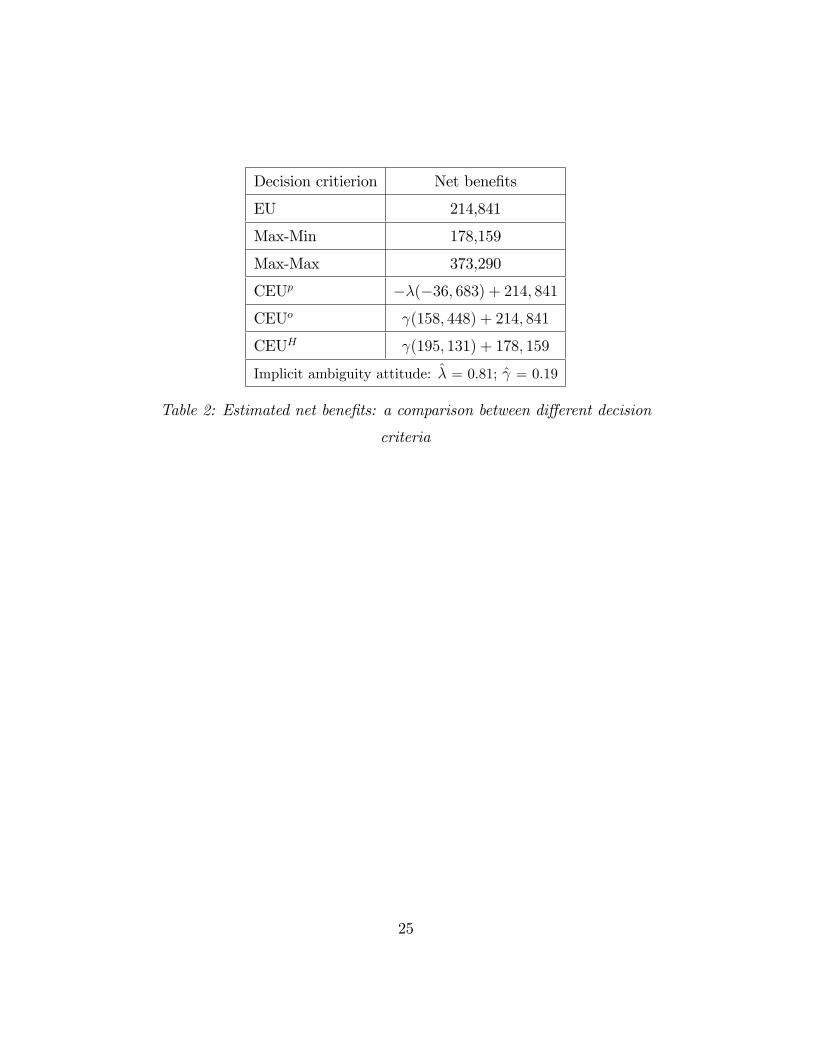
In order to compare the di¤erent estimates of total bene�ts and costs and
use them for policy considerations we need to distinguish between decision
9Our analysis does not take into account the indirect harbor costs, corresponding to
the foregone earnings due to the potential loss of navigation because of MOSE in favour
of alternative ports.
12

making variables and exogenous (environmental) ones. The formers are the
two threshold levels (+100 cm or +110 cm) and the security increment (0,
+10 cm); the latter is the sea level rise (0, +30 cm, +50 cm). Choices about
variables are supposed to be made on the basis of the estimated net bene-
�ts associated to each scenario, weighted according to the decision criterion
adopted by policy makers. We compare the results obtained from the ap-
plication of the CEU described in Equation 1 under di¤erent values of the
subjective parameters and � with the one arising from a decision framework
without ambiguity, i.e. the expected value.
Let us consider �rst the expected net bene�ts of MOSE functioning.
There is no objective probability measure that can be called on to evalu-
ate it. Thus, the states of the world should be equally weighted according to
a uniform probability distribution.10 In our case, this implies that a prob-
ability pi = 112is associated to the estimated net bene�ts for each scenario:
E(c(MOSE)) =PL
i=A pi � ci; where ci denotes the net bene�ts of MOSE inscenario i. This criterion provides a benchmark corresponding to the situ-
ation with no ambiguity. In the case of MOSE, the expected value equals
214; 841 Thousands of Euro (Table 2).
[Table 2 about here]
TheMax-Min criterion (C1) considers only the worst outcomes associated
with each possible decision, taking the decision corresponding to the less bad10On the basis of the Bernoulli�s Principle of Insu¢ cient Reason, named also principle
of Indi¤erence. There is a vast debate in the literature about it, that we cannot report
here because of space constraint. See Gravel et al., (2007), Sinn (1980) and references
therein. Notice, moreover, that our analysis would not be qualitatively a¤ected by taking
a di¤erent assumption, which leads to a di¤erent prior; simply, we would obtain a di¤erent
value for E� and a di¤erent set of ̂; �̂:
13

outcome among them. Recall that the decisions are about the safeguarding
level and the security increment. The worst scenarios11 (lowest bene�ts) re-
fer to the possibility of foreseeing a null increase of the sea level, that leads
to the lowest net bene�ts scenarios B; D; A;C. Net bene�ts range from
�6; 490 Thousands of Euro in case of scenario B, which corresponds to athreshold level of +110 cm and no security increment, to 178; 159 Thousands
of Euro under scenario C (safeguarding level of 100 cm and 10 cm of security
increment). The less bad outcome among them is associated to scenario C.
Similarly, the most optimistic criterion, the Max-Max (C2 in the previous
section), considers only the maximum values. In our case, the relevant deci-
sions about the threshold level and the security increment lead to the best
outcomes (highest bene�ts) in the case of a sea level rise of 50 cm. These
outcomes correspond to scenarios K;L; I and J . Among them, scenario K
exhibits the best outcome, equal to 373; 290 Thousands of Euro. The evalu-
ation of the net bene�ts of MOSE functioning derived from the application
of the CEU de�ned in Equation 1 changes according to the subjective am-
biguity attitude of the decision maker. For instance, if we �x = � = 12the
net bene�ts of MOSE functioning would be 12C1 +
12C2, which corresponds,
according to our estimates, to 275; 724 Thousands of Euro, higher than the
expected utility estimate. Di¤erent assumptions about the decision makers
attitude towards ambiguity entail a di¤erent value of and �: Substitut-
ing the values of C1, C2 and E� with those calculated in the case of MOSE
gives the following equations for the set of points showing pure pessimism,
pure optimism and for the Hurwicz criterion, respectively (Thousands of
Euro); CEUp = ��(�36; 683) + 214; 841; CEU o = (158; 448) + 214; 841;
11Given that the investment has already been planned and the MOSE system has to be
operated, the scenarios inducing the lowest net bene�ts are the worst ones.
14

CEUH = (195; 131)+ 178; 159: Finally, we can calculate the implicit ambi-
guity attitude: �̂ = 0:81; ̂ = 0:19: Thus, when deciding whether to �nance
the MOSE building, decision makers have implicitly shown pessimism, i.e.,
they have overevaluated the scenarios that provide the lowest bene�ts and
have underevaluated those that induce the highest ones (thus following a
precautionary approach).
5 Conclusions
Our application considers ambiguity in a real decision making problem. In all
those circumstances in which an additive probability distribution cannot be
associated to the di¤erent possible states of the world with certainty, di¤erent
scenarios have to be taken into account and weighted according to a given
decision criterion. The consequences in terms of the estimated outcomes as-
sociated to the various decision criteria may substantially di¤er. We apply
the NEO-capacity framework of Chateauneuf et al., (2007) to the study of
the net bene�ts of MOSE functioning for the city of Venice. A plus of the
model is that it encompasses various decision making criteria as speci�c cases
of the general decision making functional by choosing values of the parame-
ters expressing the optimism and/or the pessimism of the decision maker.
Moreover, it allows to calculate the implicit attitude towards ambiguity of
the decision maker who has to make the decision. We identify di¤erent bene-
�t components: avoided costs for repairing buildings from �ooding damages,
avoided costs for taking care of children at age of schooling and aged people
forced to stay home by �ooding and avoided reduction in tourists�expenses.
For the costs, we consider the direct additional costs induced by the reduced
frequency of shipping passages through the lagoon due to inlets closures. We
15
derive, for the twelve di¤erent scenarios re�ecting di¤erent assumptions on
both environmental and anthropic variables an estimate of the net bene�ts
of MOSE functioning and show the implications of the decision making cri-
terion we consider. The estimated net bene�ts substantially vary according
to the optimism and pessimism of the decision maker. Even assuming that
decision makers have a symmetric attitude towards ambiguity (i.e., optimism
and pessimism are equally weighted) net bene�ts are di¤erent from the ones
that can be calculated on the basis of their expected value only. Moreover,
the Expected Value Equivalent set shows that the decision maker has implic-
itly had a pessimistic (precautionary) approach when assessing the value of
the bene�ts of MOSE system for the city of Venice.
6 Acknowledgments
We would like to thank the Istituto Cavanis of Venice, the �Istituzione Centro
Previsioni e Segnalazioni Maree�of the city of Venice, the Venice Harbour
O¢ ce (�Capitaneria di Porto�) and Port Authority (�Autorità Portuale�) for
the data on rain, tidal real and forecasted level and ship tra¢ c kindly pro-
vided to us; CISET and Caterina Cruciani for the provision of CISET data
on tourists expenses; Paulo A.L.D. Nunes for having made available to us
estimated costs data and Carlo Carraro for his useful comments, without
implicating any of them. Lucia Vergano gratefully acknowledges the VEC-
TOR project for �nancial support and useful information on data and models
related to the objective of this study.
16

7 Appendix12
We describe here the methodology applied to calculate the net bene�ts of
the MOSE system.
Two categories of costs are considered: operational and maintenance costs
and direct costs due to the interferences with harbour activity. O&M costs
are obtained from an o¢ cial report on MOSE (Collegio di Esperti di Livello
Internazionale, 1998), updated to take into account in�ation and expressed at
prices 2005; they equal 11,136 Thousands of Euro/year. The second category
has been derived from Nunes et al. (2009) and stems from the interruption
of ship passages: when the mobile barriers are raised ships wait a longer pe-
riod in roadstead and/or stay for a longer in wharf/quay due to the closure
of inlets. These costs are calculated by summing two di¤erent components:
charter costs, re�ecting the additional time necessary to getting in and out
of the lagoon; mooring costs depending on the additional time ships have
to spend in docks. Charter costs capture the amount an individual has to
pay to charter a ship. This amount is not �xed, but varies according to
contract clauses.13 In the absence of detailed information, it is assumed that
extra charter costs equal the ordinary charter costs.14 Mooring costs include
the costs for ships to stay in harbour; it derives from the o¢ cial costs pro-
12Data sets and regressions are available from the authors upon request.13For crude oil tankers, for instance, time charters cover a long period of time, 10 or more
years; consecutive trips charters (COA) specify the number of trips or the period of time
(e.g. 1 year); spot charters refer to single trips between two speci�c harbours. Spot charters
represent the 15-20% of the total transport needs and re�ect the relationship between the
short run demand and supply of crude oil tankers for single trips (www.eniscuola.net).14We suppose that there will be no extra costs due to the delay on ships passages and
charters induced by MOSE functioning, assuming that the latter will be included among
the causes of delay not under owner�s responsibility.
17

vided by the main maritime agencies operating within the Venice harbour:
�Venezia Trasporti Passeggeri�(VTP), for passenger ships; �Terminal Inter-
modale Venezia� for all other ship categories.15 Table 2 resumes the cost
components expressed at market prices for each ship category.
[Table 3 about here]
Bene�ts are been calculated evaluating the impact of acqua alta on the
city of Venice and people in and coming to the city. Cellerino (1998) iden-
ti�es two di¤erent categories of damages induced by acqua alta: damages to
buildings, which can be subject to speci�c laws of protection on the basis of
their artistic value, and damages to individuals (residents - elderly people,
students - and tourists). We have adopted the following methodology: the
�rst category refers to damages a¤ecting the stock of real estate and thus
it depends on the intensity of �ooding; the latter a¤ects the �ow of services
(touristic and personal) and therefore depends on the frequency of the �ood-
ing episodes. Thus, we calculate the bene�ts by deriving for each category
the avoided costs, i.e., the cost saved thanks to the reduction in intensity and
frequency of �ooding due to the MOSE functioning in the following way.16
1. For buildings, high water causes damages to the walls,17 which needs to
be plastered after �ooding. We assume that the renovation intervention
is undertaken once, taking into account the highest tide experienced
15When expressed in USA dollars, costs have been transformed in Euro by using the
average o¢ cial exchange rate provided by the italian exchange bureau (�U¢ cio Italiano
Cambi, see www.uic.it) over the period January 2005 - May 2006.16All costs are expressed in 2005 prices; �gures in Canestrelli (1998), when needed,
have been converted in Euro and upadted according to the OECD Italian Consumer Price
Index.17Damages to fornitures, apparels and systems are not included because of lack of data.
18

during the whole period considered for ships�tra¢ c (2000-2002). We
also assume that only the surface of walls that have been �ooded is
renovated. The surface is calculated setting the length18 of the build-
ing surface involved by �ooding as a function of the highest tide and
multiplying it by a �xed height of 100 cm.19 For buildings interested by
speci�c laws of protection (historical buildings), the costs of renovation
include also the costs for introducing a lead plate within the walls.
2. Avoided costs due to the displacement problems for Venetians include
the avoided costs of caring for children in age of schooling and elderly
people. We used data provided by the o¢ cial statistical bureau of
the Municipality of Venice20 for the distribution of cohorts. Cellerino
(1998) shows that the 27% of children in age of schooling (from 5 to
19 years old) cannot reach their schools with a tide equal or above
120 cm. At the same tide, the 10% of the population from 75 to 84
years old cannot be cared of by their family. Therefore, we calculate
the cost of interference on the personal services taking into account
the opportunity cost of acqua alta for these people, namely, payments
needed for baby-sitting and nursery services which occurs whenever the
tide reaches + 120 cm over Punta della Salute Tidal Datum.
3. Data on the monthly tourist �ow (during the period 2001-2007) come
from the o¢ ce of the Venice Municipality. An OLS regression is per-
formed to calculate the number of tourists discouraged from coming to
Venice as a function of the acqua alta (set equal or above 120 cm, in-
18The �gure is obtained from a interpolation of the data about the length of buildings
walls involved by acqua alta for di¤erent heights of �oods, as described in Cellerino (1998).19The rationale of such a height is explained in Cellerino (1998).20See www.comune.venezia.it/�ex/cm/pages/ServeBLOB.php/L/IT/IDPagina/1523
19
cluding the months of the year as control variables).21 Data on tourist
average daily expense (for the period 2000-2002) come from the CISET
Institute and is updated and used to convert �gures of avoided tourists
into avoided expenditures. Table 3 shows the di¤erent average unitar-
ian costs.
[Table 4 about here]
Clearly, costs and bene�ts we consider are just a subset of the complete
set, yet is the only one for which we could obtain data. In particular, environ-
mental costs (and bene�ts) are not taken into account too, since there are no
clear estimates of them. We limit our analysis to the net bene�ts accruing to
the historical part of the city of Venice only, excluding Mestre (its continental
part), Lido, other islands and all other municipalities that are also a¤ected
by the acqua alta episodes in the lagoon. Moreover, we do not consider the
expenditures of residents that can be a¤ected by the displacement problems
generated by �ooding, except those of students and elderly people,22 as well
as any avoided cost due to the reduction in the damages to commercial and
industrial inventories. Finally, see that we do not take into account invest-
ment costs in our calculations. These are �xed (and sunk) costs, while we are
21On average, the presence of tourists in Venice is reduced by 3,516 units per every
acqua alta episode (OLS regression, t = �1:68, R2 = 0:582).22This is equivalent to suppose that all other Venetian residents�s needs of displacement
are not a¤ected by acqua alta. This is clearly a simplifying assumption. The report of
the international panel of experts (Collegio di Esperti di Livello Internazionale, 1998)
proposes a partial estimates of the e¤ects of MOSE for Venetian People. However, the
methodology followed in that work is not compatible with our approach since they do not
distinguish between tourists and residents; moreover their data on displacement costs are
not available.
20

interested in the evaluation of the net bene�ts of the MOSE due to the vari-
ation in the frequency of its usage. Thus, investment costs can be regarded
as a scalar that could in principle be applied to our �gures. However, it is
not clear which exact amount should be used for it, since planned investment
costs have been changing throughout the construction period, which has not
been concluded yet.23
8 References
Arrow K. J. and Hurwicz L. (1972), An Optimality Criterion for Decision-
Making under Ignorance, in Carter, C.F. and Ford, J.L. (eds.), Uncertainty
and Expectations in Economics, Blackwell, Oxford.
Breil M., Gambarelli G. and Nunes P.A.L.D. (2005), Economic Valuation
of On Site Material Damages of High Water on Economic Activities based in
the City of Venice: Results from a Dose-Response-Expert-Based Valuation
Approach, FEEM Working Papers, n. 53.05, Milano, Italy.
Canestrelli P., Cerasuolo M., Corte C. and Pastore F. (1998), La marea
a Venezia e l�impatto sulle attività umane, Centro previsioni e segnalazioni
maree, Comune di Venezia.
Cellerino R. (1998), Venezia Atlantide: l�impatto economico delle acque
alte, Franco Angeli, Milan.
Chateauneuf A., Eichberger J., and Grant S. (2007), Choice under uncer-
tainty with the best and worst in mind: Neo-additive capacities, J. Econom.
Theory, 137, 538-567.
Chichilnisky G. (2000), An Axiomatic Approach to Choice under Uncer-
tainty with Catastrophic Risks, Resources and Energy Economics, 2000, 22,
23At present it equals 4; 271:63 MEuro (www.salve.it) .
21
221-231.
Choquet, G. (1954) Theory of Capacities, Annales de l�Institut Fourier,
Grenoble, 5, 131-295.
Collegio di Esperti di Livello Internazionale (1998), Rapporto sul progetto
di massima degli interventi alle bocche lagunari per la regolazione dei �ussi
di marea. Available at http://www.salve.it/it/soluzioni/f_acquealte.htm.
Gravel N., Marchant M. and Sen A. (2007), Ranking Completely Un-
certain Decisions by the Uniform Expected Utility Criterion, Document de
travail, IDEP #67, working paper n.0705, Juillet.
IPCC (2001), Climate Change 2001, Contribution of Working Group I
to the Third Assessment Report of the Intergovernmental Panel on Climate
Change (IPCC), J. T. Houghton, Y. Ding, D.J. Griggs, M. Noguer, P. J. van
der Linden and D. Xiaosu (Eds.), Cambridge University Press, UK.
IPCC (2007), Climate Change 2007, Fourth Assessment Report, Working
Group I Report �The Physical Science Basis�, Technical Summary, Cam-
bridge University Press, Cambridge.
L. Hurwicz (1951a) Optimality criteria for decision making under igno-
rance, Cowles Commission Discussion Paper, Chicago, p. 370.
L. Hurwicz (1951b) Some speci�cation problems and application to econo-
metric models, Econometrica 19 (1951) 343�344.
Magistrato delle Acque (1997), Interventi alle bocche lagunari per la re-
golazione dei �ussi di marea - Studio di impatto ambientale del progetto di
massima, Allegato 6, Tema 5, 163.
Mukerji S. (1997), Understanding the Non-additive Probability Decision
Model, Economic Theory, 9, 23-46.
Nunes P.A.L.D., Umgiesser G. and Vergano L. (2009), The economic as-
sessment of MOSE impacts on Venice port activities, FEEM Working Paper,
22

Milano, (forthcoming).
Rawls J. (1971), A Theory of Justice, Oxford University Press, London.
Sarin R. andWakker P., (1992), A Simple Axiomatization of Non-Additive
Expected Utility, Econometrica, 60, 1255-1272.
Schmeidler D. (1989) �Subjective Probability and Expected Utilty With-
out Additivity�, Econometrica, 57, 571-87.
Sinn H.W. (1980) A Rehabilitation of the Principle of Insu¢ cient Reason,
Quarterly Journal of Economics, 95, 493-506.
Umgiesser G. and Bergamasco A. (1993), A staggered grid �nite element
model of the Venice Lagoon, in Morgan K., O�ate E., Periaux J., Peraire
J. and Zienkiewicz O.C. (eds.), Finite Elements in Fluids, Pineridge Press,
Barcellona, 659-668.
Umgiesser G. and Bergamasco A. (1995), Outiline of a primitive equation
�nite element model, Rapporto e Studi, Vol. XII, Istituto Veneto di Scienze,
Lettere ed Arti, Venezia, Italy, 291-320.
Umgiesser G., Melaku Canu D., Cucco A. and Solidoro C. (2004), A �nite
element model for the Venice Lagoon. Development, set up, calibration and
validation, Journal of Marine System, 51, 123-45.
Umgiesser G. and Maticchio B. (2006), Simulating the mobile barrier
(MOSE) operation in the Venice Lagoon, Italy: global sea level rise and its
implications for navigation, Ocean Dynamics, 56, 320-32.
Wald A. (1950), Statistical Decision Functions, Wiley, New York.
23
Scenarios Total costs Total bene�ts Net bene�ts
(A) 00_100_00 31,838 152,533 120,695
(B) 00_110_00 31,934 25,444 -6,490
(C) 00_100_10 31,669 209,828 178,159
(D) 00_110_10 31,862 152,533 120,671
(E) 30_100_00 33,588 268,182 234,593
(F ) 30_110_00 32,080 230,794 198,714
(G) 30_100_10 35,485 268,182 232,696
(H) 30_110_10 33,024 231,238 198,214
(I) 50_100_00 41,383 369,152 327,770
(J) 50_110_00 36,277 306,543 270,265
(K) 50_100_10 45,084 418,373 373,290
(L) 50_110_10 39,522 369,041 329,520
Table 1: Total costs and bene�ts (Thousands of Euro/Year) for each
scenario
24
Decision critierion Net bene�ts
EU 214,841
Max-Min 178,159
Max-Max 373,290
CEUp ��(�36; 683) + 214; 841CEUo (158; 448) + 214; 841
CEUH (195; 131) + 178; 159
Implicit ambiguity attitude: �̂ = 0.81; ̂ = 0.19
Table 2: Estimated net bene�ts: a comparison between di¤erent decision
criteria
25

Charter costs Mooring costs
Tons e/Ton/Hour e/Hour
Crude oil tanker 8xa 0.03 1,333.33
Other oils tanker x>1,000 0.13 1,333.33
1,000>=x<1,500 0.12 1,333.33
x>=1,500 0.11 1,333.33
LNG tanker x<7,000 0.29 1,333.33
7,000<=x<20,000 0.19 1,333.33
x>=20,000 0.14 1,333.33
Container x<15,000 0.03 1,000.00
x>=15,000 0.02 1,000.00
Cargo x>=4,500 0.01 1,333.33
Carrier x<4,500 0.03 1,000.00
x>=4,500 0.01 1,000.00
e/Pass/Hour e/Hour
Passenger ship 1.60 0.17
Yacht 46.77 0.45a x refers to ships�gross tonnage.
Source: our elaboration from Nunes et al. 2009
Table 3: Charter and mooring costs for ship category
26

Buildings
Plastering: internal walls 2.77 e/1m 1cm high
: external walls 5.44 e/1m 1cm high
Artistic buildings
Plastering: internal wall 2.77 e/1m 1cm high
: external walls 5.44 e/1m 1cm high
Lead plate: internal walls 20.11 e/m
: external walls 61.87 e/m
Aged people
Caring 12.37 e/hour
Children in age of schooling
Caring 12.37 e/1.5 hours
Tourists
Tourist expense 85.96 e/day
Table 4: Avoided costs and expenses for category
27