The Road to Representivity: a Demos and Ipsos MORI Report on sociological research using Twitter
57
the road to representivity a Demos and Ipsos MORI report on sociological research using Twitter Carl Miller Steve Ginnis Rowena Stobart Alex Krasodomski-Jones Michael Clemence
Transcript of The Road to Representivity: a Demos and Ipsos MORI Report on sociological research using Twitter

the road to representivity a Demos and Ipsos MORI report on sociological research using Twitter
Carl Miller Steve Ginnis Rowena StobartAlex Krasodomski-Jones Michael Clemence

Open Access. Some rights reserved.
As the co-publishers of this work, Demos and Ipsos MORI wants to encourage the circulation of their
work as widely as possible while retaining the copyright. We therefore have an open access policy
which enables anyone to access our content online without charge. Anyone can download, save,
perform or distribute this work in any format, including translation, without written permission. This
is subject to the terms of the Demos licence found at the back of this publication. Its main conditions
are:
Demos, Ipsos MORI and the author(s) are credited
This summary and the address www.demos.co.uk are displayed
The text is not altered and is used in full
The work is not resold
A copy of the work or link to its use online is sent to Demos.
You are welcome to ask for permission to use this work for purposes other than those covered by the
licence. Demos and Ipsos MORI gratefully acknowledges the work of Creative Commons in inspiring
our approach to copyright. To find out more go to www.creativecommons.org
Partners Credits
Commissioned by?
Published by Demos September 2015
© Demos. Some rights reserved.
Lloyds Wharf
2-3 Mill Street
London
SE1 2BD
www.demos.co.uk
This report is part of the Wisdom of the Crowed project, sponsored by Innovate UK, the UK's
innovation agency, with funding contributions from the TSB, the EPSRC and the ESRC. Demos,
Ipsos MORI, and the University of Sussex have come together with CASM Consulting LLP to
critically examine the possibilities of social media research.

2
CONTENTS
Executive summary 3
Introduction 7
Part 1: The difference between offline and Twitter 12
Part 2: The road to representivity 17
Conclusion 42
Technical Annex 43
Notes 52

3
EXECUTIVE SUMMARY
The rise of social media has profound consequences for those that research society to understand how it works. New bodies of information about society are now routinely produced through social media that are enormous, real-time, and rich new seams of evidence about social life: of people arguing, campaigning, talking about what they are doing, and offering what they think.
An important goal of social research is to study attitudes – to understand the fears, priorities, reactions and inclinations that people have and hold, whether to a person, a policy, company or idea. Attitudinal research is vital to inform decisions that affect and involve society: for agile, representative Government, for an effective and powerful civil society, and for good businesses that understand their consumers.
However, human attitudes are complex, difficult things to research. Principles and standards have built up over centuries to govern how to research them well, and how to avoid the many pitfalls that exist. One of the most important principles of social research, and especially when it tries to understand the attitudes of broader groups, is representivity. Research often depends on its ability to draw more general inferences about a wider population based on the data it uses, and the methods it employs. Representivity is not always important, of course, but it is vital when the research wishes to draw conclusions that are wider than simply those who have been the direct subjects of the research.
Researching society through social media must, in general, also reflect the principles of social science, including, in many contexts, the principle of representivity. However, representative research on social media is no easy task. New technologies are needed to understand very large, often complex social media datasets that are unfamiliar to social science, and do not easily fit within the conventional methods and frameworks that it uses.
This paper is about trying to research social media in ways that both represent social media users, and also possibly wider society. It is part of a wider effort between social researchers at Demos and Ipsos MORI, and technologists at the University of Sussex and CASM Consulting LLP, to build new and better ways of conducting social media research.
The challenge of representivity has a number of different layers – different reasons why online data may not be representative – either of that online community, or of course the wider population. Each layer influences different social media datasets to different extents, and each matter to varying degrees depending on the research objective. Sometimes the researcher would only want to listen to individuals, other

4
times to institutions too. Likewise, sometimes it is important to ensure the demographic makeup of the online dataset reflects broader society, other times it is exactly the skew in the group of people that are talking about something online that makes this activity interesting.
To understand the representivity challenge, we collected and contrasted online and offline datasets on three themes:
Brands: The brands most spoken about on Twitter, set against the brands most mentioned by people when asked face-to-face.
Issues: Which social and political issues are most prominent on Twitter, set against the issues people mentioned as important when asked face-to-face.
Politics: How Ed Miliband and David Cameron were spoken about on Twitter, set against their offline favourability scores.
The online data used in this report was from Twitter, but the same representivity challenges – to different extents and in different ways – apply to social media research in general.
For each theme, the paper attempts to measure the effect each layer of the representivity challenge has on the dataset. It also suggests what can be done about them, and whether these reactions move what is seen in the online data closer to their offline comparators. In doing so, it aims to identify which of the differences between the two are produced by differences in how they are researched, and which represent genuine distinctions in the nature of online and offline attitudinal data. Taken together, this is a new research method that attempts to produce research results that reflect how people really behave online, and also is critically and rigorously capable of exposing realities of offline social life. We call this the ‘road to representivity’. It deals with:
Data Collection and relevancy: Offline research attempts to construct representative samples from a wider group. On Twitter, the aim is to collect the comprehensive body of relevant data. However, due to how tweets are collected, datasets are often messy – containing lots of tweets that are irrelevant and missing ones that are relevant. Our reaction was to train natural language processing algorithms to recognise differences in the language between tweets that tended to be relevant and those that were not. The algorithms performed well, removing millions of tweets judged to be irrelevant with reasonably high levels of accuracy.
Prolific accounts: tweets do not represent Twitter users. A small number of ‘power users’ sent a large number of the tweets collected in each theme. The most prolific 1 per cent of accounts sent between 14 and 33 per cent of each total

5
dataset. Our reaction was to shift from counting tweets to counting people on the basis of their tweets, the number of ‘unique voices’ expressing a certain view. Doing this had some effect on the data: for brands modestly reducing the dominance of companies that were over-represented in the online data (compared with the offline results), and for politics both moving the online scores closer to their offline equivalents, and also more closely tracking changes in the offline data over time.
Bots: tweets are not necessarily posted by human beings. Some Twitter accounts are automatically controlled, and some of these produce content. Identifying bots – many of which try to appear as human as possible - is an arms race. This paper attempted very rudimentary identification of bots, based on very low follower accounts. This was broadly ineffective at identifying large numbers of accounts (much less bots), and had little effect on the overall results for each theme. It remains an area of active research and future effort.
Individuals vs. Institutions: Institutional Twitter accounts sent between 10 and 20 per cent of the tweets in each of the online datasets. For a range of research questions, it’s useful that this difference be recognised in how the data is analysed. Our reaction was to build an algorithm that separated them from each other. Removing tweets from institutional accounts caused, for brands, modestly moved the online data closer to the offline results. For politics, institutional accounts had greater similarity to the offline data than non-institutional ones.
Location: Twitter is used by people all over the world. It is important to place boundaries on this data: for our purposes to identify tweets from the UK, and also to understand how online attitudes vary across the UK. Again, our response was to build an algorithm to geographically locate as many tweets as possible based on public, geographically relevant data that they contained. Doing so told us, first, that certain regions within the UK are consistently over-represented in the data compared to their population, especially London. Second, there was also significant variation in attitude between regions. For politics, Scottish Tweeters were more critical of both leaders than any other part of the country, conversations about banks tend to cluster in urban areas than conversations about technology companies.
Socio-demography: Twitter is not evenly used by all parts of British society. When listening to attitudes, it is important to identify and possibly act on demographic bias in who is speaking, and therefore whom you hear. An algorithm was built to discern the aggregate gender of each of the datasets. On Twitter, men tend to be over-represented in datasets – for brands, for instance, they sent 75 per cent of the tweets. There was significant variation between the issues that men and women spoke about that broadly reflected the same differences in the offline

6
research. Women were more favourable to Miliband than men, were more concerned about education than the economy and spoke significantly more about shops and supermarket brands. Additional algorithms to do the same for age, and for socio-demographic background, are also being worked on.
Lastly, the issue of comparability: Listening to social media is not the same as asking people questions. Even if Twitter datasets are technically and formally representative, they may return different results to offline research because they are measuring different things. Tweets are often event-specific, they are public statements driven by different reasons to offline responses, and they are made in an arena that is itself an agent of social change – an electoral battlefield and an active advertising platform. There is no methodological fix for this issue. Instead, this depends on how research from Twitter datasets are understood, the questions that are asked of them, and how online and offline research are combined together. Surveys are one kind of window into society; and social media research is another. Each has its strengths, and weaknesses and each, depending on different ways of collecting and analysing fundamentally different kinds of social data, lend themselves to different kinds of knowledge about how society works.
The final challenge remains to understand how online and offline social research can best work together. In many different research contexts, social media research should not operate in isolation, but as something that contextualises and augments offline social research. Likewise, conventional social research cannot ignore the huge value of the data now routinely created and made accessible by social media platforms like Twitter.

7
INTRODUCTION
People increasingly live meaningful parts of their lives in digital spaces; everything from forging new social ties, sharing information about what is happening in society and what they’re doing, to talking about products, companies and their next Prime Minister. Over half of Brits now regularly use social media, and this is set to continue to increase in the years ahead.1 Over 50 social media platforms now have over 1 million users, for a broad range of different functions.2 Much of this data is public and accessible, and – in digital form – inherently amenable to collection and analysis. This paper is about studying society through analysing Twitter – and more broadly, social media data in general. Twitter allows enormous numbers of tweets to be acquired by researchers for free, and has been the focus of a large amount of academic attention and social research across a number of sectors – from Universities and companies and now increasingly Governments. The rise of social media platforms like Twitter presents new opportunities for researchers. Social media datasets can be collected and understood as new bodies of behavioural evidence: information about how society behaves and what it does. This includes attitudinal research, the study of the beliefs that people hold and how and why they change. Attitudinal datasets collected from Twitter are often importantly different from data collected using conventional ways of studying attitudes: such as surveys, questionnaires and focus groups. They are often much larger, reflect attitudes and views in real-time, do not require the intervention of researchers in peoples’ lives, and frequently are rich – containing links to other online content, other social media sites, videos and pictures. These attributes are often considered strengths of social media research: allowing researchers to listen to more views, more quickly, and more naturalistically, than ever before. These same attributes of Twitter data also pose profound new challenges to research method. The size and complexity of social media datasets require the use of new technologies and methods to collect, organise, analyse, collate and to present the information in ways that we can understand. Ways of understanding social media are often technologically driven, and typically do not reflect the standards, principles or values of social science. Social media is routinely researched for its content: for instance understanding how much, and in what way, individuals, companies and organisations are mentioned. Much less research and technology has been dedicated to understanding more about the overall profile of those taking part – a key principle of conducting rigorous, valid social research that produces results that we can trust and act on.

8
The problem of representivity One of the most important principles of most quantitative attitudinal research is that it must be representative: that the attitudes that are studied recognisably reflect the views of a known group - whether a given profession, type of voter, area of a country, or the whole of society. One of the most profound challenges to unlocking the research value of Twitter is understanding how it can be researched in a way that values and reflects the principle of representivity. This paper is dedicated to that problem, and aims to both explain and measure, as far as possible, the ways in which Twitter datasets are not representative of Twitter users, still less British society. Second, it aims to lay out a series of steps that can be taken to combat the problem of representivity. It is part of a larger project called ‘Wisdom of the Crowds’ funded by InnovateUK, the ESRC and EPSRC. It brings together technologists and social scientists from Demos, Ipsos MORI, CASM Consulting LLP and the University of Sussex to develop new technologies and methodologies for robust, big data social media research. The challenge of representivity is multi-layered; there are a number of ways in which Twitter datasets are not representative, either of the true picture online or offline. These are:
Collection: The data that is collected from Twitter is often not comprehensive of all the activity that is carried out on Twitter in the area being researched. Further, the data that is missed may be non-random, and so introduce and reflect systemic bias in the data that is collected versus the data that is not. Data collected may also not be relevant to the research question at hand and so likewise introduce inaccuracies and ‘false positives’ in the measurements that are made from it.
Prolific accounts: The data that Twitter produces does not reflect Twitter users. Often, a small number of very vocal accounts account for a significant proportion of any given dataset.
Bots: tweets may not reflect the activity of real people. Some Twitter accounts are automated ‘bots’ – members of remotely controlled networks that share content in coordinated ways.
Institutions: tweets may also not reflect the activity of individual people. Many corporate and institutional accounts exist on Twitter.
Location: tweets do not represent neither the attitudes of any given country, nor often all regions evenly within that country.
9
Socio-demography: Twitter is used by certain kinds of people more than others. Listening to Twitter datasets is likely to over-represent the view of certain segments of society over others.
Finally, there is the issue of comparability. Whilst not strictly a question of representivity, it is also important, perhaps most important: online and offline datasets, even when trying to measure the same thing, tap into different phenomena, and listen to different kinds of things. Approach - Politics, Brands and Issues To measure the problem of representivity, and evaluate attempts to confront it, we gathered online and offline datasets related to three themes. The intent was to look at the different ways in which the online and offline datasets on each theme differed, and to see how this difference changed when each aspect of the representivity challenge was responded to. The themes were:
Politics: Did Miliband’s and Cameron’s offline approval ratings over the height of the general election reflect the support and criticism that they received on Twitter? Is Twitter in general a harsher or kinder platform, and are there important distinctions in how popular leaders were amongst those asked face-to-face, and those who used Twitter to talk about politics?
Brands: Are certain brands, and certain kinds of brands, more popular in Twitter discussions than those that people mention that they have heard about when asked offline?
Issues: Do Twitter datasets reflect the issues that offline research suggests are the most important? Do those issues that people say are the greatest priority when asked face-to-face also dominate the conversation on Twitter? Offline Research For each theme, we used conventional social research methods to make offline measurements of representative datasets. These were:
For brands: A face-to-face omnibus survey was conducted of 961 adults (aged 15+) as a single wave between June 5th and June 11th 2015. Respondents were selected to be representative of the United Kingdom. Open responses were recorded to the question: ‘Which brands or companies, have you noticed the most

10
this week?’ These responses were then read and coded into categories by Ipsos MORI researchers.
For issues: We also used a face-to-face omnibus survey which asked adults aged 18 or over, ‘What would you say is the most important issue facing Britain today?’ Respondents were selected to be representative of the United Kingdom. This was conducted in three waves: the first was conducted between February 6 and February 12 (1,142 asked), the second was conducted between 10 and 20th of April (982 asked) and the third between 5th and 15th of June (963 people were asked). These were read and coded into categories by Ipsos MORI researchers.
For politics: A face-to-face omnibus survey was also used. In two waves, British adults (aged 18 or over) were asked ‘Are you satisfied or dissatisfied with the way David Cameron/Ed Miliband is doing his job as Prime Minister/Leader of the Labour Party’? The first wave was carried out between 8th and 10th of February (asking 1,010 people), the second was between 12th and 15th of April (asking 1,000 people). Respondents were selected to be representative of Great Britain. The responses were close-ended, either ‘satisfied’, ‘dissatisfied’, or ‘don’t know’. Online Research To collect and analyse the Twitter datasets for each theme, we established a research infrastructure using two different platforms:
Method52: This is a web-hosted software platform, developed by the project team and especially technologists at the University of Sussex and CASM Consulting LLP. It is designed to allow non-technical analysts to collect, organise and understand very large datasets, especially those that contain text at scales that are too large to manually read. Method52 was principally used to create and use ‘natural language processing classifiers’. A long-established sub-field of artificial intelligence research, natural language processing combines approaches developed in the fields of computer science, applied mathematics, and linguistics. Classifiers are algorithms that are trained to automatically place tweets in one of a number of pre-defined categories of meaning. Method52 uses NLP technology to allow the researcher to rapidly construct bespoke classifiers to sort defined bodies of tweets into categories (defined by the analyst). For a lengthier description of this technology, how classifiers are built, and how well they worked, see the annex of this report.
Qlikview: Qlikview is a data analytics and visualisation platform that allows the construction of bespoke visualisation dashboards as windows into complex, multivariate datasets. Tweets analysed and categorised by Method52 were then transferred into Qlik to allow patterns, trends and attributes of the data to be

11
visually discovered. The data was presented through a series of interactive charts, that allowed non-technical analysts the ability to inspect, filter and understand the Twitter data across a range of different fields, including when the tweets were sent, by whom, where, and any additional analysis conducted by Method52.
These two platforms were combined to allow each of the Twitter datasets to be analysed. Method52 allowed the training of algorithms to split and categorise tweets, whilst Qlik allowed the analytical outcomes of Method52 to be visualized alongside other pieces of information about the tweets.

12
PART 1: THE DIFFERENCE BETWEEN OFFLINE AND TWITTER
DATA
For each theme, there were some important similarities between the online and offline datasets, but also significant differences, and complex variation. Issues We compared the issues of public concern offline with those issues most talked about on Twitter. Offline, the NHS was the top issue for ‘all adults’ in Feb (41 per cent) and April (47 per cent). Immigration was the second most mentioned issue, with 34 and 36 per cent. However, a shift occurred in June, when immigration replaced NHS as top issue (45 vs 40 per cent). The issues spoken about online significantly differed from the offline picture. Some issues spoken frequently about online were not mentioned frequently offline: on Twitter crime was either the first or second most mentioned topic over each wave, but did not feature prominently in offline responses. Likewise, whilst immigration was either the first or second most mentioned issue offline, it was either the least or second least mentioned issue online over each of the waves. There were some overlaps too, however. Education was the most discussed issue on Twitter – with 30 per cent of tweets talking about it. It topped the list in April, but increased even further in June during exam season (41 per cent of tweets and 43 per cent of users). It was also fairly prominent on the offline responses: fifth in February, fourth in April and fifth in June. The economy was also prominent in both: third online and offline in February, fourth online and fifth offline in April, and fourth online and third offline for June.
There was less (although still considerable) difference between the issues Twitter users mentioned as important when asked face-to-face, and the issues that were Tweeted about. Immigration was still much more prominent in offline responses than online conversations, but less so. Likewise, people used Twitter to talk much more about education than were worried about it when asked. But many issues – the economy, the NHS - were broadly of equal prominence offline and online. When just the face-to-face responses of Twitter users are examined, in February the NHS was top offline issue (fourth online), the economy second (third online), immigration third (eighth online), and education fourth (second online). In April the economy was top (fourth online), the NHS second (third online), immigration third (eighth online) and education fourth (first online). In June the NHS was top (third online), immigration second (seventh online) and the economy third (fourth online), and education fourth (first online).3

13
Figure 1 Issues most talked about online and offline in February 2015
Figure 2 Issues most talked about online and offline in April 2015

14
Figure 3 Issues most talked about online and offline in June 2015
Brands We compared the volume of discussion of top brands online with unprompted mentions offline. Offline, for all adults, banks were the most referenced brand type (6 per cent) with tech companies second (5 per cent). When we look at just Twitter users’ responses during these face-to-face conversations, technology companies become easily the most referenced brands (12 per cent, versus 6 per cent for banks). Overall, over the period of June when the offline fieldwork was being done, technology companies were mentioned even more prominently in the Twitter dataset. 66 per cent of all tweets that mentioned one of the top 96 global brands were about a technology company, and 7 per cent were about banks, a ratio of more than 9:1.
15
Politics For politics, we compared the number of tweets that were ‘boos’ (broadly sceptical, critical or worse) and ‘cheers’ (tweets that were supportive or encouraging) about either Ed Miliband or David Cameron with offline satisfaction levels about both. Satisfaction with David Cameron and Ed Miliband was measured in two waves –the first in February, the second in April. This was measured as ‘net favourability’ – the proportion of people who were satisfied with each leader subtracted from those that were dissatisfied. In February, offline net satisfaction was higher for Cameron (-14) than for Miliband (-35). This gap was even greater when those Twitter-users who were asked face-to-face were taken into consideration: Cameron’s net satisfaction was -4, compared to -41 for Miliband. In April, net satisfaction for Cameron remains the same for all respondents, but for Twitter users declined to -10. Satisfaction for Miliband increased strongly compared to February, up to -19 for all respondents, and, an even sharper increase, -5 for Twitter users. To understand favourability on Twitter, an algorithm was built (see below, in the ‘data collection and relevancy section) to separate tweets into ‘boos’ – those that contained critical or sceptical comments about either Miliband or Cameron from ‘cheers’ – those that praised or supported them. A third category - ‘other’ –contained tweets that, as neither boos nor cheers, did not contain an attitude about either leader. Twitter in general treats both candidates more harshly. Of all tweets sent about both candidates that were either boos or cheers, 70 per cent were boos (see below for a description of this metric). Within the online dataset overall, Miliband fares better on Twitter. When only tweeted ‘boos’ and ‘cheers’ were taken into consideration, David Cameron received 85 per cent boos and 15 per cent cheers. Ed Miliband received 59 per cent boos and 41 per cent cheers. Whilst he still had very small numbers of Tweeted cheers, he received fewer boos. Calculating online favourability as cheers – boos, during the time of the February offline fieldwork, Cameron was on -67 and Miliband -47. By April, Cameron had improved to -61, and Miliband had declined to -54. There is therefore very little relationship between the online and the offline datasets for politics. People were more satisfied with Cameron than Miliband when asked offline; on Twitter, Miliband received more support. Also, the Twitter did not reflect the changes in offline favourability between February and April: whilst Miliband’s offline favourability increased significantly over this time (especially for Twitter users), it decreased on Twitter.

16
Figure 4 David Cameron and Ed Miliband approval ratings

17
PART 2: THE ROAD TO RERESENTIVITY A number of things account for these differences in the online and offline data. For each theme, we try to examine each layer of non-representivity in Twitter datasets – understanding how each kind of non-representivity influences any given body of data, and also suggesting what can be done to counteract this influence. This is a new methodological process we call the ‘road to representivity’. It is still a work in progress, and we do not claim that it to be a definitive way of making Twitter datasets fully representative, either of Twitter users, much less of broader society. But we suggest that it is a useful way of approaching social research using Twitter data – and indeed social media data more broadly. It is an on-going attempt to move beyond raw measurements to reflect sociological concerns and values in this new form of research. Step 1 - Data Collection and Relevancy The first problem is data collection and relevancy: do the datasets gathered represent what is really going on, on Twitter? Acquiring data on Twitter is different from sampling used in conventional attitudinal social research. Twitter data is gathered using ‘application programming interfaces’, or APIs. Twitter’s ‘stream’ and ‘search’ application programming interfaces return tweets that contain one or a number of keywords within the text of the tweet. Twitter’s ‘sample’ API returns an (arguably) random sample of 1 per cent of tweets sent on Twitter. This form of acquiring Twitter data presents two problems. First, the initial dataset may contain tweets that are irrelevant to the thing being studied and especially that the missing data is not random. Because of the key words that were selected, there is a danger that the data that is missed is consistently different from the data that is gathered, introducing a systemic bias in the collected data towards a certain type of user or conversation. Secondly, it may miss tweets that are relevant to the things being studied. These problems often interact with each other: the more expansive the series of keywords that are used to collect tweets, the more likely the dataset is to be comprehensive, and also to contain tweets that are irrelevant. The converse is also true. The issue of missing relevant data is a difficult one. Because missing, it is difficult to know how much of it has not been collected, or what kind of data is indeed missing. The broad solution attempted here – and only a partial one - is to use deliberately over-expansive keywords, and then to use make a series of algorithmic interventions, using Method52, to sort relevant from irrelevant tweets. The issue of collected, irrelevant data is easier to handle. Because this data is collected, it is possible to conceivably detect and remove it. The broad solution (see below, and the methodology section) is to build NLP classifiers to
18
automatically classify and sort relevant data from irrelevant data, and remove the latter from the datasets before any measurements are made. Issues Capturing as fair a reflection of how different issues were spoken about online as possible therefore required both the identification of as many tweets talking about each issue as we could, whilst also avoiding the identification of tweets not discussing an issue mistakenly taken to be ones that were. First, we collected tweets from Twitter’s ‘sample’ API – roughly 1 per cent of the total Tweetstream – from January 2015 to July. The sample API is a random selection of tweets posted on the site, about any subject. To restrict the size of this dataset, we immediately discarded any tweets sent from non-British time zones.4 This produced over 14 million initial tweets. Within these 14 million tweets, we needed to separate tweets that were possibly discussing a relevant issue, from those that were not. To do so, we first used ‘keyword identification’. Only tweets that contained one or more of 288 keywords (see technical annex) were selected. These keywords were selected to reflect the offline coding frame used by Ipsos MORI researchers when placing any statement given face-to-face into an issue area. Next, on the basis of the keywords that each tweet contained, they were broken down into each of the issue areas. Eight of the main issue areas were selected for analysis. These were:
Issue/Number of tweets Education: 46,376 Crime: 46,144 NHS: 1,404,124 Economy: 29,036 Defence: 29,705 Housing: 7,669 Immigration: 4,570 Unemployment: 15,639 Total: 1,583,263
It was possible that the keywords used were insufficient – that significant numbers of tweets were about one of the issues, above, but did not contain one of the keywords that we had selected. To check whether significant numbers of tweets were missing, we collected every tweet that did not contain a keyword and put them into a separate dataset. We applied a technique called ‘corpus linguistics’ to this dataset: an analysis of the kinds and frequencies of all the words that all the

19
tweets within the dataset, taken together, contained. The 2,000 most frequently used words were manually inspected to see if any implied a link with any of the relevant issue areas. None were found. This does not confirm that no relevant tweets were missed, but it does imply that the proportion of tweets that was both relevant and missed was not a significant part of the dataset. Of course, simply because a tweet contains a keyword that is possibly relevant to an issue does not mean that the tweet is indeed discussing that issue. The NHS category suffered particularly badly from a large proportion of irrelevant data: irrelevant tweets discussed everything from Doctor Who to ‘pandemic’ the board game. To respond to this challenge, for each issue area, a NLP classifier was then trained to recognise the difference between tweets that were ‘relevant’ – were about the issues in question - and those that were not (see the annex for more information). This produced the relevant numbers of tweets for each category:
Education: 38,565 (7,811 removed) Crime: 30,663 (15,481) NHS: 20,824 (1,383,300) Economy: 17,764 (11,272) Defence: 12,788 (16,917) Housing: 5,157 (2,512) Immigration: 3,225 (1,345) Unemployment: 809 (14,830) Total: 129,795 (1,453,468)
Overall then, 14 million tweets were reduced to 1.5 million tweets possibly about an issue area. However, these contained a large number of tweets that, whilst containing a keyword, were not really about the issue in question. After relevancy NLP classifiers were used, this reduced the volume to around 130,000 that were judged to be probably relevant. A particular challenge for this approach is when one category has a disproportionately large number of irrelevant tweets. This is the situation here for the NHS category. This is a problem as a very small change to the relevancy assessment is likely to create a large change in the number of NHS Tweets deemed relevant, changing the ranking. To address this problem, such big differences in the ratios of relevant and irrelevant tweets should be avoided if at all possible, suggesting here that the keywords need to be adjusted.

20
Brands To collect information regarding brands, a different Twitter API was used. The ‘Stream API’ was used to collect tweets that contained the name of 100 top global brands (see annex). This produced over 61 million tweets. To make the online dataset more comparable with unprompted offline mentions given over the same time, we selected 6 industry areas where the datasets overlapped. These were technology companies, banks, fashion companies, food and drink producers, mobile phone networks and shops or supermarkets. Only tweets mentioning those brands from the list that fell into one of these industry areas were used. This produced 576,326 tweets. On manual inspection, almost all tweets that contained a brand keyword were indeed about that brand, and no relevancy classification was judged to be necessary. Politics From late January to early June 2015, 1,580,000 tweets were collected that mentioned either David Cameron’s or Ed Miliband’s official Twitter accounts. This produced a highly precise sample: all tweets in the dataset were about Ed Miliband or David Cameron. It is certain, however, that many tweets were missed – including any that mentioned either Cameron or Miliband by name rather than @tag.5 The relevancy challenged posed by this dataset was different to either of the other themes. To be broadly comparable to the offline data, a tweet was not relevant simply because it mentioned one of the two Prime Ministerial candidates. We needed to know not simply the amount of mentions each candidate received, but what kinds of mentions these were. Relevant tweets were those that mentioned either Cameron or Miliband, and did so in a way that expressed an attitude about them, a particular judgment, preference or verdict. To find tweets containing an attitude, an algorithmic classifier was built to separate tweets into ‘boos’ – those that contained critical sceptical (or worse) views about either Miliband or Cameron, ‘cheers’ – those that praised or supported them, and ‘other’ – tweets that, neither boos nor cheers, did not contain an attitude about either leader. Only tweets that were either cheers or boos were relevant. The algorithm judged 410,471 tweets to be either a ‘boo’ or a ‘cheer’ – roughly 25 per cent of the total. The majority of the non-attitudinal tweets were unelaborated reportage – linking to an event, news story or announcement, but not offering any views from the Tweeter themselves.

21
Step 2 – Prolific Users In 2009, the Harvard Business Review found that the most vocal 10 per cent of Twitter accounts produced 90 per cent of tweets.6 Since then, a debate has opened on whether this has remained true, and a number of academic voices have sought to distinguish different kind of conversations where vocal accounts play less or more of a role.7 This debate notwithstanding, it has remained clear that a relatively small number of loud, prolific ‘power users’ often account for large proportion of Twitter content, and often a very large proportion, depending on the type of conversation.8 The influence of prolific users differed significantly across the three themes. For brands and politics, prolific users sent a large proportion of the total. For the politics dataset, the top 1 per cent of users sent 518,432 (33 per cent of the total) and the top 10 per cent sent 1,014,875, 64 per cent of the total. For the brands dataset, the same proportions roughly held true. The top 1 per cent of users sent 72,949 tweets, 29 per cent of the total, and the top 10 per cent sent 130,732, roughly 50 per cent of the total. The influence of prolific users on the issues dataset was significantly less. The most prolific 1 per cent sent 18,684 tweets – 14 per cent of the total, and the top 10 per cent sent 49,618, roughly 38 per cent of the total. A small number of very prolific users can skew or influence any analysis based on numbers of tweets. The response to the problem of prolific users is to shift from counting tweets to counting people who have tweeted. Rather than simply counting the number of tweets that mention a brand, issue or certain attitude towards a political leader, it is possible to count the number of unique users who have done so. It is also possible to calculate a ‘tweets per user’ metric that describes the extent that any given Twitter dataset is generally subject to prolific-user effects. Brands 212,717 unique voices were part of the dataset, sending an average of 2.5 tweets each. The power-users within this dataset (the most prolific 1 per cent), sent a disproportionate number of tweets about technology and fashion brands. The most prolific 1 per cent of users account for 28.9 per cent of technology mentions, but just 15.0 per cent of tweets about banks. Fashion company mentions on Twitter are most skewed by prolific users: the 1 per cent most prolific users accounting for most - 62.7 per cent - of the discussion. When users are counted rather than tweets, technology companies still receive the most mentions, but there are important differences. People tweet about tech companies on average 2.44 times compared to 1.67 for banks. Fashion is even more over-represented by prolific users than technology companies at 3.5 tweets

22
per user. Banks are therefore underrepresented in the dataset when counted by number of tweets alone, and technology and fashion brands are overrepresented. Table 1
Brand Group Number of tweets (% of total) Number of unique users
tweets per user (+/- average)
Technology 261,087 (67.5%) 98,489 (62.7%) 2.7 (+0.2)
Shop/Supermarket 68,881 (17.8%) 31,410 (20%) 2.2 (-0.3)
Banks 223,36 (5.8%) 12,828 (8.2%) 1.7 (-0.8)
Fashion 22,671 (5.9%) 6,137 (3.9%) 3.7 (+1.2)
Mobile Phone Network 8,315 (2.1%) 5,128 (3.3%) 1.6 (-0.9)
Food & Drink 3,748 (1%) 3,125 (2%) 1.2 (-1.3)
Total # of tweets 387,038 157,117 2.5
Power-users therefore are partly the reason why the online and offline datasets about brands are so different. Twitter users offline mentioned technology companies twice as much as banks. Online, there are 9 tweets about technology brands for every tweet about banks - however, there are roughly seven times more Tweeters talking about technology companies than banks. Issues 77,500 unique voices contributed the 129,795 tweets within the dataset. Unlike the other datasets, there was less difference in the tweets-per-user across each of the issues. Crime, an issue much more prominent in the online than the offline dataset, had the most tweets per user, whilst unemployment, an issue more prominent offline than online, had the least tweets per user.
Table 2
Brand group Total number of tweets (% total)
Number of unique users (% total)
Tweets per user (+- average)
Education 38,565 (29.7%) 31,200 (32.7%) 1.2 (-0.2)
Crime 30,663 (23.6%) 20,063 (21%) 1.5 (+0.1)
NHS 20,824 (16%) 14,968 (15.7%) 1.4 (+0)
Economy 17,764 (13.7%) 12,416 (13%) 1.4 (+0)
Defence 12,788 (9.9%) 9,053 (9.5%) 1.4 (+0)
Housing 5,157 (4%) 4,178 (4.4%) 1.2 (-0.2)
Immigration 3,225 (2.5%) 2,697 (2.8%) 1.2 (-0.2)
Unemployment 809 (0.6%) 775 (0.8%) 1 (-0.4)
Total # of tweets 387,038 255,962 1.4

23
Politics Counting users rather than tweets for the politics dataset is more difficult. 158,011 users contributed the 388,665 tweets in the dataset. Many people sent more than one tweet, and some users sent hundreds. It is necessary to calculate the overall attitude of each user on the basis of all the tweets that they’ve sent within the dataset. To do this, we segmented each user into one of five segments, on the basis of all the boos and cheers that a user had sent within the whole dataset:
‘Very positive’ users were those who had sent 80-100 per cent cheers, and 0-20 per cent boos
‘Positive’ users were those who had sent 79-60 per cent cheers, and 21-40 per cent boos
‘Undecided’ users were those who had sent 59-40 per cent cheers, and 41-60 per cent boos
‘Negative’ users were those who had sent 39-20 per cent cheers, and 61-80 per cent boos
‘Very negative’ users were those who had sent 0-19 per cent cheers, and 81-100 per cent boos 70 per cent of tweets in the dataset were boos, and 30 per cent were cheers. David Cameron received 85 per cent boos and 15 per cent cheers. Ed Miliband received 59 per cent boos and 41 per cent cheers. When segmented, the dataset was polarised, with almost all users either very positive or very negative about the candidates. The results were also slightly influenced by this user segmentation. For David Cameron, the results became slightly less negative. 73 per cent of the people that Tweeted about him were either ‘negative’ or ‘very negative’. For Ed Miliband, 63 per cent of the people tweeting about him were either ‘negative’ or ‘very negative’. The influence of prolific users boosted Ed Miliband’s favourability on Twitter and also decreased David Cameron’s. When these were taken into account, the results moved closer to the offline satisfaction scores for Cameron and Miliband.
Between February and April, offline favourability for Ed Miliband increased markedly – both in general (-35 to -19) and especially for Twitter users (-41 to -5). Online, the ratio of boos to cheers doesn’t reflect this rise – it actually does the opposite. However, when calculated by the number of people using Twitter in either a broadly negative or positive way to talk about Ed Miliband, a modest increase in online favourability – reflecting the offline movement - was found – as shown in Table 3.

24
Figure 5 Political Boos and Cheers by User
Table 3
Tweets - February Tweets - April Users - February Users- April
Miliband -47.6 -54.2 -59.53 -52.5
Step 3 - Bots Some Twitter accounts are automatically controlled. They can be controlled by third-party applications that influence how the account behaves: what it tweets or re-tweets and who it follows. Many of these are legitimate, and increasingly how organizations and people manage their online presence. Some, however, are used to produce and spread content in ways that are intended to appear to be the activity of a large number of individuals, but are not. These are ‘spambots’. According to Twitter, fewer than 5 per cent of accounts are spambots,9 though up to a further 8.5 per cent of accounts may be bots that do not tweet, using the site for other purposes. However, this number is contested – one paper estimated that 15 per cent of users are ‘fake’,10 and another that 24 per cent of all tweets are from bot accounts.11 There is also an industry on Twitter to buy fake followers. Some

25
researchers estimate that ‘fake’ or purchased followers make up around 4 per cent of followers overall on Twitter.12 According to research conducted by BarracudaLabs in 2012, the going rate for followers is $18 per 1,00013 others have found price packages ranging from $10 to $20,000.14 Identifying bots on Twitter is an arms race. As more sophisticated methods are constructed to do so, bot behaviour itself becomes more sophisticated, harder to profile, and therefore more difficult to distinguish from the genuine human use of Twitter. This paper attempted very rudimentary identification of bots, based on very low follower accounts.15 This is just one of a number of signals that implies an account is a bot and by no means a comprehensive or effective solution. The identification of automated accounts is something on which the project team will publish in subsequent papers. Politics 31,993 accounts with less than 10 followers sent 75,023 tweets – 4.7 per cent of the total. They did not send tweets that significantly differed from those from accounts with greater number of followers, and removing the tweets from these accounts from the dataset had practically no impact on the results. Figure 6 Tweets by follower group

26
Issues For the issues dataset, the presence of low-follower accounts was very small. Just 0.67 per cent of users had less than 10 followers, and they sent just 0.51 per cent of tweets. Figure 7 Tweets by follower group
When low-follower accounts are removed, there was predictably little influence on the results. In no case is there a difference of more than 2 per cent in the number of tweets sent on in each issue, and in the vast majority of cases closer to 0 per cent.

27
Brands For Brands, only 1.76 per cent of users had less than 10 followers and they sent 2.56 per cent of the tweets. Removing these accounts made very little difference on the amounts that each brand group were spoken about. There are slightly more bots in Tech, Shops and Mobile phone Network Categories, where removing accounts with 0-10 followers produced a 3 per cent decrease in their share of the total conversation. Figure 8 Tweets by follower group
Step 4 - Individuals vs. Institution There are broadly two different kinds of genuine Twitter account. Some, of course, are operated by individuals, but others are collective accounts – from organizations, institutions, corporations, Government departments, charities or

28
political parties. It is often important to be able to tell the difference between the two. Especially when the intent of the research is to study attitudes, the attitudes expressed from these two fundamentally different kinds of voices should be distinguished. There is no immediate way to tell the difference on Twitter. Both kinds of voices get collected, and there is no clear presence of any meta-data to immediately or easily separate institutions from individuals. Our solution was to train algorithms to recognise the difference between institutions and individuals. The public profile field, written by the user, often gives more information on the origin and purpose of the account, including, of course, information that indicates whether the account is an institutional or individual one. Technologists at the University of Sussex and CASM Consulting LLP trained algorithms to make this distinction based on their name and their public profile field. It was tested, and found to be accurate at distinguishing between institutions and individuals 87 per cent of the time. Brands 28,629 users were judged to be an institution – roughly 20 per cent of the total. They sent 131,567 tweets – 33 per cent of the total. Table 4
Brand Group Total Number of tweets (% total)
Total number with Institutions removed (% of total without institutions)
Proportional change with institutions removed
Technology 261,087 (67.5%) 168,705 (65.9%) -1.5%
Shop/Supermarket 68,881 (17.8%) 45,220 (17.7%) -0.1%
Banks 22,336 (5.8%) 14,229 (5.6%) -0.2%
Fashion 22,671 (5.9%) 20,063 (7.8%) +2%
Mobile Phone Network 8,315 (2.1%) 4,733 (1.8%) -0.3%
Food & Drink 3,748 (1%) 3,012 (1.2%) +0.2%
Total 387,038 255,962
Removing tweets from institutions had some modest impacts on the results. The proportion of tweets about technology companies slightly declined, whilst the proportion of conversations about fashion companies increased. Issues Within the issues dataset, 22 per cent of users contributing tweets were judged to be institutions, sending 27 per cent of tweets within it.

29
Table 5
Issue Total Number of tweets (% total)
Total number with Institutions removed (% of total without institutions)
Proportional change with institutions removed
Education 38,565 (29.7%) 29,526 (31.3%) 1.6%
Crime 30,663 (23.6%) 21,125 (22.4%) -1.2%
NHS 20,824 (16%) 14,246 (15.1%) -0.9%
Economy 17,764 (13.7%) 13,178 (14%) 0.3%
Defence 12,788 (9.9%) 9,870 (10.5%) 0.6%
Housing 5,157 (4%) 3,385 (3.6%) -0.4%
Immigration 3,225 (2.5%) 2,457 (2.6%) 0.1%
Unemployment 809 (0.6%) 609 (0.6%) 0%
Overall, removing institutions also had a modest impact – decreasing the proportional share of crime (bringing it closer to the offline results) and increasing the share in education (bringing it further away). Only for Education in June does removing institutional accounts produce a change in the results greater than 2 per cent: where removing institutions caused the proportional share of conversations about education to increase by 3 per cent. Politics In the political dataset, 11 per cent of the accounts contributing tweets were judged to be institutions, sending 10 per cent of the tweets. Overall, institutional accounts sent broadly equal number of tweets about Cameron and Miliband. 72 per cent of the attitudinal tweets were boos, and 28 per cent were cheers, broadly the same as non-institutional accounts. Institutions (with a boo-cheer of -61) were significantly more favourable towards Cameron over the entire dataset than non-institutional accounts (-71). Non-institutional accounts (-18) were of equal favourability to Miliband as institutional accounts (-17). Hence, the strange outcome is that, for the political dataset, it is the institutional accounts that have greater similarity with the offline data than personal accounts. Step 5 - Location Location is an important aspect of representivity. People in different areas of the UK sometimes hold consistently and markedly different opinions. According to the Pew Research Center, in 2014, 38 per cent of Twitter users were from urban areas, 35 per cent from suburban areas and 26 per cent from rural areas. This represents a significant change from 2013, at which point 40 per cent of users were from suburban areas.16 No robust statistics were found for the geographic distribution of UK Twitter users, but it is possible that they tend to lean towards areas of greater population density and, especially major urban areas like London. It is therefore important to understand the geographical dimension of Twitter-data; to know broadly where tweets come from, and to be able to understand

30
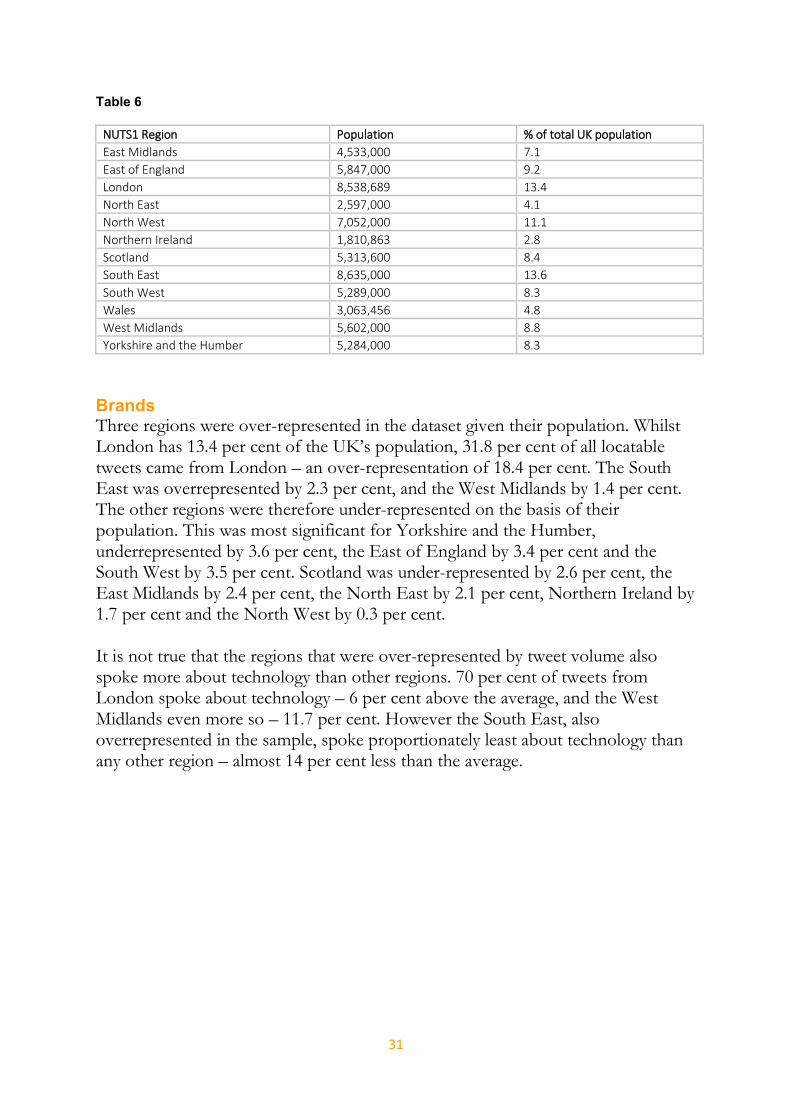
distinctions in attitude from different geographic areas, and how this varies between different datasets. A small amount of tweets have definitive information about where they were sent from. These are geo-tags: precise longitude and latitude coordinates that indicate very precisely where the tweet was posted. Only users who proactively turn on the geo-location facility on their smart phone will include this information. 2.8 per cent of the tweets about brands had specific longitudinal-latitudinal information attached, 3.47 per cent of the tweets about Cameron or Miliband did so, and 2.36 per cent of tweets about issues. However, a larger number of tweets have information – metadata – attached to them when they are accessed from Twitter that also may contain information about where the Tweeter is from. These include (in addition to the longitudinal-latitudinal data contained above), the ‘location field’ – where users report where they are from, and time zone. Our solution was to increase the number of tweets that could be geographically located using algorithmic approaches.17 Technologists at the University of Sussex and CASM Consulting LLP have developed an algorithmic approach that uses these pieces of information to probabilistically locate a larger body of tweets. It looks for information within the location field that indicates a geographic place, and especially one that falls within the same time zone as the tweet. When a location is found, it places the tweet into one of a standardised number of geographical regions across the EU. These are the ‘Nomenclature of Territorial Units for Statistics’ (or NUTS). The most general are the 12 NUTS-1 locations that make up the UK, followed by 40 more detailed NUTS-2 locations and 174 NUTS-3 locations.18 Under tests, it was found to be between 80 per cent and 90 per cent accurate for those Tweets it could locate. It could not locate all Tweets, however - its success in doing so is presented in the technical annex. As part of achieving relevancy (see above), the online for each of the themes was already filtered to just be from the UK. Using the location algorithm, however, it was possible to measure whether there were significant regional differences within each of the online datasets. For the brands dataset, roughly 68 per cent of tweets contained information that allowed their general location to be discerned. For the politics dataset it was 40 per cent and the issues data was 55 per cent. NUTS-1 regions were analysed for this paper. For reference, here are the NUTS-1 regions and their respective populations drawn from the 2011 Census.
31
Table 6
NUTS1 Region Population % of total UK population
East Midlands 4,533,000 7.1
East of England 5,847,000 9.2
London 8,538,689 13.4
North East 2,597,000 4.1
North West 7,052,000 11.1
Northern Ireland 1,810,863 2.8
Scotland 5,313,600 8.4
South East 8,635,000 13.6
South West 5,289,000 8.3
Wales 3,063,456 4.8
West Midlands 5,602,000 8.8
Yorkshire and the Humber 5,284,000 8.3
Brands Three regions were over-represented in the dataset given their population. Whilst London has 13.4 per cent of the UK’s population, 31.8 per cent of all locatable tweets came from London – an over-representation of 18.4 per cent. The South East was overrepresented by 2.3 per cent, and the West Midlands by 1.4 per cent. The other regions were therefore under-represented on the basis of their population. This was most significant for Yorkshire and the Humber, underrepresented by 3.6 per cent, the East of England by 3.4 per cent and the South West by 3.5 per cent. Scotland was under-represented by 2.6 per cent, the East Midlands by 2.4 per cent, the North East by 2.1 per cent, Northern Ireland by 1.7 per cent and the North West by 0.3 per cent. It is not true that the regions that were over-represented by tweet volume also spoke more about technology than other regions. 70 per cent of tweets from London spoke about technology – 6 per cent above the average, and the West Midlands even more so – 11.7 per cent. However the South East, also overrepresented in the sample, spoke proportionately least about technology than any other region – almost 14 per cent less than the average.

32
Table 7
Region
All tweets (% of total for all regions)
tweets concerning technology
tweets concerning technology - % of all tweets per region
Tweets concerning technology - % deviation from average (64.6%)
East Midlands 8,054 (4.7%) 5,107 63.4% -1.2%
East of England 9,992 (5.8%) 6,366 63.7% -0.9%
London 54,410 (31.8%) 38,463 70.7% +6.1%
North East 3,374 (2%) 2,158 64% -0.6%
North West 18,576 (10.8%) 13,310 71.7% +7%
Northern Ireland 1,965 (1.1%) 1,408 71.7% +7.1%
Scotland 9,909 (5.8%) 6,164 62.2% -2.4%
South East 27,257 (15.9%) 13,856 50.8% -13.8%
South West 8,301 (4.8%) 5,088 61.3% -3.3%
Wales 3,954 (2.3%) 2,321 58.7% -5.9%
West Midlands 17,450 (10.2%) 13,313 76.3% +11.7%
Yorkshire and the Humber 8,045 (4.7%) 4,893 60.8% -3.8%
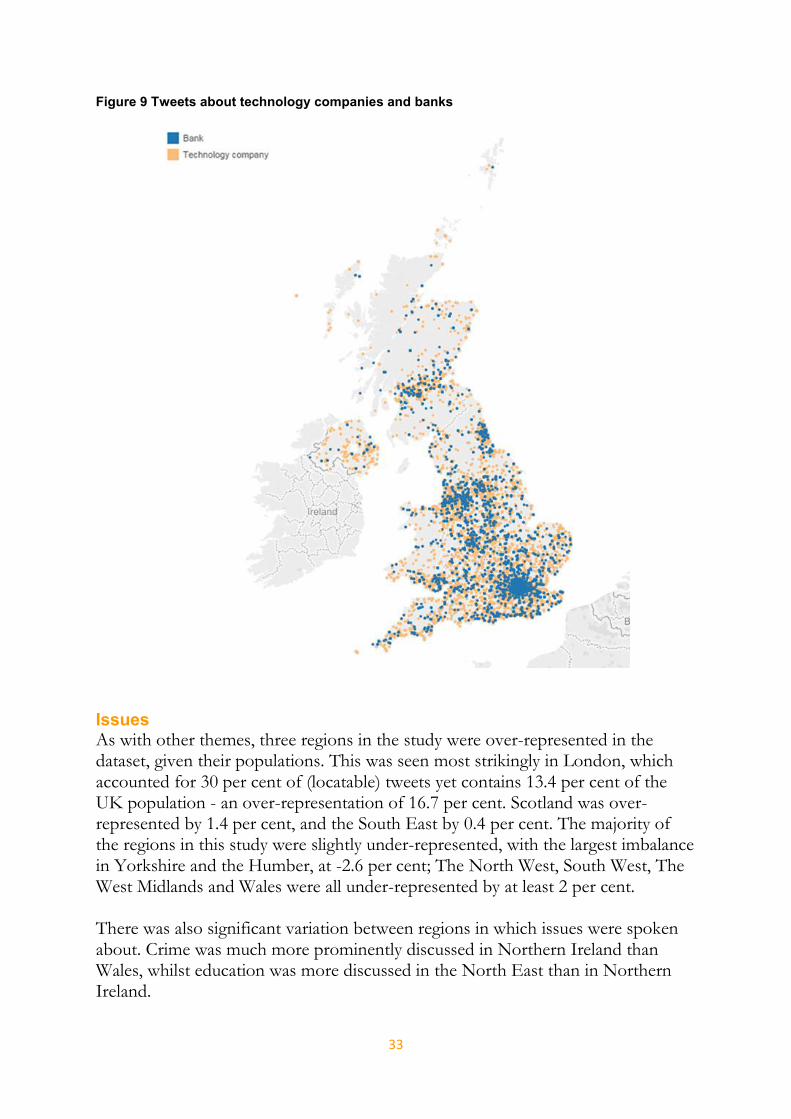
Whilst regional overrepresentation does not therefore explain the predominance of conversations about technology brands, this analysis suggests two important things: first, that there are strong differences in the extent that regions contributed to the conversations about brands in general, and second that, using technology companies as a case, there was significant regional variation in what was spoken about. This also becomes clear when the tweets are geographically visualized. Tweets about both technology companies and banks were plotted onto a map of the UK. It shows that whilst technology conversations were widely distributed, conversations about banks tended to cluster more in large urban areas, and are notably absent from other regions – especially Northern Ireland and the South West.
33
Figure 9 Tweets about technology companies and banks
Issues As with other themes, three regions in the study were over-represented in the dataset, given their populations. This was seen most strikingly in London, which accounted for 30 per cent of (locatable) tweets yet contains 13.4 per cent of the UK population - an over-representation of 16.7 per cent. Scotland was over-represented by 1.4 per cent, and the South East by 0.4 per cent. The majority of the regions in this study were slightly under-represented, with the largest imbalance in Yorkshire and the Humber, at -2.6 per cent; The North West, South West, The West Midlands and Wales were all under-represented by at least 2 per cent. There was also significant variation between regions in which issues were spoken about. Crime was much more prominently discussed in Northern Ireland than Wales, whilst education was more discussed in the North East than in Northern Ireland.

34
Table 8
Issue All areas
Most over-represented region (% issue discussed +- average)
Most over-represented region (% issue discussed +- average)
Crime 23.0% Northern Ireland (+10%) Wales (-3.8%)
Defence 9.2% London (+2.5%) South West (-3.1%)
Economy 15.5% Scotland (+4.9%) West Midlands (-3.4%)
Education 26.8% North East (+6.3%) Northern Ireland (-5%)
Housing 4.8% London (+0.8%) Yorkshire and the Humber (-0.9%)
Immigration 2.6% London (+0.7%) Northern Ireland (-0.9%)
NHS 17.6% Wales (+3.9%) Northern Ireland (-1.9%)
Unemployment 0.6% North East & Scotland (+0.1%) East of England & Wales (-0.2%)
Politics As with the brands data, a few regions were over-represented given their respective offline populations. Of all locatable tweets for both leaders, London produced 24 per cent, 10 per cent greater than its share of population. The North West was over-represented by around 1 per cent and Scotland by 3.6 per cent. All other regions were modestly under-represented. There was some significant variation in attitudes towards the leaders across the regions. Scottish Tweeters were more negative towards both leaders than any other region within the UK, and also (at -9 per cent) further away from Miliband’s average online favourability than Cameron’s. The North West and North East were less favourable towards Cameron than the average, and more favourable towards Miliband.

35
Figure10 Tweets about David Cameron and Ed Miliband by favourability
Step 6 - Social Demography Social demography is a key concern for offline representative research. Offline research either selects research participants on the basis of them being a representative cross section of society based on a range of factors; or controlled for after the data collection. These include age, gender, socio-economic status and occupation. Research conducted by Ipsos MORI shows that Twitter is not evenly used by all parts of society. Twitter is skewed to men, to younger age groups, and also towards socio-economic privilege.
In addition to a skew in the overall profile of people who use Twitter, it is likely that the tweets present in any given dataset will itself be demographically skewed towards socio-economic groups that tend to tweet more than others. Earlier research conducted by Ipsos MORI and Demos found that younger users are much more likely to be prolific Tweeters than older groups.

36
Figure 11 Demographic Profile of twitter users19
Our solution was to learn as much as possible about the broad, aggregated socio-demographic composition of each dataset. This has two aims: first, to clearly empirically measure how the dataset that is gathered is socio-demographically unrepresentative. Second, to allow – if necessary – re-weightings from this data in order to counter these socio-demographic skews. An algorithm was built by technologists at CASM Consulting LLP and the University of Sussex to discern the aggregate gender of each of the datasets. Additional algorithms to do the same for age, and for socio-demographic background, are also being worked on. Once institutional accounts were removed, the algorithm, when tested, was able to discern gender with 88 per cent accuracy. Issues Males account for 59 per cent of the tweets posed, once those from institutions are removed. The gender variation in the topics of conversation is striking. Men proportionately talk about every issue than women apart from one – education, which was almost 17 per cent more prominent in female discussions online about these issues online than male ones. This echoed the gender distinctions in the offline research. Across two of the three waves of offline research, education was a

37
greater concern for women than men. The economy was the issue that leaned closest towards men and likewise, across all three waves of offline research, the economy was raised significantly more as an important issue by men than by women.
Figure 12 Proportion of male and female Tweeters discussing each issue
Brands Of all tweets that were not sent from institutional accounts, men sent 75 per cent of the total. Gender data was not collected in the offline research, so there is no direct comparator, however there was striking variation within the offline data. Technology companies were more likely to be spoken about by men than women, as was fashion. The largest variation was for the shops and supermarket category, which proportionally accounted for 17 per cent more of the discussion by women than by men.

38
Figure 13 Proportion of male and female Tweeters discussing each brand ground
Politics Across the whole dataset, when tweets from institutions were removed, men accounts for 72 per cent of the total number of people tweeting, and 73 per cent of the tweets. 55 per cent of men’s tweets were about David Cameron, and 54 per cent of women’s tweets. For men, David Cameron’s net favourability (cheers – boos) was -71 and for women -72. However, for the total dataset, there was a significant gender difference in online favourability towards Ed Miliband. For men, Miliband’s net favourability was -25, and for women it was +1. This echoes a gender distinction discovered in the offline data. In February 4 per cent more of women were dissatisfied with Cameron than men, but 5 per cent less of women were dissatisfied with Miliband than men.

39
Comparability The final issue is not strictly an issue of representivity, but of the comparability between online and offline research. Whilst the overall research questions of online and offline research may be the same, they attempt to get to the answer in different ways. Offline quantitative sociology (at least as it is used in this paper) asks people questions and records their responses. Each of the offline forms of research used here involved asking people questions – about the issues that they cared about, the brands they had heard about recently, and their feelings about the merits of two high-profile politicians. In each case, their Twitter-data counterparts were different. They did not involve intervening in anyone’s life to ask them direct questions, instead trying to learn about the same question through listening to tweets that are produced, regardless of the existence of the research, through how people choose to use that platform. Social media research is a form of social listening, more similar to the kind social observation once carried out by Mass Observation.20 At the most fundamental level, then, these two different ways of learning about society are different. Even if Twitter datasets are technically and formally representative, they may return different results to offline research because they are observing and measuring different kinds of social phenomena. There is no methodological fix for this issue. Instead, this depends on how research from Twitter datasets are understood, the questions that are asked of them, and how the research is used. Vital to understanding the problem of comparability is to understand how each social media dataset fits into people’s lives; why they use it, when, and how. These are questions tackled in another report by Demos and Ipsos MORI called Social media in social life. In brief, that report found that talking to friends and family is the main reason that people use social media, including Twitter. Second, that people use it to keep up with news and events, ahead of sharing anything themselves, and ahead of talking about politics or issues. The kind of content that captures people’s attention are those from people that they know, and content from organizations that they trust: offline networks matter on social media platforms. In addition to the broad reasons why social media platforms attract users is also the question of how it is used. Here, some broad characteristics of Twitter data distinguish them from those typically gathered using offline means:

40
Generic Views vs. Event Specific Statements: Each of the waves of offline research asked questions which were generic: the issues that the UK faces, how well political leaders are doing their job, and brands that you’ve heard of recently. One of the most fundamental differences between these kinds of questions and Twitter is that Twitter is highly event-specific. People very rarely use Twitter to offer generic, overall views. People far more commonly use Twitter to talk about things that they have otherwise just encountered in their lives – whether something they’ve seen, a news article they’ve read, a conversation they’ve had or something they’ve just done. This was visible across each of three online datasets: education was most commonly spoken during exam time, as people spoke about either the exams they were undertaking, or that people they knew were. The leaders were often mentioned in reaction to an announcement they had made, and most prominently during the Leaders Debate they both participated in.
Solicited Statements vs. Public Statements: Offline research prompts people to respond to questions that they may not have thought much about, and as an anonymous contributor to research. Tweets are public statements, and attributable to an account if not the real person controlling it. This leads to different kinds of expressions: tweets were often from people that passionately cared about a topic or issue, or at least cared enough about it to make a public statement about it. The effect of this was seen most prominently during within the online politics data: the responses tended to be more polarised than the offline research because people either tended to agree or disagree with something in order to tweet about it. People with no opinion simply stayed silent.
Passive statements vs. Active Statements: Offline responses are passive – they are anonymously given to an interviewer in order to contribute to a piece of research. Twitter is a public space and, as such, also an active one – itself an agent of social change as well as a reflection of society. People use Twitter in a variety of ways that are often pro-active – to change society, to get someone elected, sell products, or promote themselves. This makes Twitter subject to a complex body of additional influences not present in offline research. The politics dataset, within the context of a general election campaign, represented a new arena for campaigning and influencing. Activists, commentators and the politicians themselves all used it to make interventions into the debate itself. Likewise, members of the general public used it to reach (or try to reach) politicians themselves – to make suggestions and criticisms, sometimes to throw insults and show their frustrations. Likewise, the online brands data reflected the behaviour of an active advertising medium, where companies were launching promotions, giving special offers, and (sometimes) rewarding consumers for sharing content on Twitter itself.

41
Online vs. Offline Culture: Online mediums like Twitter develop their own norms of behaviour, their own sub-cultures and forms of language and expression. Twitter for some users might be considered a place where certain language is expected to be exaggerated, and where emotional posts are more likely to be interacted with. For others, Twitter is an opportunity to construct a persona or identity different to the one they hold offline causing them to behave in ways that are different from their offline lives. The interaction with a technological platform is itself different from interacting with another person – with a range of psychological and social factors that influence the kinds of behaviour that platforms like Twitter play host to.

42
CONCLUSION Researching Twitter poses a formidable series of new challenges for research method. The ways that any gathered Twitter dataset does not represent Twitter itself, Twitter users, or the wider population, are numerous, complex and interacting. However, this paper has shown that it is possible to measure and understand the representivity challenge on Twitter, and at least partially to counter-act each of its different layers. Whilst not perfect, it is possible to conduct social media research in ways that more closely reflects the values and principles of offline research. It is possible to produce results that better reflect tweets, and Twitter users, if not the wider population overall. Yet, even if social media datasets could be researched in a way that is perfectly representative, they do not themselves represent a replacement to offline research. Surveys are one kind of window into society; and social media research is another. Each has its strengths, and weaknesses and each, depending on different ways of collecting and analysing fundamentally different kinds of social data, lend themselves to different kinds of knowledge about how society works. The final challenge remains to understand how online and offline social research can best work together. In many different research contexts, social media research should not operate in isolation, but as something that contextualises and augments offline social research. Likewise, conventional social research cannot ignore the huge value of the data now routinely created and made accessible by social media platforms like Twitter. Social media research should become part of the armoury of the social researcher – whether in Government, business or in civic society. When offline and online research are capably used together, the differences between these two windows into society are strengths, not weaknesses – and the broad endeavour of understanding society and how it works will ultimately benefit as a result.

43
TECHNICAL ANNEX Classifiers Building algorithms to categorise and separate tweets formed an important part of the research method for this paper. This responds to a general challenge of social media research: the data that is routinely produced and collected is too large to be manually read. Natural language processing classifiers provide an analytical window into these kinds of datasets. They are trained by analysts on a given dataset to recognise the linguistic difference between different kinds of (in this case) tweet: whether relevant or irrelevant, a ‘boo’ or a ‘cheer’. This training is conducted using a technology developed by the project team to allow non-technical analysts to build and use such algorithms called ‘Method 52’.21 Classifiers are built to analyse two kinds of text, (a) the content of the tweet itself, and (b) the profile of the Tweeter. Both pieces of information are contained in every tweet produced by Twitter’s API. The process to create each classifier was to go through the following phases. Each phase is undertaken via a user interface within Method52:
Phase 1: Definition of categories. The formal criteria explaining how tweets should be annotated is developed. Practically, this means that a small number of categories – between two and five – are defined. These will be the categories that the classifier will try to place each (and every) tweet within. The exact definition of the categories develops throughout the early interaction of the data. The categories are not arrived at a priori, but only through an iterative interaction with the data – wherein the definition of each category can be challenged by the actual data itself. This is to ensure that the categories reflect the evidence rather than the preconceptions or expectations of the analyst. This is consistent with a well-known sociological method called grounded theory.22
Phase 2: Creation of a Gold-standard test dataset: This phase provides a baseline of truth against which the classifier performance is tested. A number of tweets (usually 100, but more are selected if the dataset is very large) are randomly selected to form a gold standard test set. These are manually coded into the categories defined during Phase 1 – above. These tweets are then removed from the main dataset, and are not used – in the Phase 3 - to train the classifier.
Phase 3: Training: This phase describes the process wherein training data is introduced into the statistical model, called ‘mark up’. Through a process called ‘active learning’, each unlabelled tweet in the dataset is assessed by the classifier for

44
the level of confidence it has that the tweet is in the correct category. The classifier selects the tweets with the lowest confidence score, and these are presented to the human analyst via a user interface of Method51. The analyst reads each tweet, and decides which of the pre-assigned categories (see Phase 1) that it should belong to. When 10 have been selected, these are submitted as training data, and the NLP model is recalculated. The NLP algorithm looks for statistical correlations between the language used and the meaning expressed to arrive at a series of rules-based criteria.
Phase 4: Performance Review and modification: The updated classifier is then used to classify each tweet within the gold standard test set. The decisions made by the classifier are compared with the decisions made (in Phase 2) by the human analyst. On the basis of this comparison, classifier performance statistics – ‘recall’, ‘precision’, and ‘overall’ (see ‘assessment of classifiers’, above) - are created and appraised by a human analyst.
Phase 6 – Retraining: Phase 3 and 4 are iteratively repeated until classifier performance ceases to increase. This state is called ‘plateau’, and, when reached, is considered the practical optimum performance that a classifier can reasonably reach. Plateau typically occurs within 200-300 of annotated tweets, although it depends on the scenario: the more complex the task, the more training data that is required.
Phase 7 – Processing: When the classifier performance has plateaued, the NLP model is used to process all the remaining tweets in the dataset into the categories defined during Phase 1 along the same, inferred, lines as the examples it has been given. Processing creates a series of new databases – one for each category of meaning – each containing the tweets considered by the model to most likely fall within that category.
Phase 8 – Creation of a new classifier (phase 1), or post-processing analysis (phase 9). Practically, classifiers are built to work together. Each is able to perform a fairly simple task at a very large scale: to filter relevant tweets from irrelevant ones, to sort tweets into broad category of meanings, or to separate tweets containing one kind of key message with those containing another. When classifiers work together, they are called a ‘cascade’. Cascades of classifiers were used for both case studies. After Phase 7 is completed, a decisions is made about whether to return to Phase 1 to construct the next classifier within the cascade, or, if the cascade if complete, to move to the final phase – 9, post-processing analysis.
Phase 9 – Post processing analysis: After tweets have been processed, the new datasets are often analysed and assessed using a variety of other techniques.

45
Classifier Performance None of the algorithms work perfectly, and a vital new coalface in this kind of research is to understand how well any given algorithm performs, and the implications of this performance for the research results. Each classifier trained and used for this paper was measured for accuracy. In each case, this was done by (a) randomly selecting 100 tweets, (b) coding each tweet using the classifier (c) each same tweet being read and coded by an analyst, and (d) comparing the results and recording whether the classifier got the same result as the analyst. There are three outcomes of this test. Each measures the ability of the classifier to make the same decisions as a human in a different way: Recall: This is number of correct selections that the classifier makes as a proportion of the total correct selections it could have made. If there were 10 relevant tweets in a dataset, and a relevancy classifier successfully picks 8 of them, it has a recall score of 80 per cent.
Precision: This is the number of correct selections the classifiers makes as a proportion of all the selections it has made. If a relevancy classifier selects 10 tweets as relevant, and 8 of them actually are indeed relevant, it has a precision score of 80 per cent.
Overall: All classifiers are a trade-off between recall and precision. Classifiers with a high recall score tend to be less precise, and vice versa. The ‘overall’ score reconciles precision and recall to create one, overall measurement of performance for the classifier.
The overall accuracies of the classifiers are given below: Classifiers used in the Architecture – F-score tables
1. Classifiers used to determine relevancy of tweets related to issues:
Education 0.96
Crime 0.9
NHS 0.886
Economy 0.899
Defence 0.75
Housing 0.816
Immigration 0.89
Unemployment 0.826
2. Classifier used to determine boos and cheers related to Miliband and Cameron

46
The accuracy of this classifier was assessed in a different way. 100 random tweets that the classifier judged to be boos, and a further 100 that the classifier judged to be cheers, were produced, and manually assessed. Using this method, the classifier was found to 69 per cent accurate for cheers, and 75 per cent accurate for boos.
3. Classifier used to distinguish between institutions and individuals This was built and assessed using a different, ‘ground truth’ body of tweets by the University of Sussex. On a test of 2575 tweets, it was found to be accurate 87 per cent of the time at distinguishing between institutions and individuals,
4. Algorithm to determine location This algorithm was tested against a ‘ground truth’ group of 1303 Twitter users by the University of Sussex. The accuracy was assessed to on each NUTS level. To NUTS-1, 92 per cent of the tweets were accurately located. To NUT-2, 84 per cent and NUTS-3, 81 per cent. A further important aspect of this algorithm’s performance was the number of tweets that it could discern to each level of geographical precision. This was assessed for each of the datasets used in this paper. Brands NUTS Level Per cent of tweets located
All 100
NUTS-1 67.9
NUTS-2 63.4
NUTS-3 40.4
Politics NUTS Level Per cent of tweets located
All 100
NUTS-1 39.5
NUTS-2 35.9
NUTS-3 24.5
Issues NUTS Level Per cent of tweets located
All 100
NUTS-1 54.5
NUTS-2 49.8
NUTS-3 30.1

47
5. Algorithm to determine gender The algorithm to determine gender was tested on a ‘ground truth’ dataset of Twitter users collected using an Ipsos MORI panel, and analysed by the University of Sussex. On 2516 Twitter users, it had an accuracy of 88 per cent. Keywords used to collect and identify relevant tweets Each of the bodies of tweets collected used keywords either in the collection, or, after collection, in the identification of relevant tweets. Issues For issues, the following keywords were used to identify tweets, once collected, as possibly relevant to each issue.
Immigration
immigration
Immigrant
Migrant
asylum seeker
visa
welfare tourist
Visas and Immigration
refugee
foreigners
influx
NHS
NHS
National Health Service
Health
GPs
doctor
A&E
A and E
Hospitals
healthcare
medicine
public health
patients
dentists
surgeon
nurse
maternity wards
aftercare
homecare
waiting times
social care
Department of Health

48
DH
clinical commissioning
CCGs
healthwatch
Jeremy Hunt
Economy quality care commission
Andy Burnham
pandemic
Inflation
Deficit
Tax
Austerity
VAT
National debt
economy
interest rates
exchange rate
Prices
nationalisation
privatisation
George Osbourne
Ed Balls
Danny Alexander
Institute of Fiscal Studies
Paul Johnson
Bank of England
Mark Carney
World Bank
sterling
IMF
MP
Defence
extremism
terrorism
defence budget
security
trident
Syria
ISIS
Islamic State
War
Foreign affairs
nuclear weapons
nuclear war
disarmament
Northern Ireland
Unemployment commonwealth
terrorist

49
ISI
income
food banks
wages
unemployment
unemployed
inequality
poverty
trade unions
minimum wage
living wage
zero hours
factory closure
low pay
Department for Business Innovation and Skills
Vince Cable
Chuka Umunna
BIS
job
Crime Sentences
Domestic violence
anti-social
police
law
legal
crime
ASB
vandalism
burglary
robbery
murder
rape
prison
ministry of justice
moj
drug abuse
stabbing
riots
jail
gangs
graffitti
Education academies
Exams
Education
Curriculum
tuition fees
schools

50
teachers
classrooms
PISA tests
universities
university
college
sixth-form
exam
exam board
GCSE
A level
BTEC
apprenticeship
Nursery
playgroup
childminders
childcare
inspections
department for education
DfE
Ofsted
Ofqual
UCAS
EDEXCEL
AQA
OCR
Housing Housing
Homelessness
Rent
Landlords
Private Market
Social Housing
House Prices
mortgage
help to buy
housing authority
affordable housing
Brands The following keywords were used to collect tweets into each of the brand categories. They were selected on the basis of their presence within the 100 most valuable global brands.
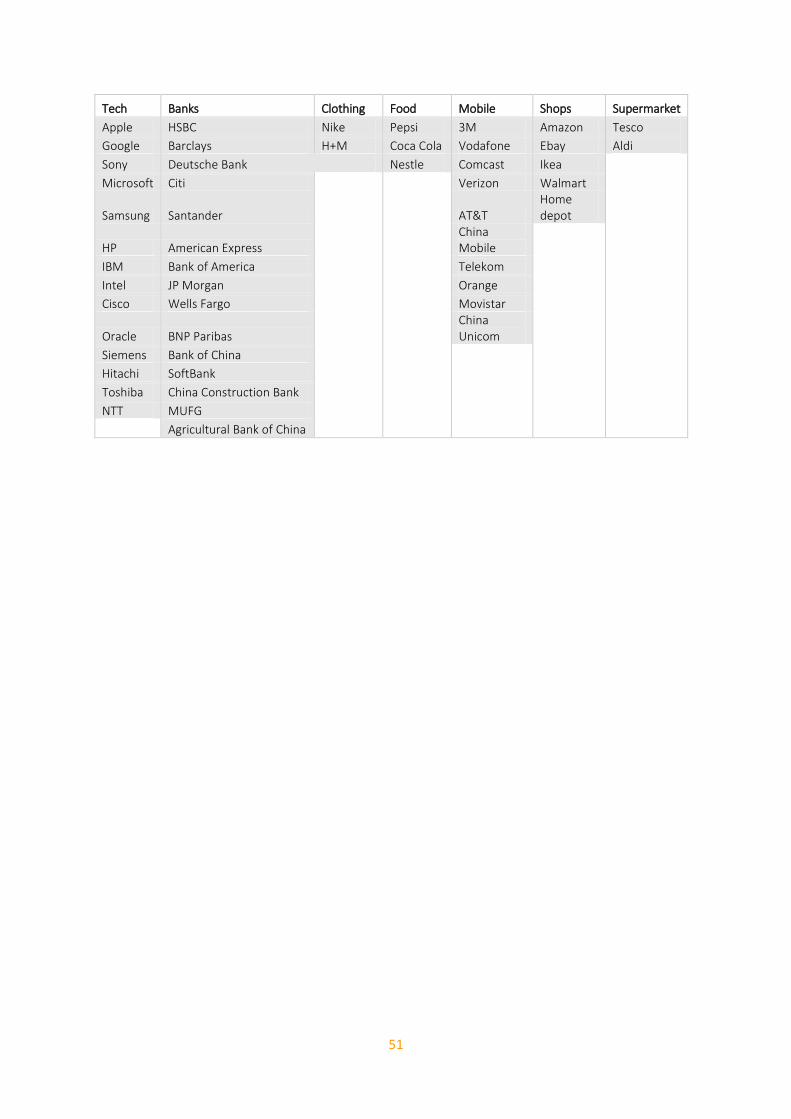
51
Tech Banks Clothing Food Mobile Shops Supermarket
Apple HSBC Nike Pepsi 3M Amazon Tesco
Google Barclays H+M Coca Cola Vodafone Ebay Aldi
Sony Deutsche Bank Nestle Comcast Ikea Microsoft Citi
Verizon Walmart
Samsung Santander
AT&T
Home depot
HP American Express
China Mobile
IBM Bank of America
Telekom Intel JP Morgan
Orange
Cisco Wells Fargo
Movistar
Oracle BNP Paribas
China Unicom
Siemens Bank of China Hitachi SoftBank Toshiba China Construction Bank NTT MUFG
Agricultural Bank of China

52
NOTES
1 https://www.ipsos-mori.com/Assets/Docs/Publications/Ipsos_Connect_Tech_Tracker_Q2_2015.pdf
2 http://www.thesocialmediahat.com/active-users
3 It should be noted that the issues that were sought for the online research were set by the top issues in
February. Other issues were also found to be prominent in the offline research in April and June (such as low pay, pensions and the EU), that were not looked for in the online data.
4 It should be noted that a debate exists over whether the sample API produces a robustly random reflection of
Twitter. http://www.aaai.org/ocs/index.php/ICWSM/ICWSM13/paper/viewFile/6071/6379
5 Of course, this introduced the danger of systemic bias if those users that used @tags to mention either
Cameron or Miliband were consistently different from those users who mentioned them in other ways.
6 https://hbr.org/2009/06/new-twitter-research-men-follo
7 http://qz.com/396107/twitter-data-show-that-a-few-powerful-users-can-control-the-conversation/
8 http://dl.acm.org/citation.cfm?doid=1772690.1772865
9 Twitter, 2Q 2014 Earnings Report http://files.shareholder.com/downloads/AMDA-
2F526X/2924193924x0x775744/742fd079-63cf-4b1c-afa0-8e0b9a9b66a1/2014_Q2_Earnings_Slides_-_Updated_NEW.pdf
10 Sysomos, Inside Twitter: An in-depth look at the Twitter world (self-publihsed, 2014)
http://sysomos.com/insidetwitter/mostactiveusers
11 Cited in Aviva Rutkin, ‘Twitter Bots Grow Up and Take Over the World’, New Scientist (30 July 2014)
https://www.newscientist.com/article/mg22329804.000-twitter-bots-grow-up-and-take-on-the-world/?full=true#bx298040B2
12 Carlo De Micheli & Andrea Stroppa, ‘Twitter and the Underground Market’,
http://nexa.polito.it/nexacenterfiles/lunch-11-de_micheli-stroppa.pdf
13 BarraCuda Labs, ‘The Twitter Underground Economy: A booming business’,
https://barracudalabs.com/2012/08/the-twitter-underground-economy-a-blooming-business/
14 Kurt Thomas, University of California, Berkeley, and Twitter; Damon McCoy, George Mason University; Chris
Grier, University of California, Berkeley, and International Computer Science Institute; Alek Kolcz, Twitter; Vern Paxson, University of California, Berkeley, and International Computer Science Institute, ‘Trafficking Fraudulent Accounts: The Role of the Underground Market in Twitter Spam and Abuse’, 22
nd Usenix Security Symposium,
August 2013 (https://www.usenix.org/conference/usenixsecurity13/technical-sessions/paper/thomas)
15 http://www.stateofdigital.com/how-to-recognize-twitter-bots-6-signals-to-look-out-for/
16 http://pewinternet.org/files/2015/01/PI_SocialMediaUpdate20144.pdf
17 It should be noted that the GPS geo-location of the tweet is a slightly different thing to the estimation of
where the Tweeter lives based on the meta-data. One is a record of where the person was when they tweeted - the other is n estimate of roughly where the Twitter-user lives.

53
18 This work is led by David Spence and Thomas Kober from the University of Sussex. A technical paper on it is
forthcoming.
19 This information is drawn fro Ipsos MORI’s tech tracker, https://www.ipsos-mori.com/researchspecialisms/ipsosmediact/customresearch/technology/techtracker.aspx
20 http://www.massobs.org.uk
21 Method51 is a software suite developed by the project team over the last 18 months. It is based on an open
source project called DUALIST - Settles, B. (2011) Closing the Loop: Fast, Interactive Semi-Supervised Annotation With Queries on Features and Instances. Proceedings of the Conference on Empirical Methods in Natural Language Processing, pp. 1467-1478. It enables non-technical analysts to build machine-learning classifiers. The most important feature of it is the speed wherein accurate classifiers can be built. Classically, an NLP algorithm would require roughly at least 10,000 examples of ‘marked-up’ examples to achieve 70 per cent of accuracy. This is both expensive, and takes days to complete. However, DUALIST innovatively uses ‘active learning’, an application of information theory that can identify pieces of text that the NLP algorithm would learn most from. This radically reduces the number of marked-up examples from 10,000 to a few hundred. Overall, in allowing social scientists to build and evaluate classifiers quickly, and therefore to engage directly with big social media datasets, the Method51 system makes possible the Digital Observation methodology used in this project.
22 Glaser, B.G & Strauss, A.L. (1967) The Discovery of Grounded Theory (AldineTransaction, New Brunswick, US).
Demos – Licence to Publish The work (as defined below) is provided under the terms of this licence ('licence'). The work is protected by
copyright and/or other applicable law. Any use of the work other than as authorized under this licence is
prohibited. By exercising any rights to the work provided here, you accept and agree to be bound by the
terms of this licence. Demos grants you the rights contained here in consideration of your acceptance of
such terms and conditions.
1 Definitions
a 'Collective Work' means a work, such as a periodical issue, anthology or encyclopedia, in which the
Work in its entirety in unmodified form, along with a number of other contributions, constituting separate and
independent works in themselves, are assembled into a collective whole. A work that constitutes a Collective
Work will not be considered a Derivative Work (as defined below) for the purposes of this Licence.
b 'Derivative Work' means a work based upon the Work or upon the Work and other pre-existing works,
such as a musical arrangement, dramatization, fictionalization, motion picture version, sound recording, art
reproduction, abridgment, condensation, or any other form in which the Work may be recast, transformed,
or adapted, except that a work that constitutes a Collective Work or a translation from English into another
language will not be considered a Derivative Work for the purpose of this Licence.
c 'Licensor' means the individual or entity that offers the Work under the terms of this Licence.
d 'Original Author' means the individual or entity who created the Work.
e 'Work' means the copyrightable work of authorship offered under the terms of this Licence.
f 'You' means an individual or entity exercising rights under this Licence who has not previously violated
the terms of this Licence with respect to the Work,or who has received express permission from Demos to
exercise rights under this Licence despite a previous violation.
2 Fair Use Rights
Nothing in this licence is intended to reduce, limit, or restrict any rights arising from fair use, first sale or other
limitations on the exclusive rights of the copyright owner under copyright law or other applicable laws.
3 Licence Grant
Subject to the terms and conditions of this Licence, Licensor hereby grants You a worldwide, royalty-free,
non-exclusive,perpetual (for the duration of the applicable copyright) licence to exercise the rights in the
Work as stated below:
a to reproduce the Work, to incorporate the Work into one or more Collective Works, and to reproduce
the Work as incorporated in the Collective Works;
b to distribute copies or phonorecords of, display publicly,perform publicly, and perform publicly by
means of a digital audio transmission the Work including as incorporated in Collective Works; The above
rights may be exercised in all media and formats whether now known or hereafter devised.The above rights
include the right to make such modifications as are technically necessary to exercise the rights in other
media and formats. All rights not expressly granted by Licensor are hereby reserved.
4 Restrictions
The licence granted in Section 3 above is expressly made subject to and limited by the following
restrictions:
a You may distribute,publicly display, publicly perform, or publicly digitally perform the Work only under
the terms of this Licence, and You must include a copy of, or the Uniform Resource Identifier for, this
Licence with every copy or phonorecord of the Work You distribute, publicly display,publicly perform, or
publicly digitally perform.You may not offer or impose any terms on the Work that alter or restrict the terms
of this Licence or the recipients’ exercise of the rights granted hereunder.You may not sublicence the
Work.You must keep intact all notices that refer to this Licence and to the disclaimer of warranties.You may
not distribute, publicly display, publicly perform, or publicly digitally perform the Work with any technological
measures that control access or use of the Work in a manner inconsistent with the terms of this Licence
Agreement.The above applies to the Work as incorporated in a Collective Work, but this does not require
the Collective Work apart from the Work itself to be made subject to the terms of this Licence. If You create
a Collective Work, upon notice from any Licencor You must, to the extent practicable, remove from the
Collective Work any reference to such Licensor or the Original Author, as requested.
b You may not exercise any of the rights granted to You in Section 3 above in any manner that is
primarily intended for or directed toward commercial advantage or private monetary compensation.The
exchange of the Work for other copyrighted works by means of digital filesharing or otherwise shall not be
considered to be intended for or directed toward commercial advantage or private monetary compensation,
provided there is no payment of any monetary compensation in connection with the exchange of
copyrighted works.

55
C If you distribute, publicly display, publicly perform, or publicly digitally perform the Work or any
Collective Works,You must keep intact all copyright notices for the Work and give the Original Author credit
reasonable to the medium or means You are utilizing by conveying the name (or pseudonym if applicable)
of the Original Author if supplied; the title of the Work if supplied. Such credit may be implemented in any
reasonable manner; provided, however, that in the case of a Collective Work, at a minimum such credit will
appear where any other comparable authorship credit appears and in a manner at least as prominent as
such other comparable authorship credit.
5 Representations, Warranties and Disclaimer
A By offering the Work for public release under this Licence, Licensor represents and warrants that, to
the best of Licensor’s knowledge after reasonable inquiry:
i Licensor has secured all rights in the Work necessary to grant the licence rights hereunder and to
permit the lawful exercise of the rights granted hereunder without You having any obligation to pay any
royalties, compulsory licence fees, residuals or any other payments;
ii The Work does not infringe the copyright, trademark, publicity rights, common law rights or any other
right of any third party or constitute defamation, invasion of privacy or other tortious injury to any third party.
B except as expressly stated in this licence or otherwise agreed in writing or required by applicable
law,the work is licenced on an 'as is'basis,without warranties of any kind, either express or implied
including,without limitation,any warranties regarding the contents or accuracy of the work.
6 Limitation on Liability
Except to the extent required by applicable law, and except for damages arising from liability to a third party
resulting from breach of the warranties in section 5, in no event will licensor be liable to you on any legal
theory for any special, incidental, consequential, punitive or exemplary damages arising out of this licence
or the use of the work, even if licensor has been advised of the possibility of such damages.
7 Termination
A This Licence and the rights granted hereunder will terminate automatically upon any breach by You of
the terms of this Licence. Individuals or entities who have received Collective Works from You under this
Licence, however, will not have their licences terminated provided such individuals or entities remain in full
compliance with those licences. Sections 1, 2, 5, 6, 7, and 8 will survive any termination of this Licence.
B Subject to the above terms and conditions, the licence granted here is perpetual (for the duration of the
applicable copyright in the Work). Notwithstanding the above, Licensor reserves the right to release the
Work under different licence terms or to stop distributing the Work at any time; provided, however that any
such election will not serve to withdraw this Licence (or any other licence that has been, or is required to be,
granted under the terms of this Licence), and this Licence will continue in full force and effect unless
terminated as stated above.
8 Miscellaneous
A Each time You distribute or publicly digitally perform the Work or a Collective Work, Demos offers to
the recipient a licence to the Work on the same terms and conditions as the licence granted to You under
this Licence.
B If any provision of this Licence is invalid or unenforceable under applicable law, it shall not affect the
validity or enforceability of the remainder of the terms of this Licence, and without further action by the
parties to this agreement, such provision shall be reformed to the minimum extent necessary to make such
provision valid and enforceable.
C No term or provision of this Licence shall be deemed waived and no breach consented to unless such
waiver or consent shall be in writing and signed by the party to be charged with such waiver or consent.
D This Licence constitutes the entire agreement between the parties with respect to the Work licensed
here. There are no understandings, agreements or representations with respect to the Work not specified
here. Licensor shall not be bound by any additional provisions that may appear in any communication from
You. This Licence may not be modified without the mutual written agreement of Demos and You.

The rise of social media has profound consequences for those that research society to understand how it works. A new body of information about society is now routinely produced through social media that are enormous, real-time, and a rich new seam of evidence about social life.
However, human attitudes are complex, difficult things to research. Principles and standards have built up over centuries to govern how to research society well, but these are often absent from how social media data is researched. This paper looks at how social media can be researched in a way that is representative of either online or offline communities. It com-pares online and offline data on three themes: the issues that people care and talk about, peoples’ opinions about political leaders, and the brands and companies that people talk about.
For each, it measures the different ways that online data may not be representative – either of that online community, or the wider population. It also suggests what can be done about each of these problems and how well they work. Overall, it presents a new research method for analysing social media in a robust, representative way; one we call the ‘road to representivity’.
Carl Miller is Research Director of the Centre for the Analysis of Social Media at Demos. Steve Ginnis is Head of Digital Research at the Social Research Institute at Ipsos MORI. Rowena Stobart is a researcher at the Social Research Institute at Ipsos MORI. Alex Krasodomski-Jones is a research associate at the Centre for the Analysis of Social Media at Demos. Michael Clemence is a researcher at the Social Research Institute at Ipsos MORI.
ISBN 978-1-909037-91-5 £10
© Demos 2015


![v11i10_ASIANMENACOUNSEL[1].pdf - MORI HAMADA ...](https://static.fdokumen.com/doc/165x107/631228f3074f092ad10d6ac9/v11i10asianmenacounsel1pdf-mori-hamada-.jpg)