Online Harm in Journalism - Ipsos
57
Online Harm in Journalism Detailed Tables Online Harm in Journalism Table of Contents 1 q1a. Are you a member of any of the following media and journalism associations? Please select all that apply. 2 q1. What is your formal status as a journalist or media worker? Please select all that apply. 3 q2. How long have you worked in the field of journalism or media? 4 q3. In which language(s) do you work? Please select all that apply. 5 q4. In which area(s) of the media do you work? Please select all that apply. 6 q5. Are you self-employed/freelancer or employed by a media organization? 7 q5b. Which media organization do you consider as your main employer? 8 q5bx. Which media organization do you consider as your main employer? 9 q6a. Which of the following topics do you typically report on? Please select all that apply. 10 q6b. Did you cover the most recent federal election (2021)? 11 q7a_1. [Threats or harassment online (social media, emails, websites, etc)] In the past 12 months, how often have you experienced any of the following as a result of the work you do in the field of journalism or media? 12 q7a_2. [Threats or harassment by phone] In the past 12 months, how often have you experienced any of the following as a result of the work you do in the field of journalism or media? 13 q7a_3. [Threats or harassment in person] In the past 12 months, how often have you experienced any of the following as a result of the work you do in the field of journalism or media? 14 q7a_4. [Physically attacked] In the past 12 months, how often have you experienced any of the following as a result of the work you do in the field of journalism or media? 15 q7a_top1. [SUMMARY - T1B (1)] In the past 12 months, how often have you experienced any of the following as a result of the work you do in the field of journalism or media? 16 q7a_top2. [SUMMARY - T2B (1-2)] In the past 12 months, how often have you experienced any of the following as a result of the work you do in the field of journalism or media? 17 q7a_top3. [SUMMARY - T3B (1-3)] In the past 12 months, how often have you experienced any of the following as a result of the work you do in the field of journalism or media? 18 q7a_top5. [SUMMARY - T5B (1-5)] In the past 12 months, how often have you experienced any of the following as a result of the work you do in the field of journalism or media? 19 q7a_top5x. [SUMMARY - T5B (1-5)] In the past 12 months, how often have you experienced any of the following as a result of the work you do in the field of journalism or media? 20 q7b_1. [Online harassment] Do you feel that the frequency of harassment has changed over the past 2 years? 21 q7b_2. [Phone harassment] Do you feel that the frequency of harassment has changed over the past 2 years? 22 q7b_3. [In person harassment] Do you feel that the frequency of harassment has changed over the past 2 years? 23 q7b_4. [Physical attacks] Do you feel that the frequency of harassment has changed over the past 2 years? 24 q7b_top1. [SUMMARY - T1B (Increased)] Do you feel that the frequency of harassment has changed over the past 2 years? 25 q8. As a journalist or media worker, have you personally experienced any of the following forms of online harassment in the past 12 months? Please select all that apply. 26 q9a. Did the online harassment you experienced in the past 12 months occur on any of the following platforms? Please select all that apply. 27 q9b. Were the messages you received public facing (viewable by others) or visible only to you? 28 q10. Please identify which of the following factors have been targeted as part of the online harassment you experienced? Select all that apply. 29 q11. In general, did the person(s) who harassed you online use their real name or do they remain anonymous? 30 q12. Did you report the acts of online harassment and to whom? Select all that apply. 31 q13. Thinking about the online harassment you experienced but did not report, please indicate the reason(s) for not reporting the situation(s). 32 q14a. As a result of being harassed online, are you experiencing or have you experienced any of the following? Please select all that apply. 33 q14b. Did any of your experiences of online harassment lead to physical/in-person harassment? 34 q15. In the past 12 months, have you accessed any of the following resources to help deal with the issue of online harassment? Please select all that apply. 35 q16a_1. [Journalist association resources (e.g. training, website, support line, guides)] How adequate do you feel the existing resources at your disposal are when it comes to dealing with the issue of online harassment? 36 q16a_2. [Employer's resources (e.g. training, website, employee support line, guides)] How adequate do you feel the existing resources at your disposal are when it comes to dealing with the issue of online harassment? 37 q16a_3. [Health professional (e.g. psychologists, doctors)] How adequate do you feel the existing resources at your disposal are when it comes to dealing with the issue of online harassment? 38 q16a_4. [Legal professional] How adequate do you feel the existing resources at your disposal are when it comes to dealing with the issue of online harassment? 39 q16a_5. [Police or security professional] How adequate do you feel the existing resources at your disposal are when it comes to dealing with the issue of online harassment? 40 q16a_6. [Other online resources] How adequate do you feel the existing resources at your disposal are when it comes to dealing with the issue of online harassment? 41 q16a_7. [The other resource you accessed] How adequate do you feel the existing resources at your disposal are when it comes to dealing with the issue of online harassment? 42 q16a_top2. [SUMMARY - T2B (4-5)] How adequate do you feel the existing resources at your disposal are when it comes to dealing with the issue of online harassment? 43 q16a_low2. [SUMMARY - L2B (1-2)] How adequate do you feel the existing resources at your disposal are when it comes to dealing with the issue of online harassment? 44 q16b. In your opinion, what resources could be developed in the future to better support journalists and media professionals who experience online harassment? 45 q16bx. In your opinion, what resources could be developed in the future to better support journalists and media professionals who experience online harassment? 46 q17. Who should be held responsible for protecting journalists from online harm? 47 q18. Please take a moment to share your thoughts on the issue of online harassment and how it affects your work as a journalist or media worker. 48 q18x. Please take a moment to share your thoughts on the issue of online harassment and how it affects your work as a journalist or media worker. 49 q18b. While this survey is focused on people who are still actively working as journalists and media professionals, we would appreciate your thoughts on the important issue of online harassment and how it affects the work of those working in media today. 50 q19. Please specify your age. 51 q20. In what province or territory do you reside the majority of your time? 52 q21. Do you identify as ...? 53 q23. What ethno-cultural or racial group(s) do you identify with? Please select all that apply. 54 q24. Do you identify as lesbian, gay, bisexual, transgender, queer, Two-Sprit, intersex, and/or non-binary? 55 UserLanguage 56 Association Ipsos 11 of 56
-
Upload
khangminh22 -
Category
Documents
-
view
0 -
download
0
Transcript of Online Harm in Journalism - Ipsos

Online Harm in Journalism Detailed Tables
Online Harm in Journalism
Table of Contents1 q1a. Are you a member of any of the following media and journalism associations? Please select all that apply.
2 q1. What is your formal status as a journalist or media worker? Please select all that apply.
3 q2. How long have you worked in the field of journalism or media?
4 q3. In which language(s) do you work? Please select all that apply.
5 q4. In which area(s) of the media do you work? Please select all that apply.
6 q5. Are you self-employed/freelancer or employed by a media organization?
7 q5b. Which media organization do you consider as your main employer?
8 q5bx. Which media organization do you consider as your main employer?
9 q6a. Which of the following topics do you typically report on? Please select all that apply.
10 q6b. Did you cover the most recent federal election (2021)?
11q7a_1. [Threats or harassment online (social media, emails, websites, etc)] In the past 12 months, how often have you experienced any of
the following as a result of the work you do in the field of journalism or media?
12q7a_2. [Threats or harassment by phone] In the past 12 months, how often have you experienced any of the following as a result of the
work you do in the field of journalism or media?
13q7a_3. [Threats or harassment in person] In the past 12 months, how often have you experienced any of the following as a result of the
work you do in the field of journalism or media?
14q7a_4. [Physically attacked] In the past 12 months, how often have you experienced any of the following as a result of the work you do in
the field of journalism or media?
15q7a_top1. [SUMMARY - T1B (1)] In the past 12 months, how often have you experienced any of the following as a result of the work you
do in the field of journalism or media?
16q7a_top2. [SUMMARY - T2B (1-2)] In the past 12 months, how often have you experienced any of the following as a result of the work you
do in the field of journalism or media?
17q7a_top3. [SUMMARY - T3B (1-3)] In the past 12 months, how often have you experienced any of the following as a result of the work you
do in the field of journalism or media?
18q7a_top5. [SUMMARY - T5B (1-5)] In the past 12 months, how often have you experienced any of the following as a result of the work you
do in the field of journalism or media?
19q7a_top5x. [SUMMARY - T5B (1-5)] In the past 12 months, how often have you experienced any of the following as a result of the work
you do in the field of journalism or media?
20 q7b_1. [Online harassment] Do you feel that the frequency of harassment has changed over the past 2 years?
21 q7b_2. [Phone harassment] Do you feel that the frequency of harassment has changed over the past 2 years?
22 q7b_3. [In person harassment] Do you feel that the frequency of harassment has changed over the past 2 years?
23 q7b_4. [Physical attacks] Do you feel that the frequency of harassment has changed over the past 2 years?
24 q7b_top1. [SUMMARY - T1B (Increased)] Do you feel that the frequency of harassment has changed over the past 2 years?
25q8. As a journalist or media worker, have you personally experienced any of the following forms of online harassment in the past 12
months? Please select all that apply.
26 q9a. Did the online harassment you experienced in the past 12 months occur on any of the following platforms? Please select all that apply.
27 q9b. Were the messages you received public facing (viewable by others) or visible only to you?
28q10. Please identify which of the following factors have been targeted as part of the online harassment you experienced? Select all that
apply.
29 q11. In general, did the person(s) who harassed you online use their real name or do they remain anonymous?
30 q12. Did you report the acts of online harassment and to whom? Select all that apply.
31q13. Thinking about the online harassment you experienced but did not report, please indicate the reason(s) for not reporting the
situation(s).
32 q14a. As a result of being harassed online, are you experiencing or have you experienced any of the following? Please select all that apply.
33 q14b. Did any of your experiences of online harassment lead to physical/in-person harassment?
34q15. In the past 12 months, have you accessed any of the following resources to help deal with the issue of online harassment? Please
select all that apply.
35q16a_1. [Journalist association resources (e.g. training, website, support line, guides)] How adequate do you feel the existing resources at
your disposal are when it comes to dealing with the issue of online harassment?
36q16a_2. [Employer's resources (e.g. training, website, employee support line, guides)] How adequate do you feel the existing resources at
your disposal are when it comes to dealing with the issue of online harassment?
37q16a_3. [Health professional (e.g. psychologists, doctors)] How adequate do you feel the existing resources at your disposal are when it
comes to dealing with the issue of online harassment?
38q16a_4. [Legal professional] How adequate do you feel the existing resources at your disposal are when it comes to dealing with the issue
of online harassment?
39q16a_5. [Police or security professional] How adequate do you feel the existing resources at your disposal are when it comes to dealing
with the issue of online harassment?
40q16a_6. [Other online resources] How adequate do you feel the existing resources at your disposal are when it comes to dealing with the
issue of online harassment?
41q16a_7. [The other resource you accessed] How adequate do you feel the existing resources at your disposal are when it comes to dealing
with the issue of online harassment?
42q16a_top2. [SUMMARY - T2B (4-5)] How adequate do you feel the existing resources at your disposal are when it comes to dealing with
the issue of online harassment?
43q16a_low2. [SUMMARY - L2B (1-2)] How adequate do you feel the existing resources at your disposal are when it comes to dealing with
the issue of online harassment?
44q16b. In your opinion, what resources could be developed in the future to better support journalists and media professionals who
experience online harassment?
45q16bx. In your opinion, what resources could be developed in the future to better support journalists and media professionals who
experience online harassment?
46 q17. Who should be held responsible for protecting journalists from online harm?
47q18. Please take a moment to share your thoughts on the issue of online harassment and how it affects your work as a journalist or media
worker.
48q18x. Please take a moment to share your thoughts on the issue of online harassment and how it affects your work as a journalist or media
worker.
49q18b. While this survey is focused on people who are still actively working as journalists and media professionals, we would appreciate your
thoughts on the important issue of online harassment and how it affects the work of those working in media today.
50 q19. Please specify your age.
51 q20. In what province or territory do you reside the majority of your time?
52 q21. Do you identify as ...?
53 q23. What ethno-cultural or racial group(s) do you identify with? Please select all that apply.
54 q24. Do you identify as lesbian, gay, bisexual, transgender, queer, Two-Sprit, intersex, and/or non-binary?
55 UserLanguage
56 Association
Ipsos11 of 56

Online Harm in Journalism Detailed Tables
Total <30 30-39 40-49 50+ Male Female
BC/Territorie
s AB MB/SK ON QC ATL
All non-
white/BIPOC Asian (NET) White (NET) Yes No
A B C D E F G H I J K L M N O P Q R
Base: All respondents 1093 170 299 276 323 547 504 99* 96* 77* 405 343 47* 290 171 822 128 905
229 58 72 41 53 99 124 33 32 29 101 17 12 79 47 161 41 175
21% 34% 24% 15% 16% 18% 25% 33% 33% 38% 25% 5% 26% 27% 27% 20% 32% 19%CDE DE F L L KL L L P P R
14 0 5 3 6 6 8 1 0 0 11 1 0 5 4 12 2 12
1% - 2% 1% 2% 1% 2% 1% - - 3% 0 - 2% 2% 1% 2% 1%L
28 15 7 3 3 11 17 3 0 2 20 2 0 28 20 4 9 18
3% 9% 2% 1% 1% 2% 3% 3% - 3% 5% 1% - 10% 12% 0 7% 2%CDE L IL P P R
35 5 7 7 16 18 15 8 4 3 12 6 2 6 5 30 3 31
3% 3% 2% 3% 5% 3% 3% 8% 4% 4% 3% 2% 4% 2% 3% 4% 2% 3%KL
11 1 7 0 3 3 8 2 0 2 6 1 0 5 4 7 1 10
1% 1% 2% - 1% 1% 2% 2% - 3% 1% 0 - 2% 2% 1% 1% 1%D L
3 1 2 0 0 3 0 0 0 0 3 0 0 2 0 1 0 3
0 1% 1% - - 1% - - - - 1% - - 1% - 0 - 0
8 0 1 4 3 5 3 0 0 0 8 0 0 7 4 3 0 8
1% - 0 1% 1% 1% 1% - - - 2% - - 2% 2% 0 - 1%L P P
239 38 64 62 66 127 97 0 0 0 4 226 0 51 28 185 24 194
22% 22% 21% 22% 20% 23% 19% - - - 1% 66% - 18% 16% 23% 19% 21%HIJKM
15 2 3 5 5 8 6 1 0 1 9 1 3 5 3 11 2 13
1% 1% 1% 2% 2% 1% 1% 1% - 1% 2% 0 6% 2% 2% 1% 2% 1%L IL
10 1 4 1 3 4 4 0 0 0 0 9 0 2 2 8 2 6
1% 1% 1% 0 1% 1% 1% - - - - 3% - 1% 1% 1% 2% 1%K
9 0 1 4 4 4 5 1 2 2 4 0 0 0 0 8 1 8
1% - 0 1% 1% 1% 1% 1% 2% 3% 1% - - - - 1% 1% 1%L L
6 0 2 1 3 2 4 0 0 0 0 6 0 3 3 6 0 6
1% - 1% 0 1% 0 1% - - - - 2% - 1% 2% 1% - 1%K
6 0 0 0 5 2 3 0 0 0 5 0 0 1 0 4 0 5
1% - - - 2% 0 1% - - - 1% - - 0 - 0 - 1%CD L
50 4 21 7 15 25 19 2 6 3 19 16 3 13 6 36 6 39
5% 2% 7% 3% 5% 5% 4% 2% 6% 4% 5% 5% 6% 4% 4% 4% 5% 4%BD
535 66 139 153 170 279 241 56 57 42 248 96 27 131 78 411 55 458
49% 39% 46% 55% 53% 51% 48% 57% 59% 55% 61% 28% 57% 45% 46% 50% 43% 51%
BC B L L L L L
1198 191 335 291 355 596 554 107 101 84 450 381 47 338 204 887 146 986
110% 112% 112% 105% 110% 109% 110% 108% 105% 109% 111% 111% 100% 117% 119% 108% 114% 109%Sigma Proportions/Means: Columns Tested (5% risk level) - B/C/D/E - F/G - H/I/J/K/L/M - N/O/P - Q/R Overlap formulae used. * small base
RTDNA Canada
Association des Communicateurs Scientifiques
Canadian Parliamentary Press Gallery
Other
I'm not a member of any associations
Canadian Association of Black Journalists (CABJ)
National Ethnic Press and Media Council of Canada
(NEPMCC)
Federation professionnelle des journalistes du Quebec
(FPJQ)
Canadian Media Guild (CMG)
Association des Journalistes Indépendants du Québec
(AJIQ)
Canadian Association of Journalists (CAJ)
Canadian Journalism Foundation (CJF)
Canadian Journalists of Colour (CJOC)
News Media Canada (NMC)
Journalists for Human Rights (JHR)
q1a. Are you a member of any of the following media and journalism associations? Please select all that apply.
Age Gender Region Ethnocultural background/race If identify as LGBTQ2S+
Ipsos11 of 56

Online Harm in Journalism Detailed Tables
Total <30 30-39 40-49 50+ Male Female
BC/Territorie
s AB MB/SK ON QC ATL
All non-
white/BIPOC Asian (NET) White (NET) Yes No
A B C D E F G H I J K L M N O P Q R
Base: All respondents 1093 170 299 276 323 547 504 99* 96* 77* 405 343 47* 290 171 822 128 905
594 121 198 135 134 283 294 57 52 47 203 204 20 161 96 442 86 483
54% 71% 66% 49% 41% 52% 58% 58% 54% 61% 50% 59% 43% 56% 56% 54% 67% 53%
DE DE F M KM R
91 18 29 19 22 59 29 13 16 6 20 25 8 14 8 75 14 73
8% 11% 10% 7% 7% 11% 6% 13% 17% 8% 5% 7% 17% 5% 5% 9% 11% 8%
G K KL KL NO
31 7 10 6 8 5 25 1 3 0 8 17 2 7 5 28 5 23
3% 4% 3% 2% 2% 1% 5% 1% 3% - 2% 5% 4% 2% 3% 3% 4% 3%
F JK
105 13 29 39 24 42 62 16 14 13 29 26 5 32 21 78 10 87
10% 8% 10% 14% 7% 8% 12% 16% 15% 17% 7% 8% 11% 11% 12% 9% 8% 10%
BE F KL KL KL
150 21 32 38 58 90 56 20 20 14 68 20 7 35 19 118 17 127
14% 12% 11% 14% 18% 16% 11% 20% 21% 18% 17% 6% 15% 12% 11% 14% 13% 14%
C G L L L L L
186 29 58 48 51 82 102 11 19 12 97 30 13 57 34 138 27 152
17% 17% 19% 17% 16% 15% 20% 11% 20% 16% 24% 9% 28% 20% 20% 17% 21% 17%
F L HL HL
103 2 18 37 44 52 48 8 10 12 42 31 0 26 15 82 6 93
9% 1% 6% 13% 14% 10% 10% 8% 10% 16% 10% 9% - 9% 9% 10% 5% 10%
B BC BC M M M M M Q
27 2 2 6 17 20 7 4 3 2 13 4 1 11 6 18 2 25
2% 1% 1% 2% 5% 4% 1% 4% 3% 3% 3% 1% 2% 4% 4% 2% 2% 3%
BC G
64 6 15 13 29 41 19 12 7 3 19 20 3 14 8 50 12 51
6% 4% 5% 5% 9% 7% 4% 12% 7% 4% 5% 6% 6% 5% 5% 6% 9% 6%
BD G KL
78 10 17 23 26 65 8 9 10 6 29 17 7 25 16 59 8 67
7% 6% 6% 8% 8% 12% 2% 9% 10% 8% 7% 5% 15% 9% 9% 7% 6% 7%
G L L
6 1 0 2 3 5 1 0 0 1 3 2 0 3 2 3 1 5
1% 1% - 1% 1% 1% 0 - - 1% 1% 1% - 1% 1% 0 1% 1%
58 2 11 15 29 34 21 9 6 3 21 17 2 20 9 40 3 53
5% 1% 4% 5% 9% 6% 4% 9% 6% 4% 5% 5% 4% 7% 5% 5% 2% 6%
B BC
6 6 0 0 0 5 1 1 0 0 3 2 0 4 4 3 3 3
1% 4% - - - 1% 0 1% - - 1% 1% - 1% 2% 0 2% 0
CDE P P R
19 9 1 2 1 7 5 2 0 1 5 5 0 6 4 8 4 9
2% 5% 0 1% 0 1% 1% 2% - 1% 1% 1% - 2% 2% 1% 3% 1%
CDE R
6 0 0 0 5 4 2 1 0 0 0 5 0 2 1 5 1 3
1% - - - 2% 1% 0 1% - - - 1% - 1% 1% 1% 1% 0
CD K K
76 10 11 20 33 41 29 5 6 4 25 29 5 21 11 57 10 57
7% 6% 4% 7% 10% 7% 6% 5% 6% 5% 6% 8% 11% 7% 6% 7% 8% 6%
C
5 0 0 0 0 0 0 0 0 0 0 0 0 0 0 0 0 0
0 - - - - - - - - - - - - - - - - -
1605 257 431 403 484 835 709 169 166 124 585 454 73 438 259 1204 209 1311
147% 151% 144% 146% 150% 153% 141% 171% 173% 161% 144% 132% 155% 151% 151% 146% 163% 145%
Summary
707 133 222 168 175 347 341 74 64 54 237 239 28 195 117 528 95 580
65% 78% 74% 61% 54% 63% 68% 75% 67% 70% 59% 70% 60% 67% 68% 64% 74% 64%
DE DE K K R
388 47 99 107 132 193 188 36 43 32 182 71 19 101 58 297 42 331
35% 28% 33% 39% 41% 35% 37% 36% 45% 42% 45% 21% 40% 35% 34% 36% 33% 37%
B BC L L L L L
27 2 2 6 17 20 7 4 3 2 13 4 1 11 6 18 2 25
2% 1% 1% 2% 5% 4% 1% 4% 3% 3% 3% 1% 2% 4% 4% 2% 2% 3%
BC G
124 14 29 32 47 93 24 17 15 9 44 32 7 32 19 97 15 105
11% 8% 10% 12% 15% 17% 5% 17% 16% 12% 11% 9% 15% 11% 11% 12% 12% 12%
B G L
79 9 9 16 33 32 30 2 4 2 20 34 5 19 10 54 8 51
7% 5% 3% 6% 10% 6% 6% 2% 4% 3% 5% 10% 11% 7% 6% 7% 6% 6%
CD HJK H
Owner/Publisher
Photographer/Videographer/Cameraman
Other
Proportions/Means: Columns Tested (5% risk level) - B/C/D/E - F/G - H/I/J/K/L/M - N/O/P - Q/R Overlap formulae used. * small base
Other (specify)
I don't work in the media industry anymore (fully
retired/career change)
Sigma
Journalist/Host
Management
Blogger
Columnist/Opinion Writer
Campus Media Employee
Media/Journalism Student
Retired - but still working in the industry occasionally
Producer
Management (of a team of journalists or media workers)
Owner/Publisher
Photographer
Videographer/Cameraman
Journalist/reporter/correspondent
Video Journalist
Research Journalist
Presenter/Host
Editor
q1. What is your formal status as a journalist or media worker? Please select all that apply.
Age Gender Region Ethnocultural background/race If identify as LGBTQ2S+
Ipsos11 of 56

Online Harm in Journalism Detailed Tables
Total <30 30-39 40-49 50+ Male Female
BC/Territorie
s AB MB/SK ON QC ATL
All non-
white/BIPOC Asian (NET) White (NET) Yes No
A B C D E F G H I J K L M N O P Q R
Base: All respondents excluding students and those
fully retired from the media sector 1082 170 299 276 323 547 504 99* 96* 77* 405 343 47* 290 171 822 128 905
41 30 8 0 3 20 19 4 0 5 14 17 1 13 10 30 13 28
4% 18% 3% - 1% 4% 4% 4% - 6% 3% 5% 2% 4% 6% 4% 10% 3%CDE D I I I R
143 89 38 9 6 61 76 15 14 11 53 46 1 50 24 102 39 97
13% 52% 13% 3% 2% 11% 15% 15% 15% 14% 13% 13% 2% 17% 14% 12% 30% 11%CDE DE M M M M M P R
172 50 97 16 7 71 97 23 19 14 68 39 6 37 21 135 27 136
16% 29% 32% 6% 2% 13% 19% 23% 20% 18% 17% 11% 13% 13% 12% 16% 21% 15%DE DE E F L L L
299 1 152 123 21 139 153 23 26 18 110 103 15 78 45 223 23 263
28% 1% 51% 45% 7% 25% 30% 23% 27% 23% 27% 30% 32% 27% 26% 27% 18% 29%BE BE B Q
427 0 4 128 286 256 159 34 37 29 160 138 24 112 71 332 26 381
39% - 1% 46% 89% 47% 32% 34% 39% 38% 40% 40% 51% 39% 42% 40% 20% 42%BC BCD G Q
1082 170 299 276 323 547 504 99 96 77 405 343 47 290 171 822 128 905
100% 100% 100% 100% 100% 100% 100% 100% 100% 100% 100% 100% 100% 100% 100% 100% 100% 100%
Summary
184 119 46 9 9 81 95 19 14 16 67 63 2 63 34 132 52 125
17% 70% 15% 3% 3% 15% 19% 19% 15% 21% 17% 18% 4% 22% 20% 16% 41% 14%CDE DE M M M M P R
Sigma
5 years or less
Proportions/Means: Columns Tested (5% risk level) - B/C/D/E - F/G - H/I/J/K/L/M - N/O/P - Q/R Overlap formulae used. * small base
Less than two years
2 to 5 years
6 to 10 years
11 to 20 years
Over 20 years
q2. How long have you worked in the field of journalism or media?
Age Gender Region Ethnocultural background/race If identify as LGBTQ2S+
Ipsos11 of 56

Online Harm in Journalism Detailed Tables
Total <30 30-39 40-49 50+ Male Female
BC/Territorie
s AB MB/SK ON QC ATL
All non-
white/BIPOC Asian (NET) White (NET) Yes No
A B C D E F G H I J K L M N O P Q R
Base: All respondents excluding students and those
fully retired from the media sector 1082 170 299 276 323 547 504 99* 96* 77* 405 343 47* 290 171 822 128 905
814 135 224 198 243 406 383 96 95 72 392 108 37 233 139 605 104 673
75% 79% 75% 72% 75% 74% 76% 97% 99% 94% 97% 31% 79% 80% 81% 74% 81% 74%LM LM LM LM L P P
405 65 110 112 118 214 177 10 4 9 50 314 14 95 50 324 49 337
37% 38% 37% 41% 37% 39% 35% 10% 4% 12% 12% 92% 30% 33% 29% 39% 38% 37%I HIJKM HIJK NO
4 1 1 1 1 0 4 0 0 0 2 2 0 4 0 0 1 3
0 1% 0 0 0 - 1% - - - 0 1% - 1% - - 1% 0
F P
32 6 3 11 11 21 11 1 1 0 18 9 0 25 11 10 4 25
3% 4% 1% 4% 3% 4% 2% 1% 1% - 4% 3% - 9% 6% 1% 3% 3%C C P P
1255 207 338 322 373 641 575 107 100 81 462 433 51 357 200 939 158 1038
116% 122% 113% 117% 115% 117% 114% 108% 104% 105% 114% 126% 109% 123% 117% 114% 123% 115%
Summary
36 7 4 12 12 21 15 1 1 0 20 11 0 29 11 10 5 28
3% 4% 1% 4% 4% 4% 3% 1% 1% - 5% 3% - 10% 6% 1% 4% 3%C J OP P
Indigenous/Other
Proportions/Means: Columns Tested (5% risk level) - B/C/D/E - F/G - H/I/J/K/L/M - N/O/P - Q/R Overlap formulae used. * small base
English
French
Indigenous languages
Other (specify)
Sigma
q3. In which language(s) do you work? Please select all that apply.
Age Gender Region Ethnocultural background/race If identify as LGBTQ2S+
Ipsos11 of 56

Online Harm in Journalism Detailed Tables
Total <30 30-39 40-49 50+ Male Female
BC/Territorie
s AB MB/SK ON QC ATL
All non-
white/BIPOC Asian (NET) White (NET) Yes No
A B C D E F G H I J K L M N O P Q R
Base: All respondents excluding students and those fully
retired from the media sector 1082 170 299 276 323 547 504 99* 96* 77* 405 343 47* 290 171 822 128 905
248 55 73 60 57 109 133 28 21 25 101 52 16 80 51 176 51 186
23% 32% 24% 22% 18% 20% 26% 28% 22% 32% 25% 15% 34% 28% 30% 21% 40% 21%DE E F L L L L P P R
348 51 95 108 90 160 179 40 24 32 110 106 27 98 57 260 47 283
32% 30% 32% 39% 28% 29% 36% 40% 25% 42% 27% 31% 57% 34% 33% 32% 37% 31%E F IK IK IKL
295 43 83 92 74 127 160 37 21 28 92 83 27 79 47 221 43 235
27% 25% 28% 33% 23% 23% 32% 37% 22% 36% 23% 24% 57% 27% 27% 27% 34% 26%E F IKL IKL HIJKL
49 8 10 15 14 30 17 5 3 3 18 17 1 15 6 37 4 41
5% 5% 3% 5% 4% 5% 3% 5% 3% 4% 4% 5% 2% 5% 4% 5% 3% 5%
15 2 4 6 3 9 5 0 0 2 3 9 1 9 4 9 0 14
1% 1% 1% 2% 1% 2% 1% - - 3% 1% 3% 2% 3% 2% 1% - 2%K P
4 1 1 1 1 2 1 1 0 0 1 1 1 2 0 3 0 3
0 1% 0 0 0 0 0 1% - - 0 0 2% 1% - 0 - 0
555 80 147 163 156 281 259 48 45 51 214 151 35 154 93 414 57 472
51% 47% 49% 59% 48% 51% 51% 48% 47% 66% 53% 44% 74% 53% 54% 50% 45% 52%BCE HIKL L HIKL
399 63 110 119 101 187 200 36 26 34 139 125 31 110 66 297 44 334
37% 37% 37% 43% 31% 34% 40% 36% 27% 44% 34% 36% 66% 38% 39% 36% 34% 37%E I HIJKL
169 21 41 47 57 102 63 12 18 17 84 30 5 45 28 128 13 150
16% 12% 14% 17% 18% 19% 13% 12% 19% 22% 21% 9% 11% 16% 16% 16% 10% 17%G L L L
14 4 3 3 4 10 3 0 1 0 8 4 1 8 2 8 0 12
1% 2% 1% 1% 1% 2% 1% - 1% - 2% 1% 2% 3% 1% 1% - 1%OP
374 59 110 80 120 196 163 40 36 21 130 142 4 90 54 296 39 313
35% 35% 37% 29% 37% 36% 32% 40% 38% 27% 32% 41% 9% 31% 32% 36% 30% 35%D D M M M M JKM
158 25 57 38 37 81 73 18 14 1 52 70 2 38 20 124 19 123
15% 15% 19% 14% 11% 15% 14% 18% 15% 1% 13% 20% 4% 13% 12% 15% 15% 14%E JM J J JKM
107 17 28 18 40 58 40 8 17 11 35 34 2 27 16 81 12 91
10% 10% 9% 7% 12% 11% 8% 8% 18% 14% 9% 10% 4% 9% 9% 10% 9% 10%D HKLM
109 17 29 18 44 57 47 13 7 9 43 35 2 25 15 85 7 94
10% 10% 10% 7% 14% 10% 9% 13% 7% 12% 11% 10% 4% 9% 9% 10% 5% 10%D
12 9 2 0 1 7 3 2 0 0 4 5 1 5 4 8 5 6
1% 5% 1% - 0 1% 1% 2% - - 1% 1% 2% 2% 2% 1% 4% 1%CDE R
44 4 17 11 11 14 26 3 2 2 12 23 2 18 10 30 5 35
4% 2% 6% 4% 3% 3% 5% 3% 2% 3% 3% 7% 4% 6% 6% 4% 4% 4%F K P
32 6 6 7 12 21 7 3 3 0 10 14 1 13 3 20 3 25
3% 4% 2% 3% 4% 4% 1% 3% 3% - 2% 4% 2% 4% 2% 2% 2% 3%G O
94 23 26 20 25 45 45 5 1 7 40 37 3 41 23 60 18 72
9% 14% 9% 7% 8% 8% 9% 5% 1% 9% 10% 11% 6% 14% 13% 7% 14% 8%DE I I I P P R
14 2 1 2 9 5 9 0 3 1 2 7 1 5 1 8 1 12
1% 1% 0 1% 3% 1% 2% - 3% 1% 0 2% 2% 2% 1% 1% 1% 1%C K O
1763 300 491 457 490 864 832 171 137 140 644 546 97 520 296 1295 225 1433
163% 176% 164% 166% 152% 158% 165% 173% 143% 182% 159% 159% 206% 179% 173% 158% 176% 158% Proportions/Means: Columns Tested (5% risk level) - B/C/D/E - F/G - H/I/J/K/L/M - N/O/P - Q/R Overlap formulae used. * small base
Magazine (general interest or specialized)
Newswire service/wire/news agency
Freelance/independent
Other
Sigma
Print - NET
Large-size newspaper (circulation 200K+)
Mid-size newspaper (circ. 50K-200K)
Small-market newspaper (circ. <50K)
Campus/Student newspaper
Campus radio
TV - NET
Public broadcasting TV
Commercial TV
Community TV
Digital first organization (online only, digital general, blog,
etc.)
Radio - NET
Public broadcasting radio
Commercial radio
Community radio
q4. In which area(s) of the media do you work? Please select all that apply.
Age Gender Region Ethnocultural background/race If identify as LGBTQ2S+
Ipsos11 of 56

Online Harm in Journalism Detailed Tables
Total <30 30-39 40-49 50+ Male Female
BC/Territorie
s AB MB/SK ON QC ATL
All non-
white/BIPOC Asian (NET) White (NET) Yes No
A B C D E F G H I J K L M N O P Q R
Base: All respondents excluding students and those
fully retired from the media sector 1082 170 299 276 323 547 504 99* 96* 77* 405 343 47* 290 171 822 128 905
75 13 14 16 30 39 31 6 3 4 27 31 2 29 17 48 11 59
7% 8% 5% 6% 9% 7% 6% 6% 3% 5% 7% 9% 4% 10% 10% 6% 9% 7%C P P
922 135 264 242 270 467 433 87 87 68 341 284 43 232 139 715 100 783
85% 79% 88% 88% 84% 85% 86% 88% 91% 88% 84% 83% 91% 80% 81% 87% 78% 87%B B NO Q
85 22 21 18 23 41 40 6 6 5 37 28 2 29 15 59 17 63
8% 13% 7% 7% 7% 7% 8% 6% 6% 6% 9% 8% 4% 10% 9% 7% 13% 7%CDE R
1082 170 299 276 323 547 504 99 96 77 405 343 47 290 171 822 128 905
100% 100% 100% 100% 100% 100% 100% 100% 100% 100% 100% 100% 100% 100% 100% 100% 100% 100%
Proportions/Means: Columns Tested (5% risk level) - B/C/D/E - F/G - H/I/J/K/L/M - N/O/P - Q/R Overlap formulae used. * small base
Self-employed/freelancer
Media organization
Both
Sigma
q5. Are you self-employed/freelancer or employed by a media organization?
Age Gender Region Ethnocultural background/race If identify as LGBTQ2S+
Ipsos11 of 56

Online Harm in Journalism Detailed Tables
Total <30 30-39 40-49 50+ Male Female
BC/Territori
es AB MB/SK ON QC ATL
All non-
white/BIPOC Asian (NET) White (NET) Yes No
A B C D E F G H I J K L M N O P Q R
Base: All respondents excluding students and those
fully retired from the media sector 1082 170 299 276 323 547 504 99* 96* 77* 405 343 47* 290 171 822 128 905
418 58 106 131 118 181 225 39 28 31 141 137 34 113 70 311 57 341
39% 34% 35% 47% 37% 33% 45% 39% 29% 40% 35% 40% 72% 39% 41% 38% 45% 38%
BCE F HIJKL
237 34 62 77 59 92 137 32 24 23 119 10 21 75 47 159 36 188
22% 20% 21% 28% 18% 17% 27% 32% 25% 30% 29% 3% 45% 26% 27% 19% 28% 21%
CE F L L L L IKL P P
168 22 41 49 56 80 84 7 3 7 18 121 12 34 20 142 19 142
16% 13% 14% 18% 17% 15% 17% 7% 3% 9% 4% 35% 26% 12% 12% 17% 15% 16%
HIJK HIJK N
13 2 3 5 3 9 4 0 1 1 4 6 1 4 3 10 2 11
1% 1% 1% 2% 1% 2% 1% - 1% 1% 1% 2% 2% 1% 2% 1% 2% 1%
199 32 65 53 47 107 89 17 27 19 103 23 8 50 28 154 20 172
18% 19% 22% 19% 15% 20% 18% 17% 28% 25% 25% 7% 17% 17% 16% 19% 16% 19%
E L L L L L
194 31 63 51 47 105 86 17 27 19 99 22 8 50 28 150 20 169
18% 18% 21% 18% 15% 19% 17% 17% 28% 25% 24% 6% 17% 17% 16% 18% 16% 19%
E L L L L L
5 1 2 2 0 2 3 0 0 0 4 1 0 0 0 4 0 3
0 1% 1% 1% - 0 1% - - - 1% 0 - - - 0 - 0
95 12 16 20 43 64 30 14 27 14 26 14 0 17 12 78 4 88
9% 7% 5% 7% 13% 12% 6% 14% 28% 18% 6% 4% - 6% 7% 9% 3% 10%
BCD G KLM HKLM KLM N Q
78 11 11 15 38 50 27 11 25 13 22 7 0 14 10 63 3 72
7% 6% 4% 5% 12% 9% 5% 11% 26% 17% 5% 2% - 5% 6% 8% 2% 8%
CD G KLM HKLM KLM L Q
7 0 1 4 2 7 0 3 0 1 1 2 0 0 0 7 0 7
1% - 0 1% 1% 1% - 3% - 1% 0 1% - - - 1% - 1%
G KL
5 0 3 0 2 4 1 0 2 0 3 0 0 1 1 4 0 5
0 - 1% - 1% 1% 0 - 2% - 1% - - 0 1% 0 - 1%
L
5 1 1 1 1 3 2 0 0 0 0 5 0 2 1 4 1 4
0 1% 0 0 0 1% 0 - - - - 1% - 1% 1% 0 1% 0
K
62 8 17 13 24 30 28 1 0 0 61 0 0 21 11 48 7 50
6% 5% 6% 5% 7% 5% 6% 1% - - 15% - - 7% 6% 6% 5% 6%
HIJLM
28 6 6 7 9 12 16 1 0 0 27 0 0 11 4 20 3 22
3% 4% 2% 3% 3% 2% 3% 1% - - 7% - - 4% 2% 2% 2% 2%
HIJL
17 2 7 3 5 6 8 0 0 0 17 0 0 2 1 16 3 13
2% 1% 2% 1% 2% 1% 2% - - - 4% - - 1% 1% 2% 2% 1%
HIL
17 0 4 3 10 12 4 0 0 0 17 0 0 8 6 12 1 15
2% - 1% 1% 3% 2% 1% - - - 4% - - 3% 4% 1% 1% 2%
B HIL
31 5 15 8 3 17 14 0 0 0 1 30 0 4 3 27 2 29
3% 3% 5% 3% 1% 3% 3% - - - 0 9% - 1% 2% 3% 2% 3%
E HIJKM
11 1 7 3 0 5 6 0 0 0 0 11 0 1 1 11 0 11
1% 1% 2% 1% - 1% 1% - - - - 3% - 0 1% 1% - 1%
E K
13 3 5 4 1 7 6 0 0 0 0 13 0 2 1 11 2 11
1% 2% 2% 1% 0 1% 1% - - - - 4% - 1% 1% 1% 2% 1%
K
7 1 3 1 2 5 2 0 0 0 1 6 0 1 1 5 0 7
1% 1% 1% 0 1% 1% 0 - - - 0 2% - 0 1% 1% - 1%
K
18 2 6 7 3 9 8 0 0 0 0 18 0 4 1 14 1 15
2% 1% 2% 3% 1% 2% 2% - - - - 5% - 1% 1% 2% 1% 2%
HIJK
22 5 7 5 5 14 8 0 3 1 12 6 0 3 3 19 3 19
2% 3% 2% 2% 2% 3% 2% - 3% 1% 3% 2% - 1% 2% 2% 2% 2%
13 2 5 5 1 6 6 0 0 0 0 13 0 2 0 10 1 8
1% 1% 2% 2% 0 1% 1% - - - - 4% - 1% - 1% 1% 1%
K
12 4 3 1 4 7 5 12 0 0 0 0 0 1 1 12 2 10
1% 2% 1% 0 1% 1% 1% 12% - - - - - 0 1% 1% 2% 1%
IJKLM
5 1 0 1 3 1 4 0 0 0 2 3 0 0 0 5 0 5
0 1% - 0 1% 0 1% - - - 0 1% - - - 1% - 1%
5 1 1 2 1 2 3 0 0 2 1 1 0 3 3 4 1 4
0 1% 0 1% 0 0 1% - - 3% 0 0 - 1% 2% 0 1% 0
KL
5 0 4 1 0 2 2 1 1 0 2 0 0 2 1 3 1 3
0 - 1% 0 - 0 0 1% 1% - 0 - - 1% 1% 0 1% 0
E
5 1 3 0 1 2 3 0 0 0 0 5 0 3 3 2 1 4
0 1% 1% - 0 0 1% - - - - 1% - 1% 2% 0 1% 0
K P
174 35 43 27 68 98 71 12 10 10 50 87 4 60 32 123 25 146
16% 21% 14% 10% 21% 18% 14% 12% 10% 13% 12% 25% 9% 21% 19% 15% 20% 16%
D CD HIJKM P
18 4 8 2 2 7 8 3 0 0 6 6 1 7 3 12 3 11
2% 2% 3% 1% 1% 1% 2% 3% - - 1% 2% 2% 2% 2% 1% 2% 1%
E
1082 170 299 276 323 547 504 99 96 77 405 343 47 290 171 822 128 905
100% 100% 100% 100% 100% 100% 100% 100% 100% 100% 100% 100% 100% 100% 100% 100% 100% 100%Sigma
Proportions/Means: Columns Tested (5% risk level) - B/C/D/E - F/G - H/I/J/K/L/M - N/O/P - Q/R Overlap formulae used. * small base
Corus Entertainment
The Globe and Mail
Métro média
Other
Nothing/ don't know
La Presse
Global News
Le Devoir
Black Press Media
La Presse Canadienne/The Canadian Press
Torstar - Other
Quebecor - Net
Québecor Media
Le Journal de Montréal
Quebecor – Other
National Post
The Montreal Gazette
TorStar - Net
Toronto Star
Metroland Media
CTV
Bell – Other
Postmedia - Net
Postmedia
The Sun
CBC/Radio-Canada - Net
CBC
Radio-Canada
CBC/Radio Canada
Bell - Net
q5b. Which media organization do you consider as your main employer?
Age Gender Region Ethnocultural background/race If identify as LGBTQ2S+
Ipsos11 of 56

Online Harm in Journalism Detailed Tables
Total <30 30-39 40-49 50+ Male Female
BC/Territori
es AB MB/SK ON QC ATL
All non-
white/BIPOC Asian (NET) White (NET) Yes No
A B C D E F G H I J K L M N O P Q R
Base: Mentioned Media or Both at Q5 - excluding
students and those fully retired from the media sector 1007 157 285 260 293 508 473 93* 93* 73* 378 312 45* 261 154 774 117 846
413 57 104 129 118 180 221 38 28 30 140 135 34 112 69 307 56 337
41% 36% 36% 50% 40% 35% 47% 41% 30% 41% 37% 43% 76% 43% 45% 40% 48% 40%
BCE F I HIJKL
234 33 61 76 59 91 135 32 24 22 118 9 21 74 46 157 35 186
23% 21% 21% 29% 20% 18% 29% 34% 26% 30% 31% 3% 47% 28% 30% 20% 30% 22%
CE F L L L L IKL P P
166 22 40 48 56 80 82 6 3 7 18 120 12 34 20 140 19 140
16% 14% 14% 18% 19% 16% 17% 6% 3% 10% 5% 38% 27% 13% 13% 18% 16% 17%
HIJK HIJK N
13 2 3 5 3 9 4 0 1 1 4 6 1 4 3 10 2 11
1% 1% 1% 2% 1% 2% 1% - 1% 1% 1% 2% 2% 2% 2% 1% 2% 1%
190 29 63 52 44 103 85 17 25 19 97 22 8 48 26 147 17 167
19% 18% 22% 20% 15% 20% 18% 18% 27% 26% 26% 7% 18% 18% 17% 19% 15% 20%
E L L L L L
186 29 61 50 44 101 83 17 25 19 93 22 8 48 26 144 17 164
18% 18% 21% 19% 15% 20% 18% 18% 27% 26% 25% 7% 18% 18% 17% 19% 15% 19%
E L L L L L
4 0 2 2 0 2 2 0 0 0 4 0 0 0 0 3 0 3
0 - 1% 1% - 0 0 - - - 1% - - - - 0 - 0
95 12 16 20 43 64 30 14 27 14 26 14 0 17 12 78 4 88
9% 8% 6% 8% 15% 13% 6% 15% 29% 19% 7% 4% - 7% 8% 10% 3% 10%
BCD G KLM HKLM KLM Q
78 11 11 15 38 50 27 11 25 13 22 7 0 14 10 63 3 72
8% 7% 4% 6% 13% 10% 6% 12% 27% 18% 6% 2% - 5% 6% 8% 3% 9%
CD G KLM HKLM KLM L Q
7 0 1 4 2 7 0 3 0 1 1 2 0 0 0 7 0 7
1% - 0 2% 1% 1% - 3% - 1% 0 1% - - - 1% - 1%
G KL
5 0 3 0 2 4 1 0 2 0 3 0 0 1 1 4 0 5
0 - 1% - 1% 1% 0 - 2% - 1% - - 0 1% 1% - 1%
L
5 1 1 1 1 3 2 0 0 0 0 5 0 2 1 4 1 4
0 1% 0 0 0 1% 0 - - - - 2% - 1% 1% 1% 1% 0
K
62 8 17 13 24 30 28 1 0 0 61 0 0 21 11 48 7 50
6% 5% 6% 5% 8% 6% 6% 1% - - 16% - - 8% 7% 6% 6% 6%
HIJLM
28 6 6 7 9 12 16 1 0 0 27 0 0 11 4 20 3 22
3% 4% 2% 3% 3% 2% 3% 1% - - 7% - - 4% 3% 3% 3% 3%
HIJL
17 2 7 3 5 6 8 0 0 0 17 0 0 2 1 16 3 13
2% 1% 2% 1% 2% 1% 2% - - - 4% - - 1% 1% 2% 3% 2%
HIL
17 0 4 3 10 12 4 0 0 0 17 0 0 8 6 12 1 15
2% - 1% 1% 3% 2% 1% - - - 4% - - 3% 4% 2% 1% 2%
B HIL P
28 5 15 7 1 16 12 0 0 0 0 28 0 2 2 26 2 26
3% 3% 5% 3% 0 3% 3% - - - - 9% - 1% 1% 3% 2% 3%
E E E HIJKM N
11 1 7 3 0 5 6 0 0 0 0 11 0 1 1 11 0 11
1% 1% 2% 1% - 1% 1% - - - - 4% - 0 1% 1% - 1%
E K
11 3 5 3 0 7 4 0 0 0 0 11 0 1 1 10 2 9
1% 2% 2% 1% - 1% 1% - - - - 4% - 0 1% 1% 2% 1%
E E K
6 1 3 1 1 4 2 0 0 0 0 6 0 0 0 5 0 6
1% 1% 1% 0 0 1% 0 - - - - 2% - - - 1% - 1%
K
18 2 6 7 3 9 8 0 0 0 0 18 0 4 1 14 1 15
2% 1% 2% 3% 1% 2% 2% - - - - 6% - 2% 1% 2% 1% 2%
HIJK
21 4 7 5 5 13 8 0 3 1 12 5 0 3 3 18 3 18
2% 3% 2% 2% 2% 3% 2% - 3% 1% 3% 2% - 1% 2% 2% 3% 2%
12 2 4 5 1 5 6 0 0 0 0 12 0 1 0 10 1 7
1% 1% 1% 2% 0 1% 1% - - - - 4% - 0 - 1% 1% 1%
K
12 4 3 1 4 7 5 12 0 0 0 0 0 1 1 12 2 10
1% 3% 1% 0 1% 1% 1% 13% - - - - - 0 1% 2% 2% 1%
IJKLM
5 1 0 1 3 1 4 0 0 0 2 3 0 0 0 5 0 5
0 1% - 0 1% 0 1% - - - 1% 1% - - - 1% - 1%
4 1 1 1 1 1 3 0 0 2 1 1 0 3 3 3 1 3
0 1% 0 0 0 0 1% - - 3% 0 0 - 1% 2% 0 1% 0
KL P
3 0 3 0 0 2 1 1 0 0 1 0 0 0 0 3 1 2
0 - 1% - - 0 0 1% - - 0 - - - - 0 1% 0
5 1 3 0 1 2 3 0 0 0 0 5 0 3 3 2 1 4
0 1% 1% - 0 0 1% - - - - 2% - 1% 2% 0 1% 0
K P
130 29 39 18 44 71 55 8 10 7 35 66 3 44 22 95 18 110
13% 18% 14% 7% 15% 14% 12% 9% 11% 10% 9% 21% 7% 17% 14% 12% 15% 13%
D D D HIJKM P
9 2 4 1 1 4 4 2 0 0 3 3 0 2 1 6 3 4
1% 1% 1% 0 0 1% 1% 2% - - 1% 1% - 1% 1% 1% 3% 0
R
1007 157 285 260 293 508 473 93 93 73 378 312 45 261 154 774 117 846
100% 100% 100% 100% 100% 100% 100% 100% 100% 100% 100% 100% 100% 100% 100% 100% 100% 100%Sigma
Proportions/Means: Columns Tested (5% risk level) - B/C/D/E - F/G - H/I/J/K/L/M - N/O/P - Q/R Overlap formulae used. * small base
Corus Entertainment
The Globe and Mail
Métro média
Other
Nothing/ don't know
La Presse
Global News
Le Devoir
Black Press Media
La Presse Canadienne/The Canadian Press
Torstar - Other
Quebecor - Net
Québecor Media
Le Journal de Montréal
Quebecor – Other
National Post
The Montreal Gazette
TorStar - Net
Toronto Star
Metroland Media
CTV
Bell – Other
Postmedia - Net
Postmedia
The Sun
CBC/Radio-Canada - Net
CBC
Radio-Canada
CBC/Radio Canada
Bell - Net
q5bx. Which media organization do you consider as your main employer?
Age Gender Region Ethnocultural background/race If identify as LGBTQ2S+
Ipsos11 of 56
Online Harm in Journalism Detailed Tables
Total <30 30-39 40-49 50+ Male Female
BC/Territorie
s AB MB/SK ON QC ATL
All non-
white/BIPOC Asian (NET) White (NET) Yes No
A B C D E F G H I J K L M N O P Q R
Base: All respondents excluding students and those fully
retired from the media sector 1082 170 299 276 323 547 504 99* 96* 77* 405 343 47* 290 171 822 128 905
230 41 57 57 73 124 93 22 24 18 82 70 14 66 38 167 35 186
21% 24% 19% 21% 23% 23% 18% 22% 25% 23% 20% 20% 30% 23% 22% 20% 27% 21%
241 39 58 77 66 130 103 19 21 14 97 82 7 61 30 186 32 202
22% 23% 19% 28% 20% 24% 20% 19% 22% 18% 24% 24% 15% 21% 18% 23% 25% 22%
CE
185 30 46 53 55 100 76 14 20 12 77 50 12 57 29 135 30 147
17% 18% 15% 19% 17% 18% 15% 14% 21% 16% 19% 15% 26% 20% 17% 16% 23% 16%
R
338 55 94 99 87 163 164 38 30 24 99 125 18 81 47 268 48 274
31% 32% 31% 36% 27% 30% 33% 38% 31% 31% 24% 36% 38% 28% 27% 33% 38% 30%
E K K K
31 5 9 8 9 13 16 1 4 3 15 6 2 9 3 23 2 27
3% 3% 3% 3% 3% 2% 3% 1% 4% 4% 4% 2% 4% 3% 2% 3% 2% 3%
392 76 117 98 98 185 194 31 45 33 124 142 13 100 59 308 57 318
36% 45% 39% 36% 30% 34% 38% 31% 47% 43% 31% 41% 28% 34% 35% 37% 45% 35%
E E HKM K K R
114 15 32 38 29 56 49 9 9 9 37 40 10 26 11 88 14 92
11% 9% 11% 14% 9% 10% 10% 9% 9% 12% 9% 12% 21% 9% 6% 11% 11% 10%
HK
536 98 152 138 143 283 236 52 60 38 183 177 21 134 73 422 78 434
50% 58% 51% 50% 44% 52% 47% 53% 63% 49% 45% 52% 45% 46% 43% 51% 61% 48%
E KM O R
228 41 67 64 53 100 117 21 23 13 89 71 7 53 31 180 29 185
21% 24% 22% 23% 16% 18% 23% 21% 24% 17% 22% 21% 15% 18% 18% 22% 23% 20%
E E F
214 35 49 62 66 126 83 21 23 14 75 70 9 44 23 174 18 189
20% 21% 16% 22% 20% 23% 16% 21% 24% 18% 19% 20% 19% 15% 13% 21% 14% 21%
G NO
175 26 48 48 51 92 77 15 20 7 69 53 8 46 26 135 21 144
16% 15% 16% 17% 16% 17% 15% 15% 21% 9% 17% 15% 17% 16% 15% 16% 16% 16%
J
63 12 16 27 8 29 28 8 9 6 19 19 2 15 10 52 10 48
6% 7% 5% 10% 2% 5% 6% 8% 9% 8% 5% 6% 4% 5% 6% 6% 8% 5%
E CE
144 26 37 52 27 63 75 21 15 15 53 28 9 36 20 116 21 117
13% 15% 12% 19% 8% 12% 15% 21% 16% 19% 13% 8% 19% 12% 12% 14% 16% 13%
E CE KL L L L L
213 31 60 72 49 107 100 13 17 10 93 69 7 59 26 162 28 175
20% 18% 20% 26% 15% 20% 20% 13% 18% 13% 23% 20% 15% 20% 15% 20% 22% 19%
E H O
606 113 164 156 168 305 281 68 66 55 196 178 40 158 96 461 82 502
56% 66% 55% 57% 52% 56% 56% 69% 69% 71% 48% 52% 85% 54% 56% 56% 64% 55%
CDE KL KL KL HIKL
408 70 110 122 99 201 193 25 33 26 174 129 15 109 52 304 61 325
38% 41% 37% 44% 31% 37% 38% 25% 34% 34% 43% 38% 32% 38% 30% 37% 48% 36%
E E H H O R
114 11 23 35 44 61 47 12 18 10 35 35 4 39 24 86 15 93
11% 6% 8% 13% 14% 11% 9% 12% 19% 13% 9% 10% 9% 13% 14% 10% 12% 10%
BC BC KL
106 13 30 34 29 56 45 7 10 10 39 33 7 29 19 82 12 91
10% 8% 10% 12% 9% 10% 9% 7% 10% 13% 10% 10% 15% 10% 11% 10% 9% 10%
105 12 30 28 34 54 49 11 11 9 48 24 1 29 17 81 6 97
10% 7% 10% 10% 11% 10% 10% 11% 11% 12% 12% 7% 2% 10% 10% 10% 5% 11%
LM Q
40 7 12 9 11 17 22 3 3 3 13 17 1 10 4 32 6 34
4% 4% 4% 3% 3% 3% 4% 3% 3% 4% 3% 5% 2% 3% 2% 4% 5% 4%
14 4 5 5 0 3 11 0 1 0 5 7 1 6 3 10 2 11
1% 2% 2% 2% - 1% 2% - 1% - 1% 2% 2% 2% 2% 1% 2% 1%
E E E F
10 0 1 4 5 3 6 0 0 0 2 8 0 4 2 7 1 9
1% - 0 1% 2% 1% 1% - - - 0 2% - 1% 1% 1% 1% 1%
K
9 0 5 3 0 4 3 0 0 0 2 7 0 1 0 5 1 6
1% - 2% 1% - 1% 1% - - - 0 2% - 0 - 1% 1% 1%
E
9 2 3 3 1 5 3 0 0 1 2 6 0 2 1 7 1 8
1% 1% 1% 1% 0 1% 1% - - 1% 0 2% - 1% 1% 1% 1% 1%
6 0 1 2 3 0 6 1 0 0 3 2 0 4 0 2 0 6
1% - 0 1% 1% - 1% 1% - - 1% 1% - 1% - 0 - 1%
F P
41 8 13 8 11 18 23 1 2 1 14 22 0 16 8 30 5 32
4% 5% 4% 3% 3% 3% 5% 1% 2% 1% 3% 6% - 6% 5% 4% 4% 4%
H
14 1 2 3 8 9 4 3 0 2 4 2 1 3 2 12 2 11
1% 1% 1% 1% 2% 2% 1% 3% - 3% 1% 1% 2% 1% 1% 1% 2% 1%
L
2 0 0 1 1 2 0 0 0 0 0 2 0 0 0 1 0 1
0 - - 0 0 0 - - - - - 1% - - - 0 - 0
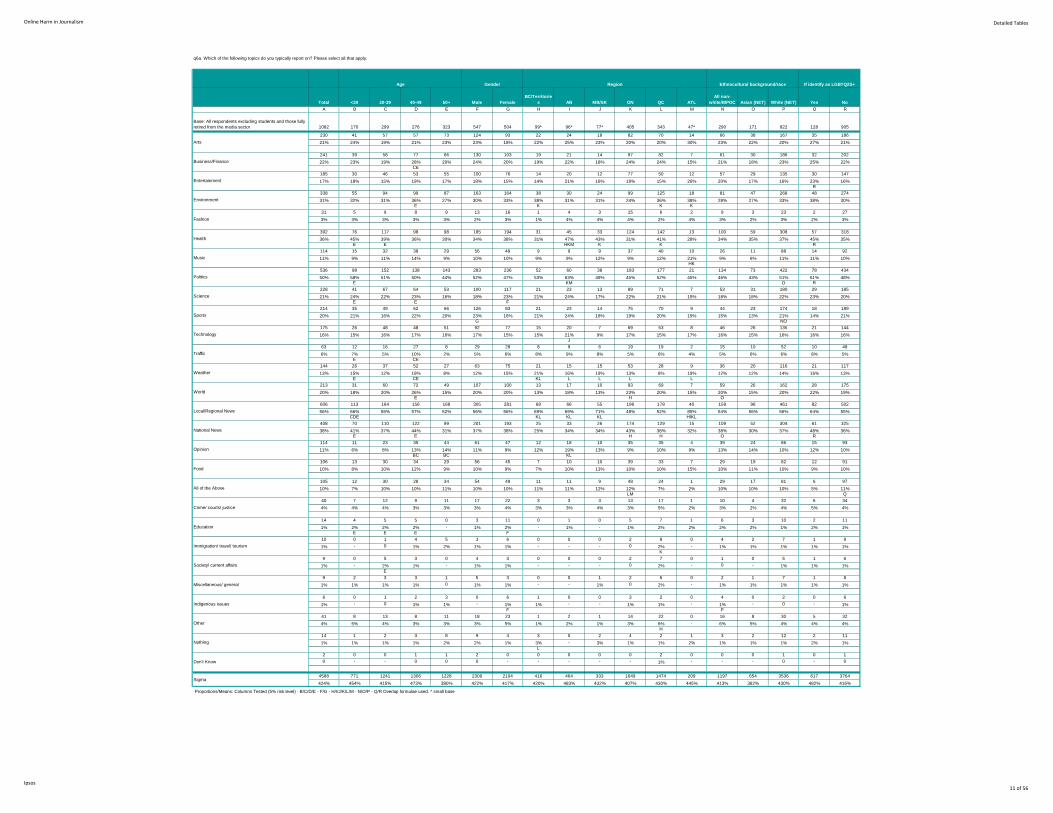
4588 771 1241 1306 1228 2309 2104 416 464 333 1649 1474 209 1197 654 3536 617 3764
424% 454% 415% 473% 380% 422% 417% 420% 483% 432% 407% 430% 445% 413% 382% 430% 482% 416%
Proportions/Means: Columns Tested (5% risk level) - B/C/D/E - F/G - H/I/J/K/L/M - N/O/P - Q/R Overlap formulae used. * small base
Other
Nothing
Don't Know
Sigma
Education
Immigration/ travel/ tourism
Society/ current affairs
Miscellaneous/ general
Indigenous issues
National News
Opinion
Food
All of the Above
Crime/ courts/ justice
Technology
Traffic
Weather
World
Local/Regional News
Health
Music
Politics
Science
Sports
Arts
Business/Finance
Entertainment
Environment
Fashion
q6a. Which of the following topics do you typically report on? Please select all that apply.
Age Gender Region Ethnocultural background/race If identify as LGBTQ2S+
Ipsos11 of 56
Online Harm in Journalism Detailed Tables
Total <30 30-39 40-49 50+ Male Female
BC/Territorie
s AB MB/SK ON QC ATL
All non-
white/BIPOC Asian (NET) White (NET) Yes No
A B C D E F G H I J K L M N O P Q R
Base: All respondents excluding students and those
fully retired from the media sector 1082 170 299 276 323 547 504 99* 96* 77* 405 343 47* 290 171 822 128 905
736 130 215 182 201 375 339 72 75 56 300 196 29 187 109 568 91 617
68% 76% 72% 66% 62% 69% 67% 73% 78% 73% 74% 57% 62% 64% 64% 69% 71% 68%DE E L LM L L
346 40 84 94 122 172 165 27 21 21 105 147 18 103 62 254 37 288
32% 24% 28% 34% 38% 31% 33% 27% 22% 27% 26% 43% 38% 36% 36% 31% 29% 32%B BC HIJK I
1082 170 299 276 323 547 504 99 96 77 405 343 47 290 171 822 128 905
100% 100% 100% 100% 100% 100% 100% 100% 100% 100% 100% 100% 100% 100% 100% 100% 100% 100%
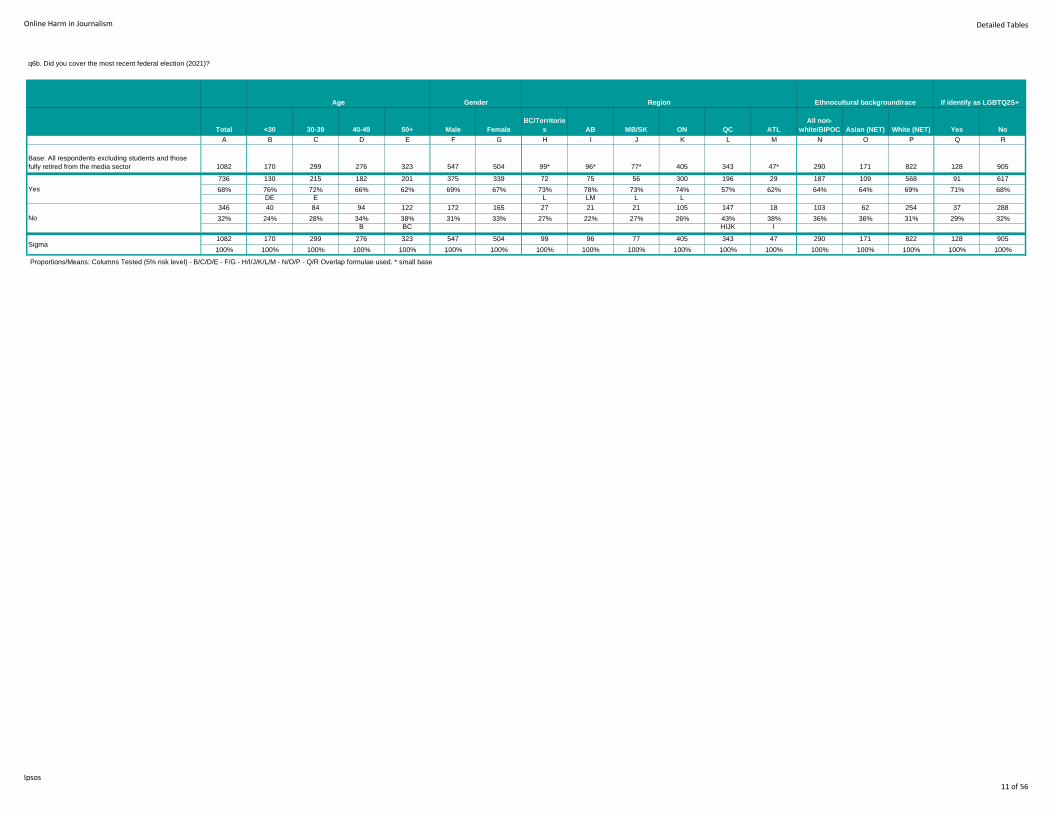
Yes
No
Sigma Proportions/Means: Columns Tested (5% risk level) - B/C/D/E - F/G - H/I/J/K/L/M - N/O/P - Q/R Overlap formulae used. * small base
q6b. Did you cover the most recent federal election (2021)?
Age Gender Region Ethnocultural background/race If identify as LGBTQ2S+
Ipsos11 of 56

Online Harm in Journalism Detailed Tables
Total <30 30-39 40-49 50+ Male Female
BC/Territorie
s AB MB/SK ON QC ATL
All non-
white/BIPOC Asian (NET) White (NET) Yes No
A B C D E F G H I J K L M N O P Q R
Base: All respondents excluding students and those
fully retired from the media sector 1082 170 299 276 323 547 504 99* 96* 77* 405 343 47* 290 171 822 128 905
66 17 16 16 17 32 34 8 14 8 22 11 2 14 6 54 9 56
6% 10% 5% 6% 5% 6% 7% 8% 15% 10% 5% 3% 4% 5% 4% 7% 7% 6%E L KL L
154 28 52 47 27 78 75 18 15 16 63 39 2 43 28 111 21 130
14% 16% 17% 17% 8% 14% 15% 18% 16% 21% 16% 11% 4% 15% 16% 14% 16% 14%E E E M LM M
153 20 51 38 39 63 87 18 15 13 55 41 7 45 25 116 23 123
14% 12% 17% 14% 12% 12% 17% 18% 16% 17% 14% 12% 15% 16% 15% 14% 18% 14%F
145 33 41 37 34 66 74 12 14 12 69 30 7 46 29 106 28 108
13% 19% 14% 13% 11% 12% 15% 12% 15% 16% 17% 9% 15% 16% 17% 13% 22% 12%E L R
185 19 55 49 58 96 79 20 18 11 67 55 9 52 32 142 19 155
17% 11% 18% 18% 18% 18% 16% 20% 19% 14% 17% 16% 19% 18% 19% 17% 15% 17%B B
379 53 84 89 148 212 155 23 20 17 129 167 20 90 51 293 28 333
35% 31% 28% 32% 46% 39% 31% 23% 21% 22% 32% 49% 43% 31% 30% 36% 22% 37%BCD G I HIJK HIJ Q
1082 170 299 276 323 547 504 99 96 77 405 343 47 290 171 822 128 905
100% 100% 100% 100% 100% 100% 100% 100% 100% 100% 100% 100% 100% 100% 100% 100% 100% 100%
Summary
220 45 68 63 44 110 109 26 29 24 85 50 4 57 34 165 30 186
20% 26% 23% 23% 14% 20% 22% 26% 30% 31% 21% 15% 9% 20% 20% 20% 23% 21%E E E LM LM LM LM
373 65 119 101 83 173 196 44 44 37 140 91 11 102 59 281 53 309
34% 38% 40% 37% 26% 32% 39% 44% 46% 48% 35% 27% 23% 35% 35% 34% 41% 34%E E E F LM KLM KLM L
703 117 215 187 175 335 349 76 76 60 276 176 27 200 120 529 100 572
65% 69% 72% 68% 54% 61% 69% 77% 79% 78% 68% 51% 57% 69% 70% 64% 78% 63%E E E F LM KLM LM L R
220 45 68 63 44 110 109 26 29 24 85 50 4 57 34 165 30 186
20% 26% 23% 23% 14% 20% 22% 26% 30% 31% 21% 15% 9% 20% 20% 20% 23% 21%E E E LM LM LM LM
153 20 51 38 39 63 87 18 15 13 55 41 7 45 25 116 23 123
14% 12% 17% 14% 12% 12% 17% 18% 16% 17% 14% 12% 15% 16% 15% 14% 18% 14%F
330 52 96 86 92 162 153 32 32 23 136 85 16 98 61 248 47 263
30% 31% 32% 31% 28% 30% 30% 32% 33% 30% 34% 25% 34% 34% 36% 30% 37% 29%L
Weekly or more frequently
Monthly
Once every 2/3 months or less frequently
Proportions/Means: Columns Tested (5% risk level) - B/C/D/E - F/G - H/I/J/K/L/M - N/O/P - Q/R Overlap formulae used. * small base
(6) Never
Sigma
T2B (1-2)
T3B (1-3)
T5B (1-5)
(1) Every or almost every day
(2) On a weekly basis
(3) On a monthly basis
(4) Once every 2 or 3 months
(5) Less often
q7a_1. [Threats or harassment online (social media, emails, websites, etc)] In the past 12 months, how often have you experienced any of the following as a result of the work you do in the field of journalism or media?
Age Gender Region Ethnocultural background/race If identify as LGBTQ2S+
Ipsos11 of 56

Online Harm in Journalism Detailed Tables
Total <30 30-39 40-49 50+ Male Female
BC/Territorie
s AB MB/SK ON QC ATL
All non-
white/BIPOC Asian (NET) White (NET) Yes No
A B C D E F G H I J K L M N O P Q R
Base: All respondents excluding students and those
fully retired from the media sector 1082 170 299 276 323 547 504 99* 96* 77* 405 343 47* 290 171 822 128 905
7 0 1 3 3 5 2 0 2 1 3 1 0 2 2 6 1 6
1% - 0 1% 1% 1% 0 - 2% 1% 1% 0 - 1% 1% 1% 1% 1%
20 2 4 9 5 14 6 5 3 1 9 2 0 5 1 18 1 19
2% 1% 1% 3% 2% 3% 1% 5% 3% 1% 2% 1% - 2% 1% 2% 1% 2%L L O
35 11 3 10 11 18 17 5 3 5 12 7 2 10 3 25 4 30
3% 6% 1% 4% 3% 3% 3% 5% 3% 6% 3% 2% 4% 3% 2% 3% 3% 3%C C C L O
61 11 13 18 17 25 35 9 15 3 19 14 0 14 8 50 8 50
6% 6% 4% 7% 5% 5% 7% 9% 16% 4% 5% 4% - 5% 5% 6% 6% 6%LM JKLM
176 33 62 36 42 76 93 23 15 25 64 33 12 54 32 125 24 145
16% 19% 21% 13% 13% 14% 18% 23% 16% 32% 16% 10% 26% 19% 19% 15% 19% 16%DE F L IKL L L
783 113 216 200 245 409 351 57 58 42 298 286 33 205 125 598 90 655
72% 66% 72% 72% 76% 75% 70% 58% 60% 55% 74% 83% 70% 71% 73% 73% 70% 72%B HIJ HIJKM
1082 170 299 276 323 547 504 99 96 77 405 343 47 290 171 822 128 905
100% 100% 100% 100% 100% 100% 100% 100% 100% 100% 100% 100% 100% 100% 100% 100% 100% 100%
Summary
27 2 5 12 8 19 8 5 5 2 12 3 0 7 3 24 2 25
2% 1% 2% 4% 2% 3% 2% 5% 5% 3% 3% 1% - 2% 2% 3% 2% 3%L L L
62 13 8 22 19 37 25 10 8 7 24 10 2 17 6 49 6 55
6% 8% 3% 8% 6% 7% 5% 10% 8% 9% 6% 3% 4% 6% 4% 6% 5% 6%C C L L L L O
299 57 83 76 78 138 153 42 38 35 107 57 14 85 46 224 38 250
28% 34% 28% 28% 24% 25% 30% 42% 40% 45% 26% 17% 30% 29% 27% 27% 30% 28%E KL KL KL L L
27 2 5 12 8 19 8 5 5 2 12 3 0 7 3 24 2 25
2% 1% 2% 4% 2% 3% 2% 5% 5% 3% 3% 1% - 2% 2% 3% 2% 3%L L L
35 11 3 10 11 18 17 5 3 5 12 7 2 10 3 25 4 30
3% 6% 1% 4% 3% 3% 3% 5% 3% 6% 3% 2% 4% 3% 2% 3% 3% 3%C C C L O
237 44 75 54 59 101 128 32 30 28 83 47 12 68 40 175 32 195
22% 26% 25% 20% 18% 18% 25% 32% 31% 36% 20% 14% 26% 23% 23% 21% 25% 22%E E F KL KL KL L L
Weekly or more frequently
Monthly
Once every 2/3 months or less frequently
Proportions/Means: Columns Tested (5% risk level) - B/C/D/E - F/G - H/I/J/K/L/M - N/O/P - Q/R Overlap formulae used. * small base
(6) Never
Sigma
T2B (1-2)
T3B (1-3)
T5B (1-5)
(1) Every or almost every day
(2) On a weekly basis
(3) On a monthly basis
(4) Once every 2 or 3 months
(5) Less often
q7a_2. [Threats or harassment by phone] In the past 12 months, how often have you experienced any of the following as a result of the work you do in the field of journalism or media?
Age Gender Region Ethnocultural background/race If identify as LGBTQ2S+
Ipsos11 of 56

Online Harm in Journalism Detailed Tables
Total <30 30-39 40-49 50+ Male Female
BC/Territorie
s AB MB/SK ON QC ATL
All non-
white/BIPOC Asian (NET) White (NET) Yes No
A B C D E F G H I J K L M N O P Q R
Base: All respondents excluding students and those
fully retired from the media sector 1082 170 299 276 323 547 504 99* 96* 77* 405 343 47* 290 171 822 128 905
15 5 3 5 2 14 1 1 2 0 10 1 1 7 6 9 1 14
1% 3% 1% 2% 1% 3% 0 1% 2% - 2% 0 2% 2% 4% 1% 1% 2%E G L P
36 1 10 13 11 25 8 5 6 2 15 7 1 13 8 27 0 35
3% 1% 3% 5% 3% 5% 2% 5% 6% 3% 4% 2% 2% 4% 5% 3% - 4%B G L Q
48 5 16 11 14 31 17 6 5 5 13 14 4 10 4 36 6 39
4% 3% 5% 4% 4% 6% 3% 6% 5% 6% 3% 4% 9% 3% 2% 4% 5% 4%
80 14 21 24 18 43 35 11 11 6 29 18 3 20 12 60 11 66
7% 8% 7% 9% 6% 8% 7% 11% 11% 8% 7% 5% 6% 7% 7% 7% 9% 7%L L
228 37 72 50 69 107 114 29 24 30 79 53 9 63 28 176 28 189
21% 22% 24% 18% 21% 20% 23% 29% 25% 39% 20% 15% 19% 22% 16% 21% 22% 21%KL L KLM O
675 108 177 173 209 327 329 47 48 34 259 250 29 177 113 514 82 562
62% 64% 59% 63% 65% 60% 65% 47% 50% 44% 64% 73% 62% 61% 66% 63% 64% 62%HIJ HIJK N
1082 170 299 276 323 547 504 99 96 77 405 343 47 290 171 822 128 905
100% 100% 100% 100% 100% 100% 100% 100% 100% 100% 100% 100% 100% 100% 100% 100% 100% 100%
Summary
51 6 13 18 13 39 9 6 8 2 25 8 2 20 14 36 1 49
5% 4% 4% 7% 4% 7% 2% 6% 8% 3% 6% 2% 4% 7% 8% 4% 1% 5%G L L P Q
99 11 29 29 27 70 26 12 13 7 38 22 6 30 18 72 7 88
9% 6% 10% 11% 8% 13% 5% 12% 14% 9% 9% 6% 13% 10% 11% 9% 5% 10%G L
407 62 122 103 114 220 175 52 48 43 146 93 18 113 58 308 46 343
38% 36% 41% 37% 35% 40% 35% 53% 50% 56% 36% 27% 38% 39% 34% 37% 36% 38%KL KL KL L O
51 6 13 18 13 39 9 6 8 2 25 8 2 20 14 36 1 49
5% 4% 4% 7% 4% 7% 2% 6% 8% 3% 6% 2% 4% 7% 8% 4% 1% 5%G L L P Q
48 5 16 11 14 31 17 6 5 5 13 14 4 10 4 36 6 39
4% 3% 5% 4% 4% 6% 3% 6% 5% 6% 3% 4% 9% 3% 2% 4% 5% 4%
308 51 93 74 87 150 149 40 35 36 108 71 12 83 40 236 39 255
28% 30% 31% 27% 27% 27% 30% 40% 36% 47% 27% 21% 26% 29% 23% 29% 30% 28%KL L KLM O
Weekly or more frequently
Monthly
Once every 2/3 months or less frequently
Proportions/Means: Columns Tested (5% risk level) - B/C/D/E - F/G - H/I/J/K/L/M - N/O/P - Q/R Overlap formulae used. * small base
(6) Never
Sigma
T2B (1-2)
T3B (1-3)
T5B (1-5)
(1) Every or almost every day
(2) On a weekly basis
(3) On a monthly basis
(4) Once every 2 or 3 months
(5) Less often
q7a_3. [Threats or harassment in person] In the past 12 months, how often have you experienced any of the following as a result of the work you do in the field of journalism or media?
Age Gender Region Ethnocultural background/race If identify as LGBTQ2S+
Ipsos11 of 56

Online Harm in Journalism Detailed Tables
Total <30 30-39 40-49 50+ Male Female
BC/Territorie
s AB MB/SK ON QC ATL
All non-
white/BIPOC Asian (NET) White (NET) Yes No
A B C D E F G H I J K L M N O P Q R
Base: All respondents excluding students and those
fully retired from the media sector 1082 170 299 276 323 547 504 99* 96* 77* 405 343 47* 290 171 822 128 905
4 0 2 2 0 3 1 0 0 0 4 0 0 1 1 3 0 4
0 - 1% 1% - 1% 0 - - - 1% - - 0 1% 0 - 0
16 3 6 4 3 12 4 2 1 0 3 6 4 7 3 11 1 15
1% 2% 2% 1% 1% 2% 1% 2% 1% - 1% 2% 9% 2% 2% 1% 1% 2%IJKL
77 5 22 24 24 48 25 6 7 4 36 19 5 28 15 52 8 63
7% 3% 7% 9% 7% 9% 5% 6% 7% 5% 9% 6% 11% 10% 9% 6% 6% 7%B B B G P
985 162 269 246 296 484 474 91 88 73 362 318 38 254 152 756 119 823
91% 95% 90% 89% 92% 88% 94% 92% 92% 95% 89% 93% 81% 88% 89% 92% 93% 91%CD F M M N
1082 170 299 276 323 547 504 99 96 77 405 343 47 290 171 822 128 905
100% 100% 100% 100% 100% 100% 100% 100% 100% 100% 100% 100% 100% 100% 100% 100% 100% 100%
Summary
4 0 2 2 0 3 1 0 0 0 4 0 0 1 1 3 0 4
0 - 1% 1% - 1% 0 - - - 1% - - 0 1% 0 - 0
97 8 30 30 27 63 30 8 8 4 43 25 9 36 19 66 9 82
9% 5% 10% 11% 8% 12% 6% 8% 8% 5% 11% 7% 19% 12% 11% 8% 7% 9%B B G JL P
4 0 2 2 0 3 1 0 0 0 4 0 0 1 1 3 0 4
0 - 1% 1% - 1% 0 - - - 1% - - 0 1% 0 - 0
93 8 28 28 27 60 29 8 8 4 39 25 9 35 18 63 9 78
9% 5% 9% 10% 8% 11% 6% 8% 8% 5% 10% 7% 19% 12% 11% 8% 7% 9%B G JKL P
Proportions/Means: Columns Tested (5% risk level) - B/C/D/E - F/G - H/I/J/K/L/M - N/O/P - Q/R Overlap formulae used. * small base
T3B (1-3)
T5B (1-5)
Monthly
Once every 2/3 months or less frequently
(3) On a monthly basis
(4) Once every 2 or 3 months
(5) Less often
(6) Never
Sigma
q7a_4. [Physically attacked] In the past 12 months, how often have you experienced any of the following as a result of the work you do in the field of journalism or media?
Age Gender Region Ethnocultural background/race If identify as LGBTQ2S+
Ipsos11 of 56

Online Harm in Journalism Detailed Tables
Total <30 30-39 40-49 50+ Male Female
BC/Territorie
s AB MB/SK ON QC ATL
All non-
white/BIPOC Asian (NET) White (NET) Yes No
A B C D E F G H I J K L M N O P Q R
Base: All respondents excluding students and those
fully retired from the media sector 1082 170 299 276 323 547 504 99* 96* 77* 405 343 47* 290 171 822 128 905
66 17 16 16 17 32 34 8 14 8 22 11 2 14 6 54 9 56
6% 10% 5% 6% 5% 6% 7% 8% 15% 10% 5% 3% 4% 5% 4% 7% 7% 6%E L KL L
7 0 1 3 3 5 2 0 2 1 3 1 0 2 2 6 1 6
1% - 0 1% 1% 1% 0 - 2% 1% 1% 0 - 1% 1% 1% 1% 1%
15 5 3 5 2 14 1 1 2 0 10 1 1 7 6 9 1 14
1% 3% 1% 2% 1% 3% 0 1% 2% - 2% 0 2% 2% 4% 1% 1% 2%E G L P
Threats or harassment online (social media, emails,
websites, etc)
Threats or harassment by phone
Threats or harassment in person
Proportions/Means: Columns Tested (5% risk level) - B/C/D/E - F/G - H/I/J/K/L/M - N/O/P - Q/R Overlap formulae used. * small base
q7a_top1. [SUMMARY - T1B (1)] In the past 12 months, how often have you experienced any of the following as a result of the work you do in the field of journalism or media?
Age Gender Region Ethnocultural background/race If identify as LGBTQ2S+
Ipsos11 of 56

Online Harm in Journalism Detailed Tables
Total <30 30-39 40-49 50+ Male Female
BC/Territorie
s AB MB/SK ON QC ATL
All non-
white/BIPOC Asian (NET) White (NET) Yes No
A B C D E F G H I J K L M N O P Q R
Base: All respondents excluding students and those
fully retired from the media sector 1082 170 299 276 323 547 504 99* 96* 77* 405 343 47* 290 171 822 128 905
220 45 68 63 44 110 109 26 29 24 85 50 4 57 34 165 30 186
20% 26% 23% 23% 14% 20% 22% 26% 30% 31% 21% 15% 9% 20% 20% 20% 23% 21%E E E LM LM LM LM
27 2 5 12 8 19 8 5 5 2 12 3 0 7 3 24 2 25
2% 1% 2% 4% 2% 3% 2% 5% 5% 3% 3% 1% - 2% 2% 3% 2% 3%L L L
51 6 13 18 13 39 9 6 8 2 25 8 2 20 14 36 1 49
5% 4% 4% 7% 4% 7% 2% 6% 8% 3% 6% 2% 4% 7% 8% 4% 1% 5%G L L P Q
Threats or harassment online (social media, emails,
websites, etc)
Threats or harassment by phone
Threats or harassment in person
Proportions/Means: Columns Tested (5% risk level) - B/C/D/E - F/G - H/I/J/K/L/M - N/O/P - Q/R Overlap formulae used. * small base
q7a_top2. [SUMMARY - T2B (1-2)] In the past 12 months, how often have you experienced any of the following as a result of the work you do in the field of journalism or media?
Age Gender Region Ethnocultural background/race If identify as LGBTQ2S+
Ipsos11 of 56

Online Harm in Journalism Detailed Tables
Total <30 30-39 40-49 50+ Male Female
BC/Territorie
s AB MB/SK ON QC ATL
All non-
white/BIPOC Asian (NET) White (NET) Yes No
A B C D E F G H I J K L M N O P Q R
Base: All respondents excluding students and those
fully retired from the media sector 1082 170 299 276 323 547 504 99* 96* 77* 405 343 47* 290 171 822 128 905
373 65 119 101 83 173 196 44 44 37 140 91 11 102 59 281 53 309
34% 38% 40% 37% 26% 32% 39% 44% 46% 48% 35% 27% 23% 35% 35% 34% 41% 34%E E E F LM KLM KLM L
62 13 8 22 19 37 25 10 8 7 24 10 2 17 6 49 6 55
6% 8% 3% 8% 6% 7% 5% 10% 8% 9% 6% 3% 4% 6% 4% 6% 5% 6%C C L L L L O
99 11 29 29 27 70 26 12 13 7 38 22 6 30 18 72 7 88
9% 6% 10% 11% 8% 13% 5% 12% 14% 9% 9% 6% 13% 10% 11% 9% 5% 10%G L
4 0 2 2 0 3 1 0 0 0 4 0 0 1 1 3 0 4
0 - 1% 1% - 1% 0 - - - 1% - - 0 1% 0 - 0
Proportions/Means: Columns Tested (5% risk level) - B/C/D/E - F/G - H/I/J/K/L/M - N/O/P - Q/R Overlap formulae used. * small base
Threats or harassment online (social media, emails,
websites, etc)
Threats or harassment by phone
Threats or harassment in person
Physically attacked
q7a_top3. [SUMMARY - T3B (1-3)] In the past 12 months, how often have you experienced any of the following as a result of the work you do in the field of journalism or media?
Age Gender Region Ethnocultural background/race If identify as LGBTQ2S+
Ipsos11 of 56

Online Harm in Journalism Detailed Tables
Total <30 30-39 40-49 50+ Male Female
BC/Territorie
s AB MB/SK ON QC ATL
All non-
white/BIPOC Asian (NET) White (NET) Yes No
A B C D E F G H I J K L M N O P Q R
Base: All respondents excluding students and those
fully retired from the media sector 1082 170 299 276 323 547 504 99* 96* 77* 405 343 47* 290 171 822 128 905
703 117 215 187 175 335 349 76 76 60 276 176 27 200 120 529 100 572
65% 69% 72% 68% 54% 61% 69% 77% 79% 78% 68% 51% 57% 69% 70% 64% 78% 63%E E E F LM KLM LM L R
299 57 83 76 78 138 153 42 38 35 107 57 14 85 46 224 38 250
28% 34% 28% 28% 24% 25% 30% 42% 40% 45% 26% 17% 30% 29% 27% 27% 30% 28%E KL KL KL L L
407 62 122 103 114 220 175 52 48 43 146 93 18 113 58 308 46 343
38% 36% 41% 37% 35% 40% 35% 53% 50% 56% 36% 27% 38% 39% 34% 37% 36% 38%KL KL KL L O
97 8 30 30 27 63 30 8 8 4 43 25 9 36 19 66 9 82
9% 5% 10% 11% 8% 12% 6% 8% 8% 5% 11% 7% 19% 12% 11% 8% 7% 9%B B G JL P
Proportions/Means: Columns Tested (5% risk level) - B/C/D/E - F/G - H/I/J/K/L/M - N/O/P - Q/R Overlap formulae used. * small base
Threats or harassment online (social media, emails,
websites, etc)
Threats or harassment by phone
Threats or harassment in person
Physically attacked
q7a_top5. [SUMMARY - T5B (1-5)] In the past 12 months, how often have you experienced any of the following as a result of the work you do in the field of journalism or media?
Age Gender Region Ethnocultural background/race If identify as LGBTQ2S+
Ipsos11 of 56

Online Harm in Journalism Detailed Tables
Total <30 30-39 40-49 50+ Male Female
BC/Territorie
s AB MB/SK ON QC ATL
All non-
white/BIPOC Asian (NET) White (NET) Yes No
A B C D E F G H I J K L M N O P Q R
Base: Did not mention none to all - excluding students
and those fully retired from the media sector 784 129 234 207 205 388 376 84* 84* 64* 299 209 32* 220 132 592 105 646
703 117 215 187 175 335 349 76 76 60 276 176 27 200 120 529 100 572
90% 91% 92% 90% 85% 86% 93% 90% 90% 94% 92% 84% 84% 91% 91% 89% 95% 89%E F L R
299 57 83 76 78 138 153 42 38 35 107 57 14 85 46 224 38 250
38% 44% 35% 37% 38% 36% 41% 50% 45% 55% 36% 27% 44% 39% 35% 38% 36% 39%KL L KL L
407 62 122 103 114 220 175 52 48 43 146 93 18 113 58 308 46 343
52% 48% 52% 50% 56% 57% 47% 62% 57% 67% 49% 44% 56% 51% 44% 52% 44% 53%G KL KL O
97 8 30 30 27 63 30 8 8 4 43 25 9 36 19 66 9 82
12% 6% 13% 14% 13% 16% 8% 10% 10% 6% 14% 12% 28% 16% 14% 11% 9% 13%B B B G HIJKL P
Proportions/Means: Columns Tested (5% risk level) - B/C/D/E - F/G - H/I/J/K/L/M - N/O/P - Q/R Overlap formulae used. * small base
Threats or harassment online (social media, emails,
websites, etc)
Threats or harassment by phone
Threats or harassment in person
Physically attacked
q7a_top5x. [SUMMARY - T5B (1-5)] In the past 12 months, how often have you experienced any of the following as a result of the work you do in the field of journalism or media?
Age Gender Region Ethnocultural background/race If identify as LGBTQ2S+
Ipsos11 of 56

Online Harm in Journalism Detailed Tables
Total <30 30-39 40-49 50+ Male Female
BC/Territorie
s AB MB/SK ON QC ATL
All non-
white/BIPOC Asian (NET) White (NET) Yes No
A B C D E F G H I J K L M N O P Q R
Base: All respondents excluding students and those
fully retired from the media sector 1082 170 299 276 323 547 504 99* 96* 77* 405 343 47* 290 171 822 128 905
795 133 230 204 221 382 394 71 80 64 304 239 29 209 128 612 101 660
73% 78% 77% 74% 68% 70% 78% 72% 83% 83% 75% 70% 62% 72% 75% 74% 79% 73%E E F LM LM M
111 11 29 37 31 65 41 11 6 6 44 30 7 30 15 83 10 93
10% 6% 10% 13% 10% 12% 8% 11% 6% 8% 11% 9% 15% 10% 9% 10% 8% 10%B G
8 0 2 3 3 4 4 1 0 1 4 0 2 4 3 4 1 7
1% - 1% 1% 1% 1% 1% 1% - 1% 1% - 4% 1% 2% 0 1% 1%L IL
168 26 38 32 68 96 65 16 10 6 53 74 9 47 25 123 16 145
16% 15% 13% 12% 21% 18% 13% 16% 10% 8% 13% 22% 19% 16% 15% 15% 13% 16%CD G IJK
1082 170 299 276 323 547 504 99 96 77 405 343 47 290 171 822 128 905
100% 100% 100% 100% 100% 100% 100% 100% 100% 100% 100% 100% 100% 100% 100% 100% 100% 100% Proportions/Means: Columns Tested (5% risk level) - B/C/D/E - F/G - H/I/J/K/L/M - N/O/P - Q/R Overlap formulae used. * small base
It has increased
It has stayed about the same
It has decreased
Don't know
Sigma
q7b_1. [Online harassment] Do you feel that the frequency of harassment has changed over the past 2 years?
Age Gender Region Ethnocultural background/race If identify as LGBTQ2S+
Ipsos11 of 56
Online Harm in Journalism Detailed Tables
Total <30 30-39 40-49 50+ Male Female
BC/Territorie
s AB MB/SK ON QC ATL
All non-
white/BIPOC Asian (NET) White (NET) Yes No
A B C D E F G H I J K L M N O P Q R
Base: All respondents excluding students and those
fully retired from the media sector 1082 170 299 276 323 547 504 99* 96* 77* 405 343 47* 290 171 822 128 905
194 41 44 54 54 103 86 18 22 20 74 50 7 55 31 148 19 166
18% 24% 15% 20% 17% 19% 17% 18% 23% 26% 18% 15% 15% 19% 18% 18% 15% 18%CE L
248 37 65 66 75 136 104 31 27 19 89 67 10 63 30 195 29 208
23% 22% 22% 24% 23% 25% 21% 31% 28% 25% 22% 20% 21% 22% 18% 24% 23% 23%L O
73 3 23 22 24 31 40 5 7 9 32 16 4 24 13 52 8 62
7% 2% 8% 8% 7% 6% 8% 5% 7% 12% 8% 5% 9% 8% 8% 6% 6% 7%B B B L
567 89 167 134 170 277 274 45 40 29 210 210 26 148 97 427 72 469
52% 52% 56% 49% 53% 51% 54% 45% 42% 38% 52% 61% 55% 51% 57% 52% 56% 52%J HIJK N
1082 170 299 276 323 547 504 99 96 77 405 343 47 290 171 822 128 905
100% 100% 100% 100% 100% 100% 100% 100% 100% 100% 100% 100% 100% 100% 100% 100% 100% 100% Proportions/Means: Columns Tested (5% risk level) - B/C/D/E - F/G - H/I/J/K/L/M - N/O/P - Q/R Overlap formulae used. * small base
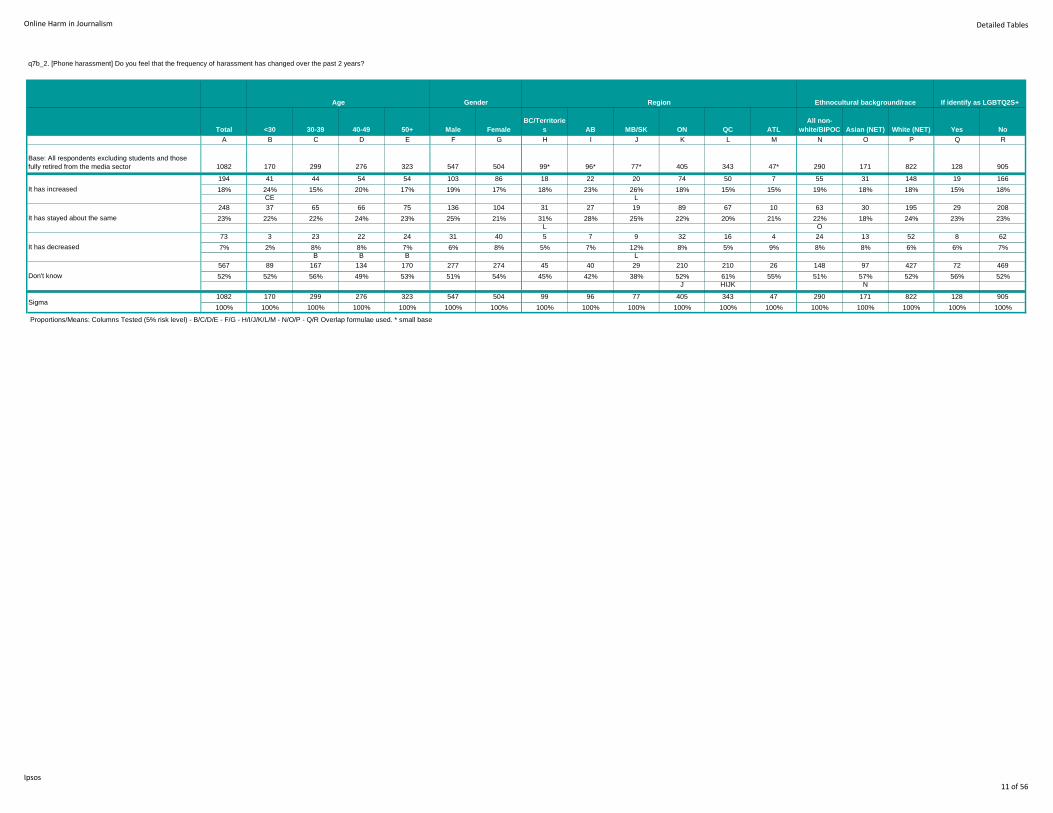
It has increased
It has stayed about the same
It has decreased
Don't know
Sigma
q7b_2. [Phone harassment] Do you feel that the frequency of harassment has changed over the past 2 years?
Age Gender Region Ethnocultural background/race If identify as LGBTQ2S+
Ipsos11 of 56

Online Harm in Journalism Detailed Tables
Total <30 30-39 40-49 50+ Male Female
BC/Territorie
s AB MB/SK ON QC ATL
All non-
white/BIPOC Asian (NET) White (NET) Yes No
A B C D E F G H I J K L M N O P Q R
Base: All respondents excluding students and those
fully retired from the media sector 1082 170 299 276 323 547 504 99* 96* 77* 405 343 47* 290 171 822 128 905
459 79 122 119 134 254 191 48 53 38 161 134 22 114 69 358 58 383
42% 46% 41% 43% 41% 46% 38% 48% 55% 49% 40% 39% 47% 39% 40% 44% 45% 42%G KL
185 25 58 43 54 98 83 19 21 17 70 50 2 51 24 142 14 163
17% 15% 19% 16% 17% 18% 16% 19% 22% 22% 17% 15% 4% 18% 14% 17% 11% 18%M M M M Q
29 3 6 10 10 11 18 2 0 3 14 6 4 11 5 18 2 25
3% 2% 2% 4% 3% 2% 4% 2% - 4% 3% 2% 9% 4% 3% 2% 2% 3%IL
409 63 113 104 125 184 212 30 22 19 160 153 19 114 73 304 54 334
38% 37% 38% 38% 39% 34% 42% 30% 23% 25% 40% 45% 40% 39% 43% 37% 42% 37%F IJ HIJ I
1082 170 299 276 323 547 504 99 96 77 405 343 47 290 171 822 128 905
100% 100% 100% 100% 100% 100% 100% 100% 100% 100% 100% 100% 100% 100% 100% 100% 100% 100% Proportions/Means: Columns Tested (5% risk level) - B/C/D/E - F/G - H/I/J/K/L/M - N/O/P - Q/R Overlap formulae used. * small base
It has increased
It has stayed about the same
It has decreased
Don't know
Sigma
q7b_3. [In person harassment] Do you feel that the frequency of harassment has changed over the past 2 years?
Age Gender Region Ethnocultural background/race If identify as LGBTQ2S+
Ipsos11 of 56

Online Harm in Journalism Detailed Tables
Total <30 30-39 40-49 50+ Male Female
BC/Territorie
s AB MB/SK ON QC ATL
All non-
white/BIPOC Asian (NET) White (NET) Yes No
A B C D E F G H I J K L M N O P Q R
Base: All respondents excluding students and those
fully retired from the media sector 1082 170 299 276 323 547 504 99* 96* 77* 405 343 47* 290 171 822 128 905
268 42 73 72 78 137 121 26 28 18 92 92 10 75 47 201 31 226
25% 25% 24% 26% 24% 25% 24% 26% 29% 23% 23% 27% 21% 26% 27% 24% 24% 25%
199 33 52 52 57 110 83 21 23 13 69 61 8 53 28 157 19 170
18% 19% 17% 19% 18% 20% 16% 21% 24% 17% 17% 18% 17% 18% 16% 19% 15% 19%
13 0 2 5 6 6 7 2 0 1 7 1 2 7 2 7 1 12
1% - 1% 2% 2% 1% 1% 2% - 1% 2% 0 4% 2% 1% 1% 1% 1%IL P
602 95 172 147 182 294 293 50 45 45 237 189 27 155 94 457 77 497
56% 56% 58% 53% 56% 54% 58% 51% 47% 58% 59% 55% 57% 53% 55% 56% 60% 55%I
1082 170 299 276 323 547 504 99 96 77 405 343 47 290 171 822 128 905
100% 100% 100% 100% 100% 100% 100% 100% 100% 100% 100% 100% 100% 100% 100% 100% 100% 100% Proportions/Means: Columns Tested (5% risk level) - B/C/D/E - F/G - H/I/J/K/L/M - N/O/P - Q/R Overlap formulae used. * small base
It has increased
It has stayed about the same
It has decreased
Don't know
Sigma
q7b_4. [Physical attacks] Do you feel that the frequency of harassment has changed over the past 2 years?
Age Gender Region Ethnocultural background/race If identify as LGBTQ2S+
Ipsos11 of 56

Online Harm in Journalism Detailed Tables
Total <30 30-39 40-49 50+ Male Female
BC/Territorie
s AB MB/SK ON QC ATL
All non-
white/BIPOC Asian (NET) White (NET) Yes No
A B C D E F G H I J K L M N O P Q R
Base: All respondents excluding students and those
fully retired from the media sector 1082 170 299 276 323 547 504 99* 96* 77* 405 343 47* 290 171 822 128 905
795 133 230 204 221 382 394 71 80 64 304 239 29 209 128 612 101 660
73% 78% 77% 74% 68% 70% 78% 72% 83% 83% 75% 70% 62% 72% 75% 74% 79% 73%E E F LM LM M
194 41 44 54 54 103 86 18 22 20 74 50 7 55 31 148 19 166
18% 24% 15% 20% 17% 19% 17% 18% 23% 26% 18% 15% 15% 19% 18% 18% 15% 18%CE L
459 79 122 119 134 254 191 48 53 38 161 134 22 114 69 358 58 383
42% 46% 41% 43% 41% 46% 38% 48% 55% 49% 40% 39% 47% 39% 40% 44% 45% 42%G KL
268 42 73 72 78 137 121 26 28 18 92 92 10 75 47 201 31 226
25% 25% 24% 26% 24% 25% 24% 26% 29% 23% 23% 27% 21% 26% 27% 24% 24% 25%
Proportions/Means: Columns Tested (5% risk level) - B/C/D/E - F/G - H/I/J/K/L/M - N/O/P - Q/R Overlap formulae used. * small base
Online harassment
Phone harassment
In person harassment
Physical attacks
q7b_top1. [SUMMARY - T1B (Increased)] Do you feel that the frequency of harassment has changed over the past 2 years?
Age Gender Region Ethnocultural background/race If identify as LGBTQ2S+
Ipsos11 of 56
Online Harm in Journalism Detailed Tables
Total <30 30-39 40-49 50+ Male Female
BC/Territorie
s AB MB/SK ON QC ATL
All non-
white/BIPOC Asian (NET) White (NET) Yes No
A B C D E F G H I J K L M N O P Q R
Base: Threatened or harassed online 703 117 215 187 175 335 349 76* 76* 60* 276 176 27** 200 120 529 100 572
175 35 49 46 42 92 78 16 12 16 74 48 9 59 27 126 32 134
25% 30% 23% 25% 24% 27% 22% 21% 16% 27% 27% 27% 33% 30% 23% 24% 32% 23%
I O
15 2 2 4 6 11 4 1 0 0 6 7 1 10 4 6 2 12
2% 2% 1% 2% 3% 3% 1% 1% - - 2% 4% 4% 5% 3% 1% 2% 2%
P
68 15 20 12 18 37 26 7 7 8 30 12 4 23 10 51 18 43
10% 13% 9% 6% 10% 11% 7% 9% 9% 13% 11% 7% 15% 12% 8% 10% 18% 8%
R
12 1 2 6 3 8 4 2 0 0 6 4 0 6 3 7 0 12
2% 1% 1% 3% 2% 2% 1% 3% - - 2% 2% - 3% 3% 1% - 2%
18 2 3 5 8 11 7 1 1 1 9 6 0 10 5 9 1 17
3% 2% 1% 3% 5% 3% 2% 1% 1% 2% 3% 3% - 5% 4% 2% 1% 3%
P
122 29 33 32 26 62 58 12 10 11 50 31 8 39 18 91 24 93
17% 25% 15% 17% 15% 19% 17% 16% 13% 18% 18% 18% 30% 20% 15% 17% 24% 16%
CE O
313 59 99 82 70 161 143 39 34 24 118 83 11 86 50 239 54 243
45% 50% 46% 44% 40% 48% 41% 51% 45% 40% 43% 47% 41% 43% 42% 45% 54% 42%
R
48 10 17 13 8 21 25 6 2 2 15 20 3 20 8 32 7 36
7% 9% 8% 7% 5% 6% 7% 8% 3% 3% 5% 11% 11% 10% 7% 6% 7% 6%
IK OP
214 47 78 48 38 112 97 25 25 20 83 51 6 51 28 167 42 161
30% 40% 36% 26% 22% 33% 28% 33% 33% 33% 30% 29% 22% 26% 23% 32% 42% 28%
DE DE R
91 25 36 20 9 46 43 10 11 8 39 21 1 22 9 74 19 67
13% 21% 17% 11% 5% 14% 12% 13% 14% 13% 14% 12% 4% 11% 8% 14% 19% 12%
DE E O O R
61 9 25 15 11 35 24 5 7 5 25 18 1 19 6 43 8 50
9% 8% 12% 8% 6% 10% 7% 7% 9% 8% 9% 10% 4% 10% 5% 8% 8% 9%
O
42 4 8 11 19 22 18 4 8 1 16 10 2 12 11 33 5 36
6% 3% 4% 6% 11% 7% 5% 5% 11% 2% 6% 6% 7% 6% 9% 6% 5% 6%
BC J N
8 1 2 4 1 3 5 2 0 1 2 3 0 2 1 7 0 8
1% 1% 1% 2% 1% 1% 1% 3% - 2% 1% 2% - 1% 1% 1% - 1%
5 0 1 3 1 5 0 0 0 0 2 2 1 2 1 3 0 5
1% - 0 2% 1% 1% - - - - 1% 1% 4% 1% 1% 1% - 1%
G
371 65 124 93 84 141 222 30 32 33 160 91 16 129 73 259 69 288
53% 56% 58% 50% 48% 42% 64% 39% 42% 55% 58% 52% 59% 65% 61% 49% 69% 50%
F HI P P R
69 15 20 22 12 36 32 8 6 5 31 16 3 21 9 50 10 55
10% 13% 9% 12% 7% 11% 9% 11% 8% 8% 11% 9% 11% 11% 8% 9% 10% 10%
70 8 20 19 22 33 36 9 6 5 29 18 3 20 7 50 9 59
10% 7% 9% 10% 13% 10% 10% 12% 8% 8% 11% 10% 11% 10% 6% 9% 9% 10%
O
165 35 66 35 27 40 118 16 17 16 73 30 7 44 24 128 51 105
23% 30% 31% 19% 15% 12% 34% 21% 22% 27% 26% 17% 26% 22% 20% 24% 51% 18%
DE DE F L R
124 22 40 32 28 53 68 10 3 6 65 32 2 86 48 44 23 96
18% 19% 19% 17% 16% 16% 19% 13% 4% 10% 24% 18% 7% 43% 40% 8% 23% 17%
I IJ I P P
33 4 11 7 11 12 19 4 4 2 16 4 3 8 3 27 2 30
5% 3% 5% 4% 6% 4% 5% 5% 5% 3% 6% 2% 11% 4% 3% 5% 2% 5%
26 4 9 6 7 10 16 1 4 1 6 12 1 7 4 21 4 21
4% 3% 4% 3% 4% 3% 5% 1% 5% 2% 2% 7% 4% 4% 3% 4% 4% 4%
K
19 1 5 6 7 9 10 0 0 1 9 6 3 5 5 15 2 17
3% 1% 2% 3% 4% 3% 3% - - 2% 3% 3% 11% 3% 4% 3% 2% 3%
10 2 4 2 1 0 10 1 1 1 3 1 3 1 0 9 0 10
1% 2% 2% 1% 1% - 3% 1% 1% 2% 1% 1% 11% 1% - 2% - 2%
F
240 53 87 48 48 80 158 22 27 25 106 48 7 69 39 180 44 187
34% 45% 40% 26% 27% 24% 45% 29% 36% 42% 38% 27% 26% 35% 33% 34% 44% 33%
DE DE F L L R
2 1 1 0 0 0 2 0 0 0 2 0 0 0 0 2 0 2
0 1% 0 - - - 1% - - - 1% - - - - 0 - 0
234 51 84 48 47 78 154 21 25 25 104 47 7 67 38 177 42 183
33% 44% 39% 26% 27% 23% 44% 28% 33% 42% 38% 27% 26% 34% 32% 33% 42% 32%
DE DE F L L
49 13 25 7 4 7 41 4 5 5 25 7 3 15 9 36 14 32
7% 11% 12% 4% 2% 2% 12% 5% 7% 8% 9% 4% 11% 8% 8% 7% 14% 6%
DE DE F L R
35 4 13 7 11 15 18 2 6 5 9 12 1 9 6 28 3 31
5% 3% 6% 4% 6% 4% 5% 3% 8% 8% 3% 7% 4% 5% 5% 5% 3% 5%
64 8 11 19 24 44 16 10 13 6 15 16 4 13 5 54 5 56
9% 7% 5% 10% 14% 13% 5% 13% 17% 10% 5% 9% 15% 7% 4% 10% 5% 10%
C G K K O
11 2 4 1 4 6 3 2 0 1 7 0 0 5 3 6 3 8
2% 2% 2% 1% 2% 2% 1% 3% - 2% 3% - - 3% 3% 1% 3% 1%
L L
1 0 0 1 0 0 1 0 0 0 1 0 0 1 1 0 0 1
0 - - 1% - - 0 - - - 0 - - 1% 1% - - 0
P
1616 315 540 385 353 716 855 163 161 136 678 386 67 518 266 1170 294 1246
230% 269% 251% 206% 202% 214% 245% 214% 212% 227% 246% 219% 248% 259% 222% 221% 294% 218%
No answer/blank
Sigma
Proportions/Means: Columns Tested (5% risk level) - B/C/D/E - F/G - H/I/J/K/L/M - N/O/P - Q/R Overlap formulae used. * small base; ** very small base (under 30) ineligible for sig testing
I received vulgar and/or sexualized messages or
images
I received threats of rape or sexual assault
Other
Nothing
Don't Know
Name calling/ insults/ personal attacks
Negative comments about my work/ profession
Questioning my skills/ competence/ reputation
SEXUAL HARM (NET)
I had sexually explicit photographs posted of me
online
My personal image was altered or manipulated
Someone impersonated my social media account
I received negative comments targeting my gender
identity and/or sexuality
I received negative comments targeting my
ethnic/national identity
Accusations of defamation/ fake news/ questioning
integrity/ credibility
Threats were made towards my family
Verbal threats/ negative comments in general
Threats to lose my job/ report my work
In-person threats
IDENTITY & REPUTATION HARM (NET)
Someone used my name and/or picture without my
permission
COERCION AND HARRASSMENT (NET)
Someone tried to blackmail me
I received physically threatening messages
I received death threats
PRIVACY AND SECURITY BASED HARM (NET)
My emails were intercepted
My identity or private information was exposed
without my consent
My data was stolen, including data stored in the
cloud
Someone intentionally planted a virus/spyware on
my computer
q8. As a journalist or media worker, have you personally experienced any of the following forms of online harassment in the past 12 months? Please select all that apply.
Age Gender Region Ethnocultural background/race If identify as LGBTQ2S+
Ipsos11 of 56

Online Harm in Journalism Detailed Tables
Total <30 30-39 40-49 50+ Male Female
BC/Territorie
s AB MB/SK ON QC ATL
All non-
white/BIPOC Asian (NET) White (NET) Yes No
A B C D E F G H I J K L M N O P Q R
Base: Threatened or harassed online 703 117 215 187 175 335 349 76* 76* 60* 276 176 27** 200 120 529 100 572
70 16 25 15 12 31 35 7 7 6 25 16 4 23 15 51 18 46
10% 14% 12% 8% 7% 9% 10% 9% 9% 10% 9% 9% 15% 12% 13% 10% 18% 8%R
411 78 145 95 88 191 212 51 46 33 156 103 14 113 66 308 64 328
58% 67% 67% 51% 50% 57% 61% 67% 61% 55% 57% 59% 52% 57% 55% 58% 64% 57%DE DE
32 7 7 8 8 17 15 3 4 3 8 11 2 5 4 27 5 27
5% 6% 3% 4% 5% 5% 4% 4% 5% 5% 3% 6% 7% 3% 3% 5% 5% 5%
155 37 60 33 25 77 73 14 18 13 69 29 9 53 32 113 34 114
22% 32% 28% 18% 14% 23% 21% 18% 24% 22% 25% 16% 33% 27% 27% 21% 34% 20%DE DE L R
329 65 119 81 60 132 193 37 40 38 127 67 12 83 43 251 51 267
47% 56% 55% 43% 34% 39% 55% 49% 53% 63% 46% 38% 44% 42% 36% 47% 51% 47%DE DE F L KL O O
163 27 46 47 42 80 79 9 13 15 52 68 3 54 28 118 23 131
23% 23% 21% 25% 24% 24% 23% 12% 17% 25% 19% 39% 11% 27% 23% 22% 23% 23%H HIK
181 28 61 48 44 80 95 21 17 22 55 56 9 37 21 145 19 156
26% 24% 28% 26% 25% 24% 27% 28% 22% 37% 20% 32% 33% 19% 18% 27% 19% 27%K K NO
64 20 27 12 5 20 42 4 10 13 27 10 0 21 11 44 8 52
9% 17% 13% 6% 3% 6% 12% 5% 13% 22% 10% 6% - 11% 9% 8% 8% 9%DE DE F L HKL
49 9 26 10 3 13 35 5 5 8 20 6 3 11 6 36 8 40
7% 8% 12% 5% 2% 4% 10% 7% 7% 13% 7% 3% 11% 6% 5% 7% 8% 7%E DE F L
44 4 13 15 11 26 17 4 1 3 21 13 2 18 8 28 4 37
6% 3% 6% 8% 6% 8% 5% 5% 1% 5% 8% 7% 7% 9% 7% 5% 4% 6%I P
236 55 76 57 48 103 125 27 26 21 92 60 6 66 46 173 48 180
34% 47% 35% 30% 27% 31% 36% 36% 34% 35% 33% 34% 22% 33% 38% 33% 48% 31%CDE R
62 6 11 23 19 36 23 9 7 6 25 12 3 24 13 45 5 54
9% 5% 5% 12% 11% 11% 7% 12% 9% 10% 9% 7% 11% 12% 11% 9% 5% 9%BC C
1796 352 616 444 365 806 944 191 194 181 677 451 67 508 293 1339 287 1432
255% 301% 287% 237% 209% 241% 270% 251% 255% 302% 245% 256% 248% 254% 244% 253% 287% 250%
Comment section on online news article
Other (specify)
Sigma Proportions/Means: Columns Tested (5% risk level) - B/C/D/E - F/G - H/I/J/K/L/M - N/O/P - Q/R Overlap formulae used. * small base; ** very small base (under 30) ineligible for sig testing
Personal Facebook account
Professional Facebook account
Personal Instagram account
Professional Instagram account
Other messaging platforms
Personal email
Professional email
Text message (SMS)
Personal Twitter account
Professional Twitter account
q9a. Did the online harassment you experienced in the past 12 months occur on any of the following platforms? Please select all that apply.
Age Gender Region Ethnocultural background/race If identify as LGBTQ2S+
Ipsos11 of 56
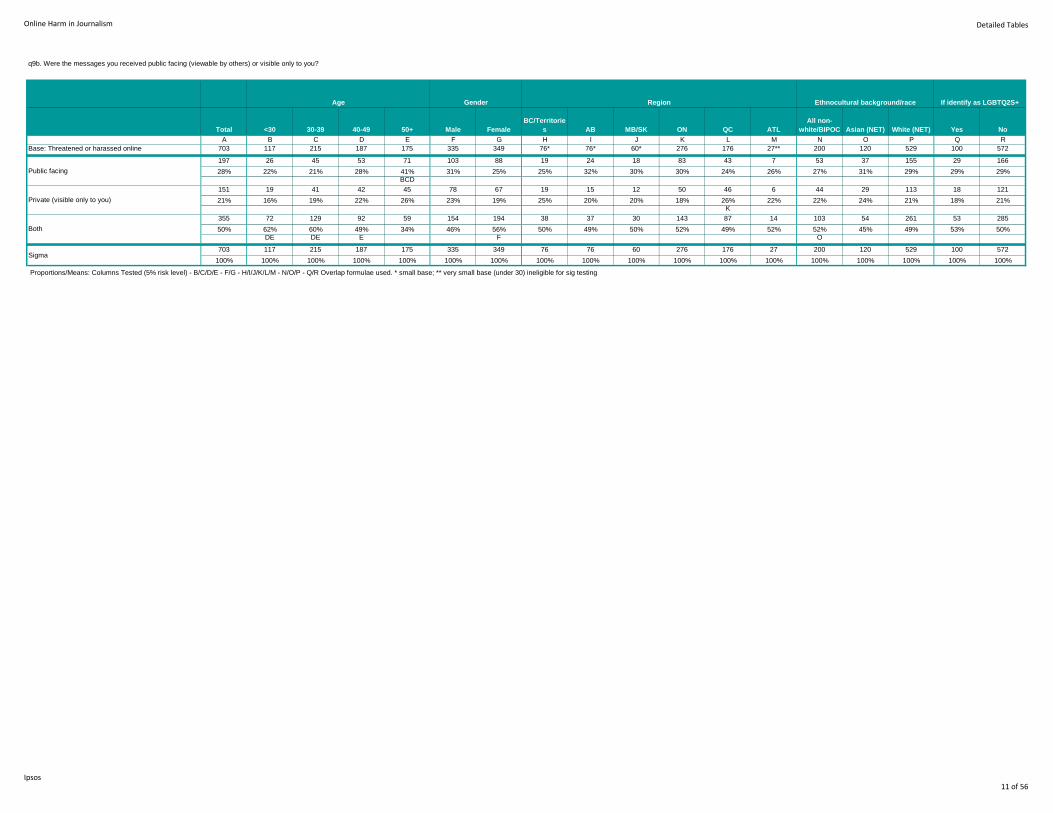
Online Harm in Journalism Detailed Tables
Total <30 30-39 40-49 50+ Male Female
BC/Territorie
s AB MB/SK ON QC ATL
All non-
white/BIPOC Asian (NET) White (NET) Yes No
A B C D E F G H I J K L M N O P Q R
Base: Threatened or harassed online 703 117 215 187 175 335 349 76* 76* 60* 276 176 27** 200 120 529 100 572
197 26 45 53 71 103 88 19 24 18 83 43 7 53 37 155 29 166
28% 22% 21% 28% 41% 31% 25% 25% 32% 30% 30% 24% 26% 27% 31% 29% 29% 29%BCD
151 19 41 42 45 78 67 19 15 12 50 46 6 44 29 113 18 121
21% 16% 19% 22% 26% 23% 19% 25% 20% 20% 18% 26% 22% 22% 24% 21% 18% 21%K
355 72 129 92 59 154 194 38 37 30 143 87 14 103 54 261 53 285
50% 62% 60% 49% 34% 46% 56% 50% 49% 50% 52% 49% 52% 52% 45% 49% 53% 50%DE DE E F O
703 117 215 187 175 335 349 76 76 60 276 176 27 200 120 529 100 572
100% 100% 100% 100% 100% 100% 100% 100% 100% 100% 100% 100% 100% 100% 100% 100% 100% 100%
Proportions/Means: Columns Tested (5% risk level) - B/C/D/E - F/G - H/I/J/K/L/M - N/O/P - Q/R Overlap formulae used. * small base; ** very small base (under 30) ineligible for sig testing
Public facing
Private (visible only to you)
Both
Sigma
q9b. Were the messages you received public facing (viewable by others) or visible only to you?
Age Gender Region Ethnocultural background/race If identify as LGBTQ2S+
Ipsos11 of 56

Online Harm in Journalism Detailed Tables
Total <30 30-39 40-49 50+ Male Female
BC/Territorie
s AB MB/SK ON QC ATL
All non-
white/BIPOC Asian (NET) White (NET) Yes No
A B C D E F G H I J K L M N O P Q R
Base: Threatened or harassed online 703 117 215 187 175 335 349 76* 76* 60* 276 176 27** 200 120 529 100 572
57 12 24 13 6 25 30 3 4 4 25 15 2 44 23 19 10 44
8% 10% 11% 7% 3% 7% 9% 4% 5% 7% 9% 9% 7% 22% 19% 4% 10% 8%E E P P
54 11 17 13 13 28 24 7 10 3 21 10 3 18 10 39 7 44
8% 9% 8% 7% 7% 8% 7% 9% 13% 5% 8% 6% 11% 9% 8% 7% 7% 8%L
28 7 8 5 7 7 20 3 2 2 14 6 0 18 8 11 6 21
4% 6% 4% 3% 4% 2% 6% 4% 3% 3% 5% 3% - 9% 7% 2% 6% 4%
F P P
74 30 19 4 19 27 46 9 8 5 29 16 6 23 11 58 18 52
11% 26% 9% 2% 11% 8% 13% 12% 11% 8% 11% 9% 22% 12% 9% 11% 18% 9%CDE D D F R
21 2 7 6 6 10 10 1 1 1 10 6 2 8 2 15 3 16
3% 2% 3% 3% 3% 3% 3% 1% 1% 2% 4% 3% 7% 4% 2% 3% 3% 3%O
94 21 26 20 24 38 54 9 4 6 47 20 3 75 38 28 21 68
13% 18% 12% 11% 14% 11% 15% 12% 5% 10% 17% 11% 11% 38% 32% 5% 21% 12%I OP P R
403 84 123 108 84 190 206 39 50 35 165 92 15 108 60 307 66 323
57% 72% 57% 58% 48% 57% 59% 51% 66% 58% 60% 52% 56% 54% 50% 58% 66% 56%CDE L
189 38 47 42 61 100 84 21 30 12 81 32 10 56 31 149 32 151
27% 32% 22% 22% 35% 30% 24% 28% 39% 20% 29% 18% 37% 28% 26% 28% 32% 26%C CD JL L
539 91 179 138 126 243 282 52 62 47 219 129 22 145 89 413 77 440
77% 78% 83% 74% 72% 73% 81% 68% 82% 78% 79% 73% 81% 73% 74% 78% 77% 77%DE F H
509 91 161 144 108 242 257 51 59 43 208 119 21 134 82 389 72 415
72% 78% 75% 77% 62% 72% 74% 67% 78% 72% 75% 68% 78% 67% 68% 74% 72% 73%
E E E
450 90 156 106 95 206 237 42 52 37 181 116 16 116 68 349 70 362
64% 77% 73% 57% 54% 61% 68% 55% 68% 62% 66% 66% 59% 58% 57% 66% 70% 63%DE DE NO
404 74 134 101 90 190 207 45 51 37 165 81 17 104 60 313 66 322
57% 63% 62% 54% 51% 57% 59% 59% 67% 62% 60% 46% 63% 52% 50% 59% 66% 56%E E L L L
384 71 131 96 85 191 187 33 51 31 144 110 12 93 58 311 54 317
55% 61% 61% 51% 49% 57% 54% 43% 67% 52% 52% 63% 44% 47% 48% 59% 54% 55%E E HK HK NO
119 33 42 24 20 16 98 16 17 11 52 16 4 34 19 96 34 80
17% 28% 20% 13% 11% 5% 28% 21% 22% 18% 19% 9% 15% 17% 16% 18% 34% 14%DE E F L L L R
57 21 20 8 8 21 32 5 5 7 20 14 4 12 6 47 29 24
8% 18% 9% 4% 5% 6% 9% 7% 7% 12% 7% 8% 15% 6% 5% 9% 29% 4%CDE D R
12 0 3 5 4 6 5 5 1 2 2 1 1 1 0 11 3 9
2% - 1% 3% 2% 2% 1% 7% 1% 3% 1% 1% 4% 1% - 2% 3% 2%KL
40 3 8 18 9 20 18 7 4 2 14 11 2 15 12 26 3 34
6% 3% 4% 10% 5% 6% 5% 9% 5% 3% 5% 6% 7% 8% 10% 5% 3% 6%BC P
3434 679 1105 851 765 1560 1797 348 411 285 1397 794 140 1004 577 2581 571 2722
488% 580% 514% 455% 437% 466% 515% 458% 541% 475% 506% 451% 519% 502% 481% 488% 571% 476%
I don't know which factor was targeted
Other (specify)
Sigma Proportions/Means: Columns Tested (5% risk level) - B/C/D/E - F/G - H/I/J/K/L/M - N/O/P - Q/R Overlap formulae used. * small base; ** very small base (under 30) ineligible for sig testing
The angle I took or the way I reported a story
The changing reputation of journalists
COVID-19/position on vaccination
My gender identity
My sexual identity
My ethnic or cultural background
The stories I cover
My political position or ideology
The current media climate, including accusations of 'fake
news'
The media organization for which I work
My nationality
The geographic area where I work
My religion
My age
A previous occupation
q10. Please identify which of the following factors have been targeted as part of the online harassment you experienced? Select all that apply.
Age Gender Region Ethnocultural background/race If identify as LGBTQ2S+
Ipsos11 of 56

Online Harm in Journalism Detailed Tables
Total <30 30-39 40-49 50+ Male Female
BC/Territorie
s AB MB/SK ON QC ATL
All non-
white/BIPOC Asian (NET) White (NET) Yes No
A B C D E F G H I J K L M N O P Q R
Base: Threatened or harassed online 703 117 215 187 175 335 349 76* 76* 60* 276 176 27** 200 120 529 100 572
80 14 18 23 23 33 43 5 8 8 31 24 3 23 16 58 11 62
11% 12% 8% 12% 13% 10% 12% 7% 11% 13% 11% 14% 11% 12% 13% 11% 11% 11%
220 26 66 61 67 124 90 26 21 18 101 41 8 73 44 163 37 175
31% 22% 31% 33% 38% 37% 26% 34% 28% 30% 37% 23% 30% 37% 37% 31% 37% 31%B G L
403 77 131 103 85 178 216 45 47 34 144 111 16 104 60 308 52 335
57% 66% 61% 55% 49% 53% 62% 59% 62% 57% 52% 63% 59% 52% 50% 58% 52% 59%E E F K
703 117 215 187 175 335 349 76 76 60 276 176 27 200 120 529 100 572
100% 100% 100% 100% 100% 100% 100% 100% 100% 100% 100% 100% 100% 100% 100% 100% 100% 100%
Proportions/Means: Columns Tested (5% risk level) - B/C/D/E - F/G - H/I/J/K/L/M - N/O/P - Q/R Overlap formulae used. * small base; ** very small base (under 30) ineligible for sig testing
Used their real name
Remained anonymous/used a nickname
Both
Sigma
q11. In general, did the person(s) who harassed you online use their real name or do they remain anonymous?
Age Gender Region Ethnocultural background/race If identify as LGBTQ2S+
Ipsos11 of 56

Online Harm in Journalism Detailed Tables
Total <30 30-39 40-49 50+ Male Female
BC/Territorie
s AB MB/SK ON QC ATL
All non-
white/BIPOC Asian (NET) White (NET) Yes No
A B C D E F G H I J K L M N O P Q R
Base: Threatened or harassed online 703 117 215 187 175 335 349 76* 76* 60* 276 176 27** 200 120 529 100 572
281 49 100 70 58 130 146 30 33 28 104 70 12 78 50 209 41 230
40% 42% 47% 37% 33% 39% 42% 39% 43% 47% 38% 40% 44% 39% 42% 40% 41% 40%E
59 12 25 14 6 27 31 5 10 5 17 20 2 15 9 49 10 47
8% 10% 12% 7% 3% 8% 9% 7% 13% 8% 6% 11% 7% 8% 8% 9% 10% 8%E E K K
162 35 67 29 30 63 96 13 19 15 64 40 7 44 22 126 30 127
23% 30% 31% 16% 17% 19% 28% 17% 25% 25% 23% 23% 26% 22% 18% 24% 30% 22%DE DE F
19 5 6 5 3 9 9 1 0 1 7 8 1 13 5 7 5 12
3% 4% 3% 3% 2% 3% 3% 1% - 2% 3% 5% 4% 7% 4% 1% 5% 2%P P
23 4 11 5 3 13 10 1 4 1 6 11 0 5 3 18 3 20
3% 3% 5% 3% 2% 4% 3% 1% 5% 2% 2% 6% - 3% 3% 3% 3% 3%K
7 0 0 3 4 5 2 1 0 0 5 1 0 4 2 5 1 6
1% - - 2% 2% 1% 1% 1% - - 2% 1% - 2% 2% 1% 1% 1%C
27 4 3 4 14 12 13 2 3 4 10 7 1 13 6 15 4 21
4% 3% 1% 2% 8% 4% 4% 3% 4% 7% 4% 4% 4% 7% 5% 3% 4% 4%CD P
322 50 87 98 84 163 148 41 31 27 129 77 11 87 55 249 45 261
46% 43% 40% 52% 48% 49% 42% 54% 41% 45% 47% 44% 41% 44% 46% 47% 45% 46%C
900 159 299 228 202 422 455 94 100 81 342 234 34 259 152 678 139 724
128% 136% 139% 122% 115% 126% 130% 124% 132% 135% 124% 133% 126% 130% 127% 128% 139% 127%
Proportions/Means: Columns Tested (5% risk level) - B/C/D/E - F/G - H/I/J/K/L/M - N/O/P - Q/R Overlap formulae used. * small base; ** very small base (under 30) ineligible for sig testing
Government or political representative
Other (specify)
No, I didn't report any acts of harassment
Sigma
Employer
Police
Social media platforms
Journalism associations/governing bodies
Unions
q12. Did you report the acts of online harassment and to whom? Select all that apply.
Age Gender Region Ethnocultural background/race If identify as LGBTQ2S+
Ipsos11 of 56

Online Harm in Journalism Detailed Tables
Total <30 30-39 40-49 50+ Male Female
BC/Territorie
s AB MB/SK ON QC ATL
All non-
white/BIPOC Asian (NET) White (NET) Yes No
A B C D E F G H I J K L M N O P Q R
Base: Threatened or harassed online and I didn't report
any acts of harassment 322 50* 87* 98* 84* 163 148 41* 31* 27** 129 77* 11** 87* 55* 249 45* 261
238 43 62 78 55 118 111 28 25 16 91 64 9 57 40 189 33 197
74% 86% 71% 80% 65% 72% 75% 68% 81% 59% 71% 83% 82% 66% 73% 76% 73% 75%E E K N
115 16 31 33 34 60 50 18 12 10 50 21 1 39 23 83 24 85
36% 32% 36% 34% 40% 37% 34% 44% 39% 37% 39% 27% 9% 45% 42% 33% 53% 33%P R
41 13 12 6 9 21 18 5 2 4 22 5 0 16 11 31 10 30
13% 26% 14% 6% 11% 13% 12% 12% 6% 15% 17% 6% - 18% 20% 12% 22% 11%DE L R
66 10 19 16 21 38 27 7 7 6 28 14 2 17 10 49 12 54
20% 20% 22% 16% 25% 23% 18% 17% 23% 22% 22% 18% 18% 20% 18% 20% 27% 21%
32 8 7 10 6 15 15 5 2 2 14 8 0 17 10 17 10 18
10% 16% 8% 10% 7% 9% 10% 12% 6% 7% 11% 10% - 20% 18% 7% 22% 7%P P R
13 3 4 3 3 6 7 5 0 1 4 2 0 6 5 9 4 7
4% 6% 5% 3% 4% 4% 5% 12% - 4% 3% 3% - 7% 9% 4% 9% 3%IKL R
11 3 3 2 3 4 5 2 1 3 2 1 0 4 3 8 4 5
3% 6% 3% 2% 4% 2% 3% 5% 3% 11% 2% 1% - 5% 5% 3% 9% 2%R
24 3 6 6 9 14 8 4 2 3 10 4 0 8 5 17 8 14
7% 6% 7% 6% 11% 9% 5% 10% 6% 11% 8% 5% - 9% 9% 7% 18% 5%R
7 0 2 1 4 4 3 2 0 0 5 0 0 4 1 4 1 5
2% - 2% 1% 5% 2% 2% 5% - - 4% - - 5% 2% 2% 2% 2%
27 3 8 8 7 11 15 3 3 4 12 3 2 7 6 20 4 20
8% 6% 9% 8% 8% 7% 10% 7% 10% 15% 9% 4% 18% 8% 11% 8% 9% 8%
574 102 154 163 151 291 259 79 54 49 238 122 14 175 114 427 110 435
178% 204% 177% 166% 180% 179% 175% 193% 174% 181% 184% 158% 127% 201% 207% 171% 244% 167%Sigma Proportions/Means: Columns Tested (5% risk level) - B/C/D/E - F/G - H/I/J/K/L/M - N/O/P - Q/R Overlap formulae used. * small base; ** very small base (under 30) ineligible for sig testing
I thought I would be labelled a troublemaker
I thought it would limit my career advancement
I worried it would only make things worse with my
harasser
Colleagues had negative experiences after they made a
report
Other (specify)
I did not feel it was serious enough to report
I did not believe anything would be done if I did report
I did not know who to report it to
Reporting it would have taken too much time and/or
effort
I felt uncomfortable making a report
q13. Thinking about the online harassment you experienced but did not report, please indicate the reason(s) for not reporting the situation(s).
Age Gender Region Ethnocultural background/race If identify as LGBTQ2S+
Ipsos11 of 56

Online Harm in Journalism Detailed Tables
Total <30 30-39 40-49 50+ Male Female
BC/Territorie
s AB MB/SK ON QC ATL
All non-
white/BIPOC Asian (NET) White (NET) Yes No
A B C D E F G H I J K L M N O P Q R
Base: Threatened or harassed online 703 117 215 187 175 335 349 76* 76* 60* 276 176 27** 200 120 529 100 572
183 27 79 43 32 77 101 18 19 10 78 51 4 58 27 129 24 150
26% 23% 37% 23% 18% 23% 29% 24% 25% 17% 28% 29% 15% 29% 23% 24% 24% 26%BDE O
229 49 82 57 39 89 134 28 31 31 86 37 12 56 25 181 41 177
33% 42% 38% 30% 22% 27% 38% 37% 41% 52% 31% 21% 44% 28% 21% 34% 41% 31%DE E F L L KL L O O R
260 42 88 67 60 107 148 30 37 28 105 42 12 74 39 200 40 207
37% 36% 41% 36% 34% 32% 42% 39% 49% 47% 38% 24% 44% 37% 33% 38% 40% 36%F L L L L
65 21 23 15 5 22 40 6 8 9 23 17 2 22 13 47 16 45
9% 18% 11% 8% 3% 7% 11% 8% 11% 15% 8% 10% 7% 11% 11% 9% 16% 8%DE E E F R
75 17 33 16 9 24 49 11 14 6 30 10 3 24 12 55 11 61
11% 15% 15% 9% 5% 7% 14% 14% 18% 10% 11% 6% 11% 12% 10% 10% 11% 11%E DE F L L
39 11 19 7 2 17 20 2 4 2 7 21 3 14 8 25 7 29
6% 9% 9% 4% 1% 5% 6% 3% 5% 3% 3% 12% 11% 7% 7% 5% 7% 5%DE DE HK
181 30 61 45 41 74 103 23 19 20 69 37 9 57 23 130 35 135
26% 26% 28% 24% 23% 22% 30% 30% 25% 33% 25% 21% 33% 29% 19% 25% 35% 24%F O R
208 40 81 49 36 75 128 21 17 17 86 54 8 69 32 149 37 163
30% 34% 38% 26% 21% 22% 37% 28% 22% 28% 31% 31% 30% 35% 27% 28% 37% 28%E DE F O
96 22 34 24 14 42 50 5 14 11 37 21 7 26 12 71 19 71
14% 19% 16% 13% 8% 13% 14% 7% 18% 18% 13% 12% 26% 13% 10% 13% 19% 12%E E H H
139 22 56 35 24 68 67 15 19 11 54 33 6 49 24 98 29 105
20% 19% 26% 19% 14% 20% 19% 20% 25% 18% 20% 19% 22% 25% 20% 19% 29% 18%E R
103 13 41 29 19 56 44 7 15 8 43 26 4 37 18 71 22 76
15% 11% 19% 16% 11% 17% 13% 9% 20% 13% 16% 15% 15% 19% 15% 13% 22% 13%E R
61 11 21 17 11 20 40 5 6 7 21 16 5 20 7 43 8 50
9% 9% 10% 9% 6% 6% 11% 7% 8% 12% 8% 9% 19% 10% 6% 8% 8% 9%F O
169 41 66 33 27 74 89 28 20 24 61 25 7 57 28 119 40 121
24% 35% 31% 18% 15% 22% 26% 37% 26% 40% 22% 14% 26% 29% 23% 22% 40% 21%DE DE KL L KL L O R
146 27 51 36 31 52 91 17 12 17 62 28 7 46 25 103 25 112
21% 23% 24% 19% 18% 16% 26% 22% 16% 28% 22% 16% 26% 23% 21% 19% 25% 20%F L
52 14 22 8 6 18 32 6 10 8 15 7 4 19 6 34 17 29
7% 12% 10% 4% 3% 5% 9% 8% 13% 13% 5% 4% 15% 10% 5% 6% 17% 5%DE DE KL KL O R
54 10 13 18 11 21 30 7 14 0 22 8 2 19 15 39 6 41
8% 9% 6% 10% 6% 6% 9% 9% 18% - 8% 5% 7% 10% 13% 7% 6% 7%J JKL J
142 20 39 41 41 81 56 16 12 14 51 43 3 29 23 113 13 124
20% 17% 18% 22% 23% 24% 16% 21% 16% 23% 18% 24% 11% 15% 19% 21% 13% 22%G N N Q
2202 417 809 540 408 917 1222 245 271 223 850 476 98 676 337 1607 390 1696
313% 356% 376% 289% 233% 274% 350% 322% 357% 372% 308% 270% 363% 338% 281% 304% 390% 297%
Other (specify)
I haven't experienced any issues due to online
harassment
Sigma Proportions/Means: Columns Tested (5% risk level) - B/C/D/E - F/G - H/I/J/K/L/M - N/O/P - Q/R Overlap formulae used. * small base; ** very small base (under 30) ineligible for sig testing
Feeling scared for the safety of your family and friends
Repeated, disturbing dreams of the stressful experience
Struggling with mental health issues
Experiencing strong negative beliefs about yourself or
other people
Taken a greater number of sick days than usual
Requested a re-assignment to cover a different topic
Had trouble sleeping
Experienced strong negative feelings such as fear,
horror, anger, guilt or shame
Feeling jumpy or easily startled
Feeling scared for your physical safety
Avoided certain stories
Thought about leaving journalism/changing career
Have deleted or taken a break from my social media
profile/account
Changed my profile picture/name
Considered requesting re-assignment to cover a different
topic
q14a. As a result of being harassed online, are you experiencing or have you experienced any of the following? Please select all that apply.
Age Gender Region Ethnocultural background/race If identify as LGBTQ2S+
Ipsos11 of 56

Online Harm in Journalism Detailed Tables
Total <30 30-39 40-49 50+ Male Female
BC/Territorie
s AB MB/SK ON QC ATL
All non-
white/BIPOC Asian (NET) White (NET) Yes No
A B C D E F G H I J K L M N O P Q R
Base: Threatened or harassed online 703 117 215 187 175 335 349 76* 76* 60* 276 176 27** 200 120 529 100 572
34 4 15 9 3 21 11 5 4 1 13 9 2 8 4 26 4 26
5% 3% 7% 5% 2% 6% 3% 7% 5% 2% 5% 5% 7% 4% 3% 5% 4% 5%E
603 98 181 160 160 279 309 65 62 50 238 155 22 173 103 456 82 497
86% 84% 84% 86% 91% 83% 89% 86% 82% 83% 86% 88% 81% 87% 86% 86% 82% 87%BC F
66 15 19 18 12 35 29 6 10 9 25 12 3 19 13 47 14 49
9% 13% 9% 10% 7% 10% 8% 8% 13% 15% 9% 7% 11% 10% 11% 9% 14% 9%
703 117 215 187 175 335 349 76 76 60 276 176 27 200 120 529 100 572
100% 100% 100% 100% 100% 100% 100% 100% 100% 100% 100% 100% 100% 100% 100% 100% 100% 100%
Proportions/Means: Columns Tested (5% risk level) - B/C/D/E - F/G - H/I/J/K/L/M - N/O/P - Q/R Overlap formulae used. * small base; ** very small base (under 30) ineligible for sig testing
Yes
No
Don't know if they were related
Sigma
q14b. Did any of your experiences of online harassment lead to physical/in-person harassment?
Age Gender Region Ethnocultural background/race If identify as LGBTQ2S+
Ipsos11 of 56

Online Harm in Journalism Detailed Tables
Total <30 30-39 40-49 50+ Male Female
BC/Territorie
s AB MB/SK ON QC ATL
All non-
white/BIPOC Asian (NET) White (NET) Yes No
A B C D E F G H I J K L M N O P Q R
Base: Threatened or harassed online 703 117 215 187 175 335 349 76* 76* 60* 276 176 27** 200 120 529 100 572
40 9 11 10 10 18 21 1 5 2 20 7 3 15 8 25 7 31
6% 8% 5% 5% 6% 5% 6% 1% 7% 3% 7% 4% 11% 8% 7% 5% 7% 5%
126 17 35 40 33 57 67 10 14 7 53 28 9 38 24 93 21 98
18% 15% 16% 21% 19% 17% 19% 13% 18% 12% 19% 16% 33% 19% 20% 18% 21% 17%
102 16 37 24 24 42 58 14 15 9 38 16 6 34 13 73 24 72
15% 14% 17% 13% 14% 13% 17% 18% 20% 15% 14% 9% 22% 17% 11% 14% 24% 13%L L O R
21 2 7 6 6 14 7 2 2 0 8 9 0 7 3 17 4 17
3% 2% 3% 3% 3% 4% 2% 3% 3% - 3% 5% - 4% 3% 3% 4% 3%
53 6 23 14 8 24 29 3 11 2 23 13 1 10 4 45 10 42
8% 5% 11% 7% 5% 7% 8% 4% 14% 3% 8% 7% 4% 5% 3% 9% 10% 7%E HJ O
34 5 10 12 7 16 17 1 3 4 15 10 1 13 7 21 4 29
5% 4% 5% 6% 4% 5% 5% 1% 4% 7% 5% 6% 4% 7% 6% 4% 4% 5%
25 5 2 5 12 9 15 1 1 2 12 7 1 11 5 13 2 22
4% 4% 1% 3% 7% 3% 4% 1% 1% 3% 4% 4% 4% 6% 4% 2% 2% 4%C C P
451 79 142 119 106 220 216 54 46 42 163 125 15 119 75 348 58 374
64% 68% 66% 64% 61% 66% 62% 71% 61% 70% 59% 71% 56% 60% 63% 66% 58% 65%K
852 139 267 230 206 400 430 86 97 68 332 215 36 247 139 635 130 685
121% 119% 124% 123% 118% 119% 123% 113% 128% 113% 120% 122% 133% 124% 116% 120% 130% 120%
Proportions/Means: Columns Tested (5% risk level) - B/C/D/E - F/G - H/I/J/K/L/M - N/O/P - Q/R Overlap formulae used. * small base; ** very small base (under 30) ineligible for sig testing
Other online resources
Other (specify)
I didn't access any resources
Sigma
Journalist association resources (e.g. training, website,
support line, guides)
Employer's resources (e.g. training, website, employee
support line, guides)
Health professional (e.g. psychologists, doctors)
Legal professional
Police or security professional
q15. In the past 12 months, have you accessed any of the following resources to help deal with the issue of online harassment? Please select all that apply.
Age Gender Region Ethnocultural background/race If identify as LGBTQ2S+
Ipsos11 of 56

Online Harm in Journalism Detailed Tables
Total <30 30-39 40-49 50+ Male Female
BC/Territorie
s AB MB/SK ON QC ATL
All non-
white/BIPOC Asian (NET) White (NET) Yes No
A B C D E F G H I J K L M N O P Q R
Base: Threatened or harassed online and accessed
resources 40* 9** 11** 10** 10** 18** 21** 1** 5** 2** 20** 7** 3** 15** 8** 25** 7** 31*
4 1 1 2 0 2 2 0 0 0 3 1 0 3 2 2 0 4
10% 11% 9% 20% - 11% 10% - - - 15% 14% - 20% 25% 8% - 13%
12 4 3 3 2 6 6 0 0 1 6 4 0 5 3 7 2 10
30% 44% 27% 30% 20% 33% 29% - - 50% 30% 57% - 33% 38% 28% 29% 32%
11 3 2 2 4 4 7 0 5 1 4 0 1 2 0 8 1 9
28% 33% 18% 20% 40% 22% 33% - 100% 50% 20% - 33% 13% - 32% 14% 29%
5 0 1 1 3 3 2 1 0 0 1 1 1 1 0 4 2 3
13% - 9% 10% 30% 17% 10% 100% - - 5% 14% 33% 7% - 16% 29% 10%
7 1 3 2 1 3 3 0 0 0 5 1 1 3 2 4 2 4
18% 11% 27% 20% 10% 17% 14% - - - 25% 14% 33% 20% 25% 16% 29% 13%
1 0 1 0 0 0 1 0 0 0 1 0 0 1 1 0 0 1
3% - 9% - - - 5% - - - 5% - - 7% 13% - - 3%
40 9 11 10 10 18 21 1 5 2 20 7 3 15 8 25 7 31
100% 100% 100% 100% 100% 100% 100% 100% 100% 100% 100% 100% 100% 100% 100% 100% 100% 100%
Summary
16 5 4 5 2 8 8 0 0 1 9 5 0 8 5 9 2 14
40% 56% 36% 50% 20% 44% 38% - - 50% 45% 71% - 53% 63% 36% 29% 45%
12 1 4 3 4 6 5 1 0 0 6 2 2 4 2 8 4 7
30% 11% 36% 30% 40% 33% 24% 100% - - 30% 29% 67% 27% 25% 32% 57% 23%
Proportions/Means: Columns Tested (5% risk level) - B/C/D/E - F/G - H/I/J/K/L/M - N/O/P - Q/R Overlap formulae used. * small base; ** very small base (under 30) ineligible for sig testing
Don't Know
Sigma
T2B (4-5)
L2B (1-2)
(5) - Completely adequate
(4)
(3)
(2)
(1) - Not at all adequate
q16a_1. [Journalist association resources (e.g. training, website, support line, guides)] How adequate do you feel the existing resources at your disposal are when it comes to dealing with the issue of online harassment?
Age Gender Region Ethnocultural background/race If identify as LGBTQ2S+
Ipsos11 of 56

Online Harm in Journalism Detailed Tables
Total <30 30-39 40-49 50+ Male Female
BC/Territorie
s AB MB/SK ON QC ATL
All non-
white/BIPOC Asian (NET) White (NET) Yes No
A B C D E F G H I J K L M N O P Q R
Base: Threatened or harassed online and accessed
resources 126 17** 35* 40* 33* 57* 67* 10** 14** 7** 53* 28** 9** 38* 24** 93* 21** 98*
19 3 3 6 6 10 9 1 3 0 10 4 0 9 4 10 4 15
15% 18% 9% 15% 18% 18% 13% 10% 21% - 19% 14% - 24% 17% 11% 19% 15%P
37 4 11 10 12 17 19 5 5 3 13 8 1 11 10 29 5 31
29% 24% 31% 25% 36% 30% 28% 50% 36% 43% 25% 29% 11% 29% 42% 31% 24% 32%
28 4 7 13 4 14 14 2 1 2 15 6 2 7 5 21 3 21
22% 24% 20% 33% 12% 25% 21% 20% 7% 29% 28% 21% 22% 18% 21% 23% 14% 21%E
20 4 5 6 5 7 13 1 3 2 7 4 1 4 1 17 3 16
16% 24% 14% 15% 15% 12% 19% 10% 21% 29% 13% 14% 11% 11% 4% 18% 14% 16%
16 1 8 3 4 6 9 1 2 0 5 4 4 4 2 12 5 10
13% 6% 23% 8% 12% 11% 13% 10% 14% - 9% 14% 44% 11% 8% 13% 24% 10%
6 1 1 2 2 3 3 0 0 0 3 2 1 3 2 4 1 5
5% 6% 3% 5% 6% 5% 4% - - - 6% 7% 11% 8% 8% 4% 5% 5%
126 17 35 40 33 57 67 10 14 7 53 28 9 38 24 93 21 98
100% 100% 100% 100% 100% 100% 100% 100% 100% 100% 100% 100% 100% 100% 100% 100% 100% 100%
Summary
56 7 14 16 18 27 28 6 8 3 23 12 1 20 14 39 9 46
44% 41% 40% 40% 55% 47% 42% 60% 57% 43% 43% 43% 11% 53% 58% 42% 43% 47%
36 5 13 9 9 13 22 2 5 2 12 8 5 8 3 29 8 26
29% 29% 37% 23% 27% 23% 33% 20% 36% 29% 23% 29% 56% 21% 13% 31% 38% 27%
Proportions/Means: Columns Tested (5% risk level) - B/C/D/E - F/G - H/I/J/K/L/M - N/O/P - Q/R Overlap formulae used. * small base; ** very small base (under 30) ineligible for sig testing
Don't Know
Sigma
T2B (4-5)
L2B (1-2)
(5) - Completely adequate
(4)
(3)
(2)
(1) - Not at all adequate
q16a_2. [Employer's resources (e.g. training, website, employee support line, guides)] How adequate do you feel the existing resources at your disposal are when it comes to dealing with the issue of online harassment?
Age Gender Region Ethnocultural background/race If identify as LGBTQ2S+
Ipsos11 of 56
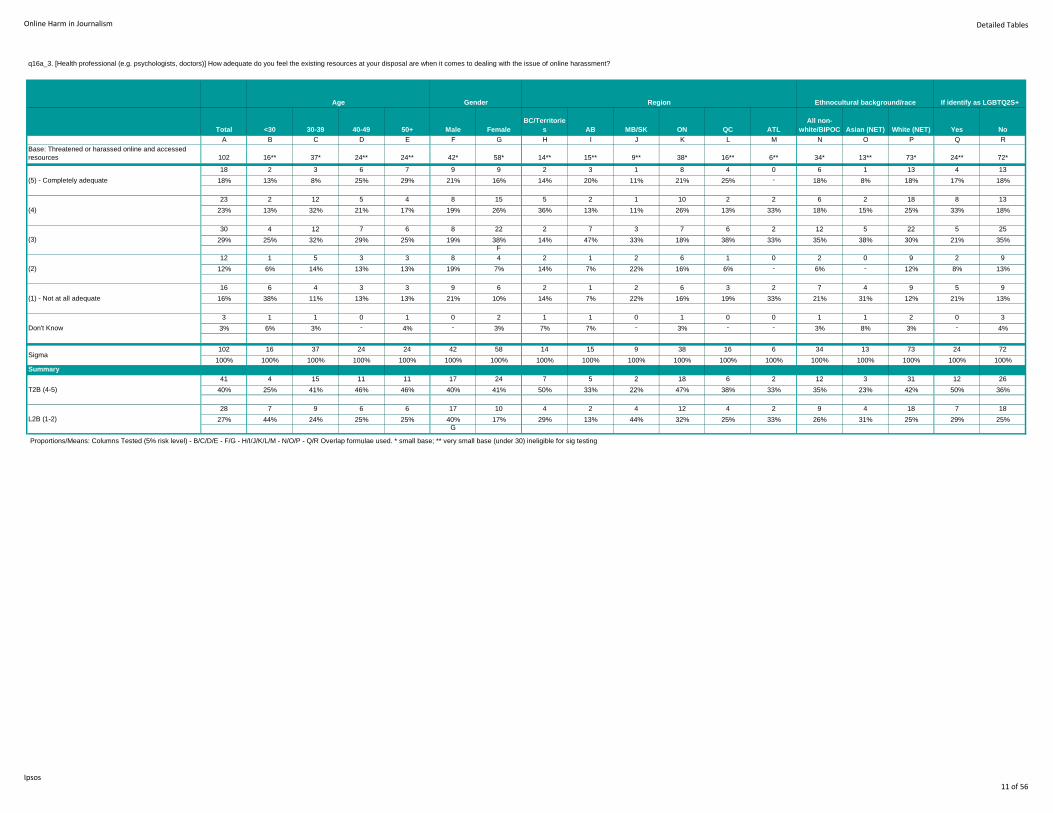
Online Harm in Journalism Detailed Tables
Total <30 30-39 40-49 50+ Male Female
BC/Territorie
s AB MB/SK ON QC ATL
All non-
white/BIPOC Asian (NET) White (NET) Yes No
A B C D E F G H I J K L M N O P Q R
Base: Threatened or harassed online and accessed
resources 102 16** 37* 24** 24** 42* 58* 14** 15** 9** 38* 16** 6** 34* 13** 73* 24** 72*
18 2 3 6 7 9 9 2 3 1 8 4 0 6 1 13 4 13
18% 13% 8% 25% 29% 21% 16% 14% 20% 11% 21% 25% - 18% 8% 18% 17% 18%
23 2 12 5 4 8 15 5 2 1 10 2 2 6 2 18 8 13
23% 13% 32% 21% 17% 19% 26% 36% 13% 11% 26% 13% 33% 18% 15% 25% 33% 18%
30 4 12 7 6 8 22 2 7 3 7 6 2 12 5 22 5 25
29% 25% 32% 29% 25% 19% 38% 14% 47% 33% 18% 38% 33% 35% 38% 30% 21% 35%F
12 1 5 3 3 8 4 2 1 2 6 1 0 2 0 9 2 9
12% 6% 14% 13% 13% 19% 7% 14% 7% 22% 16% 6% - 6% - 12% 8% 13%
16 6 4 3 3 9 6 2 1 2 6 3 2 7 4 9 5 9
16% 38% 11% 13% 13% 21% 10% 14% 7% 22% 16% 19% 33% 21% 31% 12% 21% 13%
3 1 1 0 1 0 2 1 1 0 1 0 0 1 1 2 0 3
3% 6% 3% - 4% - 3% 7% 7% - 3% - - 3% 8% 3% - 4%
102 16 37 24 24 42 58 14 15 9 38 16 6 34 13 73 24 72
100% 100% 100% 100% 100% 100% 100% 100% 100% 100% 100% 100% 100% 100% 100% 100% 100% 100%
Summary
41 4 15 11 11 17 24 7 5 2 18 6 2 12 3 31 12 26
40% 25% 41% 46% 46% 40% 41% 50% 33% 22% 47% 38% 33% 35% 23% 42% 50% 36%
28 7 9 6 6 17 10 4 2 4 12 4 2 9 4 18 7 18
27% 44% 24% 25% 25% 40% 17% 29% 13% 44% 32% 25% 33% 26% 31% 25% 29% 25%G
Proportions/Means: Columns Tested (5% risk level) - B/C/D/E - F/G - H/I/J/K/L/M - N/O/P - Q/R Overlap formulae used. * small base; ** very small base (under 30) ineligible for sig testing
Don't Know
Sigma
T2B (4-5)
L2B (1-2)
(5) - Completely adequate
(4)
(3)
(2)
(1) - Not at all adequate
q16a_3. [Health professional (e.g. psychologists, doctors)] How adequate do you feel the existing resources at your disposal are when it comes to dealing with the issue of online harassment?
Age Gender Region Ethnocultural background/race If identify as LGBTQ2S+
Ipsos11 of 56

Online Harm in Journalism Detailed Tables
Total <30 30-39 40-49 50+ Male Female
BC/Territorie
s AB MB/SK ON QC ATL
All non-
white/BIPOC Asian (NET) White (NET) Yes No
A B C D E F G H I J K L M N O P Q R
Base: Threatened or harassed online and accessed
resources 21* 2** 7** 6** 6** 14** 7** 2** 2** -** 8** 9** -** 7** 3** 17** 4** 17**
3 1 0 1 1 2 1 0 0 0 1 2 0 1 0 2 2 1
14% 50% - 17% 17% 14% 14% - - - 13% 22% - 14% - 12% 50% 6%
3 0 1 1 1 1 2 0 0 0 1 2 0 0 0 3 0 3
14% - 14% 17% 17% 7% 29% - - - 13% 22% - - - 18% - 18%
5 0 2 1 2 3 2 1 1 0 3 0 0 2 1 5 0 5
24% - 29% 17% 33% 21% 29% 50% 50% - 38% - - 29% 33% 29% - 29%
4 0 2 2 0 2 2 1 0 0 0 3 0 3 1 2 0 4
19% - 29% 33% - 14% 29% 50% - - - 33% - 43% 33% 12% - 24%
5 1 2 1 1 5 0 0 1 0 2 2 0 1 1 4 2 3
24% 50% 29% 17% 17% 36% - - 50% - 25% 22% - 14% 33% 24% 50% 18%
1 0 0 0 1 1 0 0 0 0 1 0 0 0 0 1 0 1
5% - - - 17% 7% - - - - 13% - - - - 6% - 6%
21 2 7 6 6 14 7 2 2 0 8 9 0 7 3 17 4 17
100% 100% 100% 100% 100% 100% 100% 100% 100% - 100% 100% - 100% 100% 100% 100% 100%
Summary
6 1 1 2 2 3 3 0 0 0 2 4 0 1 0 5 2 4
29% 50% 14% 33% 33% 21% 43% - - - 25% 44% - 14% - 29% 50% 24%
9 1 4 3 1 7 2 1 1 0 2 5 0 4 2 6 2 7
43% 50% 57% 50% 17% 50% 29% 50% 50% - 25% 56% - 57% 67% 35% 50% 41%
Proportions/Means: Columns Tested (5% risk level) - B/C/D/E - F/G - H/I/J/K/L/M - N/O/P - Q/R Overlap formulae used. * small base; ** very small base (under 30) ineligible for sig testing
Don't Know
Sigma
T2B (4-5)
L2B (1-2)
(5) - Completely adequate
(4)
(3)
(2)
(1) - Not at all adequate
q16a_4. [Legal professional] How adequate do you feel the existing resources at your disposal are when it comes to dealing with the issue of online harassment?
Age Gender Region Ethnocultural background/race If identify as LGBTQ2S+
Ipsos11 of 56

Online Harm in Journalism Detailed Tables
Total <30 30-39 40-49 50+ Male Female
BC/Territorie
s AB MB/SK ON QC ATL
All non-
white/BIPOC Asian (NET) White (NET) Yes No
A B C D E F G H I J K L M N O P Q R
Base: Threatened or harassed online and accessed
resources 53* 6** 23** 14** 8** 24** 29** 3** 11** 2** 23** 13** 1** 10** 4** 45* 10** 42*
5 0 1 1 3 3 2 0 0 0 3 2 0 1 1 5 2 3
9% - 4% 7% 38% 13% 7% - - - 13% 15% - 10% 25% 11% 20% 7%
9 1 2 4 1 6 3 2 0 1 5 1 0 1 0 8 1 8
17% 17% 9% 29% 13% 25% 10% 67% - 50% 22% 8% - 10% - 18% 10% 19%
12 1 7 3 1 5 7 0 2 0 8 2 0 2 1 11 1 11
23% 17% 30% 21% 13% 21% 24% - 18% - 35% 15% - 20% 25% 24% 10% 26%
6 0 5 1 0 0 6 1 3 0 0 2 0 0 0 5 1 5
11% - 22% 7% - - 21% 33% 27% - - 15% - - - 11% 10% 12%
19 4 7 5 2 8 11 0 6 1 5 6 1 5 1 14 5 13
36% 67% 30% 36% 25% 33% 38% - 55% 50% 22% 46% 100% 50% 25% 31% 50% 31%
2 0 1 0 1 2 0 0 0 0 2 0 0 1 1 2 0 2
4% - 4% - 13% 8% - - - - 9% - - 10% 25% 4% - 5%
53 6 23 14 8 24 29 3 11 2 23 13 1 10 4 45 10 42
100% 100% 100% 100% 100% 100% 100% 100% 100% 100% 100% 100% 100% 100% 100% 100% 100% 100%
Summary
14 1 3 5 4 9 5 2 0 1 8 3 0 2 1 13 3 11
26% 17% 13% 36% 50% 38% 17% 67% - 50% 35% 23% - 20% 25% 29% 30% 26%
25 4 12 6 2 8 17 1 9 1 5 8 1 5 1 19 6 18
47% 67% 52% 43% 25% 33% 59% 33% 82% 50% 22% 62% 100% 50% 25% 42% 60% 43%
Proportions/Means: Columns Tested (5% risk level) - B/C/D/E - F/G - H/I/J/K/L/M - N/O/P - Q/R Overlap formulae used. * small base; ** very small base (under 30) ineligible for sig testing
Don't Know
Sigma
T2B (4-5)
L2B (1-2)
(5) - Completely adequate
(4)
(3)
(2)
(1) - Not at all adequate
q16a_5. [Police or security professional] How adequate do you feel the existing resources at your disposal are when it comes to dealing with the issue of online harassment?
Age Gender Region Ethnocultural background/race If identify as LGBTQ2S+
Ipsos11 of 56

Online Harm in Journalism Detailed Tables
Total <30 30-39 40-49 50+ Male Female
BC/Territorie
s AB MB/SK ON QC ATL
All non-
white/BIPOC Asian (NET) White (NET) Yes No
A B C D E F G H I J K L M N O P Q R
Base: Threatened or harassed online and accessed
resources 34* 5** 10** 12** 7** 16** 17** 1** 3** 4** 15** 10** 1** 13** 7** 21** 4** 29**
2 0 0 2 0 1 1 0 0 0 1 1 0 2 2 0 0 2
6% - - 17% - 6% 6% - - - 7% 10% - 15% 29% - - 7%
8 3 2 2 1 3 5 0 1 2 3 2 0 3 2 5 1 7
24% 60% 20% 17% 14% 19% 29% - 33% 50% 20% 20% - 23% 29% 24% 25% 24%
8 1 1 3 3 4 4 0 1 1 5 1 0 4 2 5 2 6
24% 20% 10% 25% 43% 25% 24% - 33% 25% 33% 10% - 31% 29% 24% 50% 21%
4 0 2 0 2 2 2 1 0 0 3 0 0 1 0 3 0 4
12% - 20% - 29% 13% 12% 100% - - 20% - - 8% - 14% - 14%
6 1 2 2 1 3 2 0 0 1 1 3 1 2 0 3 1 4
18% 20% 20% 17% 14% 19% 12% - - 25% 7% 30% 100% 15% - 14% 25% 14%
6 0 3 3 0 3 3 0 1 0 2 3 0 1 1 5 0 6
18% - 30% 25% - 19% 18% - 33% - 13% 30% - 8% 14% 24% - 21%
34 5 10 12 7 16 17 1 3 4 15 10 1 13 7 21 4 29
100% 100% 100% 100% 100% 100% 100% 100% 100% 100% 100% 100% 100% 100% 100% 100% 100% 100%
Summary
10 3 2 4 1 4 6 0 1 2 4 3 0 5 4 5 1 9
29% 60% 20% 33% 14% 25% 35% - 33% 50% 27% 30% - 38% 57% 24% 25% 31%
10 1 4 2 3 5 4 1 0 1 4 3 1 3 0 6 1 8
29% 20% 40% 17% 43% 31% 24% 100% - 25% 27% 30% 100% 23% - 29% 25% 28%
Proportions/Means: Columns Tested (5% risk level) - B/C/D/E - F/G - H/I/J/K/L/M - N/O/P - Q/R Overlap formulae used. * small base; ** very small base (under 30) ineligible for sig testing
Don't Know
Sigma
T2B (4-5)
L2B (1-2)
(5) - Completely adequate
(4)
(3)
(2)
(1) - Not at all adequate
q16a_6. [Other online resources] How adequate do you feel the existing resources at your disposal are when it comes to dealing with the issue of online harassment?
Age Gender Region Ethnocultural background/race If identify as LGBTQ2S+
Ipsos11 of 56

Online Harm in Journalism Detailed Tables
Total <30 30-39 40-49 50+ Male Female
BC/Territorie
s AB MB/SK ON QC ATL
All non-
white/BIPOC Asian (NET) White (NET) Yes No
A B C D E F G H I J K L M N O P Q R
Base: Threatened or harassed online and accessed
resources 25* 5** 2** 5** 12** 9** 15** 1** 1** 2** 12** 7** 1** 11** 5** 13** 2** 22**
1 0 0 0 1 0 1 0 1 0 0 0 0 1 1 0 0 1
4% - - - 8% - 7% - 100% - - - - 9% 20% - - 5%
1 1 0 0 0 1 0 0 0 0 1 0 0 0 0 1 1 0
4% 20% - - - 11% - - - - 8% - - - - 8% 50% -
23 4 2 5 11 8 14 1 0 2 11 7 1 10 4 12 1 21
92% 80% 100% 100% 92% 89% 93% 100% - 100% 92% 100% 100% 91% 80% 92% 50% 95%
25 5 2 5 12 9 15 1 1 2 12 7 1 11 5 13 2 22
100% 100% 100% 100% 100% 100% 100% 100% 100% 100% 100% 100% 100% 100% 100% 100% 100% 100%
Summary
1 0 0 0 1 0 1 0 1 0 0 0 0 1 1 0 0 1
4% - - - 8% - 7% - 100% - - - - 9% 20% - - 5%
1 1 0 0 0 1 0 0 0 0 1 0 0 0 0 1 1 0
4% 20% - - - 11% - - - - 8% - - - - 8% 50% -L2B (1-2)
Proportions/Means: Columns Tested (5% risk level) - B/C/D/E - F/G - H/I/J/K/L/M - N/O/P - Q/R Overlap formulae used. * small base; ** very small base (under 30) ineligible for sig testing
(4)
(2)
(DK/NS)
Sigma
T2B (4-5)
q16a_7. [The other resource you accessed] How adequate do you feel the existing resources at your disposal are when it comes to dealing with the issue of online harassment?
Age Gender Region Ethnocultural background/race If identify as LGBTQ2S+
Ipsos11 of 56

Online Harm in Journalism Detailed Tables
Total <30 30-39 40-49 50+ Male Female
BC/Territorie
s AB MB/SK ON QC ATL
All non-
white/BIPOC Asian (NET) White (NET) Yes No
A B C D E F G H I J K L M N O P Q R
16 5 4 5 2 8 8 0 0 1 9 5 0 8 5 9 2 14
40% 56% 36% 50% 20% 44% 38% - - 50% 45% 71% - 53% 63% 36% 29% 45%
56 7 14 16 18 27 28 6 8 3 23 12 1 20 14 39 9 46
44% 41% 40% 40% 55% 47% 42% 60% 57% 43% 43% 43% 11% 53% 58% 42% 43% 47%
41 4 15 11 11 17 24 7 5 2 18 6 2 12 3 31 12 26
40% 25% 41% 46% 46% 40% 41% 50% 33% 22% 47% 38% 33% 35% 23% 42% 50% 36%
6 1 1 2 2 3 3 0 0 0 2 4 0 1 0 5 2 4
29% 50% 14% 33% 33% 21% 43% - - - 25% 44% - 14% - 29% 50% 24%
14 1 3 5 4 9 5 2 0 1 8 3 0 2 1 13 3 11
26% 17% 13% 36% 50% 38% 17% 67% - 50% 35% 23% - 20% 25% 29% 30% 26%
10 3 2 4 1 4 6 0 1 2 4 3 0 5 4 5 1 9
29% 60% 20% 33% 14% 25% 35% - 33% 50% 27% 30% - 38% 57% 24% 25% 31%
1 0 0 0 1 0 1 0 1 0 0 0 0 1 1 0 0 1
4% - - - 8% - 7% - 100% - - - - 9% 20% - - 5%
Other online resources
The other resource you accessed
Proportions/Means: Columns Tested (5% risk level) - B/C/D/E - F/G - H/I/J/K/L/M - N/O/P - Q/R Overlap formulae used. * small base; ** very small base (under 30) ineligible for sig testing
Journalist association resources (e.g. training, website,
support line, guides)
Employer's resources (e.g. training, website, employee
support line, guides)
Health professional (e.g. psychologists, doctors)
Legal professional
Police or security professional
q16a_top2. [SUMMARY - T2B (4-5)] How adequate do you feel the existing resources at your disposal are when it comes to dealing with the issue of online harassment?
Age Gender Region Ethnocultural background/race If identify as LGBTQ2S+
Ipsos11 of 56
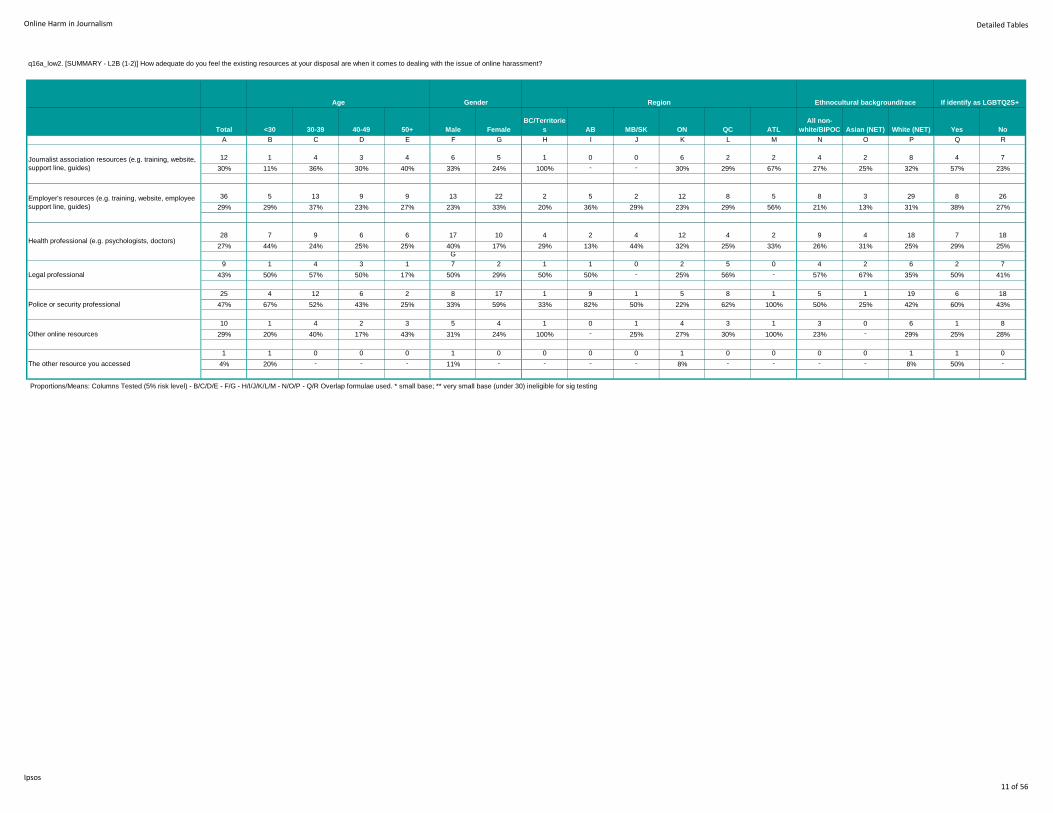
Online Harm in Journalism Detailed Tables
Total <30 30-39 40-49 50+ Male Female
BC/Territorie
s AB MB/SK ON QC ATL
All non-
white/BIPOC Asian (NET) White (NET) Yes No
A B C D E F G H I J K L M N O P Q R
12 1 4 3 4 6 5 1 0 0 6 2 2 4 2 8 4 7
30% 11% 36% 30% 40% 33% 24% 100% - - 30% 29% 67% 27% 25% 32% 57% 23%
36 5 13 9 9 13 22 2 5 2 12 8 5 8 3 29 8 26
29% 29% 37% 23% 27% 23% 33% 20% 36% 29% 23% 29% 56% 21% 13% 31% 38% 27%
28 7 9 6 6 17 10 4 2 4 12 4 2 9 4 18 7 18
27% 44% 24% 25% 25% 40% 17% 29% 13% 44% 32% 25% 33% 26% 31% 25% 29% 25%G
9 1 4 3 1 7 2 1 1 0 2 5 0 4 2 6 2 7
43% 50% 57% 50% 17% 50% 29% 50% 50% - 25% 56% - 57% 67% 35% 50% 41%
25 4 12 6 2 8 17 1 9 1 5 8 1 5 1 19 6 18
47% 67% 52% 43% 25% 33% 59% 33% 82% 50% 22% 62% 100% 50% 25% 42% 60% 43%
10 1 4 2 3 5 4 1 0 1 4 3 1 3 0 6 1 8
29% 20% 40% 17% 43% 31% 24% 100% - 25% 27% 30% 100% 23% - 29% 25% 28%
1 1 0 0 0 1 0 0 0 0 1 0 0 0 0 1 1 0
4% 20% - - - 11% - - - - 8% - - - - 8% 50% -
Other online resources
The other resource you accessed
Proportions/Means: Columns Tested (5% risk level) - B/C/D/E - F/G - H/I/J/K/L/M - N/O/P - Q/R Overlap formulae used. * small base; ** very small base (under 30) ineligible for sig testing
Journalist association resources (e.g. training, website,
support line, guides)
Employer's resources (e.g. training, website, employee
support line, guides)
Health professional (e.g. psychologists, doctors)
Legal professional
Police or security professional
q16a_low2. [SUMMARY - L2B (1-2)] How adequate do you feel the existing resources at your disposal are when it comes to dealing with the issue of online harassment?
Age Gender Region Ethnocultural background/race If identify as LGBTQ2S+
Ipsos11 of 56

Online Harm in Journalism Detailed Tables
Total <30 30-39 40-49 50+ Male Female
BC/Territori
es AB MB/SK ON QC ATL
All non-
white/BIPOC Asian (NET) White (NET) Yes No
A B C D E F G H I J K L M N O P Q R
Base: Threatened or harassed 784 129 234 207 205 388 376 84* 84* 64* 299 209 32* 220 132 592 105 646
112 25 45 22 20 49 62 14 18 11 43 22 2 33 22 84 20 88
14% 19% 19% 11% 10% 13% 16% 17% 21% 17% 14% 11% 6% 15% 17% 14% 19% 14%
DE DE L
52 13 22 7 10 22 29 6 9 6 20 9 1 11 8 42 12 40
7% 10% 9% 3% 5% 6% 8% 7% 11% 9% 7% 4% 3% 5% 6% 7% 11% 6%
D D L
48 12 16 12 8 18 30 4 6 5 21 10 1 19 12 33 8 37
6% 9% 7% 6% 4% 5% 8% 5% 7% 8% 7% 5% 3% 9% 9% 6% 8% 6%
E
15 0 9 4 2 9 6 4 3 0 3 4 1 3 2 12 0 14
2% - 4% 2% 1% 2% 2% 5% 4% - 1% 2% 3% 1% 2% 2% - 2%
B K
111 16 31 33 30 52 57 9 13 10 35 38 5 33 19 81 11 94
14% 12% 13% 16% 15% 13% 15% 11% 15% 16% 12% 18% 16% 15% 14% 14% 10% 15%
K
46 8 9 18 11 20 26 3 6 4 16 14 2 12 8 36 5 40
6% 6% 4% 9% 5% 5% 7% 4% 7% 6% 5% 7% 6% 5% 6% 6% 5% 6%
C
25 4 7 6 8 10 14 0 4 0 11 10 0 6 2 20 4 20
3% 3% 3% 3% 4% 3% 4% - 5% - 4% 5% - 3% 2% 3% 4% 3%
H H
54 7 19 13 14 28 25 6 5 6 15 19 3 20 11 34 4 46
7% 5% 8% 6% 7% 7% 7% 7% 6% 9% 5% 9% 9% 9% 8% 6% 4% 7%
97 12 29 26 30 46 51 11 8 10 48 15 4 23 15 76 14 82
12% 9% 12% 13% 15% 12% 14% 13% 10% 16% 16% 7% 13% 10% 11% 13% 13% 13%
L L
42 7 14 8 13 20 22 4 4 2 24 7 1 11 6 31 8 34
5% 5% 6% 4% 6% 5% 6% 5% 5% 3% 8% 3% 3% 5% 5% 5% 8% 5%
L
36 4 13 13 6 14 22 4 3 6 13 8 2 7 5 30 5 31
5% 3% 6% 6% 3% 4% 6% 5% 4% 9% 4% 4% 6% 3% 4% 5% 5% 5%
27 1 5 6 15 14 13 5 1 3 14 1 2 7 6 21 1 25
3% 1% 2% 3% 7% 4% 3% 6% 1% 5% 5% 0 6% 3% 5% 4% 1% 4%
BCD L L L L
5 0 2 0 3 3 2 1 2 0 2 0 0 1 0 4 0 5
1% - 1% - 1% 1% 1% 1% 2% - 1% - - 0 - 1% - 1%
L
6 2 4 0 0 2 4 2 0 1 3 0 0 3 1 5 1 4
1% 2% 2% - - 1% 1% 2% - 2% 1% - - 1% 1% 1% 1% 1%
L
23 1 11 9 2 8 15 5 1 1 12 3 1 6 5 17 3 17
3% 1% 5% 4% 1% 2% 4% 6% 1% 2% 4% 1% 3% 3% 4% 3% 3% 3%
BE E L
42 7 14 8 13 20 22 4 4 2 24 7 1 11 6 31 8 34
5% 5% 6% 4% 6% 5% 6% 5% 5% 3% 8% 3% 3% 5% 5% 5% 8% 5%
L
47 6 11 12 17 26 20 4 8 5 16 12 1 15 12 31 6 39
6% 5% 5% 6% 8% 7% 5% 5% 10% 8% 5% 6% 3% 7% 9% 5% 6% 6%
49 17 14 8 10 21 26 7 7 4 20 9 1 15 7 39 11 35
6% 13% 6% 4% 5% 5% 7% 8% 8% 6% 7% 4% 3% 7% 5% 7% 10% 5%
CDE R
56 11 20 9 15 24 32 4 10 5 23 10 2 15 7 42 8 46
7% 9% 9% 4% 7% 6% 9% 5% 12% 8% 8% 5% 6% 7% 5% 7% 8% 7%
L
11 5 2 2 2 5 6 1 3 2 3 1 1 4 3 8 5 6
1% 4% 1% 1% 1% 1% 2% 1% 4% 3% 1% 0 3% 2% 2% 1% 5% 1%
C L R
15 4 7 2 2 5 9 0 3 2 7 3 0 6 2 11 5 9
2% 3% 3% 1% 1% 1% 2% - 4% 3% 2% 1% - 3% 2% 2% 5% 1%
R
44 3 18 10 10 20 20 0 7 4 18 12 2 11 4 36 8 33
6% 2% 8% 5% 5% 5% 5% - 8% 6% 6% 6% 6% 5% 3% 6% 8% 5%
B H H H H H
9 0 3 1 5 6 2 1 0 1 5 2 0 3 3 6 0 7
1% - 1% 0 2% 2% 1% 1% - 2% 2% 1% - 1% 2% 1% - 1%
28 4 5 6 13 14 12 3 2 1 14 6 2 9 4 22 4 24
4% 3% 2% 3% 6% 4% 3% 4% 2% 2% 5% 3% 6% 4% 3% 4% 4% 4%
C
351 60 106 104 78 180 162 40 29 29 125 106 16 92 57 269 43 294
45% 47% 45% 50% 38% 46% 43% 48% 35% 45% 42% 51% 50% 42% 43% 45% 41% 46%
E IK
1031 176 331 258 257 489 519 108 117 89 409 253 40 287 171 780 149 840
132% 136% 141% 125% 125% 126% 138% 129% 139% 139% 137% 121% 125% 130% 130% 132% 142% 130%Sigma
Proportions/Means: Columns Tested (5% risk level) - B/C/D/E - F/G - H/I/J/K/L/M - N/O/P - Q/R Overlap formulae used. * small base
Better/ more protection to members of the marginalized
group/ gender/ race
Other
Nothing
Don't know
No answer/Blank
Websites/ social media companies to filter hate
comments/ shut down fake accounts
Better/ more support/ forums/ journalist support groups
Psychological support/ more resources for free mental
health
Better/ more support/ protection from employer
Better/ more support on safety and security/ body
guards
Disable comment section/ better filtering/ blocking
accounts
Verification of all social media accounts/ non-
anonymity/ way to track their accounts
Keep a low profile/ not using branding/ anonymity of
journalists/ using alias
More time off/ away from work/ paid off
Eliminate/ lessen use of social media
Better/ centralized/ easy way to report harassment
Better support from the police
Law/ legislation with strict penalties/ harassment
should be taken seriously
Better management of comments/fake accounts - NET
Websites/ social media companies to filter hate
comments/ shut down fake accounts
Education/ Awareness - NET
Education/ training on how to avoid harassment/
what to do when experienced
Handbook/ resources/ checklist on what to do/
readily available
Public education/ more awareness of what
journalism is about
Recourse - NET
q16b. In your opinion, what resources could be developed in the future to better support journalists and media professionals who experience online harassment?
Age Gender Region Ethnocultural background/race If identify as LGBTQ2S+
Ipsos11 of 56

Online Harm in Journalism Detailed Tables
Total <30 30-39 40-49 50+ Male Female
BC/Territorie
s AB MB/SK ON QC ATL
All non-
white/BIPOC Asian (NET) White (NET) Yes No
A B C D E F G H I J K L M N O P Q R
Base: Threatened or harassed - Excluding Don't know,
No answer/Blank 405 65* 123 97* 114 194 202 41* 53* 34* 160 97* 14** 119 71* 301 58* 328
112 25 45 22 20 49 62 14 18 11 43 22 2 33 22 84 20 88
28% 38% 37% 23% 18% 25% 31% 34% 34% 32% 27% 23% 14% 28% 31% 28% 34% 27%
DE DE
52 13 22 7 10 22 29 6 9 6 20 9 1 11 8 42 12 40
13% 20% 18% 7% 9% 11% 14% 15% 17% 18% 13% 9% 7% 9% 11% 14% 21% 12%
DE DE
48 12 16 12 8 18 30 4 6 5 21 10 1 19 12 33 8 37
12% 18% 13% 12% 7% 9% 15% 10% 11% 15% 13% 10% 7% 16% 17% 11% 14% 11%
E
15 0 9 4 2 9 6 4 3 0 3 4 1 3 2 12 0 14
4% - 7% 4% 2% 5% 3% 10% 6% - 2% 4% 7% 3% 3% 4% - 4%
BE K
111 16 31 33 30 52 57 9 13 10 35 38 5 33 19 81 11 94
27% 25% 25% 34% 26% 27% 28% 22% 25% 29% 22% 39% 36% 28% 27% 27% 19% 29%
K
46 8 9 18 11 20 26 3 6 4 16 14 2 12 8 36 5 40
11% 12% 7% 19% 10% 10% 13% 7% 11% 12% 10% 14% 14% 10% 11% 12% 9% 12%
C
25 4 7 6 8 10 14 0 4 0 11 10 0 6 2 20 4 20
6% 6% 6% 6% 7% 5% 7% - 8% - 7% 10% - 5% 3% 7% 7% 6%
H
54 7 19 13 14 28 25 6 5 6 15 19 3 20 11 34 4 46
13% 11% 15% 13% 12% 14% 12% 15% 9% 18% 9% 20% 21% 17% 15% 11% 7% 14%
K
97 12 29 26 30 46 51 11 8 10 48 15 4 23 15 76 14 82
24% 18% 24% 27% 26% 24% 25% 27% 15% 29% 30% 15% 29% 19% 21% 25% 24% 25%
IL
42 7 14 8 13 20 22 4 4 2 24 7 1 11 6 31 8 34
10% 11% 11% 8% 11% 10% 11% 10% 8% 6% 15% 7% 7% 9% 8% 10% 14% 10%
36 4 13 13 6 14 22 4 3 6 13 8 2 7 5 30 5 31
9% 6% 11% 13% 5% 7% 11% 10% 6% 18% 8% 8% 14% 6% 7% 10% 9% 9%
E
27 1 5 6 15 14 13 5 1 3 14 1 2 7 6 21 1 25
7% 2% 4% 6% 13% 7% 6% 12% 2% 9% 9% 1% 14% 6% 8% 7% 2% 8%
BC IL L L
5 0 2 0 3 3 2 1 2 0 2 0 0 1 0 4 0 5
1% - 2% - 3% 2% 1% 2% 4% - 1% - - 1% - 1% - 2%
6 2 4 0 0 2 4 2 0 1 3 0 0 3 1 5 1 4
1% 3% 3% - - 1% 2% 5% - 3% 2% - - 3% 1% 2% 2% 1%
L
23 1 11 9 2 8 15 5 1 1 12 3 1 6 5 17 3 17
6% 2% 9% 9% 2% 4% 7% 12% 2% 3% 8% 3% 7% 5% 7% 6% 5% 5%
E BE IL
42 7 14 8 13 20 22 4 4 2 24 7 1 11 6 31 8 34
10% 11% 11% 8% 11% 10% 11% 10% 8% 6% 15% 7% 7% 9% 8% 10% 14% 10%
47 6 11 12 17 26 20 4 8 5 16 12 1 15 12 31 6 39
12% 9% 9% 12% 15% 13% 10% 10% 15% 15% 10% 12% 7% 13% 17% 10% 10% 12%
49 17 14 8 10 21 26 7 7 4 20 9 1 15 7 39 11 35
12% 26% 11% 8% 9% 11% 13% 17% 13% 12% 13% 9% 7% 13% 10% 13% 19% 11%
CDE
56 11 20 9 15 24 32 4 10 5 23 10 2 15 7 42 8 46
14% 17% 16% 9% 13% 12% 16% 10% 19% 15% 14% 10% 14% 13% 10% 14% 14% 14%
11 5 2 2 2 5 6 1 3 2 3 1 1 4 3 8 5 6
3% 8% 2% 2% 2% 3% 3% 2% 6% 6% 2% 1% 7% 3% 4% 3% 9% 2%
C R
15 4 7 2 2 5 9 0 3 2 7 3 0 6 2 11 5 9
4% 6% 6% 2% 2% 3% 4% - 6% 6% 4% 3% - 5% 3% 4% 9% 3%
R
44 3 18 10 10 20 20 0 7 4 18 12 2 11 4 36 8 33
11% 5% 15% 10% 9% 10% 10% - 13% 12% 11% 12% 14% 9% 6% 12% 14% 10%
B H H H H
9 0 3 1 5 6 2 1 0 1 5 2 0 3 3 6 0 7
2% - 2% 1% 4% 3% 1% 2% - 3% 3% 2% - 3% 4% 2% - 2%
652 112 220 148 166 295 345 65 86 59 270 141 22 186 110 489 102 522
161% 172% 179% 153% 146% 152% 171% 159% 162% 174% 169% 145% 157% 156% 155% 162% 176% 159%
Proportions/Means: Columns Tested (5% risk level) - B/C/D/E - F/G - H/I/J/K/L/M - N/O/P - Q/R Overlap formulae used. * small base; ** very small base (under 30) ineligible for sig testing
Better/ more protection to members of the marginalized
group/ gender/ race
Other
Nothing
Sigma
Websites/ social media companies to filter hate
comments/ shut down fake accounts
Better/ more support/ forums/ journalist support groups
Psychological support/ more resources for free mental
health
Better/ more support/ protection from employer
Better/ more support on safety and security/ body
guards
Disable comment section/ better filtering/ blocking
accounts
Verification of all social media accounts/ non-
anonymity/ way to track their accounts
Keep a low profile/ not using branding/ anonymity of
journalists/ using alias
More time off/ away from work/ paid off
Eliminate/ lessen use of social media
Better/ centralized/ easy way to report harassment
Better support from the police
Law/ legislation with strict penalties/ harassment
should be taken seriously
Better management of comments/fake accounts - NET
Websites/ social media companies to filter hate
comments/ shut down fake accounts
Education/ Awareness - NET
Education/ training on how to avoid harassment/
what to do when experienced
Handbook/ resources/ checklist on what to do/
readily available
Public education/ more awareness of what
journalism is about
Recourse - NET
q16bx. In your opinion, what resources could be developed in the future to better support journalists and media professionals who experience online harassment?
Age Gender Region Ethnocultural background/race If identify as LGBTQ2S+
Ipsos11 of 56
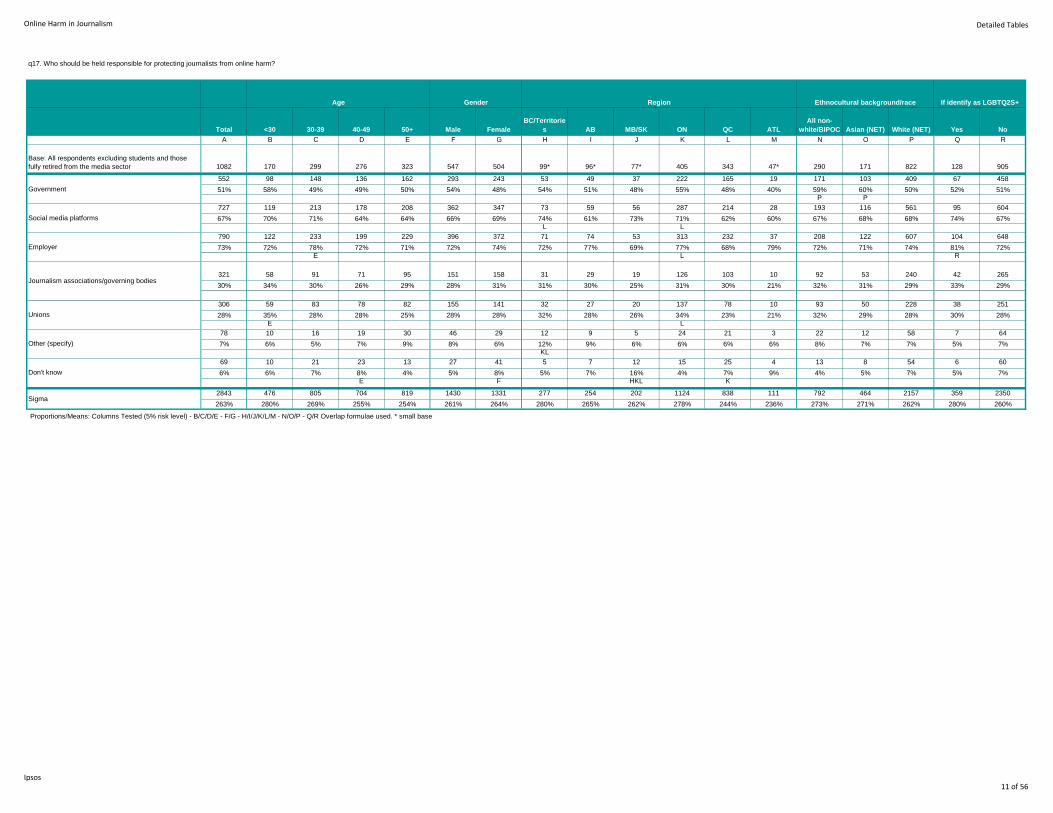
Online Harm in Journalism Detailed Tables
Total <30 30-39 40-49 50+ Male Female
BC/Territorie
s AB MB/SK ON QC ATL
All non-
white/BIPOC Asian (NET) White (NET) Yes No
A B C D E F G H I J K L M N O P Q R
Base: All respondents excluding students and those
fully retired from the media sector 1082 170 299 276 323 547 504 99* 96* 77* 405 343 47* 290 171 822 128 905
552 98 148 136 162 293 243 53 49 37 222 165 19 171 103 409 67 458
51% 58% 49% 49% 50% 54% 48% 54% 51% 48% 55% 48% 40% 59% 60% 50% 52% 51%P P
727 119 213 178 208 362 347 73 59 56 287 214 28 193 116 561 95 604
67% 70% 71% 64% 64% 66% 69% 74% 61% 73% 71% 62% 60% 67% 68% 68% 74% 67%L L
790 122 233 199 229 396 372 71 74 53 313 232 37 208 122 607 104 648
73% 72% 78% 72% 71% 72% 74% 72% 77% 69% 77% 68% 79% 72% 71% 74% 81% 72%E L R
321 58 91 71 95 151 158 31 29 19 126 103 10 92 53 240 42 265
30% 34% 30% 26% 29% 28% 31% 31% 30% 25% 31% 30% 21% 32% 31% 29% 33% 29%
306 59 83 78 82 155 141 32 27 20 137 78 10 93 50 228 38 251
28% 35% 28% 28% 25% 28% 28% 32% 28% 26% 34% 23% 21% 32% 29% 28% 30% 28%E L
78 10 16 19 30 46 29 12 9 5 24 21 3 22 12 58 7 64
7% 6% 5% 7% 9% 8% 6% 12% 9% 6% 6% 6% 6% 8% 7% 7% 5% 7%KL
69 10 21 23 13 27 41 5 7 12 15 25 4 13 8 54 6 60
6% 6% 7% 8% 4% 5% 8% 5% 7% 16% 4% 7% 9% 4% 5% 7% 5% 7%E F HKL K
2843 476 805 704 819 1430 1331 277 254 202 1124 838 111 792 464 2157 359 2350
263% 280% 269% 255% 254% 261% 264% 280% 265% 262% 278% 244% 236% 273% 271% 262% 280% 260%
Other (specify)
Don't know
Sigma Proportions/Means: Columns Tested (5% risk level) - B/C/D/E - F/G - H/I/J/K/L/M - N/O/P - Q/R Overlap formulae used. * small base
Government
Social media platforms
Employer
Journalism associations/governing bodies
Unions
q17. Who should be held responsible for protecting journalists from online harm?
Age Gender Region Ethnocultural background/race If identify as LGBTQ2S+
Ipsos11 of 56

Online Harm in Journalism Detailed Tables
Total <30 30-39 40-49 50+ Male Female
BC/Territorie
s AB MB/SK ON QC ATL
All non-
white/BIPOC Asian (NET) White (NET) Yes No
A B C D E F G H I J K L M N O P Q R
Base: Excluding Fully retired 1088 170 299 276 323 547 504 99* 96* 77* 405 343 47* 290 171 822 128 905
350 63 90 95 98 136 208 38 37 30 129 95 17 80 47 282 47 287
32% 37% 30% 34% 30% 25% 41% 38% 39% 39% 32% 28% 36% 28% 27% 34% 37% 32%
F L L N
141 27 39 41 33 47 91 19 15 12 49 35 8 27 15 115 22 114
13% 16% 13% 15% 10% 9% 18% 19% 16% 16% 12% 10% 17% 9% 9% 14% 17% 13%
F L N
52 11 16 10 14 12 39 6 5 3 21 13 3 14 9 38 10 40
5% 6% 5% 4% 4% 2% 8% 6% 5% 4% 5% 4% 6% 5% 5% 5% 8% 4%
F
82 16 23 23 20 29 51 9 9 9 30 21 3 12 4 71 11 69
8% 9% 8% 8% 6% 5% 10% 9% 9% 12% 7% 6% 6% 4% 2% 9% 9% 8%
F O NO
20 3 5 8 4 9 11 6 2 2 3 4 2 2 2 18 2 17
2% 2% 2% 3% 1% 2% 2% 6% 2% 3% 1% 1% 4% 1% 1% 2% 2% 2%
KL K
290 56 77 71 82 108 177 27 35 27 107 76 15 72 42 229 41 235
27% 33% 26% 26% 25% 20% 35% 27% 36% 35% 26% 22% 32% 25% 25% 28% 32% 26%
F L L
32 2 11 11 8 17 14 2 3 1 11 14 1 9 3 24 1 30
3% 1% 4% 4% 2% 3% 3% 2% 3% 1% 3% 4% 2% 3% 2% 3% 1% 3%
25 3 7 6 9 12 13 0 2 3 8 12 0 1 0 24 3 22
2% 2% 2% 2% 3% 2% 3% - 2% 4% 2% 3% - 0 - 3% 2% 2%
H NO
60 14 10 13 21 19 39 6 4 7 26 12 4 15 10 47 5 52
6% 8% 3% 5% 7% 3% 8% 6% 4% 9% 6% 3% 9% 5% 6% 6% 4% 6%
C F L
16 1 4 5 6 8 7 6 1 4 2 3 0 5 5 12 2 14
1% 1% 1% 2% 2% 1% 1% 6% 1% 5% 0 1% - 2% 3% 1% 2% 2%
KL KL
212 46 59 52 52 71 139 19 26 20 77 55 12 53 31 166 34 168
19% 27% 20% 19% 16% 13% 28% 19% 27% 26% 19% 16% 26% 18% 18% 20% 27% 19%
DE F L L R
88 18 21 22 27 26 61 1 9 7 37 30 3 29 17 67 11 72
8% 11% 7% 8% 8% 5% 12% 1% 9% 9% 9% 9% 6% 10% 10% 8% 9% 8%
F H H H H
73 13 19 19 20 29 42 8 10 2 27 20 3 20 10 55 11 58
7% 8% 6% 7% 6% 5% 8% 8% 10% 3% 7% 6% 6% 7% 6% 7% 9% 6%
J
101 17 33 23 26 41 57 5 17 11 39 23 5 32 17 71 17 80
9% 10% 11% 8% 8% 7% 11% 5% 18% 14% 10% 7% 11% 11% 10% 9% 13% 9%
F HKL HL
21 2 9 4 6 8 12 2 2 2 12 3 0 7 5 16 2 19
2% 1% 3% 1% 2% 1% 2% 2% 2% 3% 3% 1% - 2% 3% 2% 2% 2%
L
24 2 3 10 8 11 12 1 3 2 9 9 0 7 4 16 1 23
2% 1% 1% 4% 2% 2% 2% 1% 3% 3% 2% 3% - 2% 2% 2% 1% 3%
C
71 15 23 16 16 23 47 7 6 6 37 8 5 27 16 51 11 56
7% 9% 8% 6% 5% 4% 9% 7% 6% 8% 9% 2% 11% 9% 9% 6% 9% 6%
F L L L L
32 0 7 14 9 21 9 2 7 1 13 8 1 11 3 22 2 27
3% - 2% 5% 3% 4% 2% 2% 7% 1% 3% 2% 2% 4% 2% 3% 2% 3%
B B B G L O
88 8 21 26 32 40 44 4 7 11 34 24 7 25 14 63 5 75
8% 5% 7% 9% 10% 7% 9% 4% 7% 14% 8% 7% 15% 9% 8% 8% 4% 8%
B HL H
126 24 29 30 42 75 49 9 6 12 39 56 3 36 22 98 12 110
12% 14% 10% 11% 13% 14% 10% 9% 6% 16% 10% 16% 6% 12% 13% 12% 9% 12%
G I IK
97 19 23 25 29 46 49 10 8 11 33 29 6 28 20 76 7 87
9% 11% 8% 9% 9% 8% 10% 10% 8% 14% 8% 8% 13% 10% 12% 9% 5% 10%
4 1 2 1 0 3 1 0 0 0 4 0 0 0 0 4 1 3
0 1% 1% 0 - 1% 0 - - - 1% - - - - 0 1% 0
22 3 7 7 5 10 11 3 3 1 7 8 0 9 7 14 2 19
2% 2% 2% 3% 2% 2% 2% 3% 3% 1% 2% 2% - 3% 4% 2% 2% 2%
P
12 0 5 3 3 7 5 4 3 0 2 2 1 3 0 9 0 11
1% - 2% 1% 1% 1% 1% 4% 3% - 0 1% 2% 1% - 1% - 1%
KL KL
45 5 15 12 13 18 25 5 4 5 11 16 4 10 7 38 5 39
4% 3% 5% 4% 4% 3% 5% 5% 4% 6% 3% 5% 9% 3% 4% 5% 4% 4%
K
38 4 15 9 9 14 23 4 4 2 20 7 0 15 6 28 4 32
3% 2% 5% 3% 3% 3% 5% 4% 4% 3% 5% 2% - 5% 4% 3% 3% 4%
L
8 2 1 2 3 0 8 2 1 0 4 0 1 0 0 8 1 7
1% 1% 0 1% 1% - 2% 2% 1% - 1% - 2% - - 1% 1% 1%
F L L
22 2 11 5 4 10 12 1 6 2 8 2 3 9 5 13 3 19
2% 1% 4% 2% 1% 2% 2% 1% 6% 3% 2% 1% 6% 3% 3% 2% 2% 2%
E KL L
15 3 3 4 5 5 10 1 1 1 4 6 2 3 2 12 1 11
1% 2% 1% 1% 2% 1% 2% 1% 1% 1% 1% 2% 4% 1% 1% 1% 1% 1%
8 0 3 2 3 4 4 1 1 0 6 0 0 3 2 5 1 7
1% - 1% 1% 1% 1% 1% 1% 1% - 1% - - 1% 1% 1% 1% 1%
L
43 5 9 9 19 28 14 6 4 4 10 19 0 13 3 31 2 40
4% 3% 3% 3% 6% 5% 3% 6% 4% 5% 2% 6% - 4% 2% 4% 2% 4%
K O
14 1 1 7 4 10 4 2 0 0 4 8 0 4 1 9 0 13
1% 1% 0 3% 1% 2% 1% 2% - - 1% 2% - 1% 1% 1% - 1%
C
2 0 0 0 2 2 0 0 0 0 2 0 0 2 2 0 0 2
0 - - - 1% 0 - - - - 0 - - 1% 1% - - 0
P P
477 76 145 112 131 255 198 40 37 29 187 149 21 115 73 362 59 392
44% 45% 48% 41% 41% 47% 39% 40% 39% 38% 46% 43% 45% 40% 43% 44% 46% 43%
E G
1930 316 540 490 550 863 1010 172 191 158 727 561 90 519 300 1468 226 1614
177% 186% 181% 178% 170% 158% 200% 174% 199% 205% 180% 164% 191% 179% 175% 179% 177% 178%
Proportions/Means: Columns Tested (5% risk level) - B/C/D/E - F/G - H/I/J/K/L/M - N/O/P - Q/R Overlap formulae used. * small base
Other
Nothing
Don't Know
No answer/Blank
Sigma
We need more support/ assurance of safety
Need training on how to deal with harassment/ how to
protect ourselves
Trying to hide identity/ avoid being recognized/ use an
alias to protect myself
We need to educate the public more/ more public
awareness
Political bias/ government makes harassment worse
Prevalent/ know colleagues that have been affected
Makes me not want to trust others
Indicates mistrust/ hate of people with the media/ no
respect for journalists
Harassment is more prevalent in person/ phone/ have
experienced in person harassment
Anti-democratic/ disregards freedom of expression/
takes away from the truth/ factual information
Hiding identity should not be allowed/ they should be
held accountable
Racial/ discriminating/ gender biased/ people of colour
Harassment is a crime/ should enforce the law
Trying to ignore/ avoid confrontation/ it's part of the job
Limited/ have never experienced online harassment/ too
little experience
Anxiety/ stress/ fear of safety/ affects mental
health
May influence the writer's opinion/ self-censoring/ not
cover certain topics
Limit/ don't want to use social media/ try to avoid
posting online
Getting worse/ it has to change/ employers should
protect their people
Websites/ social media companies should address/
screen hateful algorithms
Emotional Strain - SUBNET
Dislike/ unpleasant/ unacceptable
Intimidating
Hurtful/ saddening/ disappointing
Annoying/ frustrating
Ability to Work/Emotional Strain - NET
Ability to Work - SUBNET
Distracting/ impacts ability to do the job
Discouraging/ makes me not want to continue/
hate my job
Makes the job harder
q18. Please take a moment to share your thoughts on the issue of online harassment and how it affects your work as a journalist or media worker.
Age Gender Region Ethnocultural background/race If identify as LGBTQ2S+
Ipsos11 of 56

Online Harm in Journalism Detailed Tables
Total <30 30-39 40-49 50+ Male Female
BC/Territorie
s AB MB/SK ON QC ATL
All non-
white/BIPOC Asian (NET) White (NET) Yes No
A B C D E F G H I J K L M N O P Q R
Base: Excluding Fully retired - Excluding Don't know, No
answer/Blank 609 94* 154 164 190 290 306 59* 59* 48* 216 194 26** 173 96* 460 69* 511
350 63 90 95 98 136 208 38 37 30 129 95 17 80 47 282 47 287
57% 67% 58% 58% 52% 47% 68% 64% 63% 63% 60% 49% 65% 46% 49% 61% 68% 56%
E F L L NO
141 27 39 41 33 47 91 19 15 12 49 35 8 27 15 115 22 114
23% 29% 25% 25% 17% 16% 30% 32% 25% 25% 23% 18% 31% 16% 16% 25% 32% 22%
E F L NO
52 11 16 10 14 12 39 6 5 3 21 13 3 14 9 38 10 40
9% 12% 10% 6% 7% 4% 13% 10% 8% 6% 10% 7% 12% 8% 9% 8% 14% 8%
F
82 16 23 23 20 29 51 9 9 9 30 21 3 12 4 71 11 69
13% 17% 15% 14% 11% 10% 17% 15% 15% 19% 14% 11% 12% 7% 4% 15% 16% 14%
F NO
20 3 5 8 4 9 11 6 2 2 3 4 2 2 2 18 2 17
3% 3% 3% 5% 2% 3% 4% 10% 3% 4% 1% 2% 8% 1% 2% 4% 3% 3%
KL
290 56 77 71 82 108 177 27 35 27 107 76 15 72 42 229 41 235
48% 60% 50% 43% 43% 37% 58% 46% 59% 56% 50% 39% 58% 42% 44% 50% 59% 46%
DE F L L L N R
32 2 11 11 8 17 14 2 3 1 11 14 1 9 3 24 1 30
5% 2% 7% 7% 4% 6% 5% 3% 5% 2% 5% 7% 4% 5% 3% 5% 1% 6%
25 3 7 6 9 12 13 0 2 3 8 12 0 1 0 24 3 22
4% 3% 5% 4% 5% 4% 4% - 3% 6% 4% 6% - 1% - 5% 4% 4%
NO
60 14 10 13 21 19 39 6 4 7 26 12 4 15 10 47 5 52
10% 15% 6% 8% 11% 7% 13% 10% 7% 15% 12% 6% 15% 9% 10% 10% 7% 10%
C F L
16 1 4 5 6 8 7 6 1 4 2 3 0 5 5 12 2 14
3% 1% 3% 3% 3% 3% 2% 10% 2% 8% 1% 2% - 3% 5% 3% 3% 3%
KL KL
212 46 59 52 52 71 139 19 26 20 77 55 12 53 31 166 34 168
35% 49% 38% 32% 27% 24% 45% 32% 44% 42% 36% 28% 46% 31% 32% 36% 49% 33%
DE E F L R
88 18 21 22 27 26 61 1 9 7 37 30 3 29 17 67 11 72
14% 19% 14% 13% 14% 9% 20% 2% 15% 15% 17% 15% 12% 17% 18% 15% 16% 14%
F H H H H
73 13 19 19 20 29 42 8 10 2 27 20 3 20 10 55 11 58
12% 14% 12% 12% 11% 10% 14% 14% 17% 4% 13% 10% 12% 12% 10% 12% 16% 11%
J
101 17 33 23 26 41 57 5 17 11 39 23 5 32 17 71 17 80
17% 18% 21% 14% 14% 14% 19% 8% 29% 23% 18% 12% 19% 18% 18% 15% 25% 16%
HL HL
21 2 9 4 6 8 12 2 2 2 12 3 0 7 5 16 2 19
3% 2% 6% 2% 3% 3% 4% 3% 3% 4% 6% 2% - 4% 5% 3% 3% 4%
L
24 2 3 10 8 11 12 1 3 2 9 9 0 7 4 16 1 23
4% 2% 2% 6% 4% 4% 4% 2% 5% 4% 4% 5% - 4% 4% 3% 1% 5%
71 15 23 16 16 23 47 7 6 6 37 8 5 27 16 51 11 56
12% 16% 15% 10% 8% 8% 15% 12% 10% 13% 17% 4% 19% 16% 17% 11% 16% 11%
F L L L
32 0 7 14 9 21 9 2 7 1 13 8 1 11 3 22 2 27
5% - 5% 9% 5% 7% 3% 3% 12% 2% 6% 4% 4% 6% 3% 5% 3% 5%
B B B G L O
88 8 21 26 32 40 44 4 7 11 34 24 7 25 14 63 5 75
14% 9% 14% 16% 17% 14% 14% 7% 12% 23% 16% 12% 27% 14% 15% 14% 7% 15%
H
126 24 29 30 42 75 49 9 6 12 39 56 3 36 22 98 12 110
21% 26% 19% 18% 22% 26% 16% 15% 10% 25% 18% 29% 12% 21% 23% 21% 17% 22%
G I HIK
97 19 23 25 29 46 49 10 8 11 33 29 6 28 20 76 7 87
16% 20% 15% 15% 15% 16% 16% 17% 14% 23% 15% 15% 23% 16% 21% 17% 10% 17%
4 1 2 1 0 3 1 0 0 0 4 0 0 0 0 4 1 3
1% 1% 1% 1% - 1% 0 - - - 2% - - - - 1% 1% 1%
22 3 7 7 5 10 11 3 3 1 7 8 0 9 7 14 2 19
4% 3% 5% 4% 3% 3% 4% 5% 5% 2% 3% 4% - 5% 7% 3% 3% 4%
P
12 0 5 3 3 7 5 4 3 0 2 2 1 3 0 9 0 11
2% - 3% 2% 2% 2% 2% 7% 5% - 1% 1% 4% 2% - 2% - 2%
KL K
45 5 15 12 13 18 25 5 4 5 11 16 4 10 7 38 5 39
7% 5% 10% 7% 7% 6% 8% 8% 7% 10% 5% 8% 15% 6% 7% 8% 7% 8%
38 4 15 9 9 14 23 4 4 2 20 7 0 15 6 28 4 32
6% 4% 10% 5% 5% 5% 8% 7% 7% 4% 9% 4% - 9% 6% 6% 6% 6%
L
8 2 1 2 3 0 8 2 1 0 4 0 1 0 0 8 1 7
1% 2% 1% 1% 2% - 3% 3% 2% - 2% - 4% - - 2% 1% 1%
F L
22 2 11 5 4 10 12 1 6 2 8 2 3 9 5 13 3 19
4% 2% 7% 3% 2% 3% 4% 2% 10% 4% 4% 1% 12% 5% 5% 3% 4% 4%
E KL
15 3 3 4 5 5 10 1 1 1 4 6 2 3 2 12 1 11
2% 3% 2% 2% 3% 2% 3% 2% 2% 2% 2% 3% 8% 2% 2% 3% 1% 2%
8 0 3 2 3 4 4 1 1 0 6 0 0 3 2 5 1 7
1% - 2% 1% 2% 1% 1% 2% 2% - 3% - - 2% 2% 1% 1% 1%
L
43 5 9 9 19 28 14 6 4 4 10 19 0 13 3 31 2 40
7% 5% 6% 5% 10% 10% 5% 10% 7% 8% 5% 10% - 8% 3% 7% 3% 8%
G K O
14 1 1 7 4 10 4 2 0 0 4 8 0 4 1 9 0 13
2% 1% 1% 4% 2% 3% 1% 3% - - 2% 4% - 2% 1% 2% - 3%
C
1451 240 395 378 417 606 812 132 154 129 538 412 69 402 225 1106 167 1220
238% 255% 256% 230% 219% 209% 265% 224% 261% 269% 249% 212% 265% 232% 234% 240% 242% 239%
Other
Nothing
Sigma
Proportions/Means: Columns Tested (5% risk level) - B/C/D/E - F/G - H/I/J/K/L/M - N/O/P - Q/R Overlap formulae used. * small base; ** very small base (under 30) ineligible for sig testing
We need more support/ assurance of safety
Need training on how to deal with harassment/ how to
protect ourselves
Trying to hide identity/ avoid being recognized/ use an
alias to protect myself
We need to educate the public more/ more public
awareness
Political bias/ government makes harassment worse
Prevalent/ know colleagues that have been affected
Makes me not want to trust others
Indicates mistrust/ hate of people with the media/ no
respect for journalists
Harassment is more prevalent in person/ phone/ have
experienced in person harassment
Anti-democratic/ disregards freedom of expression/
takes away from the truth/ factual information
Hiding identity should not be allowed/ they should be held
accountable
Racial/ discriminating/ gender biased/ people of colour
Harassment is a crime/ should enforce the law
Trying to ignore/ avoid confrontation/ it's part of the job
Limited/ have never experienced online harassment/ too
little experience
Anxiety/ stress/ fear of safety/ affects mental
health
May influence the writer's opinion/ self-censoring/ not
cover certain topics
Limit/ don't want to use social media/ try to avoid posting
online
Getting worse/ it has to change/ employers should
protect their people
Websites/ social media companies should address/
screen hateful algorithms
Emotional Strain - SUBNET
Dislike/ unpleasant/ unacceptable
Intimidating
Hurtful/ saddening/ disappointing
Annoying/ frustrating
Ability to Work/Emotional Strain - NET
Ability to Work - SUBNET
Distracting/ impacts ability to do the job
Discouraging/ makes me not want to continue/
hate my job
Makes the job harder
q18x. Please take a moment to share your thoughts on the issue of online harassment and how it affects your work as a journalist or media worker.
Age Gender Region Ethnocultural background/race If identify as LGBTQ2S+
Ipsos11 of 56

Online Harm in Journalism Detailed Tables
Total <30 30-39 40-49 50+ Male Female
BC/Territorie
s AB MB/SK ON QC ATL
All non-
white/BIPOC Asian (NET) White (NET) Yes No
A B C D E F G H I J K L M N O P Q R
Base: Fully retired or Student only 11* -** -** -** -** -** -** -** -** -** -** -** -** -** -** -** -** -**
11 0 0 0 0 0 0 0 0 0 0 0 0 0 0 0 0 0
100% - - - - - - - - - - - - - - - - -
11 0 0 0 0 0 0 0 0 0 0 0 0 0 0 0 0 0
100% - - - - - - - - - - - - - - - - -
(DK/NS)
Sigma Proportions/Means: Columns Tested (5% risk level) - B/C/D/E - F/G - H/I/J/K/L/M - N/O/P - Q/R Overlap formulae used. * small base; ** very small base (under 30) ineligible for sig testing
q18b. While this survey is focused on people who are still actively working as journalists and media professionals, we would appreciate your thoughts on the important issue of online harassment and how it affects the work of those working in media today.
Age Gender Region Ethnocultural background/race If identify as LGBTQ2S+
Ipsos11 of 56
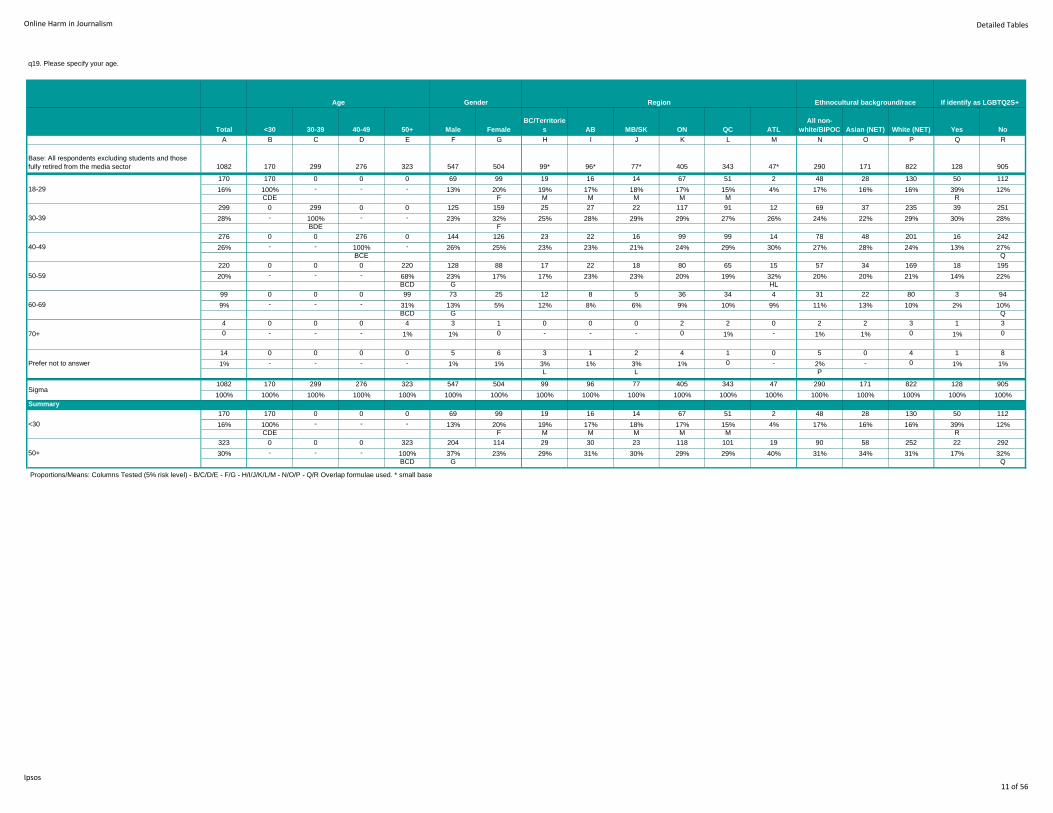
Online Harm in Journalism Detailed Tables
Total <30 30-39 40-49 50+ Male Female
BC/Territorie
s AB MB/SK ON QC ATL
All non-
white/BIPOC Asian (NET) White (NET) Yes No
A B C D E F G H I J K L M N O P Q R
Base: All respondents excluding students and those
fully retired from the media sector 1082 170 299 276 323 547 504 99* 96* 77* 405 343 47* 290 171 822 128 905
170 170 0 0 0 69 99 19 16 14 67 51 2 48 28 130 50 112
16% 100% - - - 13% 20% 19% 17% 18% 17% 15% 4% 17% 16% 16% 39% 12%CDE F M M M M M R
299 0 299 0 0 125 159 25 27 22 117 91 12 69 37 235 39 251
28% - 100% - - 23% 32% 25% 28% 29% 29% 27% 26% 24% 22% 29% 30% 28%BDE F
276 0 0 276 0 144 126 23 22 16 99 99 14 78 48 201 16 242
26% - - 100% - 26% 25% 23% 23% 21% 24% 29% 30% 27% 28% 24% 13% 27%BCE Q
220 0 0 0 220 128 88 17 22 18 80 65 15 57 34 169 18 195
20% - - - 68% 23% 17% 17% 23% 23% 20% 19% 32% 20% 20% 21% 14% 22%BCD G HL
99 0 0 0 99 73 25 12 8 5 36 34 4 31 22 80 3 94
9% - - - 31% 13% 5% 12% 8% 6% 9% 10% 9% 11% 13% 10% 2% 10%BCD G Q
4 0 0 0 4 3 1 0 0 0 2 2 0 2 2 3 1 3
0 - - - 1% 1% 0 - - - 0 1% - 1% 1% 0 1% 0
14 0 0 0 0 5 6 3 1 2 4 1 0 5 0 4 1 8
1% - - - - 1% 1% 3% 1% 3% 1% 0 - 2% - 0 1% 1%L L P
1082 170 299 276 323 547 504 99 96 77 405 343 47 290 171 822 128 905
100% 100% 100% 100% 100% 100% 100% 100% 100% 100% 100% 100% 100% 100% 100% 100% 100% 100%
Summary
170 170 0 0 0 69 99 19 16 14 67 51 2 48 28 130 50 112
16% 100% - - - 13% 20% 19% 17% 18% 17% 15% 4% 17% 16% 16% 39% 12%CDE F M M M M M R
323 0 0 0 323 204 114 29 30 23 118 101 19 90 58 252 22 292
30% - - - 100% 37% 23% 29% 31% 30% 29% 29% 40% 31% 34% 31% 17% 32%BCD G Q
Proportions/Means: Columns Tested (5% risk level) - B/C/D/E - F/G - H/I/J/K/L/M - N/O/P - Q/R Overlap formulae used. * small base
70+
Prefer not to answer
Sigma
<30
50+
18-29
30-39
40-49
50-59
60-69
q19. Please specify your age.
Age Gender Region Ethnocultural background/race If identify as LGBTQ2S+
Ipsos11 of 56

Online Harm in Journalism Detailed Tables
Total <30 30-39 40-49 50+ Male Female
BC/Territorie
s AB MB/SK ON QC ATL
All non-
white/BIPOC Asian (NET) White (NET) Yes No
A B C D E F G H I J K L M N O P Q R
Base: All respondents excluding students and those fully
retired from the media sector 1082 170 299 276 323 547 504 99* 96* 77* 405 343 47* 290 171 822 128 905
89 16 22 20 28 46 41 89 0 0 0 0 0 25 18 71 10 77
8% 9% 7% 7% 9% 8% 8% 90% - - - - - 9% 11% 9% 8% 9%
IJKLM
96 16 27 22 30 51 42 0 96 0 0 0 0 19 11 78 10 83
9% 9% 9% 8% 9% 9% 8% - 100% - - - - 7% 6% 9% 8% 9%
HJKLM
42 10 15 4 11 20 20 0 0 42 0 0 0 9 6 33 5 37
4% 6% 5% 1% 3% 4% 4% - - 55% - - - 3% 4% 4% 4% 4%
D D HIKLM
35 4 7 12 12 13 22 0 0 35 0 0 0 10 7 28 3 32
3% 2% 2% 4% 4% 2% 4% - - 45% - - - 3% 4% 3% 2% 4%
HIKLM
405 67 117 99 118 199 195 0 0 0 405 0 0 133 74 286 56 329
37% 39% 39% 36% 37% 36% 39% - - - 100% - - 46% 43% 35% 44% 36%
HIJLM P P
343 51 91 99 101 184 150 0 0 0 0 343 0 75 42 274 33 294
32% 30% 30% 36% 31% 34% 30% - - - - 100% - 26% 25% 33% 26% 32%
HIJKM NO
13 0 3 2 8 7 5 0 0 0 0 0 13 4 3 10 0 12
1% - 1% 1% 2% 1% 1% - - - - - 28% 1% 2% 1% - 1%
B HIJKL
23 0 7 7 9 13 10 0 0 0 0 0 23 5 4 20 1 22
2% - 2% 3% 3% 2% 2% - - - - - 49% 2% 2% 2% 1% 2%
B B B HIJKL
6 0 1 3 2 3 3 0 0 0 0 0 6 2 2 4 2 4
1% - 0 1% 1% 1% 1% - - - - - 13% 1% 1% 0 2% 0
HIJKL
5 2 1 2 0 2 3 0 0 0 0 0 5 0 0 4 2 0
0 1% 0 1% - 0 1% - - - - - 11% - - 0 2% -
HIJKL R
4 2 1 1 0 2 2 4 0 0 0 0 0 0 0 3 1 2
0 1% 0 0 - 0 0 4% - - - - - - - 0 1% 0
IKL
6 1 2 2 1 2 4 6 0 0 0 0 0 1 1 5 0 6
1% 1% 1% 1% 0 0 1% 6% - - - - - 0 1% 1% - 1%
IJKL
4 0 1 2 0 2 2 0 0 0 0 0 0 1 1 3 1 3
0 - 0 1% - 0 0 - - - - - - 0 1% 0 1% 0
11 1 4 1 3 3 5 0 0 0 0 0 0 6 2 3 4 4
1% 1% 1% 0 1% 1% 1% - - - - - - 2% 1% 0 3% 0
P R
1082 170 299 276 323 547 504 99 96 77 405 343 47 290 171 822 128 905
100% 100% 100% 100% 100% 100% 100% 100% 100% 100% 100% 100% 100% 100% 100% 100% 100% 100%
Summary
99 19 25 23 29 50 47 99 0 0 0 0 0 26 19 79 11 85
9% 11% 8% 8% 9% 9% 9% 100% - - - - - 9% 11% 10% 9% 9%
IJKLM
77 14 22 16 23 33 42 0 0 77 0 0 0 19 13 61 8 69
7% 8% 7% 6% 7% 6% 8% - - 100% - - - 7% 8% 7% 6% 8%
HIKLM
47 2 12 14 19 25 21 0 0 0 0 0 47 11 9 38 5 38
4% 1% 4% 5% 6% 5% 4% - - - - - 100% 4% 5% 5% 4% 4%
B B HIJKL
BC/Territories
MB/SK
ATL
Proportions/Means: Columns Tested (5% risk level) - B/C/D/E - F/G - H/I/J/K/L/M - N/O/P - Q/R Overlap formulae used. * small base
Yukon
Northwest Territories
My primary residence is outside of Canada
Prefer not to answer
Sigma
Quebec
New Brunswick
Nova Scotia
Prince Edward Island
Newfoundland
British Columbia
Alberta
Saskatchewan
Manitoba
Ontario
q20. In what province or territory do you reside the majority of your time?
Age Gender Region Ethnocultural background/race If identify as LGBTQ2S+
Ipsos11 of 56

Online Harm in Journalism Detailed Tables
Total <30 30-39 40-49 50+ Male Female
BC/Territorie
s AB MB/SK ON QC ATL
All non-
white/BIPOC Asian (NET) White (NET) Yes No
A B C D E F G H I J K L M N O P Q R
Base: All respondents excluding students and those
fully retired from the media sector 1082 170 299 276 323 547 504 99* 96* 77* 405 343 47* 290 171 822 128 905
547 69 125 144 204 547 0 50 51 33 199 184 25 143 89 420 53 475
51% 41% 42% 52% 63% 100% - 51% 53% 43% 49% 54% 53% 49% 52% 51% 41% 52%BC BCD G Q
504 99 159 126 114 0 504 47 42 42 195 150 21 139 80 385 62 425
47% 58% 53% 46% 35% - 100% 47% 44% 55% 48% 44% 45% 48% 47% 47% 48% 47%DE E E F
9 2 6 0 1 0 0 1 1 2 2 3 0 2 1 8 9 0
1% 1% 2% - 0 - - 1% 1% 3% 0 1% - 1% 1% 1% 7% -
DE R
3 0 2 1 0 0 0 0 0 0 0 2 0 1 0 2 1 0
0 - 1% 0 - - - - - - - 1% - 0 - 0 1% -
R
19 0 7 5 4 0 0 1 2 0 9 4 1 5 1 7 3 5
2% - 2% 2% 1% - - 1% 2% - 2% 1% 2% 2% 1% 1% 2% 1%B O R
1082 170 299 276 323 547 504 99 96 77 405 343 47 290 171 822 128 905
100% 100% 100% 100% 100% 100% 100% 100% 100% 100% 100% 100% 100% 100% 100% 100% 100% 100%
Summary
12 2 8 1 1 0 0 1 1 2 2 5 0 3 1 10 10 0
1% 1% 3% 0 0 - - 1% 1% 3% 0 1% - 1% 1% 1% 8% -
DE R
Sigma
Gender diverse
Proportions/Means: Columns Tested (5% risk level) - B/C/D/E - F/G - H/I/J/K/L/M - N/O/P - Q/R Overlap formulae used. * small base
Male
Female
Non-binary/third gender
Prefer to self identify
Prefer not to answer
q21. Do you identify as ...?
Age Gender Region Ethnocultural background/race If identify as LGBTQ2S+
Ipsos11 of 56

Online Harm in Journalism Detailed Tables
Total <30 30-39 40-49 50+ Male Female
BC/Territori
es AB MB/SK ON QC ATL
All non-
white/BIPOC Asian (NET) White (NET) Yes No
A B C D E F G H I J K L M N O P Q R
Base: All respondents excluding students and those
fully retired from the media sector 1082 170 299 276 323 547 504 99* 96* 77* 405 343 47* 290 171 822 128 905
171 28 37 48 58 89 80 19 11 13 74 42 9 171 171 41 23 141
16% 16% 12% 17% 18% 16% 16% 19% 11% 17% 18% 12% 19% 59% 100% 5% 18% 16%L P NP
25 6 4 12 3 11 14 4 1 2 13 3 1 25 25 2 4 20
2% 4% 1% 4% 1% 2% 3% 4% 1% 3% 3% 1% 2% 9% 15% 0 3% 2%E CE L L P NP
3 0 0 2 1 0 3 1 0 0 2 0 0 3 3 1 0 3
0 - - 1% 0 - 1% 1% - - 0 - - 1% 2% 0 - 0
P P
98 6 17 24 51 56 41 10 9 9 27 35 8 98 98 35 9 85
9% 4% 6% 9% 16% 10% 8% 10% 9% 12% 7% 10% 17% 34% 57% 4% 7% 9%B BCD K P NP
1 0 1 0 0 0 1 0 0 0 0 1 0 1 1 1 0 1
0 - 0 - - - 0 - - - - 0 - 0 1% 0 - 0
4 2 0 0 2 2 2 0 0 1 3 0 0 4 4 0 1 3
0 1% - - 1% 0 0 - - 1% 1% - - 1% 2% - 1% 0
L P P
30 13 11 5 1 12 17 4 1 1 23 1 0 30 30 1 5 23
3% 8% 4% 2% 0 2% 3% 4% 1% 1% 6% 0 - 10% 18% 0 4% 3%DE E L L P NP
15 3 5 6 1 11 4 0 0 1 9 3 0 15 15 1 5 10
1% 2% 2% 2% 0 2% 1% - - 1% 2% 1% - 5% 9% 0 4% 1%E P NP R
27 5 8 7 6 15 12 0 1 0 15 9 1 27 1 4 1 26
2% 3% 3% 3% 2% 3% 2% - 1% - 4% 3% 2% 9% 1% 0 1% 3%OP
8 1 1 3 3 5 3 0 1 0 3 2 1 8 1 0 1 7
1% 1% 0 1% 1% 1% 1% - 1% - 1% 1% 2% 3% 1% - 1% 1%OP P
12 3 5 3 1 8 4 0 0 0 10 2 0 12 0 4 0 12
1% 2% 2% 1% 0 1% 1% - - - 2% 1% - 4% - 0 - 1%L OP
6 2 0 1 2 3 3 0 0 0 2 4 0 6 0 0 0 6
1% 1% - 0 1% 1% 1% - - - 0 1% - 2% - - - 1%P
2 0 2 0 0 0 2 0 0 0 1 1 0 2 0 0 0 2
0 - 1% - - - 0 - - - 0 0 - 1% - - - 0
P
17 4 6 4 3 8 9 3 1 0 7 6 0 17 1 5 2 14
2% 2% 2% 1% 1% 1% 2% 3% 1% - 2% 2% - 6% 1% 1% 2% 2%OP
5 1 2 1 1 3 2 1 1 0 2 1 0 5 0 1 0 5
0 1% 1% 0 0 1% 0 1% 1% - 0 0 - 2% - 0 - 1%P
8 3 3 1 1 3 5 2 0 0 4 2 0 8 1 3 1 6
1% 2% 1% 0 0 1% 1% 2% - - 1% 1% - 3% 1% 0 1% 1%OP
5 0 1 3 1 3 2 0 0 0 2 3 0 5 0 2 1 4
0 - 0 1% 0 1% 0 - - - 0 1% - 2% - 0 1% 0
P
35 7 8 11 8 16 18 2 3 1 12 16 0 35 2 9 4 29
3% 4% 3% 4% 2% 3% 4% 2% 3% 1% 3% 5% - 12% 1% 1% 3% 3%OP
9 1 2 2 4 6 3 1 0 0 0 8 0 9 0 3 1 7
1% 1% 1% 1% 1% 1% 1% 1% - - - 2% - 3% - 0 1% 1%K K OP
21 5 5 7 3 9 12 2 3 1 7 7 0 21 1 7 3 17
2% 3% 2% 3% 1% 2% 2% 2% 3% 1% 2% 2% - 7% 1% 1% 2% 2%OP
3 0 1 1 1 2 1 1 0 0 2 0 0 3 0 1 1 2
0 - 0 0 0 0 0 1% - - 0 - - 1% - 0 1% 0
P
5 1 2 1 1 1 3 0 0 0 3 2 0 5 1 1 1 4
0 1% 1% 0 0 0 1% - - - 1% 1% - 2% 1% 0 1% 0
OP
822 130 235 201 252 420 385 79 78 61 286 274 38 69 41 822 106 695
76% 76% 79% 73% 78% 77% 76% 80% 81% 79% 71% 80% 81% 24% 24% 100% 83% 77%K K NO
2 0 1 0 1 2 0 0 0 0 1 1 0 1 1 2 0 2
0 - 0 - 0 0 - - - - 0 0 - 0 1% 0 - 0
1 0 0 1 0 0 1 0 0 0 1 0 0 0 0 1 0 1
0 - - 0 - - 0 - - - 0 - - - - 0 - 0
233 43 64 52 72 115 111 31 28 14 98 50 8 29 19 233 36 189
22% 25% 21% 19% 22% 21% 22% 31% 29% 18% 24% 15% 17% 10% 11% 28% 28% 21%JL L L NO
668 111 195 166 193 344 312 60 63 55 220 235 32 41 23 668 87 565
62% 65% 65% 60% 60% 63% 62% 61% 66% 71% 54% 69% 68% 14% 13% 81% 68% 62%K K K NO
2 1 0 1 0 1 1 0 0 0 2 0 0 2 0 2 1 1
0 1% - 0 - 0 0 - - - 0 - - 1% - 0 1% 0
18 4 5 4 5 5 12 0 2 4 9 2 0 18 1 5 6 11
2% 2% 2% 1% 2% 1% 2% - 2% 5% 2% 1% - 6% 1% 1% 5% 1%HL OP R
36 8 10 10 7 13 20 4 1 3 21 6 1 36 10 17 8 26
3% 5% 3% 4% 2% 2% 4% 4% 1% 4% 5% 2% 2% 12% 6% 2% 6% 3%L OP P R
19 2 2 5 8 11 6 2 2 0 12 2 0 19 1 5 2 14
2% 1% 1% 2% 2% 2% 1% 2% 2% - 3% 1% - 7% 1% 1% 2% 2%L OP
39 4 11 12 7 19 13 2 4 0 19 10 2 0 0 0 0 22
4% 2% 4% 4% 2% 3% 3% 2% 4% - 5% 3% 4% - - - - 2%
1278 220 350 323 370 645 598 125 116 91 496 381 53 406 235 996 173 1048
118% 129% 117% 117% 115% 118% 119% 126% 121% 118% 122% 111% 113% 140% 137% 121% 135% 116%
Summary
122 21 29 35 37 64 57 14 7 9 57 27 5 122 122 0 13 105
11% 12% 10% 13% 11% 12% 11% 14% 7% 12% 14% 8% 11% 42% 71% - 10% 12%L P NP
20 3 5 6 5 10 10 0 0 0 9 9 1 20 0 0 1 19
2% 2% 2% 2% 2% 2% 2% - - - 2% 3% 2% 7% - - 1% 2%OP
10 2 4 2 2 5 5 1 1 0 4 4 0 10 0 0 0 9
1% 1% 1% 1% 1% 1% 1% 1% 1% - 1% 1% - 3% - - - 1%OP
20 2 5 8 4 9 11 0 2 1 6 10 0 20 0 0 2 17
2% 1% 2% 3% 1% 2% 2% - 2% 1% 1% 3% - 7% - - 2% 2%OP
753 118 219 186 226 385 352 71 73 58 253 258 34 0 0 753 92 643
70% 69% 73% 67% 70% 70% 70% 72% 76% 75% 62% 75% 72% - - 92% 72% 71%K K K NO
12 2 4 2 4 3 8 0 2 3 4 2 0 12 0 0 2 9
1% 1% 1% 1% 1% 1% 2% - 2% 4% 1% 1% - 4% - - 2% 1%HL OP
106 18 22 25 38 52 48 11 7 6 53 23 5 106 49 69 18 81
10% 11% 7% 9% 12% 10% 10% 11% 7% 8% 13% 7% 11% 37% 29% 8% 14% 9%L OP P
290 48 69 78 90 143 139 26 19 19 133 75 11 290 171 69 36 240
27% 28% 23% 28% 28% 26% 28% 26% 20% 25% 33% 22% 23% 100% 100% 8% 28% 27%IL P P
All non-white/BIPOC
Proportions/Means: Columns Tested (5% risk level) - B/C/D/E - F/G - H/I/J/K/L/M - N/O/P - Q/R Overlap formulae used. * small base
Latin/Hispanic only(exclusive)
Middle Eastern, West/Southwest Asian, North African
only (exclusive)
White only (exclusive)
Indigenous only (exclusive)
Mixed race/other
Other (specify)
Prefer not to answer
Sigma
Asian only (exclusive)
Black only (exclusive)
European (e.g. British, French, Spanish,
Portuguese, Mediterranean, Polish, Russian)
North American (e.g. Canadian)
South American (e.g. Argentinian, Chilean)
Indigenous including First Nations, Métis or Inuk (Inuit)
Mixed race (a combination of any of the above
categories)
European (e.g., British, French, Spanish,
Portuguese, Mediterranean)
West Asia (e.g. Iranian, Afghani)
WHITE (NET)
African (e.g., Afrikaner)
Australian and New Zealand
European (e.g., British, French, Spanish,
Portuguese, Mediterranean)
South American (e.g., Brazilian, Argentinian)
MIDDLE EASTERN (NET)
North African (e.g. Algerian, Libyan,
Mediterranean, Moroccan)
Middle Eastern (e.g. Syrian, Lebanese)
Caribbean (e.g., Bajan, Haitian, Jamaican,
Grenadian)
North American (e.g., Canadian, American)
South and Central American (e.g., Brazilian,
Panamanian)
LATIN/HISPANIC (NET)
North or Central American (e.g., Mexican,
Honduran)
Asian Caribbean (e.g., Guyanese, Trinidadian)
South Asian (e.g., Indian, Pakistani, Sri Lankan)
South East Asian (e.g., Malaysian, Filipino,
Vietnamese)
BLACK (NET)
African (e.g. Ghanaian, Kenyan, Nigerian,
Somali)
ASIAN (NET)
Chinese
Korean
European (e.g., British, French, Spanish,
Portuguese, Mediterranean)
Asian African (e.g., South Africa, Nigeria,
Madagascar, Kenya)
q23. What ethno-cultural or racial group(s) do you identify with? Please select all that apply.
Age Gender Region Ethnocultural background/race If identify as LGBTQ2S+
Ipsos11 of 56

Online Harm in Journalism Detailed Tables
Total <30 30-39 40-49 50+ Male Female
BC/Territorie
s AB MB/SK ON QC ATL
All non-
white/BIPOC Asian (NET) White (NET) Yes No
A B C D E F G H I J K L M N O P Q R
Base: All respondents excluding students and those
fully retired from the media sector 1082 170 299 276 323 547 504 99* 96* 77* 405 343 47* 290 171 822 128 905
128 50 39 16 22 53 62 11 10 8 56 33 5 36 23 106 128 0
12% 29% 13% 6% 7% 10% 12% 11% 10% 10% 14% 10% 11% 12% 13% 13% 100% -
CDE DE R
905 112 251 242 292 475 425 85 83 69 329 294 38 240 141 695 0 905
84% 66% 84% 88% 90% 87% 84% 86% 86% 90% 81% 86% 81% 83% 82% 85% - 100%B B BC Q
49 8 9 18 9 19 17 3 3 0 20 16 4 14 7 21 0 0
5% 5% 3% 7% 3% 3% 3% 3% 3% - 5% 5% 9% 5% 4% 3% - -
CE J J P
1082 170 299 276 323 547 504 99 96 77 405 343 47 290 171 822 128 905
100% 100% 100% 100% 100% 100% 100% 100% 100% 100% 100% 100% 100% 100% 100% 100% 100% 100%
Proportions/Means: Columns Tested (5% risk level) - B/C/D/E - F/G - H/I/J/K/L/M - N/O/P - Q/R Overlap formulae used. * small base
Yes
No
Prefer not to answer
Sigma
q24. Do you identify as lesbian, gay, bisexual, transgender, queer, Two-Sprit, intersex, and/or non-binary?
Age Gender Region Ethnocultural background/race If identify as LGBTQ2S+
Ipsos11 of 56

Online Harm in Journalism Detailed Tables
Total <30 30-39 40-49 50+ Male Female
BC/Territorie
s AB MB/SK ON QC ATL
All non-
white/BIPOC Asian (NET) White (NET) Yes No
A B C D E F G H I J K L M N O P Q R
Base: All respondents 1093 170 299 276 323 547 504 99* 96* 77* 405 343 47* 290 171 822 128 905
737 116 202 184 220 366 348 91 92 70 384 49 35 218 131 539 92 611
67% 68% 68% 67% 68% 67% 69% 92% 96% 91% 95% 14% 74% 75% 77% 66% 72% 68%LM LM LM LM L P P
356 54 97 92 103 181 156 8 4 7 21 294 12 72 40 283 36 294
33% 32% 32% 33% 32% 33% 31% 8% 4% 9% 5% 86% 26% 25% 23% 34% 28% 32%HIJKM HIJK NO
1093 170 299 276 323 547 504 99 96 77 405 343 47 290 171 822 128 905
100% 100% 100% 100% 100% 100% 100% 100% 100% 100% 100% 100% 100% 100% 100% 100% 100% 100%
English
French
Sigma Proportions/Means: Columns Tested (5% risk level) - B/C/D/E - F/G - H/I/J/K/L/M - N/O/P - Q/R Overlap formulae used. * small base
UserLanguage
Age Gender Region Ethnocultural background/race If identify as LGBTQ2S+
Ipsos11 of 56

Online Harm in Journalism Detailed Tables
Total <30 30-39 40-49 50+ Male Female
BC/Territorie
s AB MB/SK ON QC ATL
All non-
white/BIPOC Asian (NET) White (NET) Yes No
A B C D E F G H I J K L M N O P Q R
Base: All respondents 1093 170 299 276 323 547 504 99* 96* 77* 405 343 47* 290 171 822 128 905
185 28 59 50 46 99 83 16 27 19 102 11 8 48 26 141 18 161
17% 16% 20% 18% 14% 18% 16% 16% 28% 25% 25% 3% 17% 17% 15% 17% 14% 18%L HL L L L
101 27 31 15 24 50 47 17 11 10 46 9 4 42 24 66 20 75
9% 16% 10% 5% 7% 9% 9% 17% 11% 13% 11% 3% 9% 14% 14% 8% 16% 8%DE D L L L L L P P R
387 55 101 120 107 168 207 39 27 30 137 112 34 107 66 284 53 315
35% 32% 34% 43% 33% 31% 41% 39% 28% 39% 34% 33% 72% 37% 39% 35% 41% 35%BCE F HIJKL
20 4 8 5 3 11 9 1 0 0 6 13 0 3 3 19 1 19
2% 2% 3% 2% 1% 2% 2% 1% - - 1% 4% - 1% 2% 2% 1% 2%K
199 31 56 49 53 104 79 0 0 0 3 186 0 40 22 152 17 162
18% 18% 19% 18% 16% 19% 16% - - - 1% 54% - 14% 13% 18% 13% 18%HIJKM
1 0 0 1 0 1 0 0 0 0 0 0 0 0 0 1 0 1
0 - - 0 - 0 - - - - - - - - - 0 - 0
6 0 1 2 3 4 2 0 0 0 6 0 0 5 3 2 0 6
1% - 0 1% 1% 1% 0 - - - 1% - - 2% 2% 0 - 1%L P P
26 3 9 2 12 12 14 12 4 3 6 0 1 2 2 25 3 23
2% 2% 3% 1% 4% 2% 3% 12% 4% 4% 1% - 2% 1% 1% 3% 2% 3%D D IKL L L L L N
8 2 1 4 1 5 3 0 2 0 6 0 0 2 2 6 1 7
1% 1% 0 1% 0 1% 1% - 2% - 1% - - 1% 1% 1% 1% 1%L L
87 9 15 15 44 57 28 14 25 15 23 10 0 17 12 70 4 80
8% 5% 5% 5% 14% 10% 6% 14% 26% 19% 6% 3% - 6% 7% 9% 3% 9%BCD G KLM HKLM KLM Q
60 9 16 13 22 29 27 0 0 0 60 0 0 21 10 45 10 46
5% 5% 5% 5% 7% 5% 5% - - - 15% - - 7% 6% 5% 8% 5%HIJLM
13 2 2 0 8 7 5 0 0 0 10 2 0 3 1 11 1 10
1% 1% 1% - 2% 1% 1% - - - 2% 1% - 1% 1% 1% 1% 1%D L
1093 170 299 276 323 547 504 99 96 77 405 343 47 290 171 822 128 905
100% 100% 100% 100% 100% 100% 100% 100% 100% 100% 100% 100% 100% 100% 100% 100% 100% 100%
TorontoStar
(DK/NS)
Sigma Proportions/Means: Columns Tested (5% risk level) - B/C/D/E - F/G - H/I/J/K/L/M - N/O/P - Q/R Overlap formulae used. * small base
JHR
NEPMCC
NMC
Other
Postmedia
Bell
CAJ
CBC
FAQPage
FPJO
Association
Age Gender Region Ethnocultural background/race If identify as LGBTQ2S+
Ipsos11 of 56