The relationship between the presence of extra α-globin genes and blood cell traits in Altamurana...
13
Genet. Sel. Evol. 35 (Suppl. 1) (2003) S121–133 S121 © INRA, EDP Sciences, 2003 DOI: 10.1051/gse:2003021 Original article The relationship between the presence of extra α-globin genes and blood cell traits in Altamurana sheep Elisa PIERAGOSTINI a * , Ferruccio PETAZZI b , Aldo DI LUCCIA c a Department of Engineering and Management of the Agricultural, Livestock and Forest Systems, University of Bari, Via Amendola, 165/A, 70100 Bari, Italy b Department of Animal Health and Well-being, University of Bari, Provinciale per Casamassima km 3, 70010 Valenzano (BA), Italy c Department of Animal Production, University of Bari, Via Amendola, 165/A, 70100 Bari, Italy (Accepted 4 February 2003) Abstract – Additional α-globin genes in sheep might produce extra α-globin chains and, con- sequently, the subject carrying triplicated (ααα) or quadruplicated (αααα) haplotypes may exhibit different hematological phenotypes when compared to the normal duplicated (αα) homozygotes (NN). Both ααα and αααα heterozygous (ND) and ααα and αααα homozygous (DD) individuals were obtained by selection and inbreeding. Chromatographic RP-HPLC analyses of the globin chains of 65 subjects (15 DD, 20 ND and 30 NN) were performed. A highly significant linear regression (r 2 = 0.967) of the α/β ratio on the number of α-globin genes was found, and the α/β ratio ranged on average from 1.0 in NN individuals to 1.2 in the ND and 1.6 in the DD subjects. Values for blood fell within the range of normality but were rather peculiar as a whole. When the erythrocytes of individuals carrying normal arrangements were compared with those of subjects with extra α-genes, the latter had fewer erythrocytes that were bigger in size and had a higher Hb content and a greater osmotic fragility. This hematological picture is consistent with the existence of an unbalanced α/β ratio. erythrocytes / hemoglobin / α/β ratio / endemic TBD 1. INTRODUCTION In sheep, as in humans and most other mammals, there are two α-globin genes (Iα and IIα), which are expressed at different levels, the upstream gene being the most efficient [19]. The high polymorphism of Altamurana sheep * Correspondence and reprints E-mail: [email protected]
Transcript of The relationship between the presence of extra α-globin genes and blood cell traits in Altamurana...
Genet. Sel. Evol. 35 (Suppl. 1) (2003) S121–133 S121© INRA, EDP Sciences, 2003DOI: 10.1051/gse:2003021
Original article
The relationship between the presenceof extraα-globin genes and blood cell
traits in Altamurana sheep
Elisa PIERAGOSTINIa∗, Ferruccio PETAZZIb, Aldo DI LUCCIAc
a Department of Engineering and Management of the Agricultural,Livestock and Forest Systems, University of Bari,
Via Amendola, 165/A, 70100 Bari, Italyb Department of Animal Health and Well-being, University of Bari,Provinciale per Casamassima km 3, 70010 Valenzano (BA), Italy
c Department of Animal Production, University of Bari,Via Amendola, 165/A, 70100 Bari, Italy
(Accepted 4 February 2003)
Abstract – Additionalα-globin genes in sheep might produce extraα-globin chains and, con-sequently, the subject carrying triplicated (ααα) or quadruplicated (αααα) haplotypes mayexhibit different hematological phenotypes when compared to the normal duplicated (αα)homozygotes (NN). Bothααα andαααα heterozygous (ND) andααα andαααα homozygous(DD) individuals were obtained by selection and inbreeding. Chromatographic RP-HPLCanalyses of the globin chains of 65 subjects (15DD, 20 ND and 30NN) were performed. Ahighly significant linear regression (r2 = 0.967) of theα/β ratio on the number ofα-globin geneswas found, and theα/β ratio ranged on average from 1.0 inNN individuals to 1.2 in theNDand 1.6 in theDD subjects. Values for blood fell within the range of normality but were ratherpeculiar as a whole. When the erythrocytes of individuals carrying normal arrangements werecompared with those of subjects with extraα-genes, the latter had fewer erythrocytes that werebigger in size and had a higher Hb content and a greater osmotic fragility. This hematologicalpicture is consistent with the existence of an unbalancedα/β ratio.
erythrocytes / hemoglobin /α/β ratio / endemic TBD
1. INTRODUCTION
In sheep, as in humans and most other mammals, there are twoα-globingenes (Iα andIIα), which are expressed at different levels, the upstream genebeing the most efficient [19]. The high polymorphism of Altamurana sheep
∗ Correspondence and reprintsE-mail: [email protected]
S122 E. Pieragostiniet al.
L�
L�
�L�
��
��
��
L�
L�L� L�
L�����
��
�� ��
Locus�
Iα�
IIα�
IIIα�
I� α�
����
���� �����
����
����
���� �
����
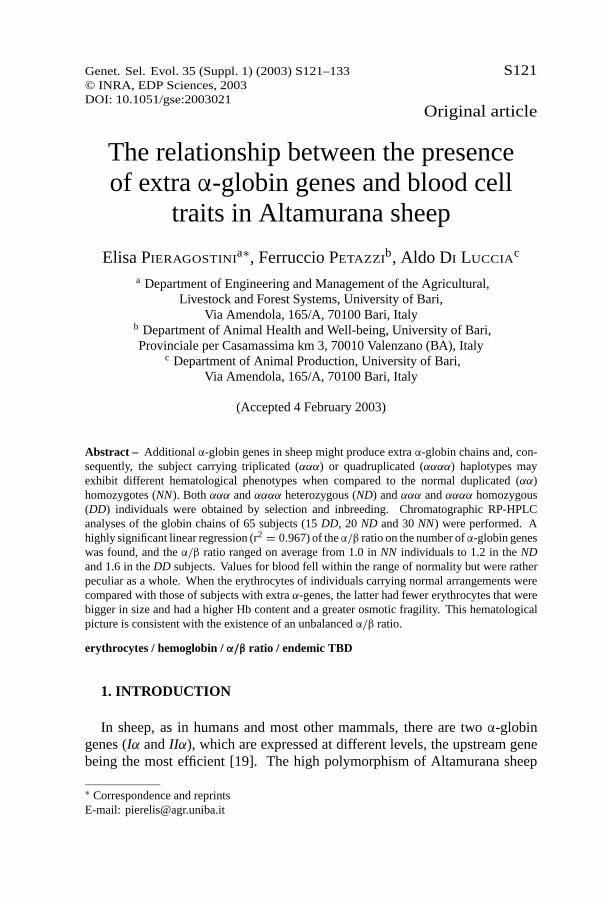
Figure 1. α-globin gene haplotypes detected in sheep. The gene efficiency (%) isindicated in parentheses. Alpha globin alleles are indicated by the capital lettercorresponding to the relevant point mutation (L= 113 Leu; H= 113 His; A= 8 Ala,113 Leu; D= 15 Gly, 113 Leu).
for the α-globin genes with the presence of the rareαD (Fig. 1) presenteda good opportunity to study the organisation of the related gene cluster byselecting and inbreeding theαD carriers. Previous work showed that theαD
allele is a marker for the presence of extraα-genes and that the general trend ofexpression of duplicatedα-genes was confirmed in the cases of gene triplicationand quadruplication for which theα-chain output of the downstream genesprogressively decreased [20,22]. Also in the quadruplicated haplotype, the 3′gene encoding the 113His-chain appears to have an efficiency of approximately1% [9,21]. Parallel investigations at the population level demonstrated thatLeccese and Gentile di Puglia, the other two Apulian native sheep breeds,also exhibit a high polymorphism at theα-globin gene arrangements withapproximately the same frequency of extra-numeralα-genes as that in theAltamurana sheep [10,11]. In 1994, Pieragostiniet al. [10] also noted thatHbD Leccese sheep had a lower packed cell volume (PCV) and haemoglobincontent than the common-type sheep.
Our working hypothesis was that the additionalα-globin genes in sheep mayproduce extraα-globin chains. Consequently, the subjects carrying triplicatedor quadruplicated haplotypes may exhibit different hematological phenotypeswhen compared to the normal duplicated homozygotes. By selecting andinbreeding the above founder Altamurana group, a small flock of homozy-gotes and heterozygotes for extraα-globin genes was set up to carry out thehematological investigation reported in this paper.
RBC values and extraα-globin genes in sheep S123
Table I. Nomenclature of sheep genotypes.
Gene arrangements Runningname
Genenumber× haplo-
type
Groupingas to genenumber
IαL–II αH/IαL–II αL
IαA–II αH/IαL–II αL
IαA–II αH/IαA–II αH
LH/LL
AH/LL
(AH)2
2/2
NN(30)
IαL–II αL–III αH/IαL–II αL
IαD–II αL–III αH/IαL–II αL
IαD–II αL–III αH/IαA–II αH
IαD–II αL–III αL–IVαH/IαL–II αL
LLH/LL
DLH/LL
DLH/AH
DLLH/LL
3/2
}4/2
ND(20)
IαD–II αL–III αH/IαL–II αL–III αH
IαD–II αL–III αH/IαD–II αL–III αH
IαD–II αL–III αL–IVαH/IαD–II αL–III αH
IαD–II αL–III αL–IVαH/IαD–II αL–III αL–IVαH
DLH/LLH
(DLH)2
DLLH/DLH
DLLH/DLLH
3/3
}4/3}4/4
DD(15)
2. MATERIALS AND METHODS
2.1. Nomenclature
To describe the sheep alpha globin gene alleles, superscripts were placedon the right with the capital letter indicating the relative point mutation:αL =α113Leu; αA = α8Ser→Ala,113Leu; αD = α15Gly→Asp,113Leu; αH = α113Leu→His.Analogously, theα-haplotypes have been described by the sequence of capitalletters corresponding to the proper gene (Tab. I).
2.2. Animals
From a small Altamurana inbred flock well characterised for globin [20], 30sheep carrying normal duplicated haplotypes and all possessing theII αH gene asa marker (NN), were sampled and compared with 35 individuals characterisedby extra-numeralα-globin gene arrangements. Of these 35 subjects, 20 wereheterozygotes carrying either one triple or quadruple chromosome (ND), and15 had only haplotypes with extra genes (DD) (Tab. I).
S124 E. Pieragostiniet al.
2.3. Blood analyses
Blood was sampled in the morning between 6:30 and 8:30, and bloodmeasurements were carried out right after blood sampling.
Cell count (RBC), hemoglobin content (Hb) and packed cell volume (PCV)were measured on red blood cells. Mean corpuscular volume (MCV), meancorpuscular hemoglobin (MCH) and mean corpuscular hemoglobin concen-tration (MCHC) were calculated. Erythrocytes and leukocytes (WBC) werecounted with a standardised automatic counter. The hemoglobin content (Hb)was determined by colorimetry [1] (Tab. II). The erythrocyte fragility test wasperformed by exposing erythrocytes to hypotonic saline solutions starting from0.84% and decreasing by 0.02% (Tab. III).
2.4. Qualitative and quantitative analyses of hemoglobin
The tetramers were analysed by PAGIF [3]. Densitometric evaluation ofthe Hb bands was obtained by using a computerised Ultrascan XL enhancedlaser densitometer equipped with Gelscan 2.0 software from Pharmacia-LKB(Uppsala Sweden).
2.5. RP-HPLC
The globin separation was performed by RP-HPLC using the analyticalVydac large-pore (300 Å) C4 column (Hesperia, CA), as partly described bySchroederet al. [15]. The chromatogram was developed with a linear gradientbetween solvent A (20% acetonitrile - 80% water containing 0.1% trifluoraceticacid, TFA) and solvent B (60% acetonitrile - 40% water containing 0.1%trifluoracetic acid, TFA). The gradient was 48% - 63% in 100 min at a flow rateof 1 mL ·min−1. The effluent was monitored at 220 nm. The chromatographicpeaks were computed with an LCI 100 computing integrator (Perkin Elmer,Norwalk, CT).
2.6. Statistics
The effects of theα-globin gene arrangement on the data sets obtained bythe hematological examinations were analysed by least-squares analyses ofvariance. A linear regression analysis of the value of theα/β ratio on thenumber ofα-globin genes was performed to investigate their relationship.
3. RESULTS
3.1. Hematological profiles
The hematological profiles of sheep classified on the basis of theα-globingene arrangements are shown in Table II. Significant differences were observedfor RBC and MCV. In both groups, all the parameters fell in the normal
RB
Cvalues
andextraα-globin
genesin
sheepS
125
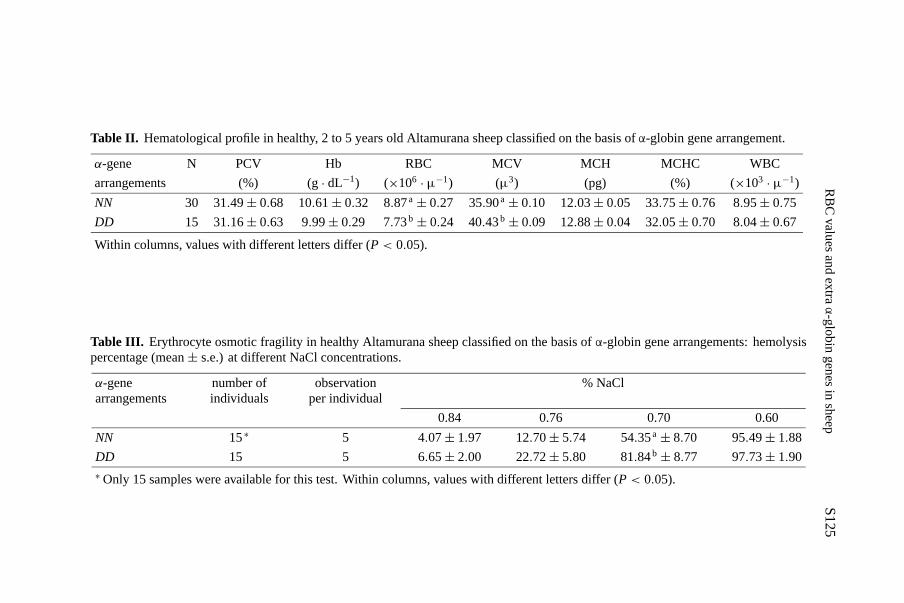
Table II. Hematological profile in healthy, 2 to 5 years old Altamurana sheep classified on the basis ofα-globin gene arrangement.
α-gene N PCV Hb RBC MCV MCH MCHC WBC
arrangements (%) (g· dL−1) (×106 · µ−1) (µ3) (pg) (%) (×103 · µ−1)
NN 30 31.49± 0.68 10.61± 0.32 8.87a± 0.27 35.90a± 0.10 12.03± 0.05 33.75± 0.76 8.95± 0.75
DD 15 31.16± 0.63 9.99± 0.29 7.73b± 0.24 40.43b ± 0.09 12.88± 0.04 32.05± 0.70 8.04± 0.67
Within columns, values with different letters differ (P< 0.05).
Table III. Erythrocyte osmotic fragility in healthy Altamurana sheep classified on the basis ofα-globin gene arrangements: hemolysispercentage (mean± s.e.) at different NaCl concentrations.
α-genearrangements
number ofindividuals
observationper individual
% NaCl
0.84 0.76 0.70 0.60
NN 15∗ 5 4.07± 1.97 12.70± 5.74 54.35a± 8.70 95.49± 1.88
DD 15 5 6.65± 2.00 22.72± 5.80 81.84b± 8.77 97.73± 1.90∗Only 15 samples were available for this test. Within columns, values with different letters differ (P< 0.05).
S126 E. Pieragostiniet al.
range [4,5] except for RBC of theDD group which revealed a mild anemiccondition. In theDD individuals the numerical deficiency of red blood cellswas compensated for by the fact that the mean corpuscular volume (MCV)increased by about 12% as did the mean corpuscular hemoglobin (MCH).
Table III shows that the osmotic fragility of erythrocytes in theDD groupwas higher than in theNN group at all NaCl concentrations, but the differencewas only significant at the 0.7 NaCl concentration for which theDD groupreached 82% of hemolysis against 54% for theNN group, which was in thenormal range [7].
3.2. Hemoglobin system analyses
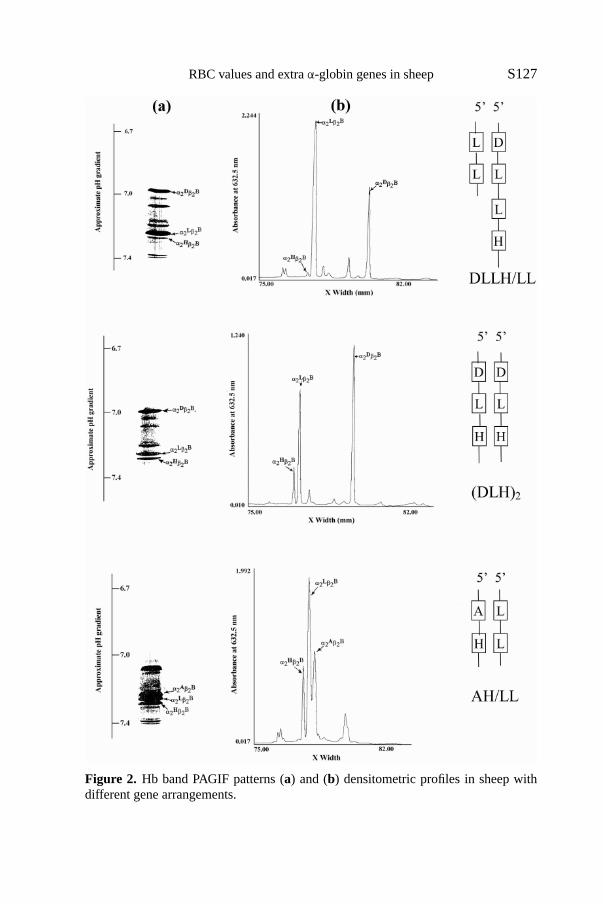
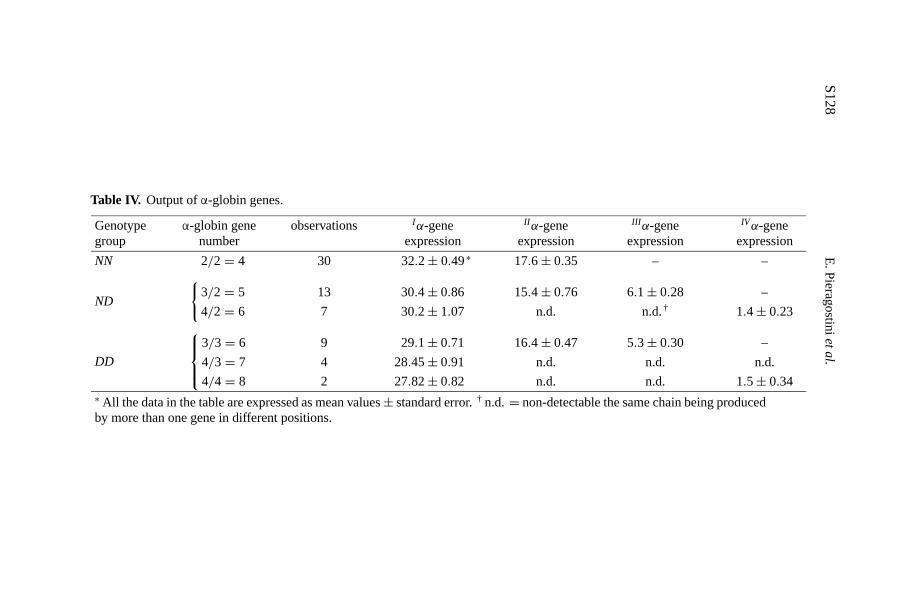
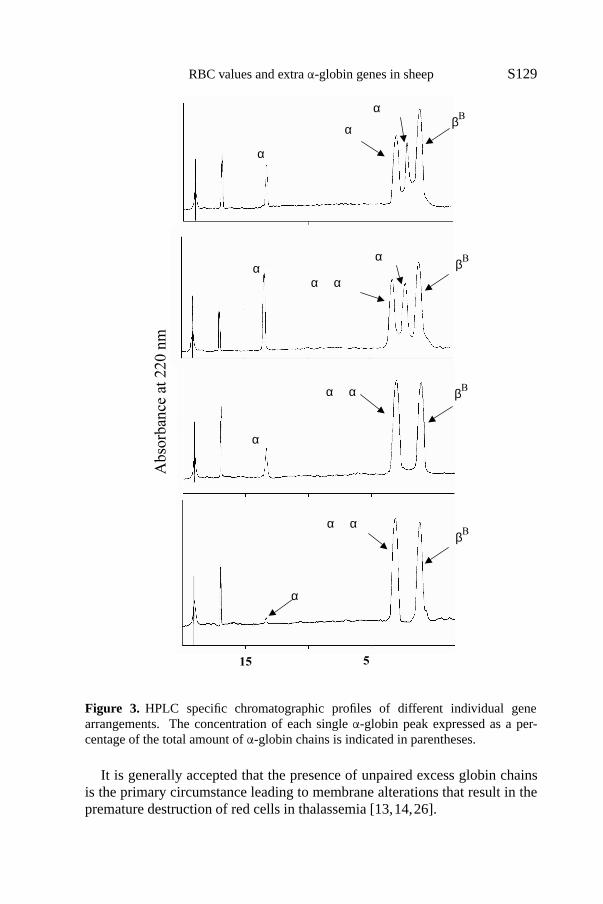
Specific chromatographic profiles were obtained for different individualgene arrangements as shown in Figures 2 and 3. Table IV provides the findingson the output ofα-genes inferred from the Hb PAGIF bands and the RP-HPLC chromatographic peaks. Overall, it seems that the 5′ gene expressed adecreasing percentage of product as the gene number increased. Table V showsthe output ofIα andII α genes as estimated from the concentrations of differentα-globin chains on the basis of the densitometric evaluation of their relevantHb PAGIF bands in the three genotype groups, and the observed values werecompared with the expected values based on previous experiments [20,22].These data suggest that, on the contrary, there is asurplusof product recordedat theII α gene level in the triple and quadrupleα-haplotypes.
The RP-HPLC analysis could not distinguish between the alpha D and thealpha L chains, but this had no consequence on the evaluation of theα/β
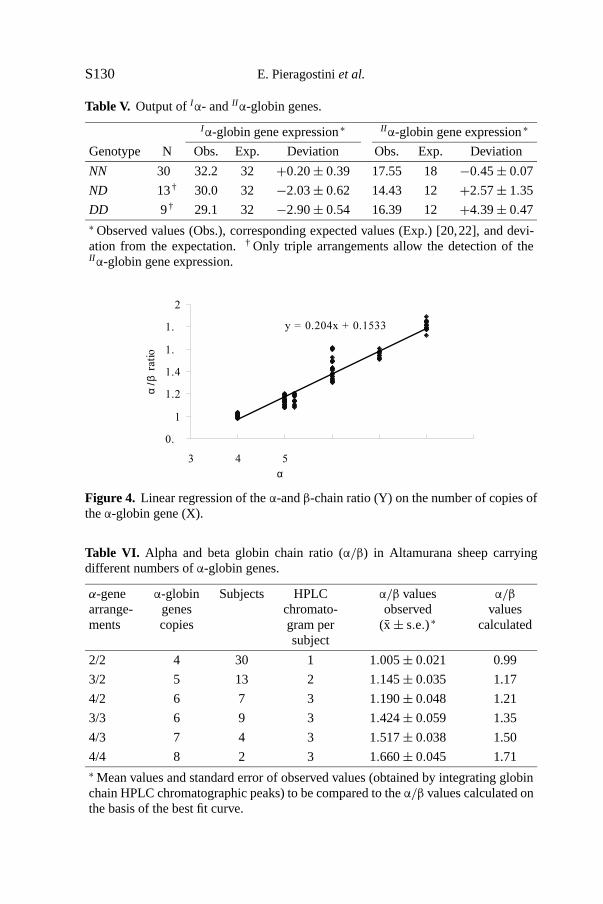
ratio since the total amounts ofα-globin chains and ofβ-globin chains werecompared. The association between the number ofα-globin genes and theα/βratio values is represented by the regression line in Figure 4. The relationshipbetween the two variables was positive and linear. The close fit (r2 = 0.967)obtained by adjusting the regression line was also illustrated by comparingexpectedα/β values with values obtained by integrating globin chain HPLCchromatographic peaks (Tab. VI).
4. DISCUSSION
The hematological profile ofDD individuals, taken together with the evid-ence of the increased osmotic fragility of their erythrocytes, seems to beconsistent with an accelerated erythrocyte turnover. It is conceivable to ascribethese phenomena to the accumulation of excess, unmatchedα-globin chains,which was already found to be strongly correlated to the erythrocyte lifespanin humans [23].
RBC values and extraα-globin genes in sheep S127
Figure 2. Hb band PAGIF patterns (a) and (b) densitometric profiles in sheep withdifferent gene arrangements.
S128
E.P
ieragostinietal.
Table IV. Output ofα-globin genes.
Genotypegroup
α-globin genenumber
observations Iα-geneexpression
II α-geneexpression
III α-geneexpression
IVα-geneexpression
NN 2/2= 4 30 32.2± 0.49∗ 17.6± 0.35 – –
ND
{3/2= 5
4/2= 6
13
7
30.4± 0.86
30.2± 1.07
15.4± 0.76
n.d.
6.1± 0.28
n.d.†–
1.4± 0.23
DD
3/3= 6
4/3= 7
4/4= 8
9
4
2
29.1± 0.71
28.45± 0.91
27.82± 0.82
16.4± 0.47
n.d.
n.d.
5.3± 0.30
n.d.
n.d.
–
n.d.
1.5± 0.34∗ All the data in the table are expressed as mean values± standard error.† n.d.= non-detectable the same chain being producedby more than one gene in different positions.
RBC values and extraα-globin genes in sheep S129
βB
α� ����
α� ����
α� ��� ���
���
α� �� � α� � α� � �
α� ���� βB
���
α� ����
α� � α� �� βB
���
α� ���
α� � α� ���
15� ��� �5�
���� � ��� �
βB
Absorbance at 220 nm
Figure 3. HPLC specific chromatographic profiles of different individual genearrangements. The concentration of each singleα-globin peak expressed as a per-centage of the total amount ofα-globin chains is indicated in parentheses.
It is generally accepted that the presence of unpaired excess globin chainsis the primary circumstance leading to membrane alterations that result in thepremature destruction of red cells in thalassemia [13,14,26].
S130 E. Pieragostiniet al.
Table V. Output ofIα- andII α-globin genes.
Iα-globin gene expression∗ II α-globin gene expression∗
Genotype N Obs. Exp. Deviation Obs. Exp. Deviation
NN 30 32.2 32 +0.20± 0.39 17.55 18 −0.45± 0.07
ND 13† 30.0 32 −2.03± 0.62 14.43 12 +2.57± 1.35
DD 9† 29.1 32 −2.90± 0.54 16.39 12 +4.39± 0.47∗Observed values (Obs.), corresponding expected values (Exp.) [20,22], and devi-ation from the expectation.† Only triple arrangements allow the detection of theII α-globin gene expression.
y = 0.204x + 0.1533
0.
1
1.2
1.4
1.�
1.
2
3 4 5 � � �
α � � �� � �� � � � � � � � � � �
α/β
ratio
Figure 4. Linear regression of theα-andβ-chain ratio (Y) on the number of copies oftheα-globin gene (X).
Table VI. Alpha and beta globin chain ratio (α/β) in Altamurana sheep carryingdifferent numbers ofα-globin genes.
α-genearrange-ments
α-globingenescopies
Subjects HPLCchromato-gram persubject
α/β valuesobserved
(x̄± s.e.) ∗
α/βvalues
calculated
2/2 4 30 1 1.005± 0.021 0.99
3/2 5 13 2 1.145± 0.035 1.17
4/2 6 7 3 1.190± 0.048 1.21
3/3 6 9 3 1.424± 0.059 1.35
4/3 7 4 3 1.517± 0.038 1.50
4/4 8 2 3 1.660± 0.045 1.71∗Mean values and standard error of observed values (obtained by integrating globinchain HPLC chromatographic peaks) to be compared to theα/β values calculated onthe basis of the best fit curve.
RBC values and extraα-globin genes in sheep S131
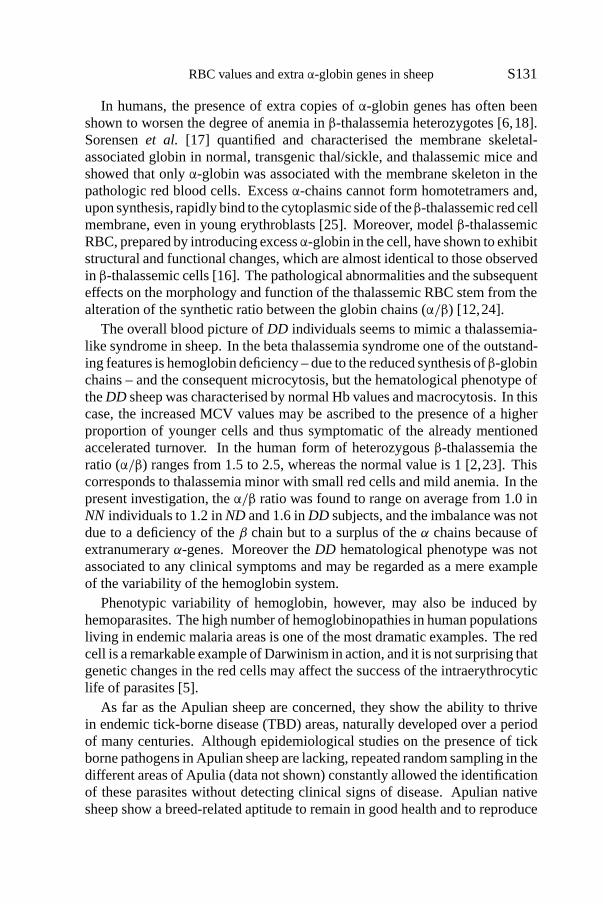
In humans, the presence of extra copies ofα-globin genes has often beenshown to worsen the degree of anemia inβ-thalassemia heterozygotes [6,18].Sorensenet al. [17] quantified and characterised the membrane skeletal-associated globin in normal, transgenic thal/sickle, and thalassemic mice andshowed that onlyα-globin was associated with the membrane skeleton in thepathologic red blood cells. Excessα-chains cannot form homotetramers and,upon synthesis, rapidly bind to the cytoplasmic side of theβ-thalassemic red cellmembrane, even in young erythroblasts [25]. Moreover, modelβ-thalassemicRBC, prepared by introducing excessα-globin in the cell, have shown to exhibitstructural and functional changes, which are almost identical to those observedin β-thalassemic cells [16]. The pathological abnormalities and the subsequenteffects on the morphology and function of the thalassemic RBC stem from thealteration of the synthetic ratio between the globin chains (α/β) [12,24].
The overall blood picture ofDD individuals seems to mimic a thalassemia-like syndrome in sheep. In the beta thalassemia syndrome one of the outstand-ing features is hemoglobin deficiency – due to the reduced synthesis ofβ-globinchains – and the consequent microcytosis, but the hematological phenotype oftheDD sheep was characterised by normal Hb values and macrocytosis. In thiscase, the increased MCV values may be ascribed to the presence of a higherproportion of younger cells and thus symptomatic of the already mentionedaccelerated turnover. In the human form of heterozygousβ-thalassemia theratio (α/β) ranges from 1.5 to 2.5, whereas the normal value is 1 [2,23]. Thiscorresponds to thalassemia minor with small red cells and mild anemia. In thepresent investigation, theα/β ratio was found to range on average from 1.0 inNN individuals to 1.2 inND and 1.6 inDD subjects, and the imbalance was notdue to a deficiency of theβ chain but to a surplus of theα chains because ofextranumeraryα-genes. Moreover theDD hematological phenotype was notassociated to any clinical symptoms and may be regarded as a mere exampleof the variability of the hemoglobin system.
Phenotypic variability of hemoglobin, however, may also be induced byhemoparasites. The high number of hemoglobinopathies in human populationsliving in endemic malaria areas is one of the most dramatic examples. The redcell is a remarkable example of Darwinism in action, and it is not surprising thatgenetic changes in the red cells may affect the success of the intraerythrocyticlife of parasites [5].
As far as the Apulian sheep are concerned, they show the ability to thrivein endemic tick-borne disease (TBD) areas, naturally developed over a periodof many centuries. Although epidemiological studies on the presence of tickborne pathogens in Apulian sheep are lacking, repeated random sampling in thedifferent areas of Apulia (data not shown) constantly allowed the identificationof these parasites without detecting clinical signs of disease. Apulian nativesheep show a breed-related aptitude to remain in good health and to reproduce
S132 E. Pieragostiniet al.
while harbouring tick borne pathogens. Indeed, Altamurana sheep infectedwith Babesia ovisare able to control parasitemia and compensate the effectsof anaemia into a benign macrocytic and hyperchromic form. There is alsoevidence that the local sheep breeds cope with anoxemic stress by producingred globules enriched with hemoglobin and accelerating the turnover of olderand less efficient red blood cells [8].
In our opinion, the findings of this investigation should be considered inthe light of the tolerance that the Apulian sheep have developed toward TBDs.The alterations recorded inDD red blood cells may produce an unfavourableenvironment for the parasites. Accordingly, the high frequency of extranumer-ary haplotypes may be the result of a selective advantage of the correspondingphenotypes in endemic TBD areas.
ACKNOWLEDGEMENTS
The authors wish to acknowledge Athina Papa for revising the English ofthe manuscript.
REFERENCES
[1] Bostedt H., Mayer B., Über die Enwicklung des roten Hämogrammes bei Läm-mern in den ersten Lebenwochen unter natürlichen und artifiziellen Aufzuchbed-dingungen, Berl. Münch. Tierärztl. Wschr. 89 (1976) 1215–1216.
[2] Chalevelakis G., Clegg J.B., Weatherall D.J., Imbalanced globin chain synthesisin heterozygous beta-thalassemic bone marrow, Proc. Natl. Acad. Sci. USA 72(1975) 3853–3857.
[3] Di Luccia A., Iannibelli L., Pieragostini E., Ferrara L., Phenotyping of all sheephaemoglobin morphs, Small Rum. Res. 7 (1992) 189–194.
[4] Jain M.C., Shalm’s Veterinary Hematology, Lea and Febinger Publ., Philadelphia,1986.
[5] Luzzato L., About hemoglobins, G6PD and parasites in red cell, Experiencia 51(1995) 206–208.
[6] Ma S.K., Au W.Y., Chan A.Y., Chan L.C., Clinical phenotype of triplicated alpha-globin genes and heterozygosity for beta 0-thalassemia in Chinese subjects, Int.J. Mol. Med. 8 (2001) 171–175.
[7] Oyewale J.O., Osmotic fragility of erythrocytes of west African dwarf sheep andgoats: effects of temperature and pH, Br. Vet. J. 147 (1991) 163–170.
[8] Pieragostini E., Petazzi F., Genetics and tolerance to tick-borne diseases inSouth Italy: experience in studying native Apulian and exotic sheep breed,Parassitologia 41, Suppl. 1 (1999) 89–94.
[9] Pieragostini E., Di Luccia A., Vincenti D., Sheep hemoglobin polymorphism:densitometric evaluation of IEF profiles, in: Proceedings of the 23th Conf. ISAG,3–7 August 1992, Anim. Genet. 23, Suppl. 1, p. 28.
[10] Pieragostini E., Dario C., Bufano G., Haemoglobin phenotypes and hematolo-gical factors in Leccese sheep, Small Rum. Res. 13 (1994) 177–185.
RBC values and extraα-globin genes in sheep S133
[11] Pieragostini E., Di Luccia A., Rullo R., Alpha and beta globin gene polymorphismin Gentile di Puglia sheep, in: Proceedings of the 24th National Congress of TheScientific Association of Animal Production (ASPA), 12–15 June 2001, Vol. 24,University of Firenze, Firenze, pp. 91–93.
[12] Rachmilewitz E., Oppenheim A., Shalev O., The red blood cell in thalassemia,in: Nagel R.L. (Ed.), Genetically abnormal red cells, CRC Press, 1988, Vol. 1,pp. 137–160.
[13] Schrier S.L., Rachmilewitz E., Mohandas N., Cellular and membrane proper-ties of alpha and beta thalassemic erythrocytes are different: implication fordifferences in clinical manifestations, Blood 74 (1989) 2194–2202.
[14] Schrier S.L., Mohandas N., Globin-chain specificity of oxidation-inducedchanges in red blood cell membrane properties, Blood 79 (1992) 1586–1592.
[15] Schroeder W.A., Shelton J.B., Shelton J.R., Huynh V., Teplow D.B., High per-formance liquid chromatographic separation of the globin chains of non-humanhemoglobins, Hemoglobin 9 (1985) 461–482.
[16] Scott M.D., Entrapment of purified alpha-hemoglobin chains in normal erythro-cytes as a model for human beta-thalassemia, Adv. Exp. Med. Biol. 326 (1992)139–148.
[17] Sorensen S., Rubin E., Polster H., Mohandas N., Schrier S., The role of membraneskeletal-associated alpha-globin in the pathophysiology of beta-thalassemia,Blood 75 (1990) 1333–1336.
[18] Thompson C.C., Ali M.A., Vacovsky M., Boyadjian S., The interaction of anti3.7 type quadruplicated alpha-globin genes and heterozygous beta-thalassemia,Hemoglobin 13 (1989) 125–135.
[19] Vestri R., Salmaso S., Further evidence supporting the hypothesis of the duplic-ation of the hemoglobin alpha-chain locus in sheep, Biochem. Genet. 19 (1981)895–900.
[20] Vestri R., Pieragostini E., Yang F., Di Gregorio P., Rando A., Masina P., Expres-sion of triplicated and quadruplicated alfa globin genes in sheep, Br. J. Haematol.77 (1991) 110–116.
[21] Vestri R., Pieragostini E., Manca L., Masala B., Detection by revesed-phaseHPLC of trace amount of theα113 His globin chain in a sheep homozygous for aquadrupleα-globin gene chromosome, Int. J. Biochem. 25 (1993) 1939–1941.
[22] Vestri R., Pieragostini E., Ristaldi M.S., Expression gradient in sheep alpha alphaand alpha alpha alpha globin gene haplotypes: mRNA levels, Blood 83 (1994)2317–2322.
[23] Vigi V., Volpato S., Gaburro D., Conconi F., Bargellesi A., Pontremoli S., Thecorrelation between red-cell survival and excess of alpha-globin synthesis inbeta-thalassemia, Br. J. Haematol. 16 (1969) 25–30.
[24] Weatherall D.J., Clegg J.B., The Thalassaemia Syndromes, Blackwell Scientific,Oxford, 1981.
[25] Wilairat P., Kittikalayawong A., Chaicharoen S., The thalassemic red cell mem-brane, Southeast Asian J. Trop. Med. Public Health 23, Suppl. 2 (1992) 74–78.
[26] Yuan J., Bunyaratvej A., Fucharoen S., Fung C., Shinar E., Schrier S.L., Theinstability of the membrane skeleton in thalassemic red blood cells, Blood 86(1995) 3945–3950.