The relationship between synoptic weather systems and meteorological forcing on the North Carolina...
27
JOURNAL OF GEOPHYSICAL RESEARCH, VOL. 104, NO. C8, PAGES 18,159-18,185, AUGUST 15, 1999 The relationship between synoptic weather systems and meteorological forcing on the North Carolina inner shelf JayA. Austin 1 Massachusetts Institute of Technology/Woods Hole Oceanographic Institution Joint Program in Physical Oceanography, Woods Hole, Massachusetts Steven J. Lentz Department of Physical Oceanography, Woods Hole Oceanographic Institution, Woods Hole, Massachusetts Abstract. A strong relationshipis observed betweensynopticweather systems and atmospheric forcing of the oceanas estimated from buoy measurements made on the North Carolina inner shelf during August and October-November 1994 as part of the Coastal Ocean Processes (COOP)Inner ShelfStudy. Synoptic variation (timescales of daysto weeks) in the meteorological time series was primarily associated with the passage of atmosphericfrontal systems. The most common synoptic weather pattern observed was the passage of a low-pressure center to the north of the study site, which caused the associated cold front to pass over the study region. Before passage of the cold front, warm, moist northeastwardwinds increased the heat flux intothe ocean, whereas afterthe cold front passed, cold, dry southwestward winds decreased the heat flux into the ocean. In addition, in the presence of oceanic stratification, northeastwardwinds drove coastal upwelling, bringing colder water to the surface, further increasingthe air-sea temperature contrast and hence the heat flux into the ocean inshore of the surface front between cool upwelled water and warmer water offshore. The decrease in surface heat flux during the passage of a coldfront wasof order 400 W m -2, due primarily to a decrease in latent heat flux. Although other synoptic patterns were observed, including one warm front passage and two tropical storm systems, the dominanceof cold fronts as a source of variability resultedin a strongpositivecorrelation between the along-shelf component of wind stressand the surfaceheat flux. To addressthe issueof spatial variation in the surfaceheat fluxes, data from several different sources located along a cross-shelf transect were analyzed. This analysis suggests that the temperature of the atmospheric boundary layer undergoes adjustment when warm air blows over cold water but not when cold air blows over warm water. This producescross-shelf gradients in the bulk estimatesof turbulent heat fluxes during offshore winds but not during onshore winds. 1. Introduction The surfaceheat flux and wind stress play a crucial role in determining the behavior of the upper ocean, especially in the shallow coastal zone, where the entire water column can be directly influenced by atmospheric forcing [WinantandBeardsley, 1979; Leeet al., 1989]. This paper presents surface heat flux and wind stress 1Now at theCollege ofOceanic and Atmospheric Sciences, OregonState University,Corvallis Copyright 1999bytheAmerican Geophysical Union. Paper number 1999JC900016. 014g-O227/99/1999JC900016509.00 estimates from observations taken off the coast of North Carolina, north of Cape Hatteras during August and October/November 1994 as part of the CoastalOcean Processes (COOP) InnerShelf Study (ISS)field program [Burman, 1994]. The primary purpose of this paperis to describe the effectof synoptic weathersystems on the temporal and spatial variation in meteorological forcing. There have been few previous observational studies of the surface heat flux over U.S. continental shelves and even fewer which use direct in situ measurements of the radiative fluxes. On the U.S. west coast, Beardsley et al. [1998] estimated surface fluxes during the Coastal Ocean Dynamics Experiment(CODE) and the Surface Mixed Layer Experiment (SMILE). They studiedsea- sonal and synopticvariation during both experiments. 18,159
-
Upload
independent -
Category
Documents
-
view
1 -
download
0
Transcript of The relationship between synoptic weather systems and meteorological forcing on the North Carolina...
JOURNAL OF GEOPHYSICAL RESEARCH, VOL. 104, NO. C8, PAGES 18,159-18,185, AUGUST 15, 1999
The relationship between synoptic weather systems and meteorological forcing on the North Carolina inner shelf
Jay A. Austin 1 Massachusetts Institute of Technology/Woods Hole Oceanographic Institution Joint Program in Physical Oceanography, Woods Hole, Massachusetts
Steven J. Lentz
Department of Physical Oceanography, Woods Hole Oceanographic Institution, Woods Hole, Massachusetts
Abstract. A strong relationship is observed between synoptic weather systems and atmospheric forcing of the ocean as estimated from buoy measurements made on the North Carolina inner shelf during August and October-November 1994 as part of the Coastal Ocean Processes (COOP) Inner Shelf Study. Synoptic variation (timescales of days to weeks) in the meteorological time series was primarily associated with the passage of atmospheric frontal systems. The most common synoptic weather pattern observed was the passage of a low-pressure center to the north of the study site, which caused the associated cold front to pass over the study region. Before passage of the cold front, warm, moist northeastward winds increased the heat flux into the ocean, whereas after the cold front passed, cold, dry southwestward winds decreased the heat flux into the ocean. In addition, in the presence of oceanic stratification, northeastward winds drove coastal upwelling, bringing colder water to the surface, further increasing the air-sea temperature contrast and hence the heat flux into the ocean inshore of the surface front between cool upwelled water and warmer water offshore. The decrease in surface heat flux during the passage of a cold front was of order 400 W m -2, due primarily to a decrease in latent heat flux. Although other synoptic patterns were observed, including one warm front passage and two tropical storm systems, the dominance of cold fronts as a source of variability resulted in a strong positive correlation between the along-shelf component of wind stress and the surface heat flux. To address the issue of spatial variation in the surface heat fluxes, data from several different sources located along a cross-shelf transect were analyzed. This analysis suggests that the temperature of the atmospheric boundary layer undergoes adjustment when warm air blows over cold water but not when cold air blows over warm water. This produces cross-shelf gradients in the bulk estimates of turbulent heat fluxes during offshore winds but not during onshore winds.
1. Introduction
The surface heat flux and wind stress play a crucial role in determining the behavior of the upper ocean, especially in the shallow coastal zone, where the entire water column can be directly influenced by atmospheric forcing [Winant and Beardsley, 1979; Lee et al., 1989]. This paper presents surface heat flux and wind stress
1Now at the College of Oceanic and Atmospheric Sciences, Oregon State University, Corvallis
Copyright 1999 by the American Geophysical Union.
Paper number 1999JC900016. 014g-O227/99/1999JC900016509.00
estimates from observations taken off the coast of North
Carolina, north of Cape Hatteras during August and October/November 1994 as part of the Coastal Ocean Processes (COOP) Inner Shelf Study (ISS) field program [Burman, 1994]. The primary purpose of this paper is to describe the effect of synoptic weather systems on the temporal and spatial variation in meteorological forcing.
There have been few previous observational studies of the surface heat flux over U.S. continental shelves and even fewer which use direct in situ measurements of the
radiative fluxes. On the U.S. west coast, Beardsley et al. [1998] estimated surface fluxes during the Coastal Ocean Dynamics Experiment (CODE) and the Surface Mixed Layer Experiment (SMILE). They studied sea- sonal and synoptic variation during both experiments.
18,159
18,160 AUSTIN AND LENTZ: METEOROLOGICAL FORCING ON THE NC SHELF
They found that variation in shortwave radiation and sea surface temperature (due to upwelling) were the most important factors in the seasonal variation of the net surface heat flux. SMILE was one of the first coastal
oceanic field experiments to make direct observations of downward longwave radiation. In the South Atlantic Bight, Blanton et al. [1989] estimated turbulent fluxes of moisture, heat, and momentum as part of the Gen- esis of Atlantic Lows Experiment (GALE). They at- tributed variation in meteorological observations, and hence in the estimated fluxes, to synoptic weather sys- tems. For instance, the passage of a cold-air outbreak on January 27, 1986, was responsible for an estimated decrease in the surface heat flux of nearly 1400 W m -2. Mountain et al. [1996] used data from moored buoys and coastal stations to estimate the annual cycle and interannual variability of the net surface heat flux in the Gulf of Maine between 1979 and 1987. In this study, annual variation in the shortwave insolation was pri- marily responsible for the annual variability of the net heat flux. On a larger scale, Bunker [1976] estimated monthly mean surface fluxes over the entire North At- lantic Ocean using data from over 8 million shipboard weather observations and discussed heat flux variabil-
ity on annual scales for the Mid-Atlantic Bight, among other specific regions. Enriquez and Friehe [1997] in- vestigated the effect of coastal upwelling off northern California on the stability of the air column, which in part determines the transfer of heat, momentum, and moisture between atmosphere and ocean. They found that the change in the transfer coefficients due to up- welling affected estimates of surface wind stress, but had a negligible effect on the turbulent transfer of heat.
The effect of fronts on surface fluxes has also been
considered in the open ocean. The Frontal Air Sea In- teraction Experiment (FASINEX) was an observational program that studied the effects of sea surface tem- perature fronts and atmospheric fronts on open ocean surface heat flux and wind stress variability. During FASINEX, Davidson et al. [1991] observed sharp de- creases in surface heat fluxes and differences in wind
direction during the passage of cold fronts over the open ocean southeast of Bermuda, with decreases of surface heat flux of up to 600 W m -•' during individual frontal passages observed during January-May 1986. Also dur- ing FASINEX, Friehe et al. [1991] studied the effect of sea surface temperature fronts on atmospheric bound- ary layer structure, showing that warm air blowing over cold water leads to a stable, shallow boundary layer, while cold air blowing over warm water leads to an un- stable, growing boundary layer. Mooers et al. [1976] studied the effects of cold fronts on surface heat flux and
wind stress using a composite of 34 low-pressure sys- tems observed over the Middle Atlantic Bight between 1972 and 1975, for use as an idealized forcing field for ocean models. This composite low-pressure system in- cluded a trailing cold front with warm, moist air ahead of the front and cold, dry air behind the front. On the basis of the air temperature and moisture content on
either side of the front, they estimated a sharp decline, of the order of 400 W m -2, in bulk estimates of the com- bined turbulent heat fluxes (latent and sensible) across the composite front. They also observed that the high- est concentration of clouds lies along the front, another important factor in determining the surface heat flux, and that the wind direction changes during the passage of the front.
The purpose of the interdisciplinary CoOP Inner Shelf Study was to increase understanding of the processes that affect larval distributions over the inner shelf, as well as to increase knowledge of the physical oceanog- raphy of the inner shelf, a region of the ocean where there have been relatively few physical oceanographic studies. The field program took place between Au- gust and December 1994, which bracketed the seasonal transition from strong stratification and surface heating to weak stratification and surface cooling. The study site was located on the shallow shelf between Chesa-
peake Bay and Cape Hatteras (Figure 1) and included two moored buoys instrumented with the meteorolog- ical sensors necessary to make bulk estimates of the surface heat flux and wind stress.
Variability in the meteorology on timescales of days to weeks during the CoOP Inner Shelf Study can be at- tributed to three basic scenarios, listed here in order of frequency of occurrence: the passage of cold fronts, the passage of tropical storms, and the passage of warm fronts. The response of the local meteorological vari- ables to these weather systems was distinctive. A key result of this study is that the predominance of cold fronts as sources of variation and the particular response of the surface heat flux and wind stress to their passage leads to a strong relationship between wind direction and surface heat flux.
The rest of the paper is organized as follows. Section 2 describes the instrumentation and methods used to estimate surface heat flux and wind stress. In section
3, meteorological time series and surface flux estimates are used to examine the relationship between synoptic meteorology and temporal variations in surface fluxes. Section 4 is a discussion of cross-shelf gradients in the air and sea surface temperature fields and the implica- tions this has for the spatial distribution of surface heat flux. Section 5 is a summary.
2. Field Program, Methods 2.1. The Site
The CoOP Inner Shelf Study took place offshore of the North Carolina Outer Banks, between Cape Henry (at the mouth of the Chesapeake Bay) and Cape Hat- teras, at the southern end of the Middle Atlantic Bight (Figure 1). The coastline is relatively straight in this region with an orientation of approximately 340øT. The shelf is approximately 80 km wide and 60m deep at the shelf break, increasing in width to the north. On the western side of the Outer Banks lie Currituck Sound, Pamlico Sound, and Albemarle Sound, which are large,
AUSTIN AND LENTZ' METEOROLOGICAL FORCING ON THE NC SHELF 18,161
36.28
36.26
CoOP Inner Shelf Study
Central line moorings I !
ß 5 km 340 ø- --F d3 (26m) 36.24 '.
36.22
z
'o 36.2
36.18
36.16
36.14
36.12
•\c,..?,LO?•'. -I- d2 (21m) "+ dl (13n:i).
37
36.5
ß 10m '.20m
35.5
Cape Henry
04401
e44006
Region of DItlill Atlantic
Ca
35 76 -75.5 -75 -74.5
I
-75.75 -75.7 -75.65 -75.6 o
Longitude, E
-75.55
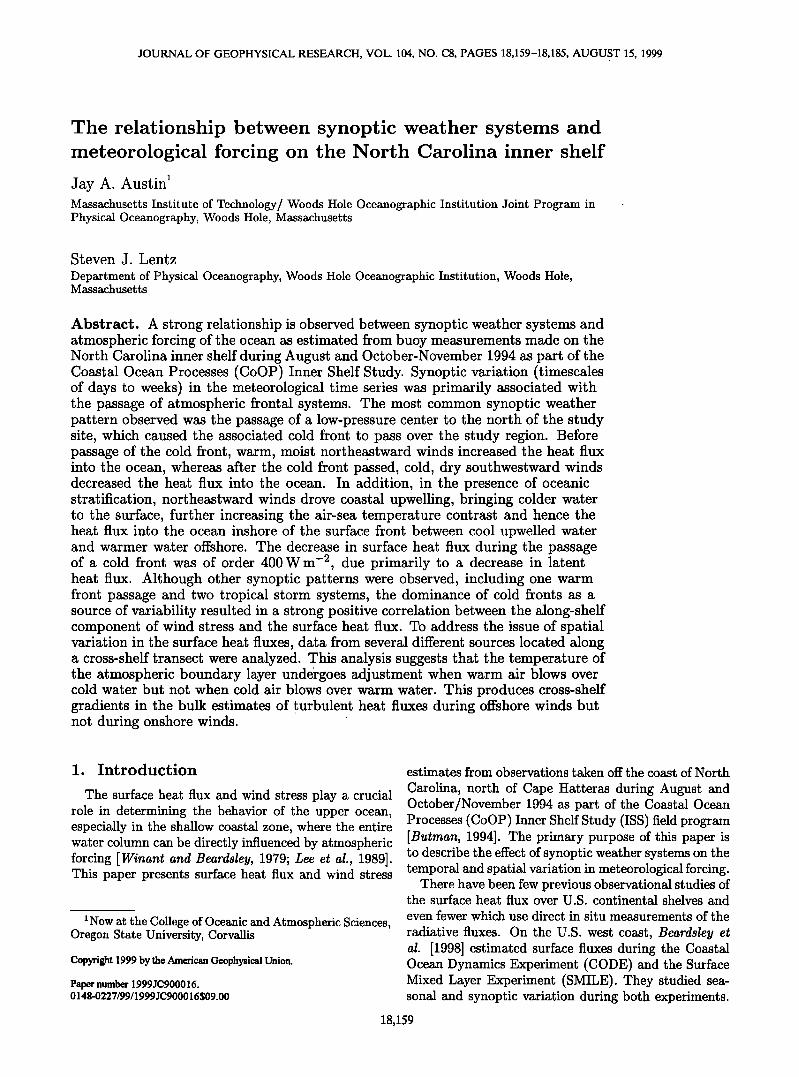
Figure 1. A plan view of the Coastal Ocean Processes Inner Shelf Study (COOP ISS) observa- tional site, showing the study area, and the locations of CoOP ISS buoys DP, dl, d2, and d3, and National Data Buoy Center buoys 44006, 44019, and 44014. The inset is a regional view.
-75.5
-5
-10
E
c.• m -20
-25
-30
-35 0 5 10 15 20 25 30 35 40 45
Offshore distance, km
Figure 2. Cross-shelf conductivity-temperature-depth (CTD) section taken from R/V Cape Hatteras on August 19, 1994, during upwelling-favorable winds. The section extends 50km offshore from the Field Research Facility, perpendicular to the shore. The positions of the three CoOP ISS moorings are indicated by vertical dashed lines.
50
18,162 AUSTIN AND LENTZ: METEOROLOGICAL FORCING ON THE NC SHELF
28
O 26-
=24-
•'22 -
ß 20- o
c/) 18-
z16-
14 Aug 3
(A) I x FRF
........ d2 '1•' ""/'"" L , I ...... NDBC 44006 •2. tr,. ]• • •,1• • i' r I --- NDBC44019
:'.. •.•,, •z.• ½ {.•.l• - ,L•:•'" .: ,•:' :: '•. • t/. •.'.. ""l-' 'd. f, •., / •:: ;"; ,'• • cl"'•: .,.: '... ß .x-.... • i't ;;.•; '. .I , .j.:• .... :•i..7' :: :':•'•i::-: '.x ': x
': r'; ', ;: ,. :............x .. ..... ,'- ;x' '.x'' ß • • ,•
.' ..x , .',: ' .' ß :. x : .. j'•'" x• x , ,,.
"- "x ,
x
I I i
Aug 8 Aug13 Aug18
CTD section (Figure 2) I i I
Aug 23 Aug 28 Sep 2 Se3 7
28
0 26 o
=24
•'22
e 20 o
0318
Z16
(B) x
d2 NDBC 44006
NDBC 44019
tl i i i i I I I I i ct 2 Oct 7 Oct 12 Oct 17 Oct 22 Oct 27 Nov 1 Nov 6 Nov 11 Nov 16Nov 21
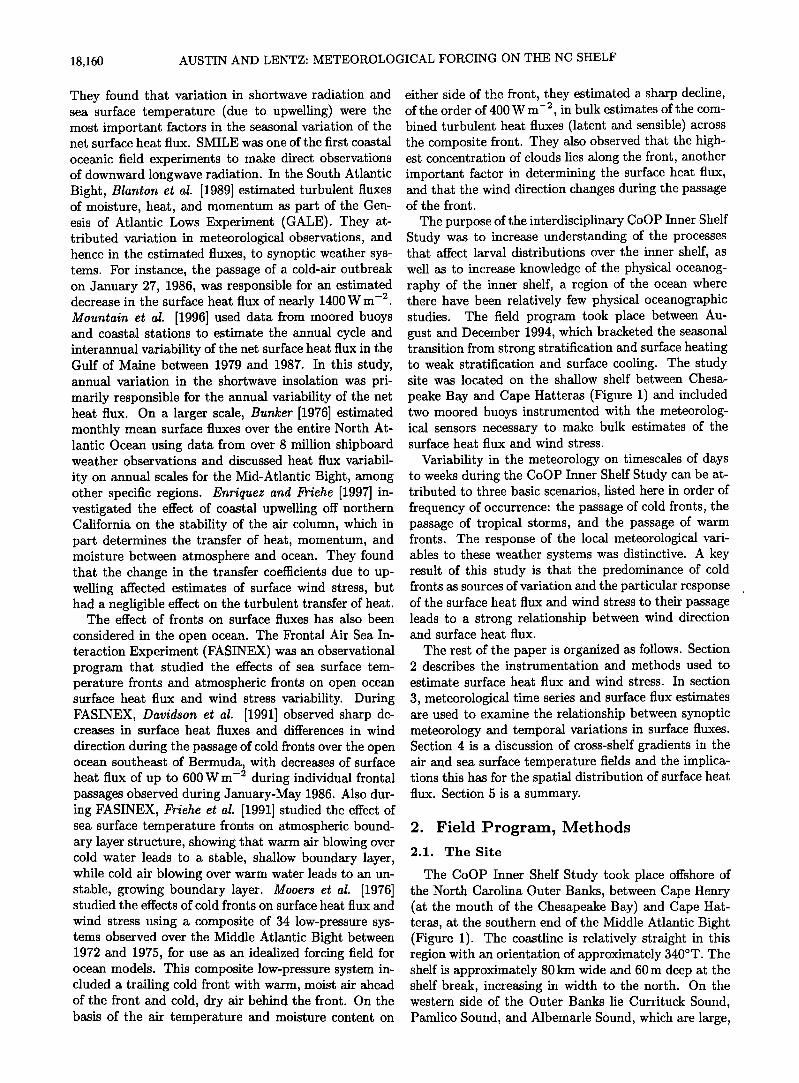
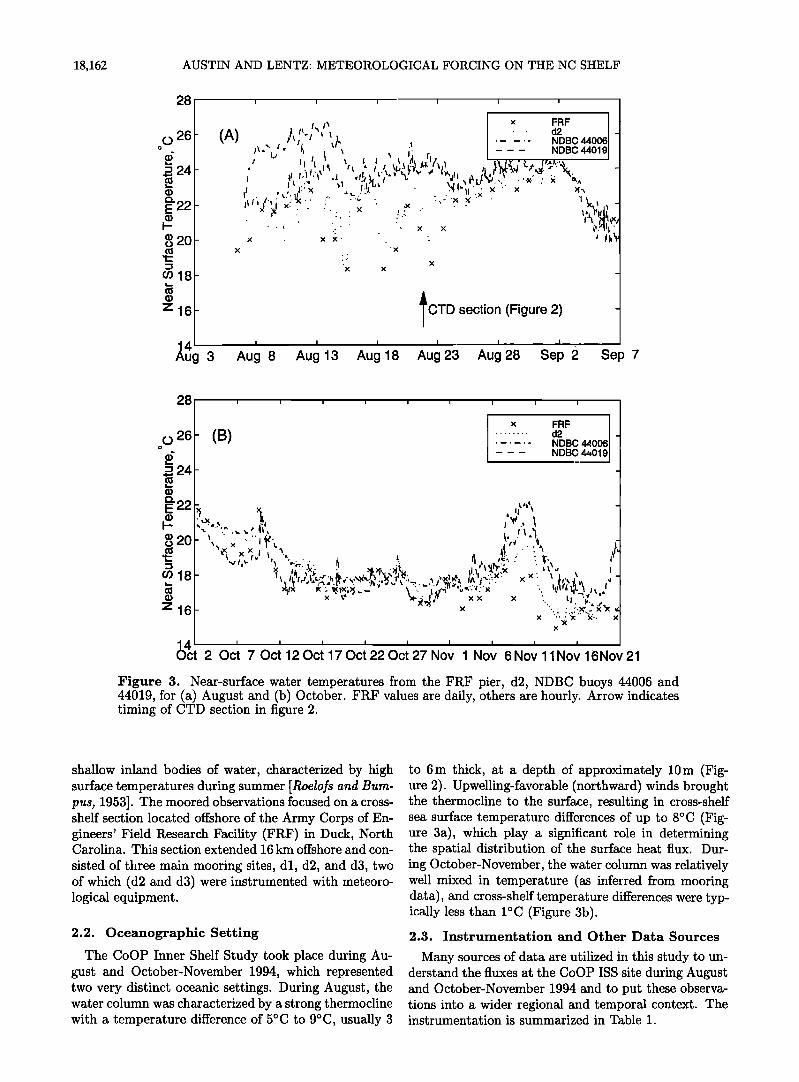
Figure 3. Near-surface water temperatures from the FRF pier, d2, NDBC buoys 44006 and 44019, for (a) August and (b) October. FRF values are daily, others are hourly. Arrow indicates timing of CTD section in figure 2.
shallow inland bodies of water, characterized by high surface temperatures during summer [Roelofs and Bum- pus, 1953]. The moored observations focused on a cross- shelf section located offshore of the Army Corps of En- gineers' Field Research Facility (FRF) in Duck, North Carolina. This section extended 16 km offshore and con-
sisted of three main mooring sites, dl, d2, and d3, two of which (d2 and d3) were instrumented with meteoro- logical equipment.
2.2. Oceanographic Setting
The CoOP Inner Shelf Study took place during Au- gust and October-November 1994, which represented two very distinct oceanic settings. During August, the water column was characterized by a strong thermocline with a temperature difference of 5øC to 9øC, usually 3
to 6m thick, at a depth of approximately 10m (Fig- ure 2). Upwelling-favorable (northward) winds brought the thermocline to the surface, resulting in cross-shelf sea surface temperature differences of up to 8øC (Fig- ure 3a), which play a significant role in determining the spatial distribution of the surface heat flux. Dur- ing October-November, the water column was relatively well mixed in temperature (as inferred from mooring data), and cross-shelf temperature differences were typ- ically less than 1øC (Figure 3b).
2.3. Instrumentation and Other Data Sources
Many sources of data are utilized in this study to un- derstand the fluxes at the CoOP ISS site during August and October-November 1994 and to put these observa- tions into a wider regional and temporal context. The instrumentation is summarized in Table 1.
AUSTIN AND LENTZ: METEOROLOGICAL FORCING ON THE NC SHELF 18,163
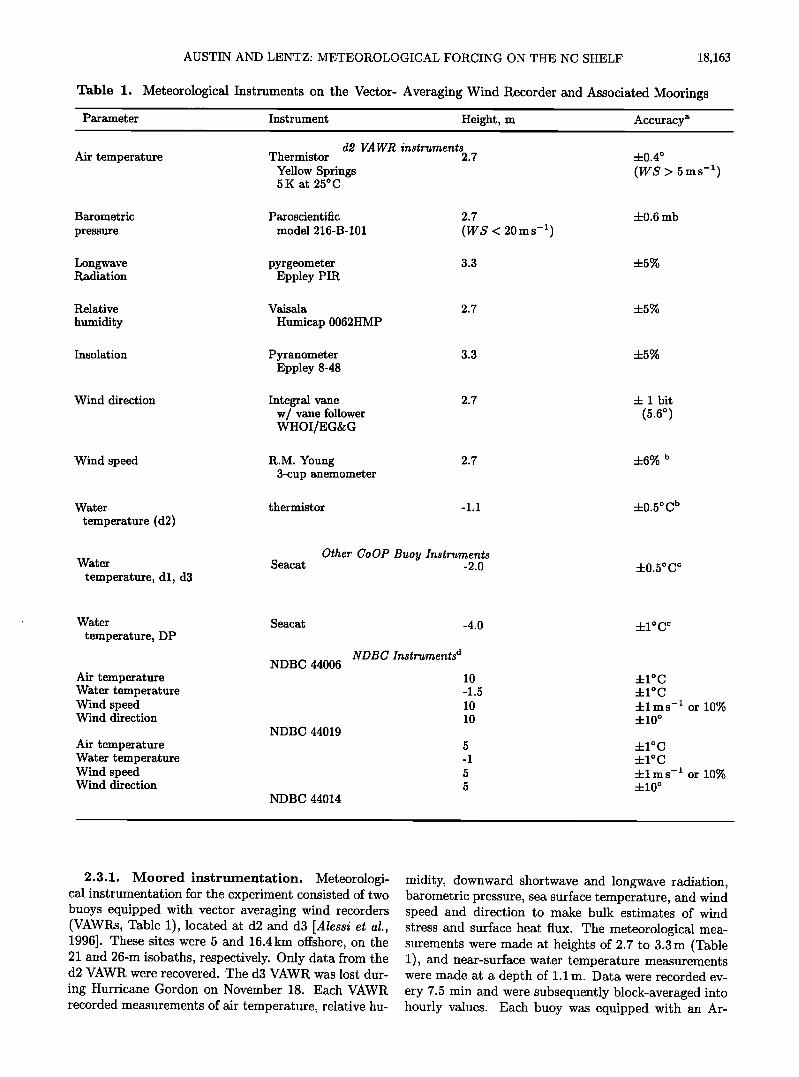
Table 1. Meteorological Instruments on the Vector- Averaging Wind Recorder and Associated Moorings
Parameter Instrument Height, m Accuracy a
dœ VA WR instruments Air temperature Thermistor 2.7 +0.4 ø
Yellow Springs (WS > 5 ms -•) 5 K at 25 ø C
Barometric Paroscientific 2.7 +0.6 mb
pressure model 216-B-101 (WS < 20ms -1)
Longwave pyrgeometer 3.3 +5% Radiation Eppley PIR
Relative Vais ala 2.7 + 5 %
humidity Humicap 0062HMP
Insolation Pyr anomet er 3.3 4- 5 % Eppley 8-48
Wind direction Integral vane 2.7 4- I bit w/vane follower (5.6 ø) WHOI/EG2•G
Wind speed R.M. Young 2.7 4-6% b 3-cup anemometer
Water thermistor -1.1 •:0.5 ø C b temperature (d2)
Other GoOP Buoy Instruments Water Seacat -2.0 +0.5 ø C c
temperature, dl, d3
Water Seacat -4.0 4-1 o C c temperature, DP
NDBC 44006 NDBC Instruments d
Air temperature 10 Water temperature - 1.5 Wind speed 10 Wind direction 10
NDBC 44O19
Air temperature 5 Water temperature -1 Wind speed 5 Wind direction 5
NDBC 44O14
4-1øC 4-1øC 4-1 ms -1 or 10% 4-10 ø
4-1øC 4-1øC 4-1 ms -1 or 10% 4-10 ø
2.3.1. Moored instrumentation. Meteorologi- cal instrumentation for the experiment consisted of two buoys equipped with vector averaging wind recorders (VAWRs, Table 1), located at d2 and d3 [Alessi et al., 1996]. These sites were 5 and 16.4km offshore, on the 21 and 26-m isobaths, respectively. Only data from the d2 VAWR were recovered. The d3 VAWR was lost dur- ing Hurricane Gordon on November 18. Each VAWR recorded measurements of air temperature, relative hu-
midity, downward shortwave and longwave radiation, barometric pressure, sea surface temperature, and wind speed and direction to make bulk estimates of wind stress and surface heat flux. The meteorological mea- surements were made at heights of 2.7 to 3.3 m (Table 1), and near-surface water temperature measurements were made at a depth of 1.1m. Data were recorded ev- ery 7.5 min and were subsequently block-averaged into hourly values. Each buoy was equipped with an Ar-
18,164 AUSTIN AND LENTZ: METEOROLOGICAL FORCING ON THE NC SHELF
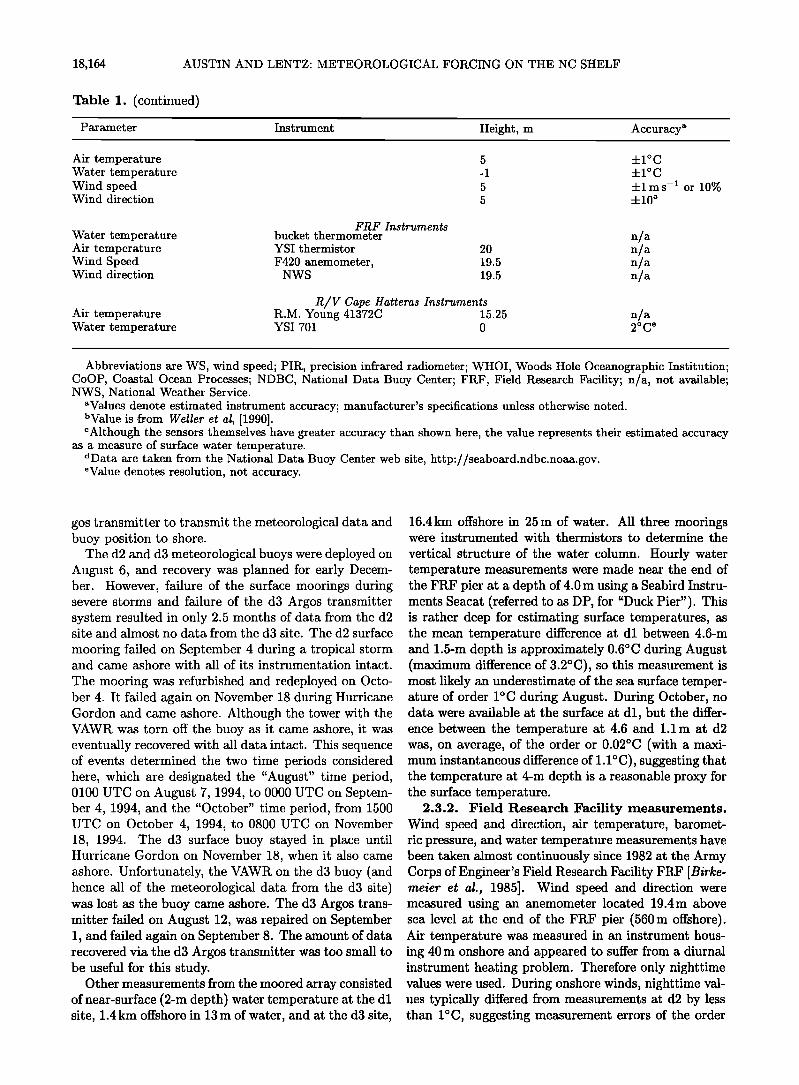
Table 1. (continued)
Parameter Instrument Height, m Accuracy a
Air temperature 5 •-1øC Water temperature -1 •-1 ø C Wind speed 5 4-1ms -• or 10% Wind direction 5 4-10 ø
FRF Instruments Water temperature bucket thermometer n/a Air temperature YSI thermistor 20 n/a Wind Speed F420 anemometer, 19.5 n/a Wind direction NWS 19.5 n/a
R/V Cape Hatteras Instruments Air temperature R.M. Young 41372C 15.25 n/a Water temperature YSI 701 0 2 øC e
Abbreviations are WS, wind speed; PIR, precision infrared radiometer; WHOI, Woods Hole Oceanographic Institution; COOP, Coastal Ocean Processes; NDBC, National Data Buoy Center; FRF, Field Research Facility; n/a, not available; NWS, National Weather Service.
aValues denote estimated instrument accuracy; manufacturer's specifications unless otherwise noted. bValue is from Weller et al, [1990]. c Although the sensors themselves have greater accuracy than shown here, the value represents their estimated accuracy
as a measure of surface water temperature. dData are taken from the National Data Buoy Center web site, http://seaboard.ndbc.noaa.gov. eValue denotes resolution, not accuracy.
gos transmitter to transmit the meteorological data and buoy position to shore.
The d2 and d3 meteorological buoys were deployed on August 6, and recovery was planned for early Decem- ber. However, failure of the surface moorings during severe storms and failure of the d3 Argos transmitter system resulted in only 2.5 months of data from the d2 site and almost no data from the d3 site. The d2 surface
mooring failed on September 4 during a tropical storm and came ashore with all of its instrumentation intact.
The mooring was refurbished and redeployed on Octo- ber 4. It failed again on November 18 during Hurricane Gordon and came ashore. Although the tower with the VAWR was torn off the buoy as it came ashore, it was eventually recovered with all data intact. This sequence of events determined the two time periods considered here, which are designated the "August" time period, 0100 UTC on August 7, 1994, to 0000 UTC on Septem- ber 4, 1994, and the "October" time period, from 1500 UTC on October 4, 1994, to 0800 UTC on November 18, 1994. The d3 surface buoy stayed in place until Hurricane Gordon on November 18, when it also came ashore. Unfortunately, the VAWR on the d3 buoy (and hence all of the meteorological data from the d3 site) was lost as the buoy came ashore. The d3 Argos trans- mitter failed on August 12, was repaired on September 1, and failed again on September 8. The amount of data recovered via the d3 Argos transmitter was too small to be useful for this study.
Other measurements from the moored array consisted of near-surface (2-m depth) water temperature at the dl site, 1.4 km offshore in 13 m of water, and at the d3 site,
16.4km offshore in 25 m of water. All three moorings were instrumented with thermistors to determine the
vertical structure of the water column. Hourly water temperature measurements were made near the end of the FRF pier at a depth of 4.0 m using a Seabird Instru- ments Seacat (referred to as D P, for "Duck Pier"). This is rather deep for estimating surface temperatures, as the mean temperature difference at dl between 4.6-m and 1.5-m depth is approximately 0.6øC during August (maximum difference of 3.2øC), so this measurement is most likely an underestimate of the sea surface temper- ature of order 1øC during August. During October, no data were available at the surface at dl, but the differ- ence between the temperature at 4.6 and 1.1m at d2 was, on average, of the order or 0.02øC (with a maxi- mum instantaneous difference of 1.1øC), suggesting that the temperature at 4-m depth is a reasonable proxy for the surface temperature.
2.3.2. Field Research Facility measurements. Wind speed and direction, air temperature, baromet- ric pressure, and water temperature measurements have been taken almost continuously since 1982 at the Army Corps of Engineer's Field Research Facility FRF [Birke- meier et al., 1985]. Wind speed and direction were measured using an anemometer located 19.4m above sea level at the end of the FRF pier (560m offshore). Air temperature was measured in an instrument hous- ing 40m onshore and appeared to suffer from a diurnal instrument heating problem. Therefore only nighttime values were used. During onshore winds, nighttime val- ues typically differed from measurements at d2 by less than 1øC, suggesting measurement errors of the order
AUSTIN AND LENTZ: METEOROLOGICAL FORCING ON THE NC SHELF 18,165
of IøC, though no actual uncertainty values are avail- able. Sea surface temperature was measured using a bucket thermometer at the end of the pier, once per day, typically around 0700 local time. These data were highly correlated with buoy measurements during the August and October 1994 periods, and were used to gain some perspective on the regional seasonal and in- terannual variability, as well as qualitative information on the cross-shelf variation during the experiment.
2.3.3. NDBC buoy array. The National Data Buoy Center (NDBC) maintained three meteorological buoys, designations 44006, 44019, and 44014 (Figure 1), across the shelf near the FRF, which proved useful to this study. These buoys recorded hourly wind speed and direction, air temperature, and water temperature, with quoted accuracies listed in Table 1. While insuf- ficient for complete heat flux calculations, these data were used to examine cross-shelf variations in the me-
teorology, estimate sensible heat flux, and infer latent heat flux.
2.3.4. Shipboard data. The R/V Cape Hatteras performed conductivity-temperature-depth (CTD) tran- sects on the North Carolina inner shelf during August and October 1994 as part of the CoOP Inner Shelf Study [Waldorf et al., 1995, 1996]. It made 16 transects of the shelf along the FRF to d3 central mooring line in Au- gust and 20 in October. In addition, cross-shelf tran- sects north and south of the central mooring line were made to quantify along-shelf variation in the hydrogra- phy. During each cruise, air temperature, surface water temperature, and wind velocity were measured every 15 s. The air temperature measurements suffered from very low (2øC) resolution, so the air temperature mea- surements are used only for qualitative comparisons.
2.4. Estimation of the Surface Heat Flux and Wind Stress
The surface wind stress and the turbulent surface
heat flux were estimated using bulk formulas developed by Fairall et al. [1996]. Like most other bulk flux algo- rithms, these were generated using measurements made in the open ocean, away from boundaries and fronts. A comparison of the heat flux and surface stress esti- mated with this formulation with those estimated using the Large and Pond [1981, 1982] formulation revealed no qualitative differences.
The appropriateness of these bulk formulas to the coastal ocean is not clear, especially to sites within a few kilometers of the shoreline. Their suitability is es- pecially questionable during offshore winds, when the marine atmospheric boundary layer must quickly adjust to new surface conditions. In addition, surface waves, steepened in shallow water, may affect the transfer co- efficients and hence estimates of turbulent fluxes [Large et al., 1995; Geernaert et al., 1986]. It should be noted that neither of these effects has been taken into account in the estimates presented here. In the absence of di- rect (i.e., eddy correlation) measurements of momen-
tum, heat, and moisture fluxes, the appropriateness of the bulk formulas of Fairall et al. [1996] cannot be judged. The uncertainty of the mean flux estimates due to measurement uncertainty will be discussed in section 2.5.
The surface wind stress is estimated using a stability- dependent transfer coefficient that relates the measured wind speed to the wind stress,
T ---- pACd(Ua -- u)lu - u•l, (1)
where PA is air density, Ca is a stability-dependent transfer coefficient, ua is wind velocity measured at a specified height (in this case 2.7m), and us is the sur- face velocity of the water. The direction of the wind stress is assumed to be the same as the velocity differ- ence vector Ua --Us.
The net surface heat flux may be considered the sum of four terms [Gill, 1982]:
QTOT -- QSWNE T + QLWNE T + QLAT + QSEN, (2)
where QSWNET is net shortwave radiation, QLWNET is net longwave radiation (the difference between upward and downward longwave radiation), QLAT is latent heat flux, and QSEN is sensible heat flux. In this paper, positive flux values always denote heat flux into the ocean.
The net shortwave radiation flux QSWNET due to so- lar insolation between 0.28/zm and 2.8/zm, is estimated using
QSWNET -- QSWDow N (1 - Ab), (3)
where QSWDow N is measured using an Eppley 8-48 pyranometer and Ab is the albedo of the sea surface, which is determined empirically as a function of the so- lar angle and atmospheric transmissivity [Payne, 1972].
The net longwave radiation flux QLWNET is the dif- ference between the upward longwave radiation QLWu P due to blackbody radiation from the ocean surface, cal- culated using the Stefan-Boltzman law, and the down-
ward longwave radiation QLWDow N due to radiation from moisture in the atmosphere, and is measured di- rectly. The formula for the net longwave radiation flux is
QLW•:T -- e(QLWDow• -- ate), (4) where e - 0.98 [Dickey et al., 1994] is the radiative ef- ficiency of the water (estimates of e vary from 0.93 to 1.0 [Fung et al., 1984]), rr = 5.67 x 10 -s W m-2K -4 is the Stefan-Boltzman constant, and Ts is the sea surface
temperature in degrees Kelvin. QLWDow N is due to in- frared radiation in the range 3.5 to 50/zm emitted by atmospheric moisture and is measured directly using an Eppley precision infrared radiometer (PIR) pyrgeome- ter. The downward longwave radiation was corrected
for instrument heating by subtracting 0.035 QSWDow N [Alados-Arboledas et al., 1988].

18,166 AUSTIN AND LENTZ: METEOROLOGICAL FORCING ON THE NC SHELF
The latent heat flux QLAT represents the heat re- leased or gained when water evaporates from or con- denses on the ocean surface. Although often interpreted as representing only evaporation, there is a significant portion of the August time series during offshore winds when it appears that heat was being gained owing to condensation at the sea surface [Beardsley et al., 1998]. The latent heat flux is related to the moisture gradient at the ocean surface and the air-water velocity differ- ence using the bulk formula
= - q0)lu - ul,
where L is the latent heat of evaporation; qz is the spe- cific humidity measured at height z above sea level (in this case, z - 2.7 m); q0 is the estimated humidity at the sea surface, calculated by assuming the air at the water surface is the same temperature as the water and that the air is saturated (assuming that the saturation humidity for air over salt water is 0.98 of the saturation humidity of air over fresh water of the same temper- ature); and Ce is a stability-dependent transfer coeffi- cient, estimated using the Fairall et al. [1996] formula- tion.
The sensible flux QSEN is related to the temperature difference between the air and sea surface and the air-
water velocity difference using the bulk formula
= - Ts)lu - ul,
where Cp is the heat capacity of water, T$ is the sea sur- face temperature, TA is the air temperature, and Ch is a stability-dependent transfer coefficient, also estimated using the Fairall et al. [1996] formulation.
2.5. Estimation of Instrument-Induced Flux
Uncertainty
Although it is impossible to take into account all po- tential sources of error inherent in making surface flux estimates, it is essential to make as good an estimate
as possible using manufacturer's specifications (Table 1) and literature values of uncertainty to provide a con- text for interpreting the surface flux estimates. This er- ror analysis reveals what terms of the surface flux (and what instruments) contribute most significantly to un- certainty in the estimate of the total surface heat flux and wind stress, given what is known about the un- certainties of the measurements. For a more thorough treatment of uncertainty in the VAWR measurements and how they apply to flux estimates, see Weller et al. [1990] and Beardsley et al. [1998]. Results of the error analysis are summarized in Table 2.
The quoted accuracy of the wind speed measure- ment is 2%, but there have been indications that cup anemometers are prone to overspeeding by as much as 6% [Weller et al., 1990]. Using a nominal value of 6% for the uncertainty of the wind speed estimate and as- suming that error in the estimate of wind stress is due primarily to this measurement (as opposed to the mea- surement of surface ocean currents, which are relatively small), overspeeding could be responsible for uncertain- ties in the stress estimates of up to 12%.
An analysis of error propagation in the latent heat flux bulk equation suggests that the main source of in- strument error is the measurement of relative humidity, assumed to be •- 5% [Weller et al., 1990]. This error causes an uncertainty in the estimate of the mean latent heat flux of order 12 W m -2.
The largest source of uncertainty in the sensible heat flux is the determination of the difference between air
and surface water temperatures. The uncertainty in the difference is greatest during strong insolation and weak winds, when the air temperature sensor suffers from overheating and the water temperature sensor underes- timates the surface temperature owing to formation of stratification in the upper meter of the water column. During strong winds, both of these effects are small. Since the sensible flux is proportional to the wind speed, uncertainty in the temperature difference during wcak winds leads to small uncertainties in the sensible flux.
Table 2. Statistics of August and October Time Series of Heat Flux Components Measured at d2.
Mean Standard Deviation Subtidal Standard Deviation. a
Aug. Oct. Aug. Oct. Aug. Oct.
QSWNE T 2204-11 1444-7 301 222 83 59 Q LWD OWN 377 4-19 325 4-16 27 37 38 39 QLWu P -4224-7 -3994.5 8 8 31 23 QLWNE T -45 4-20 - 744-17 28 37 29 35 QSEN 54-4 -154-4 19 31 22 30 QLAT -33 4-13 -944-12 72 98 68 93 QTOT 1474-26 -394-22 317 258 135 138
Uncertainties reflect instrument-based uncertainties only. All values are in W m -2. Subscripts denote SWNET, net shortwave flux; LWDOWN , downward longwave flux; LWup ,
upward longwave flux; LWNET, net longwave flux; SEN, sensible heat flux; LAT, latent heat flux; TOT, total heat flux. aThe subtidal standard deviation represents the standard deviation of the low-passed time series.
AUSTIN AND LENTZ: METEOROLOGICAL FORCING ON THE NC SHELF 18,167
1000 (A) Net ................. •-..t ............................. •.. •... • ........ I I I I
500 ........... • ........... • ............ I
o 50
o .(B) -50
-100
-150
N .I I I I I II I I II I I
et. longwave ...... •...
.. I I ....
I
200 , , . . , ., , . ., .
(C) Latent • • • • • • •
-200-' ß , • , .......... ,, ........... • ..... i l .-• ........ I I I
100 ....
(D) Sensible ......
- 100
1000
500
0
-5OO
[ ] I I [ I[ [ I I[ I 0.2 (F) Wind Stress
ß ................. , .... ,, ........ ......... • I I
• •h•re -0.2 < [ [ i , [• , • i, i Aug 3 Aug 8 Aug 13 Aug 18 Aug 23 Aug 28 Sep 2 Sep 7
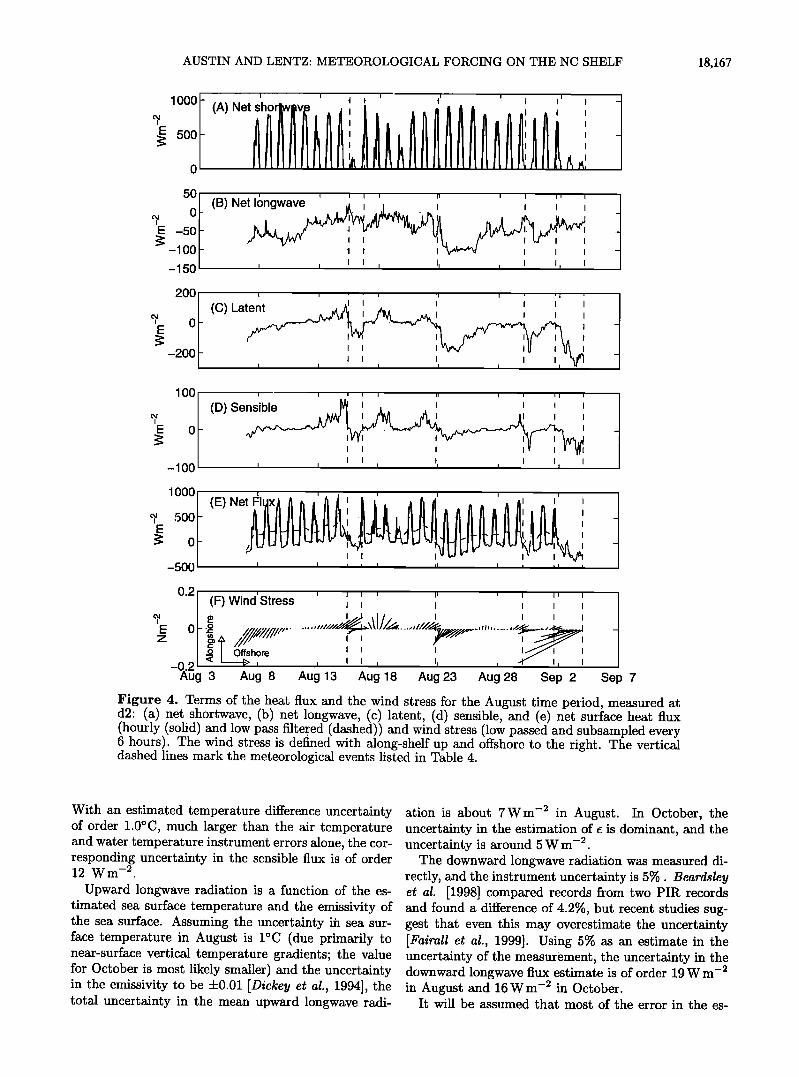
Figure 4. Terms of the heat flux and the wind stress for the August time period, measured at d2' (a) net shortwave, (b) net longwave, (c) latent, (d) sensible, and (e) net surface heat flux (hourly (solid) and low pass filtered (dashed)) and wind stress (low passed and subsampled every 6 hours). The wind stress is defined with along-shelf up and offshore to the right. The vertical dashed lines mark the meteorological events listed in Table 4.
With an estimated temperature difference uncertainty of order 1.0øC, much larger than the air temperature and water temperature instrument errors alone, the cor- responding uncertainty in the sensible flux is of order 12 W m -2.
Upward longwave radiation is a function of the es- timated sea surface temperature and the emissivity of the sea surface. Assuming the uncertainty in sea sur- face temperature in August is IøC (due primarily to near-surface vertical temperature gradients; the value for October is most likely smaller) and the uncertainty in the emissivity to be +0.01 [Dickey et al., 1994], the total uncertainty in the mean upward longwave radi-
ation is about 7Wm -2 in August. In October, the uncertainty in the estimation of e is dominant, and the uncertainty is around 5 W m -2 .
The downward longwave radiation was measured di- rectly, and the instrument uncertainty is 5%. Beardsley et aL. [1998] compared records from two PIR records and found a difference of 4.2%, but recent studies sug- gest that even this may overestimate the uncertainty [Fairall et al., 1999]. Using 5% as an estimate in the uncertainty of the measurement, the uncertainty in the downward longwave flux estimate is of order 19 W m -• in August and 16 W m -• in October.
It will be assumed that most of the error in the es-

18,168 AUSTIN AND LENTZ' METEOROLOGICAL FORCING ON THE NC SHELF
-,ooo "'(A)'sh0rave , , , , ,
500 ........ I '• I I
o l', lOO
o -100
-200
' I ' I ' ' I ' '1 ] I I' '
(B) Net Lengwave ' ' • ' ß ': ' I I [ I
I
0 '
-200 ß
-400
( [ ' ' I ] [ I ' '1 ' I I [ •
100 ' I ' I J ' I • ' I ' I I [ ' (D) Sensible , • , • /•, , ..,, ..... I .... I
-100 - ß
500
0 '
-500
I I I I I I I I I
(E) N lUx [ . . [ . [ . [. [
ß
i i i i
L [ I [ I [ [ I [ [ I I I I[ ' o.2j (F) Wind •tress , , , , ,
-0.2 J-- ....... . •//•/.////. :.1 .................... /./VJ[ .... I . .• /.! ./../..I.. . ' .. J I '/,,/•/I I I I I I I I I I" I I i
Oct 2 Oct 7 Oct12 Oct17 Oct 22 Oct 27 Nov 1 Nov 6 Nov11 Nov16 Nov 21
Figure 5. Same as figure 4 but for the October time period.
timation of shortwave radiation is in the measurement
itself, as opposed to the altitude-dependent albedo. The uncertainty in the measurement for an ungimballed sen- sor is 5% [Wetter et at., 1990], corresponding to mean uncertainties of 11Wm -2 in August and 7Wm -2 in October.
As the instruments that are primarily responsible for the uncertainty are different for each term on the net surface heat flux, the uncertainties can be considered independent. Making this assumption, the estimated uncertainty in the mean net surface heat flux due to measurement uncertainty is approximately 26 W m -2 in August and 22 W m -2 in October. The largest sources of error, given what is known about the error character- istics of the measurements, are the downward longwave and latent heat flux estimates.
3. Observations and Results
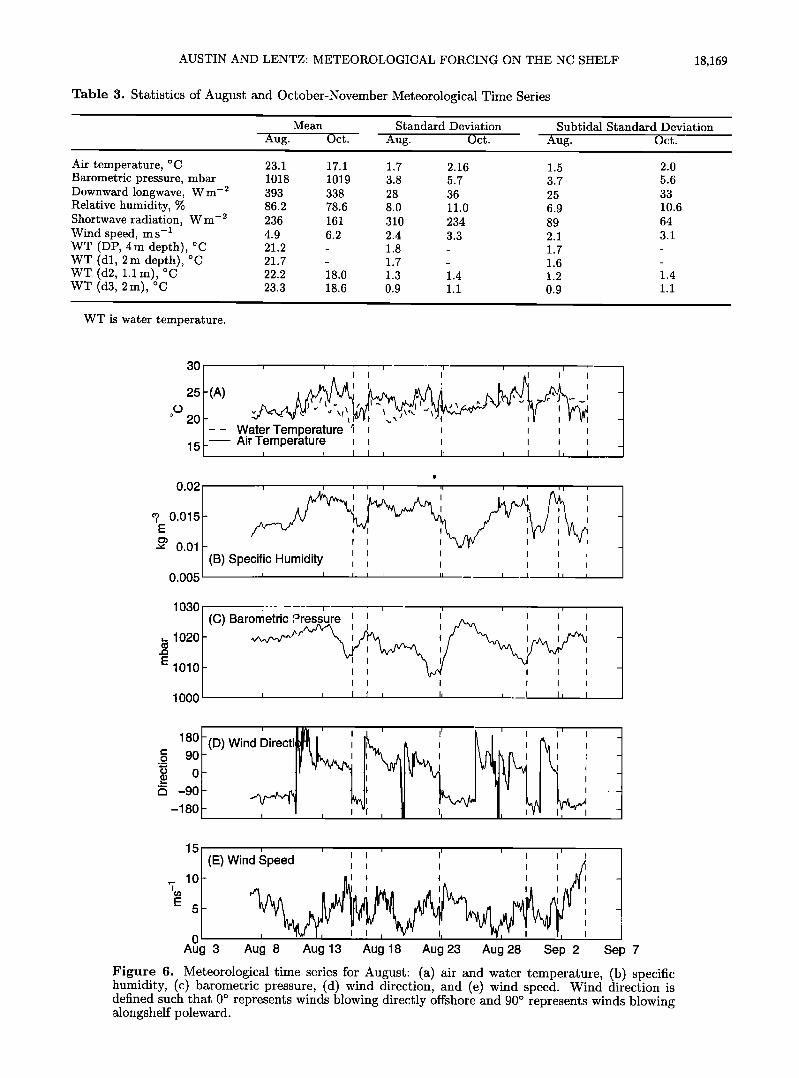
During the August and October time periods, the surface heat flux (Table 2 and Figure 4 (August) and Figure 5 (October)) varied on two distinct timescales: diurnal (daily) and synoptic (timescales of 2-7 days). This study focuses on the synoptic variability, which is evident in all of the meteorological time series (Ta- ble 3 and Figure 6 (August) and Figure 7 (October)), and hence the surface heat flux components. Diurnal variability was due almost entirely to the daily short- wave radiation cycle. This variability was removed from the data using the p164 low pass-filter [Beardstey et at., 1985]. However, there is also a large difference between the mean surface heat fluxes during August and Octo- ber, presumably associated with seasonal variation in the meteorology, which is discussed first.
AUSTIN AND LENTZ: METEOROLOGICAL FORCING ON THE NC SHELF 18,169
Table 3. Statistics of August and October-November Meteorological Time Series
Mean Standard Deviation
Aug. Oct. Aug. Oct. Subtidal Standard Deviation
Aug. Oct.
Air temperature, øC Barometric pressure, mbar Downward longwave, W m- •' Relative humidity, % Shortwave radiation, W m- •' Wind speed, m s-1 WT (DP, 4m depth), øC WT (dl, 2m depth), øC WT (d2, 1.1 m), øC WT (d3, 2m), øC
23.1 17.1 1.7 2.16 1018 1019 3.8 5.7 393 338 28 36 86.2 78.6 8.0 11.0 236 161 310 234 4.9 6.2 2.4 3.3 21.2 - 1.8 - 21.7 - 1.7 - 22.2 18.0 1.3 1.4 23.3 18.6 0.9 1.1
1.5 2.0 3.7 5.6 25 33 6.9 10.6 89 64 2.1 3.1 1.7 -
1.6 -
1.2 1.4 0.9 1.1
WT is water temperature.
30
25 -(A)
20
15
I I I •' I -I . I I I ii I i
,, .. Water Temperature • , , , , , Air Temperature , • , , , ,
• 0.015
"' 0.01 0.005
1030
,_ 1020
E 1010
1000
I I il I '1 (C) Barometric ,øressure
I I
I I I I I
180
90
0
-90
-180
(D) Wind Directi ,' ' I
..........
..
5 i i i i i i
(E) Wind Speed [ [ [ [ [ ./ I I I I I
10 '' -ii.• -• ß 4 [ [ ,,•.[ I I I I I I
I I I
5 ' I I
o Aug 3 Aug 8 Aug 13 Aug 18 Aug 23 Aug 28 Sep 2
ß _
Se) 7
Figure 6. Meteorological time series for August' (a) air and water temperature, (b) specific humidity, (c) barometric pressure, (d) wind direction, and (e) wind speed. Wind direction is defined such that 0 ø represents winds blowing directly offshore and 90 ø represents winds blowing alongshelf poleward.
18,170 AUSTIN AND LENTZ' METEOROLOGICAL FORCING ON THE NC SHELF
30
25
20
15
I I I I I I I I I
I(A) ' ' ' ' ' ' L-'. - Water Temperallure , , , / .... - :' '• ..... i .... • .... • .................. i .............. i .......... i ...... i ................ I---- Air/emDeraturE• i - '1 i
/ i I i I i i I •f • i I•1 • i I i• /•i
0.02
• 0.015 E
"' 0.01
0.005
l I i I i I I i I I i I i ii I
(B) Specific,Humidity , , , , I I I I I I
I I
...
1030 -
,... 1020
E 1010
1 ooo
I I I I I I I I ' . '1
..... I' ' I ................ I ....... I ....... I '
/ .......................... • - v.. -•. ....... '• '•/' ...... i ..... •' /(C) Barometric Pressure I /'l I • I i I i I I I I I I! [ I Ii •
180 (D)Wind•l•'rectiol•l •, I k I I • 90 , ' ', ........ , .... I- , ....
I
-90 ............. i ..........................
-180 ......
15 (E Wind S
10
I
5
0 , I , I , I ¾' •,l, I, Oct 2 Oct 7 Oct 12 Oct 17 Oct 22 Oct 27 Nov 1 Nov 8 Nov 11 Nov 18 Nov 21
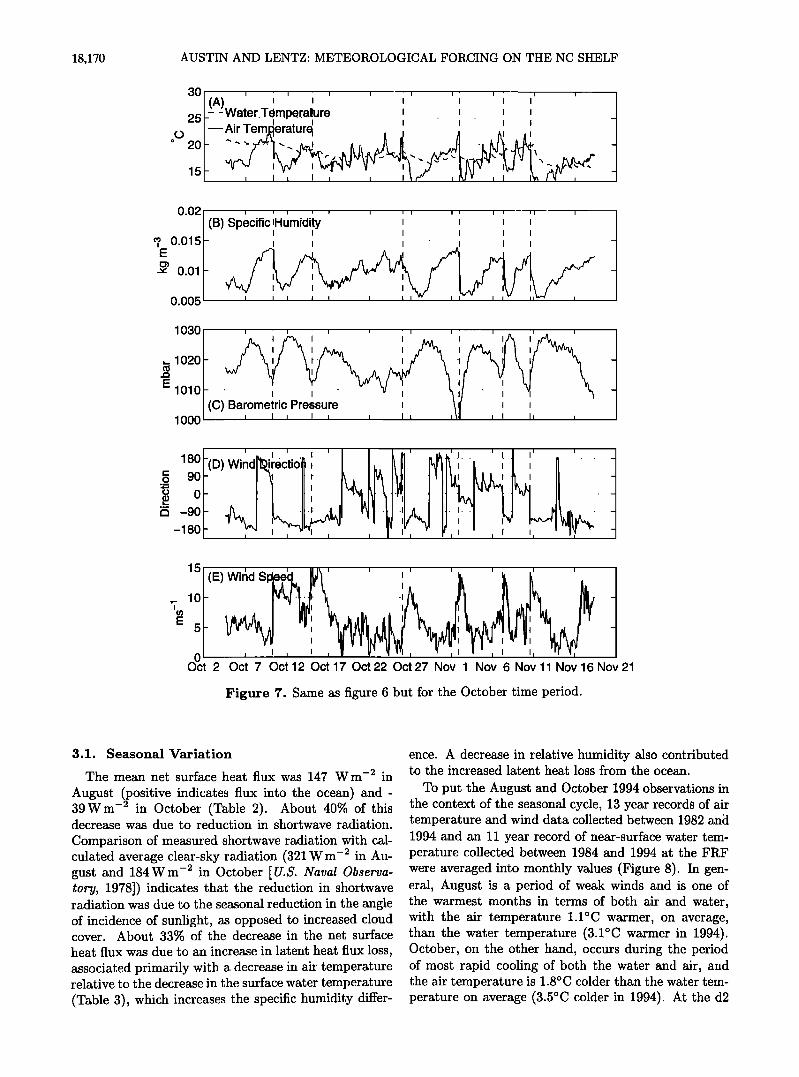
Figure 7. Same as figure 6 but for the October time period.
3.1. Seasonal Variation
The mean net surface heat flux was 147 W m -2 in
August (positive indicates flux into the ocean) and- 39Wm -2 in October (Table 2). About 40% of this decrease was due to reduction in shortwave radiation.
Comparison of measured shortwave radiation with cal- culated average clear-sky radiation (321 W m -2 in Au- gust and 184Wm -2 in October [U.S. Naval Observa- tory, 1978]) indicates that the reduction in shortwave radiation was due to the seasonal reduction in the angle of incidence of sunlight, as opposed to increased cloud cover. About 33% of the decrease in the net surface heat flux was due to an increase in latent heat flux loss, associated primarily with a decrease in air temperature relative to the decrease in the surface water temperature
(Table 3), which increases the specific humidity differ-
ence. A decrease in relative humidity also contributed to the increased latent heat loss from the ocean.
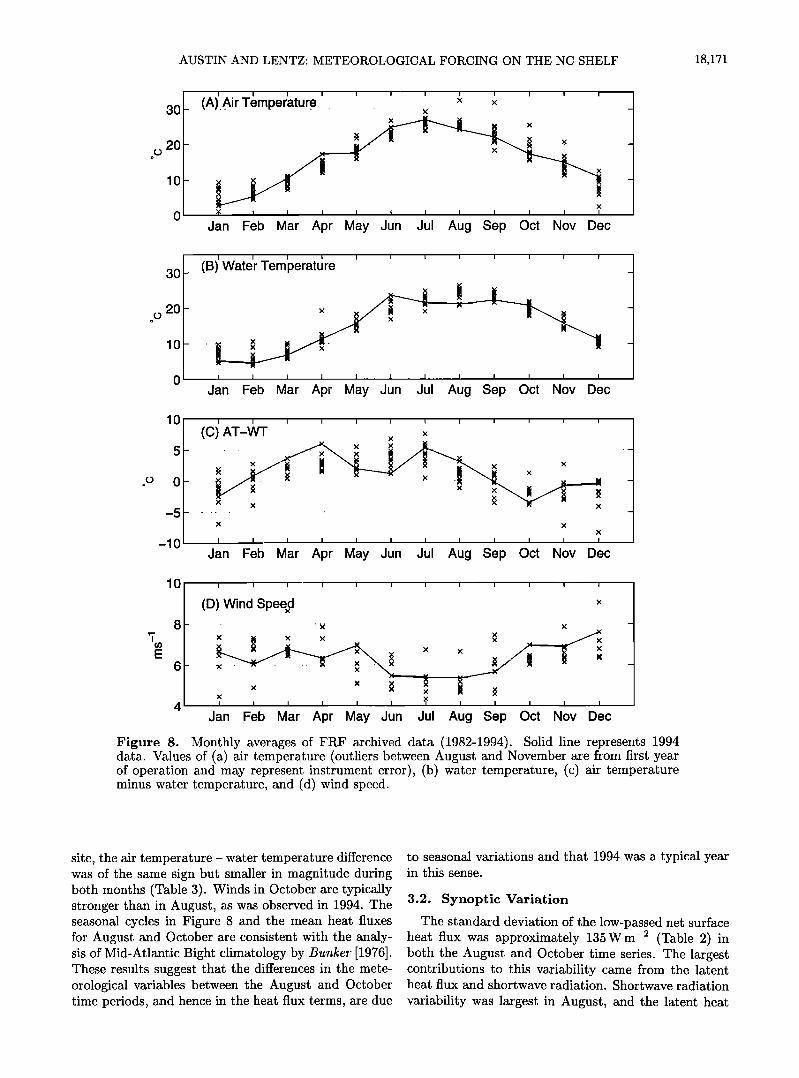
To put the August and October 1994 observations in the context of the seasonal cycle, 13 year records of air temperature and wind data collected between 1982 and 1994 and an 11 year record of near-surface water tem- perature collected between 1984 and 1994 at the FRF were averaged into monthly values (Figure 8). In gen- eral, August is a period of weak winds and is one of the warmest months in terms of both air and water, with the air temperature 1.1øC warmer, on average, than the water temperature (3.1øC warmer in 1994). October, on the other hand, occurs during the period of most rapid cooling of both the water and air, and the air temperature is 1.8øC colder than the water tem- perature on average (3.5øC colder in 1994). At the d2
AUSTIN AND LENTZ: METEOROLOGICAL FORCING ON THE NC SHELF 18,171
30
20
10
I. I I I I I I I I I I .(A) Ai.r. Temperature • x x x
x • I I I I I I I I I I I
Jan Feb Mar Apr May Jun Jul Aug Sep Oct Nov Dec
2O
10
I I I I I I I I I I I I
(B) Water Temperature
Jan Feb Mar Apr May Jun Jul Aug Sep Oct Nov Dec
10
-5
-10
x
x x x
I I I I I I I I I I I I
Jan Feb Mar Apr May Jun Jul Aug Sep Oct Nov Dec
10 I I I I I I I I I I I I
(D) Wind Speexd x
'7 x • x x •x • • • • • x x •
" ..... , ..... ...... 6 ...... x..-• .•. ß -. .• ................ X x x • x • x
Jan Feb Mar Apr May Jun Jul Aug Sep Oct Nov Dec
•i•ure 8. Monthly •ver•es of •R• •rchived d•t• (198•-1994). Solid line represents 1994 d•t•. VMues of (•) •ir temperature (outliers between August •nd November •re from firs• year of op•tio• •d m• •p•s•t i•st•m•t •o•), (b) •t• t•mp•t•, (c) •i• minus w•ter temperature, •nd (d) wind speed.
site, the air temperature - water temperature difference was of the same sign but smaller in magnitude during both months (Table 3). Winds in October are typically stronger than in August, as was observed in 1994. The seasonal cycles in Figure 8 and the mean heat fluxes for August and October are consistent with the analy- sis of Mid-Atlantic Bight climatology by •t•r•/•er [1976]. These results suggest that the differences in the mete- orological variables between the August and October time periods, and hence in the heat flux terms, are due
to seasonal variations and that 1994 was a typical year in this sense.
3.2. Synoptic Variation
The standard deviation of the low-passed net surface heat flux was approximately 135Wm -2 (Table 2) in both the August and October time series. The largest contributions to this variability came from the latent heat flux and shortwave radiation. Shortwave radiation
variability was largest in August, and the latent heat
18,172 AUSTIN AND LENTZ' METEOROLOGICAL FORCING ON THE NC SHELF
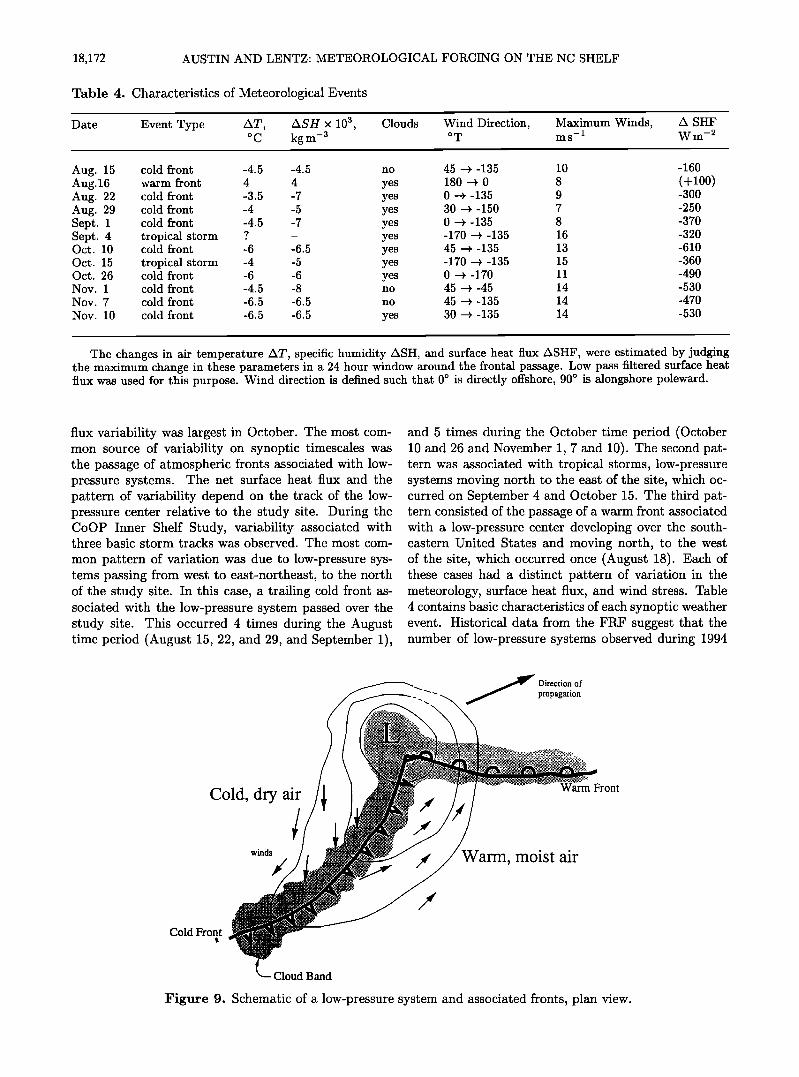
Table 4. Characteristics of Meteorological Events
Date Event Type AT, ASH x 10 a, Clouds Wind Direction, Maximum Winds, A SHF øC kgm -a øT ms -x Wm -2
Aug. 15 cold front -4.5 -4.5 no 45 -•-135 10 -160 Aug.16 warm front 4 4 yes 180 --> 0 8 (+100) Aug. 22 cold front -3.5 -7 yes 0 --> -135 9 -300 Aug. 29 cold front -4 -5 yes 30 -->-150 7 -250 Sept. 1 cold front -4.5 -7 yes 0 -+ -135 8 -370 Sept. 4 tropical storm ? - yes -170 -+ -135 16 -320 Oct. 10 cold front -6 -6.5 yes 45 -+ -135 13 -610 Oct. 15 tropical storm -4 -5 yes -170 -+-135 15 -360 Oct. 26 cold front -6 -6 yes 0 --> -170 11 -490 Nov. 1 cold front -4.5 -8 no 45 --> -45 14 -530 Nov. 7 cold front -6.5 -6.5 no 45 -->-135 14 -470 Nov. 10 cold front -6.5 -6.5 yes 30 -->-135 14 -530
The changes in air temperature AT, specific humidity ASH, and surface heat flux ASHF, were estimated by judging the maximum change in these parameters in a 24 hour window around the frontal passage. Low pass filtered surface heat flux was used for this purpose. Wind direction is defined such that 0 ø is directly offshore, 90 ø is alongshore poleward.
flux variability was largest in October. The most com- mon source of variability on synoptic timescales was the passage of atmospheric fronts associated with low- pressure systems. The net surface heat flux and the pattern of variability depend on the track of the low- pressure center relative to the study site. During the CoOP Inner Shelf Study, variability associated with three basic storm tracks was observed. The most com-
mon pattern of variation was due to low-pressure sys- tems passing from west to east-northeast, to the north of the study site. In this case, a trailing cold front as- sociated with the low-pressure system passed over the study site. This occurred 4 times during the August time period (August 15, 22, and 29, and September 1),
and 5 times during the October time period (October 10 and 26 and November 1, 7 and 10). The second pat- tern was associated with tropical storms, low-pressure systems moving north to the east of the site, which oc- curred on September 4 and October 15. The third pat- tern consisted of the passage of a warm front associated with a low-pressure center developing over the south- eastern United States and moving north, to the west of the site, which occurred once (August 18). Each of these cases had a distinct pattern of variation in the meteorology, surface heat flux, and wind stress. Table 4 contains basic characteristics of each synoptic weather event. Historical data from the FRF suggest that the number of low-pressure systems observed during 1994
•• • Direction of ''. • / propaganon
! I -:e:.•<.•.•.•....•....:...........• [ ......... i•'•:'"p-:-'.::,.'•-,•i•i•i.-'• ........... '.-'.:,.:•eii!•:•-':::•'•-*•..'..'•i• ............ ::""'•:':""""• Front
Cold, dry air ' / arm, moist alr•;•2•3i•:. .,• .
Cold Fro?
k Cloud Band Figure 9. Schematic of a low-pressure system and associated fronts, plan view.
AUSTIN AND LENTZ' METEOROLOGICAL FORCING ON THE NC SHELF 18,173
25
20
15
10
Water T"emP iAir Temp /5
0.02
0.015
0.01 0.005
Spebific Hun;lidity i'..•
1040 : .. :
I Bar(•metric Pressure' 1030 ......... ß ........ ' ............. : ........
E 1020
1010
180
o
• 90 o
= 0
5 -90
-180
20
15
e10 E
Nov 5 Nov 6 Nov 7 Nov 8 Nov 9 Nov 10
o
-100
-2OO
0
-200
-400
100
-100
500 ; . ; •Net Heal Flux l 0
-500
0.5
-0.5 Nov 5 Nov 6 Nov 7 Nov 8 Nov 9 Nov 10
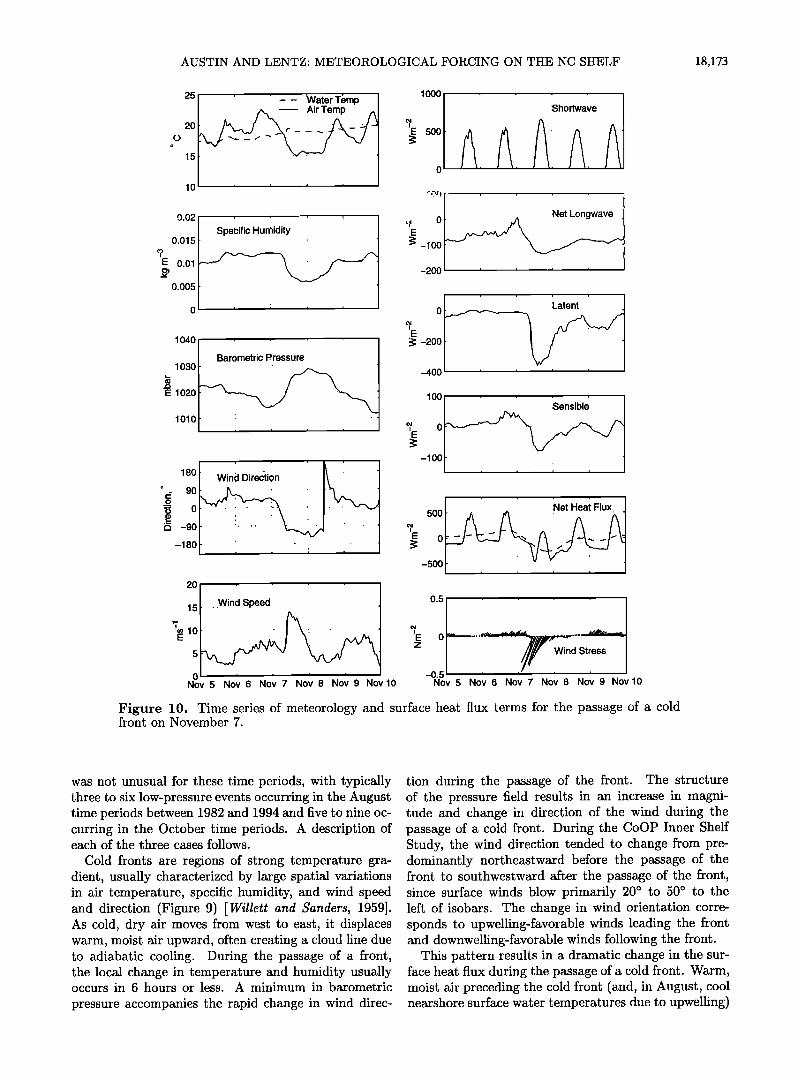
Figure 10. Time series of meteorology and surface heat flux terms for the passage of a cold front on November 7.
was not unusual for these time periods, with typically three to six low-pressure events occurring in the August time periods between 1982 and 1994 and five to nine oc- curring in the October time periods. A description of each of the three cases follows.
Cold fronts are regions of strong temperature gra- dient, usually characterized by large spatial variations in air temperature, specific humidity, and wind speed and direction (Figure 9) [Willeft and Sanders, 1959]. As cold, dry air moves from west to east, it displaces warm, moist air upward, often creating a cloud line due to adiabatic cooling. During the passage of a front, the local change in temperature and humidity usually occurs in 6 hours or less. A minimum in barometric
pressure accompanies the rapid change in wind direc-
tion during the passage of the front. The structure of the pressure field results in an increase in magni- tude and change in direction of the wind during the passage of a cold front. During the CoOP Inner Shelf Study, the wind direction tended to change from pre- dominantly northeastward before the passage of the front to southwestward after the passage of the front, since surface winds blow primarily 20 ø to 50 ø to the left of isobars. The change in wind orientation corre- sponds to upwelling-favorable winds leading the front and downwelling-favorable winds following the front.
This pattern results in a dramatic change in the sur- face heat flux during the passage of a cold front. Warm, moist air preceding the cold front (and, in August, cool nearshore surface water temperatures due to upwelling)
18,174 AUSTIN AND LENTZ: METEOROLOGICAL FORCING ON THE NC SHELF
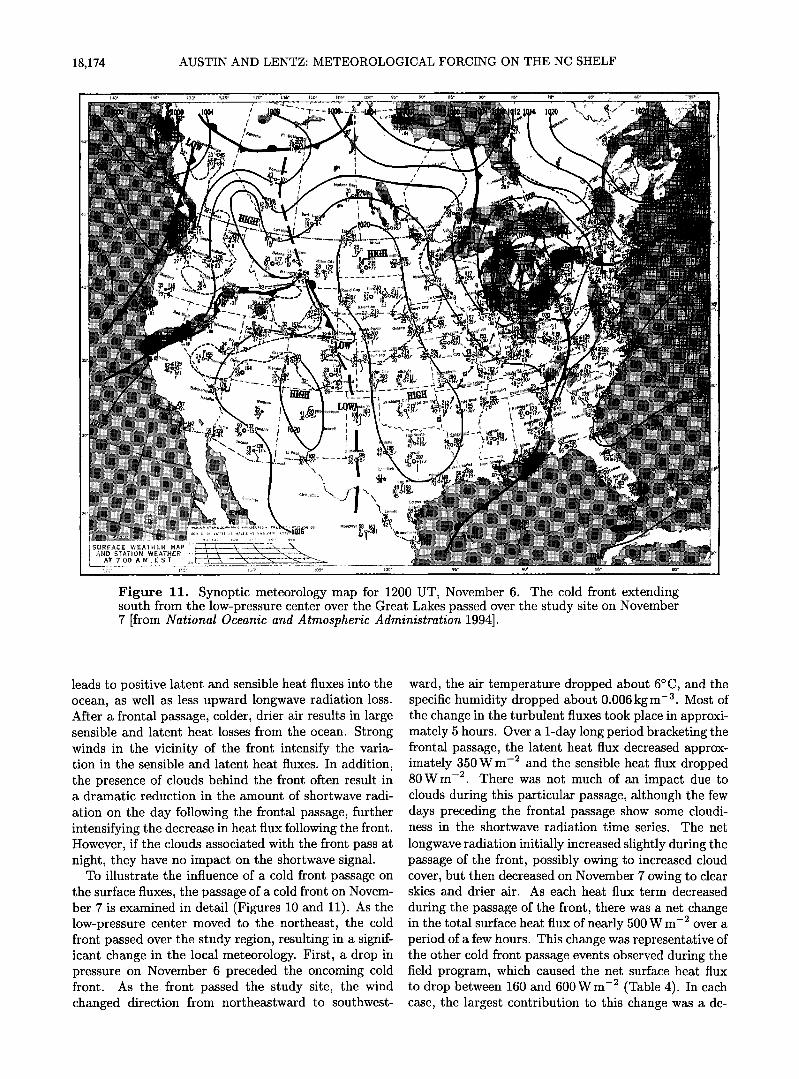
Figure 11. Synoptic meteorology map for 1200 UT, November 6. The cold front extending south from the low-pressure center over the Great Lakes passed over the study site on November 7 [from National Oceanic and Atmospheric Administration 1994].
leads to positive latent and sensible heat fluxes into the ocean, as well as less upward longwave radiation loss. After a frontal passage, colder, drier air results in large sensible and latent heat losses from the ocean. Strong winds in the vicinity of the front intensify the varia- tion in the sensible and latent heat fluxes. In addition, the presence of clouds behind the front often result in a dramatic reduction in the amount of shortwave radi-
ation on the day following the frontal passage, further intensifying the decrease in heat flux following the front. However, if the clouds associated with the front pass at night, they have no impact on the shortwave signal.
To illustrate the influence of a cold front passage on the surface fluxes, the passage of a cold front on Novem- ber 7 is examined in detail (Figures l0 and ll). As the low-pressure center moved to the northeast, the cold front passed over the study region, resulting in a signif- icant change in the local meteorology. First, a drop in pressure on November 6 preceded the oncoming cold front. As the front passed the study site, the wind changed direction from northeastward to southwest-
ward, the air temperature dropped about 6øC, and the specific humidity dropped about 0.006 kgm -3. Most of the change in the turbulent fluxes took place in approxi- mately 5 hours. Over a 1-day long period bracketing the frontal passage, the latent heat flux decreased approx- imately 350 W m -2 and the sensible heat flux dropped 80Wm -2. There was not much of an impact due to clouds during this particular passage, although the few days preceding the frontal passage show some cloudi- ness in the shortwave radiation time series. The net
longwave radiation initially increased slightly during the passage of the front, possibly owing to increased cloud cover, but then decreased on November 7 owing to clear skies and drier air. As each heat flux term decreased
during the passage of the front, there was a net change in the total surface heat flux of nearly 500 W m -2 over a period of a few hours. This change was representative of the other cold front passage events observed during the field program, which caused the net surface heat flux to drop between 160 and 600 W m -2 (Table 4). In each case, the largest contribution to this change was a de-
AUSTIN AND LENTZ: METEOROLOGICAL FORCING ON THE NC SHELF 18,175
251 i ; .'.W. ater T"emp I 1000
20 •E 500 15
0
10
0.02
0.015
E 0.01
0.005
1040
ß •arome•ric PresSure 1030 ........ : ...... : ....... • ........ : .......
E 1020
1010 ....................................... ß
; : : ;
180 ß :Wind Dir. ection ß . .
90 -. . . ' '
ß ß
-180
• -50 E
• -100
-150
0
•: -200
ß :
;ShortwaVe
Net Longwave
-4OO
lOO
-lOO
2O
10 • E
Z 5
0 0ct13 0ct14 0ct15 0ct16 0ct17 0ct18
5OO
-50O
0.5
ß .
-0.5 0ct13 0c•14 0ct15 0c;16 0c•17 0ct18
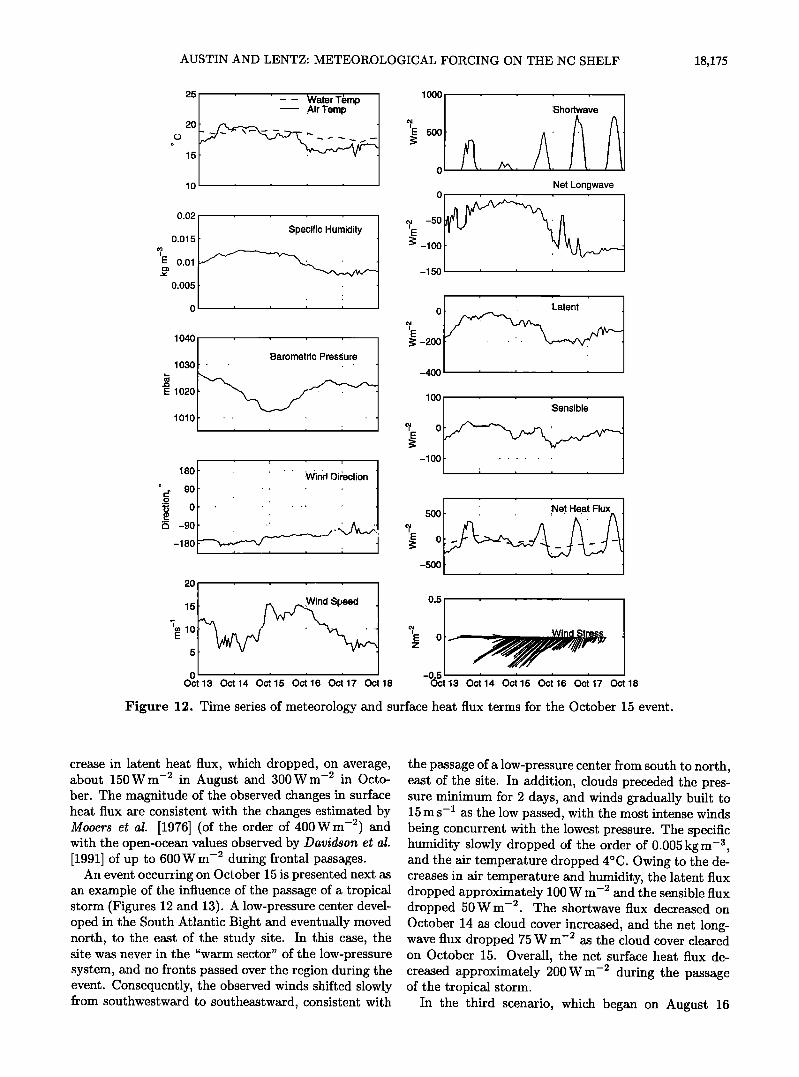
Figure 12. Time series of meteorology and surface heat flux terms for the October 15 event.
crease in latent heat flux, which dropped, on average, about 150Wm -2 in August and 300W m -2 in Octo- ber. The magnitude of the observed changes in surface heat flux are consistent with the changes estimated by Mooers et al. [1976] (of the order of 400 W m -2) and with the open-ocean values observed by Davidson et al. [1991] of up to 600 W m -2 during frontal passages.
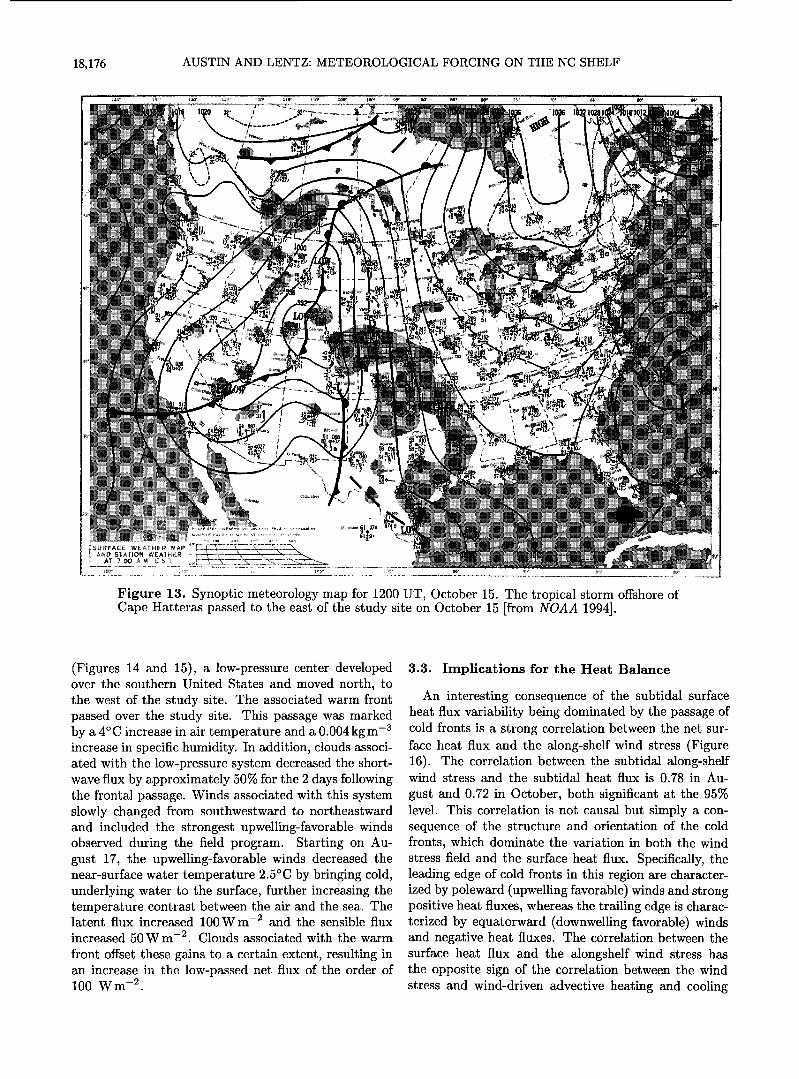
An event occurring on October 15 is presented next as an example of the influence of the passage of a tropical storm (Figures 12 and 13). A low-pressure center devel- oped in the South Atlantic Bight and eventually moved north, to the east of the study site. In this case, the site was never in the "warm sector" of the low-pressure system, and no fronts passed over the region during the event. Consequently, the observed winds shifted slowly from southwestward to southeastward, consistent with
the passage of a low-pressure center from south to north, east of the site. In addition, clouds preceded the pres- sure minimum for 2 days, and winds gradually built to 15 m s -1 as the low passed, with the most intense winds being concurrent with the lowest pressure. The specific humidity slowly dropped of the order of 0.005 kgm -3, and the air temperature dropped 4øC. Owing to the de- creases in air temperature and humidity, the latent flux dropped approximately 100 W m -2 and the sensible flux dropped 50W m -2. The shortwave flux decreased on October 14 as cloud cover increased, and the net long- wave flux dropped 75 W m -2 as the cloud cover cleared on October 15. Overall, the net surface heat flux de- creased approximately 200Wm -2 during the passage of the tropical storm.
In the third scenario, which began on August 16
18,176 AUSTIN AND LENTZ: METEOROLOGICAL FORCING ON THE NC SHELF
..
o
Figure 13. Synoptic meteorology map for 1200 UT, October 15. The tropical storm offshore of Cape Hatteras passed to the east of the study site on October 15 [from N0,4,4 1994].
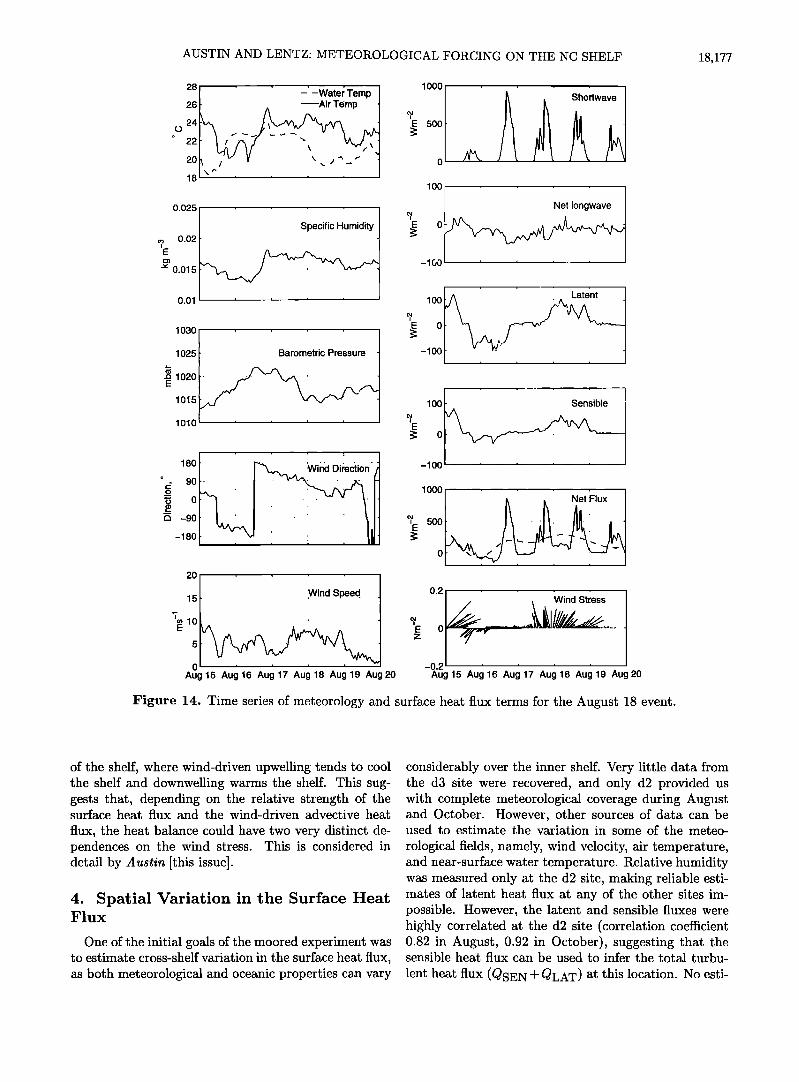
(Figures 14 and 15), a low-pressure center developed over the southern United States and moved north, to the west of the study site. The associated warm front passed over the study site. This passage was marked by a 4øC increase in air temperature and a 0.004 kg m -3 increase in specific humidity. In addition, clouds associ- ated with the low-pressure system decreased the short- wave flux by approximately 50% for the 2 days following the frontal passage. Winds associated with this system slowly changed from southwestward to northeastward and included the strongest upwelling-favorable winds observed during the field program. Starting on Au- gust 17, the upwelling-favorable winds decreased the near-surface water temperature 2.5øC by bringing cold, underlying water to the surface, further increasing the temperature contrast between the air and the sea. The latent flux increased 100Wm -2 and the sensible flux increased 50 W m -2. Clouds associated with the warm front offset these gains to a certain extent, resulting in an increase in the low-passed net flux of the order of 100 Wm -•'.
3.3. Implications for the Heat Balance
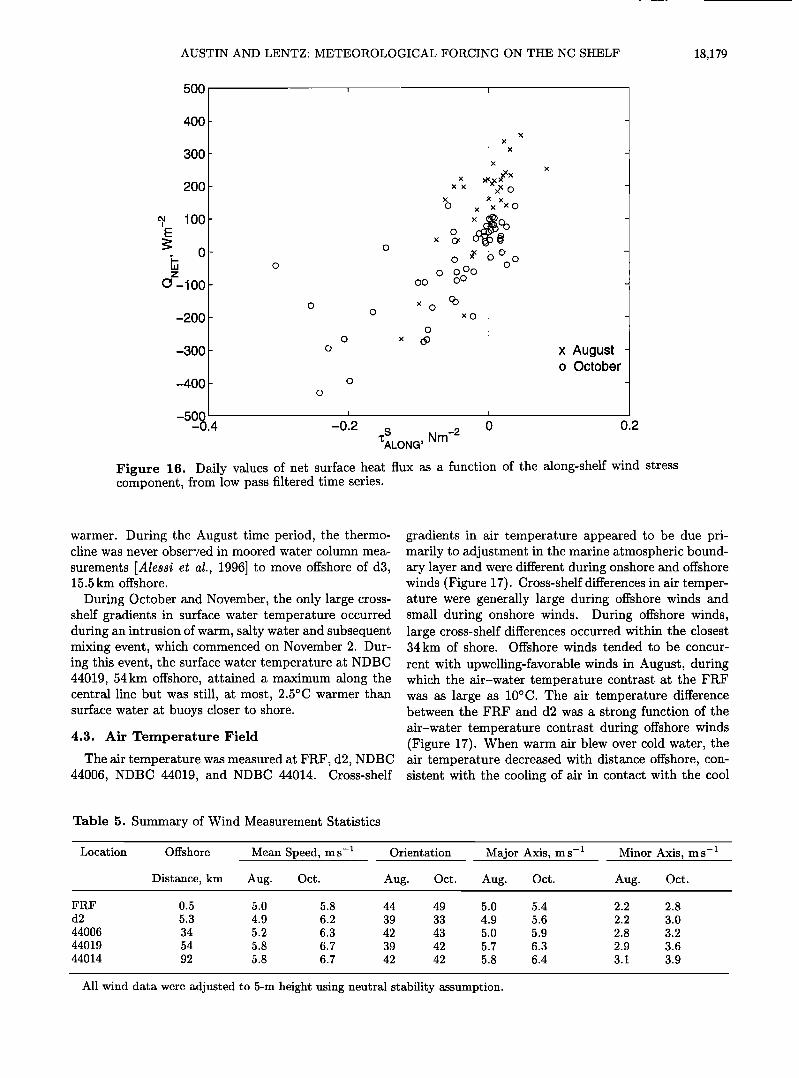
An interesting consequence of the subtidal surface heat flux variability being dominated by the passage of cold fronts is a strong correlation between the net sur- face heat flux and the along-shelf wind stress (Figure 16). The correlation between the subtidal along-shelf wind stress and the subtidal heat flux is 0.78 in Au-
gust and 0.72 in October, both significant at the 95% level. This correlation is not causal but simply a con- sequence of the structure and orientation of the cold fronts, which dominate the variation in both the wind stress field and the surface heat flux. Specifically, the leading edge of cold fronts in this region are character- ized by poleward (upwelling favorable) winds and strong positive heat fluxes, whereas the trailing edge is charac- terized by equatorward (downwelling favorable) winds and negative heat fluxes. The correlation between the surface heat flux and the alongshelf wind stress has the opposite sign of the correlation between the wind stress and wind-driven advective heating and cooling
AUSTIN AND LENTZ: METEOROLOGICAL FORCING ON THE NC SHELF 18,177
28
26
24
o
22
20
18
0.025
• 0.02 E
'" 0.015
0.01
[k• ' ; -; ,Water." Temp /
ß .: ..... -• -Air-T-•.mp ---•
Specific H•umidity
ß .
1030
1025
.a 1020 E
1015
1010
180
90
-90
-180
20
15
'7 •10 E
Aug15 Aug16 Aug17 Aug18 Aug19 Aug 20
lOOO
E 500
IO0
-1(•0
Netlongwave J
lOO
-lOO
^ ß Lat(•nt
ß
, i i
lOO
o
-lOO
lOOO
•E 500
Aug15 Aug16 Aug17 Aug18 Aug19 Aug 20
Figure 14. Time series of meteorology and surface heat flux terms for the August 18 event.
of the shelf, where wind-driven upwelling tends to cool the shelf and downwelling warms the shelf. This sug- gests that, depending on the relative strength of the surface heat flux and the wind-driven advective heat
flux, the heat balance could have two very distinct de- pendences on the wind stress. This is considered in detail by Austin [this issue].
4. Spatial Variation in the Surface Heat Flux
One of the initial goals of the moored experiment was to estimate cross-shelf variation in the surface heat flux, as both meteorological and oceanic properties can vary
considerably over the inner shelf. Very little data from the d3 site were recovered, and only d2 provided us with complete zneteorological coverage during August and October. However, other sources of data can be used to estimate the variation in some of the meteo-
rological fields, namely, wind velocity, air temperature, and near-surface water temperature. Relative humidity was measured only at the d2 site, making reliable esti- mates of latent heat flux at any of the other sites im- possible. However, the latent and sensible fluxes were highly correlated at the d2 site (correlation coefficient 0.82 in August, 0.92 in October), suggesting that the sensible heat flux can be used to infer the total turbu-
lent heat flux ((•SEN + (•LAT) at this location. No esti-
18,178 AUSTIN AND LENTZ: METEOROLOGICAL FORCING ON THE NC SHELF
7:00
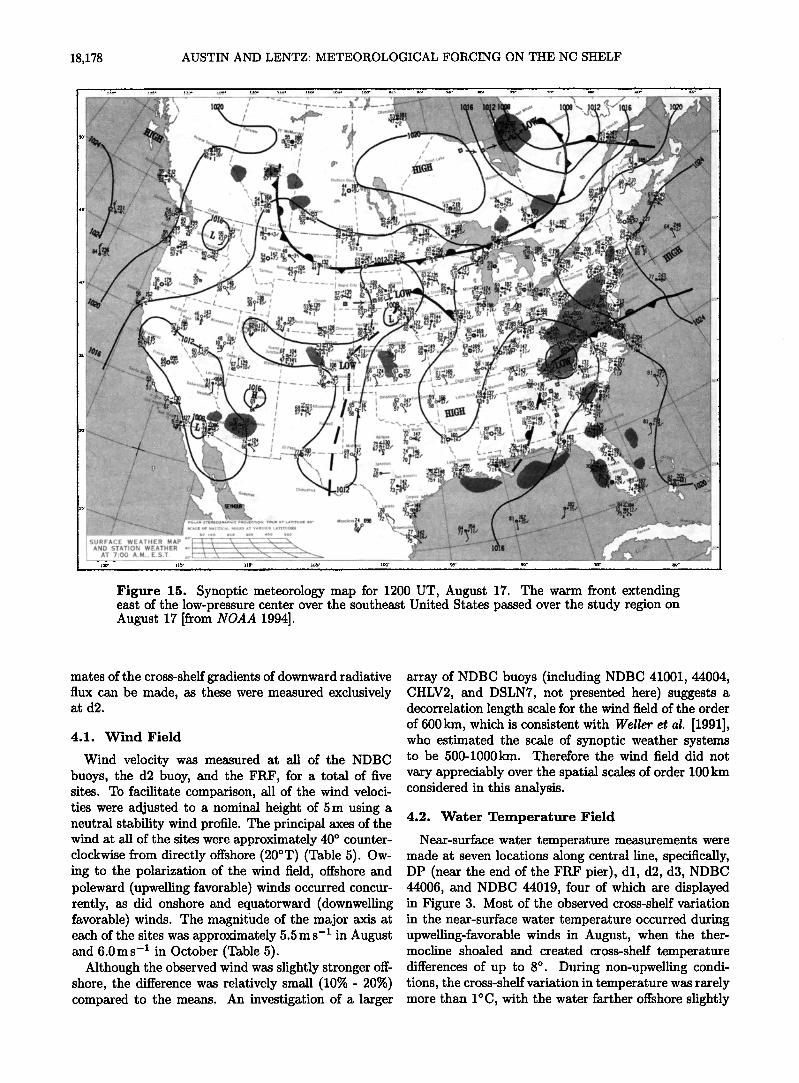
Figure 15. Synoptic meteorology map for 1200 UT, August 17. The warm front extending east of the low-pressure center over the southeast United States passed over the study region on August 17 [from NOAA 1994].
mates of the cross-shelf gradients of downward radiative flux can be made, as these •vere measured exclusively at d2.
4.1. Wind Field
Wind velocity was measured at all of the NDBC buoys, the d2 buoy, and the FRF, for a total of five sites. To facilitate comparison, all of the wind veloci- ties were adjusted to a nominal height of 5 m using a neutral stability wind profile. The principal axes of the wind at all of the sites were approximately 40 ø counter- clockwise from directly offshore (20øT) (Table 5). Ow- ing to the polarization of the wind field, offshore and poleward (upwelling favorable) winds occurred concur- rently, as did onshore and equatorward (downwelling favorable) winds. The magnitude of the major axis at each of the sites was approximately 5.5 m s -t in August and 6.0ms -t in October (Table 5).
Although the observed wind was slightly stronger off- shore, the difference was relatively small (10% - 20%) compared to the means. An investigation of a larger
array of NDBC buoys (including NDBC 41001, 44004, CHLV2, and DSLN7, not presented here) suggests a decorrelation length scale for the wind field of the order of 600 km, which is consistent with Weller et aL [1991], who estimated the scale of synoptic weather systems to be 500-1000km. Therefore the wind field did not
vary appreciably over the spatial scales of order 100 km considered in this analysis.
4.2. Water Temperature Field
Near-surface water temperature measurements were made at seven locations along central line, specifically, DP (near the end of the FRF pier), dl, d2, d3, NDBC 44006, and NDBC 44019, four of which are displayed in Figure 3. Most of the observed cross-shelf variation in the near-surface water temperature occurred during upwelling-favorable winds in August, when the ther- mocline shoaled and created cross-shelf temperature differences of up to 8 ø . During non-upwelling condi- tions, the cross-shelf variation in temperature was rarely more than 1øC, with the water farther offshore slightly
AUSTIN AND LENTZ' METEOROLOGICAL FORCING ON THE NC SHELF 18,179
500 ,
400 - - x
ß x
x
300 - ß - .X
X
200 •< •<•< x•Xx - x ix•O -
• x x x 'x xo 100 - -
o
0 ......... o • 5'ø'6 ............
0 -100 - oo -
o Xo O xo - -200 -
o
o x -300- o x August -
o October
-400 - o - O '
-500 -0.4 -0.2 0 0.2
S Nm-2 •ALONG'
Figure 16. Daily values of ne• surface hea• flux as a function of •he along-shelf wind s•ress component, from low pass filtered •ime series.
warmer. During the August time period, the thermo- cline was never observed in moored water column mea-
surements [Alessi et al., 1996] to move offshore of d3, 15.5 km offshore.
During October and November, the only large cross- shelf gradients in surface water temperature occurred during an intrusion of warm, salty water and subsequent mixing event, which commenced on November 2. Dur- ing this event, the surface water temperature at NDBC 44019, 54km offshore, attained a maximum along the central line but was still, at most, 2.5øC warmer than surface water at buoys closer to shore.
4.3. Air Temperature Field
The air temperature was measured at FRF, d2, NDBC 44006, NDBC 44019, and NDBC 44014. Cross-shelf
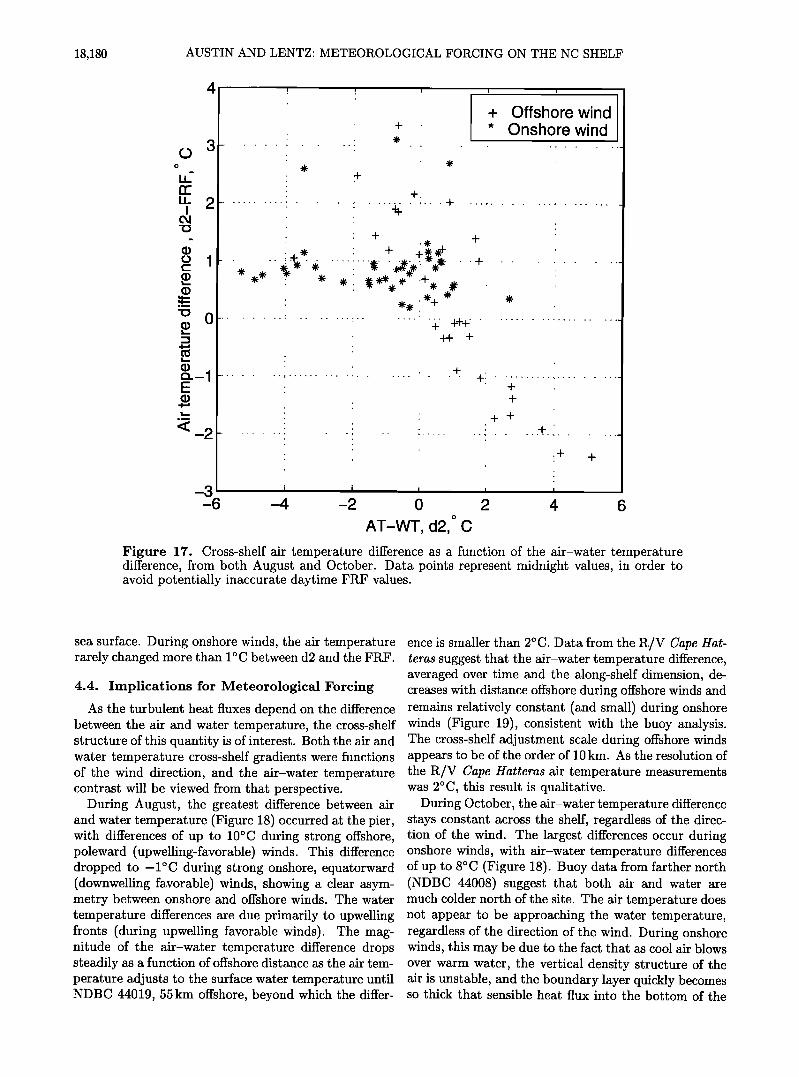
gradients in air temperature appeared to be due pri- marily to adjustment in the marine atmospheric bound- ary layer and were different during onshore and offshore winds (Figure 17). Cross-shelf differences in air temper- ature were generally large during offshore winds and small during onshore winds. During offshore winds, large cross-shelf differences occurred within the closest 34km of shore. Offshore winds tended to be concur-
rent with upwelling-favorable winds in August, during which the air-water temperature contrast at the FRF was as large as 10øC. The air temperature difference between the FRF and d2 was a strong function of the air-water temperature contrast during offshore winds (Figure 17). When warm air blew over cold water, the air temperature decreased with distance offshore, con- sistent with the cooling of air in contact with the cool
Table 5. Summary of Wind Measurement Statistics
Location Offshore Mean Speed, ms- •
Distance, km Aug. Oct.
Orientation Major Axis, m s- • Minor Axis, m s-1
Aug. Oct. Aug. Oct. Aug. Oct.
FRF 0.5 5.0 5.8 d2 5.3 4.9 6.2 44006 34 5.2 6.3 44019 54 5.8 6.7 44014 92 5.8 6.7
44 49 5.0 5.4 2.2 2.8 39 33 4.9 5.6 2.2 3.0
42 43 5.0 5.9 2.8 3.2 39 42 5.7 6.3 2.9 3.6 42 42 5.8 6.4 3.1 3.9
All wind data were adjusted to 5-m height using neutral stability assumption.
18,180 AUSTIN AND LENTZ' METEOROLOGICAL FORCING ON THE NC SHELF
3
Figure 17.
-3 -6
+ Offshore wind + ' * Onshore wind .•- :
:
:
.............. .+._• ........... + 4-•-,½' '
.......................................... •...+++ .............................
I
-4 -2 0 2 4 6 o
AT-WT, d2, C
Cross-shelf air temperature difference as a function of the air-water temperature difference, from both August and October. Data points represent midnight values, in order to avoid potentially inaccurate daytime FRF values.
sea surface. During onshore winds, the air temperature rarely changed more than 1øC between d2 and the FRF.
4.4. Implications for Meteorological Forcing
As the turbulent heat fluxes depend on the difference between the air and water temperature, the cross-shelf structure of this quantity is of interest. Both the air and water temperature cross-shelf gradients were functions of the wind direction, and the air-water temperature contrast will be viewed from that perspective.
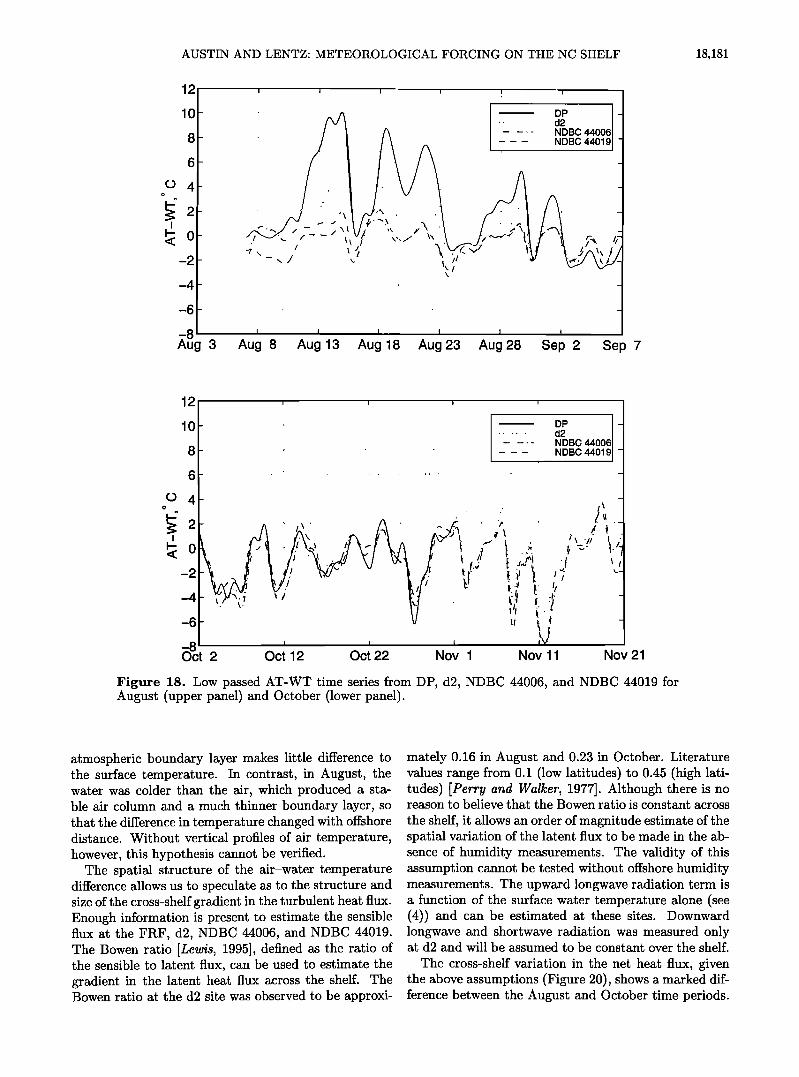
During August, the greatest difference between air and water temperature (Figure 18) occurred at the pier, with differences of up to 10øC during strong offshore, poleward (upwelling-favorable) winds. This difference dropped to -1 øC during strong onshore, equatorward (downwelling favorable) winds, showing a clear asym- metry between onshore and offshore winds. The water temperature differences are due primarily to upwelling fronts (during upwelling favorable winds). The mag- nitude of the air-water temperature difference drops steadily as a function of offshore distance as the air tem- perature adjusts to the surface water temperature until NDBC 44019, 55 km offshore, beyond which the differ-
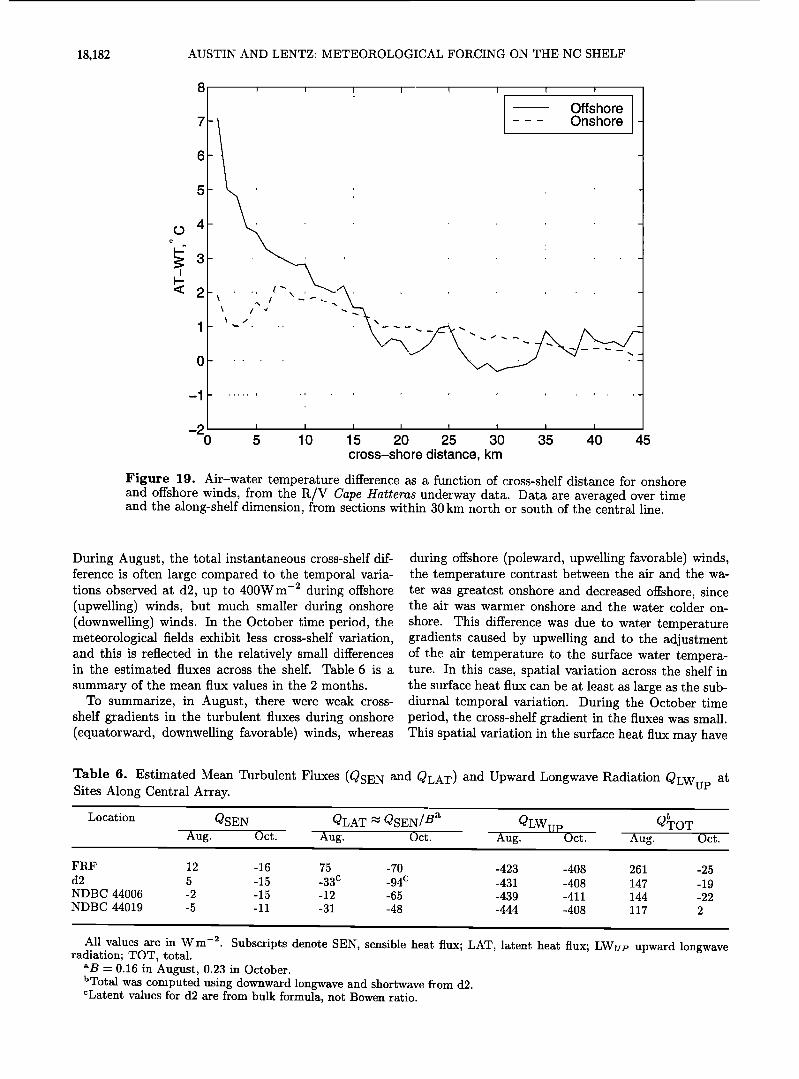
ence is smaller than 2øC. Data from the R/V Cape Hat- teras suggest that the air-water temperature difference, averaged over time and the along-shelf dimension, de- creases with distance offshore during offshore winds and remains relatively constant (and small) during onshore winds (Figure 19), consistent with the buoy analysis. The cross-shelf adjustment scale during offshore winds appears to be of the order of 10 km. As the resolution of the R/V Cape Hatteras air temperature measurements was 2øC, this result is qualitative.
During October, the air-water temperature difference stays constant across the shelf, regardless of the direc- tion of the wind. The largest differences occur during onshore winds, with air-water temperature differences of up to 8øC (Figure 18). Buoy data from farther north (NDBC 44008) suggest that both air and water are much colder north of the site. The air temperature does not appear to be approaching the water temperature, regardless of the direction of the wind. During onshore winds, this may be due to the fact that as cool air blows over warm water, the vertical density structure of the air is unstable, and the boundary layer quickly becomes so thick that sensible heat flux into the bottom of the
AUSTIN AND LENTZ: METEOROLOGICAL FORCING ON THE NC SHELF 18,181
12
lO
8
6
ø ¸ 4
-2
-4
-6
i
-8 i i Aug 3 Aug 8 Aug 13 Aug18 Aug 23 Aug 28 Sep 2 Sep 7
12
58ct 2 I I I
Oct 12 Oct 22 Nov 1 Nov 11 Nov 21
Figure 18. Low passed AT-WT time series from DP, d2, NDBC 44006, and NDBC 44019 for August (upper panel) and October (lower panel).
atmospheric boundary layer makes little difference to the surface temperature. In contrast, in August, the water was colder than the air, which produced a sta- ble air column and a much thinner boundary layer, so that the difference in temperature changed with offshore distance. Without vertical profiles of air temperature, however, this hypothesis cannot be verified.
The spatial structure of the air-water temperature difference allows us to speculate as to the structure and size of the cross-shelf gradient in the turbulent heat flux. Enough information is present to estimate the sensible flux at the FRF, d2, NDBC 44006, and NDBC 44019. The Bowen ratio [Lewis, 1995], defined as the ratio of the sensible to latent flux, can be used to estimate the gradient in the latent heat flux across the shelf. The Bowen ratio at the d2 site was observed to be approxi-
mately 0.16 in August and 0.23 in October. Literature values range from 0.1 (low latitudes) to 0.45 (high lati- tudes) [Perry and Walker, 1977]. Although there is no reason to believe that the Bowen ratio is constant across
the shelf, it allows an order of magnitude estimate of the spatial variation of the latent flux to be made in the ab- sence of humidity measurements. The validity of this assumption cannot be tested without offshore humidity measurements. The upward longwave radiation term is a function of the surface water temperature alone (see (4)) and can be estimated at these sites. Downward longwave and shortwave radiation was measured only at d2 and will be assumed to be constant over the shelf.
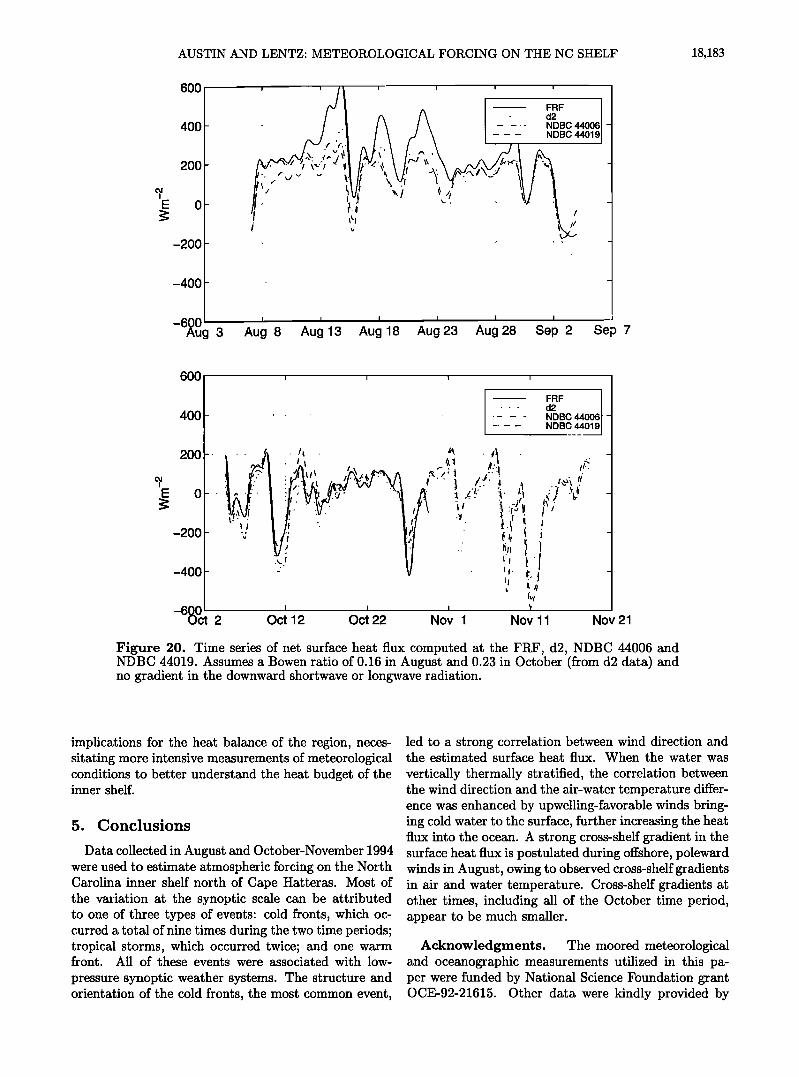
The cross-shelf variation in the net heat flux, given the above assumptions (Figure 20), shows a marked dif- ference between the August and October time periods.
18,182 AUSTIN AND LENTZ: METEOROLOGICAL FORCING ON THE NC SHELF
Offshore 7 .................... Onshore -
5
? 4
• 3 ii 2
0
-1
-2 0 5 10 15 20 25 30 35 40 45
cross-shore distance, km
Figure 19. Air-water temperature difference as a function of cross-shelf distance for onshore and offshore winds, from the R/V Cape Hatteras underway data. Data are averaged over time and the along-shelf dimension, from sections within 30 km north or south of the central line.
During August, the total instantaneous cross-shelf dif- ference is often large compared to the temporal varia- tions observed at d2, up to 400Wm -2 during offshore (upwelling) winds, but much smaller during onshore (downwelling) winds. In the October time period, the meteorological fields exhibit less cross-shelf variation, and this is reflected in the relatively small differences in the estimated fluxes across the shelf. Table 6 is a
summary of the mean flux values in the 2 months. To summarize, in August, there were weak cross-
shelf gradients in the turbulent fluxes during onshore (equatorward, downwelling favorable)winds, whereas
during offshore (poleward, upwelling favorable) winds, the temperature contrast between the air and the wa- ter was greatest onshore and decreased offshore, since the air was warmer onshore and the water colder on- shore. This difference was due to water temperature gradients caused by upwelling and to the adjustment of the air temperature to the surface water tempera- ture. In this case, spatial variation across the shelf in the surface heat flux can be at least as large as the sub- diurnal temporal variation. During the October time period, the cross-shelf gradient in the fluxes was small. This spatial variation in the surface heat flux may have
Table 6. Estimated Mean Turbulent Fluxes (QSEN and QLAT) and Upward Longwave Radiation QLWu P Sites Along Central Array.
at
Location QSEN QLAT • QSEN/Ba QLWi• P Q%OT Aug. Oct. Aug. Oct. Aug. Oct. Aug. Oct.
FRF 12 -16 75 -70 -423 -408 261 -25 d2 5 -15 -33 c -94 c -431 -408 147 -19 NDBC 44006 -2 -15 -12 -65 -439 -411 144 -22 NDBC 44019 -5 -11 -31 -48 -444 -408 117 2
All values are in W m -•'. Subscripts denote SEN, sensible heat flux; LAT, latent heat flux; LWvp upward longwave radiation; TOT, total.
aB --0.16 in August, 0.23 in October. bTotal was computed using downward longwave and shortwave from d2. CLatent values for d2 are from bulk formula, not Bowen ratio.
AUSTIN AND LENTZ: METEOROLOGICAL FORCING ON THE NC SHELF 18,185
I
6OO
400 ....
200 -'
0
-200 -
-400 ....
-6RuOg 3 Aug 8 Aug13 Aug18 Aug 23 Aug 28 Sep 2 Se2 7
I
600 • • ß
400
2OO
0
-200
-400
-6•0ct 2
i
FRF J ........ d2 ...... NDBC 44006' -
NDBC 44019J ß .
ß
...., .............. I'• ............... . ...................... , .......... t• ........ i .................. I __• : • • . •:1 ,,'./ : ,.4 I ,,• : .-'•',,, ,'•,•,:,,-• ,, .•..,?• ..,,'..'•! : . .'.:"'
i..1 !? ................. :":-......•.-• .................. V. ' '! ............. '""•i.;i .........
Oct 12 Oct 22 Nov 1 Nov 11 Nov 21
Figure 20. Time series of net surface heat flux computed at the FRF, d2, NDBC 44006 and NDBC 44019. Assumes a Bowen ratio of 0.16 in August and 0.23 in October (from d2 data) and no gradient in the downward shortwave or longwave radiation.
implications for the heat balance of the region, neces- sitating more intensive measurements of meteorological conditions to better understand the heat budget of the inner shelf.
5. Conclusions
Data collected in August and October-November 1994 were used to estimate atmospheric forcing on the North Carolina inner shelf north of Cape Hatteras. Most of the variation at the synoptic scale can be attributed to one of three types of events: cold fronts, which oc- curred a total of nine times during the two time periods; tropical storms, which occurred twice; and one warm front. All of these events were associated with low-
pressure synoptic weather systems. The structure and orientation of the cold fronts, the most common event,
led to a strong correlation between wind direction and the estimated surface heat flux. When the water was
vertically thermally stratified, the correlation between the wind direction and the air-water temperature differ- ence was enhanced by upwelling-favorable winds bring- ing cold water to the surface, further increasing the heat flux into the ocean. A strong cross-shelf gradient in the surface heat flux is postulated during offshore, poleward winds in August, owing to observed cross-shelf gradients in air and water temperature. Cross-shelf gradients at other times, including all of the October time period, appear to be much smaller.
Acknowledgments. The moored meteorological and oceanographic measurements utilized in this pa- per were funded by National Science Foundation grant OCE-92-21615. Other data were kindly provided by
18,184 AUSTIN AND LENTZ: METEOROLOGICAL FORCING ON THE NC SHELF
the Army Corps of Engineer's Field Research Facility at Duck, North Carolina, and the National Data Buoy Center. Support for the analysis of the data was pro- vided by National Science Foundation grant OCE-96- 33025. J.A.A. was supported by an Office of Naval Research AASERT grant N00014-93-1-1154. Conver- sations held with R. Beardsley, L. Illari, and R. Weller, and comments from two anonymous reviewers provided useful input. This is WHOI contribution 9417.
References
Alados-Arboledas, L., J. Vida, and J. I. Jimenez, Effects of solar radiation on the performance of pyrgeometers with silicon domes, J. Atmos. Oceanic Technol., 5, 666-670, 1988.
Alessi, C. A, S. J. Lentz, and J. A. Austin, Coastal Ocean Processes Inner-shelf Study: Coastal and moored physical oceanographic measurements, Tech. Rep. WHOI 96-06, Woods Hole Oceanogr. Inst., Woods Hole, Mass, 1996.
Austin, J. A., The role of the alongshore wind stress in the heat balance of the north carolina inner shelf, J. Geophys. Res., this issue.
Beardsley, R. C., R. Limeburner, and L. K. Rosenfeld, In- troduction to the CODE-2 Moored Array and Large Scale Data Report, in CODE-2: Moored Array and Large Scale Data Report, CODE Tech. Rep. No. 38, WHOI Tech. Rep. 85-35, Woods Hole Oceanogr. Inst., Woods Hole, Mass, 1985.
Beardsley, R. C., E. Dever, S. J. Lentz, and J. Dean, Surface heat flux variability over the northern california shelf, J. Geophys. Res., 103, 21,553-21,586, 1998.
Birkemeier, W. A., H. C. Miller, S. D. Wilhelm, A. E. De- Wall, and C. S. Gorbics, A User's Guide to the Coastal Engineering Research Center's (CERC's) Field Research Facility, publ. CERC-85-1, Department of the Army, Vicksburg, Miss., 1985.
Blanton, J. O., J. A. Amft, D. K. Lee, and A. Riordan, Wind stress and heat fluxes observed during winter and spring 1986, J. Geophys. Res., 9•, 10,686-10,698, 1989.
Bunker, A., Computations of surface energy flux and annual air-sea interaction cycles of the north atlantic ocean, Mon. Weather Rev., 10•, 1122-1140, 1976.
Burman, C. A., COOP: Coastal Ocean Processes Study, interdisciplinary approach, new technology to determine coupled biological, physical, geological processes affecting larval transport on inner shelf, Sea Technol., 35, 44-49, 1994.
Davidson, K. L., P. J. Boyle, C. Gautier, H. P. Hanson, and S. J. S. Khalsa, Medium- to large-scale atmospheric vari- ability during the Frontal Air-Sea Interaction Experiment, J. Geophys. Res., 96, 8531-8551, 1991.
Dickey, T. D., D. V. Manov, R. A. Weller, and D. A. Siegel, Determination of longwave heat flux at the air-sea inter- face using measurements from buoy platforms, J. Atmos. Oceanic Technol., 11, 1057-1078, 1994.
Enriquez, A. G. and C. A. Friehe, Bulk parameterization of momentum, heat, and moisture fluxes over a coastal upwelling area, J. Geophys. Res., 102, 5781-5798, 1997.
Fairall, C. W., E. F. Bradley, D. P. Rogers, J. B. Edson, and G. S. Young, Bulk parameterization of air-sea fluxes for Tropical Ocean-Global Atmospheric Coupled-Ocean At- mospheric Response Experiment, J. Geophys. Res., i01, 3747-3764, 1996.
Fairall, C. W., P.O. G. Persson, E. F. Bradley, R. E. Payne, and S. P. Anderson, A new look at calibration and use of
eppley precision infrared radiometers part I: theory and application, J. Atmos. Oceanic Tech., 16, 739-751, 1999.
Friehe, C. A., W. J. Shaw, D. P. Rogers, K. L. Davidson, W. G. Large, S. A. Stage, G. H. Crescenti, S. J. S. Khalsa, G. K. Greenhut, and F. Li, Air-sea fluxes and surface layer turbulence around a sea surface temperature front,
J. Geophys. Res., 96, 8593-8609, 1991. Fung, I. Y., D. E. Harrison, and A. A. Lacis, On the vari-
ability of the net longwave radiation at the ocean surface, Rev. of Geophys., 22, 177-193, 1984.
Geernaert, G. L., K. A. Katsaros, and K. Richter, Variation of the drag coefficient and its dependence on sea state, J. Geophys. Res., 91, 7667-7679, 1986.
Gill, A. E., Atmosphere-Ocean Dynamics, Academic Press, San Diego, Calif., 1982.
Large, W. G., and S. Pond, Open ocean momentum flux measurements in moderate to strong winds, J. Phys. Oceanogr., 11, 324-336, 1981.
Large, W. G., and S. Pond, Sensible and latent heat fluxes over the open ocean, J. Phys. Oceanogr., 12, 464-482, 1982.
Large, W. G., J. Morzel, and G. B. Crawford, Account- ing for surface wave distortion of the marine wind profile in low-level ocean storms wind measurements, J. Phys. Oceanogr., 25, 2959-2971, 1995.
Lee, T. N., E. Williams, J. Wang, R. Evans, Response of South Carolina continental shelf waters to wind and gulf stream forcing during winter of 1986, J. Geophys. Res., 9•, 10,715-10,754, 1989.
Lewis, J. M., The story behind the bowen ratio, Bull. Am. Meteorol. Soc., 76, 2433-2443, 1995.
Mooers, C. L., J. Fernandez-Partagas, and J. Price, Meteo- rological forcing fields of the New York bight (first year), Tech. Rep. TR76-8, Rosenstiel School of Mar. and At- mos. Sci., Univ. of Miami, Miami, Fla., 1976.
Mountain, D. G., G. A. Strout, and R. C. Beardsley, Surface heat flux in the Gulf of Maine, Deep Sea Res., Part I, 1533-1546, 1996.
National Oceanic and Atmospheric Administration, Daily Weather Maps, weekly series, Silver Spring, Md., 1994.
Payne, R. E., Albedo of the sea surface, J. Atmos. Sci., 29, 959-970, 1972.
Perry, A. H., and J. M. Walker, The Ocean-Atmosphere Sys- tem, Longman, White Plains, N.Y., 1977.
Roelofs, E. W., and D. F. Bumpus, The hydrography of pamlico sound, Bull. Mar. Sci. Gulf Carib., 3, 181-205, 1953.
United States Naval Observatory, Almanac for Computers, Nautical Almanac Off., Washington, D.C., 1978.
Waldorf, B. W., J. L. Largier, S. Rennie, J. Austin, and C. Greengrove, Coastal Ocean Processes (COOP) pilot project data report: R/V Cape Hatteras shipboard mea- surements; Underway, CTD and ADCP data, August 1994, SIO Ref. Set. 95-29, Scripps Inst. of Oceanogr., La Jolla, Calif., 1995.
Waldorf, B. W., J. L. Largier, S. Rennie, and J. Austin, Coastal Ocean Processes (COOP) pilot project data Re- port: R/V Cape Hatteras shipboard measurements; Un- derway, CTD and ADCP data, October 1994, SIO Ref. Ser. 96-9, Scripps Inst. of Oceanogr., La Jolla, Calif., 1996.
Weller, R. A., D. L. Rudnick, R. E. Payne, J.P. Dean, N.J. Pennington, and R.P. Trask, Measuring near-surface me- teorology over the ocean from an array of surface moorings in the Subtropical Convergence Zone, J. Atmos. Oceanic Tech., 7, 85-103, 1990.
Weller, R. A., D. L. Rudnick, C. C. Eriksen, K. L. Polzin,
AUSTIN AND LENTZ: METEOROLOGICAL FORCING ON THE NC SHELF 18,185
N. S. Oakey, J. W. Toole, R.W. Schmitt, and R.T. Pol- lard, Forced ocean response during the Frontal Air-Sea Interaction Experiment, J. Geophys. Res., 96, 8611-8638, 1991.
Willerr, H. C., and F. Sanders, Descriptive Meteorology, 2nd ed., $55pp., Academic Press, San Diego, Calif., 1959.
Winant, C. D., and R. C. Beardsley, A comparison of some shallow wind-driven currents. J. Phys. Oceanogr., 9, 218- 220, 1979.
J. Austin, College of Oceanic and Atmospheric Sciences, Oregon State University, Ocean Administration Building 104, Corvallis, OR 97331. ([email protected])
S. J. Lentz, Department of Physical Oceanography, Woods Hole Oceanographic Institution, Woods Hole, MA 02543. ([email protected])
(Received June 11, 1997; revised February 27, 1998; accepted May 28, 1998.)