Bushwhack Shelter, 3BE2: An Ozark Bluff-Dweller Site in Northeast Arkansas
Upload
un-lincolnCategory
view
2download
0
Agroforestry Systems 32:297-311, 1995. �9 1995 Kluwer Academic Publishers. Printed in the Netherlands.
The relationship between open windspeed and windspeed reduction in shelter*
H. ZHANG 1'2, J.R. BRANDLE 1, G.E. MEYER 3 and L. HODGES 4 I Department of Forestry, Fisheries and Wildlife, University of Nebraska, Lincoln, NE 68583- 0814, USA; 2 Current address: UCLA-DOE Laboratory, University of California, 900 Veteran Avenue, Los Angeles, CA 90024-1786, USA; 3Department of Biological Systems Engineering, University of Nebraska, Lincoln, NE 68583-0726, USA; 4 Department of Horticulture, University of Nebraska, Lincoln, NE 68583-0724, USA
Key words: relative windspeed reduction, shelterbelt, windbreaks, windspeed
Abstract. Windspeed reduction in shelter is generally expressed relatively and is usually assumed to be independent of open windspeed. The purpose of this study was to re-examine the rela- tionship between open windspeed and windspeed reduction in shelter using windspeeds and wind directions measured for two windbreak systems at various distances from the windbreaks and with three windbreak porosities. Optical windbreak porosities were estimated from digitized color photographs using an intelligent (trainable) image processing program. Relative windspeed reduction in shelter was found to be related to the open windspeed. There existed a threshold windspeed at approximately 5 m s -l, below which relative windspeed reduction varied but generally decreased as the open windspeed increased. Above the threshold windspeed, open windspeed did not have an effect on relative windspeed reduction in the sheltered zone. Using the threshold windspeed reduction, the authors propose an index to evaluate the effectiveness of a windbreak for the overall windspeed protection.
Introduction
A windbreak refers to any structure that reduces windspeed and is commonly used in the place of a shelterbelt, which is rows of trees or shrubs planted specifically for wind protection [Rosenberg et al., 1983; Brandle et al., 1988]. While most windbreaks in many countries have been primarily established for expanding or increasing agricultural production [van Eimern et al., 1964; Cao, 1985; Zhao et al., 1995], other benefits of windbreaks are increasingly being recognized. Windbreaks in the Great Plains of the United States are currently used to reduce soil erosion, protect crops, livestock, and farmstead, control drifting snow, and provide wildlife habitat [Baer, 1989]. The reduction of windspeed in the protected areas of a windbreak is because that the windbreak exerts a drag force on the wind field that results in a loss of momentum of the airflow [Plate, 1971 ]. Windspeed reduction in shelter is usually represented relatively:
* Published as Journal Series No. 10815 of the Agricultural Research Division, University of Nebraska.

298
/ 4 0 - /'/s ] 1 1 - - - - (1)
b/0
where 111 is the relative windspeed reduction in shelter, Uo is the open wind- speed, and u s is the sheltered windspeed. Another variable widely used to represent windspeed reduction in shelter is relative windspeed TI, and is defined as:
U S
r I = - - ( 2 ) /4 o
These two variables are related such that:
rl~ = 1 - T 1 (3)
These two variables have been used in most of the literature on windspeed reduction in shelter [Jensen, 1961; van Eimern et al., 1964; Raine and Stevenson, 1977; Cao, 1985; Heisler and DeWalle, 1988]. Because relative windspeed reduction and relative windspeed are complementary, the following discussion applies to both.
Two factors considered to have major effects on relative windspeed reduc- tion are windbreak (optical) porosity (qb) and distance from the windbreak (~), commonly expressed in multiples of windbreak height (H) [Plate, 1971; Seginer and Sagi, 1971, 1972; Hagen et al., 1981; Borrelli et al., 1989]. A windbreak can generally be classified as one of three categories depending on qb: dense, when qb is less than 10%; intermediate, when qb is between 10% and 35%; or porous, when qb is greater than 35% [van Eimern et al., 1964; Cao, 1985]. The effect of ~ on 111 is related to ~: for a windbreak of low ~, 11, is greater at a ~ immediately behind the windbreak and less at a further
[Plate, 1971]. As ~ increases, the location of maximum 111 is further to the lee of the windbreak [Cao, 1985]. The recent use of digital image pro- cessing techniques greatly increases the accuracy and speed of porosity esti- mation [Kenny, 1987; Loeffler et al., 1992]. Generally, binary photographs (silhouettes) of windbreaks are taken, digitized, and analyzed by a computer program. Improvements can be made by using color images (8, 16 bits or higher) together with a trainable program.
The effect of u 0 on 111 is controversial [Cao, 1985; McNaughton, 1989]. Generally, 111 has been reported or assumed independent of u0 in the majority of the literature [Wen and Wang, 1991]. Based on a linear regression between minimum relative windspeed and u 0, ~ and other factors, Loeffler [1990] con- cluded that the effect of u 0 was not significant, although no interaction terms were included in the model. Also, there are other reports indicating some effect of Uo on 11,. Van Eimern et al. [1964] reported that in most cases the magni- tude of windspeed reduction in the sheltered area decreased as u0 increased

299
but such change in T h was generally less than 5%; they concluded that as u0 increases the porosity of the windbreak changes and that accounts for the change in windspeed reduction. Song et al. [1987] calculated rh averaged over a rectangular field protected by windbreaks on all sides and reported that as u0 increased from 1.5 to 2.6 m s -1, T11 decreased from 23.3% to 16.2%. Because these observations were often made from measurements conducted on wind- breaks of similar porosities, and windspeeds were only measured over short periods (normally less than 24 h), the results are less representative and are inconclusive.
Another factor that may have significant influence on 111 is atmospheric stability, although documentation on such influence is generally scarce [McNaughton, 1988]. Under stable conditions, turbulent transport is reduced, so the relative role of static pressure across the windbreak is increased; under unstable conditions, turbulence is increased, which reduces windspeed pro- tection by shelter [Seginer, 1975]. However, van Eimern et al. [1964] and Wen and Wang [1991] concluded that such influence of atmospheric stability on windspeed reduction in shelter was relatively less important, in comparison to that of qb and ~. Ogawa and Diosey [1980] also found that windspeed reduc- tion behind a two-dimensional fence was independent of atmospheric stability when the Richardson number was between -0.03 to 0.13. Furthermore, Cao [1985] demonstrated that the effect of atmospheric stability on windspeed reduction in shelter was considerably less for windbreaks of high porosities (~ > 35%).
Because rll is so widely used in referring to the effectiveness of a wind- break in reducing windspeeds, it is useful to examine its relationship with u 0. The authors' preliminary studies indicated that such relationship changed as u0 varied and it was related to location (~) within the sheltered zone and porosity (~) of the windbreak. The objective of this research was to evaluate this relationship using field measurements for tree windbreaks, with wind- speeds measured continuously in two open fields and at various distances leeward of two windbreak systems of three optical porosities. Using an intel- ligent (trainable) computer program, windbreak optical porosities were esti- mated from images digitized from color slides taken by a camera. Windspeed reduction leeward of the two east-west oriented windbreaks was calculated for windspeeds where the wind direction was between 135 ~ (SE) and 225 ~ (SW), and its relationship with u 0 was analyzed for different distances and porosities. Possible sources of variation in r h were discussed.
Materials and methods
Windbreaks
The research was conducted in 1991 at the Agricultural Research and Development Center (ARDC) of the University of Nebraska-Lincoln near
300
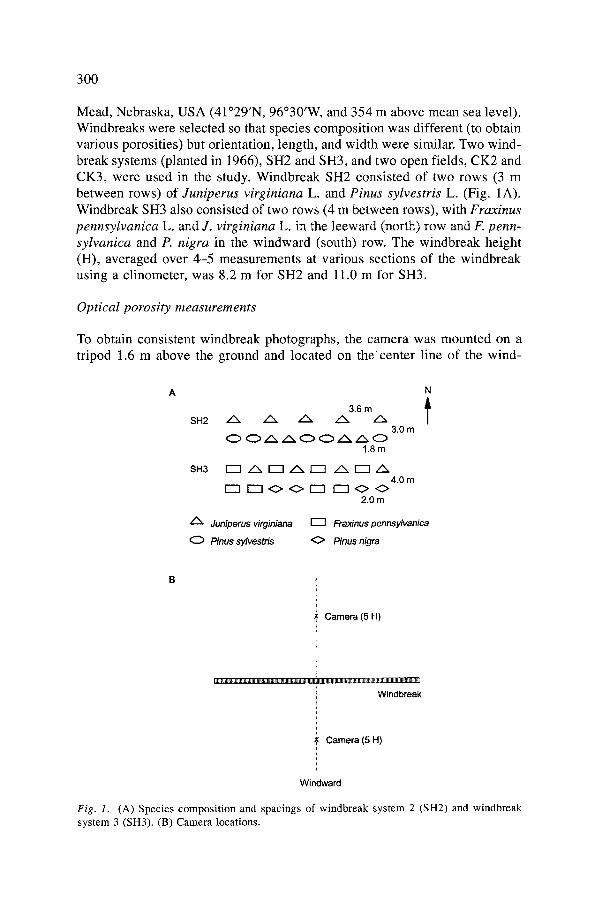
Mead, Nebraska, USA (41~ 96~ and 354 m above mean sea level). Windbreaks were selected so that species composition was different (to obtain various porosities) but orientation, length, and width were similar. Two wind- break systems (planted in 1966), SH2 and SH3, and two open fields, CK2 and CK3, were used in the study. Windbreak SH2 consisted of two rows (3 m between rows) of Juniperus virginiana L. and Pinus sylvestris L. (Fig. 1A). Windbreak SH3 also consisted of two rows (4 m between rows), with Fraxinus pennsyIvanica L. and J. virginiana L. in the leeward (north) row and F. penn- sylvanica and P. nigra in the windward (south) row. The windbreak height (H), averaged over 4-5 measurements at various sections of the windbreak using a clinometer, was 8.2 m for SH2 and 11.0 m for SH3.
Optical porosity measurements
To obtain consistent windbreak photographs, the camera was mounted on a tripod 1.6 m above the ground and located on the center line of the wind-
3.6 m SH2 / ~ /% / ~ / ~ / ~
3.0m
1.8 m
SH3 I---1 / ~ r - - I / % I"-"1 / ~ I'--1 / ~ 4.0 m
2.0 m
/ & Juniperu$ virginiana
0 Pinus sylvestris
I~1 Fraxinus pennsylvanica
Pinus nigra
Camera (5 H)
! Windbreak r
t =
Camera (5 H) i
,, i
Windward
Fig. 1. (A) Species cOmposition and spacings of windbreak system 2 (SH2) and windbreak system 3 (SH3). (B) Camera locations.

301
break at a distance of 5 H (Fig. 1B). Color slides were taken from both sides of the windbreaks using Kodachrome daylight film (ASA 64) under calm con- ditions. The slides were digitized using a Nikon 35 mm Film Scanner Model LS-3500 and Aldus Photostyler under Microsoft Windows. Color images were produced in 24-bit TARGA format and converted to 8-bit color images. An image processing program, Digit (developed by G.E. Meyer), was used to determine optical porosities, which were expressed as a percent.
Before the program was used to estimate porosity, it was 'trained' to recognize the various background sky pixels. These pixels were carefully selected to include a reasonable range of sky colors. A rectangular target window was created to cover the portion of the windbreak to be sampled. Several samples were taken, each representing various portions of the wind- break, as well as the entire windbreak. After the program was 'trained' and the windows were set, the program painted the pixels which matched the sky pixels with high intensity white. A visual comparison of the painted area with the original light-penetrated portions of the target window was made to see if the match was acceptable. If the highlighted areas were far greater or smaller than the original portions, the program was retrained. Relatively small differences were considered acceptable. The program then calculated the per- centage of area of painted pixels over the windowed area, which was defined as the optical porosity. To further increase the precision of estimation, the above procedure was repeated multiple times for each windbreak section; a porosity estimate was accepted when calculated porosities were within 5% of variation among multiple trials.
Wind measurements
All windspeeds were measured 1 m above soil surface at 0.5, 1, 2, 5, 7, and 10 H in May and October-November in 1991 (Table 1), and the flow fields for the open and sheltered sites were unobstructed for a minimum of 250 m
Table 1. Schedule of windspeed measurements. Anemometer height was 1 m. Measurements were made in two windbreak systems (SH2 and SH3) and two open fields (CK2 and CK3). Distance from the windbreak is expressed in multiples of average windbreak height (H). Distances for open fields were measured from south field edges based on windbreak heights of SH2 (for CK2) or SH3 (for CK3). Windbreak porosity is the optical porosity measured using a digital image processing technique.
Time frame Plots Distance (H) Porosity (%)
May 1991 SH3 0.5,1,2,5,7,10 47.9 CK3 0.5,1,2,5,7,10
October-November 1991 SH2 0.5,1,2,5,7,10 40.2 CK2 5 SH3 0.5,1,2,5,7,10 63.7 CK3 5

302
and 200 m, respectively. Wind direction was measured at 5 H at a height of 2.5 m because of its small variation, and both heights (2.5 m for the direc- tion and 1.0 m for the speed) conformed to standards [Sturrock, 1969]. Open windspeeds were measured at 5 H downwind from the field edge, where H was the windbreak height of SH2 (for CK2) or SH3 (for CK3). For all measurements the underlying surface was flat bare soil.
Deviation of wind direction changes the effective porosity of a windbreak [Heisler and DeWalle, 1988] and reduces windspeed reduction in shelter. Windspeed reduction is minimal when wind direction is parallel to a wind- break yet still amounts to 20 to 25% in the immediate lee because of the vertical rough surface of tree crowns [Konstantinov and Struzer, 1969]. Because the windbreak systems were mainly designed to reduce the winds from the south, the south windbreaks (east-west orientation) were regarded as the primary windbreaks. Within each 45 degree sector, the effect of direc- tion on wind reduction was assumed to be negligible [Konstantinov and Struzer, 1969]. In terms of wind protection, the greatest effect is expected for the winds from SE through SW. Consequently, winds between SE and SW were regarded as primary winds and were used in the analysis.
Windspeed and direction were measured continuously with 3-cup anemometers Model 12102 (RM Young, Traverse City, MI, USA) and Gill microvanes Model 12302 (RM Young) and recorded on CR10 dataloggers (Campbell Scientific, Inc., Logan, UT, USA). Data were logged every second, and hourly averages were recorded. Because all porosities in this study were greater than 35% (Table 1)i the effect of atmospheric thermal stratification was not taken into account for calculations of TI~.
Statistical analyses and modeling techniques
Statistical analyses were accomplished using SAS (SAS Institute, Cary, NC, USA) REG, RSQUARE, and RSREG procedures. All residuals were plotted against the predicted values, and the plots were examined and used to evaluate the models. If abnormalities such as non-constant variances occurred, a trans- formation was applied and a new simulation was developed. Transformations were based on the Box-Cox power transformation technique [Draper and Smith, 1981].
Results
Relative windspeed reduction (111) leeward of the shelter was calculated for all windspeed measurements described in Table 1 (for clarity, only 0.5 H, 5 H, and 10 H are presented in figures). When ~ was 40.2%, 111 varied as u0 increased (Fig. 2). At 0.5 H, ql decreased from about 60% to about 40% when u0 increased from 1 m s -~ to 5 m s -~. The decrease of Tl~ was greater for 5 H, which decreased from about 70% to about 20% as u0 increased by a similar

303
100 ~ �9 �9
80~- e e e �9 �9 �9 0.5H e_ ; t = Q % �9
40 F , I p - I I ~ F ~ ~ U ~ - �9 �9 o ~ �9 �9
20 f �9 4 ~ " ' 0 - -
loo I . . . . . . . . . '
.~ 80 5 H
60
~ ~ o o . ~ �9 " =2 4 0 _ _ �9
T: L @
>~ 20 �9 �9 o__4~ e e ~ 1 4 9 �9 o � 9 � 9 [ db~176176 �9 �9
100 ~ . . . .
80 10 H
40 ~,...~,L~; i" "~. �9 . ' -
0 0 2 4 6 8 10 12
Open windspeed (m s -1)
Fig. 2. Relative windspeed reduction (1]1) at three leeward distances, expressed in multiples of windbreak height (H), for windbreak system 2 (SH2) in October-November 1991. Optical porosity of the primary windbreak was 40.2%. Only windspeeds with directions between SE and SW were used for the calculations.
magnitude (Fig. 2). For 10 H, ql decreased from about 50% to about 20%. To compare relative 111 changes across different ~ and qb and hence the effec- tiveness of a windbreak in reducing windspeed (the greater the change, the less the effectiveness), a relative 111 change per unit change of u0 from 1 m s -1 to 5 m s -1 was calculated as follows: the ratio of the difference in q 1 when u0 was I m s -1 and when u�9 was 5 m s -1 over q l when u0 was 1 m s i was divided by the difference in u o (4 m s-l). For example, the relative 111 change for 0.5 H when qb was 40.2% (Fig. 2) was calculated as [(60-40)/60]/(5-1) = 8%, per unit change of u�9 (m s-l); the respective ql changes were 18% for 5 H and 15% for 10 H (Table 2). The relative ql change at u0 beyond 5 m s -~ was minimal for all distances (Fig. 2). Additionally, variability (scattering)

3O4
Table 2. Relative T h (relative windspeed reduction) change per unit of Uo (open windspeed) change when uo was less than 5 m s ~.
Porosity Windbreak Distance Relative r h change (%) (H) per unit of uo change (%)
40.2 SH2 0.5 8 5 18
10 15 47.9 SH3 0.5 5
5 1 10 12
63.7 SH3 0.5 14 5 13
10 10
in 111 was higher when Uo was less than 5 m s -1 and lower when Uo was greater than 5 m s -1.
W h e n dp was 47.9%, similar relat ionships be tween q~ and Uo were found (Fig. 3), i.e. 111 decreased as Uo increased when Uo was be low 5 m s -~, yet remained unchanged when Uo was above 5 m s -1. Relat ive rl~ changes per unit o f u o change were 5% for 0.5 H, 1% for 5 H, and 12% for 10 H (Table 2). Similarly, variability in TI~ was higher for all distances at u o less than 5 m s -1 than at uo greater than 5 m s-L W h e n Op was 63.7%, relative T h changes per unit o f u o change were 14% for 0.5 H, 13% for 5 H, and 10% for 10 H (Table 2). W h e n Uo was beyond 5 m s -I, the change of q l to Uo was also minimal (Fig. 4).
The near constant TI~ when uo was greater than 5 m s -~ represents the m i n i m u m windspeed reduct ion at that ~ for a windbreak of a part icular qb. Therefore, the greater the value, the greater the effect iveness o f a windbreak in reduc ing windspeeds . For the same windbreak, rl~ at u o o f 5 m s -~ was generally highest at 0.5 H except for 5 H in Fig. 2 where rll was not so respon- sive to u 0 and that ]11 was close to TI~ at 0.5 H. Compar ing across all three porosit ies, 111 at u o o f 5 m s -~ was a lways highest for the d~ of 47.9%0 for all three distances: 60% versus 40% (qb = 40.2%) and 30% (qb = 63.7%) at 0.5 H, 65% versus 20% and 30% at 5 H, and 50% versus 20% and 30% at 10 H, respectively.
A quadratic statistical model which incorporated ~, u 0, and ~) was used to analyze the effect o f individual variables and their interactions. Interestingly, the quadratic term of the open windspeed (u~) was not significant (p -- 0.99), but its linear term (u0) was significant (p -- 0.01). All other effects were highly signif icant (p < 0.01) indicating that the effect o f u 0 on 11~ may be linear and dependent on ~ and qb. The effect o f ~ on 111 was non- l inea r and dependent on u0 and qb. The effect o f qb was also non- l inear and dependent on ~ but not u 0.

305
100
80
60
40
0.5H
20
0 , I i I I i I I i
80 ~ e~l 5 H
o
60 oo~
40
20
8~ N, &" 60 ~ ~ 1 7 6 �9
,
4O
2O
0 I l I I
0 2 4 6 8 Open windspeed (ms -~)
I
10 12
Fig. 3. Relative windspeed reduction 01~) at three leeward distances, expressed in multiples of windbreak height (H), for windbreak system 3 (SH3) in May 1991. Optical porosity of the primary windbreak was 47.9%. Only windspeeds with directions between SE and SW were used for the calculations.
Discussion
These results indicate that the relative windspeed reduction in shelter (111) w a s a function of open windspeed (Uo) at a given porosity (qb) and distance (~), and there existed a threshold windspeed in the relationship between Uo and rl~. When u o was less than the threshold windspeed, TI~ varied but generally decreased with increasing windspeed; when u o was above the threshold wind- speed, ~1~ remained unchanged and equaled the threshold windspeed reduc- tion, which is the 11~ at the threshold windspeed. The varying shelter effect of a windbreak with increasing windspeed when u o was less than the threshold value was probably the result of increased turbulence. As u0 increased, the

306
'~176 ~ . , ~ 0 2 � 9 . �9 1
I - . 60 qr~q �9 o � 9 �9 �9 I �9 �9 �9 �9 ~ o . o , . , �9 . I 4o [ - . " ~ , ' ~ r m ~ - o _ ' O ,4 �9 . . . j
o �84
. I ~1, �9 �9 40 �9 �9 �9
20
80
60
40
20
0 0 2 4 6 8 10 12
Open windspeed (m s -1)
Fig. 4. Relative windspeed reduction (11~) at three leeward distances, expressed in multiples of windbreak height (H), for windbreak system 3 (SH3) in October-November 1991. Optical porosity of the primary windbreak was 63.7%. Only windspeeds with directions between SE and SW were used for the calculations.
horizontal and vertical components of the windspeed become decreased and increased, respectively [Carbon, 1957]. Relatively high variability in 11~ is expected because: 1) the q~ of a windbreak usually increases as uo increases [van Eimern et al., 1964]; and 2) unlike artificial windbreaks, elements of a tree windbreak could sway differently as windspeed varies, which could change the relationship between q~ and rll-
The magnitude of threshold windspeed reduction was dependent on q~ and ~, and it was generally highest at 0.5 H for the same windbreak. Comparing across three porosities, the threshold windspeed reduction was always highest when qb was 47.9%, and relative 111 changes per unit of u0 change were gen- erally the lowest at this q~. This best porosity is close to the optimum porosity (defined as the porosity with maximum overall windspeed reduction leeward of a windbreak) of 53% obtained from theoretical calculations [Wong, 1981 ].

307
Also according to Caborn [1957] and Plate [1971], optimum porosity is 'medium' porosity.
The threshold windspeed was approximately 5 m s -J within the range of u0 studied (0-12 m s-l), regardless of qb or ~. The existence of a threshold wind- speed was probably the result of qb response to u0; as u0 increases to a certain point, qb may be at its maximum, so further increases in uo would cause little changes in vl~. The value of threshold windspeed reported here is consider- ably higher than those given in two early studies. Using 47% permeable reed- mats with u0 between 1 and 7 m s -a, Nfigeli [1965] found that the relative reduction of sheltered windspeed was independent of u0 when u0 was greater than 1.5 m s -J. However, a careful examination of the presented figure indi- cated that the conclusion was based on only six data points; also according to the originally drawn regression, a threshold value appears to be around 4 m s -1, rather than the reported 1.5 m s -~. In another study using two-row corn plants as windbreaks, Brown and Rosenberg [1971, 1972] gave a threshold value of 1.2 m s -~. A re-examination of their data indicated that ~11 actually split into two separate directions in the range of u 0 studied (1-4 m s-~), and therefore no threshold value can be obtained. Considering the amount of data obtained, the number of porosities and distances used, and the range of u0 measured, the study reported here is more comprehensive and more conclusive.
How to realistically and conveniently represent the effectiveness of a windbreak in reducing windspeeds has always been an important subject in windbreak-related studies [Zhang et al., 1995]. Jensen [1961] proposed a shelter index, which he defined as 11~ integrated over the distance under wind- break protection. Seginer [ 1972, 1975] used an efficiency coefficient defined as the ratio of the surface shear reduction coefficient to the drag coefficient. Raine and Stevenson [1977] defined a total velocity index which they described as a double integration of relative windspeed over the distance of protection and the height of the windbreak influence. Because each of the above measures generally require some type of windspeed model, their use was relatively limited. More common measures are the location of minimal leeward windspeed [Heisler and DeWalle, 1988; Loeffler et al., 1992], the maximum or effective protected distance [Wei et al., 1987], and TI~.
The present results indicate that rlj could vary according to u 0, and there- fore it is not a good effectiveness index. However, the resutts also indicate that there exists a threshold T 11, which represents the minimum Tlj of a wind- break at a particular ~ and it is independent of u 0. Therefore the threshold r h can be used as an effectiveness index for a windbreak in reducing windspeeds. Using the idea of total velocity [Raine and Stevenson, 1977], the authors propose a windbreak windspeed reduction index, which is calculated as the threshold 11j averaged over the protection distance of a windbreak. Windbreaks having the greatest indices give the best overall wind protection. In practice, the protection distance of a windbreak can be the effective windbreak pro- tection distance [Wei et al., 1987], a leeward distance from the windbreak to

308
where windspeed reaches u0 or a percentage of u 0 (e.g. 80%). However, such distance is highly dependent on qb [Rosenberg et al., 1983]. Windbreaks with high ~ tend to give greater protection distance, but generally lower vii [Carbon, 1957]. Also, the critical value of the proposed index can be highly dependent on the specific purpose of the protection; the critical values for vegetable crops, for instance, are greater than for agricultural crops [Zhang et al., 1995]. In any case, the advantage of this index is that 1) it takes into account of the relationship between 111 and u0 as reported in this paper; and 2) it considers the different protection distances resulted from different leeward windspeed distribution patterns for windbreaks of different qb [Plate, 1971].
All cup anemometers have stall windspeeds and that can give erroneous results when windspeeds are close to such values. The cup anemometers used in this study have a stall speed of 0.5 m s -1. When windspeeds were close to this speed, the calculated relative windspeed reduction in shelter could be incorrectly higher; when u0 increased to 3 m s -1, however, such errors in "ql quickly reduced to 17%; when u0 increased to 5 m s -1, the error was less than 6% (R.A. Schmidt, pers. comm. 1995). Therefore, the problem of stall wind- speeds would not change the overall relationship between u0 and q l, although it contributes to q l variability when u0 was less than 5 m s -1. Anemometer stall speeds may also be responsible for the smooth curvature observed in some of the presented data (5 H in Fig. 2, 0.5 H in Fig. 3, 0.5 and 5 H in Fig. 4). Another limitation associated with a conventional cup anemometer is its inability to detect adequately turbulent wind motion [Sturrock 1969]. As u0 increases the vertical component of the air flow increases as well; a vertical component greater than about 40 ~ from horizontal cannot be registered using these instruments. Nevertheless, the above problem is alleviated when wind- breaks are less dense and measurements are made away from the windbreak [Carbon, 1957]. The problem caused by wind attack angle is expected to be less significant because the variation of windspeeds used in the study was less than 90 ~ .
Another source of variation in windspeed reduction at lower Uo is atmos- pheric stability and turbulence. Using frames made of plywood strips, Seginer [1975] found an empirical function relating rll to the Richardson number; rll increased as the Richardson number became less negative. Under unstable conditions, the recovery of sheltered windspeed with ~ can be more rapid than under neutral or stable conditions, causing the overall effectiveness of the windbreak to decrease [Miller et al., 1975]. Such effect of atmospheric stability and turbulence is closely related to qb [Sturrock 1969]; for windbreaks of low density (high qb), the effect is significantly reduced [Cao, 1985]. In some of the presented data (5 H in Fig. 2 and 0.5 H in Fig. 4), it appears that there exists a gap in ~11 when u0 was less than the threshold windspeed. Depending on qb and ~, few ql data occurred when TI~ was between 20% and 60%. It may be that as u0 increased (but was still less than the threshold wind- speed), turbulence increased as well which then increased the variability in 1"11.

309
Optical windbreak porosities are a static representation of wind-penetrating characteristics of windbreaks [Kenny, 1987; Loeffler et al., 1992]. In reality tree windbreaks are three-dimensional and dynamic. The pores are usually irregular and non-uniform. The use of optical porosity is a compromise between practicality and ideal representation. Factors affecting the accuracy of this approach include wind and light conditions during picture taking, back- ground interference, angle of viewing, and overlap of tree elements particu- larly when the windbreak is a dense, multi-row windbreak. Methods to represent realistically the 3-D porosity remain a major challenge for future research. Computer-aided tomography has recently been used to extract 3-D information on the properties of soils using commercial scanners such as the modified gamma scanner [Price and Osborne, 1990]. Fractal modeling may be another hopeful approach. Fractal analysis has been used to determine the dimension of tree leaves [Vlcek and Cheung, 1986], crowns [Zeide and Pfeifer, 1991], and branching [Morse et al., 1985]. By developing an 'A-system', Aono and Kunii [1984] successfully generated tree images for several species. The advantage of their system is that various tree images can be generated at a range of viewing angles and directions. In order to apply the system to wind- break porosity estimation, however, further rules need to be incorporated, such as the competition between trees, and shape changes from interference caused by multiple species.
Conclusions
The relative windspeed reduction at any given location in shelter is depen- dent on the open windspeed, windbreak porosity, and the distance from the windbreak. The general relationship between relative windspeed reduction in shelter and open windspeed depended on the magnitude of the open wind- speed: when the open windspeed was less than a threshold windspeed (5 m s-l), the relative windspeed reduction in shelter varied but generally decreased as the open windspeed increased; when the open windspeed was greater than the threshold windspeed, the relative windspeed reduction in shelter remained unchanged. The relative windspeed reduction at the threshold windspeed (threshold windspeed reduction) was the same as that when the open wind- speed was greater than the threshold windspeed. Using the threshold wind- speed reduction and protection distance of a windbreak, an index has been proposed to evaluate the overall effectiveness of the windbreak in reducing windspeeds.
Acknowledgements
The authors thank Drs Gene Takle, Mark Harrell, Alkhahil Adoum, Ken Hubbard, and R.A. Schmidt for helpful comments. The research was finan- cially supported by the McIntire-Stennis Cooperative Research Program.

310
References
Aono M and Kunii TL (1984) Botanical tree image generation. IEEE Computer Graphics and Appl 5 :10-34
Baer NW (1989) Shelterbelt and windbreaks in the Great Plains. J For 87(4): 32-36 Borrelli J, Gregory JM and Abtew W (1989) Wind barriers: a reevaluation of height, spacing,
and porosity. Trans ASAE 32:2023-2027 Brandle JR, Hintz DL and Sturrock JW (eds) (1988) Windbreak Technology. Elsevier Science
Publishers, Amsterdam, 598 pp Brown KW and Rosenberg NJ (1971, 1972) Shelter-effects on microclimate, growth and water
use by irrigated sugar beets in the Great Plains. Agric Meteorol 9:241-263 Caborn JM (1957) Shelterbelts and Microclimate. For Comm Bull No 29, Edinburg, 135 pp Cao X (1985) Field Windbreaks. China Forestry Publishing House, Beijing, 645 pp Draper N and Smith H (1981) Applied Regression Analysis. John Wiley and Sons, New York,
709 pp Heisler GM and DeWalle DR (1988) Effects of windbreak structure on wind flow. Agric Ecosyst
Environ 22/23:41-69 Hagen LJ, Skidmore EL, Miller PL and Kipp JE (1981) Simulation of effect of wind barriers
on airflow. Trans ASAE 24:1002-1008 Jensen M (1961) Shelter effect: Investigation into the Aerodynamics of Shelter and its Effects
on Climate and Crops. Danish Technical Press, Copenhagen, 263 pp Kenny WA (1987) A method for estimating windbreak porosity using digitized photographic
silhouettes. Agric For Meteorol 39:91-94 Konstantinov AR and Struzer LR (1969) Shelterbelts and Crop Yields. US Office of Technical
Services, Washington, DC, TT68-50370. Translated by Israel Program for Sci Translations Ltd
Loeffler AE (1990) Using optical porosity to evaluate the shelter effectiveness of windbreaks in southern Ontario. Master's Thesis, University of Guelph, Guelph, Ontario, Canada
Loeffler AE, Gordon AM and Gillespie TJ (1992) Optical porosity and windspeed reduction by coniferous windbreaks in southern Ontario. Agrofor Syst 17:119-133
McNaughton KG (1988) Effects of windbreaks on turbulent transport and microclimate. Agric Ecosyst Environ 22/23:17-39
McNaughton KG (1989) Micrometeorology of shelter belts and forest edges. Phil Trans R Soc London B 324:351-368
Miller DR, Rosenberg NJ and Bagley WT (1975) Wind reduction by a highly permeable tree shelterbelt. Agric Meteorol 14:321-333
Morse DR, Lawton JH, Dodson MM and Williamson MH (1985) Fractal dimension of the vegetation and the distribution of arthropod body lengths. Nature 314:731-733
N/igeli WV (1965) I)ber die Windverhaltnisse im Bereich gestaffelter Windschutzstreifen. Mitt Schweiz Anstalt 41:221-300
Ogawa Y and Diosey PG (1980) Surface roughness and thermal stratification effects on the flow behind a two-dimensional fence-I, field study. Atmos Environ 14:1301-1308
Plate EJ (1971) The aerodynamics of shelter belts. Agric Meteorol 8:203-222 Price TV and Osborne CF (1990) Computer imaging and its application to some problems in
agriculture and plant science. Critical Rev Plant Sci 9:235-266 Raine JK and Stevenson DC (1977) Wind protection by model fences in a simulated atmos-
pheric boundary layer. J Int Aero 2:159-180 Rosenberg NJ, Blad BL and Verma SB (1983) Microclimate: The Biological Environment.
John Wiley and Sons, New York, 495 pp Seginer I (1972) Windbreak drag calculated from the horizontal velocity field. Boundary-Layer
Meteorol 3:87-97 Seginer I (1975) Atmospheric-stability effect on windbreak shelter and drag. Boundary-Layer
Meteorol 8:383-400

311
Seginer I and Sagi R (1971, 1972) Drag on a windbreak in two-dimensional flow. Agric Meteorol 9:323-33
Song Z, Meng P, Zhang H, Lu G, Zhou H, Hong S, Liu Y and Zhang T (1987) A study on the effect of windbreaks on meteorological factors and wheat yield in Heilonggang reaches. In: Song Z (ed) A Collection of Papers on Forest Meteorology in China, pp 122-129. Meteorology Publishing House, Beijing
Sturrock JW (1969) Aerodynamic studies of shelterbelts in New Zealand - 1 low to medium height shelterbelts in mid-Canterbury. New Zealand J Sci 12:754-776
van Eimern J, Karschon R, Razumova LA and Robertson GW (1964) Windbreaks and shelter- belts. WMO Tech Note No 59, 188 pp
Vlcek J and Cheung E (1986) Fractal analysis of leaf shapes. Can J For Res 16: 124-127. Wei L, Jiang A and Zhang Y (1987) On the effective protecting distance of shelterbelts. Kexue
Tongbao (Sciences Reports) 32:605-609 Wen K-J and Wang Y-S (1991) The statistical analysis of shelterbelt structure and windproof
efficiency. Agric For Meteorol 53:257-266 Wong D (1981) Microclimate and Crop Microclimate. China Agriculture Publishing House,
Beijing, 160 pp Zeide B and Pfeifer P (1991) A method for estimation of fractal dimension of tree crowns. For
Sci 37:1253-1265 Zhang H, Brandle JR, Meyer GE and Hodges L (1995) A model to evaluate windbreak protec-
tion efficiency. Agroforestry Systems 29:191-200 Zhao Z, Xiao L, Zhao T and Zhang H (1995) Windbreaks for Agriculture. China Forestry
Publishing House, Beijing, 400 pp
Copyright © 2022 FDOKUMEN