The Relationship between Enterprise Resource Planning, Total Quality Management, Organizational...
21
Asian Social Science; Vol. 10, No. 14; 2014 ISSN 1911-2017 E-ISSN 1911-2025 Published by Canadian Center of Science and Education 158 The Relationship between Enterprise Resource Planning, Total Quality Management, Organizational Excellence, and Organizational Performance-the Mediating Role of Total Quality Management and Organizational Excellence Hassan Saleh Al-Dhaafri 1,2 , Rushami Zien Bin Yusoff 3 & Abdullah Kaid Al-Swidi 3 1 Dubai Police, Dubai, United Arab Emirates 2 Othman Yeop Abdullah Graduate School of Business, College of Business, University Utara Malaysia, Malaysia 3 College of Business, University Utara Malaysia, Sintok, Malaysia Correspondence: Hassan Saleh Al-Dhaafri, Othman Yeop Abdullah Graduate School of Business, College of Business, University Utara Malaysia, Malaysia. Tel: 971-50-882-8812. E-mail: [email protected] Received: April 12, 2014 Accepted: May 19, 2014 Online Published: June 24, 2014 doi:10.5539/ass.v10n14p158 URL: http://dx.doi.org/10.5539/ass.v10n14p158 Abstract Purpose: This study was set up to examine the mediating effect of TQM and organizational excellence between ERP and organizational performance. Design/methodology/approach: To examine the model of the study, design of survey questionnaire was employed through data collected from Dubai Police Departments. Out of 565 questionnaires, 320 only usable returned. Partial Least Square (PLS) structural equation modelling was employed to analyze the data. Findings: Based on statistical results, the effect of ERP on TQM, organizational excellence, and organizational performance were confirmed. In addition, the effect of TQM and organizational excellence on organizational performance was also confirmed. Moreover, TQM was found to partially mediate the effect of ERP on organizational performance, whereas organizational excellence was found to fully mediate the effect on the same relationship. Practical implications: The results of this study have several practical implications. This study will help managers and decision makers to take the proper decision when implementing ERP system. Due to that, TQM and organizational excellence are the most important practices to ease the ERP implementation. Originality/value: This study is considered as the only empirical study that examines the collective effect of ERP, TQM, and organizational excellence on organizational performance. Keywords: enterprise resource planning (ERP), total quality management (TQM), organizational excellence (OE), organizational performance (OP), Dubai Police (DP) 1. Introduction The current global competitive environment compels organizations around the world to enhance and increase their performance through implementing innovative strategies in order to sustain their business and remain competitive. To assist the process of development, organizations have to adopted different philosophies and approaches including Total Quality Management, business excellence (Oakland, 1999), and Enterprise Resource Planning (ERP) (Uwizeyemungu & Raymond, 2010). The resource-based view theory (RBV) of the firm has been used in IT business research to investigate and theorize the effect of rare IT capabilities on sustainable competitive advantages (Masli, Richardson, Sanchez, & Smith, 2010). ERP effects on operations such as in supply chain based on RBV and contingency theories (Hwang & Min, 2013). Previous research has empirically reported a positive relationship between superior IT capabilities and organizational performance. One of those superior IT systems in the last few years is ERP system. The implementation of ERP as an innovative system with large business organizations, and later expanded to cover other organizations such as small and medium-sized organizations (SMEs) (Everdingen,
Transcript of The Relationship between Enterprise Resource Planning, Total Quality Management, Organizational...
Asian Social Science; Vol. 10, No. 14; 2014 ISSN 1911-2017 E-ISSN 1911-2025
Published by Canadian Center of Science and Education
158
The Relationship between Enterprise Resource Planning, Total Quality Management, Organizational Excellence, and Organizational Performance-the Mediating Role of Total Quality Management and
Organizational Excellence
Hassan Saleh Al-Dhaafri1,2, Rushami Zien Bin Yusoff3 & Abdullah Kaid Al-Swidi3 1 Dubai Police, Dubai, United Arab Emirates 2 Othman Yeop Abdullah Graduate School of Business, College of Business, University Utara Malaysia, Malaysia 3 College of Business, University Utara Malaysia, Sintok, Malaysia
Correspondence: Hassan Saleh Al-Dhaafri, Othman Yeop Abdullah Graduate School of Business, College of Business, University Utara Malaysia, Malaysia. Tel: 971-50-882-8812. E-mail: [email protected]
Received: April 12, 2014 Accepted: May 19, 2014 Online Published: June 24, 2014
doi:10.5539/ass.v10n14p158 URL: http://dx.doi.org/10.5539/ass.v10n14p158
Abstract
Purpose: This study was set up to examine the mediating effect of TQM and organizational excellence between ERP and organizational performance.
Design/methodology/approach: To examine the model of the study, design of survey questionnaire was employed through data collected from Dubai Police Departments. Out of 565 questionnaires, 320 only usable returned. Partial Least Square (PLS) structural equation modelling was employed to analyze the data.
Findings: Based on statistical results, the effect of ERP on TQM, organizational excellence, and organizational performance were confirmed. In addition, the effect of TQM and organizational excellence on organizational performance was also confirmed. Moreover, TQM was found to partially mediate the effect of ERP on organizational performance, whereas organizational excellence was found to fully mediate the effect on the same relationship.
Practical implications: The results of this study have several practical implications. This study will help managers and decision makers to take the proper decision when implementing ERP system. Due to that, TQM and organizational excellence are the most important practices to ease the ERP implementation.
Originality/value: This study is considered as the only empirical study that examines the collective effect of ERP, TQM, and organizational excellence on organizational performance.
Keywords: enterprise resource planning (ERP), total quality management (TQM), organizational excellence (OE), organizational performance (OP), Dubai Police (DP)
1. Introduction
The current global competitive environment compels organizations around the world to enhance and increase their performance through implementing innovative strategies in order to sustain their business and remain competitive. To assist the process of development, organizations have to adopted different philosophies and approaches including Total Quality Management, business excellence (Oakland, 1999), and Enterprise Resource Planning (ERP) (Uwizeyemungu & Raymond, 2010).
The resource-based view theory (RBV) of the firm has been used in IT business research to investigate and theorize the effect of rare IT capabilities on sustainable competitive advantages (Masli, Richardson, Sanchez, & Smith, 2010). ERP effects on operations such as in supply chain based on RBV and contingency theories (Hwang & Min, 2013). Previous research has empirically reported a positive relationship between superior IT capabilities and organizational performance. One of those superior IT systems in the last few years is ERP system. The implementation of ERP as an innovative system with large business organizations, and later expanded to cover other organizations such as small and medium-sized organizations (SMEs) (Everdingen,
www.ccsenet.org/ass Asian Social Science Vol. 10, No. 14; 2014
159
Hillegersberg, & Waarts, 2000) and organizations of public sector (Kumar, Maheshwari, & Kumar, 2002). While some organizations reported potential benefits from ERP implementation, others reported horror stories about ERP system (Barker & Frolick, 2003; Shang & Seddon, 2000). Therefore, the decision of using the most appropriate system is not an easy task. Organizations have to implement a system that can help them to achieve their goals with low risks. ERP as a complicated system can lead to achieve high performance and competitive advantages if supported by other factors inside and outside the organizations.
Total Quality Management (TQM) as a management philosophy can be one of those factors that can help ERP system to achieve the desired goals. It has been argued that TQM is a pre-requisite practice before implementing ERP system (Ghadilolaee, Aghajani, & Rahmati, 2010). Excellence as a desired outcome for any strategy and practice can be also considered as a practice that can help organizations to implement the proposed practice in excellent ways to achieve ultimately the best organizational performance. As a result, organizations that demonstrate IT excellence should generate the greatest values from spending in their IT strategy (Masli et al., 2010). In addition, while most of practices in TQM are moving in way, but there are still lacking of the significance of employee role in developing quality improvement for the sake of accomplishing business excellence (Rashid & Aslam, 2012).
This study examined the relationship between ERP and organizational performance. Due to the inconclusiveness findings in the previous literature of the relationship between ERP and organizational performance, this study is an attempt to investigate the mechanism of TQM and organizational excellence as mediator variables that can explain that relationship through implementing quantitative research based on questionnaire survey.
2. Related Literature and Research Hypotheses
The literature review is presented in seven sections. As a base for understanding the other following relationships, the first section presents the relationship between ERP and organizational performance. The other followed sections discussed the relationships between variables in the proposed framework. As a result of the thorough discussion of the previous studies in the literature, several hypotheses are proposed for these relationships to be tested in the following parts of this research.
2.1 ERP and Organizational Performance
In the literature there are many definitions for ERP system, however, there is no agreement among researchers on an agreed definition. One of the important definition in the previous literature was defined by Davenport (2002) “ERP as an advanced technological solution system that integrate critical information within organization such as supply chain, finance and accounting, human resource, and customer relationships”. In addition, ERP is an information system that integrates the data of the organizations that are used in their operation (Pacheco-Comer & González-Castolo, 2012). There are many reasons and motivations behind implementation of ERP systems such as technical and business driven implementations (Botta-Genoulaz & Millet, 2006; Velcu, 2007).
The relationship between ERP system and organizational performance has been examined by many researchers. There are conflicting results in their relationship (Kang, Park, & Yang, 2008). Some of them reported a positive and significant relationship between ERP and organizational performance (Bendoly & Kaefer, 2004; da Silveira, Snider, & Balakrishnan, 2013; Fang & Lin, 2006; HassabElnaby, Hwang, & Vonderembse, 2012; Hayes et al., 2001; Hwang & Min, 2013; Peffers & Dos Santos, 1996; Velcu, 2007). However, on the other hand, there are some other researchers who reported adverse results (Hitt & Brynjolfsson, 1996; Weill, 1992; Wier, Hunton, & HassabElnaby, 2007).
The mixed results in the previous literature of the effect of ERP on organizational performance encourage us to do this study and examine that relationship with the existing of other variables that may help in increasing the positive and significant effect. But before investigating the mediating effect of TQM and organizational excellence, the direct effect of ERP on organizational performance can be examined to compare with other results. Therefore, the following hypothesis is proposed:
H1: Enterprise Resource Planning has a positive and significant effect on the organizational performance.
2.2 ERP and TQM
Implementation of innovative initiatives such as ERP and TQM are considered the most important practices to enhance performance and gain competitive advantages (Abdinnour & Groen, 2009). There are few studies, such as Laframboise & Reyes (2005) that discuss the collective effective of both TQM and ERP (Abdinnour & Groen, 2009). Their study used a qualitative method through interviews in the aerospace industry. In addition, Ghadilolaee, Aghajani, and Rahmati (2010) argued in their study that implementation of ERP should be
www.ccsenet.org/ass Asian Social Science Vol. 10, No. 14; 2014
160
preceded by implementation of TQM practice for the reason that TQM could bring continuous improvement and problem solving that enable organizations to implement ERP successfully.
Most of critical success factors of TQM and ERP are identical such as business process reengineering, culture, learning, training, top management support, open communication, etc. In their contribution to the same field, Jha and Joshi (2007) reported in their study that ERP and TQM practices are considered significant resources for any organization to gain competitive advantage. Additionally, Marc and Gyu (2003) argued that implementation of ERP not always success because of some critical success factors such as TQM, culture, and business process reengineering. From the above discussion, the following hypothesis is postulated:
H2: Enterprise Resource Planning has a positive and significant effect on Total Quality Management
2.3 ERP and Organizational Excellence
The main purpose of implementing ERP in organizations is to achieve the maximum performance and gain competitive advantages over competitors. In order to achieve that, the ERP system should be implemented in excellent ways either through internal or external processes. Organizational excellence is the practice of making organizations better in excellence path and growth (Attafar, Forouzan, & Shojaei, 2012). According to Moghadami (2005), excellent organizations have different characteristics in terms of customer, employees, leadership, capital owner, learning, future generation, globalization, change or transformation, and suppliers. Each one of these characteristics plays an important role in achieving excellence that leads to achieve the desired performance. When implementing ERP as a technological system, implementers or business owners should focus on the previous characteristics to help ERP to achieve what is planned to be at the earlier stages. To discover the effect of ERP on organizational excellence, the following hypothesis is proposed to be examined:
H3: Enterprise Resource Planning has a positive and significant effect on the organizational Excellence
2.4 TQM and Organizational Performance
Total Quality Management (TQM) is a management philosophy that has been obtained attention by many research (Ehigie & McAndrew, 2005), and confirms the role of internal and external suppliers, customer, and employees in pursuing continuous improvement (Kanji, 2002). There are a bulk in the literature that show the significance of TQM strategy in manufacturing organizations (Arawati, 2005; Sohal & Terziovski, 2000), service organizations (Yasin, Kunt, & Zimmerer, 2004), SMEs organizations (Sohail & Hoong, 2003), and public organizations (Nor Hazilah, 2004). However, there are plenty of studies on TQM practices, most of them in developed countries and only there are six studies out of 347 were conducted in the Middle East including Saudi Arabia, Qater, and UAE (Sila & Ebrahimpour, 2002). Therefore, this study is an attempt to fill this gap in the literature.
The relationship between TQM and organizational performance has been examined by many researchers, however, some of them found that TQM can affect and enhance the performance positively and significantly (Abebe, 2014; Barh, Tee, & Rao , 2002; Dada & Watson, 2013; Demirbag et al., 2006; Feng, Prajogo, Tan, & Sohal, 2006; Fotopoulos & Psomas, 2010; Gadenne & Sharma, 2009; Hendricks & Singhal, 1997; Lee , 2004; Salaheldin, 2009; Tang & Tang, 2012; Wang & Yen, 2012; Zhang & Zhang, 2012). On the other hand, other researchers found that TQM has no effect on organizational performance and sometimes may affect the performance negatively (Dooyoung, Kalinowski, & El-Enein, 1998). The inconsistent findings in the previous literature urge for more researches to be conducted in this area. Therefore this study is a response to those calls from previous researchers to do more researches through including other variables. For this purpose, the following hypothesis is proposed to be tested:
H4: Total Quality Management has a positive and significant effect on the organizational performance.
2.5 TQM and Organizational Excellence
As has been mentioned earlier, TQM is considered as one of the important strategic instrument that helps organizations to achieve optimal performance. In addition, TQM core essentials are to encourage business practice to increase customers’ satisfaction, productivity, reduce cost, and enhance quality output. In other words, TQM is a strategy that helps organizations to enhance business excellence (Lee, 2002). According to Ionica and Baleanu (2010), the history of TQM from inspection to business excellence has gone through different stages such as quality control.
There are some studies that investigated the relationship between TQM and organizational excellence such as Sharma and Kodali (2008) who argued that TQM is considered as a fundamental standard to achieve excellence in manufacturing industry. In addition, Ioncia and Baleanu (2010) reported that the underlying principles of

www.ccsenet.org/ass Asian Social Science Vol. 10, No. 14; 2014
161
EFQM Excellence Model are connected with basic TQM’s principles. Moreover, Lyons, Acsente, and Waesberghe (2008) examined the relationship between TQM and knowledge management to integrate a sustainable excellence framework. Lee (2002) investigated how business excellence can be sustained through TQM. In conclusion, the area of how TQM can enhance organization performance through excellence is still rare in the literature; therefore this study tries to investigate more about this relationship. To achieve this purpose, the following hypothesis is proposed:
H5: Total Quality Management has a positive and significant effect on the organizational Excellence.
2.6 Organizational Excellence and Organizational Performance
Antony and Bhattacharyya (2010) examined the relationship between organizational excellence and organizational performance where they found that organizational excellence could be figured base on relationship of performance indicators. They found also that organizational excellence enables managers to evaluate their organizations better than organizational performance method. In addition, Ooncharoen and Ussahawanitchakit (2008) in their study found that organizational excellence has a positive and significant effect on performance. Therefore the following hypothesis is postulated to be tested:
H6: Organizational Excellence has a positive and significant effect on the organizational performance.
2.7 The Mediating Role of TQM and Organizational Excellence
As has been stated earlier, the direct effect of ERP on organizational performance has been studied by many researchers. However the abundant studies on this relationship, there are still inconclusiveness about the effect of ERP on organizational performance. Therefore, many researchers call for more researches in this area to be conducted by involving other variables that may affect the relationship positively and significantly. For this purpose, TQM and organizational excellence have been intervened in the relationship as mechanisms to explain in a better way the effect of ERP on organizational performance. Through implementing TQM practices and organizational excellence concepts, ERP may has the power to achieve the desired objectives and enhance performance. TQM and organizational excellence have many dimensions such as leadership, continuous improvement, innovation, customer focus, strategic planning, benchmarking, service design, etc. By practicing these strategies and practices inside the organization, ERP as a new system can benefit in all implementation stages to gain the proposed organizational performance. Logically, TQM and organizational excellence can bring the advantage to organizations because of their involving the elements of success. According to Mele and Colurcio (2006) organizational excellence when linked with TQM has different aspects such as development of partnership, public responsibility, coherence with objectives, leadership, continuous improvement, innovation, and learning. TQM and excellence can complement each other (Adebanjo, 2001), and therefore can bring a powerful management tools to facilitate the implementation of ERP system for the sake of achieving high organizational performance. In addition, the mediation of TQM as a strategic resource was examined by Prajogo and Sohal (2006) between differentiation strategy and performance where they found a partial mediation.
For this purpose, the following hypotheses are preoposed to be examined in the next stage:
H7: TQM mediate the relationship between ERP and Organizational Performance
H8: Organizational Excellence mediate the relationship between ERP and Organizational Performance
3. Methodology
The main purpose of this study is to examine the effect of variables on each other’s. To achieve that a quantitative methodology approach was employed. Questionnaire survey is considered as one of the important instruments to collect the primary data from respondents (Kerlinger & Lee, 2000). The data collected through cross-sectional research design which is suitable for this study to collect the data at the point of time. The survey questionnaires were distributed in January, 2014 and collected end of February, 2014 through hard copy and emails. The source of data was Dubai Police where the first author works. Because of the nature of this study’s variables, sections of Dubai Police have been selected to fill the questionnaire through Head section officers. Head section officers are the middle managers as a link between managers and employees. They know better than other on how these practices and strategies are working. Five hundred forty five questionnaires have been distributed and three hundred and twenty were returned completely. Dimensions and measurements have been adopted and adapted from previous studies. ERP measurements have been adopted from Stratman and Roth (2002), whereas measurements of TQM from different sources: Brah, Wong, and Rao (2000), Anderson and Sohal (1999), Terziovski & Samson (1999), and Rao (2000). Measurements of organizational excellence have been adopted from Pinar and Girard (2000), and organizational performance from Kaplan and Norton (1992; 2000). Structural Equation Modeling (SEM) is the technique that used to analyze the data and test the proposed

www.ccsenet.org/ass Asian Social Science Vol. 10, No. 14; 2014
162
hypothesis through Smart-PLS statistical software.
4. Statistical Analysis and Results
Partial Least Square (PLS) is used to confirm the reliability and validity of the outer. As confirmed by many researchers, reliability and validity are the initial tests before doing the hypotheses testing. The model of this study contains the variables: ERP, TQM, organizational excellence and organizational performance. In order to examine the relationships between these variables, this study follows the two-step approach suggested by Chin (1998).
Figure 1. The research framework
In the literature of Structural Equation Modeling (SEM) the construct validity and reliability of the model should be approved before examining the hypothesized relationships.
4.1 The Outer Model (Measurement)
The following sections test the validity and reliability of the constructs before establishing the goodness of the measurement model. The construct validity and reliability was tested through the content validity, the discriminant validity, and the convergent validity as illustrated in the next sections.
4.1.1 The Content Validity
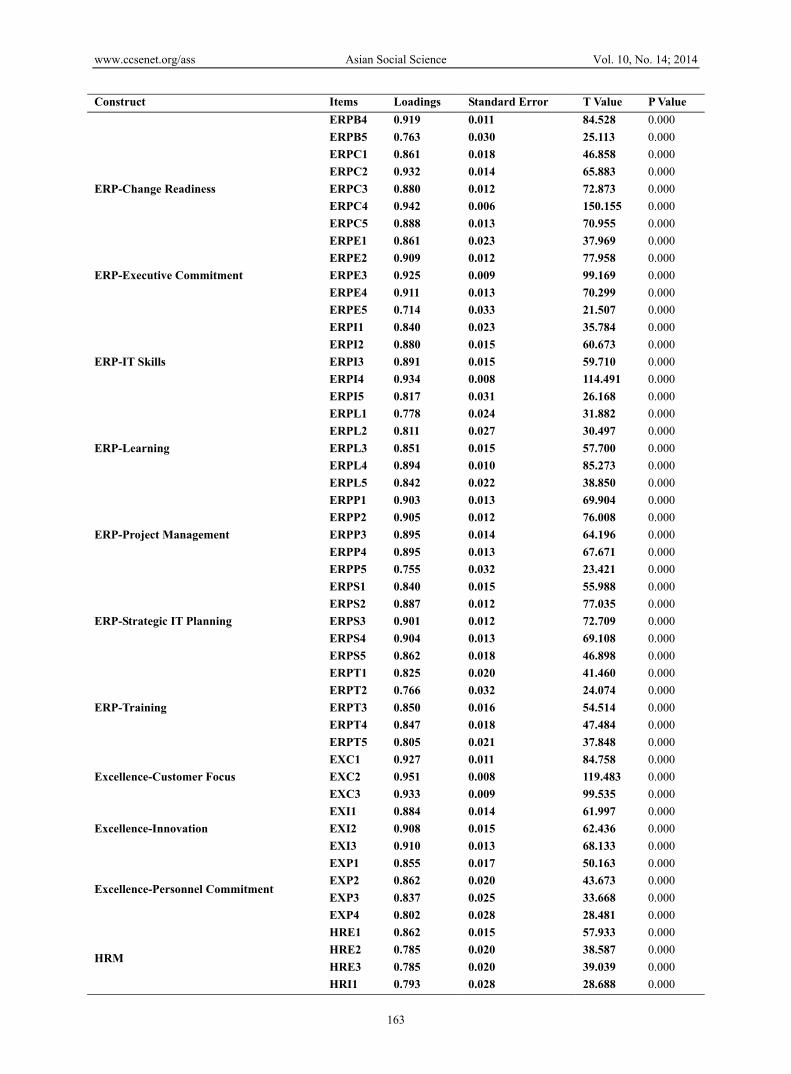
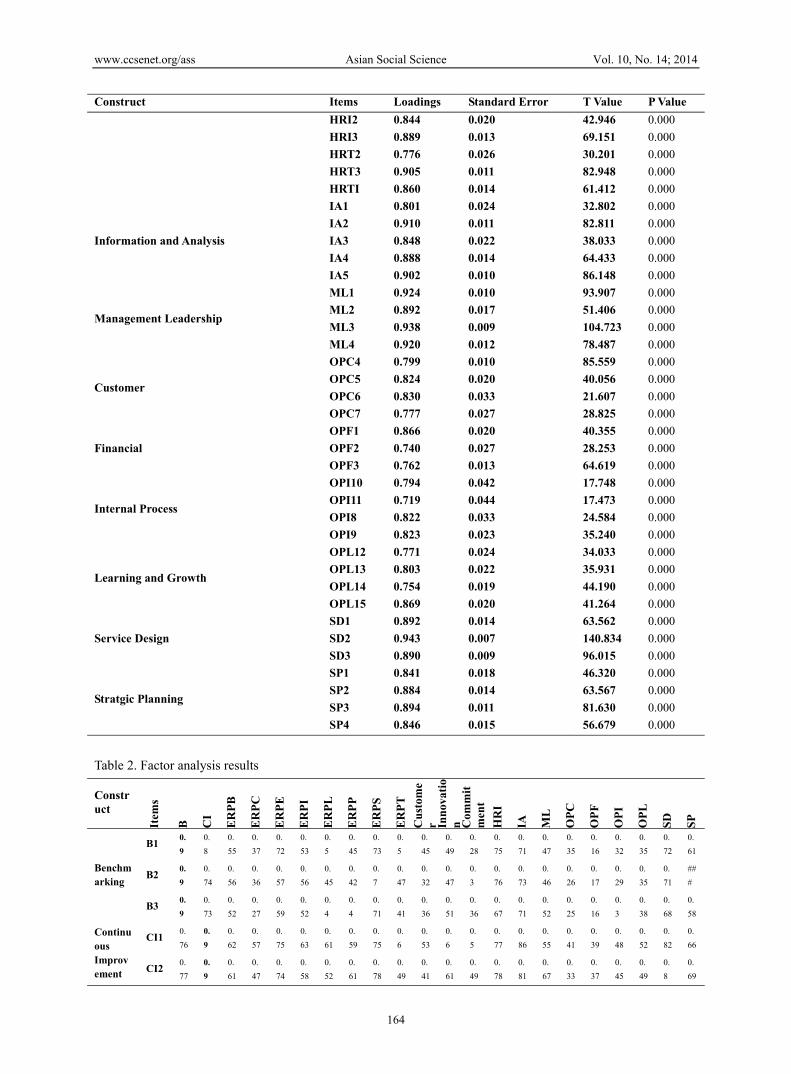
In multivariate analysis literature, the content validity of the construct compared with the other model’s constructs. Therefore, Chin (1998) and Hair et al. (2010) suggested the using of factor loading to examine the content validity. To do that, the items will be deleted if are loaded high with other constructs than their respective ones. Table 1 and 2 showed that all the constructs are significantly loaded higher in their respective variables. Therefore, these results confirmed that the measurement model of this study has content validity.
Table 1. Factor loading significance
Construct Items Loadings Standard Error T Value P Value
Benchmarking
B1 0.928 0.015 61.945 0.000
B2 0.884 0.021 43.071 0.000
B3 0.877 0.025 34.795 0.000
Continuous Improvement
CI1 0.902 0.012 76.117 0.000
CI2 0.926 0.007 127.912 0.000
CI3 0.867 0.020 43.058 0.000
CI4 0.875 0.016 55.424 0.000
ERP-Business Process Skills
ERPB1 0.851 0.018 46.642 0.000
ERPB2 0.876 0.012 71.143 0.000
ERPB3 0.873 0.016 55.122 0.000
www.ccsenet.org/ass Asian Social Science Vol. 10, No. 14; 2014
163
Construct Items Loadings Standard Error T Value P Value
ERPB4 0.919 0.011 84.528 0.000
ERPB5 0.763 0.030 25.113 0.000
ERP-Change Readiness
ERPC1 0.861 0.018 46.858 0.000
ERPC2 0.932 0.014 65.883 0.000
ERPC3 0.880 0.012 72.873 0.000
ERPC4 0.942 0.006 150.155 0.000
ERPC5 0.888 0.013 70.955 0.000
ERP-Executive Commitment
ERPE1 0.861 0.023 37.969 0.000
ERPE2 0.909 0.012 77.958 0.000
ERPE3 0.925 0.009 99.169 0.000
ERPE4 0.911 0.013 70.299 0.000
ERPE5 0.714 0.033 21.507 0.000
ERP-IT Skills
ERPI1 0.840 0.023 35.784 0.000
ERPI2 0.880 0.015 60.673 0.000
ERPI3 0.891 0.015 59.710 0.000
ERPI4 0.934 0.008 114.491 0.000
ERPI5 0.817 0.031 26.168 0.000
ERP-Learning
ERPL1 0.778 0.024 31.882 0.000
ERPL2 0.811 0.027 30.497 0.000
ERPL3 0.851 0.015 57.700 0.000
ERPL4 0.894 0.010 85.273 0.000
ERPL5 0.842 0.022 38.850 0.000
ERP-Project Management
ERPP1 0.903 0.013 69.904 0.000
ERPP2 0.905 0.012 76.008 0.000
ERPP3 0.895 0.014 64.196 0.000
ERPP4 0.895 0.013 67.671 0.000
ERPP5 0.755 0.032 23.421 0.000
ERP-Strategic IT Planning
ERPS1 0.840 0.015 55.988 0.000
ERPS2 0.887 0.012 77.035 0.000
ERPS3 0.901 0.012 72.709 0.000
ERPS4 0.904 0.013 69.108 0.000
ERPS5 0.862 0.018 46.898 0.000
ERP-Training
ERPT1 0.825 0.020 41.460 0.000
ERPT2 0.766 0.032 24.074 0.000
ERPT3 0.850 0.016 54.514 0.000
ERPT4 0.847 0.018 47.484 0.000
ERPT5 0.805 0.021 37.848 0.000
Excellence-Customer Focus
EXC1 0.927 0.011 84.758 0.000
EXC2 0.951 0.008 119.483 0.000
EXC3 0.933 0.009 99.535 0.000
Excellence-Innovation
EXI1 0.884 0.014 61.997 0.000
EXI2 0.908 0.015 62.436 0.000
EXI3 0.910 0.013 68.133 0.000
Excellence-Personnel Commitment
EXP1 0.855 0.017 50.163 0.000
EXP2 0.862 0.020 43.673 0.000
EXP3 0.837 0.025 33.668 0.000
EXP4 0.802 0.028 28.481 0.000
HRM
HRE1 0.862 0.015 57.933 0.000
HRE2 0.785 0.020 38.587 0.000
HRE3 0.785 0.020 39.039 0.000
HRI1 0.793 0.028 28.688 0.000
www.ccsenet.org/ass Asian Social Science Vol. 10, No. 14; 2014
164
Construct Items Loadings Standard Error T Value P Value
HRI2 0.844 0.020 42.946 0.000
HRI3 0.889 0.013 69.151 0.000
HRT2 0.776 0.026 30.201 0.000
HRT3 0.905 0.011 82.948 0.000
HRTI 0.860 0.014 61.412 0.000
Information and Analysis
IA1 0.801 0.024 32.802 0.000
IA2 0.910 0.011 82.811 0.000
IA3 0.848 0.022 38.033 0.000
IA4 0.888 0.014 64.433 0.000
IA5 0.902 0.010 86.148 0.000
Management Leadership
ML1 0.924 0.010 93.907 0.000
ML2 0.892 0.017 51.406 0.000
ML3 0.938 0.009 104.723 0.000
ML4 0.920 0.012 78.487 0.000
Customer
OPC4 0.799 0.010 85.559 0.000
OPC5 0.824 0.020 40.056 0.000
OPC6 0.830 0.033 21.607 0.000
OPC7 0.777 0.027 28.825 0.000
Financial
OPF1 0.866 0.020 40.355 0.000
OPF2 0.740 0.027 28.253 0.000
OPF3 0.762 0.013 64.619 0.000
Internal Process
OPI10 0.794 0.042 17.748 0.000
OPI11 0.719 0.044 17.473 0.000
OPI8 0.822 0.033 24.584 0.000
OPI9 0.823 0.023 35.240 0.000
Learning and Growth
OPL12 0.771 0.024 34.033 0.000
OPL13 0.803 0.022 35.931 0.000
OPL14 0.754 0.019 44.190 0.000
OPL15 0.869 0.020 41.264 0.000
Service Design
SD1 0.892 0.014 63.562 0.000
SD2 0.943 0.007 140.834 0.000
SD3 0.890 0.009 96.015 0.000
Stratgic Planning
SP1 0.841 0.018 46.320 0.000
SP2 0.884 0.014 63.567 0.000
SP3 0.894 0.011 81.630 0.000
SP4 0.846 0.015 56.679 0.000
Table 2. Factor analysis results
Construct
Item
s
B
CI
ER
PB
ER
PC
ER
PE
ER
PI
ER
PL
ER
PP
ER
PS
ER
PT
Cu
stom
er In
nov
atio
n Com
mit
men
t
HR
I
IA
ML
OP
C
OP
F
OP
I
OP
L
SD
SP
Benchmarking
B1 0.
9
0.
8
0.
55
0.
37
0.
72
0.
53
0.
5
0.
45
0.
73
0.
5
0.
45
0.
49
0.
28
0.
75
0.
71
0.
47
0.
35
0.
16
0.
32
0.
35
0.
72
0.
61
B2 0.
9
0.
74
0.
56
0.
36
0.
57
0.
56
0.
45
0.
42
0.
7
0.
47
0.
32
0.
47
0.
3
0.
76
0.
73
0.
46
0.
26
0.
17
0.
29
0.
35
0.
71
##
#
B3 0.
9
0.
73
0.
52
0.
27
0.
59
0.
52
0.
4
0.
4
0.
71
0.
41
0.
36
0.
51
0.
36
0.
67
0.
71
0.
52
0.
25
0.
16
0.
3
0.
38
0.
68
0.
58
Continuous Improvement
CI1 0.
76
0.
9
0.
62
0.
57
0.
75
0.
63
0.
61
0.
59
0.
75
0.
6
0.
53
0.
6
0.
5
0.
77
0.
86
0.
55
0.
41
0.
39
0.
48
0.
52
0.
82
0.
66
CI2 0.
77
0.
9
0.
61
0.
47
0.
74
0.
58
0.
52
0.
61
0.
78
0.
49
0.
41
0.
61
0.
49
0.
78
0.
81
0.
67
0.
33
0.
37
0.
45
0.
49
0.
8
0.
69

www.ccsenet.org/ass Asian Social Science Vol. 10, No. 14; 2014
165
Construct
Item
s
B
CI
ER
PB
ER
PC
ER
PE
ER
PI
ER
PL
ER
PP
ER
PS
ER
PT
Cu
stom
er In
nov
atio
n Com
mit
men
t
HR
I
IA
ML
OP
C
OP
F
OP
I
OP
L
SD
SP
CI3 0.
69
0.
9
0.
44
0.
44
0.
68
0.
44
0.
4
0.
53
0.
64
0.
45
0.
4
0.
55
0.
49
0.
79
0.
75
0.
58
0.
3
0.
37
0.
45
0.
34
0.
64
0.
56
CI4 0.
81
0.
9
0.
56
0.
37
0.
71
0.
56
0.
47
0.
37
0.
7
0.
47
0.
3
0.
48
0.
3
0.
76
0.
73
0.
52
0.
22
0.
2
0.
38
0.
36
0.
71
0.
59
ERPB
ERPB1
0.
44
0.
48
0.
9
0.
66
0.
52
0.
86
0.
76
0.
5
0.
58
0.
73
0.
25
0.
45
0.
26
0.
49
0.
5
0.
3
0.
25
0.
12
0.
29
0.
38
0.
52
0.
48
ERPB2
0.
6
0.
57
0.
9
0.
6
0.
64
0.
84
0.
74
0.
53
0.
64
0.
68
0.
42
0.
49
0.
25
0.
55
0.
5
0.
3
0.
39
0.
14
0.
31
0.
43
0.
57
0.
54
ERPB3
0.
51
0.
5
0.
9
0.
56
0.
55
0.
71
0.
64
0.
49
0.
54
0.
61
0.
51
0.
47
0.
36
0.
56
0.
52
0.
25
0.
51
0.
07
0.
27
0.
43
0.
48
0.
39
ERPB4
0.
52
0.
58
0.
9
0.
64
0.
57
0.
76
0.
71
0.
58
0.
65
0.
68
0.
41
0.
52
0.
34
0.
63
0.
59
0.
31
0.
38
0.
2
0.
34
0.
42
0.
59
0.
44
ERPB5
0.
49
0.
57
0.
8
0.
61
0.
52
0.
59
0.
58
0.
45
0.
55
0.
67
0.
31
0.
49
0.
32
0.
6
0.
56
0.
33
0.
25
0.
25
0.
31
0.
35
0.
49
0.
35
ERPC
ERPC1
0.
41
0.
52
0.
68
0.
9
0.
54
0.
73
0.
79
0.
67
0.
43
0.
67
0.
39
0.
43
0.
48
0.
43
0.
55
0.
5
0.
47
0.
4
0.
24
0.
46
0.
5
0.
56
ERPC2
0.
26
0.
39
0.
63
0.
9
0.
4
0.
63
0.
77
0.
61
0.
33
0.
68
0.
38
0.
41
0.
44
0.
37
0.
47
0.
37
0.
38
0.
36
0.
24
0.
33
0.
37
0.
42
ERPC3
0.
34
0.
45
0.
57
0.
9
0.
47
0.
61
0.
75
0.
58
0.
39
0.
68
0.
34
0.
39
0.
4
0.
4
0.
47
0.
4
0.
24
0.
36
0.
21
0.
25
0.
4
0.
43
ERPC4
0.
29
0.
48
0.
68
0.
9
0.
5
0.
69
0.
81
0.
63
0.
38
0.
72
0.
37
0.
44
0.
46
0.
41
0.
51
0.
41
0.
32
0.
34
0.
24
0.
34
0.
46
0.
42
ERPC5
0.
4
0.
49
0.
65
0.
9
0.
57
0.
64
0.
8
0.
61
0.
46
0.
72
0.
33
0.
41
0.
38
0.
44
0.
53
0.
5
0.
32
0.
37
0.
21
0.
36
0.
51
0.
5
ERPE
ERPE1
0.
57
0.
7
0.
6
0.
54
0.
9
0.
6
0.
52
0.
5
0.
73
0.
56
0.
35
0.
48
0.
35
0.
63
0.
58
0.
63
0.
29
0.
38
0.
36
0.
39
0.
62
0.
67
ERPE2
0.
66
0.
77
0.
63
0.
48
0.
9
0.
59
0.
55
0.
48
0.
78
0.
6
0.
41
0.
45
0.
31
0.
7
0.
65
0.
59
0.
37
0.
26
0.
37
0.
44
0.
68
0.
65
ERPE3
0.
73
0.
74
0.
57
0.
41
0.
9
0.
49
0.
49
0.
53
0.
79
0.
5
0.
48
0.
46
0.
31
0.
7
0.
63
0.
58
0.
48
0.
28
0.
38
0.
48
0.
69
0.
68
ERPE4
0.
69
0.
67
0.
5
0.
39
0.
9
0.
45
0.
41
0.
48
0.
73
0.
49
0.
44
0.
5
0.
35
0.
62
0.
57
0.
6
0.
42
0.
34
0.
37
0.
48
0.
65
0.
67
ERPE5
0.
46
0.
61
0.
52
0.
56
0.
7
0.
51
0.
55
0.
79
0.
61
0.
42
0.
53
0.
47
0.
5
0.
49
0.
58
0.
55
0.
43
0.
46
0.
3
0.
47
0.
68
0.
57
ERPI
ERPI1
0.
53
0.
62
0.
72
0.
77
0.
61
0.
8
0.
74
0.
68
0.
6
0.
61
0.
4
0.
48
0.
45
0.
5
0.
63
0.
53
0.
37
0.
38
0.
24
0.
49
0.
65
0.
59
ERPI2
0.
49
0.
46
0.
71
0.
57
0.
42
0.
9
0.
68
0.
45
0.
56
0.
64
0.
21
0.
45
0.
24
0.
48
0.
51
0.
3
0.
23
0.
15
0.
33
0.
41
0.
49
0.
48
ERPI3
0.
58
0.
59
0.
75
0.
59
0.
54
0.
9
0.
67
0.
48
0.
56
0.
7
0.
34
0.
41
0.
28
0.
58
0.
59
0.
31
0.
34
0.
15
0.
35
0.
44
0.
57
0.
53
ERPI4
0.
57
0.
59
0.
87
0.
71
0.
62
0.
9
0.
8
0.
53
0.
61
0.
8
0.
43
0.
49
0.
29
0.
58
0.
6
0.
31
0.
4
0.
16
0.
35
0.
5
0.
6
0.
54
ERPI5
0.
39
0.
43
0.
79
0.
57
0.
46
0.
8
0.
7
0.
49
0.
56
0.
68
0.
29
0.
52
0.
3
0.
44
0.
44
0.
25
0.
25
0.
16
0.
34
0.
39
0.
47
0.
42
ERPL
ERPL1
0.
45
0.
43
0.
69
0.
6
0.
48
0.
73
0.
8
0.
47
0.
54
0.
74
0.
3
0.
37
0.
23
0.
47
0.
51
0.
27
0.
29
0.
14
0.
24
0.
37
0.
5
0.
49
ERPL2
0.
5
0.
54
0.
77
0.
6
0.
57
0.
76
0.
8
0.
44
0.
57
0.
68
0.
23
0.
38
0.
23
0.
58
0.
57
0.
31
0.
31
0.
13
0.
29
0.
44
0.
59
0.
45
ERPL3
0.
35
0.
48
0.
66
0.
86
0.
49
0.
64
0.
9
0.
57
0.
44
0.
68
0.
31
0.
35
0.
32
0.
41
0.
46
0.
41
0.
29
0.
41
0.
16
0.
32
0.
41
0.
4

www.ccsenet.org/ass Asian Social Science Vol. 10, No. 14; 2014
166
Construct
Item
s
B
CI
ER
PB
ER
PC
ER
PE
ER
PI
ER
PL
ER
PP
ER
PS
ER
PT
Cu
stom
er In
nov
atio
n Com
mit
men
t
HR
I
IA
ML
OP
C
OP
F
OP
I
OP
L
SD
SP
ERPL4
0.
39
0.
44
0.
62
0.
8
0.
44
0.
67
0.
9
0.
59
0.
4
0.
64
0.
28
0.
3
0.
26
0.
39
0.
46
0.
32
0.
26
0.
24
0.
09
0.
28
0.
45
0.
42
ERPL5
0.
43
0.
47
0.
6
0.
78
0.
45
0.
65
0.
8
0.
53
0.
39
0.
6
0.
28
0.
29
0.
3
0.
38
0.
53
0.
35
0.
25
0.
2
0.
05
0.
26
0.
49
0.
41
ERPP
ERPP1
0.
36
0.
48
0.
55
0.
59
0.
52
0.
59
0.
55
0.
9
0.
43
0.
37
0.
4
0.
6
0.
65
0.
47
0.
54
0.
59
0.
44
0.
46
0.
43
0.
54
0.
59
0.
56
ERPP2
0.
45
0.
55
0.
49
0.
62
0.
56
0.
55
0.
56
0.
9
0.
45
0.
41
0.
39
0.
55
0.
57
0.
51
0.
58
0.
6
0.
41
0.
49
0.
42
0.
54
0.
63
0.
61
ERPP3
0.
45
0.
51
0.
56
0.
66
0.
64
0.
56
0.
64
0.
9
0.
52
0.
43
0.
51
0.
48
0.
49
0.
42
0.
5
0.
54
0.
5
0.
48
0.
33
0.
53
0.
6
0.
58
ERPP4
0.
46
0.
54
0.
55
0.
61
0.
59
0.
54
0.
54
0.
9
0.
49
0.
41
0.
49
0.
52
0.
55
0.
55
0.
59
0.
55
0.
53
0.
51
0.
36
0.
52
0.
59
0.
54
ERPP5
0.
35
0.
51
0.
44
0.
53
0.
47
0.
4
0.
41
0.
8
0.
43
0.
42
0.
45
0.
58
0.
64
0.
49
0.
56
0.
5
0.
4
0.
56
0.
35
0.
45
0.
48
0.
37
ERPS
ERPS1
0.
71
0.
67
0.
63
0.
44
0.
73
0.
58
0.
52
0.
49
0.
8
0.
53
0.
39
0.
38
0.
19
0.
63
0.
57
0.
44
0.
35
0.
18
0.
28
0.
39
0.
62
0.
58
ERPS2
0.
7
0.
71
0.
65
0.
37
0.
76
0.
63
0.
51
0.
52
0.
9
0.
52
0.
45
0.
52
0.
34
0.
7
0.
66
0.
48
0.
38
0.
19
0.
34
0.
46
0.
72
0.
59
ERPS3
0.
67
0.
69
0.
56
0.
3
0.
69
0.
54
0.
44
0.
41
0.
9
0.
42
0.
28
0.
45
0.
27
0.
67
0.
63
0.
54
0.
14
0.
24
0.
29
0.
34
0.
67
0.
6
ERPS4
0.
71
0.
72
0.
65
0.
43
0.
76
0.
6
0.
52
0.
5
0.
9
0.
54
0.
36
0.
5
0.
34
0.
74
0.
73
0.
52
0.
22
0.
25
0.
31
0.
37
0.
72
0.
63
ERPS5
0.
68
0.
74
0.
54
0.
39
0.
76
0.
56
0.
48
0.
42
0.
9
0.
57
0.
25
0.
5
0.
3
0.
66
0.
64
0.
55
0.
11
0.
25
0.
3
0.
35
0.
65
0.
6
ERPT
ERPT1
0.
38
0.
47
0.
67
0.
69
0.
48
0.
71
0.
67
0.
38
0.
46
0.
8
0.
28
0.
39
0.
28
0.
42
0.
51
0.
3
0.
2
0.
17
0.
28
0.
38
0.
48
0.
48
ERPT2
0.
37
0.
43
0.
59
0.
59
0.
47
0.
53
0.
58
0.
36
0.
41
0.
8
0.
41
0.
47
0.
33
0.
45
0.
4
0.
21
0.
3
0.
15
0.
31
0.
3
0.
34
0.
27
ERPT3
0.
43
0.
46
0.
59
0.
62
0.
5
0.
57
0.
61
0.
36
0.
49
0.
8
0.
38
0.
41
0.
3
0.
46
0.
47
0.
22
0.
26
0.
12
0.
29
0.
33
0.
41
0.
32
ERPT4
0.
41
0.
41
0.
68
0.
68
0.
44
0.
68
0.
72
0.
38
0.
48
0.
8
0.
24
0.
31
0.
16
0.
43
0.
49
0.
23
0.
22
0.
16
0.
19
0.
34
0.
46
0.
38
ERPT5
0.
55
0.
54
0.
68
0.
57
0.
55
0.
72
0.
69
0.
44
0.
55
0.
8
0.
29
0.
42
0.
24
0.
54
0.
57
0.
27
0.
22
0.
1
0.
26
0.
4
0.
55
0.
42
EXC
EXC1
0.
39
0.
42
0.
36
0.
33
0.
51
0.
33
0.
29
0.
48
0.
38
0.
33
0.
9
0.
58
0.
61
0.
39
0.
44
0.
37
0.
68
0.
41
0.
45
0.
55
0.
41
0.
54
EXC2
0.
42
0.
47
0.
42
0.
41
0.
51
0.
39
0.
36
0.
48
0.
37
0.
381
0.
66
0.
67
0.
39
0.
49
0.
39
0.
72
0.
49
0.
48
0.
62
0.
42
0.
5
EXC3
0.
41
0.
4
0.
46
0.
38
0.
41
0.
36
0.
3
0.
49
0.
37
0.
38
0.
9
0.
71
0.
73
0.
4
0.
46
0.
38
0.
62
0.
4
0.
48
0.
55
0.
36
0.
44
EXI
EXI1
0.
46
0.
54
0.
52
0.
44
0.
49
0.
52
0.
37
0.
61
0.
47
0.
46
0.
58
0.
9
0.
71
0.
59
0.
53
0.
49
0.
57
0.
5
0.
71
0.
62
0.
49
0.
51
EXI2
0.
48
0.
54
0.
48
0.
36
0.
48
0.
44
0.
32
0.
53
0.
5
0.
39
0.
65
0.
9
0.
73
0.
54
0.
56
0.
48
0.
47
0.
5
0.
59
0.
6
0.
5
0.
47
EXI3
0.
51
0.
62
0.
53
0.
46
0.
49
0.
49
0.
41
0.
55
0.
48
0.
47
0.
65
0.
9
0.
71
0.
57
0.
58
0.
46
0.
46
0.
44
0.
56
0.
57
0.
48
0.
49
EXP
EXP1
0.
32
0.
49
0.
34
0.
44
0.
32
0.
37
0.
3
0.
57
0.
27
0.
28
0.
53
0.
78
0.
9
0.
45
0.
52
0.
53
0.
42
0.
58
0.
65
0.
55
0.
46
0.
46
EXP2
0.
34
0.
48
0.
31
0.
41
0.
39
0.
34
0.
34
0.
56
0.
28
0.
29
0.
68
0.
73
0.
9
0.
42
0.
51
0.
52
0.
54
0.
59
0.
6
0.
54
0.
44
0.
5
EXP3
0.
21
0.
32
0.
2
0.
33
0.
36
0.
2
0.
16
0.
53
0.
27
0.
21
0.
67
0.
6
0.
8
0.
23
0.
4
0.
54
0.
57
0.
58
0.
38
0.
54
0.
32
0.
44
EXP4
0.
26
0.
38
0.
34
0.
43
0.
36
0.
31
0.
28
0.
56
0.
27
0.
28
0.
51
0.
53
0.
8
0.
37
0.
44
0.
63
0.
52
0.
32
0.
33
0.
44
0.
37
0.
53

www.ccsenet.org/ass Asian Social Science Vol. 10, No. 14; 2014
167
Construct
Item
s
B
CI
ER
PB
ER
PC
ER
PE
ER
PI
ER
PL
ER
PP
ER
PS
ER
PT
Cu
stom
er In
nov
atio
n Com
mit
men
t
HR
I
IA
ML
OP
C
OP
F
OP
I
OP
L
SD
SP
HRM
HRE1
0.
66
0.
71
0.
52
0.
24
0.
58
0.
48
0.
34
0.
4
0.
66
0.
45
0.
28
0.
48
0.
28
0.
9
0.
71
0.
31
0.
15
0.
13
0.
43
0.
27
0.
66
0.
38
HRE2
0.
68
0.
78
0.
64
0.
54
0.
67
0.
6
0.
55
0.
52
0.
74
0.
51
0.
46
0.
58
0.
46
0.
8
0.
72
0.
57
0.
34
0.
29
0.
35
0.
34
0.
65
0.
56
HRE3
0.
6
0.
74
0.
5
0.
43
0.
58
0.
54
0.
47
0.
56
0.
63
0.
45
0.
29
0.
44
0.
43
0.
8
0.
81
0.
46
0.
28
0.
34
0.
43
0.
4
0.
74
0.
52
HRI1
0.
68
0.
67
0.
48
0.
34
0.
63
0.
37
0.
36
0.
58
0.
65
0.
37
0.
41
0.
61
0.
42
0.
8
0.
61
0.
52
0.
34
0.
25
0.
55
0.
36
0.
61
0.
58
HRI2
0.
72
0.
73
0.
53
0.
35
0.
65
0.
45
0.
44
0.
51
0.
64
0.
43
0.
31
0.
56
0.
35
0.
8
0.
68
0.
45
0.
29
0.
23
0.
48
0.
34
0.
69
0.
51
HRI3
0.
78
0.
76
0.
62
0.
43
0.
61
0.
61
0.
55
0.
49
0.
68
0.
52
0.
36
0.
57
0.
4
0.
9
0.
75
0.
48
0.
35
0.
21
0.
5
0.
37
0.
7
0.
55
HRT2
0.
56
0.
64
0.
42
0.
28
0.
58
0.
37
0.
28
0.
35
0.
54
0.
45
0.
3
0.
44
0.
27
0.
8
0.
66
0.
28
0.
25
0.
26
0.
5
0.
32
0.
63
0.
41
HRT3
0.
67
0.
71
0.
63
0.
38
0.
62
0.
49
0.
49
0.
41
0.
63
0.
5
0.
36
0.
52
0.
32
0.
9
0.
69
0.
37
0.
32
0.
2
0.
47
0.
32
0.
65
0.
42
HRTI
0.
71
0.
74
0.
58
0.
4
0.
54
0.
52
0.
52
0.
33
0.
62
0.
53
0.
36
0.
49
0.
31
0.
9
0.
7
0.
34
0.
24
0.
15
0.
44
0.
23
0.
64
0.
46
Information and Analysis
IA1 0.
56
0.
68
0.
51
0.
49
0.
54
0.
54
0.
4
0.
55
0.
56
0.
56
0.
52
0.
58
0.
57
0.
67
0.
8
0.
46
0.
39
0.
35
0.
56
0.
53
0.
67
0.
54
IA2 0.
76
0.
78
0.
55
0.
48
0.
61
0.
56
0.
53
0.
47
0.
67
0.
56
0.
47
0.
54
0.
47
0.
75
0.
9
0.
52
0.
31
0.
3
0.
37
0.
33
0.
76
0.
61
IA3 0.
74
0.
75
0.
46
0.
36
0.
55
0.
45
0.
49
0.
54
0.
64
0.
35
0.
36
0.
48
0.
44
0.
73
0.
8
0.
49
0.
31
0.
27
0.
35
0.
36
0.
78
0.
55
IA4 0.
7
0.
81
0.
55
0.
49
0.
6
0.
55
0.
57
0.
52
0.
67
0.
53
0.
32
0.
49
0.
42
0.
75
0.
9
0.
49
0.
21
0.
36
0.
35
0.
41
0.
79
0.
52
IA5 0.
68
0.
83
0.
63
0.
63
0.
73
0.
66
0.
64
0.
68
0.
65
0.
62
0.
48
0.
6
0.
54
0.
77
0.
9
0.
53
0.
4
0.
43
0.
48
0.
51
0.
81
0.
63
Management Leadership
ML1
0.
53
0.
68
0.
36
0.
46
0.
67
0.
41
0.
39
0.
59
0.
6
0.
33
0.
34
0.
54
0.
6
0.
53
0.
59
0.
9
0.
34
0.
47
0.
36
0.
48
0.
62
0.
73
ML2
0.
48
0.
53
0.
21
0.
32
0.
54
0.
27
0.
26
0.
52
0.
47
0.
14
0.
29
0.
43
0.
53
0.
41
0.
46
0.
9
0.
3
0.
53
0.
32
0.
41
0.
49
0.
72
ML3
0.
48
0.
58
0.
36
0.
51
0.
66
0.
38
0.
41
0.
62
0.
53
0.
34
0.
44
0.
5
0.
65
0.
45
0.
51
0.
9
0.
46
0.
47
0.
27
0.
44
0.
51
0.
75
ML4
0.
46
0.
6
0.
35
0.
5
0.
63
0.
37
0.
4
0.
6
0.
5
0.
29
0.
4
0.
47
0.
62
0.
48
0.
53
0.
9
0.
44
0.
49
0.
24
0.
39
0.
49
0.
72
Customer
OPC4
0.
19
0.
25
0.
33
0.
43
0.
37
0.
27
0.
33
0.
47
0.
16
0.
19
0.
61
0.
44
0.
59
0.
18
0.
28
0.
43
0.
8
0.
41
0.
23
0.
46
0.
21
0.
41
OPC5
0.
11
0.
14
0.
3
0.
29
0.
22
0.
25
0.
22
0.
45
0.
06
0.
11
0.
48
0.
4
0.
51
0.
18
0.
17
0.
33
0.
8
0.
31
0.
39
0.
53
0.
17
0.
37
OPC6
0.
39
0.
33
0.
37
0.
21
0.
44
0.
32
0.
29
0.
31
0.
28
0.
3
0.
62
0.
49
0.
42
0.
29
0.
3
0.
26
0.
8
0.
34
0.
44
0.
62
0.
33
0.
41
OPC7
0.
35
0.
4
0.
35
0.
33
0.
43
0.
33
0.
26
0.
48
0.
36
0.
32
0.
61
0.
45
0.
46
0.
43
0.
42
0.
35
0.
8
0.
51
0.
49
0.
63
0.
37
0.
4
Financial
OPF1
0.
13
0.
34
0.
15
0.
33
0.
32
0.
19
0.
18
0.
46
0.
18
0.
12
0.
49
0.
48
0.
63
0.
23
0.
36
0.
52
0.
57
0.
9
0.
53
0.
57
0.
32
0.
45
OPF2
0.
06
0.
22
0.
16
0.
29
0.
29
0.
19
0.
23
0.
44
0.
2
0.
15
0.
24
0.
37
0.
37
0.
18
0.
23
0.
3
0.
2
0.
7
0.
28
0.
24
0.
23
0.
23
OPF3
0.
24
0.
31
0.
12
0.
35
0.
34
0.
18
0.
26
0.
47
0.
24
0.
16
0.
3
0.
39
0.
41
0.
25
0.
33
0.
39
0.
29
0.
8
0.
27
0.
35
0.
29
0.
32
Internal Process
OPI10
0.
25
0.
34
0.
17
0.
11
0.
34
0.
19
0.
05
0.
34
0.
21
0.
26
0.
47
0.
5
0.
48
0.
4
0.
36
0.
21
0.
35
0.
39
0.
8
0.
48
0.
35
0.
4
OPI11
0.
26
0.
44
0.
37
0.
3
0.
42
0.
36
0.
27
0.
4
0.
34
0.
36
0.
37
0.
61
0.
43
0.
45
0.
36
0.
29
0.
33
0.
48
0.
7
0.
55
0.
35
0.
32

www.ccsenet.org/ass Asian Social Science Vol. 10, No. 14; 2014
168
Construct
Item
s
B
CI
ER
PB
ER
PC
ER
PE
ER
PI
ER
PL
ER
PP
ER
PS
ER
PT
Cu
stom
er In
nov
atio
n Com
mit
men
t
HR
I
IA
ML
OP
C
OP
F
OP
I
OP
L
SD
SP
OPI8
0.
22
0.
35
0.
27
0.
17
0.
26
0.
29
0.
14
0.
3
0.
22
0.
19
0.
29
0.
48
0.
38
0.
41
0.
38
0.
17
0.
44
0.
37
0.
8
0.
56
0.
4
0.
29
OPI9
0.
34
0.
46
0.
31
0.
22
0.
29
0.
31
0.
17
0.
33
0.
32
0.
22
0.
45
0.
6
0.
59
0.
5
0.
43
0.
36
0.
43
0.
3
0.
8
0.
47
0.
41
0.
5
Learning and Growth
OPL12
0.
31
0.
42
0.
51
0.
46
0.
48
0.
47
0.
43
0.
55
0.
43
0.
48
0.
57
0.
54
0.
48
0.
31
0.
4
0.
38
0.
59
0.
48
0.
52
0.
8
0.
43
0.
44
OPL13
0.
18
0.
27
0.
26
0.
28
0.
3
0.
29
0.
21
0.
49
0.
2
0.
26
0.
43
0.
49
0.
51
0.
27
0.
33
0.
34
0.
59
0.
49
0.
54
0.
8
0.
36
0.
32
OPL14
0.
51
0.
47
0.
48
0.
31
0.
47
0.
57
0.
44
0.
4
0.
44
0.
44
0.
42
0.
51
0.
37
0.
42
0.
46
0.
33
0.
46
0.
17
0.
45
0.
8
0.
48
0.
44
OPL15
0.
31
0.
41
0.
29
0.
21
0.
44
0.
35
0.
24
0.
45
0.
35
0.
23
0.
53
0.
57
0.
59
0.
29
0.
4
0.
45
0.
59
0.
5
0.
58
0.
9
0.
44
0.
45
Service Design
SD1 0.
72
0.
73
0.
55
0.
42
0.
62
0.
59
0.
52
0.
61
0.
69
0.
48
0.
39
0.
51
0.
47
0.
7
0.
82
0.
51
0.
27
0.
28
0.
39
0.
43
0.
9
0.
63
SD2 0.
69
0.
77
0.
59
0.
47
0.
73
0.
6
0.
58
0.
62
0.
69
0.
5
0.
4
0.
49
0.
41
0.
71
0.
79
0.
49
0.
36
0.
32
0.
42
0.
52
0.
9
0.
6
SD3 0.
72
0.
78
0.
55
0.
47
0.
74
0.
56
0.
5
0.
58
0.
71
0.
52
0.
37
0.
49
0.
42
0.
77
0.
78
0.
57
0.
3
0.
38
0.
49
0.
49
0.
9
0.
61
Stratgic Planning
SP1 0.
48
0.
52
0.
3
0.
33
0.
52
0.
39
0.
36
0.
46
0.
48
0.
27
0.
34
0.
36
0.
49
0.
43
0.
5
0.
66
0.
36
0.
35
0.
35
0.
38
0.
53
0.
8
SP2 0.
52
0.
62
0.
48
0.
54
0.
69
0.
52
0.
53
0.
49
0.
57
0.
47
0.
39
0.
48
0.
5
0.
49
0.
57
0.
75
0.
41
0.
43
0.
41
0.
45
0.
59
0.
9
SP3 0.
61
0.
65
0.
56
0.
46
0.
74
0.
6
0.
48
0.
57
0.
69
0.
43
0.
56
0.
57
0.
52
0.
56
0.
58
0.
7
0.
55
0.
32
0.
45
0.
52
0.
62
0.
9
SP4 0.
61
0.
63
0.
42
0.
46
0.
64
0.
51
0.
43
0.
6
0.
61
0.
42
0.
51
0.
47
0.
48
0.
55
0.
63
0.
64
0.
39
0.
44
0.
42
0.
41
0.
59
0.
8
4.1.2 The Convergent Validity
The convergent validity is the degree of a group of items converges to measure a specific variable (Hair et al., 2010). In SEM literature, it can be confirmed by testing the composite reliability, the loading, and the average variance extracted (AVE). To consider the items are highly loaded and statistically significant, factor loading should at least 0.7, AVE is at least 0.5, and the composite reliability is at least 0.7. Table 3 shows that all these criteria have been achieved and confirmed. Therefore, the results of the outer model (measurement model) have suitable convergent validity (Bagozzi & Yi, 1988).
Table 3. The convergent validity analysis
Construct Items Loadings Cronbach's Alpha CRa AVEb
Benchmarking
B1 0.928
0.852 0.917 0.724 B2 0.884
B3 0.877
Continuous Improvement
CI1 0.902
0.915 0.940 0.797 CI2 0.926
CI3 0.867
CI4 0.875
ERP-Business Process Skills
ERPB1 0.851
0.909 0.933 0.736
ERPB2 0.876
ERPB3 0.873
ERPB4 0.919
ERPB5 0.763
ERP-Change Readiness ERPC1 0.861 0.942 0.956 0.812

www.ccsenet.org/ass Asian Social Science Vol. 10, No. 14; 2014
169
Construct Items Loadings Cronbach's Alpha CRa AVEb
ERPC2 0.932
ERPC3 0.880
ERPC4 0.942
ERPC5 0.888
ERP-Executive Commitment
ERPE1 0.861
0.915 0.938 0.752
ERPE2 0.909
ERPE3 0.925
ERPE4 0.911
ERPE5 0.714
ERP-IT Skills
ERPI1 0.840
0.922 0.941 0.763
ERPI2 0.880
ERPI3 0.891
ERPI4 0.934
ERPI5 0.817
ERP-Learning
ERPL1 0.778
0.892 0.921 0.699
ERPL2 0.811
ERPL3 0.851
ERPL4 0.894
ERPL5 0.842
ERP-Project Management
ERPP1 0.903
0.920 0.941 0.761
ERPP2 0.905
ERPP3 0.895
ERPP4 0.895
ERPP5 0.755
ERP-Strategic IT Planning
ERPS1 0.840
0.926 0.944 0.773
ERPS2 0.887
ERPS3 0.901
ERPS4 0.904
ERPS5 0.862
ERP-Training
ERPT1 0.825
0.877 0.911 0.671
ERPT2 0.766
ERPT3 0.850
ERPT4 0.847
ERPT5 0.805
Excellence-Customer Focus
EXC1 0.927
0.930 0.956 0.878 EXC2 0.951
EXC3 0.933
Excellence-Innovation
EXI1 0.884
0.883 0.928 0.811 EXI2 0.908
EXI3 0.910
Excellence-Personnel Commitment
EXP1 0.855
0.860 0.905 0.704 EXP2 0.862
EXP3 0.837
EXP4 0.802
HRM
HRE1 0.862
0.945 0.954 0.696
HRE2 0.785
HRE3 0.785
HRI1 0.793
HRI2 0.844
HRI3 0.889
HRT2 0.776

www.ccsenet.org/ass Asian Social Science Vol. 10, No. 14; 2014
170
Construct Items Loadings Cronbach's Alpha CRa AVEb
HRT3 0.905
HRTI 0.860
Information and Analysis
IA1 0.801
0.920 0.940 0.758
IA2 0.910
IA3 0.848
IA4 0.888
IA5 0.902
Management Leadership
ML1 0.924
0.938 0.956 0.844 ML2 0.892
ML3 0.938
ML4 0.920
Customer
OPC4 0.799
0.823 0.882 0.653 OPC5 0.824
OPC6 0.830
OPC7 0.777
Financial
OPF1 0.866
0.715 0.833 0.625 OPF2 0.740
OPF3 0.762
Internal Process
OPI10 0.794
0.799 0.869 0.625 OPI11 0.719
OPI8 0.822
OPI9 0.823
Learning and Growth
OPL12 0.771
0.813 0.877 0.641 OPL13 0.803
OPL14 0.754
OPL15 0.869
Service Design
SD1 0.892
0.894 0.934 0.826 SD2 0.943
SD3 0.890
Stratgic Planning
SP1 0.841
0.889 0.923 0.751 SP2 0.884
SP3 0.894
SP4 0.846
a: CR = (Σ factor loading) 2 / {(Σ factor loading) 2) + Σ (variance of error)} b: AVE = Σ (factor loading) 2 / (Σ (factor loading) 2 + Σ (variance of error)}
4.1.3 The Discriminant Validity
The literature of SEM defined the discriminant validity as the degree of items can distinguish a construct from other model’s constructs. According to Compeau et al. (1999), items of each construct should have variances among them more than with other constructs in the model. Table 4 shows that the diagonal line of values that contain the square root of AVE and below it there are the correlations of the constructs. To examine the discriminant validity, the values of the diagonal line should be compared with other off diagonal ones. As we can see in the table, the values of the diagonal line are higher than others in their respective columns and rows and therefore confirmed the discriminant validity of the model based on Fornell and Larcker’s (1981) criterion.
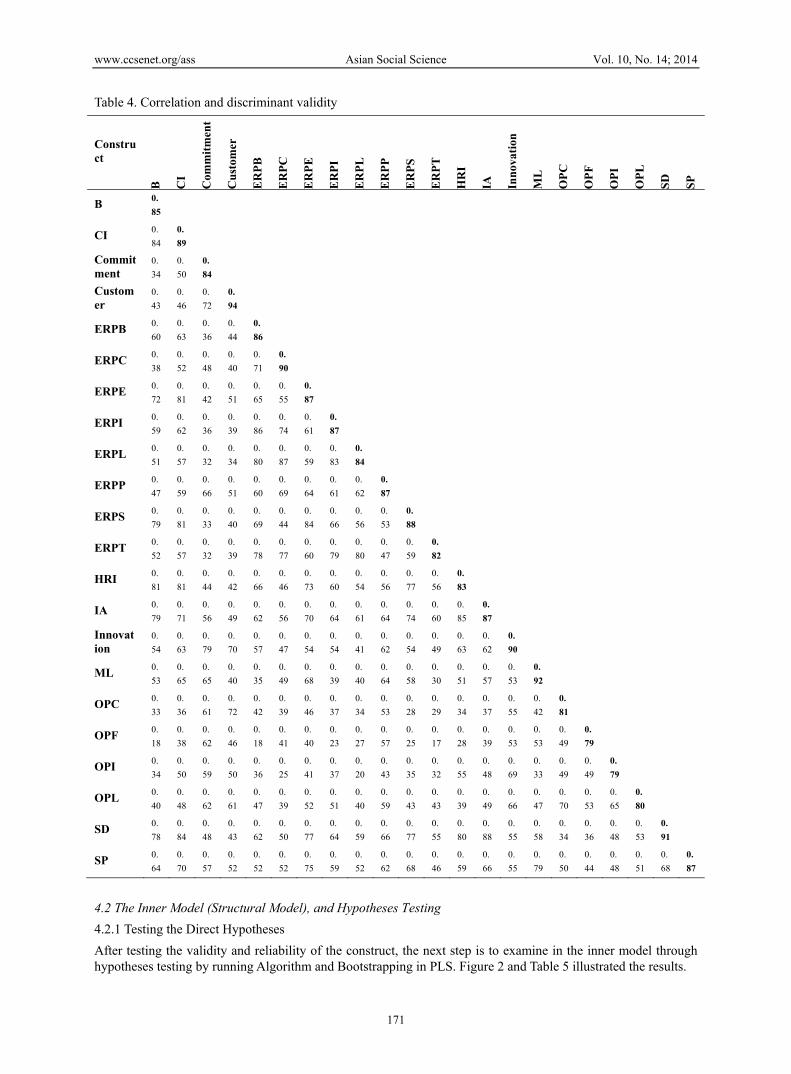
www.ccsenet.org/ass Asian Social Science Vol. 10, No. 14; 2014
171
Table 4. Correlation and discriminant validity
Construct
B
CI
Com
mit
men
t
Cus
tom
er
ER
PB
ER
PC
ER
PE
ER
PI
ER
PL
ER
PP
ER
PS
ER
PT
HR
I
IA
Inn
ovat
ion
ML
OP
C
OP
F
OP
I
OP
L
SD
SP
B 0.
85
CI 0.
84
0.
89
Commitment
0.
34
0.
50
0.
84
Customer
0.
43
0.
46
0.
72
0.
94
ERPB 0.
60
0.
63
0.
36
0.
44
0.
86
ERPC 0.
38
0.
52
0.
48
0.
40
0.
71
0.
90
ERPE 0.
72
0.
81
0.
42
0.
51
0.
65
0.
55
0.
87
ERPI 0.
59
0.
62
0.
36
0.
39
0.
86
0.
74
0.
61
0.
87
ERPL 0.
51
0.
57
0.
32
0.
34
0.
80
0.
87
0.
59
0.
83
0.
84
ERPP 0.
47
0.
59
0.
66
0.
51
0.
60
0.
69
0.
64
0.
61
0.
62
0.
87
ERPS 0.
79
0.
81
0.
33
0.
40
0.
69
0.
44
0.
84
0.
66
0.
56
0.
53
0.
88
ERPT 0.
52
0.
57
0.
32
0.
39
0.
78
0.
77
0.
60
0.
79
0.
80
0.
47
0.
59
0.
82
HRI 0.
81
0.
81
0.
44
0.
42
0.
66
0.
46
0.
73
0.
60
0.
54
0.
56
0.
77
0.
56
0.
83
IA 0.
79
0.
71
0.
56
0.
49
0.
62
0.
56
0.
70
0.
64
0.
61
0.
64
0.
74
0.
60
0.
85
0.
87
Innovation
0.
54
0.
63
0.
79
0.
70
0.
57
0.
47
0.
54
0.
54
0.
41
0.
62
0.
54
0.
49
0.
63
0.
62
0.
90
ML 0.
53
0.
65
0.
65
0.
40
0.
35
0.
49
0.
68
0.
39
0.
40
0.
64
0.
58
0.
30
0.
51
0.
57
0.
53
0.
92
OPC 0.
33
0.
36
0.
61
0.
72
0.
42
0.
39
0.
46
0.
37
0.
34
0.
53
0.
28
0.
29
0.
34
0.
37
0.
55
0.
42
0.
81
OPF 0.
18
0.
38
0.
62
0.
46
0.
18
0.
41
0.
40
0.
23
0.
27
0.
57
0.
25
0.
17
0.
28
0.
39
0.
53
0.
53
0.
49
0.
79
OPI 0.
34
0.
50
0.
59
0.
50
0.
36
0.
25
0.
41
0.
37
0.
20
0.
43
0.
35
0.
32
0.
55
0.
48
0.
69
0.
33
0.
49
0.
49
0.
79
OPL 0.
40
0.
48
0.
62
0.
61
0.
47
0.
39
0.
52
0.
51
0.
40
0.
59
0.
43
0.
43
0.
39
0.
49
0.
66
0.
47
0.
70
0.
53
0.
65
0.
80
SD 0.
78
0.
84
0.
48
0.
43
0.
62
0.
50
0.
77
0.
64
0.
59
0.
66
0.
77
0.
55
0.
80
0.
88
0.
55
0.
58
0.
34
0.
36
0.
48
0.
53
0.
91
SP 0.
64
0.
70
0.
57
0.
52
0.
52
0.
52
0.
75
0.
59
0.
52
0.
62
0.
68
0.
46
0.
59
0.
66
0.
55
0.
79
0.
50
0.
44
0.
48
0.
51
0.
68
0.
87
4.2 The Inner Model (Structural Model), and Hypotheses Testing
4.2.1 Testing the Direct Hypotheses
After testing the validity and reliability of the construct, the next step is to examine in the inner model through hypotheses testing by running Algorithm and Bootstrapping in PLS. Figure 2 and Table 5 illustrated the results.

www.ccsenet.org/ass Asian Social Science Vol. 10, No. 14; 2014
172
Figure 2. Hypotheses testing results
Table 5. Hypotheses testing results
No Hypothesis Path Coefficient Standard Error T Value P Value Decision
H1 ERP-> Performance 0.579*** 0.038 15.293 0.000 Supported
H2 ERP-> TQM 0.841*** 0.019 44.301 0.000 Supported
H3 ERP-> Excellence 0.634*** 0.041 15.337 0.000 Supported
H4 TQM-> Performance 0.605*** 0.047 12.973 0.000 Supported
H5 TQM-> Excellence 0.684*** 0.047 14.422 0.000 Supported
H6 Excellence-> Performance 0.825*** 0.024 34.747 0.000 Supported
***:p<0.001; **:p<0.01; *:P<0.05
Figure 2 and Table 5 show that all the six hypotheses have positive and significant results at the 0.001 level of significance (β=0.579, t= 15.293, p<0.001), (β=0.841, t= 44.301, p<0.001), (β=0.634, t= 15.337, p<0.001), (β=0.605, t= 12.973, p<0.001), (β=0.684, t= 14.422, p<0.001), and (β=0.825, t= 34.747, p<0.001) respectively. Therefore, these results supported the hypotheses of the study H1, H2, H3, H4, H5, and H6.
4.2.2 Testing the Mediation Role of TQM and Organizational Excellence
In order to examine the mediation effect of TQM and organizational excellence, SmartPLS was used to estimate the indirect impact between variables. Table 6 shows that TQM has a mediation effect on the relationship between ERP and organizational performance at the 0.001 level of significance (β = 0.199, t = 2.695, p < 0.001) and therefore confirm H7. The other hypothesis (H8) also confirmed where organizational excellence was found to have a mediation effect on the relationship between ERP and organizational performance at the 0.001 level of significance (β = 0.491, t = 12.332, p < 0.001). To decide whether these medications are full or partial, Variance Accounted For (VAF) has been employed. According to VAF (58%), TQM was found to have a partial mediation whereas organizational excellence has full mediation (81%) (Hair et al., 2014).

www.ccsenet.org/ass Asian Social Science Vol. 10, No. 14; 2014
173
Table 6. Mediation analysis results
Hy
p.
No
Hypothesis
a b a*b C C' Varianc
e
Account
ed For
Decision Path
Coefficie
nt
T-Valu
e
Path
Coefficie
nt
T-Valu
e
Path
Coefficie
nt
T-Valu
e
Path
Coefficie
nt
T-Valu
e
Path
Coefficie
nt
T-Val
ue
H7
TQM mediate the relationship between ERP and Organizational Performance
0.849***
48.330
0.399***
4.6760.199***
2.6950.58***
15.960
0.249***
3.864
0.576 Partial Mediation
H8
Organizational Excellence mediate the relationship between ERP and Organizational Performance
0.655***
16.842
0.75***
16.947
0.491***
12.332
0.58***
15.960
0.113***
2.642
0.813 Full Mediation
4.3 Predictive Relevance of the Model
R-square, cross-validated redundancy and cross-validated communality were employed to test the predictive power of the model. According to Cohen (1988), values of R-square are substantial with 0.26, moderate with 0.13, and weak with 0.02. All values in the table of R-square are considered substantial. Cross-validated redundancy and cross-validated communality are the medium to assess the model’s quality. To extract them, blindfolding procedure in PLS was employed. Their values should be more than zero to say that the model has predictive quality (Fornell & Cha, 1994). Table 7 shows values more than zero and therefore confirmed that the model has prediction quality.
Table 7. Prediction relevance of the model
Construct R Square Cross-validity Redundancy
Cross-validity Communality
Total Quality Management 0.735 0.407 0.582
Organizational Excellence 0.505 0.309 0.642
Organizational performance 0.687 0.292 0.430
4.4 Goodness of Fit (GoF) of the Model
According to Wetzels et al. (2009), GoF can be confirmed based on the criteria: (small =0.1, medium =0.25, large =0.36). Table 8 below shows that the GoF value was 0.743 which considered large value.
Table 8.
Construct R Square Average Variance Extracted Goodness of Fit
Benchmarking 0.731 0.724
Continuous Improvement 0.877 0.797
ERPB 0.736
ERPC 0.812
ERPE 0.752
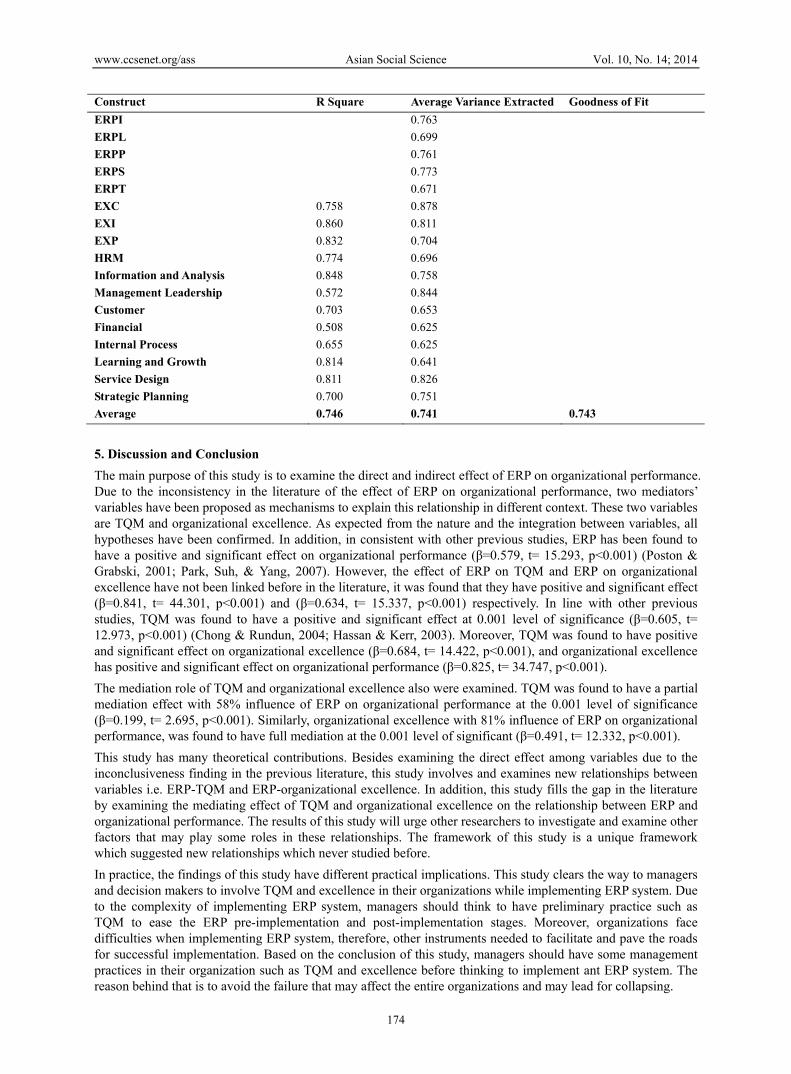
www.ccsenet.org/ass Asian Social Science Vol. 10, No. 14; 2014
174
Construct R Square Average Variance Extracted Goodness of Fit
ERPI 0.763
ERPL 0.699
ERPP 0.761
ERPS 0.773
ERPT 0.671
EXC 0.758 0.878
EXI 0.860 0.811
EXP 0.832 0.704
HRM 0.774 0.696
Information and Analysis 0.848 0.758
Management Leadership 0.572 0.844
Customer 0.703 0.653
Financial 0.508 0.625
Internal Process 0.655 0.625
Learning and Growth 0.814 0.641
Service Design 0.811 0.826
Strategic Planning 0.700 0.751
Average 0.746 0.741 0.743
5. Discussion and Conclusion
The main purpose of this study is to examine the direct and indirect effect of ERP on organizational performance. Due to the inconsistency in the literature of the effect of ERP on organizational performance, two mediators’ variables have been proposed as mechanisms to explain this relationship in different context. These two variables are TQM and organizational excellence. As expected from the nature and the integration between variables, all hypotheses have been confirmed. In addition, in consistent with other previous studies, ERP has been found to have a positive and significant effect on organizational performance (β=0.579, t= 15.293, p<0.001) (Poston & Grabski, 2001; Park, Suh, & Yang, 2007). However, the effect of ERP on TQM and ERP on organizational excellence have not been linked before in the literature, it was found that they have positive and significant effect (β=0.841, t= 44.301, p<0.001) and (β=0.634, t= 15.337, p<0.001) respectively. In line with other previous studies, TQM was found to have a positive and significant effect at 0.001 level of significance (β=0.605, t= 12.973, p<0.001) (Chong & Rundun, 2004; Hassan & Kerr, 2003). Moreover, TQM was found to have positive and significant effect on organizational excellence (β=0.684, t= 14.422, p<0.001), and organizational excellence has positive and significant effect on organizational performance (β=0.825, t= 34.747, p<0.001).
The mediation role of TQM and organizational excellence also were examined. TQM was found to have a partial mediation effect with 58% influence of ERP on organizational performance at the 0.001 level of significance (β=0.199, t= 2.695, p<0.001). Similarly, organizational excellence with 81% influence of ERP on organizational performance, was found to have full mediation at the 0.001 level of significant (β=0.491, t= 12.332, p<0.001).
This study has many theoretical contributions. Besides examining the direct effect among variables due to the inconclusiveness finding in the previous literature, this study involves and examines new relationships between variables i.e. ERP-TQM and ERP-organizational excellence. In addition, this study fills the gap in the literature by examining the mediating effect of TQM and organizational excellence on the relationship between ERP and organizational performance. The results of this study will urge other researchers to investigate and examine other factors that may play some roles in these relationships. The framework of this study is a unique framework which suggested new relationships which never studied before.
In practice, the findings of this study have different practical implications. This study clears the way to managers and decision makers to involve TQM and excellence in their organizations while implementing ERP system. Due to the complexity of implementing ERP system, managers should think to have preliminary practice such as TQM to ease the ERP pre-implementation and post-implementation stages. Moreover, organizations face difficulties when implementing ERP system, therefore, other instruments needed to facilitate and pave the roads for successful implementation. Based on the conclusion of this study, managers should have some management practices in their organization such as TQM and excellence before thinking to implement ant ERP system. The reason behind that is to avoid the failure that may affect the entire organizations and may lead for collapsing.
www.ccsenet.org/ass Asian Social Science Vol. 10, No. 14; 2014
175
There are some limitations of this study. Similar to other previous research surveys, the data collected through self-reported which considered one of common method bias (Thornton, 2006). Cross-sectional as the research design of this study was used which considered another limitation. The biasness may also generate from the self-reported answers where the respondents translate their perceptions through the questionnaire. Therefore, future researches should include the mixed method design. In addition, longitudinal researches should be considered to test the effects of TQM, Excellence, and ERP on organizational performance in different point of times.
References
Abdinnour, S., & Groen, E. (2009). Quality, ERP, and Performance at Hawker Beechcraft. Production and Inventory Management Journal, 45(1), 21-30.
Abebe, M. (2014). Electronic commerce adoption, entrepreneurial orientation and small-and medium-sized enterprise (SME) performance. Journal of Small Business and Enterprise Development, 21(1), 100-116. http://dx.doi.org/10.1108/JSBED-10-2013-0145
Adebanjo, D. (2001). TQM and business excellence: Is there really a conflict? Measuring Business Excellence, 5(3), 37-40. http://dx.doi.org/10.1108/13683040110403961
Anderson, M., & Sohal, A. S. (1999). A study of the relationship between quality management practices and performance in small businesses. International Journal of Quality & Reliability Management, 16(9), 859-877. http://dx.doi.org/10.1108/02656719910289168
Antony, J. P., & Bhattacharyya, S. (2010). Measuring organizational performance and organizational excellence of SMEs-Part 2: An empirical study on SMEs in India. Measuring Business Excellence, 14(3), 42-52. http://dx.doi.org/10.1108/13683041011074209
Antony, J. P., & Bhattacharyya, S. (2010). Measuring organizational performance and organizational excellence of SMEs-Part 1: A conceptual framework. Measuring Business Excellence, 14(2), 3-11. http://dx.doi.org/10. 1108/13683041011047812
Arawati, A. (2005). The structural linkages between TQM, product quality performance, and business performance: Preliminary empirical study in electronics companies. Singapore Management Review, 27(1), 87-105.
Attafar, A., Forouzan, B., & Shojaei, M. (2012). Evaluation of Organizational Excellence Based on Peters and Waterman's Model in Tuka Steel Investment Holding. American Journal of Scientific Research, (50), 119-137.
Barker, T., & Frolick, M. N. (2003). ERP implementation failure: A case study. Information Systems Management, 20(4), 43-49. http://dx.doi.org/10.1201/1078/43647.20.4.20030901/77292.7
Bendoly, E., & Kaefer, F. (2004). Business Technology Complementarities: Impacts of the Presence and Strategic Timing of ERP on B2B E-commerce Technology Efficiencies. Omega, 32(5), 395-406. http://dx.doi.org/10.1016/j.omega.2004.02.004
Bhatt, G. D. (2000). An empirical examination of the effects of information systems integration on business process improvement. International Journal of Operations & Production Management, 20(11), 1331-1359. http://dx.doi.org/10.1108/01443570010348280
Botta-Genoulaz, V., & Millet, P. A. (2006). An investigation into the use of the ERP systems in the service sector. International Journal of Production Economics, 99, 202-221. http://dx.doi.org/10.1016/j.ijpe.2004.12.015
Brah, S. A., Tee, S. S. L., & Rao, B. M. (2002). Relationship between TQM and performance of Singapore companies. International Journal of Quality & Reliability Management, 19(4), 356-379. http://dx.doi.org/ 10.1108/02656710210421553
Brah, S. A., Wong, J. L., & Rao, B. M. (2000). TQM and business performance in the service sector: A Singapore study. International Journal of Operations & Production Management, 20(11), 1293-1312. http://dx.doi.org/10.1108/01443570010348262
da Silveira, G. J., Snider, B., & Balakrishnan, J. (2013). Compensation-based incentives, ERP and delivery performance Analysis from production and improvement perspectives. International Journal of Operation & Production Management, 33(4), 415-441. http://dx.doi.org/10.1108/01443571311307307
Davenport, H. T. (2002). Putting the Enterprise into the Enterprise System. Harvard Business Review, 9(3), l4.
Demirbag, M., Koh, S. C. L., Tatoglu, E., & Zaim, S. (2006). TQM and market orientation’s impact on SMEs’
www.ccsenet.org/ass Asian Social Science Vol. 10, No. 14; 2014
176
performance. Industrial Management & Data System, 106(8), 1206-1228. http://dx.doi.org/10.1108/ 02635570610710836
Dooyoung, S., Kalinowski, J. G., & El-Enein, G. (1998). Critical implementation issues in total quality management. SAM Advanced Management Journal, 63(1), 10-14.
Ehigie, B. O., & McAndrew, E. B. (2005). Innovation, diffusion, and adoption of total quality management (TQM). Management Decision, 43(6), 925-940. http://dx.doi.org/10.1108/00251740510603646
Everdingen, Y. V., Hillegersberg, J. V., & Waarts, E. (2000). ERP Adoption by European midsize companies. Communication of the ACM, 43(3), 27-31. http://dx.doi.org/10.1145/332051.332064
Fang, M., & Lin, F. (2006). Measuring the Performance of ERP System-from the Balanced Scorecard Perspectives. Journal of American Academy of Business, 10(1), 256-263.
Feng, J., Prajogo, D. I., Tan, K. C., & Sohal, A. S. (2006). The impact of TQM practices on performance: A comparative study between Australian and Singaporean organizations. European Journal of Innovation Management, 9(3), 269-278. http://dx.doi.org/10.1108/14601060610678149
Fotopoulos, C. V., & Psomas, E. L. (2010). The structural relationships between TQM factors and organizational performance. The TQM Journal, 22(5), 539-552. http://dx.doi.org/10.1108/17542731011072874
Gadenne, D., & Sharma, B. (2009). An investigation of the hard and soft quality management factors of Australian SMEs and their association with firm performance. International Journal of Quality & Reliability Management, 26(9), 865-880. http://dx.doi.org/10.1108/02656710910995064
Hackman, J., & Wageman, R. (1995). Total Quality Management: Empirical, conceptual, and practical issues. Administrative Science Quarterly, 40, 309-342. http://dx.doi.org/10.2307/2393640
Hair, J. F., Anderson, R. E., Tatham, R. L., & Black, W. C. (2010). Multivariate Data.
Hair, J. F., Hult, G. T., Ringle, C. M., & Sarstedt, M. (2014). A primer on partial least squares structural equation modeling (PLS-SEM). Sage.
Hasan, M., & Kerr, R. M. (2003). The relationship between total quality management practices and organizational performance in service organizations. The TQM Magazine, 15(4), 286-291. http://dx.doi.org/ 10.1108/09544780310486191
HassabElnaby, H. R., Hwang, W., & Vonderembse, M. A. (2012). The impact of ERP implementation on organizational capabilities and firm performance. Benchmarking, 19(4/5), 618-633. http://dx.doi.org/10.1 108/14635771211258043
Hayes, D. C., Hunton, J. E., & Reck, J. L. (2001). Market reaction to ERP implementation announcements. Journal of Information System, 15(1), 3-18. http://dx.doi.org/10.2308/jis.2001.15.1.3
Hendricks, K. B., & Singhal, V. R. (1997). Does implementing an effective TQM program actually improve operating performance empirical evidence from firms that have Won Quality Awards? Management Science, 43(9), 1258-1274. http://dx.doi.org/10.1287/mnsc.43.9.1258
Hitt, L. M., & Brynjolfsson, E. (1996). Productivity, business profitability, and consumer surplus: Three different measures of information technology value. MIS Q, 20(2), 121-142. http://dx.doi.org/10.2307/ 249475
Hwang, W., & Min, H. (2013). Assessing the impact of ERP on supplier performance. Industrial Management & Data Systems, 113(7), 1025-1047. http://dx.doi.org/10.1108/IMDS-01-2013-0035
Ionica, A., & Baleanu, V. (2010). TQM and business excellence. Annals of the University of Petroşani, Economics, 10(4), 125-134.
Jha, V. S., & Joshi, H. (2007). Relevance of Total Quality Management (TQM) or business Excellence Strategy Implementation for Enterprise Resource Planning (ERP)-A Conceptual Study.
Kang, S., Park, J. H., & Yang, H. D. (2008). ERP alignment for positive business performance : Evidence from Korea’s ERP market. Journal of Computer Information Systems, 25-38.
Kanji, G. (2002). Measuring Business Excellence. London: Routledge.
Kaplan, R. S., & Norton, D. P. (1992). The balanced scorecard ± measures that drive Performance. Harvard Business Review, 70-79.
Kaplan, R. S., & Norton, D. P. (2000). Having trouble with your strategy? Then map it. Harvard Business Review, 78(5), 167-176.

www.ccsenet.org/ass Asian Social Science Vol. 10, No. 14; 2014
177
Kerlinger, F. N., & Lee, H. B. (2000). Foundations of behavioral research (4th ed.). Harcourt College Publishers: Orlando, US.
Kumar, V., Maheshwari, B., & Kumar, U. (2002). Enterprise Resource Planning Systems Adoption Process: A Survey of Canadian Organizations. International Journal of Production Research, 40, 509-523. http://dx.doi. org/10.1080/00207540110092414
Laframboise, K. (2002). Business Performance and Enterprise Resource Planning. Proceedings of ECIS 2002 Conference, Gdansk, Poland.
Laframboise, K., & Reyes, F. (2005). Gaining competitive advantage from integrating enterprise resource planning and total quality management. Journal of Supply Chain Management, 41(3), 49-64. http://dx.doi. org/10.1111/j.1055-6001.2005.04103005.x
Lee, C. Y. (2004). TQM in small manufacturers: An exploratory study in China. International Journal of Quality & Reliability Management, 21(2), 175-197. http://dx.doi.org/10.1108/02656710410516970
Lee, P. M. (2002). Sustaining business excellence through a framework of best practices in TQM. The TQM Magazine, 14(3), 142-149. http://dx.doi.org/10.1108/09544780210425883
Lyons, K., Acsente, D., & Waesberghe, M. V. (2008). Integrating knowledge management and quality management to sustain knowledge enabled excellence in performance. The journal of information and knowledge management systems, 38(2), 241-253.
Manetti, J. (2001). How Technology Is Transforming Manufacturing. Production and Inventory Management Journal, 42(1), 54-64.
Marc, S. J., & Gyu, K. C. (2003). Implementing Enterprise Resource Planning systems with Total Quality Control and Business Process Reengineering. International Journal of Operations & Production Management, 23(4), 418-429. http://dx.doi.org/10.1108/01443570310467339
Markus, M. L., Axline, S., Petrie, D., & Tanis, C. (2000). Learning from adopters’ experiences with ERP: Problems encountered and success achieved. Journal of Information Technology, 15(4), 245-266. http://dx.doi.org/10.1080/02683960010008944
Masli, A., Richardson, V. J., Sanchez, J. M., & Smith, R. E. (2010). Return to IT excellence: Evidence from financial performance around information technology excellence awards. International Journal of Accounting Information System, 12, 189-205. http://dx.doi.org/10.1016/j.accinf.2010.10.001
Mele, C., & Colurcio, M. (2006). The evolving path of TQM: Towards business excellence and stakeholder value. International Journal of Quality & Reliability Management, 23(5), 464-489. http://dx.doi.org/10. 1108/02656710610664569
Moghadami, S. (2005). Mysteries of organizational excellence. Tadbir Monthly Magazine, 144.
Nor Hazilah, A. M. (2004). Quality management in the public sector: An empirical survey of the Ministry of Health Hospitals in Peninsular Malaysia. Unpublished PhD dissertation: Universiti Malay.
Oakland, J. S. (1995). Total Quality Management (Oxford: Butterworth-Heinemann).
Pacheco-Comer, A. A., & González-Castolo, J. C. (2012). An empirical study in selecting Enterprise Resource Planning Systems: The relation between some of the variables involve on it. Size and Investment, Procedia Technology, 3, 292-303. http://dx.doi.org/10.1016/j.protcy.2012.03.032
Park, J. H., Suh, H. J., & Yang, H. D. (2007). Perceived absorptive capacity of individual users in performance of Enterprise Resource Planning (ERP) usage: The case for Korean firms. Information & Management, 44(1), 300-312. http://dx.doi.org/10.1016/j.im.2007.02.001
Peffers, K., & Dos Santos, B. L. (1996). Performance effects of innovative IT applications over time. IEEE Trans Eng Manage, 43(4), 381-392. http://dx.doi.org/10.1109/17.543980
Pinar, M., & Girard, T. (2008). Investigating the Impact of Organizational Excellence and Leadership on Business Performance: An Exploratory Study of Turkish Firms. SAM Advanced Management Journal, 73(1), 29-45.
Poston, R., & Grabski, S. (2001). Financial impacts of enterprise resource planning implementations. International Journal of Accounting Systems, 2(4), 271-294. http://dx.doi.org/10.1016/S1467-0895(01) 00024-0
Prajogo, D. I., & Sohal, A. S. (2004). The multidimensionality of TQM practices in determining quality and innovation performance-an empirical examination. Technovation, 24(6), 443-453. http://dx.doi.org/10.1016/
www.ccsenet.org/ass Asian Social Science Vol. 10, No. 14; 2014
178
S0166-4972(02)00122-0
Rao, S. S. (2000). Enterprise resource planning: Business needs and technologies. Industrial Management & Data Systems, 100(2), 81-86. http://dx.doi.org/10.1108/02635570010286078
Rashid, K., & Aslam, H. (2012). Business excellence through total supply chain quality management. Asian Journal on Quality, 13(3), 309-324. http://dx.doi.org/10.1108/15982681211287829
Salaheldin, S. I. (2009). Critical success factors for TQM implementation and their impact on performance of SMEs. International Journal of Productivity and Performance Management, 58(3), 215-237. http://dx.doi. org/10.1108/17410400910938832
Shang, S., & Seddon, P. B. (2000). A Comprehensive framework for classifying the benefits of ERP systems. Proceedings of the Sixth Americas Conference on Information Systems, Long Beach, Ca, August 10-13.
Sharma, M., & Kodali, R. (2008). TQM implementation elements for manufacturing excellence. The TQM Magazine, 20(6), 599-621. http://dx.doi.org/10.1108/17542730810909365
Sila, I., & Ebrahimpour, M. (2002). An investigation of the total quality management survey based research published between 1989 and 2000: A literature review. International journal of Quality and Reliability Management, 19(7), 902-970.
Sohail, M. S., & Hoong, T. B. (2003). TQM practices and organizational performances of SMEs in Malaysia: Some empirical observations. Benchmarking, 10(1), 37-53. http://dx.doi.org/10.1108/14635770310457539
Sohal, A. S., & Terziovski, M. (2000). TQM in Australian manufacturing: Factors critical to success. International Journal of Quality & Reliability Management, 17(2), 158-167. http://dx.doi.org/10.1108/ 02656710010304564
Stratman, J. K., & Roth, A. V. (2002). Enterprise resource planning (ERP) competence constructs: Two-stage multi-item scale development and validation. Decision Sciences, 33(4), 601-628. http://dx.doi.org/10.1111/j. 1540-5915.2002.tb01658.x
Terziovski, M., & Samson, D. (1999). The link between total quality management practices and organizational performance. The International Journal of Quality & Reliability Management, 16(3), 226. http://dx.doi.org/ 10.1108/02656719910223728
Thornton, G. C. (2006). The relationship between supervisory and self-appraisals of executive performance. Personnel Psychology, 21(4), 441-455. http://dx.doi.org/10.1111/j.1744-6570.1968.tb02044.x
Uwizeyemungu, S., & Raymond, L. (2010). Linking the Effects of ERP to Organizational Performance: Development and Initial Validation of an Evaluation Method. Information Systems Management, 27(1), 25-41. http://dx.doi.org/10.1080/10580530903455122
Velcu, O. (2007). Exploring the effects of ERP systems on organizational performance: Evidence from Finnish companies. Industrial Management & Data Systems, 107(9), 1316-1334. http://dx.doi.org/10.1108/0263 5570710833983
Wang, H., & Yen, Y. (2012). An empirical exploration of corporate entrepreneurial orientation and performance in Taiwanese SMEs: A perspective of multidimensional construct. Total Quality Management, 23(9), 1035-1044. http://dx.doi.org/10.1080/14783363.2012.670917
Weill, P. (1992). The Relationship Between Investment in Information Technology and Firm Performance: A Study of the Valve Manufacturing Sector. Information Systems Research, 3(4), 307-333. http://dx.doi.org/ 10.1287/isre.3.4.307
Wier, B., Hunton, J., & HassabElnaby, H. R. (2007). Enterprise resource planning systems and non-financial performance incentives: The joint impact on corporate performance. International Journal of Accounting Information Systems, 8(3), 165-190. http://dx.doi.org/10.1016/j.accinf.2007.05.001.
Yasin, M. M., Kunt, J. A. M., & Zimmerer, T. W. (2004). TQM practices in service organizations: An exploratory study into the implementation, outcomes and effectiveness. Managing Service Quality, 14(5), 377-389. http://dx.doi.org/10.1108/09604520410557985.
Copyrights
Copyright for this article is retained by the author(s), with first publication rights granted to the journal.
This is an open-access article distributed under the terms and conditions of the Creative Commons Attribution license (http://creativecommons.org/licenses/by/3.0/).