A study of the beliefs for total quality management comparing ...
229
Retrospective eses and Dissertations Iowa State University Capstones, eses and Dissertations 1993 A study of the beliefs for total quality management comparing superintendents, board members, and classroom teachers in Iowa schools Michael David Teigland Iowa State University Follow this and additional works at: hps://lib.dr.iastate.edu/rtd Part of the Educational Administration and Supervision Commons is Dissertation is brought to you for free and open access by the Iowa State University Capstones, eses and Dissertations at Iowa State University Digital Repository. It has been accepted for inclusion in Retrospective eses and Dissertations by an authorized administrator of Iowa State University Digital Repository. For more information, please contact [email protected]. Recommended Citation Teigland, Michael David, "A study of the beliefs for total quality management comparing superintendents, board members, and classroom teachers in Iowa schools" (1993). Retrospective eses and Dissertations. 10193. hps://lib.dr.iastate.edu/rtd/10193
-
Upload
khangminh22 -
Category
Documents
-
view
0 -
download
0
Transcript of A study of the beliefs for total quality management comparing ...

Retrospective Theses and Dissertations Iowa State University Capstones, Theses andDissertations
1993
A study of the beliefs for total quality managementcomparing superintendents, board members, andclassroom teachers in Iowa schoolsMichael David TeiglandIowa State University
Follow this and additional works at: https://lib.dr.iastate.edu/rtd
Part of the Educational Administration and Supervision Commons
This Dissertation is brought to you for free and open access by the Iowa State University Capstones, Theses and Dissertations at Iowa State UniversityDigital Repository. It has been accepted for inclusion in Retrospective Theses and Dissertations by an authorized administrator of Iowa State UniversityDigital Repository. For more information, please contact [email protected].
Recommended CitationTeigland, Michael David, "A study of the beliefs for total quality management comparing superintendents, board members, andclassroom teachers in Iowa schools" (1993). Retrospective Theses and Dissertations. 10193.https://lib.dr.iastate.edu/rtd/10193
INFORMATION TO USERS
This manuscript has been reproduced from the microfilm master. UMI
films the text directly from the original or copy submitted. Thus, some
thesis and dissertation copies are in typewriter face, while others may
be from any type of computer printer.
The quality of this reproduction is dependent upon the quality of the
copy submitted. Broken or indistinct print, colored or poor quality
illustrations and photographs, print bleedthrough, substandard margins,
and improper alignment can adversely affect reproduction.
In the unlikely event that the author did not send UMI a complete
manuscript and there are missing pages, these will be noted. Also, if
unauthorized copyright material had to be removed, a note will indicate
the deletion.
Oversize materials (e.g., maps, drawings, charts) are reproduced by
sectioning the original, beginning at the upper left-hand corner and
continuing from left to right in equal sections with small overlaps. Each
original is also photographed in one exposure and is included in
reduced form at the back of the book.
Photographs included in the original manuscript have been reproduced
xerographically in this copy. Higher quality 6" x 9" black and white
photographic prints are available for any photographs or illustrations
appearing in this copy for an additional charge. Contact UMI directly
to order.
University Microfilms International A Bell & Howell Information Company
300 Nortti Zeeb Road. Ann Arbor Ml 48106-1346 USA 313/761-4700 800/521-0600

Order Number 9321218
A study of the beliefs for total quality management comparing superintendents, board members, and classroom teachers in Iowa schools
Teigland, Michael David, Ph.D.
Iowa State University, 1993
U M I 300N.ZeebRd. Ann Arbor, MI 48106


A study of the beliefs for total quality management
comparing superintendents, board members, and classroom teachers
A Dissertation Submitted to the
Graduate Faculty in Partial Fulfillment of the
Requirements for the Degree of
DOCTOR OF PHILOSOPHY
Department: Professional Studies in Education Major: Education (Educational Administration)
in Iowa schools
by
Michael David Teigland
Approved:
For the Education Major
Iowa State University Ames, Iowa
1993
Signature was redacted for privacy.
Signature was redacted for privacy.
Signature was redacted for privacy.
Signature was redacted for privacy.

ii
TABLE OF CONTENTS
Pape
CHAPTER I. INTRODUCTION 1
Statement of the Problem 3
Purpose of the Study 4
Basic Assumptions 6
Glossary 7
CHAPTER II. REVIEW OF LITERATURE 8
The Bureaucratic Model 8
The Beginnings of Change 10
Teacher Empowerment 13
School-Based Management 14
Past and Current Practices of School-Based Management 16
Benefits of School-Based Management 17
Limitations of School-Based Management 20
Preliminary Conclusions of School-Based Management 24
Strategic Planning 26
A Thrust for Total Quality Management in Education 30
Similarities between Total Quality Management and Education 34
The Beginning of Total Quality Management 37
Quality Circles in Japan 40
A Closer Look at Quality Circles 43
A Definition of Quality 51
An Overview of Total Quality Management 52
The Malcolm Baldridge Award 55
ill
Page
The Spokespersons of TQM 55
Key Components of Total Quality Management 58
Implementation Efforts in Business, Government, Service Industries, and Universities 66
Difficulties in Implementing Total Quality Management 71
Reasons for Successful Implementation in Total Quality Management 71
Comparisons of Traditional Management and Total Quality Management 73
Analytic and Enumerative Studies 74
Deming's Four Beliefs 75
The Theory Behind Deming's 14 Points of Management 76
Deming's 14 Points 77
Deming's Process Tools 85
Summary 87
CHAPTER III. METHODS 90
The Sample and Population Used in the Study 93
Administration of the Instrument 94
Analysis of the Data 94
CHAPTER IV. FINDINGS 96
Key Demographic Factors 96
Methods Used for Presenting Statistical Findings 99
Examination of the Data 100
Summary of Findings 137
iv
Page
CHAPTER V. SUMMARY, CONCLUSIONS, AND RECOMMENDATIONS 145
Summary 145
Conclusions 149
Discussion 150
Limitations 158
Recommendations for Practice 159
Recommendations for Further Research 160
BIBLIOGRAPHY 162
APPENDIX A. SURVEY OF EDUCATOR BELIEFS CONCERNING TOTAL QUALITY MANAGEMENT 187
APPENDIX B. LETTERS TO PANEL OF EXPERTS 193
APPENDIX C. SCHOOL DISTRICTS USED IN STUDY 200
APPENDIX D. DIRECTIONS TO SUPERINTENDENTS 203
APPENDIX E. DIRECTIONS TO TEACHER 205
APPENDIX F, DIRECTIONS TO BOARD MEMBER 207
APPENDIX G. FOLLOW-UP LETTER 209
APPENDIX H. FOURTEEN POINTS AND FORTY-TWO BELIEF STATEMENTS 211
Page
35
92
97
97
98
99
99
102
104
106
107
108
110
111
V
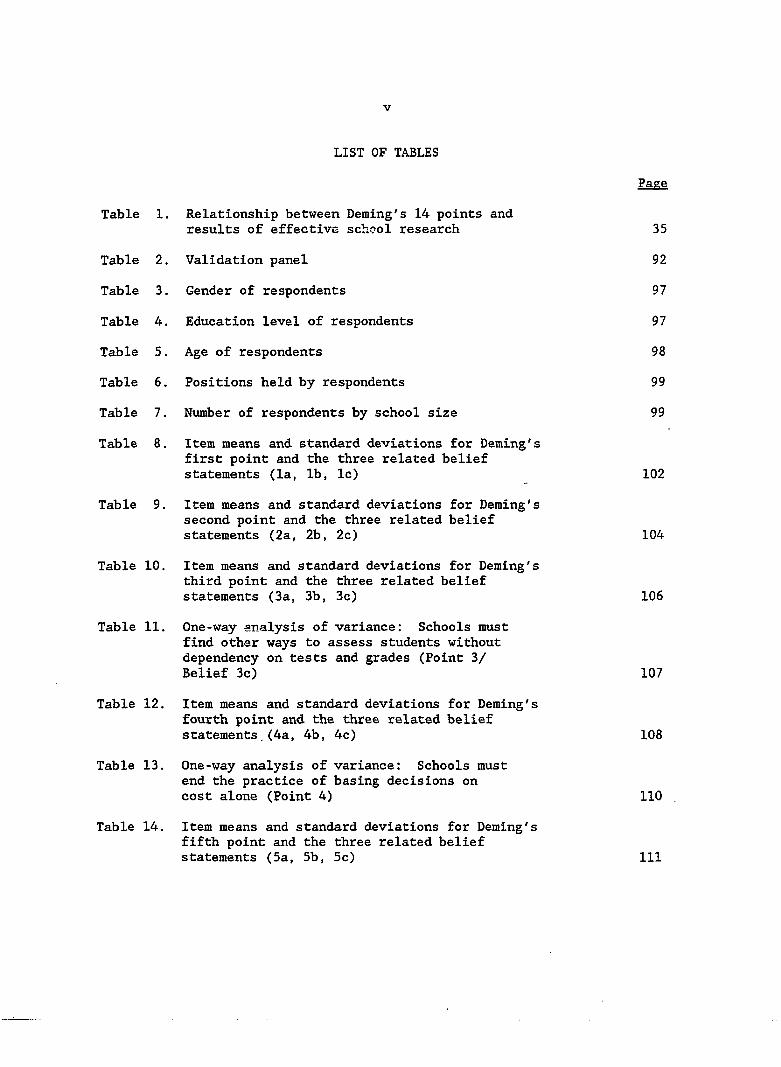
LIST OF TABLES
Relationship between Deming's 14 points and results of effective school research
Validation panel
Gender of respondents
Education level of respondents
Age of respondents
Positions held by respondents
Number of respondents by school size
Item means and standard deviations for Deming's first point and the three related belief statements (la, lb, Ic)
Item means and standard deviations for Deming's second point and the three related belief statements (2a, 2b, 2c)
Item means and standard deviations for Deming's third point and the three related belief statements (3a, 3b, 3c)
One-way analysis of variance: Schools must find other ways to assess students without dependency on tests and grades (Point 3/ Belief 3c)
Item means and standard deviations for Deming's fourth point and the three related belief statements.(4a, 4b, 4c)
One-way analysis of variance: Schools must end the practice of basing decisions on cost alone (Point 4)
Item means and standard deviations for Deming's fifth point and the three related belief statements (5a, 5b, 5c)

vi
Page
Table 15. One-way analysis of variance: Administrators and no one else are responsible for finding and correcting systematic problems (Point 5/ Belief la) 112
Table 16. Item means and standard deviations for Deming's sixth point and the three related belief statements (6a, 6b, 6c) 114
Table 17. One-way analysis of variance: School employees cannot perform well unless they know their jobs and feel free to inform administrators of problems they encounter (Point 6/Belief 6a) 115
Table 18. Item means and standard deviations for Deming's seventh point and the three related belief statements (7a, 7b, 7c) 116
Table 19. One-way analysis of variance: Evaluations need to be systematic, programmatic, and formative rather than individual, personal, and summative (Point 7/Belief 7c) 118
Table 20. Item means and standard deviations for Deming's eighth point and the three related belief statements (8a, 8b, 8c) 119
Table 21. One-way analysis of variance: Schools must create an atmosphere conducive to risk taking and experimentation without the fear of punishment for failure (Point 8/Belief 8c) 121
Table 22. Item means and standard deviations for Deming's ninth point and the three related belief statements (9a, 9b, 9c) 122
Table 23. Item means and standard deviations for Deming's tenth point and the three related belief statements (10a, 10b, lOc) 124
Table 24. One-way analysis of variance: Schools must eliminate posters and slogans that ask staff for new levels of productivity without providing new methods (Point 10) 126
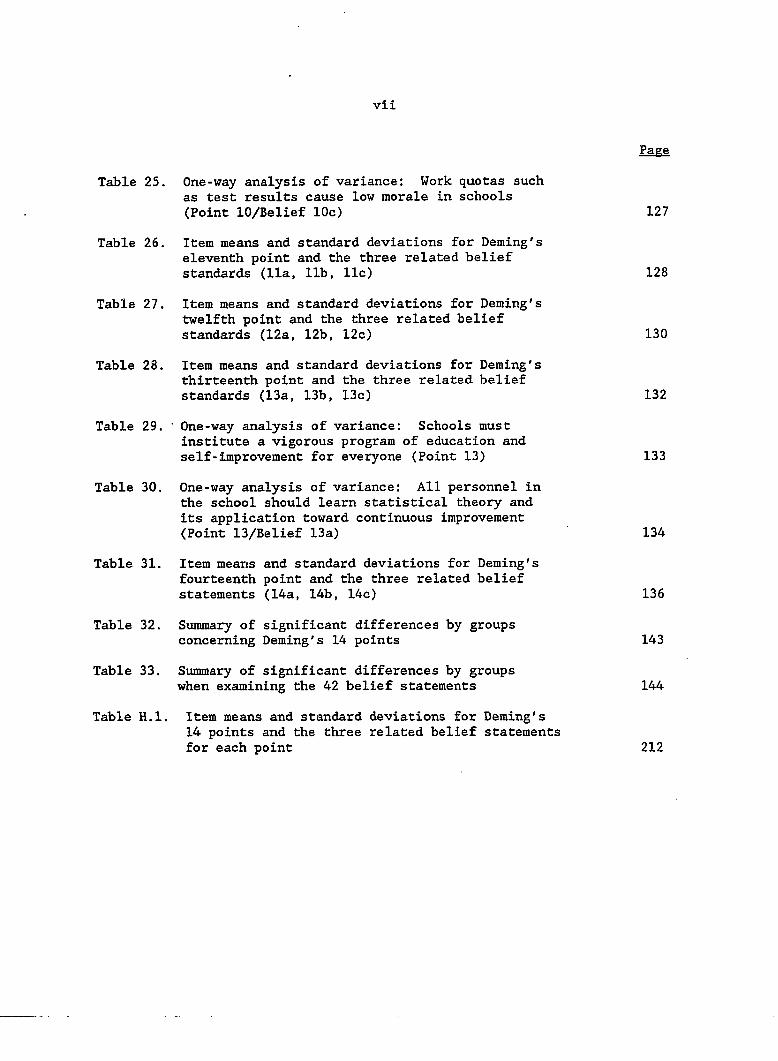
vii
Page
Table 25. One-way analysis of variance: Work quotas such as test results cause low morale in schools (Point 10/Belief 10c) 127
Table 26. Item means and standard deviations for Deming's eleventh point and the three related belief standards (11a, lib, 11c) 128
Table 27. Item means and standard deviations for Deming's twelfth point and the three related belief standards (12a, 12b, 12c) 130
Table 28. Item means and standard deviations for Deming's thirteenth point and the three related belief standards (13a, 13b, 13c) 132
Table 29. ' One-way analysis of variance: Schools must institute a vigorous program of education and self-improvement for everyone (Point 13) 133
Table 30. One-way analysis of variance: All personnel in the school should leam statistical theory and its application toward continuous improvement (Point 13/Belief 13a) 134
Table 31. Item means and standard deviations for Deming's fourteenth point and the three related belief statements (14a, 14b, 14c) 136
Table 32. Summary of significant differences by groups concerning Deming's 14 points 143
Table 33. Summary of significant differences by groups when examining the 42 belief statements 144
Table H.l. Item means and standard deviations for Deming's 14 points and the three related belief statements for each point 212
1
CHAPTER I. INTRODUCTION
The call for reform in our nation's schools over the past twenty
years has been varied and strong.
Few would deny that the 1980s has earned the distinction of being one
of the most active decades of educational reform in recent memory. The
"Nation at Risk Report" (1983) charged that the "educational foundations
of society are presently being eroded by a rising tide of mediocrity."
The early 1980s witnessed a groundswell of public and political energy and
enthusiasm for improving education that has yet to subside (Boyer, 1983;
Business-Higher Education Forum, 1983; Gardner, 1971; Goodlad, 1984;
Lightfoot, 1983; National Commission on Excellence in Education for
Economic Growth, 1983; Ravitch, 1984; Sizer, 1984; Twentieth Century Fund
Task Force on Federal Elementary and Secondary Policy, 1983) .
At all levels--local, state, and federal--the amount of sustained
activity and commitment to improving education has been almost
unprecedented. Additional funds have been allocated in support of
education; new policies and regulations have been developed and
instituted; school improvement initiatives have been designed and
implemented; curriculum has been reviewed and revised; standards for
students and faculty have been raised (Harvey & Crandell, 1988; Manatt &
Stow, 1986; Bush, 1991; Lezotte & Jacoby, 1990; Lepley, 1988; Branstad,
1991).
Consequently, in what might be considered a second wave of reform
reports, new concerns began to be voiced more loudly in 1986 and 1987
about the health of the educational enterprise. The Carnegie Forum on
Education and the Economy, the National Governors' Association, the Holmes
Group, and the National Commission on Excellence in Educational
Administration, among others, brought about another call for excellence in
education. However, there was a difference in the second wave of reform
efforts and recommendations. Many of the proposals of the more prominent
commissions and task forces of the first wave of reform represented little
more than a recommendation for more of the same--take schools as they are,
for better or worse, and treat their problems by adding more, e.g., more
time on task, more course requirements. As a result, fundamentals
regarding structure, organization, management, curriculum, instruction,
and so forth were seldom addressed (Banner, 1986; Sizer, 1990; Lezotte,
1991).
In a presentation at "School Year 2000: An International Seminar on
Creating Effective Schools of the Future," C. L. Hutchins (1987),
executive director of the Mid-Continent Regional Educational Laboratory,
stated that although "American education is better today than it was five,
ten, twenty-five, fifty years ago" and that public schools "reach more
students, provide more services, and produce a higher level than schools
of the past," the current structure of American schools is nevertheless
"not sufficiently powerful to meet the needs of students who will live and
work in the 21st century."
Since the second round of reform movements that occurred in the
second half of the 1980s, continuous reform is spreading across the
country. Kentucky's far-reaching Education Reform Act of 1990 has school
board members watching as that state embarks on what many describe as the
most radical state reform act in decades (Lueker, 1990).
Charged with overhauling the entire K-12 system of public education,
the Kentucky General Assembly in the spring of 1990 developed a landmark
school reform scheme. This plan, according to Lueker, mandates site-based
management, abolishes the existing state department of education, and
institutes an ambitious system of rewards and sanctions designed to hold
school accountable for their students' performance.
Similarly, the public schools in Chicago are decentralizing and
pushing a parent-driven site-based school governance. Passed by the
Illinois State Legislature in November 1988 and implemented in the summer
of 1989, the reform act is creating a new way of doing things for the
public schools in Chicago. School reform in Chicago significantly dilutes
the power of the central administration and school board and places
authority for hiring, planning curriculum, and budgeting with local school
councils, each made up of a majority of parents (Rist, 1990).
Statement of the Problem
Educators and businesses are becoming increasingly frustrated that
the education system is inflexible and cannot meet the demands of society
and the needs of students. Restructuring has become the byword in
education for a movement that questions whether the rules, standards, and
practices of today's schools can meet the high-stakes challenges of the
decades ahead. Changes in the family structure, shifting demographics,
and more demands placed on schools by society are placing greater pressure
on the education system.
The past experience of public schools has suggested that the
bureaucratic organizational structure employed by most schools does not
cultivate excellence in teaching and learning. Bureaucratic schools
operate through clear lines of authority with rules devised by superiors
to manage subordinates. Planning, decision-making, and evaluation of
school programs are often centralized. This centralization often tends to
impede change rather than facilitate it. The bureaucratic school seems to
be inadequate for promoting excellence and efficiency in education.
Moreover, changes in the structure of society and the nature of learning
have made it impossible for any one person to have all of the knowledge
and skills necessary to carry out the many complex tasks of leading and
managing a school.
Tremendous changes in the way schools do business will have to take
place in coming years for meaningful reform to occur. The leadership in
the public schools will also have to change. How will this happen? What
type of managerial style will bring about the most successful change?
Are educators in Iowa prepared to adopt the philosophical tenets
proposed by Edward Deming and the total quality management approach?
Purpose of the Study
Efforts to involve staff members in decision making, to increase
cooperation within schools, and to provide training and support systems
for educators are occurring in many forward-looking school districts in
Iowa and the nation. Some Iowa schools are exploring shared decision
making systems that put more responsibility at the building level with
staff members who work directly with students. Others are developing new
partnerships among schools and social service agencies to provide much-
needed services to children and families.
"We're at a critical moment because our entire system is becoming
unstuck," said W. P. (Pat) Dolan, who facilitated the recent ISEA
conference held February 21-22, 1991 in Des Moines. "We're beginning to
change the culture and decision-making process to allow for school-focused
leadership" (Dolan, 1991).
Under the theme, "Leadership for Productive Decision Making," the
conference was a follow-up to one held in September of 1990, where teams
of teachers, administrators, and school board members from 28 selected
districts gathered together in a first-in-the-nation pilot project
designed to help them examine their respective roles, relationships, and
responsibilities.
Dolan, a nationally recognized labor-management consultant from
Kansas City, contends that the way schools are currently structured is a
major block to what- is, and what can be, in classrooms.
At the heart of the problem, Dolan says, is that the current military
model--or organizational pyramid, as he calls it--doesn't allow for
improving both quality and productivity.
In addition, Dolan says that the top level management must be willing
to share information with those workers at the bottom so that they are
fully equipped to make decisions that impact them and the ultimate workers
in the pyramid--namely the students.
It appears that major school improvement is needed and in order for
it to happen, radical change will need to be involved.
Total quality leadership seems to be the most promising "radical
change. " TQM is an approach that focuses on giving top value to the
customer by building excellence into every aspect of the organization.
This is done by creating an environment that allows and encourages
everyone to contribute to the organization and by developing the skills
that will enable them to scientifically study and constantly improve every
process by which work is accomplished (Joiner, 1985; Jesperson, 1989;
Vansina, 1989; Atkinson, 1991; Butler, 1990; Johnson, 1991).
The primary purposes of this study are to:
1. Identify key components of total quality management for schools.
2. Assess the beliefs of teachers, superintendents, and school board
members toward adopting and utilizing the key components of total
quality management.
Basic Assumptions
The research design of this study is based on a number of assumptions
and observations. These basic assumptions and observations are based upon
the research conducted on school reform and the total quality management
system. The basic assumptions are :
7
1. A management style based upon the total quality management system
is one important variable of the total school improvement
movement.
2. Beliefs for quality management by school administrators, board
members, and classroom teachers can be measured.
3. Expectations for quality from schools is increasing.
4. Effective leadership is essential to quality improvement in
schools.
5. Achieving total quality in schools will involve organizational
change.
6. Persons completing the survey are knowledgeable about their
personal beliefs and current school practice.
7. Respondents will provide complete and accurate information.
Glossary
The following are operational definitions as used in this study:
1. Reform - to form again.
2. Restructuring - the manner of rebuilding, reconstructing, or
reorganizing.
3. School transformation - the act of changing the form, outward
appearance, condition, nature, or function of schools.
4. School improvement - a continuing process that enables a school
to become better and better.
5. Culture - the concepts, habits, skills, arts, instruments, and
institutions of a given people in a given period.
6. Paradigm - a mindset, pattern, example, or model.
8
CHAPTER II. REVIEW OF LITERATURE
A review of literature necessitates a survey of the history of
leadership and change in America's schools to properly understand the
context of attempted reform in the present and future age.
The Bureaucratic Model
By the beginning of the 20th century, the bureaucratic model of
supervision was well-entrenched in American education--perhaps with good
reason. The teaching force in the early part of this century was young,
transient, poorly paid, and for the most part only slightly better
educated than the students to be taught (Evenden, Gamble, & Blud, 1933;
Sherman, 1931).
Furthermore, teaching in America was originally a male occupation,
but several events in the last half of the 19th century changed that.
With the advent of the Industrial Revolution, males drifted into
manufacturing, trade, and business, where compensation promised to be
better than in education. The Civil War displaced many male teachers, who
were expected to go into the army. Women soon replaced them and economics
sealed this trend (Woody, 1928; Dawson, 1943). Because differentiated
salary schedules were universal, women were simply much cheaper to employ
than men (Atkinson & Maleska, 1965; Douglas, 1947).
Consequently, schools were left largely to women. Willard Elsbree
(1939) summed up the circumstance well when he wrote : "The removal of men
from the profession had its unfortunate results. The wages of females
were uniformly lower, and salary policies tended more and more to be
established in terms of the going rates for women, accounting, in part,
for the relatively low rate of compensation which has been accorded
members of the public-school teaching profession" (p. 207).
Moreover, women teachers were a transient group, withdrawing after a
few years of service to be married (Winship, 1932). This reduced their
political effectiveness, slowed up educational reforms, and impeded the
improvement of professional welfare (Elsbree, 1939; fielding, 1931).
Other evidence of the condition of the teaching force in the first
half of the 20th century came from early surveys conducted by the National
Education Association (NEA). In 1923 the NEA reported that 57 percent of
rural teachers had less than three years of experience and that 77 percent
had less than two years of training beyond elementary school (National
Education Association, 1923).
Similarly, a report from the U.S. Office of Education acknowledged
the transient nature of the work force in the public schools. The report
stated that "...the high rate of transiency among teachers in the public
school system in the past has been detrimental not only to educational
planning but unquestionably has been of significance in lowering the
professional status of teachers in the public mind" (Evenden, Gamble, &
Blud, 1933, p. 32).
In 1920 half of the classroom teachers in the United States had less
than four years of teaching experience. By 1940 that figure had increased
to approximately ten years of experience. A conclusion in a 1940 NEA
research bulletin stated, "Teaching has not yet become a life-career
10
service, but the tendency is definitely in that direction" (National
Education Association, 1940, p. 59).
Consequently, the administrative solution to this lack of stable,
career-oriented teachers was to create a system of bureaucratic control
with decision making and authority tested above the level of the classroom
(Kellog, 1940; Hronicek, 1981). No one planned or structured the system
for professional, career-motivated teachers. Indeed, efforts were
directed largely toward "teacher proofing" the schools. A great deal of
attention was paid to teacher's guides, specified courses of study, and
other "directive" controls (National Education Association, 1940). In
other words, until recent years, supervision was focused on the teacher.
It was largely a matter of evaluating personalities, determining
cleverness or lack of it in discipline, and checking on the details of
classroom procedure. Such supervision emphasized uniformity and demanded
strict adherence to detailed courses of study that had been designed to
include certain knowledge and common skills (Eginton, 1931; Kincaid,
1931). There were two fundamental criteria: Could the teacher control
the class? And were administrative edicts being strictly followed
(Atkinson & Maleska, 1965; Kellog, 1940)?
The Beginnings of Change
The building of a career-oriented teaching force was gaining
momentum. Several societal forces combined to stimulate this needed
change.

11
With the end of the World War II came the baby boom. The schools
soon needed an expanded supply of teachers. Large numbers of men came
home from the war motivated to seek an education and they were financed in
achieving their goal by the G.I, Bill. Supply and demand dovetailed well.
The number of men seeking employment as teachers increased steadily, and
this increasing proportion of men favored the growing career of teachers
(Atkinson & Maleska, 1965; Stokes, 1947; Walters, 1984).
Equally important was the growing career focus of the women who
sought teaching positions. The wartime society had sanctioned the idea
that married women could work outside the home. In 1923, 75 percent of
urban school districts refused to hire married women; rural districts were
even more conservative. This figure dropped to 58 percent of urban
districts in 1941 and to only 8 percent in 1951 (National Education
Association, 1952).
As teachers who viewed their teaching positions as careers increased,
so did frustration with the bureaucratic model of supervision that they
found embedded in the public school system (Atkinson & Maleska, 1965;
Stucker, 1985; Reavis, 1949; Hronicek, 1981).
Consequently, by the late 1950s discontent with the system and a
desire for professional status was manifesting itself throughout the
nation. According to Atkinson and Maleska, commentators on education
began using labels that are now regarded as cliches. Such phrases as
"angry young men," "teacher advocacy movement," and "old ladies in tennis
shoes" all conveyed the growing recognition that change was on its way.
12
As a result, it appears that no one should have underestimated the
sincerity and depth of feeling of the teaching force in postwar America.
Teachers truly wanted increased access to the means of building a better-
compensated career and of doing a better job in the classroom (Price,
1949; Hronicek, 1981; Stucker, 1985). Their objectives were both economic
and professional. The best means at hand for teachers to achieve these
ambitious goals were the processes of collective bargaining and political
action. By 1970 the "advocacy revolution" was in full swing, and the
drive for a new form of professionalism was under way (Hronicek, 1981;
Stucker, 1985; Walters, 1984).
The thrust for empowerment became an outright attack on the
unilateral decision making that was the foundation of the bureaucratic
model of supervision. At first the attack was broad in scope and included
not only matters of compensation but also professional, curricular, and
pedagogical concerns. According to Stucker and Walters, the institutional
forces struggling to preserve the status quo gave ground on the matters of
wages, hours, and conditions of employment as traditionally defined in
labor law. But they drew the line on broader issues, arguing that such
professional matters were not appropriate for the collective bargaining
table. While teachers were successful in achieving bilateral decision
making on some matters in some school districts, bureaucratic systems were
generally preserved (Hronicek, 1981).
Throughout the nation, strategies for school reform and restructuring
in the 1970s and 1980s have been as wide-ranging and diverse as the
settings in which they occurred. Two, however, appear consistently as
13
part of school reform plans--teacher empowerment and school-based
management (Classer, 1990; Lezotte, 1989; Lezotte & Jacoby, 1990; Hixson,
1990; Gllckman, 1990). Both have become the hallmarks of attempts to
improve the nation's public schools.
Teacher Empowerment
The calls for teacher empowerment are based on 1) a growing
frustration with the apparent inability of centralized "bureaucracies" to
significantly improve schools, and 2) a growing body of research from the
private and corporate sectors on the benefits of "employee involvement"
and decentralized decision making (Hixson, 1990; Cook, 1990; Duke &
Showers, 1980; Classer, 1990; Clickman, 1990; Lezotte, 1991).
Calls for empowerment of teachers often derive from four premises or
assumptions :
1. Increasing the professional roles and responsibilities of
teachers requires that they become more directly involved in
issues affecting the overall status of the profession, such as
certification, selection, preservice and inservice training, and
evaluation.
2. Centralized decisions about classroom practices deprive teachers
of the opportunity to make professional judgments about what
strategies will work.
3. Decisions about what should happen in classrooms on a daily basis
should be made by those who will be responsible for
implementation and accountability.
14
4. Instructional and curricular decisions can best be made by those
who are most knowledgeable about the students they will affect
(Clune & White, 1988; Lezotte, 1991; Lezotte & Jacoby, 1990;
Glickman, 1990).
Proponents of increased teacher empowerment argue that allowing
teachers to exercise professional judgment, discretion, and autonomy in
making decisions (about curriculum, instruction, and classroom management)
will result in: 1) better and more appropriate decisions; 2) increased
commitment and enhanced teacher performance; 3) increased willingness of
teachers to assume responsibility for instructional results ; and most
importantly, 4) improved student achievement (Hixson, 1990; Lezotte, 1991;
Tucker & Mandel, 1986; Glickman, 1990; Lezotte and Jacoby, 1990).
School-Based Management
School improvement based on the Effective Schools Research (ESR)
represents a struggle that has now spanned nearly twenty years (Lezotte,
1990). The struggle of this vision of school improvement, according to
Lezotte, has successfully overcome numerous barriers and has demonstrated,
with accelerating frequency, that schools can successfully teach all of
the children whose schooling is of interest to educators.
An outgrowth of the effective schools movement has been increased
interest in school-based management. This movement is also referred to as
site-based management, building-based management, and school-centered
decision making (Clune & White, 1988; Casner-Lotto, 1988; Lezotte, 1991;
Lezotte & Jacoby, 1991; Hixson, 1990). With the increasing view that the
15
school is the fundamental unit of change, many building level
administrators are clamoring to increase decision-making responsibility at
the school level (Casner-Lotto, 1988; Duke, Showers, & Imber, 1980;
Hixson, 1990; Sickler, 1988). Collaboration and staff empowerment must
increase if building level staff are going to become meaningfully involved
in the planning, problem solving, and evaluation of their schools'
programs. By doing this, decision making will be more decentralized as
the individual school is recognized as the production center of public
education and, therefore, the strategic unit for planned change (Lezotte,
1991; Sizer, 1990; Classer, 1990; Nardini & Mandel, 1986; Lezotte &
Jacoby, 1990).
School-based management has become an important issue in educational
policy. School-based management (SBM) refers to a program or philosophy
adopted by schools or school districts to improve education by increasing
the autonomy of the school staff to make school site decisions (White,
1988; Duke, Showers, & Imber, 1980; Decker, 1977).
However, much ambiguity surrounds the notion of SBM. Researchers,
practitioners, and policy makers interpret SBM differently, and there are
numerous variations within districts and schools regarding the levels of
authority, the actors involved, and the areas of control (Casner-Lotto,
1988; Lueker, 1990; Nardini & Mandel, 1986; Sickler, 1988; Rist, 1990).
While decentralization is a broad concept that refers to the
delegation of decision-making authority to subunits, SBM is a system of
decentralization in which authority over school policy is shared by the
16
central office and the school site (David, Purkey, & White, 1988; White,
1988).
Nevertheless, the impetus for SBM may come from superintendents,
school boards, or school personnel. While it was most common for SBM
districts to allocate greater decision-making authority to principals,
school districts have also initiated SBM programs or incorporated SBM
philosophies that emphasize increased authority of teachers, students,
parents, and community members (Clune & White, 1988; Pierce, 1980; Lueker,
1990; Rist, 1990).
Past and Current Practices of School-Based Management
School-based management is not a new idea. Several movements were
initiated in the 1960s and 1970s. For example. New York City began a
city-wide decentralization program in 1967, and Detroit adopted a
decentralization plan in 1970 (Fantini & Gettell, 1973).
Although strategies for teacher empowerment have often been linked to
various forms of school-based management, there are also several types of
"empowerment" initiatives that vary a great deal in how they function.
For example, New York City's 1985 school improvement plan has focused
on community participation in school decision making; the ABC School
District in Cerritos, California, initiated a plan in 1976 that focuses on
teacher empowerment. Since 1985 schools in Hammond, Indiana, have
implemented a school improvement program that includes the active
involvement of teachers, students, parents, and other community members
(Casner-Lotto, 1988; Kelly, 1988; Sickler, 1988).
17
Another form of SBM that several school districts in Iowa are
exploring is called vertical leader teams. There appears to be several
benefits:
1. Vertical leader teams improve communication between parents,
teachers, administrators, and school board members.
2. Vertical leader teams enable the vision for the district to
become the shared vision for everyone.
3. Vertical leader teams establish the communication link between
the central office and the individual buildings which helps to
provide common direction on a daily basis (Newsome & McCormick,
1992).
How widespread is SBM? In California alone more than sixty districts
were managed in the early seventies under a philosophy of shared decision
making or have incorporated SBM programs (Decker et al., 1977). There is
no exact figure, however, the 1980s have seen many school districts across
the country experimenting and becoming more involved with some form of
school-based management (Clune & White, 1988; Rosenholtz, 1987; Sickler,
1988).
Benefits of School-Based Management
What has been learned from these various experiences? Some of the
beneficial outcomes for empowering teachers follow (White, 1988; Lezotte,
1991; Lezotte & Jacoby, 1989; Glickman, 1990).
1. Encourage making decisions more carefully and appropriately
matched to student needs.
18
2. Minimize "surprise" changes in programs, goals, and fiscal
allocations.
3. Increase feelings of professionalism among staff.
4. Increase interest, ownership, commitment, and excitement about
the school and/or program.
5. Encourage reexamination of current programs and strategies and
developments of new innovative approaches.
6. Shorten time lines for decision making and program
implementation.
7. Increase faculty interest in their own professional growth and
development.
8. Improve the level of community and parent support and involvement
in the school.
9. Improve collaboration among faculty and encourage better
utilization of faculty experience and expertise.
10. Enhance accountability for improved student performance.
Furthermore, school-based management appears to give greater
flexibility, increased participation of school staff in school decisions,
and the ability to provide more appropriate services to meet the specific
needs of students (Lezotte & Jacoby, 1990; Nardini & Mandel, 1986; Prasch,
1984; Dolan, 1992). There is some evidence that SBM is related to student
achievement. School effectiveness literature supports the need for school
personnel to play an important role in school decision making to increase
the academic performance of students (Purkey & Smith, 1983).
19
Levin (1988) suggests that school site decision making is related to
student learning and achievement. However, the direct relationship is not
clear. According to Levin, it is difficult to draw a cause and effect
relationship between SBM and student achievement since any impact of SBM
is complicated by other trends at the school site, or local, state, and
national level.
In addition to improved learning and academic achievement, there are
other benefits of SBM. Increased authority at the school site may improve
self-esteem, morale, and efficiency of school personnel. The greater
standardization of schooling, centralization, and top-down controls
throughout the 1980s have added to declining morale of school personnel
(Duke, Showers, & Imber, 1980; Pierce, 1980). Increased discretion over
decision making provides incentives for school staff to be more efficient.
Rosenholtz (1987) has suggested that autonomy enhances performance.
Jobs that give people autonomy and discretion require that they exercise
judgment and choice; in doing so, they become aware of themselves as
causal agents in their own performance. Loss of the capacity to control
the terms of work or to determine what work is to be done, how the work is
to be done, or what its aim is to be, widens the gap between the knowledge
of one's unique contributions to work and any performance efficacy that
can be derived from it (p. 540).
School-based management improves communication among school staff and
the community (Nebgen, 1991; Newsome & McCormick, 1992). Participation in
school budget, curriculum, and staffing decisions gives school personnel
the opportunity collectively to develop ideas about what is important to
20
emphasize in teaching (Sickler, 1988; Rist, 1990). According to Little
(1981) , the most successful schools appear to be those where school staff
members frequently exchange ideas about teaching. SBM opens up
communication between parents, teachers, and students, and improves
educational services by giving them a larger voice in educational
decisions.
Furthermore, increased authority at the school site may help to
attract and retain quality staff. Poor teacher working conditions,
including low status and low pay, have made it increasingly difficult to
attract bright students to the teaching profession (McNeil, 1987; Nyberg &
Farber, 1986). By providing increased discretion and autonomy of
objectives to teachers, the role of the teacher may gain increased respect
and raise teachers' interest and motivation in teaching.
Limitations of School-Based Management
Many problems may arise in implementing school-based management. It
may create confusion in roles and responsibilities. It may be difficult
for teachers, administrators, parents, and students to adapt to new roles,
and they may become frustrated if they do not know what is expected of
them (Decker et al., 1977; Glickman, 1990). Principals may not know which
decisions must be made in consultation with teachers and which they should
make on their own.
Cook (1990) states that local school boards of education have
traditionally been concerned that SBM undermines the authority of elected
officials of public schools. According to Cook, local boards are not just
21
interested in effective schools. They are responsible for effective
school systems. Consequently, board members often fear that accepting SBM
means abdicating legal responsibility for the entire system.
According to Lezotte (1991), school-based management may become a
power struggle among administrators, teachers, parents, and students.
Contradictions may arise among central administrators who endorse the
philosophy of SBM but find it difficult to allocate decision-making
authority to principals. Principals may want more control over their own
destiny but are resistant to change. Teachers, parents, and students may
want greater ownership over objectives but do not have the time to spend
away from the classroom, their jobs, their family, or their hobbies to
develop curricula, make budget recommendations, or interview personnel.
SBM encourages administrators, parents, and school staff to work
together on school policy issues. According to Lezotte, however, it is
not necessarily a case of these individuals struggling collectively to
obtain great authority. For example, teachers may fear that greater
parental authority will interfere with their own power, goals, and
objectives.
As a result, many authors speak of the problems in reaching a balance
between centralization and decentralization (Brooke, 1984; Decker et al.,
1977; Glickman, 1990). It is neither practical nor feasible for a
district to develop a fully centralized or decentralized system of school
management. There is a tension between providing too much freedom for
school staff and risking confusion and inconsistency, and the problem of
22
allowing too little freedom and facing a staff that feels restrained or
inefficient (Rosenholtz, 1987; Glickman, 1990).
According to Beaubier and Thayer (1973), "As contrary as it may seem,
it is absolutely essential to centralize some aspects of a district's
operations for successful decentralization of the operating unit" (p. 20).
Problems in implementing SBM may arise from the structure of school
organization and the nesting of individual schools with a series of larger
organizations, such as conflicting state mandates, standardized curricula,
and budget and personnel constraints at the district and state level
(Duke, Showers, & Imber, 1980; Prasch, 1984; Glickman, 1990).
Consequently, increased involvement of school staff and community
members in school policy decisions may conflict with state mandates
prescribing curriculum form and content (Darling-Hammond & Berry, 1988).
For example, Florida has imposed legislative action regarding curriculum
standardization and some districts with SBM programs have requested
special status to diverge from state requirements (National School Boards
Association, 1988).
SBM may increase the authority of school personnel regarding budget
issues. Decisions regarding instructional salaries, the number of
teachers, and instructional materials and equipment will be limited by the
amount of resources available (Gideonse, Holm, & Westheimer, 1981). In
addition, hiring decisions will be limited by enrollment trends, district
agreements with teacher unions, and state teacher-student ratio
requirements (Johnson, 1984).
23
School-based management raises potential conflicts in collective
bargaining issues. By allocating administrative responsibilities to
teachers and engaging school staff in decisions that might normally be a
management right in union contracts (Glickman, 1990). As Johnson (1984)
suggests, collective bargaining often results in standardization of
procedures. SBM, on the other hand, often leads to diversity and
differentiation in procedures from school to school. While teachers'
unions have traditionally emphasized material incentives such as pay
raises and benefits, SBM emphasizes ownership over objectives such as what
is taught and what materials are used.
Nevertheless, SBM advocates do not believe SBM runs counter to union
strategies. In most instances, teachers' unions have not served as
obstacles to the implementation of SBM. In school districts such as Dade
County, Florida, and Hammond, Indiana, the unions have worked
cooperatively with the district to obtain SBM (National School Boards
Association, 1988). In districts where union leaders have played an
important role in the initiation and implementation of SBM, the unions
believe that SBM offers a method to move beyond traditional collective
bargaining strategies and to acquire the status and autonomy desired by
teachers (Casner-Lotto, 1988; David, Purkey, & White, 1988; McDonnell &
Pascal, 1988).
Glickman (1990) suggests some additional considerations that should
be taken into account in the planning and implementation of any
"empowerment" effort. Among Glickman's "ironies" of empowerment are the
following:
24
1. The more an empowered school improves, the more apparent it is
that there's more to be improved.
2. The more an empowered school is recognized for its success, the
more non-empowered schools criticize it.
3. The more an empowered school works collectively, the more
individual differences and tensions among staff members become
obvious.
4. The more an empowered school becomes a model of success, the less
the school becomes a practical model to be imitated by other
schools.
Finally, there is a limit to what SBM can do. Although many policy
makers advocate the decentralization of authority at the school site, most
supporters recognize that SBM alone will not solve all school problems
such as low teacher salaries, poorly trained teachers, discipline
problems, or societal tensions. Researchers argue that major changes in
school effectiveness cannot occur unless educational reforms move beyond a
narrow focus on the schools (Canoy & Levin, 1976).
Preliminary Conclusions of School-Based Management
As schools and districts explore the potential of increased teacher
empowerment and autonomy or school-based management as vehicles for school
reform, restructuring, and improvement, research by Hixson (1990) and
Clune and White (1988) suggests six basic areas that should receive more
attention and consideration than has typically been the case:
25
1. Improved delineation and coordination of rules, roles, and
responsibilities within the schools, between the school and
central office, and between the school/central office and state
departments of education.
2. Massive increases and improvement in the quantity and quality of
training and support.
3. New systems, strategies, and standards for accountability.
4. Redefining contractual relationships and provisions between
teachers and school systems.
5. Increased attention to process as well as outcomes.
6. Changes in the preservice preparation of both teachers and
administrators.
In addition, Clune and White suggest that school staff must be aware
of the various challenges, "ironies," and contradictions they will likely
encounter along the path toward empowerment, and make provisions to avoid
or account for them from the beginning of the process.
It appears that strategies for empowering teachers and moving
decision-making authority to the local school level provide important
vehicles for improving and ultimately restructuring public schools. Both
strategies may well be necessary, but they are not, in and of themselves,
sufficient to solve the complex problems faced by the schools, their
students, and the communities which they serve. Nevertheless, increasing
the opportunities for teachers and local schools to serve a more central
role in restructuring efforts appears to be a significant first step in
the right direction.
26
Strategic Planning
Along with school-based management, strategic planning is another
form of managing schools that has become quite popular in America's
schools.
Strategic planning has had a long history. Its origins are military
and it has been used by generals to help formulate battles for hundreds,
perhaps thousands, of years (Quinn, 1980). Around the turn of the 20th
century, its value for international policy was recognized and strategic
planning became a commonly used geopolitical decision-making tool (Mahan,
1890; Makinder, 1919). It was adopted as a corporate planning process in
the mid-20th century and introduced to the public, not-for-profit sector
shortly thereafter (VonNeuman & Morgenstern, 1947; Wilkinson 1986).
Educators began using strategic planning in the early 1970s (Cope, 1981;
Schendel & Hatten, 1972). Today strategic planning is the dominant
management planning paradigm in North America (Hurst, 1986; Cook, 1988,
1990; Herman & Kaufman, 1991; McCune, 1986).
One of America's leading experts in the past on strategic planning,
George Steinre (1979), says there is no clear consensus among those
writing about the topic. However, he and others (Herman & Kaufman, 1991;
Brandt, 1991; Meca & Adams, 1991; Cook 1992; McCune, 1986; Bennis & Nanus,
1985) have described several themes underlying strategic planning. These
themes represent the key principles and beliefs upon which this planning
process is based:
27
1. People can influence the future. Strategic planners believe that
what is done today can help shape what happens tomorrow, next
year, and even the next decade.
2. Today's trends can help people anticipate the future. Strategic
planners believe that many current events presage future events.
By "reading" the trends shown in these current events and
extrapolating from them, people can describe a limited number of
probable alternative future scenarios—outline descriptions of
what will happen in years to come.
3. Today's decisions can help people realize the future scenario
that is best for them. Strategic planners believe that with a
series of systematically arrived at decisions and plans, people
can exploit opportunities, avoid pitfalls, and bring about a
desired future.
In education, strategic planning has not been well defined. School
administrators talk about strategic planning, but there is a distressing
overabundance of ideas about what strategic planning really is (Cook,
1988). Nevertheless, there is sufficient similarity among definitions to
permit a rough draft of classification. A sampling of some representative
definitions of strategic planning include the following:
1. Strategic planning is "a process consisting of an examination of
the current environmental circumstances; the establishment of a
statement of purpose or mission with related time-frame goals;
supporting operational objectives and specific plans to carry out
these objectives; and resource analysis" (Spikes, 1985, pp. 3-4).

28
Strategic planning is "a process for organizational renewal and
transformation which provides a framework for improvement and
restructuring of programs, management, collaborations, and
evaluation of the organization's progress" (McCune, 1986, p. 34).
Strategic planning is "a process designed to move an educational
organization through the steps of understanding changes in the
external environment, assessing organizational strengths and
weaknesses, developing a vision of a desired future and ways to
achieve that mission, developing and implementing specific plans,
and motivating that implementation so that necessary changes can
be made" (Brown & Marshall, 1987, p. 1).
Strategic planning is "the means by which an organization
constantly recreates itself to achieve common purpose (Cook,
1990).
Strategic planning can express a clear vision of the future for a
school district, as reflected in every facet of school
operations. Strategic planning helps school employees, students,
and the community rally around the vision and set goals to
achieve it. It creates a system to monitor the district's
progress toward that vision--and to renew daily and yearly plans
to achieve the strategic goals and objectives. It holds people
accountable and judges progress on the basis of results. It
gives school employees, students, and community members a greater
knowledge and sense of ownership of their school system. It
allows the school board and administration to identify, justify,
29
and integrate the needs to the school organization with the needs
of society (Herman & Kaufman, 1991).
While these definitions differ slightly, they identify three
essential elements of strategic planning: 1) an orientation toward the
future, 2) a vision or mission, and 3) widespread participation of faculty
and community members in the planning process (Spikes, 1985; McCune, 1986;
Brown & Marshall, 1987; Cook, 1991; Herman & Kaufman, 1991; Mecca & Adams;
Blum & Kneidek; Below & Morrisey, 1987; Brandt, 1991).
Strategic planning within a school district does not eliminate the
need for traditional planning activities. Rather, it provides the
framework or superordinate set (a mission and strategic goals) to guide
other planning, decision making, and management (McCune, 1986; pp. 35-36).
Strategic planning assumes an open system whereby organizations must
constantly change as the needs of the larger society change (Boulton &
Lindsay, 1982; Bennis & Nanus, 1985; Cook, 1990). It focuses on the
process of planning, building a vision, internal and external
environmental scanning, and faculty and community development (Cook, 1992;
Herman & Kaufman, 1991). Strategic planning is done by a small group of
planners with widespread involvement of stakeholders. It uses current and
projected trends to make current decisions (Wooley & Croteau, 1991; Mecca
& Adams, 1991; Bennis & Nanus, 1985; McCune, 1986). Strategic planning
emphasizes changes outside the organization, organizational values, and
proactive action (Boulton & Lindsay, 1982; Below & Morrisey, 1987; Cook,
1990; Herman & Kaufman, 1991). Strategic planners ask what decision is
appropriate now based on an understanding of the situation five years from
30
now. Finally, strategic planning depends upon intuitive and creative
decision making as to how to guide the organization over time in a dynamic
environment, and an organization-wide process that anticipates the future,
makes decisions, and behaves according to an agreed-upon vision (Herman &
Kaufman, 1991; Cook, 1988; Blum & Kniedek, 1991; Below & Morrisey, 1987;
Cook, 1992; Nebgen, 1991; McCune, 1986).
A Thrust for Total Quality Management in Education
Education has been at the forefront of the national agenda for over a
decade; public dissatisfaction with the American educational system is
continually more apparent. Therefore, it seems natural to inquire as to
whether that educational system should follow the lead of the private
sector in pursuing total quality management.
Since the early 1980s, after seeing the impressive industrial
successes of the Japanese, American business, government, and service
organizations have begun to embrace the concepts of total quality
management (Geber, 1990; Bernard, 1991; Sensenbrenner, 1991; Burstein &
Sedlak, 1988; Tribus, 1991; Therrien, 1991; Peterson, Kelly, Weber, and
Gross, 1991; Woodruff & Levine, 1991; Armstrong & Symonds, 1991;
Armstrong, 1991; Siler & Garland, 1991). By redirecting their focus to
serve the needs of their "customers," and through processes aimed at
"getting it right the first time," they too are experiencing success.
Now, school leaders and reformers have begun to look to the
principles of total quality management to help transform schools and the
American education system so that both their processes and their results
31
reflect the goals that are being held for them (Rhodes, 1990; Stampen,
1987; Classer, 1990; Moen, 1991; Melvin, 1991; Meaney, 1991; Tribus, 1991;
Houlihan, 1991; Mcleod, 1991; Leonard, 1991; Glaub, 1991).
It seems to be essential to determine whether organizations as
distinct as private corporations and public schools may benefit from
similar management philosophies. As Lois and Miles (1990) caution, "There
are many books in the business management literature focusing on leading
and managing change. But many of them advise strategies based on an image
of organizations that does not fit well with the reality of life in
schools" (p. 13).
Is it possible then to determine what the essential characteristics,
philosophies, and practices are in TQM and affirm that they are
potentially desirable for the administration of America's public schools?
An important question to ask appears to be, "What characteristics of
the corporate culture suggest that TQM might be an appropriate management
approach?" Scott (1989) cites the failure of organizations to cooperate
and neglect of human resources as being prime causes of lack of quality
and lack of success in private organizations. Furthermore, he cites
outmoded strategies grounded in mass production and inward focused
marketing, a near-sighted economic outlook centered on short-term profits,
a weakness in the technology of production, emphasis on elegant, high
technology designs at the expense of a quality first focus, and strained
relations and mistrust between industry and government as characteristics
that might lead private sector organizations to consider the
implementation of TQM. Drucker (1980) describes the major barriers to
32
corporate productivity as a lack of clear performance targets, trying to
do too many things at once, lack of experimental attitude, lack of
evaluation, and a reluctance to abandon less-productive programs.
In his examination of public sector organizations, Milakovich (1991)
cites the attempt to balance multiple, vague, conflicting goals of diverse
interest groups, a focus on short-term political rewards, and the
inability to control and define markets as being key factors that lead
these organizations to failure and make them prime candidates for the
implementation of TQM. If, indeed, these factors of organizational
culture were instrumental in leading other public and private sector
organizations to embrace TQM, the question remains as to the comparability
of the public school culture.
Studies of the public school culture, e.g., Boyer (1983), Goodlad
(1984), Lightfoot (1983), Powell, Cohen, and Farrar (1984), and Sizer
(1984), suggest that public schools suffer from remarkably similar
conditions to those noted by Scott, Drucker, Milakovich, and others. The
most common characteristics of the school culture seem to be the isolation
of teachers, the lack of clearly defined goals, and the continuing failure
of schools to measure the quality of their products to these goals.
Although much reform and restructuring efforts have taken place
during the past decade, the culture of the American school still remains
much the same. Support for this is found in Glickman's (1990) description
of the legacy of the one-room schoolhouse. He describes teachers as
isolated and individualistic, often incapable of working collaboratively.
He characterizes the school environment as an incessant stream of
33
psychological encounters, generally mediated by resorting to routines,
which in themselves are typically imposed by administrators. He notes
that after the intense challenge teachers face in their initial year,
there is little mobility or job enhancement available. Teachers seldom
discuss instruction or key issues with their peers, nor are they involved
in key issues with their peers, nor are they involved in key decisions
affecting the school.
Fullan (1991) supports this characterization of isolation, finding
that 91 percent of teachers would choose to use additional time (if
available) on tasks which they typically perform alone (p. 121). In his
massive qualitative study of schooling, Goodlad (1984) found precisely the
same quality of isolation to be prevalent. Louis and Miles (1990)
conclude that this pattern results in teachers struggling privately with
their anxieties and problems, thus failing to develop a common technical
culture.
The critical issue of the lack of congruent goals was also a key
finding of Goodlad's (1982) study, which found that the greatest predictor
of school success was goal congruence among teachers, administrators,
students, and parents. Leithwood (1990) supports this finding, concluding
that goals are "the glue that holds together the myriad decisions of
highly effective principals" (p. 85). Both studies recognized the general
lack of such clear, congruent goals in American public education.
34
Similarities between Total Quality Management and Education
Former studies that compared the ideas of W. Edwards Deming to the
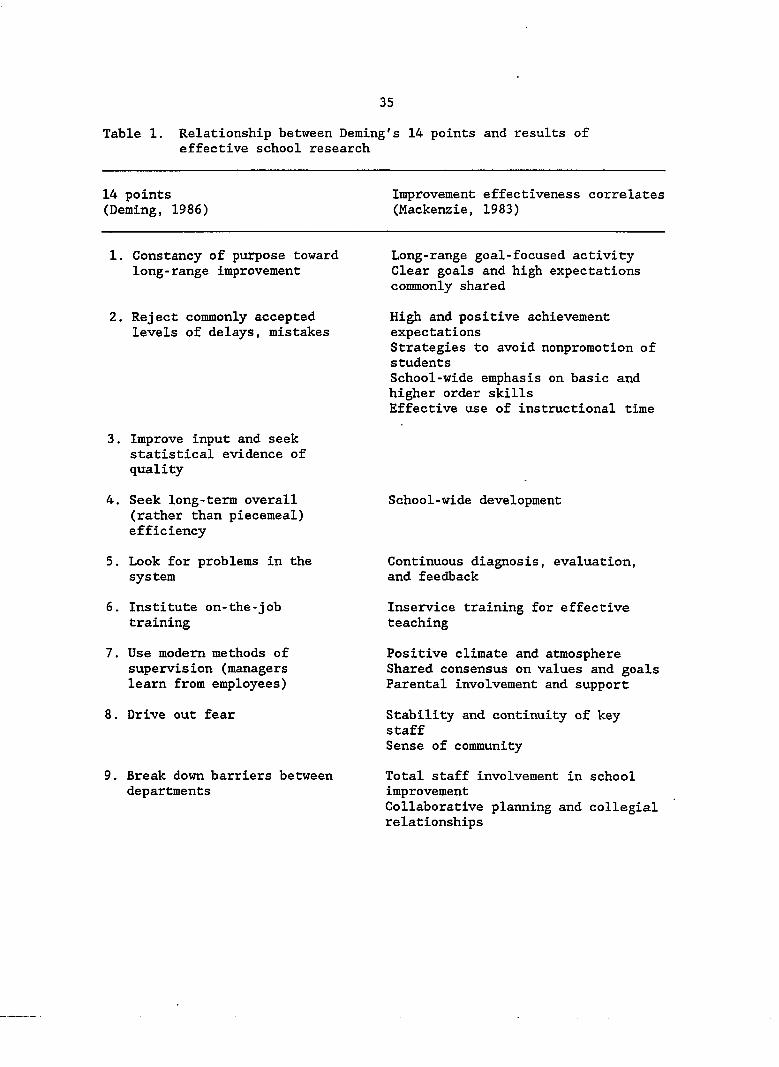
ideas and research from effective schools have shown to offer guidelines
that are quite similar (Table 1) (Mackenzie, 1983; Purkey & Smith, 1983,
1985).
School practitioners and others are finding that many of their
management strategies, such as strategic planning and site-based
management, are enhanced by total quality processes (Meaney, 1991; Tribus,
1990; Houlihan, 1991; McLeod, 1991; Melvin, 1991), TQM is not another
add-on, but a systematic, all-over approach that provides for the "top-
down" enablement of "bottom-up" decisions. Total quality management
empowers employees, managers, organizations, and even whole communities
(Rhodes, 1991).
Rhodes contends that many of the principles of total quality are
"naturals" for educators. The most basic beliefs about people--what
motivates them and how they grow and learn--are embedded in the foundation
of TQM. Educators and others are finding that TQM frees them to change
their systems, processes, policies, and practices so they are better
aligned with their long-held personal and professional beliefs and values.
Unlike school improvement processes, total quality management process that
is based on the belief that people are already self-improving beings who
regularly put forth their best efforts and need a work setting that
supports them so that each day they are successful.
35
Table 1. Relationship between Deming's 14 points and results of effective school research
14 points (Deming, 1986)
Improvement effectiveness correlates (Mackenzie, 1983)
1. Constancy of purpose toward long-range improvement
2. Reject commonly accepted levels of delays, mistakes
Long-range goal-focused activity Clear goals and high expectations commonly shared
High and positive achievement expectations Strategies to avoid nonpromotion of students School-wide emphasis on basic and higher order skills Effective use of instructional time
3. Improve input and seek statistical evidence of quality
4. Seek long-term overall (rather than piecemeal) efficiency
5. Look for problems in the system
6. Institute on-the-job training
7. Use modem methods of supervision (managers learn from employees)
8. Drive out fear
9. Break down barriers between departments
School-wide development
Continuous diagnosis, evaluation, and feedback
Inservice training for effective teaching
Positive climate and atmosphere Shared consensus on values and goals Parental involvement and support
Stability and continuity of key staff Sense of community
Total staff involvement in school improvement Collaborative planning and collégial relationships
36
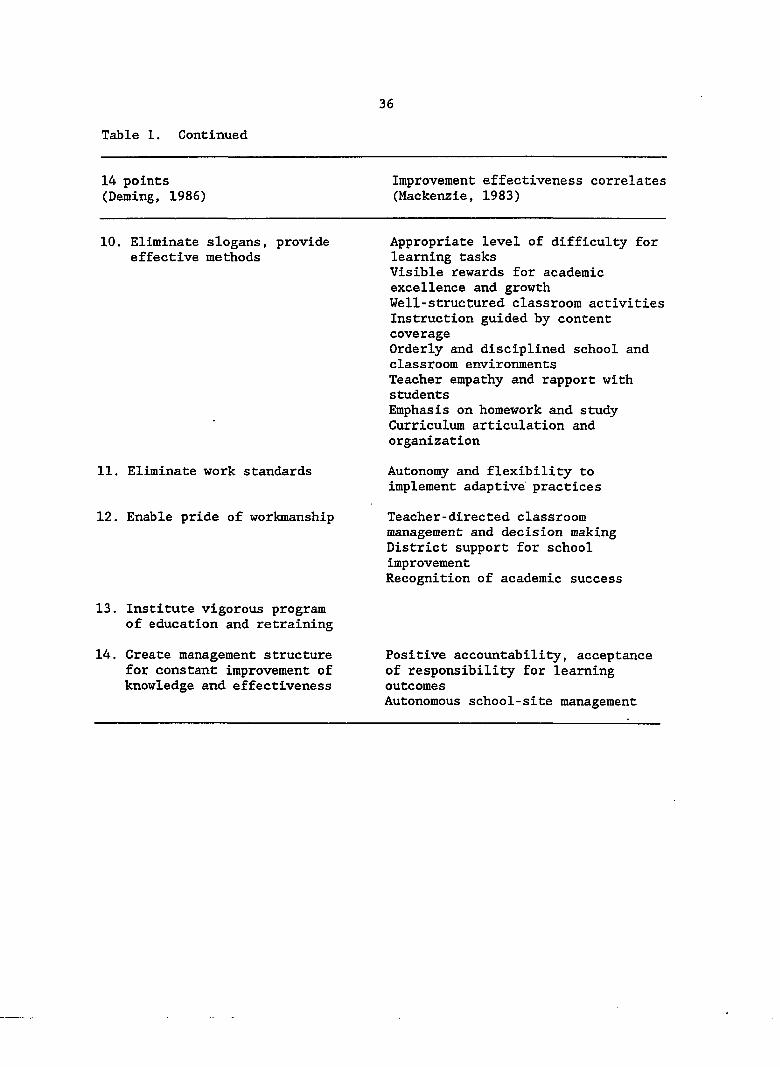
Table 1. Continued
14 points (Deming, 1986)
Improvement effectiveness correlates (Mackenzie, 1983)
10. Eliminate slogans, provide effective methods
11. Eliminate work standards
12. Enable pride of workmanship
13. Institute vigorous program of education and retraining
14. Create management structure for constant improvement of knowledge and effectiveness
Appropriate level of difficulty for learning tasks Visible rewards for academic excellence and growth Well-structured classroom activities Instruction guided by content coverage Orderly and disciplined school and classroom environments Teacher empathy and rapport with students Emphasis on homework and study Curriculum articulation and organization
Autonomy and flexibility to implement adaptive practices
Teacher-directed classroom management and decision making District support for school improvement Recognition of academic success
Positive accountability, acceptance of responsibility for learning outcomes Autonomous school-site management
37
The Beginning of Total Quality Management
Peter Drucker, in his book on management, reported details of group
activities that took place in Germany during the late 1800s. One of the
companies that Drucker highlighted was the Zeiss Company, known for its
optical products. Ernest Abbe collaborated with his workers, turning the
responsibility for working out jobs to the employees themselves. He
gathered the plant's masters and journeymen together, outlined the
procedures and principles, and left the organization and the actual work
up to them. He insisted that the machinery be developed by the skilled
workers, aided by scientists and engineers. Using group problem-solving
techniques as well as feedback from workers and respected craftsmen, he
helped the Zeiss Company achieve recognition in the optical business
(Drucker, 1974, p. 259),
In the 1940s the basic notion of worker participation was used
effectively by a lot of people. Prominent among them was Walt Disney. He
was fond of calling the wives and children of his employees every week for
a talk. He would say, "I get good, useful ideas from children and
mothers." It is assumed that he might have obtained his best ideas from
them (Ingle, 1982, p. 6).
Administratively, Disney encouraged worker participation in all his
projects. Any time a new attraction was built, he would call the
employees together for their impressions and suggestions. On a particular
occasion, one of the key attractions was reviewed by several employees. A
janitor did not like the setup, mainly the atmosphere. When asked why, he
replied, "It does not resemble the actual conditions" (Ingle, 1982, p. 6).
38
He then explained the differences between what Disney had built and the
way conditions had been. When questioned as to how he knew so many
details, he said, "I was bom there and lived there for twenty years; I
should know something about the place." The attraction was then modified
according to his suggestions. This practice of worker involvement enabled
Disney to establish a record for quality and near perfection in his work
(Ingle, 1982, p. 6).
Other great businessmen used similar techniques to promote employee
involvement. Although no formal records exist, one can readily see that
communication within the companies was good and that employees were closer
to management (Ingle, 1982, p. 6).
In the late 1940s, IBM also used total quality management techniques.
As one of the first electronic computers was being developed, the great
demand for it caused production to begin before the engineering details
were completed. Engineers, foremen, and workers cooperatively worked out
the details, resulting in a superior design in which the production
engineering was significantly better, cheaper, and faster. Because each
worker shared in the engineering of the product, each employee's total
level of involvement increased, as seen in tlie better and more productive
work (Ingle, 1982, p. 7).
The birth of total quality management (TQM) resulted from adversity.
In 1942 the Allied cause was suffering. Facing an unprecedented demand
for materials, the U.S. War Department established a quality control
section, staffed largely by employees from Bell Telephone Laboratories
(Pines, 1990; Port, 1991; Gail, 1991; Gabor, 1990).
39
Eleven years earlier, a Bell Labs statistician, Walter A. Shewart,
had published ideas on quality control. Noting that all manufacturing
processes entailed variation, Shewart defined acceptable upper and lower
limits for tasks. One could thereby detect variations outside of these
limits and find their causes. Shewart introduced "statistical control"
charts that workers on the factory floor could use to plot and adjust
variations (Nolan & Provost, 1990; Port, 1991; Psihoyos, 1991; Maguire,
1991).
Shewart's statistics had made quality a science. Monitoring
manufacturing according to measurable information brought a process under
control and made its future performance predictable. According to Nolan
and Provost, it also replaced traditional end-line inspection with an "on
line" awareness of variation.
Furthermore, this advantage of acceptable quality levels (AQL)--a
progressive idea in the 1930s--held an obvious appeal for Ariny procurement
officials, acquiring large volumes of armaments from many suppliers. The
next step was rapidly teaching statistical methods to those engaged in
wartime production (Pines, 1990; Port, 1991; Psihoyos, 1991; Perine,
1990).
One of Shewart's disciples, W. Edwards Deming, became greatly
involved in Shewart's work. In July 1941, Deming taught the first of 23
courses he would present over the next five years (Nolan & Provost, 1990;
Psihoyos, 1991).
In addition, statistical control proved a key element in the war
effort. Quality techniques became military secrets. America's defense
40
needs had given birth to a highly guarded, valuable "body of quality
knowledge" (Pines, 1990; Port; 1991).
Consequently, when the war ended, the files were opened to businesses
and industries. But by that time, an America enjoying the war's legacy of
consumer prosperity did not have the same interest in quality. However,
such was not the case with the country it had just defeated (Pines, 1990;
Psihoyos, 1991; Port, 1991; Perine, 1990; Reilly, 1991).
Quality Circles in Japan
After World War II, people in Japan were more interested in surviving
the aftermath than in maintaining a high level of quality control of their
products. The quality of goods became so poor that the identification
"Made in Japan" came to symbolize poor and shoddy quality to the rest of
the world (Dreyfack, 1982, p. 131).
General Douglas MacArthur felt that significant changes should be
made to improve the nation's image as well as its products, and he
requested assistance from the government of the United States. The U.S.
government complied and sent Dr. Edwards Deming, a government
statistician, to teach quality control methods to Japanese management
leaders. Deming worked with the Japanese from 1948 to 1950 and was
honored for his services in 1951 when the Japanese government created the
Deming Prize.
Deming's system is based upon the concept that everyone should:
1) plan (a production plan is created); 2) do (plan is implemented on a
small scale); 3) study (production is studied to make sure it conforms to
41
the plan); 4) act (lessons learned in the study stage are used to modify
the ongoing production process so that a new set of data can be used in
creating and implementing the next plan of a larger scale). Then the
circle must keep rotating (Moen, 1989; Ingle, 1982, p. 8). This four-step
improvement cycle which Deming (1990) calls the "Shewart cycle for
learning and improvement" is commonly referred to as the "Deming Wheel."
On July 13, 1950, W. Edwards Deming addressed the presidents of
Japan's leading companies. These leaders, representing diverse
industries, were each striving to reestablish a still faltering economy.
There was a felt need to implement ideas that could make a difference
(Port, 1991; Psihoyos, 1991; Ferine, 1990; Maguire, 1991).
Deming's premise was that quality was essential to survival and he
urged the Japanese manufacturers to work in partnership with their
vendors, to develop instrumentation, and to gain control over their
processes. Deming emphasized that the customer is the most important part
of the production line (Schaff, 1991; Port, 1991).
From 1954 to 1955 another prominent consultant, J. M. Juran, made a
series of visits to Japan. While there, he lectured and preached what is
known as total quality control. In this program, quality begins in the
design stage and ends only after satisfactory services are provided to the
consumer; for a company to be successful, quality must be viewed as a
total, all-encompassing concept. At this time, the Japanese government
was also deeply involved in this service aspect for a quality improvement
program. Under a comprehensive plan, many programs on quality control,
statistics, and related subjects were broadcast on radio and television.
42
The month of November was proclaimed Quality Month with "Q" flags,
slogans, seminars, and conventions initiated during the month to promote
the drive for quality.
During 1961, Kaoru Ishikawa and the Union of Japanese Scientists and
Engineers (JUSE) tied the theories of the behavioral scientists together
with those of the quality sciences. The result was the concept of quality
circles, commonly known in Japan as quality control circles. The first
circles were registered with JUSE during May of 1962. The phenomenon grew
in Japan to involve millions of employees.
It took the United States until the 1970s to realize the competitive
aspects of this new discipline and that "made in Japan" had become a new
standard for quality. This change in quality was not magic, nor was it
accomplished overnight. It took Japan thirty years of hardship and
dedication to quality for that country to become the third industrial
power in the present world. The new quality standard meant more than
efficient mass production; it meant providing service and product to meet
the customer's expectations throughout the life of the product (Port,
1991; Gabor, 1990; Maguire, 1991).
Japan's success triggered an evolution in quality improvement.
Insightful leaders began to give new energy to providing "quality" in
their organization's products.
Eventually, American executives began to pay attention to the
Japanese model of quality control and visited Japanese companies in the
early 1980s. The executives found that top management was as concerned
with quality as with finance--perhaps more so. The Americans saw quality
43
precepts and practices permeating every level of enterprise, from the
boardroom to the factory floor. The effort toward quality was, in a word,
"total" (Nolan & Provost, 1990; Port, 1991; Psihoyos, 1991; Gabor, 1990).
Through the work of Deming and Juran, the Japanese introduced new
concepts and processes to industry. Their focus on process control and
the use of statistics to manage the processes led to a new discipline for
the manufacturing arena (Pines, 1990; Oberle, 1990).
In the early days of the quality movement, the concern was focused on
conformance to product specifications. This definition later evolved to
meeting customer expectations which go beyond product quality to
marketing, service, and technical support (Deming, 1986; Juran, 1980). In
some cases billing terms or product availability have become as important
as the product itself. Deming and Juran believe that product variables
such as billing and technical service are part of the internal business
systems that form a link in the chain supporting the delivery of products
and services which satisfy customers.
Quality begins with planning and involves effective control of the
manufacturing and business processes. All the processes are part of the
delivery of quality that meet today's customer expectations in the
consumer and industrial markets (Armstrong, 1991; Bernard, 1991; Morton,
1992; Woodruff & Levine, 1991; Sensenbrenner, 1991; Maguire, 1991).
A Closer Look at Quality Circles
The term "made in Japan" used to have a negative connotation for
American consumers. Since the 1970s, however, Japanese products have
44
developed a reputation for superior quality. The quality circle
management technique has been credited with this change in opinion (Zippo,
1980; Temple & Dale, 1989; Blair & Whitehead, 1984).
One of the first organizations to become involved in the quality
circle movement in the United States was Hughes Aircraft Company. After
years of working with quality circles, the company had expanded its
program to include over 500 circles, with about 40 percent of them in
white collar areas (Mohr, 1983). One successful implementation, however,
is perhaps that of General Motors' Tarryton, New York plant. Over a
period of years the plant went from one of the worst to one of the best in
the system by using participatory problem-solving techniques of quality
circles (Cohen, 1981),
By 1983 over 400 major manufacturers and service industries had
implemented quality circles at a tremendous cost and were reporting both
cost savings and optimistic long-term benefits (Roll & Roll, 1983). The
literature gives some examples of some early successful quality circle
programs which included: Beech Aircraft, Bendix, British Steel, Champion
International, Chrysler Motors, Control Data, Frolic Footwear, General
Motors, Honeywell, IBM Corporation, International Revenue Service,
Lakeshore Technical Institute, Lane Community College, Lockhead Company,
Mercury Marine, Middlesex County College, Motorola, Muskegon, Michigan
Schools, New York City Public Schools (District 11), Norfolk Naval
Shipyard, North Carolina State Department of Community Colleges (Raleigh),
Northrup, Tektroniz, 3M, Union Carbide, Veterans Administration, and Xerox
(Aquila, 1982; Bryant & Keams, 1982; Burstein, 1983; Cohen & Cohen, 1983;
45
Ladwig, 1983; Levine, 1983; Lloyd & Rehg, 1983; Moretz, 1983; Romine,
1981; Torrance, 1982; Werther, 1981).
Although quality circles have been implemented throughout the United
States in business and industry, many have also failed. Richard Whiteley
(1991) of Forum Corporation states that "quality circles have failed
miserably primarily because the infrastructure was not created, everybody
was teaching everybody else how to 'do' quality circles, but we didn't
teach people in the circles what the themes were, or how the themes should
or would be selected, or how they would be recognized, or what would be
done with the suggestions for implementation that came from the circles.
We pumped people up and when we didn't follow through, we let them down."
Yet the concept of the quality circle is still valid and valuable,
maintains J. M. Juran of the Juran Institute. "The basic concept is
good," he contends. "The Japanese have made a big thing about that, but
we went at it the wrong way. We botched it. Now we have to regroup and
try it again" (Schaff, 1991).
Perhaps one of the main reasons for quality circle failure is
directly related to what Dr. Edwards Deming describes as American
management's five deadly diseases. Deming (1986) suggests that American
managers ;
1. Lack a consistency of purpose because they have not committed
themselves to long-range planning;
2. Emphasize short-term thinking because of the desire for immediate
benefit of the quarterly dividend;
46
3. Focus on an annual system of rating which utilizes fear or
failure to accomplish results;
4. Produce mobility of managers because of employee dissatisfaction
and frustration with the system;
5. Tend to only make use of visible statistics and figures resulting
in shoddy products and services.
Deming refers to these quality circles as a network of study groups
composed of individuals representing different functions and levels of
responsibility within an organization (e.g., administrators, other
professionals, and various workers). They work together to identify and
solve organizational problems.
The specific procedure advocated by Deming is the quality control
circle (QCC), invented in Japan by Ishikawa (Deming, 1986). Key
characteristics specified by Deming include access to statistically
controlled data and other information, rules, and procedures for efficient
interaction among study group members, and direct access to top
management.
Philosophy of management in Japan
Several authors have outlined basic influential concepts of Japanese
management which affect outcomes in the operation of quality circles. It
is a Japanese belief that 1) the group is more important than the
individual; 2) workers intelligent enough to do the work are intelligent
enough to improve productivity in general; 3) participatory management
enhances leadership and motivational skills ; 4) all workers form a family
47
unit; and 5) the sharing of feelings in a social atmosphere as opposed to
communicating ideas is an important part of a group communication context
(Miller, 1989; Watanabe, 1991; Aston, 1983; Creagh & Smeltzer, 1985;
Barrick & Alexander, 1987).
Definition of a quality circle
The quality circle is a group problem-solving technique in which six
to fifteen workers from a given area gather several times a month on
company time to study and solve problems that affect their production
area. Quality circles use the skills and the know-how of the workers who
deal with a problem on a daily basis and whose efforts ultimately
determine the quality of the product. Due to the greater potential for
worker job satisfaction, the common results from the implementation of
quality circles include improved quality of products, lower production
costs, better labor/management communication, higher productivity, and
increased patents and inventions (Dewar, 1980; Miller, 1989; Watanabe,
1991; Torrance, 1982).
Objectives of oualitv circles
Much of the research seems to support the following areas as being
the primary objectives of quality circles (Trades Union Congress, 1982;
Honeycut, 1989; Watanabe, 1991; Tang, 1987; Bowman, 1989; Larson, 1989;
Miller, 1989; Miljus, 1986; Alexander, 1984): 1) to promote individual
job satisfaction, 2) to develop harmonious manager/worker relationships,
3) to improve communications within the organization, 4) to reduce errors
48
and enhance quality of work and product, 5) to create a problem-solving
capability within the organization, 6) to increase employee motivation,
7) to promote personal and leadership development, 8) to inspire more
effective team work, 9) to develop a greater safety awareness on the part
of the employees, and 10) to build an attitude of "problem
preventiveness."
There is a difference between quality circles and other types of
committees and task forces. Alexander (1981) and Zippo and Greenberg
(1982) have identified specific differences between quality circles and
task forces: 1) quality circles are voluntary, while task forces are
usually assigned management; 2) development of relationships is an
important part of quality circles, whereas issues are the focus of task
forces; 3) in quality circles members work together on a regular basis,
while in a task force, members come together for a short time then
disperse; 4) quality circle activity takes special skill and training,
while task forces require no special expertise; 5) the work project is
developed by members in quality circles, but in task forces the work
project is assigned by management; 6) quality circle personnel implement
their project, whereas a task force may or may not be a part of the
implementation process.
Advantages of using oualitv circles
There appear to be many positive outcomes for organizations that
become involved with quality circles: 1) Quality circles can have a
positive effect on the quality of work life, 2) the team approach enhances

49
group spirit and enthusiasm toward reaching a goal, 3) participatory
management is considered by management and participants as a common sense
technique, 4) matching workers' needs to company goals can be accomplished
through quality circles, 5) the improvement of quality ensures the
improvement of productivity, 6) recognition of worker participation is a
positive reinforcer and a positive motivator, 7) quality circles have
resulted in improved operating effectiveness measured in terms of lowered
absenteeism rates, reduced costs, improved product quality, higher morale,
and greater job satisfaction, 8) quality circles can improve productivity
and communication, 9) Maslow's highest level of needs, that of self-
actualization, can be met through quality circles, and 10) the design of
quality circles provides a vehicle for implementing McGregor's theory
(Watanabe, 1991: Berry, 1984; Alexander, 1984; Tang, 1987; Larson, 1989;
Berman & Hellweg, 1989; Lansing, 1989; Barrick & Alexander, 1987).
Disadvantages of usinp quality circles
Many times organizations have difficulty implementing quality
circles. Many authors agree that: 1) the lack of objectives can cause
lack of direction, 2) American industry is oriented toward tangible
results and managers are unwilling to allow time for what may seem like
intangible service, 3) problems with other unrelated programs can cause
problems with circle implementation, 4) too high of an expectation from
management can cause detrimental pressures, 5) closed policies inhibit
realization of goals, 6) often management gives only "lip service" to
implementation of concepts, 7) lack of appropriate training causes a
50
breakdown in skill development, 8) a poor communication system can cause
problems in implementation, 9) the size of the organization can affect the
success or failure, 10) failure to maintain enthusiasm and changes in
management can cause problems, 11) management not following up on projects
points to their lack of commitment, 12) lack of financial planning can
mean loss of funding, 13) consultants who add quality circles to their
list of program offerings, but have no first-hand experience, can impose
their lack of expertise, 14) lack of union involvement can cause problems.
Attitudes of middle management and firstline supervisors toward
quality circles and their lack of commitment are more of a stumbling block
than opposition from union, 15) a rush to expand the program too fast can
lead to poor decision making, 16) a "not for me" or "not possible here"
attitude from members can mean lack of needed cooperation, and 17) no
interest in the importance of quality work within the organization can
affect the success or failure (Watanabe, 1991; Drago, 1988; Vogt & Hunt,
1988; Lawson & Tubbs, 1985; Ingle, 1982; Blue, 1988; Lawler, 1987; Bowman,
1989; Griffin, 1988; Barrick & Alexander, 1987; Alie, 1986; Collard &
Dale, 1985; Zahra, 1984; Dollar, 1983).
Recommendations for success in quality circles
After reviewing the advantages and disadvantages of quality circles,
the literature supports the following recommendations to have successful
quality circle programs: 1) The focus must be on clear goals and on
results of efforts, 2) organizations must be committed to quality,
51
3) there must be advance planning for diffusion and institutionalization,
4) responsible facilitators are a must, 5) organizations must begin slowly
with small pilot programs, 6) management must be willing to share
responsibility, 7) management on every level must be honestly supportive,
8) policies and procedures must reflect supportive philosophy, 9) there
must be extensive organizational orientation, 10) quality circles must be
based upon trust, 11) intense and comprehensive training of employees to
be more effective communicators is necessary, 12) programs must be
voluntary, 13) quality circles work best in change-oriented environments,
14) use of organizational development strategies is recommended,
15) several needs assessment instruments are recommended to indicate
organizational readiness, 16) open communication must exist so that there
is (a) access to information and (b) no punishment for errors, 17) the
importance of employee recognition and feedback cannot be overemphasized
(Watanabe, 1991; Drago, 1988; Alexander, 1984; Barrick & Alexander, 1987;
Bowman, 1989; Lansing, 1989; Miller, 1989; Miljus, 1986).
A Definition of Quality
Experts have given various definitions to the word "quality."
Phillip Crosby, founder and chairman of Phillip Crosby Associates
Inc., defines quality as conformance to requirements. In other words,
finding out what the customers desire, describing that desire, and then
meeting that desire exactly (Burstein & Sedlak, 1988; Ferine, 1990;
Crosby, 1984).
52
Joseph Juran, founder and chairman emeritus of Juran Institute, Inc.,
offers two critical distinctions of quality. First, quality involves
those features of what's being produced that respond to the customer's
needs and that create the income. It's what enables the company to sell
its products. Every company must provide products (goods or services)
that meet the needs of its customers. Juran states this is important
because it generates the income, and if one does not have the income, all
the rest is academic (Pines, 1990; Ferine, 1990; Juran, 1980; Oberle,
1990).
Juran's second definition of quality is freedom from waste, freedom
from trouble, freedom from failure. According to Pines, it is mainly
cost-oriented, instead of sales-oriented. Juran emphasizes the importance
of distinguishing between the two by stating that generally, higher
quality in the sense of product features costs more; higher quality in the
sense of less failure costs less (Juran, 1980; Gryna, 1988).
Deming notes that quality could have no meaning without some
reference to the customer. In Deming's opinion, quality is meeting and
exceeding the customer's needs and expectations--and then continuing to
improve (Deming, 1986).
An Overview of Total Quality Management
For the last decade, United States firms have been playing catch-up
in the areas of quality and productivity. Japanese companies and other
foreign competitors have entered markets once dominated by United States
companies by producing higher quality products (Aly, May tubby, &
53
Elshennawy, 1990; Burstein & Sedlak, 1988; Wilkinson, Allen, & Snape,
1991; Horton, 1989). The problem in the United States has been the
misdirection of quality and improvement programs and the lack of total
management commitment (Sprackland, 1991; Deming, 1986; Berger & Sudman,
1991; Clemmer, 1991).
Axline (1991) defines TQM as "a synthesized, pervasive, and
unwavering commitment to quality through continuous process improvement by
all members of the organization" (p. 64). Scott (1989) characterizes it
as "doing the right thing, right the first time, on time, all the time,
always striving for improvement, and always satisfying the customer"
(p. 67). Krone (1990) considers its four essential elements to be:
customer satisfaction, a supportive cultural environment, people teams and
partnerships, and disciplined systems and processes. He expands on these
four by discussing seven basic principles of TQM: 1) teamwork and
participation at the lowest possible level and decision making at the
lowest appropriate level, 2) strategic planning to establish a vision
statement and improved projects with measurable milestones and goals,
3) getting the process right the first time and up-front through better
planning, rather than fixing it later, 4) competition is replaced by
cooperation, 5) networking of teams replacing hierarchies, 6) power and
knowledge delegated to the lowest practical level, and 7) continual
improvement, not snapshot or random fixes (p. 35).
Total quality management (TQM) is considered an effective method for
achieving higher levels of quality and increasing productivity (Day, 1992;
Kaufman, 1991; Scheuing, 1990; Leader, 1989). The purpose of TQM is to
54
implement a process that is long term and continuous, in which all
managers participate in establishing continuous improvement initiatives
throughout an organization starting with their own functions (Douglas &
Wykowski, 1991; Hull, 1991; Jesperson, 1989). The primary goal is to
incorporate quality and integrity into every function at every level of an
organization (Cook, 1991; Vansina, 1989; Hendricks & Triplett, 1989;
Aalbregtse, Hejna, & McNeley, 1991; Oberle, 1990; Wilkinson, Allen, &
Snape, 1991; Klelamp, 1989; Hull, 1991).
Scott (1989) singled out the following six points of emphasis as
forming the cornerstone of this managerial approach: 1) developing close
ties to customers and meeting their needs, 2) focus on continuous
improvement of processes to reduce cost and improve quality of a product
or service, 3) fostering closer quality-base relationships with a select
group of suppliers, 4) breaking down organizational hiérarchies to improve
communication between traditional functional areas, 5) applying technology
to advantage through a strategic, long-term approach, and 6) developing
human resource policies and rewards that promote employee participation,
teamwork, flexibility, and continuous learning (p. 70).
The literature supports the fact that total quality management is a
powerful new approach to help management refocus its priorities on
customers and produce superior quality products and services (Aly,
Maytubby, & Elshennawy, 1990; Goodard, 1988; Guaspari, 1988; Douglas &
Wykowski, 1991). TQM is a comprehensive management system for achieving
continuous improvement in customer satisfaction. An integral part of TQM
is allowing the customer to define quality (Cook, 1991; Deming, 1986;
55
Horton, 1989; Day, 1991; Crosby, 1979; Wilkinson, Allen, & Snaps, 1991;
Juran, 1980).
The Malcolm Baldridge Award
Total quality management is different from other programs in that it
involves all employees and constitutes a fundamental change in the way an
organization is measured and managed (Aly, Maytubby, & Elshennawy, 1990;
Wilkinson, Allen, & Snape, 1991; Day, 1992). In 1987 the institution of
the Malcolm Baldridge National Quality Award provided a nationally
accepted set of criteria for evaluating the extent to which a company had
implemented TQM in the United States. The key principles of the award
include: 1) customer driven quality, 2) continuous improvement,
3) measurement, 4) employee participation, 5) leadership, and
6) management decisions based upon data analysis (Rohan, 1989; McDonnell &
Hudiburg, 1988; Aly, Maytubby, & Elshennawy, 1990).
These six themes appear throughout the criteria, which are divided
into seven categories: 1) leadership, 2) information and analysis,
3) strategic quality planning, 4) human resource use, 5) quality assurance
of products and services, 6) quality results, and 7) customer satisfaction
(Finley, 1991; Rohan, 1989; Edowsomwan & Savage-Moore, 1991; McDonnell,
1988; Baatz, 1991; Spiker, 1991; Kiely, 1991; Brown, 1991).
The Spokespersons of TQM
After ten years of quality improvement efforts in some U.S.
organizations and almost four decades of quality in Japan, the quality
56
movement has grown enormously (Morton, 1992; Reynolds, 1989; Bernard,
1991; Woodruff & Levine, 1991; Klekamp, 1989; Therrien, 1991; Pines, 1990;
Maguire, 1991; Schaaf, 1991).
Indeed, the list of those who qualify as "quality experts" has
expanded, yet the trio of Edwards Deming, Joseph Juran, and Phillip Crosby
are the real leaders (Port, 1991; Gabor, 1988; Gartner & Naughton, 1988;
Ferine, 1990). These three have made such terms as QC (quality control),
TQI (total quality improvement), COQ (cost of quality), and SPC
(statistical process control) familiar acronyms in the quality workplace
(Deming, 1986; Juran, 1980; Crosby, 1979).
For more than four decades, W. Edwards Deming and J. M. Juran have
been known as the key leaders in the quality movement. While they cross
paths quite often, and maintain an air of cordiality, they are fierce
competitors (Oberle, 1990; Pines, 1990; Gabor, 1988; Port, 1991).
Although Deming and Juran have their differences, their lives are
somewhat similar (Gabor, 1990; Ferine, 1990; Garner & Naughton, 1988;
Port, 1991). Both were employed by the Western Electric Company in the
1920s. Deming and Juran came under the influence of Walter A. Shewart,
the AT&T Bell Laboratories physicist who was turning statistical concepts
that originated in agricultural research into a manufacturing discipline.
After World War II, both Deming and Juran became independent consultants.
The basic message of all three is the same; Commit to quality
improvement throughout the entire organization. Attack the system rather
than the employee. Strip down the work process, whether it be the
manufacturing of a product or customer service, to find and eliminate
57
problems that prevent quality. Identify your customer, external or
internal, and satisfy that customer's requirements in the work process or
the finished product. Eliminate waste, instill pride and teamwork, and
create an atmosphere of innovation for continued and permanent quality
improvement (Ferine, 1990; Juran, 1980; Gryna, 1988; Crosby, 1979; Deming,
1986).
Although the basic message of the three leaders in TQM is the same,
there are also some differences. One of Crosby's slogans calls for zero
defects in a product, while Deming's tenth point is to "eliminate slogans,
exhortations, and targets for the work force asking for zero defects and
new levels of productivity" (Crosby, 1979; Ferine, 1990; Deming, 1986).
Deming's fourth point warns managers to "drive out fear" so that everyone
can do their jobs, while Juran says, "fear can bring out the best in
people." The second point of Juran's "breakthrough sequence" calls for
problem analysis to "distinguish the vital few projects from the trivial
many and set priorities based on problem frequency" (Juran, 1980). This
differs from Crosby's eleventh point on error-cause removal, which
encourages employees "to inform management of any problems that prevent
them from performing error-free work," implying that no problem is too
small (Crosby, 1979, 1984).
The other differences are not so clear cut. All three experts call
for the use of statistical tools in process measurement, but Deming and
Juran place more emphasis on them than Crosby. They all stress total
company commitment, but Deming starts at the top and works down, while
Juran says the process can begin with middle management and work up and
58
down the ranks; Crosby, focusing on conformance to requirements and
product defects, appears to put more responsibility on operators (Deming,
1986; Deming. 1985; Juran, 1980; Gryna, 1988; Crosby, 1984).
Key Components of Total Quality Management
The process of managing the total quality of an organization requires
establishing certain criteria for success. There appear to be four key
components of an effective total quality management process (Deming, 1986;
Tumey, 1991; Mendenhall, 1991; Steimer, 1990; Sarazen, 1991; Hames, 1991;
Gryna, 1988; Ritter, 1991; Perlman, 1989; Willis, 1991; Ferine, 1990;
Oberle, 1990; Muller, 1991; Goldbaum, 1988; Roller, 1991; Salter, 1991;
McLaughlin & Kaluzny, 1990).
Customer satisfaction
The literature supports the fact that business and industries' main
focus is the customer. Glenn (1991) makes a strong point for public
sector organizations to maintain this same focus; "We forget that in the
public sector, unlike the private sector, we don't have the luxury of
losing our customers: our customers, like the poor, we always have with
us. One of the worst things we can do is turn them into enemies" (p. 18).
This same author addresses the issue of which customers should be the
source for determining an organization's product. He simply states:
Customers are worthy people, both honest and competent. It means treating them that way. If our customers are honest and competent people, they are perfectly capable of expressing their valid needs, although we may have to negotiate with them to translate those needs into measurable terms we can
59
work to fulfill. We can ask customers what they want, need, and expect, (p. 18)
Similar conclusions are reached by Hendricks and Triplett (1989), who
affirm:
A vision must be presented and reinforced at all levels that everyone has customer responsibilities and that customer satisfaction depends on reliable service, credible representation, the customer's consistently favorable impressions about the company, responsive employees, and empathy to each customer's unique situation, (p. 47)
As Scott (1989) explains, one of the key components of TQM is
maintaining a constant focus on the needs of the customer, and of defining
quality in direct relation to those needs. He contends that "customers
may be inside an organization or outside, but every person--from the chief
executive to the janitor--has customers who receive and depend on that
individual's product" (p. 68). Krone (1990) discusses the same issue,
noting that each member of the organization must establish a clear vision
of how to provide service to the customer, a vision which views that
service as: "courteous, clear, concise, correct, complete, and concerned"
(p. 35).
Glenn (1991) reinforces this theory on the customer, stating: "All
we do is for their sake; without them, our work has no purpose.
Therefore, if we are serious about quality, customers, no matter whether
they are internal or external, have every right to have their
requirements, needs, and expectations met the first time and every time"
(p. 17).
In his report on TQM in the health care sector. Perry (1988) notes
that customer needs are constantly being redefined, perhaps as much a

60
function of the increasing levels of education and sophistication of those
customers in being able to express their needs than as a function of the
actual needs themselves (p. 32).
It would seem that the concept of "customer" is not new to the
professional literature in educational administration; it may, however, be
more difficult to determine who is the customer in schools than it is in
industry or commerce. Educators may be viewed as having multiple
customers, including parents, students, school board members, community
patrons, and employers. It would seem, however, that students are
generally viewed as the primary "targets," if not customers, of education.
Louis and Miles (1990) clearly define students as the "customers" of
schools and contend that schools will need to meet the holistic needs of
their students (pp. 25-26).
It appears then if students are the school's "customers," they should
be the focus of the school's "product," the students' needs must then
become the basis for goal-setting in public education. This is emphasized
by Shanker (1990), who states: "Student success is the shared goal.
Time, space, instruction, and people are organized to achieve that goal"
(p. 93).
It appears that the keys to customer satisfaction are staying in
touch with the customer to understand what customers value and determining
how best to provide that value ahead of the competition at a profitable
price.
61
Leadership and vision
Axline (1991) gives leadership a key role in TQM, stating: "When
committed leadership is lacking, the various pieces of TQM do not fit
together in a coherent pattern" (p. 64). Axline goes on to mention that
leadership is required at all levels of the organization, not confined to
or reserved for only the high-ranking executives.
Aalbregtse et al. (1991) help define the role of the leader in TQM:
Leadership involves defining the need for change, creating new visions, and using new frameworks to mobilize commitment to those visions--frameworks for thinking about strategy, structure, and people. Leadership emphasizes the ability to articulate those visions clearly and forcefully. Leaders provide focus by consolidating or challenging conventional wisdom, and translating their ideas into operational actions. (p. 30).
Glenn (1991) defines the role of the leader in the following terms:
• Leaders excite other people by communication, including action and inspiration.
• What leaders have in common in addition to their galvanizing vision are positiveness, passion, and humility.
• Leaders reach beyond mere facts to the what-could-be, to facts which have not yet come into existence.
• When leaders are leading, their focus is outside of themselves, on the goal--the vision they are committed to. (p. 18)
In her review of the principles of total quality management, Walton
(1986) stresses such related leadership issues as ceasing reliance on mass
inspection and, instead, enlisting workers in the ongoing improvement of
the process; improving constantly the system of production and service ;
helping people to do a better job and learning by objective methods who is
in need of individual help; driving out fear; and removing the barriers to
62
pride of workmanship. Koons (1991) further defines the leadership role in
TQM, noting that at times it must go well beyond the support and
facilitation modes :
Not all problems or issues are appropriate for team assignments. There is still a role for creative managers to identify opportunities for operational program enhancements under their control, and to take the necessary administrative actions to implement these enhancements. At some point decisions have to be made even though all of the subordinate staff may not agree. Even in a TQM environment, managers are not merely facilitators, but still must make some tough decisions that are not always popular. (p. 38)
These same concepts of leadership seem to exist in the professional
literature in educational administration (see Edmonds, 1979; Fullan, 1991;
Glatthorn, 1990; Glickman, 1990; Sarason, 1990; Snyder & Anderson, 1986;
among others). However, the question remains as to how extensively this
model of leadership is being implemented in the public schools.
It appears that the organization's leaders must develop a vision for
how the organization needs to change and what it should become. They must
become committed to leading the quality improvement process. Vision
shapes the organization's culture; it motivates people to pursue
improvement.
Process control
The issue of quality is clearly the foundation of Deming's (1986)
work. He states:
The central problem in management, leadership, and production...is failure to understand the nature and interpretation of variation. Efforts and methods of improvement of quality and productivity are in most companies and in most government agencies fragmented,
63
with no overall competent guidance, no integrated system for continual improvement, (pp. 465-566)
Scott (1989) continues on by stating that the key to TQM is "pursuing
a strategy of steady, continuous improvement by focusing on and
understanding all elements of existing tasks. Ideally, every person in an
organization is always looking for a better way to do a job" (p. 68). To
accomplish this, he advocates, much as did Deming (1986), Feigenbaum
(1954), Ishikawa (1985), Juran (1988), and others, the use of statistical
tools to reduce variations in processes. The importance of this quality
control issue is clearly highlighted in the qualitative research conducted
in Japanese organizations by Atkinson and Naden (1989) and in Aalbregtse,
Hejka, and McNeley (1991), who state: "If managers typically spend 40
percent of their time on production and cost issues and 10 percent on
quality issues, then their priorities are clear" (p. 30).
Although schools have long been characterized by standardized, norm-
referenced tests to measure quality, these mechanisms do not appear to be
compatible with the TQM approach in that they generally do not have
meaningful impact on "production," are imposed by external rather than
internal forces, and do not measure quality in ways that are meaningful to
the "customer," or student. Similarly, Classer (1990) criticizes the
validity of the standardized tests when compared to the "consumer's"
definition of quality:
Nothing of high quality, including schoolwork, can be measured by standardized, machine-scored tests. If we are truly interested in measuring what successful teachers in magnet schools are doing, we will need to conduct thorough interviews with them, collect observations of a statistically significant sample of them, and carry out follow-up studies to see if the
64
future academic performance of their students is enhanced. (p. 426)
Classer (1990) asserts that each student will recognize what
represents "quality" (or lack thereof) for that student and, more
importantly, that it is the student's own assessment that should take
priority over the assessments of teachers, parents, administrators, peers,
etc. If the student is considered as the customer, rather than as a
worker in the process, this stance shares Deming's insistence on
satisfying the customer's concept and needs for quality.
Understanding the value of continuous improvement in systems and
processes becomes a way of life in the total quality organization.
Continuous improvement requires the use of statistical tools to understand
and control the process and to then eliminate causes of problems within
the system.
Employee ownership
Training, or staff development, has long been recognized as a key
element in public school management (see Glatthorn, 1990; Glickman, 1990;
Hunter, 1990; Leithwood., 1990; Louis & Miles, 1990; Shanker, 1990; Snyder
& Anderson, 1986). Admittedly, it has not always been implemented as
consistently as advocated under TQM or in as structured a manner as
suggested by Glenn (1991). However, its importance has certainly been
recognized. Hunter (1990) states: "A final criterion of a profession is
that its practitioners never stop learning better ways of providing
seirvice for their clients" (p. xii). Shanker (1990) goes further,
asserting: 1) Teachers are viewed as an important source of knowledge
65
that should inform what happens in schools; 2) teachers' learning comes
about through continuous inquiry and interaction with colleagues, as well
as through exposure to new research and ideas from the academic and
broader communities; and 3) the focus for staff development is the school.
It means that the school is structured so that staff development is an
ongoing, continuous, and integral part of the school's mission. Teachers'
time is legitimately spent in the improvement of practice (p. 93).
Hoy and Miskel (1991) assert that people work best when they are in,
and feel part of, a team in which they can be trusted and trust each other
to do their jobs; share leadership and make decisions; are accepted and
respected; resolve issues with sensitivity and understanding; have the
opportunity to accomplish challenging goals ; and contribute to continuing
improvement.
Axline (1991) assigns training a pivotal role in the implementation
of TQM in organizations, asserting, "When there is a lack of follow-
through in organization-wide TQM training, the concept and approach
sometimes become a battleground" (p. 64). He further explains that:
"Production-level workers, first-line supervisors, middle management and
top executives often leam a great deal from one another when they're
involved together in training and process actions teams" (p. 64).
Glenn (1991) defines these training needs in four basic categories:
skills, statistical tools, interpersonal dynamics, and the basic
principles of TQM. His contention is that all needs must be addressed on
an ongoing basis, for all organizational members, yet in accordance with
the specific roles occupied and skills needed by each.
66
It appears ownership begins with employees understanding their role
in the quality process. By working on teams to achieve results,
individuals become involved in quality improvement and take ownership of
the quality process.
Implementation Efforts in Business, Government, Service Industries, and Universities
A recent Gallup survey conducted for the American Society for Quality
Control (ASQC) says that 70 percent of adult Americans believe that jobs
in America have been lost due to foreign competition (Morton, 1992). The
survey also indicates that most feel that American businesses should
continue to improve quality even though it may mean short-term losses.
Edward M. Baker (1989), director of Quality Planning and Statistical
Methods for Ford Motor Company, stated that:
American enterprises have lost their leadership position to foreign competition as suppliers of high quality goods and services to world markets. Quality has become the primary differentiator in the marketplace. Customers are becoming increasingly more discerning and demanding... each new level of product and service quality which enterprise provides establishes a new minimum threshold of customers' expectations. Enterprises with the capability to improve and innovate products and services have the key to marketplace leadership.
Furthermore, world-class companies know that it no longer is enough
to merely satisfy customers; rather, customers must become excited about
products and services (Gufreda, Maynard, & Lytle, 1989; Harbour, 1988;
Goodkin, 1990; Horton, 1989).
The growth of total quality management over the past fifteen years
has been phenomenal. Roll and Roll (1983) stated that by 1983, over 400
67
major manufacturers and services industries had implemented quality-
circles at a tremendous cost savings and optimistic long-term benefits.
By 1990 about one-fourth of United States manufacturing firms were
involved with total quality management programs (Moskal, 1991).
Today the literature supports organizations of all types that are
reaping savings by adapting quality techniques and processes on the
assembly line including: Toyota, Canon, Mercedes-Benz, IBM, 3M, Xerox
Westinghouse, Deere & Co., Exxon, General Electric Co., Rockwell
International, Colgate-Palmolive, Union Pacific Railroad, Corning, Dow
Chemical, Ford, Motorola, Monsanto, Interox Chemicals Ltd., Alcoa, Digital
Equipment, Convex Computer Corp., Martin Marietta, Target Stores, Texaco,
Florida Light and Power Co., Stouffer Hotels, Boeing, Black and Decker,
Renault, Cadillac Motor Division, and Federal Express (Peterson, Kelly, &
Weber, 1991; DeYoung, 1989; Abramson, 1991; Hopkins, 1989; Walsh, 1990;
Velocci, 1991; Chapman, Clark, & Sloan, 1991; Reynolds, 1989; Morrow,
1991; Bull, 1991; Freundlich, Schine, Smith, & Carey, 1991; Harbour, 1988;
Dreyfuss, 1988; Whiting, 1991; Barks, 1991; Spiker, 1991; Yovovich, 1991;
Wyszewianski, 1988; Moskal, 1991; Mooney, 1991).
Total quality management is also beginning to make inroads in service
companies (Hammons & Maddux, 1989; Reynolds, 1989; Williamson, 1988;
Donebedian, 1988). Today, 10 percent of American service companies have
some type of quality program. However, by the year 2000, perhaps 70
percent of those with more than 500 employees will have formal quality
initiatives. The most aggressive will have formal quality initiatives.
The most aggressive will be financial service providers (Beer, Eisenstat,
68
& Spector, 1990), health care companies (McLaughlin & Kaluzny, 1990;
Kaluzny, 1989; Berwick, 1989), and government, followed by retailers and
universities (Placek, 1991; Coate, 1990; Morton, 1992).
The literature (Dawson & Patrickson, 1991; Thor, 1991; Hopkins, 1989)
contends that in the 1990s, financial organizations will be leaner and
more flexible. The most important concern will be quality of service.
Managers will pay increased attention to external customers and will
develop formal customer satisfaction systems for internal customers.
Localization of decision making will require more local data in order to
maintain accountability. Thor (1991) contends that leading banks must
direct efforts toward a significant culture change to meet the needs of
the 1990s. Since it involves profit improvement, competitive strength,
and customer service, quality planning must be integrated into the bank's
overall strategic business planning.
Quality in health care delivery is a popular topic and a buzzword
today (Anderson & Daigh, 1991; Williamson, 1988; Mendenhall, 1991;
Donabedian, 1988; Rago, 1991). More than any other concept of
organization and management, total quality management offers the potential
to positively affect every major health care constituency (Burda, 1991;
Eubanks, 1991; Biddix & McClearen, 1991).
In health care today, TQM can be used as a means to such ends as cost
containment and downsizing (McCarthy, 1991). TQM is a comprehensive,
realistic, and practical approach that can help hospitals run the way they
should. TQM in health care views all work as a process, whether that work
be clinical or managerial. It teaches people to see beyond their own
69
immediate tasks and roles, and it makes everyone more aware of the larger
work processes of which they are a part (Hagland, 1991; Weber, 1991;
Labovitz, 1991; Eubanks, 1991). TQM in health care empowers people to
work together to analyze and improve work processes. It is a top-down
process, driven by senior managers who shape and communicate a unifying
vision of quality, set clear quality improvement goals, and serve as the
organization's most avid champions of continuous improvement (Burda, 1991;
Donabedian, 1988; Rago, 1991).
In a TQM health care organization, the customer focus of TQM means
that all constituencies in the delivery system are working on behalf of
the patient (Labovitz, 1991; Donabedian, 1988; Biddix & McClearen, 1991).
Public service visionaries have successfully introduced total quality
management ideas and techniques into a variety of governmental programs
including the postal service, city government, Internal Revenue Service,
the Naval Air Logistics Command (in the U.S. Navy), and the Forest Service
(in the Department of Agriculture) (Sensenbrenner, 1991; Hammond & Maddux,
1989; McKenna, 1991; Penzer, 1991; Reynolds, 1989; Milakovich, 1991;
Guaspari, 1988; Newman, 1991; Stratton, 1991).
In February 1986, a Presidential Executive Order was signed that
aimed at making agencies in the executive branch significantly more
productive by 1992. The intent was to emphasize productivity management
practices in federal agencies to support future improvement efforts. This
has remained the basic thrust of federal efforts, but the overall program
has been modified to include a greater emphasis on quality management
(Burstein & Sedlak, 1988).
70
Although United States colleges and universities are recognized
worldwide for education and research, a number of problems threaten their
strength and stability (Saunders & Walker, 1991; McWilliams, 1991;
Bemowski, 1991). These include: 1) increasing costs and decreasing
funding, 2) a decreasing number of high school graduates, and
3) competition. One source of competition is Europe, Japan, and other
countries where world-class schools are being built. The second source of
competition is major companies, such as Motorola and General Electric Co.,
which are educating their executives internally (Morton, 1992; McWilliams,
1991; Wachel, 1991).
On January 22, 1992, five major corporations joined eight
universities in a TQM university challenge (Morton, 1992). According to
Morton, IBM Corp. will participate with Massachusetts Institute of
Technology and the Rochester Institute of Technology. Purdue University
is participating with Motorola, Inc., Proctor & Gamble is joining in the
Challenge with Tuskegee University and the University of Wisconsin at
Madison. Carnegie Mellon University will participate with Xerox Corp.
Milliken & Co. will join with North Carolina State University and the
Georgia Institute of Technology.
Several colleges and universities have recognized their precarious
state and have begun using the principles and practices of total quality
management (TQM) to improve how they educate and generate knowledge. For
example, Columbia University (New York) has incorporated TQM into its
curriculum with education modules, courses on TQM, and a TQM master's
degree program (Wachel, 1991; Placek, 1991; Coate, 1990).

71
Difficulties in Implementing Total Quality Management
Although total quality management has been successful in many
organizations, the literature cites some difficulties that seem to exist
when TQM is being implemented: 1) Managers do not truly understand how
radically different a TQM work environment is when compared with more
traditional management approaches; 2) for middle managers, TQM either may
give them the power they need to manage their workers better or it may
cost them their jobs because as top executives become more frustrated with
the slow pace of corporate change, the middle manager becomes a target;
3) many organizations do not understand how to communicate quality;
4) inadequate measuring results; 5) mistaking the program initiative;
6) failing to develop a change strategy; 7) getting top management
support; 8) failing to get customer feedback on quality measurement;
9) lack of employee training; 10) perceived as "just another program" or
merely "more work"; 11) convincing management and staff of the long-term
value; and 12) competing demands on time for the CEO and other managers in
the organization (Kem, 1991; Holpp, 1989; Whiting, 1991; Sprackland,
1991; Wyszewianski, 1988; Hull, 1991; Quimby, Parker, & Weimersckirch,
1991; Berger & Sudman; Clemner, 1991; McLaughlin & Kaluzny, 1990;
Kratochwill & Gaucher, 1991; Kwok, 1990).
Reasons for Successful Implementation in Total Quality Management
The literature shows the following attributes to be quite common in
organizations that have successfully implemented total quality management:
1) a high degree of employee enthusiasm and empowerment, 2) top management
is totally committed, 3) there is total commitment throughout the
organization, 4) the focus of the implementation strategy is across the
entire organization, 5) a cross-functional quality team is set up for the
purpose of managing the implementation process, with the aim of developing
responsibility for quality management to the staff, 6) the strategic
significance of the change and the enormity of the task is recognized from
the outset, 7) the TQM process is backed up by the allocation of
appropriate funds to ensure the success of the project, 8) key people such
as facilitators are appointed on a full-time and long-term basis,
9) communication lines have been well developed, 10) there is a true team
concept based on the environment that encourages candor, trust, and ethics
throughout the organization, 11) measurement systems are in place and
accessible to all levels, 12) employees are involved in developing the
measurement systems, 13) there is a vision of quality throughout the
organization, 14) there is a thorough understanding of the total quality
management process throughout the organization, and 15) there is a
motivation to change within the organization (Axland, 1991; Coombes, 1991;
Scheuing, 1990; Fertik, 1991; Dawson & Patrickson, 1991; Leader, 1989;
Jenkins, 1991; DeCieri, Samson, & Sohal, 1991; Perlman, 1989; Blackman,
1991; Varian, 1991; Sandholm, 1988; Axline, 1991; Hyde, 1990; Melum, 1990;
Socolovsky, 1990; Melum, 1990).
73
Comparisons of Traditional Management and Total Quality Management
Perhaps the number one reason that TQM is somewhat difficult to
instill in organizations is because it differs substantially from
traditional management. The research supports several key differences
between the two approaches: 1) Traditional management's focus is on its
own requirements, while TQM focuses on the customer; 2) TQM takes the view
that profits follow quality, while traditional management views profits as
its first responsibility; 3) TQM considers quality as multidimensional and
customer-oriented, while traditional management defines quality in terms
of a single dimension; 4) TQM encourages every employee to find better
ways to work, while, with traditional management, workers work and
managers manage; and 5) TQM takes a long-term, process-oriented approach
to improving process quality, while traditional management strives for
short-term, results-oriented gains (Tobin, 1990; Jesperson, 1989; Butler,
1990; Johnson, 1991; Klelamp, 1989; Herrington, 1991; Guaspari, 1988).
In summarizing, many leaders are emphasizing a new type of leadership
that is necessary for total quality management to occur including:
1) Commitment is the foundation of an effective total quality management
(TQM) initiative; 2) leadership is the key issue in promoting commitment;
3) leaders should be charismatic, flexible, and inspiring--especially with
regard to those they manage; 4) leaders must be able to inspire others to
create and manage change, to take responsibility, and, above all, to take
risks; 5) involving, participating, and actively listening to others is
the only way mangers can create genuine improvement; 6) transformational
leaders are dependent, visionary, and inspirational and are driven by
74
long-term goals, visions, and objectives; and 7) they are interested in
ends rather than means (Atkinson, 1991; Dreyfuss, 1988; Farquhar, 1990;
Guaspari, 1988; Johnson, 1991; Baker, 1991; Juran, 1988; Jesperson, 1989;
Vansina, 1989; Hendricks & Triplett, 1989; Herrington, 1991).
Analytic and Enumerative Studies
Deming is a statistician. Much of his work is in statistical theory,
and it is statistics that provides the theory behind the 14 points.
Deming (1950, Chapter 7) introduced concepts labeled enumerative and
analytic statistical studies. In any statistical study the ultimate aim
is to provide a rational basis for action. Enumerative and analytic
studies differ by where the action is taken. Deming (1975) summarized the
distinction between enumerative and analytic studies as follows:
Rnumerative study: A statistical study in which action will be taken
on the frame being studied.
Analytic study: A statistical study in which action will be taken on
the process or cause-system that produced the frame being studied,
the aim being to improve practice in the future.
An enumerative study is a statistical study in which the focus is on
judgment of results and an analytic study is one in which the focus is on
improvement of the process or system which created the results being
evaluated and which will continue creating results in the future. A
statistical study can be enumerical or analytic, but according to Deming
(1950), it cannot be both.
75
This distinction between enumerative and analytic studies is the
theory behind the 14 points. Darning's philosophy is that management
should be analytic instead of enumerative. In other words, management
should focus on improvement of processes for the future instead of on
judgment of current results (Deming, 1950).
Deming's Four Beliefs
Deming offers an alternative way of viewing an organization. The
four basic beliefs, or components of profound knowledge as Deming (1982)
sees them are:
1. Psychology. Deming believes that people are purposeful,
cognitive beings with an intrinsic desire to learn and be
innovative, and that each individual has the right to enjoy his
or her work and be successful.
2. Systems. Deming believes that all organizations should be viewed
as systems whose activities must be aimed at fulfilling the
mission of the organization. The task of management is to
optimize the whole.
3. Perceptual framework. Deming believes that knowledge is
constructed from experience bound within a framework of theories
and beliefs. Everyone within the organization needs the same
theoretical road map.
4. Causes of variance. Deming believes that 80 or 90 percent of the
variation from expected outcome is a result of problems within
76
the system or process, not the worker. To lessen the occurrence
of variations, the system must be modified.
From a historical perspective over the past 40 years, these four
beliefs have transformed the postwar economy of Japan into the
revitalized, competitive system we see today (Walton, 1986). Now,
following the rediscovery of Deming by American industry in 1980, the same
is being done in the United States by industries interested in becoming
better adapted to a changing environment. To date, application of these
beliefs to K-12 public school systems is limited to only a few projects
(Melvin, 1991; Meaney, 1991; Tribus, 1990; Houlihan, 1991; McLeod, 1991;
Leonard, 1991; Glaub, 1990).
The Theory Behind Deming's 14 Points of Management
Many organizations are concluding that quality is critically
important. Some believe it can provide a strategic advantage, while
others see it as a requirement for survival. In pursuit of improving
quality, many organizations have chosen to follow the management
philosophy of W. Edwards Deming as embodied by his 14 points for
management (Tviete, 1989; Stampen, 1987; Geber, 1990; Bernard, 1991;
Geber, 1991; Sensenbrenner, 1991; Tribus, 1991; Melvin, 1991; Therrien,
1991; Peterson, Kelly, Weber, & Gross, 1991; Woodruff & Levine, 1991;
Armstrong & Symonds, 1991; Siler & Garland, 1991).
Each of Deming's 14 points which follows are summarized by Deming
(1986). Researchers and educators comment on each point's applicability
to education.
77
Deming's 14 Points
1. Establish constancy of purpose.
Deming's first point is to create constancy of purpose toward the
improvement of products and services by allocating resources for long-term
planning, organizational research, and education of the workforce.
Deming contends that with constancy of purpose, management designs
products, services, and processes to meet the needs of the customer, both
now and in the future. Management also initiates efforts to continually
improve the products and the processes of the organization. When top
management establishes constancy of purpose, it creates an environment
where everyone in the organization works toward the purpose, allowing the
organization to move in a single direction with a longer term focus
(Deming, 1986).
Educators must believe that all resources are aimed at student
development. All programs that consume critical resources are examined
and those that do not contribute to student achievement are eliminated.
Students, parents, support staff, teachers, administrators, school board
members, and the community at large must all share a common understanding
of the desired outcomes, beliefs and mission, and a consistent belief that
those outcomes can be accomplished. Educators must develop a willingness
to measure progress and to change short term strategy to accomplish long-
range objectives (McLeod, 1991; Tribus, 1991; Melvin, 1991; Glaub, 1990;
Leonard, 1991).
78
2. Adopt a new philosophy.
Deming's second point is to reject commonly accepted levels of
delays, mistakes, defective materials, and defective workmanship.
Organizations must constantly perfect processes aimed at finding problems,
their causes, and ways of correcting them (Deming, 1986).
A new philosophy for assuring quality education is being adopted
within the school. This philosophy is a transformation to a new way of
thinking and planning for student learning. Educators must refuse to
accept the idea that students cannot learn at high levels under the right
conditions of teaching and learning (McLeod, 1991).
Educational management must awaken to the challenge, must learn their
responsibilities, and take on leadership for change (Melvin,1991; Tribus,
1990; Leonard, 1991; Glaub, 1990).
3. Cease dependence on mass inspection.
Deming's third point is to cease mass inspection of purchased
materials and services. Instead, improve selection processes and seek
statistical evidence of quality (Deming, 1985).
In education, concentration on a new philosophy emphasizes the move
from the identification of student failure to preventing student failure
through continuous improvement. A school system cannot wait until the end
of the year to measure student progress. A school system must understand
and use statistical assessment of student growth and development on a
daily basis. The system must understand and agree upon the various
79 ,
meaning of "outcomes" (McLeod, 1991; Glaub, 1990; Tribus, 1990; Leonard,
1991; Melvin, 1991).
4. End the practice of awarding business on the basis of price alone.
Deming's fourth point advocates ending the practice of awarding
business on the basis of price tag. Strive for the long-term reduction of
total cost rather than piecemeal efficiency (Deming, 1986).
Educators should invest in quality, rather than just low cost. In
the long run, high quality produces lower cost. Therefore, schools must
choose, use, and evaluate facilities, textbooks, technologies, and other
resources in teaching based on statistical evidence of success of the
particular product and upon accepted outcome measurements (McLeod, 1991;
Leonard, 1991; Glaub, 1990).
Tribus (1990) recommends to cease dependence on testing to achieve
quality. The need for inspections on a mass basis by providing learning
experience which create quality performance must be eliminated.
5. Constantly improve every system.
Deming's fifth point advocates looking for problems in the system.
Managers and no one else, are responsible for finding and correcting
systematic problems (Deming, 1986).
Educators believe that improvement is not a one-time effort. There
is potential for improvement in each step taken to create or upgrade
school programs and services. Making a commitment to constantly improve
the system necessitates a long-term perspective. Schools should
80
continually identify barriers and seek workable solutions to improve
processes (McLeod, 1991; Glaub, 1990; Leonard, 1991; Melvin, 1991).
Tribus (1990) recommends working cooperatively with the educational
institutions from which students come. He suggests minimizing the total
cost of education by improving the relationship with colleges of education
and helping to improve the quality of students coming into the school
system.
6. Institute training on the job.
Deming's sixth point supports instituting modern methods of training
on the job. Employees cannot perform well unless they know their jobs and
feel free to inform managers of problems they encounter. Also,
statistical methods must be used to identify when on-the-job training has
achieved its purpose (Deming, 1986).
Schools need to constantly stay abreast of changing demands and
requirements. A wide range of internal and external resources must be
used for the managerial, professional and technical development of all
division personnel. Resources should be geared toward positively
contributing to student achievement (McLeod, 1991; Tribus, 1990; Glaub,
1990; Leonard, 1991; Melvin, 1991).
7. Institute leadership.
Deming's seventh point advocates instituting modern methods of
supervision. Supervision is one of the most important responsibilities of
managers. They must learn from employees to help them do a better job
81
(Deming, 1986). Deming (1989) says that managers or supervisors must
become leaders and that an effective leader: 1) must understand the
meaning of a system, and how the work of groups supports the system,
2) sees the group as a function of the system, 3) understands that all
people are different and try to optimize the education, skills, and
abilities of everyone, and help everyone to improve, 4) is a coach and
counselor, not a judge, 5) will study results with the aim to continuously
improve, 6) will know when someone is in need of special help, 7) creates
an environment conducive to trust, freedom, and innovation, 8) does not
expect perfection; people can learn from mistakes, 9) listens and learns
without passing judgments, and 10) understands the benefits of
cooperation.
Educators believe that the job of management is not to tell people
what to do, but rather to lead people in the right direction. They
emphasize the quality of the total program rather than individual
behaviors. Evaluations need to be programmatic, systematic, and formative
rather than individual, personal, and summative (McLeod, 1991; Glaub,
1990; Leonard, 1991; Melvin, 1991; Tribus, 1990).
8, Drive out fear.
Deming's eighth point is to drive out fear so that everyone can work
effectively. Employees must hold secure jobs and feel free to express
ideas, ask questions, and ask for instructions. The elimination of fear
is an important responsibility of managers (Deming, 1986).
82
"Respect for the basic human dignity of others." The belief is that
one of the best ways to help an individual acquire a good self-image is
not to do anything to damage it. Drive out fear. Encourage
nonthreatening, two-way communications on quality outcomes between levels
of the organization (McLeod, 1991; Tribus, 1990; Glaub, 1990; Leonard,
1991; Melvin, 1991).
9. Break down barriers between departments.
Deming's ninth point advocates breaking down barriers between
departments. Teams composed of people performing different functions can
work effectively to improve products and services (Deming, 1986).
Schools need to be committed to rebuilding and nurturing an
environment in which trust and respect can be applied to what is said,
heard, read, and written. Barriers must be broken down by problem solving
through teamwork and combining the efforts of people from different school
areas (McLeod, 1991; Tribus, 1990; Glaub, 1990; Leonard, 1991; Melvin,
1991).
10. Abandon slogans.
Deming's tenth point recommends the elimination of goals, quotas,
posters, and slogans asking for new levels of productivity without
providing effective methods. Goals without "road maps are useless"
(Deming, 1986).
Schools do not want employees searching for excuses and explanations.
School employees should always strive to continually improve; however,
83
solving all problems in a school system at one time can never take place
(McLeod, 1991; Leonard, 1991; Melvin, 1991).
Tribus (1990) recommends the elimination of slogans, exhortations,
and targets for teachers and students asking for perfect performance and
new levels of productivity. Exhortations create adversarial
relationships. The bulk of the causes of low quality and low productivity
belong to the system and thus lie beyond the control of teachers and
students (Glaub, 1990).
11. Eliminate numerical goals and quotas.
Deming's eleventh point is to eliminate work standards that prescribe
numerical quotas. Such standards, according to Deming, are "fortresses"
against the improvement of quality and provide appropriate supervision
(Deming, 1986).
Numerical goals should be replaced with charts that measure progress
and analyze the situation. This demonstrates that the school is committed
to a long-term process. Numbers should be used constructively. Mandates
and numerical goals should be eliminated. All educational employees must
be involved in identifying problems, designing programs, planning,
budgeting, and selecting materials (McLeod, 1991; Tribus, 1990; Glaub,
1991; Leonard, 1991; Melvin, 1991).
12. Remove barriers that rob people of pride in workmanship.
Deming's twelfth point recommends the removal of barriers to
employee's rights to pride of workmanship. Pride of workmanship is
84
impossible without accurate definitions of acceptable workmanship.
Definitions are the responsibilities of managers (Deming, 1986) .
Schools need to remove barriers that rob the students, teachers,
management, and support staff of their right to pride and job of
workmanship. This includes abolition of the annual or merit rating and of
management by objective. The responsibility of all educational managers
must be changed from quantity to quality (Tribus, 1990; Glaub, 1990;
Leonard, 1991; Melvin, 1991).
13. Promote education and self-improvement.
Deming's thirteenth point is to institute a vigorous program of
education and retraining. Improvement in productivity means reassignment
of personnel. Education and retraining will prepare people for new jobs
and responsibilities. It is also necessary for everyone to learn the
rudiments of statistical theory and application. The latter is a language
of communication for organizational improvement (Deming, 1986).
Schools must provide all employees with training in quality
leadership, measurement, analysis, problem solving, self-evaluation, and
assertiveness training. They must recognize that different levels and
functions in the organization require different types of training.
Inservice cannot be a yearly or even monthly activity. It must be part of
the normal work of the school (Tribus, 1990; Leonard, 1991; McLeod, 1991;
Melvin, 1991).
85
14. Structure management to accomplish the transformation.
Deming's fourteenth point is to create a structure in top management
that will encourage implementation of the above 13 points every day
(Deming, 1986; p. 23-96),
Educational leaders must move toward processes that are geared
towards problem prevention. It takes years to correct deficiencies and
accomplish the complete transformation of the educational system.
Everyone in the system (superintendents, central office personnel,
principals, teachers, support staff, students, parents, community
partners, and board members) is responsible for helping to bring about
this transformation (McLeod, 1991; Glaub, 1990; Melvin, 1991).
A comprehensive understanding of the past, the ability to assess the
events that led to the present, and the ability to forecast future needs
and requirements, all demand an entrepreneurial approach. Conceptual
skill is a critical ingredient in moving from traditional management
practices to total quality management practices (Tribus, 1990; Leonard,
1991).
Deming's Process Tools
Along with Deming's philosophy and 14 points belong a set of process
tools, that in his view, enable an organization to improve the quality of
whatever it produces. In his judgment, to put his philosophy into
practice, effective techniques are needed for harnessing the collective
intelligence of everyone within an organization to discover and solve
systematic problems. According to Deming (1986), this can be done by
86
developing processes (beyond standard system diagrams and flow charts)
that embody three components: a master teacher of statistics, management
and staff-development information systems, and manager-worker study
groups.
The master teacher
According to Deming (1986), every sizable organization should employ
a master teacher of statistics whose role is to establish organizational
means of identifying and researching systematic problems. The most
important function is to teach at varying levels of sophistication,
depending on the nature of a manager or work responsibilities, statistical
sampling, analytic techniques, tests of reliability, and other basic
elements of experimental design. Other functions according to Deming
include developing organizational studies and process-related information
systems, maintaining data bases, and training apprentice statisticians as
needed. The intent of all these efforts, according to Deming, is to
develop self-correcting processes that will yield road maps for
organizational improvement.
Information svstems
According to Deming (1986), everyone within an organization should
somehow be involved in constructing product or service-related information
systems. The master teacher's role is to provide basic designs that
managers and workers can perfect. Analytical (preferably longitudinal)

87
data should be in a state of statistical control (defined as follows in
Deming, 1986):
Stability or the existence of a system is seldom a natural state. It is an accomplishment, the result of eliminating special causes one by one on statistical signal, leaving only the random variation of stable process. A stable process, one with no indication of a special cause of variation is said, following Shewart, to be statistical control. Its behavior in the future is predictable. (pp. 119-120)
Studv groups
Deming's third tool is a network of study groups composed of
individuals representing different functions and levels of responsibility
within an organization (e.g., administrators, other professionals, and
various workers). They work together to identify and solve organizational
problems. The specific procedure advocated by Deming is the quality
control circle (QCC), invented in Japan by Ishikawa (Deming, 1986). Key
characteristics specified by Deming (1986, include access to statistically
controlled data and other information, rules and procedures for efficient
interaction among study group members, and direct access to top
management.
Summary
Just how can the theories, principles, and practices of total quality
management help in school transformation? Can something that is working
well for some businesses also apply to education?
It appears that with the past success of total quality management in
business, industry, and the public sector, the possibilities of applying
88
TQM to education seem to exist. If one looks back at past managerial
practices in education, it seems that the latest trends in school-based
management, strategic planning, effective schools, and school improvement
literatures blend well with the total quality management philosophy.
However, the elements of TQM that appear to be significantly lacking
in school reform/restructuring are: 1) Schools need process controls that
are valid in order to give feedback for continuous improvement, 2) an
individual who is educated in the use of statistical methods and in the
development of information will be needed to teach faculty, other staff,
and administrators how to use information effectively, and 3) there has to
be "continual improvement, not snapshot or random fixes." As Leader
(1989) notes: "Significant improvements to quality require managing a
major, multi-yeared change effort" (p.69). When asked how long it would
take an organization implementing TQM to attain Toyota Corporation's
present level of development in this approach, Atkinson and Naden (1989)
estimated that it would take a minimum of twenty years. After reviewing
the literature in education administration, it appears that only in the
past couple years has the TQM model been considered for implementation in
public schools. Furthermore, with the amount of continuous employee
training that will be needed, the typical day/calendar doesn't appear to
be sufficient.
The American Association of School Administrators has enlisted the
expertise of quality management expert W. Edwards Deming to offer school
leaders a new lens through which to view the transformation of schools
89
that the president and governors are calling for by the year 2000 (Marx,
1991).
Among Deming's principles, which he promoted in a recent conversation
with AASA staff are:
1. That education can only be transformed one system at a time;
2. That leaders must have a vision and must understand their system in order to put that vision into practice;
3. That schools must expect and design for variation among children;
4. That the goal of education leaders should not be achieving numerical goals, but transforming school systems. (Marx, 1991)
Educators who apply Deming's quality concepts to schools are
demonstrating that any form of effective decision making closer to the
"product" requires a different kind of support. For example, mid-
management, or central office staff in schools, must serve as
facilitators, rather than directors (Eckard, 1991).
Deming's approach also emphasizes something that has been understood
for quite some time but ignored by many educational researchers and
practitioners: namely, that the test of anyone's ideas for improving the
quality of educational services is whether they can be shown to be
effective. Deming and his track record argue persuasively that it is
possible to determine whether a system is becoming better or worse, and he
provides concepts and tools for sure-footed actions when the latter is the
case.
School administrators will need to take a serious look at total
quality management as one way to bring about needed change and continuous
improvement in education.
90
CHAPTER III. METHODS
This study was designed to identify key components of total quality
management for schools and to compare the beliefs of teachers,
superintendents, and school board members for adopting and utilizing total
quality management concepts at the local level. The four major elements
of the study outlined in this chapter are: 1) identification and
validation of the 42 belief statements, 2) the sample and population used
in the study, 3) the administration of the instrument, and 4) the analysis
of the data.
Identification and Validation of the 42 Attitude Statements
The instrument used in this study, "Educator Beliefs" (Appendix A),
was developed by the researcher utilizing a two-step procedure. After the
review of the literature was completed, 42 belief statements were created
to assess and compare educators' beliefs concerning Deming's 14 points
(three beliefs for each of the 14 points) as they apply to education.
Attitudes are often measured in educational research because of their
possible predictive value. According to Borg and Gall (1989), an attitude
is usually thought of as having three components ; an affective component,
which consists of the individual's feelings about the attitude object; a
cognitive component, which is the individual's beliefs or knowledge about
the attitude object; and a behavioral component, which is the individual's
predisposition to act toward the attitude object in a particular way (Borg
& Gall, 1989, p. 311).
91
This particular study dealt with the cognitive component which
assessed and compared the three different groups' beliefs concerning total
quality management.
A review of research on the effectiveness of attitude measures as
predictors of behavior indicated that general attitude measures are not
very accurate predictors of specific behavior (Fishbein & Ajzen, 1975,
1977). However, recent work suggests that specific behavior can be
predicted from measures of attitude toward the specific behavior (Canary &
Siebold, 1984).
The instrument in this particular study consisted of 42 belief
statements (three beliefs for each of the 14 points). Respondents were
asked to assess the degree to which they agreed or disagreed with each of
the 42 belief statements using a five-point Likert scale.
A rating of A was given by a respondent to a belief statement with
which he/she strongly agreed. A rating of E was given to a belief
statement with which he/she strongly disagreed. A rating of C indicated
that the respondent was unsure of his/her belief. Reverse wording was
used on some questions to avoid a response set so the reader could not
fall into a pattern on marking the questionnaire (Orlich, 1978, p. 65).
It should be noted that the ratings of A, B, C, D, and E were given a
number weighting of A-1, B-2, C-3, D-4, and E-5. The boundaries for the
mean rating scores were as follows; Strongly agree = 1 to 1.49, Agree =
1.50 to 2.49, Not sure - 2.50 to 3.49, Disagree - 3.50 to 4.49, Strongly
disagree - 4.50 to 5.00.
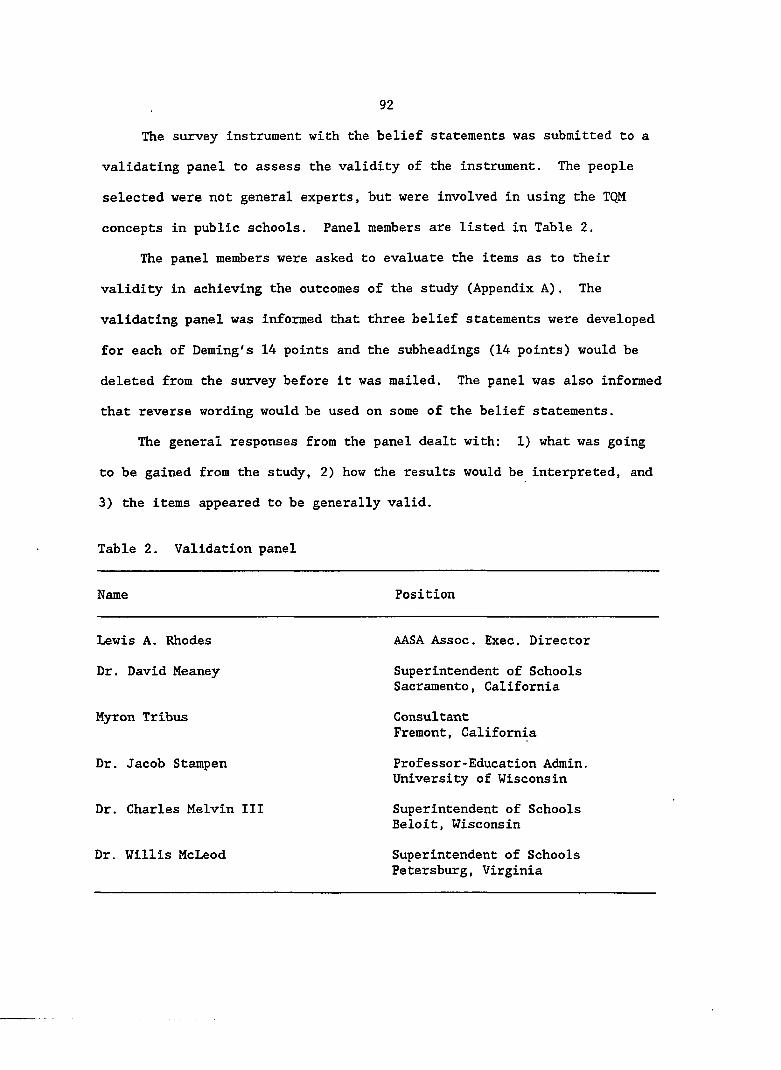
92
The survey instrument with the belief statements was submitted to a
validating panel to assess the validity of the instrument. The people
selected were not general experts, but were involved in using the TQM
concepts in public schools. Panel members are listed in Table 2.
The panel members were asked to evaluate the items as to their
validity in achieving the outcomes of the study (Appendix A). The
validating panel was informed that three belief statements were developed
for each of Deming's 14 points and the subheadings (14 points) would be
deleted from the survey before it was mailed. The panel was also informed
that reverse wording would be used on some of the belief statements.
The general responses from the panel dealt with: 1) what was going
to be gained from the study, 2) how the results would be interpreted, and
3) the items appeared to be generally valid.
Table 2. Validation panel
Name Position
Lewis A. Rhodes AASA Assoc. Exec. Director
Dr. David Meaney Superintendent of Schools Sacramento, California
Myron Tribus Consultant Fremont, California
Dr. Jacob Stampen Professor-Education Admin. University of Wisconsin
Dr. Charles Melvin III Superintendent of Schools Beloit, Wisconsin
Dr. Willis McLeod Superintendent of Schools Petersburg, Virginia
93
The survey instruments were returned by the panelists in early April.
The second and final version of "Educator Beliefs" was administered to the
sample population in early May.
The Sample and Population Used in the Study
In order to properly represent educators' beliefs, the sample used in
this study represented 42 school districts from the state of Iowa. To
insure geographical population representation, three school districts were
chosen at random from each of the 14 Area Education Agencies (AEA). The
three school districts chosen from each AEA were selected based upon their
student population. The student population categories chosen were 0 to
500, 501 to 1,500, and greater than 1,500 (Appendix C).
Superintendents of the selected districts were contacted by letter
and asked to participate in this study (Appendix D). The superintendents
were asked to distribute a copy of the same survey to a teacher in their
district who is: 1) not an officer of the local district's teacher's
association, 2) has been in the district for at least five years, and
3) is well respected by the rest of the staff (Appendix E).
A board member from each district was randomly selected and directly
mailed a copy of the survey (Appendix F). After completing the survey the
teachers, superintendents, and board members were instructed to return the
surveys in self-addressed stamped envelopes. Sixty percent of the surveys
were returned within the two weeks time allotted. A follow-up letter
(Appendix G) and telephone calls were used to encourage the nonrespondents
94
to participate. The response rate increased to 83 percent after mailing
the reminder and follow-up phone calls.
Administration of the Instrument
The instrument was mailed to participants of the study in late April
1992. Anonymity of the respondents was guaranteed by not using names on
the survey instrument. A letter was enclosed with each survey instrument
to 1) explain the purpose of the study, 2) assure the participants that
their input was very valuable to this research effort, 3) assure the
participants that total confidentiality of their responses was guaranteed,
4) ask the participants to place their completed audits in the individual
envelopes provided, and 5) encourage the participants to return the
completed surveys as soon as possible.
The Iowa State University Committee on the Use of Human Subjects in
Research reviewed this project and concluded that the rights and welfare
of the human subjects were adequately protected, that risks were
outweighed by the potential benefits and expected value of the knowledge
sought, that confidentiality of data was assured, and that informed
consent was obtained by appropriate procedures.
Analysis of the Data
All data were collected during the month of May 1992. Completed
surveys were collected from 104 participants. The scoring for negatively
stated items of the survey was reversed and the data analyzed.
95
Initial data analysis involved four separate procedures. First,
total means and standard deviations were calculated for the ratings given
each of the 42 belief statements by the 104 respondents. Means and
standard deviations across participants were calculated for the 14
subscales that were organized according to Deming's 14 points.
As a third statistical procedure, one-way analysis of variance was
performed to test for significant differences among the mean ratings for
each of the 14 points as well as for the 42 individual belief statements
comparing the three participant groups. The one-way analysis of variance
was used to test the research null hypothesis that there would be no
significant differences among the mean scores of the beliefs, when
comparing the three groups' responses to each of the 42 belief statements
and the 14 points in the "Educator Beliefs" survey.
Hp : At least two /z's are not equal
a — .05.
It should be noted that since three respondents were sought from each
school district, it was decided to block on district. Thus, the ANOVA
will have the following lines: Districts (Block), Between groups, Error,
and Total. Due to the fact that not all districts responded to each
question, the degrees of freedom and the accompanying sums of squares for
the blocks will vary by question.
The final statistical procedure involved conducting at the .05 level
of significance, the Scheffé post hoc multiple range procedure.
96
CHAPTER IV. FINDINGS
Findings of the data collection process are presented in this
chapter. Reporting is ordered in the following manner for purposes of
clarity and accuracy: 1) a report of key demographic factors used in the
study, 2) a report of methods used for presenting statistical findings,
3) an examination of the data, 4) testing for mean differences, and
5) summary.
Key Demographic Factors
The findings of this study are based on the results obtained by
administering the survey instrument to a superintendent, teacher, and
board member from each of the 42 school districts from the state of Iowa
(Appendix C).
Demographic variables used in this study include gender of
respondents, education level of respondents, age of respondents, positions
held by respondents, and school size of respondents.
Table 3 reveals that out of 104 respondents, 71 were males and 32
were females. One person did not indicate his or her gender.
As indicated in Table 4, the highest educational level of respondents
ranged anywhere from a high school diploma to a doctorate degree.
Out of the 104 respondents, 10 had bachelor's degrees, 28 had
master's degrees, 30 had specialist degrees, 15 had doctorate degrees, and
21 had high school diplomas.
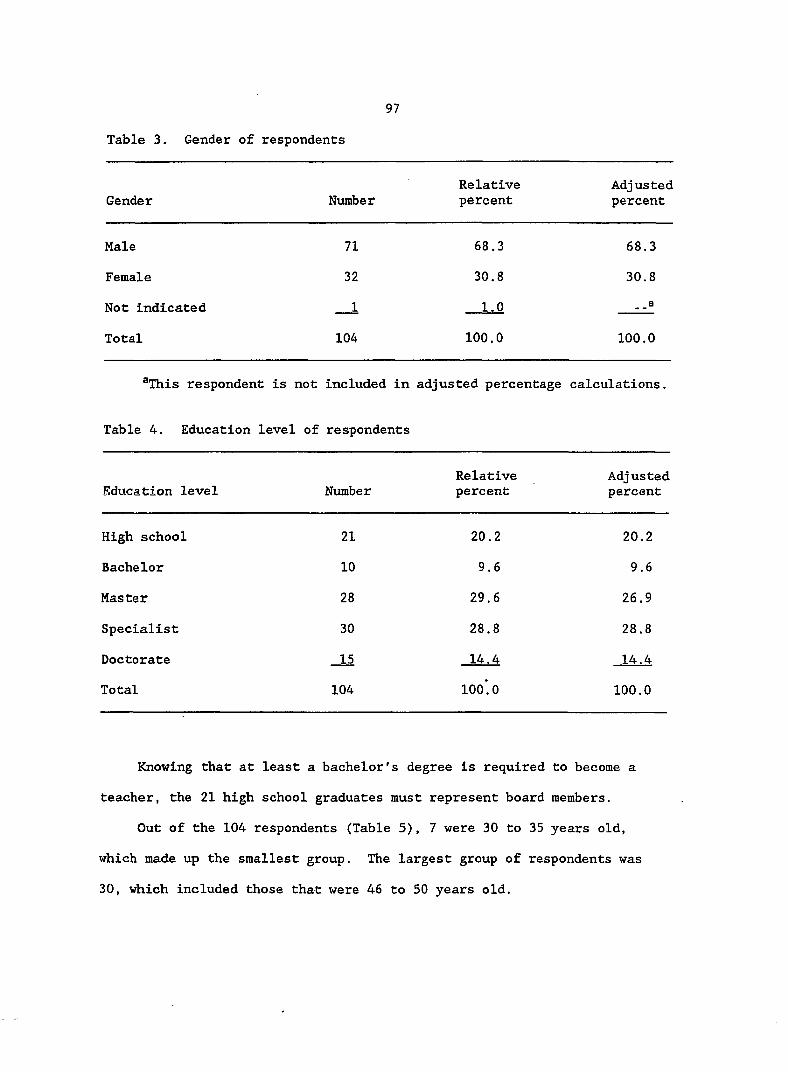
97
Table 3. Gender of respondents
Relative Adjusted Gender Number percent percent
Male 71 68.3 68.3
Female 32 30.8 30.8
Not indicated 1 1.0 _ a
Total 104 100.0 100.0
®This respondent is not included in adjusted percentage calculations.
Table 4. Education level of respondents
Relative Adjusted Education level Number percent percent
High school 21 20.2 20.2
Bachelor 10 9.6 9.6
Master 28 29.6 26.9
Specialist 30 28.8 28.8
Doctorate 15 14.4 14.4
Total 104 100'.0 100.0
Knowing that at least a bachelor's degree is required to become a
teacher, the 21 high school graduates must represent board members.
Out of the 104 respondents (Table 5), 7 were 30 to 35 years old,
which made up the smallest group. The largest group of respondents was
30, which included those that were 46 to 50 years old.
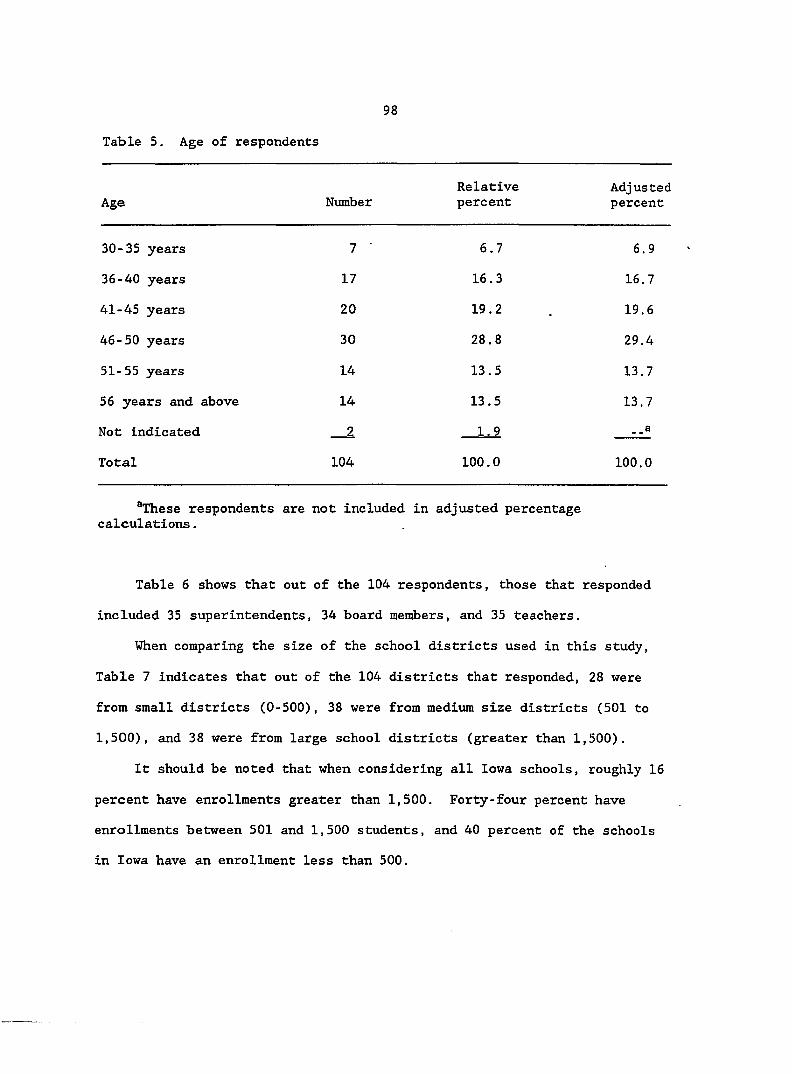
98
Table 5. Age of respondents
Relative Adjusted Age Number percent percent
30-35 years 7 " 6.7 6.9
36-40 years 17 16.3 16.7
41-45 years 20 19.2 19.6
46-50 years 30 28.8 29.4
51-55 years 14 13.5 13.7
56 years and above 14 13.5 13.7
Not indicated 2 1.9 ..a
Total 104 100.0 100.0
®These respondents are not included in adjusted percentage calculations.
Table 6 shows that out of the 104 respondents, those that responded
included 35 superintendents, 34 board members, and 35 teachers.
When comparing the size of the school districts used in this study,
Table 7 indicates that out of the 104 districts that responded, 28 were
from small districts (0-500), 38 were from medium size districts (501 to
1,500), and 38 were from large school districts (greater than 1,500).
It should be noted that when considering all Iowa schools, roughly 16
percent have enrollments greater than 1,500. Forty-four percent have
enrollments between 501 and 1,500 students, and 40 percent of the schools
in Iowa have an enrollment less than 500.
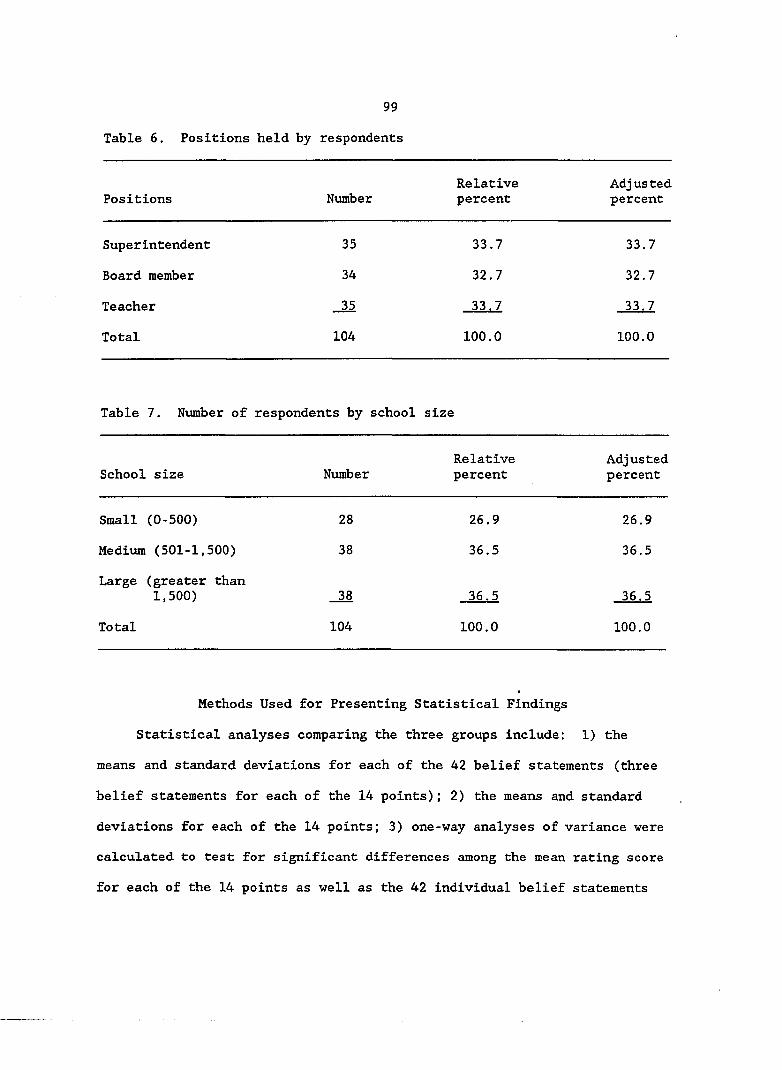
99
Table 6. Positions held by respondents
Positions Number Relative percent
Adjusted percent
Superintendent 35 33.7 33.7
Board member 34 32.7 32.7
Teacher 35 33.7 33.7
Total 104 100.0 100.0
Table 7. Number of respondents by school size
School size Number Relative percent
Adjusted percent
Small (0-500) 28 26.9 26.9
Medium (501-1,500) 38 36.5 36.5
Large (greater than 1,500) 36.5 36.5
Total 104 100.0 100.0
Methods Used for Presenting Statistical Findings
Statistical analyses comparing the three groups include: 1) the
means and standard deviations for each of the 42 belief statements (three
belief statements for each of the 14 points); 2) the means and standard
deviations for each of the 14 points; 3) one-way analyses of variance were
calculated to test for significant differences among the mean rating score
for each of the 14 points as well as the 42 individual belief statements
100
comparing the three participant groups; and 4) the one-way analysis of
variance was used to test the research null hypothesis that there would be
no significant differences among the mean scores of the three groups when
tested for response to each of the 42 belief statements in the "Educator
Beliefs" survey and the 14 points.
Ho : - ft - *3
: At least two f i ' s are not equal
a — .05.
The final statistical procedure involved conducting at the .05 level
of significance the Scheffé post hoc multiple-range procedure. This
procedure was used to identify any group means found to be significantly
different at the .05 level. The critical value of the F-statistic with 2
and 61 degrees of freedom is 3.55. An F-statistic greater than 3.55 will
be needed to reject the null hypothesis that there are no significant
differences in the mean scores.
Examination of the Data
Appendix H shows tables that will give a condensed version of the
means and standard deviations for the 14 points and the three belief
statements that make up each point.
The following tables beginning with Table 8 also reveal the means and
the standard deviations for each of the 14 points and the three belief
statements that represent each point. Preceding each table is the
discussion of the table content that explains the responses given by
superintendents, board members, and teachers.
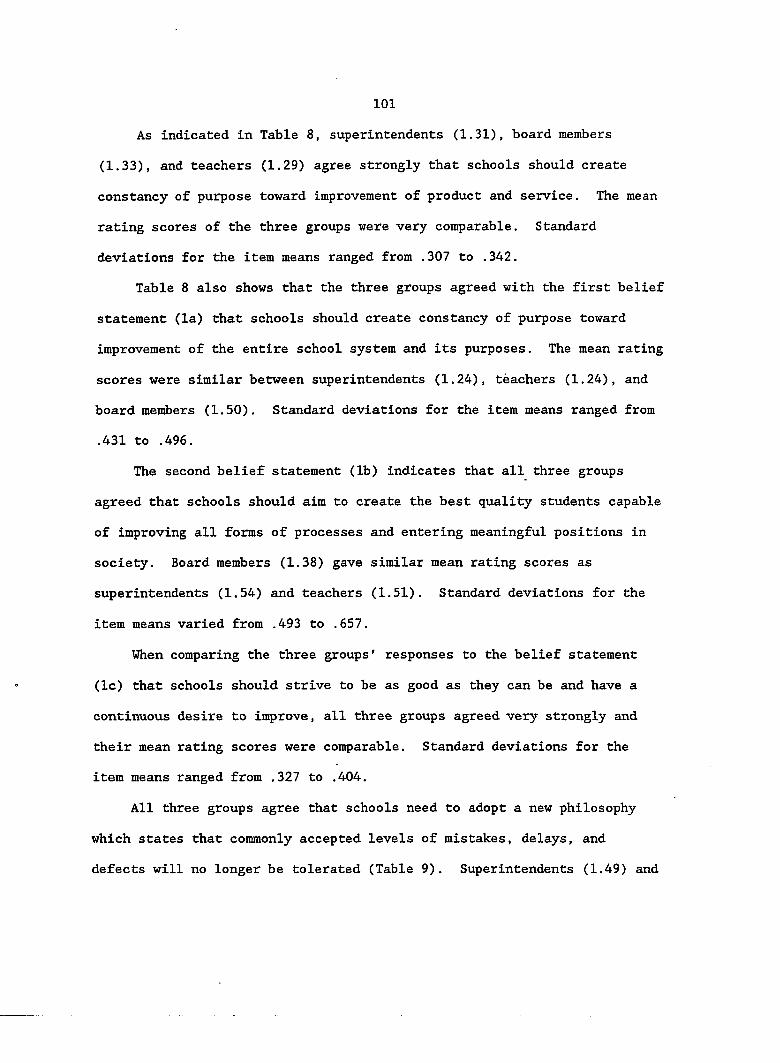
As indicated in Table 8, superintendents (1.31), board members
(1.33), and teachers (1.29) agree strongly that schools should create
constancy of purpose toward improvement of product and service. The mean
rating scores of the three groups were very comparable. Standard
deviations for the item means ranged from .307 to .342.
Table 8 also shows that the three groups agreed with the first belief
statement (la) that schools should create constancy of purpose toward
improvement of the entire school system and its purposes. The mean rating
scores were similar between superintendents (1.24), teachers (1.24), and
board members (1.50). Standard deviations for the item means ranged from
.431 to .496.
The second belief statement (lb) indicates that all three groups
agreed that schools should aim to create the best quality students capable
of improving all forms of processes and entering meaningful positions in
society. Board members (1.38) gave similar mean rating scores as
superintendents (1.54) and teachers (1.51). Standard deviations for the
item means varied from .493 to .657.
When comparing the three groups' responses to the belief statement
(Ic) that schools should strive to be as good as they can be and have a
continuous desire to improve, all three groups agreed very strongly and
their mean rating scores were comparable. Standard deviations for the
item means ranged from .327 to .404.
All three groups agree that schools need to adopt a new philosophy
which states that commonly accepted levels of mistakes, delays, and
defects will no longer be tolerated (Table 9). Superintendents (1.49) and
102
Table 8. Item means and standard deviations for Deming's first point and the three related belief statements (la, lb, Ic)®
Deming's point/Belief statements N Mean S.D.
Deming Pt. 1. Schools should create constancy of purpose toward improvement of product and service.
Superintendent 35 1.31 .342 Board member 34 1.33 .307 Teacher 35 1.29 .325
Belief la. Schools should create constancy of purpose toward improvement of the entire school system and its purposes.
Superintendent 34 1.24 .496 Board member 34 1.50 .564 Teacher 34 1.24 .431
Belief lb. Schools should aim to create the best quality students capable of improving all forms of processes and entering meaningful positions in society.
Superintendent 35 1, ,54 .657 Board member 34 1. ,38 .493 Teacher 35 1. ,51 .562
Belief Ic. Schools should strive to be as good as they can be and have a continuous desire to improve.
Superintendent 35 1, ,17 .382 Board member 34 1. ,12 .327 Teacher 35 1, ,11 .404
F̂ive-point Likert scale: l=>Strongly agree, 2=Agree, 3=Not sure, 4-Disagree, 5-Strongly disagree.
10.3
board members (1.52) gave similar mean rating scores as teachers (1.70)
when comparing the three groups. Standard deviations for the item means
ranged from .451 to .520.
When contrasting the three groups and their responses to the first
belief statement (2a), superintendents (1.39) and board members (1.42)
gave comparable mean rating scores as teachers (1.71) when asked if
educational management must awaken to the challenge, must learn their
responsibilities, and take on leadership for change. Standard deviations
for the item means varied from .561 to .788,
The second belief statemsnt̂ iZb) reveals that all three groups were I
in agreement that schools must accept the idea that students can learn at
high levels under the right conditions of teaching and learning.
Superintendents (1.44) gave a similar mean rating score as board members
(1.59) and teachers (1.51). Standard deviations for the item means ranged
from .504 (superintendents) and .658 (teachers) to .857 (board members).
When responding to the third belief statement (2c), all three groups
agreed that schools must not accept underachievement from anyone in the
system, including board members, administrators, staff, students, or
parents. It appears that superintendents (1.51), board members (1.56),
and teachers (1.89) gave similar mean rating scores. Standard deviations
for the item means varied from .562 (superintendent) to .963 (teacher).
All three groups agree that schools need to cease dependence upon
mass inspection (Table 10). The item mean rating scores for Deming's
third point included superintendents (1.91), board members (2.21), and
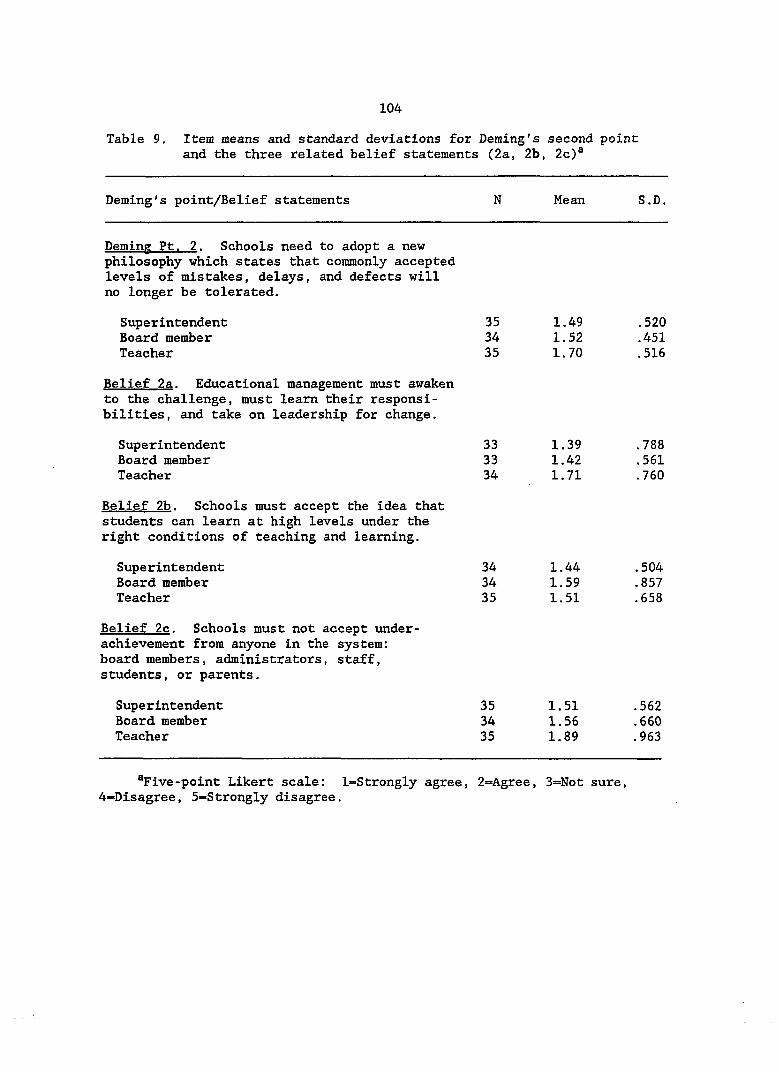
104
Table 9. Item means and standard deviations for Deming's second point and the three related belief statements (2a, 2b, 2c)®
Deming's point/Belief statements N Mean S.D.
Deminp Pt. 2. Schools need to adopt a new philosophy which states that commonly accepted levels of mistakes, delays, and defects will no longer be tolerated.
Superintendent 35 1, .49 .520 Board member 34 1. ,52 .451 Teacher 35 1. ,70 .516
Belief 2a. Educational management must awaken to the challenge, must learn their responsibilities, and take on leadership for change.
Superintendent 33 1, .39 .788 Board member 33 1, ,42 .561 Teacher 34 1. ,71 .760
Belief 2b. Schools must accept the idea that students can learn at high levels under the right conditions of teaching and learning.
Superintendent 34 1, .44 .504 Board member 34 1, ,59 .857 Teacher 35 1. ,51 .658
Belief 2c. Schools must not accept under-achievement from anyone in the system: board members, administrators, staff, students, or parents.
Superintendent 35 1.51 .562 Board member 34 1.56 .660 Teacher 35 1.89 .963
F̂ive-point Likert scale; l=Strongly agree, 2'=Agree, 3=Not sure, 4-Disagree, 5-Strongly disagree.
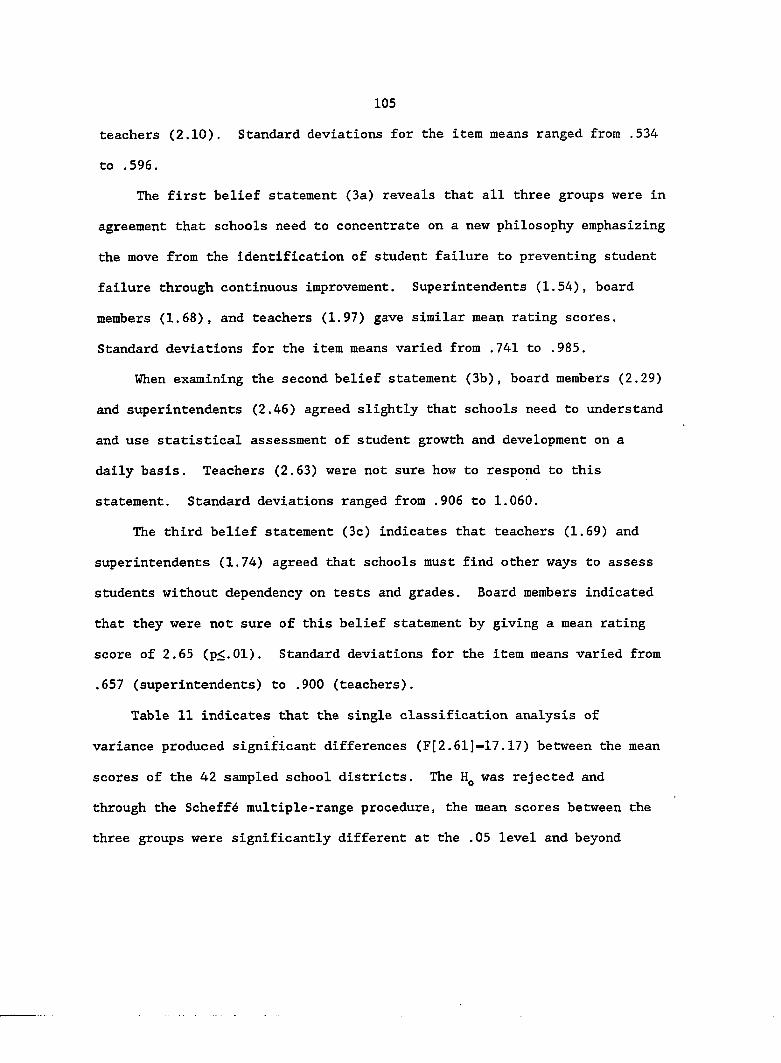
105
teachers (2.10). Standard deviations for the item means ranged from .534
to .596.
The first belief statement (3a) reveals that all three groups were in
agreement that schools need to concentrate on a new philosophy emphasizing
the move from the identification of student failure to preventing student
failure through continuous improvement. Superintendents (1.54), board
members (1.68), and teachers (1.97) gave similar mean rating scores.
Standard deviations for the item means varied from .741 to .985.
When examining the second belief statement (3b), board members (2.29)
and superintendents (2.46) agreed slightly that schools need to understand
and use statistical assessment of student growth and development on a
daily basis. Teachers (2.63) were not sure how to respond to this
statement. Standard deviations ranged from .906 to 1.060.
The third belief statement (3c) indicates that teachers (1.69) and
superintendents (1.74) agreed that schools must find other ways to assess
students without dependency on tests and grades. Board members indicated
that they were not sure of this belief statement by giving a mean rating
score of 2.65 (p<.01). Standard deviations for the item means varied from
.657 (superintendents) to .900 (teachers).
Table 11 indicates that the single classification analysis of
variance produced significant differences (F[2.61J-17.17) between the mean
scores of the 42 sampled school districts. The was rejected and
through the Scheffé multiple-range procedure, the mean scores between the
three groups were significantly different at the .05 level and beyond
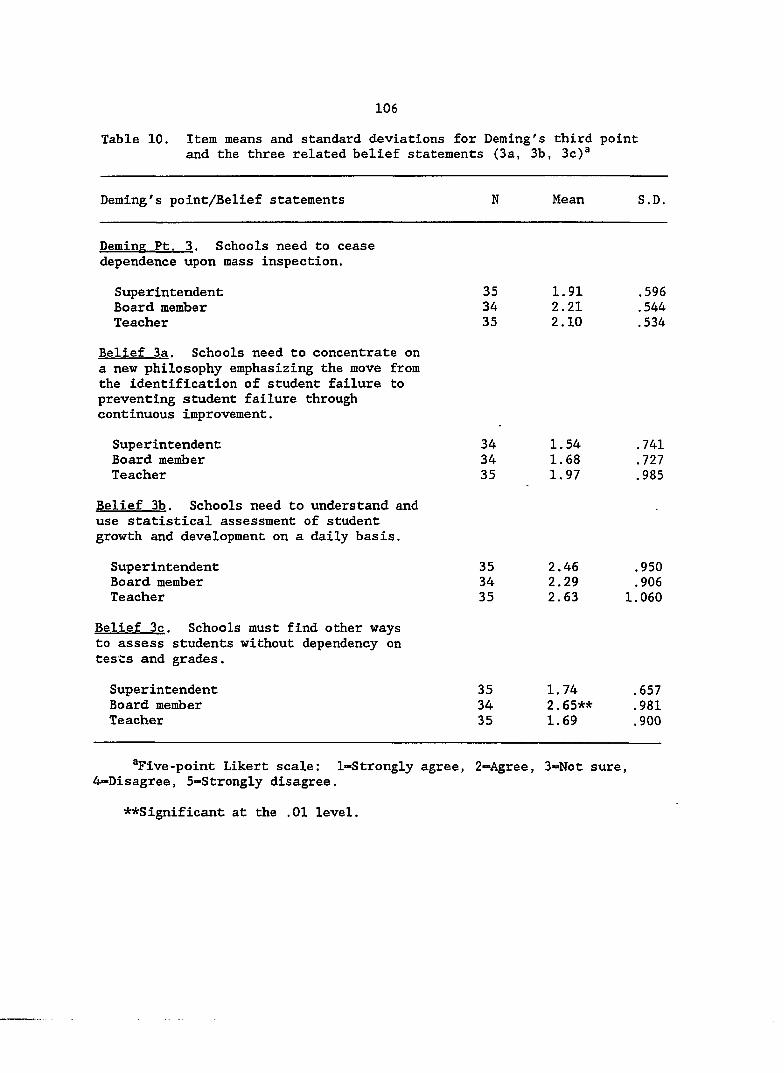
106
Table 10. Item means and standard deviations for Deming's third point and the three related belief statements (3a, 3b, 3c)®
Deming's point/Belief statements N Mean S.D.
Deming Pt. 3. Schools need to cease dependence upon mass inspection.
Superintendent 35 1.91 .596 Board member 34 2.21 .544 Teacher 35 2.10 .534
Belief 3a. Schools need to concentrate on a new philosophy emphasizing the move from the identification of student failure to preventing student failure through continuous improvement.
Superintendent 34 1.54 .741 Board member 34 1.68 .727 Teacher 35 1.97 .985
Belief 3b. Schools need to understand and use statistical assessment of student growth and development on a daily basis.
Superintendent 35 2.46 .950 Board member 34 2.29 .906 Teacher 35 2.63 1.060
Belief 3c. Schools must find other ways to assess students without dependency on tests and grades.
Superintendent 35 1.74 .657 Board member 34 2.65** .981 Teacher 35 1.69 .900
^Five-point Likert scale: 1-Strongly agree, 2—Agree, 3«»Not sure, 4-Disagree, 5-Strongly disagree.
**Significant at the .01 level.
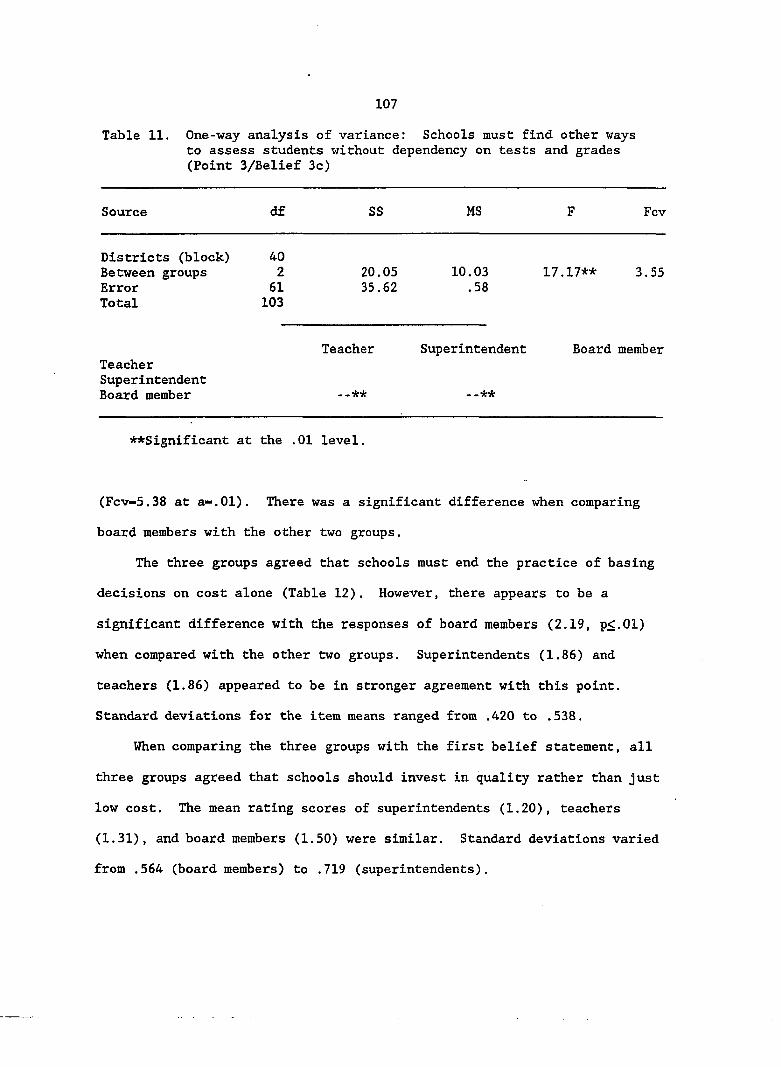
107
Table 11. One-way analysis of variance: Schools must find other ways to assess students without dependency on tests and grades (Point 3/Belief 3c)
Source df SS MS F Fcv
Districts (block) 40 Between groups 2 20.05 10.03 17.17** 3.55 Error 61 35.62 .58 Total 103
Teacher Superintendent Board member Teacher Superintendent Board member - -**
**Significant at the .01 level.
(Fcv"5.38 at a—.01). There was a significant difference when comparing
board members with the other two groups.
The three groups agreed that schools must end the practice of basing
decisions on cost alone (Table 12). However, there appears to be a
significant difference with the responses of board members (2.19, p<.01)
when compared with the other two groups. Superintendents (1.86) and
teachers (1.86) appeared to be in stronger agreement with this point.
Standard deviations for the item means ranged from .420 to .538.
When comparing the three groups with the first belief statement, all
three groups agreed that schools should invest in quality rather than just
low cost. The mean rating scores of superintendents (1.20), teachers
(1.31), and board members (1.50) were similar. Standard deviations varied
from .564 (board members) to .719 (superintendents).
108
Table 12. Item means and standard deviations for Deming's fourth point and the three related belief statements (4a, 4b, 4c)®
Deming's point/Belief statements N Mean S.D.
Deming Ft. 4. Schools must end the practice of basing decisions on cost alone.
Superintendent 35 1. ,86 .538 Board member 34 2, 19** .420 Teacher 35 1. ,86 .438
Belief 4a. Schools should invest in quality rather than just low cost.
Superintendent 35 1.20 .719 Board member 34 1.50 .564 Teacher 35 1.31 .631
Belief 4b. Schools should choose, use, and evaluate facilities, textbooks, technologies, and other resources in teaching based on statistical evidence of success of the particular product and upon accepted outcome measurements.
Superintendent 35 2, .20 .933 Board member 34 2, ,03 .577 Teacher 35 2, ,17 .954
Belief 4c. Schools need to cease dependence on testing to achieve quality and instead provide learning experiences which create quality performance.
Superintendent 35 2, .17 .923 Board member 34 3, .03** .993 Teacher 35 2, ,09 .818
®Five-point Likert scale: 1-Strongly agree, 2=Agree, 3=Not sure, 4-Disagree, 5-Strongly disagree.
**Significant at the .01 level.
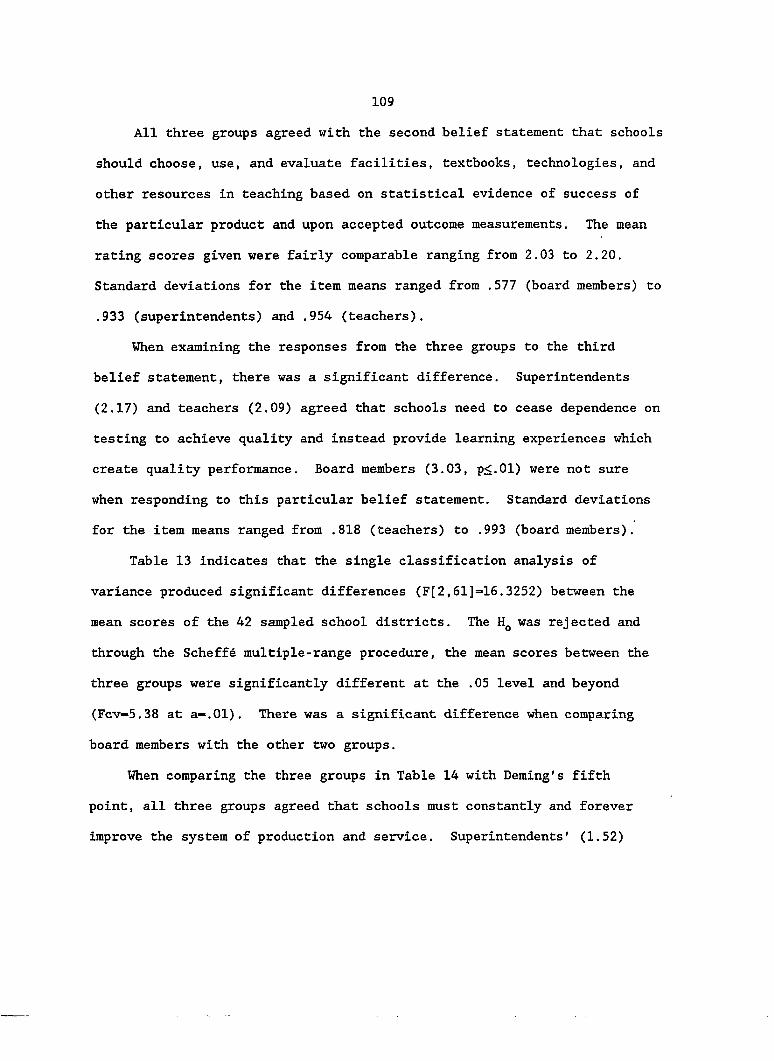
109
All three groups agreed with the second belief statement that schools
should choose, use, and evaluate facilities, textbooks, technologies, and
other resources in teaching based on statistical evidence of success of
the particular product and upon accepted outcome measurements. The mean
rating scores given were fairly comparable ranging from 2.03 to 2.20.
Standard deviations for the item means ranged from .577 (board members) to
.933 (superintendents) and .954 (teachers).
When examining the responses from the three groups to the third
belief statement, there was a significant difference. Superintendents
(2.17) and teachers (2.09) agreed that schools need to cease dependence on
testing to achieve quality and instead provide learning experiences which
create quality performance. Board members (3.03, p<.01) were not sure
when responding to this particular belief statement. Standard deviations
for the item means ranged from .818 (teachers) to .993 (board members).
Table 13 indicates that the single classification analysis of
variance produced significant differences (F[2,61]=16,3252) between the
mean scores of the 42 sampled school districts. The was rejected and
through the Scheffé multiple-range procedure, the mean scores between the
three groups were significantly different at the .05 level and beyond
(Fcv-5.38 at a-.01). There was a significant difference when comparing
board members with the other two groups.
When comparing the three groups in Table 14 with Deming's fifth
point, all three groups agreed that schools must constantly and forever
improve the system of production and service. Superintendents' (1.52)
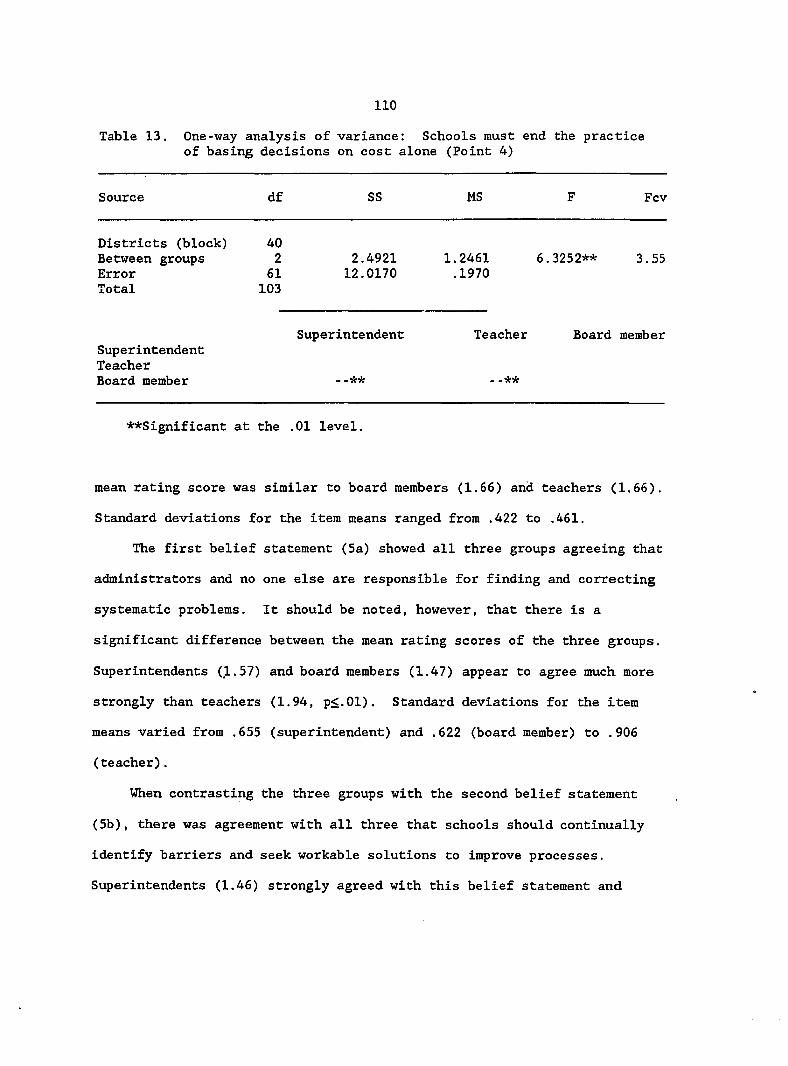
110
Table 13. One-way analysis of variance: Schools must end the practice of basing decisions on cost alone (Point 4)
Source df SS MS F Fcv
Districts (block) Between groups Error Total
40 2 61 103
2.4921 12.0170
1.2461 .1970
6.3252** 3.55
Superintendent Teacher Board member
Superintendent
- -**
Teacher
. .**
Board member
**Significant at the .01 level.
mean rating score was similar to board members (1.66) and teachers (1.66).
Standard deviations for the item means ranged from .422 to .461.
The first belief statement (5a) showed all three groups agreeing that
administrators and no one else are responsible for finding and correcting
systematic problems. It should be noted, however, that there is a
significant difference between the mean rating scores of the three groups.
Superintendents (.1.57) and board members (1.47) appear to agree much more
strongly than teachers (1.94, p<.01). Standard deviations for the item
means varied from .655 (superintendent) and .622 (board member) to .906
(teacher).
When contrasting the three groups with the second belief statement
(5b), there was agreement with all three that schools should continually
identify barriers and seek workable solutions to improve processes.
Superintendents (1.46) strongly agreed with this belief statement and
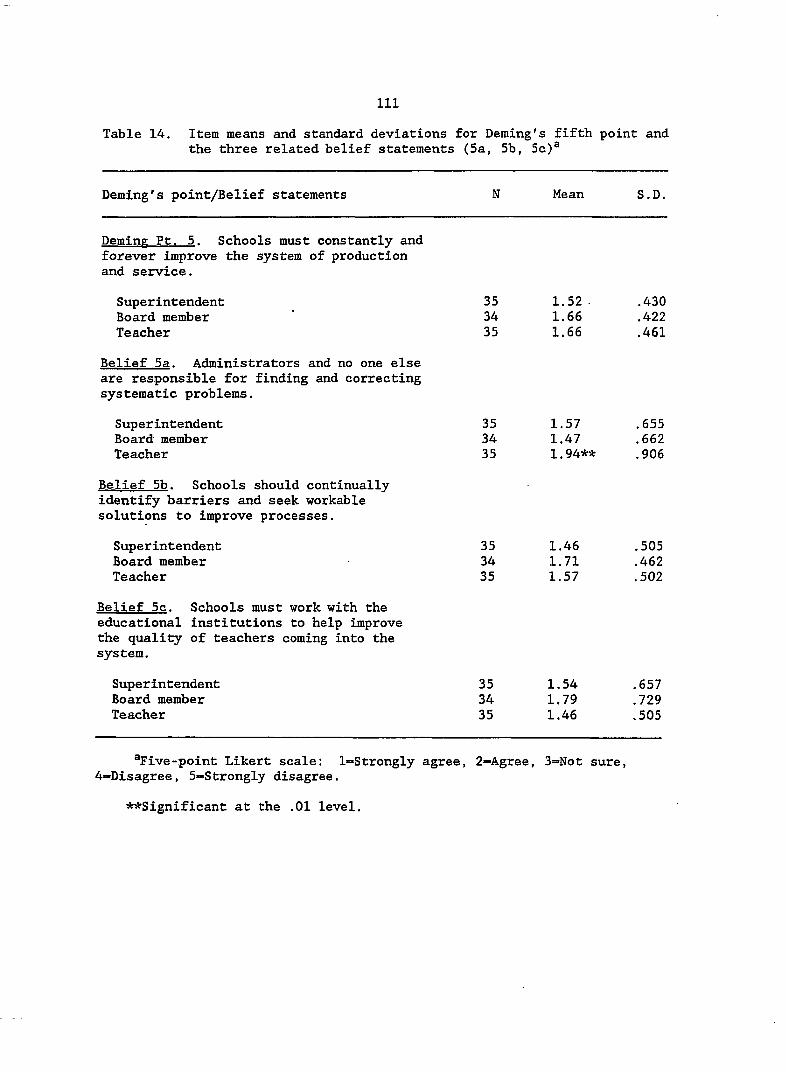
Ill
Table 14. Item means and standard deviations for Deming's fifth point and the three related belief statements (5a, 5b, 5c)®
Deming's point/Belief statements N Mean S.D.
Deminp Ft. 5. Schools must constantly and forever improve the system of production and service.
Superintendent 35 1.52 .430 Board member 34 1.66 .422 Teacher 35 1.66 .461
Belief 5a. Administrators and no one else are responsible for finding and correcting systematic problems.
Superintendent 35 1.57 .655 Board member 34 1.47 .662 Teacher 35 1.94** .906
Belief 5b. Schools should continually identify barriers and seek workable solutions to improve processes.
Superintendent 35 1, .46 .505 Board member 34 1, .71 .462 Teacher 35 1. ,57 .502
Belief 5c. Schools must work with the educational institutions to help improve the quality of teachers coming into the system.
Superintendent 35 1.54 .657 Board member 34 1.79 .729 Teacher 35 1.46 .505
*Five-point Likert scale: l=Strongly agree, 2-Agree, 3=Not sure, 4-Disagree, 5-Strongly disagree.
**Significant at the .01 level.
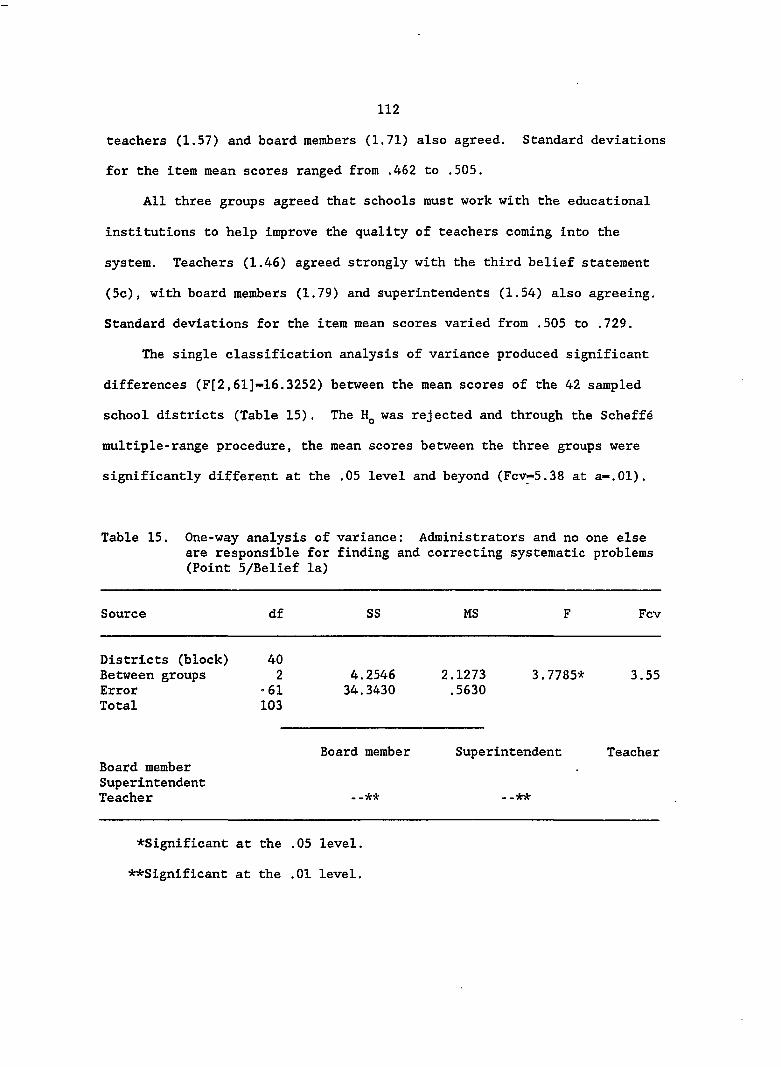
112
teachers (1.57) and board members (1.71) also agreed. Standard deviations
for the item mean scores ranged from .462 to .505.
All three groups agreed that schools must work with the educational
institutions to help improve the quality of teachers coming into the
system. Teachers (1.46) agreed strongly with the third belief statement
(5c), with board members (1.79) and superintendents (1.54) also agreeing.
Standard deviations for the item mean scores varied from .505 to .729.
The single classification analysis of variance produced significant
differences (F[2,61]-16.3252) between the mean scores of the 42 sampled
school districts (Table 15). The was rejected and through the Scheffé
multiple-range procedure, the mean scores between the three groups were
significantly different at the .05 level and beyond (Fcv-5.38 at a-.01).
Table 15. One-way analysis of variance: Administrators and no one else are responsible for finding and correcting systematic problems (Point 5/Belief la)
Source df SS MS F Fcv
Districts (block) 40 Between groups 2 4.2546 2.1273 3.7785* 3.55 Error •61 34.3430 .5630 Total 103
Board member Superintendent Teacher Board member Superintendent Teacher . .** . _**
*Significant at the .05 level.
**Significant at the .01 level.
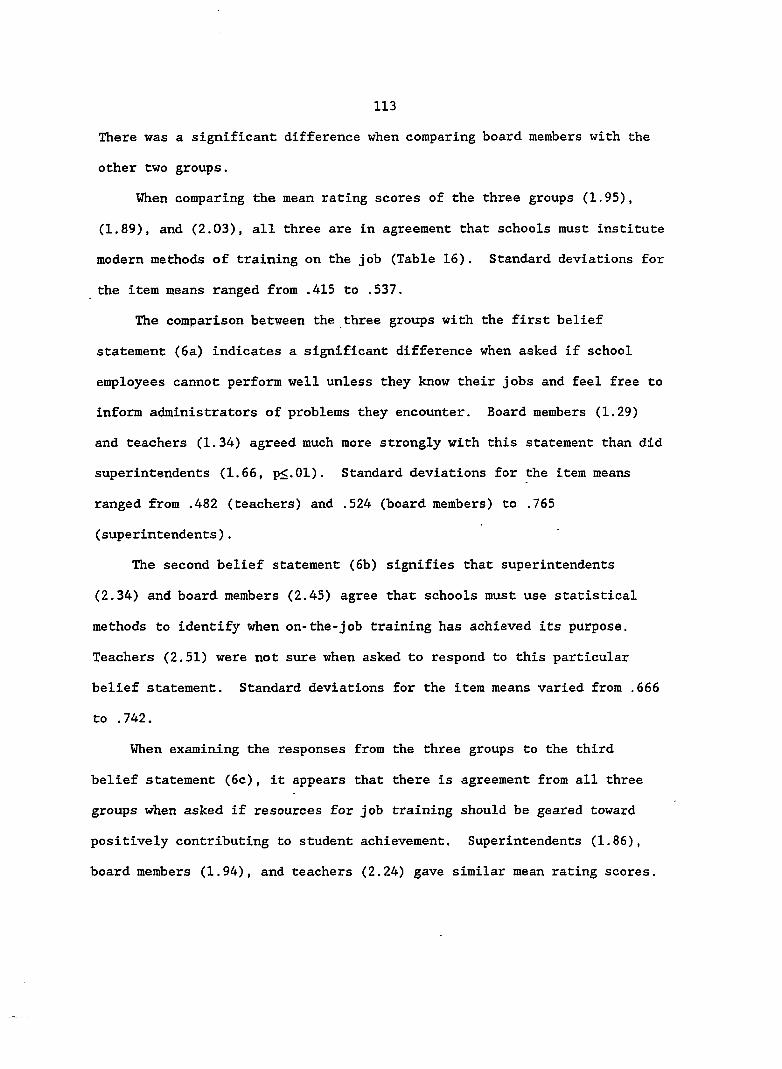
113
There was a significant difference when comparing board members with the
other two groups.
When comparing the mean rating scores of the three groups (1.95),
(1,89), and (2.03), all three are in agreement that schools must institute
modern methods of training on the job (Table 16). Standard deviations for
the item means ranged from .415 to .537.
The comparison between the three groups with the first belief
statement (6a) indicates a significant difference when asked if school
employees cannot perform well unless they know their jobs and feel free to
inform administrators of problems they encounter. Board members (1.29)
and teachers (1.34) agreed much more strongly with this statement than did
superintendents (1.66, p<.01). Standard deviations for the item means
ranged from .482 (teachers) and .524 (board members) to .765
(superintendents).
The second belief statement (6b) signifies that superintendents
(2.34) and board members (2.45) agree that schools must use statistical
methods to identify when on-the-job training has achieved its purpose.
Teachers (2.51) were not sure when asked to respond to this particular
belief statement. Standard deviations for the item means varied from .666
to .742.
When examining the responses from the three groups to the third
belief statement (6c), it appears that there is agreement from all three
groups when asked if resources for job training should be geared toward
positively contributing to student achievement. Superintendents (1.86),
board members (1.94), and teachers (2.24) gave similar mean rating scores.
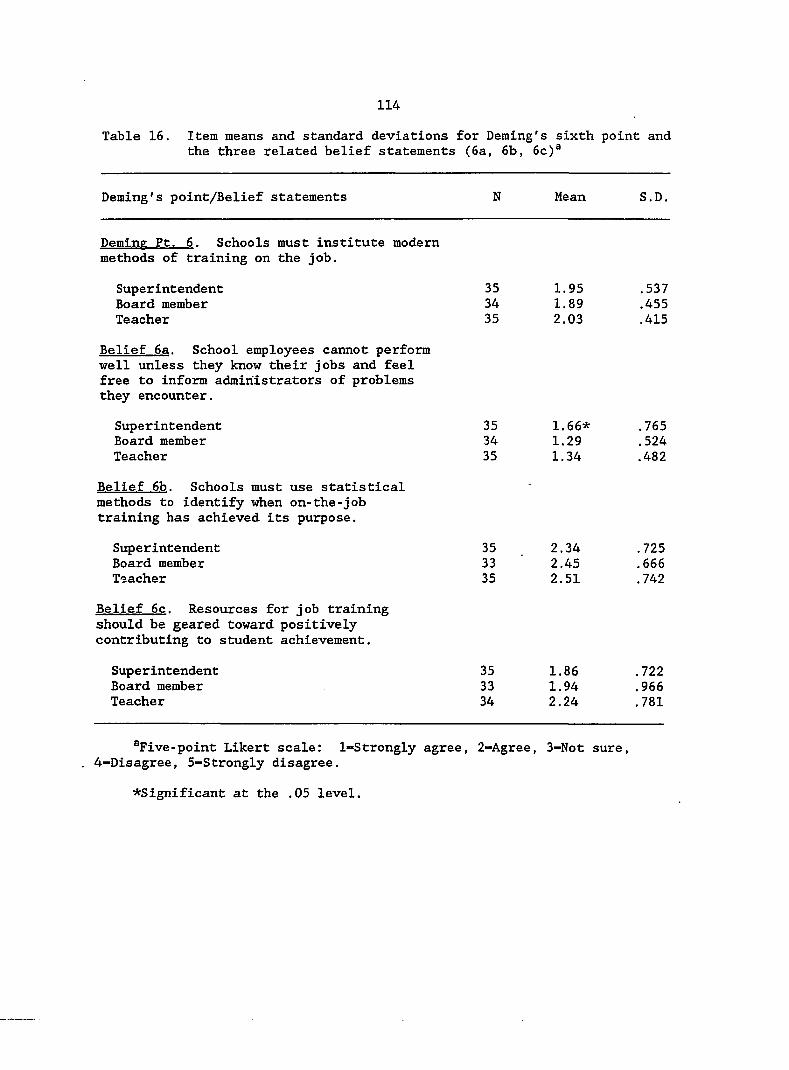
114
Table 16. Item means and standard deviations for Deming's sixth point and the three related belief statements (6a, 6b, 6c)®
Deming's point/Belief statements N Mean S.D.
Deming Pt. 6. Schools must institute modern methods of training on the job.
Superintendent 35 1,95 .537 Board member 34 1.89 .455 Teacher 35 2.03 .415
Belief 6a. School employees cannot perform well unless they know their jobs and feel free to inform administrators of problems they encounter.
Superintendent 35 1, 66* .765 Board member 34 1, ,29 .524 Teacher 35 1. 34 .482
Belief 6b. Schools must use statistical methods to identify when on-the-job training has achieved its purpose.
Superintendent 35 2, ,34 .725 Board member 33 2, ,45 .666 Teacher 35 2, ,51 .742
Belief 6c. Resources for job training should be geared toward positively contributing to student achievement.
Superintendent 35 1, ,86 .722 Board member 33 1, ,94 .966 Teacher 34 2, ,24 .781
^'Five-point Likert scale: 1-Strongly agree, 2-Agree, 3-Not sure, . 4-Disagree, 5-Strongly disagree.
^Significant at the .05 level.
115
Standard deviations for the item means ranged from .722 (superintendents)
to .966 (board members).
The single classification analysis of variance produced significant
differences (F[2,61]-3.7449) between the mean scores of the 42 sampled
school districts (Table 17). The was rejected and through the Scheffé
multiple-range procedure, the mean scores between the three groups were
significantly different at the .05 level. There was a significant
difference when comparing board members with the other two groups.
All three groups agreed that schools must do more to adopt and
institute leadership and get leaders to take responsibility for quality
(Table 18). Superintendents' (1.90) mean rating score was similar with
board members (2.17) and teachers (2.09). Standard deviations for the
item means ranged from .460 to .604.
Table 17. Oné-way analysis of variance: School employees cannot perform well unless they know their jobs and feel free to inform administrators of problems they encounter (Point 6/Belief 6a)
Source df SS MS F Fcv
Districts (block) Between groups Error Total
40 2 61 103
2, 22. .8012 .8140
1.4006 .3740
3.7449* 3.55
Board member Teacher Superintendent
Board member
.*
Teacher Superintendent
•Significant at the .05 level.
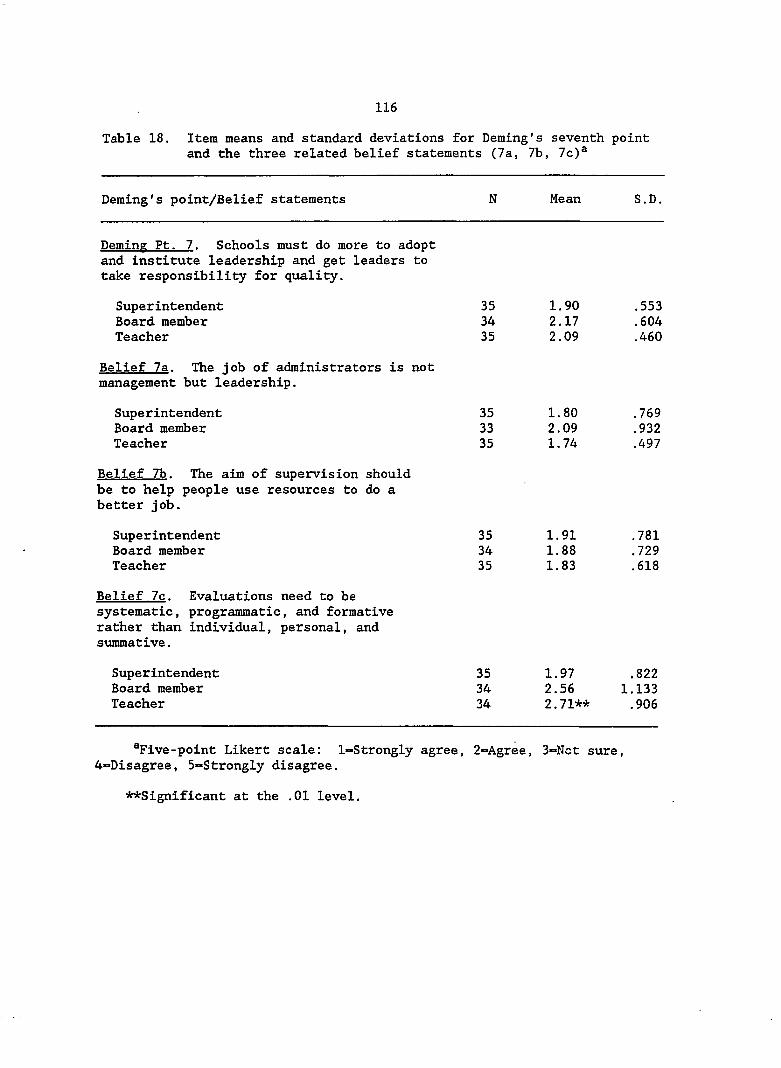
116
Table 18. Item means and standard deviations for Deming's seventh point and the three related belief statements (7a, 7b, 7c)^
Deming's point/Belief statements N Mean S.D.
Deming Ft. 7. Schools must do more to adopt and institute leadership and get leaders to take responsibility for quality.
Superintendent 35 1, .90 .553 Board member 34 2, .17 .604 Teacher 35 2. ,09 .460
Belief 7a. The job of administrators is not management but leadership.
Superintendent 35 1, .80 .769 Board member 33 2, ,09 .932 Teacher 35 1. ,74 .497
Belief 7b. The aim of supervision should be to help people use resources to do a better job.
Superintendent 35 1, ,91 .781 Board member 34 1, ,88 .729 Teacher 35 1. ,83 .618
Belief 7c. Evaluations need to be systematic, programmatic, and formative rather than individual, personal, and summative.
Superintendent 35 1,97 .822 Board member 34 2.56 1.133 Teacher 34 2.71** .906
^Five-point Likert scale: l=Strongly agree, 2=Agree, 3=Nct sure, 4-Disagree, 5=Strongly disagree.
**Significant at the .01 level.
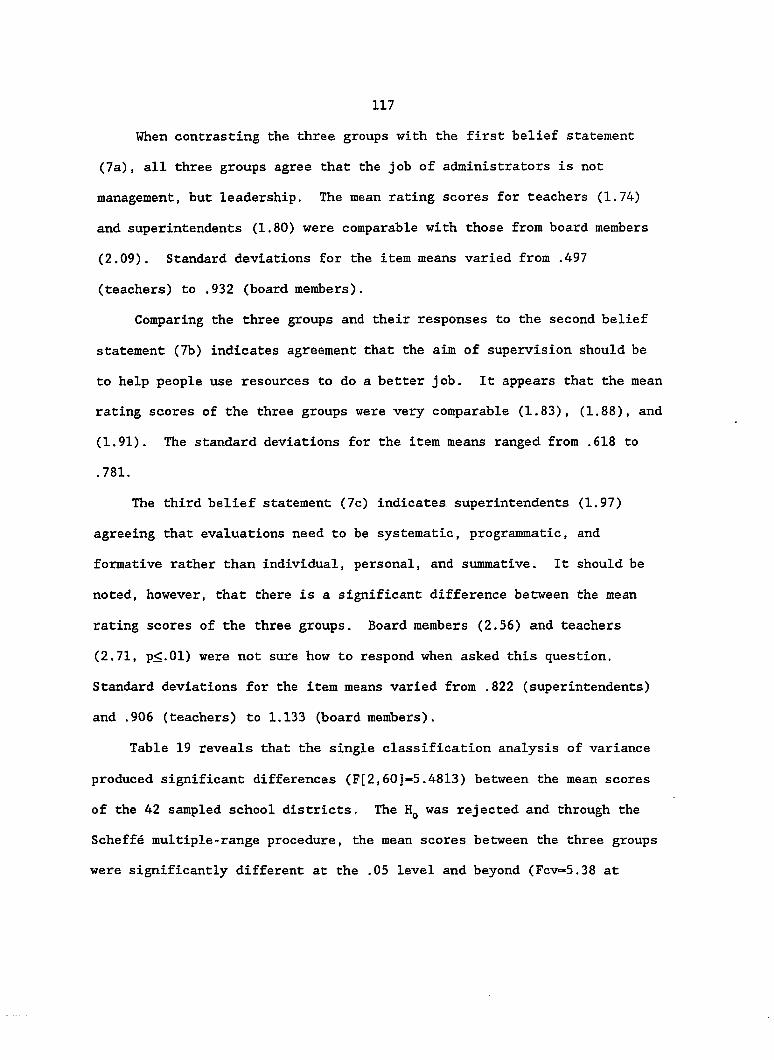
117
When contrasting the three groups with the first belief statement
(7a), all three groups agree that the job of administrators is not
management, but leadership. The mean rating scores for teachers (1.74)
and superintendents (1.80) were comparable with those from board members
(2.09). Standard deviations for the item means varied from .497
(teachers) to .932 (board members).
Comparing the three groups and their responses to the second belief
statement (7b) indicates agreement that the aim of supervision should be
to help people use resources to do a better job. It appears that the mean
rating scores of the three groups were very comparable (1.83), (1.88), and
(1.91). The standard deviations for the item means ranged from .618 to
.781.
The third belief statement (7c) indicates superintendents (1.97)
agreeing that evaluations need to be systematic, programmatic, and
formative rather than individual, personal, and summative. It should be
noted, however, that there is a significant difference between the mean
rating scores of the three groups. Board members (2.56) and teachers
(2.71, p<.01) were not sure how to respond when asked this question.
Standard deviations for the item means varied from .822 (superintendents)
and .906 (teachers) to 1.133 (board members).
Table 19 reveals that the single classification analysis of variance
produced significant differences (F[2,60]-5.4813) between the mean scores
of the 42 sampled school districts. The was rejected and through the
Scheffé multiple-range procedure, the mean scores between the three groups
were significantly different at the .05 level and beyond (Fcv=5.38 at
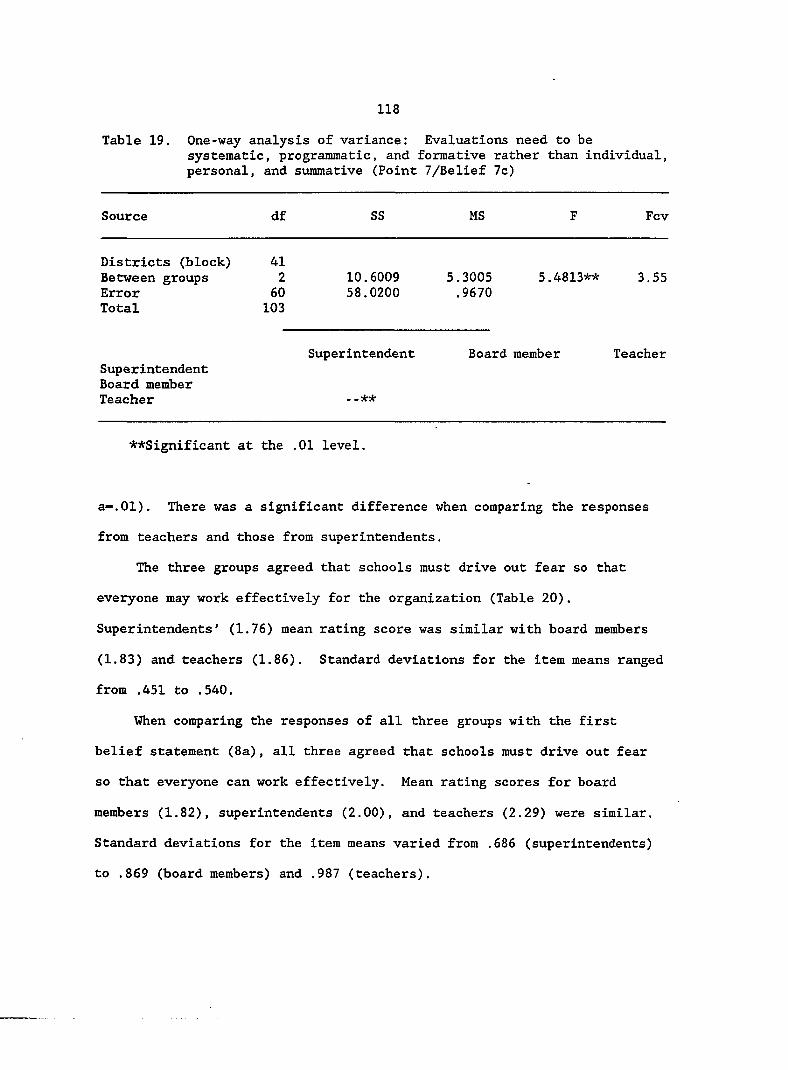
118
Table 19. One-way analysis of variance: Evaluations need to be systematic, programmatic, and formative rather than individual, personal, and summative (Point 7/Belief 7c)
Source df SS MS Fcv
Districts (block) Between groups Error Total
Superintendent Board member Teacher
41 2
60 103
10.6009 58.0200
Superintendent
5.3005 .9670
5.4813**
Board member
3.55
Teacher
. -**
**Significant at the .01 level.
a-.01), There was a significant difference when comparing the responses
from teachers and those from superintendents.
The three groups agreed that schools must drive out fear so that
everyone may work effectively for the organization (Table 20).
Superintendents' (1.76) mean rating score was similar with board members
(1.83) and teachers (1.86). Standard deviations for the item means ranged
from .451 to .540.
When comparing the responses of all three groups with the first
belief statement (8a), all three agreed that schools must drive out fear
so that everyone can work effectively. Mean rating scores for board
members (1.82), superintendents (2.00), and teachers (2.29) were similar.
Standard deviations for the item means varied from .686 (superintendents)
to .869 (board members) and .987 (teachers).
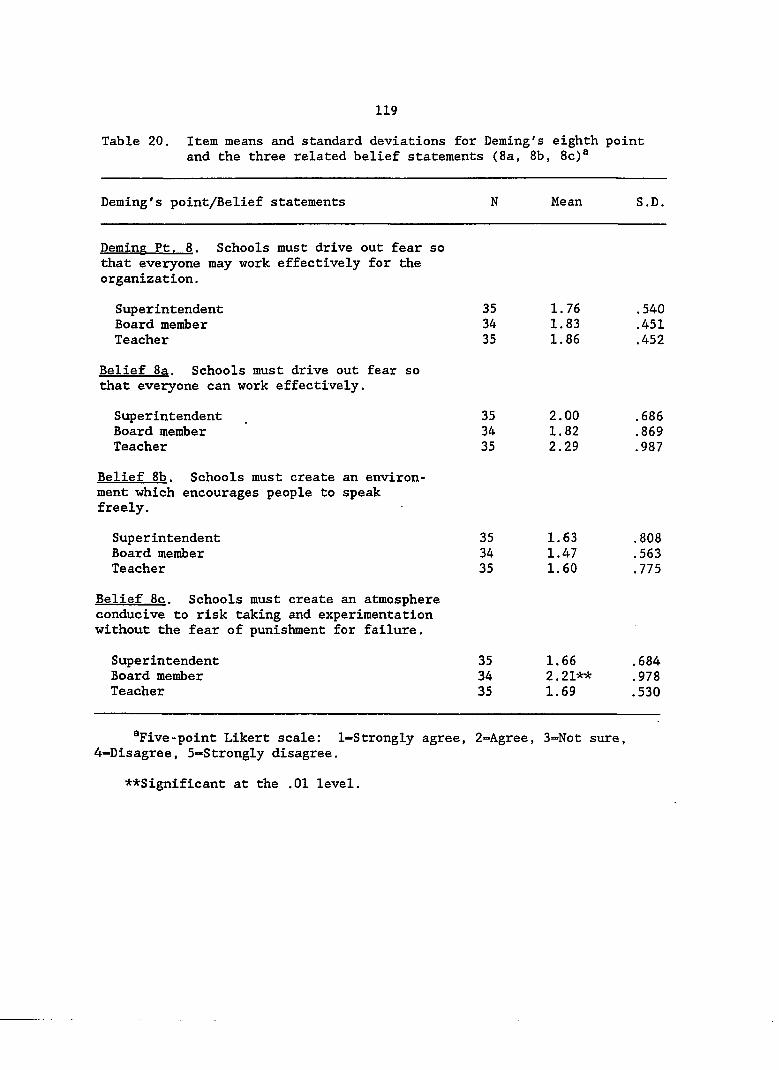
119
Table 20. Item means and standard deviations for Deming's eighth point and the three related belief statements (8a, 8b, 8c)®
Deming's point/Belief statements N Mean S.D.
Deming Pt. 8. Schools must drive out fear so that everyone may work effectively for the organization.
Superintendent 35 1, .76 .540 Board member 34 1. ,83 .451 Teacher 35 1, ,86 .452
Belief 8a. Schools must drive out fear so that everyone can work effectively.
Superintendent 35 2, ,00 .686 Board member 34 1, ,82 .869 Teacher 35 2. ,29 .987
Belief 8b. Schools must create an environ ment which encourages people to speak freely.
Superintendent 35 1. .63 .808 Board member 34 1, .47 .563 Teacher 35 1. ,60 .775
Belief 8c. Schools must create an atmosphere conducive to risk taking and experimentation without the fear of punishment for failure.
Superintendent 35 1, ,66 .684 Board member 34 2, ,21** .978 Teacher 35 1. ,69 .530
^'Five-point Likert scale: l=-Strongly agree, 2=Agree, 3=Not sure, 4=Disagree, 5-Strongly disagree.
••Significant at the .01 level.
120
The second belief statement (8b) indicates the three groups agree
that schools must create an environment which encourages people to speak
freely. Board members (1.47) indicated a similar mean rating score with
those responses from superintendents (1.63) and teachers (1.60). Standard
deviations for the item means ranged from .563 (board members) to .808
(superintendents).
When examining the responses for the third belief statement (8c), the
three groups agree that schools must create an atmosphere conducive to
risk taking and experimentation without fear of punishment for failure.
However, there was a significant difference between the responses of board
members (2.21, p<.01) and those from superintendents (1.66) and/or
teachers (1.69). Board members did not agree as strongly to this belief
as did superintendents and teachers. Standard deviations for the item
means ranged from .530 (teachers) and .684 (superintendents) to .978
(board members).
The single classification analysis of variance produced significant
differences (F[2,61]=6.1710) between the mean scores of the 42 sampled
school districts (Table 21). The was rejected and through the Scheffé
multiple-range procedure, the mean scores between the three groups were
significantly different at the .05 level and beyond (Fcv-5.38 at a=.01).
There was a significant difference when comparing board members with
superintendents and teachers.
Table 22 reveals that the three groups agree with Deming's ninth
belief statement. Mean rating scores of superintendents (1.77) and board
members (1.76) were similar with those of teachers (1.83) when asked if
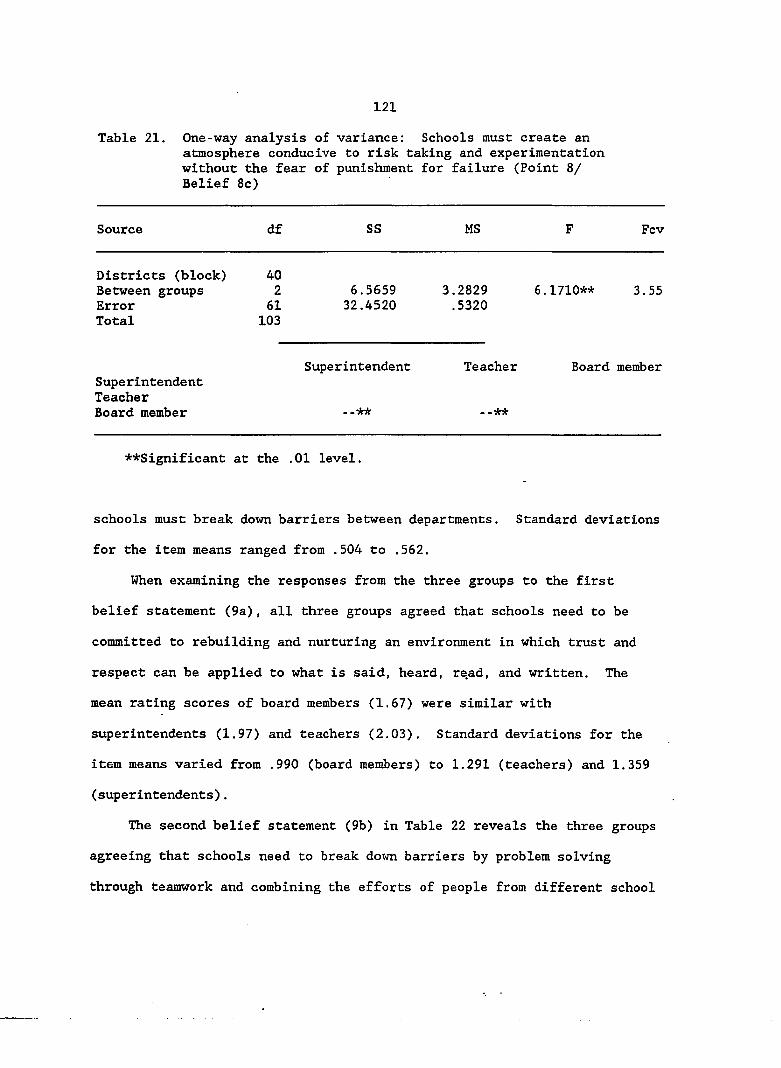
121
Table 21. One-way analysis of variance: Schools must create an atmosphere conducive to risk taking and experimentation without the fear of punishment for failure (Point 8/ Belief 8c)
Source df SS MS F Fcv
Districts (block) Between groups Error Total
40 2 61 103
6.5659 32.4520
3.2829 .5320
6.1710** 3.55
Superintendent Teacher Board member
Superintendent
- .**
Teacher
- .**
Board member
**Significant at the .01 level.
schools must break down barriers between departments. Standard deviations
for the item means ranged from .504 to .562.
When examining the responses from the three groups to the first
belief statement (9a), all three groups agreed that schools need to be
committed to rebuilding and nurturing an environment in which trust and
respect can be applied to what is said, heard, read, and written. The
mean rating scores of board members (1.67) were similar with
superintendents (1.97) and teachers (2.03). Standard deviations for the
item means varied from .990 (board members) to 1.291 (teachers) and 1,359
(superintendents).
The second belief statement (9b) in Table 22 reveals the three groups
agreeing that schools need to break down barriers by problem solving
through teamwork and combining the efforts of people from different school
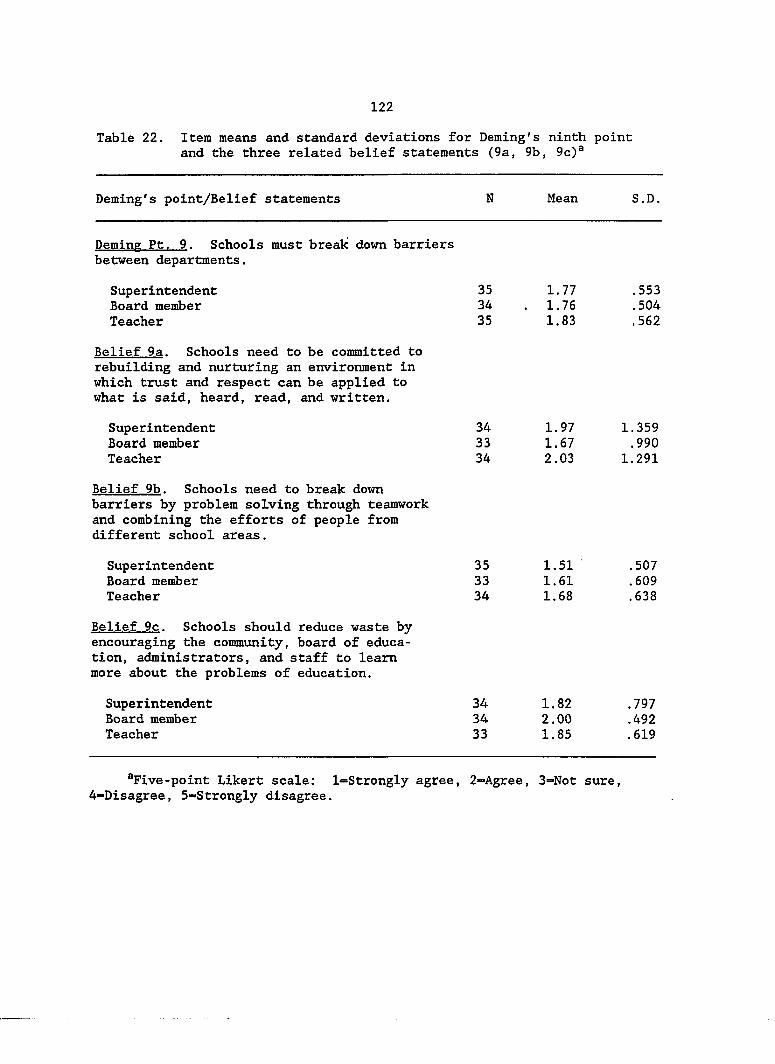
122
Table 22. Item means and standard deviations for Deming's ninth point and the three related belief statements (9a, 9b, 9c)®
Deming's point/Belief statements N Mean S.D.
Deming Pt. 9. Schools must break down barriers between departments.
Superintendent 35 1, .77 .553 Board member 34 . 1. ,76 .504 Teacher 35 1, ,83 .562
Belief 9a. Schools need to be committed to rebuilding and nurturing an environment in which trust and respect can be applied to what is said, heard, read, and written.
Superintendent 34 1.97 1.359 Board member 33 1.67 .990 Teacher 34 2.03 1.291
Belief 9b. Schools need to break down barriers by problem solving through teamwork and combining the efforts of people from different school areas.
Superintendent 35 1, .51 • .507 Board member 33 1, ,61 .609 Teacher 34 1, ,68 .638
Belief 9c. Schools should reduce waste by encouraging the community, board of education, administrators, and staff to learn more about the problems of education.
Superintendent 34 1, .82 .797 Board member 34 2, .00 .492 Teacher 33 1, .85 .619
®Five-point Likert scale: l=Strongly agree, 2-»Agree, 3=Not sure, 4-Disagree, 5-Strongly disagree.
123
areas. When contrasting the three groups' mean scores, superintendents
(1.51) gave a similar mean rating score as did board members (1.61) and
teachers (1.68). Standard deviations for the item means ranged from .507
to .638.
When examining the third belief statement (9c), it appears that all
three groups agreed that schools should reduce waste by encouraging the
community, board of education, administrators, and staff to learn more
about the problems of education. When comparing the mean scores of the
three groups, superintendents (1.82) and teachers (1.85) were in similar
agreement with board members (2.00). Standard deviations for the item
means varied from .492 (board members) to .619 (teachers) and .797
(superintendents).
There were some different responses from the three groups when asked
if schools must eliminate posters and slogans that ask staff for new
levels of productivity without providing new methods (Table 23) .
Superintendents (3.48) were not sure when asked to respond to this item
while board members (3.89, p<.01) and teachers (3.50) disagreed with
Deming's ninth point. There was a significant difference between board
members' responses and the mean rating score of one or both of the other
groups. Standard deviations for the item means ranged from .391 (board
members) and .579 (teachers) to .742 (superintendents).
When examining the first belief statement (10a), it appears that all
three groups were not sure when asked if schools should eliminate the use
of goals, targets, and slogans to encourage performance—unless training
and administrative support are provided to meet the goals. Teachers

124
Table 23. Item means and standard deviations for Darning's tenth point and the three related belief statements (10a, 10b, 10c)®
Deming's point/Belief statements N Mean S.D.
Deming Ft. 10. Schools must eliminate posters and slogans that ask staff for new levels of productivity without providing new methods.
Superintendent 35 3.48 .742 Board member 34 3.89** .391 Teacher 35 3.50 .579
Belief 10a. Schools should eliminate the use of goals, targets, and slogans to encourage performance--unless training and administrative support are provided to meet the goals.
Superintendent 34 2, .97 1.029 Board member 34 3, ,29 1.315 Teacher 35 2, ,71 .893
Belief 10b. The causes of low quality and low productivity belong to the system and thus lie beyond the control of teachers and students.
Superintendent 35 4.14 .974 Board member 34 4.50 .663 Teacher 35 4.00 .840
Belief 10c. Work quotas such as test results cause low morale in schools.
Superintendent 35 2.31 1, ,051 Board member 34 3.00** ,816 Teacher 35 2.37 1. ,060
^Five-point Likert scale: 1-Strongly agree, 2-Agree, 3=Not sure, 4-Disagree, 5-Strongly disagree.
**Signifleant at the .01 level.
125
(2.71) gave a similar mean rating score when compared to superintendents
(2.97) and board members (3.29). Standard deviations for the item means
ranged from .893 (teachers) and 1.029 (superintendents) to 1.315 (board
members).
Table 23 reveals that all three groups disagreed that the causes of
low quality and low productivity belong to the system and thus lie beyond
the control of teachers and students. Mean rating scores of
superintendents (4.14) and teachers (4.00) were very comparable in showing
disagreement with the second belief statement (10b). However, board
members (4.50) disagreed strongly with the statement. Standard deviations
for the item means ranged from .663 (board members) and .840 (teachers) to
.974 (superintendents).
The third belief statement (10c) indicates that the three groups
differed in their opinion when asked if work quotas such as test results
cause low morale in schools. Superintendents (2.31) and teachers (2.37)
agreed with this statement while board members (3.00, p<.01) were not sure
how to respond to this statement. Standard deviations for the item means
varied from .816 to 1.060.
There is a significant difference between the response from board
members and the responses from one or both of the other groups.
The single classification analysis of variance produced significant
differences (F[2,61]=5.38) between the mean scores of the 42 sampled
school districts (Table 24). The was rejected and through the Scheffé
multiple-range procedure, the mean scores between the three groups were
significantly different at the .05 level and beyond (Fcv=5.38 at a=.01).
126
Table 24. One-way analysis of variance: Schools must eliminate posters and slogans that ask staff for new levels of productivity without providing new methods (Point 10)
Source df SS MS F Fcv
Districts (block) Between groups Error Total
40 2 61 103
3, 21,
,747 ,235
1.873 .348
5.38** 3.55
Teacher Superintendent Board member
Teacher
- .**
Superintendent
. -**
Board member
**Significant at the .01 level.
There was a significant difference when comparing board members with
superintendents and teachers.
Table 25 shows that the single classification analysis of variance
produced significant differences (F[2,61]-5.3733) between the mean scores
of the 42 sampled school districts. The was rejected and through the
Scheffé multiple-range procedure, the mean scores between the three groups
were significantly different at the .05 level and beyond (Fcv=5.38 at
a-.01). There was a significant difference when comparing board members
with superintendents and teachers.
The three groups were not sure when asked to respond to whether or
not schools must eliminate numerical goals and quotas for the work force
(Table 26). The mean rating score for teachers (2.52) was similar with
those responses from board members (2.81) and superintendents (2.71).
127
Table 25. One-way analysis of variance: Work quotas such as test results cause low morale in schools (Point 10/Belief 10c)
Source df SS MS F Fcv
Districts (block) 40 Between groups 2 10.0315 5.0158 5.8733** 3.55 Error 61 52,0940 .8540 Total 103
Superintendent Teacher Board member Superintendent Teacher Board member - .** - -**
**Significant at the .01 level.
Standard deviations for the item means ranged from .570 (teachers) and
.576 (board members) to .755 (superintendents).
When examining the first belief statement (11a), all three groups
agreed that all educational employees must be involved in identifying
problems, designing program, planning, budgeting, and selecting material.
When comparing the mean rating scores of the three groups, it appears that
board members (1.65) gave a similar mean rating score as teachers (1.86)
and superintendents (2.06). Standard deviations for the item means ranged
from .734 (board members) to .998 (superintendents).
Table 26 indicates that all three groups were not sure when asked if
schools must eliminate management by numbers and numerical goals and
instead substitute leadership. There was a similar comparison in the mean
rating scores between teachers (2.71), board members (3.29), and
128
Table 26. Item means and standard deviations for Deming's eleventh point and the three related belief statements (11a, lib, 11c)®
Deming's point/Belief statements N Mean S.D.
Deming Ft. 11. Schools must eliminate numerical goals and quotas for the work force.
Superintendent 35 2 .71 .755 Board member 34 2, ,81 .576 Teacher 35 2, ,52 .570
Belief 11a. All educational employees must be involved in identifying problems, designing program, planning, budgeting, and selecting material.
Superintendent 34 2.06 .998 Board member 34 1.65 .734 Teacher 35 1.86 .845
Belief lib. Schools must eliminate manage ment by numbers and numerical goals and instead substitute leadership.
Superintendent 34 2 .97 • 1.029 Board member 34 3, .29 1.315 Teacher 35 2 .71 .893
Belief 11c. Grades and test scores do not motivate the student to learn, but rather drive out the joy of learning.
Superintendent 35 3, .09 3.121 Board member 34 3, .50 .707 Teacher 34 3, .03 1.243
^'Five-point Likert scale: 1-Strongly agree, 2-Agree, 3=Not sure, 4=Disagree, 5=Strongly disagree.
129
superintendents (2.97). Standard deviations for the item means varied
from .893 (teachers) to 1.029 (superintendents) and 1.315 (board members).
The third belief statement (3c) indicates somewhat of a difference in
the responses from the three groups. Board members (3.50) disagreed when
asked if grades and test scores do not motivate the students to learn, but
rather drive out the joy of learning. Teachers (3.03) and superintendents
(3.09) were not sure when responding to this statement. Standard
deviations for the item means ranged from .707 (board members) and 1.243
(teachers) to 1.121 (superintendents).
Table 27 indicates that all three groups were not sure if schools
must remove barriers that rob people of pride in workmanship and eliminate
the annual rating or merit system. ' When comparing the mean rating scores
of the three groups, superintendents (2.62), board members (2.67), and
teachers (2.55) were similar. Standard deviations for the item means
ranged from .435 to .567.
When examining the first belief statement (12a), it appears that the
three groups were not sure when asked if traditional practices of teacher
evaluation destroys teamwork, fosters mediocrity, and fosters short-term
thinking--all detriments to continuing improvement. The mean scores of
the three groups were somewhat similar, although teachers (2.74) tended to
be closer to agreeing with this statement than did superintendents (2.94)
or board members (3.00). Standard deviations for the item means varied
from 1.067 (teachers) to 1.235 (superintendents) and 1.348 (board
members).
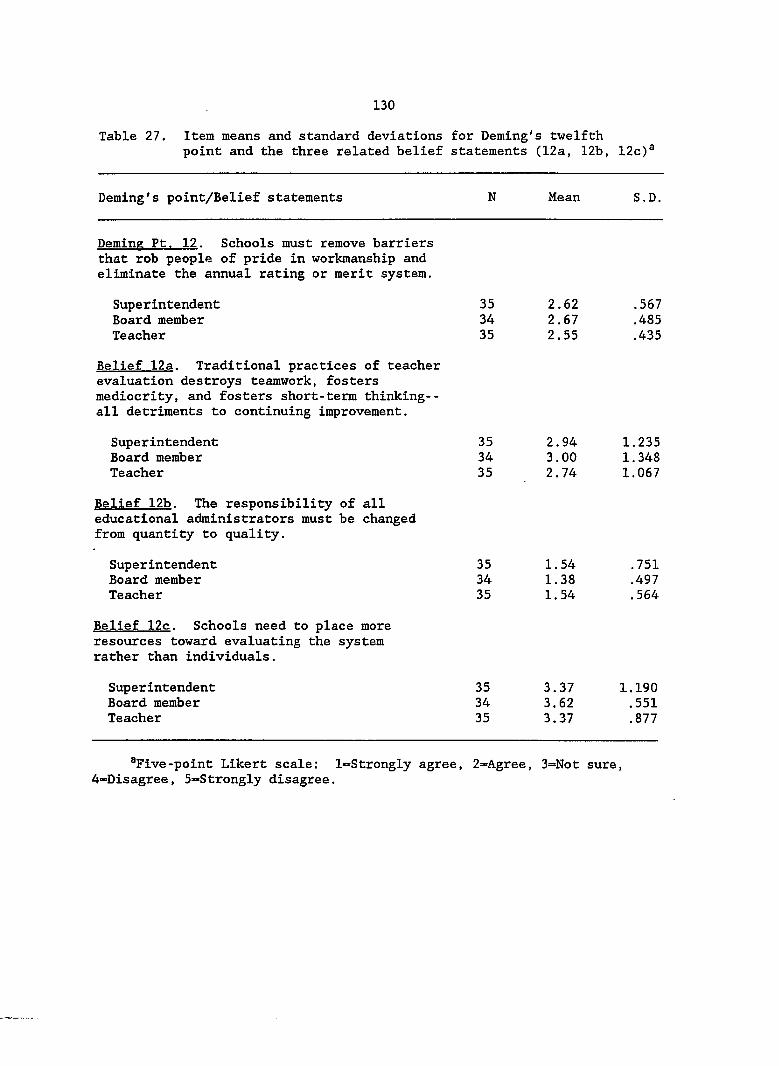
130
Table 27. Item means and standard deviations for Deming's twelfth point and the three related belief statements (12a, 12b, 12c)®
Deming's point/Belief statements N Mean S.D.
Deming Ft. 12. Schools must remove barriers that rob people of pride in workmanship and eliminate the annual rating or merit system.
Superintendent 35 2.62 .567 Board member 34 2.67 .485 Teacher 35 2.55 .435
Belief 12a. Traditional practices of teacher evaluation destroys teamwork, fosters mediocrity, and fosters short-term thinking--all detriments to continuing improvement.
Superintendent 35 2 .94 1, .235 Board member 34 3, .00 1, ,348 Teacher 35 2, .74 1. ,067
Belief 12b. The responsibility of all educational administrators must be changed from quantity to quality.
Superintendent 35 1, ,54 .751 Board member 34 1. ,38 .497 Teacher 35 1. ,54 .564
Belief 12c. Schools need to place more resources toward evaluating the system rather than individuals.
Superintendent 35 3.37 1.190 Board member 34 3.62 .551 Teacher 35 3.37 .877
^Five-point Likert scale: l«=Strongly agree, 2=Agree, 3=Not sure, 4-Disagree, 5-Strongly disagree.
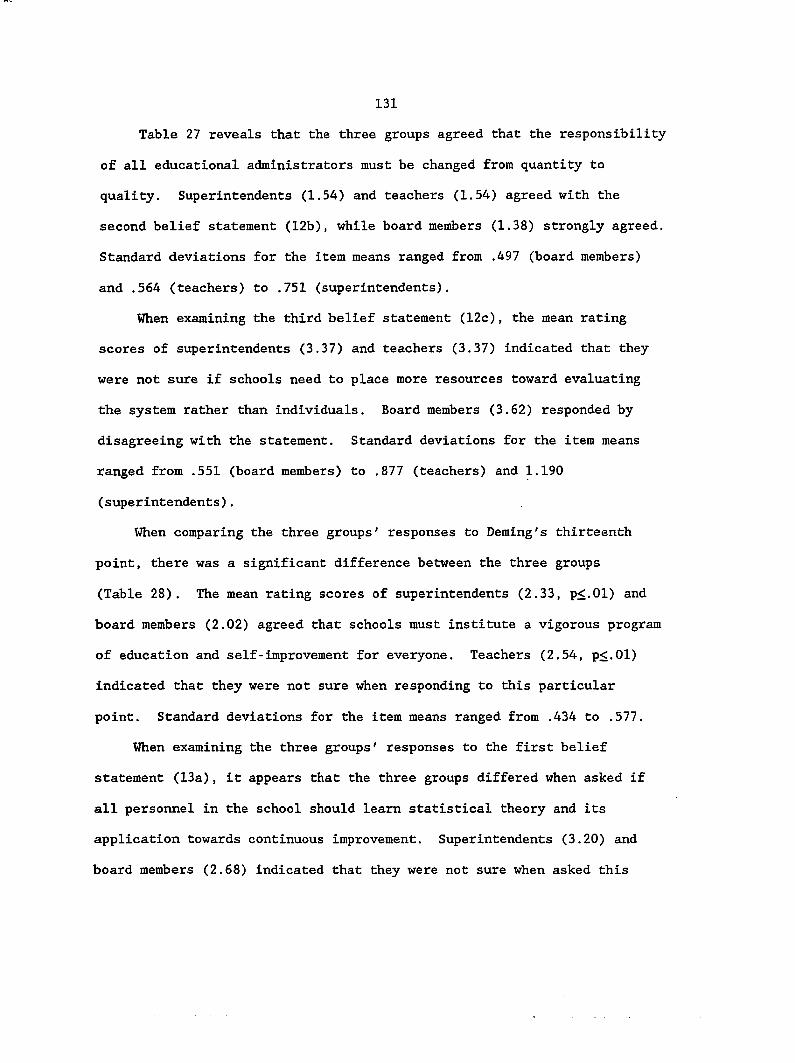
131
Table 27 reveals that the three groups agreed that the responsibility
of all educational administrators must be changed from quantity to
quality. Superintendents (1.54) and teachers (1.54) agreed with the
second belief statement (12b), while board members (1.38) strongly agreed.
Standard deviations for the item means ranged from .497 (board members)
and .564 (teachers) to .751 (superintendents).
When examining the third belief statement (12c), the mean rating
scores of superintendents (3.37) and teachers (3.37) indicated that they
were not sure if schools need to place more resources toward evaluating
the system rather than individuals. Board members (3.62) responded by
disagreeing with the statement. Standard deviations for the item means
ranged from .551 (board members) to .877 (teachers) and 1.190
(superintendents).
When comparing the three groups' responses to Dealing's thirteenth
point, there was a significant difference between the three groups
(Table 28). The mean rating scores of superintendents (2.33, p<.01) and
board members (2.02) agreed that schools must institute a vigorous program
of education and self-improvement for everyone. Teachers (2.54, p<.01)
indicated that they were not sure when responding to this particular
point. Standard deviations for the item means ranged from .434 to .577.
When examining the three groups' responses to the first belief
statement (13a), it appears that the three groups differed when asked if
all personnel in the school should learn statistical theory and its
application towards continuous improvement. Superintendents (3.20) and
board members (2.68) indicated that they were not sure when asked this
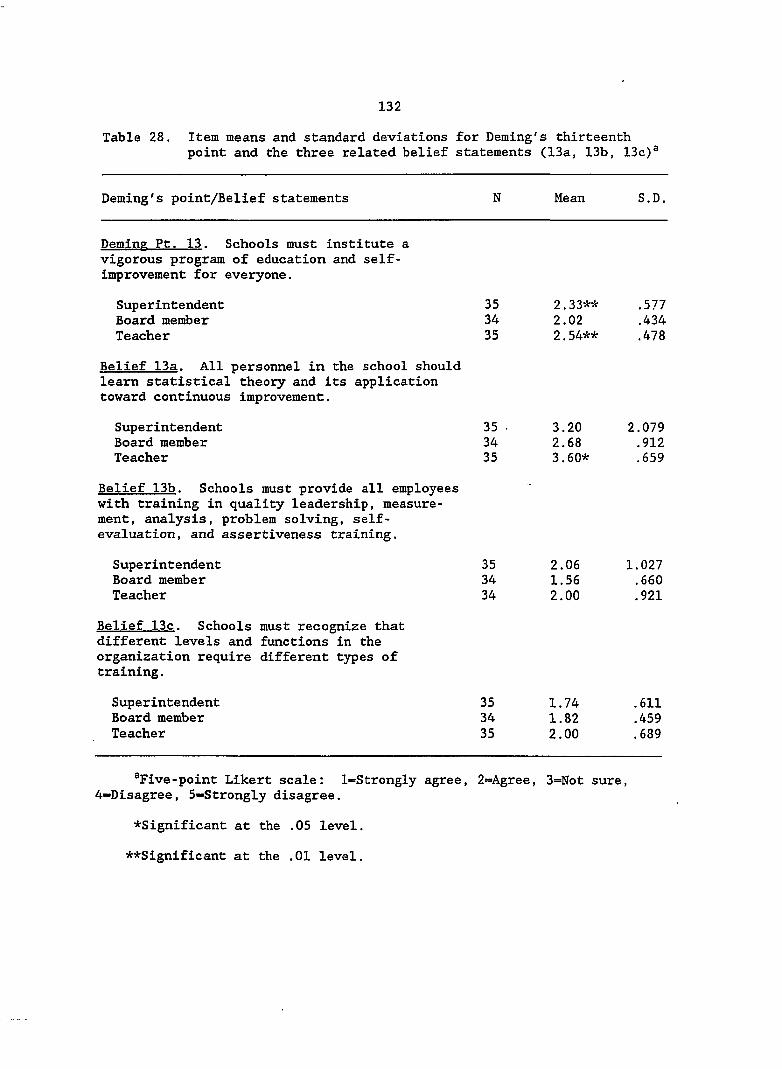
132
Table 28. Item means and standard deviations for Deming's thirteenth point and the three related belief statements (13a, 13b, 13c)®
Deming's point/Belief statements Mean S.D.
Deming Pt. 13. Schools must institute a vigorous program of education and self-improvement for everyone.
Superintendent 35 2 ,33** .577 Board member 34 2, ,02 .434 Teacher 35 2, , 54** .478
Belief 13a. All personnel in the school should learn statistical theory and its application toward continuous improvement.
Superintendent Board member Teacher
Belief 13b. Schools must provide all employees with training in quality leadership, measurement, analysis, problem solving, self-evaluation, and assertiveness training.
35 34 35
3.20 2 . 6 8 3.60*
2.079 .912 .659
Superintendent 35 2, ,06 1.027 Board member 34 1, ,56 .660 Teacher 34 2. .00 .921
Belief 13c. Schools must recognize that different levels and functions in the organization require different types of training.
Superintendent 35 1, ,74 .611 Board member 34 1, ,82 .459 Teacher 35 2, ,00 .689
^Five-point Likert scale: l=Strongly agree, 2=Agree, 3=Not sure, 4-Disagree, 5-Strongly disagree.
•Significant at the .05 level.
••Significant at the .01 level.
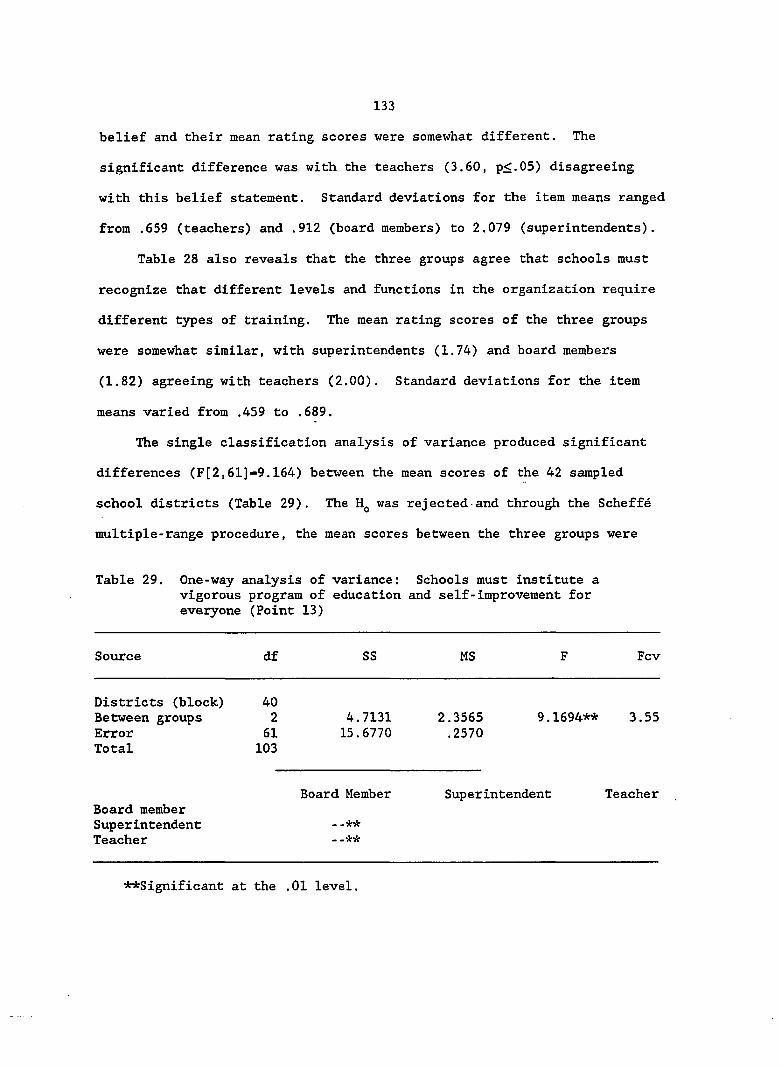
133
belief and their mean rating scores were somewhat different. The
significant difference was with the teachers (3.60, p<.05) disagreeing
with this belief statement. Standard deviations for the item means ranged
from .659 (teachers) and .912 (board members) to 2.079 (superintendents).
Table 28 also reveals that the three groups agree that schools must
recognize that different levels and functions in the organization require
different types of training. The mean rating scores of the three groups
were somewhat similar, with superintendents (1.74) and board members
(1.82) agreeing with teachers (2.00). Standard deviations for the item
means varied from .459 to .689.
The single classification analysis of variance produced significant
differences (F[2,61]-9.164) between the mean scores of the 42 sampled
school districts (Table 29). The was rejected and through the Scheffé
multiple-range procedure, the mean scores between the three groups were
Table 29. One-way analysis of variance: Schools must institute a vigorous program of education and self-improvement for everyone (Point 13)
Source df SS MS F Fcv
Districts (block) Between groups Error Total
40 2 61 103
4.7131 15.6770
2.3565 .2570
9.1694** 3.55
Board member Superintendent Teacher
Board Member
--
Superintendent Teacher
**Significant at the .01 level.
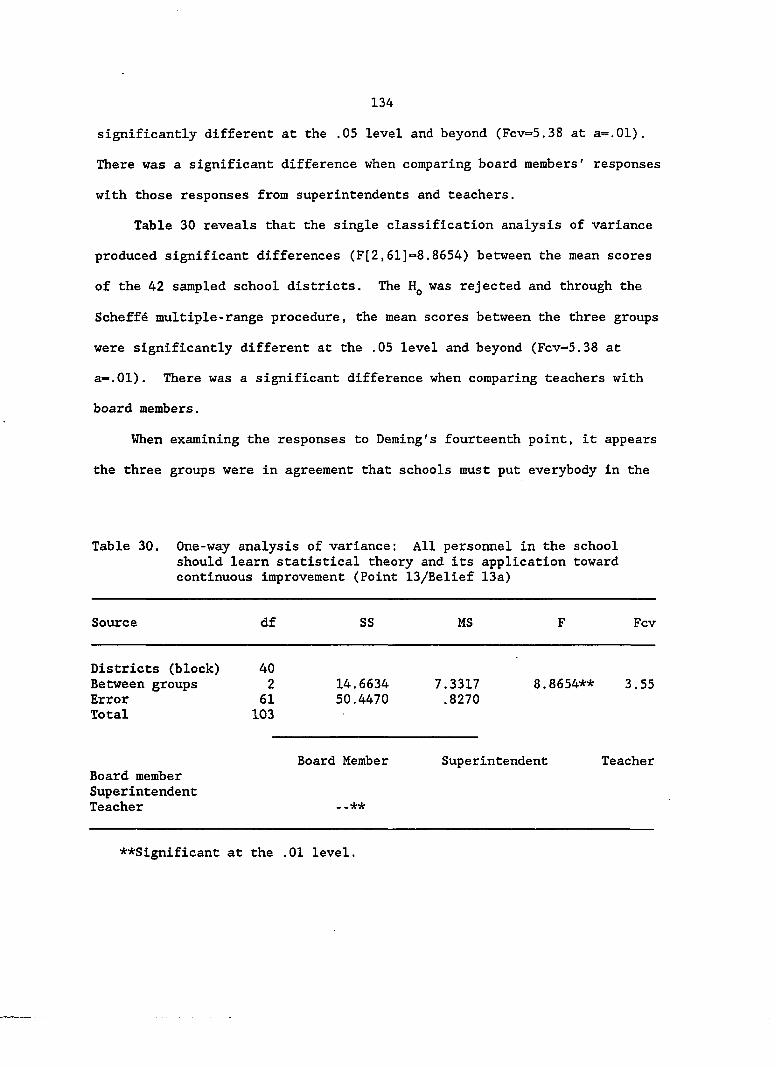
134
significantly different at the .05 level and beyond (Fcv=5.38 at a=.01).
There was a significant difference when comparing board members' responses
with those responses from superintendents and teachers.
Table 30 reveals that the single classification analysis of variance
produced significant differences (F[2,61]=8.8654) between the mean scores
of the 42 sampled school districts. The was rejected and through the
Scheffé multiple-range procedure, the mean scores between the three groups
were significantly different at the .05 level and beyond (Fcv-5.38 at
a-.01). There was a significant difference when comparing teachers with
board members.
When examining the responses to Deming's fourteenth point, it appears
the three groups were in agreement that schools must put everybody in the
Table 30. One-way analysis of variance: All personnel in the school should learn statistical theory and its application toward continuous improvement (Point 13/Belief 13a)
Source df SS MS F Fcv
Districts (block) Between groups Error Total
40 2 61 103
14.6634 50.4470
7.3317 .8270
8.8654** 3.55
Board member Superintendent Teacher
Board Member
. -**
Superintendent Teacher
**Significant at the .01 level.
135
organization to work to accomplish the transformation (Table 31). The
mean rating scores of superintendents (2.14), board members (2.21), and
teachers (2.06) were similar. Standard deviations for the item means
ranged from .479 to .683.
When responding to the first belief statement (14a), it appears that
all three groups were not sure when asked if school administrators have
been ineffective in bringing about needed change in schools. When
comparing the mean scores of the three groups, superintendents (3.37),
teachers (3.06), and board members (3.12) were similar. Standard
deviations for the item means ranged from ,844 (board members) to 1.083
(teachers) and 1.165 (superintendents).
The second belief statement (14b) in Table 31 shows all three groups
agreeing that schools as they are traditionally designed will not meet the
needs of a changing society. The mean rating scores for superintendents
(1.86) and teachers (2.03) were similar with board members (2.26).
Standard deviations for the item means ranged from .931 to 1.033.
In response to the third belief statement (14c), all three groups
agreed strongly that every individual in the system (superintendents,
central office personnel, principals, teachers, support staff, students,
parents, community partners) plays a major role in providing a quality
education. The mean rating scores of teachers (1.09), superintendents
(1.20), and board members (1.24) were quite similar. Standard deviations
for the item means varied from .284 (teachers) to .406 (superintendents)
and .431 (board members).
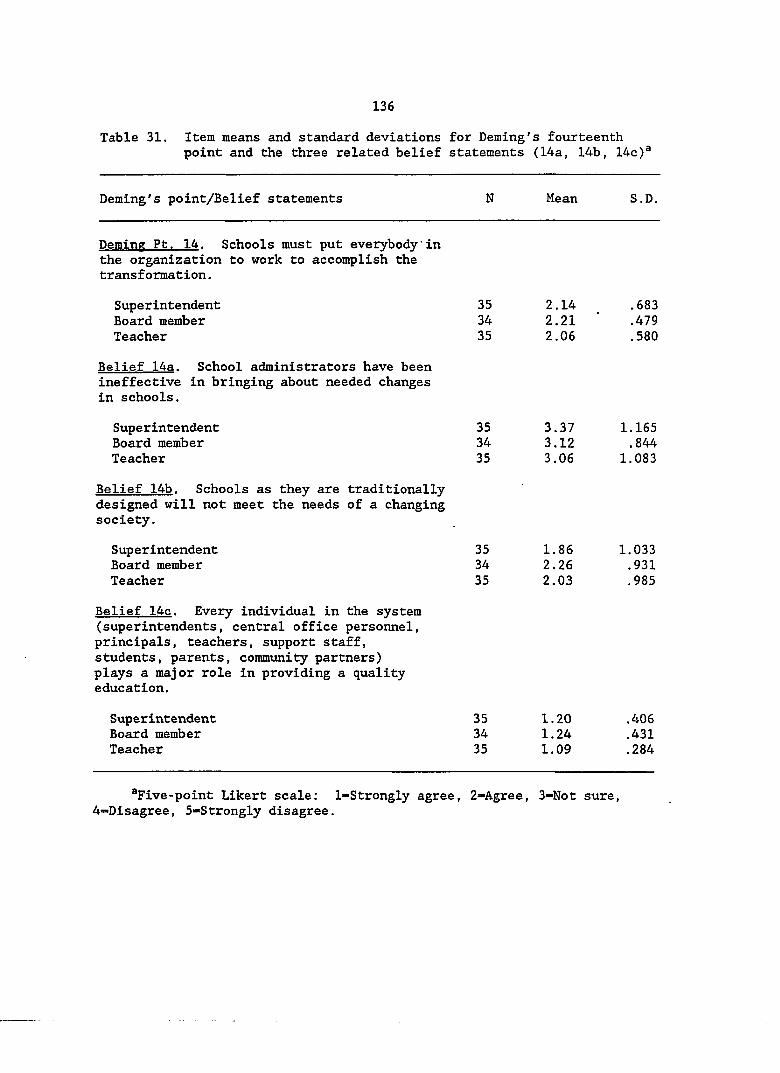
136
Table 31. Item means and standard deviations point and the three related belief
for Deming' statements
s fourteenth (14a, 14b, 14c)a
Deming's point/Belief statements N Mean S.D.
Demine Pt. 14. Schools must cut evervbodv'in the organization to work to accomplish the transformation.
Superintendent Board member Teacher
35 34 35
2.14 2.21 2.06
.683
.479
.580
Belief 14a. School administrators have been ineffective in bringing about needed changes in schools.
Superintendent Board member Teacher
35 34 35
3.37 3.12 3.06
1.165 .844 1.083
Belief 14b. Schools as thev are traditionally designed will not meet the needs of a changing society.
Superintendent Board member Teacher
35 34 35
1.86 2.26 2.03
1.033 .931 .985
Belief 14c. Everv individual in the svstem (superintendents, central office personnel, principals, teachers, support staff, students, parents, community partners) plays a major role in providing a quality education.
Superintendent Board member Teacher
35 34 35
1.20 1.24 1.09
.406
.431
.284
®Five-point Likert scale: 1-Strongly agree, 2-Agree, 3-Not sure, 4=Disagree, 5-Strongly disagree.
137
Summary of Findings
When comparing the three groups' beliefs toward total quality
management, there appears to be some agreement, disagreement, and
uncertainty with the 14 points and the 42 belief statements.
Findings related to the 14 points
The following points were found to be agreed upon by superintendents,
board members, and teachers:
(1) Schools should create constancy of purpose toward improvement of
product and service.
(2) Schools need to adopt a new philosophy which states that
commonly accepted levels of mistakes, delays, and defects will
no longer be tolerated.
(3) Schools need tp cease dependence upon mass inspection.
(4) Schools must end the practice of basing decisions on cost alone.
(5) Schools must constantly and forever improve the system of
production and service.
(6) Schools must institute modern methods of training on the job.
(7) Schools must do more to adopt and institute leadership and get
leaders to take on responsibility for quality.
(8) Schools must drive out fear so that everyone can work
effectively.
(9) Schools must break down barriers between departments.
(14) Schools must put everybody in the organization to work to
accomplish the transformation.
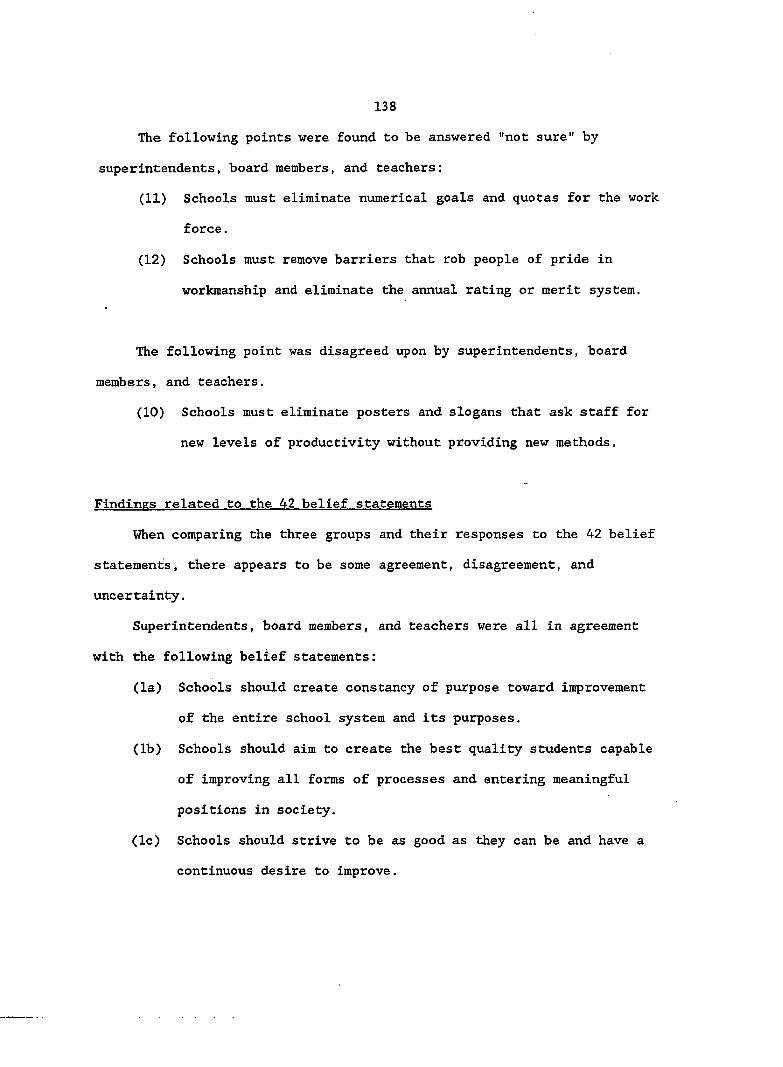
138
The following points were found to be answered "not sure" by
superintendents, board members, and teachers :
(11) Schools must eliminate numerical goals and quotas for the work
force.
(12) Schools must remove barriers that rob people of pride in
workmanship and eliminate the annual rating or merit system.
The following point was disagreed upon by superintendents, board
members, and teachers.
(10) Schools must eliminate posters and slogans that ask staff for
new levels of productivity without providing new methods.
Findings related to the 42 belief statements
When comparing the three groups and their responses to the 42 belief
statements, there appears to be some agreement, disagreement, and
uncertainty.
Superintendents, board members, and teachers were all in agreement
with the following belief statements:
(la) Schools should create constancy of purpose toward improvement
of the entire school system and its purposes.
(lb) Schools should aim to create the best quality students capable
of improving all forms of processes and entering meaningful
positions in society.
(Ic) Schools should strive to be as good as they can be and have a
continuous desire to improve.
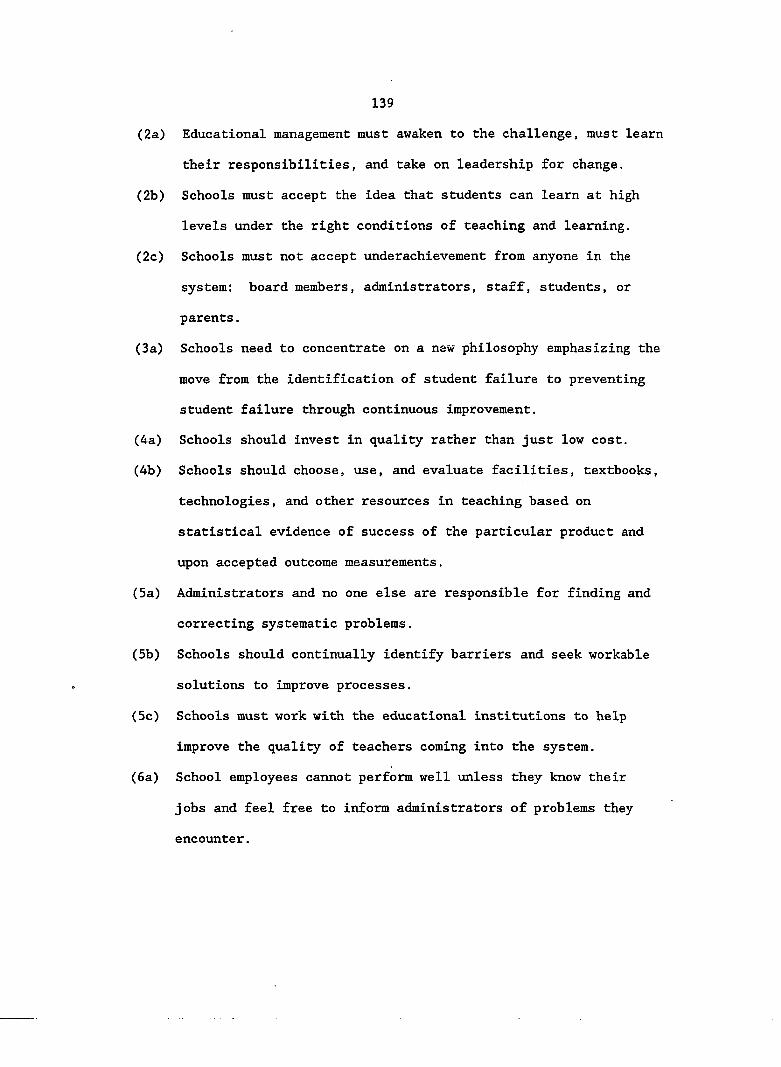
139
(2a) Educational management must awaken to the challenge, must learn
their responsibilities, and take on leadership for change.
(2b) Schools must accept the idea that students can learn at high
levels under the right conditions of teaching and learning.
(2c) Schools must not accept underachievement from anyone in the
system: board members, administrators, staff, students, or
parents.
(3a) Schools need to concentrate on a new philosophy emphasizing the
move from the identification of student failure to preventing
student failure through continuous improvement.
(4a) Schools should invest in quality rather than just low cost.
(4b) Schools should choose, use, and evaluate facilities, textbooks,
technologies, and other resources in teaching based on
statistical evidence of success of the particular product and
upon accepted outcome measurements.
(5a) Administrators and no one else are responsible for finding and
correcting systematic problems.
(5b) Schools should continually identify barriers and seek workable
solutions to improve processes.
(5c) Schools must work with the educational institutions to help
improve the quality of teachers coming into the system.
(6a) School employees cannot perform well unless they know their
jobs and feel free to inform administrators of problems they
encounter.
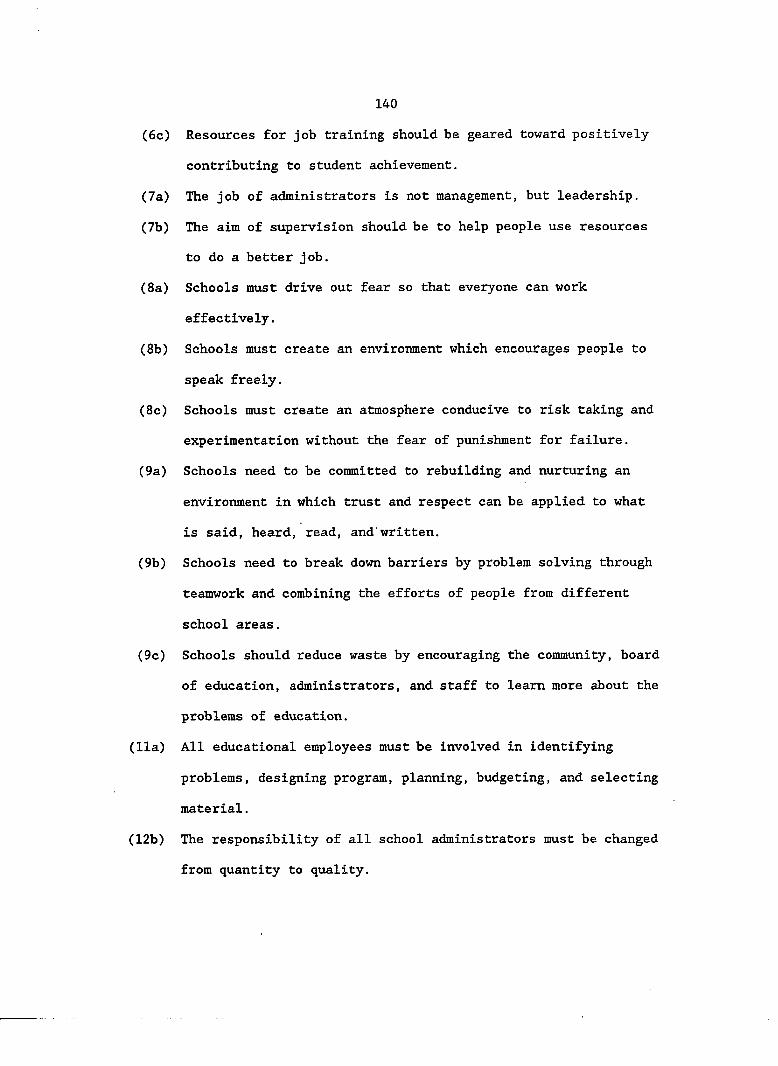
140
(6c) Resources for job training should be geared toward positively
contributing to student achievement.
(7a) The job of administrators is not management, but leadership.
(7b) The aim of supervision should be to help people use resources
to do a better job.
(8a) Schools must drive out fear so that everyone can work
effectively.
(8b) Schools must create an environment which encourages people to
speak freely.
(8c) Schools must create an atmosphere conducive to risk taking and
experimentation without the fear of punishment for failure.
(9a) Schools need to be committed to rebuilding and nurturing an
environment in which trust and respect can be applied to what
is said, heard, read, and written.
(9b) Schools need to break down barriers by problem solving through
teamwork and combining the efforts of people from different
school areas.
(9c) Schools should reduce waste by encouraging the community, board
of education, administrators, and staff to learn more about the
problems of education.
(11a) All educational employees must be involved in identifying
problems, designing program, planning, budgeting, and selecting
material.
(12b) The responsibility of all school administrators must be changed
from quantity to quality.
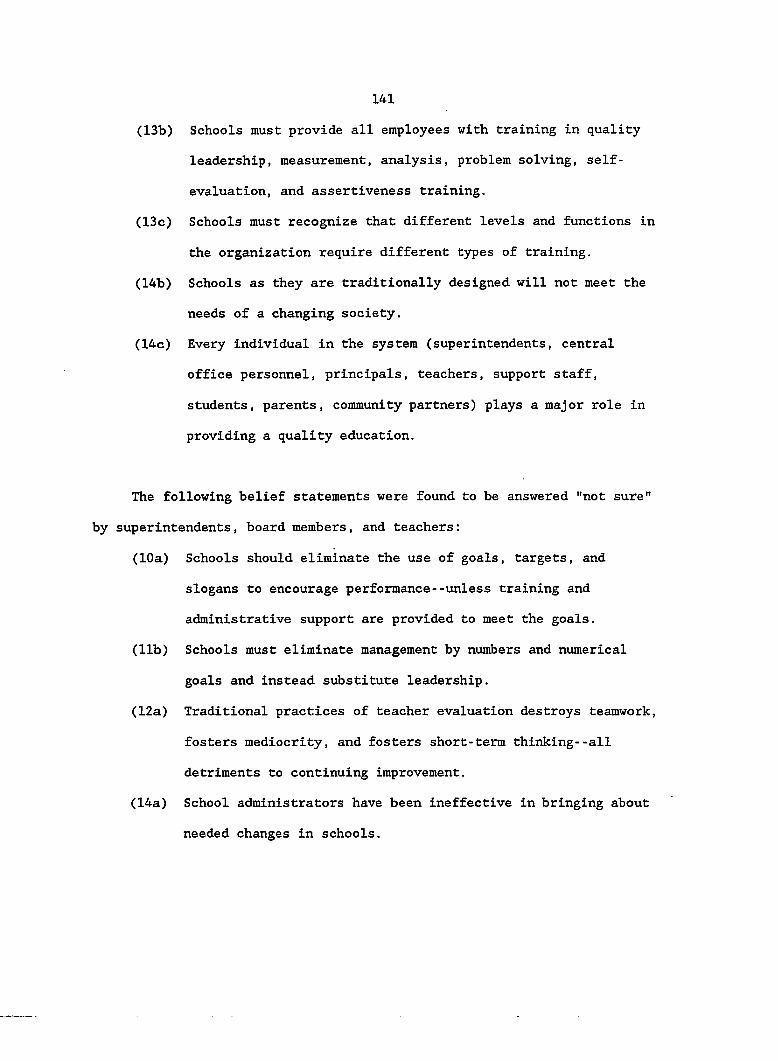
141
(13b) Schools must provide all employees with training in quality
leadership, measurement, analysis, problem solving, self-
evaluation, and assertiveness training.
(13c) Schools must recognize that different levels and functions in
the organization require different types of training.
(14b) Schools as they are traditionally designed will not meet the
needs of a changing society.
(14c) Every individual in the system (superintendents, central
office personnel, principals, teachers, support staff,
students, parents, community partners) plays a major role in
providing a quality education.
The following belief statements were found to be answered "not sure"
by superintendents, board members, and teachers :
(10a) Schools should eliminate the use of goals, targets, and
slogans to encourage performance--unless training and
administrative support are provided to meet the goals.
(lib) Schools must eliminate management by numbers and numerical
goals and instead substitute leadership.
(12a) Traditional practices of teacher evaluation destroys teamwork,
fosters mediocrity, and fosters short-term thinking--all
detriments to continuing improvement.
(14a) School administrators have been ineffective in bringing about
needed changes in schools.
142
Superintendents, board members, and teachers all disagreed with the
following belief statement:
(10b) The causes of low quality and low productivity belong to the
system and thus lie beyond the control of teachers and
students.
The following belief statements were answered differently (but not
significantly different) by superintendents, board members, and teachers:
(3b) Schools need to understand and use statistical assessment of
student growth and development on a daily basis.
(Superintendents agree, board members agree, teachers not
sure.)
(6b) Schools must use statistical methods to identify when on-the-
job training has achieved its purpose. (Superintendents
agree, board members agree, teachers not sure.)
(11c) Grades and test scores do not motivate the student to learn,
but rather drive out the joy of learning. (Superintendents
not sure, board members disagree, teachers not sure.)
(12c) Schools need to place more resources toward evaluating the
system rather than individuals. (Superintendents not sure,
board members disagree, teachers not sure.)
Findings related to the significant differences between the three groups when comparing the item mean scores
When comparing the three groups' beliefs toward total quality
management, there appear to be some significant differences among the 14
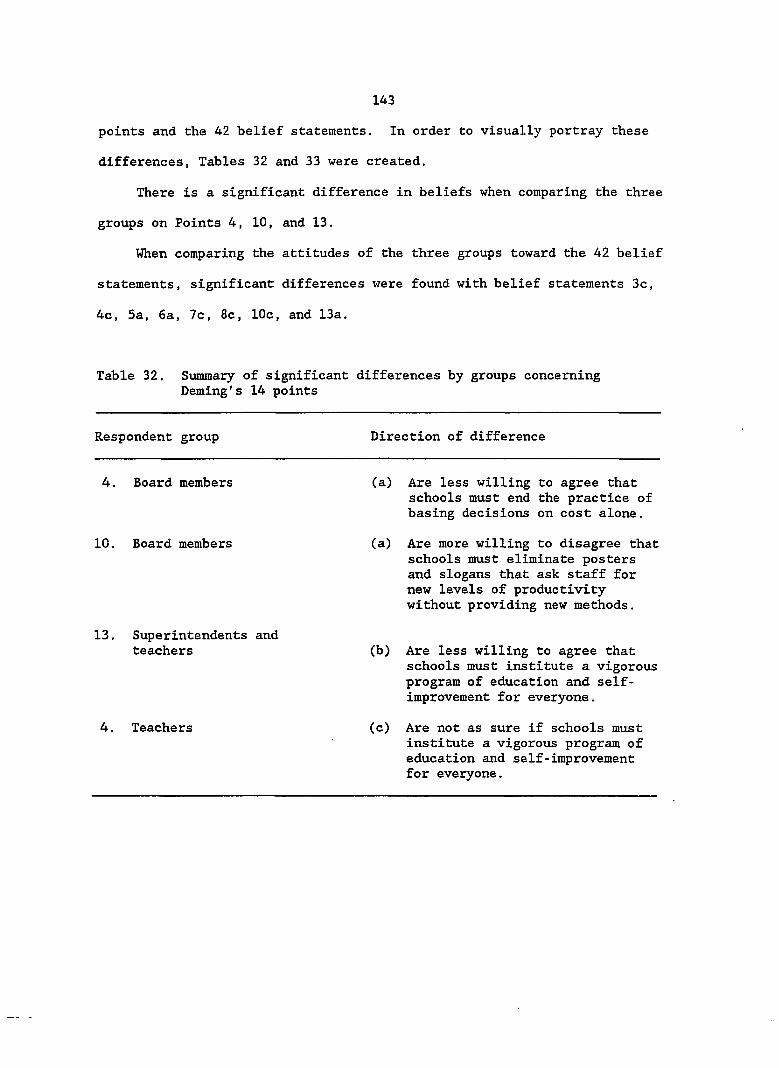
143
points and the 42 belief statements. In order to visually portray these
differences, Tables 32 and 33 were created.
There is a significant difference in beliefs when comparing the three
groups on Points 4, 10, and 13.
When comparing the attitudes of the three groups toward the 42 belief
statements, significant differences were found with belief statements 3c,
4c, 5a, 6a, 7c, 8c, 10c, and 13a.
Table 32. Summary of significant differences by groups concerning Deming's 14 points
Respondent group Direction of difference
4. Board members
10. Board members
13. Superintendents and teachers
4. Teachers
(a) Are less willing to agree that schools must end the practice of basing decisions on cost alone.
(a) Are more willing to disagree that schools must eliminate posters and slogans that ask staff for new levels of productivity without providing new methods.
(b) Are less willing to agree that schools must institute a vigorous program of education and self-improvement for everyone.
(c) Are not as sure if schools must institute a vigorous program of education and self-improvement for everyone.
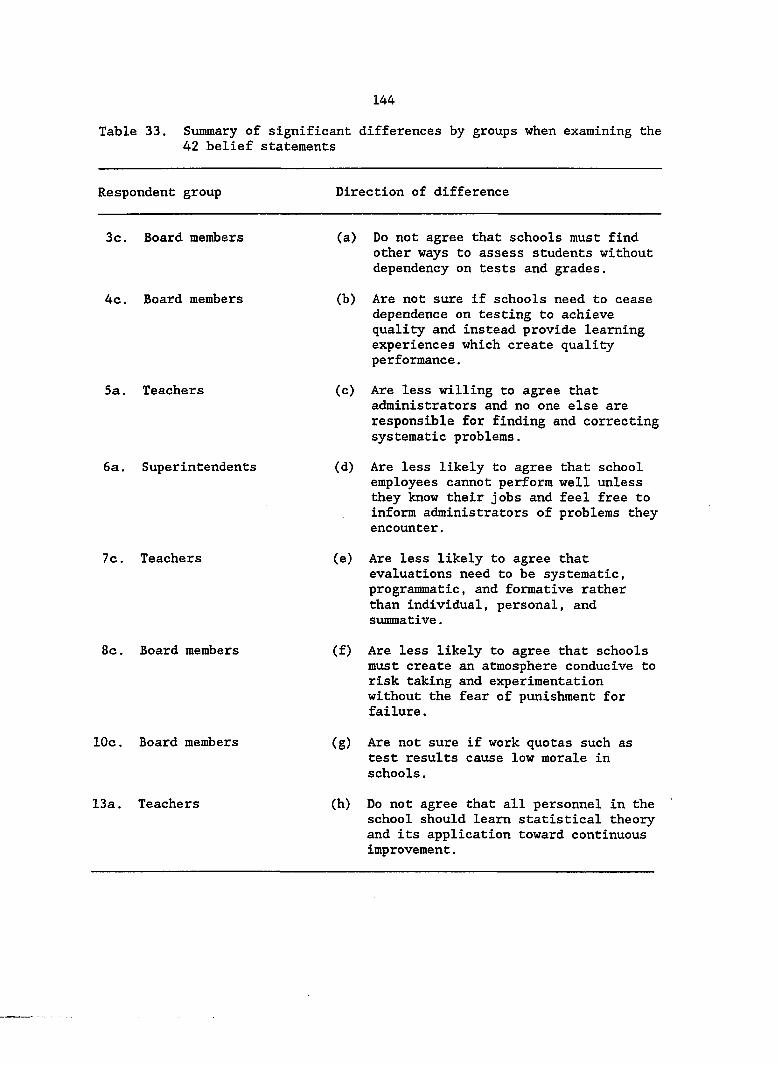
144
Table 33. Summary of significant differences by groups when examining the 42 belief statements
Respondent group Direction of difference
3c. Board members
4c. Board members
5a. Teachers
6a. Superintendents
(a) Do not agree that schools must find other ways to assess students without dependency on tests and grades.
(b) Are not sure if schools need to cease dependence on testing to achieve quality and instead provide learning experiences which create quality performance.
(c) Are less willing to agree that administrators and no one else are responsible for finding and correcting systematic problems.
(d) Are less likely to agree that school employees cannot perform well unless they know their jobs and feel free to inform administrators of problems they encounter.
7c. Teachers (e) Are less likely to agree that evaluations need to be systematic, programmatic, and formative rather than individual, personal, and summative.
8c. Board members (f) Are less likely to agree that schools must create an atmosphere conducive to risk taking and experimentation without the fear of punishment for failure.
10c. Board members (g) Are not sure if work quotas such as test results cause low morale in schools.
13a. Teachers (h) Do not agree that all personnel in the school should learn statistical theory and its application toward continuous improvement.
145
CHAPTER V. SUMMARY, CONCLUSIONS, AND RECOMMENDATIONS
Summary
The purpose of this study, conducted during the spring and summer of
1992, was to assess the beliefs of superintendents, board members, and
teachers regarding total quality management.
The survey instrument used in this study was developed by the
researcher using a two-step procedure. After the review of literature was
completed, 42 belief statements were created to assess and compare
educators' beliefs concerning Deming's 14 points (three beliefs for each
of the 14 points) as they apply to education. These 42 belief statements
were submitted to a validating panel to assess the validity of the
instrument.
In order to properly represent educators' beliefs, the sample used in
this study represented 42 school districts from the state of Iowa. To
insure geographical and population representation, three school districts
were chosen at random from each of the 14 Area Education Agencies (AEA).
The three school districts chosen from each AEA were selected based upon
their student population. The student population categories chosen were 0
to 500, 501 to 1,500, and greater than 1,500 (Appendix C).
Superintendents of the selected districts were contacted by letter
and asked to participate in this study (Appendix D). One superintendent
contacted the researcher and refused to participate because he felt that
this type of study would possibly cause future problems for educators.
146
The superintendents were asked to distribute a copy of the same
survey to a teacher in their district who was : 1) not an officer of the
local district's teachers' association, 2) has been in the district at
least five years, and 3) is well respected by the rest of the staff
(Appendix E).
A board member from each district was randomly selected and directly
mailed a copy of the survey (Appendix F). After completing the survey,
the teachers, superintendents, and board members were instructed to return
the surveys in self-addressed stamped envelopes. Sixty percent of the
surveys were returned within the two weeks' time allotted. A follow-up
letter and telephone calls were used to encourage the nonrespondents to
participate. The response rate increased to 83 percent after mailing the
reminder and making follow-up phone calls.
All data were collected during the month of May 1992. Completed
surveys were collected from 104 participants which included 35
superintendents, 34 board members, and 35 teachers. The scoring for
negatively stated items of the survey was reversed before the data were
analyzed.
Initial data analysis involved four separate procedures. First,
total means and standard deviations were calculated for the ratings given
each of the 42 belief statements by the 104 respondents. Means and
standard deviations across participants were calculated for the 14
subscales that were organized according to Deming's 14 points. As a third
statistical procedure, one-way analysis of variance was performed to test
for significant differences among the mean ratings for each of the 14
147
points as well as for the 42 individual belief statements comparing the
three participant groups. The one-way analysis of variance was used to
test the research null hypothesis that there would be no significant
differences among the mean scores of the beliefs, when comparing the three
groups' response to each of the 42 belief statements and the 14 points in
the "Educator Beliefs" survey.
Ho : Pi - At - P3
H|. : At least two p i ' s are not equal
a - .05.
The final statistical procedure involved conducting the Scheffé post
hoc multiple range procedure (p<.05).
Summarization of findings
In summary, if schools are going to implement total quality
management, there appear to be several major areas that are going to have
to be addressed: 1) continuous improvement, 2) the use of goals and
slogans in schools, 3) the use of tests and grades in schools, 4) using
statistical assessment.in schools, and 5) the current employee evaluation
and merit system.
Several belief statements emphasized the need for continuous
improvement in schools, and generally all three groups were in agreement
with this philosophy.
However, the concept of giving up the use of goals and slogans in
schools met with some resistance. All three groups expressed uncertainty
148
and some disagreement when asked if goals, targets, and slogans should be
eliminated to encourage performance.
Several belief statements addressed the current practice of using
tests and grades in schools, and the three groups had different
viewpoints. Teachers and superintendents agreed that schools must find
other ways to assess students without dependency on tests and grades while
board members Indicated that they were not sure.
The idea that test scores and grades do not motivate the students to
learn, but rather drive out the joy in learning, was disagreed with by
board members while teachers and superintendents expressed uncertainty.
Furthermore, teachers and superintendents agreed that work quotas such as
test results cause low morale in school while board members disagreed with
this belief statement.
The belief that all personnel in schools should learn statistical
theory and its application toward school improvement was met with
uncertainty and disagreement by the three groups. Superintendents and
board members indicated uncertainty while teachers disagreed with this
belief statement.
Several belief statements indicated that the three groups would have
problems when examining the areas of employee evaluation and the merit pay
system. Board members disagreed that schools need to place more resources
toward evaluating the system rather than individuals while superintendents
and teachers indicated that they were not sure. Furthermore,
superintendents, board members, and teachers all disagreed that the causes
149
of low quality and low productivity belong to the system and thus lie
beyond the control of teachers and students.
All three groups indicated resistance when asked to respond to
eliminating the annual rating or merit pay system. The three groups
indicated that they were not sure.
Conclusions
Piecemeal interventions within our current educational system have
done little to increase the productivity or usefulness of most schools.
Recent evaluations indicate that the educational improvement strategies
advocated by various interest groups in the early 1980s have not resulted
in any significant changes or payoffs. Some argue that our current
system's effectiveness and efficiency has reached its upper limit and,
therefore, significant improvements can be made only through a fundamental
restructuring of the system.
It is evident that tremendous changes in the way schools do business
will have to take place in coming years for meaningful reform to occur.
The leadership in the public schools will also have to change. How will
this happen? It appears that with the past success of TQM in business,
industry, and the public sector, the possibilities of applying TQM to
education seem to exist.
What type of managerial style will bring about the most successful
change? An analysis of the literature and practice in both educational
and management suggests that we are moving from a "coercive" to a
"participative" style in recent years and total quality management seems
150
to blend in well with this type of approach. Creating an environment
which allows and encourages everyone to contribute to the organization
seems to be essential.
Are educators in Iowa prepared to adopt the philosophical tenets
proposed by Edward Deming and the total quality management approach? The
results from this study seem to indicate that educators are currently
involved with several of TQM's fundamental beliefs, but not ready for the
complete system that TQM requires.
There are several major philosophical differences that will need to
be agreed upon before organizations can become a "comprehensive" TQM
organization. The results of this study indicated that superintendents,
board members, and teachers were most unwilling to change their ideas in
such areas as: 1) eliminating goals and slogans, 2) abolishing grades and
tests, 3) evaluating or blaming the system rather than individuals, along
with eliminating the merit pay system, and 4) becoming trained in
statistical theory.
Another major philosophical difference is with continuous
improvement. Although superintendents, teachers, and board members agreed
that continuous improvement ijs necessary upon reflection, this research
may imply that most educators' ideas of continuous improvement don't carry
the magnitude that Deming's TQM would entail.
Discussion
When analyzing the purposes of this study as set forth in Chapter I,
it would seem that many of the beliefs from superintendents, board
151
members, and teachers are a direct reflection upon the culture and
paradigms that are embedded in public schools today.
If one had to name the single biggest influence on paradigms and
public school culture during the past century, one candidate that would
come to mind might be Frederick Winslow Taylor, the father of "scientific
management." It appears that the philosophy of educational management may
have been patterned similar to that of Frederick Taylor's philosophy and
his book entitled Principles of Scientific Management. The major thrust
of Taylor's management philosophy when compared to Deming's TQM makes it
evident why the current culture and paradigms in schools exist.
According to Barker (1990), paradigms oftentimes keep people from
accepting new ideas. There is a tendency for people to adjust data and
information by filtering it through scientific mindsets that agree with
their paradigms. Therefore, data or information that agree with the
current paradigms are more likely to gain acceptance than data that
disagree with the current paradigm. Barker contends that this is called
the "paradigm effect," which tends to blind people and organizations to
new opportunities. It causes them to try to discover the future through
the current paradigm. This, of course, limits people's thinking.
Further studies on culture in educational settings (Taylor, 1991;
Snyder & Anderson, 1986; Boyer, 1983; Goodlad, 1984; Lightfoot, 1983;
Powell, Cohen, & Farrar, 1984; Sizer, 1984) indicate several major
cultural features which would appear contradictory to the TQM philosophy.
Perhaps Snyder and Anderson (1986) summarize it best by stating the
152
following: 1) effort focus vs. results focus, 2) role isolation vs.
working in groups, 3) individual deficits vs. individual contributions,
4) role generalizations vs. standards of productivity, 5) job protection
vs. skill proficiency, and 6) personal interest vs. goal-based tasks.
The existing literature reveals that public schools are in the early
stages with the quality movement (Stampen, 1987; Ballanca, 1982; Meaney,
1991; Tribus, 1990; Melvin, 1991; Houlihan, 1991; McLeod, 1991). The
philosophy of continuous improvement seems to be commonly accepted
throughout. However, it appears that continuous improvement is still
difficult because most educators are accustomed to annual projects and
programs as the definition of change. Furthermore, convincing staff that
quality is not a quick fix also seems to be a problem with those schools
involved. As mentioned earlier, most educators' ideas of continuous
improvement don't carry the magnitude that Deming's TQM would entail.
The results of this study indicated that superintendents, board
members, and teachers were most unwilling to change their ideas in such
areas as: 1) eliminating goals and slogans, 2) abolishing grades and
tests, 3) evaluating or blaming the system rather than individuals, along
with eliminating the merit pay system, and 4) becoming trained in
statistical theory. The existing literature would also support the fact
that those schools involved with TQM are finding it most difficult to also
make these major philosophical changes (Willis, 1993; Bonstingl, 1992;
Thurber, 1992; Abernathy & Serfass, 1992; Harris & Harris, 1992; Andrade &
Ryley, 1992; Hixson & Lovelace, 1992; Schmoker & Wilson, 1993).
153
Eliminating goals and slogans
The elimination of goals, objectives, and slogans appears to be a
very controversial issue when compared to the words in Peter Drucker's
standard MBO text. According to Drucker (1977), the whole organization
"must be directed toward the performance goals of the business."
Additionally, the core of the federal government's America 2000 is the six
national goals for education; yet the belief that setting ambitious goals
will enhance quality is part of the MBO doctrine that Deming rejects.
Furthermore, the effective schools movement and a major segment of
strategic planning is based upon goals, objectives, and mission
statements. The same exit objectives and goals-based thinking is a big
part of outcome-based education (OBE), which again is at odds with the
total quality management philosophy.
This writer contends that perhaps the reason Deming is against goals,
slogans, and quotas, etc., is because for many years, organizations have
focused on outcomes and didn't improve the processes that were involved in
attaining those outcomes. It seems that such concepts as mission
statements, goals, and objectives may be feasible if controls are built
into the processes that help to determine whether or not an organization
is continually improving.
Abolishing tests and grades
The entire idea of judging the effectiveness of an organization only
on tests and grades appears to be a major problem with Deming because he
believes that numbers are easy to collect, but fail to describe what
154
really matters. According to Deming, schools must focus on helping
students to maximize their own potential through continuous improvement.
Test scores are much less important.
Deming believes that the sole intent of improving district-wide test
scores destroys interpersonal trust which is essential to success.
Reliance on tests as the major means of assessment of student production
is wasteful and often neither reliable or authentic. Tests and other
indicators of student learning should be given as diagnostic and
prescriptive instruments throughout the learning process. According to
Deming, learning is best shown by the student's performance, applying
information and skills to real-life challenges. Students must be taught
how to assess their own work and progress if they are to take ownership of
their own educational processes.
Consider, for example, the recommendation of two recent educational
reports. The National Council on Education Standards and Testing declares
that "national standards tied to assessments are desirable" in order to
"measure and hold students, schools, school districts, states, and the
nation accountable for educational performance." Additionally, the
Commission on the Skills of the American Workforce pins its hopes on "a
new educational performance standard" against which all 16-year-old
students will be measured, using "a series of performance-based
assessments."
TQM would emphasize that assignments and tests that focus attention
on numerical or letter symbols of learning and production often do not
fully reflect the quality of student progress and performance. When the
155
grade becomes the bottom-line product, short-term gains replace student
investment in long-term learning, and this may prove counterproductive in
the long run.
This philosophical difference between our current educational system
and TQM seems to be worthy of examining quite closely. The idea of going
away from testing and giving grades in schools is going to be a major
challenge for educators.
Evaluating or blaming the system rather than individuals and eliminating the merit pav svstem
Another conflict that currently exists between public education and
TQM is the conventional management practice of staff appraisal and merit
systems. Deming rejects these completely because "it is necessary that
people feel secure," and trust is a much better motivator than fear
(Deming, 1990). According to Deming, the reason that organizations have
problems is largely due to the "system" in which people work, not
individuals.
Deming would contend that if management is doing its job, workers
will be doing theirs. Cooperation is much more important to quality than
competition. If some aspect of the process needs improvement, Deming's
approach is not to allocate blame, but to bring together all those--
including senior management--who can effect the process and establish a
deliberative procedure that can arrive at a credible solution.
The entire concept of eliminating teacher evaluation and the merit
pay system would be very difficult. Most states require that a written
performance rating be filed on every teacher and administrator. Many
156
school districts have also negotiated agreements with teachers'
organizations and unions that have agreements on how individual
performance evaluations will take place. Any changes on these agreements
would have to be negotiated.
Furthermore, for many years building administrators have been trained
in teacher evaluation practices that are currently embedded in public
schools. To begin discussing that the many hours of classroom
observations and follow-up conferences was a waste of time may be
difficult to accept by not only principals, but also classroom teachers.
Becoming trained in statistical theory
One of the key components of TQM is to have statistical controls
built into the system to determine whether or not an organization is
improving.
Deming believes that workers as well as managers be trained in
statistical techniques so that they themselves can theorize about their
own practice, if necessary, in formal discussion with managers and other
interested parties, such as students, parents, and employers.
Furthermore, Deming believes that statistical process control
concentrates more on the learning process, not on individual achievement
data. Individual achievement data are determined by many variables, some
of which the school has little or no control over. Therefore, for the
school to attempt to exercise statistical control over these variables is
counterproductive. However, the schools can exercise influence over the
learning processes that are practiced by schools.
157
In examining a school setting, the literature supports that the
following educational processes would be considered to be the statistical
tools that need to be measured in some form or another: 1) instruction,
2) curriculum, 3) correlation between curriculum and assessment,
4) congruity between curriculum and instruction, 5) attendance of staff
and students, 6) number of student dropouts, 7) educational environment,
and 8) utilization of resources.
The entire concept of statistical process control will be difficult
for schools to implement because the idea of having to learn statistics
scares most people. Furthermore, learning statistics will require a great
deal of time and training of all employees.
Perhaps another reason that the three groups gave the responses they
did in this study was due to the roles that they represent. Board members
are elected by the public and required by state law for holding school
districts accountable. Their responses to goals, test scores, merit pay,
and evaluation procedures reflect the wise beliefs and values that exist
today among many board members. It is understandable that until TQM is
proved to be "the answer," board members will hold firm on their current
beliefs.
It appears that total quality management represents a major change in
philosophy. School districts that adopt TQM will have to address and cope
with a new philosophy while simultaneously grappling with the difficulties
associated with any significant change along with the outside expectations
of patrons and state statutes.
158
To implement total quality management, the people in the school
system will have to change the way they view schools, and they must be
willing to challenge some of the beliefs and paradigms upon which school
management has been based for decades.
Limitations
1. The sample used in this study represented roughly 10 percent of
all the schools in Iowa. The teachers surveyed were chosen to participate
in the study by their district's superintendent. The board members
surveyed may not have given a true reflection of the entire board's
thoughts. Generalizations from this study should be guarded.
2. This study utilized the scores from a single measurement. Single
observed scores tell nothing about the error of measurement. As more
studies are completed, the scores should become more meaningful and valid.
3. Although there is no evidence that the format utilized in the
construction of the survey instrument affected the outcome of the
research, the researcher has some concerns about the level of
understanding of the participants in completing the survey.
The survey instrument used in this study likely didn't contain all of
the belief statements that TQM would entail. Furthermore, some of the
belief statements according to Deming would probably be more important
than others, and in this particular study all of the belief statements
were given equal weightings.

159
Recommendations for Practice
1. It is evident that the school districts involved in this study
will need to have a thorough understanding of total quality management,
including the similarities and major differences of current educational
practices. In other words, are these school districts and communities
ready to buy into the major paradigm shifts that TQM will bring?
2. The literature supports that a great deal of time will be needed
in order to develop the readiness that school districts will need before
they are ready to truly involve themselves with TQM. For instance, the
Saturn Corporation of General Motors has given nearly 700 hours of
training to their employees with the majority of the training going
towards the fundamental beliefs of total quality management.
3. School districts in this study and across the state of Iowa will
have to be patient. When asked how long it would take an organization
implementing TQM to attain Toyota Corporation's present level of
development in this approach, it was estimated that it would take a
minimum of 20 years (Atkinson & Naden, 1989).
Although educators agree that continuous improvement is necessary,
this writer contends that 20 years is not the general mindset among most
educators.
4. Students, teachers, parents, board members, administrators,
support staff, and community members across Iowa will need to have a
thorough understanding of the radical change that will be involved. A
tremendous amount of careful planning will have to take place before this
happens.
160
Recommendations for Further Research
The writer is concerned that there may have been some confusion among
survey participants regarding their understanding of the basic concepts in
total quality management.
More observations and further surveying is essential. Only 42 school
districts in Iowa were used with a sample size of 126. This makes
generalizing beyond this limited population rather difficult. Perhaps
entire staffs and all school board members should be surveyed to see if
the findings would differ.
Future pilot testing should take place concurrently in schools that
are routinely recognized as being outstanding in ever increasing quality
and successful implementation of TQM principles and those that are not.
Further statistical analysis may involve the mean differences between
schools by size, demography, geographic location, and other possible
characteristics.
Qualitative research consisting of teacher, superintendent, and board
member interviews may help to confirm the results of this research and
also strengthen the validity of the survey items.
Further research might focus on exploring any of the belief
statements that indicated a difference of opinion between the three groups
concerning total quality management. In other words, why did a particular
group differ when comparing their response to the other two groups?
Perhaps the most important area for further research deals with
statistical quality control in schools. Are there any statistical
161
controls in place that measure student improvement in a school setting
while at the same time truly reflecting Deming's beliefs?
162
BIBLIOGRAPHY
Aalbregtse, R. J., Hejka, J. A,, & McNeley, P. K. (1991). TQM: How do you do it? Automation. 38(8), 30-32.
Abernathy, P. E., & Serfass, R. W. (1992). One district's quality improvement story. Educational Leadership. 50(9), 14-17.
Abramson, M. L. (1991, October). The quality imperative [Special issue]. Business Week, pp. 67-68.
Aguayo, R. (1990). Dr. Deming. New York: Simon & Schuster.
Ajzen, I., & Fishbein, M. (1977). Attitude-behavior relations: A theoretical analysis and review of empirical research. Psychological Bulletin. M. 888-918.
Alexander, C. P. (1981). Learning from the Japanese. Personnel Journal. 60, 616-619.
Alexander, C. P. (1984). A hidden benefit of quality circles. Personnel. 63. 54-58.
Allé, R. E. (1986). The middle management factor in quality circle programs. Advantage Management. 51. 9-15.
Aly, N. A., & Maytubby, V. J., & Elshennawy, A. K. (1990). Total quality management: An approach and a case study. Computers and Industrial Engineering. 19(1-4), 111-116.
American Association of School Administrators. (1991). An Introduction to total quality for schools. A collection of articles on the concepts of total quality management and W. Edwards Deminp. Arlington, VA: Author.
Anderson, C. A., & Daigh, R. D. (1991). Quality mind-set overcomes barriers to success. Healthcare Financial Management. ̂ (2), 20-32.
Andrade, J., & Ryley, H. (1992). A quality approach to writing assessment. Educational Leadership. 50(9), 22-23.
Anonymous author. Douglas boosts production without key TQM provision. Aviation Week and Space Technology. 135(23). 61-63.
Armstrong, L. (1991, October). The quality imperative [Special issue]. Business Week, p. 104.
163
Armstrong, L., & Symonds, W. (1991, October). The quality imperative [Special issue]. Business Week, pp. 100-103.
Aston, J. P. (1983). Three principles of Japanese management. Personnel Journal. 62. 758-763.
Atkinson, C., & Maleska, E. T. (1965). The story of education. Philadelphia, PA: Chitton Books.
Atkinson, P. (1991). Leadership; Total quality and cultural change. Management Services (UK), 35(6), 16-19.
Atkinson, P. E., & Naden, J. (1989). Total quality management: Eight lessons to leam from Japan. Management Services. 21(3), 6-10.
Axland, S. (1991). Two awarded NASA's prize trophy. Quality Progress. 24(12), 51-52.
Axline, L. L. (1991). TQM: A look in the mirror. Management Review. 80(7), 64.
Baatz, E. B. (1991). Who says small-fry can't compete for the Baldridge? Electronic Business. 17(19), 50.
Bacon, J. (1991, September). Ambulatory health care: A growing concern. Business and Health Supplement, pp. 18-22.
Baker, E., & Hunter, W. (1989, April). The chief executive officer's role in total quality: Preparing the enterprise for leadership in the new economic age. Paper presented to the Conference on Quality, Madison, WI.
Baker, J. T. (1991). We're lost, but we're making great time. Industrial Management. 33(6), 6-7.
Barker, J. A. (1990). Discovering the future, the business of paradigms, a videotape. Bumsville, MN: Chart House Learning Corporation.
Barks, J. V. (1991). Logistics pay; Finally, a flight to quality? Distribution. 90(10), 28-38.
Barrick, M. R., & Alexander, R. A. (1987). A review of quality circle efficacy and the existence of positive findings. Personnel Psychology. 40. 579-592.
Beaubier, E., & Thayer, A. (Eds.). (1973). Participative management. Decentralized decision making; Working models. California Association of School Administrators, Burlingame, CA.
164
Beer, M., Eisenstat, R. , & Spector, B. (1990). Why change programs that don't produce change? Harvard Business Review, pp. 158-166.
Belding, A. W. (1931, April). The to-be married teacher. Journal of Education, p. 397.
Below, B. J., Morrisey, G. L. , & Acomb, B. L. (1987). The executive guide to strategic planning. San Francisco, CA: Jossey-Bass Publishers.
Bemowski, K. (1991). Restoring the pillars of higher education. Quality Progress. 24(10), 37-42.
Bennis, W., & Nanus, B. (1985). Leaders: The strategies for taking charge. New York: Harper & Row.
Benson, T. E, (1991). Challenging global myths. Industry Week. 240(19). 12-25.
Berger, S., & Sudman, S. K. (1991). Making total quality management work. Healthcare Executive. 17(8), 23-28.
Berkman, B. N. (1991). European electronics goes green. Electronic Business. 12(16), 50-54.
Berman, S. J., & Hellweg,. S. A. (1989). Perceived supervisor communication competence and supervisor satisfaction as a function of quality circle participation. Business Communication. 26, 103-122.
Bernard, D. (1991, March). Olin Hunt--Quality spoken here. 3x400 Information Management, pp. 40-45.
Berry, J. (1984). Employee morale an added benefit of quality circles. Computerworld. 18(36), 100.
Berwick, D. (1989). Health services research and quality of care. Medical Care. 27(8), 763-771.
Biddix, M., & McClearen, B. (1991). Today's healthcare environment; New career trends and opportunities. Healthcare Executive. 6(6), 16-17.
Blackman, T. (1991). Team concept involves crews in all aspects of mills. Forest Industries. 118(9). 14-15.
Blair, J. D. , & Whitehead, C. J. (1984). Can quality circles survive in the United States? Business Horizons. 27, 17-23.
Blue, R. R. (1988). Overcoming the threat of participation. Supervision. 50. 3-5.
165
Blum, R. E., & Kneidek, A. W. (1991). Strategic improvement that focuses on student achievement. Educational Leadership. 48(7), 17-21.
Bonstingl, J. J. (1992). The quality revolution in education. Educational Leadership. 50(3), 4-9.
Borg, W. R., & Gall, M. D. (1989). Educational research: An introduction (5th ed.). New York: Longman.
Boulton, W. R., Lindsay, W. M., Franklin, S. G., & Rue, L. W. (1982). Strategic planning: Determining the impact of environmental characteristics and uncertainty. Academy of Management Journal. 25(8), 500-509.
Bowman, J. S. (1989). Quality circles: Promise problems and prospects in Florida. Public Personnel Management. 18, 375-403.
Boyer, E. L. (1983). High school: A report on secondary education in America. New York: Harper & Row.
Bozeman, W., & Schmelzer, S. (1984, Spring). Strategic planning: Application in business and education. Planning and Changing, pp. 35-49.
Brandt, R. (1991). Coping with change. Educational Leadership. 48(7). 3.
Branstad, T. (1991). Iowa's-progress toward the national education goals. Des Moines: Office of the Governor, State of Iowa.
Brooke, M. Z. (1984). Centralization and autonomy: A study in organization behavior. London: Holt, Rinehart and Winston.
Brown, M. G. (1991a). The Baldridge Award: How do you win? Automation. 38(10), 34-37.
Brown, M. G. (1991b). Measuring your company against the Baldridge criteria. Journal for Quality and Participation. 14(3), 82-88.
Brown, P., & Marshall, M. (1987, December). Strategic planning for school districts. Paper presented at the annual meeting of the California School Boards Association, San Francisco, CA.
Bull, S. (1991). Total quality management in a redundancy situation. European Management Journal. 9(3), 288-294.
Burda, D. (1991). Study rates U.S. hospitals vs. other nations, industries. Modern Healthcare. 21(40), 36, 38.
166
Burstein, C., & Sedlak, K. (1988). The federal quality and productivity improvement effort. Quality Progress (October), 38-41.
Bush, G. (1991), America 2000: An education strategy. U.S. Department of Education, Washington, D.C.
Business-Higher Education Forum. (1983). America's competitive challenge: The need for a national response. Washington, DC: Author.
Butler, M. L. (1990). Quality leadership equals quality service. Bureaucrat. 19(2), 44-46.
Canary, D. J., & Siebold, D. R. (1984). Attitudes and behavior. New York: Praeger.
Carnegie Forum on Education and the Economy. (1986). A nation prepared: Teachers for the 21st century. New York: The Carnegie Corporation of New York.
Carnoy, M., & Levin, H. (1976). The limits of educational reform. New York: D. McKay Co.
Casner-Lotto, J. (1988). Expanding the teacher's role: Hammond's school improvement process. Phi Delta Kappan. ̂ (5), 349-353.
Caudron, S. (1991). The importance of being earnest. Electronic Business. 17(10), 150-154.
Chapman, R. L. , Clarke, P., & Sloan, T. (1991). TQM in continuous-process manufacturing: Dow-Corning (Australia). International Journal of Quality and Reliability Management. 8(5), 77-90.
Clemmer, J. (1991). How total is your quality management? Canadian Business Review. 18(1), 38-41.
Clune, W. H., & White, P. A. (1988). School-based management: Institutional variation, implementation, and issues for further research. New Brunswick, NJ: Center for Policy Research in Education, Rutgers University.
Coate, L. E. (1990, December). TQM at Oregon State University. Journal for Quality and Instruction, pp. 90-101.
Commission on the Skills of the American Workforce, America's Choice. (1990). High skills or low wages? Rochester, NY: National Center on Education and the Economy.
Cook, B. M. (1991). Quality: The pioneers survey the landscape. Industry Week. 240(20). 68-73.
167
Cook, W. J., Jr. (1988). Bill Cook's strategic planning for America's schools. Arlington, VA: American Association of School Administrators.
Cook, W. J., Jr. (1990). Strategic planning for America's schools. Arlington, VA: Cambridge Management Group, Inc.
Cook, W. J., Jr. (1992, Winter). Keeping current. Strategic Planner for Education, p. 3.
Coombes, P. (1991). Implementing the programs: Olin. Chemical Week. 149(210), 42.
Cope, R. G. (1981). Strategic planning management and decision making. AAHE-ERIC/Higher Education Research Report No. 9. Washington, DC: American Association for Higher Education.
Cornell, L. (1983). Banks should travel in quality circles. ABA Bank. 75, 152.
Creagh, S., & Smeltzer, L. (1985). The relationship of communication to productivity: Quality circles as a mediating variable. Research in Education. 23, 4-7.
Crosby, B. (1991). By George, I think I've got it! HR Focus. 68(12). 23.
Crosby, B. (1979). Quality is free: The art of making quality certain. New York: McGraw-Hill.
Crosby, B. (1984). Quality without tears. New American Library.
D'Amico, J. (1989, Winter). Strategic planning, not educational reform and improvements. Planning and Changing, pp. 237-251.
Darling-Hammond, L. , & Berry, B. (1988). The evolution of teacher policy. Santa Monica, CA: Center for Policy Research in Education.
David, J., Purkey, S., & White, P. (1988). Restructuring in progress: Lessons from pioneering districts. Paper prepared for the National Governors' Association, Washington, DC.
Dawson, H. A. (1943). What we're up against. Educational Leadership. 2(2), 6-7.
Dawson, P., & Patrickson, M. (1991). Total quality management in the Australian banking industry. International Journal of Quality and Reliability Management. 8(5), 66-76.
168
Day, C. R. (1992), 11 points of reality-quality: Make it a matter of policy. Industry Week. 241(1). 46.
DeCieri, H., Samson, D. A., & Sohal, A. S. (1991). Implementation of TQM in an Australian manufacturing company. International Journal of Quality and Reliability Management. 8(5), 55-65.
Decker, E. et al. (1977). Site management. An analysis of the concepts and fundamental operational components associated with the delegations of decision-making authority and control of resources to the school-site level in the California Public School System. Sacramento, CA: California State Department of Education.
Deming, W. E. (1950). Some theory of sampling. Dover, NY: Harper & Row,
Deming, W. E. (1975). On probability as a basis for action. The American Statistician. 29(4), 146-152.
Deming, W. E. (1982). Quality, productivity, and competitive position. Cambridge, MA: Center for Advanced Engineering Study, MIT.
Deming, W. E. (1983, July). Reforming American management. Paper presented at the Quality Management Seminar, the University of Wisconsin at Madison.
Deming, W. E. (1985). Quality, productivity, and competitive position. (MIT Video Course, 16 video cassettes). Cambridge, MA: Institute of Technology, Center for Advanced Engineering Study, MIT.
Deming, W. E. (1986). Out of the crisis. Cambridge, MA; Institute of Technology, Center for Advanced Engineering Study, MIT.
Deming, W. E, (1989). Quality, productivity, and competitive position. Los Angeles, CA: Quality Enhancement Seminars, Inc.
Deming, W. E. (1990). A system of profound knowledge. Handout at Deming Study Group, Fall Seminar, Detroit, MI.
Dewar, D. L, (1980). Leader manual and instructional guide. Red Bluff, CA: Quality Circle Institute.
DeYoung, H, G. (1989). Back from the brink: Xerox redefines its notion of quality. Electronic Business. 15(50), 4.
Dolan, W. P. (1991, February). Leadership for productive decision making. ISEA Conference, Des Moines, lA.
Dollar, W. E. (1983). The danger of quality circles. Purchasing. 94. 47.
169
Donabedian, A. (1988). Quality assessment and assurance: Unity of purpose, diversity of means in health care. Inquiry. 25. 173-192.
Douglas, H. R. (1947). Does it pay to teach? For men, too? Educational Outlook Journal. 21(4), 164-173.
Douglas, N., & Wykowski, T. S. (1991). High leverage change. Executive Excellence. 8(10), 10-11.
Drago, R. (1988). Quality circle survival: An exploratory analysis. Industry Relations. 27. 336-351.
Dreyfack, R. (1982). Making it in management the Japanese way. Rockville Centre, NY: Farnsworth Publishing Company.
Dreyfuss, J. (1988). Victories in the quality crusade. Fortune. 118. 80-81.
Drucker, P. (1974). Management: Tasks, responsibilities, practices. New York: Harper & Row.
Drucker, P. (1977). Management. New York: Harper's College Press.
Drucker, P. (1980). The deadly sins in public administration. Public Administration Review. ̂ (2), 103-106.
Duke, D., Showers, B., & Imber, M. (1980). Teachers as school decision makers. Stanford, CA: Institute for Research on Educational Finance and Governance, Stanford University.
Eckard, L. (1991). Total quality management--A new lens to focus schools. Leadership News. AASA. 83. 1-2.
Edmonds, R. (1979). Effective schools for the urban poor. Educational Leadership. 17(1), 15-24.
Eginton, D. P. (1931, December). Thirty ways to improve teaching. Journal of Education, pp. 479-480.
Elsbree, W. S. (1939). The American teacher: Evolution of a profession in a democracy. New York: American Book Co.
Edowsomwan, J. A., & Savage-Moore, W. (1991). Assess your organization's TQM posture and readiness to successfully compete for the Malcolm Baldridge Award. Industrial Engineering. 22(2), 22-24.
Eubanks, P. (1991). Hospitals offer wellness programs in effort to trim health costs. Hospitals. 65(23), 42-43.
170
Evenden, E. S., Gamble, G. C., & Blud, H. G. (1933). National survey of the education teachers (Bulletin No. 10, p. 32). Washington, DC: U.S. Department of the Interior, Office of Education.
Fantini, M., & Gittell, M. (1973). Decentralization: Achieving reform. New York: Praeger Publishers.
Parish, P. (1987). Beyond quality circles. Personnel Administration. 32, 14.
Farquhar, C. R. (1990). Total quality management: A competitive imperative for the '90s. Optimum. 21(4), 30-39.
Feigenbaum, A. V. (1954). Total quality control. New York: McGraw-Hill.
Fertik, E. (1991). Applying TQM principles to part-time employees. Bureaucrat. 20(3), 42-44.
Finley, M. (1991). The power of X-Y grids. Quality Progress. 24(10), 102-107.
Fishbein, M., & Ajzen, I. (1975). Belief, attitude, intention, and behavior: An introduction to theory and research. Reading, MA: Addison-Wesley.
Fitch, T. P. (1984). Putting the emphasis on quality. U.S. Banker. 95. 28-30.
Freundlich, N., Schine, E., Smith, G., & Carey, J. (1991, October). Research and development: Getting everybody into the act; weapons to plowshares; a warm feeling inside; the courage to fail [Special issue]. Business Week, pp. 148-160.
Fullan, M. (1991). The new meaning of educational change. New York: Teacher's College Press.
Gabor, A. (1988), The man who changed the world of quality. International Management. 43. 42-43.
Gabor, A. (1990). Deming's quality manifesto. Best of Business Quarterly. 12(4), 6-10.
Gail, C. (1991, October). The quality imperative [Special issue]. Business Week, pp. 8-14.
Gardner, J. W. (1971). Excellence: Can we be equal and excellent too? New York: Harper & Row.

171
Gartner, W. B. , & Naughton, M. J. (1988). The Deraing theory of management. Academic Management Review. 13. 138-142.
Geber, B. (1986). Quality circles: The second generation. Training, 23, 54-59.
Geber, B. (1990, September). Improving the quality of white-collar work. Training, the Magazine of Human Resources Development, pp. 29-34.
Geber, B. (1991, March). The IBM way of winning. Training, the Magazine of Human Resources Development, pp. 39-40.
Gideonse, H., Holm, D., & Westheimer, R. (1981). School site budgeting: Abstracting the literature. A Project for the Education Panel of the Cincinnatus Association.
Glasser, W. (1990a). The quality school. New York: Harper & Row.
Classer, W. (1990b). The quality school. Phi Delta Kappan. 71(6), 425-435.
Glatthorn, A. A. (1990). Supervisory leadership: Introduction to instructional supervision. Glenview, IL: Scott, Foresman, and Company.
Claub, J. (1990), Made in Japan. Illinois School Board Journal. 58. 5-7.
Glenn, T. (1991). The formula for success in TQM. Bureaucrat. 20(1), 17-20.
Glickman, C. D. (1990a), Pushing school reform to a new edge: The seven ironies of school empowerment. Phi Delta Kappan. 66-75.
Glickman, C. D, (1990b). Supervision of instruction: A developmental approach (2nd ed.). Boston, MA: Allyn and Bacon.
Goddard, R, W. (1988), In quest of quality. Management World. 17. 19-21.
Goldbaum, E. (1988), How quality programs win respect--and get results. Chemical Week. 143. 30-33.
Goodkin, S. R. (1990). Quality: A goal for the '90s. Professional Builder. 55, 56.
Goodlad, J. I. (1982). A study of schooling. Unpublished paper presented to the Stanford Teacher Education Project, Stanford, CA.
Goodlad, J. I. (1984). A place called school: Prospects for the future. New York: McGraw-Hill.
172
Griffin, R. W. (1988). Consequences of quality circles in an industrial setting: A longitudinal assessment. Academic Management. 31. 338-358.
Gryna, F. M. (1988). Juran's quality control handbook. New York: McGraw-Hill.
Guaspari, J. (1988). You want buy-in to quality? Then you've got to sell it. Management Reyiew. 77. 22-25.
Gufreda, J. J., Maynard, L. A., & Lytle, L. N. (1989). Employee involvement in the quality process. Implementing Prerequisites, pp. 163-176.
Hagland, M. M. (1991). ED overcrowding spurs interest in quality and credentialing issues. Hospitals. 65(14), 33-36.
Halberstam, D. (1986). The Reckoning. New York: William Morrow.
Hames, R. D. (1991). Total quality management; The strategic advantage. International Journal of Physical Distribution and Logistics Management. 21(4), 9-14.
Mammons, C. , & Maddux, G. A. (1989). An obligation to Improve [applying W. E. Deming's managerial techniques in public sector]. Management Decisions. 22(6), 5-8.
Harbour, J. (1988). Key success factors. Automotive Industry. 168. 19.
Harris, F. H., & Harris, R. C. (1992). Glasser comes to a rural school. Educational Leadership. ̂ (3), 18-21.
Harvey, G., & Crandall, D. (1988). A beginning look at the what and how of restructuring. Andover, MA: The Regional Laboratory for Education Improvement of the Northeast and Islands.
Hendricks, C. F., & Triplett, A. (1989). TQM: Strategy for '90s management. Personnel Administration. ̂ (12), 42-48.
Herman, J., & Kaufman, R. (1991a, May). Making the mega plan. The American School Board Journal, pp. 24-25.
Herman, J., & Kaufman, R, (1991b). Strategic planning for a better society. Educational Leadership. ̂ (7), 4-8.
Herrington, G. M. (1991). The catch-22 of total quality management. Across the Board. 28(9), 53-55.
173
Hixson, J. (1990). Restructuring schools: Exploring school-based management and empowerment issues. Policy Briefs, North Central Regional Educational Library.
Hixson, J., & Lovelace, K. (1992). A quality approach of writing assessment. Educational Leadership. 50(9), 24-27.
Holpp, L. (1989). Ten reasons why total quality is less than total. Training. 26, 93-103.
Honeycutt, A. (1989). Research report: The key to effective quality circles. Training Development. 43. 81-84.
Hopkins, S. A. (1989). Have U.S. financial institutions really embraced quality control? National Product Review. 8, 407-420.
Horan, K. (1991, October). The quality imperative [Special issue]. Business Week, pp. 70-71.
Horton, T. R. (1989). Back to basics: Quality is the key to global success. Business Credit. 12. 91.
Houlihan, C. T. (1991). Planning a total quality school district in Johnston County, North Carolina. An Introduction to Total Oualitv for Schools• A Collection of Articles on the Concepts of Total Oualitv. Management and W. Edwards Deming. 32, 1-6.
Hoy, W. K., & Miskel, C. G. (1991). Educational administration: Theory. research, and practice (4th ed.). ' New York: McGraw-Hill.
Hronicek, F. R. (1981). The historical development of the teachers' union in United States' public education (Doctoral dissertation. University of Saint Louis, 1982). Dissertation Abstracts International. 41. 2857A.
Hull, K., & Neptune, D. (1991). The data quality objectives process. Journal for Oualitv and Participation. 14(5), 72-78.
Hull, T. (1991). Total quality management; Rededicating management to customer satisfaction. Canadian Manager. 16(3), 12-13.
Hunter, L. L. , & Vanderslice, L. M. (1991). The LIS: The overlooked tool for TQM. Computers in Healthcare. 12(9), 48-49.
Hunter, M. (1990). Preface: Thoughts on staff development. In B. Joyce (Ed.), Changing school culture through staff development (pp. xi-xiv). Alexandria, VA: Association for Supervision and Curriculum Development.

174
Hurst, D. K. (1986, Autumn). Why strategic management is bankrupt. Organizational Dynamics. p p . 5 - 2 7 .
Hutchins, C. L. (1987). Restructuring as a third waye strategy for school reform. Presented at School Year 2000: An International Seminar on Creating Effective Schools of the Future. Aurora, CO: Mid-Continent Regional Educational Laboratory.
Hyde, A. C, (1990), Rescuing quality measurement from TQM. Bureaucrat. 19(4), 16-20.
Ingle, S. (1982). How to avoid quality circle failure in your company. Training and Development Journal. 36(6), 54-59.
Iowa Department of Education, (1988). New standards for Iowa schools. Des Moines: Author.
Ishikawa, K. (1985). What is total quality control? The Japanese wav (D. Lu, Trans.). Englewood Cliffs, NJ: Prentice-Hall,
Jenkins, G, C. (1991). How to succeed by really trying--The sequel. Security Management. 35(10), 56-57.
Jespersen, F. F. (1989). Once more with feeling: Quality starts at the top. Business Monthly. 134. 65-66,
Johnson, J, G. (1991). Why aren't our managers better leaders? Tapping the Network Journal. 2(1), 2-4.
Johnson, S. M. (1984), Teacher unions in schools. Philadelphia, PA: Temple University Press.
Joiner, B. L, (1985), Total quality leadership vs, management by results. An Introduction to Total Quality Schools. A Collection of Articles on the Concepts of Total Quality Management and W. Edwards Deming, 12, 1-7.
Juran, J, M. (1980), Quality planning and analysis (2nd ed.). New York: McGraw-Hill.
Juran, J. M. (1988a), Juran on leadership: for quality. New York: McGraw-Hill.
Juran, J. M, (1988b). Quality can't be delegated. Supervision. 49, 6-7.
Kaluzny, A. D. (1980). Revitalizing decision-making at the middle management level. Hospital and Health Services Administration. 34(1). 39-51.
175
Kaufman, R. (1991). Toward total quality "plus." Training. 28(12), 50-54.
Kelley, C. A., & Brown, M. B. (1987). Quality circles in the hospital setting: Their current status and potential for the future. Health Care Management Review. 12, 55-59.
Kellog, A. B. (1940). Adapt or quit! Journal of Education. (January), 16-17.
Kelly, T. (1988). Small change: The comprehensive school improvement program. New York: Educational Priorities Panel.
Kern, J. P. (1991). The QIS/TQM balancing act. Quality. 30(12), 18-41.
Kiely, T. (1991). "Q" tips. CIO, 4(11), 26-32.
Kincaid, W. A. (1931). Teaching is more than a job. Journal of Education. (October), 227-228.
Klekamp, R. C. (1989). Commitment to quality is not enough. Advantage Management. 54. 13-16.
Koalatv Kid Manual. (1991). American Society for Quality Control. Milwaukee, WI.
Koller, A. M. (1991). TQM: Understanding the basics of total quality management. Manage. ̂ (4), 15, 27-28.
Koons, P. F. (1991). Getting comfortable with TQM. Bureaucrat. 20(2), 35-38.
Kratochwill, E. W., & Gaucher, E. J. (1991, Jan.). National demonstration project on industrial quality control and health care quality. Journal for Oualitv and Participation, pp. 32-34.
Krone, B. (1990). Total quality management: An American odyssey. Bureaucrat. 19(3), 35-38.
Kwok, D. (1990). TQM and Australian CEOs. Oualitv. 29(11), 14-15.
Labovitz, G. H. (1991a). Beyond the total quality management mystique. Healthcare Executive. 6(2), 15-17.
Labovitz, G. H. (1991b). The total-quality health care revolution. Oualitv Progress. 24(9), 45-47.
Lansing, R. L. (1989). The power of teams. Supervisorv Management. 34. 39-43.
176
Larson, J. S. (1989). Employee participation in federal government. Public Personnel Management. 18. 404-414.
Lawler, E. E. (1987). Quality circles: After the honeymoon. Organizational Dynamics. 15, 42-54.
Lawson, D., & Tubbs, L. (1985). Quality circles: An experiment in higher education. National Association of Secondary Principals Association Journal. 22(4), 35-46.
Leader, C. (1989). Making total quality management work: Lessons from industry. Aviation Week and Space Technology. 131(18), 65-69.
Leithwood, K. A, (1990). The principal's role in teacher development. In B. Joyce (Ed.), Changing school culture through staff development (pp. 71-90). Alexandria, VA: Association for Supervision and Curriculum Development.
Leonard, J. F. (1983). Can your organization support quality circles? Training Development. 37. 67-68.
Leonard, J. F. (1991). Applying Deming's principles to our schools. South Carolina Business. 11, 82-87.
Lepley, W. L. (1991, September). Responsibility for top schools falls on all lowans [Letter to the editor]. Des Moines Sunday Register. p. 32.
Levin, H. M. (1988). Accelerated schools for at-risk students. New Brunswick, NJ: Center for Policy Research in Education, Rutgers University.
Lezotte, L. (1991). School improvement based on effective schools research. Okemos, MI.
Lezotte, L., & Jacoby, B. (1990). A guide for developing a building plan for school improvement. Okemos, MI.
Lightfoot, S. L. (1983). The good high school: Portraits of character and culture. New York: Basic Books, Inc.
Little, J, W. (1981). The power of organizational setting: School norms and staff development. Paper presented at the annual meeting of the American Educational Research Association, Los Angeles, CA.
Louis, K. S., & Miles, M. B. (1990). Improving the urban high school: What works and why. New York: Teacher's College Press.
Lueker, D. (1990). Kentucky starts from scratch. The American School Board Journal. 177(9), 17-21.
177
MacKenzie, D. (1983). Research for school improvement: An appraisal for some recent trends. Educational Researcher. 12(4), 5-17.
MacKinder, H. (1919). The geographic pivot of history. In MacKinder, H. (Ed.), The scope and methods of geography. London: The Royal Geographic Society.
Mahan, A. (1890). The Influence of sea power on history. 1660-1783. Boston, MA: Little, Brown.
Maquire, M. (1991, March). Fathoming Deming's ideas on quality. The Washington Times, p. C2.
Margolis, N. (1991). Black & Decker revs quality tool; its survey uncovers cost-saving methods. Computer World. £5(28), 18.
Marx, G. (1991). Total quality management--A new lens to focus schools. Leadership News. AASA. 83. 1-2.
McCarthy, G. J. (1991). TQM is key to improving services but it's not for every hospital. Health Care Strategic Management. 9(11), 18-20.
McCune, S. D. (1986). Guide to strategic planning for educators. Alexandria, VA: Association for Supervision and Curriculum Development.
McDonnell, L. M., & Pascal, A. (1988). Teacher unions and educational reforms. New Brunswick, NJ: Center for Policy Research in Education, Rutgers University.
McDonnell, S. N., & Hudiburg, J. J. (1988). The foundation for the Malcolm Baldridge National Quality Award. Business America. 109. 7.
McKenna, J. F. (1991). TQM government. Industry Week. 240(21') . 12-19.
McLaughlin, C. P., & Kaluzny, A. D. (1990). Total quality management in health: Making it work. Health Care Management Review. 15(3), 7-14.
McLeod, W. (1991). Toward a system of total quality management (the Deming way). An Introduction to Total Quality for Schools. A Collection of Articles on the Concepts of Total Quality Management and W. Edwards Deming. 33. 1-14.
McNeil, L. M. (1987). Exit, voice and community: Magnet teachers' responses to standardization. Educational Policy. 2, 93-113.
McWilliams, G. (1991, October). The quality imperative [Special issue]. Business Week, pp. 144-145.
178
Meaney, D. (1991). Quest for quality. California Technology Project Quarterly. 2, 8-15.
Mecca, T. V., & Adams, C. F. (1991). An alternative futures approach to planning for school systems. Educational Leadership. ̂ (7), 12-16.
Malum, M. M. (1990). Total quality management: Steps to success. Hospitals. 64(23), 42, 44.
Melvin, C. (1991). Restructuring schools by applying Deming's management theories. Journal of Staff Development. 12, 16-20.
Mendenhall, S. (1991). How the supplier can contribute to TQM. Health Industry Today. 45(12), 13-14.
Milakovich, M. E. (1991a). Total quality management for public sector productivity improvement. Public Productivity and Management Review. 14(1), 19-32.
Milakovich, M. E. (1991b). Total quality management in the public sector. National Productivity Review. 10(2), 195-213.
Miljus, R. C. (1986). Key ingredients in cooperative initiatives. Personnel. 63. 69-73.
Miller, T. R. (1984). The quality circle phenomenon; A review and appraisal. 54, 4-7.
Moen, R. D. (1989). The Deming philosophy for improving the educational process. Paper presented to the Third Annual International Deming Users' Group Conference, Cincinnati, OH.
Mooney, S. F. (1991). Gearing up for the 21st century. Insurance Review. 52(1), 26-28.
Morrow, D. W. (1991). Be good or be gone. International Business. 4(6), 24-28.
Morton, R. (1992). Quality concepts are coming to education. School and College. 31(2), 17-19.
Moskal, B. S. (1991). Mysteries remain for management. Industry Week. 2̂ (14), 53.
Muller, W. (1991). Gaining competitive advantage through customer satisfaction. European Management Journal. 9(2), 201-211.
Nardini, M., & Mandel, D. (1986). The right reforms. The American School Board Journal. 173(12), 17-19.
179
National Commission on Excellence in Education. (1983). A nation at risk: The imperative for educational reform. Washington, DC: U.S. Government Printing Office.
National Council on Education Standards and Testing. (1992). Raising standards for American education (pp. 2, 6). Washington, DC: Office of Technology Assessment.
National Education Association. (1923). What are the weak spots in our public school system? Research Bulletin. 1, 265.
National Education Association. (1940). The status of the teaching professional. Research Bulletin. 18, 59.
National Education Association. (1952). Teacher personnel practices, 1950-51: Appointed and termination of service. Research Bulletin. 30, 12-13.
National Governors' Association. (1987). Results in education. Washington, DC: National Governors' Association.
Nebgen, M. (1991). The key to success in strategic planning is communication. Educational Leadership. 26-28.
Newman, C. B. (1991). Good government needs good people. Bureaucrat. 20(2), 6-10.
Newsome, R., & McCormick, R. (1992, May). Individual telephone interview with elementary principals, Indianola and Marshalltown community schools, Marshalltown and Indianola, Iowa.
North Central Regional Educational Laboratory. (1990). The future is now. Annual report.
Nyberg, D., & Farber, P. (1986). Authority in education. Teachers College Record. M(l), 4-14.
Oberle, J. (1990, January). Quality gurus : The men and their message. Training, the Magazine of Human Resources Development, pp. 47-52.
Orlich, D. C. (1978). Designing sensible survevs. Pleasantville, NY: Redgrave.
Penzer, E. (1991). Making a federal case for quality. Incentive. 165(8), 29-30, 107.
Perine, J, (1990). America's quality coaches. Federal Total Quality Management Handbook, pp. 1-11.
180
Perlman, L. (1989). Control data; Giving employees ownership in quality. Management Review. 78, 64-65.
Perry, L. (1988). The quality process. Modern Healthcare. 18(14), 30-34.
Peterson, T., Kelly, K., Weber, J., & Gross, N. (1991, October). The quality imperative [Special issue]. Business Week, pp. 66-68.
Pierce, L. C. (1980). School based management. OSSC Bulletin. 10, 1-49.
Pines, E. (1990a, May 21). From top secret to top priority: The story of TQM. Aviation Week and Space Technology. Advertiser Sponsored Market Supplement, pp. 5, 8, 12, 17, 24.
Pines, E. (1990b, May). The gurus of TQM. Aviation Week and Space Technology. Advertiser Sponsored Market Supplement, pp. 29, 33-34, 36.
Placek, C. (1991). Academic, industry seek approaches to teaching and researching TQM in business and engineering schools. Quality Volume. 30(9), 11-12.
Port, Q. (1991, October). The quality imperative [Special issue]. Business Week, pp. 15, 17.
Powell, A., Cohen, D., & Farrar, E. (1984). The shopping mall high school. New York: Houghton-Mifflin.
Prasch, J. C. (1984). Reversing the trend toward centralization. Educational Leadership. 42(2), 27-29.
Price, M. (1949). Professional attitudes for teachers. Educational Outlook. 23(2).
Psihoyos, L. (1991, October). The quality imperative [Special issue]. Business Week, pp. 20-22.
Purkey, S, C., & Smith, M. S. (1983). Effective schools : A review. The Elementary School Journal. ̂ (4), 426-452.
Purkey, S. C., & Smith, M. S. (1985). School reform: The district policy implications of the effective schools literature. The Elementary School Journal. ̂ (3), 353-389.
Quimby, C., Parker, L., & Weimersckirch, A. M. (1991). How, exactly, do you communicate quality? Quality Progress. 24(6), 52-54.
Quinn, J. B. (1980). Strategies for change: Logical incrementalism. Homewood, ID: Richard D. Irwin, Inc.
181
Rago, W. V. (1991). Total quality management strategies in mental health systems. Journal of Mental Health Administration. 18(3), 253-263.
Ravitch, D. (1984). The troubled crusade: American education 1945-1980. New York: Basic Books.
Reavis, W. C. (1949). What teachers should know about educational administration. Educational Outlook. 23(2).
Reilly, L. (1991, April). Deming: A lesson from the master? Washington Technology. 6(1), 23.
Reynolds, L. (1989). Promoting quality in the public and private sectors. Management Review. 78, 16-17.
Rhodes, L. (1990). Beyond your belief: Quantum leaps toward quality schools. The School Administrator. ̂ (11), 23-26.
Rhodes, L. (1990). Why quality is within our grasp . . . if we reach. The School Administrator. ̂ (10), 31-34.
Rhodes, L. (1991). An introduction to total quality for schools. A collection of articles on the concents of total quality management on W. Edwards Deming. Arlington, VA.
Rist, M. (1990). Chicago decentralized. The American School Board Journal. 177(9). 21-36.
Ritter, D. (1991). Let's elevate quality on our national agenda. National Productivity Review. 10(4), 447-452.
Rohan, T. M. (1989). Baldridge Award's winners tell how. Industry Week. 238, 23.
Roll, J. L., & Roll, D. L. (1983). The potentials for application of quality circles in the American public sector. Public Productivity Review. 7(27), 122-142.
Rosenholtz, S. J. (1987). Education reform strategies; Will they increase teachers' commitment? American Journal of Education. 3, 534-562.
Salter, J. M. (1991). Take systematic approach to measuring satisfaction. Marketing News. 23(3), 9.
Sandholm, L. (1988). Inspection--Key role in a company's export quality control system. International Trade Forum. 24. 14-17.
Sarason, S. B. (1990). The predictable failure of educational reform. San Francisco, CA: Jossey-Bass.
182
Sarazen, J. S. (1991). Continuous improvement and innovation. Journal for Quality and Participation. 14(5), 34-39.
Saunders, I. W., & Walker, M. (1991). TQM in tertiary education. International Journal of Quality and Reliability Management. 8/5), 91-102.
Schaaf, Dick. (1991, March). Beating the drum for quality. Training, the Magazine of Human Resources Development, pp. 5-6, 8, 11-12, 30.
Schendel, D. E., & Hutten, K. J. (1972). Strategic planning and higher education: Some concepts, problems, and opportunities (Reprint #442), Lafayette. IN: Institute for Research in the Behavioral, Economic, and Management Sciences, Purdue University.
Schening, E. E. (1990). How to build a quality-conscious team. Supervisor Management. 35. 6.
Schmoker, M., & Wilson, R. B. (1993). Transforming schools through total quality education. Phi Delta Kappan. 74(5), 389-395.
Scott, W. B. (1989). TQM expected to boost productivity, ensure survival of U.S. industry. Aviation Week. 13(23), 64-69.
Sensenbrenner, J. (1991a, March-April). Quality comes to city hall. Harvard Business Review, pp. 64-65, 68-70, 74-75.
Sensenbrenner, J. (1991b). Quality for cities. Nation's Business. 79(10), 60, 62.
Shanker, A. (1990). Staff development and the restructured school. In B. Joyce (Ed.), Changing culture through staff development (pp. 91-103). Alexandria, VA: Association for Supervision and Curriculum Development.
Sherman, E. R. (1931, December). Abolish the teacher type. Journal of Education, p. 8.
Sickler, J. L. (1988). Teachers in charge: Empowering the professionals. Phi Delta Kappan. 354, 356, 375.
Siler, J., & Garland, S. (1991, October). The quality imperative [Special issue]. Business Week, pp. 111-112.
Sizer, T. R. (1984). Horace's compromise: The dilemma of the American high school. Boston, MA: Houghton-Mifflin.
Sizer, T. (1990, February). Lessons from the trenches. U.S. News and World Report, pp. 50-55.
183
Smeltzer, L. R., & Kedia, B. L. (1987). Training needs of quality circles. Personnel. 64. 51-55.
Smyth, H. G. (1986). A more open workplace. Nation's Business. 74. 6.
Snyder, K. J., & Anderson, R. H. (1986). Managing productive schools: Toward an ecology. Orlando, FL: Academic Press, Inc.
Socolovsky, A. (1990). The Baldridge Award can make you a winner even without winning. Electronic Business. 16(19), 25.
Spiker, B. K. (1991). Total quality management: The mind-set for competitiveness in the 1990s. Manufacturing Systems. 9 ( 9 ) , 40-55.
Spikes, W. F., III. (1985, November). Utilizing the concepts of strategic planning in an educational setting. Paper presented at the Conference of the American Association for Adult and Continuing Education, Milwaukee, WI.
Sprackland, T. (1991). Mid-managers seek escape from quality squeeze. Electronic Business. 17(19), 83-84.
Stampen, J. (1987). Improving the quality of education: W. Edwards Deming and effective schools. Contemporary Education Review. 6(3), 423-433.
Steimer, T. E. (1990). Activity-based accounting for total quality. Management Accounting. 72(4), 39-42.
Steiner, G. A. (1979). Strategic planning : What every manager must know. New York: The Free Press.
Stokes, J. H. (1974, January). Enrollment in the school of education. Educational News. pp. 93-95.
Stratton, B. (1991). Federal quality missionaries. Quality Progress. 24(5), 67-69.
Stucker, D. E. ' (1985). An overview of the history of collective bargaining and a detailed analysis of scope of collective bargaining of public school employees (Doctoral dissertation, University of San Francisco, 1986). Dissertation Abstracts International. 47. 1566A.
Tang, L. P. (1987). The effect of quality circle initiation on motivation to attend quality circle meetings and on task performance. Personnel Psychology. 40. 799-814.
Taylor, T. E. (1991). Development of a valid and reliable school culture audit. Doctoral dissertation, Iowa State University, Ames, lA.
184
Temple, A. I., & Dale, B. G. (1989). A study of quality circles in white-collar areas. Management Decisions. 27(3), 28-36.
The Holmes Group. (1986). Tomorrow's teachers. East Lansing, MI: The Holmes Group, Inc.
Therrien, L. (1991, October). The quality imperative [Special issue]. Business Week, pp. 60-61.
Thor, C. G. (1991). Quality and productivity improvement in banking. Financial Managers' Statement. 13(5), 11-14.
Thurber, J. (1992). Classer comes to a rural school. Educational Leadership. 50(9), 18-21.
Tobin, L. M. (1990). The new quality landscape: Total quality management. Journal of Systems Management. ̂ (11), 10-14.
Torrance, P. E. (1982). Education for quality circles in Japanese schools. Journal of Research and Development in Education. 15, 11-12.
Trades Union Congress. (1982). Quality circles. Duality Circle Digest. 2, 11-12.
Tribus, M. (1990). The application of quality management principles in education at Mt. Edgecujnbe High School, Sitka, Alaska. An Introduction to Quality Schools. A Collection of Articles on the Concepts of Total Duality Management and W. Edwards Deming. 30. 1-12.
Tribus, M. (1991). TQM at the grass roots. An Introduction to Quality Schools. A Collection of Articles on the Concepts of Total Duality Management and W. Edwards Deming. 23, 1-29.
Tribus, M., & Yoshikazy, T. (1987). Creating the quality company. Quality First: Selected Papers on Quality and Productivity, American Quality and Productivity Institute/National Society of Professional Engineers, Section D, 17 pp.
Tucker, M., & Mande1, D. (1986). The Carnegie report--A call for redesigning the schools. Phi Delta Kappan. pp. 24-27.
Tumey, R. D. (1991). The application of total quality management to hazard studies and their recording. International Journal of Duality and Reliability Management. 8(6), 47-53.
Tveite, M. D. (1989). The theory behind the fourteen points: Management focused on improvement instead of on judgment. An Introduction to Quality Schools. A Collection of Articles on the Concepts of Total Quality Management and W. Edwards Deming. 4, 1-7.

185
Twentieth Century Fund Task Force on Federal Elementary and Secondary Education Policy. (1983). Making the prade. New York: Author.
Ummel, S. L. (1991). Quality management; Fad or future? Computers in Healthcare. 12(9), 4.
Vansina, L. S. (1989). Total quality control: An overall organizational improvement strategy. National Productivity Review. 9, 59-73.
Varian, T. (1991). Communicating total quality inside the organization. Quality Progress. 24(6), 30-31.
Velocci, A. L. (1991). TQM makes Rockwell tougher competitor. Aviation Week and Space Technology. 135(23), 68-69.
Vogt, J. F., & Hunt, B. D. (1988). What really goes wrong with participative work groups? Training Development. 42. 96-100.
Von Neumann, J., & Morgenstern, 0. (1947). Theory of games and economic behavior. Princeton, NJ: Princeton University Press.
Wachel, W. (1991). An interview with the college's chairman, Paul Ellison. Healthcare Executive. 6(5), 19-22.
Walsh, M. (1990). Quality improvement team handbook. Union Pacific Railroad, pp. 1-12.
Walters, P. B. (1984). Educational expansion and economic growth in the United States, 1890 to 1979 (Doctoral dissertation, John Hopkins University, 1984). Dissertation Abstracts International. 44. 3506A.
Walton, M. (1986). The Deming management method. New York: Dodd, Mead, & Company.
Watanabe, S. (1991). The Japanese quality control circle: Why it works. International Labour Review. 130(1), 57-80.
Weber, D. 0. (1991). Pioneering quality in the intermountain west. Healthcare Forum. 34(5), 54-60.
White, P. A. (1988). Resource materials on school-based management. New Brunswick, NJ: Center for Policy Research in Education, Rutgers University.
Whiting, R. (1991a). Benchmarking: Lessons from the best-in-class. Electronic Business. 17(19), 128-134.
Whiting, R. (1991b). Engineers say "Prove it!" Electronic Business. 12(19), 89-92.
186
Wilkinson, A., Allen, P., & Snape, E. (1991). TQM and the management of labor. International Journal of Manpower. 12(6), 35-42.
Wilkinson, G. W. (1986). Strategic planning in the voluntary sector. In Gardner, J. L,, Rachlin, R., & Sweeny, H. W. A. (Eds.), Handbook of strategic planning. New York: John Wiley & Sons.
Williamson, J. W. (1988), Future policy directions for quality assurance: Lessons from the health accounting experience. Inquiry. 25, 67-77.
. Willis, G. (1991). The "Q" word and management accounting. CMA Magazine. 6̂ (6), 28.
Willis, S. (1993). Creating quality schools. ASCD Update. 2(35), 1-5.
Winship, A. E. (1932, November). Married women teachers. Journal of Education, p. 598.
Woodruff, D., & Levine, J. (1991). The quality imperative [Special issue]. Business Week, pp. 70-73.
Woody, T. (1943). Entrance of women into the teaching profession. Educational Outlook. 2(2), 72-88.
Woolley, W. M., & Croteau, J. M. (1991). Beginning strategic planning in Leon County, Florida. Educational Leadership. M.(7), 9-11.
Wyszewianski, L. (1988). Quality of care: Past achievement and future challenges. Inquiry. 25. 13-22.
Yates, R. E. (1991, January). Management guru, 91, still trying to get message home to U.S. The Chicago Tribune, pp. 1, 13.
Yovovich, B. G. (1991). Becoming a world-class customer. Business Marketing. 26(9), 16, 29.
Zahra, S. A. (1984). What supervisors think about quality circles. Supervisor Management. 29, 27-33.
Zentmyer, R. K. (1991). The journey from bureaucracy to TQM. Oualitv Progress. 24(9), 61-66.
Zippo, M. (1980). Productivity and moral sagging: Try the quality circle approach. Personnel. 57(37), 43.
Zippo, M. , & Greenberg, K. (1982). Task forces are not quality circles. Personnel. 6, 47-49.
187
APPENDIX A.
SURVEY OF EDUCATOR BELIEFS CONCERNING TOTAL QUALITY MANAGEMENT
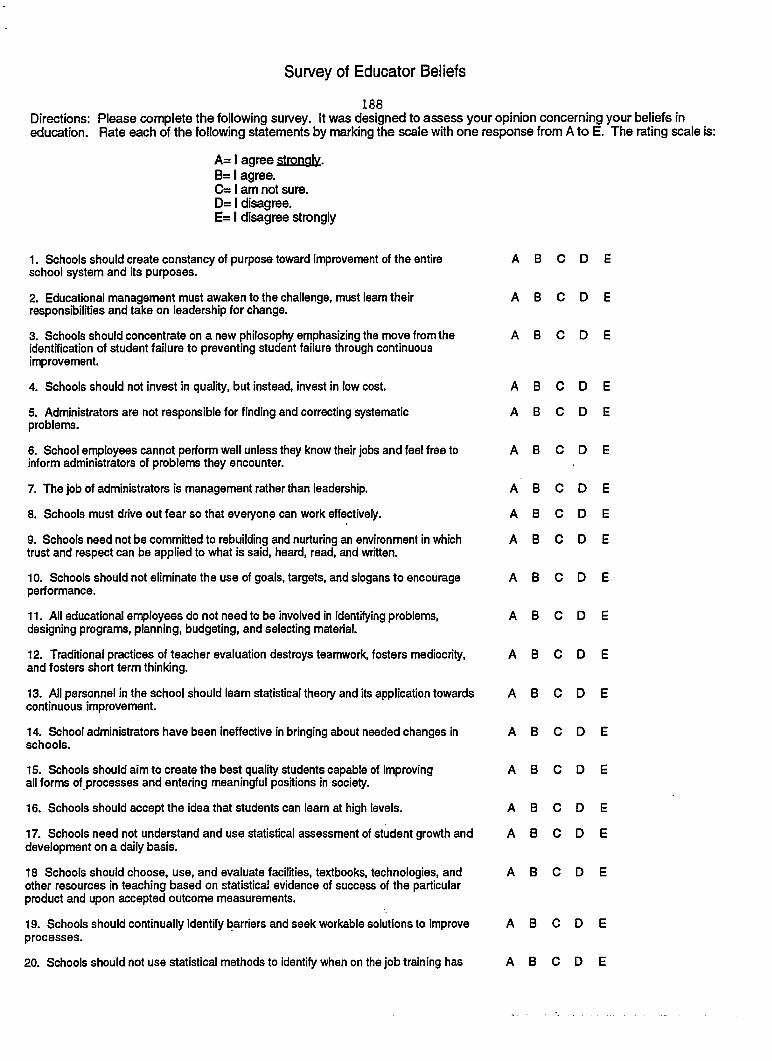
Survey of Educator Beliefs
188 Directions: Please complete the following survey. It was designed to assess your opinion concerning your beliefs in education. Rate each of the following statements by marking the scale with one response from A to E. The rating scale is:
A= I agree stronalv. B= I agree. C= I am not sure. D= I disagree. E= I disagree strongly
1. Schools should create constancy of purpose toward improvement of the entire ABODE school system and its purposes.
2. Educational management must awaken to the challenge, must learn their ABODE responsibilities and take on leadership for change.
3. Schools should concentrate on a new philosophy emphasizing the move from the ABODE identification of student failure to preventing student failure through continuous improvement.
4. Schools should not invest in quality, but instead, invest in low cost. ABODE
5. Administrators are not responsible for finding and correcting systematic ABODE problems.
6. School employees cannot perform well unless they know their jobs and feel free to ABODE inform administrators of problems they encounter.
7. The job of administrators is management rather than leadership. ABODE
8. Schools must drive out fear so that everyone can work effectively. ABODE
9. Schools need not be committed to rebuilding and nurturing an environment in which ABODE trust and respect can be applied to what is said, heard, read, and written.
10. Schools should not eliminate the use of goals, targets, and slogans to encourage ABODE performance.
11. All educational employees do not need to be involved in identifying problems, ABODE designing programs, planning, budgeting, and selecting material.
12. Traditional practices of teacher evaluation destroys teamwork, fosters mediocrity, ABODE and fosters short term thinking.
13. All personnel in the school should learn statistical theory and its application towards ABODE continuous improvement.
14. School administrators have been ineffective in bringing about needed changes in ABODE schools.
15. Schools should aim to create the best quality students capable of improving ABODE all forms of processes and entering meaningful positions in society.
16. Schools should accept the idea that students can learn at high levels. ABODE
17. Schools need not understand and use statistical assessment of student growth and ABODE development on a daily basis.
18 Schools should choose, use, and evaluate facilities, textbooks, technologies, and ABODE other resources in teaching based on statistical evidence of success of the particular product and upon accepted outcome measurements.
19. Schools should continually identify barriers and seek workable solutions to improve ABODE processes.
20. Schools should not use statistical methods to identify when on the job training has ABODE
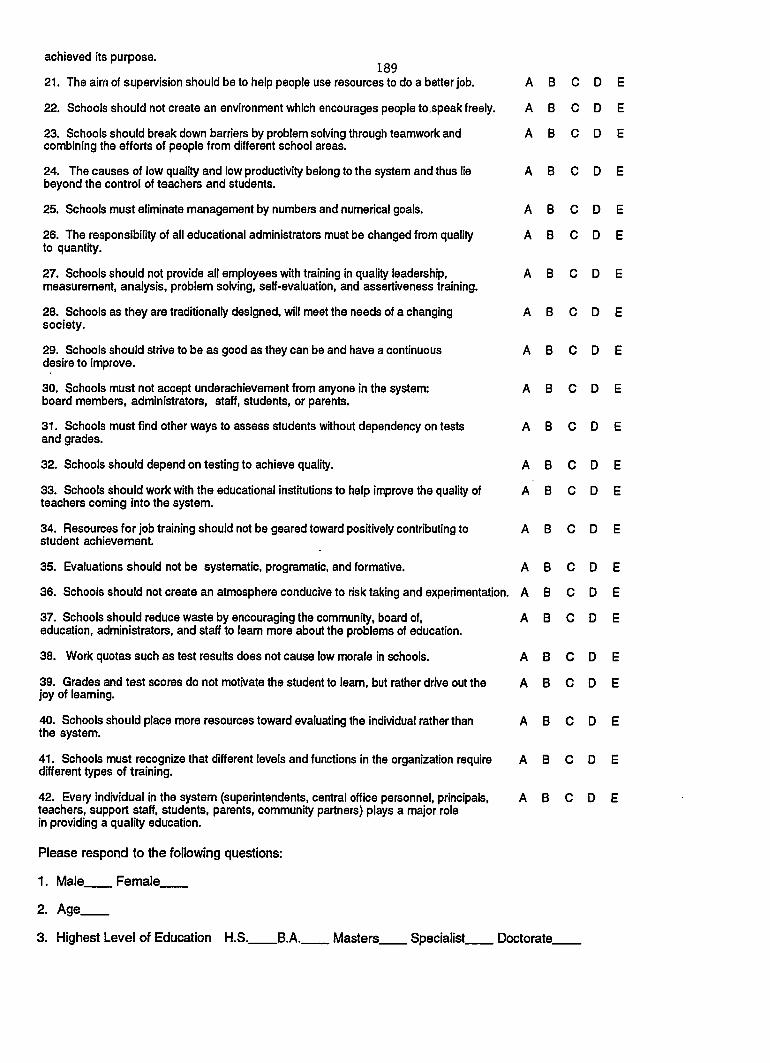
achieved its purpose. 189
21. The aim of supervision should be to help people use resources to do a better job. ABODE
22. Schools should not create an environment which encourages people to.speak freely. ABODE
23. Schools should break down barriers by problem solving through teamwork and ABODE combining the efforts of people from different school areas.
24. The causes of low quality and low productivity belong to the system and thus lie ABODE beyond the control of teachers and students.
25. Schools must eliminate management by numbers and numerical goals. ABODE
26. The responsibility of all educational administrators must be changed from quality ABODE to quantity.
27. Schools should not provide all employees with training in quality leadership, ABODE measurement, analysis, problem solving, self-evaluation, and assertiveness training.
28. Schools as they are traditionally designed, will meet the needs of a changing ABODE society.
29. Schools should strive to be as good as they can be and have a continuous ABODE desire to improve.
30. Schools must not accept underachievement from anyone in the system: ABODE board members, administrators, staff, students, or parents.
31. Schools must find other ways to assess students without dependency on tests ABODE and grades.
32. Schools should depend on testing to achieve quality. ABODE
33. Schools should work with the educational institutions to help improve the quality of ABODE teachers coming into the system.
34. Resources for job training should not be geared toward positively contributing to ABODE student achievement.
35. Evaluations should not be systematic, programatic, and formative. A B 0 D E
A B 0 D E
A B 0 D E 37. Schools should reduce waste by encouraging the community, board of, education, administrators, and staff to leam more about the problems of education.
38. Wori< quotas such as test results does not cause low morale in schools. ABODE
39. Grades and test scores do not motivate the student to leam, but rather drive out the ABODE joy of learning.
40. Schools should place more resources toward evaluating the individual rather than ABODE the system.
41. Schools must recognize that different levels and functions in the organization require ABODE different types of training.
42. Every individual in the system (superintendents, central office personnel, principals, ABODE teachers, support staff, students, parents, community partners) plays a major role in providing a quality education.
Please respond to the following questions:
1. Male Female
2. Age
3. Highest Level of Education H.S. B.A. Masters Specialist Doctorate
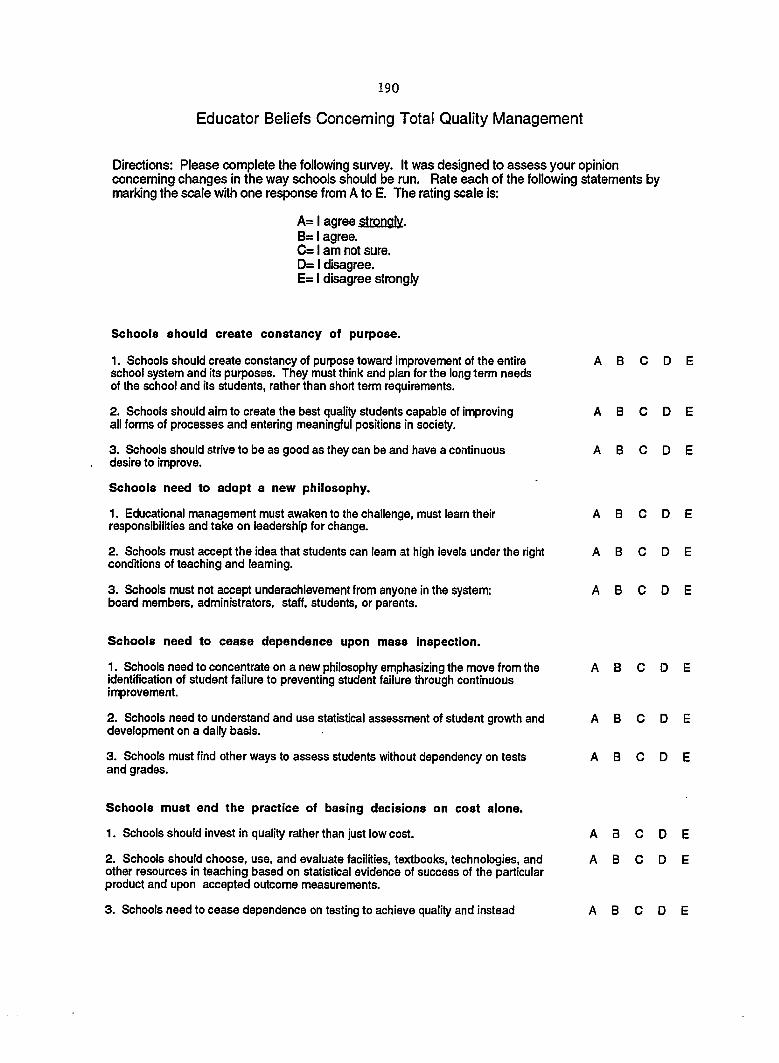
190
Educator Beliefs Concerning Total Quality Management
Directions: Please complete the following survey. It was designed to assess your opinion concerning changes in the way schools should be run. Rate each of the following statements by marking the scale with one response from A to E. The rating scale is:
A=lagreegi2og|y. B= I agree. C= I am not sure. D= I disagree. E= I disagree strongly
Schools should create constancy of purpose.
1. Schools should create constancy of purpose toward improvement of the entire ABODE school system and its purposes. They must think and plan for the long term needs of the school and its students, rather than short term requirements.
2. Schools should aim to create the best quality students capable of improving ABODE all forms of processes and entering meaningful positions in society.
3. Schools should strive to be as good as they can be and have a continuous ABODE desire to improve.
Schools need to adopt a new philosophy.
1. Educational management must awaken to the challenge, must learn their ABODE responsibilities and take on leadership for change.
2. Schools must accept the idea that students can learn at high levels under the right ABODE conditions of teaching and teaming.
3. Schools must not accept underachievement from anyone in the system: ABODE board members, administrators, staff, students, or parents.
Schools need to cease dependence upon mass inspection.
1. Schools need to concentrate on a new philosophy emphasizing the move from the ABODE identifkation of student failure to preventing student failure through continuous improvement.
2. Schools need to understand and use statistical assessment of student growth and ABODE development on a daily basis.
3. Schools must find other ways to assess students without dependency on tests ABODE and grades.
Schools must end the practice of basing decisions on cost alone.
1. Schools should invest in quality rather than just low cost. ABODE
2. Schools should choose, use, and evaluate facilities, textbooks, technologies, and ABODE other resources in teaching based on statistical evidence of success of the particular product and upon accepted outcome measurements.
3. Schools need to cease dependence on testing to achieve quality and instead ABODE
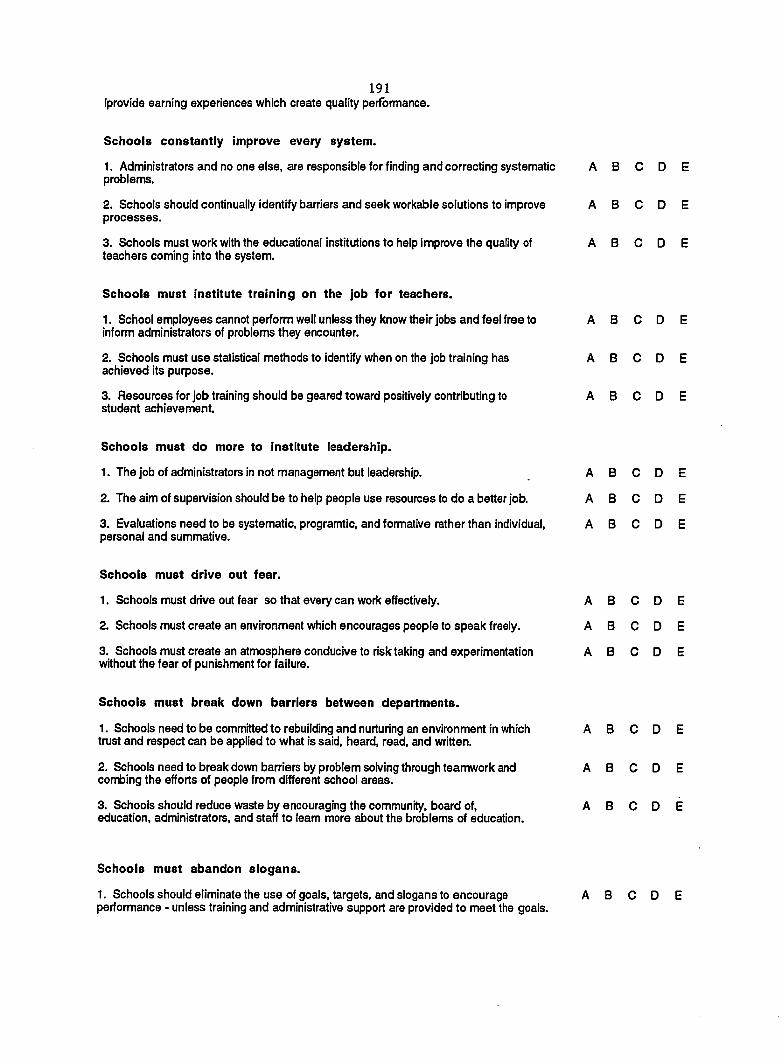
191
Iprovide earning experiences whicli create quality performance.
Schools constantly improve every system.
1. Administrators and no one else, are responsible for finding and correcting systematic problems.
A B C D E
2. Schools should continually identify barriers and seek workable solutions to improve processes.
A B C D E
3. Schools must work with the educational institutions to help improve the quality of teachers coming into the system.
A B C D E
Schools must institute training on the job for teachers.
1. School employees cannot perform well unless they know their jobs and feel free to infomri administrators of problems they encounter.
A B C D E
2. Schools must use statistical methods to identify when on the job training has achieved its purpose.
A B C D E
3. Resources for job training should be geared toward positively contributing to student achievement.
A B C D E
Schools must do more to institute leadership.
1. The job of administrators in not management but leadership. A B C D E
2. The aim of supervision should be to help people use resources to do a better job. A B C D E
3. Evaluations need to be systematic, programtic, and formative rather than individual, personal and summative.
A B C D E
Schools must drive out fear.
1. Schools must drive out fear so that every can work effectively. A B C D E
2. Schools must create an environment which encourages people to speak freely. A B C D E
3. Schools must create an atmosphere conducive to risk taking and experimentation without the fear of punishment for failure.
A B C D E
Schools must break down barriers between departments.
1. Schools need to be committed to rebuilding and nurturing an environment in which trust and respect can be applied to what is said, heard, read, and written.
A B C D E
2. Schools need to break down barriers by problem solving through teamwork and combing the efforts of people from different school areas.
A B C D E
3. Schools should reduce waste by encouraging the community, board of, education, administrators, and staff to learn more about the brobiems of education.
A B C D E
Schools must abandon slogans.
1. Schools should eliminate the use of goals, targets, and slogans to encourage performance - unless training and administrative support are provided to meet the goals.
A B C D E
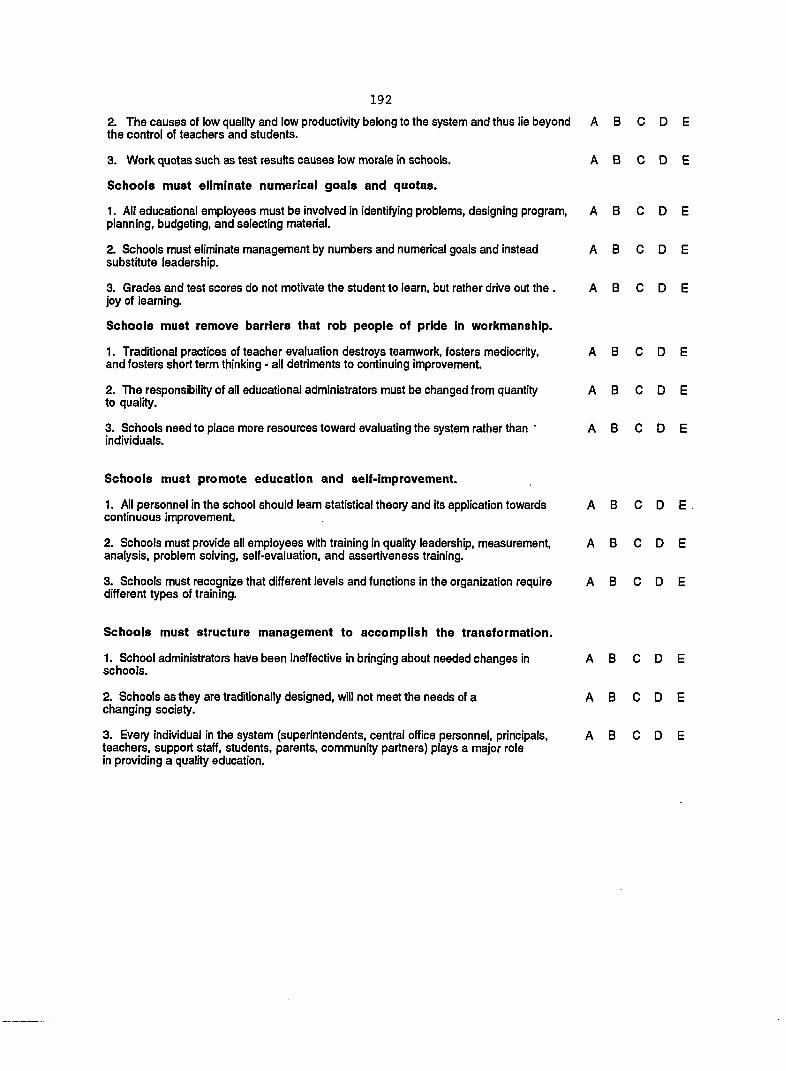
192
2. The causes of low quality and low productivity belong to the system and thus lie beyond the control of teachers and students.
3. Work quotas such as test results causes low morale in schools.
Schools must eliminate numerical goals and quotas.
1. All educational employees must be involved in identifying problems, designing program, planning, budgeting, and selecting material.
2. Schools must eliminate management by numbers and numerical goals and instead substitute leadership.
3. Grades and test scores do not motivate the student to learn, but rather drive out the . joy of learning.
Schools must remove barriers that rob people of pride In workmanship.
1. Traditional practices of teacher evaluation destroys teamwork, fosters mediocrity, and fosters short term thinking - all detriments to continuing improvement.
2. The responsibility of all educational administrators must be changed from quantity to quality.
3. Schools need to place more resources toward evaluating the system rather than ' individuals.
Schools must promote education and self-improvement.
1. All personnel in the school should learn statistical theory and its application towards continuous improvement.
2. Schools must provide all employees with training in quality leadership, measurement, analysis, problem solving, self-evaluation, and assertiveness training.
3. Schools must recognize that different levels and functions in the organization require different types of training.
Schools must structure management to accomplish the transformation.
1. School administrators have been ineffective in bringing about needed changes in schools.
2. Schools as they are traditionally designed, will not meet the needs of a changing society.
3. Every individual in the system (superintendents, central office personnel, principals, teachers, support staff, students, parents, community partners) plays a major role in providing a quality education.

193
APPENDIX B.
LETTERS TO PANEL OF EXPERTS
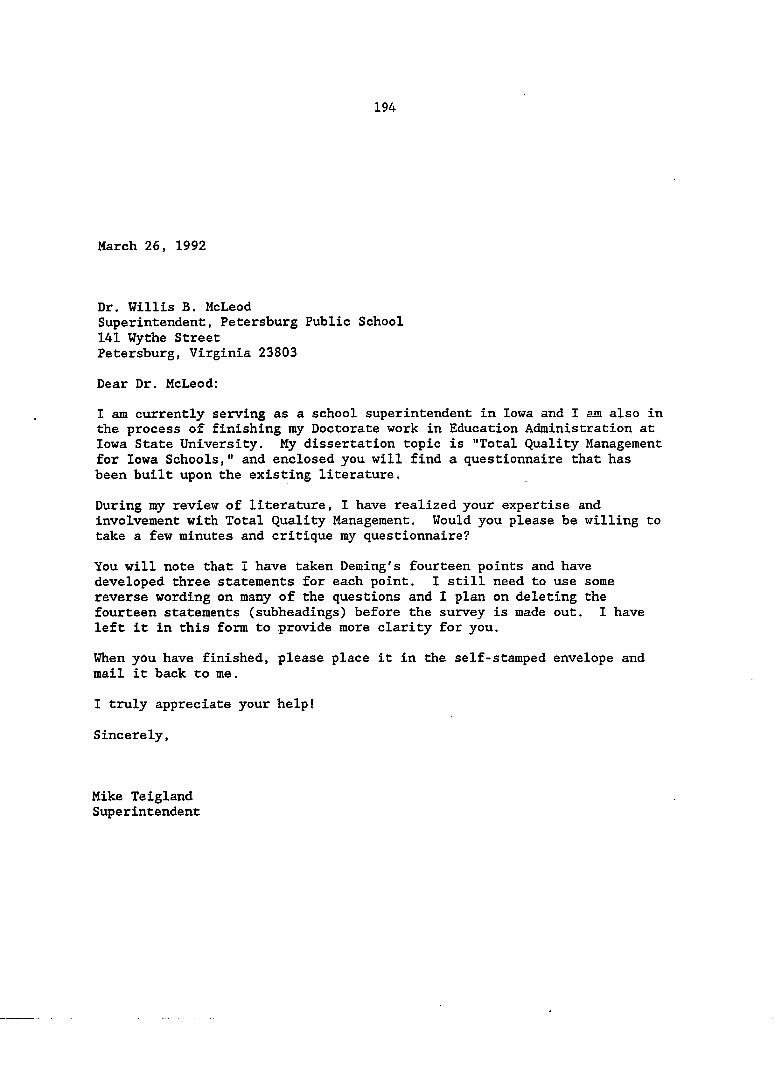
194
March 26, 1992
Dr. Willis B. McLeod Superintendent, Petersburg Public School 141 Wythe Street Petersburg, Virginia 23803
Dear Dr. McLeod:
I am currently serving as a school superintendent in Iowa and I am also in the process of finishing my Doctorate work in Education Administration at Iowa State University. My dissertation topic is "Total Quality Management for Iowa Schools," and enclosed you will find a questionnaire that has been built upon the existing literature.
During my review of literature, I have realized your expertise and involvement with Total Quality Management. Would you please be willing to take a few minutes and critique my questionnaire?
You will note that I have taken Deming's fourteen points and have developed three statements for each point. I still need to use some reverse wording on many of the questions and I plan on deleting the fourteen statements (subheadings) before the survey is made out. I have left it in this form to provide more clarity for you.
When you have finished, please place it in the self-stamped envelope and mail it back to me.
I truly appreciate your help!
Sincerely,
Mike Teigland Superintendent
195
March 26, 1992
Dr, Jacob Stampen Dept. Education Administration/ Univ. Wisconsin-Madison 1025 W. Johnson St. Madison, Wisconsin 53706
Dear Dr. Stampen;
I am currently serving as a school superintendent in Iowa and I am also in the process of finishing my Doctorate work in Education Administration at Iowa State University. My dissertation topic is "Total Quality Management for Iowa Schools," and enclosed you will find a questionnaire that has been built upon the existing literature.
During my review of literature, I have realized your expertise and involvement with Total Quality Management. Would you please be willing to take a few minutes and critique my questionnaire?
You will note that I have taken Deming's fourteen points and have developed three statements for each point. I still need to use some reverse wording on many of the questions and I plan on deleting the fourteen statements (subheadings) before the survey is made out. I have left it in this form to provide more clarity for you.
When you have finished, please place it in the self-stamped envelope and mail it back to me.
I truly appreciate your help!
Sincerely,
Mike Teigland Superintendent
196
March 26, 1992
Dr. Charles A. Melvin, III Superintendent School District of Beloit Turner 1231 Inman Parkway Beloit, Wisconsin 53511
Dear Dr. Melvin:
I am currently serving as a school superintendent in Iowa and I am also in the process of finishing my Doctorate work in Education Administration at Iowa State University. My dissertation topic is "Total Quality Management for Iowa Schools," and enclosed you will find a questionnaire that has been built upon the existing literature.
During my review of literature, I have realized your expertise and involvement with Total Quality Management. Would you please be willing to take a few minutes and critique my questionnaire?
You will note that I have taken Deming's fourteen points and have developed three statements for each point. I still need to use some reverse wording on many of the questions and I plan on deleting the fourteen statements (subheadings) before the survey is made out. I have left it in this form to provide more clarity for you.
When you have finished, please place it in the self-stamped envelope and mail it back to me.
I truly appreciate your help!
Sincerely,
Mike Teigland Superintendent

197
March 26, 1992
Lewis A. Elhodes American Association of School Administrators 1801 North Moore Street Arlington, Virginia 22209-9988
Dear Mr. Rhodes :
I am currently serving as a school superintendent in Iowa and I am also in the process of finishing my Doctorate work in Education Administration at Iowa State University. My dissertation topic is "Total Quality Management for Iowa Schools," and enclosed you will find a questionnaire that has been built upon the existing literature.
During my review of literature, I have realized your expertise and involvement with Total Quality Management. Would you please be willing to take a few minutes and critique my questionnaire?
You will note that I have taken Deming's fourteen points and have developed three statements for each point. I still need to use some reverse wording on many of the questions and I plan on deleting the fourteen statements (subheadings) before the survey is made out. I have left it in this form to provide more clarity for you.
When you have finished, please place it in the self-stamped envelope and mail it back to me.
I truly appreciate your help!
Sincerely,
Mike Teigland Superintendent
198
March 26, 1992
Dr. David Meaney Superintendent, Sacramento County Schools Sacramento County Office of Education 9738 Lincoln Village Drive Sacramento, California 95827
Dear Dr. Meaney;
I am currently serving as a school superintendent in Iowa and I am also in the process of finishing my Doctorate work in Education Administration at Iowa State University. My dissertation topic is "Total Quality Management for Iowa Schools," and enclosed you will find a questionnaire that has been built upon the existing literature.
During my review of literature, I have realized your expertise and involvement with Total Quality Management. Would you please be willing to take a few minutes and critique my questionnaire?
You will note that I have taken Deming's fourteen points and have developed three statements for each point. I still need to use some reverse wording on many of the questions and I plan on deleting the fourteen statements (subheadings) before the survey is made out. I have left it in this form to provide more clarity for you.
When you have finished, please place it in the self-stamped envelope and mail it back to me.
I truly appreciate your help!
Sincerely,
Mike Teigland Superintendent
199
March 26, 1992
Mr. Myron Tribus Exergy Inc. Hayward, California 94541
Dear Mr. Tribus:
I am currently serving as a school superintendent in Iowa and I am also in the process of finishing my Doctorate work in Education Administration at Iowa State University. My dissertation topic is "Total Quality Management for Iowa Schools," and enclosed you will find a questionnaire that has been built upon the existing literature.
During my review of literature, I have realized your expertise and involvement with Total Quality Management. Would you please be willing to take a few minutes and critique my questionnaire?
You will note that I have taken Deming's fourteen points and have developed three statements for each point. I still need to use some reverse wording on many of the questions and I plan on deleting the fourteen statements (subheadings) before the survey is made out. I have left it in this form to provide more clarity for you.
When you have finished, please place it in the self-stamped envelope and mail it back to me.
I truly appreciate your help!
Sincerely,
Mike Teigland Superintendent

200
APPENDIX C.
SCHOOL DISTRICTS USED IN STUDY
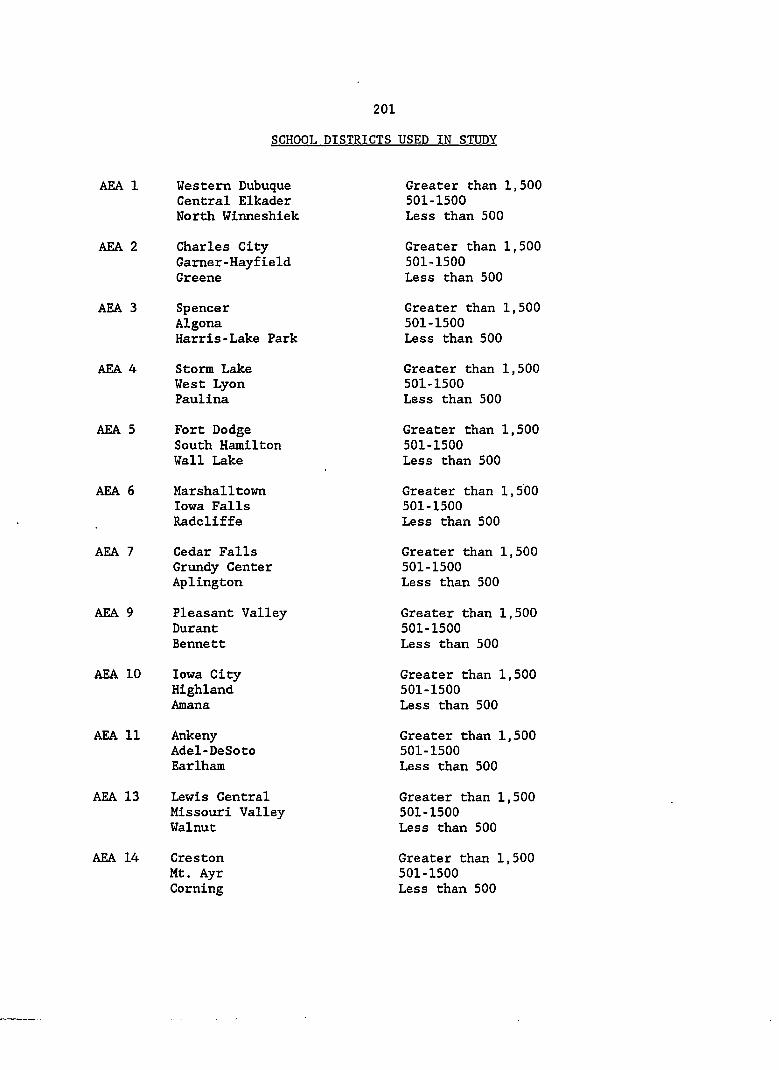
201
SCHOOL DISTRICTS USED IN STUDY
AEA 1 Western Dubuque Central Elkader North Winneshiek
Greater than 1,500 501-1500 Less than 500
AEA 2 Charles City Garner-Hayfield Greene
Greater than 1,500 501-1500 Less than 500
AEA 3 Spencer Algona Harris-Lake Park
Greater than 1,500 501-1500 Less than 500
AEA 4 Storm Lake West Lyon Paulina
Greater than 1,500 501-1500 Less than 500
AEA 5 Fort Dodge South Hamilton Wall Lake
Greater than 1,500 501-1500 Less than 500
AEA 6 Marshalltown Iowa Falls Radcliffe
Greater than 1,500 501-1500 Less than 500
AEA 7 Cedar Falls Grundy Center Aplington
Greater than 1,500 501-1500 Less than 500
AEA 9 Pleasant Valley Durant Bennett
Greater than 1,500 501-1500 Less than 500
AEA 10 Iowa City Highland Amana
Greater than 1,500 501-1500 Less than 500
AEA 11 Ankeny Adel-DeSoto Earlham
Greater than 1,500 501-1500 Less than 500
AEA 13 Lewis Central Missouri Valley Walnut
Greater than 1,500 501-1500 Less than 500
AEA 14 Creston Mt. Ayr Corning
Greater than 1,500 501-1500 Less than 500
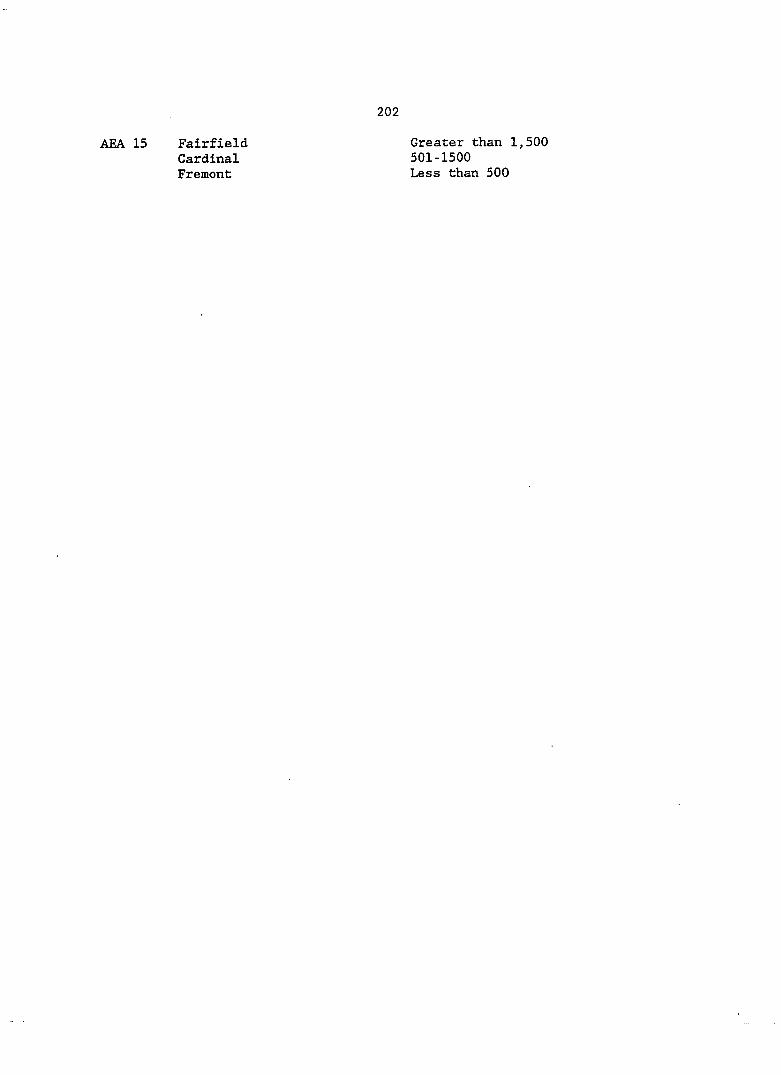
202
Fairfield Cardinal Fremont
Greater than 1,500 501-1500 Less than 500

203
APPENDIX D.
DIRECTIONS TO SUPERINTENDENTS
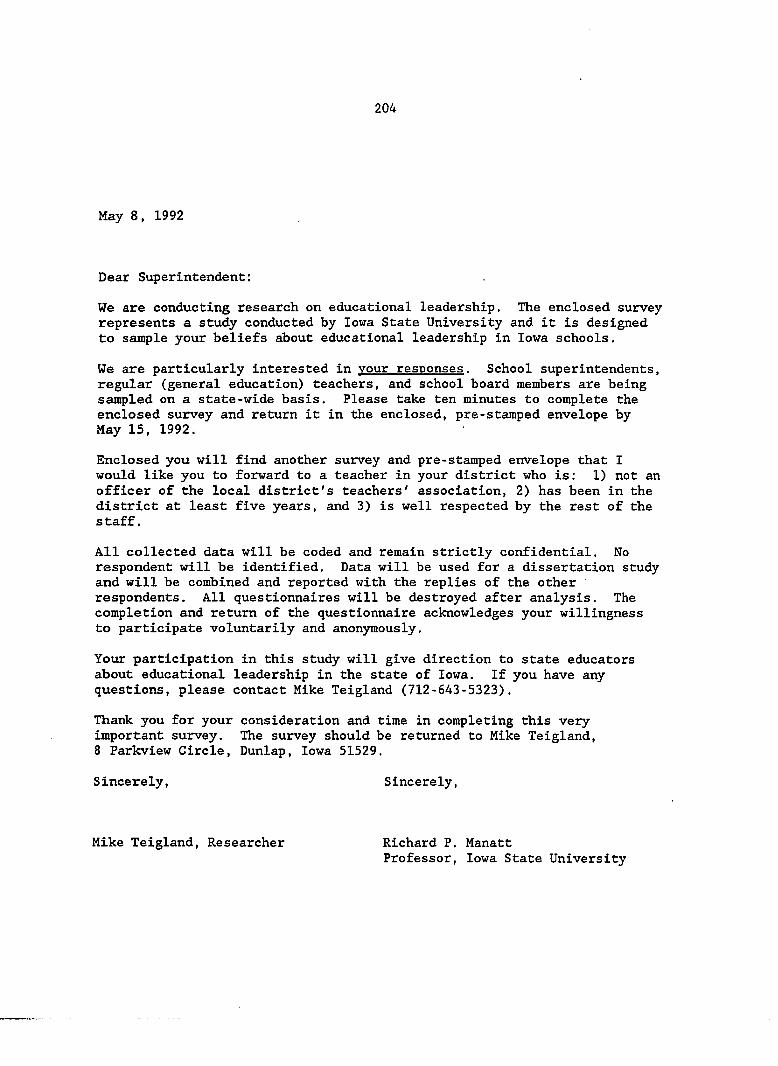
204
May 8, 1992
Dear Superintendent:
We are conducting research on educational leadership. The enclosed survey represents a study conducted by Iowa State University and it is designed to sample your beliefs about educational leadership in Iowa schools.
We are particularly interested in your responses. School superintendents, regular (general education) teachers, and school board members are being sampled on a state-wide basis. Please take ten minutes to complete the enclosed survey and return it in the enclosed, pre-stamped envelope by May 15, 1992.
Enclosed you will find another survey and pre-stamped envelope that I would like you to forward to a teacher in your district who is: 1) not an officer of the local district's teachers' association, 2) has been in the district at least five years, and 3) is well respected by the rest of the staff.
All collected data will be coded and remain strictly confidential. No respondent will be identified. Data will be used for a dissertation study and will be combined and reported with the replies of the other respondents. All questionnaires will be destroyed after analysis. The completion and return of the questionnaire acknowledges your willingness to participate voluntarily and anonymously.
Your participation in this study will give direction to state educators about educational leadership in the state of Iowa. If you have any questions, please contact Mike Teigland (712-643-5323).
Thank you for your consideration and time in completing this very important survey. The survey should be returned to Mike Teigland, 8 Parkview Circle, Dunlap, Iowa 51529.
Sincerely, Sincerely,
Mike Teigland, Researcher Richard P. Manatt Professor, Iowa State University
205
APPENDIX E.
DIRECTIONS TO TEACHER

206
May 8, 1992
Dear Fellow Educator:
We are conducting research on educational leadership. The enclosed survey represents a study conducted by Iowa State University and it is designed to sample your beliefs about educational leadership in Iowa schools.
We are particularly interested in vour responses. School (general education) teachers, superintendents, and school board members are being sampled on a state-wide basis. Please take ten minutes to complete the enclosed survey and return it in the enclosed, pre-stamped envelope by May 15, 1992.
All collected data will be coded and remain strictly confidential. No respondent will be identified. Data will be used for a dissertation study and will be combined and reported with the replies of the other respondents. All questionnaires will be destroyed after analysis. The completion and return of the questionnaire acknowledges your willingness to participate voluntarily and anonymously.
Your participation in this study will give direction to state educators about educational leadership in the state of Iowa. If you have any questions, please contact Mike Teigland (712-643-5323).
Thank you for your consideration and time in completing this very important survey. The survey should be returned to Mike Teigland, 8 Parkview Circle, Dunlap, Iowa 51529.
Sincerely, Sincerely,
Mike Teigland, Researcher Richard P. Manatt Professor, Iowa State University

207
APPENDIX F.
DIRECTIONS TO BOARD MEMBER
208
May 8, 1992
Dear Board Member:
We are conducting research on educational leadership. The enclosed survey represents a study conducted by Iowa State University and it is designed to sample your beliefs about educational leadership in Iowa schools.
We are particularly interested in your responses. School superintendents, regular (general education) teachers, and school board members are being sampled on a state-wide basis. Please take ten minutes to complete the enclosed survey and return it in the enclosed, pre-stamped envelope by May 15, 1992.
All collected data will be coded and remain strictly confidential. No respondent will be identified. Data will be used for a dissertation study and will be combined and reported with the replies of the other respondents. All questionnaires will be destroyed after analysis. The completion and return of the questionnaire acknowledges your willingness to participate voluntarily and anonymously.
Your participation in this study will give direction to state educators about educational leadership in the state of Iowa. If you have any questions, please contact Mike Teigland (712-643-5323).
Thank you for your consideration and time in completing this very important survey. The survey should be returned to Mike Teigland, 8 Parkview Circle, Dunlap, Iowa 51529.
Sincerely, Sincerely,
Mike Teigland, Researcher Richard P. Manatt Professor, Iowa State University

209
APPENDIX G.
FOLLOW-UP LETTER

210
May 18, 1992
Dear Fellow Educator:
Approximately two weeks ago I mailed out a survey instrument for use in research for my dissertation study at Iowa State University.
If this survey instrument is still laying on your desk, would you please take ten to fifteen minutes to complete the form and return it to me. I would appreciate it greatly and I can assure you that your responses will be kept strictly anonymous.
Thanks again for your cooperation in this study. If you should happen to need another copy of the survey, I would be happy to mail you one.
Sincerely,
Mike Teigland Researcher
211
APPENDIX H.
FOURTEEN POINTS AND FORTY-TWO BELIEF STATEMENTS
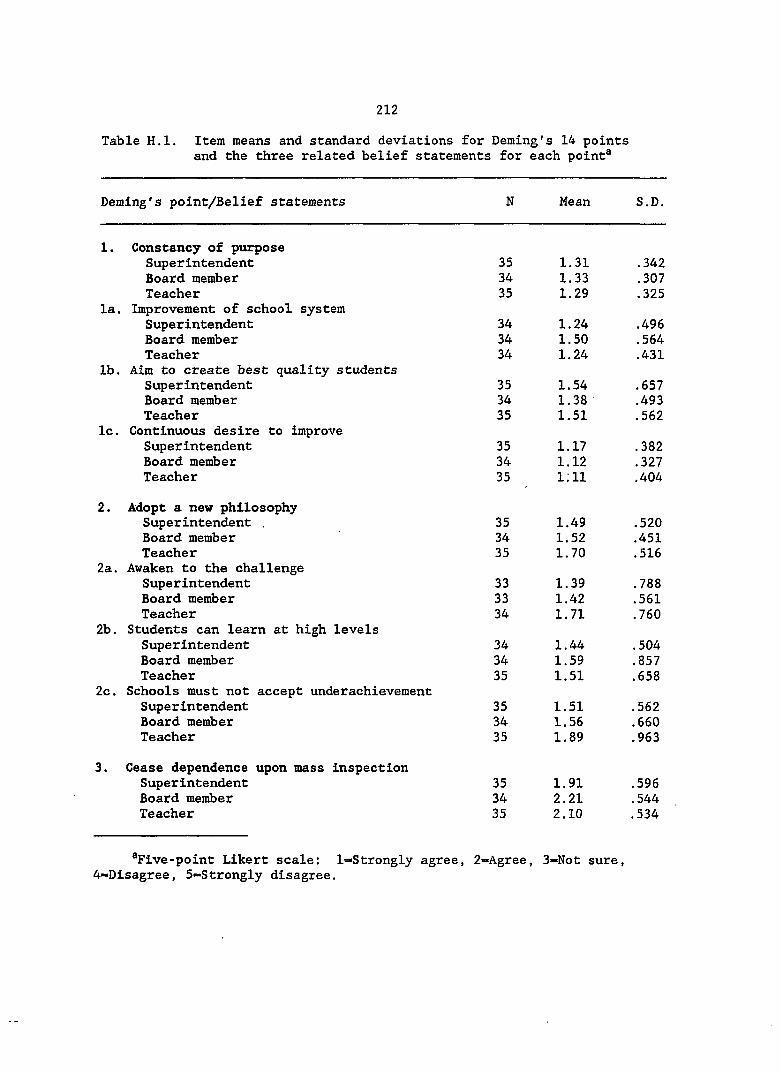
212
Table H.l. Item means and standard deviations for Deming's 14 points and the three related belief statements for each point®
Deming's point/Belief statements N Mean S.D.
1. Constancy of purpose Superintendent 35 1.31 .342 Board member 34 1.33 .307 Teacher 35 1.29 .325
la. Improvement of school system Superintendent 34 1.24 .496 Board member 34 1.50 .564 Teacher 34 1.24 .431
lb. Aim to create best quality students Superintendent 35 1.54 .657 Board member 34 1.38 .493 Teacher 35 1.51 .562
Ic. Continuous desire to improve Superintendent 35 1.17 .382 Board member 34 1.12 .327 Teacher 35 1:11 .404
2. Adopt a new philosophy Superintendent . 35 1.49 .520 Board member 34 1.52 .451 Teacher 35 1.70 .516
2a. Awaken to the challenge Superintendent 33 1.39 .788 Board member 33 1.42 .561 Teacher 34 1.71 .760
2b. Students can learn at high levels Superintendent 34 1.44 .504 Board member 34 1.59 .857 Teacher 35 1.51 .658
2c. Schools must not accept underachievement Superintendent 35 1.51 .562 Board member 34 1.56 .660 Teacher 35 1.89 .963
3. Cease dependence upon mass Inspection Super intendent 35 1.91 .596 Board member 34 2.21 .544 Teacher 35 2.10 .534
^Five-point Likert scale: l=-Strongly agree, 2-Agree, 3-Not sure, 4-Disagree, 5-Strongly disagree.
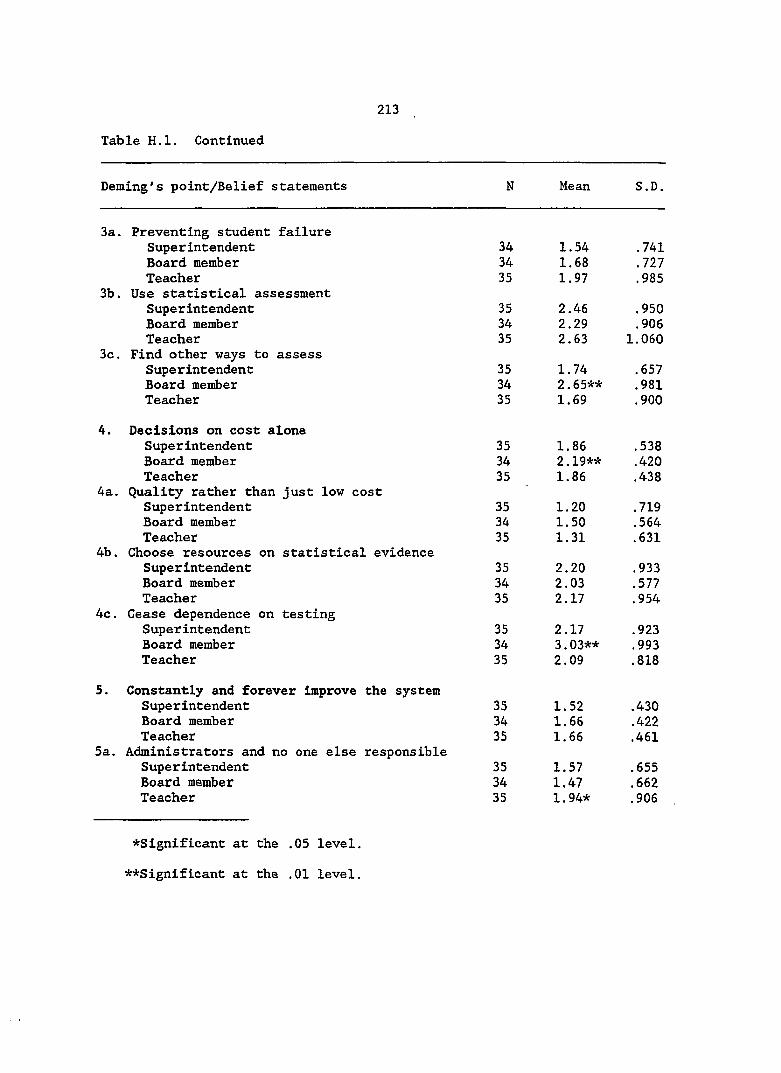
Table H.l. Continued
213
Deming's point/Belief statements N Mean S.D.
3a. Preventing student failure Superintendent 34 1.54 .741 Board member 34 1.68 .727 Teacher 35 1.97 .985
3b. Use statistical assessment Superintendent 35 2.46 .950 Board member 34 2.29 .906 Teacher 35 2.63 1.060
3c. Find other ways to assess Superintendent 35 1.74 .657 Board member 34 2.65** .981 Teacher 35 1.69 .900
4. Decisions on cost alone Superintendent 35 1.86 .538 Board member 34 2.19** .420 Teacher 35 1.86 .438
4a. Quality rather than just low cost Superintendent 35 1.20 .719 Board member 34 1.50 .564 Teacher 35 1.31 .631
4b. Choose resources on statistical evidence Superintendent 35 2.20 .933 Board member 34 2.03 .577 Teacher 35 2.17 .954
4c. Cease dependence on testing Superintendent 35 2.17 .923 Board member 34 3.03** .993 Teacher 35 2.09 .818
5. Constantly and forever improve the system Superintendent 35 1.52 .430 Board member 34 1.66 .422 Teacher 35 1.66 .461
5a. Administrators and no one else responsible Superintendent 35 1.57 .655 Board member 34 1.47 .662 Teacher 35 1.94* .906
*Significant at the .05 level.
**Significant at the .01 level.
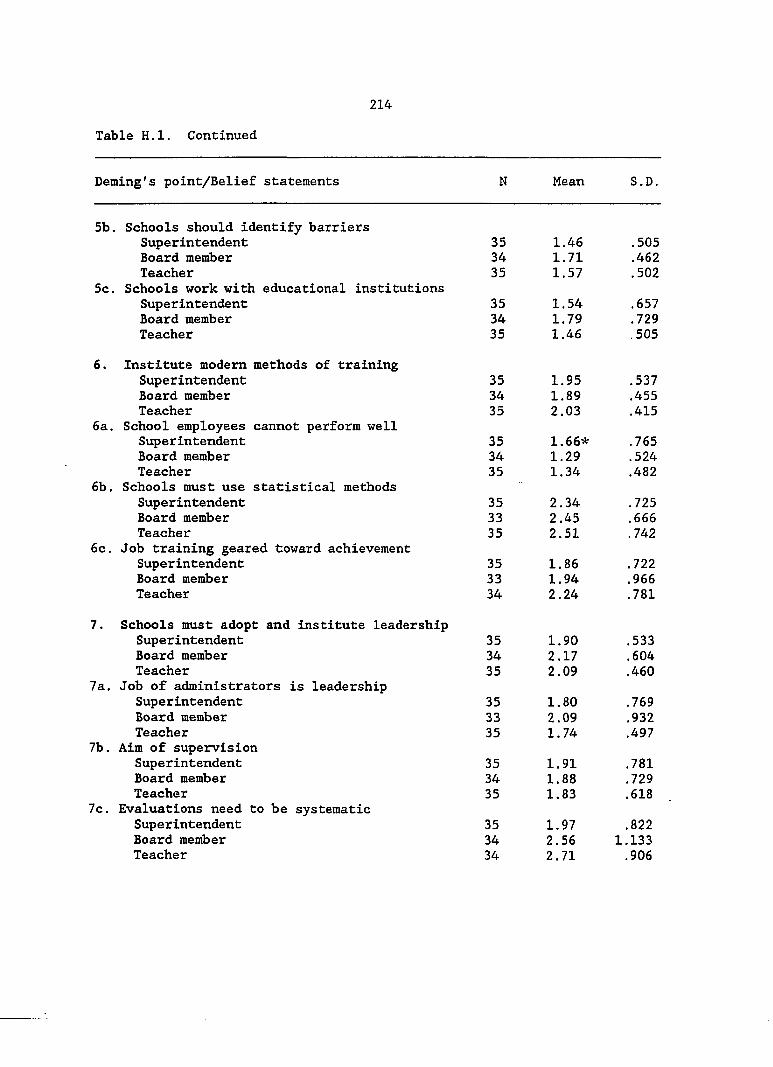
214
Table H.l. Continued
Deming's point/Belief statements N Mean S.D.
5b. Schools should identify barriers Superintendent 35 1.46 .505 Board member 34 1.71 .462 Teacher 35 1.57 .502
5c. Schools work with educational institutions Superintendent 35 1.54 .657 Board member 34 1.79 .729 Teacher 35 1.46 .505
6. Institute modern methods of training Superintendent 35 1.95 .537 Board member 34 1.89 .455 Teacher 35 2.03 .415
6a. School employees cannot perform well Superintendent 35 1.66* .765 Board member 34 1.29 .524 Teacher 35 1.34 .482
6b. Schools must use statistical methods Superintendent 35 2.34 .725 Board member 33 2.45 .666 Teacher 35 2.51 .742
6c. Job training geared toward achievement Superintendent 35 1.86 .722 Board member 33 1.94 .966 Teacher 34 2.24 .781
7. Schools must adopt and institute leadership Superintendent 35 1.90 .533 Board member 34 2.17 .604 Teacher 35 2.09 .460
7a. Job of administrators is leadership Superintendent 35 1.80 .769 Board member 33 2.09 .932 Teacher 35 1.74 .497
7b. Aim of supervision Superintendent 35 1.91 .781 Board member 34 1.88 .729 Teacher 35 1.83 .618
7c. Evaluations need to be systematic Superintendent 35 1.97 .822 Board member 34 2.56 1.133 Teacher 34 2.71 .906
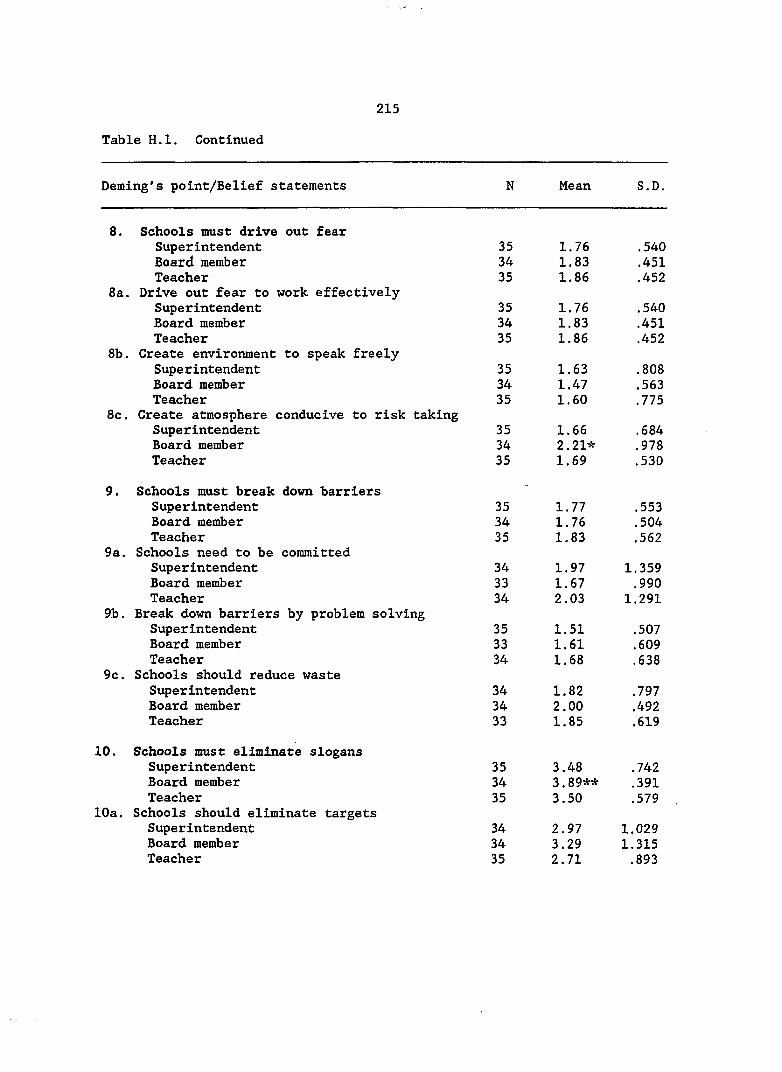
215
Table H.l. Continued
Demlng's point/Belief statements N Mean S.D.
8. Schools must drive out fear Superintendent 35 1.76 .540 Board member 34 1.83 .451 Teacher 35 1.86 .452
8a. Drive out fear to work effectively Superintendent 35 1.76 .540 Board member 34 1.83 .451 Teacher 35 1.86 .452
8b. Create environment to speak freely Superintendent 35 1.63 .808 Board member 34 1.47 .563 Teacher 35 1.60 .775
8c. Create atmosphere conducive to risk taking Superintendent 35 1.66 .684 Board member 34 2.21* .978 Teacher 35 1.69 .530
9. Schools must break down barriers Superintendent 35 1.77 .553 Board member 34 1.76 .504 Teacher 35 1.83 .562
9a. Schools need to be committed Superintendent 34 1.97 1.359 Board member 33 1.67 .990 Teacher 34 2.03 1.291
9b. Break down barriers by problem solving Superintendent 35 1.51 .507 Board member 33 1.61 .609 Teacher 34 1.68 .638
9c. Schools should reduce waste Superintendent 34 1.82 .797 Board member 34 2.00 .492 Teacher 33 1.85 .619
10. Schools must eliminate slogans Superintendent 35 3.48 .742 Board member 34 3.89** .391 Teacher 35 3.50 .579
10a. Schools should eliminate targets Superintendent 34 2.97 1.029 Board member 34 3.29 1.315 Teacher 35 2.71 .893
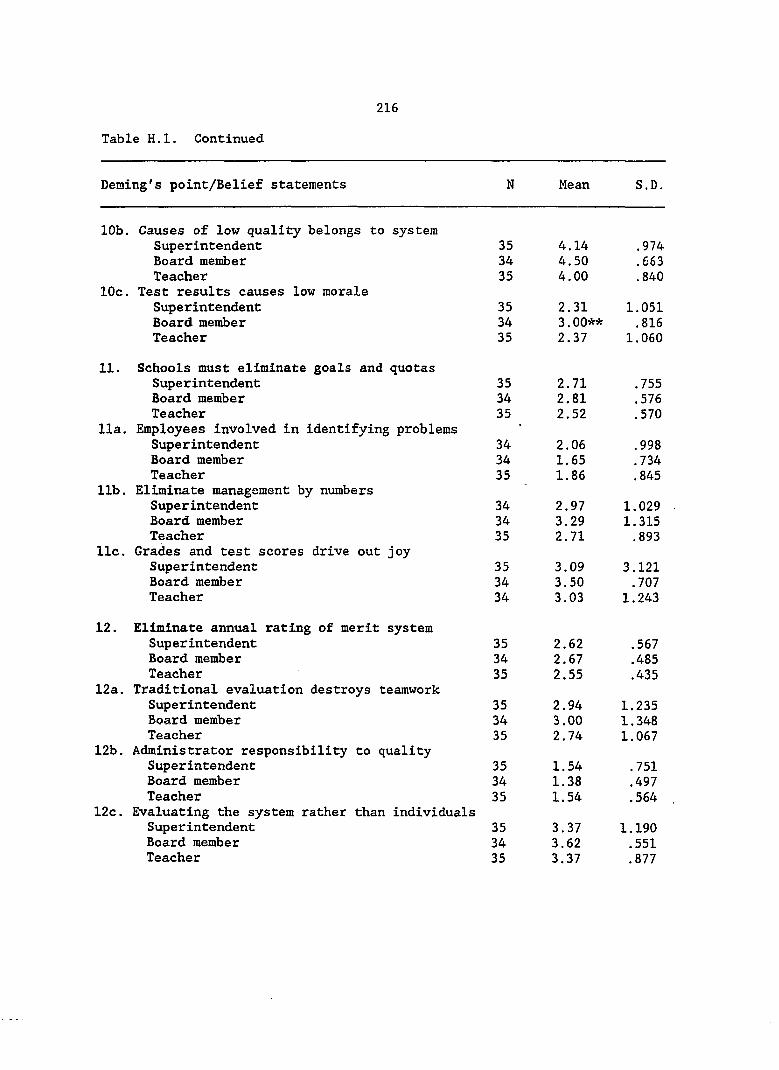
216
Table H.l. Continued
Deraing's point/Belief statements N Mean S.D.
10b, Causes of low quality belongs to system Superintendent 35 4.14 .974 Board member 34 4.50 .663 Teacher 35 4.00 .840
10c. Test results causes low morale Superintendent 35 2.31 1.051 Board member 34 3.00** .816 Teacher 35 2.37 1.060
11. Schools must eliminate goals and quotas Superintendent 35 2.71 .755 Board member 34 2.81 .576 Teacher 35 2.52 .570
11a. Employees involved in identifying problems Superintendent 34 2.06 .998 Board member 34 1.65 .734 Teacher 35 1.86 .845
lib. Eliminate management by numbers Superintendent 34 2.97 1.029 Board member 34 3.29 1.315 Teacher 35 2.71 .893
11c. Grades and test scores drive out joy Superintendent 35 3.09 3.121 Board member 34 3.50 .707 Teacher 34 3.03 1.243
12. Eliminate annual rating of merit system Superintendent 35 2.62 .567 Board member 34 2.67 .485 Teacher 35 2.55 .435
12a. Traditional evaluation destroys teamwork Superintendent 35 2.94 1.235 Board member 34 3.00 1.348 Teacher 35 2.74 1.067
12b. Administrator responsibility to quality Superintendent 35 1.54 .751 Board member 34 1.38 .497 Teacher 35 1.54 .564
12c. Evaluating the system rather than individuals Superintendent 35 3.37 1.190 Board member 34 3.62 .551 Teacher 35 3.37 .877
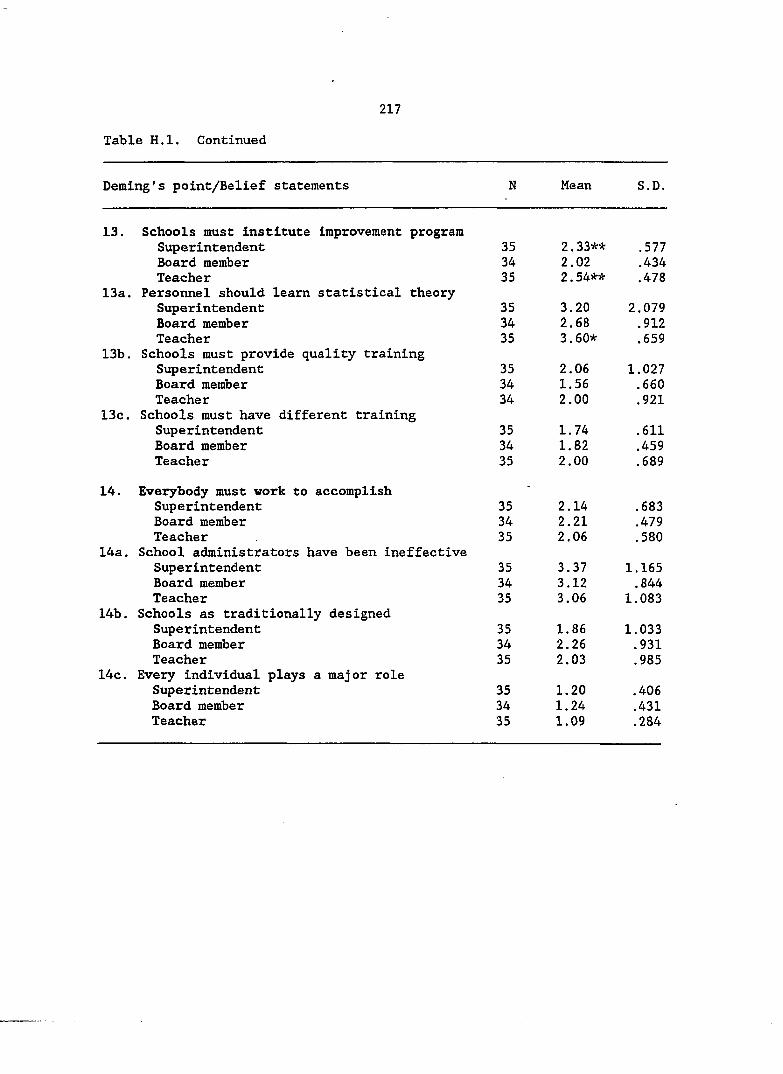
217
Table H.l. Continued
Deming's point/Belief statements N Mean S.D.
13. Schools must Institute improvement program Superintendent 35 2.33** .577 Board member 34 2.02 .434 Teacher 35 2.54** .478
13a. Personnel should learn statistical theory Superintendent 35 3.20 2.079 Board member 34 2.68 .912 Teacher 35 3.60* .659
13b. Schools must provide quality training Superintendent 35 2.06 1.027 Board member 34 1.56 .660 Teacher 34 2.00 .921
13c. Schools must have different training Superintendent 35 1.74 .611 Board member 34 1.82 .459 Teacher 35 2.00 .689
14. Everybody must work to accomplish -
Superintendent 35 2.14 .683 Board member 34 2.21 .479 Teacher 35 2.06 .580
14a. School administrators have been ineffective Superintendent 35 3.37 1.165 Board member 34 3.12 .844 Teacher 35 3.06 1.083
14b. Schools as traditionally designed Superintendent 35 1.86 1.033 Board member 34 2.26 .931 Teacher 35 2.03 .985
14c. Every individual plays a major role Superintendent 35 1.20 .406 Board member 34 1.24 .431 Teacher 35 1.09 .284