Qatar Air Quality Modelling QP / TOTAL Project - HARMO.org
32
Qatar Photochemical Modeling platform: A new tool to optimize air pollution control for the Oil and Gas industries Dr Ali H. Al-Mulla, Dr Azhari F. M. Ahmed, Diane Lecoeur HARMO Conference 1 st June 2010, Bois Colombes
-
Upload
khangminh22 -
Category
Documents
-
view
1 -
download
0
Transcript of Qatar Air Quality Modelling QP / TOTAL Project - HARMO.org
Qatar Photochemical Modeling
platform: A new tool to optimize air pollution control
for the Oil and Gas industries
Dr Ali H. Al-Mulla, Dr Azhari F. M. Ahmed, Diane Lecoeur
HARMO Conference
1st June 2010, Bois Colombes
22
Content of the presentation
Introduction
Fundamentals of Photochemical processes
Architecture of QAQM photochemical platform
Evaluation
Overview of results
Conclusions
33
Introduction
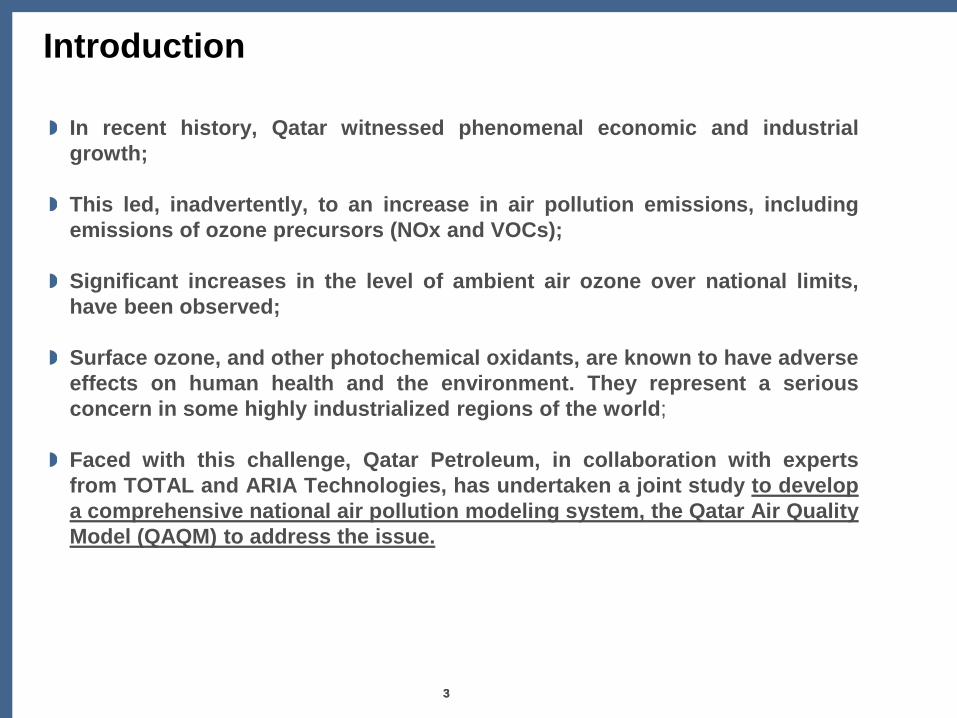
In recent history, Qatar witnessed phenomenal economic and industrial
growth;
This led, inadvertently, to an increase in air pollution emissions, including
emissions of ozone precursors (NOx and VOCs);
Significant increases in the level of ambient air ozone over national limits,
have been observed;
Surface ozone, and other photochemical oxidants, are known to have adverse
effects on human health and the environment. They represent a serious
concern in some highly industrialized regions of the world;
Faced with this challenge, Qatar Petroleum, in collaboration with experts
from TOTAL and ARIA Technologies, has undertaken a joint study to develop
a comprehensive national air pollution modeling system, the Qatar Air Quality
Model (QAQM) to address the issue.
4IPTC Conference - Doha – 08/12/2009
4QAQM – 23/03/2008
Fundamentals of Photochemical processes
4
55
Fundamentals of Photochemical process
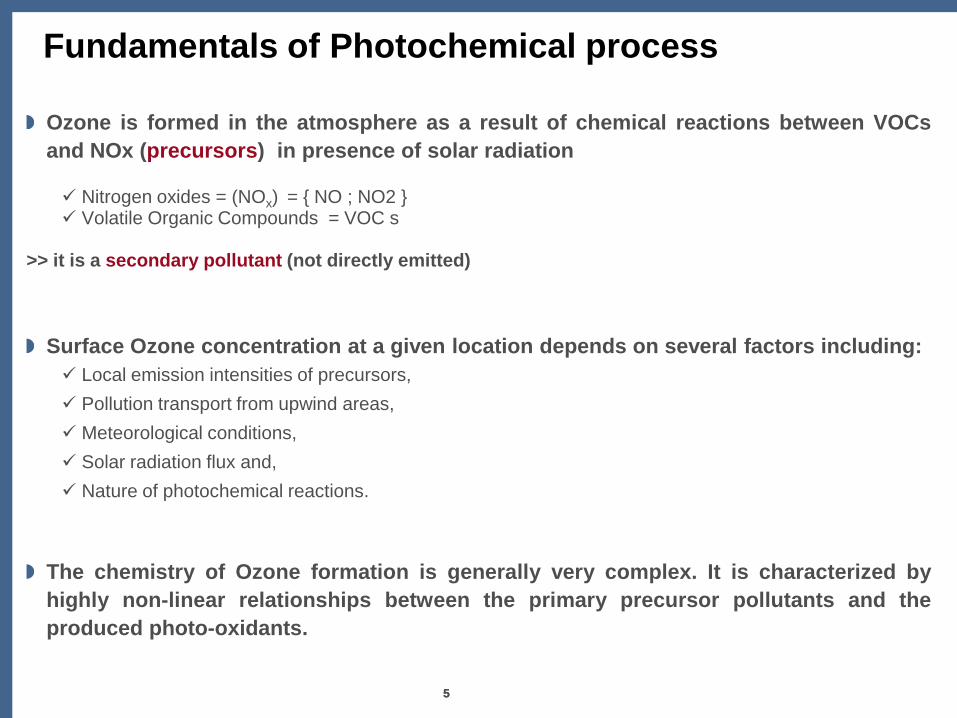
Ozone is formed in the atmosphere as a result of chemical reactions between VOCs
and NOx (precursors) in presence of solar radiation
Nitrogen oxides = (NOx) = { NO ; NO2 } Volatile Organic Compounds = VOC s
>> it is a secondary pollutant (not directly emitted)
Surface Ozone concentration at a given location depends on several factors including:
Local emission intensities of precursors,
Pollution transport from upwind areas,
Meteorological conditions,
Solar radiation flux and,
Nature of photochemical reactions.
The chemistry of Ozone formation is generally very complex. It is characterized by
highly non-linear relationships between the primary precursor pollutants and the
produced photo-oxidants.
7IPTC Conference - Doha – 08/12/2009
7QAQM – 23/03/2008
Architecture of QAQM photochemical platform
7
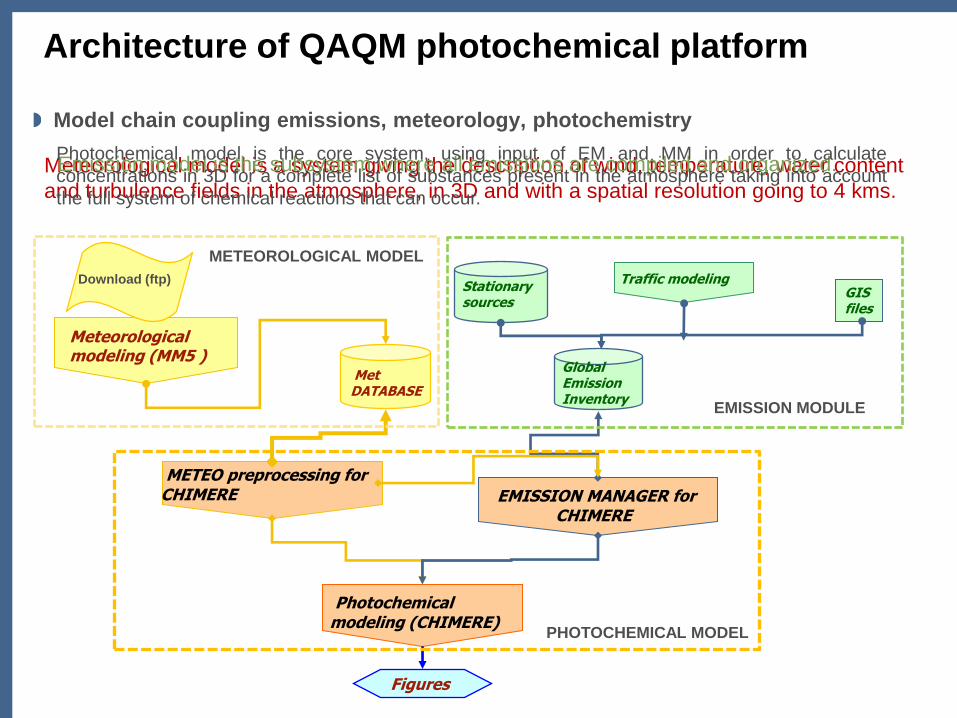
Architecture of QAQM photochemical platform
Model chain coupling emissions, meteorology, photochemistry
EMISSION MANAGER for CHIMERE
METEO preprocessing for CHIMERE
Photochemical modeling (CHIMERE)
Figures
PHOTOCHEMICAL MODEL
Met DATABASE
Meteorological modeling (MM5 )
Download (ftp)
METEOROLOGICAL MODEL
Global Emission Inventory
Stationary sources
GIS files
Traffic modeling
EMISSION MODULE
Meteorological model is a system giving the description of wind, temperature, water content
and turbulence fields in the atmosphere, in 3D and with a spatial resolution going to 4 kms.
Emission model is the subsystem where all emissions are compiled and organized.Photochemical model is the core system, using input of EM and MM in order to calculate
concentrations in 3D for a complete list of substances present in the atmosphere taking into account
the full system of chemical reactions that can occur.
9
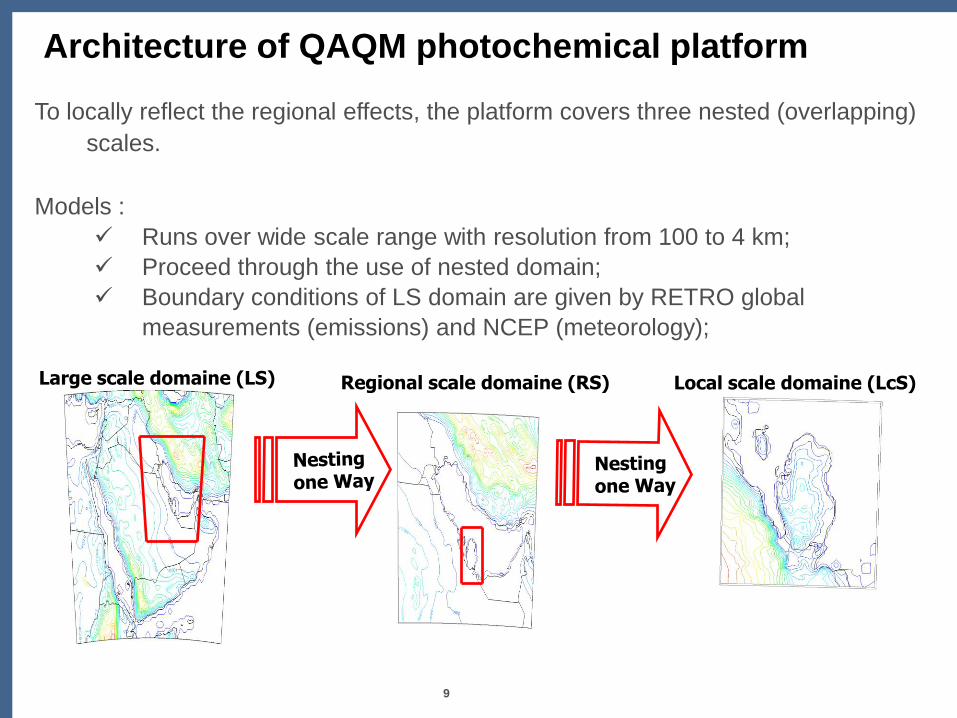
Architecture of QAQM photochemical platform
Large scale domaine (LS) Local scale domaine (LcS)Regional scale domaine (RS)
To locally reflect the regional effects, the platform covers three nested (overlapping)
scales.
Models :
Runs over wide scale range with resolution from 100 to 4 km;
Proceed through the use of nested domain;
Boundary conditions of LS domain are given by RETRO global
measurements (emissions) and NCEP (meteorology);
10
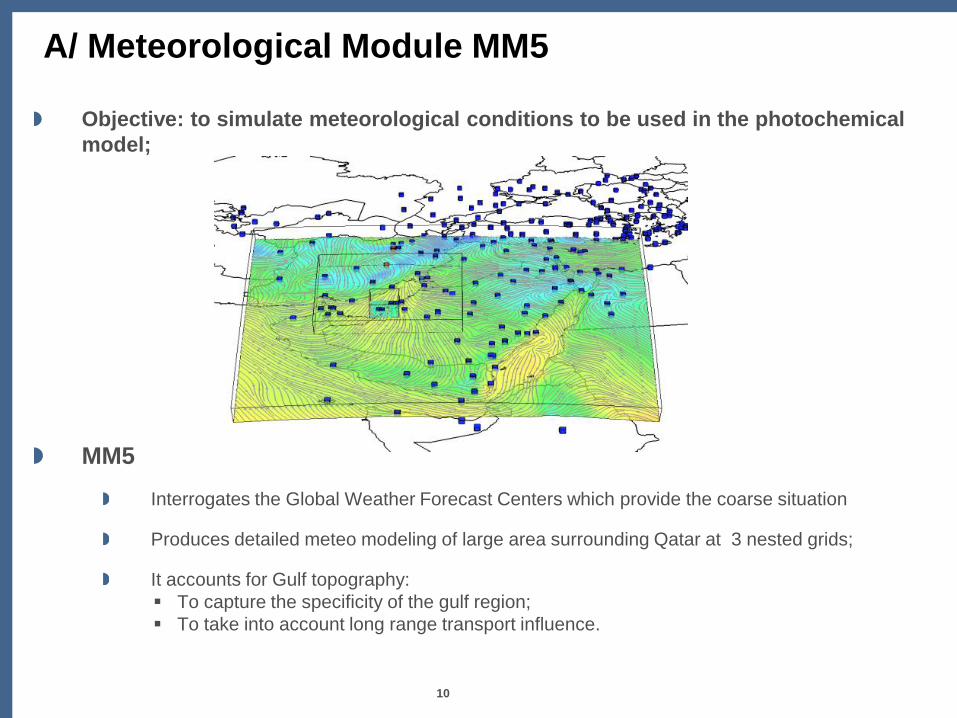
A/ Meteorological Module MM5
Objective: to simulate meteorological conditions to be used in the photochemical
model;
MM5
Interrogates the Global Weather Forecast Centers which provide the coarse situation
Produces detailed meteo modeling of large area surrounding Qatar at 3 nested grids;
It accounts for Gulf topography:
To capture the specificity of the gulf region;
To take into account long range transport influence.
11
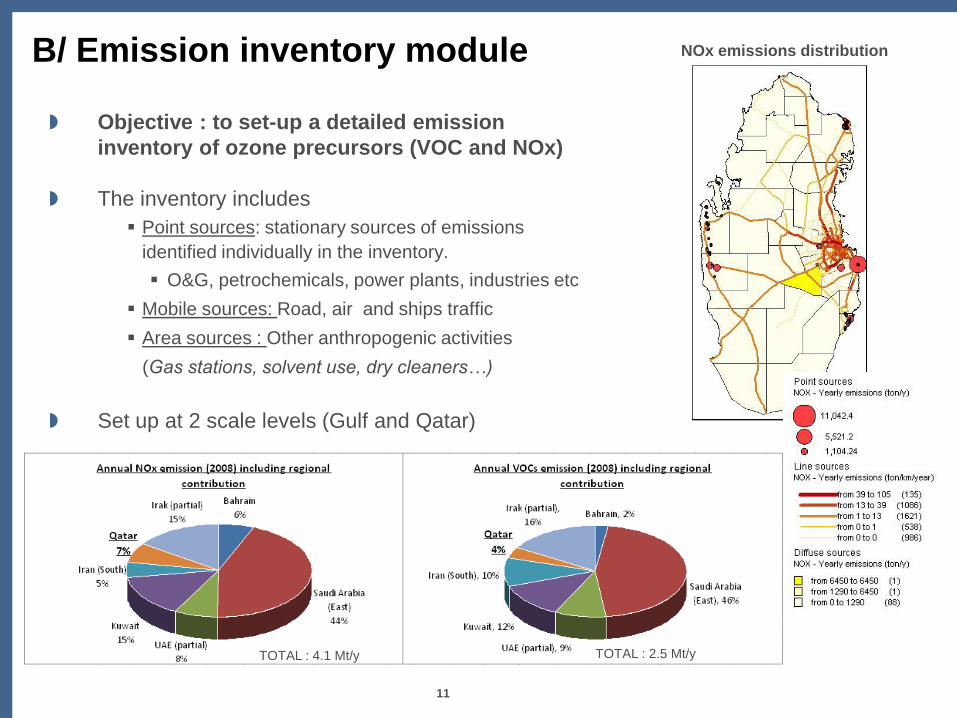
B/ Emission inventory module
Objective : to set-up a detailed emission
inventory of ozone precursors (VOC and NOx)
The inventory includes
Point sources: stationary sources of emissions
identified individually in the inventory.
O&G, petrochemicals, power plants, industries etc
Mobile sources: Road, air and ships traffic
Area sources : Other anthropogenic activities
(Gas stations, solvent use, dry cleaners…)
Set up at 2 scale levels (Gulf and Qatar)
NOx emissions distribution
TOTAL : 2.5 Mt/yTOTAL : 4.1 Mt/y
12
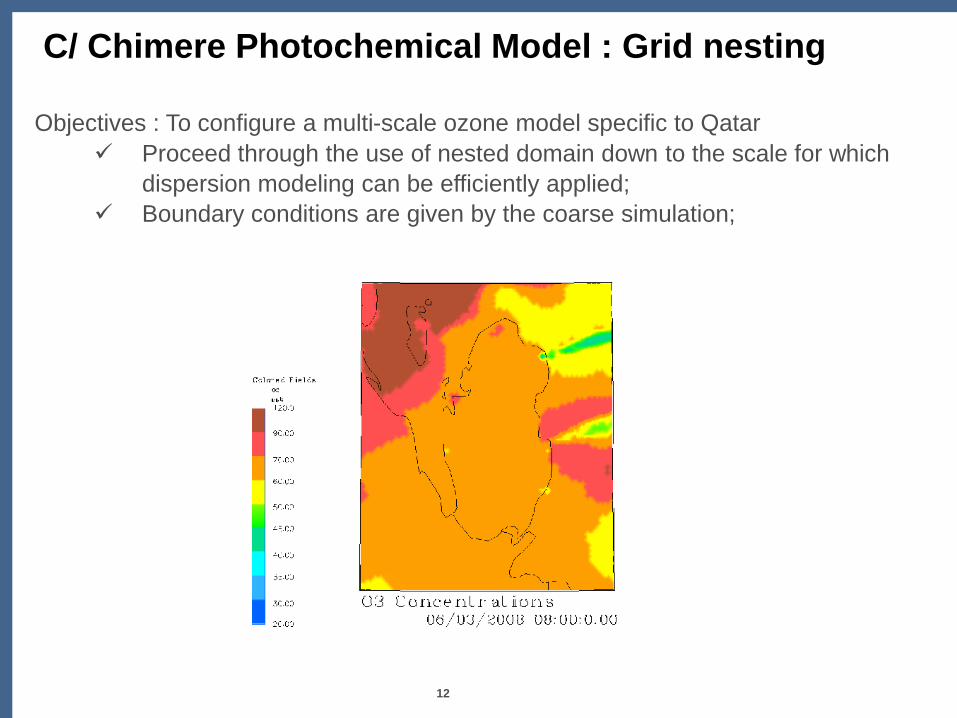
C/ Chimere Photochemical Model : Grid nesting
Objectives : To configure a multi-scale ozone model specific to Qatar
Proceed through the use of nested domain down to the scale for which
dispersion modeling can be efficiently applied;
Boundary conditions are given by the coarse simulation;
13IPTC Conference - Doha – 08/12/2009
13QAQM – 23/03/2008
Model evaluation
13
1414
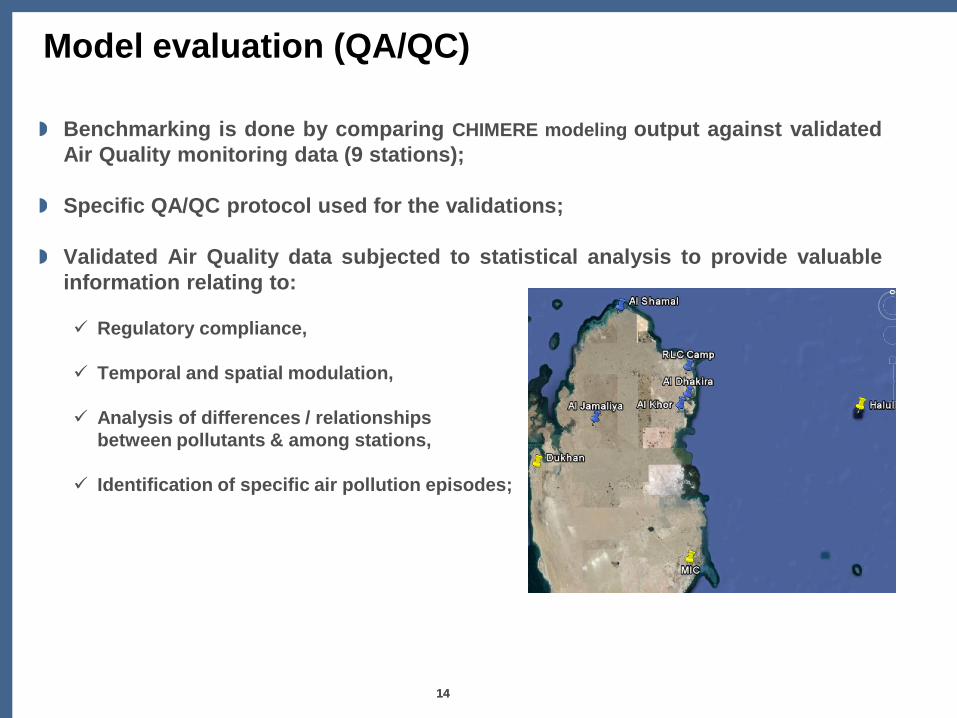
Model evaluation (QA/QC)
Benchmarking is done by comparing CHIMERE modeling output against validated
Air Quality monitoring data (9 stations);
Specific QA/QC protocol used for the validations;
Validated Air Quality data subjected to statistical analysis to provide valuable
information relating to:
Regulatory compliance,
Temporal and spatial modulation,
Analysis of differences / relationships
between pollutants & among stations,
Identification of specific air pollution episodes;
Model evaluation:meteorology
Based on 2008 data, the MM5 configuration has shown:
No visible numerical artifacts;
Good representation of temperature and wind fields over Qatar;
Good general agreement between observations and simulations for wind direction
at most stations (excluding systematic discrepancies due to equipment
malfunction);
Overestimation of wind speed during episodes of synoptic wind (wind from north-
west or east), which will be corrected by improved land-use definition;
The need of more suitable land-use application to improve the model performance.
The need for further assessment of the model vertical resolution to improve the
surface simulation.
18IPTC Conference - Doha – 08/12/2009
18
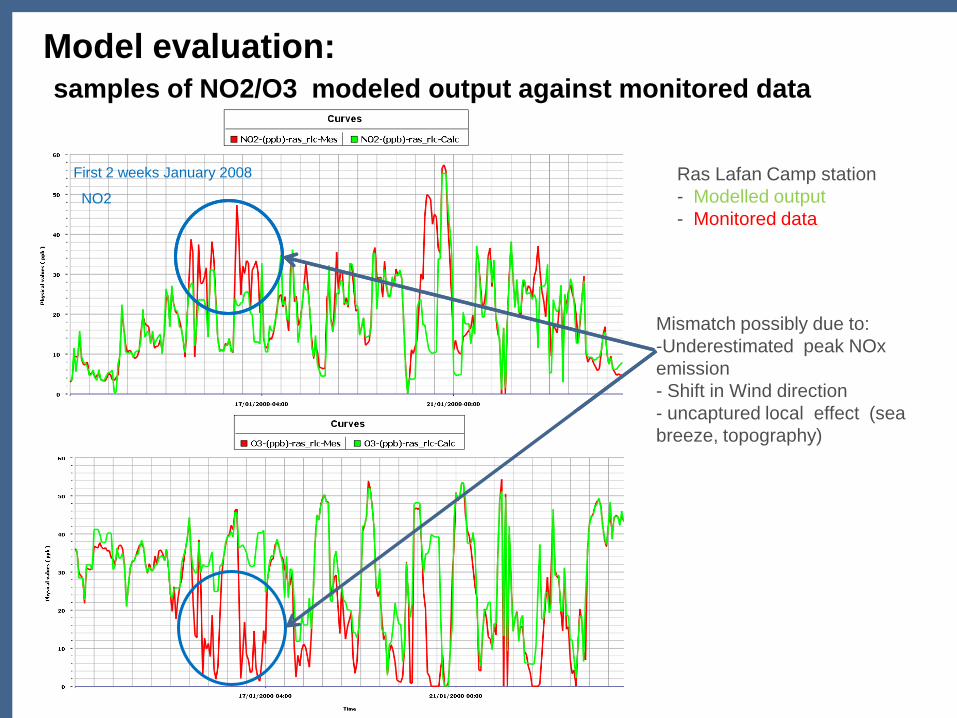
Model evaluation:samples of NO2/O3 modeled output against monitored data
Ras Lafan Camp station
- Modelled output
- Monitored data
First 2 weeks January 2008
First 2 weeks January 2008
NO2
Ozone
Environment 2009 Conference - 21/01/2009
Mismatch possibly due to:
-Underestimated peak NOx
emission
- Shift in Wind direction
- uncaptured local effect (sea
breeze, topography)
Model evaluation: Nox
For2008 data set , NOx concentrations are rather well simulated by the
model.
However model tends to slightly underestimate the concentrations. The
underlining causes for this may be due to the following:
Underestimation of NOx in the emission inventory e.g. Al Shammal;
Some episodic industrial events may be missed by the model;
The model overestimates wind speed during synoptic wind conditions and
subsequently underestimates NO2 concentrations especially in RLC-Camps and Al
Khor. This issue can be partly corrected by applying the new land-use.
Model configuration considers NOx emissions within 4*4km grid cells >> lead to
dilution of NOx in industrial areas like RLC (further investigation including
introduction of ‘’Plume in Grid’’ and additional nesting levels to improve horizontal
grid cell resolution from 4km up to 100 meters).
Model evaluation
Despite its inherent difficulty relative to NOx, Ozone simulations
indicate good representations particularly with regard to
diurnal variations
background levels.
However, the following constrains have been observed
in Al Shammal, the diurnal variation is not well reproduced by the model, as a result
of the AQS being located in a so called ‘’sea’’ grid cell
Underestimation of NOx leads to less ozone titration and subsequently higher
ozone simulations

Scenarios
21
Boundary conditions
22
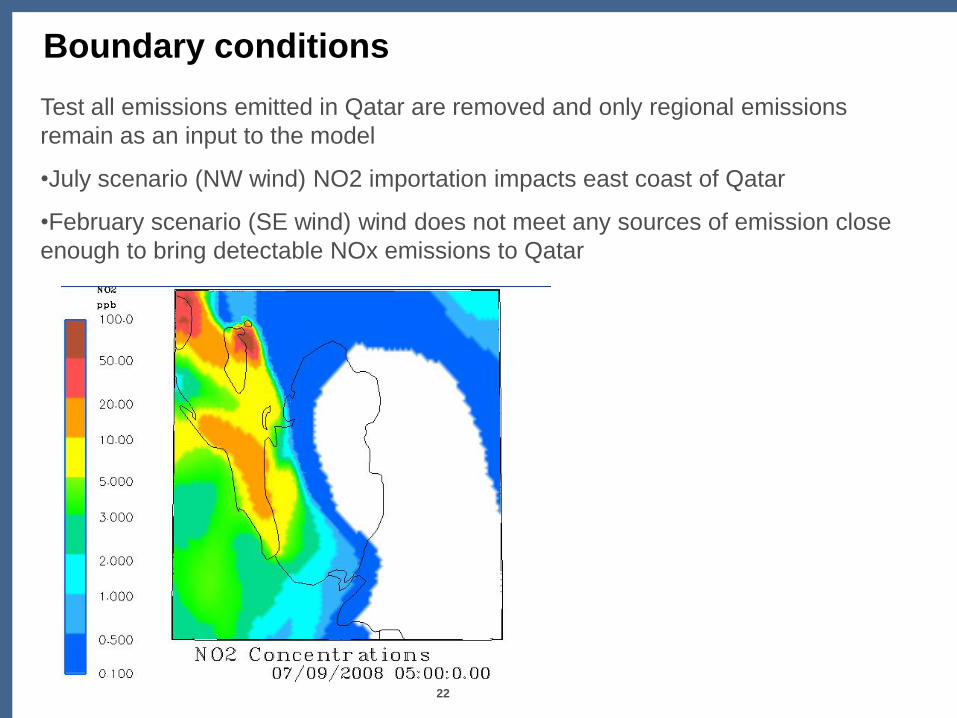
Test all emissions emitted in Qatar are removed and only regional emissions
remain as an input to the model
•July scenario (NW wind) NO2 importation impacts east coast of Qatar
•February scenario (SE wind) wind does not meet any sources of emission close
enough to bring detectable NOx emissions to Qatar
23
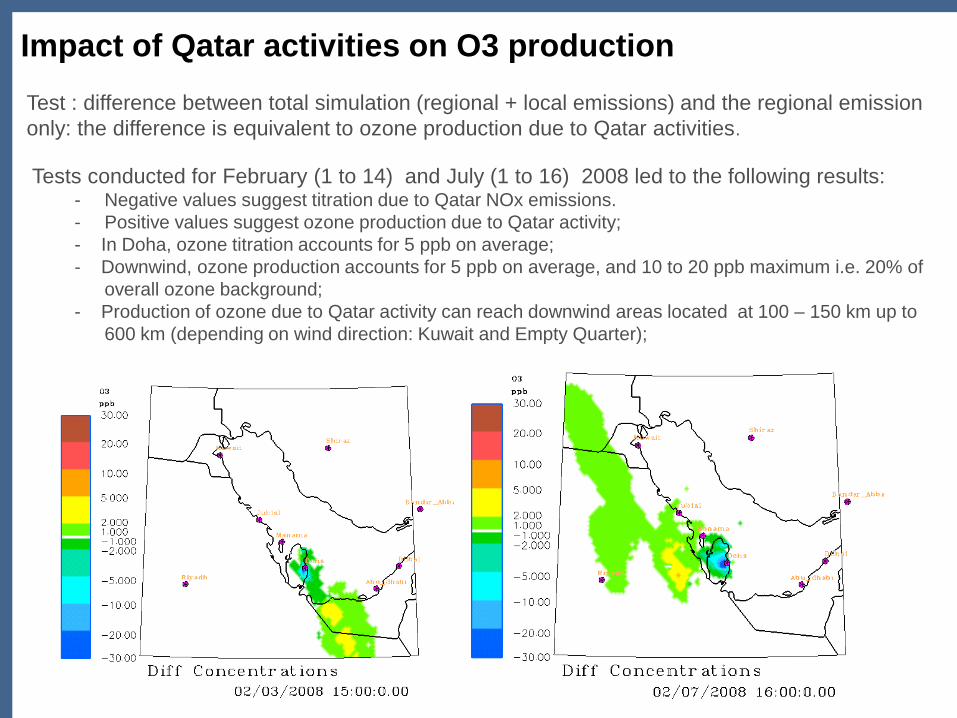
Impact of Qatar activities on O3 production
Test : difference between total simulation (regional + local emissions) and the regional emission
only: the difference is equivalent to ozone production due to Qatar activities.
Tests conducted for February (1 to 14) and July (1 to 16) 2008 led to the following results: - Negative values suggest titration due to Qatar NOx emissions.
- Positive values suggest ozone production due to Qatar activity;
- In Doha, ozone titration accounts for 5 ppb on average;
- Downwind, ozone production accounts for 5 ppb on average, and 10 to 20 ppb maximum i.e. 20% of
overall ozone background;
- Production of ozone due to Qatar activity can reach downwind areas located at 100 – 150 km up to
600 km (depending on wind direction: Kuwait and Empty Quarter);
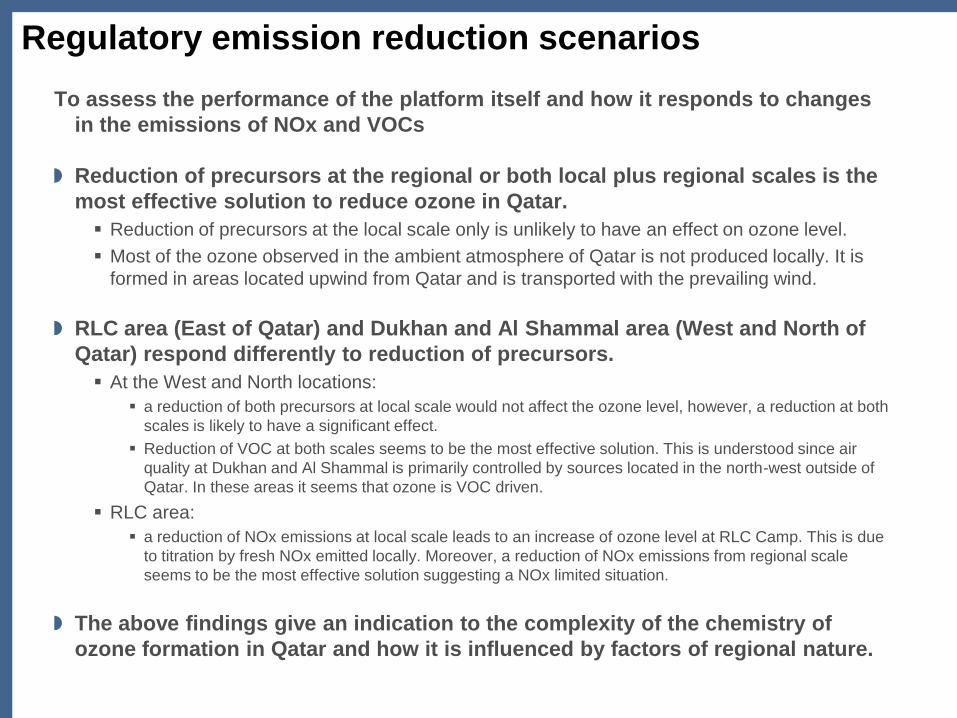
Regulatory emission reduction scenarios
To assess the performance of the platform itself and how it responds to changes
in the emissions of NOx and VOCs
Reduction of precursors at the regional or both local plus regional scales is the
most effective solution to reduce ozone in Qatar.
Reduction of precursors at the local scale only is unlikely to have an effect on ozone level.
Most of the ozone observed in the ambient atmosphere of Qatar is not produced locally. It is
formed in areas located upwind from Qatar and is transported with the prevailing wind.
RLC area (East of Qatar) and Dukhan and Al Shammal area (West and North of
Qatar) respond differently to reduction of precursors.
At the West and North locations:
a reduction of both precursors at local scale would not affect the ozone level, however, a reduction at both
scales is likely to have a significant effect.
Reduction of VOC at both scales seems to be the most effective solution. This is understood since air
quality at Dukhan and Al Shammal is primarily controlled by sources located in the north-west outside of
Qatar. In these areas it seems that ozone is VOC driven.
RLC area:
a reduction of NOx emissions at local scale leads to an increase of ozone level at RLC Camp. This is due
to titration by fresh NOx emitted locally. Moreover, a reduction of NOx emissions from regional scale
seems to be the most effective solution suggesting a NOx limited situation.
The above findings give an indication to the complexity of the chemistry of
ozone formation in Qatar and how it is influenced by factors of regional nature.

25IPTC Conference - Doha – 08/12/2009
25QAQM – 23/03/2008
Conclusions
25
2626
Conclusions
The QAQM Modeling system designed to investigate photochemical air pollutionat Qatar and regional scale, is now operational;
The way the QAQM platform is currently configured, allows the study of impact scenarios (emission reduction policies, industrial economic development) and retrospective investigation of specific ozone pollution events.
The major local and regional sources responsible for ozone formation in Qatarare more or less well understood.
Validation of modeled outputs against observations collected from variousmonitoring stations produced significant results and conclusions.
Identified improvement: land-use, additional nesting, better vertical resolutionremains to be introduced
Depending on the prevalent wind, Qatar ozone production can be transportedalong the Gulf from 100 to 600 km;
Photochemical system in Qatar is mostly VOCs driven`
Regional collaboration and convention is critical to address this issue.
2727
Utilization
Results from this study will streamline the strategy for pollution control
and contribute to protection of human health and sustainable
development.
The platform is a tool to assess
the long-term impact, on air quality, of various economic / industrial scenarios for Qatar
the cost-benefits of the national regulatory limits and determine the most optimum
strategy to roll down surface ozone levels;
Acquire critical information for QP top management / State to take best
decisions (in line with Sustainable Development principles) on
industrial and economic development;
Prospective further work, in this regard, may address future economic
development pathways and possible environmental regulatory policies.
Develop the ozone modeling platform as a forecast tool for a long term
objective.

28IPTC Conference - Doha – 08/12/2009
28QAQM – 23/03/2008
Thank you for your attention
28
29IPTC Conference - Doha – 08/12/2009
29QAQM – 23/03/2008
Annexes
29
30IPTC Conference - Doha – 08/12/2009
30QAQM – 23/03/2008
Model evaluation (QA/QC step)
30
31IPTC Conference - Doha – 08/12/2009
31
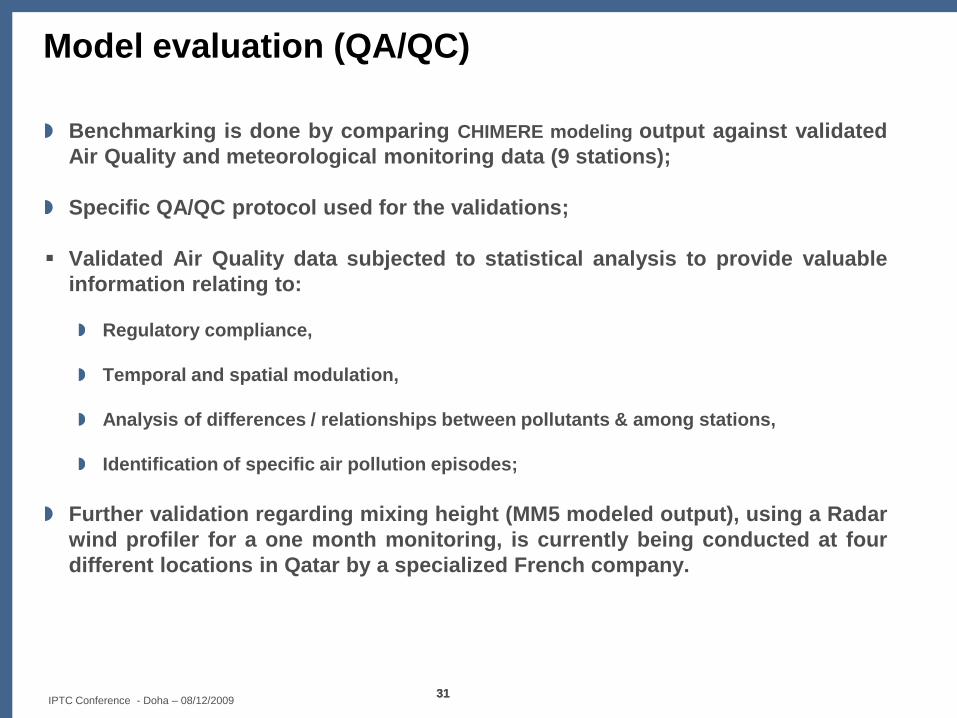
Model evaluation (QA/QC)
Benchmarking is done by comparing CHIMERE modeling output against validated
Air Quality and meteorological monitoring data (9 stations);
Specific QA/QC protocol used for the validations;
Validated Air Quality data subjected to statistical analysis to provide valuable
information relating to:
Regulatory compliance,
Temporal and spatial modulation,
Analysis of differences / relationships between pollutants & among stations,
Identification of specific air pollution episodes;
Further validation regarding mixing height (MM5 modeled output), using a Radar
wind profiler for a one month monitoring, is currently being conducted at four
different locations in Qatar by a specialized French company.
40IPTC Conference - Doha – 08/12/2009
40QAQM – 23/03/2008
Ozone effects on human health and
ecosystem
40
41IPTC Conference - Doha – 08/12/2009
41
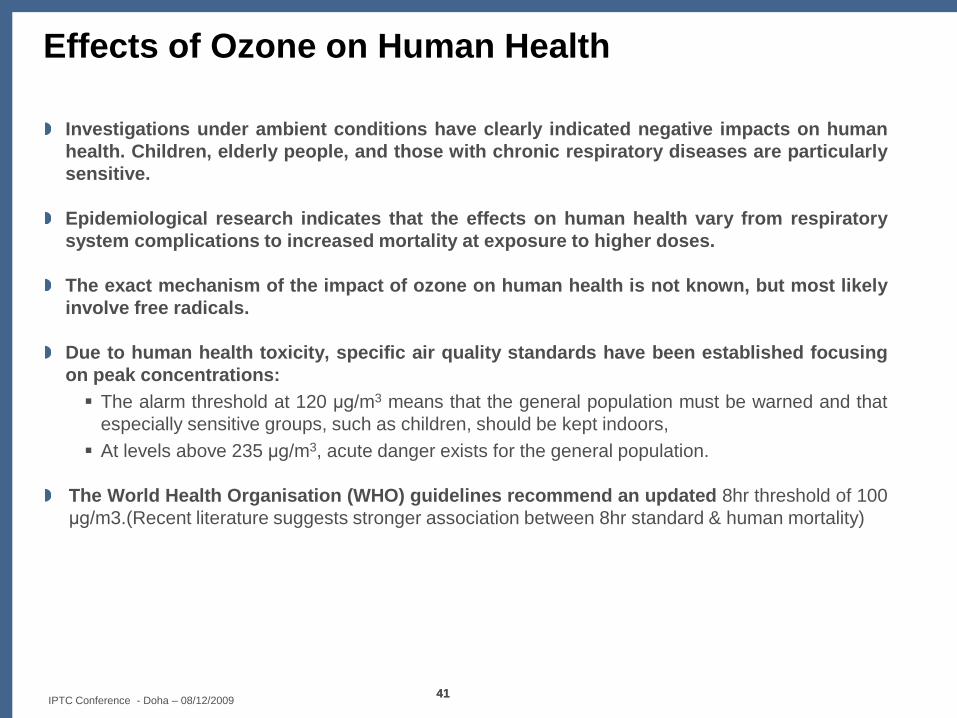
Effects of Ozone on Human Health
Investigations under ambient conditions have clearly indicated negative impacts on human
health. Children, elderly people, and those with chronic respiratory diseases are particularly
sensitive.
Epidemiological research indicates that the effects on human health vary from respiratory
system complications to increased mortality at exposure to higher doses.
The exact mechanism of the impact of ozone on human health is not known, but most likely
involve free radicals.
Due to human health toxicity, specific air quality standards have been established focusing
on peak concentrations:
The alarm threshold at 120 μg/m3 means that the general population must be warned and that
especially sensitive groups, such as children, should be kept indoors,
At levels above 235 μg/m3, acute danger exists for the general population.
The World Health Organisation (WHO) guidelines recommend an updated 8hr threshold of 100
μg/m3.(Recent literature suggests stronger association between 8hr standard & human mortality)

42IPTC Conference - Doha – 08/12/2009
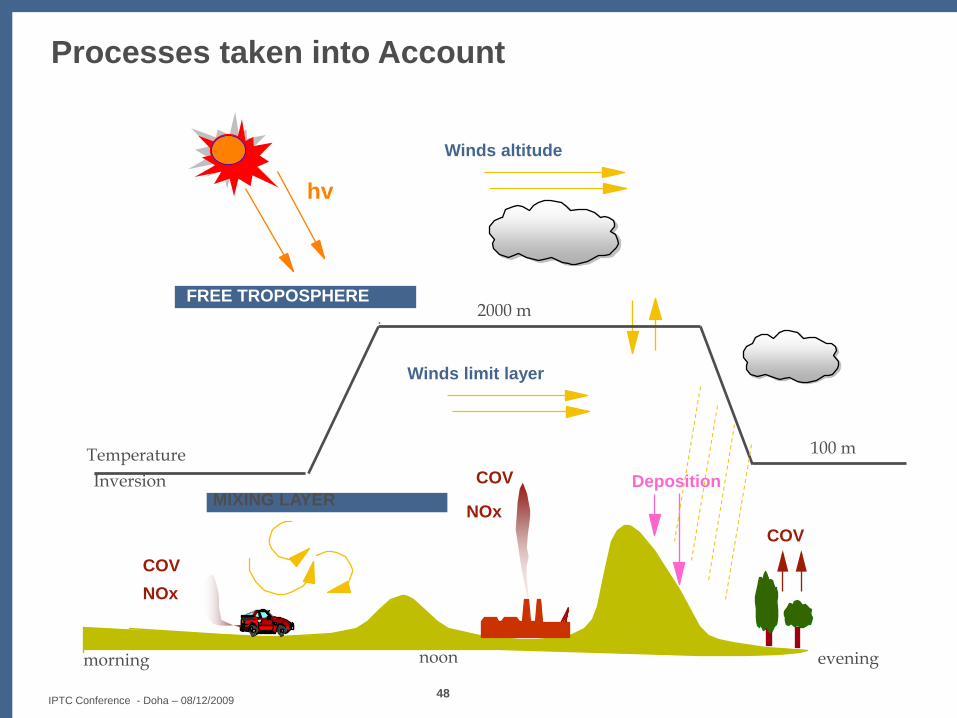
48IPTC Conference - Doha – 08/12/2009
eveningnoonmorning
COV
NOx
COV
NOx
COV
Deposition
Winds limit layer
FREE TROPOSPHERE
100 mTemperature
2000 m
Winds altitude
MIXING LAYER
hv
Inversion
Processes taken into Account