Experimental research on the relation between food price ...
Upload
khangminh22Category
view
6download
0
sustainability
Article
The Relation between Environmental ManagementSystems and Environmental and FinancialPerformance in Emerging Economies
Cosmina L. Voinea * , Bas-Jan Hoogenberg, Cosmin Fratostiteanu and Hammad Bin Azam Hashmi
Faculty of Management, Open University of the Netherlands, 6419 AT Heerlen, The Netherlands;[email protected] (B.-J.H.); [email protected] (C.F.);[email protected] (H.B.A.H.)* Correspondence: [email protected]
Received: 13 May 2020; Accepted: 2 June 2020; Published: 1 July 2020�����������������
Abstract: This study pursues to clarify the effect of environmental management systems (EMS)comprehensiveness on environmental performance and financial performance using an extensivequantitative dataset obtained in Brazil over an eight-year period. It is recognized that theimplementation of environmental management differs per company varying in how manyenvironmental practices are adopted and hence how comprehensive the EMS is. The relationshipbetween EMS comprehensiveness, environmental performance, and financial performance proves to becomplex. First of all, the overall negative effect of environmental performance on financial performancemay indicate that the resources needed to realize an improved environmental performance do notoutweigh the cost reductions resulting from eco-efficiency or improved reputation. The effect of EMScomprehensiveness on financial performance is in line with that, indicating that an above averageEMS comprehensiveness results in lower financial performance, which may correspond to highenvironmental management- and overhead costs. Across sectors, the companies operating in sectorindustries have high quality EMS comprehensiveness, while the companies in agriculture, commerce,and services exhibit a lower EMS.
Keywords: environmental management systems; environmental performance; financial performance;emerging economies; Brasil
1. Introduction
The advanced industrialisation of society has resulted in a large metamorphosis of the emergingeconomies. Though living standards may have increased, another effect is without a doubt a strongimpact on the environment. Greenhouse gas emissions, the use of natural resources, and the disposalof waste and toxic substances are all thought to have a strong effect on climate change. In addition,a growing population and expectations for further improvements in welfare may result in an evenhigher demand for the world’s resources. A growing awareness of this unsustainable state ofexponential growth and excessive consumption of resources led to a more conscious policy regardingthe environmental footprint. The resulting effect is stronger focus on the environment and sustainableresource usage, by governments, citizens, and industry [1].
Growing concerns over this influence on the environment have led to increased awareness onthe effect of companies and industry on the environment. Pressures, originating from for instancecustomers, governments, NGOs, or the industry, lead to a focus within companies on environmentalperformance. Since much of the resource consumption is related to goods and services that needto be manufactured, used, maintained and disposed of, one of the logical political focus areas on
Sustainability 2020, 12, 5309; doi:10.3390/su12135309 www.mdpi.com/journal/sustainability

Sustainability 2020, 12, 5309 2 of 21
reducing environmental impact is therefore on companies. Here, the focus is both on reducing theconstant resource usage as well as preventing accidents that can have an incidental yet excessiveenvironmental impact.
One policy instrument to affect environmental performance is by defining rules and regulations.Such a hierarchical approach aims at setting broad and minimal requirements, thereby forcingcompanies under that jurisdiction to comply with those ‘hard’ rules. In sharp contrast with suchapproaches, new environmental policy instruments focus more on defining procedures that are required.This follows a broader approach on regulating and similar strategies that have been implementedin for instance safety regulation in other industries. Such ‘soft’ policy instruments largely rely onvoluntary implementation and action, learning processes, and procedural change instead of directcontrol exerted by a regulatory body. This allows companies to be flexible in their implementationand execution of such procedures, which is thought to result in a more dynamic, effective, and lessresource-intensive way to improve environmental performance. However, critics doubt the superiorityof such policy instruments over ‘old-fashioned’ rule-setting and claim the actual environmentalimprovement may be less than expected. The effect of such systems is not as directly observable due tothe voluntary nature [2].
Environmental Management Systems (EMS) are the most evident implementation of such‘soft’ instruments. The International Standardization Organization (ISO) has created ISO 14001 asa framework and guideline to implement an EMS. As of 2014, more than 300,000 companies haveimplemented the standard [3]; almost doubling the number of companies compared to 2006 [4]. EMS arecommon procedural tools to monitor, measure, plan, and make choices regarding environmentalperformance. Rather than having a direct effect on environmental performance, the effects of suchprocedures are thought to be indirect. In the first place, it should aid in altering the institutionalizedperception that pollution is a logical resultant from (profitable) economic activity. In effect, the realizationthat environmentally beneficial actions do not necessarily result in excessive costs and thereby promotingsuch actions [2]. However, how many of such environmentally beneficial actions are required or howto balance environmental costs with financial costs is unknown. Though the ISO-regulations describea systematic approach to managing the impact on the environment, environmental targets remainundefined and environmental reporting is not required.
As described above, there is thus doubt about the actual effect of an EMS on the environmentalperformance. There are two important aspects that hinder agreement on this topic. In the firstplace; no EMS is the same. The voluntary and flexible nature results in company-specific procedureimplementations. For instance, responsibilities may lie in different departments, procedures mayfocus on different topics (i.e., water usage reduction, communication of environmental performance,life-cycle management) or there could be different procedures for (self) auditing. In summary;the comprehensiveness of the EMS varies between companies.
Secondly, quantitative and uniform methods for the assessment of a firm’s environmentalperformance do not exist or are not agreed upon [5,6]. Due to differences in policies or focus point,companies may report different performance indicators. Other companies may not report at all.The result is that studies range from quantitative measurements of environmental performance [7]to qualitative studies where an interviewee is asked about their perception of the environmentalperformance [8,9].
Previous research on the effect of the EMS on environmental performance has yielded conclusionsranging from no significant effect to a positive influence of the EMS on the environmentalperformance [3,4]. The inconclusive results on this relation present an opportunity for further research.
Often, environmental performance is claimed to hinder financial performance. In the first place, thecosts and resources involved with implementing the ISO 14001 are an often cited drawback [3], let alonethe perceived costs of environmental good-doing [2]. However, some companies have managedto align environmental- with financial performance and realize both targets simultaneously [8].Studies have found a positive relation between EMS and financial performance [10] (or disprove a

Sustainability 2020, 12, 5309 3 of 21
negative relation [11] as well as correlations between environmental- and financial performance [12].The minor disagreement seems present on the effect on financial performance, yet it is not uniformwhether the EMS or environmental performance is an indicator of increased financial performance.
Though EMS has been implemented by a large variety of firms and organizations, research haspursued to identify determinants of its implementation. More specifically, certain determinants mayresult in a more comprehensive EMS that has for instance strong institutionalized procedures forresponsibilities, training, and audits. One determinant may be company size [8,13]. The costs involvedwith implementation are a significant drawback [3] and may be easier to cover for larger companies.Also, economies of scale may play a role, where larger companies may be in a better position to reap thebenefits of the improved performance compared to a smaller company [14]. On the other hand, theremay be a relation between the degree of globalization and the EMS comprehensiveness as multinationalcorporations (MNCs) operate in multiple legal and social areas and have to design their environmentalpractices accordingly so that they can meet all the required regulations [15,16]. Therefore, a globalapproach to the EMS would result in procedures that need to address the most stringent combinationof national requirements on environmental practice [16]. Keeping these determinants in mind, theobjective is to investigate the relationship between the comprehensiveness of the environmentalmanagement systems, the environmental performance, and the financial performance of MNCs inemerging economies.
There is strong disagreement and contradictory arguments about the relations between EMS,environmental performance and financial performance, even though a large number of research paperson these topics can be found [17].
Furthermore, existing literature provides confusing and opposing evidence regardingenvironmental management systems determinants for MNCs. Some studies claim that company sizeis the most determinant of the quality of environmental management systems [8] other studies arguefor the degree of globalization as most relevant for environmental management systems [16].
Policymakers should valorise the outcome of our study to add to the debate around the MNCsrelocating activities to countries with less strict environmental requirements [15]. Considering sucheffects, the political discussion on the balance between (international) competitiveness of acountry’s economy (financial performance) and reducing the environmental footprint of that country(environmental performance) may be more in favour of stricter regulations if those indeed go handin hand [18].
Furthermore, with globalization as a key indicator for EMS comprehensiveness, this providestools for national or regional policy makers to influence the environmental performance across theborder with more global effectiveness. However, if a firm’s size is a key indicator this may steerpolicymakers towards size-dependent policies. Here, there may be a focus on exploiting economies ofscale for the larger companies, while not hindering new entrants with too high entry barriers [14].
Managers or consultants in the industry can use the research outcome to design the company’sEMS. Certain EMS characteristics may aid in promoting improved environmental performance and/orfinancial performance. With such characteristics in mind, the cost of implementing the EMS may havean increased ROI, be it through financial or environmental gain mechanisms. If the outcome is that thedetermining EMS aspects are the same for both financial- and environmental performance, the ROIincrease is even stronger. Such an outcome should provide firms with the confidence to adopt EMSand reap the financial benefits while reducing their environmental footprint.
Further, the study is structured as follows. First, previous literature on the EMS is elaboratedalong with predictors and outcomes of EMS to identify the research gap. Second, the methodology isdefined which covers delineation of the research context, operationalization of variables, study sample,and data collection. Third, results are reported which include descriptive findings and hypothesestesting mainly. Forth, discussion of the main findings is done. Lastly, the study is concluded withanswers to main research questions, literature reflection, and future research directions.

Sustainability 2020, 12, 5309 4 of 21
2. Literature Overview
2.1. Environmental Management Systems
The Environmental Management System (EMS) is ‘the portion of the overall management systemwhich includes organizational structure, planning activities, responsibilities, practices, procedures,processes and resources for implementing, achieving, reviewing, and maintaining the environmentalpolicy’. It thus denotes a rather broad range of disciplines and activities intending to have a policy onthe environment [19] with this definition, the goal of the EMS is to provide the characteristics of themanagement system to address those aspects effectively. Here, effectively refers to both an efficientimplementation, and, to aid in realizing environmental performance [4,20]. Many large multinationalshave now certified their EMS under the ISO 14001 [20] and the number of certifications has doubledfrom 2006 to 2014 [3,4].
A core aspect of the EMS as described in the ISO is the ‘plan-do-check-act’-cycle (PDCA) as atool to systematically address and actively manage environmental issues. The EMS should addressall those steps in the cycle and should thus provide the required procedures, responsibilities, andresources to go from a recognition of the problem to controlling and monitoring it [21].
It is important to stress that the implementation of an EMS (or ISO 14001 certification) doesnot ensure that a firm is compliant with the minimal legal environmental requirements or that it iscontinuously improving the environmental performance [20]. Some critics go as far as labelling anEMS implementation as a superficial tool to improve stakeholder perception without an attempt toimprove environmental efficiency [22].
The perceived effect of an EMS has not been extensively studied, yet commonly reported effects are;improvement of stakeholder relationships, such as a greener customer perception [3,23] or preventingthe introduction of stricter regulations [24], and an improvement of performance, be it financial and/orenvironmental [25].
In addition, the ISO 14001 for an EMS, the 14000 series contains more standards on environmentalmanagement. The standards in addition to 14001 can be seen as supporting standards that focus onmore specific topics of environmental management (“ISO 14000 family - environmental management,”n.d.). ISO are meant to help the organization to organize proper management, Eco-Managementand Audit Scheme (EMAS) Regulation (Reg 761/01 EC) is EU scheme implemented by the EuropeanCommission and it is for the implementation of an Environmental Management System (EMS) byany organization.
The EMS can be regarded as an incentive-based policy instrument [20,26], the opposite ofcommand-and-control where strict qualitative and quantitative limits on emissions are imposed [27].EMS includes: Environmental auditing; Evaluation of environmental performance; Environmentallabelling; Analysis of lifecycle of product and service; Environmental communication.
The instruments are voluntary in nature and based on learning processes and proceduralchange. Such instruments have gained popularity whereas previous hierarchical instruments werethought not to provide dynamic incentives to improve environmental performance [28]. Also, suchflexible instruments would be more cost-effective, partly due to the self-regulatory nature rather thanenforcement by public authorities [2]. It has been observed that such incentive-based instruments(i.e., with fewer ‘hard’ demands) have a higher participation rate [29]. This can be credited to the actualbehaviour of employees and managers in a firm which is not so much steered by facts and rules, butby their (subjective) perception of facts and rules. The resulting effect is ignorance about the statusquo due to an institutionalized perception of a negative relation between environmental good-doingand economic gains [2]. Such ‘framing’ obviously reduces the will to change to environmentallybeneficial practices.
The procedural goal in the EMS is to reduce the subjective component in the interpretation, byproviding learning and a structural approach to sense making [2]. Here, one must assume that thebehaviour of the firm is a resultant of the behaviour of all, or some key, employees. Following the theory

Sustainability 2020, 12, 5309 5 of 21
of planned behaviour, the behaviour results from intention. The stronger the intention, the higher theeffort, and the more likely that you engage in the intended behaviour. Intention results from attitudes,subjective norms, and perceived behavioural control [30]. Learning and insight can affect the beliefsthat form the attitude. The presence of an EMS and recurring managerial attention to the environmentcould alter how employees believe their environmental behaviour is judged by others and thus affecttheir subjective norms. The procedures in the EMS should provide the tools to alter the behaviour andthus affect an employee’s perceived possibility to control environmental performance.
2.2. EMS Comprehensiveness
It has been observed that the realisation of environmental management is done differentlyby companies. A commonly used instrument to differentiate between how actively companiesfocus on environmental management is by looking at comprehensiveness (meaning completeness orall-inclusiveness [19] Definitions used include for example:
Arimura, Hibiki and Katayame [27] used “Comprehensiveness was measured as the numberof environmental practices adopted by the facility, implementation of a certified EMS, specificallyISO 14001, and publication of environmental reports”.
Darnall [19] argue that “facilities that implement more of these environmental practices as part oftheir EMS may be regarded as having a more comprehensive EMS than facilities with fewer of theseenvironmental practices”.
Phan and Baird [9] operationalized EMS comprehensiveness “with respect to the intensity of useof nine environmental practices identified as important components of an EMS”.
Thus, the environmental intensity of a company is often measured by EMS comprehensiveness,which is operationalized by looking at the number of and/or frequency of environmental practices thata company employs. These include the abovementioned ISO 14000 series standards, for example forenvironmental management, environmental reporting, or product life-cycle management [28].
2.3. Determinants of EMS Comprehensiveness
The comprehensiveness of a firm’s EMS may be affected by the characteristics of the firm.The implementation of an EMS is perceived as a complex undertaking that requires the right expertiseand sufficient resources [8]. It can, therefore, be argued that the resources the firm can dedicate to theimplementation and the know-how, either through experience or acquired, can be of influence to theenvironmental management performance. Multiple determinants may be of influence and will bediscussed hereafter.
2.3.1. Firm Resources
Tangible resourcesIt has been found that improved environmental performance is associated with larger and
innovative factories where quality- and manufacturing improvement are actively managed. On average,the individual sites had more than 250 employees, had more staff dedicated to environmental practices,and are likely to be part of a larger company [8,13]. Larger companies are more likely to have the slackresources required to address environmental management [16,31]. Here, economies of scale thus playa role and large enterprises may be in a better position to reap the economic benefits of an improvedenvironmental performance than smaller entities [14].
In addition to economic arguments about why larger companies may implement more completeand comprehensive EMS, their size also increases visibility. Size becomes a liability, where largercompanies are expected to do more on environment management [16].
In quantity, many more small- (<50) and medium (<249) enterprises exist, but only a few haveimplemented a (formal) EMS. Estimates indicate that those SMEs could contribute to as much as 70%of all pollution. In addition to insufficient (human-) resources to successfully implement and executean EMS, unsupportive company culture towards environmental performance, scepticism towards

Sustainability 2020, 12, 5309 6 of 21
benefits of an EMS, and absence of customer pressure has resulted in a minimal implementation rateat SMEs [32].
Hypothesis 1a (H1a). Firm size positively relates to the comprehensiveness of the EMS, thus the larger thefirm the more comprehensive its EMS.
Intangible resources:Time devoted to having a (formal) EMS may result in a more comprehensive EMS as the firm gains
more experience with environmental management. Over time such management systems may growand a maturated EMS can allow the firm to make proper use of the tools. However, it has been foundthat the age of (and experience with) the EMS has a minor effect on performance, though it may affectthe EMS comprehensiveness. A possible explanation for this is that over-time all easy environmentalimprovements have already been implemented (the ‘low-hanging fruit’) and the further performanceimprovements are of a more difficult and resource intensive nature [33]. Therefore:
Hypothesis 1b (H1b). Firm experience is positively related to the EMS comprehensiveness and therefore olderfirms have a higher environmental management performance.
Hypothesis 1c (H1c). EMS age is positively related to the EMS comprehensiveness and thus firms who haveimplemented an EMS for a longer period already have a higher environmental management performance.
2.3.2. Globalization
Multiple sources state a relation between the level of globalization and the environmentalperformance of MNCs. More specifically, as suggested by Sharfman et al., (1) the greater the degree ofglobalization, (2) the more diversification across industries, (3) the more diversification across countries,(4) the more centralized the firm and (5) the more standardized the product, the higher the firm’s levelof environmental performance. Similar to size, a global presence also increases visibility. In order tomeet or exceed legitimacy to operate, the expectations are higher when firms operate globally ratherthan local [16] as the global firms face a plurality of legal requirements on environmental performance.To conform these requirements, global companies are required to opt for a uniform and global policy onenvironmental management. Consequently, the resulting EMS will be of a higher level [15]. In contrast,firms may take globalization as an opportunity to transfer environmental technologies, procedures,and processes from stricter to less strict countries. Yet some argue that globalization may lead to atransfer of polluting practices to countries with lower environmental requirements, often referred to as‘pollution haven’. However, empirical evidence of such practices is weak [34] therefore we formulate thefollowing hypothesis:
Hypothesis 1d (H1d). The degree of globalization positively influences the comprehensiveness of EMS andtherefore the higher the degree of globalization of the firm, the more comprehensive its EMS.
2.4. Environmental Performance
Studies have used definitions ranging from absolute quantities to the relative results of changesand focus on the outcome of the management of activities, the activities itself or the final (financial)result of activities. Others refer to the definition provided in the ISO 14031/14001, namely ‘(measurable)results of an organization’s management of its environmental impact’. Thus, on the one hand, the focusis the (extent of) activities done for environmental management, and on the other hand the resultsfrom those activities [35,36]. For this study, the ISO definition shall be leading. Here, arguably, theextent of activities for environmental management is corresponding to the comprehensiveness of theEMS as discussed before. Hence the remaining definition is the operational effect on environmentalperformance. This operational performance should be measured relatively; how is the usage changing

Sustainability 2020, 12, 5309 7 of 21
over time (due to environmental management)? The reason for this is that activities, productrequirements, and situations that organizations face will never be comparable and in effect comparingabsolute usage would be non-valid [2]. The operational effects can be grouped into inputs and outputs.Inputs focus on the changes in resources that enter the firm, such as water, paper, gas, and electricity.The outputs focus on what leaves the firm, such as solid waste, carbon emissions, NOx emissions, andwastewater [37,38].
EMS and environmental performanceMany studies have explored the relationship between EMS and environmental performance.
The results vary from negative- to no- or positive correlations. Yet, all those studies are difficult tocompare, since they may employ different measurement parameters and focus on different industries.In order to construct a hypothesis, it is thus key to take into account the specific research goal anddefinitions of the source. Systematic reviews, such as those created by Boiral et al. and Hertin et al. [2,3].can aid in providing an overview of the outcome as well as the used definitions per publication [2,3].
Iraldo and Frey (2009) [26] show the positive impact of a well-designed environmental managementsystem on environmental performance. When looking at quantitative and specific environmentalindicators, such as waste and energy consumption, the large majority of studies have found a significantimprovement with the implementation of ISO 14001, compared to firms without the ISO. When theseindicators are defined in a more general fashion (and in effect the data is less quantitative), thesignificance becomes less pronounced [2,3,8]. Looking at the effect of an EMS as a general indicator,the significance is also less pronounced. However, when taking EMS comprehensiveness into account,the effect of the EMS on environmental performance becomes significant. Here comprehensivenessindicators are environmental management practices, such as employee training, environmental policies,internal audits [39], implications of Eco-Management and Audit Scheme (EMAS) regulation [26].More specifically, while certification of the EMS may help increase performance [26], the number ofoptional standards from the ISO implemented help to organize proper management, in case of EMSenvironmental management [33]. This may indicate that the implementation of a comprehensive EMS,and thus the quality of the EMS, rather than the implementation of an EMS as a binary indicator, may bekey to the realization of environmental improvements [2,9,26]. Therefore, we formulate the following:
Hypothesis 2 (H2). The more comprehensive the EMS is than the greater the improvements in environmentaloperational performance.
2.5. EMS, Environmental Performance and Financial Performance
Environmental performance was long thought to be opposing financial performance, yet somefirms seem to realize both simultaneously. The EMS are tools that may promote innovation due to thenature of the EMS and the firms where financial and environmental performance was improved wereusually those that were most innovative [8]. It is thought that EMS is the learning tool that provides theorganisation with critical information [33]. Similarly, those criticizing environmental regulations andEMS for their negative effect on economic competitiveness, are often those not considering innovationas a key source for performance improvements [40].
Financial effects due to environmental management can be broad. Ranging from direct effects,such as cost reductions due to decreased resource usage, and indirect effects, which include marketingadvantages and an improved reputation. EMS can play an important role in the reputation andtherefore affect the customer’s loyalty and satisfaction [41]. Here, a clear indirect effect on financialperformance has been observed [10].
On a manufacturing plant-level, the introduction of greener technologies leads to improvedmanufacturing performance and environmental performance as well. Here, both the perceived andobjectively measured financial performance improved [13]. The rationale behind this is a reduction ofresource input and the waste outcome has an effect on the environmental- and financial performance [33].For high-adopters, the effect of an EMS was much stronger on both cost-savings and emission reduction

Sustainability 2020, 12, 5309 8 of 21
compared to non-adopters [8], and the more comprehensive the EMS, the higher the financial gains [19].However, the effect of the EMS may not always be both positive on environmental- and financialperformance. For example, the EMS may organize environmental duties more efficiently or identifycheaper options for waste disposal. This would positively affect financial performance, without achange in environmental performance [2]. From this overview, it could be claimed the effects of theEMS on financial performance are perceived through two possible paths. First, the EMS can have adirect effect on the firms’ reputation and therefore on the financial performance. Secondly, by affectingenvironmental performance the EMS improves eco-efficiency and thereby financial performance.Therefore, we formulate the following:
Hypothesis 3a (H3a). The more comprehensive the EMS, the larger the improvements in financial performance.
Hypothesis 3b (H3b). The larger the improvements in environmental performance, the larger the improvementsin financial performance.
3. Methodology
3.1. Research Context: Environmental Research, Management and Performance in Brazil
Compared to countries with a comparable GDP, Brazil has a relatively low energy usage per capitaand a strong environmental regulatory regime [42]. Of all BRICS countries, China, India, and Brazil havethe most sustainable focus on development. Possibly due to that, sufficient research on environmentalmanagement can be found for those countries, as opposed to Russia and South-Africa [43].
As of 2007, 40% of the companies in Brazil had implemented a certified EMS [44]. The primaryincentive and outcome of EMS is eco-efficiency. Here, on the proposed scale from reactive to preventiveto proactive, Brazil can be considered preventive [45]. This means that companies are doing morethan the minimum required by legislation (which is considered simply ‘reactive’) and are looking foroptions to reduce resource usage, hence eco-efficiency. They cannot be regarded as proactive, whichwould include active innovations towards more environmentally friendly processes and products withenvironmental-friendliness as the prime motivator [46].
A self-reflective survey study yielded a perceived positive effect on environmental performance(i.e., energy and waste reduction as well as incident reduction), and a positive effect on business,such as being more attractive to investors [44,46]. This was, however, not a quantitative study.Quantitative analysis may be performed by using disclosed information on company websites.The completeness of such information varies a lot per sector, with mainly mining, paper, and energycompanies disclosing conclusive information [47].
3.2. Operationalization of Variables
Firm size is measured by a number of employees. The value has been normalized using thecommon logarithm. Normalization using the common logarithm creates a more normalized distributionand a more comprehensible format than the natural logarithm. By logical reasoning, it can also beargued that this is a more suitable data format. The difference between a small and large company isnotlinear, but is a logarithmic difference (i.e., ten- or hundredfold higher number of employees).
Firm experience in (host) country refers to general operating experience measured in years inBrazil. Thus, for international countries, it is measured starting from the year the company startedits operations in Brazil. The value was then recalculated to years of experience by subtractingthe questionnaire date from the year the operations started. The value was normalized on thelogarithmic scale.
EMS age is the second measure of experience, indicating how long the environmental managementsystem has been implemented. In the questionnaire, this has been categorically asked to respondents,for instance, 2-5 years or more than 10 years. Hence, the data is included as categorical and ordinal.
Sustainability 2020, 12, 5309 9 of 21
Globalization can make use of a region of origin (categorical). Region of origin can be a valuableindicator since it indicates the cultural roots of a company. The literature investigation suggeststhat the region of origin may be a valuable measure, because the location of the headquarter of thecompany may highly affect the ‘blueprint’ of the EMS. This can be in either a positive way, wherestricter regulations are universally adopted [16], or a negative way where a country with differentenvironmental requirements could be exploited as ‘pollution haven’ [34]. Hence, region or origin is used.
The construct of EMS comprehensiveness is based on how many environmental practices acompany employs. Thus, indicators that reflect how complete and inclusive the EMS is being used.These are for instance whether the firm has an environmental policy, has implemented ISO 14001 or hasimplemented other 14000 series standards. Note that this variable is a dependent variable in H1, butan independent (predicting) variable in H2 and H3. Environmental performance is a second variablethat is challenging to measure directly. Since all companies provide different products or services underdifferent conditions, ‘bad’ or ‘good’ environmental performance is hard to define. Here the definition inISO standards is used as a guideline, namely; (measurable) results of an organization’s management ofits environmental impact. The focus is on positive changes in environmental performance concerningits previous performance. Nevertheless, direct measurements of for instance resource usage oremissions is challenging (and not included in the dataset). For further analysis, we, therefore, proceedwith indicators that from a conceptual perspective are likely to positively influence environmentalperformance. From all possible actions on resources and emissions, the presence of a structured programme[on resource] and has a process to reduced generation [of emission] is considered a highly likely actionthat results in improved environmental performance.
Financial performance was measured by the indicator revenue change. Similarly, this was calculatedfor companies that have submitted information about their net revenue at least three times. It is notrelevant whether this was submitted in subsequent years. The coefficient for revenue change (%/year)was calculated using the least squares method. The limitation to at least three submissions is requiredto prevent overfitting.
Control Variables: The main control variable used is that of the industry sector. It is expectedthat the nature of operations affects the usage (intensity) of resources. Secondly, certain sectors mayexperience other pressures, for instance from consumers, from within the industry sector, or fromindustry-specific regulations [34]. This control shall be used for all hypotheses.
For H2 and H3, the statistically significant determinants for H1 will be added as a control factor.Though a strong effect is not expected, it may be that certain company aspects have a stronger effecton the performance resulting from the EMS than on the EMS itself. For example, larger firms mayhave more resources dedicated to executing the EMS and as a result, reaping performance benefits.Nevertheless, from the questionnaire, the EMS comprehensiveness may appear comparable [8].Control for industry sector results in four categories to control for, namely: agriculture, services, industry,and commerce. Table 1 presents the operationalization of variables.
Table 1. Operationalization.
Variable Indicator(s) Source Format Example
Firm size Employees in year X Council, 1978;van Kranenburg& Voinea, 2017[48,49]
Numerical,discrete (& lognormalized)
100.3, 105.0, . . .
Firm experience Number of years in(host) country
Voinea, 2018 [17] Numerical,discreate (& lognormalized)
100.3, 101.5, . . .

Sustainability 2020, 12, 5309 10 of 21
Table 1. Cont.
Variable Indicator(s) Source Format Example
EMS age Years of business withEMS in place
Melnyk &Calantone., 2003[33]
Categorical,ordinal
0–2, 5–10, >10, . . .
Globalization Region of origin Sharfman &Society., 2004;Voinea, 2018[16,17]
Categorical,nominal
Brazil, Europe,. . .
EMScomprehensiveness
The company has anenvironmental policy +implementation of ISO14001 + number of ISO14000 series standardsimplemented
Darnall &Sadorsky, 2008;Phan & Baird,2015[9,19]
Categorical,ordinal
0, 1, 2, . . .
Environmentalperformance
Presence of structuredprogramme to addressresources and emissions
Nawrocka &Parker,2009;Tung, Baird, &Schoch, 2014[4,50]
Numerical,interval
10%, 80%, . . .
Financialperformance
Revenue change Darnall &Sadorsky, 2008;Melnyk &Calantone., 2003[19,33]
Numerical,interval
4%, −19%, . . .
Control Industry sector (control) Voinea, 2017 [49] Categorical,nominal
Agriculture,services, . . .
3.3. Data and Sample
The data has been obtained from Análise Editorial by sending a questionnaire survey to thecompanies [51]. This was done bi-annually and the results for years 2010, 2012, 2014, and 2016 areused in this study. The data was combined (labelled to year), and where questions were changed overtime the data was not used. Over the eight year period, 2395 questionnaires were obtained with astable return rate of around 600 per year. Though roughly halve are companies that only submittedonce, about 600 companies have multiple submissions over-time and would thus allow for changeover time. A total of 148 companies have submitted the questionnaires four times (over the complete8 year period).
3.4. Data Preparation
The dataset is created by combining all four bi-annual datasets. The number of indicators isreduced in order to create one measure per variable as described in Section 3.1. Research context:Environmental research, management and performance in Brazil
Compared to countries with a comparable GDP, Brazil has a relatively low energy usage per capitaand a strong environmental regulatory regime [41]. Of all BRICS countries, China, India, and Brazil havethe most sustainable focus on development. Possibly due to that, sufficient research on environmentalmanagement can be found for those countries, as opposed to Russia and South-Africa [42].
As of 2007, 40% of the companies in Brazil had implemented a certified EMS [43]. The primaryincentive and outcome of EMS is eco-efficiency. Here, on the proposed scale from reactive to preventiveto proactive, Brazil can be considered preventive [44]. This means that companies are doing morethan the minimum required by legislation (which is considered simply ‘reactive’) and are looking foroptions to reduce resource usage, hence eco-efficiency. They cannot be regarded as proactive, which

Sustainability 2020, 12, 5309 11 of 21
would include active innovations towards more environmentally friendly processes and products withenvironmental-friendliness as the prime motivator [45].
A self-reflective survey study yielded a perceived positive effect on environmental performance(i.e., energy and waste reduction as well as incident reduction), and a positive effect on business, suchas being more attractive to investors [43,45]. This was, however, not a quantitative study. Quantitativeanalysis may be performed by using disclosed information on company websites. The completeness ofsuch information varies a lot per sector, with mainly mining, paper, and energy companies disclosingconclusive information [46].
Section 3.2. Operationalization of variables. Thus, where more than one indicator provesnecessary, the indicators are combined into a composite measure. The overview is provided inTable 2. The number of employees, number of years in (host) country, years of business with EMSin place, a region of origin, revenue change, and industry sector could directly be obtained fromthe dataset. EMS comprehensiveness and environmental performance make use of composites.EMS comprehensiveness is measured using multiple indicators: Company has an environmentalpolicy; Company has implemented ISO 14001; Company has implemented other ISO 14000 seriesstandards. However, using Chi-square tests it was observed that all indicators are significantlycorrelated and thus resulted in high collinearity. This is likely to cause model issues when jointlyintegrated into a model later and thus the number of indicators was reduced. From three indicators acomposite scale was constructed. The result is an ordinal combination that represents different levelsof EMS comprehensiveness and is provided in Table 2. The resulting scale ranges from no EMS (0) tohigh EMS comprehensiveness (4).
Table 2. Scale construct for EMS comprehensiveness.
Dummy Variable EMS Comprehensiveness0 No environmental policy1 Environmental policy
2Environmental policy + ISO 14001 implemented OREnvironmental policy + 1* other ISO 14000 standard
3Environmental policy + ISO 14001 implemented + 1* other ISO 14000 standard OREnvironmental policy + > 1* other ISO 14000 standard
4 Environmental policy + ISO 14001 implemented + > 1* other ISO 14000 standardUsing the three indicators (1) the presence of environmental policy, (2) implementation of ISO 14001 and (3) numberof ISO 14000 series standards implemented, an ordinal categorical scale was created. This represents a scaleranging from no EMS (0) to high EMS comprehensiveness (4). *1 was chosen as a cut-off point as it is the sample’smedian value.
Environmental performance makes use of multiple indicators. For the resources and emissions:Water; Electricity; Fuel; Wood and coal; Minerals; Solid waste; Effluents. The combined measure is acalculated numerical value based on how many structured programmes are in place for the resourcesand emissions of that company. Where a resource or emission is not relevant (for instance coal usagefor a hospital) the value is compensated. The scale is calculated according to equation bellow:
Environmental per f ormance = 100%×number o f (structured) programmes in placenumber o f relevant resources and emmisions
The formula for the calculation of environmental performance: A scale from 0–100% is calculatingthe number of structured programmes to address resources and emissions divided by the number ofrelevant resources and emissions for that company.

Sustainability 2020, 12, 5309 12 of 21
4. Results
First, we elaborate on the data content that has obtained to perform the analysis, including datashortcomings. Then, the results of statistical testing as performed to test the individual hypotheses willbe presented. The goal here is also to reduce the large set of indicators into a limited set of statisticallysignificant indicators.
4.1. Descriptive Statistics
Table 3 shows the descriptive statistics of the variables. According to size, firms range from fiveemployees up to companies with 152.000 employees. This is thus a representation from small to largecompanies in the broadest sense. Normalization with the logarithm resulted in a comprehensiblerange (from 0.7 to 5.18). Moreover, visual inspection, skewness, and kurtosis indicate normality canbe assumed.
Table 3. Descriptive statistics.
Variable N Mean Median Min Max SD Skewness Kurtosis
Firm size (normalized) 2012 3.18 3.19 0.70 5.18 0.66 −0.16 0.56
Firm size * 2012 4655 1559 5 152000 n.a. n.a. n.a.
Firm experience(normalized) 407 1.64 1.68 0.60 2.55 0.31 −0.37 0.12
Firm experience * 407 55 48 4 353 n.a. n.a. n.a.
Environmentalperformance 2395 48.28 40.00 0.00 100.00 32.33 0.35 −0.61
Financial performance 423 3.91 3.68 −24.54 30.33 9.27 0.25 0.98
Firm size, firm experience (years), EMS comprehensiveness (ordinal categories 0–4), environmental performance(scale 0–100%) and financial performance (% net revenue change per year). For firm size both the normalized andoriginal values are reported. * For analysis, only the normalized values are used.
Firm experience ranged from just four years up to three and a half centuries. This broad range hastherefore also been normalized, which results in a population where normality can be assumed basedon skewness and kurtosis values. However, visual inspection of a histogram indicates the sample maycontain two distributions; one that peaks around 20 years and one that peaks around 45–50 years.Considering the date of the questionnaires, this corresponds to 1990–1995 and the 60s respectively.
Experience with the EMS shows an unbalanced sample. The reason is that 0 years of experienceare companies without EMS. At 55.9% the large majority falls in this category. The second largestgroup has 5–10 years of experience (20.5%), then >10 years (11.3%), then 2–5 years (8.2%), and at last0–2 years (4.0%). Note that categories have no equal spacing; some contain a group of five years (5–10)while others only contain two years (0–2).
The constructed scale for environmental shows a mean value of 48%, properly centered in thetolerable range (0–100%). Moreover, the standard deviation is high thus the sample makes use of thefull potential of the scale.
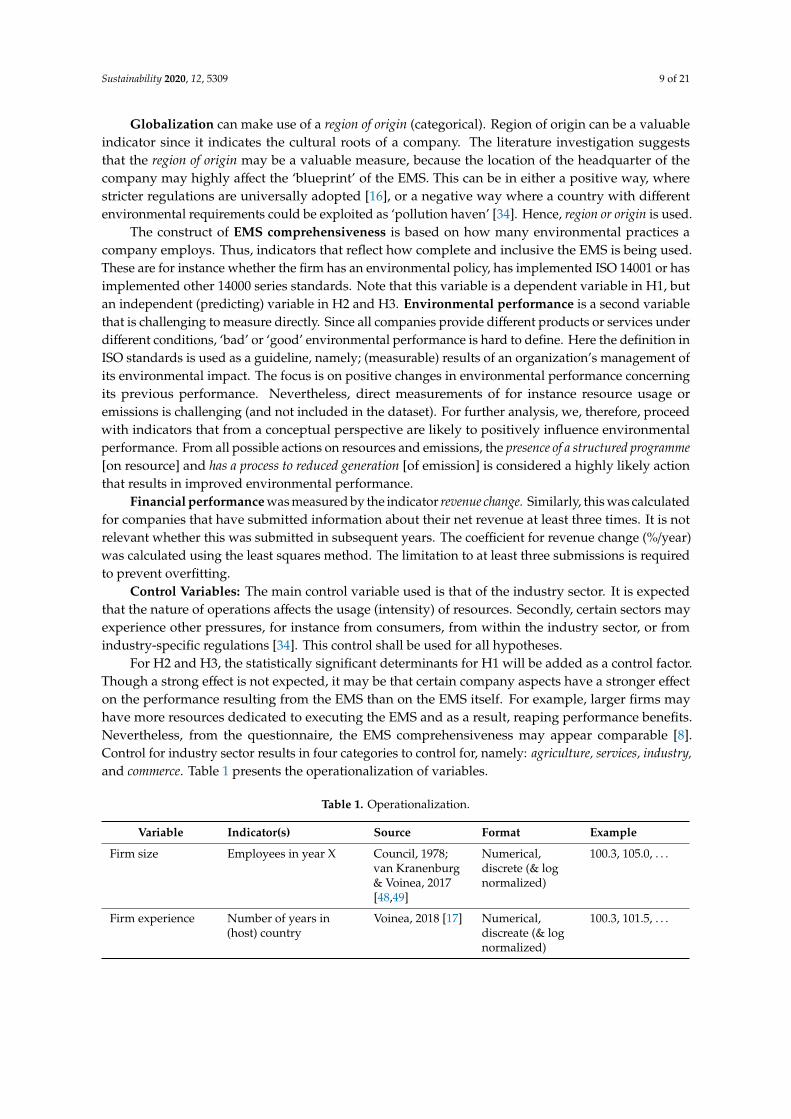
On average, the companies experienced an annual net revenue growth of +3.9%. The samplehistogram is provided in Figure 1. However, the range shows large differences ranging from −24.5% to+ 30.3%. The large variance (9.3%) also indicates the distribution is broad and in this sample, 30% ofthe companies experienced a decline in net revenue and thus negative financial performance.

Sustainability 2020, 12, 5309 13 of 21
Sustainability 2020, 12, x FOR PEER REVIEW 12 of 20
Experience with the EMS shows an unbalanced sample. The reason is that 0 years of experienceare companies without EMS. At 55.9% the large majority falls in this category. The second largest group has 5-10 years of experience (20.5%), then >10 years (11.3%), then 2-5 years (8.2%),and at last 0-2 years (4.0%). Note that categories have no equal spacing; some contain a group of five years (5-10) while others only contain two years (0-2).
The constructed scale for environmental shows a mean value of 48%, properly centered in thetolerable range (0-100%). Moreover, the standard deviation is high thus the sample makes use of the full potential of the scale.
On average, the companies experienced an annual net revenue growth of +3.9%. The sample histogram is provided in Figure 1. However, the range shows large differences ranging from -24.5% to + 30.3%. The large variance (9.3%) also indicates the distribution is broad and in this sample, 30% of the companies experienced a decline in net revenue and thus negative financial performance.
The constructed ordinal categories for EMS comprehensiveness are coded from 0-4, with 0 worst category and 4 highest score (and undefined distance between categories). The mean is 2.05 and median 2. The sample distribution is thus properly centered on the constructed scale. The variance is high and balanced; all categories are equally filled and contain roughly 20% of the samples.
Table 3. Descriptive statistics.
Variable N Mean Median Min Max SD Skewness Kurtosis Firm size (normalized) 2012 3.18 3.19 0.70 5.18 0.66 -0.16 0.56
Firm size* 2012 4655 1559 5 152000 n.a. n.a. n.a.
Firm experience (normalized) 407 1.64 1.68 0.60 2.55 0.31 -0.37 0.12
Firm experience* 407 55 48 4 353 n.a. n.a. n.a.
Environmental performance 2395 48.28 40.00 0.00 100.00 32.33 0.35 -0.61
Financial performance 423 3.91 3.68 -24.54 30.33 9.27 0.25 0.98Firm size, firm experience (years), EMS comprehensiveness (ordinal categories 0-4),
environmental performance (scale 0-100%) and financial performance (% net revenue change per year). For firm size both the normalized and original values are reported. *For analysis, only the normalized values are used.
Figure 1 presents the histogram of the financial performance (% change in net revenue per year). On average, a growth of +3.9% occurred. The large standard deviation indicates a high variancein financial performance exists with 30% of the companies experiencing a net revenue decline.
Figure 1. Sample histogram of the financial performance.
The constructed ordinal categories for EMS comprehensiveness are coded from 0–4, with 0 worstcategory and 4 highest score (and undefined distance between categories). The mean is 2.05 andmedian 2. The sample distribution is thus properly centered on the constructed scale. The variance ishigh and balanced; all categories are equally filled and contain roughly 20% of the samples.
Figure 1 presents the histogram of the financial performance (% change in net revenue peryear). On average, a growth of +3.9% occurred. The large standard deviation indicates a high variancein financial performance exists with 30% of the companies experiencing a net revenue decline.
Further, regarding the sector variable, industry companies have a much higher representation(at 49.1%), then services (33.1%), while the minority sector is commerce (5.9%) and agriculture (11.8%).
4.2. Cross Tabulations
For hypothesis 2, we analyse the dataset by tabulating the different EMS comprehensivenesslevels characteristics split per industry sector. This can be seen in Table 4. Clear differences can beobserved. For industry companies, most companies have the highest EMS comprehensiveness score,and the large majority of companies have an above average score. For the other sectors the opposite istrue. The different sectors have an apparent different distribution. The overall average value was 2.05.For industry companies, the majority has an above average EMS comprehensiveness, while it is belowaverage for agriculture, commerce, and services.
Table 4. EMS comprehensiveness across industry sectors.
EMS Comprehensiveness
Industry Sector 0 1 2 3 4
Agriculture 27% 22% 18% 25% 8%
Commerce 25% 27% 28% 16% 4%
Industry 11% 14% 26% 20% 29%
Services 20% 31% 16% 16% 16%
For hypothesis 2, the data was analysed by tabulating the environmental performancecharacteristics split to the different EMS comprehensiveness levels. As a control, this is also performed

Sustainability 2020, 12, 5309 14 of 21
for the industry sector. The results can be observed in Table 5. The observation results in theassumption that statistical modelling may find a statistically significant effect of EMS comprehensivenesson environmental performance. There is a clear difference in mean values at the different EMScomprehensiveness levels. The same is true for industry sector. Industry shows a higher environmentalperformance, commerce & services an average performance and the lowest performance for agriculture.
Table 5. Analysis of the different sub-groups of environmental performance for different levels of EMScomprehensiveness (top) and different industry sectors (bottom).
Environmental Performance Mean Median Min Max SD Skewness Kurtosis
EMS comprehensiveness
0 37.5% 33.0% 0.0% 100.0% 31.1% 0.46 −0.93
1 37.7% 33.0% 0.0% 100.0% 29.8% 0.46 0.82
2 50.5% 50.0% 0.0% 100.0% 31.8% −0.01 −1.16
3 54.2% 57.0% 0.0% 100.0% 32.6% −0.08 −1.25
4 60.1% 60.0% 0.0% 100.0% 30.2% −0.21 −1.11
Industry sector
Industry 58.7% 60.0% 0.0% 100.0% 30.8% −0.25 −1.11
Commerce 38.2% 33.0% 0.0% 100.0% 31.2% 0.59 −0.68
Services 41.1% 40.0% 0.0% 100.0% 31.4% 0.28 −1.11
Agriculture 30.2% 20.0% 0.0% 100.0% 26.1% 0.99 0.49
Similarly, as for hypothesis 2, comparable tabulations are created for hypothesis 3. Here the datasethas been analysed by tabulating the environmental performance characteristics split to the differentEMS comprehensiveness levels. As a control, this is also performed for the industry sector. The resultscan be observed in Table 6. The observation results in the assumption that statistical modelling mayfind a statistically significant effect of EMS comprehensiveness on financial performance. There isa clear difference in mean values at some different EMS comprehensiveness levels. Here, it seemsthat the lowest and highest EMS comprehensiveness results in lower financial performance. For theindustry sector, the effects look minor.
Table 6. Analysis of the different sub-groups of financial performance for different levels of EMScomprehensiveness (top) and different industry sectors (bottom).
Financial Performance Mean Median Min Max SD Skewness Kurtosis
EMS comprehensiveness
0 2.8% 4.3% −24.5% 16.5% 8.7% −1.02 1.75
1 4.8% 4.7% −24.5% 27.6% 10.0% 0.15 0.69
2 4.6% 4.5% −17.6% 27.6% 8.1% 0.31 1.93
3 4.6% 4.0% −15.0% 30.3% 9.2% 0.74 1.34
4 2.7% 2.7% −17.6% 27.6% 9.7% 0.53 0.31
Industry sector
Industry 3.0% 3.0% −24.5% 30.3% 9.6% 0.06 1.07
Commerce 6.0% 4.6% −8.9% 26.8% 12.6% 0.51 −0.67
Services 4.4% 3.7% −15.3% 30.3% 8.4% 0.37 1.29
Agriculture 4.9% 5.4% −10.2% 27.6% 9.1% 0.58 0.43

Sustainability 2020, 12, 5309 15 of 21
4.3. Hypothesis Testing
The first model contains all predicting variables. The ordinal regression model shows an overallstatistical significance (model fitting) (χ2(1) = 199.895, p = 0.000). The data can explain a large partof the variance in EMS comprehensiveness (Nagelkerke R2 43.0%). Goodness-of-fit shows properresults, where Pearson’s is proper goodness (χ2(1) = 1442.773, p = 0.811) and Deviance shows propergoodness (G2 = 987.173, p = 1.000). Parameter estimates show that a high (negative) effect withthe highest statistical significance on the EMS comprehensiveness is caused by EMS age = 0 yearsof experience. This is an obvious result as no experience means no EMS thus the lowest score forEMS comprehensiveness.
The test of parallel lines indicates odds proportionality cannot be assumed (χ2(1) = 177.455,p = 0.000). A general model may thus actually provide an improved fit. However, the oddsproportionality often fails under the parallel lines test, especially with many samples and a continuouspredictor (ReStore, n.d.). Here, two continuous predictors are included in the model, namely firmexperience and firm size.
The second model iteration removes EMS age from the model because of the prementioned reasons.The ordinal regression model shows an overall statistical significance (model fitting) (χ2(1) = 50.422,p = 0.000). The data is able to explain a smaller part of the variance in EMS comprehensiveness(Nagelkerke R2 13.1%), but goodness-of-fit still shows proper results for Pearson’s (χ2(1) = 1560.622,p = 0.116) and Deviance (G2 = 1136.646, p = 1.000). The only variable that is statistically significant isfirm size. A tenfold increase in the number of employees results in about 0.35 increase in the log oddsof a higher EMS comprehensiveness level (B = 0.366, p = 0.024). The test of parallel lines indicatesodds proportionality cannot be assumed (χ2(1) = 63.406, p = 0.000).
In a third iteration, the globalization and firm experience variables were removed. The reason isthat many samples are excluded because data is missing for those variables. With firm size and controlfor the sector, more samples can be included in the model (n = 2012). The ordinal regression modelshows an overall statistical significance (model fitting) (χ2(1) = 164.216, p = 0.000). As expected, thedata can explain an even smaller part of the variance in EMS comprehensiveness (Nagelkerke R2 8.2%)and goodness-of-fit shows proper results where Pearson’s goodness is (χ2(1) = 5460.640, p = 0.253)and Deviance (G2 = 4590.841, p = 1.000). The variable that is statistically significant remains firm size.A tenfold increase in several employees results in about 0.33 increase in the log odds of a higher EMScomprehensiveness level (B = 0.327, p = 0.000). Thus, on a higher sample size model iteration, two isconfirmed. Furthermore, the sector industry (w.r.t. baseline services) results in statistically significanthigher odd of EMS comprehensiveness (B = 0.881, p = 0.000). The test of parallel lines indicates oddsproportionality cannot be assumed (χ2(1) = 82.253, p = 0.000).
Hypothesis 1a (Firm size positively relates to the comprehensiveness of the EMS, thus the larger the firm,the more comprehensive its’ EMS.) was supported by data as used in this research study. The ordinalregression models show a higher EMS comprehensiveness for companies that are larger in terms ofemployee count. More precisely, a tenfold increase in the number of employees on average resultsin a factor e0.366 = 1.44 increase in odds of having a higher EMS comprehensiveness score (B = 0.366,p = 0.024).
Hypothesis 1b (Firm experience is positively related to the EMS comprehensiveness and thus older firmshave a higher environmental management performance.) was not supported by data as used in this researchstudy. The ordinal regression models show a lower EMS comprehensiveness for companies that have alonger experience. However, the resulting relation has no statistical significance.
Hypothesis 1c (EMS age is positively related to the EMS comprehensiveness and thus firms who haveimplemented an EMS for a longer period already have a higher environmental management performance.) wasnot supported by data as used in this research study. The ordinal regression models show no logicaltrend or response for EMS age. Moreover, the results are not statistically significant.
Hypothesis 1d (The degree of globalization positively influences the comprehensiveness of EMS, thus thehigher the degree of globalization of the firm, the more comprehensive its’ EMS.) was not supported by data as

Sustainability 2020, 12, 5309 16 of 21
used in this research study. The ordinal regression models show a lower EMS comprehensiveness forcompanies that have their roots in Brazil and North America and a higher EMS comprehensiveness forcompanies with roots in Europe, South America, and Africa. However, the resulting relations have nostatistical significance.
Hypothesis 2 (The more comprehensive the EMS, the larger the improvements in environmental operationalperformance.) was supported by data as used in this research study. Tukey’s HSD shows that the clusterwith lowest environmental performance, meaning performing actions for only 37% of the possibleresources & emissions, is EMS comprehensiveness value 0 and 1. This corresponds to companies thathave either no EMS at all or only an environmental policy. EMS comprehensiveness value 2 and 3 showimproved environmental performance with about 52% off the possible actions. These are companiesthat have an environmental policy but that also implemented ISO 14001 and/or one or more other ISOstandards from the 14000 series. The highest environmental performers with on average 60% of thepossible actions have an environmental policy, implemented ISO14001, and more than one other ISOstandard of the 14000 series.
Furthermore, firm size positively influences environmental performance. A tenfold increasein the number of employees is estimated to result in an 8% increase in environmental performance(B = 7.86, p = 0.000). Also, companies from commerce and services show comparable environmentalperformance. Agriculture shows an on average 13% lower environmental performance (B = −13.112,p = 0.000) and industry a 15% higher environmental performance (B = 14.779, p = 0.000). This results inthree clusters with agriculture having the lowest environmental performance (estimated at 30%), thencommerce & services (estimated at 40%), and industry the highest performance (estimated at 59%).
Hypothesis 3a (The more comprehensive the EMS, the larger the improvements in financial performance.)This hypothesis was partially supported by data as used in this research study. The model outcomesuggests that a more comprehensive EMS results in a higher financial performance up to a certain level,after which financial performance is greatly reduced.
EMS comprehensiveness for companies in a particular sector results in significant differences fortheir expected financial performance as follows:
For the industry sectors, companies with EMS comprehensiveness = 0 & 1, the financialperformance is much lower (B = −10.220, p = 0.006 & B = −7.355, p = 0.023 respectively).
For industry companies with EMS comprehensiveness = 3, the financial performance is muchlower (B = −8.060, p = 0.011).
For commerce companies with EMS comprehensiveness = 1, the financial performance is muchhigher (B = 17.594, p = 0.011).
For agriculture companies with average EMS comprehensiveness (3), the financial performance ismuch lower (B = −12.567, p = 0.013).
Moreover, the industry sector plays an important explanatory role in the model, resulting in largedifferences in financial performance. For instance, for the industry sector, the financial performancedoes not reduce with high EMS comprehensiveness and for commerce, the best financial performancewas found to be companies with a low EMS comprehensiveness.
Hypothesis 3b (The larger the improvements in environmental performance, the larger the improvementsin financial performance.) was not supported by data as used in this research study. The model showsthat higher environmental performance results in decreased financial performance.
However, when the industry sector is included in the model, the statistical significance fades out.This suggests that the differences in financial performance vary significantly per industry sector or (asfound in H2) that the environmental performance varies as well significantly per industry sector.
5. Discussion
Based on our result some interesting observations can be made. Firstly, with increasing EMScomprehensiveness the environmental performance increases. In effect, three differentiable clusters arefound that range from a 37% environmental performance score for the lowest EMS comprehensiveness

Sustainability 2020, 12, 5309 17 of 21
scores up to 60% environmental performance score for the highest EMS comprehensiveness scores.Translating this back to the used indicators for these variables it tells us that a higher degree of- andmore complete adaptation of policies and standards related to environmental management resultsin a higher number of active actions and programmes related to the reduction of resource usage andwaste generation. It is clear from our result that the inclusion of EMS in organization as an integralpart may enhance its environmental performance. In addition, the more an organization considersenvironmental programmes while planning operational tasks, the more it may achieve environmentalperformance. Further, it was hypothesized that a higher degree of EMS comprehensiveness resultsin higher environmental performance and this was thus confirmed. Also, the lowest and highestEMS comprehensiveness scores result in lower financial performance. Here, these two extremesresult in a 2% lower increase in net revenue per year, or calculated relatively; an almost 50% lowerfinancial performance compared to the average EMS comprehensiveness scores. This relatively largedifference suggests that under- or over performing with respect to environmental management andrelated policies results in lower financial performance. Although it is costly to implement EMSs,several researches identify that companies can gain financial benefits from the implementation of EMSs.Our results are in accordance with recommendations from [19,33]. For that purpose, firm managersmust acknowledge that an integrated effort is required to mobilize both tangible and intangibleresources for better sustainable business results while dealing with environmental issues. This isparticularly needed when there is an appropriate time to invest in environmental projects.
Regarding environmental performance, similar to EMS comprehensiveness and financialperformance, industry companies have on average the highest environmental performance as wellas the lowest financial performance. Though independent variables were controlled for collinearity,it remains unclear whether environmental performance has a direct effect on financial performance orwhether these are in fact industry sector characteristics. Nevertheless, a statistically significant linearnegative relationship was found between environmental performance and financial performance.
Furthermore, it has been found that company size has a positive effect on the EMScomprehensiveness. Thus, companies with more employees have on average implemented moreenvironmental management policies and standards. Experience with the EMS was not found to havean effect on the EMS comprehensiveness. Firm experience, measured in years of operation, showed anegative trend on the EMS comprehensiveness. The resulting conclusions from this research indicatethat the effects on financial performance are ambiguous where;
EMS comprehensiveness has a certain optimum where financial performance is at its highest.On average, the lower financial performance is realized with extreme EMS comprehensiveness,meaning no environmental practices at all or the implementation of a very high number ofenvironmental practices.
Environmental performance has a negative relationship with financial performance; the higher theenvironmental performance, the lower the financial performance. In summary, the reverse relationshipcan be credited to strict environmental regulations and tough disclosure practices. There is an importantimplication for the managers to well aware of the regulations and try to market their company asenvironment friendly, so they may reduce the negative consequences of environmental performance.
6. Conclusions
The objective of this study was to investigate the relationship between the comprehensiveness ofthe environmental management systems, the environmental performance and the financial performanceof MNCs in emerging economies. The relationship between EMS comprehensiveness, environmentalperformance, and financial performance proves to be complex. First of all, it has been observed that thecomprehensiveness of EMS is positively associated with environmental performance. However, thisrelationship varies among industry, commerce, services, and agriculture. Second, this study reports apartial relationship between the comprehensiveness of EMS and financial performance across differentindustry sector. The influence of the comprehensiveness of EMS on financial performance is higher

Sustainability 2020, 12, 5309 18 of 21
for commerce as compared to agriculture and industry. Finally, this study determines the oppositerelationship between environmental performance and financial performance. The overall negativeeffect of environmental performance on financial performance may indicate that the resources needed torealize an improved environmental performance does not outweigh the cost reductions resulting fromeco-efficiency or improved reputation. The effect of EMS comprehensiveness on financial performanceis in line with that, indicating that an above average EMS comprehensiveness results in lower financialperformance, which may correspond to high environmental management and overhead costs.
From an alternative standpoint, that of positive effects on reputation due to environmentalmanagement, the same could be claimed. Having environmental management in place arguably resultsin higher turnover due to an improved reputation but a too comprehensive EMS may offset that byimposing costs. Nevertheless, a differentiation between EMS comprehensiveness effects on either costreduction or reputation (direct and indirect effects [10] is not provided in this research.
7. Literature Reflection
The main indicator of EMS comprehensiveness was found to be firm size, as claimed previouslyin prior research [8,13]. Regarding globalization, data suggest that companies with their roots inBrazil or North America have a lower EMS comprehensiveness than companies with their roots inEurope or Asia (mainly Japan). This contributes to the theory that firms that operate globally seem toimplement on a global scale their policies such that the environmental requirements of all areas aremet and, in effect, this would result in a more comprehensive EMS [15,16]. However, this relation wasnot statistically significant in this research.
Another of our findings regarding a more comprehensive EMS does result in a higher frequencyof environmental actions being employed, thereby confirming existing claims regarding thisrelationship [2,9,26]. Arguably, the effect of a (comprehensive) EMS and higher environmentalperformance on a firm’s financial performance is the most debatable and interesting claim.
For the effect of a comprehensive EMS on financial performance, an optimum was observed (at anaverage EMS comprehensiveness). The observed ‘optimum’ contradicts previous research, where theoutcome was that a more comprehensiveness EMS results in higher financial performance [19]. Also, itopted that an EMS can be seen as a structuring tool to facilitate innovation [8] but this does not help inexplaining the observed optimum. Other research failed to find a statistically significant relationshipbetween EMS and financial performance. This could be due to the use of probit model regression,measuring the dependent financial performance as either improved or not [2] instead of the linearregressions used here.
The negative linear relationship between environmental- and financial performance makes itreasonable to claim that there is indeed a cost to environmental good-doing [2]. Through qualitativeresearch is able to find good examples of firms that do realize both improved financial- andenvironmental performance [8], the opposite is statistically significant.
8. Future Research
Findings in this research have shown interesting insights, with some proving and others rejectingprevious research. Arguably the most interesting finding has been that of an ‘optimum’ EMScomprehensiveness when striving for the best financial performance. Further research could focus onfinding that optimum so that companies are able to balance environmental- and financial performanceas desired from their stakeholders. Furthermore, differentiating financial performance to operatingcosts and sales income could aid in differentiation effects on either eco-efficiency or reputation due toenvironmental management [52].
In addition, it has been found that the sector a company operates in greatly affects the EMScomprehensiveness, environmental performance, and financial performance. It would be of greatinterest to conduct an explorative study on how these differences could be explained. Such research

Sustainability 2020, 12, 5309 19 of 21
may be able to provide insights on what drives these differences, such as sector specific legislation,customer pressures or peer pressure.
At last, an obvious extension of this research would be to perform a comparative analysis ondifferent markets. Not only should the focus be on the stage of economic development (such as otherBRIC countries or Western markets) but also taking into a countries’ stage of sustainability, such aswhether they are reactive, preventive or proactive [45,46].
Author Contributions: Conceptualization, C.L.V., B.-J.H.; methodology, C.L.V., B.-J.H.; software, C.L.V., B.-J.H.;validation, C.L.V.; formal analysis, C.L.V., B.-J.H.; investigation, H.B.A.H.; resources, C.L.V., C.F.; data curation,H.B.A.H.; writing—original draft preparation, C.L.V., B.-J.H.; writing—C.F., H.B.A.H.; visualization, C.F.;supervision, C.L.V., C.F.; project administration, C.L.V. All authors have read and agreed to the published versionof the manuscript.
Funding: This research received no external funding.
Conflicts of Interest: The authors declare no conflict of interest.
References
1. Salim, H.K.; Padfield, R.; Hansen, S.B.; Mohamad, S.E.; Yuzir, A.; Syayuti, K.; Tham, M.H.; Papargyropoulou, E.Global trends in environmental management system and ISO14001 research. J. Clean. Prod. 2018, 170,645–653. [CrossRef]
2. Hertin, J.; Berkhout, F.; Wagner, M.; Tyteca, D. Are EMS environmentally effective? The link betweenenvironmental management systems and environmental performance in European companies. J. Environ.Plan. Manag. 2008, 51, 259–283. [CrossRef]
3. Boiral, O.; Guillaumie, L.; Saizarbitoria, I.H.; Tene, C.V.T. Adoption and outcomes of ISO 14001: A systematicreview. Int. J. Manag. Rev. 2018, 20, 411–432. [CrossRef]
4. Nawrocka, D.; Parker, T.J. Finding the connection: Environmental management systems and environmentalperformance. J. Clean. Prod. 2009, 17, 601–607. [CrossRef]
5. Lober, D.J. Evaluating the environmental performance of corporations. J. Manag. Issues 1996, 8, 184–205.6. Henri, J.F.; Journeault, M. Eco-control: The influence of management control systems on environmental and
economic performance. Account. Organ. Soc. 2010, 35, 63–80. [CrossRef]7. Kassinis, G.I.; Vafeas, N. Stakeholder pressures and environmental performance. Acad. Manag. J. 2006, 49,
145–159. [CrossRef]8. Florida, R.; Davison, D. Gaining from green management: Environmental management systems inside and
outside the factory. Calif. Manag. Rev. 2001, 43, 64–84. [CrossRef]9. Phan, T.N.; Baird, K. The comprehensiveness of environmental management systems: The influence of
institutional pressures and the impact on environmental performance. J. Environ. Manag. 2015, 160, 45–56.[CrossRef] [PubMed]
10. Feng, T.; Wang, D. The influence of environmental management systems on financial performance:A moderated-mediation analysis. J. Bus. Ethics 2016, 135, 265–278. [CrossRef]
11. Watson, K.; Klingenberg, B.; Polito, T.; Geurts, T.G. Impact of environmental management systemimplementation on financial performance. Manag. Environ. Qual. Int. J. 2004, 15, 622–628. [CrossRef]
12. Moneva, J.M.; Ortas, E. Corporate environmental and financial performance:a multivariate approach.Ind. Manag. Data Syst. 2010, 110, 193–210. [CrossRef]
13. Klassen, R.D.; Whybark, D.C. The impact of environmental technologies on manufacturing performance.Acad. Manag. J. 1999, 42, 599–615.
14. Dean, T.J.; Brown, R.L. Pollution regulation as a barrier to new firm entry: Initial evidence and implicationsfor future research. Acad. Manag. J. 1995, 38, 288–303.
15. Christmann, P. Multinational companies and the natural environment: Determinants of global environmentalpolicy. Acad. Manag. J. 2004, 47, 747–760.
16. Sharfman, M.P.; Shaft, T.M.; Tihanyi, L. A model of the global and institutional antecedents of high-levelcorporate environmental performance. Bus. Soc. 2004, 43, 6–36. [CrossRef]
17. Voinea, C.L.; Fratostiteanu, C. Corporate Social in Emerging Economies: Reality and Illusion; Routledge: New York,NY, USA, 2018.

Sustainability 2020, 12, 5309 20 of 21
18. Rauf, F.; Voinea, C.L.; Hashmi, H.B.A.; Fratostiteanu, C. Moderating Effect of Political Embeddedness on theRelationship between Resources Base and Quality of CSR Disclosure in China. Sustainability 2020, 12, 3323.[CrossRef]
19. Darnall, N.; Henriques, I.; Sadorsky, P. Do environmental management systems improve business performancein an international setting? J. Int. Manag. 2008, 14, 364–376. [CrossRef]
20. Rondinelli, D.A.; Vastag, G. Panacea, common sense, or just a label? The value of ISO 14001 environmentalmanagement systems. Eur. Manag. J. 2000, 18, 499–510. [CrossRef]
21. Lesinski, B.C. Environmental Management System. Preventive L. Rep. 2001, 20, 3.22. Boiral, O. Corporate greening through ISO 14001: A rational myth? Organ. Sci. 2007, 18, 127–146. [CrossRef]23. Darnall, N.; Kim, Y. Which types of environmental management systems are related to greater environmental
improvements? Public Adm. Rev. 2012, 72, 351–365. [CrossRef]24. Hamschmidt, J.J.E.E. Economic and Ecological Impacts of Environmental Management Systems in Companies:
Experiences from Switzerland; BoD-Books on Demand: Norderstedt, Germany, 2000.25. Tourais, P.C.; Videira, N. Why, how and what do organizations achieve with the implementation of
environmental management Systems?—Lessons from a comprehensive review on the eco-management andaudit scheme. Sustainability 2016, 8, 283. [CrossRef]
26. Iraldo, F.; Testa, F.; Frey, M. Is an environmental management system able to influence environmental andcompetitive performance? The case of the eco-management and audit scheme (EMAS) in the Europeanunion. J. Clean. Prod. 2009, 17, 1444–1452. [CrossRef]
27. Arimura, T.H.; Hibiki, A.; Katayama, H. Is a voluntary approach an effective environmental policy instrument?A case for environmental management systems. J. Environ. Econ. Manag. 2008, 55, 281–295. [CrossRef]
28. Morrow, D.; Rondinelli, D.A. Adopting corporate environmental management systems: Motivations andresults of ISO 14001 and EMAS certification. Eur. Manag. J. 2002, 20, 159–171. [CrossRef]
29. Davies, T.; Mazurek, J.; McCarthy, K.; Darnall, N. Industry Incentives for Environmental Improvement: Evaluationof US Federal Initiatives; Global Environmental Management Initiative: Washington, DC, USA, 1996.
30. Lindenberg, S.; Steg, L.; van den Berg, A.E.; de Groot, J.I.M. Environmental Psychology: An Introduction;Wiley-BPS Blackwell, 2012.
31. Aragón-Correa, J.A. Strategic proactivity and firm approach to the natural environment. Acad. Manag. J.1998, 41, 556–567. [CrossRef]
32. Hillary, R. Environmental management systems and the smaller enterprise. J. Clean. Prod. 2004, 12, 561–569.[CrossRef]
33. Melnyk, S.A.; Sroufe, R.; Calantone, R.J. Assessing the impact of environmental management systems oncorporate and environmental performance. J. Oper. Manag. 2003, 21, 329–351. [CrossRef]
34. Christmann, P.; Taylor, G. Globalization and the environment: Determinants of firm self-regulation in China.J. Int. Bus. Stud. 2001, 32, 439–458. [CrossRef]
35. Perotto, E.; Canziani, R.; Marchesi, R.; Butelli, P. Environmental performance, indicators and measurementuncertainty in EMS context: A case study. J. Clean. Prod. 2008, 16, 517–530. [CrossRef]
36. Trumpp, C.; Endrikat, J.; Zopf, C.; Guenther, E. Definition, conceptualization, and measurement of corporateenvironmental performance: A critical examination of a multidimensional construct. J. Bus. Ethics 2015, 126,185–204. [CrossRef]
37. Xie, S.; Hayase, K. Corporate environmental performance evaluation:a measurement model and a newconcept. Bus. Strategy Environ. 2007, 16, 148–168. [CrossRef]
38. Dragomir, V.D. How do we measure corporate environmental performance? A critical review. J. Clean. Prod.2018, 196, 1124–1157. [CrossRef]
39. Anton, W.R.; Deltas, G.; Khanna, M. Incentives for environmental self-regulation and implications forenvironmental performance. J. Environ. Econ. Manag. 2004, 48, 632–654. [CrossRef]
40. Porter, M.E.; Der Linde, C.L.V. Toward a new conception of the environment-competitiveness relationship.J. Econ. Perspect. 1995, 9, 97–118. [CrossRef]
41. Voinea, C.L.; Logger, M.; Rauf, F.; Roijakkers, N. Drivers for Sustainable Business Models in Start-Ups:Multiple Case Studies. Sustainability 2019, 11, 6884. [CrossRef]
42. Esty, D.C.; Porter, M.E. National environmental performance: An empirical analysis of policy results anddeterminants. Environ. Dev. Econ. 2005, 10, 391–434. [CrossRef]

Sustainability 2020, 12, 5309 21 of 21
43. Pinto, G.M.; Pedroso, B.; Moraes, J.; Pilatti, L.A.; Picinin, C.T. Environmental management practices inindustries of Brazil, Russia, India, China and South Africa (BRICS) from 2011 to 2015. J. Clean. Prod. 2018,198, 1251–1261. [CrossRef]
44. De Oliveira, O.J.; Serra, J.R.; Salgado, M.H. Does ISO 14001 work in Brazil? J. Clean. Prod. 2010, 18, 1797–1806.[CrossRef]
45. Jabbour, C.J.; Silva, E.M.; Paiva, E.L.; Santos, F.C. Environmental management in Brazil: Is it a completelycompetitive priority? J. Clean. Prod. 2012, 21, 11–22. [CrossRef]
46. Gavronski, I.; Ferrer, G.; Paiva, E.L. ISO 14001 certification in Brazil: Motivations and benefits. J. Clean. Prod.2008, 16, 87–94. [CrossRef]
47. Trierweiller, A.C.; Peixe, B.C.; Tezza, R.; Bornia, A.C.; Campos, L.M. Measuring environmental managementdisclosure in industries in Brazil with item response theory. J. Clean. Prod. 2013, 47, 298–305. [CrossRef]
48. Directive, F.C. 78/660/EEC of 25 July 1978 based on Article 54 (3)(g) of the Treaty on the annual accountsof certain types of companies. OJ L, 222(14.08). 1978. Available online: www.academia.edu (accessed on2 December 2019).
49. Van Kranenburg, H.; Voinea, C.L. Nonmarket strategies predictors for foreign firms. Scand. J. Manag. 2017,33, 82–92. [CrossRef]
50. Tung, A.; Baird, K.; Schoch, H. The relationship between organisational factors and the effectiveness ofenvironmental management. J. Environ. Manag. 2014, 144, 186–196. [CrossRef] [PubMed]
51. Editorial, A. 2016. Available online: https://analise.com/ (accessed on 3 July 2018).52. Voinea, C.L.; Fratostiteanu, C.; Romein, B. The Influence of Governance and Ownership on CSR Practices in
Romania. Eur. J. Sustain. Dev. 2019, 8, 313. [CrossRef]
© 2020 by the authors. Licensee MDPI, Basel, Switzerland. This article is an open accessarticle distributed under the terms and conditions of the Creative Commons Attribution(CC BY) license (http://creativecommons.org/licenses/by/4.0/).
Copyright © 2022 FDOKUMEN