The Racial/Ethnic Group Disadvantage Scale: A Scale for Use with Multiple Groups in Diverse...
13
International Journal of Psychological Studies; Vol. 5, No. 2; 2013 ISSN 1918-7211 E-ISSN 1918-722X Published by Canadian Center of Science and Education 39 The Racial/Ethnic Group Disadvantage Scale: A Scale for Use with Multiple Groups in Diverse Geographical Contexts Julie Spencer-Rodgers 1,2 , Meaghan Gilbert 3 & Kaiping Peng 2,4 1 Department of Psychology and Child Development, California Polytechnic State University, San Luis Obispo, USA 2 Department of Psychology, Tsinghua University, Beijing, China 3 School of Public Health, University of Alberta, Edmonton, Canada 4 Department of Psychology, University of California at Berkeley, Berkeley, USA Correspondence: Julie Spencer-Rodgers, Department of Psychology and Child Development, California Polytechnic State University, San Luis Obispo, California, 93407-0387, USA. Tel: 1-805-280-8092. E-mail: [email protected] Received: April 10, 2013 Accepted: April 26, 2013 Online Published: May 14, 2013 doi:10.5539/ijps.v5n2p39 URL: http://dx.doi.org/10.5539/ijps.v5n2p39 Abstract The Racial-Ethnic Group Disadvantage Scale (REGDS) is a new brief (7-item) measure of general perceptions of racial/ethnic group disadvantage, designed for use with multiple racial/ethnic groups in diverse geographical contexts. The scale measures the extent to which individuals believe that their racial/ethnic group has lower social status, fewer economic resources, and less political power than other racial/ethnic groups in society, combined with collective experiences of discrimination, social exclusion, and negative stereotyping. We report the results of several studies conducted with international and American college students (White, Asian-, Latino-, and African-American students), and present evidence establishing the reliability and validity of the REGDS, including internal consistency, test-retest reliability, criterion (known-groups) validity, and concurrent validity. Keywords: minority groups, prejudice, racial discrimination, cross-cultural differences, racial/ethnic populations, psychometrics, test construction 1. Introduction Minority groups exist in almost every country in the world, including the Maoris in New Zealand, the Kurds in Iraq, the Zhuang in China, the Harijans in India, the Basque in Spain, and Blacks in South Africa (Bornman, 1999; Hutnik, 1991; McCool, Du Toit, & Petty, 2006; Tajfel, 1978; Verkuyten & Yildiz, 2006). Majority/minority group distinctions are likely to become increasingly important as international migration patterns and globalization bring more and more racial/ethnic groups into contact (Hutnik, 1991; Sidanius & Pratto, 1999; Spencer-Rodgers, Tong, & Liao, 2012). These sociological trends also highlight the importance of examining the construct of racial/ethnic group disadvantage from a cross-cultural and international perspective. Within social, counseling, and other branches of psychology, there has been burgeoning interest in the correlates of racial/ethnic group disadvantage among individuals in diverse societies (Atkinson, Morten, & Sue, 1983; Crocker, Major, & Steele, 1998; Kaiser & Wilkins, 2010; Major, Gramzow, McCoy, Levin, Schmader, & Sidanius, 2002; Phinney, 1996). Scholars have examined the psychosocial antecedents and outcomes associated with racial/ethnic group discrimination in various countries (Cross & Vandiver, 2001; Hutnik, 1991; Spencer-Rodgers et al., 2012), and have proposed numerous theoretical models of racial/ethnic minority identity development (e.g., Atkinson et al., 1983; Cross, 1991; Sellers, Smith, Shelton, Rowley, & Chavous, 1998). However, most of these theoretical models are limited to one racial/ethnic group and cannot be used in a variety of geographical contexts. The purpose of the present research was to develop a brief measure of racial/ethnic group disadvantage for use with multiple groups in diverse geographical contexts. In the next section, we summarize previous research on the construct of racial/ethnic group disadvantage. Then, we present data on the reliability and validity of the Racial/Ethnic Group Disadvantage Scale (REGDS).
Transcript of The Racial/Ethnic Group Disadvantage Scale: A Scale for Use with Multiple Groups in Diverse...

International Journal of Psychological Studies; Vol. 5, No. 2; 2013 ISSN 1918-7211 E-ISSN 1918-722X
Published by Canadian Center of Science and Education
39
The Racial/Ethnic Group Disadvantage Scale: A Scale for Use with Multiple Groups in Diverse Geographical Contexts
Julie Spencer-Rodgers1,2, Meaghan Gilbert3 & Kaiping Peng2,4
1 Department of Psychology and Child Development, California Polytechnic State University, San Luis Obispo, USA 2 Department of Psychology, Tsinghua University, Beijing, China 3 School of Public Health, University of Alberta, Edmonton, Canada 4 Department of Psychology, University of California at Berkeley, Berkeley, USA
Correspondence: Julie Spencer-Rodgers, Department of Psychology and Child Development, California Polytechnic State University, San Luis Obispo, California, 93407-0387, USA. Tel: 1-805-280-8092. E-mail: [email protected]
Received: April 10, 2013 Accepted: April 26, 2013 Online Published: May 14, 2013
doi:10.5539/ijps.v5n2p39 URL: http://dx.doi.org/10.5539/ijps.v5n2p39
Abstract
The Racial-Ethnic Group Disadvantage Scale (REGDS) is a new brief (7-item) measure of general perceptions of racial/ethnic group disadvantage, designed for use with multiple racial/ethnic groups in diverse geographical contexts. The scale measures the extent to which individuals believe that their racial/ethnic group has lower social status, fewer economic resources, and less political power than other racial/ethnic groups in society, combined with collective experiences of discrimination, social exclusion, and negative stereotyping. We report the results of several studies conducted with international and American college students (White, Asian-, Latino-, and African-American students), and present evidence establishing the reliability and validity of the REGDS, including internal consistency, test-retest reliability, criterion (known-groups) validity, and concurrent validity.
Keywords: minority groups, prejudice, racial discrimination, cross-cultural differences, racial/ethnic populations, psychometrics, test construction
1. Introduction
Minority groups exist in almost every country in the world, including the Maoris in New Zealand, the Kurds in Iraq, the Zhuang in China, the Harijans in India, the Basque in Spain, and Blacks in South Africa (Bornman, 1999; Hutnik, 1991; McCool, Du Toit, & Petty, 2006; Tajfel, 1978; Verkuyten & Yildiz, 2006). Majority/minority group distinctions are likely to become increasingly important as international migration patterns and globalization bring more and more racial/ethnic groups into contact (Hutnik, 1991; Sidanius & Pratto, 1999; Spencer-Rodgers, Tong, & Liao, 2012). These sociological trends also highlight the importance of examining the construct of racial/ethnic group disadvantage from a cross-cultural and international perspective. Within social, counseling, and other branches of psychology, there has been burgeoning interest in the correlates of racial/ethnic group disadvantage among individuals in diverse societies (Atkinson, Morten, & Sue, 1983; Crocker, Major, & Steele, 1998; Kaiser & Wilkins, 2010; Major, Gramzow, McCoy, Levin, Schmader, & Sidanius, 2002; Phinney, 1996). Scholars have examined the psychosocial antecedents and outcomes associated with racial/ethnic group discrimination in various countries (Cross & Vandiver, 2001; Hutnik, 1991; Spencer-Rodgers et al., 2012), and have proposed numerous theoretical models of racial/ethnic minority identity development (e.g., Atkinson et al., 1983; Cross, 1991; Sellers, Smith, Shelton, Rowley, & Chavous, 1998). However, most of these theoretical models are limited to one racial/ethnic group and cannot be used in a variety of geographical contexts.
The purpose of the present research was to develop a brief measure of racial/ethnic group disadvantage for use with multiple groups in diverse geographical contexts. In the next section, we summarize previous research on the construct of racial/ethnic group disadvantage. Then, we present data on the reliability and validity of the Racial/Ethnic Group Disadvantage Scale (REGDS).

www.ccsenet.org/ijps International Journal of Psychological Studies Vol. 5, No. 2; 2013
40
1.1 Racial/Ethnic Group Disadvantage
A number of definitions of racial/ethnic group disadvantage have been proposed by psychologists, sociologists, and other social scientists (Allport, 1954; Greene, Way, & Pahl, 2006; Hutnik, 1991; Phinney, 1991; Spencer-Rodgers et al., 2012; Tajfel, 1978). A central component of the construct concerns the political and economic position of one’s group with respect to other groups in society: racial/ethnic minorities are allocated a smaller share of the political power and material resources in society, per capita, than are racial/ethnic majorities (Phinney, 1996; Sidanius & Pratto, 1999; Tajfel, 1978). A second component pertains to the many social consequences of belonging to a group that is devalued by the majority community. Racial/ethnic minorities experience significant prejudice and discrimination at the hands of a majority group (Allport, 1954; Angel & Angel, 2006; Sidanius & Pratto, 1999; Tajfel, 1978). According to Hutnik (1991), minority group members are individuals who are connected to similar others by a common history, culture, and fate, and by collective experiences of exploitation and oppression.
1.2 Group Disadvantage and Racial/Ethnic Identity Scales
There exists in the literature a multitude of theoretical models, scales, and assessment tools tailored to the examination of perceptions of prejudice and racial/ethnic identity. These scales assess the multiple facets of the construct under investigation, but many are limited in that they focus on only one racial/ethnic group in one context. For example, a scale based on Nigrescence Theory, now known as Cross’s Revised Racial Identity Model (CRIS; Cross & Vandiver, 2001), has been shown to be both valid and reliable (Vandiver, Cross Jr., Worrel, & Fhagon-Smith, 2002; Vandiver, Fhagen-Smith, Cokley, Cross Jr., & Worrel, 2001). Furthermore, the CRIS is related to “internalized racism” and perceptions of prejudice (Cokley, 2002). However, the CRIS is limited in its generalizability because the theoretical model on which it was built focuses exclusively on the African American population within the United States. Several measures, such as the Scale of Ethnic Experiences (SEE; Malcarne, Chavira, Fernandez, & Liu, 2006) and the Perceived Ethnic Discrimination Questionnaire-Community Version (PEDQ-CF; Brondolo, Kelly, Coakley, Gordon, Thompson, et al., 2005), were designed for use with multiple racial/ethnic groups. However, these instruments also are limited in that they focus on participants’ experiences in the United States or modern Western societies. For example, factors 2 and 3 of the SEE assess Perceived Discrimination and Mainstream Comfort. Thus, the SEE is psychometrically sound when assessing the perceptions of a variety of racial/ethnic group members, but only when used with American minority groups.
Some scales originally developed for specific racial/ethnic groups have been adapted for use with other groups and cultures. For example, based on their rejection-identification model, Branscombe, Schmitt and Harvey (1999) designed a scale to examine the effects of perceived discrimination on psychological well-being. Their instrument, originally developed for use with an African American population, was later used by Schmitt, Spears and Branscombe (2003) to investigate the effects of perceived discrimination on psychological well-being in an international student population. Another study investigated the same effects among immigrants in Finland (Jasinskaja-Lahti, Liebkind, & Perhoniemi, 2006). However, in both cases, the measures are limited by their focus on one aspect of discrimination: the perception of rejection and psychological exclusion by the majority group. They do not measure other facets of group disadvantage, including perceptions of reduced political power and material resources in society, and collective experiences of exploitation and oppression.
Thus, the principal goal of this research was to develop a brief measure of perceived racial/ethnic group disadvantage for use across racial/ethnic groups in diverse geographical contexts. Specifically, the REGDS was designed to measure the extent to which individuals believe that their racial/ethnic group has lower social status, fewer economic resources, and less political power than other racial/ethnic groups in society, combined with collective experiences of discrimination, social exclusion, and negative stereotyping.
1.3 Preliminary Studies
1.3.1 Item Development
Items for the REGDS were developed based on our theoretical conceptualization of the construct, consultation with international experts, and a comprehensive review of the minority identity, racial prejudice, and social stigma literatures. From an initial pool of 14 items, 7 were selected for inclusion in the scale based on exploratory factor analyses with multiple participant samples recruited at the University of California, Berkeley. The students completed the scale items as part of the Dept. of Psychology’s prescreening mass-testing sessions and received course credit for their participation. The largest sample (N = 326) consisted of: 54% Asian American, 21% European American, 12% Latino American, 3% African American, and 10% Other (<1% unreported). Fifty-eight percent of the sample was female. Exploratory factor analysis (maximum likelihood with

www.ccsenet.org/ijps International Journal of Psychological Studies Vol. 5, No. 2; 2013
41
promax rotation) was conducted. A scree test (Cattell, 1966) indicated one strong factor. The item loadings ranged from .70 to .81, and the factor explained 62% of the variance. The 7 items are presented in Appendix 1.
1.3.2 Test-Retest Reliability
The REGDS was administered twice over a 4-week interval to a separate sample of Asian and White undergraduate students (N = 43) at UC Berkeley and the University of Victoria. The students volunteered to complete the scale at the end of their regularly scheduled classroom periods. The test-retest reliability was .77 for those who identified as Asian and .79 for those who identified as White.
1.4 Study 1
1.4.1 Overview
In Study 1, racial/ethnic group disadvantage was examined among individuals from a total of 57 countries. Two participant groups were compared and contrasted: a large group of American college students and a smaller group of international students residing in the United States. International students enable us to examine racial/ethnic group disadvantage among individuals from diverse national and cultural backgrounds. International students also share similar challenges and difficulties in adjusting to American society (Spencer-Rodgers, 2001). For example, international students of color report experiencing substantial prejudice and discrimination on the basis of race/ethnicity in the United States (Paige, 1990; Pedersen, 1991; Schmitt, Spears, & Branscombe, 2003).
To examine the factor structure of the scale, confirmatory factor analyses were conducted across the various groups. To investigate the criterion (know-groups) validity of the scale, we examined group-level differences in racial/ethnic group disadvantage. Because African Americans and Latinos experience greater discrimination and possess lower socioeconomic status (SES) than do Asian and European Americans (Kaiser & Wilkins, 2010; Phinney, 1996; Vega & Rumbaut, 1991), we predicted that the former two groups would report higher scores on the REGDS than would the latter two groups. We expected to find parallel differences among international students (i.e., those who self-identified as Latino would report higher scores than those who self-identified as Asian). Although international students of color are likely to identify as majority group members in their home country, as a result of experiences with discrimination in the United Sates, they may come to identify as members of a minority group in the host country (Schmitt, Spears, & Branscombe, 2003). We hypothesized that international students of color would report higher scores on the scale the longer they had lived in the United States.
To investigate the concurrent validity of the scale, we examined the intercorrelations between the REGDS and conceptually similar constructs. We predicted that the REGDS would be correlated (but not too highly correlated) with lower public regard (i.e., the perception that others value one’s racial/ethnic group; Luhtanen & Crocker, 1992), lower socioeconomic status, and stronger racial/ethnic identity (i.e., racial/ethnic centrality, group attachment, and private regard). Given the longstanding interest in minority self-worth (for a review, see Spencer-Rodgers et al., 2012), we also examined whether the REGDS predicted lower self-esteem across the various racial/ethnic groups.
2. Method
2.1 Participant Characteristics
2.1.1 International Students
The international participants were undergraduate and graduate students (132 women; 124 men; 4 unreported) at two West coast universities. They were citizens of 56 countries (e.g., China, Japan, Mexico, France, Brazil, Nigeria, etc.). The students ranged in age from 18 to 52 (M = 22.7), and 162 self-identified as Asian, 64 as White, 34 as Latino, 11 as Black, 8 as Other (e.g., East Indian, Asian/Caucasian, etc.), and 5 unreported (note 1). The participants’ fathers’ highest level of education served as an approximate indicator of socioeconomic status: 12% (some high school or less), 21% (high school graduate), 38% (college graduate), and 29% (advanced degree).
2.1.2 American Students
The American participants (N = 1036) were undergraduate and graduate students (655 women; 371 men; 10 unreported) enrolled at two West coast universities. The participants ranged in age from 18 to 47 (M = 20.3), and 409 self-identified as Asian, 267 as White, 180 as Latino, 113 as Black, 67 as Other (14 unreported). The participants’ fathers’ educational attainment was as follows: 14% (some high school or less), 28% (high school graduate), 29% (college graduate) and 29% (advanced degree).

www.ccsenet.org/ijps International Journal of Psychological Studies Vol. 5, No. 2; 2013
42
2.2 Procedures
Most of the international (84%) and American students (93%) participated for psychology course credit. A number of (mostly Latino) students also were recruited from Spanish language and literature classes. Latino and African American students were over-sampled in order to increase their representation in the sample. The study was described as concerning the “psychology of group membership.” When completing the group measures, the international participants were instructed to think about their racial group “within the context of the United States.” Testing sessions were conducted over 3 semesters and were administered by a multiracial group of research assistants.
2.3 Measures
All of the items on the following scales were rated on a 7-point scale, ranging from 1 (not at all) to 7 (very much) (note 2).
Racial/ethnic group disadvantage. Participants rated the 7 items that appear in Appendix 1. Cronbach’s alphas were reasonably high in all of the groups. In the international sample, Cronbach’s alphas were as follows: Asians, .78, Whites, .78, and Latinos, .83. In the American sample, Cronbach’s alphas were: Asians, .84, Whites, .83, Latinos, .89, and Blacks, .79.
Racial centrality. Importance of race to the self-concept (Luhtanen & Crocker, 1992) was assessed with 4 items. Sample items include: (a) “Being a member of my racial group is an important part of my self-image” and (b) “Being a member of my racial group has very little to do with how I feel about myself” (reverse-scored). In the international sample, Cronbach’s alphas were: Asians, .80, Whites, .78, and Latinos, .68. In the American sample, Cronbach’s alphas were: Asians, .78, Whites, .77, Latinos, .81, and Blacks, .73.
Private regard. Personal attitudes towards one’s racial group (Luhtanen & Crocker, 1992) were measured with 4 items, including: (a) “I feel good about the racial group I belong to” and (b) “I often regret that I belong to my racial group” (reverse-scored). In the international sample, Cronbach’s alphas were: Asians, .78, Whites, .71, and Latinos, .74. In the American sample, Cronbach’s alphas were: Asians, .80, Whites, .74, Latinos, .69, and Blacks, .72.
Group attachment. Attachment to one’s racial group (Spencer-Rodgers & Collins, 2006) was assessed with 4 items: (a) “I feel a common bond or connection with other members of my racial group,” (b) “I feel emotionally attached to other members of my racial group,” (c) “I feel separate or independent from other members of my racial group” (reverse-scored), and (d) “I identify with other members of my racial group.” In the international sample, Cronbach’s alphas were: Asians, .81, Whites, .72, and Latinos, .56. In the American sample, Cronbach’s alphas were: Asians, .84, Whites, .72, Latinos, .83, and Blacks, .83.
Public regard. Perceived public attitudes towards one’s racial group (Luhtanen & Crocker, 1992) was assessed with 4 items. A sample item includes: “My racial group is considered to be good by other people.” In the international sample, Cronbach’s alphas were: Asians, .71, Whites, .69, and Latinos, .51. In the American sample, Cronbach’s alphas were: Asians, .70, Whites, .69, Latinos, .76, and Blacks, .79.
Self-esteem. Self-esteem was assessed with the 10-item Rosenberg Self-Esteem Scale (RSES; Rosenberg, 1979). In the international sample, Cronbach’s alphas were: Asians, .85, Whites, .82, and Latinos, .80. In the American sample, Cronbach’s alphas were: Asians, .87, Whites, .87, Latinos, .84, and Blacks, .83.
3. Results
3.1 Confirmatory Factor Analyses
As indicated in Table 1, confirmatory factor analyses were conducted among the international and American participants, separately. Analyses also were conducted among each of the 4 racial/ethnic groups, separately (note 3).

www.ccsenet.org/ijps International Journal of Psychological Studies Vol. 5, No. 2; 2013
43
Table 1. Confirmatory factor analyses of the racial/ethnic group disadvantage scale (regds) by type of participant and racial/ethnic category membership
N 2 df p GFI CFI NFI TLI
International students 260 27.0 11 .001 .97 .98 .96 .96
American students 1036 294.5 11 .001 .92 .95 .95 .90
Asians 571 46.4 11 .001 .98 .98 .97 .96
Latinos 214 29.6 11 .001 .96 .98 .96 .95
Blacks 113 48.7 11 .001 .88 .87 .85 .75
Whites 331 147.8 11 .001 .89 .85 .84 .71
Note. 2 = Chi-square goodness-of-fit index, df = Degrees of freedom, GFI = Goodness-of-fit index, CFI = Comparative-fit-index, NFI = Normed fit index, TLI = Tucker Lewis coefficient.
The models were tested using the Amos structural equation modeling program (Arbuckle & Wothke, 1999). Assessment of model fit was based on 5 indices: the chi-square goodness-of-fit index, the Comparative-Fit Index (CFI, Bentler, 1990), the Goodness-of-Fit Index (GFI, Jöreskog & Sörbom, 1984), the Normed-Fit Index (NFI, Bentler & Bonett, 1980), and the Tucker-Lewis Coefficient (TLI, Bentler & Bonnett, 1980). A non-significant chi-square goodness-of-fit is considered desirable. However, when samples sizes are large, a trivial discrepancy between the observed and estimated variance-covariance matrices can result in a significant chi-square statistic. Values of about .90 are considered acceptable, and .95 (or higher) are considered very good, for the other indices (Arbuckle & Wothke, 1999; Bentler & Bonnett, 1980; Marsh, Hau, & Wen, 2004). With the exception of Whites (N = 331) and Blacks (N = 113) (note 4), the fit-indices suggest that a one-factor model yielded adequate fit to the data. Following Byrne (2001), the model we tested included 3 correlated error terms (between items 1 and 2, 3 and 4, and 5 and 6) (note 5). Table 2 presents the factor loadings and uniquenesses (error terms) by type of participant and racial/ethnic category membership.
Table 2. Factor loadings (standardized regression weights) and uniquenesses (unstandardized variances) by type of participant and racial/ethnic category membership
International (N=260)
American (N=1036)
Asians (N=571)
Latinos (N=214)
Blacks (N=113)
Whites (N=331)
FL Uni FL Uni FL Uni FL Uni FL Uni FL Uni
Item 1
.63 2.2 .81 1.4 .56 1.5 .67 1.1 .45 0.4 .62 1.9
Item 2
.66 1.7 .72 1.5 .66 1.3 .65 1.0 .49 0.6 .71 1.8
Item 3
.75 1.0 .69 1.5 .76 0.9 .74 1.1 .55 2.0 .72 1.3
Item 4
.81 0.8 .81 1.1 .78 0.7 .78 1.1 .73 0.6 .80 0.9
Item 5
.54 2.3 .81 1.5 .51 1.8 .65 1.5 .59 0.9 .36 1.0
Item 6
.63 1.5 .84 1.2 .56 1.5 .79 1.0 .67 0.9 .49 0.8
Item7 .43 2.9 .79 1.6 .45 2.1 .70 1.4 .71 0.9 .39 1.8
Note. FL = factor loading, Uni = uniqueness, unstandardized variance.
3.2 Criterion (Known-Groups) Validity
A three-way ANOVA was performed on the REGDS using gender, type of participant (international vs. American), and racial/ethnic category membership as the factors. There was no main effect of gender and no
www.ccsenet.org/ijps International Journal of Psychological Studies Vol. 5, No. 2; 2013
44
interactions involving gender. Hence, all further analyses combined women and men.
There was a main effect of type of participant, F(1, 1288) = 22.80, p < .001, a main effect of racial/ethnic category membership, F(4, 1288) = 210.53, p < .001, and a type of participant x racial/ethnic category membership interaction, F(2, 1288) = 10.13, p < .001.
To explore the interaction, we examined the simple effect of racial/ethnic category membership within the international and American samples, separately. This effect was significant in the international sample, F(2, 257) = 43.61, p < .001. Post-hoc multiple comparisons (using the Games Howell statistic for unequal cell sizes) revealed that Latinos (M = 4.31) reported higher scores on the REGDS than did Asians (M = 3.68), who in turn, reported higher scores than did Whites (M = 2.46) (note 6). The simple effect of racial/ethnic category membership was also significant in the American sample, F(4, 1031) = 333.80, p < .001. Blacks (M = 5.96) reported higher scores than did Latinos (M = 5.31), who in turn, reported higher scores than did Asians (M = 4.04) and others (M = 3.76). The latter two groups reported higher scores than did Whites (M = 2.36).
In addition, we examined the simple effect of type of participant (international vs. American) among each of the racial/ethnic groups. Asian Americans reported higher scores on the REGDS than did Asian internationals, F(1, 569) = 13.92, p < .001. Likewise, Latino Americans possessed higher scores than did Latino internationals, F(1, 212) = 21.93, p < .001. White Americans and White internationals did not differ significantly, F<1.
3.3 Concurrent Validity
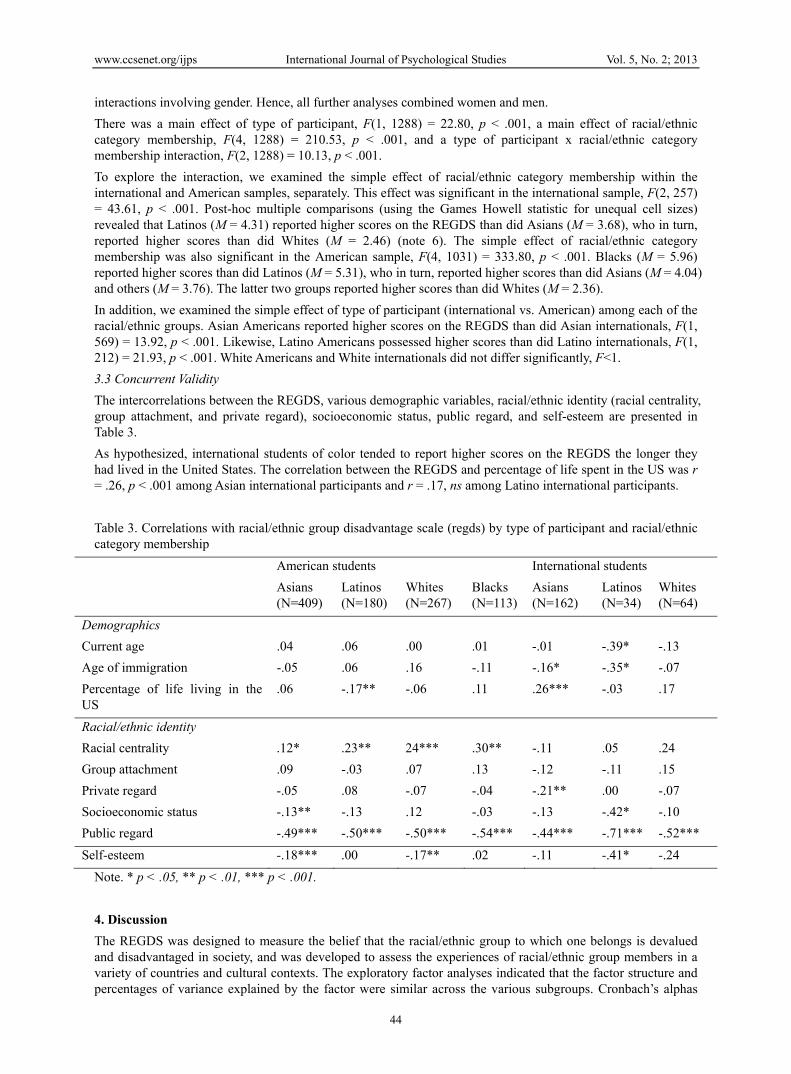
The intercorrelations between the REGDS, various demographic variables, racial/ethnic identity (racial centrality, group attachment, and private regard), socioeconomic status, public regard, and self-esteem are presented in Table 3.
As hypothesized, international students of color tended to report higher scores on the REGDS the longer they had lived in the United States. The correlation between the REGDS and percentage of life spent in the US was r = .26, p < .001 among Asian international participants and r = .17, ns among Latino international participants.
Table 3. Correlations with racial/ethnic group disadvantage scale (regds) by type of participant and racial/ethnic category membership
American students International students
Asians (N=409)
Latinos (N=180)
Whites (N=267)
Blacks (N=113)
Asians (N=162)
Latinos (N=34)
Whites (N=64)
Demographics
Current age .04 .06 .00 .01 -.01 -.39* -.13
Age of immigration -.05 .06 .16 -.11 -.16* -.35* -.07
Percentage of life living in the US
.06 -.17** -.06 .11 .26*** -.03 .17
Racial/ethnic identity
Racial centrality .12* .23** 24*** .30** -.11 .05 .24
Group attachment .09 -.03 .07 .13 -.12 -.11 .15
Private regard -.05 .08 -.07 -.04 -.21** .00 -.07
Socioeconomic status -.13** -.13 .12 -.03 -.13 -.42* -.10
Public regard -.49*** -.50*** -.50*** -.54*** -.44*** -.71*** -.52***
Self-esteem -.18*** .00 -.17** .02 -.11 -.41* -.24
Note. * p < .05, ** p < .01, *** p < .001.
4. Discussion
The REGDS was designed to measure the belief that the racial/ethnic group to which one belongs is devalued and disadvantaged in society, and was developed to assess the experiences of racial/ethnic group members in a variety of countries and cultural contexts. The exploratory factor analyses indicated that the factor structure and percentages of variance explained by the factor were similar across the various subgroups. Cronbach’s alphas

www.ccsenet.org/ijps International Journal of Psychological Studies Vol. 5, No. 2; 2013
45
were reasonably high and consistent across the international and American participants and different racial/ethnic groups. The confirmatory factor analyses further showed that a one-factor model yielded adequate fit to the data in most of the subgroups. Taken together, these findings suggest that the REGDS is consistent and reliable across a variety of groups.
To investigate the criterion (known-groups) validity of the scale, we examined group-level differences on the measure. In accordance with well-documented status differences found among racial/ethnic groups in the United States (Major et al., 2002; Kaiser & Wilkins, 2010; Vega & Rumbaut, 1991), African Americans reported higher scores than did Latinos, who in turn, reported higher scores than did Asian Americans. Asian Americans and individuals of mixed racial/ethnic heritage possessed higher scores than did European Americans. Among international students, group-level differences in perceived group disadvantage paralleled those in the US sample. It is noteworthy that societal differences in levels of prejudice and political/socioeconomic disadvantage were perceived by the American and international participants themselves. Although some scholars have argued that minority group members minimize or deny discrimination and disadvantage (for reviews, see Crocker et al., 1998; Kaiser & Wilkins, 2010), consistent with Major et al. (2002), we found that perceptions of group disadvantage corresponded with objective group-level differences in society.
When we compared international and American participants, we found that international students of color reported lower scores on the REGDS than did American students of color, although they tended to report higher scores on the scale the longer they had lived in the United States. International students who study in the US are likely to arrive to the host country as majority-identified individuals. As a result of cross-cultural transition, acculturation, and experiences with negative stereotyping and discrimination (Paige, 1990; Pedersen, 1991; Spencer-Rodgers & McGovern, 2002), many international students of color experience a shift from majority to minority identity along racial/ethnic lines. Eventually, they come to identify as members of a minority group in the United States (Schmitt et al., 2003). A number of factors influence cross-cultural minority identity development, including one’s length of residence in the host country, one’s residency plans (e.g., to remain in the US vs. return to the home country), and personal experiences with prejudice and discrimination, among others. The development of a minority identity through cross-cultural transition may have important implications for the psychosocial adjustment of international students.
To examine the concurrent validity of the scale, we compared participants’ responses on the REGDS with conceptually similar constructs (note 7). The pattern of correlations presented in Table 3 shows that the REGDS was correlated (but not too highly) with public regard and socioeconomic status. For example, the correlations between the REGDS and SES were generally negative, with higher SES participants perceiving somewhat less racial/ethnic group disadvantage. For three of the racial/ethnic groups, perceptions of group disadvantage were related to lower self-esteem, a point that we return to later in the General Discussion.
5. Study 2
To further examine the concurrent validity of the REGDS, we conducted a second study with an American minority group. Perceptions of discrimination, assessed with scales designed specifically for use with Asian Americans, generally are correlated with lower wellbeing (Lee & Ahn, 2011). A recent meta-analysis of 24 studies with Asian Americans revealed an effect size of r = .23 (SE = .03, Z = 9.40, p < .01) between perceived discrimination and psychological distress (Lee & Ahn, 2011). Hence, we predicted that the REGDS would be significantly correlated with lower life satisfaction, less positive affect, and greater negative affect in a sample of Asian American college students.
5.1 Method
5.1.1 Participants and Procedures
Asian American participants (N = 88; Mage = 19.8, SDage = 1.5) at UC Berkeley completed the REGDS as part of a larger study on culture and well-being. (Participants in Study 2 were independent of those in Study 1). Sixty-five percent of the participants were women. The participants’ father’s education attainment served as an approximate indicator of socioeconomic status. The frequency distribution of this variable was as follows: 17% (some high school or less), 34% (high school graduate), 22% (college graduate), and 27% (advanced degree). Forty-eight percent of the sample was foreign-born (Mean age of immigration = 5.2, SD = 6.6 years). The students received course credit in a psychology course for taking part in the study. The study sessions were conducted by a multiracial group of research assistants.
5.1.2 Measures
All of the items on the following scales were rated on a 7-point scale, ranging from 1 (not at all) to 7 (very

www.ccsenet.org/ijps International Journal of Psychological Studies Vol. 5, No. 2; 2013
46
much).
Racial/ethnic group disadvantage. Participants rated the 7 items that appear in Appendix 1. A principal components analysis (with varimax rotation) was conducted. All 7 items had adequate factor loadings (> .44) and formed a unidimensional scale that explained 45% of the variance. Cronbach’s alpha was .78.
Life satisfaction. Satisfaction with one’s life was assessed with the 5-item Satisfaction with Life Scale (Diener, Emmons, Larsen, & Griffin, 1985). Cronbach’s alpha was .80.
Positive and negative affect. Participants completed a modified version of the Positive and Negative Affect Schedule (Watson, Clark, & Tellegen, 1988). They indicated the extent to which they felt 11 positive emotions (e.g., happy, proud) and 11 negative emotions (e.g., angry, distressed). Cronbach’s alpha for positive affect was .92 and for negative affect .93.
5.2 Results and Discussion
Socioeconomic status was negatively correlated with scores on the REGDS (r = -.25, p < .05), such that Asian American participants with higher socioeconomic status perceived less racial/ethnic group disadvantage. However, the REGDS was not significantly correlated with gender, current age, age of immigration, or nativity status (0 = Unites States born, 1 = foreign born). These findings are consistent with the results of Study 1, in which socioeconomic status was negative related to perceived racial/ethnic group disadvantage, but no other demographic variables, among Asian Americans.
As hypothesized, the REGDS was associated with lower life satisfaction (r = -.26, p < .05), less positive affect (r = -w.23, p < .05), and greater negative affect (r = .23, p < .05). Likewise, in Study 1, we found that the REGDS was associated with lower self-esteem (r = -.18, p < .001) among Asian Americans. Taken together, these results are similar to those obtained with ethnic-group specific instruments designed to assess Asian Americans’ experiences with racism (Lee & Ahn, 2011) and provide further evidence of the concurrent validity of the REGDS.
6. General Discussion
The central purpose of this research was to present a conceptual and empirical analysis of racial/ethnic group disadvantage. We developed a brief 7-item scale that assesses group disadvantage for use with multiple groups in different contexts. The REGDS measures the extent to which individuals believe that their racial/ethnic group has lower social status, fewer economic resources, and less political power than other racial/ethnic groups in society, combined with collective experiences of discrimination, social exclusion, and negative stereotyping. The preliminary and main studies indicate that the REGDS is reliable and valid (i.e., with respect to internal consistency, test-retest reliability, criterion validity, and concurrent validity).
6.1 Perceptions of Racial/Ethnic Group Disadvantage
Despite the traditional emphasis placed on group size as the principal determinant of majority/minority status, numerical factors alone do not account for the minority group experience (Angel & Angel, 2006; Phinney, 1996; Smith, 1991; Wagley & Harris, 1958; Way & Pahl, 2006). Rather, majority/minority distinctions are largely determined by group differences in social status, political power, and economic resources. Minority group members are individuals who possess one or more distinctive physical, cultural, or behavioral attributes (such as race, language, religious and cultural practices, etc.) that differentiate them from the majority community. These distinguishing attributes are generally held in low regard by the dominant segments of society, and become the basis for unfair treatment, social derogation, and marginalization.
Racial/ethnic group disadvantage can be distinguished from similar constructs, such as social stigma (Crocker et al., 1998; Major, 2006; Pinel & Paulin, 2005) however, in that racial/ethnic group disadvantage is associated with an explicit group identity. Minority groups are “self-conscious units” that are of relatively long duration (Tajfel, 1978); they possess well-defined intergroup boundaries and distinctive group norms, values, and customs. Minority group membership also implies significant differences in political power and access to societal resources, such as education, health care, and housing (Hutnik, 1991, Major et al., 2002; Smith, 1991). Due to past or present economic exploitation, minority group members are socioeconomically disadvantaged relative to the majority community. Racial/ethnic minority group members also confront cultural deprivation and must struggle to preserve those cultural values, norms, and customs that differ from those of the dominant segments of society (Verkuyten & Lay, 1998).
Research on racial/ethnic group disadvantage, racial/ethnic identity, socioeconomic status, culture, and acculturation are sometimes confounded in the literature (Betancourt & Lopez, 1993). Studies that focus on

www.ccsenet.org/ijps International Journal of Psychological Studies Vol. 5, No. 2; 2013
47
perceived group disadvantage, separate from related constructs, might provide insight into a number of psychological phenomena. For instance, East Asian minority group members in the United States, Canada, and several Western European nations sometimes report lower levels of self-esteem and psychological well-being than do majority group members in those countries (for a review, see Spencer-Rodgers et al., 2012). Although scholars frequently attribute these group-level differences to perceptions of prejudice and minority status, they may be due to a host of other factors, including cultural variables (e.g., interdependent self-construals; Markus & Kityama, 1991) and acculturative stress (e.g., Betancourt & Lopez, 1993; Phinney, 1996). Measures that differentiate racial/ethnic group disadvantage from related constructs are needed in order to examine their independent effects, and possible interaction, on various psychological variables. The REGDS may be a useful tool for this purpose. Furthermore, existing scales are limited with respect to the groups and/or contexts in which they can be used (see Vandiver et al., 2001; Vandiver et al., 2002). The REGDS can be used not only to measure perceptions of group disadvantage among a variety of racial/ethnic groups in one country/context, but in various countries and geographical contexts.
6.2 Limitations and Future Directions
The present research examined perceptions of group disadvantage among a broad range of racial/ethnic groups. Although we included a diverse sample of international students in Study 1 (from 56 countries), the perceptions of all of these students were based on their experiences in the United States. Studies with racial/ethnic minority groups in other countries would be beneficial. In addition, the REGDS was administered in English in both studies. Further research is needed on the measurement invariance of translated versions of the scale.
Although the present research focused on the perceptions of racial/ethnic group members, group-based disadvantage may derive from a number of other demographic factors. Scholars have long argued that race is critical to majority/minority distinctions (Allport, 1954; Tajfel, 1978; Wagley & Harris, 1958). For example, social dominance theory (Sidanius & Pratto, 1999) posits that group-based hierarchies have existed throughout history in all human civilizations and that social differentiation occurs primarily and pervasively along racial lines. As a result of international migration, most countries today are characterized by the presence of racial/ethnic minority groups (Spencer-Rodgers et al., 2012). Nevertheless, in some nations and geographical regions (e.g., Northern Ireland), social status, political power, and economic resources may be structurally distributed according to other demographic factors, such as religion or language, and race may not figure as prominently in majority/minority societal divisions (Cairns, 1989; Hutnik, 1991).
Less theoretical and empirical research has examined perceived group disadvantage as a general psychological construct, distinct from race/ethnicity. Group disadvantage may derive from one’s religion (e.g., Catholics in Northern Ireland) or language (e.g., the French-Quebecois in Canada), among others. Moreover, within a given context, an individual may hold several compatible and even competing identities. For example, a Caucasian Jewish woman in the United States might feel that she belongs to a majority group by virtue of her race and a minority group on the basis of her religion. Psychology would benefit from more general models of minority identity, its development, and its antecedents and consequences.
Acknowledgments
Preparation of this manuscript was supported by a Cher Wang and Wenchi Chen grant and the American Association of University Women (AAUW American Fellowship awarded to the first author). We wish to thank Antonio Cortijo, Adelaida Cortijo, Tammy English, and Jim Gibson for their assistance with the data collection and Susannah B. Paletz for her valuable comments on an earlier draft of this paper.
References
Allport, G. (1954). The nature of prejudice. Cambridge, MA: Addison-Wesley.
Angel, J., & Angel, R. (2006). Minority group status and healthful aging: Social structure still matters. American Journal of Public Health, 96(7), 1152-1159. http://dx.doi.org/10.2105/AJPH.2006.085530
Arbuckle, J., & Wothke, W. (1999). AMOS 4.0 User’s guide. Chicago: SmallWaters.
Atkinson, D., Morten, G., & Sue, D. (1983). A minority identity development model. In D. Atkinson, G. Morten, & D. Sue (Eds.), Counseling American minorities (pp. 35-52). Dubuque: William Brown.
Bentler, P. (1990). Comparative fit indices in structural models. Psychological Bulletin, 197, 238-246. http://dx.doi.org/10.1037/0033-2909.107.2.238
Bentler, P., & Bonett, D. (1980). Significance tests and goodness of fit in the analysis of covariance structures. Psychological Bulletin, 88, 588-606. http://dx.doi.org/10.1037/0033-2909.88.3.588

www.ccsenet.org/ijps International Journal of Psychological Studies Vol. 5, No. 2; 2013
48
Betancourt, H., & Lopez, S. (1993). The study of culture, ethnicity, and race in American psychology. American Psychologist, 48, 629-637. http://dx.doi.org/10.1037/0003-066X.48.6.629
Bornman, E. (1999). Self-image and ethnic identification in South Africa. Journal of Social Psychology, 139, 411-425. http://dx.doi.org/10.1080/00224549909598401
Branscombe, N., Schmitt, M., & Harvey, R. (1999). Perceiving pervasive discrimination among African Americans: Implications for group identification and well-being. Journal of Personality & Social Psychology, 77, 135-149. http://dx.doi.org/10.1037/0022-3514.77.1.135
Brondolo, E., Kelly, K. P., Coakley, V., Gordon, T., Thompson, S., Levy, E., Cassells, A., & Tobin, J. N. (2005). The Perceived Ethnic Discrimination Questionnaire: Development and preliminary validation of a community version. Journal of Applied Social Psychology, 35(2), 335-365. http://dx.doi.org/10.1111/j.1559-1816.2005.tb02124.x
Byrne, B. M. (2001). Structural equation modeling with AMOS: Basic concepts, applications, and programming. Mahwah, NJ: Erlbaum.
Cairns, E. (1989). Social class, psychological well-being and minority status in Northern Ireland. International Journal of Social Psychiatry, 35, 231-236. http://dx.doi.org/10.1177/002076408903500303
Cattell, R. (1966). The scree test for the number of factors. Multivariate Behavioral Research, 1, 246-276. http://dx.doi.org/10.1207/s15327906mbr0102_10
Cokley, K. (2002).Testing Cross’s Revised Racial Identity Model: An examination of the relationship between racial identity and internalized racism. Journal of Counseling Psychology, 49(4), 476-483. http://dx.doi.org/10.1037/0022-0167.49.4.476
Crocker, J., & Major, B. (1989). Social stigma and self-esteem: The self-protective properties of stigma. Psychological Review, 96, 608-630. http://dx.doi.org/10.1037/0033-295X.96.4.608
Crocker, J., Major, B., & Steele, C. (1998). Social stigma. In D. T. Gilbert, & S. T. Fiske (Eds.), The handbook of social psychology: Vol. 2 (4th ed., pp. 504-553). Boston: McGraw-Hill.
Cross, W. (1991). Shades of Black: Diversity in African-American identity. Philadelphia: Temple University Press.
Cross, W., & Vandiver, B. J. (2001). Nigrescence theory and measurement: Introducing the Cross Racial Identity Scale (CRIS). In J. G. Ponterotto, J. M. Casas, L. A. Suzuki, & C. M. Alexander (Eds.), Handbook of multicultural counseling (2nd ed., pp. 371-393). Thousand Oaks, CA: Sage.
Diener, E., Emmons, R., Larsen, J., & Griffin, S. (1985). The Satisfaction with Life Scale. Journal of Personality Assessment, 49, 71-75. http://dx.doi.org/10.1207/s15327752jpa4901_13
Greene, M., Way, N., & Pahl, K. (2006). Trajectories of perceived adult and peer discrimination among Black, Latino, and Asian American adolescents: Patterns and psychological correlates. Developmental Psychology, 42(2), 218-238. http://dx.doi.org/10.1037/0012-1649.42.2.218
Hutnik, N. (1991). Ethnic minority identity: A social psychological perspective. Oxford University Press.
Jasinskaja-Lahti, I., Liebkind, K., & Perhoniemi, R. (2006). Perceived discrimination and well-being: A victim study of different immigrant groups. Journal of Community and Applied Social Psychology, 16, 267-284. http://dx.doi.org/10.1002/casp.865
Jöreskog, D., & Sörbom, D. (1984). LISREL VI. Mooresville, IN: Scientific Software.
Kaiser, C. R., & Wilkins, C. (2010). Group identification and prejudice: Theoretical and empirical advances and implications. Journal of Social Issues, 66, 461-476. http://dx.doi.org/10.1111/j.1540-4560.2010.01656.x
Lee, D. L., & Ahn, S. (2011). Racial discrimination and Asian mental health: A meta-analysis. The counseling psychologist, 39(3), 463-489. http://dx.doi.org/10.1177/0011000010381791
Luhtanen, R., & Crocker, J. (1992). A collective self-esteem scale: Self-evaluation of one’s social identity. Personality and Social Psychology Bulletin, 18, 302-318. http://dx.doi.org/10.1177/0146167292183006
Malcarne, V. L., Chavira, D. A., Fernandez, S., & Liu, P. (2006). The Scale of Ethnic Experience: Development and psychometric properties. Journal of Personality Assessment, 86(2), 150-161. http://dx.doi.org/10.1207/s15327752jpa8602_04
Major, B. (2006). New perspectives on social stigma and psychological well-being. In S. Levin, & C. van Laar
www.ccsenet.org/ijps International Journal of Psychological Studies Vol. 5, No. 2; 2013
49
(Eds.), Stigma and group inequality: Social psychological perspectives (pp. 193-210). Mahwah, NJ: Lawrence Erlbaum.
Major, B., Gramzow, R., McCoy, S., Levin, S., Schmader, T., & Sidanius, J. (2002). Perceiving personal discrimination: The role of group status and legitimizing ideologies. Journal of Personality and Social Psychology, 82, 269-282. http://dx.doi.org/10.1037/0022-3514.82.3.269
Major, B., Quinton, W., McCoy, S., & Schmader, T. (2000). Reducing prejudice: The target's perspective. In S. Oskamp (Ed.), Reducing prejudice and discrimination (pp. 211-237). New Jersey: Erlbaum.
Marsh, H. W., Hau, K. T., & Wen, Z. (2004). In search of golden rules: Comment on hypothesis-testing approaches to setting cutoff values for fit indexes and dangers in overgeneralizing Hu and Bentler’s (1999) findings. Structural Equation Modeling, 11, 320-341. http://dx.doi.org/10.1207/s15328007sem1103_2
McCool, A., Du Toit, F., & Petty, C. (2006). The impact of a program of prejudice-reduction seminars in South Africa. Journal of Applied Social Psychology, 36(3), 586-613. http://dx.doi.org/10.1111/j.0021-9029.2006.00020.x
McGuire, W. J., McGuire, C. V., Child, P., & Fujioka, T. (1978). Salience of ethnicity in the spontaneous self-concept as a function of one’s ethnic distinctiveness in the social environment. Journal of Personality and Social Psychology, 36, 511-520. http://dx.doi.org/10.1037/0022-3514.36.5.511
Paige, R. M. (1990). International students: Cross-cultural psychological perspectives. In R. W. Brislin (Ed.), Applied cross-cultural psychology: Cross-cultural research and methodology series: Vol. 14 (pp. 367-382). Newbury Park: Sage.
Pedersen, P. B. (1991). Counseling international students. Counseling Psychologist, 19, 10-58. http://dx.doi.org/10.1177/0011000091191002
Phinney, J. (1991). Ethnic identity and self-esteem: A review and integration. Hispanic Journal of Behavioral Science, 13, 193-208. http://dx.doi.org/10.1177/07399863910132005
Phinney, J. (1996). When we talk about American ethnic groups, what do we mean? American Psychologist, 51, 918-927. http://dx.doi.org/10.1037/0003-066X.51.9.918
Pinel, E., & Paulin, N. (2005). Stigma consciousness at work. Basic and Applied Social Psychology, 27(4), 345-352. http://dx.doi.org/10.1207/s15324834basp2704_7
Rosenberg, M. (1965). Society and the adolescent self-image. Princeton University Press.
Rowley, S., Sellers, R., Chavous, T. M., & Smith, M. A. (1998). The relationship between racial identity and self-esteem in African American college and high school students. Journal of Personality and Social Psychology, 74, 715-724. http://dx.doi.org/10.1037/0022-3514.74.3.715
Schmitt, M. T., Spears, R., & Branscombe N. R. (2003). Constructing a minority identity out of shared rejection: The case of international students. European Journal of Social Psychology, 33, 1-12. http://dx.doi.org/10.1002/ejsp.131
Sellers, R., Smith, M. A., Shelton, J., Rowley, S., & Chavous, T. M. (1998). Multidimensional model of racial identity: A reconceptualization of African American racial identity. Personality and Social Psychology Review, 2, 18-39. http://dx.doi.org/10.1207/s15327957pspr0201_2
Sidanius, J., & Pratto, F. (1999). Social dominance: An intergroup theory of social hierarchy and oppression. Cambridge University Press. http://dx.doi.org/10.1017/CBO9781139175043
Smith, E. J. (1991). Ethnic identity development: Toward the development of a theory within the context of majority/minority status. Journal of Counseling & Development, 70, 181-187. http://dx.doi.org/10.1002/j.1556-6676.1991.tb01581.x
Spencer-Rodgers, J. (2000). The vocational situation and country of orientation of international students. Journal of Multicultural Counseling and Development, 21, 63-72.
Spencer-Rodgers, J., & Collins, N. L. (2006). Risk and resilience: Dual effects of perceptions of group disadvantage among Latinos. Journal of Experimental Social Psychology, 42, 729-737. http://dx.doi.org/10.1016/j.jesp.2005.10.009
Spencer-Rodgers, J., & McGovern, T. (2002). Attitudes toward the culturally different: The role of intercultural communication barriers, consensual stereotyping, affective responses, and perceived threat. International Journal of Intercultural Relations, 26, 608-630. http://dx.doi.org/10.1016/S0147-1767(02)00038-X

www.ccsenet.org/ijps International Journal of Psychological Studies Vol. 5, No. 2; 2013
50
Spencer-Rodgers, J., Tong, J., & Liao, J. (2012). Perceptions of discrimination and the self-concept: Psychological and physiological evidence. In K. Gana (Ed.), Psychology of self-concept. Hauppauge, NY: Nova Science Publishers.
Tajfel, H. (1978). The social psychology of minorities. London: Minority Rights Group.
Tajfel, H., & Turner, J. C. (1986). The social identity theory of intergroup behavior. In W. Austin, & S. Worchel (Eds.), The social psychology of intergroup relations (pp. 7-24). Monterey: Brooks/Cole.
Taylor, D. M., Wright, S. C., Moghaddam, F. M., & Lalonde, R. N. (1990). The personal/group discrimination discrepancy: Perceiving my group, but not myself, to be a target for discrimination. Personality and Social Psychology Bulletin, 16, 254-262. http://dx.doi.org/10.1177/0146167290162006
Turner, J. C. (1987). Rediscovering the social group: A self-categorization theory. New York: Blackwell.
Vandiver, B. J., Cross, W. E. Jr., Worrell, F. C., & Fhagen-Smith, P. E. (2002). Validating the Cross Racial Identity Scale. Journal of Counseling Psychology, 49(1), 71-85. http://dx.doi.org/10.1037/0022-0167.49.1.71
Vandiver, B. J., Fhagen-Smith, P. E., Cokley, K. O., Cross, W. E. Jr., & Worrell, F. C. (2001). Cross’s Nigrescence Model: From Theory to Scale to Theory. Journal of Multicultural Counseling and Development, 29, 174-200. http://dx.doi.org/10.1002/j.2161-1912.2001.tb00516.x
Vega, W., & Rumbaut, R. (1991). Ethnic minorities and mental health. Annual Review of Sociology, 17, 351-383. http://dx.doi.org/10.1146/annurev.so.17.080191.002031
Verkuyten, M., & Lay, C. (1998). Ethnic minority identity and psychological well-being: The mediating role of collective self-esteem. Journal of Applied Social Psychology, 28, 1969-1986. http://dx.doi.org/10.1111/j.1559-1816.1998.tb01356.x
Verkuyten, M., & Yildiz, A. (2006). The endorsement of minority rights: The role of group position, national context, and ideological beliefs. Political Psychology, 27(4), 527-548. http://dx.doi.org/10.1111/j.1467-9221.2006.00525.x
Wagley, C., & Harris, M. (1958). Minorities in the new world: Six case studies. Columbia University Press.
Watson, D., Clark, L. A., & Tellegen, A. (1988). Development and validation of brief measures of positive and negative affect: The PANAS scales. Journal of Personality and Social Psychology, 54, 1063-1070. http://dx.doi.org/10.1037/0022-3514.54.6.1063
Notes
Note 1. Racial/ethnic category membership was assessed using an open-ended and a forced-choice item. Although it is problematic to employ American group labels with international students (Paige, 1990), it was necessary to include this item for purposes of comparison. The categories Asian, White, Latino, and Black were used to maintain consistency across the international and US samples. Pretesting indicated that the international participants had some prior knowledge of these labels or had gained familiarity with them in the US.
Note 2. All of the measures were pretested with a small group of international students (total N = 16) who provided written and verbal feedback on the scales. Pretesting indicated that a unipolar response format (e.g., not at all – very much) was simpler to use than a bipolar format (e.g., strongly disagree – strongly agree).
Note 3. For the racial/ethnic group analyses, we collapsed across type of participant. Otherwise, the samples sizes would have been too small (e.g., Latino internationals N = 34).
Note 4. The lack of model fit among Whites is not all that surprising given that Whites are majority group members in the United States, and the scale was designed for use with minority group members.
Note 5. Three correlated errors were hypothesized, a priori, as the item pairs were strongly conceptually related and/or very similar in phraseology (items 5 and 6).
Note 6. Because their numbers were so few, Blacks and others were not included in these analyses.
Note 7. As discussed previously, the REGDS was not compared to a number of other scales, such as the CRIS and SEE, because the target populations and reference groups are not compatible. For example, we could not compare the REGDS with the CRIS because the target population (African Americans) is different. We could not, for similar reasons, compare the REGDS to the SEE, as the latter focuses exclusively on the experiences of people in the United States.

www.ccsenet.org/ijps International Journal of Psychological Studies Vol. 5, No. 2; 2013
51
Appendix 1
Racial/Ethnic Group Disadvantage Scale (REGDS)
1. Historically, my racial/ethnic group has been discriminated against by other racial/ethnic groups.
2. Members of my racial/ethnic group are negatively stereotyped by other racial/ethnic groups.
3. My racial/ethnic group is socially excluded (rejected or left out) by other racial/ethnic groups.
4. My racial/ethnic group is treated unfairly by other racial/ethnic groups.
5. My racial/ethnic group has fewer economic resources than other racial/ethnic groups.
6. My racial/ethnic group has lower social status than other racial/ethnic groups.
7. My racial/ethnic group has fewer political resources than other racial/ethnic groups
Note. The scale may be modified by using the terms racial group or ethnic group.