Racial Harassment, Ethnic Concentration and Economic Conditions
40
! " #$ % &" &’() * + +,, - &
-
Upload
independent -
Category
Documents
-
view
4 -
download
0
Transcript of Racial Harassment, Ethnic Concentration and Economic Conditions
���������������� �������������������������
���������������������������������������������������������������� �!������"��������������#�$�� �%
��������&�����"����
��&�'�� () *
�
������������������ ������������������
�����������������������
� ����������������+��������+�,,��������-���&������
�
���������������� �������������������������
�������������������������������������������������������� ������!�"����#�
$���� ����%��&��'�())�*�+,��-.-/�0111�2��������%��&��'�())�*�+,��-/".�,--0
����������� ����������������
�
������������ ������ ���� � ������ �
�� ���� ������ ����� �
������� ������ ��� �� ��� �!!������� ��"� ������ ��
3����������������� ��������������������������������������������������4��5�������������� ������
�
33������ ������������ ���������������������������������� �������������������������
�� #$�� �����!�����
!�������6��� ������������&��7���������������������������������������������������������������� ���������������������� ������������ ��������8������������������� �� �� ��9�!�� �������� � � �� ���������� ��� ������ ��������� ���� � �� �����6������ �����������������������5�����5�����������������������������������������5������������ �9�!����5������������7��:�� ����&�����������������������;������� ��������������������������������������� �������9�<������������� ����������������&�� � ������� ������� ������������������&� �5����9�<��� ����� ������ ���� � �� ����� �%�����������5�������� ������������������� ��4=������ ��"/1"�����"//"�4=�����9�
Racial Harassment, Ethnic Concentration and
Economic Conditions ∗
Christian Dustmann ‡ Francesca Fabbri† Ian Preston ‡
September 2004
Abstract
We analyze the association between ethnic concentration of minorities and local economic
conditions on the one side, and racial harassment and hostile majority attitudes on the
other. We distinguish the formation of hostile attitudes and the realization of acts of racially
motivated violence as distinct processes and find strong evidence for this. We develop a
framework that subsumes and structures many existing theories on attitude formation and
acts of harassment. Our measures of harassment include both direct reports and precau-
tionary behavior. Our data sources are the fourth National Survey of Ethnic Minorities for
the UK and the 1981 and 1991 UK Census.
Key Words: Attitudes, Economics of Minorities
JEL Classification: J15, R23.
∗Francesca Fabbri gratefully acknowledges support from the Frederick Bonnart-Braunthal scholarship.
We are grateful to James Nazroo and Richard Berthoud for assistance with data.†Munich Graduate School of Economics and CReAM, University College London, Department of
Economics.‡University College London, Department of Economics, Gower Street, London WC1E 6BT, Institute
for Fiscal Studies, 7 Ridgmount Street, London WC1E 7AE and CReAM.
1
1 Introduction
Acts of intimidation and harassment aimed at ethnic minority individuals are common
throughout the industrialized world. Such interracial conflict creates high immediate so-
cial costs, and discourages long term integration. It often manifests itself through social
exclusion and deterioration of welfare of the ethnic groups subjected to it (for instance,
see Karlsen and Nazroo, 2003, who report evidence on the positive association between
racism and ill-health and psychological distress). Indeed hostile attitudes of any form
towards minorities, even if they do not manifest themselves in acts of intimidation, may
seriously affect the process of social and economic integration of immigrant minorities
and their offsprings. Not only is harassment directly harmful to individual wellbeing
but by inhibiting social and economic interaction it also limits possibilities for economic
betterment of minorities. Not surprisingly, maintenance of good ethnic relations and
fostering understanding between race groups is a prime objective of race relations and
immigration policies. The persistence of racial harassment experienced by the result-
ing minority communities and hostility in attitudes towards minorities is nonetheless a
continuing problem.1
Key questions for social scientific enquiry are the isolation of the determinants of
hostile attitudes, and the circumstances under which racial harassment occurs. Below we
summarize existing theory and seek to set it within a framework distinguishing different
components of the processes generating harassment.
Much of our empirical analysis (as well as the existing empirical work on attitude
formation, and racial violence) concentrates on the relationship between ethnic concen-
tration in a particular neighborhood, and acts of racial harassment. It is important to
recognize the complexity of this relationship. Firstly, ethnic context affects the probability
of minority individuals meeting majority individuals. Secondly, it affects the attitudes of
the majority population. Thirdly, it affects the probability of hostility finding expression
1See a recent report for the British Home Office (Statistics on Race and the Criminal Justice System
2000) and reports by Park, Curtice, Thomson, Jarvis and Bromley (2003), Bowling (1998) and Virdee
(1995, 1997) for evidence.
2
in acts of racial harassment.
In order to distinguish clearly between hostility in attitudes and acts of harassment
and violence, we emphasize the distinction between the processes, allowing nonetheless
that hostile white attitudes may be one input feeding into the harassment process, but
recognizing that white hostility and harassment may be related to ethnic concentration
in a different way. Our work therefore constitutes empirical inquiry into ”prejudiced
conduct” as opposed to ”prejudice” in the sense encouraged by Green, McFalls and Smith
(2001). Our empirical findings support the significance of the distinction. The likelihood
of a minority individual being harassed is found to decline with local ethnic concentration
but to be aggravated by poor economic conditions. By contrast, expressions of attitudinal
prejudice amongst white respondents are found to increase with local ethnic concentration
(at least at low levels) whereas no effect can be detected from economic conditions.
Our data includes not only direct reports on frequency of experienced harassment
but also evidence on precautionary behavior in response to harassment. Precautions
taken on the side of the minority individual for fears of harassment and intimidation offer
an alternative indicator of the intensity of harassment. Furthermore this may be more
closely related to the welfare impact than a simple count of harassment incidents since
these precautions are costly and therefore unlikely to be undertaken unless the harassment
which they are designed to avoid is itself seriously harmful. Precautionary activity may
seriously undermine life quality, with detrimental effects on the minority individual and
his/her family’s welfare. Precautionary behavior in a particular neighborhood may be a
consequence of expected racial harassment in that same neighborhood, but may also be
driven by other factors affecting the costliness of the precautions. To understand which are
the driving forces of precautionary behavior is a key prerequisite for implementing policies
that improve the situation of minorities. Here it is important whether improvements in
the individual’s immediate neighborhood lead to abolishing self-imposed restrictions on
the behavior of minority individuals.
We base our empirical investigation on the British Fourth National Survey on Ethnic
Minorities (FNSEM), which has been collected between 1993 and 1994. This survey
3
contains a ”boost” sample of ethnic minorities and a random sample of white natives,
and provides a wide range of socioeconomic information on respondents. In addition, the
FNSEM contains specific information on different forms of racial harassment and abuse
experienced by ethnic minorities. The FNSEM also contains information on how ethnic
minority individuals take precautions, and change some of their habits as a response to
racial harassment. Finally, the survey contains information on self-reported prejudice of
white majority individuals. Our key explanatory variable is ethnic concentration in the
respondent’s neighborhood, which we measure on the level of small geographical units,
where information is obtained from the 1991 British Census.
Our results can be contrasted with those using data from other countries. Green,
Strolovich and Wong (1998) investigate the incidence of racially motivated crime in the
US and its relationship with in-migration of minorities as well as economic conditions.
They find a link to in-movements of nonwhites into “white strongholds” whereas our
results for the UK point to association with levels rather than changes. They find little
evidence of any link between hate crime and local economic conditions whereas we do
find an association, though not one evident in white attitudes. In this respect our results
contrast also with the US evidence in Green, Glaser and Rich (1998). Krueger and Pischke
(1997) investigate the link between crime against minorities and ethnic concentration
for Germany, which experienced a fast and large inflow of ethnic Germans from former
Eastern countries and refugees from the former Yugoslavia in the 1990s. Their evidence
suggests that high concentrations of minorities in areas of Germany have caused a rise in
hostility and criminal acts against minorities.
The structure of the paper is as follows. In the next section, we discuss some theo-
ries that explain racial conflict and attitude formation, and briefly review some stylized
facts on racial conflict in the UK. We then structure this discussion into a formal model
encapsulating features of the main theories. Next, we develop the empirical model that
we use for estimation, and discuss identification. We then introduce the data. Finally, we
present the results, and provide a discussion in the last section.
4
2 Theories
Harassment occurs when there is a meeting between an ethnic minority individual and a
prejudiced white person who chooses to harass. There are therefore three elements to such
events: the hostility, the meeting and the decision to express hostility aggressively. We can
theorize fruitfully about each of these aspects, drawing on papers in this literature that
review different theories on the formation of racial harassment or racial prejudice. Green,
Strolovich and Wong (1998), for example, provide a useful categorization of theories which
we draw on below. We restrict our discussion here to the essential features of some of
these models and their empirical implications, and refer the reader to the literature for
more details.
Hostile attitudes
The first element, the formation of hostile attitudes towards other ethnic groups, is the
subject of a very large theoretical literature. A distinction is frequently drawn (Le Vine
and Campbell 1972, Quillian 1995) between sociopsychological theories positing individual
origins and societal theories of group conflict.
Theories of the former type concentrate on the displacement of aggressive frustrated
impulses onto external groups. Since such hostile impulses are greatest where the envi-
ronment is most frustrating (Le Vine and Campbell, p.124), this is commonly supposed
to provide grounds to expect an association between interracial hostility and adverse
economic conditions (Dollard, Doob, Miller, Mowrer and Sears 1939, Hovland and Sears
1940, Green, Glaser and Rich 1998). Since ethnic minority numbers increase their salience
as potential objects of displaced aggression there may also be reason to expect an asso-
ciation between minority concentration and aggression, though the form in which this
relationship might be expected is far from clear.
Theories of the latter type emphasize group conflict as at the heart of patterns of
hostility. Realistic group conflict theory suggests that racial prejudices derive from “a
threat to real resources and accepted practices” of the majority population posed by
minorities (Blumer 1958, Bobo, 1983). The power-threat hypothesis (Blalock 1967, Tolnay,
5
Beck and Massey 1989) says that intolerance in the white majority population is due
to minorities being seen as competitors for either the economic or political power of the
majority population. The level of intolerance will increase as this distance is threatened by
growing concentration of ethnic minorities, suggesting therefore an increasing relationship
between racial prejudice or racism, and ethnic minority concentration.
In linking racial prejudice to the competition for scarce resources, group conflict the-
ories come closest to economic explanations for prejudice and opposition towards immi-
gration. These economic theories are based on equilibrium models that predict adverse
effects for groups that compete most intensively with newcomers in the local labor mar-
ket. Scheve and Slaughter (1999), Gang, Rivera-Batiz and Yun (2002), Mayda (2003)
and Dustmann and Preston (2004) among others analyze the determinants of individual
preferences over immigration policies in the US and Europe respectively. In these papers,
an empirical association between labor market status and attitudes is established and in
some papers argued to be consistent with a determining role for labor market competition.
In essence this approach suggests hostility which is not so much related to the ethnicity
of the minority population as to the threat any newcomers impose to sharing of resources
perceived as finite, as well as to social and political hegemony. It predicts higher sensitiv-
ity of the majority population towards any threats of economic and political hegemony in
times and at places where competition for economic resources is most intense. Empirical
implications are that indicators that reflect economic hardship at a geographical level
should be positively correlated with the intensity of prejudice, or acts of harassment.
It is not only economic competition however that can establish grounds of interracial
hostility, but also the broader collective threat to their established social and political
prerogatives that the majority population perceives as coming from the minority popula-
tion . According to the theory of defended neighborhoods (Suttles 1972, Green, Strolovich
and Wong 1998), hostility to ethnic minorities is based on a fear of loss of social iden-
tity. Residents in ethnically homogeneous neighborhoods are hypothesized to define their
identity through the exclusion of other ethnic groups. Racism and racial harassment are
according to this theory highest in areas where one ethnicity has been dominant for a
6
long time but suddenly experiences inflows of a new group or is threatened by encroach-
ment. This hypothesis suggests that it may be the change in ethnic composition that is
a catalyst for racist prejudice and action.
Such processes may be moderated by induced population flows. As ethnic minority
density increases, some whites adapt to integration, whereas the most hostile individuals
may leave the neighborhood after their attempts to stop the minority inflow fail. This
latter phenomenon - so-called “white flight” - may accelerate as ethnic density reaches
a “tipping-point” (Clark, 1993) giving rise to nonlinearities in the relationship between
ethnic balance and indicators of hostility.
Racial prejudices are sustained by acceptance of stereotyping and misrepresentation of
minority practices and characteristics. The contact hypothesis draws attention to the role
of social contact with minorities in undermining such prejudice (Pettigrew 1998, Powers
and Ellison 1995). Since the frequency of such contact increases with minority concen-
tration this may provide a countervailing force through which higher minority density
reduces hostility. As Kinder and Mendelberg (1995, p.404) put it, such a view “sees racial
isolation not as a safe haven for liberal tolerance but as a depository for prejudice and
ignorance”.
Interaction
These ideas all offer useful insight into the determination of attitudes in the majority
community. However, the existence of hostility towards minorities does not necessitate
the incidence of harassment.
For harassment to occur, it is necessary that majority and minority individuals come
into contact. Blau (1977, 1994) points out that, other things being equal, the frequency
with which ethnic minority individuals encounter whites decreases as ethnic minority con-
centration increases in an area, meaning that there are less opportunities for harassment
to occur. For a fixed level of prejudice, the probability of a minority individual experienc-
ing harassment should therefore decline as the size of the minority community increases.
“Members of smaller groups are more likely than those of larger ones to be involved - as
7
victims or malefactors - in intergroup conflict (Blau 1994, p.40).”
There is good reason to think interaction may not be random. The frequency with
which minorities visit locations where they are likely to encounter whites may well be
affected by expected levels of prejudice. Also, while, on the one hand, weak racists may
avoid areas where they are likely to meet ethnic minorities, on the other hand, extreme
racists within the majority community may seek out opportunities for confrontation.
Local social characteristics also affect the nature and intensity of social practices which
bring different ethnic communities into contact. We use below several regressors that
describe aspects of the neighborhood that may be important, including unemployment,
percentage of highly educated individuals, and car usage.
Aggression
Finally, harassment requires that prejudice find violent or aggressive expression. Intensity
of hostility presumably predisposes majority individuals towards harassment and to that
extent the theories discussed above may also serve as theories of harassment. Harass-
ment, however, is not simply a more extreme form of prejudice but a particular mode of
manifestation. As Green, Strolovich and Wong (1998, p.398) put it: “The observed link
between racial composition and racially motivated crime may be due to the ways in which
prejudice is mobilized by demographic composition and change.” For any given level of
hostility in white attitudes, the likelihood of this translating into harassment may itself
depend upon the circumstances of the encounter and the characteristics of the potential
perpetrator and victim. Specifically, the tendency to harass, as a conscious choice of the
harasser, may be expected to depend not only on strength of the desire to harass but also
on the costliness of harassment to the perpetrator and on the availability of substitute
forms of expression, as suggested by the literature on economics of other forms of crime
(see Becker, 1968).
The power-differential hypothesis (Green, Strolovich and Wong 1998, Levin and McDe-
vitt 1993) points out that minorities can protect themselves better in neighborhoods at
high ethnic density and therefore white perpetrators will fear more in terms of reprisal
8
or punishment. This suggests there may be “safety in numbers” for minority individuals
who may be less likely to suffer harassment, albeit that white hostility may be greater in
areas of higher density.
Economic conditions may also be relevant in this respect. The likelihood that whites
choose to express hostility through harassment may also depend upon the availability of
other means of releasing dissatisfaction. More affluent, more articulate and more educated
whites may, for example, be less inclined to resort to violent expression of discontent
against minorities.
Summary
All these hypotheses point to a possible link between ethnic concentration on the one
hand, and expressions of racial intolerance on the other, and it is this link which has been
most extensively explored in previous work. To briefly summarize the main implications,
theories where competition for scarce resources underlies the conflict between minorities
and majorities (group threat theories) predict a positive correlation between concentration
of minorities and hostile attitudes, which may result in acts of racial violence. These
theories also predict that conflict is harsher the more intense the competition for resources,
i.e. the more unfavorable are the economic conditions. The defended neighborhood
hypothesis suggests that both the level and the change in minority concentration should
matter to racial aggression. It is the sudden increase in minority concentration in areas
previously unexposed to minorities which leads most strongly to conflict. Out-migration of
the most aggressive individuals may lead nonetheless to a turning point in the relationship
with increasing minority density.
Focus on processes of interaction predicts by contrast a decrease in exposure to harass-
ment with increasing ethnic concentration as the probability of encountering individuals
from other communities diminishes. The power differential hypothesis also comes to such
a conclusion . Here racial aggression decreases with concentration as majorities find it
harder to harass in areas where they may have to fear reprisal. The contact hypoth-
esis comes to similar conclusions, but here it is ignorance that creates aggression, and
9
enhanced knowledge by contact that reduces aggression.
The theories also provide clear grounds to postulate links to economic conditions,
both in influence on attitude formation and in the translation of such attitudes into acts
of harassment. The typical prediction here is that poor economic conditions aggravate
conflict both by generating frustration in the majority community which can be displaced
into interracial aggression and by sharpening intergroup competition for resources.
These theories are not exclusive, pointing as they do to effects which can coexist. To
the extent that predictions are unambiguous and uncontested by the predictions of other
theories they can be tested but where theories suggest counteracting effects we can aim
only to estimate the balance between them.
3 Ethnic Concentration and Harassment
In this section we set out a model of the mechanism behind the relationship between
ethnic composition and racial harassment at a local level. Our analysis will not explicitly
attempt to test one of the above mentioned theories against another; we believe that each
of these hypotheses contributes in some way to explain racial aggression. We will however
develop a model that subsumes, and is motivated by a variety of theoretical explanations.
Our main aim is the estimation of an inclusive harassment equation capturing the
impact of individual and contextual variables through all channels, including influences
on precautionary activities, internal migration and so on. While it would be desirable
to separate effects arising through different channels it is not easy to think of plausible
restrictions allowing identification.
It is also unlikely that all individuals belonging to a minority population are equally
affected by racially motivated aggression. Individual-specific features may explain a lot
of variation in being victimized. For instance, male minority individuals may be more or
less exposed to racial harassment than females, as a consequence either of the attitudes
of potential harassers or of differences in the social and occupational situation of the
potentially harassed.
Our approach tries to take account of some of these issues. We define for each potential
10
victim i a rate of arrival of harassment incidents λi, which is the product of the probability
of meeting a white racist µi and the probability of that person choosing to harass or insult
νi given the encounter. Both these probabilities depend in principle on individual specific
characteristics, as well as the local minority concentration, and the change in the local
minority concentration, both through the impact on white attitudes and directly.
More formally,
λi = µiνi (1)
µi = f(Aj(i), πj(i), ∆πj(i), Xi, Zj(i), ni) (2)
νi = g(Aj(i), πj(i), ∆πj(i), Xi, Zj(i), ni) (3)
⇒ λi = h(Aj(i), πj(i), ∆πj(i), Xi, Zj(i), ni) (4)
where j(i) is the area in which the ith individual lives, Aj is the hostility in attitude of
white individuals towards minorities in the jth area, πj is the concentration of ethnic
minorities in the jth area and ∆πj is the change in ethnic concentration in that area.
Other characteristics of the jth area are denoted by Zj, and Xi denotes other individual
characteristics. Finally, ni is the degree of precaution taken against meeting white racists.
Attitudes of white individuals in a particular area depend themselves on area charac-
teristics including πj:
Aj = F (πj, ∆πj(i), Zj) (5)
Notice that this formulation acknowledges different sources of racial aggression, as put
forward by above mentioned theories. Theories of interaction concentrate on the fact that
λi decreases with ethnic concentration because µi increases. The power threat hypothesis
is not explicit about µi, but predicts that νi increases with ethnic concentration. Similarly
the defended neighborhood hypothesis suggests that νi increases if the change in ethnic
concentration is large within a low concentration areas, but does not specifically concern
µi. Selective out-migration leads both µi and νi to decrease. Finally, the power differential
hypothesis, again, refers to νi rather than µi.
On the whole theories are quiet on the way minority individuals may react to perceived
threat from majorities. Precautionary behavior such as going out less frequently, making
11
the home safer and so on, is a decision which will be motivated both by the prevalence
of harassment in the area and personal circumstances and characteristics which make
harassment harmful,
ni = G(λi, Xi, Zj(i)) (6)
with ∂G/∂λ positive.
A partially reduced form for this system relates harassment and precaution jointly to
local characteristics, including local white attitudes, and personal circumstances
λi = L(Aj(i), πj(i), ∆πj(i), Xi, Zj(i)) (7)
ni = N(Aj(i), πj(i), ∆πj(i), Xi, Zj(i)). (8)
The fact that Aj(i), πj(i) and ∆πj(i) enter (6) only through λi implies cross-equation
(proportionality) restrictions on the way that these enter (7) and (8) which could be
tested with suitable data.
These equations pick up effects of ethnic context πj on harassment intensity given
white prejudice. However we can also substitute from (5) to develop a fully reduced form
capturing total dependence of harassment on πj incorporating its effect on white attitudes
λi = Λ(πj(i), ∆πj(i), Xi, Zj(i)) (9)
ni = H(πj(i), ∆πj(i), Xi, Zj(i)). (10)
Which of these we choose to estimate will depend upon the availability and reliability
of information on local attitudes of the white community.
Structural identification of (4) and (6) requires exclusion restrictions in the harass-
ment equation that are unlikely to be plausible. Characteristics which might encourage
precaution without affecting harassment propensities directly might be those which affect
the costliness to the victim of being harassed but in so far as these are observable by po-
tential harassers it is difficult to justify the exclusion required. Racism may, for instance,
encourage people to direct harassment at the most vulnerable.
Restrictions which might allow separation of effects through µi and through νi are
also difficult to imagine. Since several ambiguities have been identified in effects coming
12
through f(·) and through g(·) overall impact of white attitudes and of ethnic densities on
harassment are difficult to sign. 2
2We may worry about endogeneity of location choice j(i) if our interest is in identifying effects condi-
tional on fixed location. Moving house is after all one extreme form of precaution. This could motivate
instrumenting Aj(i) and πj(i) if suitable instruments exist but arguments for these tend to be tenuous.
We do not follow this route.
13
4 Empirical Implementation
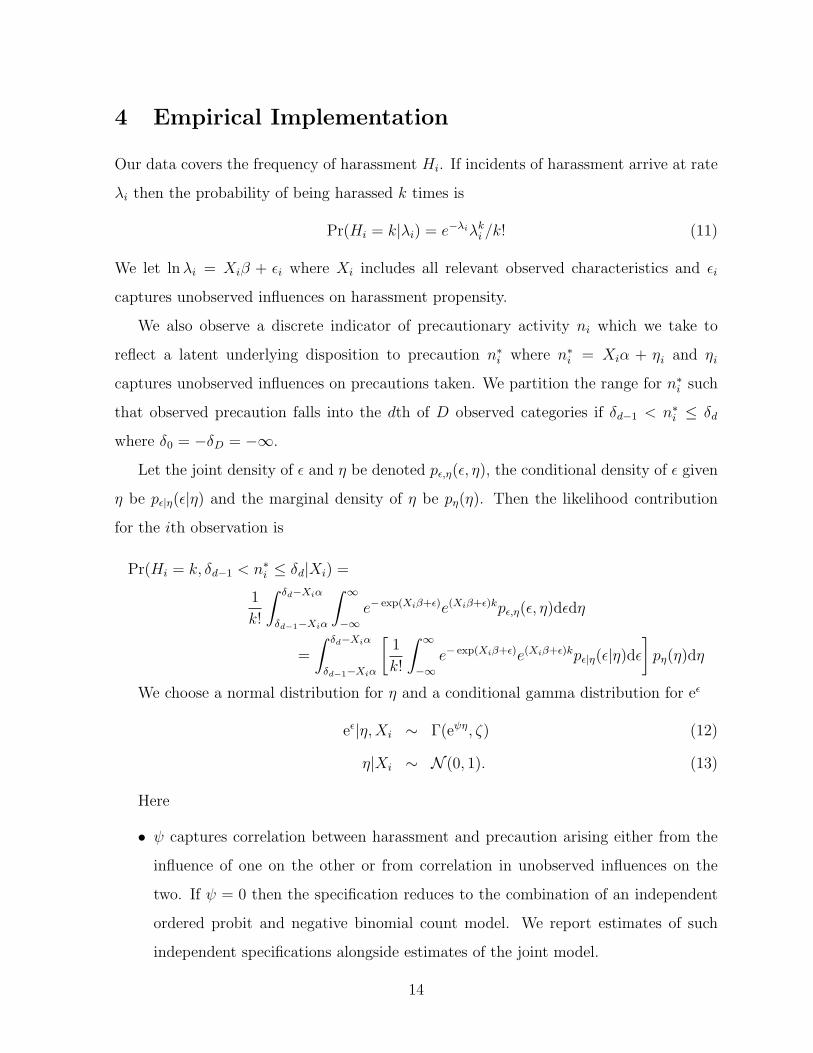
Our data covers the frequency of harassment Hi. If incidents of harassment arrive at rate
λi then the probability of being harassed k times is
Pr(Hi = k|λi) = e−λiλki /k! (11)
We let ln λi = Xiβ + εi where Xi includes all relevant observed characteristics and εi
captures unobserved influences on harassment propensity.
We also observe a discrete indicator of precautionary activity ni which we take to
reflect a latent underlying disposition to precaution n∗i where n∗i = Xiα + ηi and ηi
captures unobserved influences on precautions taken. We partition the range for n∗i such
that observed precaution falls into the dth of D observed categories if δd−1 < n∗i ≤ δd
where δ0 = −δD = −∞.
Let the joint density of ε and η be denoted pε,η(ε, η), the conditional density of ε given
η be pε|η(ε|η) and the marginal density of η be pη(η). Then the likelihood contribution
for the ith observation is
Pr(Hi = k, δd−1 < n∗i ≤ δd|Xi) =
1
k!
∫ δd−Xiα
δd−1−Xiα
∫ ∞
−∞e− exp(Xiβ+ε)e(Xiβ+ε)kpε,η(ε, η)dεdη
=
∫ δd−Xiα
δd−1−Xiα
[1
k!
∫ ∞
−∞e− exp(Xiβ+ε)e(Xiβ+ε)kpε|η(ε|η)dε
]pη(η)dη
We choose a normal distribution for η and a conditional gamma distribution for eε
eε|η, Xi ∼ Γ(eψη, ζ) (12)
η|Xi ∼ N (0, 1). (13)
Here
• ψ captures correlation between harassment and precaution arising either from the
influence of one on the other or from correlation in unobserved influences on the
two. If ψ = 0 then the specification reduces to the combination of an independent
ordered probit and negative binomial count model. We report estimates of such
independent specifications alongside estimates of the joint model.
14
• ζ allows for two things. Firstly it permits unobserved variation in harassment
propensity λi independent of precautionary behavior. Secondly it divorces the mean
and variance of the harassment process, allowing for “overdispersion” or “underdis-
persion” in the harassment equation relative to a Poisson model. As 1/ζ → 0 then
the specification reduces to one in which harassment follows a Poisson process with
unobservable influences perfectly correlated in the two latent specifications.
With the specification in (12) and (13) we can integrate to derive (see Cameron and
Trivedi 1996)
Pr(Hi = k, δd−1 < n∗i ≤ δd|Xi) =
∫ δd−Xiα
δd−1−Xiα
[Γ(k + ζ)
Γ(k + 1)Γ(ζ)
(ζ
ζ + Xiβ + ψη
)ζ (Xiβ + ψη
ζ + Xiβ + ψη
)k]
φ(η)dη (14)
This formula involves only a single integral which we compute numerically (by Gauss-
Legendre quadrature). In cases where precaution behavior is unrecorded we integrate
over the whole real line.
There are cross equation restrictions involving proportionality of coefficients on vari-
ables hypothesized to enter the precaution equation only through λi, namely those in-
volving white attitudes and ethnic density. We report unrestricted estimates but also
calculate χ2 tests of the restrictions by minimum distance methods.
Standard error calculations are made so as to be robust to geographical clustering in
the unobserved variation.
15
5 Data
The data we use for our analysis comes from the Fourth National Survey for Ethnic
Minorities (FNSEM). The FNSEM is a cross-section survey collected between 1993 and
1994. It consists of a main sample of respondents belonging to ethnic minorities, and a
reference sample of individuals belonging to the white majority population. In the survey,
59% of the ethnic minority sample was selected from wards where, according to the 1991
Census data, ethnic minorities represent at least 10 percent of the whole population.
About 38% were selected from areas with ethnic concentration between 1 and 5 percent
and the rest in areas with concentration of less than 1 percent. In contrast, the white
reference sample was a random sample in the population.
One section of the survey is dedicated to “victimization” experienced by ethnic minor-
ity individuals in the year previous to the interview. Various incidents are recorded, such
as personal attacks, property damage, and insult and whether the victim believed such
incidents were based on reasons of race or color. Furthermore, the white respondents’ sam-
ple contains a set of questions on self-reported prejudice towards different types of ethnic
minorities. These can be used to estimate the relationship between the average attitudes
surrounding ethnic minority individuals and the probability that they are harassed.
We base our estimations on the indicator of a milder form of harassment, whether
the respondent has been insulted “for reasons to do with race or color”. Information on
more serious forms of harassment is available only for less than half of the victimized
sub-sample and would heavily reduce sample size. Furthermore, the racial component in
an insult should be relatively straightforward to determine 3. Although less serious, the
incidence of such milder forms of harassment is more common than other forms and still
likely to have disruptive consequences on the degree of integration of minorities in the
society.
The data gives information both on whether or not the individual has been harassed
3The wording of the question in the survey is as follows: “In the last twelve months, has anyone
insulted you for reasons to do with race or color? By insulted, I mean verbally abused, threatened or
been a nuisance to you?”
16
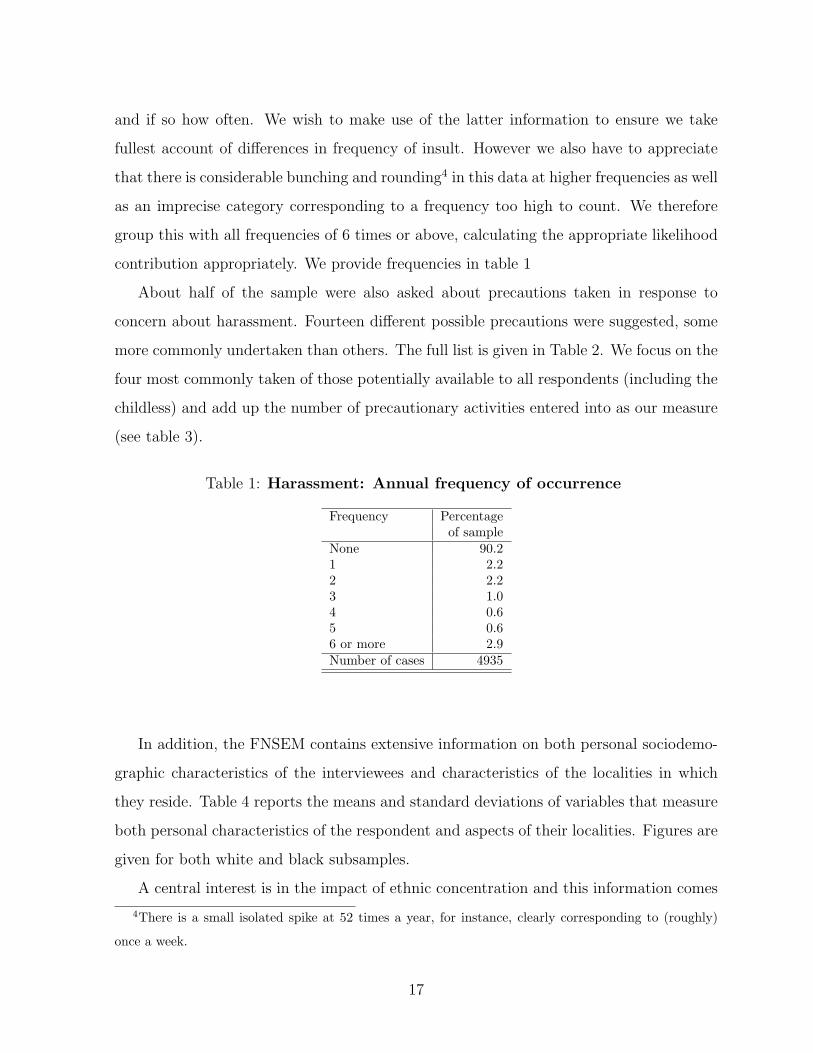
and if so how often. We wish to make use of the latter information to ensure we take
fullest account of differences in frequency of insult. However we also have to appreciate
that there is considerable bunching and rounding4 in this data at higher frequencies as well
as an imprecise category corresponding to a frequency too high to count. We therefore
group this with all frequencies of 6 times or above, calculating the appropriate likelihood
contribution appropriately. We provide frequencies in table 1
About half of the sample were also asked about precautions taken in response to
concern about harassment. Fourteen different possible precautions were suggested, some
more commonly undertaken than others. The full list is given in Table 2. We focus on the
four most commonly taken of those potentially available to all respondents (including the
childless) and add up the number of precautionary activities entered into as our measure
(see table 3).
Table 1: Harassment: Annual frequency of occurrence
Frequency Percentageof sample
None 90.21 2.22 2.23 1.04 0.65 0.66 or more 2.9Number of cases 4935
In addition, the FNSEM contains extensive information on both personal sociodemo-
graphic characteristics of the interviewees and characteristics of the localities in which
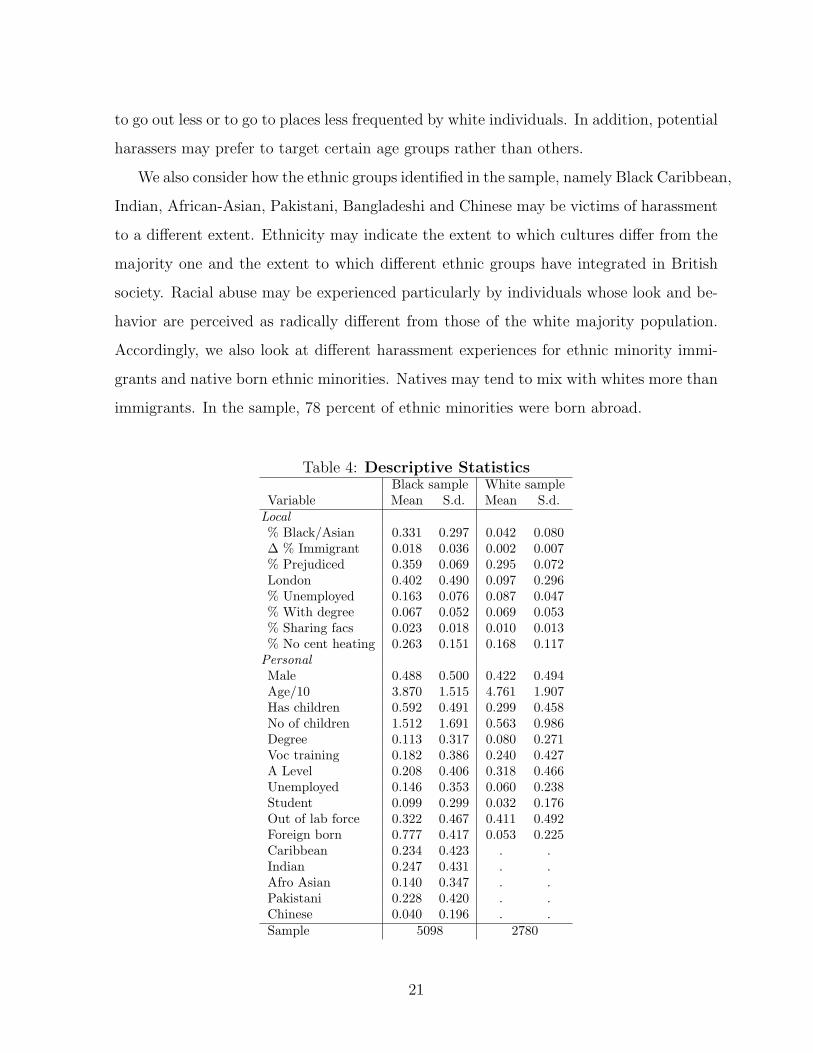
they reside. Table 4 reports the means and standard deviations of variables that measure
both personal characteristics of the respondent and aspects of their localities. Figures are
given for both white and black subsamples.
A central interest is in the impact of ethnic concentration and this information comes
4There is a small isolated spike at 52 times a year, for instance, clearly corresponding to (roughly)
once a week.
17
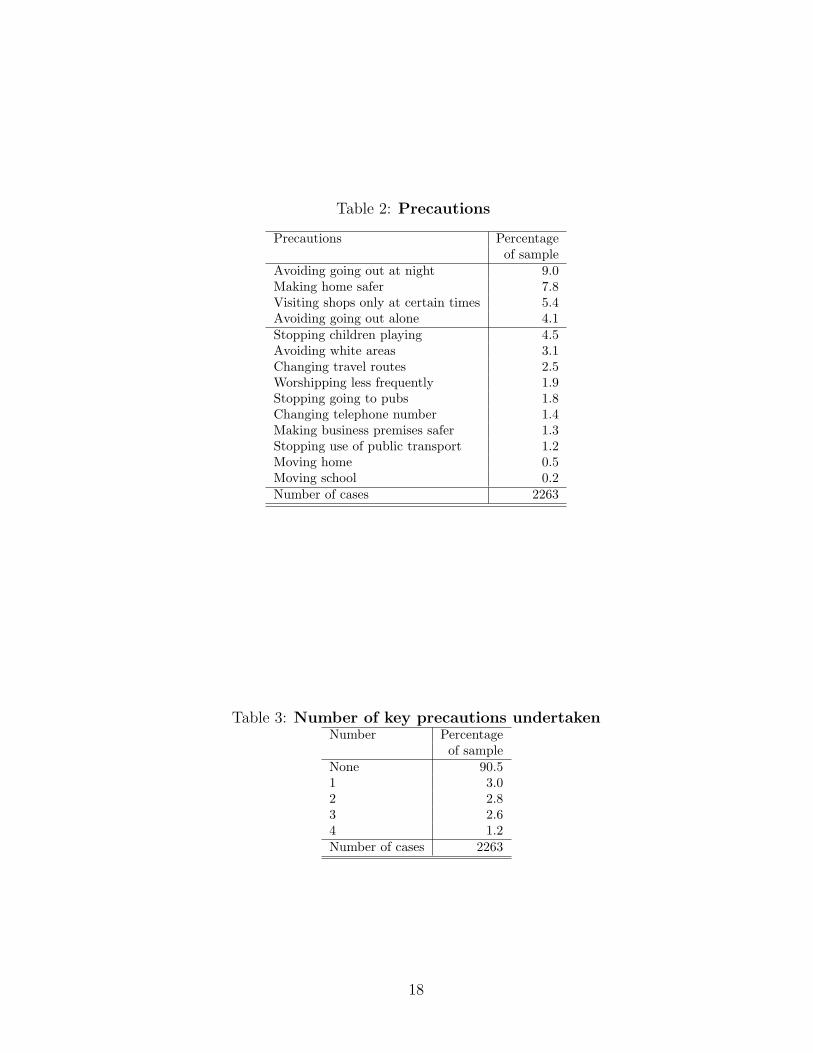
Table 2: Precautions
Precautions Percentageof sample
Avoiding going out at night 9.0Making home safer 7.8Visiting shops only at certain times 5.4Avoiding going out alone 4.1Stopping children playing 4.5Avoiding white areas 3.1Changing travel routes 2.5Worshipping less frequently 1.9Stopping going to pubs 1.8Changing telephone number 1.4Making business premises safer 1.3Stopping use of public transport 1.2Moving home 0.5Moving school 0.2Number of cases 2263
Table 3: Number of key precautions undertakenNumber Percentage
of sampleNone 90.51 3.02 2.83 2.64 1.2Number of cases 2263
18
from the UK census at ward level.5 This allows us to capture the wide diversity in lo-
cal ethnic composition within regions and, consequently, gives sufficient variation across
different geographical units for subsequent analysis. According to the 1991 Census of pop-
ulation, in the UK, almost 80% of ethnic minorities live in the South East (mainly Greater
London) and the Midlands regions. Inside these regions, however, ethnic concentration
varies widely across smaller areas, such as wards.
The sociological literature points to arguments for expecting both the level and the
recent change in minority concentration to matter to white hostility (as discussed above).
The 1991 census collected information on racial identities of the population and this
forms the basis for our measure of current ethnic minority concentration, calculated as
the percentage of the ward population who are Asian or black. However this information
was not collected in the previous 1981 census and is therefore unavailable for the purpose
of constructing information on dynamics of ethnic concentration. What is present in both
1991 and 1981 censuses is information on country of birth and we use this to construct a
measure of changes in ethnic density based on the percentages of immigrants from South
Asia and the West Indies. These particular sources are the main geographical origin of
ethnically different immigration to the UK (excluding only East Asia).6
The availability of the white sample and the inclusion of questions to them on prejudice
towards minorities allows us, to a limited extent, also to construct for the black sample
measures of local white prejudice. We can therefore begin to explore the extent to which
frequency of harassment depends on the prejudicial attitudes of the white community in
the area where the individual lives by including this as conditioning information. Our data
here concerns broad expressions of prejudice against minorities. As Smith (1989, p.150)
notes, it is possible that such “low-level” attitudes “provide a reservoir of procedural
norms that not only tacitly inform routine activity, but are also available to legitimize
more purposive, explicitly racist, practice.”
5In the UK, a ward is the smallest geographical area identified in the Population Census, and typically
comprises about 7000 individuals.6The measure for 1991 on concentration of immigrants is very highly correlated with the measure of
ethnic concentration, the correlation coefficient being 0.97.
19
Specifically, to investigate this, we add a variable indicating the average attitudes
against minority individuals at county level. We are unable to use such a regressor at
ward level because of the survey sampling design described above. The white sub-sample
typically live in different wards from ethnic minority respondents and this leaves too
small a number of observations which would match the minority sample at ward, or even
district, level. Therefore, we aggregate to county level, appreciating nonetheless that we
may consequently be matching black respondents with the attitudes of white respondents
who may be geographically fairly distant.
The impact of ethnic context on attitudes of this type is investigated in many papers,
including, for the UK, Dustmann and Preston (2001). We should avoid thinking of the
estimates including this measure of white attitudes as an estimate however of (7) and (8)
rather than of (9) and (10), since the questionnaire responses on which the data is based
can only hope to pick up a limited subset of relevant white attitudes.
Our other central focus is on the role of local economic conditions. We incorporate
census information on local measures of economic deprivation, including percentages of
population unemployed, lacking education, sharing residential facilities and lacking central
heating. As Table 4 makes plain, the black sample lives in more deprived areas according
to any measure.
At the personal level we make use of data on demographic status, including age and
children, labor market status and education. In our estimations, we include three ed-
ucation dummies indicating whether individuals have university education, A-levels or
vocational qualifications. Education is likely to influence the type of socioeconomic en-
vironment in which the individual interacts. Therefore, it can affect the probability of
being harassed. Attitudes and, in particular, propensity to harass may vary in different
socioeconomic environments. In addition, individuals with different qualifications may
come in contact with white people to different extents. Moreover, education may also
reflect different degrees of sensitivity to harassment.
The average age of minority individuals in the sample is 39 years. Age may be another
determinant of the propensity to be harassed. Older individuals, for example, may tend
20
to go out less or to go to places less frequented by white individuals. In addition, potential
harassers may prefer to target certain age groups rather than others.
We also consider how the ethnic groups identified in the sample, namely Black Caribbean,
Indian, African-Asian, Pakistani, Bangladeshi and Chinese may be victims of harassment
to a different extent. Ethnicity may indicate the extent to which cultures differ from the
majority one and the extent to which different ethnic groups have integrated in British
society. Racial abuse may be experienced particularly by individuals whose look and be-
havior are perceived as radically different from those of the white majority population.
Accordingly, we also look at different harassment experiences for ethnic minority immi-
grants and native born ethnic minorities. Natives may tend to mix with whites more than
immigrants. In the sample, 78 percent of ethnic minorities were born abroad.
Table 4: Descriptive StatisticsBlack sample White sample
Variable Mean S.d. Mean S.d.Local% Black/Asian 0.331 0.297 0.042 0.080∆ % Immigrant 0.018 0.036 0.002 0.007% Prejudiced 0.359 0.069 0.295 0.072London 0.402 0.490 0.097 0.296% Unemployed 0.163 0.076 0.087 0.047% With degree 0.067 0.052 0.069 0.053% Sharing facs 0.023 0.018 0.010 0.013% No cent heating 0.263 0.151 0.168 0.117
PersonalMale 0.488 0.500 0.422 0.494Age/10 3.870 1.515 4.761 1.907Has children 0.592 0.491 0.299 0.458No of children 1.512 1.691 0.563 0.986Degree 0.113 0.317 0.080 0.271Voc training 0.182 0.386 0.240 0.427A Level 0.208 0.406 0.318 0.466Unemployed 0.146 0.353 0.060 0.238Student 0.099 0.299 0.032 0.176Out of lab force 0.322 0.467 0.411 0.492Foreign born 0.777 0.417 0.053 0.225Caribbean 0.234 0.423 . .Indian 0.247 0.431 . .Afro Asian 0.140 0.347 . .Pakistani 0.228 0.420 . .Chinese 0.040 0.196 . .Sample 5098 2780
21
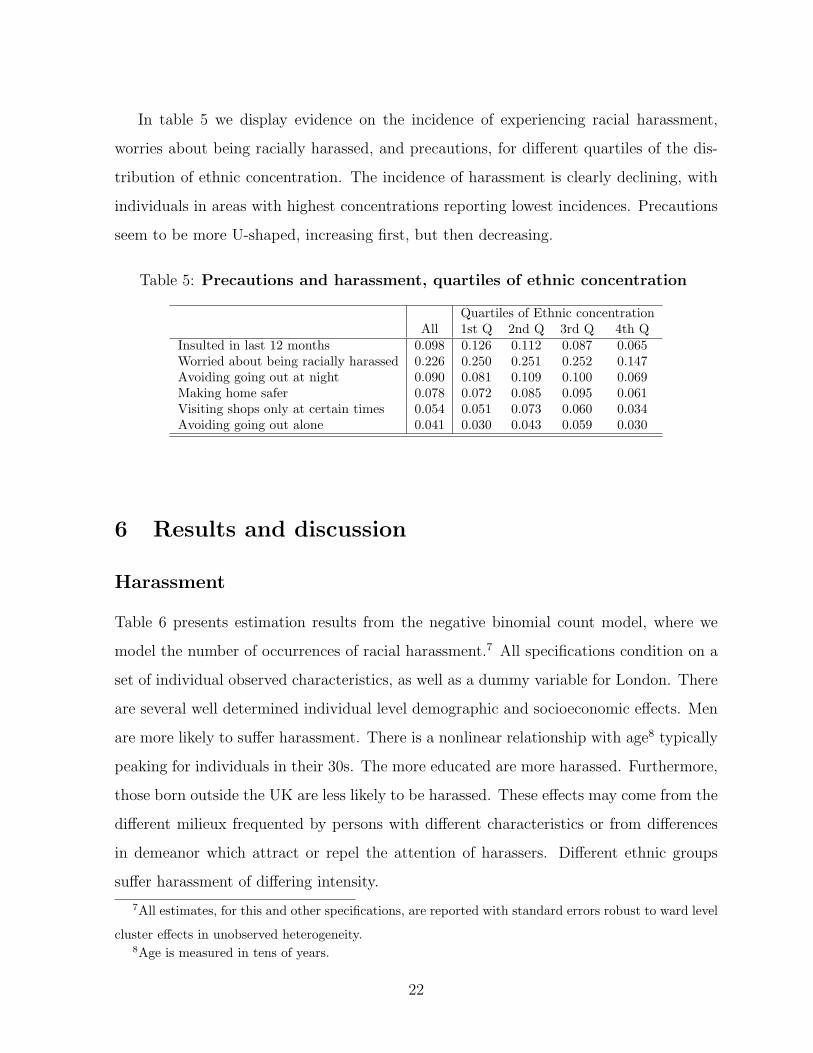
In table 5 we display evidence on the incidence of experiencing racial harassment,
worries about being racially harassed, and precautions, for different quartiles of the dis-
tribution of ethnic concentration. The incidence of harassment is clearly declining, with
individuals in areas with highest concentrations reporting lowest incidences. Precautions
seem to be more U-shaped, increasing first, but then decreasing.
Table 5: Precautions and harassment, quartiles of ethnic concentration
Quartiles of Ethnic concentrationAll 1st Q 2nd Q 3rd Q 4th Q
Insulted in last 12 months 0.098 0.126 0.112 0.087 0.065Worried about being racially harassed 0.226 0.250 0.251 0.252 0.147Avoiding going out at night 0.090 0.081 0.109 0.100 0.069Making home safer 0.078 0.072 0.085 0.095 0.061Visiting shops only at certain times 0.054 0.051 0.073 0.060 0.034Avoiding going out alone 0.041 0.030 0.043 0.059 0.030
6 Results and discussion
Harassment
Table 6 presents estimation results from the negative binomial count model, where we
model the number of occurrences of racial harassment.7 All specifications condition on a
set of individual observed characteristics, as well as a dummy variable for London. There
are several well determined individual level demographic and socioeconomic effects. Men
are more likely to suffer harassment. There is a nonlinear relationship with age8 typically
peaking for individuals in their 30s. The more educated are more harassed. Furthermore,
those born outside the UK are less likely to be harassed. These effects may come from the
different milieux frequented by persons with different characteristics or from differences
in demeanor which attract or repel the attention of harassers. Different ethnic groups
suffer harassment of differing intensity.
7All estimates, for this and other specifications, are reported with standard errors robust to ward level
cluster effects in unobserved heterogeneity.8Age is measured in tens of years.
22
The role of ethnic density is a first focus of attention. The first column presents results
with a single linear ethnic concentration variable, measured on ward level. These results
point clearly towards lower harassment in areas of higher minority concentration, consis-
tently with an interaction-based story or with a ”safety in numbers” effect as predicted
by the power differentials hypothesis. The second column adds a quadratic term yielding
some evidence of curvature with the marginal effect diminishing as minority concentra-
tion increases though it does not flatten off until quite high levels of ethnic density. No
evidence of any impact from rate of change in ethnic density is apparent from results in
the third column, contrary to the predictions of the defended neighborhoods argument.
The final column adds a variable reflecting mean white hostility at county level as
measured by responses of white individuals within the same survey. The effect is negative,
which is surprising. It may be that the sort of attitudes picked up by the questions on
prejudice asked to white respondents are those which discourage contact with ethnic
minorities rather than aggressive confrontation with them.
A role for local economic conditions is also evident. Local unemployment seems to be
associated with higher harassment, even conditional on white attitudes. The results in
Dustmann and Preston (2001) point to no identifiable impact of white unemployment on
prejudice or hostility to minorities - a result which, to anticipate, we find again when look-
ing at white attitudes below. It is interesting that these results are indicative of greater
harassment, perhaps because unemployment provokes greater hostility in the expression
of negative attitudes or because it puts a pool of unemployed individuals into contact
with others in circumstances where hostile outcomes can easily occur. We can contrast
our findings with those of Green, Strolovich and Wong (1998, p.373) for the US who
“. . . turn up no relationship between unemployment rates and racially motivated crime.”
Poverty of local housing conditions also appears to have an association with intensity of
harassment in some specifications.
23
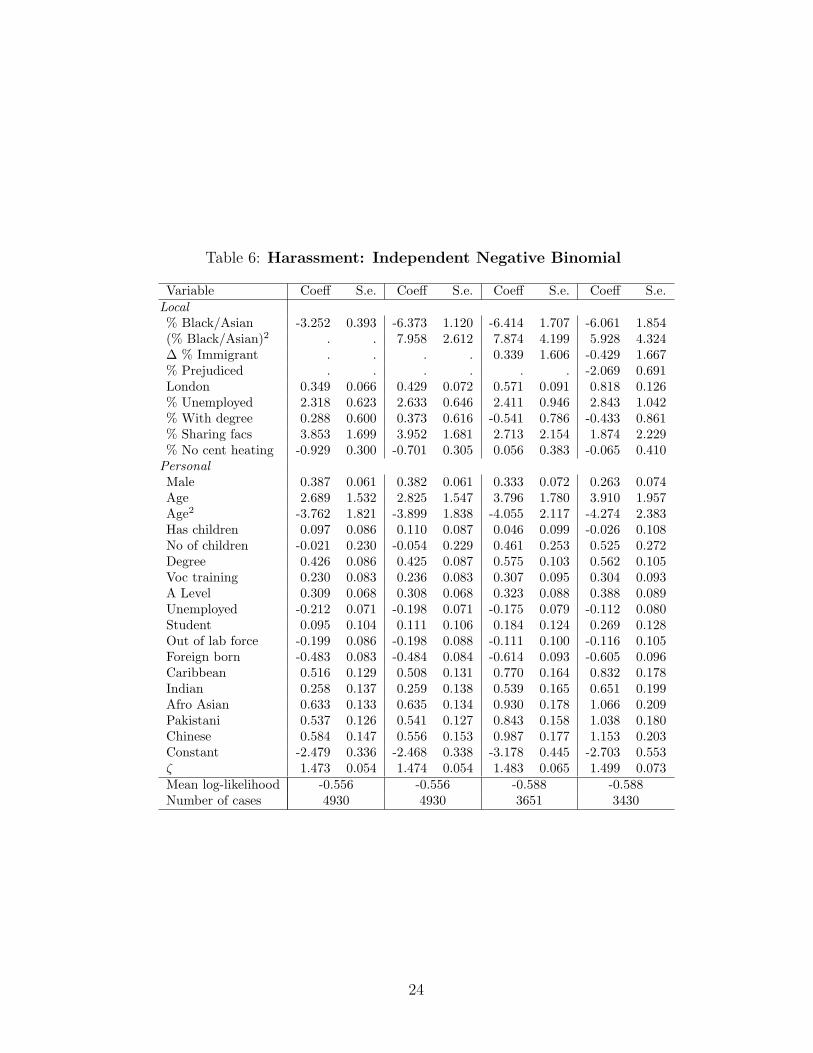
Table 6: Harassment: Independent Negative Binomial
Variable Coeff S.e. Coeff S.e. Coeff S.e. Coeff S.e.Local% Black/Asian -3.252 0.393 -6.373 1.120 -6.414 1.707 -6.061 1.854(% Black/Asian)2 . . 7.958 2.612 7.874 4.199 5.928 4.324∆ % Immigrant . . . . 0.339 1.606 -0.429 1.667% Prejudiced . . . . . . -2.069 0.691London 0.349 0.066 0.429 0.072 0.571 0.091 0.818 0.126% Unemployed 2.318 0.623 2.633 0.646 2.411 0.946 2.843 1.042% With degree 0.288 0.600 0.373 0.616 -0.541 0.786 -0.433 0.861% Sharing facs 3.853 1.699 3.952 1.681 2.713 2.154 1.874 2.229% No cent heating -0.929 0.300 -0.701 0.305 0.056 0.383 -0.065 0.410
PersonalMale 0.387 0.061 0.382 0.061 0.333 0.072 0.263 0.074Age 2.689 1.532 2.825 1.547 3.796 1.780 3.910 1.957Age2 -3.762 1.821 -3.899 1.838 -4.055 2.117 -4.274 2.383Has children 0.097 0.086 0.110 0.087 0.046 0.099 -0.026 0.108No of children -0.021 0.230 -0.054 0.229 0.461 0.253 0.525 0.272Degree 0.426 0.086 0.425 0.087 0.575 0.103 0.562 0.105Voc training 0.230 0.083 0.236 0.083 0.307 0.095 0.304 0.093A Level 0.309 0.068 0.308 0.068 0.323 0.088 0.388 0.089Unemployed -0.212 0.071 -0.198 0.071 -0.175 0.079 -0.112 0.080Student 0.095 0.104 0.111 0.106 0.184 0.124 0.269 0.128Out of lab force -0.199 0.086 -0.198 0.088 -0.111 0.100 -0.116 0.105Foreign born -0.483 0.083 -0.484 0.084 -0.614 0.093 -0.605 0.096Caribbean 0.516 0.129 0.508 0.131 0.770 0.164 0.832 0.178Indian 0.258 0.137 0.259 0.138 0.539 0.165 0.651 0.199Afro Asian 0.633 0.133 0.635 0.134 0.930 0.178 1.066 0.209Pakistani 0.537 0.126 0.541 0.127 0.843 0.158 1.038 0.180Chinese 0.584 0.147 0.556 0.153 0.987 0.177 1.153 0.203Constant -2.479 0.336 -2.468 0.338 -3.178 0.445 -2.703 0.553ζ 1.473 0.054 1.474 0.054 1.483 0.065 1.499 0.073Mean log-likelihood -0.556 -0.556 -0.588 -0.588Number of cases 4930 4930 3651 3430
24
Precautions
In table 7 we present results from the precaution equation. The pattern of results re-
garding local area characteristics is very much compatible with the findings from direct
analysis of harassment. As with harassment, precautions seem to decrease with ethnic
concentration, though the effect is well determined only in the linear specification. As
before, the effect of changes in ethnic composition on precautions is positive, but not
significant. There is no strong evidence of association with local white prejudice. Local
unemployment nonetheless appears possibly to be associated with more precautionary
behavior.
There are few significant effects from personal characteristics although those with more
children do seem more inclined to undertake precautions and there are some differences
among racial groups (with Caribbeans noticeably disinclined to precaution).
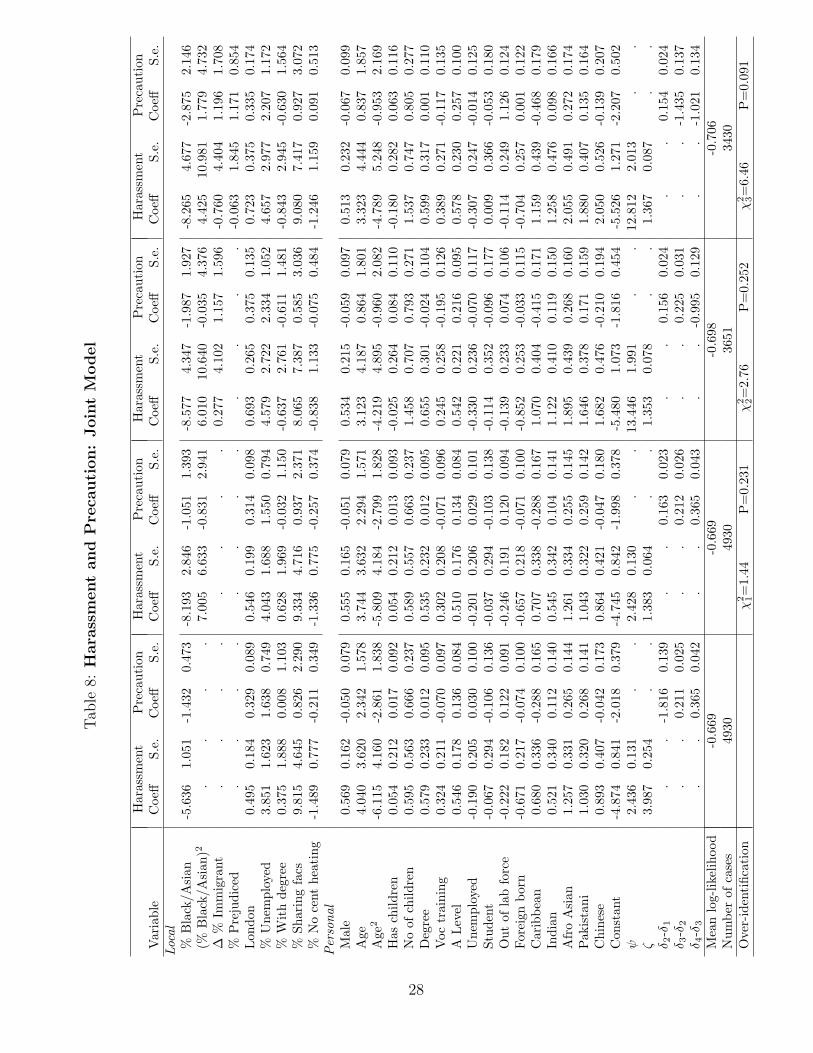
Joint Estimation
Not all determinants of precautions and harassment are observable. Much variation in
these two variables is explained by unobservables. In table 8 we present results of a joint
model, where we allow the unobservables in the two equations to be correlated. The
estimates point very conclusively towards a positive value for ψ showing that harass-
ment and precautionary behavior are positively associated either because of correlation
in unobserved influences or because precaution responds to the prevalence of harassment.
The main influences remain well identified when estimated jointly. In particular,
our key finding of a negative relationship between ethnic concentration on the one hand
and the incidence of harassment and of precautionary responses on the other continues
to find strong support in these estimates (although specifications with nonlinear terms
are less well estimated). There is still no clear evidence of any effect from changes in
immigrant numbers and the puzzling result on association with local white prejudice
has now disappeared. At the same time, some evidence of association between local
unemployment and harassment remains apparent.
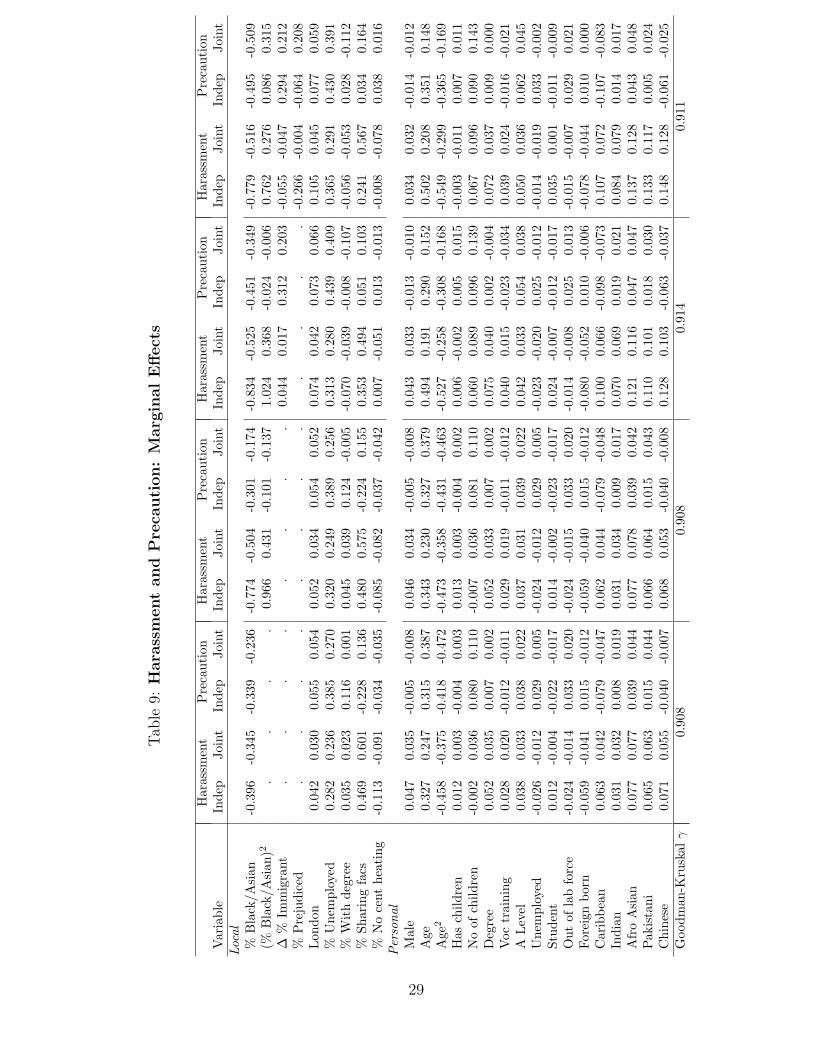
Table 9 presents some of the same results in terms of the implied marginal effects at
25
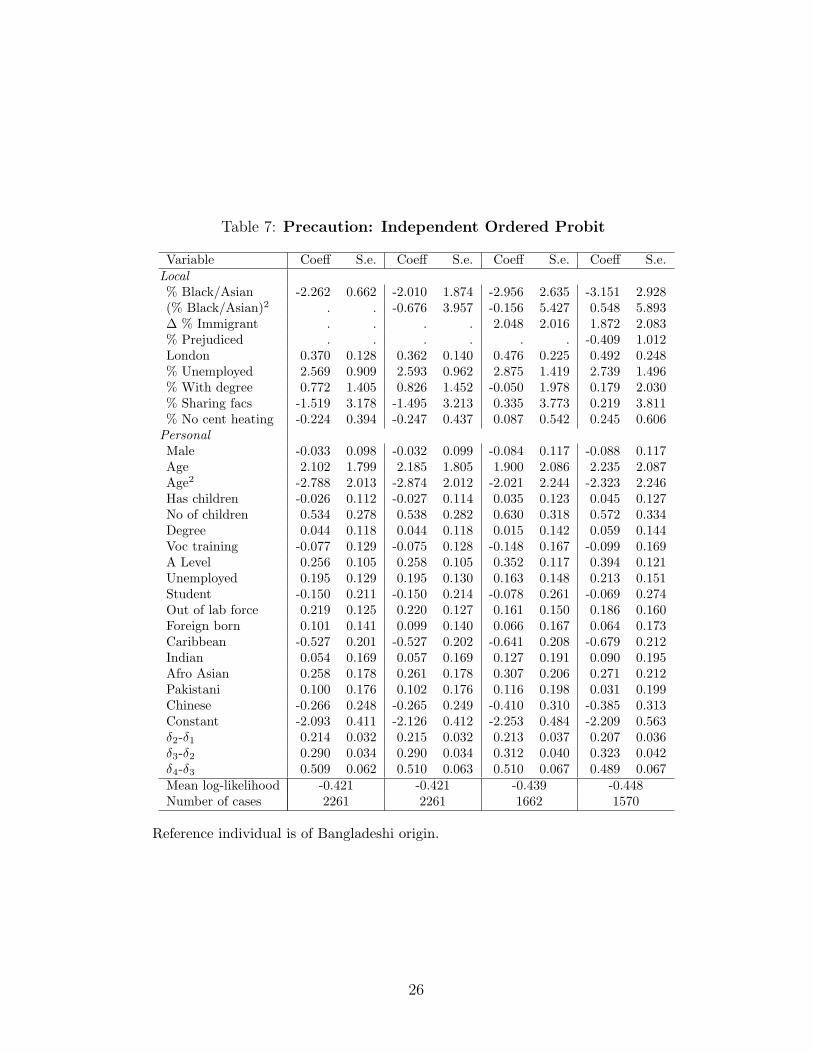
Table 7: Precaution: Independent Ordered Probit
Variable Coeff S.e. Coeff S.e. Coeff S.e. Coeff S.e.Local% Black/Asian -2.262 0.662 -2.010 1.874 -2.956 2.635 -3.151 2.928(% Black/Asian)2 . . -0.676 3.957 -0.156 5.427 0.548 5.893∆ % Immigrant . . . . 2.048 2.016 1.872 2.083% Prejudiced . . . . . . -0.409 1.012London 0.370 0.128 0.362 0.140 0.476 0.225 0.492 0.248% Unemployed 2.569 0.909 2.593 0.962 2.875 1.419 2.739 1.496% With degree 0.772 1.405 0.826 1.452 -0.050 1.978 0.179 2.030% Sharing facs -1.519 3.178 -1.495 3.213 0.335 3.773 0.219 3.811% No cent heating -0.224 0.394 -0.247 0.437 0.087 0.542 0.245 0.606
PersonalMale -0.033 0.098 -0.032 0.099 -0.084 0.117 -0.088 0.117Age 2.102 1.799 2.185 1.805 1.900 2.086 2.235 2.087Age2 -2.788 2.013 -2.874 2.012 -2.021 2.244 -2.323 2.246Has children -0.026 0.112 -0.027 0.114 0.035 0.123 0.045 0.127No of children 0.534 0.278 0.538 0.282 0.630 0.318 0.572 0.334Degree 0.044 0.118 0.044 0.118 0.015 0.142 0.059 0.144Voc training -0.077 0.129 -0.075 0.128 -0.148 0.167 -0.099 0.169A Level 0.256 0.105 0.258 0.105 0.352 0.117 0.394 0.121Unemployed 0.195 0.129 0.195 0.130 0.163 0.148 0.213 0.151Student -0.150 0.211 -0.150 0.214 -0.078 0.261 -0.069 0.274Out of lab force 0.219 0.125 0.220 0.127 0.161 0.150 0.186 0.160Foreign born 0.101 0.141 0.099 0.140 0.066 0.167 0.064 0.173Caribbean -0.527 0.201 -0.527 0.202 -0.641 0.208 -0.679 0.212Indian 0.054 0.169 0.057 0.169 0.127 0.191 0.090 0.195Afro Asian 0.258 0.178 0.261 0.178 0.307 0.206 0.271 0.212Pakistani 0.100 0.176 0.102 0.176 0.116 0.198 0.031 0.199Chinese -0.266 0.248 -0.265 0.249 -0.410 0.310 -0.385 0.313Constant -2.093 0.411 -2.126 0.412 -2.253 0.484 -2.209 0.563δ2-δ1 0.214 0.032 0.215 0.032 0.213 0.037 0.207 0.036δ3-δ2 0.290 0.034 0.290 0.034 0.312 0.040 0.323 0.042δ4-δ3 0.509 0.062 0.510 0.063 0.510 0.067 0.489 0.067Mean log-likelihood -0.421 -0.421 -0.439 -0.448Number of cases 2261 2261 1662 1570
Reference individual is of Bangladeshi origin.
26
mean values of characteristics on probabilities of any harassment and of any precaution,
respectively. We see from the results in the first set of columns that an increase of ten
percentage points in ethnic minority concentration is estimated to reduce the probability
of either by between three and four percentage points. The figures at the base of the table
are predicted Goodman Kruskal γ coefficients taken again at mean characteristics - the
values consistently exceeding 0.9 points to a very strong correlation between harassment
and precaution beyond that explained by the observed variables.
At the base of Table 8 we report χ2 tests of the cross equation proportionality restric-
tions implied by the hypothesis that all local ethnic concentration and prejudice variables
affect harassment and precaution through a common channel. These restrictions are con-
sistently accepted at the 5% level.
Attitudes of white respondents
As we explain above, our data covers a random sample of white respondents who provide
the same background information as the ethnic minority sample, and who are interviewed
about a set of minority related issues. Much theorizing about harassment relates to the
determination of such attitudes and the availability of such data gives us the chance to
look at this directly. We concentrate here on an analysis of two questions. Question
1 is an index on prejudice. Individuals were asked whether they are a little or very
prejudiced towards individuals of different characteristics. We use here the responses to
ethnic minorities of Caribbean or Asian origin. We create an indicator variable which is
equal to one if individuals assess themselves as being at least a little prejudiced against
either of the two groups.9
Respondents were also asked about their attitudes towards inter-ethnic marriage. The
exact wording of the question is given in the footnote to table 10. Again, we construct
an indicator variable which equals one if the respondent minds if a close relative marries
an ethnic minority individual.
9We have experimented with more detailed classifications, but results were very similar. For ease of
interpretation, we use a simple binary variable.
27
Tab
le8:
Hara
ssm
ent
and
Pre
cauti
on:
Join
tM
odel
Har
assm
ent
Pre
caut
ion
Har
assm
ent
Pre
caut
ion
Har
assm
ent
Pre
caut
ion
Har
assm
ent
Pre
caut
ion
Var
iabl
eC
oeff
S.e.
Coe
ffS.
e.C
oeff
S.e.
Coe
ffS.
e.C
oeff
S.e.
Coe
ffS.
e.C
oeff
S.e.
Coe
ffS.
e.Lo
cal
%B
lack
/Asi
an-5
.636
1.05
1-1
.432
0.47
3-8
.193
2.84
6-1
.051
1.39
3-8
.577
4.34
7-1
.987
1.92
7-8
.265
4.67
7-2
.875
2.14
6(%
Bla
ck/A
sian
)2.
..
.7.
005
6.63
3-0
.831
2.94
16.
010
10.6
40-0
.035
4.37
64.
425
10.9
811.
779
4.73
2∆
%Im
mig
rant
..
..
..
..
0.27
74.
102
1.15
71.
596
-0.7
604.
404
1.19
61.
708
%P
reju
dice
d.
..
..
..
..
..
.-0
.063
1.84
51.
171
0.85
4Lon
don
0.49
50.
184
0.32
90.
089
0.54
60.
199
0.31
40.
098
0.69
30.
265
0.37
50.
135
0.72
30.
375
0.33
50.
174
%U
nem
ploy
ed3.
851
1.62
31.
638
0.74
94.
043
1.68
81.
550
0.79
44.
579
2.72
22.
334
1.05
24.
657
2.97
72.
207
1.17
2%
Wit
hde
gree
0.37
51.
888
0.00
81.
103
0.62
81.
969
-0.0
321.
150
-0.6
372.
761
-0.6
111.
481
-0.8
432.
945
-0.6
301.
564
%Sh
arin
gfa
cs9.
815
4.64
50.
826
2.29
09.
334
4.71
60.
937
2.37
18.
065
7.38
70.
585
3.03
69.
080
7.41
70.
927
3.07
2%
No
cent
heat
ing
-1.4
890.
777
-0.2
110.
349
-1.3
360.
775
-0.2
570.
374
-0.8
381.
133
-0.0
750.
484
-1.2
461.
159
0.09
10.
513
Per
sona
lM
ale
0.56
90.
162
-0.0
500.
079
0.55
50.
165
-0.0
510.
079
0.53
40.
215
-0.0
590.
097
0.51
30.
232
-0.0
670.
099
Age
4.04
03.
620
2.34
21.
578
3.74
43.
632
2.29
41.
571
3.12
34.
187
0.86
41.
801
3.32
34.
444
0.83
71.
857
Age
2-6
.115
4.16
0-2
.861
1.83
8-5
.809
4.18
4-2
.799
1.82
8-4
.219
4.89
5-0
.960
2.08
2-4
.789
5.24
8-0
.953
2.16
9H
asch
ildre
n0.
054
0.21
20.
017
0.09
20.
054
0.21
20.
013
0.09
3-0
.025
0.26
40.
084
0.11
0-0
.180
0.28
20.
063
0.11
6N
oof
child
ren
0.59
50.
563
0.66
60.
237
0.58
90.
557
0.66
30.
237
1.45
80.
707
0.79
30.
271
1.53
70.
747
0.80
50.
277
Deg
ree
0.57
90.
233
0.01
20.
095
0.53
50.
232
0.01
20.
095
0.65
50.
301
-0.0
240.
104
0.59
90.
317
0.00
10.
110
Voc
trai
ning
0.32
40.
211
-0.0
700.
097
0.30
20.
208
-0.0
710.
096
0.24
50.
258
-0.1
950.
126
0.38
90.
271
-0.1
170.
135
ALev
el0.
546
0.17
80.
136
0.08
40.
510
0.17
60.
134
0.08
40.
542
0.22
10.
216
0.09
50.
578
0.23
00.
257
0.10
0U
nem
ploy
ed-0
.190
0.20
50.
030
0.10
0-0
.201
0.20
60.
029
0.10
1-0
.330
0.23
6-0
.070
0.11
7-0
.307
0.24
7-0
.014
0.12
5St
uden
t-0
.067
0.29
4-0
.106
0.13
6-0
.037
0.29
4-0
.103
0.13
8-0
.114
0.35
2-0
.096
0.17
70.
009
0.36
6-0
.053
0.18
0O
utof
lab
forc
e-0
.222
0.18
20.
122
0.09
1-0
.246
0.19
10.
120
0.09
4-0
.139
0.23
30.
074
0.10
6-0
.114
0.24
91.
126
0.12
4Fo
reig
nbo
rn-0
.671
0.21
7-0
.074
0.10
0-0
.657
0.21
8-0
.071
0.10
0-0
.852
0.25
3-0
.033
0.11
5-0
.704
0.25
70.
001
0.12
2C
arib
bean
0.68
00.
336
-0.2
880.
165
0.70
70.
338
-0.2
880.
167
1.07
00.
404
-0.4
150.
171
1.15
90.
439
-0.4
680.
179
Indi
an0.
521
0.34
00.
112
0.14
00.
545
0.34
20.
104
0.14
11.
122
0.41
00.
119
0.15
01.
258
0.47
60.
098
0.16
6A
fro
Asi
an1.
257
0.33
10.
265
0.14
41.
261
0.33
40.
255
0.14
51.
895
0.43
90.
268
0.16
02.
055
0.49
10.
272
0.17
4Pak
ista
ni1.
030
0.32
00.
268
0.14
11.
043
0.32
20.
259
0.14
21.
646
0.37
80.
171
0.15
91.
880
0.40
70.
135
0.16
4C
hine
se0.
893
0.40
7-0
.042
0.17
30.
864
0.42
1-0
.047
0.18
01.
682
0.47
6-0
.210
0.19
42.
050
0.52
6-0
.139
0.20
7C
onst
ant
-4.8
740.
841
-2.0
180.
379
-4.7
450.
842
-1.9
980.
378
-5.4
801.
073
-1.8
160.
454
-5.5
261.
271
-2.2
070.
502
ψ2.
436
0.13
1.
.2.
428
0.13
0.
.13
.446
1.99
1.
.12
.812
2.01
3.
.ζ
3.98
70.
254
..
1.38
30.
064
..
1.35
30.
078
..
1.36
70.
087
..
δ 2-δ
1.
.-1
.816
0.13
9.
.0.
163
0.02
3.
.0.
156
0.02
4.
.0.
154
0.02
4δ 3
-δ2
..
0.21
10.
025
..
0.21
20.
026
..
0.22
50.
031
..
-1.4
350.
137
δ 4-δ
3.
.0.
365
0.04
2.
.0.
365
0.04
3.
.-0
.995
0.12
9.
.-1
.021
0.13
4M
ean
log-
likel
ihoo
d-0
.669
-0.6
69-0
.698
-0.7
06N
umbe
rof
case
s49
3049
3036
5134
30O
ver-
iden
tific
atio
nχ
2 1=
1.44
P=
0.23
1χ
2 2=
2.76
P=
0.25
2χ
2 3=
6.46
P=
0.09
1
28
Tab
le9:
Hara
ssm
ent
and
Pre
cauti
on:
Marg
inalEffect
s
Har
assm
ent
Pre
caut
ion
Har
assm
ent
Pre
caut
ion
Har
assm
ent
Pre
caut
ion
Har
assm
ent
Pre
caut
ion
Var
iabl
eIn
dep
Join
tIn
dep
Join
tIn
dep
Join
tIn
dep
Join
tIn
dep
Join
tIn
dep
Join
tIn
dep
Join
tIn
dep
Join
tLo
cal
%B
lack
/Asi
an-0
.396
-0.3
45-0
.339
-0.2
36-0
.774
-0.5
04-0
.301
-0.1
74-0
.834
-0.5
25-0
.451
-0.3
49-0
.779
-0.5
16-0
.495
-0.5
09(%
Bla
ck/A
sian
)2.
..
.0.
966
0.43
1-0
.101
-0.1
371.
024
0.36
8-0
.024
-0.0
060.
762
0.27
60.
086
0.31
5∆
%Im
mig
rant
..
..
..
..
0.04
40.
017
0.31
20.
203
-0.0
55-0
.047
0.29
40.
212
%P
reju
dice
d.
..
..
..
..
..
.-0
.266
-0.0
04-0
.064
0.20
8Lon
don
0.04
20.
030
0.05
50.
054
0.05
20.
034
0.05
40.
052
0.07
40.
042
0.07
30.
066
0.10
50.
045
0.07
70.
059
%U
nem
ploy
ed0.
282
0.23
60.
385
0.27
00.
320
0.24
90.
389
0.25
60.
313
0.28
00.
439
0.40
90.
365
0.29
10.
430
0.39
1%
Wit
hde
gree
0.03
50.
023
0.11
60.
001
0.04
50.
039
0.12
4-0
.005
-0.0
70-0
.039
-0.0
08-0
.107
-0.0
56-0
.053
0.02
8-0
.112
%Sh
arin
gfa
cs0.
469
0.60
1-0
.228
0.13
60.
480
0.57
5-0
.224
0.15
50.
353
0.49
40.
051
0.10
30.
241
0.56
70.
034
0.16
4%
No
cent
heat
ing
-0.1
13-0
.091
-0.0
34-0
.035
-0.0
85-0
.082
-0.0
37-0
.042
0.00
7-0
.051
0.01
3-0
.013
-0.0
08-0
.078
0.03
80.
016
Per
sona
lM
ale
0.04
70.
035
-0.0
05-0
.008
0.04
60.
034
-0.0
05-0
.008
0.04
30.
033
-0.0
13-0
.010
0.03
40.
032
-0.0
14-0
.012
Age
0.32
70.
247
0.31
50.
387
0.34
30.
230
0.32
70.
379
0.49
40.
191
0.29
00.
152
0.50
20.
208
0.35
10.
148
Age
2-0
.458
-0.3
75-0
.418
-0.4
72-0
.473
-0.3
58-0
.431
-0.4
63-0
.527
-0.2
58-0
.308
-0.1
68-0
.549
-0.2
99-0
.365
-0.1
69H
asch
ildre
n0.
012
0.00
3-0
.004
0.00
30.
013
0.00
3-0
.004
0.00
20.
006
-0.0
020.
005
0.01
5-0
.003
-0.0
110.
007
0.01
1N
oof
child
ren
-0.0
020.
036
0.08
00.
110
-0.0
070.
036
0.08
10.
110
0.06
00.
089
0.09
60.
139
0.06
70.
096
0.09
00.
143
Deg
ree
0.05
20.
035
0.00
70.
002
0.05
20.
033
0.00
70.
002
0.07
50.
040
0.00
2-0
.004
0.07
20.
037
0.00
90.
000
Voc
trai
ning
0.02
80.
020
-0.0
12-0
.011
0.02
90.
019
-0.0
11-0
.012
0.04
00.
015
-0.0
23-0
.034
0.03
90.
024
-0.0
16-0
.021
ALev
el0.
038
0.03
30.
038
0.02
20.
037
0.03
10.
039
0.02
20.
042
0.03
30.
054
0.03
80.
050
0.03
60.
062
0.04
5U
nem
ploy
ed-0
.026
-0.0
120.
029
0.00
5-0
.024
-0.0
120.
029
0.00
5-0
.023
-0.0
200.
025
-0.0
12-0
.014
-0.0
190.
033
-0.0
02St
uden
t0.
012
-0.0
04-0
.022
-0.0
170.
014
-0.0
02-0
.023
-0.0
170.
024
-0.0
07-0
.012
-0.0
170.
035
0.00
1-0
.011
-0.0
09O
utof
lab
forc
e-0
.024
-0.0
140.
033
0.02
0-0
.024
-0.0
150.
033
0.02
0-0
.014
-0.0
080.
025
0.01
3-0
.015
-0.0
070.
029
0.02
1Fo
reig
nbo
rn-0
.059
-0.0
410.
015
-0.0
12-0
.059
-0.0
400.
015
-0.0
12-0
.080
-0.0
520.
010
-0.0
06-0
.078
-0.0
440.
010
0.00
0C
arib
bean
0.06
30.
042
-0.0
79-0
.047
0.06
20.
044
-0.0
79-0
.048
0.10
00.
066
-0.0
98-0
.073
0.10
70.
072
-0.1
07-0
.083
Indi
an0.
031
0.03
20.
008
0.01
90.
031
0.03
40.
009
0.01
70.
070
0.06
90.
019
0.02
10.
084
0.07
90.
014
0.01
7A
fro
Asi
an0.
077
0.07
70.
039
0.04
40.
077
0.07
80.
039
0.04
20.
121
0.11
60.
047
0.04
70.
137
0.12
80.
043
0.04
8Pak
ista
ni0.
065
0.06
30.
015
0.04
40.
066
0.06
40.
015
0.04
30.
110
0.10
10.
018
0.03
00.
133
0.11
70.
005
0.02
4C
hine
se0.
071
0.05
5-0
.040
-0.0
070.
068
0.05
3-0
.040
-0.0
080.
128
0.10
3-0
.063
-0.0
370.
148
0.12
8-0
.061
-0.0
25G
oodm
an-K
rusk
alγ
0.90
80.
908
0.91
40.
911
29
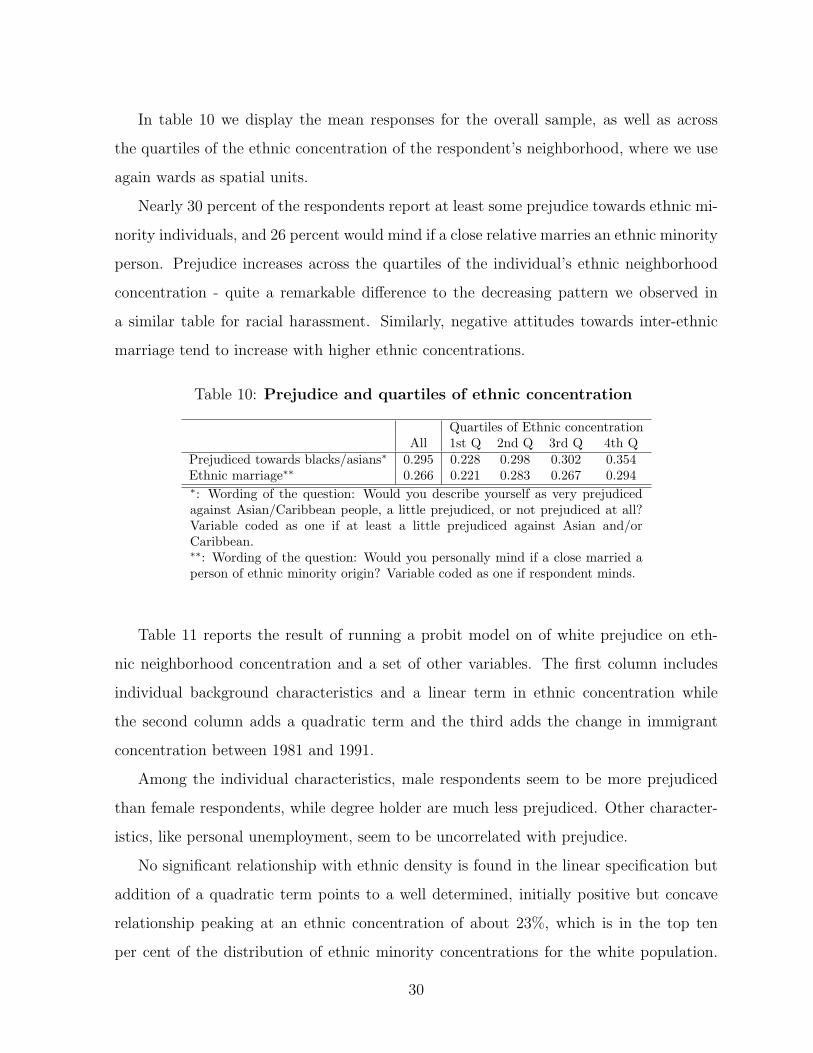
In table 10 we display the mean responses for the overall sample, as well as across
the quartiles of the ethnic concentration of the respondent’s neighborhood, where we use
again wards as spatial units.
Nearly 30 percent of the respondents report at least some prejudice towards ethnic mi-
nority individuals, and 26 percent would mind if a close relative marries an ethnic minority
person. Prejudice increases across the quartiles of the individual’s ethnic neighborhood
concentration - quite a remarkable difference to the decreasing pattern we observed in
a similar table for racial harassment. Similarly, negative attitudes towards inter-ethnic
marriage tend to increase with higher ethnic concentrations.
Table 10: Prejudice and quartiles of ethnic concentration
Quartiles of Ethnic concentrationAll 1st Q 2nd Q 3rd Q 4th Q
Prejudiced towards blacks/asians∗ 0.295 0.228 0.298 0.302 0.354Ethnic marriage∗∗ 0.266 0.221 0.283 0.267 0.294∗: Wording of the question: Would you describe yourself as very prejudicedagainst Asian/Caribbean people, a little prejudiced, or not prejudiced at all?Variable coded as one if at least a little prejudiced against Asian and/orCaribbean.∗∗: Wording of the question: Would you personally mind if a close married aperson of ethnic minority origin? Variable coded as one if respondent minds.
Table 11 reports the result of running a probit model on of white prejudice on eth-
nic neighborhood concentration and a set of other variables. The first column includes
individual background characteristics and a linear term in ethnic concentration while
the second column adds a quadratic term and the third adds the change in immigrant
concentration between 1981 and 1991.
Among the individual characteristics, male respondents seem to be more prejudiced
than female respondents, while degree holder are much less prejudiced. Other character-
istics, like personal unemployment, seem to be uncorrelated with prejudice.
No significant relationship with ethnic density is found in the linear specification but
addition of a quadratic term points to a well determined, initially positive but concave
relationship peaking at an ethnic concentration of about 23%, which is in the top ten
per cent of the distribution of ethnic minority concentrations for the white population.
30
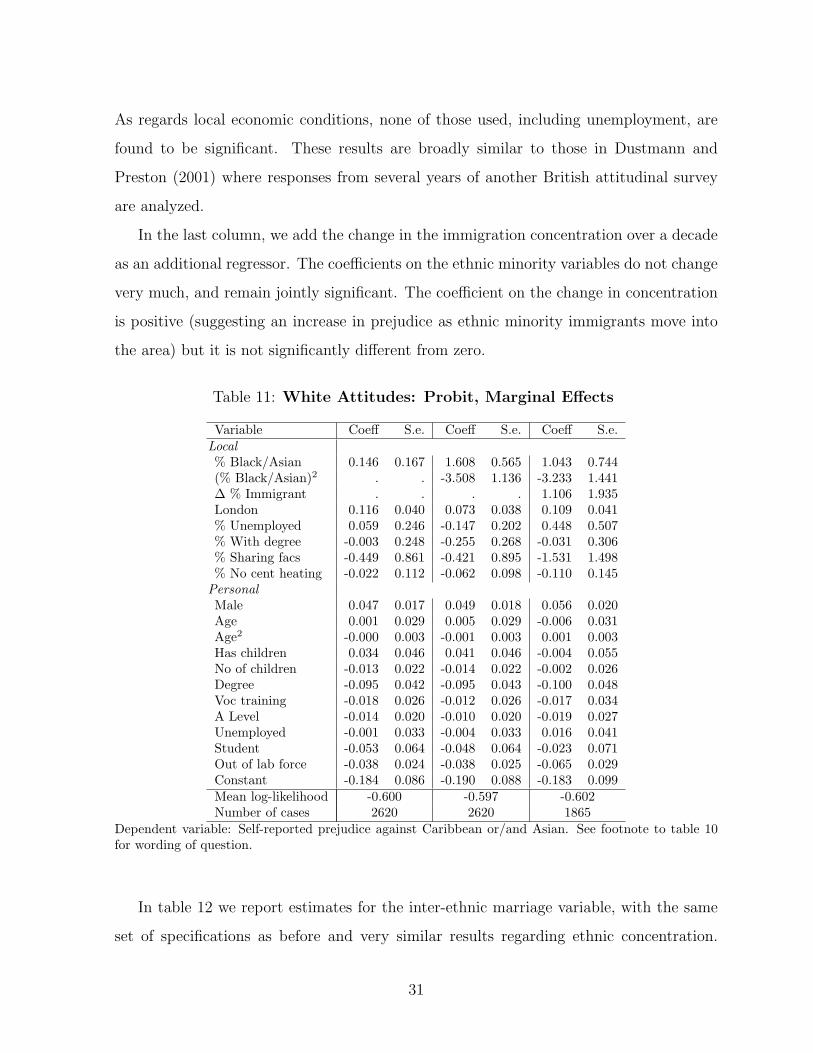
As regards local economic conditions, none of those used, including unemployment, are
found to be significant. These results are broadly similar to those in Dustmann and
Preston (2001) where responses from several years of another British attitudinal survey
are analyzed.
In the last column, we add the change in the immigration concentration over a decade
as an additional regressor. The coefficients on the ethnic minority variables do not change
very much, and remain jointly significant. The coefficient on the change in concentration
is positive (suggesting an increase in prejudice as ethnic minority immigrants move into
the area) but it is not significantly different from zero.
Table 11: White Attitudes: Probit, Marginal Effects
Variable Coeff S.e. Coeff S.e. Coeff S.e.Local% Black/Asian 0.146 0.167 1.608 0.565 1.043 0.744(% Black/Asian)2 . . -3.508 1.136 -3.233 1.441∆ % Immigrant . . . . 1.106 1.935London 0.116 0.040 0.073 0.038 0.109 0.041% Unemployed 0.059 0.246 -0.147 0.202 0.448 0.507% With degree -0.003 0.248 -0.255 0.268 -0.031 0.306% Sharing facs -0.449 0.861 -0.421 0.895 -1.531 1.498% No cent heating -0.022 0.112 -0.062 0.098 -0.110 0.145
PersonalMale 0.047 0.017 0.049 0.018 0.056 0.020Age 0.001 0.029 0.005 0.029 -0.006 0.031Age2 -0.000 0.003 -0.001 0.003 0.001 0.003Has children 0.034 0.046 0.041 0.046 -0.004 0.055No of children -0.013 0.022 -0.014 0.022 -0.002 0.026Degree -0.095 0.042 -0.095 0.043 -0.100 0.048Voc training -0.018 0.026 -0.012 0.026 -0.017 0.034A Level -0.014 0.020 -0.010 0.020 -0.019 0.027Unemployed -0.001 0.033 -0.004 0.033 0.016 0.041Student -0.053 0.064 -0.048 0.064 -0.023 0.071Out of lab force -0.038 0.024 -0.038 0.025 -0.065 0.029Constant -0.184 0.086 -0.190 0.088 -0.183 0.099Mean log-likelihood -0.600 -0.597 -0.602Number of cases 2620 2620 1865
Dependent variable: Self-reported prejudice against Caribbean or/and Asian. See footnote to table 10for wording of question.
In table 12 we report estimates for the inter-ethnic marriage variable, with the same
set of specifications as before and very similar results regarding ethnic concentration.
31
Again, except for education and age, little evidence is found to relate individual or other
area characteristics to the outcome variable.
To summarize, higher ethnic concentrations in the individual’s immediate neighbor-
hood seem to be associated, at least at all but high values of ethnic concentration, with
higher hostility towards ethnic minorities. This is in stark contrast with the harassment
estimates in the previous section. This suggests strongly that racial abuse is not just
an intensification of hostile prejudice towards minorities. In fact at low ethnic minority
densities the two measures relate to ethnic concentrations in the opposite way, indicating
that, although whites in areas with higher ethnic concentration tend to be more preju-
diced towards minorities, incidents of racial harassment occur less frequently. While the
formation of attitudes seems therefore compatible with theories that predict a positive
correlation between concentration of minorities and attitudes, the relationship between
racial abuse and concentration points rather towards explanations that emphasize the
opposite.
It is not unlikely that attitudes are formed consistently with group conflict theories,
while harassment is reduced with concentration due to decreasing contact, as well as safety
in numbers serving as a deterrent of aggression, as predicted by the power differential
hypothesis. On the basis of our results, the contact hypothesis, for example, has little
ground as a complete underlying explanation for attitude formation, as it should predict
a negative relationship between ethnic concentration and prejudice, and it is therefore
also unlikely to be a candidate for explaining racial harassment.
7 Conclusions
In this paper, we analyze the association between ethnic minority concentration, hostile
attitudes towards minorities, and the probability of ethnic minorities experiencing racial
hostility. Our main focus is on the relationship between ethnic concentration of minorities
and economic conditions on the one side, and hostile attitudes as well as acts of racial
harassment on the other. In addition, we investigate in detail precautionary behavior of
minority individuals. Changes in behavior induced by fear of racial violence may lead to
32
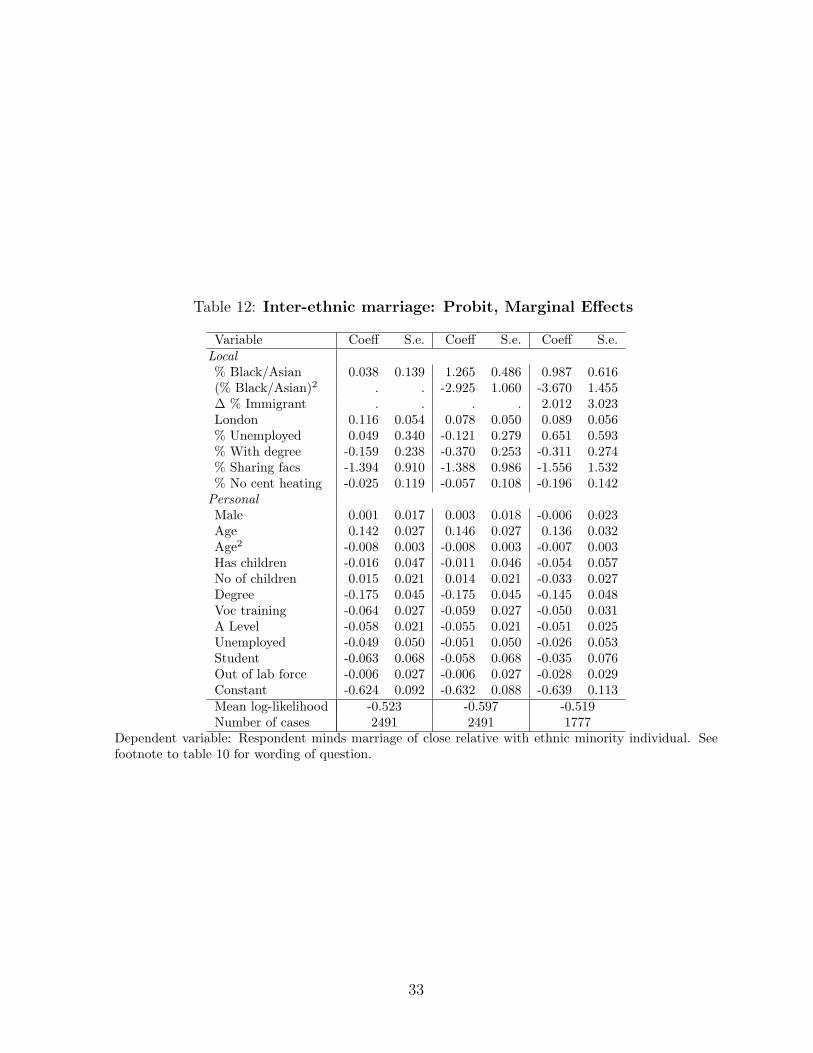
Table 12: Inter-ethnic marriage: Probit, Marginal Effects
Variable Coeff S.e. Coeff S.e. Coeff S.e.Local% Black/Asian 0.038 0.139 1.265 0.486 0.987 0.616(% Black/Asian)2 . . -2.925 1.060 -3.670 1.455∆ % Immigrant . . . . 2.012 3.023London 0.116 0.054 0.078 0.050 0.089 0.056% Unemployed 0.049 0.340 -0.121 0.279 0.651 0.593% With degree -0.159 0.238 -0.370 0.253 -0.311 0.274% Sharing facs -1.394 0.910 -1.388 0.986 -1.556 1.532% No cent heating -0.025 0.119 -0.057 0.108 -0.196 0.142
PersonalMale 0.001 0.017 0.003 0.018 -0.006 0.023Age 0.142 0.027 0.146 0.027 0.136 0.032Age2 -0.008 0.003 -0.008 0.003 -0.007 0.003Has children -0.016 0.047 -0.011 0.046 -0.054 0.057No of children 0.015 0.021 0.014 0.021 -0.033 0.027Degree -0.175 0.045 -0.175 0.045 -0.145 0.048Voc training -0.064 0.027 -0.059 0.027 -0.050 0.031A Level -0.058 0.021 -0.055 0.021 -0.051 0.025Unemployed -0.049 0.050 -0.051 0.050 -0.026 0.053Student -0.063 0.068 -0.058 0.068 -0.035 0.076Out of lab force -0.006 0.027 -0.006 0.027 -0.028 0.029Constant -0.624 0.092 -0.632 0.088 -0.639 0.113Mean log-likelihood -0.523 -0.597 -0.519Number of cases 2491 2491 1777
Dependent variable: Respondent minds marriage of close relative with ethnic minority individual. Seefootnote to table 10 for wording of question.
33
significant restrictions of individual’s liberties.
We develop a general empirical model that subsumes many of the existing theories
and estimate a reduced version of that model. Our findings are interesting in several
respects. First, we find strong evidence that racial harassment is not simply a stronger
form of racial prejudice. Our results show that, although racial prejudice increases with
ethnic concentration over most of the concentration distribution, acts of racial harassment
as well as induced precautionary behavior decrease. Accordingly, these measures can not
be interchangeably used to test different theories against each other. Our results are
compatible with attitudes being formed according to considerations as suggested by group
threat theory. Acts of harassment however follow a different process, where in addition the
frequency of contact, as well as deterrence by power through numbers on the side of the
minority population, may play an important role, as suggested by the power differential
hypothesis.
The differentiation of mechanisms leading to hostile attitudes, and harassment is fur-
ther suggested by findings on other regressors - for example while unemployment in the
local community does led to higher frequencies of harassment, no well determined relation
with white attitudes is evident.
34
References
• Becker, G. S., “Crime and Punishment: An Economic Approach”, Journal of Po-
litical Economy 76 (1968), 169-217.
• Blalock, H.M., Toward a Theory of Minority Group Relations (New York: Wiley,
1967).
• Blau, P.M., Inequality and Heterogeneity: A Primitive Theory of Societal Structure,
(New York: Free Press, 1977).
• Blau, P. M., Structural Contexts of Opportunities, (Chicago: University of Chicago
Press, 1994).
• Blumer, H., “Race Prejudice as a Sense of Group Position”, Pacific Sociological
Review 1 (1958), 3-7.
• Bobo, L., “Whites’ Opposition to Busing: Symbolic Racism or Realistic Group
Conflict?”, Journal of Personality and Social Psychology 45 (1983), 1196-1210.
• Bowling, B., Violent Racism: Victimisation, Policing and Social Context, (Oxford:
OUP, 1998).
• Clark, W.A.V., “Neighborhood Tipping in Multiethnic/Racial Context”, Journal of
Urban Affairs 15 (1993), 161-172.
• Dollard, J., L. W. Doob, N. E. Miller, O. H. Mowrer and R. R. Sears, Frustration
and Aggression, (New Haven: Yale Press, 1939).
• Dustmann, C. and I. Preston, “Attitudes to Ethnic Minorities, Ethnic Context and
Location Decisions”, The Economic Journal 111 (2001), 353-373.
• Dustmann, C. and I. Preston, “Racial and Economic Factors in Attitudes Towards
Migration”, CReAM DP1 (2004).
• Hovland, C. I. and R. R. Sears, “Minor Studies of Aggression: VI. Correlation of
Lynchings with Economic Indices”, Journal of Psychology 9 (1940), 301-310.
35
• Ira N. Gang, Francisco L. Rivera-Batiz and Myeong-Su Yun, “ Economic Strain,
Ethnic Concentration and Attitudes Towards Foreigners in the European Union”,
IZA DP5 578 (2002)
• Green, D. P., J. Glaser and A. Rich, “From Lynching to Gay Bashing: The Elusive
Connection Between Economic Conditions and Hate Crime”, Journal of Personality
and Social Psychology 75 (1998), 82-92.
• Green, D. P., L. H. McFalls and J. K. Smith, “Hate Crime: An Emergent Research
Agenda”, Annual Review of Sociology 27 (2001), 479-504.
• Green, D. P., D. Z. Strolovich, and J. S. Wong, “Defended Neighborhoods, Integra-
tion, and Racially Motivated Crimes”, American Journal of Sociology 104 (1998),
372-403.
• Home Office publication, ”Statistics on Race and the Criminal Justice System”,
(2000) www.homeoffice.org.uk/rds/pdfs/s95race00.pdf
• Karlsen S. and J. Nazroo, “The Relationship between Racial Discrimination, Social
Class and Health among Ethnic Minority Groups”, American Journal of Public
Health (2003), forthcoming.
• Kinder, D.R. and T. Mendelberg, “Cracks in American Apartheid: The Political
Impact of Prejudice among Desegregated Whites”, Journal of Politics 57 (1995),
402-424.
• Krueger, A. and J. S. Pischke, “A Statistical Analysis of Crime Against Foreigners
in Unified Germany”, Journal of Human Resources 32 (1997), 182-209.
• Levin, J. and J. McDevitt, Hate Crimes: The Rising Tide of Bigotry and Bloodshed,
(New York: Plenum Press, 1993).
• Le Vine, R.A. and D. T. Campbell, Ethnocentrism, (New York: Plenum Press,
1972).
36
• Mayda, A.M., “Who is Against Immigration? A Cross-Country Investigation of
Attitudes towards Immigrants”, Job Market Paper, Department of Economics, Har-
vard University, 2003).
• Park, A., J. Curtice, K. Thomson, L. Jarvis and C. Bromley, “British Social At-
titudes - Continuity and Change over Two Decades”, (London: Sage Publication
Ltd, 2003)
• Pettigrew, T. F., “Intergroup Contact Theory”, Annual Review of Psychology 49
(1998), 65-85.
• Powers, D. A. and C. G. Ellison, “Interracial Contact and Black racial Attitudes:
The Contact Hypothesis and Selectivity Bias”, Social Forces 74 (1995), 205-226.
• Quillian, L., “Prejudice as a Response to Perceived Group Threat:Population com-
position and Anti-Immigrant and Racial Prejudice in Europe”, American Sociolog-
ical Review 60 (1995), 586-611.
• Scheve, K. and Slaughter, M., “Labor-Market Competition and Individual Pref-
erences Over Immigration Policy”, Review of Economics and Statistics 83 (2001),
133-145.
• Suttles, G.D., The Social Construction of Communities, (Chicago: Chicago Univer-
sity Press, 1972)
• Smith, S.J., The Politics of ”Race” and Residence: Citizenship, Segregation and
White Supremacy in Britain, (Cambridge: Polity Press, 1989).
• Tolnay, S. E., E. M. Beck and J. L. Massey, “The Power Threat Hypothesis and
Black Lynching: ‘Wither’ the Evidence?”, Social Forces 67 (1989), 634-641.
• Virdee, S., “Racial Harassment”, in: T. Modood, R. Berthoud, J. Lakey, J.Nazroo,
P. Smith, S. Virdee and S. Beishon (eds), Ethnic Minorities in Britain: Diversity
and Disadvantage, (London: Policy Studies Institute, 1997)
37

• Virdee, S., Racial Violence and Harassment, (London: Policy Studies Institute,
1995).
38