Examining Gaps in Mathematics Achievement Among Racial ...
185
This PDF document was made available from www.rand.org as a public service of the RAND Corporation. 6 Jump down to document Visit RAND at www.rand.org Explore RAND Education View document details This document and trademark(s) contained herein are protected by law as indicated in a notice appearing later in this work. This electronic representation of RAND intellectual property is provided for non- commercial use only. Permission is required from RAND to reproduce, or reuse in another form, any of our research documents. Limited Electronic Distribution Rights For More Information CHILD POLICY CIVIL JUSTICE EDUCATION ENERGY AND ENVIRONMENT HEALTH AND HEALTH CARE INTERNATIONAL AFFAIRS NATIONAL SECURITY POPULATION AND AGING PUBLIC SAFETY SCIENCE AND TECHNOLOGY SUBSTANCE ABUSE TERRORISM AND HOMELAND SECURITY TRANSPORTATION AND INFRASTRUCTURE The RAND Corporation is a nonprofit research organization providing objective analysis and effective solutions that address the challenges facing the public and private sectors around the world. Purchase this document Browse Books & Publications Make a charitable contribution Support RAND
-
Upload
khangminh22 -
Category
Documents
-
view
1 -
download
0
Transcript of Examining Gaps in Mathematics Achievement Among Racial ...

This PDF document was made available
from www.rand.org as a public service of
the RAND Corporation.
6Jump down to document
Visit RAND at www.rand.org
Explore RAND Education
View document details
This document and trademark(s) contained herein are protected by law as indicated in a notice appearing later in this work. This electronic representation of RAND intellectual property is provided for non-commercial use only. Permission is required from RAND to reproduce, or reuse in another form, any of our research documents.
Limited Electronic Distribution Rights
For More Information
CHILD POLICY
CIVIL JUSTICE
EDUCATION
ENERGY AND ENVIRONMENT
HEALTH AND HEALTH CARE
INTERNATIONAL AFFAIRS
NATIONAL SECURITY
POPULATION AND AGING
PUBLIC SAFETY
SCIENCE AND TECHNOLOGY
SUBSTANCE ABUSE
TERRORISM AND HOMELAND SECURITY
TRANSPORTATION ANDINFRASTRUCTURE
The RAND Corporation is a nonprofit research organization providing objective analysis and effective solutions that address the challenges facing the public and private sectors around the world.
Purchase this document
Browse Books & Publications
Make a charitable contribution
Support RAND

This product is part of the RAND Corporation monograph series.
RAND monographs present major research findings that address the
challenges facing the public and private sectors. All RAND mono-
graphs undergo rigorous peer review to ensure high standards for
research quality and objectivity.

E x a m i n i n g G a p sin Mathematics AchievementAmong Racial-Ethnic Groups,
1972-1992
Mark Berends, Samuel R. Lucas,Thomas Sullivan, R.J. Briggs
Prepared for The Spencer Foundation and the U.S. Department of Education

The RAND Corporation is a nonprofit research organization providing objective analysis and effective solutions that address the challenges facing the public and private sectors around the world. RAND’s publications do not necessarily reflect the opinions of its research clients and sponsors.
R® is a registered trademark.
© Copyright 2005 RAND Corporation
All rights reserved. No part of this book may be reproduced in any form by any electronic or mechanical means (including photocopying, recording, or information storage and retrieval) without permission in writing from RAND.
Published 2005 by the RAND Corporation1776 Main Street, P.O. Box 2138, Santa Monica, CA 90407-2138
1200 South Hayes Street, Arlington, VA 22202-5050201 North Craig Street, Suite 202, Pittsburgh, PA 15213-1516
RAND URL: http://www.rand.org/To order RAND documents or to obtain additional information, contact
Distribution Services: Telephone: (310) 451-7002; Fax: (310) 451-6915; Email: [email protected]
Library of Congress Cataloging-in-Publication Data
Examining gaps in mathematics achievement among racial ethnic groups, 1972–1992 / Mark Berends ... [et al.]. p. cm. “MG-255.” Includes bibliographical references. ISBN 0-8330-3690-4 (pbk. : alk. paper) 1. Mathematics—Study and teaching—United States—Evaluation. 2. Mathematics—Study and teaching—United States—History—20th century. 3. Mathematical ability—Testing. 4. Minorities—Education—United States—Evaluation. I. Berends, Mark, 1962–
QA13.E956 2005 510'.71'073—dc22
2004023042
Cover design by Stephen Bloodsworth
The research described in this report was conducted by RAND Education for The Spencer Foundation and the U.S. Department of Education.

iii
Preface
As schools in the United States become more and more output driven within the context of current federal and state educational policies, students, educators, administrators, and policymakers are now being held accountable for improving the academic achievement of all stu-dents. In particular, as our society continues to become increasingly diverse, there is now a national focus on the achievement gaps between students of different social backgrounds (socioeconomic, racial-ethnic, language, and challenges or disabilities). In fact, with the recent pas-sage of the No Child Left Behind Act of 2001 (NCLB), federal educa-tion policy now mandates that states, districts, and schools monitor achievement gaps among different student groups.
Systematic empirical examination of these achievement gaps may provide important information on school improvement efforts. Analy-ses of how individual, family background, and school characteristics are associated with different achievement levels are important in such empirical examinations. Moreover, understanding changes in family and school factors and student achievement trends and their interre-lationships is important for understanding how the educational sys-tem contributes to inequities in our society. In this book we conduct a series of analyses of several family- and school-based factors posited as explaining the minority and nonminority test score trends between the early 1970s and early 1990s. We hope these analyses inform the ongoing debate about the quality of children’s family environments, the quality of their schools, and how changes in families and schools are associated with student achievement, particularly for students from different racial-ethnic groups. Within this debate, questions remain

iv Examining Gaps in Mathematics Achievement Among Racial-Ethnic Groups
regarding the effectiveness of public policies and increased investments in education and social programs in improving student achievement. As federal, state, and local policymakers attempt to improve the learn-ing conditions of all students, we hope our analyses are informative.
The research for this book was supported by a grant from the Field Initiated Studies Program, Office of Educational Research and Improvement, U.S. Department of Education, under grant number R305F960164 and by a grant from The Spencer Foundation, under grant number 199700213. Mark Berends and Samuel Lucas were the co–principal investigators for these projects. Thomas Sullivan and R. J. Briggs were the statistical analysts who did the programming for the analyses reported here. Mark Berends took the lead on writing the final manuscript for consistency and clarity.

v
Contents
Preface ...................................................................iiiFigures ................................................................... ixTables ....................................................................xiSummary ............................................................... xiiiAcknowledgments ...................................................... xviiAbbreviations ............................................................xix
CHAPTER ONE
Explaining Student Achievement Gaps Over Time ....................... 1Background and Significance ............................................. 2Student Test Score Trends Between the 1970s and 1990s ................. 4Families, Schools, and Student Test Score Gaps ........................... 6Organization of Analysis ................................................. 11
CHAPTER TWO
Individual, Family, and School Conditions and Their Relationships to Student Achievement ............................................ 13
Theoretical Perspectives for Examining Student Achievement ............ 14Economic, Human Capital Perspective ................................ 14Status Attainment Research ........................................... 15Human Development Ecological Perspective .......................... 17Schools as Organizations .............................................. 18
Examining Families, Schools, and Student Achievement Gaps ........... 22Individual and Family Characteristics .................................... 23
Racial-Ethnic Group .................................................. 23Gender ................................................................ 24

vi Examining Gaps in Mathematics Achievement Among Racial-Ethnic Groups
Socioeconomic Status (Family Income, Parents’ Educational Attainment, and Occupational Status) ............................. 25
School Factors ........................................................... 27Socioeconomic Composition .......................................... 27Racial-Ethnic Composition ........................................... 28School Sector ......................................................... 28High School Tracking ................................................. 29
CHAPTER THREE
Data and Methodology ................................................. 33Data for High School Senior Cohorts .................................... 33
National Longitudinal Study of the High School Class of 1972 ....... 33High School and Beyond ............................................. 34National Education Longitudinal Study .............................. 34National Assessment of Educational Progress ......................... 35
Dependent Measure: Mathematics Achievement ......................... 35Definitions of Family Variables .......................................... 37
Race-Ethnicity ........................................................ 37Gender ................................................................ 37Parents’ Education .................................................... 37Parent Occupational Status ............................................ 38Family Income ........................................................ 38
School Variables ......................................................... 39School Socioeconomic Composition .................................. 39School Minority Composition ......................................... 39School Sector ......................................................... 40School Urban Locale .................................................. 40High School Track Placement ......................................... 40
Methodology ............................................................ 41
CHAPTER FOUR
Trends in Mathematics Achievement, Family, and School Characteristics, 1972–1992 ......................................... 47
Test Score Differences Among Racial-Ethnic Groups over Time .......... 47Changes in Family Background Characteristics Among Racial-Ethnic
Groups ............................................................ 49

Black-White Family Background Trends ............................... 50Latino-White Family Background Trends .............................. 51
Changes in School Characteristics Among Racial-Ethnic Groups ........ 52Black-White Differences in School Characteristics ..................... 53Latino-White Differences in School Characteristics .................... 55
Changes in Self-Reported Track Placement Among Racial-Ethnic Groups ............................................................ 56
Black-White Differences in Self-Reported Academic-Track Placement ......................................................... 57
Latino-White Differences in Self-Reported Academic-Track Placement ......................................................... 58
Summary ................................................................ 58
CHAPTER FIVE
The Relationships Between Mathematics Test Score Gaps and Changes in Families and Schools, 1972–1992 .................. 61
Decomposing Changes in the Black-White Test Score Gap ............... 61Decomposing the Black-White Test Score Gap in 1992 ................ 64
Decomposing Changes in the Latino-White Test Score Gap ............. 65Decomposing the Latino-White Test Score Gap in 1992 ............... 67
CHAPTER SIX
Test Score Gaps Among Racial-Ethnic Groups: Conclusions and Policy Implications ............................... 69
Limitations of Our Analysis ............................................. 69Changes in Mathematics Score Gaps Among Blacks,
Latinos, and Whites ............................................... 70Changes in Families and Test Score Gaps in Mathematics ................ 71Changes in Schools and Test Score Gaps in Mathematics ................ 73Persistent Inequality in the Mathematics Test Score Gaps ................ 74Policy Implications of Our Analysis ...................................... 76
APPENDIX
A. Item Response Theory Scaling of Pooled Senior Cohorts in NLS, HSB, and NELS ................................... 83
Contents vii

viii Examining Gaps in Mathematics Achievement Among Racial-Ethnic Groups
B. Mathematics Items Mapping Across Data Sources, 1972–1992 ........................................................109
C. Item Response Theory Estimation Methods .........................115D. Survey Items Used to Operationalize Individual, Family,
and School Measures in NLS-72, HSB-82, and NELS-92 ..........119E. Multilevel Results Relating Mathematics Achievement
to Individual, Family, and School Characteristics, 1972–1992 ......131
References ..............................................................139

ix
Figures
Figures
1.1 NAEP Mathematics Proficiency for 17-Year-Olds by Race-Ethnicity ..................................................... 4
1.2 NAEP Reading Proficiency for 17-Year-Olds by Race-Ethnicity ..... 5 4.1 Black-White Mathematics Differences in the Senior Cohorts
Compared with the NAEP Trend Assessment ..................... 48 4.2 Latino-White Mathematics Differences in the Senior Cohorts
Compared with the NAEP Trend Assessment ..................... 49 A.1 Test Characteristic Curve, All 25 Mathematics Items ............... 93 C.1 Latent Proficiency Distribution of Mathematics Scores for Each
Senior Cohort NLS-72, HSB-80, and HSB-82 from Option I ...116


xi
Tables
4.1 Selected Racial-Ethnic Differences in Family Background Characteristics in LS Data, 1972–1992 ........................... 51
4.2 Racial-Ethnic Differences in School Conditions in LS Data, 1972–1992 ....................................................... 54
4.3 Racial-Ethnic Differences in Self-Reported Track Placement in LS Data, 1972–1992 .............................................. 57
5.1 Decomposition of the Relationships of Family Background, Track, and School Measures to the Convergence in Black-White Mathematics Scores, 1972–1992 .................................. 62
5.2 Decomposition of the Relationships of Family Background, Track, and School Measures to the Convergence in Latino- White Mathematics Scores, 1972–1992. .......................... 66
A.1 Weighted Comparison of IRT Number Right Mathematics Formula Score Estimates with ETS’s Original Estimates ........... 89
A.2 Weighted Results of Pooled IRT Scaling (NRFS) ................... 91 A.3 Weighted Results of Pooled IRT Scaling for the NELS
Adaptive Groups (NRFS) ......................................... 91 A.4 Source Used to Create Different Mathematics Variables ............ 92 A.5 Decomposition of Changes in NRFS from Three-Cohort to
Four-Cohort Pooling .............................................. 94 A.6 Weighted Summary of Test Scores by Cohort ...................... 95 A.7 National Longitudinal Study of the High School Class of 1972 .... 97 A.8 High School and Beyond 1980 ..................................... 98 A.9 High School and Beyond 1982 ..................................... 99 A.10 National Longitudinal Study, Senior Class 1992 .................100

xii Examining Gaps in Mathematics Achievement Among Racial-Ethnic Groups
A.11 Weighted Standard Deviation Differences Between Racial-Ethnic Groups ............................................101
A.12 Mathematics Achievement Differences Between Racial-Ethnic Groups in the National Assessment of Educational Progress Trend Assessment for 17-Year-Olds (in Standard Deviation Units) .................................................101
A.13 Standardized Differences in Mathematics Proficiency (in Standard Deviation Units) ....................................103
A.14 Distribution of Population of Twelfth-Grade High School Students by Race-Ethnicity .......................................104
B.1 Mathematics Items Mapping Across Data Sources, 1972–1992 ......................................................109
D.1 Survey Items Used to Operationalize Individual, Family, and School Measures in NLS-72, HSB-82, and NELS-92 ............120
E.1 Family Background, Individual, and School Measures for LS High School Senior Cohorts ...........................................132
E.2 Relationships of Individual, Family Background, and School Measures to Seniors’ Mathematics Achievement in LS Data, 1972–1992 (Weighted) ..........................................135

xiii
Summary
With the passage of NCLB, students, teachers, and schools face great test-based accountability for ensuring that all students in the United States are meeting rigorous, challenging standards for academic work. As the name of this legislation implies, no child is to be left behind. To monitor progress toward this ambitious goal, states and districts are required to monitor the achievement gaps between students from dif-ferent groups (socioeconomic, racial-ethnic, language, and disability). Although it will be a few years before states’ test-based accountability systems are fully implemented to monitor students’ mathematics and reading achievement, it is important to understand those factors that are related to student test score gaps. In this book we focus on the mathematics test score gaps among black, Latino, and white students.1 We examine several nationally representative senior high school stu-dent cohorts between the early 1970s and early 1990s to understand trends in the mathematics scores of these different racial-ethnic groups. We also analyze how changes in family, school, and schooling measures help explain changes in the test score gaps over time.
It is our belief that systematic empirical examination of these achievement gaps may provide results that inform social theory, public policy, school improvement efforts, and future data collection efforts. We hope these analyses contribute to the ongoing discussion about the qual-
1 The focus of our analysis is on black, Latino/Latina, and non-Latino/a students. Such classifi-cations are not without controversy and at times confusing. For example, non-Latino/as could include individuals who are black. Our analyses use the student self-reported racial-ethnic classification to create nonoverlapping categories for blacks, Latinos, and whites. Rather than use cumbersome language in the text of Latino/a and non-Latino/a, we simply refer to these student groups as blacks, Latinos, and whites.

xiv Examining Gaps in Mathematics Achievement Among Racial-Ethnic Groups
ity of children’s family environments, the quality of their schools, and how changes in families and schools are associated with student achieve-ment, particularly for students from different racial-ethnic groups.
Our analyses aim to contribute to theory, research, and policy that address how family and school measures are related to black-white and Latino-white test score gaps over time. There are only a few studies that are able to examine the relationships between student test score gaps and family and school measures in nationally representative data over several time periods. We build on this previous work and address some of its limitations by analyzing nationally representative data in 1972, 1982, and 1992, which provides consistent measures of students’ mathematics achievement and several school and family measures. We also motivate our analyses and the family and school measures we analyze by discussing several different theoretical perspectives from economics, sociology, child development, and organizational analysis. Grounded in past theory and research, the main research questions of our analyses include:
• How did the test scores of blacks, Latinos, and whites change between the early 1970s and early 1990s?
• How did selected family and school measures change over this period?
• To what extent were changes in these measures associated with the convergence of the black-white and Latino-white test score gaps that occurred during this period?
• What are the policy implications that arise from our empiri-cal analyses examining how changes in families and schools are related to student gaps in mathematics achievement?
To address these questions, we compare the racial-ethnic test score gaps to changes in individual, family, school, and schooling measures that were comparable across several cohorts for high school seniors. The data used are nationally representative: the National Longitudinal Study of the High School Class of 1972 (NLS-72), High School and Beyond study (HSB-82, for the 1982 follow-up), and the National Education Longitudinal Study of 1988 (NELS-92, for the 1992 follow-up). Because these data are part of the Longitudinal Studies program

within the U.S. Department of Education, we refer to these data sets as the “LS cohorts” and compare our findings, when appropriate, to the trend assessment of the National Assessment of Educational Progress (NAEP). Within these LS data sets, there are common mathematics test score items across the cohorts, so we were able to equate the tests over time to make them comparable. With these equated mathemat-ics scores, we examine how the black-white and Latino-white math-ematics gap changed over time and whether changes in family and school measures are related to these trends in test score differences. We describe changes in the mathematics gap, as well as changes in several comparable family, school, and schooling measures. We relied on mul-tivariate analyses to assess whether changes in the average levels of the family and school measures scaled to the coefficients from the earliest cohort correspond to changes in student achievement gaps.
The patterns spanning the early 1970s to the early 1990s reveal a narrowing of the black-white and Latino-white differences in math-ematics achievement. In both the LS senior cohorts and NAEP data, we see a significant reduction between 1972 and 1992 in the black-white (from 1.09 to 0.87 standard deviation unit difference, or a 20 percent reduction) and Latino-white (from a 0.88 to a 0.60 stan-dard deviation unit difference, or a 32 percent reduction) mathematics test score gaps. Although the gaps remain large, the significant conver-gence is something we are able to examine further in these data.
When examining the changes across the senior cohorts in the lev-els of family background measures and their relationships to math-ematics achievement over time, we find that the socioeconomic condi-tions of black and Latino students improved relative to white students. Moreover, these improved socioeconomic circumstances corresponded to decreases in the black-white and Latino-white mathematics gaps. For example, the family background measures we analyze (i.e., fam-ily income, parent education, and socioeconomic status) alone corre-sponded to a 54 percent decrease of the black-white gap in mathematics scores between 1972 and 1992. For Latinos, our results reveal that the improved social conditions of Latino students during the 1972–1982 time frame corresponded to the convergence in mathematics scores with white students over this ten-year period. However, the family and
Summary xv

xvi Examining Gaps in Mathematics Achievement Among Racial-Ethnic Groups
school conditions of Latino students did not continue to converge with white students between 1982 and 1992, which corresponded to an increase of the Latino-white mathematics gap over this later period.
In contrast to these positive family changes, the changes that occurred between schools did not correspond to the closing of the mathematics test score gaps between black and white and Latino and white students. Our analyses reveal that the increases in the minority composition of high schools that black (and Latino) students attended between 1972 and 1992 corresponded to an increase of the test score gaps. Thus, the convergence of black-white and Latino-white math-ematics gap might have been even greater if the minority composi-tion of the schools that black and Latino students attended had not increased over this 20-year period.
Although there were few positive changes between schools, the within-school experiences of black and Latino students changed for the better compared with white students when measured by student self-reported academic-track placement. In both 1972 and 1992, we find that about half of white students reported being in the academic track. By contrast, about 28 percent of black students reported academic-track placement in 1972, and 41 percent of black students reported such placement in 1992. For Latino students, 26 percent reported academic-track placement in 1972 compared with 37 percent in 1992. When these changes are scaled to the coefficients of the 1972 cohort, we find that these changes for black and Latino students reporting academic-track placement corresponded to nearly 60 percent of the black-white mathematics gap between 1972 and 1992 and 34 percent of the Latino-white gap over this 20-year period.
Our analyses do not allow us to determine the causes of the conver-gence of black-white and Latino-white mathematics scores. Rather, we can only examine the correspondence among family, school, and achieve-ment measures in ways that we believe build on previous research. Our analyses have several limitations, and we point out that it is important to remember these when we discuss the policy implications of our analysis. We point out the possibilities of various policies that address improving the socioeconomic and educational opportunities of students. In addi-tion, we argue that it will be necessary for policymakers to think in more creative, coordinated, and comprehensive ways if we are to more effec-tively address student achievement gaps.

xvii
Acknowledgments
We are grateful to our reviewers, Daniel McCaffrey of RAND and Meredith Phillips of the University of California, Los Angeles. This book benefited greatly in substance, clarity, and technical detail from their careful review and comments.
We also appreciate the generous cooperation of the National Center for Education Statistics in providing the restricted-use data, of Donald Rock and Judith Pollack of ETS, who shared with us their IRT expertise and data, and of Mathilde Dutoit of Scientific Software International, who provided technical support. We are thankful for the insights of Ellen Goldring, David Grissmer, Daniel Goldhaber, Laura Hamilton, Robert M. Hauser, and Daniel Koretz, and Maria Orlando, who all provided helpful advice along the way. In writing up of the final manuscript, Al Boerema, a doctoral student at Peabody College of Vanderbilt University, provided valuable research assistance. Of course, this book does not reflect the views of these agencies or individuals; any errors are the responsibility of the authors.


xix
Abbreviations
3PL three-parameter logistic modelCPI consumer price indexECLS Early Childhood Longitudinal StudyECLS-B Early Childhood Longitudinal Study, Birth CohortECLS-K Early Childhood Longitudinal Study, Kindergarten Class
of 1998–1999EEO Equality of Educational Opportunity survey of 1965ETS Educational Testing ServiceHSB High School and Beyond StudyHSB-82 High School and Beyond senior cohort of 1982ICC Item Characteristic CurveIRT Item Response Theory LS Longitudinal Studies (program within the U.S. Depart-
ment of Education)MLE maximum likelihood estimationMML Marginal Maximal LikelihoodNAEP National Assessment of Educational ProgressNCDS National Child Development Study (UK)NCES National Center for Education StatisticsNCLB No Child Left Behind Act of 2001NELS National Educational Longitudinal StudyNELS-88 National Education Longitudinal Study of 1988NELS-92 National Education Longitudinal Study of the senior co-
hort of 1992

xx Examining Gaps in Mathematics Achievement Among Racial-Ethnic Groups
NLS-72 National Longitudinal Study of the high school class of 1972
NLSY National Longitudinal Survey of YouthNLSY-80 National Longitudinal Survey of Youth of 1980NRFS Number Right Formula ScoreNRTS Number Right True ScoreSEI (Duncan’s) Socioeconomic IndexSES socioeconomic status

1
CHAPTER ONE
Explaining Student Achievement Gaps Over Time
Systematic empirical examination of the effects of changes between and within schools on student achievement is important for provid-ing a context to assess current educational reforms at the federal, state, and local levels. In this analysis, we empirically examine several family- and school-based explanations for black-white and Latino-white test score differences over the past 20 years, using data available for several national cohorts of high school seniors between 1972 and 1992.1 Spe-cifically, the main research questions we analyze include:
• How did the test scores of blacks, Latinos, and whites change between the early 1970s and early 1990s?
• How did selected family and school measures change over this period?
• To what extent were changes in these measures associated with the convergence of the black-white and Latino-white test score gaps that occurred during this period?
• What are the policy implications that arise from our empiri-cal analyses examining how changes in families and schools are related to student gaps in mathematics achievement?
1 Our analyses focus on the mathematics test score differences among black, Latino/Latina, and non-Latino/a students. Such classifications are not without controversy and at times confusing. Our analyses use the student self-reported racial-ethnic classification to create nonoverlapping categories for blacks, Latinos, and whites. We want to avoid cumbersome language in the text, such as the use of Latino/a and non-Latino/a, so we simply refer to these student groups as blacks, Latinos, and whites. Our focus is not an indication that issues related to other races and ethnicities are less important. Certainly, there is a need for richer national data to examine other groups, such as Native American and Asian American students (Ferguson, 1998).

2 Examining Gaps in Mathematics Achievement Among Racial-Ethnic Groups
Background and Significance
The debate about the quality of students’ family environments, the qual-ity of their schools, and how changes in families and schools may be affecting student achievement continues despite decades of research. Within this debate, questions remain regarding the effectiveness of public policies and increased investments in education and social programs in improving student achievement. Throughout the economic prosperity of the 1990s, nearly one in five children continued to live in poverty. With the economic uncertainties of the early 21st century, childhood poverty has increased (Seccombe, 2002; U.S. Census Bureau, 2001). As federal and local policymakers consider programs for families and schools, infor-mation about achievement trends and those family and school factors related to them is beneficial when creating and modifying policies.
Some researchers raise concerns that worsening family environ-ments and schools have negative consequences for students’ educational outcomes (Christensen, 1990; Haveman and Wolfe, 1994; Herrnstein and Murray, 1994; Murray and Herrnstein, 1992; Popenoe, 1988, 1993, 1996; Uhlenberg and Eggebeen, 1986). Yet not all research sup-ports the claims about the negative effects of changes in families and schools on student achievement (Berliner and Biddle, 1995; Camp-bell, Hombo, and Mazzeo, 2000; Cook and Evans, 2000; Grissmer et al., 1994; Hedges and Nowell, 1998; Koretz, 1986, 1987, 1992; Lankford and Wyckoff, 1995; Porter, forthcoming; Tyack and Cuban, 1995). The conventional wisdom about schools is that expenditures have doubled in real terms over the past few decades, but achievement scores have declined (Hanushek, 1986, 1989, 1994). This has led to continuing calls for educational reform, reflected in the recent federal legislation No Child Left Behind Act of 2001 (NCLB), which places greater emphasis on high standards for student learning, testing, and accountability (<http://www.ed.gov/legislation/ESEA02/>; on test-based accountability, see Hamilton, Stecher, and Klein, 2002).
Because of the ongoing debates about families and schools, it is important to consider a more complete set of family and school changes that have taken place and to apply multivariate methods for estimat-ing the net associations among changes in these measures and student

Explaining Student Achievement Gaps Over Time 3
achievement. In addition, researchers have infrequently assessed such associations among family and school measures and student achievement with several different longitudinal national cohorts.
Current educational reformers stress raising the achievement of the entire population while reducing disparities among groups, which is certainly an important goal despite being a significant challenge (Berends, Bodilly, and Kirby, 2002; Jencks and Phillips, 1998). In part, the concern over some of these achievement gaps—for example, those between racial-ethnic groups—has been heightened by the grow-ing diversity in the United States. The recent NCLB legislation, reau-thorizing Title I, which is the largest federal funding program aimed at disadvantaged students, requires states to report achievement gaps between certain subgroups to help schools, districts, and states decrease achievement gaps over time. Specifically, NCLB states that the purpose of Title I is
to ensure that all children have a fair, equal, and significant oppor-tunity to obtain a high-quality education and reach, at a minimum, proficiency on challenging state academic achievement standards and state academic assessments. This purpose can be accomplished by . . . closing the achievement gap between high- and low- performing children, especially the achievement gaps between minority and nonminority students, and between disadvantaged children and their more advantaged peers . . . . (1001 NCLB 3)
The past several decades represent a unique period and provide an opportunity to assess the independent relationships of families, schools, and public policies to students’ achievement gaps in a comprehensive manner. Current educational and family reforms are unlikely to be suc-cessful if we do not accurately estimate how the fundamental changes over time are related to student outcomes. Additional empirical analy-ses need to be done to place current student achievement scores in the context of long-term test score trends, to examine the relationships between these test score trends and changes in families and schools, and to address changes in educational policies (e.g., school desegrega-tion, tracking and ability grouping, standards-based reform, and com-prehensive school reform).

4 Examining Gaps in Mathematics Achievement Among Racial-Ethnic Groups
Student Test Score Trends Between the 1970s and 1990s
What is the context of long-term test score trends in the United States? How did the test scores of black, Latino, and white students change between the early 1970s and early 1990s? Students, especially black and Latino students, are scoring higher on mathematics and read-ing tests today than they were a few decades ago. Figures 1.1 and 1.2 show these trends for 17-year-old students between the early 1970s and the late 1990s on the National Assessment of Educational Progress (NAEP) mathematics and reading tests (see Campbell, Hombo, and Mazzeo, 2000). Overall, U.S. high school students today are scoring about the same as they were in the early 1970s in terms of achievement proficiency in mathematics and reading.
These overall trends mask significant progress made among cer-tain groups. For instance, over the past 30 years, minority students
Figure 1.1NAEP Mathematics Proficiency for 17-Year-Olds by Race-Ethnicity
RAND MG255-1.1
Ave
rag
e p
rofi
cien
cy
300
280
260
240
2201996199419921990
Year
1986198219781973 1999
320
SOURCE: U.S. Department of Education. Office of Educational Research and Improve-ment. National Center for Education Statistics. NAEP 1999 Trends in Academic Progress: Three Decades of Student Performance, NCES 2000–469, by J.R. Campbell, C.M. Hombo, and J. Mazzeo. Washington, DC: 2000.
TotalWhiteBlackHispanic

Explaining Student Achievement Gaps Over Time 5
made substantial progress toward closing the minority-nonminority test score gap in both mathematics and reading. In 1999 black students scored 13 points higher (or 14 percentile points) on the NAEP math-ematics test and about 27 points higher (or 21 percentile points) in reading than black students in the early 1970s. Similarly, Latinos made large improvements in achievement. Between 1973 and 1994 Latinos gained 16 points (16 percentile points) on the NAEP mathematics test, and between 1975 and 1994 Latinos gained 11 points (or 17 percentile points) in reading.
In recent years, as the minority trend lines in Figures 1.1 and 1.2 show, black and Latino students’ gains in reading have not continued to increase as they did in the 1970s and 1980s. However, minority students are still performing markedly higher than similar students did over 25 years ago (see Porter, forthcoming).
Figure 1.2NAEP Reading Proficiency for 17-Year-Olds by Race-Ethnicity
RAND MG255-1.2
Ave
rag
e p
rofi
cien
cy
300
280
260
240
2201994199219901988
Year
1984198019751971 1999
320
1996
SOURCE: U.S. Department of Education. Office of Educational Research and Improve-ment. National Center for Education Statistics. NAEP 1999 Trends in Academic Progress: Three Decades of Student Performance, NCES 2000–469, by J.R. Campbell, C.M. Hombo, and J. Mazzeo. Washington, DC: 2000.
TotalWhiteBlackHispanic

6 Examining Gaps in Mathematics Achievement Among Racial-Ethnic Groups
Families, Schools, and Student Test Score Gaps
Although many researchers have addressed possibilities for why the test score gaps have closed over the past several decades (e.g., Ferguson, 1998; Koretz, 1986, 1987; Porter, forthcoming), only a few researchers have been able to empirically study how changes in family background and school factors related to the test score convergence that occurred (Cook and Evans, 2000; Grissmer et al., 1994; Grissmer, Flannagan, and Williamson, 1998; Hedges and Nowell, 1998). The main reason for this is the lack of data for multiple student cohorts that would allow for the examination of relationships between family and school mea-sures and student achievement gaps.
A few studies have been able to examine how changes in fam-ily background factors relate to student achievement gaps in national data. For example, RAND research by Grissmer et al. (1994) was spe-cifically interested in how changes in families related to the test score gaps among black, Latino, and white students. In their analyses of the National Education Longitudinal Study of 1988 (NELS-88) and the National Longitudinal Survey of Youth (NLSY-80), they described how students’ family background (parents’ educational attainment, family income, and mother’s work status) and family structure (family size, age of mother at child’s birth, and single-mother household) were related to mathematics and reading achievement.
Grissmer et al. (1994) estimated the net effects on mathemat-ics and reading scores of several important family changes occurring between the early 1970s and early 1990s and provided information about what non-family factors may have contributed to achievement trends. Specifically, the study examined how achievement scores would change for 14- to 18-year-olds raised in families of the 1950s and 1960s compared to families of the 1970s and 1980s. In addition to estimat-ing the effects of family changes on overall test scores, Grissmer et al. also estimated the effects for different racial-ethnic groups. Moreover, Grissmer et al. (1994) compared actual changes in NAEP achievement to those predicted by changes in family characteristics. This approach produced residual estimates that provided indicators of the effects of factors operating outside the family. These residuals were obtained by

Explaining Student Achievement Gaps Over Time 7
comparing the predicted test score changes to actual changes in test scores based on the NAEP data during the period of the study.
Grissmer et al.’s findings revealed that black, Latino, and white academic achievement should have risen between the early 1970s and early 1990s. Overall, they predicted a gain of about 0.20 of a stan-dard deviation for 14- to 18-year-old youth in 1990 compared to simi-larly aged youth in 1970. They found that the major factors leading to higher predicted test scores were the markedly higher education levels for 1990 parents and smaller family size. Children in 1990 were living with better-educated parents, in smaller families, with more income per child. Grissmer et al. concluded that the effect of these factors far outweighed the negative impact of more single-parent families, a small shift in births to younger mothers, and the changing racial-ethnic com-position of the American population.
When estimating the effects of family changes for different racial-ethnic groups, Grissmer et al. (1994) also predicted positive test score gains. Black and Latino students made sizable gains in test scores over and above the gains that family changes would predict, while white stu-dents did not. Grissmer et al.’s results suggested that changes in minor-ity family characteristics—when considered together—were more supportive of student achievement in 1990 than in the early 1970s. Although their analyses fully accounted for the gains of white students, they concluded that changing family characteristics accounted for no more than about a third of the gain for black and Latino students. Attempting to explain what factors outside the family were related to the black and Latino achievement gains, the RAND researchers sug-gested that changes in educational policies and public investment may have been influential, although further research was certainly needed (see Berends, Grissmer, Kirby, and Williamson, 1999).
In subsequent research, Grissmer, Flanagan, and Williamson (1998) extended their analysis by examining what factors may have contributed to the test score gap convergence between black and white students. Although this later study did not examine Latino-white test gaps, some of the factors they examine may have contributed to the closing of that gap as well. Grissmer, Flanagan, and Williamson (1998) moved beyond changes in family characteristics and reviewed factors

8 Examining Gaps in Mathematics Achievement Among Racial-Ethnic Groups
that may have changed between the early 1970s and early 1990s, such as desegregation, secondary school tracking, changes in the curriculum, per pupil expenditures, pupil-teacher ratios, teachers’ educational back-ground and experience, and school violence. Based on their review of extant research, Grissmer, Flanagan, and Williamson (1998) concluded that both social investment in the 1960s and 1970s (i.e., the civil rights movement and the War on Poverty programs) and the school-based changes (desegregation, secondary school tracking, and class size) were the likely factors that explain the closing of the test score gap between black and white students.
Building on the research by Grissmer and colleagues (1994), Hedges and Nowell (1999) were also interested in the achievement gaps among students over the past 30 years and how family back-ground characteristics were related to any changes in those gaps. In their study of several national data sets from the early 1960s to the early 1990s, Hedges and Nowell (1998, 1999) pointed out several limita-tions of Grissmer et al.’s (1994) research. Their criticisms were aimed at Grissmer et al.’s assumptions that the effects of family characteristics on student achievement remained the same between the early 1970s and early 1990s and that all unexplained changes in the test score gaps were attributable to social and educational policies. Hedges and Nowell addressed some of these problems by analyzing all the national data that were available between 1965 and the early 1990s that included student test scores and family characteristics such as parents’ educa-tional attainment, family income, and mother’s work status.2
Similarly to Grissmer et al. (1994), Hedges and Nowell (1998, 1999) found that the black-white test score gap did narrow signifi-cantly over time when they examined changes in mean achievement levels. In addition, their analyses of family background characteristics accounted for roughly one-third of the achievement gap, which is also similar to the Grissmer et al. findings. However, in contrast to Griss-mer et al., Hedges and Nowell found that the relationships between
2 These data include the EEO survey of 1965, the National Longitudinal Study of the High School Class of 1972 (NLS-72), the High School and Beyond surveys (HSB), the National Longitudinal Survey of Youth of 1980 (NLSY-80), the National Education Longitudinal Study of 1988 (NELS-88), and NAEP.

Explaining Student Achievement Gaps Over Time 9
family characteristics and student achievement were not constant over time. Moreover, Hedges and Nowell argued that we need more direct measures of educational policies that may have contributed further to the closing of the gap.
Although it makes a significant contribution to our understanding of black-white test score trends as they relate to family characteristics, the Hedges and Nowell studies (1998, 1999) are not without limitations. First, the measures of family characteristics (e.g., family income and par-ents’ education) were not operationalized in the same way. For example, in the 1965 Equality of Educational Opportunity (EEO) data, Hedges and Nowell used possessions in the home as a proxy for family income because income data were not available in the EEO as they were in the other data they analyzed. Second, Hedges and Nowell were not able to examine changes in schools that occurred during the early 1960s and 1990s, and they raised the importance of such analyses. Finally, although such changes were beyond the scope of the Hedges and Nowell studies, it was unfortunate that they did not examine changes in the Latino-white test score gap as they did for the black-white gap.
Extending research to examine school quality, Cook and Evans (2000) were specifically interested in whether it was changes in family characteristics or changes in school quality (or both) that were associ-ated with the narrowing of the black-white test score gap over time. Analyzing the NAEP trend assessment, their research focused not only on how changes in mean levels of family and school characteristics were related to the black-white test score trends, but also on how the rela-tionships between family and school measures were related to achieve-ment differences in reading and mathematics. They found that only about 25 percent of the overall convergence in black-white test scores can be attributed to changing family and school characteristics. They argued that the remainder is due to changes within schools.
There are several strengths of the Cook and Evans (2000) study. First, they were able make fewer assumptions than the studies reviewed above. For example, Cook and Evans examined tests that were stable over time, in contrast to the studies by Grissmer and colleagues (1994, 1998) and Hedges and Nowell (1998, 1999). In addition, their meth-ods allowed them to examine how changes in the relationships between

10 Examining Gaps in Mathematics Achievement Among Racial-Ethnic Groups
their measures and student achievement differ over time, again in con-trast to work by Grissmer and colleagues (1994, 1998) that assumed stability of these relationships. Finally, Cook and Evans extended the critical work on changes in families to include changes in school qual-ity when examining the black-white test score gap.
However, their study also has its limitations. First, they were limited to examining family background changes as measured by par-ent educational attainment. Unfortunately, the NAEP is very limited in terms of family background measures because it lacks other fam-ily measures such as parent income, occupational status, and other family characteristics (Berends and Koretz, 1996; Grissmer, Flana-gan, and Williamson, 1998). Second, their measure of school quality was lacking in that they assume that “school quality is the effect that attending a given school has on student performance after controlling for the student’s observable characteristics” (Cook and Evans, 2000, p. 732). Although they discuss how omitted variable biases may affect their results, their analyses lacked direct measures of schools, how these school measures changed, and how these changes were associated with student test score gaps. Third, similarly to Hedges and Nowell (1998, 1999), their focus was on the black-white test score gap, and they did not examine Latino-white test score differences.
Thus, despite this important past research, questions remain about achievement differences among black, Latino, and white stu-dents and about what family and school factors are associated with achievement gaps over time. Our analyses aim to build on the work of Grissmer and colleagues (1994, 1998), Hedges and Nowell (1998, 1999), and Cook and Evens (2000) with data for three senior cohorts in 1972, 1982, and 1992. Although decomposing the black-white and Latino-white achievement gaps into changes in families and schools is a complex exercise (Berends, Grissmer, Kirby, and Williamson, 1999; Grissmer, Flanagan, and Williams, 1998), we believe our analyses make important contributions. For instance, similarly to Cook and Evans, we attempt here to use methods that allow for examination of changes in mean levels of family and school characteristics and changes in the relationships of these characteristics to student achievement. However, we do so by using data that have several direct measures of students’

Explaining Student Achievement Gaps Over Time 11
family and school characteristics, measured consistently over time. In addition, unlike some past studies, we equate the mathematics achieve-ment tests over the 1972, 1982, and 1992 student cohorts to make the achievement measure comparable over time.
The analyses that follow in subsequent chapters provide results about specific family and school factors that are related to student achievement trends, particularly the black-white and Latino-white mathematics test score gaps for students in high schools. No studies have comprehensively analyzed several family and school measures across nationally represen-tative data for different cohorts of high school seniors with comparable achievement outcomes. Our study aims to fill this gap.
Organization of Analysis
The next chapter discusses some theories and research on the family and school measures that motivate our analyses in subsequent chapters; although differing in important ways, such theory and research points to the importance of the family and school measures we are able to analyze in national data. Chapter Three provides details on our data and meth-ods. The analyses describing the mathematics test score differences and changes in individual, family, and school measures appear in Chapter Four. We decompose the changes in the means of key family and school measures and their associations with the black-white and Latino-white mathematics achievement gaps in Chapter Five. In Chapter Six we con-clude with a summary of our findings and discuss the policy implica-tions of our analyses. Appendices A through C describe the test score equating procedures we used to examine the effects of individual, family, and school measures on students’ mathematics achievement. Appendix D provides information about the measurement of the family and school measures we analyze, and Appendix E provides more detailed results of the analyses presented in Chapters Four and Five.


13
CHAPTER TWO
Individual, Family, and School Conditions and Their Relationships to Student Achievement
This chapter reviews some of the research on family and school measures that have been related to student achievement and can be measured in our analysis. Although our focus is on how changes in families and schools between 1972 and 1992 are related to student achievement trends, it is important to understand the relevant research that examines these fac-tors with a variety of data and methods. We begin the chapter by discuss-ing some theoretical perspectives on human capital, status attainment, human development, and schools as organizations. Although different, all of these aspects point to the importance of examining the relation-ships between student achievement and the family and school measures in our analysis. In particular, the perspectives we discuss all emphasize the importance of family background characteristics, particularly socio-economic status (e.g., family income, parents’ educational attainments, and parents’ occupational status). Some perspectives also emphasize the importance of school quality. Although we are unable to test one theo-retical perspective against the others, we are able to place our research within a context of theoretical perspectives that emphasize the impor-tance of family and schools for the development of students’ academic achievement. We end the chapter by briefly highlighting several indi-vidual, family, and school measures that we are able to measure in our analyses and that previous researchers have related to student achieve-ment in multivariate analyses.

14 Examining Gaps in Mathematics Achievement Among Racial-Ethnic Groups
Theoretical Perspectives for Examining Student Achievement
There are several different perspectives that explicate the processes link-ing family and school factors to academic achievement. These perspec-tives stem from different paradigms or frameworks concerning what the important factors are that influence youth outcomes, and each uses methods and approaches tailored to a specific field of study. Yet each points to the importance of the family and school measures examined in the analyses that follow, despite their different interpretation of the family dynamics underlying the observed associations with student achievement.
Economic, Human Capital Perspective
A basic economic model linking child achievement to family char-acteristics has its foundation in both theories of production and the human capital approach, which views investments in an individual’s knowledge, skills, habits, values, and areas of expertise as having pay-offs in the form of adult attainments such as increased earnings and wealth (Becker, 1981, 1993; Becker and Tomes, 1986; Schultz, 1961). As Becker reflected on human capital studies over the past couple of decades, he stated, “No discussion of human capital can omit the influ-ence of families on the knowledge, skills, values, and habits of their children” (Becker, 1993, p. 21).
Within a human capital perspective, researchers assume par-ents engage in the production of the achievement of their children, using parental time, family resources, and a child’s innate endowment as inputs. Thus, although there is some transmission of genetic abil-ity, a child’s achievement is also conditioned by the learning envi-ronment that parents provide and by their preferences for schooling and achievement. This model specifies achievement as a function of parental income; parental time; parental tastes for learning; the ability endowment of the child, inherited from the parents; and the prefer-ence for high-quality schools. Human capital researchers assume an inherent trade-off between child “quantity and quality.” That is, the more children in a family—other things being equal—the fewer the

Individual, Family, and School Conditions and Student Achievement 15
resources that will be available per child. Intrafamily allocation of resources toward activities that develop achievement as well as different allocations to different children help explain differences in children’s outcomes. An overall budget constraint is imposed by family income and market prices, including the opportunity cost of parental time.
This resource-oriented model helps explain why family socio-economic indicators and school characteristics (e.g., socioeconomic composition, sector, and track placement) might be important in explaining test score trends over time. Over time, if changes in these characteristics are more positive for blacks and Latinos than for white students, then we would expect a closing of the minority-nonminority achievement gap. If these characteristics worsen for minority students and their families and stay the same or improve for nonminorities, then we would expect achievement gaps to widen.
Status Attainment Research
Although researchers who take a human capital perspective tend to emphasize income and educational attainment, status attainment researchers add occupational status in their examination of how family background is related to adult attainments. Status attainment research has been primarily concerned with how the ascribed and achieved characteristics of individuals influence their educational aspirations and achievement and subsequent occupational status and income. In fact, socioeconomic status has been one of the most attended-to social characteristics of students, especially in cultures that value equal oppor-tunity (Coleman, 1990). As Haller and Portes (1973) write,
the place of status attainment research in the study of social strati-fication lies in the effort to specify the causal sequence through which individuals reach their positions in status hierarchies. Status attainment research seeks to identify those basic factors describing the persons and their situations which account for whatever status locations they come to occupy. (p. 55)
The major contributions to sociologists’ understanding of the sta-tus attainment process include Blau and Duncan’s The American Occu-

16 Examining Gaps in Mathematics Achievement Among Racial-Ethnic Groups
pational Structure (1967) and William Sewell et al.’s Wisconsin social psychological model of status attainment (forthcoming). Focusing on the intergenerational transmission of status, Blau and Duncan’s work represented a paradigmatic shift in research on mobility and education (Featherman, 1981), a program of research that led them to conclude that there is “a fundamental trend towards expanding universalism [that] characterized industrial society” (1967, p. 429).
Expanding on this framework, the Wisconsin Longitudinal Study has contributed both substantively and methodologically to the under-standing of how ascribed and achieved characteristics contribute to the distribution of societally valued resources such as income, educational attainment, and occupational attainment. Some of the first model spec-ifications began in the late 1960s and have been refined up to the pres-ent (Hauser, Tsai, and Sewell, 1983; Sewell and Hauser, 1975; Sewell, Hauser, and Wolf, 1980; Sewell et al., forthcoming; Sewell, Haller, and Ohlendorf, 1970; Sewell, Haller, and Portes, 1969). The model posits that social background characteristics affect adult occupational status and income first through student ability and grades, second through significant others’ influence (parent, teachers, and peers), and finally through educational attainment. Generally, although education (i.e., years of schooling) is important for mediating the effects of social back-ground on adult attainments, family background remains an impor-tant influence.
To further understand the social dynamics represented in the sta-tus attainment model, many researchers have extended this model to examine the relationships of social background characteristics (parent educational attainment, occupational status, income, etc.) to students’ academic outcomes, such as grades and tested achievement in core aca-demic subjects (see Bidwell and Friedkin, 1988; Dreeben, 1994; Kara-bel and Halsey, 1977).
Like the human capital perspective, the status attainment research and the extensions to examine academic outcomes point to the impor-tance of examining how changes in the socioeconomic characteristics of families are associated with student test scores as well as trends in those scores. Over time, if the socioeconomic conditions of students improve, and if these improvements are greater for black and Latino

Individual, Family, and School Conditions and Student Achievement 17
students than for white students, we would expect a closing of the black-white and Latino-white test score gaps.
Human Development Ecological Perspective
When examining students’ academic outcomes, a developmental per-spective is relevant for our purposes because it theorizes that individual development is influenced by the various social spheres that individuals experience, including families, schools, peer groups, and neighborhoods (Bronfenbrenner, 1979, 1986; Elder, 1974; Rutter, 1988, 2002; Stein-berg, 1996). Although he wanted to examine the complicated processes of human development in different social spheres, Bronfenbrenner (1979) did see the place of simpler models relating family and social background to developmental outcomes such as academic achievement, or what he has labeled “social address” models (p. 724). These simpler models are important for comparative purposes and providing maps for unexplored terrain: “[L]ike the surveyor’s grid, they provide a useful frame for describ-ing at least the surface of the new terrain” (Bronfenbrenner, 1986, p. 724; see also Bronfenbrenner et al., 1996). The models we estimate in our analysis attempt to provide such a map, to guide further research that can provide more-detailed topographical characteristics in the portrayal of family, school, and student achievement trends that we examine here.
Moreover, our analyses build on Bronfenbrenner’s suggestion that an essential task of researchers should be to “penetrate behind the label of socioeconomic status to identify the specific elements of social structure and substance that shape the course and content of human development. This unraveling process requires the decomposition of the typically composite measure of social class into their most common components” such as parental education and family income (Bronfen-brenner, 1986, p. 736). Such a decomposition of socioeconomic status allows for examination of how particular effects may differ for particu-lar groups of students. Moreover, with the emphasis that developmental theorists place on other social spheres, such as schools, it is important to examine not only changes in socioeconomic background charac-teristics, but also schools, to assess how these spheres have changed in ways that contribute to the development of student achievement, par-ticularly test score differences among different racial-ethnic groups.

18 Examining Gaps in Mathematics Achievement Among Racial-Ethnic Groups
Schools as Organizations
Because the ecological perspective sees individuals as developing in dif-ferent contexts, developmental researchers have often focused on not only families, but schools. There has been a great deal of research that has attempted to uncover those aspects of school context that matter most for student achievement.
Moreover, one of the central questions left unanswered by status attainment and human capital perspectives above is, how does social background affect students’ experiences during the schooling process? These experiences can only be roughly approximated by the years of education in status attainment and human capital models. Critics have pointed to organizational variables as being crucial in explaining the effects of social background on adult attainments (Barr and Dreeben, 1983; Baron, 1984; Horan, 1978; Kerckhoff, 1976; Karabel and Halsey, 1977; Sorensen and Hallinan, 1977). This criticism led to the exami-nation of how school characteristics are related to students’ academic achievement (Coleman et al., 1966; Jencks et al., 1972, Jencks et al., 1979; for a review see Averch et al., 1972). School effects research con-tributes to our understanding about those organizational characteristics of schools that enhance academic achievement (Dreeben, 1994).1
Often, researchers confuse the “school, an organization, with schooling, a process that individual students experience” (Bidwell and Kasarda, 1980, p. 402, emphasis added). Researchers have often exam-ined the relationships between school organization characteristics (e.g., socioeconomic composition, racial-ethnic mix, and public ver-
1 Although researchers argue for examination of the effects of social background characteris-tics on schooling and adult outcomes, they are often skeptical about the contextual effects of schools because contextual effects may be unmeasured, or inadequately measured, individual-level effects (Hauser, 1970; Manski, 1994; Sewell et al., forthcoming). While recent methods allow for more precision in estimation of individual student and school effects, it is worth noting this skepticism and the technical difficulty of measuring contextual effects. In part, this difficulty is due to findings that most of the variation in student achievement scores lies within schools rather than between them (Coleman et al., 1966; Gamoran, 1987; Gamoran, Secada, and Marrett, 2000; Jencks, Smith, et al., 1972; Lee and Bryk, 1989; Rowan, 2001; Scheerens and Bosker, 1997). Yet in the past couple of decades methodological techniques have advanced to separately estimate effects at the individual and school levels to further our knowledge about the important effects that occur at each level (see Kreft and De Leeuw, 1998; Raudenbush and Bryk, 2002; Singer, 1998; Snijders and Bosker, 1999). We rely on such techniques in our analysis.

Individual, Family, and School Conditions and Student Achievement 19
sus private sector) and student achievement. In addition, researchers have examined schooling processes, such as secondary school tracking (Gamoran and Berends, 1987; Gamoran et al., 1995; Lucas, 1999; Oakes, Gamoran, and Page, 1992).2 However, there are national data for analyzing trends in student self-reports of high school track place-ment, controlling for school characteristics such as composition and sector. Thus, we review some of the school effects studies as well as those studies that examine relationships between student track place-ment and academic achievement.
School effects research began by being self-consciously policy- oriented. Its original purpose was to investigate the lack of equal opportu-nity for individuals. The Equality of Educational Opportunity report was a response to the Civil Rights Act of 1964, which directed the U.S. Com-missioner of Education to “conduct a survey and make a report to the President and the Congress . . . concerning the lack of availability of equal educational opportunities for individuals by reason of race, color, reli-gion, or national origin in public educational institutions at all levels . . .” (Coleman et al., 1966, p. iii). Examining the effects of school resources (size, location, per pupil expenditures, library books, science laboratories, and guidance counselors), many anticipated that these measures of school quality would explain the differential achievement between lower-class and middle-class, and black and white students. They did not.
Coleman and colleagues found that when controlling for social background, differences between schools in terms of their resources have little effect on students’ academic achievement.3 Moreover, achieve-
2 Schooling processes are difficult to quantify with consistent measures over time. For example, although there have been advances in the measurement of classroom instruction with survey data (Burstein et al., 1995; Gamoran et al., 1995; Gamoran, 1989; Hoffer and Moore, 1996; Mayer, 1999; Porter, 2002), we do not have consistent measures of trends in classroom instruc-tion over time. Only a few national databases allow for examining the effects on achievement of track measures based on students’ course-taking and transcripts (Berends, Lucas, and Briggs, forthcoming), despite the advances in the conceptualization and measurement of high school tracking over the past 15 years (Gamoran, 1989, 1992; Lucas, 1999).3 Coleman et al. (1966) also found that school composition was a stronger predictor of stu-dent achievement than school resources. The implication of this finding was that desegregat-ing schools led to a greater increase in opportunity than did increasing spending on school resources. This finding was picked up by policymakers and the public and led to concentration on desegregation of schools.

20 Examining Gaps in Mathematics Achievement Among Racial-Ethnic Groups
ment differences within schools were much greater than those between schools. Some have interpreted this as meaning that schools do not mat-ter much (see discussion in Averch et al., 1972; Gamoran, 1987; Jen-cks et al., 1972). Others have criticized Coleman’s research for failing to look inside the schooling box (Barr and Dreeben, 1983; Karabel and Halsey, 1977). Recent research on school effects is careful to examine the organizational features of schooling that explain the variation of student achievement within schools (Alexander and Cook, 1982; Alexander, Cook, and McDill, 1978; Alexander and McDill, 1976; Bidwell and Kasarda, 1980; Heyns, 1974). Such analyses draw attention to the dif-ferences in student achievement that can be attributed to schools, class-rooms, and among students within classrooms (Rowan, 2001; Scheerens and Bosker, 1997). This line of work is recasting the debates about the effects of school resources on student outcomes (e.g., Goldhaber, 2004; Greenwald, Hedges, and Laine, 1996; Hanushek, 1986, 1994, 1997; Hedges, Laine, and Greenwald, 1994).
One organizational feature that was thought to be especially salient for explaining student achievement within schools was high school tracking, the placement of students into different curricular programs purportedly based on student interest and ability. The way students are stratified within school has concerned researchers for decades because tracking is one of the ways in which researchers suspect that resources (e.g., high-quality instruction, high expectations, and motivated peers) are unequally distributed within schools. In a seminal study on track-ing, Heyns (1974) argued:
schools structure attainment selectively through differentiation and the allocation of rewards. . . . One crucial mechanism for academic differentiation and selection is the high school curricu-lum. . . . Tracking . . . policies typically segregate students within schools and define an academic hierarchy through which certain rewards may be allocated. (pp. 1434–1435).
Heyns’s work began a series of investigations that attempted to find a within-school mechanism that would explain the variation in achieve-ment among students with different socioeconomic, racial, and ethnic backgrounds (see Gamoran and Berends, 1987).

Individual, Family, and School Conditions and Student Achievement 21
Does the stratification of students within schools contribute to students’ academic and social development? The quantitative research to date on academic achievement suggests that tracking disadvantages students in the low tracks compared with their high-track counterparts. With regard to social outcomes, the ethnographic research consistently finds a negative impact of tracking on social outcomes, but quantita-tive studies have failed to find consistent results (see Berends, 1995).
Several meta-analyses have compared the academic achievement effects of grouped to nongrouped school settings, both elementary and secondary (Kulik and Kulik, 1982, 1987; Slavin, 1987, 1990). How-ever, research comparing students in the high groups to those in the low groups suggests that there is a positive effect of high-group place-ment on academic achievement. This effect is offset by the negative effect of the low group, which makes the overall effect appear to be zero (see Gamoran, 1987; Gamoran and Mare, 1989; Gamoran et al., 1995; Hoffer, 1991; Kerckhoff, 1986; Vanfossen et al., 1987). Thus, although the research on ability grouping suggests differential effects of ability grouping or tracking, not all this work provides similar results (for further reviews see Gamoran and Berends, 1987; Lucas, 1999; Oakes, Gamoran, and Page, 1992). Neither does this research lead to clear policy implications (see Hallinan, 1994; Oakes, 1994). Yet, it is an important aspect of school organizations that deserves further study, particularly examining changes in the effects of tracking over time (Berends et al., forthcoming).
Furthermore, because there is some debate about whether track-ing may explain convergence in black-white and Latino-white test score gaps (compare Ferguson, 1998 with Grissmer, Flanagan, and Wil-liamson, 1998; Porter, forthcoming), we focus in our study on track-ing with consistent measures between 1972 and 1992 to inform this debate. Although we are limited to a measure of student self-reports of track placement, we believe this measure is an important proxy for the academic opportunities students perceive in schools (see Lucas, 1999; Lucas and Gamoran, 2001). We hypothesize that if black and Latino students are taking more academic-track classes in the 1990s than the 1970s, and if such enrollment closes the black-white and Latino-white gaps in track placements, then it is likely that these changes in tracking

22 Examining Gaps in Mathematics Achievement Among Racial-Ethnic Groups
would contribute to the narrowing of the test score gaps among these student groups.
Examining Families, Schools, and Student Achievement Gaps
Although these theoretical perspectives differ in important ways, they motivate our focus on how changes in families and schools are related to student achievement, particularly black-white and Latino-white test score differences. As stated previously, we cannot test one theoretical perspective against another, but the perspectives provide a backdrop for our questions that focus on the test score trends for blacks, Latinos, and whites between the early 1970s and early 1990s, the changes that have occurred in family and school measures for different racial-ethnic groups, and whether changes in these measures are related to changes in racial-ethnic test score gaps.
Although limited to selected family and school characteristics available in nationally representative data over time, we are able to examine critical family characteristics and key school measures that empirical research has shown are related to student achievement and the closing of the black-white test score gap. We focus on student mathematics achievement and those family and school measures that we could consistently measure over time across nationally representa-tive cohorts of high school seniors. We believe it is an important con-tribution to analyze family, school, and achievement measures between 1972 and 1992 that have been operationalized in the same way (see Appendices A to D). Moreover, these national data we analyze cover the same periods as the studies by Grissmer et al. (1994), Hedges and Nowell (1998, 1999), and Cook and Evans (2000), so our findings can be directly compared with their research.
In the remainder of this chapter, we turn to specific research that examines the relationships of individual, family, and school fac-tors related to student achievement. Although many factors have been related to achievement, we limit our review to studies that examine measures for which we have data between 1972 and 1992. We begin by reviewing research that examines relationships between individual

Individual, Family, and School Conditions and Student Achievement 23
characteristics (race-ethnicity and gender) and then family background or socioeconomic status measures (i.e., family income, parents’ educa-tional attainment, and occupational status). We then turn to research on how academic achievement is related to school factors, such as socioeconomic composition, racial-ethnic composition, school sector, and high school track placement.
Individual and Family Characteristics
Much of the work on student achievement stresses the importance of individual factors, especially demographic and family characteris-tics. The following sections review the research on the relationships of test scores to racial-ethnic group, gender, and socioeconomic status. Although several other factors (e.g., single-parent households, family size, age of mother at birth of the child, immigrant status, and English as a second language) are related to student achievement scores, our focus here is on reviewing the research for which we have consistent measures in our data (i.e., race-ethnicity, gender, family income, par-ents’ educational and occupational attainments).
Racial-Ethnic Group
As we discussed previously, research has consistently shown that black and Latino students are more likely to have lower standardized test scores than white students. Although there are several explanations for why these minority groups have lower scores (e.g., Delgado-Gaitan, 1991, 1992; Fordham and Ogbu, 1986; Lareau, 2002; McCarthy, 1990; Ogbu, 1979, 1989, 1992; Omi and Winant, 1994; Stanton-Salazar, 2001; Stanton-Salazar and Dornbusch, 1995; Steele and Aronson, 1998; Wilson, 1987, 1991, 1993), it is important to note the significant progress over the past 25 years that black and Latino students have made in closing the minor-ity-nonminority test score gap (Campbell, Hombo, and Mazzeo, 2000; Cook and Evans, 2000; Grissmer et al., 1994; Hedges and Nowell, 1998, 1999; Jencks and Phillips, 1998; Koretz, 1986, 1992; Linn and Dunbar, 1990; Neisser, 1998; Porter, forthcoming; Smith and O’Day, 1991a).
The gaps have narrowed, but the average achievement gap between different racial-ethnic groups remains large. Although

24 Examining Gaps in Mathematics Achievement Among Racial-Ethnic Groups
achievement gaps vary across tests, grades, and subject areas, the average achievement gap between blacks and whites in national data often ranges between about 0.75 and 0.90 of a standard deviation on nationally representative tests (see Berends, Sullivan, and Lucas, 1999; Berends and Koretz, 1996; Hedges and Nowell, 1998; Koretz, 1986). If black and white students are held equal on a wide range of family, school, and community measures, the gap is reduced sub-stantially. For example, Berends and Koretz (1996) controlled for a variety of family and school factors in nationally representative data and found that these reduced the gap by about 0.40 of a standard deviation. Similarly, they found the unadjusted gap between Latinos and whites is about 0.60 of a standard deviation, while the gap that adjusts for several social context measures is about 0.25 of a standard deviation (see Berends and Koretz, 1996).
Gender
Generally, the average sex differences in most achievement areas are small, except for a couple of areas. For instance, in science and ste-reotypically male vocational domains, boys outperform girls, but in writing girls have the advantage over boys (Hedges and Nowell, 1995). Several argue that the learning environment and organization of junior high and high schools is better suited to boys than girls (Eccles and Hoffman, 1987; Steinkamp and Maehr, 1984), but the empirical evidence for such claims is lacking (see Mickelson, 1989). Studies that control for other family and school factors find that high school girls score lower than boys on mathematics tests by about 0.10 of a standard deviation, score higher on writing by about 0.30 of a standard deviation, and do not differ from boys on reading or vocab-ulary tests (Gamoran, 1987). Although the gender gap in writing achievement continues to favor girls over boys, the boys’ advantage in mathematics may be dissipating (see U.S. Department of Educa-tion, 2002).
In our analyses, we do not explore how gender interacts with race over time to explore the convergence of student test score gaps. Such analyses are beyond the scope here, but worthy of further research in the future. In our analyses, we include gender as a covariate.

Individual, Family, and School Conditions and Student Achievement 25
Socioeconomic Status (Family Income, Parents’ Educational Attain-ment, and Occupational Status)
In studies of academic achievement, family income and parent socioeco-nomic status are often incorporated into a composite defined as socioeco-nomic status (SES), but when income is examined as a separate variable, it tends to be positively related to student achievement scores, although the relationships tend to be small in magnitude when controlling for other factors. Some studies suggest that SES is the strongest predictor of student achievement (see Coleman et al., 1966; Gamoran, 1987; Jencks et al., 1972; Jencks et al., 1979; Lee, Bryk, and Smith, 1993). SES may be a proxy for a variety of family processes (ability, culture, tastes, stimu-lating environments, parenting styles, and parents’ involvement in child’s education).4 Whatever the underlying factors, SES remains a strong pre-dictor of student achievement.
The findings on SES are consistent in the few studies that examine the relationship between achievement and family income net of other family factors, such as parents’ educational attainment, single-parent household, and family size: students in higher-income families tend to have higher achievement scores. For example, Hill and O’Neill (1994) found an increase of $10,000 per year is associated with an increase of scores of 2.4 percentile points—a small increase in achievement. This
4 Many studies that analyze data from the U.S. Department of Education rely on composites in these data sets for SES, usually an unweighted linear combination of parents’ educational attainment, parents’ occupational status, family income, and measures of home possessions. Such scaling, however, may introduce measurement error and thus attenuate associations of SES with student outcomes. In addition, in the U.S. Department of Education’s LS program, data since NLS-72 through HSB and the base year 1988 NELS rely on a restricted version of Duncan’s Socioeconomic Index (SEI) (Duncan, 1961), which transforms a list of occupational categories into average SEI scores. The SEI in these data sets is based on the 1960 Census, but the 1992 wave of NELS did update the SEI with the 1990 Census. For our purposes, the SEI is useful for examining trends since the early 1970s and is calibrated back to the earliest time period.
Examples of research on these various processes underlying parent educational attainment include: Plomin (1986) on ability; Bourdieu (1984) and Bourdieu and Passeron (1977) on cul-ture and tastes; Bradley (1985), Kohn and Schooler (1983), Menaghan and Parcel (1991), and Parcel and Menaghan (1990) on stimulating home environments; Baumrind (1968, 1978), Dornbusch et al. (1987), and Steinberg, Elmen, and Mounts (1989) on authoritarian, authori-tative, and permissive parenting styles; and Astone and McClanahan (1991), Epstein (1990, 2001), Lareau (1989, 2002), Schneider and Coleman (1993), and Stevenson and Baker (1987) on parent involvement in child’s education.

26 Examining Gaps in Mathematics Achievement Among Racial-Ethnic Groups
is consistent with Grissmer et al.’s (1994) findings of the relationship between income and mathematics and reading achievement in national data, such as the NLSY and NELS-88. However, it may be important to measure income over a period of years, since Hanushek (1992) finds that such a measure (i.e., “permanent income”) is positively related to achieve-ment, while current income measured at one point in time is not.
Like income, parents’ educational attainment is an indicator of socioeconomic status and may be a proxy for several underlying fam-ily processes. Higher parent educational attainment is strongly related to higher student achievement scores in those studies that include the attainment measures separately, rather than subsuming it under the more global measure of family SES (Berends and Koretz, 1996; Grissmer et al., 1994). For example, previous analyses of the NELS data show that students whose mothers graduated college score about 0.33 of a standard deviation higher in reading (0.38 of a standard deviation in mathematics) than students whose mothers graduated high school (Grissmer et al., 1994; Hill and O’Neill, 1994). There is also empirical evidence that the father’s educational attainment is associated with achievement even after other family characteristics are taken into account (e.g., family income and mother’s education). For instance, Grissmer et al. (1994) found that students with college- educated fathers score about one-third of a standard deviation above those whose fathers did not go beyond high school. This finding was consistent across mathematics and reading tests in the NELS and the NLSY, both national data sets.
Although many studies that analyze data from the U.S. Depart-ment of Education rely on composites in these data sets for SES (usually an unweighted linear combination of parents’ educational attainment, parent occupational status, family income, and measures of home pos-sessions), we examine family income, parent occupational status, and parents’ educational attainments separately. The SES composites or scales may introduce measurement error and thus attenuate associa-tions of SES with student achievement. Moreover, we are interested in examining changes in these factors over time to understand their rela-tionships with achievement gaps among blacks, Latinos, and whites.

Individual, Family, and School Conditions and Student Achievement 27
School Factors
As mentioned previously, researchers have recently addressed the chal-lenge of examining the relationships between student test scores and school characteristics. The following sections review the research on the relationships of test scores to school organizational factors (i.e., socio-economic and racial-ethnic composition, and school sector) as well as academic-track placement.
Socioeconomic Composition
Schools with higher proportions of students from high socioeconomic backgrounds have higher achievement, higher graduation rates, and more college-bound graduates. This has been known for some time (Conant, 1961; Wilson, 1959). The question of interest, however, is whether these relationships reflect contextual effects above and beyond the individual-level relationships between SES and achievement. For example, one possible contextual effect would arise if schools with higher numbers of socially advantaged students provide environments that foster success over and above the effects of individual background characteristics (Gamoran, 1992).
This topic has received attention for several decades, and gener-ally the research reveals that although students’ scores may be higher in schools that have greater percentages of higher-status students, the net effect of school SES to achievement is not as strong as the association between individual students’ SES and achievement (Gamoran, 1992). For example, the landmark Coleman study (Coleman et al., 1966) reports that schools with higher average SES levels also have higher student test scores, even after controlling for individual characteristics. Analyses of HSB show that school SES is strongly related to mathemat-ics scores (Bryk and Driscoll, 1988; Lee and Bryk, 1989), but school SES does not have significant independent effects on other subject matter scores (Gamoran, 1987). Other studies also show a weak rela-tionship between student achievement and school SES after account-ing for individual characteristics (Alexander, Cook, and McDill, 1978; Alwin and Otto, 1977).

28 Examining Gaps in Mathematics Achievement Among Racial-Ethnic Groups
Racial-Ethnic Composition
Another finding of Coleman et al. (1966) was that the achievement of minority students is higher in racially integrated schools even after control-ling for individual and other school and community characteristics. How-ever, like other school effects, minority composition was not as strongly related to student achievement scores when compared to the strong net effects of individual measures for students’ racial-ethnic and socioeco-nomic background. Gamoran (1987) found that students in schools with a greater proportion of black students score worse on science and vocabu-lary tests; however, he found the Latino composition of schools had no significant relationship to the six tests administered in HSB. Moreover, Entwisle and Alexander (1992) showed that for younger children, fam-ily economic factors far outweigh the influence of the racial mix of the school. Generally, these findings are consistent with reviews of the short-term effects of school desegregation that reveal mixed effects of school desegregation on minority students’ achievement scores (Cook, 1984; Crain and Weisman, 1972; Hanushek, Kain, and Rivkin, 2004; Mahard and Crain, 1983). Compared with the short-term effects of desegregation on achievement, studies of the long-term effects consistently show that desegregation is related to positive outcomes (Wells and Crain, 1994).
One of the concerns in recent years about changes in school com-position has been the increases in patterns of racial-ethnic segregation (Orfield, 2001; Orfield and Yun, 1999). Historical patterns reveal that most of the desegregation took place between 1968 and 1972 (Armor, 1995; Grissmer, Flanagan, and Williamson, 1998). However, since that time of court-ordered desegregation, there has been a developing trend toward resegregation, particularly for black and Latino youth. This trend, while present over the last 25 years, has become more pro-nounced in the last 10 years (Orfield, 2001; Orfield and Yun, 1999). Thus, it is important to continuously examine changes in school com-position over time and how such changes are related to differences in student test scores among black, Latino, and white students.
School Sector
Many have argued that public schools are outperformed by private schools, particularly Catholic schools (Chubb and Moe, 1990; Coleman and Hof-fer, 1987; Coleman, Hoffer, and Kilgore, 1982). However, the magnitude

Individual, Family, and School Conditions and Student Achievement 29
of these effects and their implications are often the center of heated debate. Much of this debate has focused on whether students attending Catholic schools score higher on achievement tests than students in public schools. Although the private sector includes schools other than Catholic (e.g., religious independent and nonreligious independent), the vast majority of private schools are Catholic schools. One of the more balanced perspec-tives is that of Jencks (1985), who stated that students learn slightly more in Catholic schools than in public schools over the last two years of high school; however, while the effects are statistically significant, the magni-tude of those effects is uncertain. This uncertainty is likely to remain, since it is very difficult to control for problems of selection when compar-ing Catholic to public schools, despite various innovative attempts (see Altonji, Elder, and Taber, 2000; Coleman and Hoffer, 1987; Goldberger and Cain, 1982; Sander, 1996; Sander and Krautman, 1995).
In addition to the average effects of school sector on the general population of high school students, there is some research that shows Catholic schools benefit at-risk students (Bryk, Lee, and Holland, 1993; Coleman and Hoffer, 1987; Coleman, Hoffer, and Kilgore, 1982; Grog-ger and Neal, 2000; Lee and Bryk, 1989; Sander, 1996). However, some argue that “the evidence that Catholic schools are especially helpful for initially disadvantaged students is quite suggestive, but not conclusive” (Jencks, 1985, p. 134).
Although the magnitude of the effects of school sector is often debated, some research has attempted to explain how sector effects occur through the internal organization of schools (Bryk, Lee, and Holland, 1993; Bryk, Lee, and Smith, 1990; Lee, Bryk, and Smith, 1993). A grow-ing number of studies have compared the organization of private to pub-lic schools in terms of ability grouping and tracking, social relationships between teachers and students, parent involvement, and normative order of the school (Bryk, Lee, and Holland, 1993; Bryk and Driscoll, 1988; Lee and Bryk, 1988). Many of the positive effects of the Catholic schools on students at risk have been associated with these organizational factors.
High School Tracking
Research suggests that high-track placement is associated with greater test score gains compared with low-track placement, leading to greater inequality between students placed in high- and low-track classes over

30 Examining Gaps in Mathematics Achievement Among Racial-Ethnic Groups
time (Argys, Rees, and Brewer, 1995; Kerckhoff, 1986; Metz, 1978; Oakes, 1985; Rosenbaum, 1976). This achievement gap between stu-dents in different tracks remains even after taking into account other relevant factors such as family background, race-ethnicity, gender, and prior achievement (for a review see Gamoran and Berends, 1987; Gamoran and Hallinan, 1995; Oakes, Gamoran, and Page, 1992). Even though this relationship is not universal (Alexander and Cook, 1982; Jencks and Brown, 1975), there is persuasive evidence for achievement differences among track levels based on well-specified models for both the United States and abroad (Gamoran, 1992; Gamoran and Mare, 1989; Kerckhoff, 1986; Natriello, Pallas, and Alexander, 1989; Shavit and Featherman, 1988). Thus, even those who argue there is no effect of subject-by-subject ability grouping in secondary schools have accepted that broad differentiation into tracks probably increases inequalities in achievement (Slavin, 1990).
Yet no one has examined the effects of tracking over time in national data taking into account changes in family and school charac-teristics. Thus, we add a temporal perspective to the question of whether student-reported track placement has changed over time and whether this is related to student achievement trends for different racial-ethnic groups.
One of the important developments in research on secondary school tracking has been the increasing awareness of measurement problems and their implications for school practice and policy (e.g., Gamoran, 1989; Gamoran and Berends, 1987; Hoffer, 1992; Lucas, 1990, 1999, 2001; Lucas and Gamoran, 2001; Lucas and Good, 2001; Rosenbaum, 1980; Slavin, 1987). Our focus here is on changes in stu-dents’ perceptions of their track placement between the early 1970s and early 1990s and how these changes are related to student achieve-ment trends.
National surveys have asked students about their high school track placements for decades. Such surveys have assumed a tripartite struc-ture of tracking, consisting of academic or college-preparatory, general, and vocational programs. Typically, these surveys ask students, “Which of the following best describes your high school program?” Students then report from a set of categories that are easily collapsed into one of

Individual, Family, and School Conditions and Student Achievement 31
the three designations. Research has suggested that a dichotomous cat-egory (academic or college-preparatory versus noncollege) is the most relevant distinction for examining student achievement (Gamoran, 1987; Gamoran and Mare, 1989).
Student self-reports of their track location have salience during the schooling process as a social-psychological measure of track location (i.e., where the student believes he or she is in the curricular structure), but such self-reports are weaker measures of the structural dimension of tracking (i.e., where a student is in the curricular structure) (Lucas, 1999; Lucas and Gamoran, 2001). Here, we focus on changes in the social-psychological perceptions of track placement and student achieve-ment; our other work examines the structural dimension of tracking in more detail (Lucas, 1999; Lucas and Berends, 2002; Berends et al., forthcoming). Although there are discrepancies between the social-psychological (self-reports) and structural dimensions (course-based indicators from transcripts), Lucas and Gamoran (2001) found that there was nearly 70 percent exact agreement between these measures in the early 1980s and 63 percent exact agreement in the early 1990s (Lucas and Gamoran, 2001). The discrepancies that existed suggest that students were more likely to report being in the noncollege track when their transcripts suggest that they are in a college-preparatory program. This “underreporting” increased between the early 1980s and early 1990s, a pattern that was consistent across racial-ethnic groups. Thus, the associations we examine between tracking and achievement may underestimate the relationship of students’ structural track place-ment on student test scores.
In the next chapter we describe how we operationalized each of these individual, family, and school measures as well as the national data sets and methods we relied on to conduct our analyses for understanding what factors were influential in closing the minority- nonminority test score gap.


33
CHAPTER THREE
Data and Methodology
To answer the questions posed about trends in test scores, family and school characteristics, and achievement gaps between racial-ethnic groups, we analyze three cohorts of high school seniors in nationally representa-tive data sets that cover the experiences of secondary school students in the United States between 1972, 1982, and 1992. The data sets are:
• NLS of the high school class of 1972 (NLS-72). • HSB senior cohort of 1982 (HSB-82). • NELS senior cohort of 1992 (NELS-92).
These national data sets are part of the LS program of the National Center for Education Statistics (NCES), so hereafter we refer to these data sets as “LS data,” which we later compare to the trend assessment of NAEP. In what follows, we discuss the data sets analyzed, the opera-tionalization of the individual, family, and school measures analyzed across the data sets, and our methodological approach.
Data for High School Senior Cohorts
National Longitudinal Study of the High School Class of 1972
NLS-72 was designed to produce representative data at the national level on a cohort of high school seniors who graduated in 1972. The base-year sample was a stratified, two-stage probability sample of stu-dents from all public and private schools in the United States, with schools as the first-stage units and students within schools as the second-stage units. The result is a nationally representative sample of 19,000

34 Examining Gaps in Mathematics Achievement Among Racial-Ethnic Groups
seniors in 1,061 high schools (Riccobono et al., 1981). Student, school administrator, and test score data are available for measuring students’ academic achievement and individual, family, and school characteris-tics. We analyzed data from student tests, student questionnaires, and information about the school. The student questionnaire was com-pleted by 16,683 high school seniors. Because we wanted complete data from the student questionnaires, the students’ mathematics test, and information from the school information form, the sample for our analyses resulted in 14,469 students in 875 schools.
High School and Beyond
Similar to NLS-72, HSB is a two-stage stratified probability sample with schools as the first-stage units and students within schools as the sec-ond-stage units. In the first stage 1,100 schools were selected, and in the second stage about 36 students were randomly selected in each school. Some types of schools were oversampled to ensure adequate numbers of students were available in subpopulations of interest. We analyzed the sample of about 26,000 students who were sophomores in the 1980 base-year sample and were followed up in 1982 when they were seniors. The follow-up sample retained the essential features of the base-year design: multistage, stratified, and clustered (see Jones et al., 1983).
HSB was unique in that it gathered data on two high school grade levels in 1980 (tenth and twelfth grades). Both the sophomore and senior cohorts in HSB have information on students, schools, and test scores. The sophomore cohort was followed up two years later when the students were seniors (HSB-82). Although we used the 1980 senior cohort (HSB-80) to equate students’ mathematics scores over time (Appendix A), our descriptive and multivariate analyses of the effects of family and school measures on student achievement revealed no sig-nificant differences between the 1980 and 1982 senior cohorts. For the sake of parsimony and presentation, we thus present the 1972, 1982, and 1992 comparisons when examining how the trends in the math-ematics gap related to changes in family and school measures.
National Education Longitudinal Study
NELS is a nationally representative data set that includes detailed infor-mation from students, schools, and parents (Ingels et al., 1994). The 1988 base-year NELS included about 25,000 eighth-grade students in

Data and Methodology 35
1,035 schools. Students in NELS were followed up in the tenth grade (1990), twelfth grade (1992), two years after high school (1994), and in the year 2000. These data contain extensive information about the achievement and school experiences of students prior to high school entry, data on school organization in middle and high school, students’ family and demographic characteristics, and students’ experiences beyond high school. In each of the first three waves of NELS students were tested in various subject areas.
National Assessment of Educational Progress
When examining test score trends, we compare our estimates in the LS data sets to the NAEP trend assessment, which contains information over time on the same set of test score items for nationally representa-tive samples of students. Although NAEP asks the same items over time, NAEP data lack critical information about individual, family, and school characteristics to examine family and school-based explana-tions over time (see Berends and Koretz, 1996). However, NAEP pro-vides a useful benchmark to compare the test score trends in NLS-72, HSB-82, and NELS-92 (Green, Dugoni, and Ingels, 1995).
Dependent Measure: Mathematics Achievement
The dependent variable in our models is the individual student math-ematics test scores, assumed to be a function of a set of independent individual, family, and school variables that are directly comparable in the senior cohort data sets. The group differences that are the focus of this paper are those between black and white and between Latino and white students during their senior year of high school.
In order to more accurately measure the extent of group differ-ences within each of the senior cohorts, we linked the mathematics tests over time and calibrated them to be on the same scale so that it is as though students across cohorts had taken the same test (see Appendices A to C for details on linking procedures). Because the read-ing, science, and social studies tests did not have items in common across the cohorts, we were limited to mathematics. However, because of the sensitivity of mathematics tests to school effects and variation in mathematics scores across schools (Sørensen and Morgan, 2000),

36 Examining Gaps in Mathematics Achievement Among Racial-Ethnic Groups
it is important to understand trends in mathematics achievement and how other family and school changes relate to them, particularly for students from different racial-ethnic groups.
To link the mathematics achievement tests among the senior cohorts, we calculated test scores using Item Response Theory (IRT) (see Lord, 1980; Hambleton, 1989). IRT assumes that a test taker’s probabil-ity of answering an item on a test correctly is a function of his or her pro-ficiency level and other characteristics of the test itself. For instance, in a three-parameter IRT model, aspects used to mathematically determine a student’s score include how well a particular item distinguishes between proficiency levels at a particular point, the difficulty of the item, and the extent to which a student can guess the item correctly (“guessability” of the item). These aspects are used to place each test taker at a particular point (i.e., theta or θ) on a continuous proficiency scale. Essentially, this linking procedure allows us to examine what test scores would be if all students over the years had taken the 1972 test in mathematics.
Although IRT methods provide accurate measures of student scores throughout the proficiency distribution, it is important to remain aware that the tests do differ; they are not identical across the different cohorts.1 However, the tests are similar in structure and the domains tested, and they do contain some common items to use for equating purposes. More-over, research to date suggests the tests across these cohorts are reliable and valid measures of students’ mathematics achievement in secondary school (see Koretz and Berends, 2001; Berends et al., 1999; Rock and Hilton, et al., 1985; Rock and Pollack, 1995).
1 To measure a broader range of abilities and the extent of cognitive gains between eighth and twelfth grades, NELS included various forms of the tenth and twelfth grade tests to avoid floor and ceiling effects. For example, tenth graders in the first follow-up test administration were given different forms of the test depending on how they scored in the eighth grade base year. In mathematics, there were seven forms, and in reading there were five forms—all differing in dif-ficulty to provide better estimates of achievement throughout the proficiency distribution (for further details on the psychometric properties of the NELS tests, see Rock and Pollack, 1995). Specific test score information allowed us to link scores across all these NELS mathematics forms and the NLS and HSB cohorts. There were no common items to equate the reading scores in the senior NELS sample to the previous cohorts.

Data and Methodology 37
Definitions of Family Variables
The definitions for the other measures in our models are matched across the data sets for the three senior cohorts. Our selection of variables was dictated by the necessity of comparable measures across the data sets (NLS-72, HSB-82, and NELS-92). Ideally, we would have liked to ana-lyze a fuller set of family and school characteristics across the three senior cohorts, including specific measures for parenting styles, social capital, and other economic and sociocultural resources (Berends and Grissmer, et al., 1999; Phillips et al., 1998; Brooks-Gunn, Klebanov, and Duncan, 1996). Even though limited to those measures that were common across the senior cohorts, we were able to analyze a number of variables to examine student test score differences to extend past research on student test score gaps with a particular emphasis on how changes in families and schools related to black-white and Latino-white mathematics test score gaps (Cook and Evans, 2000; Grissmer et al., 1994; Grissmer, Flanagan, and Williamson, 1998; Hedges and Nowell, 1998). The survey items used to operationalize these measures are described in Appendix D.
Race-Ethnicity
All the surveys included items for students to report their racial-ethnic group. We include dummy variables to classify students into nonover-lapping categories for African American or black, Latino or Latina, non-Latino–white, and other (mostly Asian and American Indian). In our analyses, we focus on the nonoverlapping student groups as blacks, Latinos, and whites; our overall sample estimates for the senior cohorts include the “other” category.
Gender
In the analysis gender is included as a dummy variable equal to one if the student is female.
Parents’ Education
Both mother’s and father’s educational attainment are included as sepa-rate variables in our analysis. Each senior cohort survey provided infor-mation to create a measure for parents’ years of education, coded as

38 Examining Gaps in Mathematics Achievement Among Racial-Ethnic Groups
10 years if the parent did not finish high school, 12 if the parent was a high school graduate, 14 if the parent attended some college, 16 if the parent received a four-year college degree, and 18 if the parent received a graduate or professional degree.
Parent Occupational Status
We included a measure of parent’s SEI or occupational status measure, based on the maximum status reported for the father or mother (range in the data sets 7.33–70.21). On the surveys, respondents could select from a list of comparable occupations, which were then translated into Duncan’s SEI (Duncan, 1961) scores. NLS-72 through HSB and the base year 1988 NELS rely on Duncan’s SEI (Duncan, 1961), and this particular SEI measure is based on the 1960 Census. Thus, the esti-mates of change provided use this earlier time frame for the SEI as a reference point.
Family Income
The income variable represents a particularly challenging problem due the fact that each survey used different intervals for students to select. Initially, we aimed to rescale all of the income variables to 1972 using the annual average Consumer Price Index (CPI) value for each year. However, many categories in the upper tail of the income distribution for NELS-92 are not found in the other cohorts. As an alternative, we parsed each cohort’s income values into five categories (five quintiles) by assigning the income category midpoints to the responses and then found the corresponding quintiles from the pop-ulation as reported by the Census Bureau.2 We created dummy vari-
2 See data table F.1 as reported by the Census Bureau (<http://www.census.gov/hhes/income/histinc/f01.html>). The resulting quintiles are in 1992 dollars (not adjusted for CPI). Thus, the Census quintiles are on the same scale as the NCES data sets, and we placed the seniors into one of these categories based on the inflation adjusted value reported in the survey. We then ran frequencies to see if each cohort now had roughly 15–25 percent in each quintile (with 20 percent being ideal). There was one anomaly that was easily corrected. The second income group for the 1980 HSB sophomores had a range of $8,000–14,999 with a midpoint of $11,499.50. The threshold in the Census tables for Quintile1/Quintile 2 was $11,399. This means that the second group would get assigned to Quintile 2. This result was that 6.7 percent of observations fell into Q1 and 24.7 percent fell into Q2. However, by allowing the Q1/Q2

Data and Methodology 39
ables for each quintile; the median income category in each cohort was the reference group.3
School Variables
School Socioeconomic Composition
The student-level measures for parent income and mother’s education level were aggregated to the school level. Thus, we were able to calculate the percentage of students within each school in the income quintiles as well as the average parent education level in the school.
School Minority Composition
School administrators in NLS-72, HSB-82, and NELS-92 were asked about the percentage of various population groups that attended the school. Based on this information we were able to create two school-level variables that measured the percentages of black and Latino stu-dents that attended each school.
threshold to be $11,500 (instead of $11,399) the distribution became Q1:17.3 percent and Q2:14.1 percent. This was our only intervention.3 Due to missing data for the family background measures, we first replaced missing values for mother and father’s education, parent occupational status, and family income using the cohort-level mean computed from students with nonmissing values. In our initial estima-tion of multilevel models that included dummy variables indicating that imputation had been performed showed large t-values for the slope estimates of these variables. This indicated to us that the imputation process was inadequate. We next tried replacing with the means based on other students within the same school and cohort and found that the t-values were still large. We then tried a multiple imputation routine and found similar results (see Little and Rubin, 1987). As the final step, we replaced missing values with the mean from students within the same school and cohort and adjusted the imputation values based on the resulting slope coef-ficients on the imputation flags (if the flag had a negative slope, we reduced the imputed value to try to offset it). We then repeated the process and further adjusted the imputation values based until successive iterations had no impact. We found that we needed to put bounds on the imputed values based on the max and min values of possible responses in the original survey (e.g., an imputed value for mother’s education could not be less than 10). Without the bounds, we could drive the slope coefficients closer to zero but only at the expense of nonsensical impu-tation values (e.g., a negative value for socioeconomic status [SEI]). However, with the bounds, we found that the imputation values that minimized the t-values on the imputation flags were those at the minimum response level. For example, nearly all imputed values for mother’s education ended up being 10, the minimum. This suggests that the students whose parents are in the lower-income quintile have lower values of educational attainment, and those who have low-Duncan SEI are less likely to respond to the background questionnaire.

40 Examining Gaps in Mathematics Achievement Among Racial-Ethnic Groups
School Sector
Schools were classified into public or private schools. The categories were not directly comparable across NLS-72, HSB-82, and NELS-92, because NELS differentiated the private sector into additional catego-ries. However, all the databases included a composite measure from which we were able to create a simple dummy variable for private schools (public schools as reference group).
School Urban Locale
Schools were located in either urban, rural, or suburban locales.4 We created dummy variables for each with rural as the reference category.
High School Track Placement
The data set included a question for measuring the students’ percep-tions of their secondary school track positions, either academic, gen-eral, or vocational. Although these measures can only be viewed as gen-eral markers of students’ positions within the educational stratification system (Lucas, 1999; Gamoran and Berends, 1987; Gamoran, 1989), the academic group includes students who typically take courses for college-bound students (either an officially mandated program of courses or a more unofficial sequence within the curriculum). General-track students refer to those who neither take courses oriented specifi-cally toward college admission and acceptance, nor courses focused on a specific vocation (such as vocational-track students). Dummy variables
4 Locale is a 7-digit code on the CCD, defined as: 1. Large City—A central city of a CMSA or MSA, with the city having a population greater than or equal to 250,000; 2. Mid-Size City— A central city of a CMSA or MSA, with the city having a population less than 250,000; 3. Urban Fringe of a Large City—Any incorporated place, Census-designated place, or non-place territory within a CMSA or MSA of a Large City and defined as urban by the Census Bureau; 4. Urban Fringe of a Mid-Size City—Any incorporated place, Census-designated place, or nonplace territory within a CMSA or MSA of a Mid-Size City and defined as urban by the Census Bureau; 5. Large Town—An incorporated place or Census-designated place with a population greater than or equal to 25,000 and located outside a CMSA or MSA; 6. Small Town—An incorporated place or Census-designated place with population less than 25,000 and greater than or equal to 2,500 and located outside a CMSA or MSA; 7. Rural—Any incorporated place, Census-designated place, or nonplace territory designated as rural by the Census Bureau. The usual practice is to combine these into three categories: urban = 1, 2; suburban/large town = 3, 4, 5; and rural/small town = 6, 7.

Data and Methodology 41
were created for track, with academic track coded as one and nonaca-demic track as zero for the reference group (see Gamoran, 1987).
Methodology
Methods to assess the effects of individual, family, and schools over time need to factor in both the changes in the characteristics of interest (means) and changes in the effects of these characteristics (coefficients) on achievement scores at different points in time.5 To decompose such effects, we rely on a technique widely used in both sociology (Dun-can, 1967, 1968; Cancio, Evans, and Maume, 1996) and labor eco-nomics (Oaxaca, 1970; Cain, 1986; Corcoran and Duncan, 1979). This approach has been primarily used to explain differences in wages across groups in cross-sectional data (Cain, 1986; Corcoran and Dun-
5 The most direct way to make an assessment of family quality across two generations would be to have two or more longitudinal data sets that collected similar data and followed the children and their families from birth. This would allow comparisons between outcomes as well as an examination of the factors accounting for any differences between outcomes. Unfortunately, no such data are available that focus on American children for more than one cohort. There is, to our knowledge, only one such data set explicitly collected for this purpose—the National Child Development Study (NCDS) of three birth cohorts in Great Britain (see Ferri, 1976; Fogelman, 1983). However, the U.S. Department of Education’s National Center for Educa-tion Statistics is currently fielding such a study—the Early Childhood Longitudinal Study (ECLS) program (<http://nces.ed.gov/ecls/>). The Early Childhood Longitudinal Study, Kin-dergarten Class of 1998–1999 (ECLS-K) is a longitudinal study that follows a nationally rep-resentative sample of approximately 22,000 children from kindergarten through fifth grade. The ECLS-K began collecting data from kindergarten students, their teachers, and schools in the fall of 1998. Data will be collected periodically until the spring of 2004, when the students are in the spring of fifth grade. Although ECLS-K is designed primarily as a longitudinal survey of students, teachers, and school administrators are sampled in each wave. This makes it possible to use the data to examine changes in schools over time. In the first year, for exam-ple, sample students were in kindergarten, so the sampled teachers were largely kindergarten teachers. In subsequent years, first-, third-, and fifth-grade teachers have formed the primary sample. The Early Childhood Longitudinal Study, Birth Cohort (ECLS-B) is an additional longitudinal study, providing detailed information on child development, health, early care, and education. The study follows a nationally representative sample of approximately 13,500 children born in 2001 from nine months of age through the first grade. This longitudinal study gathers information on children’s cognitive, social, emotional, and physical development from multiple sources—from the children, their parents, their child care providers, their teachers, and their school administrators. In this longitudinal cohort, the same children are followed up from birth through first grade with data collected when the children are 9, 24, and 48 months old and in kindergarten and in first grade.

42 Examining Gaps in Mathematics Achievement Among Racial-Ethnic Groups
can, 1979), but it has also been used to explain the time-series pat-tern of wages in repeated cross-sections (Sahling and Smith, 1983). There have been recent applications in education as well (Cook and Evans 2000; Goldhaber, 1996; Gill and Michaels, 1992). For example, Cook and Evans (2000) used such methods to investigate how changes in the mean differences and changes in the coefficients of family and school measures were related to the convergence of the black-white test score gap; our analyses aim to build on their findings using a similar approach.
The first step in decomposing the effects of family background measures on the black-white and Latino-white test score gaps is to esti-mate a series of regressions for each senior cohort. For these regressions, we first enter the race dummy variable to estimate the unadjusted predicted mathematics test score difference between black and white students and between Latino and white students. We also estimate a series of multilevel regressions of students nested in schools. These regressions estimate the relationship of mathematics achievement to mother’s and father’s educational attainment, the higher of mother’s or father’s occupational status (Duncan’s SEI), the family income quintile dummies, academic track, minority and socioeconomic composition of the school, sector, and urban locale. Gender is also included in these regressions as a covariate.
To analyze how trends in individual, family, and school measures were related to trends in the black-white and Latino-white mathemat-ics test score gaps, we use multilevel regression. We first fit a hierar-chical linear model to each cohort and estimate regression coefficients (Kreft and De Leeuw, 1998; Raudenbush and Bryk, 2002; Snijders and Bosker, 1999). Then, we use the coefficients in the decomposition of the difference between the predicted means of white and black test scores and white and Latino test scores (Equation 1) (e.g., Duncan, 1967, 1968; Oaxaca, 1970; Cain, 1986; Sahling and Smith, 1983; Gill and Michaels, 1992; Cook and Evans, 2000; Goldhaber, 1996). The LS data allowed for this analysis over three time intervals: 1972–1982, 1982–1992, and 1972–1992. By looking at the results of these decom-positions, we can begin to understand how black and Latino mathe-matics scores changed relative to those of whites over this 20-year span.

Data and Methodology 43
Moreover, we can examine in which decade the most notable changes occurred. Mathematically, for each of these intervals we employed the following decomposition:
∆ y1 − ∆ y0 = (∆x–1 − ∆x–0) · ß0 + ∆x–1 · (ß1 − ß0) + x–1w · (ß1w − ß1) (1)
− x–0w · (ß0w − ß0) + x–1b · (ß1 − ß1b) − x–0b · (ß0 − ß0b)
where
• ∆ y1 − ∆ y0 = ( y1w − y1b) − ( y0w − y0b) is the change from time 0 to time 1 in the difference between the predicted means of white and black test scores and of white and Latino scores6
• ∆x–i = x– iw − x–ib is the difference at time i between the means of white and black or Latino individual and school-level characteris-tics
• x–ib and x–iw are the vectors of means at time i of individual and school-level characteristics for the respective minority and non-minority groups considered, respectively
• ßi is the estimated coefficient vector for a representative student at time i
• ßib and ßiw are the estimated coefficient vectors at time i for black and white and for Latino and white students respectively
6 The predicted means used in the decompositions are not simple averages of the dependent variable. Given the nested nature of the data and the consequent need to employ a multilevel or hierarchical model (HLM), the equation above would not necessarily hold if the change in the difference between simple averages ∆ y
_ t1 − ∆ y
_ t0 were placed on the left-hand side since
the estimates of β generated under HLM assumptions are not necessarily such that y_ = x– ·
ßi . In fact, y_ = x– · ßi under HLM only if the HLM estimates of β are the same as the OLS
estimates of β. Using the HLM estimates of β for our model, the dot product x– · ßi equals y, i.e., the predicted value of y given x–. Thus, we use y in each of our decompositions so that equality will hold between our manipulations of x– · ßi. The differences between y and y are slight in all cases.
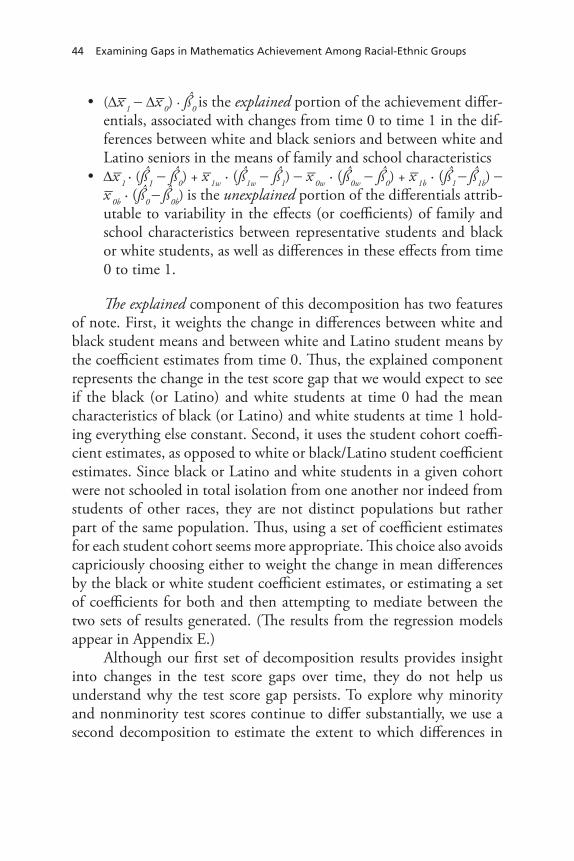
44 Examining Gaps in Mathematics Achievement Among Racial-Ethnic Groups
• (∆x–1 − ∆x–0) · ß0 is the explained portion of the achievement differ-entials, associated with changes from time 0 to time 1 in the dif-ferences between white and black seniors and between white and Latino seniors in the means of family and school characteristics
• ∆x–1 · (ß1 − ß0) + x–1w · (ß1w − ß1) − x–0w · (ß0w − ß0) + x–1b · (ß1 − ß1b) − x–0b · (ß0 − ß0b) is the unexplained portion of the differentials attrib-utable to variability in the effects (or coefficients) of family and school characteristics between representative students and black or white students, as well as differences in these effects from time 0 to time 1.
The explained component of this decomposition has two features of note. First, it weights the change in differences between white and black student means and between white and Latino student means by the coefficient estimates from time 0. Thus, the explained component represents the change in the test score gap that we would expect to see if the black (or Latino) and white students at time 0 had the mean characteristics of black (or Latino) and white students at time 1 hold-ing everything else constant. Second, it uses the student cohort coeffi-cient estimates, as opposed to white or black/Latino student coefficient estimates. Since black or Latino and white students in a given cohort were not schooled in total isolation from one another nor indeed from students of other races, they are not distinct populations but rather part of the same population. Thus, using a set of coefficient estimates for each student cohort seems more appropriate. This choice also avoids capriciously choosing either to weight the change in mean differences by the black or white student coefficient estimates, or estimating a set of coefficients for both and then attempting to mediate between the two sets of results generated. (The results from the regression models appear in Appendix E.)
Although our first set of decomposition results provides insight into changes in the test score gaps over time, they do not help us understand why the test score gap persists. To explore why minority and nonminority test scores continue to differ substantially, we use a second decomposition to estimate the extent to which differences in

Data and Methodology 45
family background characteristics between the black, Latino, and white groups are associated with the test-score gaps in 1992 (equation 2).
yw − yb = (x–w − x–b) · ß + x–w · (ßw − ß) + x–b · (ß − ßb) (2)
where
• yw − yb is the difference between white and black (or Latino) pre-dicted mean scores in 1992
• x–w and x–b are the vectors of means of family and school charac-teristics in 1992 for white and black and for white and Latino students, respectively
• ß is the estimated coefficient vector for a representative student in 1992
• ßb and ßw are the respective estimated coefficient vectors for black (or Latino) and white students in 1992
• (x–w − x–b) · ß is the explained part of the 1992 achievement differ-ential, attributable to differences between the means of family and school characteristics of white and black or of white and Latino seniors in 1992 (note again the use of representative student coef-ficient estimates)
• x–w · (ßw − ß) + x–b · (ß− ßb) is the unexplained portion of the achieve-ment differential, attributable to variability in the effects of fam-ily and school characteristics between representative students and black, Latino, or white students.
Before examining the results of these decompositions, it is impor-tant to understand the trends that have occurred in black-white and Latino-white mathematics scores and selected family and school char-acteristics in the LS data we analyze. In the next chapter, we present trends in the minority and nonminority test score differences in the senior cohorts and compare them to other national achievement trends in NAEP. We also examine the trends in family and school measures for the 1972, 1982, and 1992 senior cohorts.


47
CHAPTER FOUR
Trends in Mathematics Achievement, Family, and School Characteristics, 1972–1992
Black and Latino students have made considerable achievement gains in the last couple of decades in narrowing the minority-nonminority test score gap. The convergence occurs across subject area tests (Campbell et al., 2000), and the gap has narrowed more in reading than in mathemat-ics. In addition, there have been changes in family and school conditions over this period that are likely to be related to student achievement trends and the achievement gaps between minority and nonminority youth.
In this chapter, we first present trends in the black-white and Latino-white mathematics score differences in the senior cohorts and compare them to other national achievement trends in NAEP. The focus here is on mathematics because we were able to conduct further multivariate analyses in the LS data that appear in subsequent chapters due to our linking of mathematics scores across the cohorts. Second, we examine the trends in family background and school measures for the different groups.
Test Score Differences Among Racial-Ethnic Groups over Time
Data for the senior cohorts of NLS-72, HSB-82, and NELS-92, con-sistent with other national data, show that black students have made sizeable achievement gains in narrowing the black-white test score gap in this period. The estimates for the black-white convergence in math-ematics appear in Figure 4.1 (see alsoTable A.12). The estimates for the three LS senior cohorts are plotted against those in the NAEP trend

48 Examining Gaps in Mathematics Achievement Among Racial-Ethnic Groups
assessment because NAEP provides the strongest trend assessment available in the United States and offers an important benchmark for the LS cohorts. The black-white difference was more than a standard deviation (standard deviation = 1.09) in the NLS-72 data, but by the early 1990s the gap narrowed by about 20 percent, to 0.87 of a stan-dard deviation unit difference in NELS. In 1973 the black-white dif-ference in NAEP was 1.14 of a standard deviation, similarly narrowing to 0.89 of a standard deviation in 1996 (a 22 percent reduction). Both the LS and NAEP data sources reveal that the black-white differences in mathematics converged by roughly 1/100th of a standard deviation per year between 1972 and 1992. The overall pattern remains consis-tent, even though the LS and NAEP samples differ in their design and tests administered. The LS senior cohorts reveal a narrowing of the test score gap between blacks and whites, a convergence that calls for explanation.
Over this same period, Latino students also made gains in student achievement and closed the gap with white students. Estimates for the
Figure 4.1Black-White Mathematics Differences in the Senior Cohorts Compared with the NAEP Trend Assessment
RAND MG255-4.1
Mat
hem
atic
s d
iffe
ren
ces
in s
tan
dar
dd
evia
tio
n u
nit
s
1.0
0.8
0.6
0.4
084848280
Year
7876741972 96
1.2
0.2
92908886
NAEPLS

Trends in Mathematics Achievement, Family, and School Characteristics, 1972–1992 49
Latino-white convergence in mathematics appear in Figure 4.2 (see also Table A.12). The Latino-white gap is large, even though the black-white mathematics achievement gap is even larger. For example, in the NLS-72 data the Latino-white difference was 0.88 of a standard deviation, but by the early 1990s the gap narrowed by 32 percent, to 0.60 of a standard deviation unit difference in NELS. In 1973 the Latino-white difference in NAEP was 0.94 of a standard deviation, narrowing to 0.71 of a standard deviation in 1996 (a 24 percent reduction). Similar to the black-white dif-ferences, the overall pattern remains consistent between the LS and NAEP samples despite their differences, and the reduction in the test score gaps between Latino and white students is worthy of examination.
Changes in Family Background Characteristics Among Racial-Ethnic Groups
In addition to the significant changes in the test score trends of black, Latino, and white students, important changes have occurred in family Figure 4.2Latino-White Mathematics Differences in the Senior Cohorts Compared with the NAEP Trend Assessment
RAND MG255-4.2
Mat
hem
atic
s d
iffe
ren
ces
in s
tan
dar
dd
evia
tio
n u
nit
s
1.0
0.8
0.6
0.4
084848280
Year
7876741972 96
1.2
0.2
92908886
NAEPLS
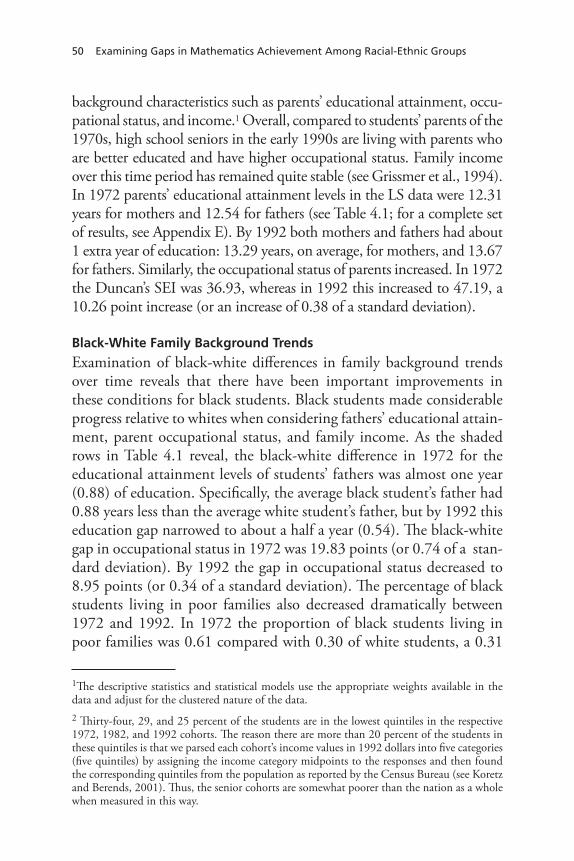
50 Examining Gaps in Mathematics Achievement Among Racial-Ethnic Groups
background characteristics such as parents’ educational attainment, occu-pational status, and income.1 Overall, compared to students’ parents of the 1970s, high school seniors in the early 1990s are living with parents who are better educated and have higher occupational status. Family income over this time period has remained quite stable (see Grissmer et al., 1994). In 1972 parents’ educational attainment levels in the LS data were 12.31 years for mothers and 12.54 for fathers (see Table 4.1; for a complete set of results, see Appendix E). By 1992 both mothers and fathers had about 1 extra year of education: 13.29 years, on average, for mothers, and 13.67 for fathers. Similarly, the occupational status of parents increased. In 1972 the Duncan’s SEI was 36.93, whereas in 1992 this increased to 47.19, a 10.26 point increase (or an increase of 0.38 of a standard deviation).
Black-White Family Background Trends
Examination of black-white differences in family background trends over time reveals that there have been important improvements in these conditions for black students. Black students made considerable progress relative to whites when considering fathers’ educational attain-ment, parent occupational status, and family income. As the shaded rows in Table 4.1 reveal, the black-white difference in 1972 for the educational attainment levels of students’ fathers was almost one year (0.88) of education. Specifically, the average black student’s father had 0.88 years less than the average white student’s father, but by 1992 this education gap narrowed to about a half a year (0.54). The black-white gap in occupational status in 1972 was 19.83 points (or 0.74 of a stan-dard deviation). By 1992 the gap in occupational status decreased to 8.95 points (or 0.34 of a standard deviation). The percentage of black students living in poor families also decreased dramatically between 1972 and 1992. In 1972 the proportion of black students living in poor families was 0.61 compared with 0.30 of white students, a 0.31
1The descriptive statistics and statistical models use the appropriate weights available in the data and adjust for the clustered nature of the data.2 Thirty-four, 29, and 25 percent of the students are in the lowest quintiles in the respective 1972, 1982, and 1992 cohorts. The reason there are more than 20 percent of the students in these quintiles is that we parsed each cohort’s income values in 1992 dollars into five categories (five quintiles) by assigning the income category midpoints to the responses and then found the corresponding quintiles from the population as reported by the Census Bureau (see Koretz and Berends, 2001). Thus, the senior cohorts are somewhat poorer than the nation as a whole when measured in this way.

Trends in Mathematics Achievement, Family, and School Characteristics, 1972–1992 51
Table 4.1Selected Racial-Ethnic Differences in Family Background Characteristics in LS Data, 1972–1992
1972 1982 1992Change
(1992–1972)
Mother’s Education 12.31 12.65 13.29 +0.98
Whites 12.45 12.84 13.50 +1.05
Blacks 11.57 12.22 12.96 +1.39
Latino 11.04 11.90 12.03 +0.99
B-W Difference –0.88 –0.62 –0.54 +0.34
L-W Difference –1.41 –0.94 –1.47 –0.06
Father’s Education 12.54 12.88 13.67 +1.13
Whites 12.73 13.19 13.92 +1.19
Blacks 11.27 11.76 12.96 +1.69
Latino 11.32 11.98 12.33 +1.01
B-W Difference –1.46 –1.43 –0.96 +0.50
L-W Difference –1.21 –1.41 –1.59 –0.18
Occupational Status (Duncan’s SEI) 36.93 47.79 47.19 +10.26
Whites 39.55 50.64 49.58 +10.03
Blacks 19.72 38.47 40.63 +20.91
Latino 21.70 39.98 36.73 +15.03
B-W Difference –19.83 –12.17 –8.95 +10.88
L-W Difference –17.85 –10.66 –12.85 +5.00
Lowest Income Quintile 0.34 0.29 0.25 –0.09
Whites 0.30 0.24 0.19 –0.11
Blacks 0.61 0.51 0.41 –0.20
Latino 0.57 0.38 0.49 –0.08
B-W Difference 0.31 0.27 0.22 –0.09
L-W Difference 0.27 0.14 0.30 0.03
difference.2 In 1992 the proportion of black students living in poverty was 0.41 compared with 0.19 of white students, a 0.22 difference. Of course, the proportion of black students who still live in poverty is sig-nificant, but the progress of blacks relative to whites is noteworthy.
Latino-White Family Background Trends
When examining differences between Latino and white students in family background measures between the early 1970s and early 1990s, we find that overall conditions have improved for Latino students and their families. However, these overall positive trends have not helped Latino students and their families close the gap with white students on the family background measures examined here.

52 Examining Gaps in Mathematics Achievement Among Racial-Ethnic Groups
For example, Latino students’ mothers had 11.04 years of school-ing in 1972, but by 1992, the average mother’s educational attainment for Latino students was 12.03, an increase of almost a year. A similar pattern emerges when considering father’s educational attainment for Latino students. Despite these positive trends in parental educational attainment, however, this progress has not closed the gap between Latino and white students. For instance, in 1972 the gap between Latino and white students in mother’s educational attainment was 1.41, and this gap actually increased slightly by 1992, to 1.47 years. That is, in the early 1990s Latino students had, on average, mothers who had just under one and a half years less education than white students’ parents. The Latino-white difference in fathers’ educational attainments was 1.21 in 1972, and this gap increased to 1.59 in 1992. In general, while the educational attainment of Latino students’ par-ents increased between the early 1970s and early 1990s, these increases were not sufficient to close the gap with white students.
When considering occupational status, the gap between Latino and white students decreased over the time period examined. The gap in 1972 was 17.85 Duncan’s SEI points (or 0.67 of a standard devia-tion), and this gap decreased to 12.85 points in 1992 (0.48 standard deviation units). In general, the gap in occupational status closed by just under one-fifth of a standard deviation over this 20-year period.
In 1972 the proportion of Latino students in the bottom income quintile was 0.57 compared with 0.30 of white students, a 0.27 differ-ence. Twenty years later, 0.49 of Latino students were in the bottom income quintile compared to 0.19 of white students, a 0.30 difference. The gaps in poverty between students in Latino and white families were and remain equally large.
Changes in School Characteristics Among Racial-Ethnic Groups
Examining changes in school characteristics in the data sets spanning 1972 to 1992, we see that there have been increases in the proportion of students across the nation who attend urban schools, schools with a

Trends in Mathematics Achievement, Family, and School Characteristics, 1972–1992 53
greater number of black and Latino students than white students, and private schools. Table 4.2 shows the differences in school conditions between 1972 and 1992 for all samples in the data sets as well as by racial-ethnic groups.
There have been increases in the proportion of students attend-ing urban schools and schools with a greater proportion of black and Latino students than white students. For example, in 1972, 28 percent of the nation’s students attended schools in urban areas compared with 36 percent of students in 1992. In addition, although overall students in 1972 attended schools in which the proportion of the nonwhite student body was 0.19, in 1992 students, on average, attended schools in which the nonwhite proportion was 0.36.
Paralleling changes in students’ families, schools tended to be somewhat higher in parent occupational status in 1992 compared with 1972. That is, in 1972 students attended schools where the aver-age socioeconomic status was (−0.05) compared with the 1992 coun-terparts, who typically attended schools where the average SEI was (0.05).
Students in 1992 were also more likely to attend private schools than students in 1972, at least as evident in these data sets. Whereas the proportion of students attending private schools in NLS-72 was 0.07, the proportion of high school seniors in NELS attending private schools was 0.16.
Black-White Differences in School Characteristics
When considering the types of schools that black and white students attended between 1972 and 1992, there have been some differences that have remained over time. In 1972 black students were likely to attend schools for which the average proportion of schools classified as urban was 0.44 compared with white students, who attended schools for which the average proportion was 0.27. There were slight changes in the proportion of white and black students attending urban schools between 1972 and 1992, and the gap between blacks and whites decreased slightly, from 0.17 in 1972 to 0.14 in 1992.
When considering the socioeconomic composition of schools as measured by Duncan’s SEI, the black-white difference in the typical

54 Examining Gaps in Mathematics Achievement Among Racial-Ethnic Groups
schools attended by blacks and whites narrowed between 1972 (−0.18 difference) and 1982 (−0.08); however the black-white difference in the average socioeconomic composition of schools was quite similar in 1992 (gap of −0.21) to the gap 20 years earlier. Apparently, the closing of the black-white socioeconomic circumstances seen among individu-als was not reflected in the socioeconomic composition of schools that blacks and whites attended.
If a high minority composition is viewed as a proxy for schools that have historically been underserved by the education system in terms of providing high-quality resources, services, and instruction, then the
Table 4.2Racial-Ethnic Differences in School Conditions in LS Data, 1972–1992
1972 1982 1992Change
(1992–1972)
Proportion Urban School 0.28 0.25 0.36 +0.08
Whites 0.27 0.21 0.30 +0.03
Blacks 0.44 0.36 0.44 0.00
Latino 0.48 0.26 0.45 –0.03
B-W Difference +0.17 +0.15 +0.14 –0.03
L-W Difference 0.21 0.05 0.15 –0.06
Proportion Minority Composition 0.19 0.26 0.25 +0.06
Whites 0.17 0.21 0.18 +0.01
Blacks 0.36 0.37 0.42 +0.06
Latino 0.33 0.28 0.37 +0.04
B-W Difference +0.19 +0.16 +0.24 +0.05
L-W Difference +0.16 +0.07 +0.19 +0.03
Mean Socioeconomic Composition –0.05 0.00 0.05 +0.10
Whites –0.03 0.04 0.13 +0.16
Blacks –0.21 –0.04 –0.08 +0.13
Latino –0.12 –0.06 –0.15 –0.03
B-W Difference –0.18 –0.08 –0.21 –0.03
L-W Difference –0.09 –0.10 –0.28 –0.19
Proportion Private School 0.07 0.12 0.16 +0.09
Whites 0.07 0.12 0.17 +0.10
Blacks 0.05 0.10 0.11 +0.06
Latino 0.06 0.10 0.12 +0.06
B-W Difference –0.02 –0.02 –0.06 –0.04
L-W Difference –0.01 –0.02 –0.05 –0.04

Trends in Mathematics Achievement, Family, and School Characteristics, 1972–1992 55
increasing proportion of high-minority schools suggests a lack of prog-ress for black students. The average proportion of minority composi-tion for schools attended by white students was 0.17, compared with the average of 0.36 for schools attended by black students. While there were not significant changes in minority composition for schools attended by whites between 1972 and 1992, the average minority composition for schools attended by black students increased from 0.36 to 0.42, a 0.06 point change in proportion. Comparing minority composition in the typical schools between 1972 and 1992, there was actually an increase of the difference between blacks and whites (0.19 to 0.24).
When comparing the proportion of black and white students attending private schools, we find that while there has been an increase of private school attendance in both groups, the gap in private school attendance has grown slightly. For example, in 1972 the proportion of white students attending private schools was 0.07, compared with 0.05 of black students. By 1992 the proportion of white students attending private schools was 0.17, compared with 0.11 of black students. The black-white gap in private school attendance was −0.02 in 1972 com-pared with −0.06 in 1992, suggesting that private school attendance is more prevalent among white students than among black students, and this gap has increased by a very small amount over time.
Latino-White Differences in School Characteristics
Turning now to the type of schools that Latino and white students attended in 1972 through 1992, we see some indicators of change and stability that may be related to changes in test score trends. There has been stability in the proportion of Latino students attending urban schools and in the socioeconomic composition of the schools they attended. There have been very small increases in the Latino population attending private schools and schools with a higher percentage of minority students.
In 1972 the proportion of Latino students attending urban schools was 0.48 compared with 0.27 of white students, a 0.21 differ-ence. By 1992 there were slight increases in the proportion of white students attending urban schools and small decreases in the propor-tion of Latino students attending such schools, so the Latino-white gap decreased from 0.21 in 1972 to 0.15 in 1992.

56 Examining Gaps in Mathematics Achievement Among Racial-Ethnic Groups
When considering the socioeconomic composition of schools, the Latino-white difference actually increased over time, favoring white students. In 1972 the average socioeconomic composition of schools attended by whites, measured in terms of Duncan’s SEI, was −0.03, but this improved to 0.13 in 1992. By contrast, the average socioeco-nomic composition of schools attended by Latino students in 1972 was −0.12 and this got worse in 1992 (−0.15). Thus, the Latino-white gap in school socioeconomic composition actually got worse for Latino students between 1972 and 1992.
Again, if a high minority composition is viewed as a proxy for schools that have historically been underserved by the education system in terms of providing high-quality resources, services, and instruction, then these conditions have not benefited Latino students. For exam-ple, in 1972 the average minority composition for schools attended by Latino students was 0.33, compared with 0.17 for white students. The Latino-white gap in minority composition increased slightly, from 0.16 in 1972 to 0.19 in 1992, suggesting that changes in minority composition are unlikely to benefit Latino students.
We find that like the black-white gap in private school attendance, the Latino-white gap in private school attendance has increased to a small extent. For example, in 1972 the proportion of white students attending private schools was 0.07, compared with 0.06 of Latino students. By 1992 the proportion of white students attending private schools was 0.17, compared with 0.12 of Latino students. The Latino-white gap in private school attendance was −0.01 in 1972 compared with −0.05 in 1992. These differences suggest that private school atten-dance is more prevalent among white students than among Latino stu-dents. This gap has increased over time to a small degree.
Changes in Self-Reported Track Placement Among Racial-Ethnic Groups
The school organization characteristics described above are important because they have been related to student achievement, and because any changes over time for one racial-ethnic group vis-à-vis another may

Trends in Mathematics Achievement, Family, and School Characteristics, 1972–1992 57
suggest growing or declining inequities. Although school characteristics help describe elements of the organization, it is also important to con-sider schooling characteristics such as track placement, since these pro-vide indicators of student experiences within the organization (Bidwell and Kasarda, 1980; Gamoran, Secada, and Marrett, 2000).
When considering track placement for the different national cohorts of high school seniors, we see relative stability in students reporting placement in the academic track. For example, in 1972 the proportion of students reporting academic-track placement was 0.47. This decreased slightly in the early 1980s, when the proportion of stu-dents reporting academic-track placement was 0.39. But by 1992, the proportion once again increased to 0.47.
Black-White Differences in Self-Reported Academic-Track Placement
When looking at black-white differences in track placement, we see a significant increase of the proportion of black students reporting academic-track placement, suggesting a closing of the black-white tracking gap. In 1972 the proportion of black students reporting aca-demic-track placement was 0.28, whereas in 1992, the proportion was 0.41, a 0.13 point increase. About half of all white students in 1972 and 1992 reported academic-track placement. Although the black-white difference in reported track placement was 0.22 in 1972, this difference declined to 0.08 in 1992, a significant reduction suggesting a possible benefit for black students.
Table 4.3 Racial-Ethnic Differences in Self-Reported Track Placement in LS Data, 1972–1992
1972 1982 1992Change
(1992–1972)
Academic Track 0.47 0.39 0.47 0.00
Whites 0.50 0.42 0.49 –0.01
Blacks 0.28 0.35 0.41 +0.13
Latino 0.26 0.25 0.37 +0.11
B-W Difference –0.22 –0.07 –0.08 +0.14
L-W Difference –0.24 –0.17 –0.12 +0.12
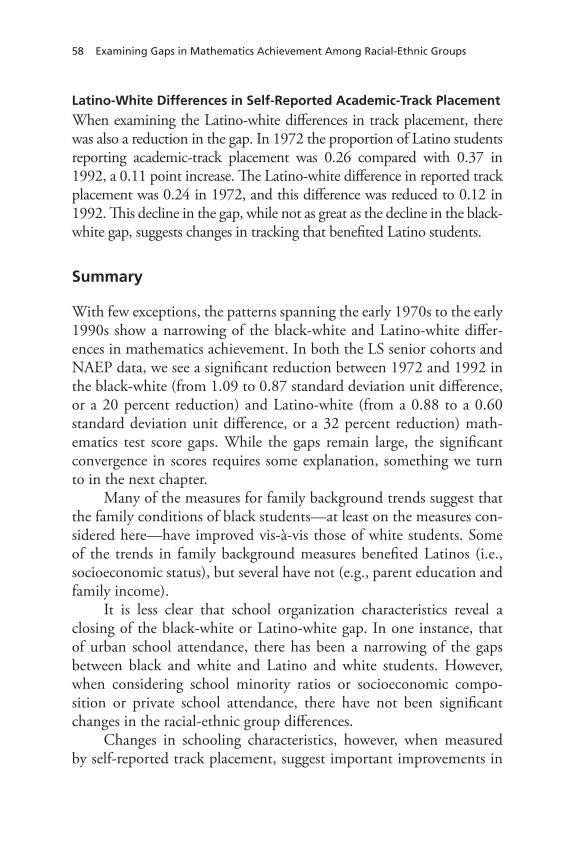
58 Examining Gaps in Mathematics Achievement Among Racial-Ethnic Groups
Latino-White Differences in Self-Reported Academic-Track Placement
When examining the Latino-white differences in track placement, there was also a reduction in the gap. In 1972 the proportion of Latino students reporting academic-track placement was 0.26 compared with 0.37 in 1992, a 0.11 point increase. The Latino-white difference in reported track placement was 0.24 in 1972, and this difference was reduced to 0.12 in 1992. This decline in the gap, while not as great as the decline in the black-white gap, suggests changes in tracking that benefited Latino students.
Summary
With few exceptions, the patterns spanning the early 1970s to the early 1990s show a narrowing of the black-white and Latino-white differ-ences in mathematics achievement. In both the LS senior cohorts and NAEP data, we see a significant reduction between 1972 and 1992 in the black-white (from 1.09 to 0.87 standard deviation unit difference, or a 20 percent reduction) and Latino-white (from a 0.88 to a 0.60 standard deviation unit difference, or a 32 percent reduction) math-ematics test score gaps. While the gaps remain large, the significant convergence in scores requires some explanation, something we turn to in the next chapter.
Many of the measures for family background trends suggest that the family conditions of black students—at least on the measures con-sidered here—have improved vis-à-vis those of white students. Some of the trends in family background measures benefited Latinos (i.e., socioeconomic status), but several have not (e.g., parent education and family income).
It is less clear that school organization characteristics reveal a closing of the black-white or Latino-white gap. In one instance, that of urban school attendance, there has been a narrowing of the gaps between black and white and Latino and white students. However, when considering school minority ratios or socioeconomic compo-sition or private school attendance, there have not been significant changes in the racial-ethnic group differences.
Changes in schooling characteristics, however, when measured by self-reported track placement, suggest important improvements in

Trends in Mathematics Achievement, Family, and School Characteristics, 1972–1992 59
the schooling experiences of black and Latino students vis-à-vis their white counterparts. A greater proportion of black and Latino students report academic-track placement in 1992 compared with 1982 and 1972. The black-white and Latino-white gaps in this regard have closed dramatically.
But what are the relationships among these trends? How do the changes in the family background and school measures relate to black-white and Latino-white test score trends? By decomposing the effects of these measures on mathematics achievement, we can provide some answers to these questions, something we turn to in the next chapter.


61
CHAPTER FIVE
The Relationships Between Mathematics Test Score Gaps and Changes in Families and Schools, 1972–1992
As we have argued, examining trends in individual, family, and school differences among different racial-ethnic groups is critical for moni-toring societal inequalities over time. In this chapter, we analyze the correspondence of these family and school changes to the mathematics test score differences for nationally representative senior high school cohorts between 1972 and 1992.
Decomposing Changes in the Black-White Test Score Gap
The methods we use allow us to disentangle the changes that have occurred for black and white students (and later for Latino and white students). We examine the changes between 1972 and 1992 in levels (means) of the individual, family background, and school measures. When these changes are scaled by the 1972 regression coefficients, we are able to examine how family and school changes corresponded to the changes that occurred in the test score gap between black and white students and between Latino and white students. In other words, assuming that the 1972 relationships between family and school mea-sures and mathematics achievement remained constant for later senior cohorts, we examine how changes in population characteristics cor-responded to changes in the mathematics achievement gap over this 20-year period. When presenting the results, we focus on changes in the population (i.e., family and school) and then on the changes in student reports about secondary school tracking. The results of this decompo-sition for mathematics achievement scores appear in Table 5.1. The

62 Examin
ing
Gap
sin
Math
ematics
Ach
ievemen
tA
mo
ng
Racial-Eth
nic
Gro
up
s
Table 5.1Decomposition of the Relationships of Family Background, Track, and School Measures to the Convergence in Black-White Mathematics Scores, 1972–1992
Black-White
1972–1982 1982–1992 1972–1992 1992
∆ % ∆ % ∆ % ∆ %
Individual and Family Measures Total –0.086 30.86 –0.045 –89.77 –0.128 56.65 0.133 18.55
Female –0.010 3.47 0.001 2.95 –0.007 2.91 0.004 0.50
Family Income –0.007 2.48 –0.005 –10.59 –0.012 5.22 0.047 6.63
Parental Education 0.014 –5.26 –0.028 –55.29 –0.012 5.30 0.058 8.11
Occupational Status –0.083 30.17 –0.013 –26.84 –0.097 43.22 0.024 3.31
School Measures Total –0.024 8.72 0.067 134.19 0.027 –12.16 0.106 14.77
School Mean SES –0.007 2.54 0.017 34.32 0.002 –0.93 0.021 2.98
–0.020 7.31 0.050 100.00 0.023 –10.34 0.093 12.97School Percent Minority
Suburban School 0.000 0.05 0.000 0.97 0.001 –0.51 –0.004 –0.57
Private School 0.005 –1.90 0.000 –0.48 0.004 –1.90 0.000 –0.07
Urban School –0.002 0.72 0.000 –0.62 –0.003 1.53 –0.004 –0.54
Academic Track –0.138 50.33 0.004 8.80 –0.133 59.28 0.054 7.51
Total –0.247 89.92 0.027 53.22 –0.233 103.78 0.292 40.83
Unexplained –0.028 10.08 0.023 46.78 0.008 –3.78 0.423 59.17
Total Change –0.275 0.050 –0.225 0.715

Mathematics Test Score Gaps and Changes in Families and Schools, 1972–1992 63
column of ∆’s in Table 5.1 is the change in the black-white test score gap for the period considered that is associated with the changes in the means for the variable (rows) being considered. The percent column (%) is the percentage of the total black-white test score gap for the period being considered to which changes in that particular variable correspond; positive percentages indicate that the predicted test score gaps would have decreased or converged, while negative percentages indicate that test score gaps would have increased or diverged.
Between 1972 and 1992, relative to white students, black stu-dents’ individual and family characteristics—parent education level, family income, and particularly parent occupational status—improved. These changes were large, and when scaled by the 1972 regression coef-ficients, these relative changes between the black and white student populations corresponded to 56.65 percent of the change in the test score gap. Of particular importance was the relative improvement of the socioeconomic circumstances of black families compared to white families as seen by changes in the SEI measure corresponding to 43.22 percent of the convergence in the mathematics scores between black and white students.
If one only considers changes in the mean school variables mea-sured here when scaled to the 1972 regression coefficients, there was a corresponding increase of the black-white test score gap between 1972 and 1992. The increases in black students’ likelihood of being segre-gated in high-minority schools corresponded to a 10.34 increase of the black-white mathematics gap. Overall, changes in school-level means corresponded to a 12.16 percent increase of the black-white gap.
One of the most important measures that corresponded to a decrease of the mathematics test score gap between white and black students was the change in the schooling experiences of black students as measured by self-reported academic-track placement. As discussed in Chapter Four, the gap between blacks and whites enrolled in the college track was −0.22 in 1972 and −0.08 in 1992. These differences indicate that while white students tended to report academic-track placement more than black students, these differences decreased significantly between 1972 and 1992. In Table 5.1, when this change is scaled to the 1972 regression coefficients, these changes in reported track placement

64 Examining Gaps in Mathematics Achievement Among Racial-Ethnic Groups
between black and white students corresponded to a 59.28 percent change in the mathematics score gap. Compared with black students in 1972, those in 1982 were more likely to report academic-track place-ment, which resulted in a closing of the gap with white students. These relative changes in reported academic-track placement corresponded to 50.33 percent of the convergence in the mathematics scores between black and white students. The relationship between track placement and the convergence of mathematics scores between black and white students remained relatively stable between 1982 and 1992, but here too, the increase in academic-track enrollment for black students com-pared with their white counterparts was associated with 8.80 percent of the test score convergence between 1982 and 1992.
Decomposing the Black-White Test Score Gap in 1992
Despite the associations between the convergence in mathematics scores and the changes in individual, family, and school measures that occurred between the different senior cohorts, substantial differences in mathematics scores remain between blacks and whites.
To examine what factors are related to the persistence of inequality in test scores between blacks and whites, we used our second decompo-sition to estimate the extent to which the variables measured here were associated with the black-white test score gap in 1992. The results for this decomposition appear in the final two columns of Table 5.1.
Important factors that were related to the 1992 test score differ-ences include students’ socioeconomic background, minority school composition, and track placement. Overall, the measures we consider corresponded to 40.83 percent of the difference in mathematics scores between black and white students. Considered separately, black-white differences in individual and family measures corresponded to an 18.55 percent decrease of the 1992 black-white mathematics gap. Par-ent education, income, and parental SEI corresponded, respectively, to decreases of about 8, 7, and 3 percent of the black-white mathematics gap in 1992.
In total, black-white differences in the school-level measures cor-responded to about a 15 percent decrease of the black-white mathemat-ics gap in 1992. Of particular importance was the minority composi-

Mathematics Test Score Gaps and Changes in Families and Schools, 1972–1992 65
tion of the school. Differences in attending schools of varying minority composition corresponded to about a 13 percent decrease of the black-white mathematics gap in 1992. This is particularly relevant because black students in these 1992 data attended schools where 42 percent of the student body was minority, compared with white students who attended schools where 18 percent of the students was minority (see Table 4.2). Accounting for these disparities in school composition is important in examining relationships to the continuing inequalities in black-white test score differences.
As in the cross-cohort decompositions, academic track revealed important relationships to black-white test score differences. In the decomposition for the 1992 cohort, black-white differences in academic-track placement corresponded to a 7.51 percent decrease of the math-ematics score gap.
Decomposing Changes in the Latino-White Test Score Gap
Turning now to the decompositions of mathematics test score differ-ences between Latino and white students, a different story emerges, and the results of this decomposition appear in Table 5.2. Our results reveal that the improved social conditions of Latino students during the 1972–1982 time frame corresponded to the convergence in math-ematics scores with white students over this ten-year period. However, the family and school conditions of Latino students did not continue to converge with white students between 1982 and 1992, which cor-responded to an increase of the Latino-white mathematics gap over this later period.
Over the 20-year period between 1972 and 1992, the changes in the family measures for Latino students were mixed. As we discussed in the previous chapter, for some family measures, Latino students’ circumstances did not improve relative to those of white students. If we scale these differences by the 1972 regression coefficients, we find that changes in parent education and family income correspond to increases, not decreases, in the mathematics test score gap of 12.13 per-

66 Examin
ing
Gap
sin
Math
ematics
Ach
ievemen
tA
mo
ng
Racial-Eth
nic
Gro
up
s
Table 5.2Decomposition of the Relationships of Family Background, Track, and School Measures to the Convergence in Latino-White Mathematics Scores, 1972–1992
Latino-White
1972–1982 1982–1992 1972–1992 1992
∆ % ∆ % ∆ % ∆ %
Individual and Family Measures Total –0.107 134.28 0.086 –31.36 0.003 –0.58 0.195 42.39
Female –0.018 22.28 0.007 –2.59 –0.003 0.94 0.000 –0.04
Family Income –0.021 25.91 0.030 –10.85 0.009 –2.54 0.057 12.33
Parental Education –0.004 5.30 0.039 –14.34 0.043 –12.13 0.104 22.69
Occupational Status –0.064 80.79 0.010 –3.58 –0.046 13.15 0.034 7.41
School Measures Total –0.056 70.63 0.099 –36.29 0.029 –8.17 0.094 20.45
School Mean SES 0.001 –0.95 0.025 –9.19 0.014 –3.97 0.029 6.19
School Percent Minority –0.045 57.10 0.072 –26.34 0.017 –4.77 0.074 16.03
Private School 0.000 –0.30 0.000 –0.14 0.001 –0.35 –0.004 –0.76
Suburban School 0.005 –6.89 –0.001 0.26 0.003 –0.77 0.000 –0.09
Urban School –0.017 21.66 0.002 –0.88 –0.006 1.69 –0.004 –0.92
Academic Track –0.068 85.33 –0.045 16.49 –0.120 34.07 0.077 16.77
Total –0.231 290.24 0.140 –51.17 –0.089 25.32 0.367 79.60
Unexplained 0.151 –190.24 –0.413 151.17 –0.263 74.68 0.094 20.40
Total Change –0.079 –0.273 –0.352 0.461

Mathematics Test Score Gaps and Changes in Families and Schools, 1972–1992 67
cent and 2.54 percent, respectively. For parent occupation status, Lati-nos did improve relative to whites between 1972 and 1992, and this change corresponded to a 13.15 percent decrease of the mathematics gap. Overall, changes in individual and family measures scaled to the 1972 regression coefficients corresponded to a 0.58 percent increase of the Latino-white mathematics score gap.
Turning to changes in school measures for Latino and white stu-dents between 1972 and 1992, we found that these changes corre-sponded to an overall increase of the Latino-white mathematics gap of 8.17 percent. Between 1972 and 1992, changes in school socioeco-nomic status corresponded to a 3.97 percent increase of the mathemat-ics score differences between Latino and white students, and changes in school percent minority composition was accompanied by a 4.77 percent increase of the gap.
Similar to what we found for black students, a critical change that improved the circumstances of Latino students relative to their white counterparts was the relative increase of Latinos reporting academic-track placement. In the last chapter we found that the gap between Latino and white students reporting academic-track enrollment was −0.24 in 1972 and −0.12 in 1992, indicating that although white students tend to report academic-track placement more than Latino students, these differences decreased significantly during this 20-year period. When scaled to the 1972 regression coefficients, the increase of Latino students reporting academic-track placement corresponded to a 34.07 percent decrease of the Latino-white mathematics scores between 1972 and 1992.
Decomposing the Latino-White Test Score Gap in 1992
As we did for black students, in the 1992 data we explored the extent to which Latino-white differences in family and school measures were associated with the mathematics score differences between Latino and white students (see the last two columns of Table 5.2).
Important factors that were related to Latino-white mathematics test score differences in 1992 were parent education, parent occupa-tional status, family income, minority and socioeconomic school com-position, and track placement. When considered together, Latino-white

68 Examining Gaps in Mathematics Achievement Among Racial-Ethnic Groups
differences in individual, family, and school measures corresponded to a 79.60 percent decrease of the 1992 mathematics gap.
Considered separately, differences in individual and family mea-sures between Latinos and whites corresponded to a 42.39 percent decrease of the Latino-white mathematics gap in 1992. Of particular importance are differences between Latinos and whites in terms of par-ent education levels. These parent education differences corresponded to a 22.69 percent decrease of the 1992 mathematics gap. Latino-white disparities in family income and parent occupational status cor-responded to respective decreases of 12.33 and 7.41 percent of the Latino-white mathematics gap.
Differences between Latino and white students in terms of the school measures corresponded to a 20.45 percent decrease of the 1992 mathematics gap. The school composition measures (socioeco-nomic status and percent minority) were particularly important. Dif-ferences between Latino and white students in terms of the minor-ity school composition corresponds to a 16 percent decrease of the Latino-white mathematics gap in 1992, and differences in school socioeconomic composition corresponded to a 6 percent decrease of the 1992 gap. Similar to what we found for black-white test score dif-ferences, these findings are relevant because Latino high school seniors in 1992 attended schools in which 37 percent of the student body was minority, compared with white students, who attended schools where 18 percent of the students were minority (see Table 4.2). Account-ing for these disparities in school composition, viewed as a proxy for schools that have historically been underserved by the education sys-tem, is important when examining persistent inequalities in Latino-white test score differences.
Finally, Latino-white differences in self-reported academic-track placement measure corresponded to a 16.77 percent decrease of the 1992 mathematics gap. This finding about the relevance of track place-ment is consistent with what we found in the cross-cohort decom-positions, which suggested that changes in academic-track placement between 1972 and 1992 corresponded to meaningful decreases in the Latino-white test score gap over this 20-year period.

69
CHAPTER SIX
Test Score Gaps Among Racial-Ethnic Groups: Conclusions and Policy Implications
Our analyses examined several family and school factors related to black-white and Latino-white test score differences in mathematics. We set out to build on past research by analyzing nationally represen-tative data between the early 1970s and early 1990s to address ques-tions related to mathematics score trends among blacks, Latinos, and whites; how selected family and school measures changed during this time period; and the correspondence of changes in these measures to black-white and Latino-white test score gaps. In this chapter, we sum-marize our findings based on these research questions and discuss the policy implications that arise from our empirical analyses, but before doing so, we discuss the limitations of our analysis to provide a context to interpret the results and their implications.
Limitations of Our Analysis
It is important to understand the limitations of the analyses we reported herein. First, the achievement, individual, family, and school measures were limited to those that we could measure across the 1972, 1982, and 1992 cohorts. Because there were not common items across other subject area tests, such as English, science, or social studies, we were unable to analyze other black-white and Latino-white achievement dif-ferences. Our analysis was limited to mathematics. Moreover, while prior research has shown the family and school measures we examined are important for examining achievement differences among black, Latino, and white students, we would have liked to examine a richer set of family and school measures. We were limited to analyzing mea-

70 Examining Gaps in Mathematics Achievement Among Racial-Ethnic Groups
sures available across the senior cohorts, and even some of these mea-sures were based on survey items that were not exactly the same across cohorts (see Appendix D).
Second, our measure of tracking is based on student self-reports. The focus in our analyses was on changes in students’ perceptions of their track placement between the early 1970s and early 1990s and how these changes corresponded to black-white and Latino-white test score differ-ences over time. Recent research on secondary school tracking has pointed out the problems of such self-reported track measures, even though several researchers continue to argue for the salience of these student perceptions (see Gamoran, 1989; Lucas, 1999; Lucas and Gamoran, 2001).
Third, when examining how changes in family, school, and track-ing measures correspond to changes in black-white and Latino-white mathematics achievement gaps, we examine changes in the means across cohorts, but we assume that the relationships between these measures and student achievement remained constant between 1972 and 1992. This is consistent with prior research that examined how family char-acteristics were related to black, Latino, and white student achievement trends (e.g., Grissmer et al., 1994, Grissmer, Flanagan, and Williamson, 1998). Further examination of the changing coefficients and interactions between racial groups over time is certainly warranted.
In addition, the decomposition results that we presented in the last chapter are limited in their interpretation. We did not directly model changes in family and school means and their effects using the achieve-ment gap as the dependent measure to directly assess how changes in the population explained achievement differences among students. Rather, our decomposition analyses serve only as an indirect guide to gauge the size of family and school changes and their correspondence to changes in the black-white and Latino-white mathematics gaps that occurred over this 20-year period.
Changes in Mathematics Score Gaps Among Blacks, Latinos, and Whites
Data from NAEP reveal that high school students in the United States today are scoring about the same in 1999 as they were in the early

Test Score Gaps Among Racial-Ethnic Groups 71
1970s when considering achievement proficiency in mathematics and reading. These overall trends mask significant progress made among certain groups. For instance, over the past 30 years, when compared with their white counterparts, black and Latino students made sub-stantial progress toward closing the test score gap in both mathematics and reading.
Consistent with these national trends, we found that black and Latino students have made considerable achievement gains in narrow-ing the black-white and Latino-white test score gap when examining the senior cohorts of NLS-72, HSB-82, and NELS-92. The black-white difference was over a standard deviation in 1972, and this gap narrowed by about 20 percent by 1992. Both the data we analyze here and NAEP reveal that the black-white differences in mathematics con-verged by roughly 1/100th of a standard deviation a year between the early 1970s and early 1990s. Black and white students’ mathematics scores did converge more between the early 1970s and 1980s com-pared with the convergence occurring between the early 1980s and early 1990s. Over this 20-year period, the Latino-white gap in math-ematics also converged. In 1972 the Latino-white mathematics gap was nearly 9/10ths of a standard deviation, but by 1992 the gap narrowed by about one-third, to 6/10ths of a standard deviation. Latino and white students’ scores converged more between 1982 and 1992 than they did between 1972 and 1982.
These overall patterns remain consistent, even though the data for the senior cohorts we analyze and the NAEP data differ in their design and specific mathematics test items. Because the 1972, 1982, and 1992 senior cohorts reveal a significant narrowing of the test score gaps between blacks and whites and between Latinos and whites, our analysis focused a great deal on how changes in family and school fac-tors contributed to the convergence of these mathematics score gaps.
Changes in Families and Test Score Gaps in Mathematics
When examining the relationships between family background mea-sures and test score gaps among blacks, Latinos, and whites, researchers frequently analyze cross-sectional or panel data for a particular cohort

72 Examining Gaps in Mathematics Achievement Among Racial-Ethnic Groups
of students to explain the percentage of the gap with family or other social indicators (see Berends, Sullivan, and Luca, 1999; Jencks and Phillips, 1998; Phillips et al., 1998; Hedges and Nowell, 1998, 1999; Brooks-Gunn, Klebanov, and Duncan, 1996; Grissmer et al., 1994). In such analyses, family background explains about 25–30 percent of the cross-sectional black-white gap in scores for a particular cohort (see Hedges and Nowell, 1998, 1999).
To further disentangle the relationships of family background to student achievement gaps, our analysis looks at the changes across cohorts in the levels of the background measures themselves and scaled these relationships to the 1972 regression coefficients. For different senior cohorts between 1972 and 1992, our analyses reveal that the improved socioeconomic conditions of black students—such as par-ents’ occupational status, educational attainments, and income—cor-responded to the significant amount of convergence in black-white test scores. Changes in the family background measures we analyzed cor-responded to a 54 percent decrease of the black-white mathematics gap between 1972 and 1992.
For these same cohorts, our findings show that the improved socioeconomic conditions of Latino students during the 1972–1982 time frame were consistent with the convergence in mathematics scores with white students over this ten-year period. However, the family and school conditions of Latino students did not improve relative to white students between 1982 and 1992 as revealed in the data sets, which corresponded to an increase of the Latino-white mathematics gap for this later time period.
Generally, between 1972 and 1992 Latinos students’ circum-stances across the family measures did not improve as did those of black students. For example, while Latino students did improve in terms of parent occupational status, they did not close the gap with whites when considering parent education or family income. Black students did close the gaps with whites on these family measures. The changes in the black-white and Latino-white test score gaps correspond to the extent and comprehensiveness of these family changes for Latino and black students relative to white students.

Test Score Gaps Among Racial-Ethnic Groups 73
Changes in Schools and Test Score Gaps in Mathematics
Despite some of the positive changes in family circumstances for black and Latino students, the changes that occurred between schools cor-responded to an increase of the black-white and Latino-white math-ematics test score gaps between 1972 and 1992. In our analyses, com-pared with white students, black and Latino students were more likely to attend higher-minority schools in 1992 than in 1972, and these changes corresponded to increasing the black-white and Latino-white mathematics achievement gaps over this 20-year period. Several other authors have commented on the increasing segregation of minority students in recent years (Orfield and Yun, 1999; Orfield, 2001). The effects of desegregation were most dramatic in changing the racial- ethnic composition of schools during the 1960s and 1970s (Griss-mer, Flanagan, and Williamson, 1998; Armor, 1995), so our analyses may have missed the most dramatic positive effects of these changes. Yet changes in composition do not immediately result in changes in school activities and culture that are beneficial to black students. As Grissmer, Flanagan, and Williamson (1998) showed, black seniors who were tested in the early 1970s entered school in the early 1960s, a time when 60 percent of the black population was educated in schools in which more than 90 percent of the students were from minority backgrounds. Because of the dramatic desegregation in schools that occurred between 1968 and 1972 (especially in the South), students who entered school in the early 1970s were the first to experience a schooling career from K-12 in less-segregated schooling circumstances. These are the students that would be taking tests as seniors in the mid-1980s. Yet as our analyses suggest, changes in the minority composi-tion of high schools did not correspond to a decrease of the black-white and Latino-white achievement gaps. Rather, our analyses reveal that the increases in the minority composition of high schools that black (and Latino) students attended between 1972 and 1992 corresponded to an increase of the test score gaps.
Compared with these between school changes, there were posi-tive changes in the within-school experiences of black and Latino
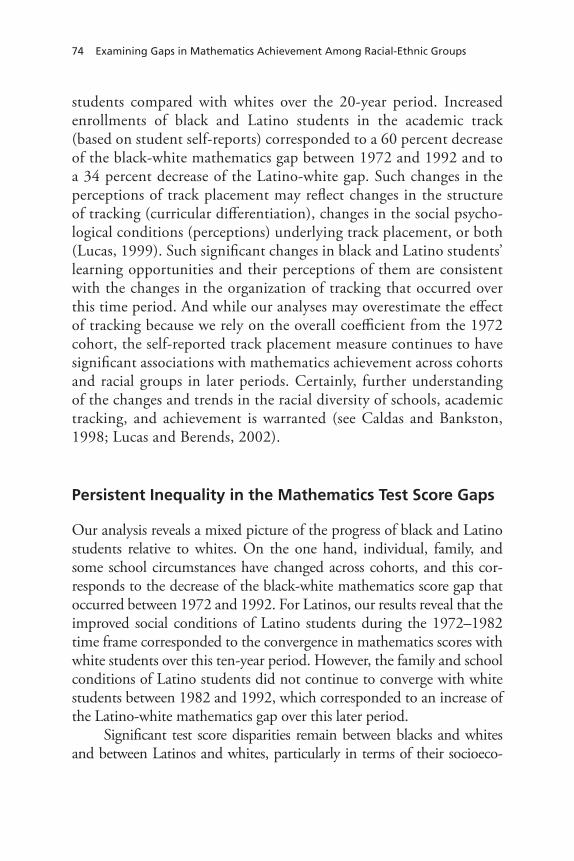
74 Examining Gaps in Mathematics Achievement Among Racial-Ethnic Groups
students compared with whites over the 20-year period. Increased enrollments of black and Latino students in the academic track (based on student self-reports) corresponded to a 60 percent decrease of the black-white mathematics gap between 1972 and 1992 and to a 34 percent decrease of the Latino-white gap. Such changes in the perceptions of track placement may reflect changes in the structure of tracking (curricular differentiation), changes in the social psycho-logical conditions (perceptions) underlying track placement, or both (Lucas, 1999). Such significant changes in black and Latino students’ learning opportunities and their perceptions of them are consistent with the changes in the organization of tracking that occurred over this time period. And while our analyses may overestimate the effect of tracking because we rely on the overall coefficient from the 1972 cohort, the self-reported track placement measure continues to have significant associations with mathematics achievement across cohorts and racial groups in later periods. Certainly, further understanding of the changes and trends in the racial diversity of schools, academic tracking, and achievement is warranted (see Caldas and Bankston, 1998; Lucas and Berends, 2002).
Persistent Inequality in the Mathematics Test Score Gaps
Our analysis reveals a mixed picture of the progress of black and Latino students relative to whites. On the one hand, individual, family, and some school circumstances have changed across cohorts, and this cor-responds to the decrease of the black-white mathematics score gap that occurred between 1972 and 1992. For Latinos, our results reveal that the improved social conditions of Latino students during the 1972–1982 time frame corresponded to the convergence in mathematics scores with white students over this ten-year period. However, the family and school conditions of Latino students did not continue to converge with white students between 1982 and 1992, which corresponded to an increase of the Latino-white mathematics gap over this later period.
Significant test score disparities remain between blacks and whites and between Latinos and whites, particularly in terms of their socioeco-

Test Score Gaps Among Racial-Ethnic Groups 75
nomic circumstances and achievement scores. While there has been a 20 percent reduction in the black-white mathematics test score gap, the unadjusted differences remain about 0.85 of a standard deviation in math-ematics, a large difference. Moreover, despite the large gains in the family background measures considered here, 41 percent of the black students in the 1992 cohort were living in poverty, compared with 19 percent of white students. Gaps in the other social background measures remain as well, such as black students’ being in schools that are high-minority and low SES. In our decompositions for 1992, changes in the measures for students’ socioeconomic background, track placement, and minor-ity school composition, when scaled to the 1972 coefficients, corre-sponded to decreases in the persisting gap in black-white mathematics achievement. Thus, while a great deal of progress has been made in improving the conditions of black students relative to whites, substan-tial inequalities remain.
When considering the Latino-white test score differences, we found a that the mathematics gap was 0.88 of a standard deviation in 1972 and converged to 0.60 of a standard deviation in 1992, a 32 percent reduction in the gap. Yet it is important to note that the 0.60 difference between Latino and white students’ mathemat-ics scores remains large. Moreover, despite the changes in family background and school measures considered here, 49 percent of the Latino students in the 1992 cohort were living in poor families, while about one-fifth of white students were living in poverty. Similar to their black counterparts, Latino students were more likely to attend schools that have traditionally been underserved by the American education system, as proxied by the high percent of minority stu-dents and low SES of those schools. In our decompositions for 1992, changes in the measures for students’ socioeconomic background, track placement, and minority school composition corresponded to decreases in the Latino-white gap in mathematics scores. Again, while some progress has been made at different periods for Latino students, the most recent years in the data we analyzed suggest that our society—and its social polices and educational system—need to address the lack of sustained attention to improving the family and school conditions of Latino students.

76 Examining Gaps in Mathematics Achievement Among Racial-Ethnic Groups
Policy Implications of Our Analysis
Although we were able to examine the relationships between stu-dents’ test score gaps and several family and school measures, it is important to note that our data do not allow us to attribute cause to any one factor in particular. Moreover, we were limited to the measures in our study that could be measured in consistent ways over time. Thus, some other important family and school measures may be omitted from our analyses; for example, our findings might have changed significantly if we had been able to control for stu-dents’ prior achievement differences. Because of these and the other limitations noted previously, we need to be cautious about the policy implications we draw from our analyses. However, the general cor-respondence that we found between family and school measures and the student mathematics achievement gaps suggests that there are some policy implications worth considering.
While sorting out the relative contributions of families and schools to the black-white and Latino-white achievement gaps is a complex exercise—limited by a lack of nationally representative data and con-sistent measures over time—it is important to think about policies that support families, provide opportunities to students within schools, and provide experiences to students across schools that may improve their academic achievement.
For example, the federal NCLB legislation aims to support stu-dent achievement in school by supporting not only schools, but also families. Parent involvement in their childrens’ academic activities at home is emphasized in NCLB, a factor that previous work has shown is related to academic achievement (see Phillips, Brooks-Gunn, et al., 1998; Turnbull et al., 1999, 2001). Yet one of the consistent challenges of schools, particularly high-poverty urban schools, is to actively engage a significant number of parents in support of the school (Lareau, 1989; 2002). Despite the significant challenges of trust among schools and different racial-ethnic minorities (Bryk and Schneider, 2002), federal and state support for parent involvement in the schooling activities of their children may be helpful if sustained in meaningful ways over time. Because NCLB requires states and districts to monitor the black-

Test Score Gaps Among Racial-Ethnic Groups 77
white and Latino-white achievement gaps in mathematics and reading, there may be evidence available in the near future from states about whether parent involvement activities supported with federal funding are associated with closing of achievement gaps.
Because of the correspondence between improved parents’ socio-economic circumstances and decreases in the black-white and Latino-white mathematics score gaps, policies that support the advancement of educational attainment, occupational attainment, and wages are also worthwhile. A key factor in improving socioeconomic circumstances is access to higher education (Becker, 1993; Sewell and Hauser, forthcom-ing). While there is a great deal of controversy about providing racial preferences for college admission, policymakers need to think about revis-ing affirmative action policies in higher education to provide black and Latino students with advanced educational opportunities (Kane, 1998; Wilson, 1999). As the labor market payoff to a college education has increased and as admission to elite colleges and universities has become more competitive, providing racial preferences during the admissions process has certainly become increasingly controversial and contested.
As our society becomes increasingly diverse, addressing such chal-lenges is a worthwhile exercise. As Kane (1998) argues,
The debate over affirmative action in college admissions will depend on a careful weighing of the value of racial diversity on college campuses against the real costs imposed on the stu-dents who are not admitted. In social policy debates, the easy answer—promising social benefits without social costs—usually proves ephemeral. The debate over affirmative action in college admissions is likely to be no different . . . an end to racial prefer-ence would seem to impose real costs on minority youth. Thus there is no avoiding the difficult trade-offs to be made. (p. 453)
Because of the positive changes in black and Latino families’ socio-economic circumstances that we found in our analyses, their corre-spondence with closing the achievement gaps, and the large gaps in achievement and socioeconomic circumstances that remain, dealing with these difficult trade-offs is a policy exercise worth the difficult work and debate. As Wilson (1999) states, “it could take several gen-

78 Examining Gaps in Mathematics Achievement Among Racial-Ethnic Groups
erations before adjustments in socioeconomic inequality produce their full benefits” (p. 98) (see also Jencks and Phillips, 1998).
In addition, our analyses suggest that educational policy and reform need to be attentive to educational opportunities within schools and between schools by addressing issues related to secondary school tracking and the increasing isolation of minority students in predomi-nately minority schools. Our analyses show that there have been signif-icant advances for black and Latino students who reported academic-track placement in the early 1990s compared with the early 1970s. A large portion of the black-white and Latino-white mathematics score convergence corresponded to the increase of black and Latino students who reported college-track placement over time compared with white students. Although our analyses cannot attribute cause to our tracking measure and may overestimate the academic-track coefficient, the cor-respondence we find in our analysis is consistent with those researchers who speculate that tracking has played an important part in the closing of the achievement gaps (see Cook and Evans, 2000; Grissmer, Flana-gan, and Williamson, 1998; Porter, forthcoming). Thus, further atten-tion to tracking in research and policy is worth consideration.
Tracking today differs a great deal from the organization of track-ing in the 1960s and 1970s (see Lucas, 1999; Oakes, 1985; Oakes, Gamoran, and Page, 1992), but there have been questions about whether these changes have benefited minority students. For exam-ple, Ferguson (1998) has argued that changes in the organization of tracking would not decrease the achievement gaps unless there were substantial differences in the curriculum and courses taken. There is good reason to believe that many students, especially those who are black and Latino, are experiencing such changes to the curriculum (see Berends et al., forthcoming; Lucas and Gamoran, 2001; National Sci-ence Board, 2002). With more students—black, Latino, and white—taking academic-track classes, there has been concern that the increas-ing number of lower-achieving students taking academic courses has resulted in a dumbing down of the curriculum. However, analyzing teacher logs over the school year, teacher questionnaires of content and the cognitive demand of the content covered, and observations, Porter and colleagues find no evidence that teachers are dumbing down the
Test Score Gaps Among Racial-Ethnic Groups 79
content of mathematics and science to accommodate students (Porter, forthcoming; Porter, Kirst, Osthoff, Smithson, and Schneider, 1993). Thus, educational policies and reforms that require students to take college preparatory courses like mathematics are likely to further nar-row the achievement gap, or at least keep it from widening.
In addition to the implications for how tracking is organized, our analyses point to between-school factors that policymakers need to keep in mind when framing family and educational policies. We found that there was an increasing proportion of high-minority schools in the early 1990s compared with the early 1970s, and these changes suggest diverging test scores rather than the observed convergence in scores between black and white students and between Latino and white stu-dents. Others have found similar trends in other data (Orfield, 2001; Orfield and Yun, 1999). Policies that address the increasing racial isola-tion of students in predominantly minority schools (like college admis-sions policies) can certainly be controversial. However, recent policy initiatives of states and school districts to address school funding issues and the racial balance of schools are likely to be worthwhile in improv-ing the racial balance of schools.
For example, using socioeconomic circumstances for admissions purposes in elementary and secondary schools may hold some promise in diversifying schools racially and ethnically (even though using such criteria for college admissions has been hotly debated [see Kahlenberg, 1996; Kane, 1998; Wilson, 1999]). While the correlation between the racial-ethnic and socioeconomic composition of schools is not per-fect, Flinspach, Banks, and Khanna (2003) found that school districts may be able to use socioeconomic measures such as family income to preserve racially diverse schools. Achieving such balance in schools prevents racial isolation, but also ameliorates some school problems related to poverty (see also Kahlenberg, 2001).
Other educational policies that have gained currency include school choice, vouchers, and charter schools. While there may be some benefits of choice plans in creating more racially diverse schools (Gold-ring and Smrekar, 2002; Kahlenberg, 2001), the evidence is far from complete about whether such plans reduce racial isolation across the nation as a whole and whether choice plans contribute directly to clos-

80 Examining Gaps in Mathematics Achievement Among Racial-Ethnic Groups
ing achievement gaps (Gill et al., 2001; Zimmer et al., 2003). This does not mean, however, that such policies should not be pursued if they promote desegregation in ways that provide educational opportunities and improve academic achievement. As choice plans are developed and implemented under NCLB, the next few years will be telling in terms of the positive and negative effects of different choice policies.
In spite of the public policies that may contribute to the closing of the achievement gap—whether by providing more support to families, increasing educational opportunities within schools, or decreasing the racial isolation between schools—it is important understand the family and welfare policies need to be coordinated with educational policies; this complex, yet critical interplay is often ignored by policymakers. Without thinking about how educational policies complement or conflict with policies related to such spheres as welfare, work, and housing, the goal of narrowing achievement gaps will continue to face significant obstacles.
When commenting on research that focuses on academic achieve-ment score gaps, Wilson (1999) argues that policymakers, educators, and researchers need to understand
the impact of relational, organizational, and collective processes that embody the social structure of inequality. Included among these processes are the institutional influences on mobility and opportu-nity; the operation and organization of schools; the mechanism of residential racial segregation and social isolation in poor neighbor-hoods; categorical forms of discrimination in hiring, promotions, and other avenues of mobility; ideologies of group differences shared by members of society and institutionalized in organizational prac-tices and norms that affect social outcomes; unequal access to infor-mation concerning the labor market, financial markets, apprentice-ship programs, and schools; the activities of employers’ associa-tions and unions; government policies involving taxation, service, investment, and redistribution; and corporate decisions concerning the location of mobility of industries. . . . [I]n the long term the programs that will have the greatest effect are those that attack all aspects of the structure of inequality. (p. 508)
Only then, Wilson continues, will we be able to drastically reduce and perhaps eliminate the differences in social context that create the pres-ent black-white and Latino-white achievement gaps.
Test Score Gaps Among Racial-Ethnic Groups 81
We hope that the findings reported in our analysis, although addressing a tiny portion of Wilson’s agenda, contribute to our under-standing of the correspondence between family and school changes and changes in student achievement gaps, in order to further our thinking about coordinating public policies to support students, particularly students of color. Time will tell whether our society has the commit-ment, will, and capacity to further reduce student achievement gaps.


83
APPENDIX A
Item Response Theory Scaling of Pooled Senior Cohorts in NLS, HSB, and NELS
When comparing racial-ethnic test score differences over time, ide-ally the underlying proficiency scores (theta or θ) should stem from the same set of items. The data we examine do not have the same set of items, but the sample of multiple choice items that are common across years in the data allow us to calculate equated proficiency scores. In order to more accurately measure the extent of group differences within each of the senior cohorts, the tests also need to be calibrated on the same scale. To equate, or link, the test scores over time, we used the common test score items that appeared across four senior cohorts in NLS-72, HSB-80, HSB-82, and NELS-92. Because there was also a cohort for seniors in 1980 for HSB, those students’ scores are used in our test score equating procedures. We plan to make these newly equated scores for NLS-72, HSB-80, HSB-82, and NELS-92 publicly available. Although our descriptive and multivariate analyses revealed no significant difference between the HSB-80 and HSB-82 cohorts, we used three senior cohorts in the main chapters of this book.
Toward this end, test scores were calculated using Item Response Theory (IRT) (see Lord, 1980; Hambleton, 1989). While explained in more detail later, IRT assumes that a test taker’s probability of correctly answering an item on a test is a function of his or her proficiency level and other characteristics of the item itself. For instance, in a three-parameter IRT model, aspects used to mathematically determine a stu-dent’s score include how well a particular item distinguishes between proficiency levels at a particular point, the difficulty of the item, and the extent to which a student can guess the item correctly (“guessabil-

84 Examining Gaps in Mathematics Achievement Among Racial-Ethnic Groups
ity” of the item). These aspects are used to place each test taker at a particular point (i.e., theta or θ on a continuous proficiency scale).
Options for Equating Mathematics Scores Across Senior Cohorts
In their report Psychometric Analysis of the NLS and The High School and Beyond Test Batteries, Rock et al. (1985b) of the Educational Testing Service (ETS) created a vector of IRT-scaled estimated Number Right Formula Score (NRFS) for the NLS-72, HSB-80, and the HSB-82 seniors. Here, we document the RAND reestimation of IRT scaling for mathematics and discuss differences from those generated by ETS. Later, we estimate IRT mathematics scores after adding the NELS-92 data to the item test pool.1
The three-cohort reestimation serves as a baseline for understand-ing differences between the original ETS scores and the four-cohort pooled estimates (what we call Option II). Our reestimation of scores in NLS-72, HSB-80, and HSB-82 are quite similar to the original ETS scores. This should be comforting to those who have examined the existing IRT scores in these cohorts, especially since there have been several advances in computer software and capability and IRT meth-odology since ETS generated those IRT scores. By reestimating the three-cohort mathematics scores (Option I), we are able to decompose the differences between the ETS scores and the four-cohort estimates (Option II) into (1) differences due to the availability of more sophis-ticated software, increased computational power, and weighting of the baseline sample, and (2) differences due to the addition of the addi-tional cohort.
Following Hambleton (1989), the estimated probability that a ran-domly selected examinee of proficiency θ will answer item i correctly is specified through the following three-parameter logistic model (3PL):
1 Again, we replicated this approach for equating reading scores across NLS-72, HSB-80, and HSB-82.

Item Response Theory Scaling of Pooled Senior Cohorts in NLS, HSB, and NELS 85
where • n = number of items on the exam • ai = item discrimination • bi = item difficulty • ci = pseudochance level (a.k.a. “lower asymptote” or “guessing
parameter”) • D = 1.7, a scaling factor • θ = the proficiency of the randomly selected examinee θ ~ N
(0,1)
In our estimation of IRT scores, we first entered an individual’s actual response (1, 2, 3, or 4) to each of the common multiple choice items that were part of the mathematics tests, or 65 items in the case for NLS-72, HSB-80, and HSB-82. Each item was given a binary response (1 = correct, 0 = incorrect). If a student did not reach an item (possibly due to the time limitation), the item was treated as not administered and was not used in the IRT estimation. Internal omits occurred when no response was given to a question, but a valid response was given to a later question in the test. These items are considered to be “skipped” by the student and were scored as incorrect.
All students who had a valid case weight (greater than zero) and who gave one or more valid responses (i.e., not internal or external omits) in the test were used to calibrate the item parameters.2 The responses from each of the three cohorts were pooled. For mathemat-
Pi (θ) = ci + (1 – ci) eDai (θ – bi) = ci + 1 = (i = 1,2,. . ., n)1 + eDai (θ – bi) 1 + e–Dai (θ – bi)
2 In each cohort, we used the test weight instead of the questionnaire weight. The sum of the questionnaire weights and the sum of the test weights both equal the population total. Where unavailable, the test weight was computed by adjusting strata weight totals for instrument nonresponse. Case weights were rescaled within cohort so that the sum of each cohort’s case weights equals the sample size in the NLS-72 cohort. For mathematics, there were:
15,709 valid cases in the NLS-72 cohort24,771 valid cases in the HSB-80 cohort25,690 valid cases in the HSB-82 cohort 66,170 Total Cases
Therefore, the sum of the weighted responses used to calibrate was 15,709 for each cohort.

86 Examining Gaps in Mathematics Achievement Among Racial-Ethnic Groups
ics, 12 of the 25 items in the NLS-72 cohort were also present in the HSB-80 and HSB-82 cohorts. Six items offered in the HSB-80 cohort were identical to the HSB-82 cohort. Thirteen, 14, and 20 items were unique to the 1972, 1980, and 1982 cohorts, respectively. Therefore, there are 65 unique items in the pooled test. If a particular question was not offered to a particular student, the item for that student was coded as an external omit and not used in the estimation of proficiency and item parameters.
IRT parameters were calibrated based on the pooled sample of the three-cohort students (using BILOG-MG; see Zimowski, et al., 1996). Item parameters were estimated for the entire pool, but the latent distributions of proficiency (θ) were allowed to vary by cohort.3 The general term for this type of IRT scaling is nonequivalent groups equating, which is explained by Zimowski et al. (1996, p. 20):
Either to satisfy disclosure regulations or to protect the test from compromise, testing programs must regularly retire or replace some or all of the items with others from the same content and process domains. They then face the problem of equating the reporting scales of the new and old forms so that the scores remain comparable. . . . A [more] economical approach is to provide for a subset of items that are common to the old and new form, and to employ nonequivalent groups equating to place their scores on the same scale. . . . With suitable common items included, the old and the new forms can be equated in data from the operational administration of the tests without an additional equating study.
However, because there are some common mathematics items administered to high school seniors across all the data sets, a second rescaling option exists for mathematics. We examine this second option for equating test scores across the cohorts and compare these estimates
3 Any form of equating must hold something constant. Our approach does not hold students constant, so it holds difficulty estimates constant. That is, it assumes that the true difficulty of items is constant across cohorts. Or, as may be more accurate for IRT equating, it assumes that the link between theta (θ) and the item parameters is unchanged. This assumption may not always be met. We hope to address this in our future research on these data.

Item Response Theory Scaling of Pooled Senior Cohorts in NLS, HSB, and NELS 87
to the approach above, and then we conduct further sensitivity analysis by comparing the IRT estimates to those in the NAEP trend assess-ment.4 Because of NAEP-equated scores in NELS, we are able to ana-lyze further whether the test score differences in NELS are comparable to those we would find in NAEP.
There are sufficient data to calculate IRT scaled mathematics scores for the pooled NLS-72, HSB-80, HSB-82, and NELS-92 data. To avoid floor and ceiling effects after the base year when the students were eighth graders, NELS used adaptive testing when the students were in grades 10 and 12. Thus, there were several different forms of the test that students took in follow-up years depending on how they scored previously. These forms can be grouped into low-, medium-, and high-proficiency groups. For estimation purposes, we treated each proficiency group in the NELS survey as a separate group. Thus, pool-ing the NELS groups with the other three senior cohorts results in a total of four cohorts and six groups.
There are 14 mathematics items that are common to both NELS-92 and HSB-82, although there are only 10 items common to the low-proficiency group, 11 items common to the medium-level group, and 5 items common to the high-proficiency group. Furthermore, 6 of the 14 common items are also found in the NLS-72 and HSB-80 sur-veys and 1 item that is common to HSB-82 (but not NLS-72). When considering the six different tests administered to the four cohorts, there are 121 unique mathematics items (MATH001-MATH121). For example, item 20 on the NLS-72, HSB-80, and HSB-82 tests was offered as item 15 on the low-proficiency test, item 11 on the medium-proficiency test, and not offered to the high-proficiency test group.
4 The specific list of data sources and variables used in this analysis are as follows: (1) NLS-72—scores based on matrix of responses of 25 mathematics multiple-choice items, weight variable is W1 (rescaled); (2) HSB-80—scores based on matrix of responses of 32 mathematics mul-tiple-choice items, weight variable is DESIGNWT (rescaled); (3) HSB-82—scores based on matrix of responses of 38 mathematics multiple-choice items, weight variable is FUTESTWT; (4) NELS-92—scores are from variable F22XMTH (standardized theta), F22XMSTD (stan-dardized NRFS), and F22XNAEP (NAEP-equated theta), weight variable is F2QWT (res-caled). (The NELS mathematics test had 40 questions.); and (5) NAEP-92—first plausible value from National Math assessment, MRPCM1. The weight variable is ORIGWT—only 6,973 students in Grade 12 are used from pool of 9,499 students. The NAEP mathematics test had 27 questions.

88 Examining Gaps in Mathematics Achievement Among Racial-Ethnic Groups
Appendix B provides a mapping of mathematics items to the tests in each of the cohorts.
The same approach that was used to calculate the three-cohort IRT scores was used to calculate the four-cohort scores. The three test groups (low, medium, and high proficiency) were administered differ-ent tests and were treated as separate groups. This means that a common set of item parameters was estimated for all four cohorts, but the profi-ciency distributions for each of the six groups was estimated separately. The design weights were rescaled so that the sum of the weights for the entire NELS-92 test-taking group equaled the sample size for NLS-72. Therefore, each of the four cohorts contributes equally to the calibra-tion of item parameters. Items not administered to a cohort are treated as “not presented” and are not used in the scoring. The NLS-72–based Number Right True Scores (NRTS) can also be easily calculated by passing the normally distributed θ values through the estimated item parameters for the 25 NLS-72 questions. Making the nonlinear adjust-ment (see Appendix C) to the NRTS allows us to acquire the NRFS. To allow comparison with the original ETS estimates, the estimated scores can also be represented as NRFS, since scores on the theta scale are not available for the data set.
Option I: Comparison of Estimated Three-Cohort Proficiencies and Educational Testing Service Estimates
Overall, our reestimation of mathematics scores in NLS-72, HSB-80, and HSB-82 are quite similar to the original ETS scores. Details of the comparisons between our estimates and those of ETS are provided in Table A.1. Once item parameter and proficiency estimates were gener-ated, the NRFS was obtained by applying the θ estimates to the item parameters for the 25 NLS-72 items. The within-cohort weighted correlations among our estimates and those of ETS exceed 0.994 for all three cohorts. The weighted estimates for the three senior cohorts appear in Table A.1, in which RAND NRFS-3 is our estimate of the NRFS for the three senior cohorts, and ETS NRFS is ETS’s original estimate.

Item Response Theory Scaling of Pooled Senior Cohorts in NLS, HSB, and NELS 89
As one might expect, there are some differences between the ETS- and RAND-created scores. There are several reasons for these differences.
First, there have been advances in software since ETS first cal-culated their IRT scores. ETS used the LOGIST program (which uses maximum likelihood estimation [MLE] and requires that upper bounds be placed on the pseudochance and item difficulty parameters). RAND used BILOG-MG’s marginal maximum likelihood method, which does not require upper bounds on parameters (although the parameters can be controlled through specification of appropriate prior distributions) and allows prior distributions of guessing param-eters to be applied.
Second, there have been advances in hardware capabilities. At the time each vector of scores was generated in 1985, ETS was constrained by the excessive costs of computer processing and used only 6,000 stu-dents in the calibration of examinee proficiency and model parameters (2,000 per cohort). The advances of computer technology since the mid-1980s makes RAND’s processing costs negligible, so we were able to process all responses.
Third, the research on IRT methods has developed. Since the early 1980s a large amount of research has been published on IRT scaling. Some of this literature directly suggests alternative techniques to those used by ETS in their IRT analysis. For example, De Gruijtner (1984) suggested that introduction of a prior estimate on the pseudochance parameter, rather than fixing this parameter, drives down the standard error on the location parameter. Moreover, Bayesian estimates increase
Table A.1 Weighted Comparison of IRT Number Right Mathematics Formula Score Estimates with ETS’s Original Estimates
Cohort Variable N Mean Standard Deviation Minimum Maximum
1972 ETS NRFS 15,705 12.881 7.314 –2.832 24.993RAND NRFS-3 15,709 12.781 7.389 –2.134 24.646
1980 ETS NRFS 24,758 11.830 7.220 –2.832 24.993RAND NRFS-3 24,771 11.698 7.287 –2.188 24.799
1982 ETS NRFS 25,679 10.477 7.475 –2.832 24.993RAND NRFS-3 25,690 10.272 7.481 –2.410 24.769

90 Examining Gaps in Mathematics Achievement Among Racial-Ethnic Groups
the likelihood that estimates stay in the desired parameter space and generally produce better estimates (measured in terms of mean squared difference between estimated and true scores) than the MLE method employed by LOGIST (Swaminathan and Gifford, 1986). With the software available in 1985, ETS had to control the discrimination parameters by specifying the upper bounds rather than setting values for prior distributions.
Finally, the RAND NRFS-3 scores are based on a weighted sam-ple of students based on rescaled test weights. There is no evidence in the ETS report to suggest that weighting was used in the original calibration.
Option II: Comparison of Estimated Proficiencies Across NLS-72, HSB, and NELS
Having replicated the ETS estimates in NLS-72 and HSB, we can now analyze these IRT estimates in conjunction with those IRT estimates that equate scores across the senior cohorts between 1972 and 1992 by adding the NELS test score data. The summary statistics for each of the four cohorts appears in Table A.2.5 For comparison, the ETS three-cohort scores and our estimated three-cohort scores are provided (from Table A.1). The source of the changes that result from comparison of the four-cohort estimates and the ETS estimates can be decomposed into those that result from the changes in software, methodology, and sampling design, and those that result from the addition of the fourth cohort. Variable RAND NRFS-3 is our three-cohort estimate, RAND NRFS-4 is our four-cohort estimate, and ETS NRFS is the original ETS estimate.
Within NELS-92, the estimated proficiency among the differ-ent forms is shown in Table A.3. Note that the standard deviations for each cohort are significantly smaller than the overall standard deviation of 6.9.
5 These results are also based on using MLE for the score distribution and using nonequivalent groups (six groups) equating. Again, IRT estimates were generated using BILOG-MG.

Item Response Theory Scaling of Pooled Senior Cohorts in NLS, HSB, and NELS 91
Option I Versus Option II: Comparison of Equating Alternatives
In Option I, we documented RAND’s reestimation of the IRT scaling for mathematics in NLS-72, HSB-80, and HSB-82, and in Option II we estimate IRT mathematics scores by adding the common items from NELS-92. In our first option for equating scores, the data set reflected IRT scores generated from two separate scaling operations: (1) equating scores from the 1972, 1980, and 1982 senior cohorts; and (2) using the IRT-created scores as they appear in the 1992 data. Since the NELS NRFSs are based on a different number of test questions (38) than the IRT estimates, we now restandardize the different NRFS scores so that all separate sources are distributed N(50,10). The four variables that we create are summarized in Table A.4.
Table A.2Weighted Results of Pooled IRT Scaling (NRFS)
Cohort Variable N MeanStandard Deviation Minimum Maximum
1972 ETS NRFS 15,705 12.881 7.314 –2.832 24.993
RAND NRFS-3 15,709 12.781 7.389 –2.134 24.646
RAND NRFS-4 15,709 12.772 7.408 –2.793 24.607
1980 ETS NRFS 24,758 11.830 7.220 –2.832 24.993
RAND NRFS-3 24,771 11.698 7.287 –2.188 24.799
RAND NRFS-4 24,771 11.666 7.382 –2.909 24.598
1982 ETS NRFS 25,679 10.477 7.475 –2.832 24.993
RAND NRFS-3 25,690 10.272 7.481 –2.410 24.769
RAND NRFS-4 25,690 10.274 7.642 –3.205 24.720
1992 RAND NRFS-4 12,891 14.268 6.940 –1.852 24.756
Table A.3 Weighted Results of Pooled IRT Scaling for the NELS Adaptive Groups (NRFS)
Adaptive Test Variable N Mean
Standard Deviation Minimum Maximum
Low RAND NRFS-4 2,055 5.299 3.853 –1.852 18.755
Medium RAND NRFS-4 6,929 13.429 5.435 –1.761 24.466
High RAND NRFS-4 3,907 21.299 2.709 6.677 24.756

92 Examining Gaps in Mathematics Achievement Among Racial-Ethnic Groups
For example, the ETS MATH variable represents the ETS NRFS scores for NLS-72, HSB-80, and HSB-82 standardized to the N(50,10) distribution and the NELS math variable (provided on NCES data under variable name F22XSTD) separately standardized to a N(50,10).
The last column, variable MIXED, requires more explanation. To further decompose the effect of adding the fourth cohort to the pooled sample, we apply the θ estimates from the four-cohort pooled sample to the item parameters from the three-cohort pooling; the resulting NRFS from this approach is what we refer to as “Mixed.” This allows us to parti-tion the effect of adding an additional cohort into (1) changes in the item parameters and (2) changes in the underlying proficiency distributions.
For each item, an Item Characteristic Curve (ICC) can be drawn that maps each proficiency score (θ) into an expected probability of answering that item correctly. The NRTS for a student of proficiency θ is the sum of the probabilities evaluated at θ over all test items. Since the theoretical ICC is monotonically increasing with regard to θ, stu-dents with greater mathematics proficiency will have larger NRTS (and NRFS) values. For the total mathematics test (the sum of the 25 ICCs), the difference between the three-cohort and four-cohort estimates can be decomposed as follows:
Total Difference = (RAND NRFS-3) − (RAND NRFS-4)
= [(RAND NRFS-3) − (MIXED)] − [(RAND
NRFS-4) − (MIXED)]
= D1 − D2
Table A.4 Source Used to Create Different Mathematics Variables
Cohort ETS MATH RAND NRFS-3 RAND NRFS-4 MIXED
1972 NLS IRT Scaling IRT Scaling IRT Scaling IRT Scaling
1980 HSB 1985 ETS Calculations
1999 RAND Calculations
1999 RAND Calculations
1999 RAND Calculations
1982 HSB Three-Cohort Pool
Three-Cohort Pool
Four-Cohort Pool
Four-Cohort Pool θ’sThree-Cohort Item
Parameters
1992 NELS NCES NCES

Item Response Theory Scaling of Pooled Senior Cohorts in NLS, HSB, and NELS 93
where
• D1 is the difference that results by changing θ while holding the item parameters fixed at the three-cohort levels, and
• D2 is the additional difference due to change in item parameters while holding θ fixed at the four-cohort levels.
A summary of these components is found in Table A.5, which indicates that most of the difference in the three-cohort and four-cohort NRFS values is the result of the new vector of θs that results from the addition of the fourth cohort. Because our analysis here focuses on the racial-ethnic groups that have historically fallen in the tails of the distribution—where the differences in RAND NRFS-3 and RAND NRFS-4 are most pronounced—the summary statistics by racial- ethnic group and cohort should also be evaluated. Thus, Table A.5 shows these results.
Comparisons of the three-cohort to the four-cohort test curves in Figure A.1 reveal that for a given θ value greater than 30 (from the standardized N(50,10) distribution), the resulting NRFS will be higher Figure A.1Test Characteristic Curve, All 25 Mathematics Items
RAND MG255-A.1
20
Nu
mb
er r
igh
t fo
r fo
rmu
la s
core
15
10
5
0
Theta
80604020
25
3 cohort4 cohort

94 Examining Gaps in Mathematics Achievement Among Racial-Ethnic Groups
Table A.5Decomposition of Changes in NRFS from Three-Cohort to Four-Cohort Pooling
Race Variable N MeanStandard Deviation Minimum Maximum
1972 Cohort Latino D1 710 0.754 0.498 -1.889 1.431
D2 710 0.022 0.463 -0.414 1.434
Black D1 1,931 0.622 0.564 -2.211 2.705
D2 1,931 0.087 0.497 -0.414 1.434
Asian D1 182 0.780 0.284 -0.493 1.485
D2 182 0.050 0.327 -0.414 1.434
Other D1 648 0.732 0.480 -1.897 1.492
D2 648 0.037 0.453 -0.414 1.434
White D1 12,182 0.814 0.331 -2.445 2.549
D2 12,182 -0.024 0.326 -0.414 1.434
1980 Cohort Latino D1 2,708 0.766 0.480 -2.253 2.450
D2 2,708 0.081 0.487 -0.414 1.475
Black D1 3,157 0.756 0.492 -3.480 2.312
D2 3,157 0.092 0.501 -0.414 1.475
Asian D1 317 0.745 0.475 -1.850 1.730
D2 317 0.073 0.355 -0.414 1.475
Other D1 507 0.820 0.414 -1.598 1.499
D2 507 -0.006 0.422 -0.414 1.475
White D1 17,760 0.829 0.416 -3.754 2.552
D2 17,760 -0.037 0.336 -0.414 1.475
1982 Cohort Latino D1 4,607 0.691 0.702 -5.555 3.617
D2 4,607 0.142 0.513 -0.414 1.583
Black D1 3,407 0.700 0.747 -4.750 2.873
D2 3,407 0.145 0.516 -0.414 1.583
Asian D1 393 0.660 0.447 -1.913 2.123
D2 393 0.051 0.368 -0.414 1.392
Other D1 337 0.586 0.888 -3.376 2.005
D2 337 0.040 0.459 -0.414 1.497
White D1 16,946 0.727 0.507 -4.951 3.617
D2 16,946 -0.011 0.369 -0.414 1.583
when the item parameters from the four-cohort sample are used. For given θ values less than 30, there is some very small difference that assigns a lower NRFS to the four-cohort sample. However, the impact of new θ values dominates any changes in the NRFS that result from this slight difference in the Test Characteristic Curve.

Item Response Theory Scaling of Pooled Senior Cohorts in NLS, HSB, and NELS 95
Researchers need to make decisions about whether to analyze group differences using equated scores from our two approaches, for example, the RAND NRFS-3 or RAND NRFS-4 scores. The RAND NRFS-4 vector of scores directly addresses the conflict that motivated this analysis; that is, the RAND NRFS-3 scores were generated by two separate IRT scalings, and we wanted to include the common items from NELS-92 to equate with NLS-72, HSB-80, and HSB-82.
Rescaled to the N(50,10) scale, the values by cohort are shown in Table A.6. DELTA-3 is the difference between RAND NRFS-3 and ETS NRFS for mathematics, and DELTA-4 is the difference between RAND NRFS-3 and RAND NRFS-4. Note how the DELTA-4 values
Table A.6 Weighted Summary of Test Scores by Cohort
Variable N MeanStandard Deviation Minimum Maximum
1972 Cohort ETS NRFS 15705 51.677 9.864 30.486 68.012RAND NRFS-3 15709 51.732 9.896 31.757 67.623
RAND NRFS-4 15709 50.947 9.847 30.256 66.680
Delta-3 15705 -0.053 0.713 -6.454 7.231
Delta-4 15709 -0.785 0.232 -4.073 1.995
1980 Cohort ETS NRFS 24758 50.260 9.737 30.486 68.012
RAND NRFS-3 24771 50.281 9.760 31.685 67.828
RAND NRFS-4 24771 49.478 9.813 30.101 66.669
Delta-3 24758 -0.026 0.825 -7.727 14.761
Delta-4 24771 -0.803 0.313 -3.776 3.313
1982 Cohort ETS NRFS 25679 48.435 10.080 30.486 68.012
RAND NRFS-3 25690 48.372 10.019 31.386 67.787
RAND NRFS-4 25690 47.627 10.159 29.709 66.830
Delta-3 25679 0.064 1.040 -8.099 35.156
Delta-4 25690 -0.746 0.528 -3.861 5.491
1992 Cohort ETS NRFS 12891 50.000 10.000 27.443 70.778
RAND NRFS-3 12891 50.000 10.000 27.443 70.778
RAND NRFS-4 12891 52.936 9.226 31.507 66.878
Delta-3 12891 0.000 0.000 0.000 0.000
Delta-4 12891 2.936 1.681 -7.014 9.305

96 Examining Gaps in Mathematics Achievement Among Racial-Ethnic Groups
for each of the first three cohorts are about 0.75. If most of this differ-ence is merely a location shift, there will be little impact on the stan-dardized differences across cohorts. Our focus is on the racial-ethnic groups that have historically fallen in the tails of the distribution, so we evaluate the summary statistics by race-ethnicity and cohort.
The summary of test scores and differences by cohort and race-ethnicity is found in Tables A.7–A.10. Note that the DELTA-4 value of approximately 0.75 in the first three cohorts is almost uniformly pres-ent across racial-ethnic groups and cohorts. This implies that the use of RAND NRFS-4 instead of RAND NRFS-3 will have little impact on standardized differences between race-ethnicity groups within cohorts. However, in the NELS cohort, the overall DELTA-4 value is −2.9, but the measure in the black and Latino subgroups is much larger (both less than –3.3) while the white groups DELTA-4 value is −2.8. This nonuniform allocation of the DELTA-4 across race-ethnicity groups implies that standardized differences between groups may differ by a nonnegligible amount depending on which test measure is used.
It is interesting to see how much the rescaling relates to differ-ences in proficiency between racial-ethnic groups over time. Table A.11 lists the weighted group differences (standard deviation units) between groups using each scoring variable. The conclusion is that the three-cohort and four-cohort pooling and IRT estimation operations have very little effect on the mathematics achievement gaps between racial-ethnic groups within cohorts.
Relying on various data sets for evaluating group achievement differences is useful for benchmarking purposes (Philips, Crouse, and Ralph, 1998; Green, Dugoni, and Ingels, 1995; Grissmer et al., 1994). Toward this end, we compare the equated scores to data avail-able from NAEP. Even though there are several components to NAEP, we focus here on the NAEP trend assessment (see Campbell, Hombo, and Mazzeo, 2000). Since its inception more than 25 years ago, NAEP has been a primary source of information on the trends in the aca-demic achievement of students in the United States. NAEP is the only assessment administered at regular intervals to nationally representa-tive samples of students (ages 9, 13, and 17) in a variety of subject areas. For our purposes here, we examine the NAEP trend data for

Item Response Theory Scaling of Pooled Senior Cohorts in NLS, HSB, and NELS 97
Table A.7National Longitudinal Study of the High School Class of 1972
Racial- Ethnic Group Variable N Mean
Standard Deviation Minimum Maximum
Latino ETS NRFS 710 44.840 8.850 30.486 68.012RAND NRFS-3 710 44.890 8.772 31.757 67.623
RAND NRFS-4 710 44.114 8.749 30.256 66.680
Delta-3 710 -0.050 0.939 -6.052 4.200
Delta-4 710 -0.776 0.299 -2.623 1.049
Other ETS NRFS 648 46.238 9.929 30.486 68.012
RAND NRFS-3 648 46.365 9.852 31.757 67.623
RAND NRFS-4 648 45.596 9.820 30.256 66.680
Delta-3 648 -0.126 0.868 -5.731 4.577
Delta-4 648 -0.768 0.313 -2.509 1.379
Asian ETS NRFS 182 55.723 9.146 30.486 68.012
RAND NRFS-3 182 55.766 9.181 32.022 67.623
RAND NRFS-4 182 54.936 9.172 30.256 66.680
Delta-3 182 -0.043 0.618 -1.536 5.073
Delta-4 182 -0.830 0.187 -1.767 0.169
Black ETS NRFS 1931 42.994 8.279 30.486 68.012
RAND NRFS-3 1931 42.963 8.248 31.757 67.623
RAND NRFS-4 1931 42.214 8.239 30.256 66.680
Delta-3 1931 0.031 1.019 -5.526 6.316
Delta-4 1931 -0.749 0.395 -4.073 1.540
White ETS NRFS 12179 53.088 9.368 30.486 68.012
RAND NRFS-3 12182 53.147 9.408 31.757 67.623
RAND NRFS-4 12182 52.357 9.356 30.256 66.680
Delta-3 12179 -0.059 0.651 -6.454 7.231
Delta-4 12182 -0.790 0.198 -3.786 1.741
Total ETS NRFS 15705 51.677 9.864 30.486 68.012
RAND NRFS-3 15709 51.732 9.896 31.757 67.623
RAND NRFS-4 15709 50.947 9.847 30.256 66.680
Delta-3 15705 -0.053 0.713 -6.454 7.231
Delta-4 15709 -0.785 0.232 -4.073 1.995

98 Examining Gaps in Mathematics Achievement Among Racial-Ethnic Groups
Table A.8High School and Beyond 1980
Racial- Ethnic Group Variable N Mean
Standard Deviation Minimum Maximum
Latino ETS NRFS 2705 44.561 9.240 30.486 68.012
RAND NRFS-3 2708 44.667 9.128 31.685 67.828
RAND NRFS-4 2708 43.821 9.222 30.101 66.669
Delta-3 2705 -0.089 1.117 -6.424 14.761
Delta-4 2708 -0.846 0.348 -3.776 1.666
Other ETS NRFS 506 46.769 9.121 30.486 67.768
RAND NRFS-3 507 46.813 9.088 31.685 67.709
RAND NRFS-4 507 45.999 9.168 30.101 66.669
Delta-3 506 -0.103 0.955 -4.505 5.261
Delta-4 507 -0.814 0.306 -2.352 1.363
Asian ETS NRFS 317 55.158 9.699 30.800 68.012
RAND NRFS-3 317 55.162 9.730 31.685 67.828
RAND NRFS-4 317 54.344 9.707 30.101 66.669
Delta-3 317 -0.004 0.649 -3.801 4.899
Delta-4 317 -0.819 0.362 -2.068 0.982
Black ETS NRFS 3153 43.341 8.469 30.486 68.012
RAND NRFS-3 3157 43.294 8.376 31.685 67.828
RAND NRFS-4 3157 42.446 8.482 30.101 66.669
Delta-3 3153 0.050 1.117 -7.727 7.033
Delta-4 3157 -0.848 0.356 -3.248 3.151
White ETS NRFS 17756 51.796 9.280 30.486 68.012
RAND NRFS-3 17760 51.826 9.324 31.685 67.828
RAND NRFS-4 17760 51.034 9.362 30.101 66.669
Delta-3 17756 -0.033 0.734 -7.120 10.406
Delta-4 17760 -0.792 0.299 -3.731 3.313
Total ETS NRFS 24758 50.260 9.737 30.486 68.012
RAND NRFS-3 24771 50.281 9.760 31.685 67.828
RAND NRFS-4 24771 49.478 9.813 30.101 66.669
Delta-3 24758 -0.026 0.825 -7.727 14.761
Delta-4 24771 -0.803 0.313 -3.776 3.313

Item Response Theory Scaling of Pooled Senior Cohorts in NLS, HSB, and NELS 99
Table A.9High School and Beyond 1982
Racial- Ethnic Group Variable N Mean
Standard Deviation Minimum Maximum
Latino ETS NRFS 4604 42.791 8.648 30.486 68.012
RAND NRFS-3 4607 42.740 8.530 31.386 67.787
RAND NRFS-4 4607 41.907 8.687 29.709 66.830
Delta-3 4604 0.062 1.199 -6.927 12.564
Delta-4 4607 -0.834 0.685 -3.538 5.491
Other ETS NRFS 337 43.469 8.521 30.486 67.193
RAND NRFS-3 337 43.580 8.369 31.784 67.465
RAND NRFS-4 337 42.953 8.363 30.020 66.669
Delta-3 337 -0.111 1.079 -5.146 4.921
Delta-4 337 -0.627 0.839 -3.153 3.009
Asian ETS NRFS 393 53.833 10.271 30.486 68.012
RAND NRFS-3 393 53.699 10.213 31.913 67.787
RAND NRFS-4 393 52.989 10.346 30.414 66.830
Delta-3 393 0.134 1.059 -2.249 19.203
Delta-4 393 -0.711 0.368 -2.914 1.346
Black ETS NRFS 3406 42.062 7.954 30.486 68.012
RAND NRFS-3 3407 41.932 7.825 31.386 67.787
RAND NRFS-4 3407 41.088 7.989 29.709 66.830
Delta-3 3406 0.134 1.336 -8.099 25.945
Delta-4 3407 -0.845 0.743 -3.754 4.591
White ETS NRFS 16939 50.495 9.778 30.486 68.012
RAND NRFS-3 16946 50.440 9.726 31.386 67.787
RAND NRFS-4 16946 49.723 9.851 29.709 66.830
Delta-3 16939 0.055 0.948 -7.544 35.156
Delta-4 16946 -0.717 0.435 -3.861 4.760
Total ETS NRFS 25679 48.435 10.080 30.486 68.012
RAND NRFS-3 25690 48.372 10.019 31.386 67.787
RAND NRFS-4 25690 47.627 10.159 29.709 66.830
Delta-3 25679 0.064 1.040 -8.099 35.156
Delta-4 25690 -0.746 0.528 -3.861 5.491

100 Examining Gaps in Mathematics Achievement Among Racial-Ethnic Groups
Table A.10National Longitudinal Study, Senior Class 1992
Racial- Ethnic Group Variable N Mean
Standard Deviation Minimum Maximum
Latino ETS NRFS 1488 45.776 9.299 27.680 70.056
RAND NRFS-3 1488 45.776 9.299 27.680 70.056
RAND NRFS-4 1488 49.106 8.853 31.507 66.834
Delta-3 1488 0.000 0.000 0.000 0.000
Delta-4 1488 3.329 1.349 -3.222 7.475
Other ETS NRFS 125 43.637 9.033 28.506 65.401
RAND NRFS-3 125 43.637 9.033 28.506 65.401
RAND NRFS-4 125 47.271 8.796 31.507 65.254
Delta-3 125 0.000 0.000 0.000 0.000
Delta-4 125 3.634 1.199 -1.260 6.438
Asian ETS NRFS 910 53.015 10.304 27.949 70.654
RAND NRFS-3 910 53.015 10.304 27.949 70.654
RAND NRFS-4 910 55.482 9.114 31.628 66.878
Delta-3 910 0.000 0.000 0.000 0.000
Delta-4 910 2.467 2.078 -3.776 7.443
Black ETS NRFS 1183 43.276 8.822 28.093 68.126
RAND NRFS-3 1183 43.276 8.822 28.093 68.126
RAND NRFS-4 1183 46.784 8.522 31.507 66.493
Delta-3 1183 0.000 0.000 0.000 0.000
Delta-4 1183 3.508 1.270 -2.545 7.944
White ETS NRFS 9167 51.562 9.583 27.443 70.778
RAND NRFS-3 9167 51.562 9.583 27.443 70.778
RAND NRFS-4 9167 54.373 8.780 31.507 66.878
Delta-3 9167 0.000 0.000 0.000 0.000
Delta-4 9167 2.811 1.726 -7.014 9.305
Total ETS NRFS 12891 50.000 10.000 27.443 70.778
RAND NRFS-3 12891 50.000 10.000 27.443 70.778
RAND NRFS-4 12891 52.936 9.226 31.507 66.878
Delta-3 12891 0.000 0.000 0.000 0.000
Delta-4 12891 2.936 1.681 -7.014 9.305
17-year-olds in mathematics (see Campbell, Hombo, and Mazzeo, 2000). The blocks of items for mathematics (and reading) have been the same since the early 1970s.
Our specific interest is how the achievement differences in math-ematics between blacks and whites and between Latinos and whites compare to the IRT-estimated differences discussed above. We first

Item Response Theory Scaling of Pooled Senior Cohorts in NLS, HSB, and NELS 101
Table A.11Weighted Standard Deviation Differences Between Racial-Ethnic Groups
Equating Option I RAND NRFS-3 Equating Option II RAND NRFS-4
Cohort Black-White Latino-White Black-White Latino-White
1972 NLS 1.09 0.88 1.09 0.88
1980 HSB 0.91 0.78 0.91 0.78
1982 HSB 0.90 0.81 0.90 0.80
1992 NELS 0.87 0.61 0.87 0.60
compare our results above to the achievement differences between minorities and nonminorities in NAEP. Second, the NELS-92 data contains a variable that can be equated with NAEP-92 data to conduct further sensitivity analyses of our IRT minority-nonminority test score estimates.
The IRT test score differences closely compare to those in NAEP, especially when considering the black-white differences in mathemat-ics. Table A.12 reveals that 30 years ago, the average difference in math-ematics achievement between blacks and whites was 1.14 of a standard deviation (see also Figures 4.1 and 4.2). This black-white gap contin-ued to narrow through 1990, when the average difference was 0.68 of a standard deviation. Note that the shaded rows, which correspond to the years for which we have IRT data, are very close to the achievement differences reported in Table A.11.
Table A.12Mathmatics Achievements Differences Between Racial-Ethnic Groups in the National Assessment of Educational Progress Trend Assessment for 17-Year-Olds (in Standard Deviation Units)
Black-White Difference Latino-White Difference
NAEP 1973 1.14 0.94
NAEP 1978 1.08 0.86
NAEP 1982 0.98 0.84
NAEP 1986 0.93 0.77
NAEP 1990 0.68 0.84
NAEP 1992 0.87 0.66
NAEP 1994 0.89 0.73
NAEP 1996 0.89 0.71

102 Examining Gaps in Mathematics Achievement Among Racial-Ethnic Groups
Similarly, the Latino-white differences in mathematics decreased between the early 1970s and early 1990s. In 1973 the average differ-ence in mathematics achievement between Latinos and whites was 0.94 of a standard deviation. This achievement gap narrowed until 1992, when the Latino-white difference was 0.66 of a standard deviation. The Latino-white differences in NAEP differ somewhat when compared to the IRT differences in the senior cohorts (i.e., compare shaded rows of Table A.12 to Table A.11). As discussed in more detail later, although there may be several explanations for the observed inconsistencies across data for the Latino-white differences, the most likely factor is the different sampling techniques of the Latino population groups in NAEP and the other senior cohort data sets.
Sensitivity Analyses: Comparing Equated Scores in NELS to NAEP
The NELS-92 data contains a variable (F22XNAEP) that is an equi-percentile score that equates the NELS-92 with the NAEP-92 math-ematics scores. Equipercentile equating adjusts the entire test score distribution of one test (e.g., the NELS-92 mathematics test) to the entire score distribution of the other test (e.g., the NAEP-92 math-ematics text) for a given population. For example, the NAEP-equated score for the person scoring at the ninetieth percentile of the weighted distribution of NELS scores would be the score that represented the ninetieth percentile of the weighted NAEP score. The simple cor-relation between these two scores is very high (0.998). This nonlin-ear equating procedure is considered valid, since both surveys were administered to a nationally representative sample of high school seniors in the spring of 1992. However, one should consider that some differences will appear, since NAEP tested high school seniors or 17-year-olds, while NELS-92 tested seniors, dropouts, early grad-uates, and out-of-sequence students (Ingels et al., 1994, p. H-36). To reduce the definitional differences, only the twelfth graders in the NAEP survey were used in this analysis.
Benchmark
The 1992 NAEP and 1992 NELS were both administered to high school seniors in the spring of 1992, and it is expected that the racial-

Item Response Theory Scaling of Pooled Senior Cohorts in NLS, HSB, and NELS 103
ethnic group differences in mathematics performance should be approximately the same. Table A.13 contains the weighted standard-ized differences in standard deviation units for mathematics achieve-ment of three different variables from two data sources.
For the Latino-white and black-white differences, the results of this table indicate a large discrepancy between the standardized values of the NAEP-equated measure in NELS (F22XNAEP) and the NAEP first plausible value (MRPCM1). This result conflicts with a minor reference to a similar benchmarking procedure used by Rock and Pol-lack (1995):
Empirical checks on the validity of the equating procedure included comparing subgroup differences on the equated score with those found on the original NAEP scale. Virtually all checks were within one standard error. (p. 65)
By contrast, we found all the differences between NAEP and NELS exceeded one standard error. Although “subgroup differences” are not defined in the technical report, the measured gaps are still suspiciously large and demand some attention. Reasons for this discrepancy might include relative weights among racial-ethnic groups and plausible value sampling, which we explore in the sections that follow.
Relative Weights Among Racial-Ethnic Groups
The weighted population figures for the NELS-92 and NAEP-92 surveys are both approximately 2.5 million high school seniors (see
Table A.13Standardized Differences in Mathematics Proficiency (in Standard Deviation Units)
Source Variable Black-White Latino-White
1992 NAEP First Plausible Value (MRPCM1) 0.94 0.67
1992 NELS NAEP Equated (F22XNAEP) 0.87 0.60
1992 NELS Standardized Theta (F22XMTH) 0.86 0.59

104 Examining Gaps in Mathematics Achievement Among Racial-Ethnic Groups
Table A.14 below), but the distribution among racial-ethnic groups differs enough that the standardized group differences in proficiency may be affected. This unequal distribution of racial-ethnic groups is more pronounced when comparing the NELS test-taking population to the NAEP population. Table A.14 reveals discrepancies in NELS and NAEP in the numbers and proportions of blacks and Latinos with test scores. To correct for these disparities, it is possible to reweight the NAEP data so that the weighted student count in each racial-ethnic group equals the corresponding figure for the test-taking population in the NELS survey.
The equipercentile equating can then be redone to reflect the reweighted distribution. A rescaling factor to be applied to the NAEP data is listed in the last column of Table A.14. This factor is computed as (NELS-92 Test Weights)/(NAEP-92 Weights) for each race-ethnic-ity group. For example, the factor for the white group is calculated as 1.0437 = 1,871,582/1,793,242. Rescaling each NAEP-92 white stu-dent’s weight by this factor will cause the total weight to equal that of the NELS-92 test-taking population within each race-ethnicity group.
The original differences in the estimated racial-ethnic composition of the population explain about half of the discrepancy in Latino-white and black-white scores as measures by NELS-92 and NAEP-92. After rescaling the NAEP-92 data to have the same frequencies within racial-ethnic groups as the NELS-92 test-taking population, equipercentile equating was again performed. With the new mapping from NELS to
Table A.14Distribution of Population of Twelfth-Grade High School Students by Race- Enthnicity
Race-Ethnicity NAEP 1992 NELS 1992 Factor
White 1,793,242 71.1% 1,871,582 72.7% 1.0437
Black 371,641 14.7% 296,229 11.5% 0.7971
Latino 238,472 9.5% 257,536 10.0% 1.0799
Other 118,816 4.7% 148,989 5.8% 1.2540
Total 2,522,171 100.0% 2,574,336 100.0% 1.2540

Item Response Theory Scaling of Pooled Senior Cohorts in NLS, HSB, and NELS 105
NAEP, the Latino-white standardized difference in standard deviation units becomes 0.63 (as opposed to 0.60), and the black-white differ-ence becomes 0.92 (as opposed to 0.87). Therefore, differential weights explain about half of the discrepancy in Latino-white and black-white scores as measures by NELS-92 and NAEP-92.
Plausible Value Sampling
NAEP-92 proficiency data reflects random draws from an empirical distribution and hence have some additional noise that is not present in the NELS-92 data. This may partially explain why the standardized differences are smaller for the NAEP-92 data, since it implies a larger standard deviation if all other factors are held constant. The NAEP first plausible value (MRPCM1) used for analysis is the first of five plausible values (MRPCM1-MRPCM5) drawn from the distribution.
Alternative Transformations
For comparability to the first option examined in the beginning of this paper (NLS-72, HSB-80, HSB-82), the only transformations available to the existing NELS-92 data are rescaling using the equipercentile method discussed above, and a linear transformation to a new nor-mal distribution with a target mean and variance. The equipercentile method can be performed to better equate the NELS and NAEP popu-lations but does little to alleviate the underlying problem: NELS-92 and the first option for equating scores in 1972, 1980, and 1982 scores are generated by a different IRT scaling. The benchmarking procedure showed that some differences exist in the NAEP-92 and NELS-92 measures of differences between racial-ethnic groups. Therefore, using the NAEP-equated (or reequated) scores does little to address the root of the problem and is irrelevant unless comparisons to NAEP become part of the analysis.
A linear transformation to a target mean and variance is a futile operation, since the standardized differences are invariant to shifts in location and scale. As long as the comparisons across time are expressed in standardized units, there is no need for a transformation. Therefore, it is recommended that the standardized NELS score data be used as the measure of the NELS cohort’s mathematics proficiency.

106 Examining Gaps in Mathematics Achievement Among Racial-Ethnic Groups
Implications for National Data on Student Achievement
The examination of group differences in achievement is critical for a vari-ety of reasons, particularly for understanding whether and why group inequalities have changed over time. Our options for equating scores in national data show that such equating is feasible across several senior cohorts between 1972 and 1992. Moreover, our equating options yield results that are consistent with trends in other nationally representative data on racial-ethnic test score differences over the past 20 years.6
The IRT estimates of minority-nonminority test scores in the senior cohorts also compare quite closely to differences in NAEP. Across all comparisons, the black-white test score gaps over the period exam-ined here are similar. However, we found some inconsistencies when estimating the Latino-white test score gaps, especially when compar-ing the IRT estimates to NAEP. We examined several explanations for these differences, the mostly likely being differences in sampling of the Latino population groups across the data sets.
There have been several proposals to improve national data collec-tion efforts, especially through NCES (Pellegrino, Jones, and Mitchell, 1998; Phillips, 1998; Raudenbush, 1998; Berends and Koretz, 1996; Grissmer et al., 1994). Our analyses here suggest some relatively inex-pensive options to improve such data collection. The achievement tests that are included in data sets such as NLS, HSB, and NELS are not extensive, especially compared to NAEP. It would be relatively inex-pensive to include more overlapping items in future data collections. This would allow for further examination of changes in the scores on particular items over time and for a greater number of items to pool for IRT equating purposes. Particularly as NCES considers future data collections of different high school cohorts, such inclusion of math-ematics and additional reading items on future tests for equating pur-poses would greatly benefit research on achievement trends over time.
6 The IRT scores calculated here will be made available by the U.S. Department of Education, NCES through this agency’s restricted-use data agreements.

Item Response Theory Scaling of Pooled Senior Cohorts in NLS, HSB, and NELS 107
A more ambitious option would be to include items from extant tests of previous senior cohorts, the NAEP assessments, and the Third International Mathematics and Science Study (TIMSS).7 Such items would allow for additional information to compare over time, both nationally and internationally.
Whether these options will be pursued is anyone’s guess. However, the sophistication of both theory and methods as well as the advances in computer technology and data collection efforts suggest that the future may be promising for those who hope to obtain better infor-mation on estimates of student learning and possible explanations for them. However, to actually document that the data are more reliable and valid is a laborious process, as reflected in the analyses reported here. Perhaps future NCES decisions about data collection may ease this burden.
7For a brief overview of TIMSS, see < http://www.nces.ed.gov/timss/>.


109
APPENDIX B
Mathematics Items Mapping Across Data Sources, 1972–1992
Table B.1. Mathematics Items Mapping Across Data Sources, 1972–1992
NELS-92
Item NLS-72 HSB-80 HSB-82Low Test
Medium Test
High Test
3 Cohort Common
ItemNELS
Common
Common to NELS & 3 Cohorts
MATH001 1
MATH002 2 2 2 3 3 X X X
MATH003 3 3 3 X
MATH004 4 4 4 5 5 X X X
MATH005 5 5 5 9 4 X X X
MATH006 6
MATH007 7
MATH008 8
MATH009 9
MATH010 10 10 10 11 X X
MATH011 11
MATH012 12 12 12 X
MATH013 13 13 13 X
MATH014 14
MATH015 15
MATH016 16 16 16 X
MATH017 17 17 17 X
MATH018 18
MATH018 19
MATH020 20 20 20 15 11 X X X
MATH021 21 21 21 13 3 X X X
MATH022 22
MATH023 23
MATH024 24 24 24 X
MATH025 25
Continued

110 Examining Gaps in Mathematics Achievement Among Racial-Ethnic Groups
Table B.1. (continued)
NELS-92
Item NLS-72 HSB-80 HSB-82Low Test
Medium Test
High Test
3 Cohort Common
ItemNELS
Common
Common to NELS & 3 Cohorts
MATH026 6 6
MATH027 11 11
MATH028 14 14
MATH029 15 15
MATH030 18 18
MATH031 22 22 16 10 1 X X X
MATH032 1
MATH033 7
MATH034 8
MATH035 9
MATH036 19
MATH037 23
MATH038 25
MATH039 26
MATH040 27
MATH041 28
MATH042 29
MATH043 30
MATH044 31
MATH045 32
MATH046 1 7 X X
MATH047 7 10 6 X X X
MATH048 8 6 2 X X X
MATH049 9
MATH050 19 12 9 X X X

Mathematics Items Mapping Across Data Sources, 1972–1992 111
Table B.1. (continued)
NELS-92
Item NLS-72 HSB-80 HSB-82Low Test
Medium Test
High Test
3 Cohort Common
ItemNELS
Common
Common to NELS & 3 Cohorts
MATH051 23 4 X X
MATH052 25
MATH053 26
MATH054 27
MATH055 28
MATH056 29
MATH057 30 14 7 X X X
MATH058 31
MATH059 32
MATH060 33
MATH061 34
MATH062 35
MATH063 36 12 2 X X X
MATH064 37
MATH065 38
MATH066 30 19 X
MATH067 26
MATH068 22
MATH069 17
MATH070 28
MATH071 24
MATH072 29
MATH073 23 17 X
MATH074 2
MATH075 8
Continued

112 Examining Gaps in Mathematics Achievement Among Racial-Ethnic Groups
Table B.1. (continued)
NELS-92
Item NLS-72 HSB-80 HSB-82Low Test
Medium Test
High Test
3 Cohort Common
ItemNELS
Common
Common to NELS
& 3 Cohorts
MATH076 13 8 X
MATH077 1 1 X
MATH078 34 24 X
MATH079 27 16 X
MATH080 31 21 8 X
MATH081 40 23 10 X
MATH082 33 18 6 X
MATH083 36 20 7 X
MATH084 38 36 22 X
MATH085 25 22 X
MATH086 18 14 X
MATH087 19
MATH088 20 15 X
MATH089 32
MATH090 4
MATH091 21 5 X
MATH092 35 15 X
MATH093 37 35 21 X
MATH094 39 26 14 X
MATH095 27 13 X
MATH096 34 26 X
MATH097 38 32 X
MATH098 25 12 X
MATH099 28 11 X
MATH100 30 18 X

Mathematics Items Mapping Across Data Sources, 1972–1992 113
Table B.1. (continued)
NELS-92
Item NLS-72 HSB-80 HSB-82Low Test
Medium Test
High Test
3 Cohort Common
ItemNELS
Common
Common to NELS & 3 Cohorts
MATH101 32 24 X
MATH102 31 17 X
MATH103 40 40 X
MATH104 39 37 X
MATH105 29 16 X
MATH106 33 25 X
MATH107 37 27 X
MATH108 29
MATH109 23
MATH110 19
MATH111 28
MATH112 9
MATH113 20
MATH114 30
MATH115 31
MATH116 33
MATH117 34
MATH118 35
MATH119 36
MATH120 38
MATH121 39


115
APPENDIX C
Item Response Theory Estimation Methods
The item parameter calibration used the method of Marginal Maxi-mum Likelihood (MML) with the following prior distributions placed on the item difficulty and pseudochance parameters: Pseudochance parameter uses θ = 1, θ = 19: (mean = 0.050). The discrimination parameter uses mean = 1.100, standard deviation (SD) = 0.600.
Proficiency Estimation
The full population of students answering at least one item was scored using maximum likelihood (ML) estimation after considering the item parameters calculated above as fixed. To facilitate comparisons in other analyses including the available IRT scores in NELS-92, the resulting vector of scores (θ) was rescaled to have a N(50,10) distribution. An acceptable linear transformation : θ θ* (Hambleton, 1989) would be θ* = xθ + y and would be performed through the item parameters ai , bi , and ci , where
i ci* = ci
ii bi* = xbi + y
iii ai* = (1/x)ai

116 Examining Gaps in Mathematics Achievement Among Racial-Ethnic Groups
This linear transformation would preserve the probabilities {Pi(θ*) = Pi(θ
*) Gi}.1 The latent mathematics distributions of proficiency used in the calibration (the entire set of θ scores rescaled to a N(50,10) dis-tribution with these priors are depicted below.
1 The proof for preserving the linear probabilities with this linear transformation is:Pi(θ*) = ci
*+ (1 ci*) [1 + eDai
*(θ* bi*)]
1
= ci + (1 ci) [1+ eD (1/x)ai ((x θ + y) (xbi + y))]1
= ci+ (1 ci) [1+ eDai (θ bi)]
1
= Pi(θ)
Figure C.1Latent Proficiency Distribution of Mathematics Scores for Each Senior Cohort NLS-72, HSB-80, and HSB-82 from Option I
RAND MG255-C.1
55504540
3 cohort theta
35302520 60 757065
1982 HSB
1980 HSB
1972 NLS

Item Response Theory Estimation Methods 117
Number Right True Scores
After these estimation procedures, the estimated probability Pi(θ) of answering each item, i, correctly can be calculated as if each student had answered the 25 questions on the NLS-72. Using the transformed item parameter estimates for the twenty-five math items and each indi-viduals estimated proficiency, θ*, the estimated NRTS for examinee j is the sum of the estimated probabilities
NRTSj = ∑25
Pi (θ) where Pi (θ) = ci*+ (1-ci*) [1+ e–Dai*(θ – bi)]–1
Number Right Formula Scores
The NRTS were then transformed to a formula score, NRFS, based on the following algorithm:
NRTSj = NRFSj (n NRFSj)/(k 1),
• where k = # of response alternatives (4 for mathematics) and • n is the number of items on the test (n = 25 for mathematics).
i=1


119
APPENDIX D
Survey Items Used to Operationalize Individual, Family, and School Measures in NLS-72, HSB-82, and NELS-92

120 Exam
inin
gG
aps
inM
athem
aticsA
chievem
ent
Am
on
gR
acial-Ethn
icG
rou
ps
Table D.1. Survey Items Used to Operationalize Individual, Family, and School Measures in NLS-72, HSB-82, and NELS-92
Variable NLS-72 HSB-82 NELS-92
Race-ethnicitya How do you describe yourself? (Circle one.) Students’ Race Composite (CRACE)• White or Caucasian• Black or Afro-American • Asian American• American Indian• Mexican-American or Chicano• Puerto Rican• Other Hispanic• Other
What is your race? Students’ Race Composite (RACE, BB089, BB090)• Hispanic• American Indian• Asian• Black• White • Other
What best describes you? (F2RACE1)• Asian, Pacific Islander• Hispanic• Black, not Hispanic• White, not Hispanic• American Indian, Alaskan Native
Genderb Student Sex Composite (CSEX)• Male• Female
Student Sex Composite (SEX)• Male• Female
Student Sex Composite (F2SEX)• Male • Female

Survey Item
s Used
to O
peratio
nalize In
divid
ual, Fam
ily, and
Scho
ol M
easures 121
Family Incomec What is the approximate income before taxes of your parents (or guardian)? Include taxable and non-taxable from all sources. (Circle one.) (BQ93)• Less than $3,000 a year (about $60 a
week or less)• Between $3,000 and $5,999 a year
(from $60 to $119 a week)• Between $6,000 and $7,499 a year
(from $120 to $149 a week)• Between $7,500 and $8,999 a year
(from $150 to $179 a week)• Between $9,000 and $10,499 a year
(from $180 to $209 a week)• Between $10,500 and $11,999 a year
(from $210 to $239 a week)• Between $12,000 and $13,499 a year
(from $240 to $269 a week)• Between $13,500 and $14,999 a year
(from $270 to $299 a week)• Between $15,000 and $18,000 a year
(from $300 to $359 a week)• Over $18,000 a year (about $360 a
week or more)
American families are divided into seven groups according to how much money they make in a year. Mark the oval for the group which comes closet to the amount of money your family makes in a given year. (Mark one.) (BB100)• $6,999 or less• $7,000 to $11,999• $12,000 to 15,999• $16,000 to $19,999• $20,000 to $24,999• $25,000 to $37,999• $38,000 or more
What was your total gross family income from all sources before taxes in 1991? (If you are not sure of the amount, please estimate.) (F2P74)• None• Less than $1,000• $1,000 to $2,999• $3,000 to $4,999• $5,000 to $7,499• $7,500 to $9,999• $10,000 to $14,999• $15,000 to $19,999• $20,000 to $24,999• $25,000 to $34,999• $35,999 to $49,999• $50,000 to $74,999• $75,000 to $99,999• $100,000 to $199,999• $200,000 or more
Continued

122 Exam
inin
gG
aps
inM
athem
aticsA
chievem
ent
Am
on
gR
acial-Ethn
icG
rou
ps
Table D.1. (continued)
Variable NLS-72 HSB-82 NELS-92
Father’s Educationd
What was the highest educational level each of the following persons completed? If you are not sure, please give your best guess. (Circle one number in each column.) (BQ90)Father or Male Guardian • Doesn’t apply• Did not complete high (secondary)
school• Finished high school or equivalent• Adult education program• Business or trade school• Some college• Finished college (four year)• Attended graduate or professional
school (for example, law or medical school), but did not attain a graduate or professional degree
• Obtained a graduate or professional degree (for example, M.A. , Ph.D. , or M.D.)
What was the highest level of education your father (stepfather or male guardian) completed? (BB039)• Do not live with father (stepfather or
male guardian)• High school graduation only• Vocational, trade, or business school
after high schoolo Less than two yearso Two years or more
• College programo Less than two years of collegeo Two or more years of college
(including two-year degree)o Finished college (four- or five-year
degree)o Master’s degree or equivalento Ph.D., M.D., or other advanced
professional degree• Don’t know
What is the highest level of education your father (stepfather or male guardian) has completed? (F2N8B)• Eighth grade or less• Beyond eighth grade, but not high
school graduation• GED• High school graduation• Vocational, trade, or business school
after high schoolo Less than two yearso Two years or more
• College programo Less than two years of collegeo Two or more years of college
(including two-year degree)o Finished college (four- or five-year
degree)• Graduate or professional school
o Master’s degree or equivalento Ph.D., M.D., or other advanced
professional degree• Don’t know

Survey Item
s Used
to O
peratio
nalize In
divid
ual, Fam
ily, and
Scho
ol M
easures 123
Mother’s Educatione
What was the highest educational level each of the following persons completed? If you are not sure, please give your best guess. (Circle one number in each column.) (BQ90)Mother or female guardian • Doesn’t apply• Did not complete high (secondary)
school• Finished high school or equivalent• Adult education program• Business or trade school• Some college• Finished college (four year)• Attended graduate or professional
school (for example, law or medical school), but did not attain a graduate or professional degree
• Obtained a graduate or professional degree (for example, M.A., Ph.D., or M.D.)
What was the highest level of education your mother (stepmother or female guardian) completed? (BB042)• Do not live with mother
(stepmother or female guardian)• High school graduation only• Vocational, trade, or business
school after high schoolo Less than two yearso Two years or more
• College programo Less than two years of collegeo Two or more years of college
(including two-year degree)o Finished college (four- or five-year
degree)o Master’s degree or equivalento Ph.D., M.D., or other advanced
professional degree• Don’t know
What is the highest level of education your mother (stepmother or female guardian) has completed? (F2N8A)• Eighth grade or less• Beyond eighth grade, but not high
school graduation• GED• High school graduation• Vocational, trade, or business school
after high schoolo Less than two yearso Two years or more
• College programo Less than two years of collegeo Two or more years of college
(including two-year degree)o Finished college (four- or five-year
degree)• Graduate or professional school
o Master’s degree or equivalento Ph.D., M.D., or other advanced
professional degree• Don’t know
Continued

124 Exam
inin
gG
aps
inM
athem
aticsA
chievem
ent
Am
on
gR
acial-Ethn
icG
rou
ps
Table D.1. (continued)
Variable NLS-72 HSB-82 NELS-92
Father’s Occupationf
In the column under YOU, circle the one number that goes with the best description of the kind of work you would like to do. Under FATHER, circle the one number that best describes the work done by your father (or male guardian). Under MOTHER, circle the one number that best describes the work done by your mother (or female guardian). The exact job may not be listed but circle the one that comes closest. If either of your parents is out of work, disabled, retired, or deceased, mark the kind of work that he or she used to do. (Circle one number in each column.) (BQ5)• CLERICAL such as bank teller,
bookkeeper, secretary, typist, mail carrier, ticket agent
• CRAFTSMAN such as baker, automobile mechanic, machinist, painter, plumber, telephone installer, carpenter
• FARMER, FARM MANAGER• HOMEMAKER OR HOUSEWIFE• LABORER such as construction
worker, car washer, sanitary worker, farm laborer
Please describe the job most recently held by your father (stepfather or male guardian), even if he is not working at present. (Write in.) Which of the categories below comes closest to describing that job? (Mark one.) (BB038)• Do not live with father (stepfather or
male guardian)• CLERICAL such as bank teller,
bookkeeper, secretary, typist, mail carrier, ticket agent
• CRAFTSMAN such as baker, automobile mechanic, machinist, painter, plumber, telephone installer, carpenter
• FARMER, FARM MANAGER• HOMEMAKER OR HOUSEWIFE• LABORER such as construction
worker, car washer, sanitary worker, farm laborer
• MANAGER, ADMINISTRATOR such as sales manager, office manager, school administrator, buyer, restaurant manager, government official
• MILITARY such as career officer, enlisted man or woman in the armed forces
Which of the categories below comes closest to describing your father (stepfather or male guardian)’s present or most recent job or occupation? (Circle one.) (F2N5)• OFFICE WORKER such as data entry
clerk, bank teller, bookkeeper, secretary, word processor, mail carrier, ticket agent
• TRADESPERSON such as baker, auto mechanic, machinist, housepainter, plumber, phone/cable installer, carpenter
• FARMER, FARM MANAGER• FULL-TIME HOMEMAKER • LABORER such as construction
worker, car washer, sanitary worker, farm laborer
• MANAGER such as sales manager, office manager, school administrator, retail buyer, restaurant manager, government administrator
• MILITARY such as officer or enlisted person in the Armed Forces
• OPERATOR of machines or tools, such as meat cutter, assembler, welder, taxicab/bus/truck driver

Survey Item
s Used
to O
peratio
nalize In
divid
ual, Fam
ily, and
Scho
ol M
easures 125
Father’s Occupation (cont.)
• MANAGER, ADMINISTRATOR such as sales manager, office manager, school administrator, buyer, restaurant manager, government official
• MILITARY such as career officer, enlisted man or woman in the armed forces
• OPERATIVE such as meat cutter; assembler; machine operator; welder; taxicab, bus, or truck driver; gas station attendant
• PROFESSIONAL such as accountant, artist, clergyman, dentist, physician, registered nurse, engineer, lawyer, librarian, teacher, writer, scientist, social worker, actor, actress
• PROPRIETOR OR OWNER such as owner of a small business, contractor, restaurant owner
• PROTECTIVE SERVICE, such as detective, policeman or guard, sheriff, fireman
• SALES such as salesman, sales clerk, advertising or insurance agent, real estate broker
• SERVICE such as barber, beautician, practical nurse, private household worker, janitor, waiter
• TECHNICAL such as draftsman, medical or dental technician, computer programmer
• OPERATIVE such as meat cutter; assembler; machine operator; welder; taxicab, bus, or truck driver
• PROFESSIONAL such as accountant, artist, registered nurse, engineer, librarian, writer, social worker, actor, actress, athlete, politician, but not including teacher
• PROFESSIONAL such as clergyman, dentist, physician, lawyer, scientist, college teacher
• PROPRIETOR OR OWNER such as owner of a small business, contractor, restaurant owner
• PROTECTIVE SERVICE, such as detective, police officer or guard, sheriff, fire fighter
• SALES such as sales person, advertising or insurance agent, real estate broker
• SERVICE such as barber, beautician, practical nurse, private household worker, janitor, waiter
• TECHNICAL such as draftsman, medical or dental technician, computer programmer
• Never worked• Don’t know
• PROFESSIONAL such as accountant, registered nurse, engineer, banker, librarian, writer, social worker, actor, athlete, politician, but not including teacher
• PROFESSIONAL such as minister, dentist, doctor, lawyer, scientist, college teacher
• OWNER such as owner of a small business or restaurant, contractor
• PROTECTIVE SERVICE, such as police officer, fire fighter, detective, sheriff, security guard
• SALES such as sales representative, advertising or insurance agent, real estate broker
• SCHOOL TEACHER such as elementary, junior high, or high school, but not college
• SERVICE WORKER such as hair stylist, practical nurse, child care worker, waiter, domestic, janitor
• TECHNICAL such as computer programmer, medical or dental technician, draftsperson
• Never worked• Don’t know
Continued

126 Exam
inin
gG
aps
inM
athem
aticsA
chievem
ent
Am
on
gR
acial-Ethn
icG
rou
ps
Table D.1. (continued)
Variable NLS-72 HSB-82 NELS-92
Mother’s Occupationg
In the column under YOU, circle the one number that goes with the best description of the kind of work you would like to do. Under FATHER, circle the one number that best describes the work done by your father (or male guardian). Under MOTHER, circle the one number that best describes the work done by your mother (or female guardian). The exact job may not be listed but circle the one that comes closest. If either of your parents is out of work, disabled, retired, or deceased, mark the kind of work that he or she used to do. (Circle one number in each column.) (BQ5)• CLERICAL such as bank teller,
bookkeeper, secretary, typist, mail carrier, ticket agent
• CRAFTSMAN such as baker, automobile mechanic, machinist, painter, plumber, telephone installer, carpenter
• FARMER, FARM MANAGER• HOMEMAKER OR HOUSEWIFE• LABORER such as construction
worker, car washer, sanitary worker, farm laborer
Please describe the job most recently held by your mother (stepmother or female guardian), even if he is not working at present. (Write in.) Which of the categories below comes closest to describing that job? (Mark one.) (BB041)• Do not live with mother (stepmother
or female guardian) • CLERICAL such as bank teller,
bookkeeper, secretary, typist, mail carrier, ticket agent
• CRAFTSMAN such as baker, automobile mechanic, machinist, painter, plumber, telephone installer, carpenter
• FARMER, FARM MANAGER• HOMEMAKER OR HOUSEWIFE• LABORER such as construction
worker, car washer, sanitary worker, farm laborer
• MANAGER, ADMINISTRATOR such as sales manager, office manager, school administrator, buyer, restaurant manager, government official
• MILITARY such as career officer, enlisted man or woman in the armed forces
Which of the categories below comes closest to describing your mother (stepmother or female guardian)’s present or most recent job or occupation? (Circle one.) (F2N5)• OFFICE WORKER such as data entry
clerk, bank teller, bookkeeper, secretary, word processor, mail carrier, ticket agent
• TRADESPERSON such as baker, auto mechanic, machinist, housepainter, plumber, phone/cable installer, carpenter
• FARMER, FARM MANAGER• FULL-TIME HOMEMAKER • LABORER such as construction
worker, car washer, sanitary worker, farm laborer
• MANAGER such as sales manager, office manager, school administrator, retail buyer, restaurant manager, government administrator
• MILITARY such as officer or enlisted person in the Armed Forces
• OPERATOR of machines or tools, such as meat cutter, assembler, welder, taxicab/bus/truck driver

Survey Item
s Used
to O
peratio
nalize In
divid
ual, Fam
ily, and
Scho
ol M
easures 127
Mother’s Occupation (cont.)
• MANAGER, ADMINISTRATOR such as sales manager, office manager, school administrator, buyer, restaurant manager, government official
• MILITARY such as career officer, enlisted man or woman in the armed forces
• OPERATIVE such as meat cutter; assembler; machine operator; welder; taxicab, bus, or truck driver; gas station attendant
• PROFESSIONAL such as accountant, artist, clergyman, dentist, physician, registered nurse, engineer, lawyer, librarian, teacher, writer, scientist, social worker, actor, actress
• PROPRIETOR OR OWNER such as owner of a small business, contractor, restaurant owner
• PROTECTIVE SERVICE, such as detective, policeman or guard, sheriff, fireman
• SALES such as salesman, sales clerk, advertising or insurance agent, real estate broker
• SERVICE such as barber, beautician, practical nurse, private household worker, janitor, waiter
• TECHNICAL such as draftsman, medical or dental technician, computer programmer
• OPERATIVE such as meat cutter; assembler; machine operator; welder; taxicab, bus, or truck driver
• PROFESSIONAL such as accountant, artist, registered nurse, engineer, librarian, writer, social worker, actor, actress, athlete, politician, but not including teacher
• PROFESSIONAL such as clergyman, dentist, physician, lawyer, scientist, college teacher
• PROPRIETOR OR OWNER such as owner of a small business, contractor, restaurant owner
• PROTECTIVE SERVICE, such as detective, police officer or guard, sheriff, fire fighter
• SALES such as sales person, advertising or insurance agent, real estate broker
• SERVICE such as barber, beautician, practical nurse, private household worker, janitor, waiter
• TECHNICAL such as draftsman, medical or dental technician, computer programmer
• Never worked• Don’t know
• PROFESSIONAL such as accountant, registered nurse, engineer, banker, librarian, writer, social worker, actor, athlete, politician, but not including teacher
• PROFESSIONAL such as minister, dentist, doctor, lawyer, scientist, college teacher
• OWNER such as owner of a small business or restaurant, contractor
• PROTECTIVE SERVICE, such as police officer, fire fighter, detective, sheriff, security guard
• SALES such as sales representative, advertising or insurance agent, real estate broker
• SCHOOL TEACHER such as elementary, junior high, or high school, but not college
• SERVICE WORKER such as hair stylist, practical nurse, child care worker, waiter, domestic, janitor
• TECHNICAL such as computer programmer, medical or dental technician, draftsperson
• Never worked• Don’t know
Continued

128 Exam
inin
gG
aps
inM
athem
aticsA
chievem
ent
Am
on
gR
acial-Ethn
icG
rou
ps
Table D.1. (continued)
Variable NLS-72 HSB-82 NELS-92
High School Programh
Which of the following best describes your present high school program? (HSPGH)• General• Academic or college preparatory• Vocational or technical:
o Agricultural occupationso Business or office occupationso Distributive educationo Health occupationso Home economics occupationso Trade or industrial occupations
Which of the following best describes your present high school program? (BB002)• General• Academic or college preparatory• Vocational or technical:
o Agricultural occupationso Business or office occupationso Distributive educationo Health occupationso Home economics occupationso Technical occupationso Trade or industrial occupations
Which of the following best describes your present high school program? (F2S12A)• General high school program• College prep, academic, or
specialized academic (such as Science or Math)
• Vocational, technical or business and careero Industrial arts/Technology
educationo Agricultural occupationso Business or office occupationso Marketing or Distributive
educationo Health occupationso Home economics occupationso Consumer and homemaking
educationo Technical occupationso Trade or industrial occupations
• Other specialized high school program
• Special education• I don’t know

Survey Item
s Used
to O
peratio
nalize In
divid
ual, Fam
ily, and
Scho
ol M
easures 129
School Percent Minorityi
Percentage black (SCHQ18B) Percentage Hispanic (SCHQ18C, D, E)
Percentage black (SB094)Percentage Hispanic (SB093)
Percentage black (F2C22C)Percentage Hispanic (F2C22B)
School Sectorj School Type Composite (SCHTYPE)• Public• Private • Catholic
School Type Composite (SCHSAMP)• Regular public schools• Alternative schools• Cuban Hispanic public schools• Other Hispanic public schools• Regular Catholic schools• Black Catholic schools• Cuban Hispanic Catholic schools• Private schools (Elite)• Private schools (Other)
School Type Composite (G12CTRL)• Public school• Catholic school• Private school, other religious
affiliation• Private school, no religious affiliation• Private school, type not ascertained
Urban Localek Community Type (BQ95)• Urban• Suburban• Rural
Community Type (SCHURB)• Urban• Suburban• Rural
Community type (G12URBN3)• Urban• Suburban• Rural
aCreated nonoverlapping dummy variables for black, Latino, and other (reference group is whites).bCreated dummy variable for female (reference group is males).cCreated income quintiles and dummy variable for highest-poverty group; income adjusted in 1992 dollars (see text).dCreated father education measure equal to 10 if father did not finish high school, 12 if father was a high school graduate, 14 if father
attended some college, 16 if father received four-year college degree, and 18 if father received a graduate or professional degree; also created a dummy variable if missing.
fCreated mother education measure equal to 10 if mother did not finish high school, 12 if mother was a high school graduate, 14 if mother attended some college, 16 if mother received four-year college degree, and 18 if mother received a graduate or professional degree; also created a dummy variable if missing.
gCreated parent socioeconomic index measure (SEI) based on the higher of father’s or mother’s occupational status categories, which were recoded into SEI scores ranging from 7.33 to 70.21 (Jones et al., 1983, p. 63); also created a dummy variable if missing.
hCreated dummy variable for academic track (reference group includes categories general and vocational).iCombined into a measure of school percent minority (black and Latino).jCreated dummy variables for private (reference group is public).kCreated dummy variables for urban and suburban (reference group is rural).


131
APPENDIX E
Multilevel Results Relating MathematicsAchievements to Individual, Family, and School Characteristics, 1972–1992

132 Examin
ing
Gap
s in M
athem
atics Ach
ievemen
t Am
on
g R
acial-Ethn
ic Gro
up
s
Table E.1.Family Background, Individual, and School Measures for LS High School Senior Cohorts
All Black Latino White
1972 High School Seniors Mean SD Mean SD Mean SD Mean SD
Number of students 14,469 1,719 1,380 11,370
Math IRT 51.14 9.80 42.31 8.25 44.18 8.59 52.46 9.34
Female 0.50 0.50 0.57 0.50 0.51 0.50 0.50 0.50
Academic track 0.47 0.50 0.28 0.45 0.26 0.47 0.50 0.50
Income quintile 1 0.34 0.47 0.61 0.49 0.57 0.46 0.30 0.46
Income quintile 2 0.16 0.37 0.19 0.39 0.20 0.38 0.16 0.36
Income quintile 4 0.13 0.34 0.04 0.20 0.05 0.23 0.14 0.35
Income quintile 5 0.12 0.32 0.03 0.16 0.03 0.19 0.13 0.33
Missing income data 0.21 0.41 0.19 0.39 0.23 0.40 0.21 0.41
Father’s education 12.54 2.43 11.27 1.83 11.32 1.87 12.73 2.44
Missing father’s education 0.01 0.11 0.04 0.20 0.03 0.22 0.01 0.10
Mother’s education 12.31 2.04 11.57 1.92 11.04 1.95 12.45 2.03
Missing mother’s education 0.01 0.10 0.02 0.15 0.03 0.12 0.01 0.09
Parents’ Maximum SEI 36.93 26.81 19.72 24.07 21.70 25.03 39.55 26.23
Missing SEI data 0.19 0.40 0.44 0.50 0.35 0.49 0.16 0.37
Number of schools 875 360 327 846
School mean SES –0.05 0.51 –0.21 0.47 –0.12 0.48 –0.03 0.50
School percent minority 19.08 25.94 36.21 28.01 32.53 26.34 16.60 22.13
Private school 0.07 0.25 0.05 0.21 0.06 0.23 0.07 0.25
Suburban school 0.48 0.50 0.38 0.48 0.40 0.49 0.49 0.50
Urban school 0.29 0.46 0.44 0.50 0.48 0.49 0.27 0.45

Resu
lts Relatin
g A
chievem
ents to
Ind
ividu
al, Family, an
d Sch
oo
l Ch
aracteristics 133
1982 High School Seniors Mean SD Mean SD Mean SD Mean SD
Math IRT 48.95 10.07 42.05 8.20 42.99 8.30 50.96 9.62
Female 0.51 0.50 0.54 0.50 0.45 0.50 0.52 0.50
Academic track 0.39 0.49 0.35 0.48 0.25 0.48 0.42 0.49
Income quintile 1 0.29 0.45 0.51 0.50 0.38 0.47 0.24 0.43
Income quintile 2 0.13 0.33 0.14 0.35 0.14 0.37 0.12 0.33
Income quintile 4 0.15 0.36 0.08 0.28 0.12 0.29 0.17 0.37
Income quintile 5 0.16 0.37 0.06 0.24 0.11 0.26 0.19 0.39
Missing income data 0.10 0.30 0.13 0.34 0.08 0.33 0.10 0.30
Father’s education 12.88 2.51 11.76 2.04 11.98 2.50 13.19 2.53
Missing father’s education 0.09 0.28 0.23 0.42 0.12 0.33 0.06 0.24
Mother’s education 12.65 2.13 12.22 2.12 11.90 2.11 12.84 2.10
Missing mother’s education 0.05 0.23 0.10 0.31 0.08 0.25 0.04 0.19
Parents’ Maximum SEI 47.79 22.26 38.47 24.72 39.98 23.08 50.64 20.77
Missing SEI data 0.03 0.16 0.07 0.26 0.04 0.22 0.01 0.12
Number of schools 905 466 507 838
School mean SES –0.05 0.56 –0.04 0.56 –0.06 0.55 0.04 0.54
School percent minority 26.11 31.13 36.67 31.87 28.25 26.33 20.82 25.32
Private school 0.12 0.32 0.10 0.30 0.10 0.31 0.12 0.33
Suburban school 0.47 0.50 0.44 0.50 0.47 0.50 0.50 0.50
Urban school 0.25 0.43 0.36 0.48 0.26 0.44 0.21 0.41
Continued
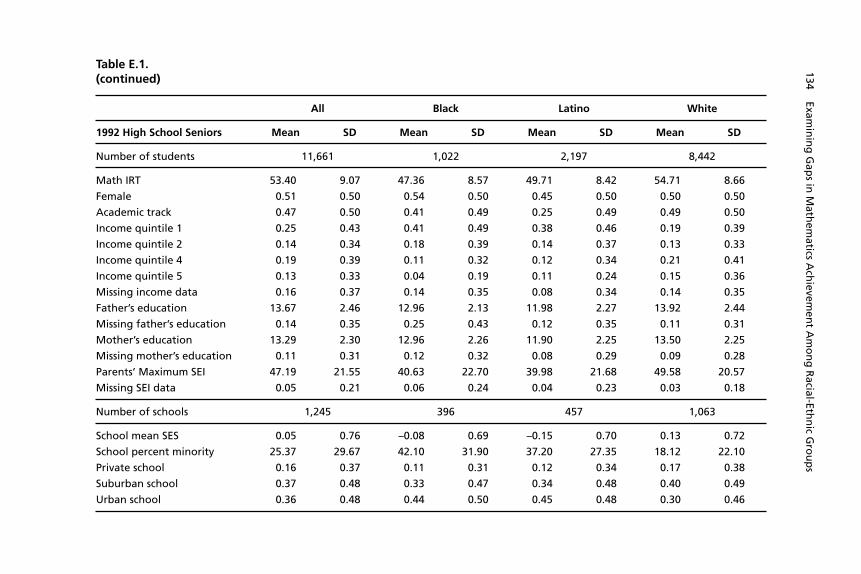
134 Examin
ing
Gap
s in M
athem
atics Ach
ievemen
t Am
on
g R
acial-Ethn
ic Gro
up
s Table E.1.(continued)
All Black Latino White
1992 High School Seniors Mean SD Mean SD Mean SD Mean SD
Number of students 11,661 1,022 2,197 8,442
Math IRT 53.40 9.07 47.36 8.57 49.71 8.42 54.71 8.66
Female 0.51 0.50 0.54 0.50 0.45 0.50 0.50 0.50
Academic track 0.47 0.50 0.41 0.49 0.25 0.49 0.49 0.50
Income quintile 1 0.25 0.43 0.41 0.49 0.38 0.46 0.19 0.39
Income quintile 2 0.14 0.34 0.18 0.39 0.14 0.37 0.13 0.33
Income quintile 4 0.19 0.39 0.11 0.32 0.12 0.34 0.21 0.41
Income quintile 5 0.13 0.33 0.04 0.19 0.11 0.24 0.15 0.36
Missing income data 0.16 0.37 0.14 0.35 0.08 0.34 0.14 0.35
Father’s education 13.67 2.46 12.96 2.13 11.98 2.27 13.92 2.44
Missing father’s education 0.14 0.35 0.25 0.43 0.12 0.35 0.11 0.31
Mother’s education 13.29 2.30 12.96 2.26 11.90 2.25 13.50 2.25
Missing mother’s education 0.11 0.31 0.12 0.32 0.08 0.29 0.09 0.28
Parents’ Maximum SEI 47.19 21.55 40.63 22.70 39.98 21.68 49.58 20.57
Missing SEI data 0.05 0.21 0.06 0.24 0.04 0.23 0.03 0.18
Number of schools 1,245 396 457 1,063
School mean SES 0.05 0.76 –0.08 0.69 –0.15 0.70 0.13 0.72
School percent minority 25.37 29.67 42.10 31.90 37.20 27.35 18.12 22.10
Private school 0.16 0.37 0.11 0.31 0.12 0.34 0.17 0.38
Suburban school 0.37 0.48 0.33 0.47 0.34 0.48 0.40 0.49
Urban school 0.36 0.48 0.44 0.50 0.45 0.48 0.30 0.46
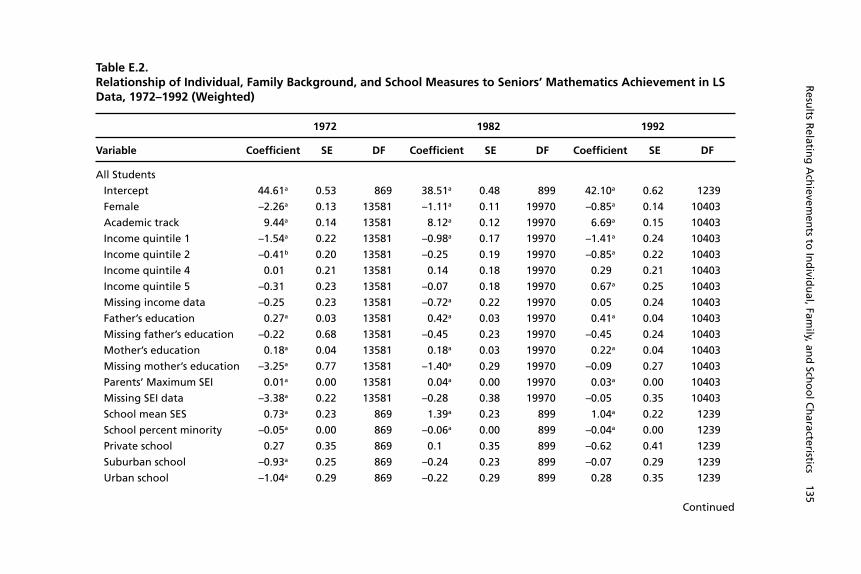
Resu
lts Relatin
g A
chievem
ents to
Ind
ividu
al, Family, an
d Sch
oo
l Ch
aracteristics 135
Table E.2.Relationship of Individual, Family Background, and School Measures to Seniors’ Mathematics Achievement in LS Data, 1972–1992 (Weighted)
1972 1982 1992
Variable Coeffi cient SE DF Coeffi cient SE DF Coeffi cient SE DF
All Students
Intercept 44.61a 0.53 869 38.51a 0.48 899 42.10a 0.62 1239
Female –2.26a 0.13 13581 –1.11a 0.11 19970 –0.85a 0.14 10403
Academic track 9.44a 0.14 13581 8.12a 0.12 19970 6.69a 0.15 10403
Income quintile 1 –1.54a 0.22 13581 –0.98a 0.17 19970 –1.41a 0.24 10403
Income quintile 2 –0.41b 0.20 13581 –0.25 0.19 19970 –0.85a 0.22 10403
Income quintile 4 0.01 0.21 13581 0.14 0.18 19970 0.29 0.21 10403
Income quintile 5 –0.31 0.23 13581 –0.07 0.18 19970 0.67a 0.25 10403
Missing income data –0.25 0.23 13581 –0.72a 0.22 19970 0.05 0.24 10403
Father’s education 0.27a 0.03 13581 0.42a 0.03 19970 0.41a 0.04 10403
Missing father’s education –0.22 0.68 13581 –0.45 0.23 19970 –0.45 0.24 10403
Mother’s education 0.18a 0.04 13581 0.18a 0.03 19970 0.22a 0.04 10403
Missing mother’s education –3.25a 0.77 13581 –1.40a 0.29 19970 –0.09 0.27 10403
Parents’ Maximum SEI 0.01a 0.00 13581 0.04a 0.00 19970 0.03a 0.00 10403
Missing SEI data –3.38a 0.22 13581 –0.28 0.38 19970 –0.05 0.35 10403
School mean SES 0.73a 0.23 869 1.39a 0.23 899 1.04a 0.22 1239
School percent minority –0.05a 0.00 869 –0.06a 0.00 899 –0.04a 0.00 1239
Private school 0.27 0.35 869 0.1 0.35 899 –0.62 0.41 1239
Suburban school –0.93a 0.25 869 –0.24 0.23 899 –0.07 0.29 1239
Urban school –1.04a 0.29 869 –0.22 0.29 899 0.28 0.35 1239
Continued

136 Examin
ing
Gap
s in M
athem
atics Ach
ievemen
t Am
on
g R
acial-Ethn
ic Gro
up
s
Table E.2.(continued)
1972 1982 1992
Variable Coeffi cient SE DF Coeffi cient SE DF Coeffi cient SE DF
Black Students
Intercept 42.07a 1.88 13524 38.56a 1.41 19913 42.34a 1.89 10346
Female –1.79a 0.43 13524 –0.43 0.32 19913 0.38 0.44 10346
Academic track 8.03a 0.49 13524 5.85a 0.34 19913 6.95a 0.46 10346
Income quintile 1 –0.55 0.69 13524 –0.05 0.44 19913 –0.69 0.62 10346
Income quintile 2 –0.32 0.76 13524 0.32 0.54 19913 –0.65 0.66 10346
Income quintile 4 0.69 1.20 13524 0.09 0.65 19913 –0.35 0.79 10346
Income quintile 5 0.64 1.44 13524 1.85b 0.74 19913 2.26 1.18 10346
Missing income data –0.64 0.59 13524 –1.00 0.52 19913 –0.23 0.69 10346
Father’s education –0.02 0.13 13524 0.13 0.10 19913 0.12 0.13 10346
Missing father’s education 0.34 1.33 13524 –0.21 0.46 19913 –0.54 0.58 10346
Mother’s education 0.22 0.13 13524 0.11 0.09 19913 0.02 0.12 10346
Missing mother’s education –0.82 1.75 13524 –1.37b 0.62 19913 0.75 0.77 10346
Parents’ Maximum SEI 0.01 0.01 13524 0.03a 0.01 19913 0.03a 0.01 10346
Missing SEI data –2.35a 0.63 13524 –0.68 0.68 19913 –1.03 0.91 10346
School mean SES 0.86a 0.23 870 1.50a 0.23 900 1.42a 0.22 1240
School percent minority –0.02a 0.00 870 –0.02a 0.00 900 –0.01 0.01 1240
Private school 0.27 0.36 870 0.11 0.34 900 –0.40 0.42 1240
Suburban school –0.90a 0.26 870 –0.12 0.22 900 0.01 0.29 1240
Urban school –0.90a 0.29 870 –0.12 0.28 900 0.15 0.35 1240

Resu
lts Relatin
g A
chievem
ents to
Ind
ividu
al, Family, an
d Sch
oo
l Ch
aracteristics 137
Latino Students
Intercept 46.71a 2.80 13524 37.27a 1.28 19913 44.93a 1.83 10346
Female –1.95 a 0.70 13524 –0.95a 0.33 19913 –2.03a 0.44 10346
Academic track 8.83 a 0.82 13524 6.70a 0.39 19913 6.41a 0.47 10346
Income quintile 1 –3.17 a 1.11 13524 –0.25 0.44 19913 –1.36 0.70 10346
Income quintile 2 –1.76 1.19 13524 –0.63 0.53 19913 –0.59 0.72 10346
Income quintile 4 0.46 1.81 13524 1.61a 0.56 19913 0.77 0.85 10346
Income quintile 5 0.23 2.06 13524 0.47 0.60 19913 –0.92 1.21 10346
Missing income data –0.78 0.97 13524 –0.24 0.64 19913 –0.50 0.60 10346
Father’s education 0.00 0.21 13524 0.37a 0.09 19913 0.42a 0.12 10346
Missing father’s education –1.71 2.46 13524 –1.20 0.62 19913 –0.56 0.69 10346
Mother’s education 0.07 0.26 13524 0.02 0.10 19913 –0.01 0.13 10346
Missing mother’s education –0.66 2.63 13524 –1.44b 0.72 19913 –0.07 0.74 10346
Parents’ Maximum SEI 0.01 0.02 13524 0.03a 0.01 19913 0.01 0.01 10346
Missing SEI data –3.24a 1.04 13524 –1.01 0.88 19913 –1.67b 0.76 10346
School mean SES 0.86a 0.23 870 1.50a 0.23 900 1.42a 0.22 1240
School percent minority –0.02a 0.00 870 –0.02a 0.00 900 –0.01 0.01 1240
Private school 0.27 0.36 870 0.11 0.34 900 –0.40 0.42 1240
Suburban school –0.90a 0.26 870 –0.12 0.22 900 0.01 0.29 1240
Urban school –0.90a 0.29 870 –0.12 0.28 900 0.15 0.35 1240
Continued

138 Examin
ing
Gap
s in M
athem
atics Ach
ievemen
t Am
on
g R
acial-Ethn
ic Gro
up
s
Table E.2.(continued)
1972 1982 1992
Variable Coeffi cient SE DF Coeffi cient SE DF Coeffi cient SE DF
White Students
Intercept 44.99a 0.55 13524 39.26a 0.52 19913 41.43a 0.67 10346
Female –2.29a 0.13 13524 –1.49a 0.12 19913 –0.75a 0.15 10346
Academic track 9.33a 0.15 13524 8.45a 0.14 19913 6.74a 0.17 10346
Income quintile 1 –0.80a 0.26 13524 –0.77a 0.20 19913 –0.80a 0.29 10346
Income quintile 2 –0.23 0.21 13524 –0.07 0.21 19913 –0.69a 0.25 10346
Income quintile 4 –0.01 0.22 13524 –0.14 0.19 19913 0.34 0.22 10346
Income quintile 5 –0.34 0.24 13524 –0.36 0.19 19913 0.33 0.27 10346
Missing income data –0.85a 0.27 13524 –1.05a 0.26 19913 –0.27 0.30 10346
Father’s education 0.27a 0.03 13524 0.36a 0.03 19913 0.38a 0.04 10346
Missing father’s education 0.18 0.86 13524 –0.21 0.30 19913 0.03 0.29 10346
Mother’s education 0.16a 0.04 13524 0.25a 0.04 19913 0.30a 0.04 10346
Missing mother’s education –4.64a 0.93 13524 –1.22a 0.37 19913 –0.35 0.32 10346
Parents’ Maximum SEI 0.01b 0.00 13524 0.03a 0.00 19913 0.03a 0.00 10346
Missing SEI data –3.16a 0.25 13524 0.04 0.57 19913 0.01 0.45 10346
School mean SES 0.86a 0.23 870 1.50a 0.23 900 1.42a 0.22 1240
School percent minority –0.02a 0.00 870 –0.02a 0.00 900 –0.01 0.01 1240
Private school 0.27 0.36 870 0.11 0.34 900 –0.40 0.42 1240
Suburban school –0.90a 0.26 870 –0.12 0.22 900 0.01 0.29 1240
Urban school –0.90a 0.29 870 –0.12 0.28 900 0.15 0.35 1240

139
References
Alexander, K. L., and M. A. Cook, “Curricula and Coursework: A Surprise Ending to a Familiar Story,” American Sociological Review, Vol. 47, 1982, pp. 626–640.
Alexander, K. L., M. A. Cook, and E. L. McDill, “Curriculum Tracking and Educational Stratification,” American Sociological Review, Vol. 43, 1978, pp. 47–66.
Altonji, J. G., T. E. Elder, and C. R. Taber, “Selection on Observed and Unobserved Variables: Assessing the Effectiveness of Catholic Schools,” Working Paper 7831, Cambridge, Mass.: National Bureau of Economic Research, 2000.
Alwin, D. F., “Family of Origin and Cohort Differences in Verbal Ability,” American Sociological Review, Vol. 56, 1991, pp. 625–638.
Alwin, D. F., and L. B. Otto, “High School Context Effects on Aspirations,” Sociology of Education, Vol. 50, 1977, pp. 259–273.
Argys, L. M., D. I. Rees, and D. J. Brewer, The Impact of Ability Grouping on High School Student Achievement: Evidence from NELS, Washington, D.C.: National Center for Education Statistics, U.S. Department of Education, 1995.
Armor, D. J., Forced Justice: School Desegregation and the Law, New York: Oxford University Press, 1995.
Astone, N. M., and S. S. McLanahan, “Family Structure, Parental Practices and High School Completion,” American Sociological Review, Vol. 56, 1991, pp. 309–320.
Averch, H. A., S. J. Carroll, T. S. Donaldson, H. J. Kiesling, and J. Pincus, How Effective Is Schooling? Santa Monica, Calif.: RAND Corporation, R-0956, 1972.

140 Examining Gaps in Mathematics Achievement Among Racial-Ethnic Groups
Baron, J. N., “Organizational Perspectives on Stratification,” Annual Review of Sociology, Vol. 10, 1984, pp. 37–69.
Barr, R., and R. Dreeben, How Schools Work, Chicago: The University of Chicago Press, 1983.
Baumrind, D., “Authoritarian Versus Authoritative Parental Control,” Adoles-cence, Vol. 3, 1968, pp. 255–272.
———, “Parental Disciplinary Patterns and Social Competence in Chil-dren,” Youth and Society, Vol. 9, 1978, pp. 239–276.
Becker, G. A Treatise on the Family. Cambridge, Mass.: Harvard University Press, 1981.
———, Human Capital: A Theoretical and Empirical Analysis with Special Reference to Education, Third Edition, Chicago, Ill.: The University of Chi-cago Press, 1993.
Becker, G., and N. Tomes, “Human Capital and the Rise and Fall of Fami-lies,” Journal of Labor Economics, Vol. 4, 1986, pp. s1–s39.
Berends, M., “Educational Stratification and Students’ Social Bonding to School,” British Journal of Sociology of Education, Vol. 16, No. 3, 1995, pp. 327–351.
———, “Educational Productivity,” in D. L. Levinson, P. W. Cookson, and A. R. Sadovnik, eds., Education and Sociology: An Encyclopedia, New York: Garland Publishing, 2000, pp. 203–209.
Berends, M., S. Bodilly, and S. N. Kirby, Facing the Challenges of Whole-School Reform: New American Schools After a Decade, Santa Monica, Calif.: RAND Corporation, MR-1498-EDU, 2002.
Berends, M., D. W. Grissmer, S. N. Kirby, and S. Williamson, “The Chang-ing American Family and Student Achievement Trends,” Review of Sociol-ogy of Education and Socialization, Vol. 12, 1999, pp. 67–101.
Berends, M., and D. Koretz, “Reporting Minority Students’ Test Scores: How Well Can the National Assessment of Educational Progress Account for Differ-ences in Social Context?” Educational Assessment, Vol. 3, 1996, pp. 249–285.
Berends, M., S. R. Lucas, and R. J. Briggs, “Effects of Curricular Differen-tiation on Student Achievement: Longitudinal Analyses of High School Students,” in M. Ross and G. Bohrnstedt, eds., Instructional and Perfor-mance Consequences of High-Poverty Schooling, Washington, D.C.: U.S. Department of Education, National Center for Education Statistics, forth-coming.

References 141
Berends, M., T. J. Sullivan, and S. R. Lucas, “Examining Racial-Ethnic Test Score Differences in National Data: Linking Scores Among Several High School Senior Cohorts, 1972–1992,” unpublished paper, 1999.
Berliner, D. C. and B. J. Biddle, The Manufactured Crisis: Myths, Fraud, and the Attack on America’s Public Schools, New York: Addison-Wesley, 1995.
Bidwell, C., and N. Friedkin, “Sociology of Education,” in Neil J. Smelser, ed., Handbook of Sociology, Beverly Hills, Calif.: Sage, 1988, pp. 449–471.
Bidwell, C. E., and J. D. Kasarda, “Conceptualizing and Measuring the Effects of School and Schooling,” American Journal of Education, Vol. 88, 1980, pp. 401–430.
Blake, J., Family Size and Achievement, Berkeley: University of California Press, 1989.
Blau, F. D., and A. J. Grossberg, .“Maternal Labor Supply and Children’s Cognitive Development,” The Review of Economics and Statistics, Vol. 74, 1992, pp. 474–481.
Blau, P. M., and O. D. Duncan, The American Occupational Structure, New York: Wiley, 1967.
Bourdieu, P., Distinction: A Social Critique of the Judgment of Taste, trans. Richard Nice, Cambridge, Mass.: Harvard University Press, 1984.
Bourdieu, P., and J. Passeron, Reproduction in Education, Society and Culture, trans. Richard Nice, London: Sage Publications, 1977.
Bradley, R. H., “The Home Inventory: Rationale and Research,” in J. Lachen-meyer and M. Gibbs, eds., Recent Research in Developmental Psychopathol-ogy, Gardner, N.Y.: Book Supplement to the Journal of Child Psychology and Psychiatry, 1985, pp. 191–201.
Bronfenbrenner, U., The Ecology of Human Development: Experiments by Nature and Design, Cambridge, Mass.: Harvard University Press, 1979.
———, “Ecology of the Family as a Context for Human Development: Research Perspectives,” Developmental Psychologist, Vol. 22, No. 6, 1986, pp. 723–742.
Bronfenbrenner, U., P. McClelland, E. Wethington, P. Moen, and S. Ceci, The State of Americans, New York: Free Press, 1996.
Brooks-Gunn, J., G. J. Duncan, P. K. Klebanov, and N. Sealand, “Do Neigh-borhoods Influence Child and Adolescent Development?” American Jour-nal of Sociology, Vol. 99, 1993, pp. 353–394.

142 Examining Gaps in Mathematics Achievement Among Racial-Ethnic Groups
Brooks-Gunn, J., P. Klebanov, and G. J. Duncan, “Ethnic Differences in Children’s Intelligence Test Scores: Role of Economic Deprivation, Home Environment, and Maternal Characteristics,” Child Development, Vol. 67, 1996, pp. 396–408.
Bryk, A. S. and M. E. Driscoll, “The High School as Community: Contex-tual Influences, and Consequences for Students and Teachers,” paper pre-pared for the National Center on Effective Secondary Schools, University of Wisconsin-Madison, 1998.
Bryk, A. S., V. Lee, and P. Holland, Catholic Schools and the Common Good, Cambridge, Mass.: Harvard University Press, 1993.
Bryk, A. S., V. Lee, and J. B. Smith, “High School Organization and Its Effects on Teachers and Students: An Interpretative Summary of the Research,” in W. H. Clune and J. F. Witte, eds., Choice and Control in American edu-cation: Vol. 1, New York: The Falmer Press, 1990, pp. 136–226.
Bryk, A. S., and B. Schneider, Trust in Schools: A Core Resource for Improve-ment. New York: Russell Sage Foundation, 2002.
Burstein, L., L. M. McDonnell, J. Van Winkle, T. Ormseth, J. Mirocha, and G. Guitton, Validating National Curriculum Indicators, Santa Monica, Calif.: RAND Corporation, MR-658-NSF, 1995.
Cain, G. G., “The Economic Analysis of Labor Market Discrimination: A Survey,” in O. Ashenfelter and R. Layard, eds., Handbook of Labor Eco-nomics: Vol. I, New York: Elsevier Science, 1986, pp. 693–785.
Caldas, S. J., and C. L. Bankston, “The Inequality of Separation: Racial Com-position of Schools and Academic Achievement,” Educational Administra-tion Quarterly, Vol. 34, No. 4, 1998, pp. 533–557.
Campbell, J. R., C. M. Hombo, and J. Mazzeo, J., NAEP 1999 Trends in Aca-demic Progress: Three Decades of Student Performance, Washington, D.C.: U.S. Department of Education, 2000.
Cancio, A. S., T. D. Evans, and D. Maume, “Reconsidering the Declining Significance of Race: Racial Difference in Early Career Wages,” American Sociological Review, Vol. 61, 1996, pp. 541–556.
Caplan, N., M. H. Choy, and J. K. Whitmore, Children of the Boat People: A Study of Educational Success, Ann Arbor, Mich.: The University of Michi-gan Press, 1991.
Carey, N., E. Farris, and J. Carpenter, Curricular Differentiation in Public High Schools: Fast Response Survey System E. D. Tabs, Rockville, Md.: Wes-tat, Inc., 1994.

References 143
Chambers, J. G., “An Analysis of School Size Under a Voucher System,” Edu-cational Evaluation and Policy Analysis, Vol. 3, 1981, pp. 29–40.
Chambers, J., J. Lieberman, T. Parrish, D. Kaleba, J. Van Campen, and S. Stullich, Study of Education Resources and Federal Funding: Final Report, Washington, D.C.: U.S. Department of Education, 2000.
Cherlin, A. J., “The Changing American Family and Public Policy,” in A. J. Cherlin, ed., The Changing American Family and Public Policy, Washing-ton, D.C.: The Urban Institute Press, 1988, pp. 1–29.
Chow, G. C., “Tests of Equality Between Sets of Coefficients in Two Linear Regressions,” Econometrica, Vol. 28, 1960, pp. 591–605.
Christensen, B. J., Utopia Against the Family, San Francisco, Calif.: Ignatius Press, 1990.
Chubb, J., and T. Moe, Politics Markets and America’s Schools, Washington, D.C.: The Brookings Institution Press, 1990.
Coleman, J. S., “Social Capital in the Creation of Human Capital,” American Journal of Sociology, Vol. 94, 1988, pp. 95–120.
———, Foundations of Social Theory. Boston, Mass.: Harvard University Press, 1990.
———, “Output-Driven Schools: Principles of Design,” unpublished man-uscript, University of Chicago, 1994.
Coleman, J. S., E. Campbell, C. Hobson, J. McPartland, A. M. Mood, F. Weinfield, and R. York, Equality of Educational Opportunity, Washington, D.C.: U.S. Government Printing Office, 1966.
Coleman, J. S., and T. B. Hoffer, Public and Private Schools: The Impact of Communities, New York: Basic Books, 1987.
Coleman, J. S., T. B. Hoffer, and S. Kilgore, High School Achievement: Public, Catholic, and Private Schools Compared, New York: Basic Books, 1982.
Conant, J. B., The American High School Today, New York: McGraw-Hill, 1959.———, The Comprehensive High School, New York: McGraw-Hill, 1967.Contemporary Sociology, Vol. 24, No. 2, 1995. Cook, M., and W. N. Evans, “Families or Schools? Explaining the Conver-
gence in White and Black Academic Performance,” Journal of Labor Eco-nomics, Vol. 18, 2000, pp. 729–754.
Cook, T. “School Desegregation and Black Achievement.” Washington, D.C.: National Institute of Education, U.S. Department of Education, 1984.
144 Examining Gaps in Mathematics Achievement Among Racial-Ethnic Groups
Corcoran, M. E., and S. H. Danziger, “Rags to Rags: Poverty and Mobility in the U.S.,” Annual Review of Sociology, Vol. 21, 1996, pp. 237–267.
Corcoran, M. E., and G. J. Duncan, “Work History, Labor Force Attach-ment, and Earnings Differences Between the Races and Sexes,” Journal of Human Resources, Vol. 14, 1979, pp. 3–20.
Cowan, P. A., “The Sky Is Falling, but Popenoe’s Analysis Won’t Help Us Do Anything About It,” Journal of Marriage and Family, Vol. 55, 1993, pp. 548–553.
Crain, R., and C. Weisman, Discrimination, Personality, and Achievement, New York: Academic Press, 1972.
De Gruijter, D. N. M., “A Comment on ‘Some Standard Errors in Item Response Theory,’” Psychometrika, Vol. 49, 1984, pp. 269–272.
Delgado-Gaitan, C., “Involving Parents in the Schools: A Process of Empower-ment,” American Journal of Education, Vol. 100, No. 1, 1991, pp. 20–46.
———, “School Matters in the Mexican-American Home: Socializing Chil-dren to Education,” American Educational Research Journal, Vol. 29, 1992, pp. 495–513.
Desai, S. P., L. Chase-Lansdale, and R. T. Michael, “Mother or Market? Effects of Maternal Employment on the Intellectual Ability of 4-Year-Old Children,” Demography, Vol. 26, 1989, pp. 545–561.
Dornbusch, S. M., P. L. Ritter, P. H. Leiderman, D. F. Roberts, and M. J. Fraleigh, “The Relation of Parenting Style to Adolescent School Perfor-mance,” Child Development, Vol. 58, 1987, pp. 1244–1257.
Dreeben, Robert. “The Sociology of Education: Its Development in the Unites States,” in A. Pallas, ed., Research in Sociology of Education and Socializa-tion: Vol. 10, Greenwich, Conn.: JAI Press, 1994, pp. 7–52.
Duncan, O. D., “A Socioeconomic Index for All Occupations,” in A. J. Reiss, ed., Occupations and Social Status, New York: Free Press, 1961, pp. 109-138.
———, “Discrimination Against Negroes,” The Annals of the American Acad-emy of Political and Social Science, Vol. 3, No. 71, 1967, pp. 85–103.
———, “Inheritance of Poverty or Inheritance of Race?” in D. P. Moynihan, ed., On Understanding Poverty: Perspectives from the Social Sciences, New York: Basic Books, 1968, pp. 85–110.
Eccles, J. S., and L. W. Hoffman, “Sex Roles, Socialization, and Occupational Behavior,” in H. W. Stevenson and A. E. Siegel, eds., Research in Child Development and Social Policy: Vol. 1, Chicago: The University of Chicago Press, 1987, pp. 367–420.

References 145
Elder, G. H., Jr., Children of the Great Depression, Chicago: The University of Chicago Press, 1974.
Entwisle, D. R., and K. L. Alexander, “Summer Setback: Race, Poverty, School Composition, and Mathematics Achievement in the First Two Years of School,” American Sociological Review, Vol. 57, 1992, pp. 72–84.
Epstein, J., “School and Family Connections: Theory, Research, and Implica-tions for Integrating Sociologies of Education and Family,” Marriage and Family Review, Vol. 15, No. 1–2, 1990, pp. 99–126.
———, Schools, Family, and Community Partnerships, Boulder, Colo.: West-view, 2001.
Feagin, J. R., and V. Hernán, White Racism, New York: Routledge, 1995.Featherman, D. L., “Social Stratification and Mobility Research: Two Decades
of Cumulative Social Science,” in J. Start, ed., The State of Sociology: Prob-lems and Prospects, San Francisco, Calif.: Sage Press, 1981, pp. 83–104.
Ferguson, R. F., “Can Schools Narrow the Black-White Test Score Gap?” in C. Jencks and M. Phillips, eds., The Black-White Test Score Gap, Washing-ton, D.C.: The Brookings Institution Press, 1998, pp. 318–374.
Ferri, E., Growing Up in a One-Parent Family: A Long-Term Study of Child Development, Windsor, England: NFER Publishing, 1976.
Feuer, M. J., P. W. Holland, B. F. Green, M. W. Bertenthal, and F. C. Hemp-hill, eds., Uncommon Measures: Equivalence and Linkage Among Educa-tional Tests, Washington, D.C.: National Academy Press, 1998.
Fischer, C. S., M. Hout, M. S. Jankowski, S. R. Lucas, A. Swidler, and K. Voss, Inequality by Design: Cracking the Bell Curve Myth, Princeton, N.J.: Princeton University Press, 1996.
Flinspach, S. L., K. Banks, K., and R. Khanna, “Socioeconomic Integration as a Tool for Diversifying Schools: Promise and Practice in Two Large School Systems,” paper presented at the Harvard Color Lines Conference, The Civil Rights Project, Harvard University, 2003.
Fogelman, K., ed., Growing Up in Great Britain: Papers from the National Child Development Study, London: Macmillan, 1983.
Fordham, S., and J. U. Ogbu, “Black Students’ School Success: Coping with the Burden of ‘Acting White,’” Anthropology and Education Quarterly, Vol. 18, 1986, pp. 312–334.
Fuchs, V. R., and D. M. Reklis, “America’s Children: Economic Perspectives and Policy Options,” Science, Vol. 255, 1992, pp. 41–45.

146 Examining Gaps in Mathematics Achievement Among Racial-Ethnic Groups
Gamoran, A., “The Stratification of High School Learning Opportunities,” Sociology of Education, Vol. 60, 1987, pp. 135–155.
———, “Measuring Curriculum Differentiation,” American Journal of Edu-cation, Vol. 97, 1989, pp. 129–143.
———, “The Variable Effects of High School Tracking,” American Sociologi-cal Review, Vol. 57, 1992, pp. 812–828.
Gamoran, A., and M. Berends, “The Effects of Stratification in Secondary Schools: Synthesis of Survey and Ethnographic Research,” Review of Edu-cational Research, Vol. 57, 1987, pp. 415–435.
Gamoran, A., and M. T. Hallinan, “Tracking Students for Instruction: Con-sequences and Implications for School Restructuring,” in M. T. Hallinan, ed., Restructuring Schools: Promising Practices and Policies, New York: Ple-num Press, 1995, pp. 113–131.
Gamoran, A., and R. D. Mare, “Secondary School Tracking and Educational Inequality: Compensation, Reinforcement, or Neutrality?” American Jour-nal of Sociology, Vol. 94, 1989, pp. 1146–1183.
Gamoran, A., M. Nystrand, M. Berends, and P. C. LePore, “An Organiza-tional Analysis of the Effects of Ability Grouping,” American Educational Research Journal, Vol. 32, No. 4, 1995, pp. 687–715.
Gamoran, A., W. G. Secada, and C. B. Marrett, “The Organizational Con-text of Teaching and Learning,” in M. T. Hallinan, ed., Handbook of the Sociology of Education, New York: Kluwer, 2000, pp. 37–63.
Gill, A. M., and R. J. Michaels, “Does Drug Use Lower Wages?” Industrial & Labor Relations Review, Vol. 45, 1992, pp. 419–434.
Gill, B. P., M. P. Timpane, K. E. Ross, and D. J. Brewer, Rhetoric Versus Real-ity: What We Know and What We Need to Know About Vouchers and Charter Schools, Santa Monica, Calif.: RAND Corporation, MR-1118-EDU, 2001.
Glenn, N. D., “A Plea for Objective Assessment of the Notion of Family Decline,” Journal of Marriage and Family, Vol. 55, 1993, pp. 542–544.
Goldberger, A. S., and G. G. Cain, “The Causal Analysis of Cognitive Out-comes in the Coleman, Hoffer, and Kilgore Report,” Sociology of Educa-tion, Vol. 55, 1982, pp. 103–122.
Goldberger, A. S., and C. F. Manski, “The Bell Curve by Herrnstein and Mur-ray” (review article), Journal of Economic Literature, Vol. 33, 1995, pp. 762–776.

References 147
Goldhaber, D. D., “Public and Private High Schools: Is School Choice an Answer to the Productivity Problem?” Economics of Education Review, Vol. 15, No. 2, 1996, pp. 93–109.
———, “Can Teacher Quality Be Effectively Assessed?” unpublished manu-script, University of Washington, 2004.
Goldring, E. B., and C. Smrekar, “Shifting from Court-Ordered to Court-Ended Desegregation in Nashville: Student Assignment and Teacher Resources,” paper presented at the conference, The Resegregation of Southern Schools: A Crucial Moment in the History and Future of Pub-lic Schooling in America, University of North Carolina, Chapel Hill, 2002.
Gottfried, A. E., A. W. Gottfried, and K. Bathhurst, “Maternal Employment, Family Environment, and Children’s Development: Infancy Through the School Years,” in A. E. Gottfried and A. W. Gottfried, eds., Maternal Employment and Children’s Development: Longitudinal Research, New York: Plenum Press, 1988, pp. 32–51.
Gould, S. J., “Curveball,” The New Yorker, November 28, 1994, pp. 139–149.Granovetter, M., “Economic Action, Social Structure, and Embeddedness,”
American Journal of Sociology, Vol. 91, 1985, pp. 481–510.Green, P. J., B. L. Dugoni, and S. J. Ingels, Trends Among High School Seniors,
1972–1992, Washington, D.C.: National Center for Education Statistics, NCES 95–380, 1995.
Greenwald, R., L. V. Hedges, and R. Laine, “The Effect of School Resources on Student Achievement,” Review of Education Research, Vol. 66, No. 3, 1996, pp. 361–396.
Grissmer, D., A. Flanagan, and S. Williamson, “Why Did the Black-White Score Gap Narrow in the 1970s and 1980s?” in C. Jencks and M. Phillips, eds., The Black-White Test Score Gap, Washington, D.C.: The Brookings Institution Press, 1998, pp. 182–226.
Grissmer, D. W., S. N. Kirby, M. Berends, and S. Williamson, Student Achievement and the Changing American Family, Santa Monica, Calif.: RAND Corporation, MR-488-LE, 1994.
Grogger, J., and Neal, D., “Further Evidence on the Effects of Catholic Sec-ondary Schooling,” in W. G. Gale and J. R. Pack, eds., Brookings-Wharton Papers on Urban Affairs, Washington, D.C.: Brookings Institution Press, 2000.

148 Examining Gaps in Mathematics Achievement Among Racial-Ethnic Groups
Grusky, D. B., “The Contours of Social Stratification,” in D. B. Grusky, ed., Social Stratification: Class, Race, and Gender in Sociological Perspective, Boulder, Colo.: Westview Press, 1994, pp. 3–35.
Haller, A. O., and A. Portes, “Status Attainment Processes,” Sociology of Edu-cation, Vol. 46, 1973, pp. 51–91.
Hallinan, M. T. “Tracking : From Theory to Practive.” Sociology of Education, 67, pp. 79–84,89–91, 1994.
Hambleton, R. K., “Principles and Selected Applications of Item Response Theory,” in Robert L. Linn, ed., Educational Measurement, 3rd ed., New York: American Council on Education, Macmillan Publishing Company, 1989, pp. 147–200.
Hamilton, L. S., B. M. Stecher, and S. P. Klein, eds., Making Sense of Test-Based Accountability in Education, Santa Monica, Calif.: RAND Corpora-tion, MR-1554-EDU, 2002.
Hanushek, E. A., “The Economics of Schooling: Production and Efficiency in Public Schools,” Journal of Economic Literature, Vol. 24, 1986, pp. 1141–1177.
———, “The Impact of Differential Expenditures on School Performance,” Educational Researcher, Vol. 18, No. 4, 1989, pp. 45–51.
———, The Trade-Off Between Child Quantity and Quality,” Journal of Political Economy, Vol. 100, 1992, pp. 84–117.
———, Making Schools Work: Improving Performance and Controlling Costs, Washington, D.C.: The Brookings Institution Press, 1994.
———, “Assessing the Effects of School Resources on Student Performance: An Update,” Educational Evaluation and Policy Analysis, Vol. 19, 1997, pp. 141–164.
Hanushek, E. A., J. F. Kain, and S. G. Rivkin, New Evidence About Brown v. Board of Education: The Complex Effects of School Racial Composition on Achievement, Palo Alto, Calif.: National Bureau of Economic Research, 2004.
Hauser, R. M., “Context and Consex: A Cautionary Tale,” American Journal of Sociology, Vol. 75, 1970, pp. 645–664.
———, “The Bell Curve,” Contemporary Sociology, Vol. 24, 1995, pp. 149–153.

References 149
Hauser, R. M., S. L. Tsai, and W. H. Sewell, “A Model of Stratification with Response Error in Social Psychological Variables,” Sociology of Education, Vol. 56, 1983, pp. 20–46.
Haveman, R., and B. Wolfe, Succeeding Generations: On the Effects of Invest-ments in Children, New York: Russell Sage Foundation, 1994.
Hedges, L. V., and A. Nowell, “Sex Differences in Mental Test Scores, Vari-ability, and Numbers of High-Scoring Individuals,” Science, Vol. 269, 1995, pp. 41–45.
———, “Black-White Test Score Convergence Since 1965,” in C. Jencks and M. Phillips, eds., The Black-White Test Score Gap, Washington, D.C.: The Brookings Institution Press, 1998, pp. 149–182.
———, “Changes in the Black-White Gap in Achievement Scores,” Sociology of Education, Vol. 72, No. 2, 1999, pp. 111–135.
Hedges, L. V., R. Laine, and R. Greenwald, “A Meta-Analysis of Studies of the Effects of Differential School Inputs on Student Outcomes,” Educa-tional Researcher, Vol. 23, No. 3, 1994, pp. 5–14.
Herrnstein, R. J., C. Murray, The Bell Curve: Intelligence and Class Structure in American Life, New York: Free Press, 1994.
Hetherington, E. M., K. Camara, and D. L. Featherman, Cognitive Per-formances, School Behavior, and Achievement of Children from One-Par-ent Households, Washington, D.C.: National Institute of Education, 1981.
Heubert, J. P., and R. M. Hauser, eds., High Stakes Testing for Tracking, Promo-tion, and Graduation, Washington, D.C.: National Academy Press, 1998.
Heyns, Barbara, “Social Selection and Stratification within Schools,” Ameri-can Journal of Sociology, Vol. 79, 1974, pp. 1434–1451.
Hill, M. A., and J. O’Neill, “Family Endowment and the Achievement of Young Children with Special Reference to the Underclass,” Journal of Human Resources, Vol. 29, 1994, pp. 1065–1100.
Hoffer, Thomas B., “The Effects of Ability Grouping in Middle School Sci-ence and Mathematic Students’ Achievement,” paper presented at the annual meeting of the American Sociological Association, Cincinatti, Ohio, 1991.
150 Examining Gaps in Mathematics Achievement Among Racial-Ethnic Groups
———, “Middle School Ability Grouping and Student Achievement in Sci-ence and Mathematics,” Educational Evaluation and Policy Analysis, Vol. 14, No. 3, 1992, pp. 205–227.
Hoffer, T. B., and W. Moore, High School Seniors’ Instructional Experiences in Science and Mathematics, Washington, D.C.: National Center for Educa-tion Statistics, 1996.
Hoffman, L. W., “Effects of Maternal Employment in the Two-Parent Fam-ily,” American Psychologist, Vol. 44, 1989, pp. 283–292.
Horan, P. M., “Is Status Attainment Research Atheoretical?” American Socio-logical Review, Vol. 43, 1978, pp. 534–541.
Hout, M., “Occupational Mobility of Black Men: 1962 to 1973,” American Sociological Review, Vol. 49, 1984, pp. 308–322.
Ingels, S. J., and J. Baldridge, National Educational Longitudinal Study of 1988: Conducting Trends Analyses of NLS-72, HS&B, and NELS:88 Seniors (Working Paper No. 95–05), Washington D.C.: National Center for Edu-cation Statistics, 1995.
Ingels, S. J., K. L. Dowd, J. Baldridge, J. L. Stipe, V. H. Bartot, and M. R. Frankel, National Education Longitudinal Study of 1988: Second Follow-Up: Student Component Data File User’s Manual (NCES 94–374), Wash-ington, D.C.: National Center for Education Statistics, 1994.
Jaynes, G. D., and R. M. Williams, A Common Destiny: Black and American Society. Washington, D.C.: National Academy Press, 1989.
Jencks, C., “How Much Do High School Students Learn?” Sociology of Edu-cation, Vol. 58, 1985, pp. 128–135.
———, Rethinking Social Policy: Race, Poverty, and the Underclass, Cam-bridge, Mass.: Harvard University Press, 1992.
Jencks, C. S., S. Bartlett, M. Corcoran, J. Crouse, D. Eaglesfield, G. Jackson, K. McClelland, P. Mueser, M. Olneck, J. Schwartz, S. Ward, and J. Wil-liams, Who Gets Ahead? The Determinants of Economic Success in America, New York: Basic Books, 1979.
Jencks, Christopher S., and Marsha Brown, “Effects of High Schools on Their Students,” Harvard Educational Review, Vol. 45, 1975, pp. 273–324.
Jencks, C., and M. Phillips, eds., The Black-White Test Score Gap, Washing-ton, D.C.: The Brookings Institution Press, 1998.

References 151
Jencks, C., M. Smith, H. Acland, H., M. Bane, D. Cohen, H. Gintis, B. Heyns, and S. Michelson, Inequality: A Reassessment of the Effect of Family and Schooling in America, New York: Basic Books, 1972.
Jones, C., M. Clark, G. Mooney, H. McWilliams, I. Crawford, B. Stephenson, and R. Tourangeau, High School and Beyond 1980 Sophomore Cohort: First Follow-Up: 1982 Data File User’s Manual, Washington, D.C.: National Center for Education Statistics, 1983.
Kahlenberg, R. D., Class, Race, and Affirmative Action, New York: Basic Books, 1996.
———, All Together Now: Creating Middle-Class Schools Through Public School Choice, Washington, D.C.: Brookings Institute Press, 2001.
Kane, T. J., “Racial and Ethnic Preferences in College Admissions,” in. C. Jencks and M. Phillips, eds., The Black-White Test Score Gap, Washington, D.C.: The Brookings Institution Press, 1998, pp. 431–456.
Karabel, J., and A. H. Halsey, eds., Power and Ideology in Education, New York: Oxford University Press, 1977.
Kerckhoff, A. C., “The Status Attainment Process: Socialization or Alloca-tion?” Social Forces, Vol. 55, 1976, pp. 368–381.
———, “Effects of Ability Grouping in British Secondary Schools,” Ameri-can Sociological Review, Vol. 51, 1986, pp. 842–858.
Klein, S., and L. Hamilton, Large-Scale Testing: Current Practices and New Directions. Santa Monica, Calif.: RAND Corporation, IP-182-EDU, 1999.
Kmenta, J., Elements of Econometrics, 2nd ed., New York: MacMillan, 1986.Kohn, M. L., and C. Schooler, Work and Personality: An Inquiry into the
Impact of Social Stratification, Norwood, N.J.: Ablex Publishing Corpora-tion, 1983.
Koretz, D. M., Trends in Educational Achievement, Washington, D.C.: Con-gressional Budget Office, 1986.
———, Educational Achievement: Explanations and Implications of Recent Trends, Washington, D.C.: Congressional Budget Office, 1987.
———, “What Happened to Test Scores, and Why?” Educational Measure-ment: Issues and Practice, Winter 1992, pp. 7–11.

152 Examining Gaps in Mathematics Achievement Among Racial-Ethnic Groups
Koretz, D. M., and M. Berends, Changes in High School Grading Standards in Mathematics, 1982–1992, Santa Monica, Calif.: RAND Corporation, MR-1445-CB, 2001.
Kreft, I., and J. De Leeuw, Introducing Multilevel Modeling, Thousand Oaks, Calif.: Sage Publications, 1998.
Krein, S. F., and A. H. Beller, “Educational Attainment of Children from Single-Parent Families: Differences by Exposure, Gender and Race,” Demography, Vol. 25, 1988, pp. 221–234.
Kulik, C. and J. Kulik. “Effects of Ability Grouping on Secondary School Studends: A Meta-Analysis of Evaluation Findings.” American Educational Research Journal, 19, pp. 415–528, 1982.
———, “ Effects of Ability Grouping on Student Achievement.” Equity and Excellence, 23, pp. 22–30, 1987.
Lankford, H., and J. Wyckoff, “Where Has the Money Gone? An Analysis of School District Spending in New York,” Educational Evaluation and Policy Analysis, Vol. 17, 1995, pp. 195–218.
Lareau, A., Home Advantage: Social Class and Parental Intervention in Elemen-tary Education, New York: The Falmer Press, 1989.
———, “Invisible Inequality: Social Class and Childrearing in Black Fami-lies and White Families,” American Sociological Review, Vol. 67, 2002, pp. 747–776.
Lee, V. E., and A. S. Bryk, “Curriculum Tracking as Mediating the Social Distribution of High School Achievement,” Sociology of Education, Vol. 61, 1988, pp. 78–94.
———, “A Multilevel Model of the Social Distribution of High School Achievement,” Sociology of Education, Vol. 52, 1989, pp. 172–192.
Lee, V. E., A. S. Bryk, and J. Smith, “The Organization of Effective Secondary Schools,” Review of Research in Education, Vol. 19, 1993, pp. 171–267.
Lee, V. E., R. G. Croninger, and J. B. Smith, “Course-Taking, Equity, and Mathematics Learning: Testing the Constrained Curriculum Hypothesis in U.S. Secondary Schools,” Educational Evaluation and Policy Analysis, Vol. 19, 1997, pp. 99–121.
Lee, V. E., and J. Smith, “Effects of School Restructuring on the Achievement and Engagement of Middle-Grade Students,” Sociology of Education, Vol. 66, 1993, pp. 164–187.

References 153
———, “High School Size: Which Works Best for Whom?” Educational Evaluation and Policy Analysis, Vol. 19, 1997, pp. 205–227.
Lindert, P. H., “Sibling Position and Achievement,” The Journal of Human Resources, Vol. 12, 1977, pp. 198–219.
Linn, R. L., and S. B. Dunbar, “The Nation’s Report Card Goes Home: Good News and Bad About Trends in Achievement,” Phi Delta Kappan, Vol. 72, No. 2, 1990, pp. 127–133.
Lord, F. M., “Evaluation with Artificial Data of a Procedure for Estimat-ing Ability and Item Characteristic Curve Parameters,” Research Bulletin, Princeton, N.J.: Educational Testing Service, 1975.
———, Applications of Item Response Theory to Practical Testing Problems, Hillsdale, N.J.: Erlbaum, 1980.
Lucas, S. R., Course-Based Indicators of Curricular Track Location, unpub-lished master’s thesis, Department of Sociology, University of Wisconsin-Madison, 1990.
———, “Prominent Explanations and Potential Prominent Factors in the Black/White Test Score Gap,” paper presented at the Workshop on the Role of Tests in Higher Education Admissions, a National Research Coun-cil Workshop sponsored by the Board on Testing and Assessment and the Office of Scientific and Engineering Personnel, Washington, D.C., 1998.
———, Tracking Inequality: Stratification and Mobility in American High Schools, New York: Teachers College Press, 1999.
———, “Effectively Maintained Inequality: Education Transitions, Track Mobility, and Social Background Effects,” American Journal of Sociology, Vol. 106, 2001, pp. 1642–1690.
Lucas, S. R., and M. Berends, “Sociodemographic Diversity, Correlated Achievement and de facto Tracking,” Sociology of Education, Vol. 75, 2002, pp. 328–348.
Lucas, S. R., and A. Gamoran, “Track Assignment and the Black-White Test Score Gap: Divergent and Convergent Evidence from 1980 and 1990 Sophomores,” invited paper presented at the Brookings Institution, Wash-ington, D.C., 2001.
Lucas, S. R., A. D. Good, “Race, Class, and Tournament Track Mobility,” Sociology of Education, Vol. 74, 2001, pp. 139–156.

154 Examining Gaps in Mathematics Achievement Among Racial-Ethnic Groups
McCarthy, C., Race and Curriculum: Social Inequality and the Theories and Politics of Difference in Contemporary Research on Schooling, London: The Falmer Press, 1990.
McCarthy, K. F., G. Vernez, Immigration in a Changing Economy: California’s Experience, Santa Monica, Calif.: RAND Corporation, MR-845-OSD/CBR/FF/WFHF/IF/AMF 1997.
McDonnell, L. M., P. T. Hill, Newcomers in American Schools: Meeting the Educational Needs of Immigrant Youth, Santa Monica, Calif.: RAND Cor-poration, MR-103-AWM/PRIP, 1993.
McLanahan, S., and G. Sandefur, Growing Up with a Single Parent: What Hurts, What Helps, Cambridge, Mass.: Harvard University Press, 1994.
Mahard, R. E., and R. L. Crain, “Research on Minority Achievement in Desegregated Schools,” in C. H. Rossell and W. D. Hawley, eds., The Con-sequences of School Desegregation, Philadelphia: Temple University, 1983, pp. 103–105.
Manski, C. F., “Identification Problems in the Social Sciences,” Sociological Methodology, Vol. 23, 1994, pp. 1–56.
Mayer, S. E., “How Much Does a High School’s Racial and Socioeconomic Mix Affect Graduation and Teenage Fertility Rates?” in C. Jencks and P. E. Peterson, eds., The Urban Underclass, Washington, D.C.: The Brookings Institution Press, 1991, pp. 321–341.
———, “Measuring Instructional Practice: Can Policymakers Trust Survey Data?” Educational Evaluation and Policy Analysis, Vol. 21, No. 1, 1999, pp. 29–45.
Mayer, S., and C. Jencks, “Growing Up in Poor Neighborhoods: How Much Does It Matter?” Science, Vol. 17, 1989, pp. 1441–1445.
Menaghan, E. G., and T. L. Parcel, “Determining Children’s Home Envi-ronments: The Impact of Maternal Characteristics and Current Occupa-tional and Family Conditions,” Journal of Marriage and the Family, Vol. 53, 1991, pp. 417–431.
Metz, M. H., Classrooms and Corridors: The Crisis of Authority in Desegregated Secondary Schools, Berkeley, Calif.: University of California Press, 1978.
Mickleson, R. A., “Why Does Jane Read and Write So Well? The Anomaly of Women’s Achievement,” Sociology of Education, Vol. 61, 1989, pp. 47–63.

References 155
Milne, A. M., D. E. Mayers, A. Rosenthal, and A. Ginsburg, “Single Parents, Working Mothers, and the Educational Achievement of School Children,” Sociology of Education, Vol. 5, 1986, pp. 125–139.
Moore, D. R., and S. Davenport, The New Improved Sorting Machine, Madi-son, Wisc.: National Center on Effective Secondary Schools, 1988.
Mulkey, L. M., R. L. Crain, and A. J. C. Harrington, “One-Parent House-holds and Achievement: Economic and Behavioral Explanations of a Small Effect,” Sociology of Education, Vol. 65, 1992, pp. 48–65.
Murray, C., and R. J. Herrnstein, “What’s Really Behind the SAT-Score Decline?” Public Interest, Vol. 106, 1992, pp. 32–56.
National Science Board, Science and Engineering Indicators 2000 (NSB-00-1), Arlington, Va.: National Science Foundation, 2002.
Natriello, G., E. L. McDill, and A. M. Pallas, Schooling Disadvantaged Chil-dren: Racing Against Catastrophe, New York: Teachers College Press, 1990.
Natriello, G., A. Pallas, K. L. Alexander, “On the Right Track? Curriculum and Academic Achievement,” Sociology of Education, Vol. 62, 1989, pp. 109–118.
Neisser, U., ed., The Rising Curve: Long-Term Gains in IQ and Related Mea-sures, Washington, D.C.: American Psychological Association, 1998.
Newmann, F. M., “Reducing Student Alienation in High Schools: Implica-tions of Theory,” Harvard Educational Review, Vol. 51, 1981, pp. 546–564.
Oakes, J. “Tracking Policies and Practices: School by School Summaries: A Study of Schooling in the United States,” Technical Report Series Number 25, Los Angeles, Calif.: University of California at Los Angeles Graduate School of Education, 1981.
———, Keeping Track: How Schools Structure Inequality, New Haven, Conn.: Yale University Press, 1985.
———, Multiplying Inequalities: The Effects of Race, Social Class, and Tracking on Opportunities to Learn Mathematics and Science, Santa Monica, Calif.: RAND Corporation, R-3928, 1990.
———, “More than Misapplied Technology: A Normative and Political Response to Hallinan on Tracking,” Sociology of Education, Vol. 67, 1994, pp. 84–89, 91.

156 Examining Gaps in Mathematics Achievement Among Racial-Ethnic Groups
Oakes, J., A. Gamoran, and R. Page, “Curriculum Differentiation: Oppor-tunities, Outcomes, and Meanings,” in P. W. Jackson, ed., Handbook of Research on Curriculum, New York: Macmillan, 1992, pp. 570–608.
Oaxaca, R., “Male-Female Wage Differentials in Urban Labor Markets,” International Economic Review, Vol. 14, 1970, pp. 693–709.
Ogbu, J., Minority Education and Caste: The American System in Cross-Cul-tural Perspective, New York: Academic Press, 1979.
———, “The Individual in Collective Adaptation: A Framework for Focus-ing on Academic Underperformance and Dropping Out Among Invol-untary Minorities,” in L. Weis, E. Farrar, and H. G. Petrie, eds., Dropouts from Schools: Issues, Dilemmas and Solutions, Buffalo, N.Y.: State University of New York Press, 1989, pp. 181–204.
———, “Understanding Cultural Diversity and Learning,” Educational Researcher, Vol. 21, No. 8, 1992, pp. 5–14, 24.
Oliver, M. L., T. M. Shapiro, Black Wealth/White Wealth: A New Perspective on Racial Inequality, New York: Routledge, 1995.
Omi, M., and H. Winant, Racial Formation in the United States from the 1960s to the 1990s, New York: Routledge, 1994.
Orfield, G., Schools More Separate: Consequences of a Decade of Resegrega-tion, Cambridge, Mass.: Harvard Civil Rights Project, Harvard University, 2001.
Orfield, G., and J. T. Yun, Resegregation in American Schools, Cambridge, Mass.: Harvard Civil Rights Project, Harvard University, 1999.
Parcel, T. L., and E. G. Menaghan, “Maternal Working Conditions and Children’s Verbal Facility: Studying the Intergenerational Transmission of Inequality from Mothers to Young Children,” Social Psychology Quarterly, Vol. 53, 1990, pp. 132–147.
Pellegrino, J. W., L. R. Jones, and K. J. Mitchell, eds., Grading the Nation’s Report Card: Evaluating NAEP and Transforming the Assessment of Educa-tional Progress, Washington, D.C.: National Academy Press, 1998.
Phillips, M., “How to Improve Our Understanding of Ethnic Differences in Academic Achievement: Empirical Lessons from National Data,” paper presented at the conference Analytic Issues in the Assessment of Student Achievement, sponsored by the National Center for Education Statistics in Washington, D.C., 1998.

References 157
Phillips, M., J. Brooks-Gunn, G. J. Duncan, P. Klebanov, and J. Crane, “Family Background, Parenting Practices, and the Black-White Test Score Gap,” in C. Jencks and M. Phillips, eds., The Black-White Test Score Gap, Washington, D.C.: The Brookings Institution Press, 1998, pp. 103–145.
Phillips, M., J. Crouse, and J. Ralph, “Does the Black-White Test Score Gap Widen After Children Enter School?” in C. Jencks and M. Phillips, eds., The Black-White Test Score Gap, Washington, D.C.: The Brookings Institu-tion Press, 1998, pp. 229–272.
Plomin, R., Development, Genetics, and Psychology, Hillsdale, N.J.: Laurence Erlbaum, 1986.
Popenoe, D., Disturbing the Nest: Family Change and Decline in Modern Soci-eties, New York: Aldine de Gruyter, 1988.
———, “American Family Decline, 1960–1990: A Review and Appraisal,” Journal of Marriage and the Family, Vol. 55, 1993, pp. 527–555.
———, Life Without Fathers: Compelling New Evidence That Fatherhood and Marriage are Indispensable for the Good of Children and Society, New York: Free Press, 1996.
Porter, A. C., “Prospects for School Reform and Closing the Achievement Gap,” in C. A. Dwyer, ed., Measurement and Research in the Accountability Era, Mahway, N.J.: Lawrence Erlbaum Associates, forthcoming.
———, “Measuring the Content of Instruction: Uses in Research and Prac-tice,” Educational Researcher, Vol. 31, No. 7, 2002, pp. 3–14.
Porter, A. C., M. W. Kirst, E. J. Osthoff, J. S. Smithson, and S. A. Schneider, Reform Up Close: An Analysis of High School Mathematics and Science Class-rooms, Final Report to the National Science Foundation on Grant No. SPA-8953446 to the Consortium for Policy Research in Education, Madi-son, Wisc.: Wisconsin Center for Education Research, 1993.
Portes, A., “Social Capital: Its Origins and Applications in Modern Sociol-ogy,” Annual Review of Sociology, Vol. 24, 1998, pp. 1–24.
Rasinski, K. A., S. J. Ingels, D. A. Rock, and J. M. Pollack, America’s High School Sophomores: A Ten-Year Comparison 1980–1990, Washington D.C.: National Center for Education Statistics, 1993.
Raudenbush, S. W., “Synthesizing Results from the Trial State Assessment,” paper presented at the conference, Analytic Issues in the Assessment of

158 Examining Gaps in Mathematics Achievement Among Racial-Ethnic Groups
Student Achievement, sponsored by the National Center for Education Statistics in Washington, D.C., 1998.
Raudenbush, S. W., and A. S. Bryk, Hierarchical Linear Models: Applications and Data Analysis Methods, 2nd ed., Thousand Oaks, Calif.: Sage Publica-tions, 2002.
Riccobono, J., L. B. Henderson, G. J. Burkheimer, C. Place, and J. R. Levinsohn, National Longitudinal Study: Base Year (1972) Through Fourth Follow-Up (1979): Data File User’s Manual, Washington, D.C.: National Center for Education Statistics, 1981.
Rock, D. A., R. B. Ekstrom, M. E. Goertz, T. L. Hilton, and J. Pollack, Fac-tors Associated with Decline of Test Scores of High School Seniors, 1972 to 1980 (NCES 85–218), Princeton, N.J.: Educational Testing Service, 1985.
Rock, D. A., T. L. Hilton, J. Pollack, R. B. Ekstrom, and M. E. Goertz, Psy-chometric Analysis of the NLS and the High School and Beyond Test Batteries, Washington D.C.: National Center for Education Statistics, 1985.
Rock, D. A., and J. M. Pollack, Psychometric Report for the NELS:88 Base Year Through Second Follow-Up, Washington D.C.: National Center for Educa-tion Statistics, 1995.
Rose, L. C., and A. M. Gallup, “The 30th Annual Phi Delta Kappa/Gallup Poll of the Public’s Attitudes Toward the Public Schools,” Phi Delta Kap-pan, Vol. 80, 1998, pp. 41–56.
Rosenbaum, J. E., Making Inequality, New York: Wiley, 1976.———, “Track Misperceptions and Frustrated College Plans: An Analysis of
the Effects of Tracks and Track Perceptions in the National Longitudinal Survey,” Sociology of Education, Vol. 53, 1980, pp. 74–88.
Rothstein, R., and K. H. Miles, Where’s the Money Gone? Changes in the Level and Composition of Education Spending, Washington, D.C.: Economic Policy Institute, 1995.
Rowan, B., “What Large-Scale Survey Research Tells Us About Teacher Effects on Student Achievement,” unpublished manuscript, Study of Instructional Improvement, School of Education, University of Michigan, 2001.
Rutter, M., Studies of Psychosocial Risk: The Power of Longitudinal Data, Cam-bridge, UK: Cambridge University Press, 1988.
———, “Nature, Nurture, and Development: From Evangelism Through Science Toward Policy and Practice,” Child Development, Vol. 73, No. 1, 2002, pp. 1–21.

References 159
Sahling, L. G., and S. P. Smith, “Regional Wage Differentials: Has the South Risen Again?” Review of Economics and Statistics, Vol. 65, 1983, pp. 131–135.
Sander, W., “Catholic Grade Schools and Academic Achievement,” The Jour-nal of Human Resources, Vol. 31, No. 3, 1996, pp. 540–548.
Sander, W., and A. C. Krautmann, “Catholic Schools, Dropout Rates and Educational Attainment,” Economic Inquiry, Vol. 33, 1995, pp. 217–233.
Scheerens, J., and R. Bosker, The Foundations of Educational Effectiveness, New York: Pergamon, 1997.
Schneider, B., and J. S. Coleman, eds., Resources and Actions: Parents, Their Children and Schools, Boulder, Colo.: Westview, 1993.
Schultz, A., “Investment in Human Capital,” American Economic Review, Vol. 51, 1961, pp. 1–17.
Seccombe, K., “‘Beating the Odds’ Versus ‘Changing the Odds’; Poverty, Resilience, and Family Policy,” Journal of Marriage and Family, Vol. 64, 2002, pp. 384–394.
Sewell, W. H., A. O. Haller, and G. W. Ohlendorf, “The Educational and Early Occupational Status Attainment Process: Replication and Revi-sion,” American Sociological Review, Vol. 35, 1970, pp. 1014–1027.
Sewell, W. H., A. O. Haller, and A. Portes, “The Educational and Early Occupational Attainment Process,” American Sociological Review, Vol. 34, 1969, pp. 82–92.
Sewell, W. H., and R. M. Hauser, Education, Occupation, and Earnings: Achievement in the Early Career, New York: Academic Press, 1975.
Sewell, W. H., R. M. Hauser, K. W. Springer, and T. S. Hauser, “As We Age: The Wisconsin Longitudinal Study, 1957–2001,” in K. Leicht, ed., Research in Social Stratification and Mobility, Greenwich, Conn.: JAI Press, forthcoming.
Sewell, W. H., R. M. Hauser, and W. C. Wolf, “Sex, Schooling and Occu-pational Status,” American Journal of Sociology, Vol. 86, 1980, pp. 551–583.
Shavit, Y., and D. L. Featherman, “Schooling, Tracking, and Teenage Intel-ligence,” Sociology of Education, Vol. 61, 1988, pp. 42–51.
Singer, J. D., “Using SAS PROC MIXED to Fit Multilevel Models, Hierar-chical Models, and Individual Growth Models,” Journal of Educational and Behavioral Statistics, Vol. 24, No. 4, 1998, pp. 323–355.

160 Examining Gaps in Mathematics Achievement Among Racial-Ethnic Groups
Slavin, R. E., “Ability Grouping and Student Achievement in Elementary Schools: A Best-Evidence Synthesis,” Review of Educational Research, Vol. 57, 1987, pp. 293–336.
———, “Achievement Effects of Ability Grouping in Secondary Schools: A Best-Evidence Synthesis,” Review of Educational Research, Vol. 60, 1990, pp. 471–499.
Smith, J., Unequal Wealth and Incentives to Save, Santa Monica, Calif.: RAND Corporation, DB-145-RC, 1995.
Smith, M. S., and J. A. O’Day, “Educational Equality: 1966 and Now,” in D. A. Verstegen and J. G. Ward, eds., The 1990 American Education Finance Association Yearbook: Spheres of Justice in Education, Washington, D.C.: American Education Finance Association, 1991a.
———, “Equality in Education: Progress, Problems And Possibilities,” Con-sortium for Policy Research in Education Policy Brief (RB-007–6/91), University of Pennsylvania, Philadelphia, 1991b.
Snijders, R., R. Bosker, Multilevel Analysis, London: Sage Publications, 1999.
Sørensen, A. B., and M. T. Hallinan, “A Reconceptualization of School Effects,” Sociology of Education, Vol. 43, 1977, pp. 273–289.
Sørensen, A. B., and S. L. Morgan, “School Effects: Theoretical and Method-ological Issues,” in M. T. Hallinan, ed., Handbook of Research in the Sociol-ogy of Education, New York: Kluwer Academic Press, 2000, pp. 137–160.
Stacey, J., “Good Riddance to ‘The Family’: A Response to David Popenoe,” Journal of Marriage and the Family, Vol. 55, 1993, pp. 545–547.
Stanton-Salazar, R. D., Manufacturing Hope and Despair: The School and Kin Support Networks of U.S.-Mexican Youth, New York: Teachers College Press, 2001.
Stanton-Salazar, R. D., and S. M. Dornbusch, “Social Capital and the Repro-duction of Inequality: Information Networks Among Mexican-Origin High School Students,” Sociology of Education, Vol. 58, 1995, pp. 116–135.
Steele, C. M., and J. Aronson, “Stereotype Threat and the Test Performance of Academically Successful African Americans,” in C. Jencks and M. Phil-lips, eds., The Black-White Test Score Gap, Washington D.C.: The Brook-ings Institution Press, 1998, pp. 401–427.

References 161
Steinberg, L., Beyond the Classroom: Why School Reform Has Failed and What Parents Need to Do, New York: Simon and Schuster, 1996.
Steinberg, L. B., B. Brown, M. Cider, N. Kaczmarek, and C. Lazzaro, “Non-instructional Influences on High School Student Achievement: The Contributions Of Parents, Peers, Extracurricular Activities, and Part-Time Work,” paper prepared for the National Center on Effective Secondary Schools, University of Wisconsin-Madison, 1988.
Steinberg, L., J. D. Elmen, and N. Mounts, “Authoritative Parenting, Psy-chosocial Maturity, and Academic Success Among Adolescents,” Child Development, Vol. 60, 1989, pp. 1424–1435.
Steinkamp, M. W., and M. L. Maehr, “Gender Differences in Motivational Orientation Toward Achievement in School Science: A Quantitative Syn-thesis,” American Educational Research Journal, Vol. 21, 1984, pp. 39–59.
Stevenson, D. L., and D. P. Baker, “The Family-School Relation and the Child’s School Performance,” Child Development, Vol. 58, 1987, pp. 1348–1357.
Swaminathan, H., and J. A. Gifford, “Bayesian Estimation in the Three-Parameter Logistic Model,” Psychometrika, Vol. 51, 1986, pp. 589–601.
Thissen, D. M., H. Wainer, “Some Supporting Evidence for Lord’s Guideline for Estimating ‘c,’” Research Bulletin 85–57, Princeton, N.J.: Educational Testing Service, 1985.
Turnbull, B., M. Welsh, C. Heid, W. Davis, and A. C. The Longitudinal Evaluation of School Change and Performance (LESCP) in Title I Schools: Interim Report to Congress, Washington, D.C.: Policy Studies Associates/Westat, 1999.
———, The Longitudinal Evaluation of School Change and Performance (LESCP) in Title I Schools: Final Report, Washington, D.C.: Policy Stud-ies Associates/Westat, 2001.
Tyack, D., and L. Cuban, Tinkering Toward Utopia: A Century of Public School Reform, Cambridge, Mass.: Harvard University Press, 1995.
Uhlenberg, P., and D. Eggebeen, “The Declining Well-Being of American Adolescents,” The Public Interest, Vol. 82, 1986, pp. 25–38.
U.S. Census Bureau, Poverty in the United States: 2000, in Current Popula-tion Reports (Series No. P60–214), Washington, D.C.: U.S. Government Printing Office, 2001.

162 Examining Gaps in Mathematics Achievement Among Racial-Ethnic Groups
U.S. Department of Education, The Condition of Education, 2000, Washing-ton, D.C.: U.S. Department of Education, 2000.
———, High Standards for All Students: A Report from the National Assess-ment of Title I on Progress and Challenges Since the 1994 Reauthorization, Washington, D.C.: U.S. Department of Education, 2001.
———, Digest of Education Statistics, 2001, Washington, D.C.: U.S. Depart-ment of Education, 2002.
Vanfossen, Beth E., James D. Jones, and Joan Z. Spade, “Curriculum Track-ing and Status Maintenance,” Sociology of Education, Vol. 60, 1987, pp. 104–122.
Vernez, G., and A. Abrahams, How Immigrants Fare in U.S. Education, Santa Monica, Calif.: RAND Corporation, 1996.
Vernez, G., R. A. Krop, and C. P. Rydell, Closing the Education Gap: Benefits and Costs, Santa Monica, Calif.: RAND Corporation, MR-1036-EDU, 1999.
Wells, A. S., and R. L. Crain, “Perpetuation Theory and the Long-Term Effects of School Desegregation,” Review of Educational Research, Vol. 64, No. 4, 1994, pp. 531–555.
Willie, C. V., “The Inclining Significance of Race,” Society, Vol. 15, No. 5, 1978, pp. .
Wilson, A. B., “Residential Segregation of Social Classes and Aspirations of High School Boys,” American Sociological Review, Vol. 24, 1959, pp. 836–845.
Wilson, W. J., The Declining Significance of Race: Blacks and Changing Ameri-can Institutions, Chicago: The University of Chicago Press, 1978a.
———, “The Declining Significance of Race: Revisited but Not Revisited,” Society, Vol. 15, No. 5, 1978b, pp. .
———, The Truly Disadvantaged: The Inner City, the Underclass, and Public Policy, Chicago: The University of Chicago Press, 1987.
———, “Studying Inner-City Social Dislocations: The Challenge of Public Agenda Research,” American Sociological Review, Vol. 56, 1991, pp. 1–14.
———, “The Underclass: Issues, Perspectives, and Public Policy,” In W. J. Wilson, ed., The Ghetto Underclass: Social Science Perspectives, Newbury Park, : Sage, 1993, pp. 1–24.

References 163
———, “The Role of Environment in the Black-White Test Score Gap,” in C. Jencks and M. Phillips, eds., The Black-White Test Score Gap, Washing-ton, D.C.: The Brookings Institution Press, 1998, pp. 501–510.
———, The Bridge over the Racial Divide: Rising Inequality and Coalition Politics, Berkeley, Calif.: University of California Press, 1999.
Zill, N., and C. C. Rogers, “Recent Trends in the Well-Being of Children in the United States and Their Implications for Public Policy,” in A. J. Cherlin, ed., The Changing American Family and Public Policy, Washing-ton, D.C.: The Urban Institute Press, 1988, pp. 31–115.
Zimmer, R., R. Buddin, D. Chau, B. Gill, C. Guarino, L. Hamilton, C. Krop, D. McCaffrey, M. Sandler, and D. Brewer, Charter School Opera-tions and Performance: Evidence from California, Santa Monica, Calif.: RAND Corporation, MR-1700-EDU, 2003.
Zimowski, M. F., M. Eiji, R. J. Mislevy, and R. D. Bock, BILOG-MG: Mul-tiple-Group IRT Analysis and Test Maintenance for Binary Items, Chicago: Scientific Software International, Inc., 1996.