Changing Hispanic demographics: challenges in natural resource management

Closing the Gap? A Comparison of Changes Over Time in White-Black and White-Hispanic Achievement Gaps
on State Assessments Versus State NAEP
CSE Report 721
Varick Erickson, Andrew Ho, Deborah Holtzman, Andrew Jaciw,
Brian Lukoff, Xuejun Shen, Xin Wei, and Edward Haertel Stanford University
June 2007
National Center for Research on Evaluation, Standards, and Student Testing (CRESST)
Center for the Study of Evaluation Graduate School of Education and Information Studies
University of California, Los Angeles GSEIS Bldg., Box 951522
Los Angeles, CA 90095-1522 (310) 206-1532

Copyright © 2007 The Regents of the University of California
The work reported herein was supported under the Educational Research and Development Centers Program, PR/Award Number R305B960002, as administered by the Institute of Education Sciences (IES), U.S. Department of Education.
The findings and opinions expressed in this report are those of the author(s) and do not necessarily reflect the positions or policies of the National Center for Education Research, the Institute of Education Sciences (IES), or the U.S. Department of Education.

1
CLOSING THE GAP? A COMPARISON OF CHANGES OVER TIME IN WHITE-
BLACK AND WHITE-HISPANIC ACHIEVEMENT GAPS ON STATE
ASSESSMENTS VERSUS STATE NAEP
Varick Erickson, Andrew Ho, Deborah Holtzman, Andrew Jaciw,
Brian Lukoff, Xuejun Shen, Xin Wei, and Edward Haertel1
Stanford University
Abstract
When a state test and National Assessment of Educational Progress (NAEP) are both
measuring the same construct, the achievement gaps between subgroups on both tests should
be the same. However, if a teacher or school engages in “teaching to the test” then student
performance may improve on one test but not on another. We hypothesized that teaching to
the test could have consequences for changes in achievement gaps over time because, for a
variety of reasons, students in low-achieving schools or classrooms may be more likely to
receive instruction narrowly focused on increasing their test scores. Our analysis proceeded by
examining (at the state level) gaps between White students (the “reference” group) and either
Black or Hispanic students (a “focal” group). The clearest conclusion from our state-by-state
analyses of state and NAEP test data is that the pattern of gap changes varies widely both
between and within states. Further, gap changes came in a variety of forms, and not all types of
gap reduction are equally desirable.
Introduction
In comparison to the “low stakes” of the National Assessment of Educational Progress (NAEP), a test intended to serve as a statewide or nationwide report of the academic progress of American students (National Center for Education Statistics, 2006), states have in place testing programs that may be considered to be “high stakes” because they have implications for individual students, teachers, and/or schools.
1 The first seven authors are listed alphabetically, not by order of contribution.
2
When a state test and NAEP are both measuring the same construct, the achievement gaps between subgroups on both tests should be the same. However, if a teacher or school engages in “teaching to the test”—coaching students to obtain a high score on one particular test instead of helping students to gain more generalizable knowledge or understanding about the subject matter—then student performance may improve on one test but not on another. When the state test has high stakes, teachers might teach to the high-stakes state test and give less attention to content or techniques that would lead to a high score on the low-stakes NAEP.
We hypothesized that teaching to the test could have consequences for changes in achievement gaps over time because, for a variety of reasons, students in low-achieving schools or classrooms may be more likely to receive instruction narrowly focused on increasing their test scores. Factors contributing to such a pattern would include more ambitious growth expectations as low-achieving schools are expected to "catch up" under high-stakes testing regimes; teachers who are on average less experienced (with a smaller repertoire of instructional approaches); and lower levels of additional instructional resources required to support a broad and rich curriculum (Raudenbush, Fotiu, & Cheong, 1998). To the extent that teachers focus on the high-stakes state test, their students’ test scores on that test may increase relatively more than on the corresponding low-stakes NAEP. Students in low-achieving classrooms are more likely to be poor and a higher proportion of them are likely to be students of color. We thus expected to see Black-White and Hispanic-White achievement gaps shrink over time on state tests more so than on NAEP. State and NAEP test data, disaggregated by ethnicity, are readily available for many states, and since students of different ethnicities tend to have differing levels of poverty, achievement, and access to school resources, we used ethnicity as a proxy for this constellation of factors in order to test our hypothesis. Thus, this report analyzes gaps in test performance between ethnic subgroups and how these gaps change over time, using both NAEP and state test data. Two reports that analyze similar questions with a different set of methodological tools that serve as useful comparison points to this work are the pair of reports by McLaughlin, Bandeira de Mello, Blankenship, Chaney, Hikawa, William, & Wolman (2004, under review).
Methodology
Our analysis proceeded by examining (at the state level) gaps between White students (the “reference” group) and either Black or Hispanic students (a “focal”
3
group). While the ethnicity of the focal group changed from state to state due to varying sizes of minority groups in each state, we assumed that in general either Black or Hispanic students would tend to be in lower-resource classrooms while White students would tend to be in higher-resource classrooms. The following section describes the procedure by which we selected the six states that we use in our analysis. One important problem in comparing test score gaps across different tests (state tests and NAEP) is that scores for each test are reported on different scales, and it is not obvious how to compare gaps across different tests. We thus adopted a metric-free methodology (Ho & Haertel, 2006) that allowed us to compare different test score gaps over time between state tests and NAEP. The section entitled metric-free techniques briefly describes the metric-free techniques that we used; Ho & Haertel (2006) contains a more definitive account of these techniques.
Collection of State and NAEP Test Data
Gap analyses using the metric-free technique are based on percentages of focal and reference groups scoring at or below certain common score cut points. We collected these data from a variety of statewide assessments in addition to collecting data from NAEP. State assessment data are most readily available in the performance level format as it has become commonplace to reference student performances to judgmentally determined performance standards and associated cut scores. In particular, the No Child Left Behind Act of 2001 (NCLB; Pub. L. No. 107-110) requires each state to define such performance levels for their assessment programs. Fourth- and eighth-grade NAEP reading assessment results (disaggregated by state) were available from 1992, 1994, 1998, 2002, and 2003; math results were available from 1990, 1992, 1996, 2000, and 2003. The NAEP data were retrieved from the NAEP data tool web site.2 The state assessment data were collected in 2003. Each state’s Department of Education (DOE) web site was searched for state testing data that matched the year, subject, and grade level of the NAEP data, and was reported separately for ethnic groups within the state.
The search of the state DOE websites indicated that there was at least one statewide assessment program in place in each state. The earliest available state assessment results that were compatible with the NAEP data were for 1998 in reading and 1996 in math. Each state assessment administration was characterized by the state,
2 The NAEP Data Tool has since been replaced by the NAEP Data Explorer; to our knowledge, the original web tool that we used to retrieve the data is no longer available. However, the same data are obtainable using the NAEP Data Explorer.

4
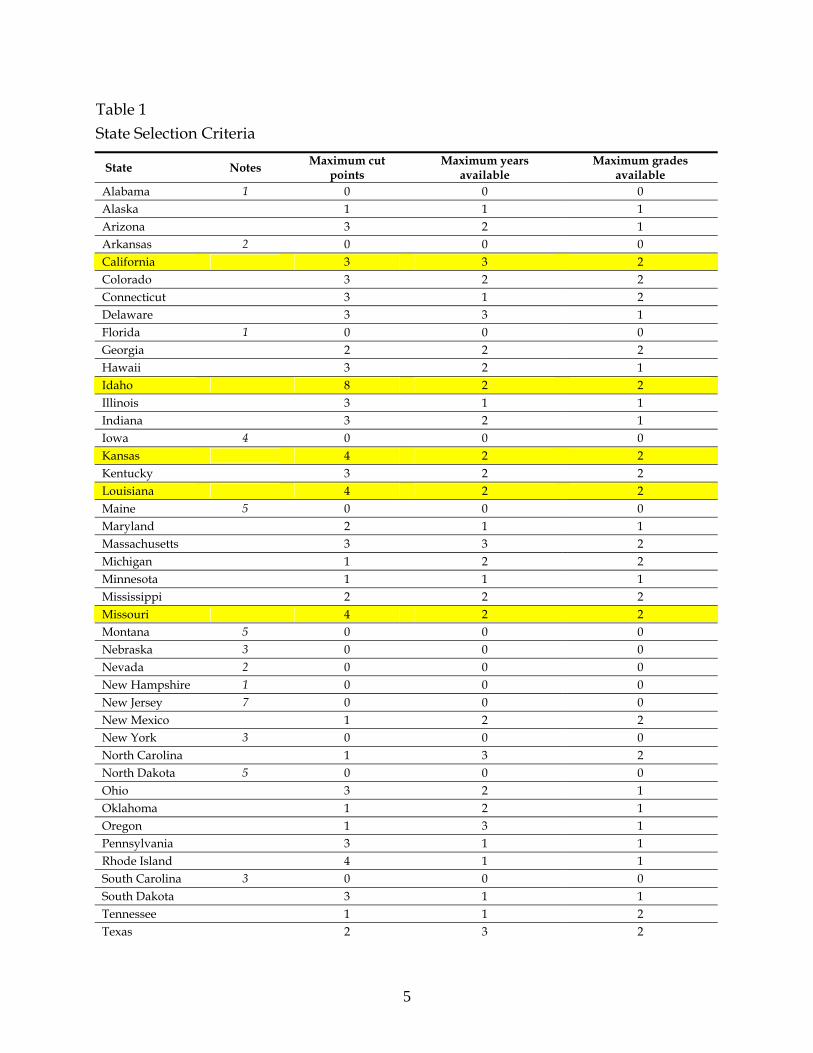
assessment name, year in which the assessment was given, grade level, and ethnic group (either Black, Hispanic or White). The final 251 state data entries were collected from 34 of the 50 states. Three of the 16 remaining states administered their state tests to grades other than those for which NAEP data was available (fourth or eighth grade); 8 of them did not report state-level assessment data by ethnicity, year, and grade on their DOE websites; and although the remaining 5 states had one or more eligible assessment data entries, either NAEP did not cover the state in that year or the number of minority students in the tested sample was too low to make a reliable estimate of the performance of the minority student population in that state. Specific reasons for the lack of data in each of the 16 states are listed in Table 1.
Also included in Table 1 are the features of the assessment data for the states from which one or more data entries were available for analysis. The “Maximum cut points” column indicates maximum number of performance level cut points by which the assessment data were reported, the “maximum years available” column indicates the maximum years of data available for a subject area (reading or math), and the “maximum grades available” column indicates the maximum number of grade level(s) (1 or 2, corresponding to fourth grade, eighth grade, or both) available for a cross-sectional set of data.
Since the reliability of the estimation of the entire score distribution increases with the number of cut points, we applied the metric-free techniques only to states where there were at least 4 cut points available. (Despite the fact that only 3 cut points were available for California, we included it in our analysis because of the local relevance.) Of course, since we were interested in gap changes over time, we only included in our analysis states where data were available over at least two time points. These criteria reduced our analysis to six states (which are highlighted in Table 1): California, Idaho, Kansas, Louisiana, Missouri, and Wisconsin. In this report we present case studies from each of these six states.
5
Table 1 State Selection Criteria
State Notes Maximum cut points
Maximum years available
Maximum grades available
Alabama 1 0 0 0 Alaska 1 1 1 Arizona 3 2 1 Arkansas 2 0 0 0 California 3 3 2 Colorado 3 2 2 Connecticut 3 1 2 Delaware 3 3 1 Florida 1 0 0 0 Georgia 2 2 2 Hawaii 3 2 1 Idaho 8 2 2 Illinois 3 1 1 Indiana 3 2 1 Iowa 4 0 0 0 Kansas 4 2 2 Kentucky 3 2 2 Louisiana 4 2 2 Maine 5 0 0 0 Maryland 2 1 1 Massachusetts 3 3 2 Michigan 1 2 2 Minnesota 1 1 1 Mississippi 2 2 2 Missouri 4 2 2 Montana 5 0 0 0 Nebraska 3 0 0 0 Nevada 2 0 0 0 New Hampshire 1 0 0 0 New Jersey 7 0 0 0 New Mexico 1 2 2 New York 3 0 0 0 North Carolina 1 3 2 North Dakota 5 0 0 0 Ohio 3 2 1 Oklahoma 1 2 1 Oregon 1 3 1 Pennsylvania 3 1 1 Rhode Island 4 1 1 South Carolina 3 0 0 0 South Dakota 3 1 1 Tennessee 1 1 2 Texas 2 3 2

6
Table 1 continued:
Utah 2 0 0 0 Vermont 5 0 0 0 Virginia 3 2 1 Washington 3 3 1 West Virginia 6 0 0 0 Wisconsin 5 2 2 Wyoming 1 2 2 Notes: 1. State test grades mismatched with NAEP grades 2. Ethnically disaggregated data unavailable 3. Grades combined for ethnically disaggregated data (e.g., reported in elementary/secondary level) 4. Racially disaggregated results are only reported in biennium periods 5. No NAEP/state Black or Hispanic student data available due to small minority population 6. Test results were reported at the school level only 7. State data mismatched with state NAEP years
Metric-free techniques
In this report we make use of a variety of “metric-free” methods for comparing gaps between tests. For any two subgroups (in this report, one subgroup always consists of White students and the other consists of either Black or Hispanic students), a PP plot is a metric-free way to plot the gap between two subgroups on a particular test. If the point (x, y) is plotted, then x% of students in the first subgroup are below the yth percentile of the second subgroup. The PP plot always contains the points (0%, 0%) and (100%, 100%); the entire plot is a continuous curve between these two points. If there is no score gap, then the PP plot will consist of all points along the diagonal y = x. If the curve is completely above or completely below the diagonal, then we can be sure that there is a gap in one direction or the other (i.e., one subgroup scores consistently better than the other subgroup, at each performance level). However, if the curve crosses the diagonal, then the first subgroup may outperform the second subgroup at some performance levels while the reverse happens at other performance levels.
The data available to us from the six states analyzed in this report were in the form of median (or mean) scores as well as the percentages of students from different subgroups that scored below certain score cut points. Each cut point can be used to plot a single point of a PP plot; the rest of the PP plot was filled out using a Bezier interpolation procedure which attempts to connect the discrete points with a smooth curve. As described above in Section 2.1, we only selected states for analysis where enough data were available to make us confident that this interpolation procedure would produce a fairly accurate curve.

7
The PD plot is essentially a rotation and scaling of the PP plot so that the y = x diagonal is transformed into the x-axis. The preceding reasoning about parts of the curve being above or below the diagonal corresponds to parts of the curve being above or below the x-axis in the PD plot. Similarly, we can visualize the changes in test score gaps by overlaying two PD plots on top of each other (one for each point in time). If the curve from the second time point is closer to the x-axis than the curve from the first time point, then the gap has gotten smaller. With real data, two PD curves from two different time points often cross, and we want to measure quantitatively whether the curve from Time 2 is generally closer than the curve from Time 1. For a single time point, the V' statistic quantifies the magnitude of the gap by transforming the area underneath the curve (Ho & Haertel, 2006). Differences in V' statistics can be used to analyze gap changes. Section 4 summarizes all of these gaps in terms of the V' statistics, and presents an aggregation of the results to obtain a test of the overall hypothesis that the gaps are closing more rapidly on state tests (the focal tests) than NAEP (the audit test).
State-By-State Analysis
The following sections contain detailed state-by-state analyses of the available data for each of the six states that met our selection criteria. Each section briefly describes the state assessment program that was used for comparison to NAEP, including the years, subjects, and grade levels for which data were available. When the results do not match our hypothesis—as occurs in many cases—we briefly provide some possible explanations of the result.
For each of the six states analyzed, simple plots showing the trends of median or mean scores over the available time points are displayed, followed by the metric-free PD plots that display the gaps on both the state test and NAEP over the available time points. In the PD plots, arrows between pairs of curves are shown to indicate the change in the gap on a particular test over time.
It should be noted that the simple median or mean trend plots may be misleading in certain cases. For example, in Figure 1, the eighth-grade reading median trend lines for White and Black students on the NAEP are essentially parallel, which would seem to suggest that the White-Black gap did not close over that time period. But Figure 3 shows that on the NAEP the White-Black gap did indeed close by a substantial amount. The reason for this apparent paradox is that the median trend plots hide a great deal of information by only displaying the median values at each time

8
point. In actuality, the underlying distributions of White and Black scores may be shifting substantially relative to each other while the medians remain the same distance apart.
In all cases we intentionally placed the median or mean trend lines for the state and NAEP tests on separate plots, rather than plotting them together on one set of axes. The reason for this is that the scales on the tests are essentially arbitrary (and different depending on which state test one looks at), so the magnitudes of changes on the state test cannot be visually compared to the magnitudes of changes on the NAEP test. We also purposely drew the median or mean trend plots much smaller and with less precision than the metric-free PD plots because, while familiar, they convey much less information than the corresponding PD plots. Finally, the mean/median plots contain some blank boxes to indicate which subject/grade combinations were unavailable in the data for each state.
California
The state testing program in California enjoyed remarkable stability over the five-year span from 1998 through 2002 (Rogosa, 2003). The Stanford Achievement Test version 9 (SAT9) was administered to public school students in Grades 2 through 11 for these five years. In 1999, SAT9 scores became officially “high-stakes” with the passage of the Public Schools Accountability Act (PSAA) of 1999. Under this Act, schools were held accountable for meeting growth criteria as measured by an Academic Performance Index (API), a weighted composite of test scores. Schools meeting their growth targets were eligible for rewards, including monetary rewards and waivers of certain requirements. Schools that did not meet targets could receive improvement funds, but also faced state and local sanctions.
State NAEP assessments were administered relatively infrequently in this five-year period, and no Math gap comparison is available. A Reading gap comparison is available from 1998 to 2002. Median percentile rank scores were not available in 2002, so mean scores are used for trend comparisons for both the SAT9 and NAEP. Hispanic students far outnumber Black students in California, so this section overviews Hispanic-White gaps.
Grade 4 Reading results show that NAEP scores increased for both Hispanic and White students on both the SAT9 and NAEP. For NAEP, mean figures (Figure 1) show that the gap decreases from 1998 to 2002 and that this gap closure is due to relatively

9
large gains for Hispanic students. The PD plot (Figure 2) shows a more complicated picture in that NAEP PD curves for 1998 and 2002 cross a number of times. The V' statistic does show a slight decrease in the Hispanic-White gap on NAEP. The mean figure for the SAT9 does not appear to show a change in the gap, but the PD plot makes it clear that the gap is decreasing to a larger extent than the NAEP gaps. The PD plot makes it clear that Hispanic-White gaps are larger on the SAT9 than they are on NAEP at both time points. This suggests that Hispanic students are better prepared for NAEP-like items than they are for SAT9-like items relative to their White counterparts. To summarize, Grade 4 Reading results suggest that all subgroups are improving; PD plots show that the extent of the gap closure on the SAT9 is not confirmed by NAEP gap results; and Hispanic-White gaps are larger for the SAT9 than they are for NAEP.
Grade 8 NAEP mean plots show that the Hispanic-White gap decreases from 1998 to 2002 due to a decline in the White mean score. This is confirmed by the NAEP PD plot (Figure 3.1.3), where there is a clear decrease in the NAEP gap. State mean plots show that the gap decreases also, but this gap decrease is due to gains in Hispanic scores that are greater than gains in White scores. The notable decrease in the NAEP performance of White eighth-graders, a decrease that is not found in SAT9 results, is inconsistent with the hypothesis that accountability pressures disproportionally affect low-income students. However, mean plots show that gains shown on the SAT9 are not confirmed on NAEP, where White student scores are declining and Hispanic scores are unchanged.

10
Reading Math State NAEP State NAEP
4th Grade
570
690
1998 2002
150
250
1998 2002
8th Grade
650
720
1998 2002
225
280
1998 2002
Figure 1. Mean trend plots for California White Hispanic

11
White/Hispanic gap from 1998-2002 in California for 4th grade reading
0
5
10
15
20
25
30
35
40
45
50
0 20 40 60 80 100
Reference
Diff
eren
ceState
NAEP
Figure 2
White/Hispanic gap from 1998-2002 in California for 8th grade reading
0
5
10
15
20
25
30
35
40
45
50
0 20 40 60 80 100
Reference
Diff
eren
ce
State
NAEP
Figure 3

12
Idaho
Math scores from 2000 and 2003 were available from the Idaho Direct Math Assessment (DMA) for fourth and eighth grade. The DMA is not in the usual multiple-choice format; instead, it is a performance assessment composed of short-answer questions scored on a scale from 0 to 5, with scores of 3 indicating grade-level proficiency. (Direct writing assessment & direct math assessment, n.d.). The assessment had previously been administered yearly to fourth- and eighth-graders in Idaho, and as of 2003 was administered to fourth-, sixth-, and eighth-graders (Direct writing assessment & direct math assessment, n.d.; Wright Fellows III, 2003). Due to the small number of Black students in the NAEP Idaho sample, the analysis here focuses on White/Hispanic gaps instead of White/Black gaps.
Figure 4 shows the trend plots of median math scores on DMA and NAEP in 2000 and 2003. The plots show that, for Grade 4, the DMA median scores for the White group decreased slightly, while the medians for the Hispanic group increased. The net result was a decrease in the gap (at least as measured in this way). As for the eighth graders, the DMA gap decreased, but not in the way that one might want: medians for both White and Hispanic groups decreased, with the White median decreasing much more than the Hispanic median. The PD plots are more equivocal than the median trend plots: in each grade, they show the DMA gap closing at some points but not at others.
According to the median trend plots, the NAEP gaps appear to be stagnant: instead of decreasing in both grades, both of the White/Hispanic gaps in NAEP performance stay roughly equivalent between 2000 and 2003. However, the metric-free PD plots tell quite a different story: according to these plots, the NAEP performance gaps seem instead to increase quite substantially, at both grade levels.
It should be noted that Idaho is not among the states with a long history of high-stakes accountability policies. Accountability in Idaho has traditionally been based on school accreditation, and there has been no individual accountability for students (Goertz, Duffy & Le Floch, 2001). Among the five standards for school accreditation, it was required under Standard IV of Accountability/Assessment/Measures that “Schools will participate in the

13
statewide testing program and report their test results to district patrons and the State Department of Education” (Goertz, Duffy & Le Floch, 2001, p. 11). The standard does not specify the level of performance that students need to reach for accreditation. The “stakes” for the test seem to consist only of the reporting of the results.

14
Reading Math State NAEP State NAEP
4th Grade
1.9
2.9
1998 2001.5 2005 2000 2003
200
250
1998 2001.5 20052000 2003
8th Grade
1.3
2.7
1998 2001.5 2005 2000 2003
240
300
1998 2000 2003
Figure 4. Median trend plots for Idaho White Hispanic

15
White/Hispanic gap from 2000-2003in Idaho for 4th grade math
0
5
10
15
20
25
30
35
0 20 40 60 80 100
Reference
Diff
eren
ce
NAEP
State
Figure 5
White/Hispanic gap from 2000-2003in Idaho for 8th grade math
0
5
10
15
20
25
30
35
40
45
0 20 40 60 80 100
Reference
Diff
eren
ce
NAEP
State
Figure 6
16
In addition, the DMA has not been the focal math test for fourth and eighth graders in the Idaho state testing program. The Iowa Tests of Basic Skills (ITBS), a norm-referenced standardized assessment, had been given to Grades 3 through 8 to address student math knowledge and skills until the school year 2001-2002 (Wright Fellows III, 2003). From 2002-2003 on, in following the lead of other states in complying with NCLB requirements, Idaho has implemented the Idaho Standards Achievement Tests (ISAT), a criterion-referenced standardized assessment aligned with the prescribed state academic standards (Writing Fellows III), in the 2nd through 11th grades. Although DMA is still included in the newly devised state assessment system, the accountability is largely attached to the ISAT alone. NCLB adequate yearly progress and statewide annual measurable objectives are defined solely in terms of student ISAT performances (Idaho State Board of Education [ISBOE], 2004). A proficient-level performance on the ISAT is also required for high school graduation (ISBOE).
In summary, the status of the DMA in the Idaho state assessment system seems to resemble NAEP; it is more of an audit test supplementary to the focal test (ITBS or ISAT). Since instruction is likely to be test oriented under the pressure of high-stakes testing and there have been relatively low stakes attached to DMA, there would be, according to our hypothesis, fewer instructional activities teaching to DMA and less of the resultant score inflation. As reported above, the DMA medians in general decreased for the White and Hispanic groups from 2000 to 2003 at both grade levels, except for the Hispanic fourth graders. Given the “audit test” status of DMA, the decreasing DMA score trends (and the corresponding uniformly decreasing trends on NAEP) could signal the focus of the instructional activities and resources on preparing students to perform on the focal standardized test in the state testing program.
Kansas
The Kansas Assessments are a set of multiple-choice exams given in reading, math, science, and social studies along with a free-response writing assessment and a diagnostic exam for second-graders. The available data allow us to make comparisons between the results of the Kansas Assessments and the NAEP results only for fourth-grade math and eighth-grade reading. A key feature of the Kansas Assessments is that, like the NAEP, they are low-stakes, in

17
the sense that there is no direct consequence for students who perform poorly; there are no stakes attached to any of the tests (Consortium for Policy Research in Education, 2000a).
Figure 7 shows the median trend plots. For every test except the eighth grade reading NAEP, the median trend plots show that the gap is closing in the same way, with both White and Black groups increasing their median score but with the Black medians increasing faster than the White medians. However, in eighth-grade reading, the trend is reversed: both groups’ median scores decrease, but the Black median decreases at a slower rate than the White median. The PD plots show similar patterns of gap changes for both fourth-grade math (Figure 8) and eighth-grade reading (Figure 9): the gaps are closing for both the state test and for NAEP, in both subject areas.

18
Reading Math State NAEP State NAEP
4th Grade
30
70
2000 2003
200
260
2000 2003
8th Grade
40
60
2002 2003
240
280
2002 2003
Figure 7. Median trend plots for Kansas White Black

19
White/Black gap from 2000-2003 in Kansas for 4th grade math
0
5
10
15
20
25
30
35
40
45
50
0 20 40 60 80 100
Reference
Diff
eren
ce
NAEP
State
Figure 8
White/Black gap from 2000-2003 in Kansas for 8th grade reading
0
5
10
15
20
25
30
35
40
0 20 40 60 80 100
Reference
Diff
eren
ce
NAEP
State
Figure 9

20
The state of Kansas uses a program called Quality Performance Accreditation (QPA). This program was first tested in 1991 on a trial basis, and in 1996, the accreditation regulations of this program were approved (Kansas State Department of Education; Kansas State Department of Education School Improvement and Accreditation Team, 2000). In 2001, the Kansas Board of Education initiated a study to examine the QPA and identify changes necessary to comply with the “No Child Left Behind” policies (Kansas State Department of Education, n.d.).
One of the changes implemented was an increase in the number of high school math courses required for graduation (Kansas State Department of Education, n.d.). This requirement may have motivated increased emphasis on math in earlier grades. In particular, lower scoring Black students may have been more pressured to improve in the earlier grades. Since White students already had a relatively high percentage of high scores, we would expect a smaller increase in performance from White students. Thus, the rate of improvement from Black students would be greater than the rate of improvement from White students, leading to a gap decrease in the math scores.
Another possible explanation of the closing gap is the Kansas QPA accreditation status system. Every school is given an accreditation status based on quality and performance criteria (Kansas State Department of Education). There are four levels of accreditation: Candidate, Accredited, Accredited Conditionally, and Denied Accredited. Schools categorized as Accredited Conditionally are required to form and implement a one year improvement plan. The school is reevaluated at the end of the second year to determine whether the school is granted Accredited status (Kansas State Department of Education School Improvement and Accreditation Team, 2000). This accreditation system would most likely help low-performing students in schools that did not have adequate curricula, teachers, or other resources. Thus, this could also be a possible source of the gap change.
Louisiana
The Louisiana Educational Assessment Program (LEAP) was administered for the first time in 1999 and includes math and reading assessments in Grades 4
21
and 8. The tests are constructed to be “aligned with the state’s content standards” and “as rigorous as” the NAEP. Performance is classified according to five levels (Louisiana Department of Education, 2003). Student performance on the LEAP math assessment can be compared against the NAEP for the fourth and eighth grade for the years 2000 and 2003. Results of the LEAP reading assessments can be compared with the NAEP for fourth and eighth grade for the years 2002 and 2003.
The LEAP consists of criterion-referenced tests that include both multiple choice and extended response items. The fourth- and eighth-grade English tests include multiple choice and short answer items as well as an essay. Some parts of the English assessment (e.g., the section assessing proofreading skills) include only multiple choice items whereas others (e.g., the section that addresses “reading and responding” skills) use a variety of item types. The math assessments are designed to test advanced skills beyond the rote application of algorithms. The tests are designed to assess performance on both open-ended and open-process problems as well as problems with more than one solution. The math assessments are divided into two parts. The first part consists of multiple choice questions. The second part consists of three open-ended tasks in Grade 4 and four open-ended tasks in Grade 8. The open-ended tasks require numerical answers, short written answers or constructed responses (Louisiana Department of Education, 2003).
High stakes are attached to the LEAP in both grades. Starting in the spring of 2000, fourth and eighth graders were retained at the same grade level if they performed at the “unsatisfactory” level on either the English and Math components of the test. Starting in Spring 2004, more stringent performance standards were to be put in place for fourth graders only: in addition to the earlier requirement, students would also need to achieve at the “basic” level (third of the five levels) or above in one of these two subject areas to avoid being retained. An identical policy for eighth graders had a planned implementation date of 2006. Students who perform below the required levels are given the opportunity to participate in “intensive summer remediation,” after which they can take the tests again (Louisiana Department of Education, 2003).
In 2003, standard LEAP testing became required of a number of groups of special education students who were previously exempt from the testing requirements; however, some students are still exempt and others may receive

22
accommodations to participate in regular LEAP testing. The state also started requiring LEP (limited English proficiency) students to participate in LEAP testing in 2003, but such students are also allowed to receive accommodations “provided [such accommodations] are used in the students’ classroom instruction and assessment” (Louisiana Department of Education, 2003).
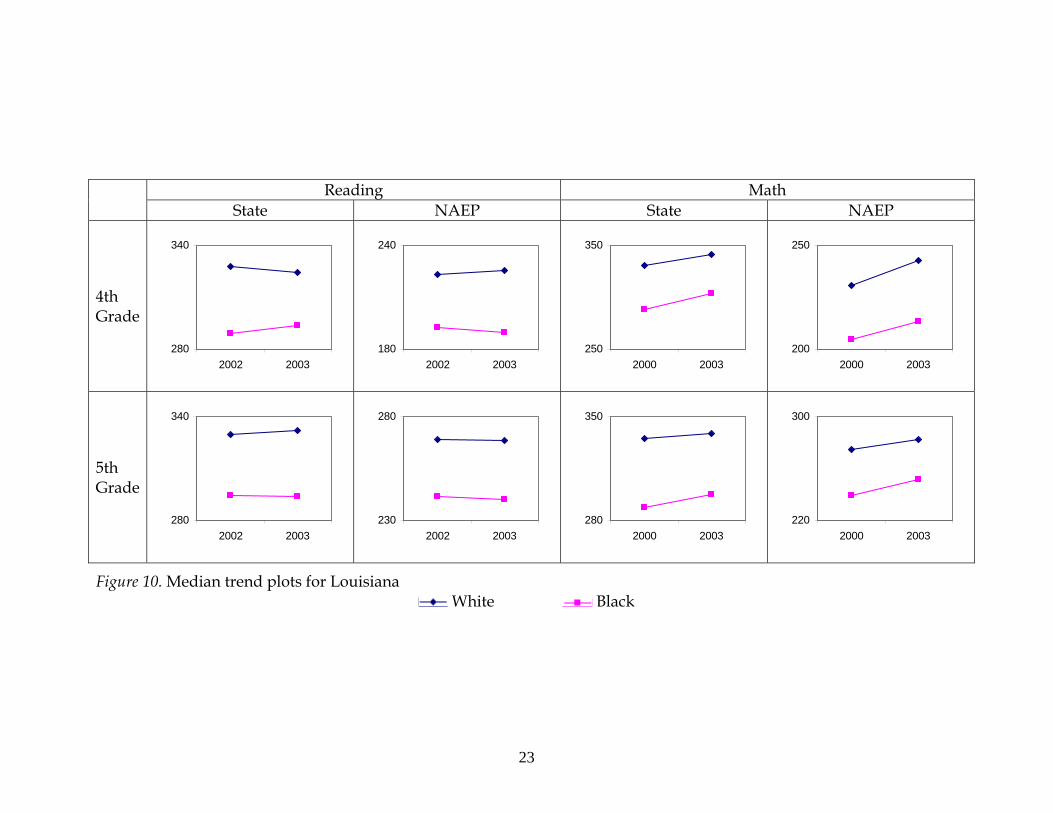
Figure 10 shows the median trend plots for the Louisiana data. An interesting pattern emerges in the plots for fourth-grade reading: the gap in the medians for the state test is closing because the White median is decreasing and the Black median increasing, but the gap in the medians for the NAEP is widening because of the exact opposite pattern. The PD plot in Figure 11 echoes this pattern.
In the median trend plots for eighth-grade reading it appears that little is changing between the two time points on both the state and the NAEP test. However, this is an example of where the PD plot (shown in Figure 12) can show what the trend plots are hiding: there is a substantial gap change for both the state and NAEP tests. Interestingly, both are in directions opposite to each other and opposite to the directions seen for the gap changes in fourth-grade reading.
In the trend plots for fourth-grade math it appears that both groups are improving on both the state and NAEP tests by roughly the same amount, but again the PD plot (shown in Figure 13) shows that in fact the directions of gap changes are again opposite to each other, with the NAEP gap widening and the state gap closing. The trend plots for eighth-grade math appear to show both gaps closing, and the PD plot (shown in Figure 14) makes clear that the NAEP gap is closing much more quickly than the state gap, which barely changes. In summary, the direction and magnitude of the gap changes are wildly different between the different tests and subject/grade pairs.
23
Reading Math State NAEP State NAEP
4th Grade
280
340
2002 2003
180
240
2002 2003
250
350
2000 2003
200
250
2000 2003
5th Grade
280
340
2002 2003
230
280
2002 2003
280
350
2000 2003
220
300
2000 2003
Figure 10. Median trend plots for Louisiana
White Black

24
White/Black gap from 2002-2003 in Louisiana for 4th grade reading
0
5
10
15
20
25
30
35
40
45
0 20 40 60 80 100
Reference
Diff
eren
ceNAEP
State
Figure 11
White/Black gap from 2002-2003 in Louisiana for 8th grade reading
0
5
10
15
20
25
30
35
40
0 20 40 60 80 100
Reference
Diff
eren
ce
NAEP
State
Figure 12

25
White/Black gap from 2002-2003 in Louisiana for 4th grade math
0
10
20
30
40
50
60
0 20 40 60 80 100
Reference
Diff
eren
ce
NAEP
State
Figure 13
White/Black gap from 2002-2003 in Louisiana for 8th grade math
0
10
20
30
40
50
60
0 20 40 60 80 100
Reference
Diff
eren
ce
NAEP State
Figure 14

26
There are several plausible explanations for why the results generally contradicted our hypothesis. First, the state math test consists largely of extended response items. Conceivably, it is difficult to prepare students for such tests aside from actually teaching them the curriculum. This means that teachers would not be able to single out disadvantaged students and coach them to do well on the exam, by, for instance, exposing them to items that resemble the items that are actually on the test. Both advantaged and disadvantaged groups may have improved over time, with the gap remaining constant between them.
The results do not rule out the possibility that gap closure took place on the focal test before the time period that we examined. The test was first administered in 1999. The first year for which we have data is 2000. Having experienced the high-pressure climate by the end of the 1998/1999 school year, and grasping the high-stakes consequences for students beginning in 2000, teachers may have already implemented strategies for bringing lower performing students in line with higher performing students by the year 2000. The gap closure on NAEP may be lagged because it results from a different sort of differential effect of instruction. That is, the gap closure on the state test may have been rapid and fully effected by 2000. This change may have been due to test preparation practices. The gap closure on the NAEP may have been slower and may be the consequence of some component of the reform effort (perhaps improved instruction) that is especially beneficial to disadvantaged students. (The gap closures on the NAEP that are witnessed in 2003 on the eighth-grade tests may be the result of beneficial instruction in that year as well as the cumulative effect of the reform since its inception.)
Missouri
The available state test data for Missouri included 2000 and 2003 math scores for students in Grade 4 and Grade 8 taking part in the Missouri Assessment Program (MAP). The MAP was originally designed to include a variety of school subjects, including science, social studies, and fine arts. Although the test was developed to align with the state’s “Show-Me Standards,” individual school districts do not use a prescribed curriculum (however, districts must link their curricula to the standards). The exams include a variety of item types, including both open-ended and selected-response questions. Students with disabilities may be exempted from particular tests upon the decision of their

27
IEP team, and appropriate accommodations may also be made to help such students participate (Consortium for Policy Research in Education, 2000b).
Figure 15 shows the median trend plots for the Missouri data. Unlike many of the trend plots shown elsewhere in this report, the story told by the median trend plots is relatively simple. For both tests, both groups’ median scores are improving in fourth-grade math, but Black students are improving faster. Figure 16 tells the more complete metric-free story; this PD plot shows that the gaps are generally closing for all achievement levels for fourth-grade students. In eighth-grade math, both median scores are again improving, but the Black students’ median is improving faster. The PD plot in Figure 17 again shows gaps closing for both the state and NAEP tests.

28
Reading Math State NAEP State NAEP
4th Grade
610
650
2000 2003
190
250
2000 2003
8th Grade
640
720
2000 2003
220
300
2000 2003
Figure 15. Median trend plots for Missouri
White Black

29
White/Black gap from 2000-2003 in Missouri for 4th grade math
0
5
10
15
20
25
30
35
40
45
50
0 20 40 60 80 100
Reference
Diff
eren
ce
NAEP
State
Figure 16.
White/Black gap from 2000-2003 in Missouri for 8th grade math
0
5
10
15
20
25
30
35
40
45
50
0 20 40 60 80 100
Reference
Diff
eren
ce
State
NAEP
Figure 17

30
This finding of the gaps closing for both groups is contrary to the hypothesis that the patterns would be different for the state and NAEP tests. There are several possible reasons that the data do not support the hypothesis: the degree of “stakes” attached to the MAP in Missouri is lower than what would likely be attached to what one would normally consider a “high-stakes test,” and the required components of MAP as actually implemented are restricted to only two content areas, giving teachers the ability to focus more attention on those content areas (Consortium for Policy Research in Education, 2000b; Missouri Department of Elementary and Secondary Education, 2004).
As of 2000, the MAP might be considered “medium-stakes” rather than “high-stakes” because there are no stakes for individual students. Instead, the stakes are really for the school: the MAP is used for accreditation of individual school districts. We have not found any indication that student-level stakes have been attached since 2000, although the MAP does report results at the student-level (Consortium for Policy Research in Education, 2000b; Missouri Department of Elementary and Secondary Education, 2004). This lack of “high-stakes” may partially explain why the gaps are closing on both the focal and audit tests; our hypothesis was that teachers would teach more narrowly in low-resource classrooms, but the lack of stakes for individual students would likely reduce pressure on these teachers to improve their students’ test scores. This absence of student-level stakes could mean that instruction is not targeted to the specifics of the MAP test as it would be if there were stakes for each student.
Although for technical reasons (described in section 2) we only looked at the gaps between groups on mathematics scores in Missouri, the MAP contains other content areas besides mathematics. But as of 2004, mathematics was one of only two parts of the MAP that districts are required to give, due to budgetary issues (Missouri Department of Elementary and Secondary Education, 2004). It is possible that due to this change additional instruction time is allotted to mathematics (time that previously would have been spent on tests in the MAP that are now discontinued or voluntary), and that as a result student performance has improved across the board on the mathematics part of the MAP. This explanation assumes that students are in a single class for all of their subjects (so that their teachers can shift instructional time from one content area to another), which is likely true for fourth grade but possibly not for eighth
31
grade. But the PD plots show the gap closing more in fourth than in eighth grade, which is consistent with this explanation.
Wisconsin
In response to NCLB, Wisconsin employed a new standards-driven accountability system, WSAS, to evaluate students, schools, and districts. The Wisconsin Student Assessment System (WSAS) includes two components, the Wisconsin Reading Comprehension Test (WRCT) and the Wisconsin Knowledge and Concepts Examinations (WKCE). Wisconsin law requires that third-, fourth-, eighth-, and tenth-grade students in all school districts take state-provided tests. WKCE categorizes students into five levels (advanced, proficient, basic, minimal performance and pre-requisite skill) which are based on the scores students obtain on the test (State of Wisconsin Department of Public Instruction, 2003).
WKCE test scores have high-stakes for the students, schools and districts. For individual students, WKCE scores have been used as one of several criteria for advancing students from fourth to fifth grade and from eighth to ninth grade since September 1, 2002. The WCKE Reading and Mathematics tests are also used to evaluate AYP under NCLB.
Figure 18 presents median White and Black achievement trend plots for NAEP tests for fourth-grade reading and eighth-grade math from 1998 to 2003. Figures 19-22 show the White/Black achievement gap for Wisconsin State tests for fourth- and eighth-grade reading and math in 1998 and 2003. Median trend plots are not shown for the state test data because the state proficiency test data for 1998 and 2003 are not comparable with each other due to the change of the proficiency level assessment in November of 2003 (State of Wisconsin Department of Public Instruction, 2003). The White/Black change of gap plots include data from NAEP and Wisconsin Knowledge and Concepts Examinations (WKCE) tests. The WKCE test data is the only available statewide standardized exam data that can match the year, subject and grade of the NAEP test data. WKCE was administered each year to students in Grades 4, 8, and 10 to assess student achievement in five subject areas (reading, language arts, mathematics, science, and social studies) using multiple choice, short answer questions and a writing test.

32
For fourth-grade reading, median trend plots (Figure 18) show that Black students’ test scores improve but White students’ test scores decrease on NAEP. The PD plot clearly shows this NAEP gap decreasing (Figure 19), but it is equivocal about the fourth grade reading gap change on the WKCE. The PD plot for fourth grade math (Figure 20) echoes the NAEP trend plot in that the NAEP gap seems to be closing slowly from 1998 to 2003; however, the PD plot shows the state gap apparently closing more quickly. In eighth grade reading the NAEP gap seems to widen, as seen in both the trend plot and in the PD plot (Figure 21); in contrast, the same PD plot shows the gap shrinking on the WKCE. The median trend plot shows the gap fairly constant in NAEP eighth-grade math, but the PD plot (Figure 22) shows the gap shrinking somewhat overall. However, this PD plot presents an unclear picture about what is happening to the gap on the WKCE.
The results from Grade 4 math and Grade 8 reading are consistent with our hypothesis of greater gap closing on state tests versus NAEP. Indeed, for eighth grade reading the gap decreases on the state test and actually increases on NAEP. However, data for the remaining two subject/grade combinations do not support our hypothesis. There are several plausible reasons why the data do not support the hypothesis in general. Wisconsin is one of the states encouraging improvement of education and professional development of teachers. The state and local school districts provide mentoring, induction and other beginning-teacher support programs, support the recruitment of teachers, and strengthen the standards for the teaching professions (Education Commission of the States, 2001). These policies might help improve the quality of teaching. More effective teachers might help students study well and the gap between White and Black students might decrease uniformly across tests due to better quality of teaching.
Another possible reason for gap closure across tests is that high-stakes testing policy in the state may have motivated individual students to study harder after 2002 than before 2002. Wisconsin did not have a high school graduation test before fall 2002. However, since fall 2002, each student must pass the high school graduation test in order to earn a high school diploma. Further, WKCE test scores are used as one of the criteria for advancing students from fourth to fifth grade and from eighth to ninth grade. This policy might have had the effect of increasing low-achieving students’ scores since they are likely the ones affected by a test score requirement for grade promotion or graduation.

33
Gap statistics
Section 3 presented case studies of six states in which we analyzed gap trends using two different graphical methods (mean/median trend plots and metric-free PD plots). In this section we summarize the metric-free gap trends results using the V' statistic (Ho & Haertel, 2006). In Table 2, “State 1” and “State 2” (and “NAEP 1” and “NAEP 2”) give the V' statistics for the White/Black gap at two time periods on the state test (NAEP test) respectively. Depending on the state, Time 1 is either 2000 or 2002, and time 2 is 2003. The “Difference” column indicates the difference in the V' statistics between Time 1 and Time 2, with negative numbers indicating a gap closure. The bottom row averages each column. The overall hypothesis of this study was that gaps would close more on the focal tests (the state tests) than on the audit test (NAEP). For a particular grade/subject/state combination, this corresponds to the “Difference” column being larger on the left (for the state tests) than on the right (for NAEP). Over all of the available data, our hypothesis corresponds to the left gray shaded cell being larger than the right gray shaded cell.
Although the mean of the state difference column is more negative than the mean of the NAEP difference column, this difference is not statistically significant (a one-sample Wilcoxon signed-rank test on the difference of the difference columns in the table below yields a nonsignificant p =0.24). Since the available data do point towards a difference in the hypothesized direction, the difference may have been significant had more data been available for analysis (i.e., had fewer states merited exclusion using the elimination rules described in Section 2 of this report).
However, one interesting point to note is that the overall average of the V' statistics for the state data points (0.759) is significantly lower than the overall average for the NAEP data points (0.864). (A one-sample Wilcoxon signed-rank test on the differences yields p <0.01.) Thus, on average the gaps were smaller on the state tests than on the NAEP.

34
Reading Math State NAEP State NAEP
4th Grade
180
240
1998 2003
180
250
1998 2003
8th Grade
220
280
1998 2003
220
300
1998 2003
Figure 18. Median trend plots for Wisconsin
White Black

35
White/Black Gap from 1998 to 2003 in Wisconsin for 4th Grade Reading
0
10
20
30
40
50
60
0 20 40 60 80 100
Reference
Diff
eren
ce
NAEP
State
Figure 19
Black/White Gap from 1998-2003 in Wisconsin Students for 4th Grade Math
0
10
20
30
40
50
60
0 20 40 60 80 100
Reference
Diff
eren
ce State
NAEP
Figure 20

36
White/Black Gap from 1998 to 2003in Wisconsin for 8th Grade Reading
0
5
10
15
20
25
30
35
40
45
50
0 20 40 60 80 100
Reference
Diff
eren
ce
StateNAEP
Figure 21
White/Black Gap from 1998 to 2003 in Wisconsin for 8th Grade Math
0
10
20
30
40
50
60
70
0 20 40 60 80 100Reference
Diff
eren
ce
NAEP
State
Figure 22

37
Table 2 V' Statistics By Test, Time Point, and State
State 1 State 2 Difference NAEP 1 NAEP 2 Difference California Reading 4 1.100 1.033 -0.067 0.881 0.865 -0.016 Reading 8 1.067 1.013 -0.054 0.962 0.815 -0.147 Idaho Math 4 0.566 0.523 -0.043 0.622 0.792 0.170 Math 8 0.566 0.523 -0.043 0.622 0.962 0.340 Louisiana Math 4 0.624 0.580 -0.044 0.710 0.825 0.115 Math 8 0.717 0.700 -0.017 0.868 0.694 -0.174 Reading 4 0.597 0.524 -0.073 0.632 0.698 0.066 Reading 8 0.582 0.663 0.081 0.653 0.609 -0.044 Kansas Math 4 0.667 0.565 -0.102 0.769 0.728 -0.041 Reading 8 0.580 0.521 -0.059 0.630 0.589 -0.041 Missouri Math 4 0.620 0.468 -0.152 0.801 0.656 -0.146 Math 8 0.717 0.643 -0.074 0.818 0.739 -0.078 Wisconsin Math 4 1.053 0.889 -0.164 1.349 1.240 -0.109 Math 8 1.205 1.226 0.021 1.588 1.445 -0.143 Reading 4 0.882 0.805 -0.077 1.238 0.752 -0.486 Reading 8 1.080 0.979 -0.102 0.967 1.142 0.175 Average 0.777 0.714 -0.061 0.919 0.843 -0.035
Average over all state 0.759 Average over all NAEP 0.864
Discussion and Conclusion
The clearest conclusion from the state-by-state analyses of state and NAEP test data is that the pattern of gap changes varies widely both between and within states. Further, gap changes came in a variety of forms, and not all types of gap reduction are equally desirable. While it may seem laudatory for a state to have closed its White/Black or White/Hispanic achievement gap in a specific area, such a gap closing is not a sign of success if it comes as the result of a median score decrease in both groups (as was the case for the White/Hispanic achievement gap on the eighth-grade state math test in Idaho).
38
One important finding arising from these metric-free data is that in the majority of cases, the gaps are larger in general on NAEP than on the state tests. While this is not exactly the overall hypothesis of the study—we hypothesized that the state gap would be closing faster than the NAEP gap—one possible explanation for this finding is that the phenomenon we imagined occurring actually happened before the first year in which data were available to us for comparison. For example, if a high-stakes accountability policy were implemented in a particular state in the early or mid 1990s, it could have resulted in the partial closing of a gap on the focal test prior to 2000.
Even though some data in the preceding sections may be consistent with our overall hypothesis, it does not necessarily mean that our explanation is necessarily the reason (or the only reason) for the observed changes in test score gaps. Since our data are non-experimental in nature, there are a number of factors that may be confounded with our hypothesized high-stakes testing effects. Between the two years from which data were analyzed for each state, a number of changes may have occurred in the policy context in each state (e.g., changes in exclusion policies). In each section above, we have tried to describe any policy changes we are aware of, but it is certainly possible that more subtle policy changes may have had large effects on test score gaps. In some cases, these changes may not even have been publicized—or may not have been apparent to us when we investigated each state’s policies, since some policy change announcements may have been several years old by the time of our research. The National Assessment Governing Board report Using the National Assessment of Educational Progress to Confirm State Test Results (2002) lists some potential differences between the NAEP and state tests that may affect scores in different ways for different states: “content coverage in the subjects, definitions of subgroups, changes in the demography within a state over time, sampling procedures, standard-setting approaches, reporting metrics, student motivation in taking the state test versus taking NAEP, mix of item formats, test difficulty, etc.” (p. 9). Thus, although in the case studies above we have sometimes speculated on how policy changes may have given rise to the results we observed, we do not claim to have the correct and complete explanations about the causes of the gap changes because we realize that there are a great number of possible unknown factors at work in each state.

39
References
Consortium for Policy Research in Education (2000a). Assessment and Accountability in the Fifty States: 1999-2000: Kansas. Retrieved February 23, 2005 from http://www.cpre.org/Publications/ks.pdf
Consortium for Policy Research in Education (2000b). Assessment and Accountability in the Fifty States: 1999-2000: Missouri. Retrieved February 9, 2005 from http://www.cpre.org/Publications/mo.pdf
Direct writing assessment & direct math assessment. (n.d.). Retrieved March 3, 2005, from
http://www.sd41.k12.id.us/Curriculum/Testing%20information/direct_writing_assessment.htm
Education Commission of the States (2001). How Ready Are States to Implement President Bush’s Education Plan? Retrieved February 17, 2005 from http://www.ecs.org/clearinghouse/22/88/2288.pdf
Goertz, M. E., Duffy, M. C., & Le Floch, K. C. (2001). Assessment and accountability systems in the 50 states: 1999-2000. (No. RR-046). Philadelphia, PA:
Consortium for Policy Research in Education. Retrieved September 17, 2004, from http://www.cpre.org/Publications/rr46.pdf
Ho, A. D. & Haertel, E. H. (2006). Metric-Free Measures of Test Score Trends and Gaps with Policy-Relevant Examples (CSE Report No. 665). Technical Report for the National Center for Research on Evaluation, Standards, and Student Testing, UCLA.
Idaho State Board of Education (ISBOE). (2004, August). Consolidated state application accountability workbook. Washington DC: U.S. Department of Education. Retrieved March 4, 2005, from
http://www.ed.gov/admins/lead/account/stateplans03/idcsa.pdf
Kansas State Department of Education School Improvement and Accreditation Team (2000). Quality Performance Accreditation Manual: A Guide for Navigating School Improvement and Quality Performance Accreditation. Retrieved February 23, 2005 from
http://www.ksde.org/outcomes/qpamanual2001.pdf

40
Kansas State Department of Education (n.d.). QPA, NCLB, and Graduation Requirements. Retrieved February 24, 2005 from
http://www.ksde.org/qpa_and_grad_reqs_summary_march_03.htm
Louisiana Department of Education (2003). 2002-2003 Annual Report: Grades 4 and 8 and GEE 21 Criterion-Referenced Tests. Retrieved May 5, 2005 from http://www.doe.state.la.us/lde/uploads/3771.pdf
McLaughlin, D., Bandeira de Mello, V., Blankenship, C., Chaney, K., Hikawa, H., Rojas, D., William, P., & Wolman, M. (2004a) Comparison between NAEP and state reading assessment results: 2003. Report under review by the National Center for Education Statistics.
McLaughlin, D., Bandeira de Mello, V., Blankenship, C., Chaney, K., Esra, P., Hikawa, H., Rojas, D., William, P., & Wolman, M. (2004b) Comparison between NAEP and state mathematics assessment results: 2003. Report under review by the National Center for Education Statistics.
Missouri Department of Elementary and Secondary Education (2004). MAP 2004 Update. Retrieved February 9, 2005 from
http://dese.mo.gov/divimprove/MAP%20-%20Update%202004.pdf
National Assessment Governing Board (2002). Using the National Assessment of Educational Progress to Confirm State Test Results. Retrieved May 5, 2005 from http://www.nagb.org/pubs/color_document.pdf
National Center for Education Statistics. (2006). Frequently Asked Questions. Retrieved December 28, 2006 from
http://nces.ed.gov/nationsreportcard/faq.asp
Raudenbush, S. W., Fotiu, R. P., & Cheong, Y. F. (1998). Inequality of Access to Educational Resources: A National Report Card for Eighth-Grade Math. Educational Evaluation and Policy Analysis, 20(4), 253-267.
Rogosa, D. R. (2003). Four-peat: Data Analysis Results from Uncharacteristic Continuity in California Student Testing Programs. Retrieved April 8, 2005 from http://www-stat.stanford.edu/%7Erag/api/ms4peat.pdf
State of Wisconsin Department of Public Instruction (2003). Questions and Answers Regarding the New 2002-03 WKCE Proficiency Levels. Retrieved February 18, 2005 from
http://www.dpi.state.wi.us/dpi/oea/pdf/profnewq&a.pdf

41
Wright Fellows III. (2003). A current view of accountability issues in Idaho: A perspective from the Wright Fellows III. University of Idaho, Moscow: Thomas C. Wright Fellowship Program. Retrieved March 3, 2005, from http://www.uidaho.edu/ed/wrightfellows/WrightPaperFinal%5b1%5d.pdf
Copyright © 2022 FDOKUMEN