RWHAP 2019 Wayne State Part C Audit Report - Ryan White ...
104
WAYNE STATE UNIVERSITY FINANCIAL REPORT
-
Upload
khangminh22 -
Category
Documents
-
view
3 -
download
0
Transcript of RWHAP 2019 Wayne State Part C Audit Report - Ryan White ...

Year Ended September 30, 2019
WAYNE STATE UNIVERSITY FINANCIAL REPORT

M. Roy WilsonPresident
Keith WhitfieldProvost
Susan E. BurnsVice President for Development and Alumni Affairs
William DecaturVice President for Finance and Business Operations, Treasurer and Chief Financial Officer
Stephen M. LanierVice President for Research
Louis LessemVice President and General Council
Patrick O. LindseyVice President for Government and Community Affairs
Julie H. MillerVice President and Secretary to the Board of Governors
Ned StaeblerVice President for Economic Development
Michael WrightChief of Staff and Vice President for Marketing and Communications
Executive Officers
Board of Governors
Finance Administrators
Sandra Hughes O’Brien
Bryan C. Barnhill II
Michael J. Busuito
Mark Gaffney
Marilyn Kelly, vice chair
Anil Kumar
Dana Thompson
Kim Trent, chair
M. Roy Wilson, ex officio
William DecaturVice President, Treasurerand Chief Financial Officer
Bryan DadeySenior Associate Vice President for Finance and Deputy CFO
Marianne CunninghamAssistant Vice President, Treasury and Assistant Treasurer
Tamaka M. ButlerAssistant Vice President and Controller
Colleen CiliaDirector of Accounting
Tony L. MillerDirector of Accounting
Gail L. RyanAssociate Vice President for Sponsored Program Administration

Wayne State University
Contents
Independent Auditor’s Report 1-2
Management’s Discussion and Analysis - Unaudited 3-18
Financial Statements
Statement of Net Position 19
Statement of Revenues, Expenses, and Changes in Net Position 20
Statement of Cash Flows 21
Notes to Financial Statements 22-51
Required Supplementary Information 52
Schedule of Changes in the University's Total OPEB Liability and Related Ratios 53
Supplemental Information 54
Combining Statement of Net Position (Deficit) 55 Combining Statement of Revenues, Expenses, Transfers, and Changes
in Net Position (Deficit) 56-57 Combining Statement of Net Position (Deficit) - 2018 58
Combining Statement of Revenues, Expenses, Transfers, and Changes
in Net Position (Deficit) - 2018 59-60

Independent Auditor's Report
To the Board of GovernorsWayne State University
Report on the Financial Statements
We have audited the accompanying financial statements of the business-type activities and the discretelypresented component unit of Wayne State University (the "University") as of and for the years ended September30, 2019 and 2018 and the related notes to the financial statements, which collectively comprise Wayne StateUniversity's basic financial statements, as listed in the table of contents.
Management’s Responsibility for the Financial Statements
Management is responsible for the preparation and fair presentation of these financial statements in accordancewith accounting principles generally accepted in the United States of America; this includes the design,implementation, and maintenance of internal control relevant to the preparation and fair presentation of financialstatements that are free from material misstatement, whether due to fraud or error.
Auditor’s Responsibility
Our responsibility is to express opinions on these financial statements based on our audits. We conducted ouraudits in accordance with auditing standards generally accepted in the United States of America and the standardsapplicable to financial audits contained in Government Auditing Standards, issued by the Comptroller General ofthe United States. Those standards require that we plan and perform the audits to obtain reasonable assuranceabout whether the financial statements are free from material misstatement.
An audit involves performing procedures to obtain audit evidence about the amounts and disclosures in thefinancial statements. The procedures selected depend on the auditor’s judgment, including the assessment of therisks of material misstatement of the financial statements, whether due to fraud or error. In making those riskassessments, the auditor considers internal control relevant to the entity’s preparation and fair presentation of thefinancial statements in order to design audit procedures that are appropriate in the circumstances, but not for thepurpose of expressing an opinion on the effectiveness of the entity’s internal control. Accordingly, we express nosuch opinion. An audit also includes evaluating the appropriateness of accounting policies used and thereasonableness of significant accounting estimates made by management, as well as evaluating the overallpresentation of the financial statements.
We believe that the audit evidence we have obtained is sufficient and appropriate to provide a basis for our auditopinions.
Opinions
In our opinion, the financial statements referred to above present fairly, in all material respects, the respectivefinancial position of the business-type activities and the discretely presented component unit of Wayne StateUniversity as of September 30, 2019 and 2018 and the respective changes in its financial position and, whereapplicable, cash flows for the years then ended in accordance with accounting principles generally accepted in theUnited States of America.
1
Sharice.McClendon
East Lansing
Sharice.McClendon
Praxity
To the Board of GovernorsWayne State University
Other Matters
Required Supplemental Information
Accounting principles generally accepted in the United States of America require that the management'sdiscussion and analysis and schedule of changes in the University's total OPEB liability and related ratios bepresented to supplement the basic financial statements. Such information, although not a part of the basicfinancial statements, is required by the Governmental Accounting Standards Board, which considers it to be anessential part of financial reporting for placing the basic financial statements in an appropriate operational,economic, or historical context. We have applied certain limited procedures to the required supplementalinformation in accordance with auditing standards generally accepted in the United States of America, whichconsisted of inquiries of management about the methods of preparing the information and comparing theinformation for consistency with management's responses to our inquiries, the basic financial statements, andother knowledge we obtained during our audit of the basic financial statements. We do not express an opinion orprovide any assurance on the information because the limited procedures do not provide us with sufficientevidence to express an opinion or provide any assurance.
Other Information
Our audits were conducted for the purpose of forming an opinion on the financial statements that collectivelycomprise Wayne State University's basic financial statements. The other supplemental information, as identified inthe table of contents, is presented for the purpose of additional analysis and is not a required part of the basicfinancial statements.
The other supplemental information is the responsibility of management and was derived from and relates directlyto the underlying accounting and other records used to prepare the basic financial statements. Such informationhas been subjected to the auditing procedures applied in the audit of the basic financial statements and certainadditional procedures, including comparing and reconciling such information directly to the underlying accountingand other records used to prepare the basic financial statements or to the basic financial statements themselves,and other additional procedures in accordance with auditing standards generally accepted in the United States ofAmerica. In our opinion, the other supplemental information is fairly stated in all material respects in relation to thebasic financial statements as a whole.
Other Reporting Required by Government Auditing Standards
In accordance with Government Auditing Standards, we have also issued our report dated February 13, 2020 onour consideration of Wayne State University's internal control over financial reporting and on our tests of itscompliance with certain provisions of laws, regulations, contracts, grant agreements, and other matters. Thepurpose of that report is to describe the scope of our testing of internal control over financial reporting andcompliance and the results of that testing, and not to provide an opinion on the internal control over financialreporting or on compliance. That report is an integral part of an audit performed in accordance with GovernmentAuditing Standards in considering Wayne State University's internal control over financial reporting andcompliance.
February 13, 2020
2
Wayne State University
3
Management’s Discussion and Analysis - Unaudited
Introduction The following discussion and analysis provides an overview of the financial position of Wayne State University (the “University”) at September 30, 2019 and the results of its operations and cash flows for the year then ended. Comparative information is provided as of and for the year ended September 30, 2018. This discussion has been prepared by management and should be read in conjunction with the accompanying financial statements and related notes to facilitate and enhance the reader’s understanding of the 2019 financial report. Wayne State University is a nationally recognized public research university with urban roots and a global reputation. The main campus, located in Detroit’s University Cultural Center, includes more than 350 undergraduate, graduate, doctoral, certificate, and professional programs offered through the University’s schools and colleges. The University ranks among the top public universities in the nation and has the most diverse student body of any university in Michigan. As the 6th largest employer in the city of Detroit, as ranked by the 2019 Crain’s Business Survey of Detroit’s Largest Employers, the University has a significant impact on the local economy and contributes to the state and nation as well through its research and public service programs. Excellence in research is essential to the University’s mission. Based on the 2018 National Science Foundation Research and Development Expenditures Survey, the University ranked 99th among all universities and 68th among public universities in research and development expenditures. A substantial portion of the University’s research is conducted at the School of Medicine, the nation’s largest single-campus medical school. The 2018 National Science Foundation Research and Development Expenditures Survey ranked the University 53rd in the health sciences category. Based on the 2019 Carnegie classification of higher education, Wayne State University ranked within the top 3.0 percent of the nation’s universities and colleges with the Carnegie classification of R1 (very high research activity). Wayne State University, Michigan State University, and the University of Michigan, the state’s three largest research universities, are partners in the University Research Corridor (URC). The URC is an alliance among these three universities to spark regional economic development through invention, innovation, and technology transfer, by educating a work force prepared for the “knowledge economy,” and by attracting smart and talented people to Michigan. Using this Report The University’s financial report includes three financial statements: the statement of net position; the statement of revenue, expenses, and changes in net position; and the statement of cash flows. The report also includes notes to the financial statements, which are an integral component of the report, and required supplementary information (RSI). These financial statements, accompanying notes, and RSI are prepared in accordance with the principles of the Governmental Accounting Standards Board (GASB). Consistent with the GASB principles, the Wayne State University Foundation (the “Foundation”), as a controlled corporate organization, is a discretely presented component unit (DCU) of the University. The Foundation’s statement of financial position and statement of activities and changes in net position are discretely presented in the University’s financial statements. The management’s discussion and analysis refers to the University only (excluding the Foundation), unless otherwise noted. Additional supplemental information, which provides the statement of net position and operating information for the various funds of the University, is also included in the report.
Wayne State University
4
Management’s Discussion and Analysis - Unaudited (Continued)
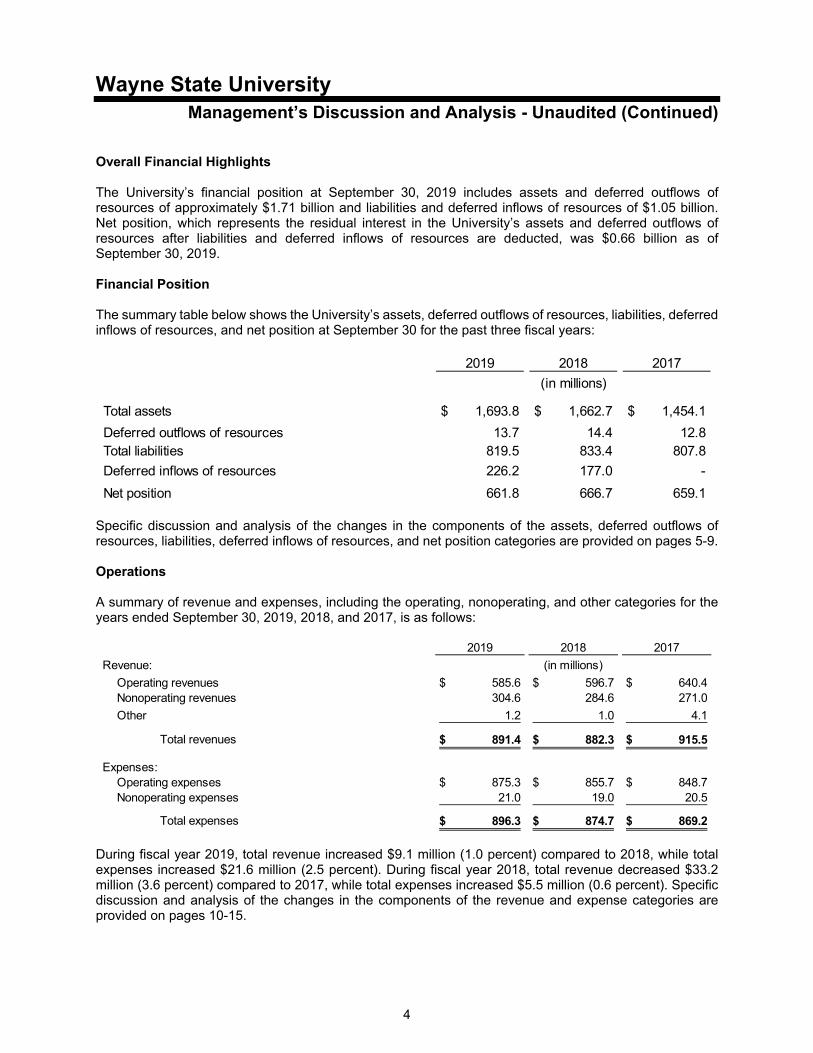
Overall Financial Highlights The University’s financial position at September 30, 2019 includes assets and deferred outflows of resources of approximately $1.71 billion and liabilities and deferred inflows of resources of $1.05 billion. Net position, which represents the residual interest in the University’s assets and deferred outflows of resources after liabilities and deferred inflows of resources are deducted, was $0.66 billion as of September 30, 2019. Financial Position The summary table below shows the University’s assets, deferred outflows of resources, liabilities, deferred inflows of resources, and net position at September 30 for the past three fiscal years:
2019 2018 2017
Total assets 1,693.8$ 1,662.7$ 1,454.1$
Deferred outflows of resources 13.7 14.4 12.8 Total liabilities 819.5 833.4 807.8
Deferred inflows of resources 226.2 177.0 -
Net position 661.8 666.7 659.1
(in millions)
Specific discussion and analysis of the changes in the components of the assets, deferred outflows of resources, liabilities, deferred inflows of resources, and net position categories are provided on pages 5-9. Operations A summary of revenue and expenses, including the operating, nonoperating, and other categories for the years ended September 30, 2019, 2018, and 2017, is as follows:
2019 2018 2017
Revenue:
Operating revenues 585.6$ 596.7$ 640.4$ Nonoperating revenues 304.6 284.6 271.0
Other 1.2 1.0 4.1
Total revenues 891.4$ 882.3$ 915.5$
Expenses:Operating expenses 875.3$ 855.7$ 848.7$ Nonoperating expenses 21.0 19.0 20.5
Total expenses 896.3$ 874.7$ 869.2$
(in millions)
During fiscal year 2019, total revenue increased $9.1 million (1.0 percent) compared to 2018, while total expenses increased $21.6 million (2.5 percent). During fiscal year 2018, total revenue decreased $33.2 million (3.6 percent) compared to 2017, while total expenses increased $5.5 million (0.6 percent). Specific discussion and analysis of the changes in the components of the revenue and expense categories are provided on pages 10-15.

Wayne State University
5
Management’s Discussion and Analysis - Unaudited (Continued)
Statement of Net Position The statement of net position presents the financial position of the University at the end of each fiscal year and includes all assets, deferred outflows of resources, liabilities, and deferred inflows of resources of the University. Net position is one key indicator of the current financial position of the University, while the change in net position is a key indicator of how the current year’s operations affected the overall financial condition of the University. Assets, deferred outflows of resources, deferred inflows of resources, and liabilities are generally measured using current values. One notable exception is capital assets, which are stated at historical cost less accumulated depreciation. A summarized comparison of the University’s assets, deferred outflows of resources, liabilities, deferred inflows of resources, and net position at September 30, 2019, 2018, and 2017 is as follows:
2019 2018 2017
Current assets 587.3$ 596.0$ 570.3$ Noncurrent assets:
Investments 78.8 106.8 4.1 Capital assets - Net of depreciation 996.3 926.1 842.7 Other 31.4 33.8 37.0
Total assets 1,693.8 1,662.7 1,454.1
Deferred outflows of resources 13.7 14.4 12.8
Current liabilities 313.7 312.3 300.5 Noncurrent liabilities:
Long-term debt - Net of current portion 448.8 464.7 446.5 Other 57.0 56.4 60.8
Total liabilities 819.5 833.4 807.8
Deferred inflows of resources 226.2 177.0 -
Total net position 661.8$ 666.7$ 659.1$
(in millions)
Current Assets and Liabilities
Current assets are comprised primarily of cash and cash equivalents, current investments, and receivables. In 2019, current assets decreased $8.7 million (1.5 percent) to $587.3 million compared to $596.0 million at September 30, 2018. This decrease consisted of a decrease in cash and cash equivalents and current investments of $9.1 million, and a decrease in net current receivables of $3.1 million, partially offset by an increase in other assets of $3.5 million. Changes in cash and cash equivalents and current investments are the result of the University’s overall operating performance and timing. In 2018, current assets increased $25.7 million (4.5 percent) to $596.0 million compared to $570.3 million at September 30, 2017. The increase was attributable to an increase in cash and temporary investments of $71.1 million, partially offset by a decline in net current receivables of $45.4 million.
Wayne State University
6
Management’s Discussion and Analysis - Unaudited (Continued)
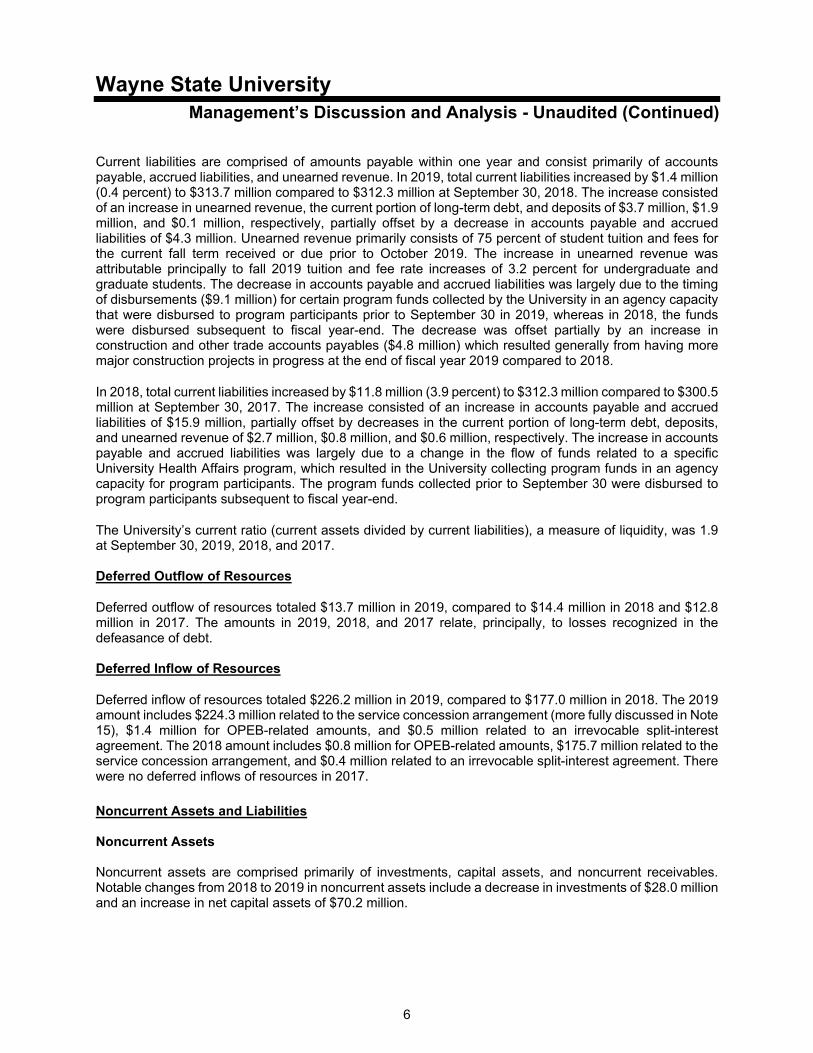
Current liabilities are comprised of amounts payable within one year and consist primarily of accounts payable, accrued liabilities, and unearned revenue. In 2019, total current liabilities increased by $1.4 million (0.4 percent) to $313.7 million compared to $312.3 million at September 30, 2018. The increase consisted of an increase in unearned revenue, the current portion of long-term debt, and deposits of $3.7 million, $1.9 million, and $0.1 million, respectively, partially offset by a decrease in accounts payable and accrued liabilities of $4.3 million. Unearned revenue primarily consists of 75 percent of student tuition and fees for the current fall term received or due prior to October 2019. The increase in unearned revenue was attributable principally to fall 2019 tuition and fee rate increases of 3.2 percent for undergraduate and graduate students. The decrease in accounts payable and accrued liabilities was largely due to the timing of disbursements ($9.1 million) for certain program funds collected by the University in an agency capacity that were disbursed to program participants prior to September 30 in 2019, whereas in 2018, the funds were disbursed subsequent to fiscal year-end. The decrease was offset partially by an increase in construction and other trade accounts payables ($4.8 million) which resulted generally from having more major construction projects in progress at the end of fiscal year 2019 compared to 2018.
In 2018, total current liabilities increased by $11.8 million (3.9 percent) to $312.3 million compared to $300.5 million at September 30, 2017. The increase consisted of an increase in accounts payable and accrued liabilities of $15.9 million, partially offset by decreases in the current portion of long-term debt, deposits, and unearned revenue of $2.7 million, $0.8 million, and $0.6 million, respectively. The increase in accounts payable and accrued liabilities was largely due to a change in the flow of funds related to a specific University Health Affairs program, which resulted in the University collecting program funds in an agency capacity for program participants. The program funds collected prior to September 30 were disbursed to program participants subsequent to fiscal year-end.
The University’s current ratio (current assets divided by current liabilities), a measure of liquidity, was 1.9 at September 30, 2019, 2018, and 2017. Deferred Outflow of Resources
Deferred outflow of resources totaled $13.7 million in 2019, compared to $14.4 million in 2018 and $12.8 million in 2017. The amounts in 2019, 2018, and 2017 relate, principally, to losses recognized in the defeasance of debt. Deferred Inflow of Resources
Deferred inflow of resources totaled $226.2 million in 2019, compared to $177.0 million in 2018. The 2019 amount includes $224.3 million related to the service concession arrangement (more fully discussed in Note 15), $1.4 million for OPEB-related amounts, and $0.5 million related to an irrevocable split-interest agreement. The 2018 amount includes $0.8 million for OPEB-related amounts, $175.7 million related to the service concession arrangement, and $0.4 million related to an irrevocable split-interest agreement. There were no deferred inflows of resources in 2017. Noncurrent Assets and Liabilities Noncurrent Assets Noncurrent assets are comprised primarily of investments, capital assets, and noncurrent receivables. Notable changes from 2018 to 2019 in noncurrent assets include a decrease in investments of $28.0 million and an increase in net capital assets of $70.2 million.
Wayne State University
7
Management’s Discussion and Analysis - Unaudited (Continued)
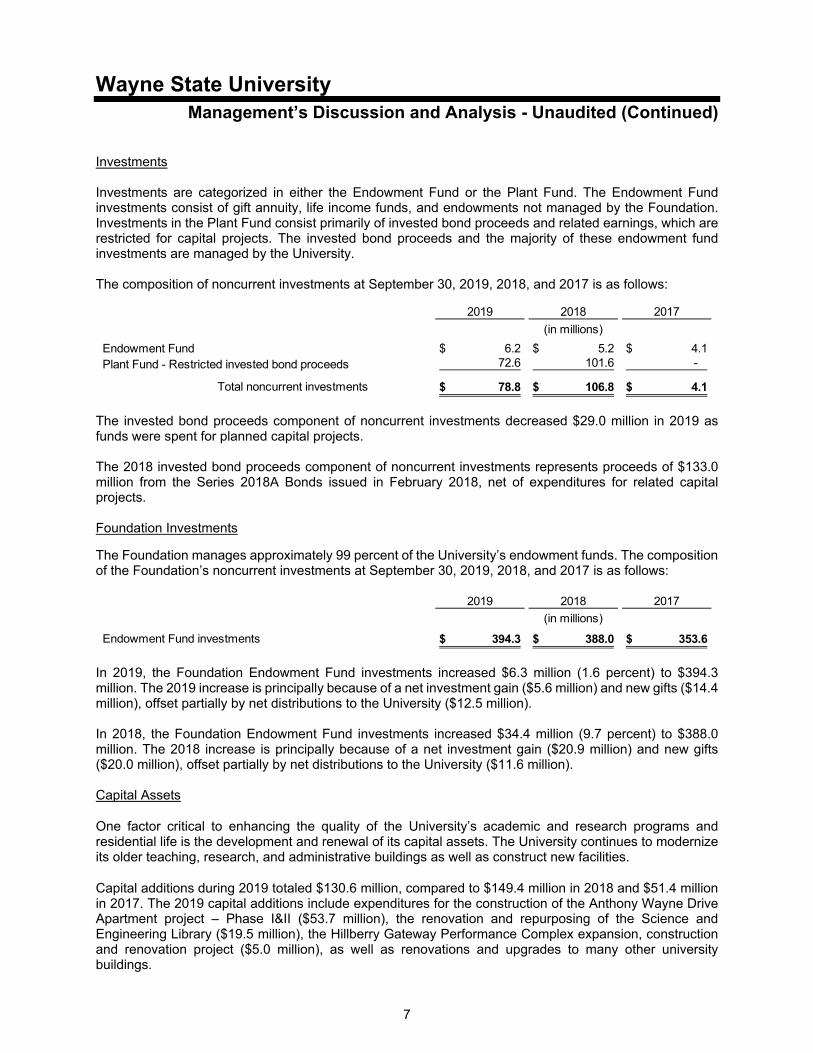
Investments Investments are categorized in either the Endowment Fund or the Plant Fund. The Endowment Fund investments consist of gift annuity, life income funds, and endowments not managed by the Foundation. Investments in the Plant Fund consist primarily of invested bond proceeds and related earnings, which are restricted for capital projects. The invested bond proceeds and the majority of these endowment fund investments are managed by the University. The composition of noncurrent investments at September 30, 2019, 2018, and 2017 is as follows:
2019 2018 2017
Endowment Fund 6.2$ 5.2$ 4.1$ Plant Fund - Restricted invested bond proceeds 72.6 101.6 -
Total noncurrent investments 78.8$ 106.8$ 4.1$
(in millions)
The invested bond proceeds component of noncurrent investments decreased $29.0 million in 2019 as funds were spent for planned capital projects. The 2018 invested bond proceeds component of noncurrent investments represents proceeds of $133.0 million from the Series 2018A Bonds issued in February 2018, net of expenditures for related capital projects. Foundation Investments
The Foundation manages approximately 99 percent of the University’s endowment funds. The composition of the Foundation’s noncurrent investments at September 30, 2019, 2018, and 2017 is as follows:
2019 2018 2017
Endowment Fund investments 394.3$ 388.0$ 353.6$
(in millions)
In 2019, the Foundation Endowment Fund investments increased $6.3 million (1.6 percent) to $394.3 million. The 2019 increase is principally because of a net investment gain ($5.6 million) and new gifts ($14.4 million), offset partially by net distributions to the University ($12.5 million). In 2018, the Foundation Endowment Fund investments increased $34.4 million (9.7 percent) to $388.0 million. The 2018 increase is principally because of a net investment gain ($20.9 million) and new gifts ($20.0 million), offset partially by net distributions to the University ($11.6 million). Capital Assets
One factor critical to enhancing the quality of the University’s academic and research programs and residential life is the development and renewal of its capital assets. The University continues to modernize its older teaching, research, and administrative buildings as well as construct new facilities.
Capital additions during 2019 totaled $130.6 million, compared to $149.4 million in 2018 and $51.4 million in 2017. The 2019 capital additions include expenditures for the construction of the Anthony Wayne Drive Apartment project – Phase I&II ($53.7 million), the renovation and repurposing of the Science and Engineering Library ($19.5 million), the Hillberry Gateway Performance Complex expansion, construction and renovation project ($5.0 million), as well as renovations and upgrades to many other university buildings.
Wayne State University
8
Management’s Discussion and Analysis - Unaudited (Continued)
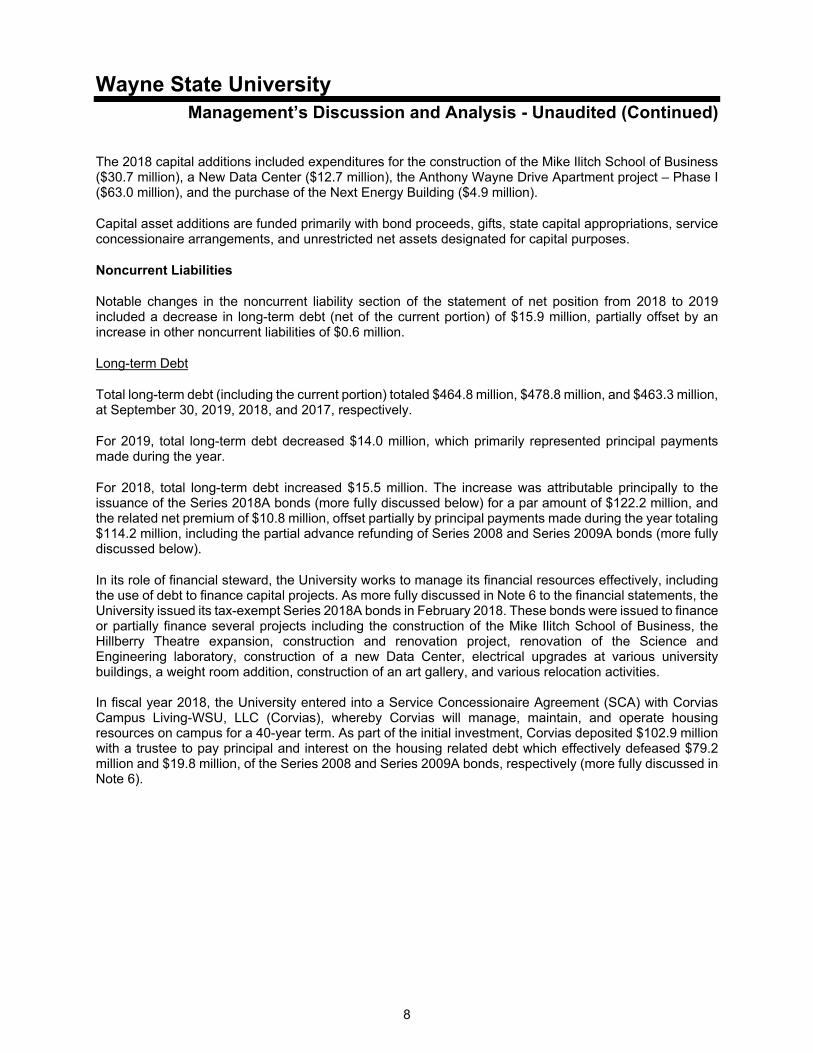
The 2018 capital additions included expenditures for the construction of the Mike Ilitch School of Business ($30.7 million), a New Data Center ($12.7 million), the Anthony Wayne Drive Apartment project – Phase I ($63.0 million), and the purchase of the Next Energy Building ($4.9 million).
Capital asset additions are funded primarily with bond proceeds, gifts, state capital appropriations, service concessionaire arrangements, and unrestricted net assets designated for capital purposes.
Noncurrent Liabilities
Notable changes in the noncurrent liability section of the statement of net position from 2018 to 2019 included a decrease in long-term debt (net of the current portion) of $15.9 million, partially offset by an increase in other noncurrent liabilities of $0.6 million.
Long-term Debt
Total long-term debt (including the current portion) totaled $464.8 million, $478.8 million, and $463.3 million, at September 30, 2019, 2018, and 2017, respectively.
For 2019, total long-term debt decreased $14.0 million, which primarily represented principal payments made during the year.
For 2018, total long-term debt increased $15.5 million. The increase was attributable principally to the issuance of the Series 2018A bonds (more fully discussed below) for a par amount of $122.2 million, and the related net premium of $10.8 million, offset partially by principal payments made during the year totaling $114.2 million, including the partial advance refunding of Series 2008 and Series 2009A bonds (more fully discussed below).
In its role of financial steward, the University works to manage its financial resources effectively, including the use of debt to finance capital projects. As more fully discussed in Note 6 to the financial statements, the University issued its tax-exempt Series 2018A bonds in February 2018. These bonds were issued to finance or partially finance several projects including the construction of the Mike Ilitch School of Business, the Hillberry Theatre expansion, construction and renovation project, renovation of the Science and Engineering laboratory, construction of a new Data Center, electrical upgrades at various university buildings, a weight room addition, construction of an art gallery, and various relocation activities. In fiscal year 2018, the University entered into a Service Concessionaire Agreement (SCA) with Corvias Campus Living-WSU, LLC (Corvias), whereby Corvias will manage, maintain, and operate housing resources on campus for a 40-year term. As part of the initial investment, Corvias deposited $102.9 million with a trustee to pay principal and interest on the housing related debt which effectively defeased $79.2 million and $19.8 million, of the Series 2008 and Series 2009A bonds, respectively (more fully discussed in Note 6).

Wayne State University
9
Management’s Discussion and Analysis - Unaudited (Continued)
Net Position
Net position represents the difference between assets, deferred outflows of resources, deferred inflows of resources, and liabilities. The University’s net position at September 30, 2019, 2018, and 2017 is summarized as follows:
2019 2018 2017
Net investment in capital assets 391.5$ 391.4$ 393.2$
Restricted:
Nonexpendable 11.3 11.1 11.3
Expendable 74.4 73.3 91.2
Unrestricted 184.6 190.9 163.4
Total net position 661.8$ 666.7$ 659.1$
(in millions)
Descriptions of the components of total net position are as follows:
Net Investment in Capital Assets - The University’s investment in capital assets, net of accumulated depreciation, and outstanding principal balances of debt issued for the acquisition, construction, or improvement of those assets. Changes from year to year result from capital additions, issuance and payments of long-term debt, retirement of assets, and depreciation expense.
Restricted:
o Nonexpendable - The corpus portion of gifts to the University’s permanent true endowment funds, certain University funds, which have been specifically allocated and restricted pursuant to specific agreements with individuals or entities, and the University’s required funding match for federal student loans and donor-restricted University loans.
o Expendable - Gifts and sponsored and governmental grants and contracts, which are subject to externally imposed restrictions governing their use (scholarships, academic and research programs, and capital projects). This category of net position also includes undistributed accretion from investments of permanent true endowments and funds functioning as endowments with externally imposed restrictions.
The restricted nonexpendable funds and the funds functioning as endowments included in the restricted expendable components of net position are directly affected by the performance of the University’s long-term investments and its spending policy.
Unrestricted - Funds which are not subject to externally imposed restrictions; however, most of the University’s unrestricted net position is designated by the board of governors and/or management for various academic, research and administrative programs, and capital projects. In 2019, unrestricted net position decreased $6.3 million (3.3 percent) to $184.6 million compared to $190.9 million and $163.4 million at September 30, 2018 and 2017, respectively. The 2018 increase of $27.5 million was attributable to increases in the General Fund ($14.5 million), Designated Fund ($3.2 million), Auxiliary Operations ($5.7 million), and the Plant Fund ($3.7 million).

Wayne State University
10
Management’s Discussion and Analysis - Unaudited (Continued)
Statement of Revenues, Expenses, and Changes in Net Position The statement of revenues, expenses, and changes in net position presents the operating results of the University, as well as the nonoperating revenues and expenses. Revenues Consistent with GASB principles, revenues are categorized as operating, nonoperating, or other. Operating revenues generally result from exchange transactions, such as revenues received for tuition and fees or grants and contracts revenue for services performed on sponsored programs. Nonoperating revenues are primarily nonexchange in nature, such as state operating appropriations and investment income. Other represents capital and endowment transactions. Summarized operating, nonoperating, and other revenues for the years ended September 30, 2019, 2018, and 2017 are presented below:
2019 2018 2017
Operating Revenues
Student tuition and fees - Gross 404.1$ 393.7$ 382.5$ Less scholarship allowances (121.2) (110.9) (103.9)
Net student tuition and fees 282.9 282.8 278.6
Grants and contracts 247.6 255.9 298.1
Departmental activities, auxiliary enterprises, and other 55.1 58.0 63.7
Total operating revenues 585.6 596.7 640.4
Nonoperating Revenues
State operating appropriation 202.4 199.2 196.1
Federal Pell grants 38.9 33.9 33.1 Gifts 22.5 27.7 22.3
Investment income:
Income and realized gains 12.9 11.6 9.7
Unrealized (loss) gain 9.2 (8.3) (2.3)
Change in fair value of derivatives 0.4 0.1 (0.3)
Net distributions from the Foundation 12.5 11.6 10.4
Other 5.8 8.8 2.0
Total nonoperating revenues 304.6 284.6 271.0
Other
State capital appropriation - - 0.6 Capital and endowment gifts 1.2 1.0 3.5
Total other 1.2 1.0 4.1
Total revenues 891.4$ 882.3$ 915.5$
(in millions)
Wayne State University
11
Management’s Discussion and Analysis - Unaudited (Continued)
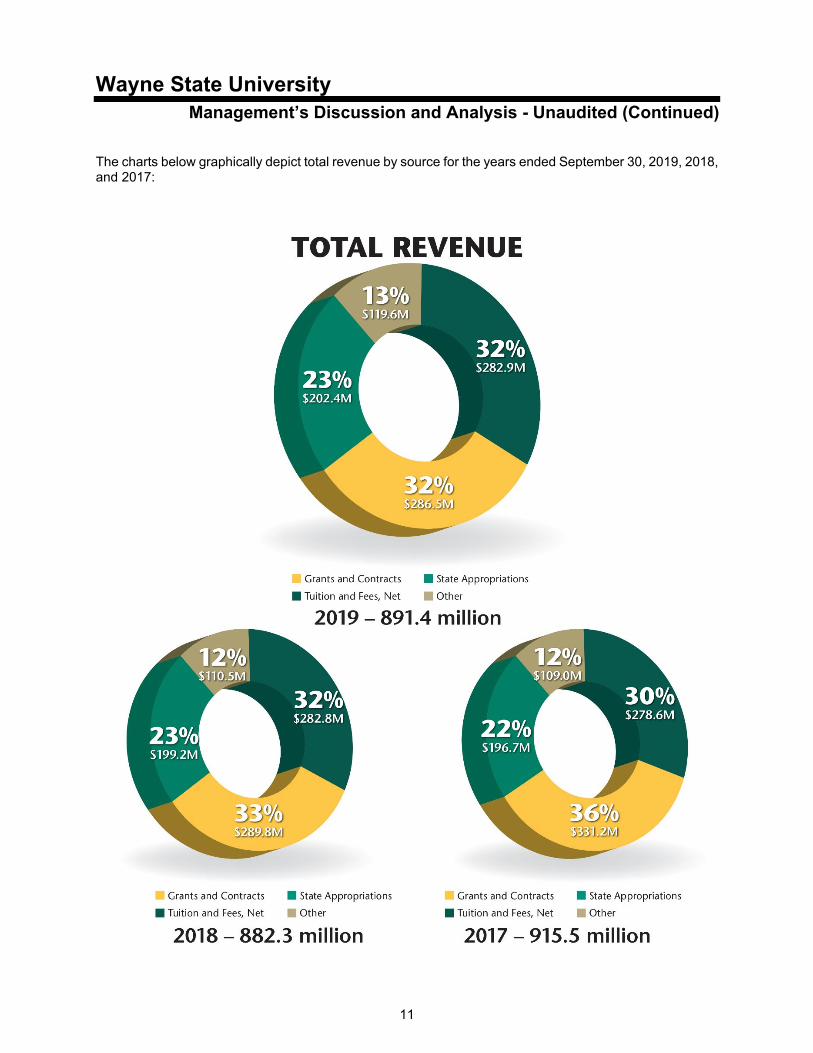
The charts below graphically depict total revenue by source for the years ended September 30, 2019, 2018, and 2017:

Wayne State University
12
Management’s Discussion and Analysis - Unaudited (Continued)
Primary Revenue Sources The University’s research and public service mission and significant components of instruction are supported primarily by federal, state, and nongovernmental grants and contracts, which, in the aggregate, typically comprise the largest revenue source to the University. The state operating appropriation and student tuition and fees represent the majority of resources available to fund the University’s General Fund operations. Operating Revenues Operating revenue totaled $585.6 million in 2019 compared to $596.7 and $640.4 million in 2018 and 2017, respectively. The 2019 decrease in total operating revenues of $11.1 million (1.9 percent) was attributable to several factors: Student Tuition and Fees - In fiscal year 2019, gross student tuition and fees increased $10.4 million and scholarship allowances increased by $10.3 million, resulting in an increase in net student tuition and fees of $0.1 million. The increase in gross student tuition and fees was attributable principally to the fall 2018 tuition rate increases for undergraduate and graduate students of 2.9 percent. The 2018 increase in gross student tuition and fees was attributable principally to the fall 2017 undergraduate lower and upper division tuition rate increases of 3.75 and 4.0 percent, respectively, combined with a slight increase in student credit hours. For financial reporting purposes, student tuition and fees and auxiliary enterprise revenue are reduced by “scholarship allowances.” These scholarship allowances represent financial aid granted to students, which is applied directly to their accounts to pay tuition and fee assessments (in the General Fund) and room and board assessments (in the Auxiliary Activities Fund). The University continues to provide a substantial amount of financial aid to mitigate the impact of tuition rate increases. In 2019, 2018, and 2017 the University provided total scholarships and fellowships of $141.1 million, $127.3 million, and $122.5 million, respectively. For 2019, the $13.8 million increase represents a 10.8 percent increase in financial aid. The increases in 2018 and 2017 of $4.8 million and $6.5 million, respectively, represent percentage increases of 3.9 and 5.6 percent, respectively. The increase in 2019 was driven by an overall increase in university scholarships and other financial aid to help minimize the impact of rising tuition rates for students in need and to provide incentives to increase student retention, combined with an increase in Federal Pell awards of $5.0 million. Grants and Contracts - Grants and contracts revenues decreased $8.3 million (3.2 percent) from 2018 to 2019. The decrease consisted of a decrease in nongovernmental grants and contracts of $14.7 million, offset partially by increases in federal grants and contracts of $3.5 million, and state and local grants and contracts of $2.9 million. The 2019 decrease in nongovernmental grants and contracts was attributable largely to an increase in adjustments to reduce certain contract receivable amounts due from affiliate organizations, deemed uncollectible, to the net realizable value ($23.9 million), offset partially by an overall increase other nongovernmental grant revenue ($9.2 million). Grants and contracts revenues decreased $42.2 million (14.2 percent) from 2017 to 2018. The decrease consisted of decreases in nongovernmental grants and contracts of $37.1 million, federal grants and contracts of $3.4 million, and state and local grants and contracts of $1.7 million. The 2018 decline was attributable largely to a decrease in program revenue for a specific University Health Affairs program.
Wayne State University
13
Management’s Discussion and Analysis - Unaudited (Continued)
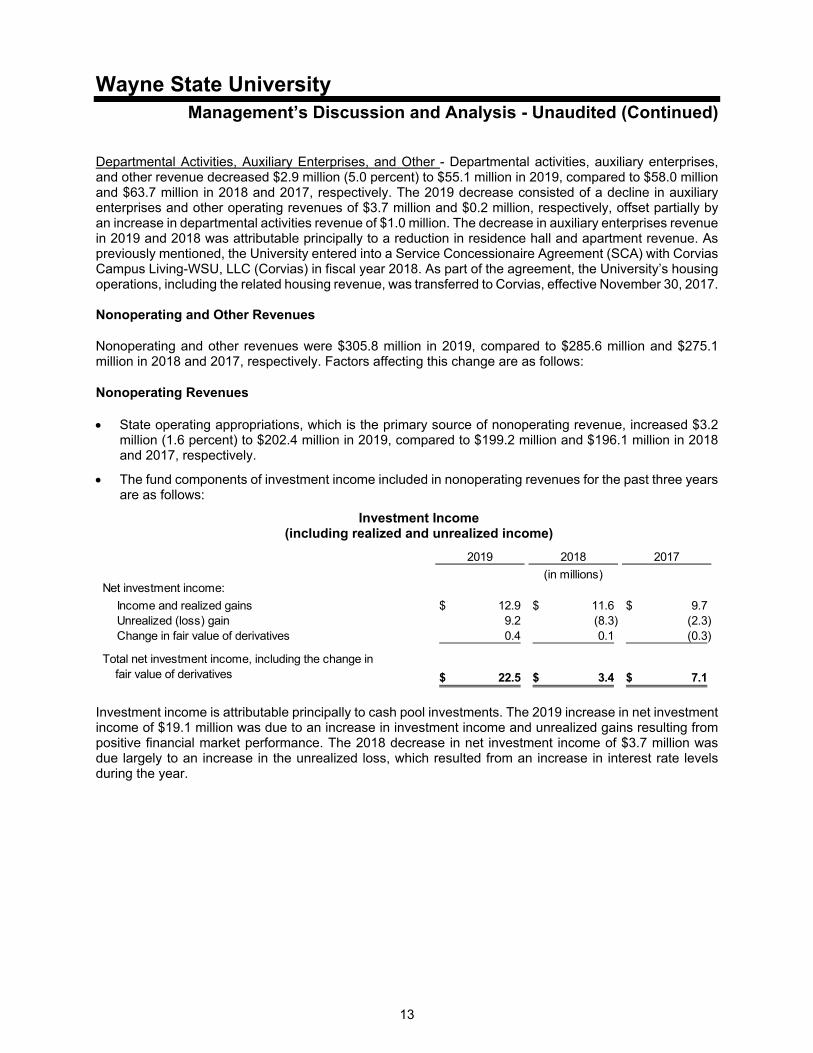
Departmental Activities, Auxiliary Enterprises, and Other - Departmental activities, auxiliary enterprises, and other revenue decreased $2.9 million (5.0 percent) to $55.1 million in 2019, compared to $58.0 million and $63.7 million in 2018 and 2017, respectively. The 2019 decrease consisted of a decline in auxiliary enterprises and other operating revenues of $3.7 million and $0.2 million, respectively, offset partially by an increase in departmental activities revenue of $1.0 million. The decrease in auxiliary enterprises revenue in 2019 and 2018 was attributable principally to a reduction in residence hall and apartment revenue. As previously mentioned, the University entered into a Service Concessionaire Agreement (SCA) with Corvias Campus Living-WSU, LLC (Corvias) in fiscal year 2018. As part of the agreement, the University’s housing operations, including the related housing revenue, was transferred to Corvias, effective November 30, 2017. Nonoperating and Other Revenues
Nonoperating and other revenues were $305.8 million in 2019, compared to $285.6 million and $275.1 million in 2018 and 2017, respectively. Factors affecting this change are as follows:
Nonoperating Revenues
State operating appropriations, which is the primary source of nonoperating revenue, increased $3.2 million (1.6 percent) to $202.4 million in 2019, compared to $199.2 million and $196.1 million in 2018 and 2017, respectively.
The fund components of investment income included in nonoperating revenues for the past three years are as follows:
Investment Income (including realized and unrealized income)
2019 2018 2017
Net investment income:
Income and realized gains 12.9$ 11.6$ 9.7$ Unrealized (loss) gain 9.2 (8.3) (2.3)Change in fair value of derivatives 0.4 0.1 (0.3)
Total net investment income, including the change in fair value of derivatives 22.5$ 3.4$ 7.1$
(in millions)
Investment income is attributable principally to cash pool investments. The 2019 increase in net investment income of $19.1 million was due to an increase in investment income and unrealized gains resulting from positive financial market performance. The 2018 decrease in net investment income of $3.7 million was due largely to an increase in the unrealized loss, which resulted from an increase in interest rate levels during the year.

Wayne State University
14
Management’s Discussion and Analysis - Unaudited (Continued)
Expenses
Operating and nonoperating expenses for the years ended September 30, 2019, 2018, and 2017 are summarized below:
2019 2018 2017
Operating expenses 875.3$ 855.7$ 848.7$ Nonoperating expenses:
Interest 20.3 19.0 20.5Other 0.7 - -
Total nonoperating expenses 21.0 19.0 20.5
Total expenses 896.3$ 874.7$ 869.2$
(in millions)
Operating expenses by both functional and natural classification for the years ended September 30, 2019, 2018, and 2017 are as follows:
2019 2018 2017
Dollars
Percentage of Total
Operating Expenses Dollars
Percentage of Total
Operating Expenses Dollars
Percentage of Total
Operating Expenses
Natural ClassificationCompensation and benefits 600.7$ 68.6% 583.7$ 68.2% 580.4$ 68.4%Supplies, services, and other 196.6 22.5% 198.2 23.2% 193.3 22.7%Depreciation 59.8 6.8% 59.1 6.9% 61.6 7.3%
Scholarships and fellowships (1)18.2 2.1% 14.7 1.7% 13.4 1.6%
Total 875.3$ 100% 855.7$ 100% 848.7$ 100%
Functional ClassificationInstruction 277.8$ 31.7% 276.3$ 32.3% 276.5$ 32.6%Research 155.2 17.7% 157.3 18.5% 156.4 18.5%Public service 65.6 7.5% 62.0 7.2% 62.2 7.3%Academic support 73.4 8.4% 68.2 8.0% 66.4 7.8%Student services 42.2 4.8% 39.6 4.6% 41.9 4.9%Institutional support 94.9 10.8% 92.7 10.8% 85.0 10.0%Operation and maintenance of plant 66.0 7.6% 62.0 7.2% 60.4 7.1%
Scholarships and fellowships (1) 18.2 2.1% 14.7 1.7% 13.4 1.6%Auxiliary enterprises 22.2 2.6% 23.8 2.8% 24.9 2.9%Depreciation 59.8 6.8% 59.1 6.9% 61.6 7.3%
Total 875.3$ 100% 855.7$ 100% 848.7$ 100%
(in millions)
(1) Excludes “scholarship allowances” applied directly to students’ tuition and room and board (see pages 10, 12, and 15).

Wayne State University
15
Management’s Discussion and Analysis - Unaudited (Continued)
Operating Expenses
Compensation and benefit expenses increased $17.0 million (2.9 percent) in 2019 to $600.7 million compared to $583.7 million and $580.4 million in 2018 and 2017, respectively. The moderate increases in 2019 and 2018 resulted primarily from inflationary increases in salary and benefit costs.
Total scholarships and fellowships granted in 2019 increased $13.8 million (10.8 percent) to $141.1 million, compared to $127.3 million in 2018. As discussed previously, the increase in 2019 was attributable principally to an overall increase in university scholarships and other financial aid, combined with an increase in Federal Pell grant awards of $5.0 million. Total scholarships and fellowships granted in 2018 increased $4.8 million (3.9 percent) to $127.3 million, compared to $122.5 million in 2017. The increase in 2018 was attributable to an overall increase in university scholarships and other financial aid. Total scholarships and fellowships granted have two components. The scholarships and fellowships reflected on the table on page 14 of $18.2 million, $14.7 million, and $13.4 million are disbursed directly to students and are reported as operating expenses in 2019, 2018, and 2017, respectively. The remaining amounts for 2019, 2018, and 2017 of $122.9 million, $112.6 million and $109.1 million, respectively, are applied directly to the students’ accounts receivable balances. These amounts are netted against student tuition and fees, or room and board in the Auxiliary Activities Fund, as “scholarship allowances” in the statement of revenue, expenses, and changes in net position on page 20. Another way to analyze this same pool of operating expenses is by function. In this regard, combined expenditures for instruction increased $1.5 million (0.5 percent) to $277.8 million in 2019, compared to $276.3 million and $276.5 million in 2018 and 2017, respectively. The expenses in 2019 and 2018 remained relatively flat. Research expenditures decreased $2.1 million (1.3 percent) in 2019 to $155.2 million, compared to $157.3 million and $156.4 million in 2018 and 2017, respectively. The decrease in 2019 was attributable to a decrease in compensation-related expenses of $1.8 million, combined with a decrease in direct expenses of $0.3 million. The expenses in 2018 remained relatively flat. Institutional support expenses increased $2.2 million (2.4 percent) in 2019 to $94.9 million, compared to $92.7 million and $85.0 million in 2018 and 2017, respectively. The increase in 2019 was attributable to an increase in compensation-related expenses of $2.1 million, combined with an increase in direct expenses of $0.1 million. The increase in 2018 was attributable to an increase in compensation-related expenses of $1.7 million, combined with an increase in direct expenses of $6.0 million. Nonoperating Expenses
Interest expense totaled $20.3 million, $19.0 million, and $20.5 million, in 2019, 2018, and 2017, respectively. Interest expense was net of a federal subsidy related to the Series 2009B Build America Bonds of $0.5 million in 2019, 2018, and 2017.
Wayne State University
16
Management’s Discussion and Analysis - Unaudited (Continued)
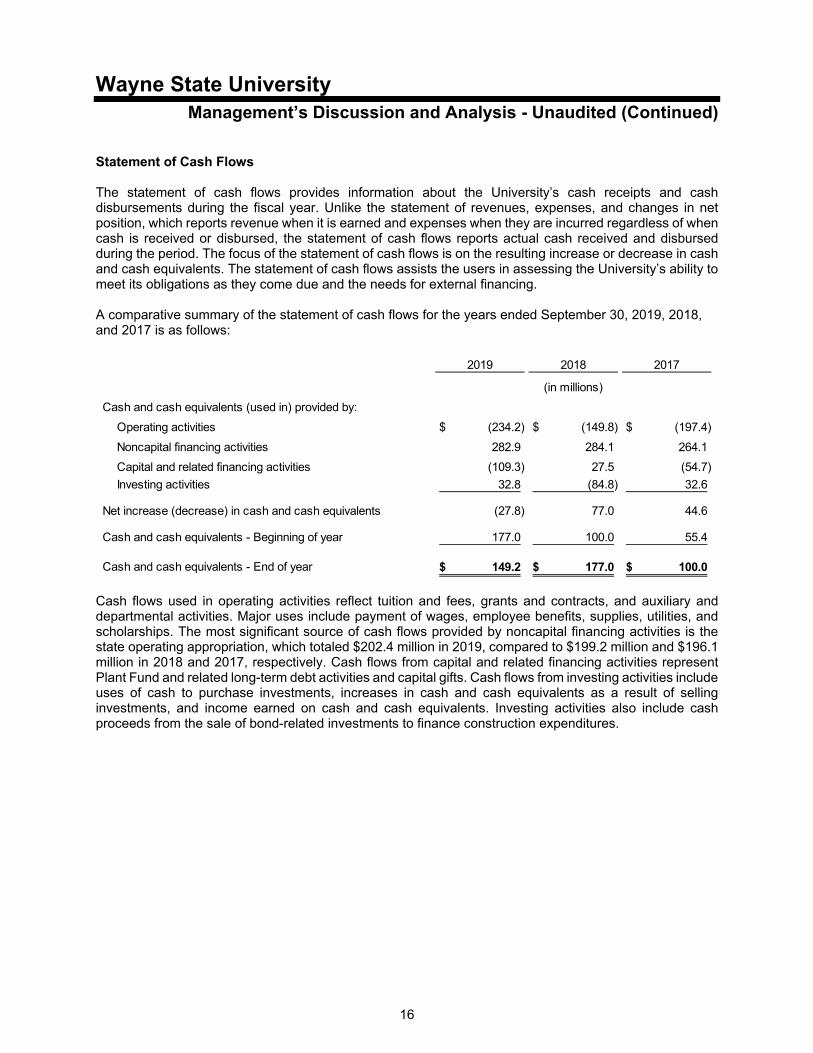
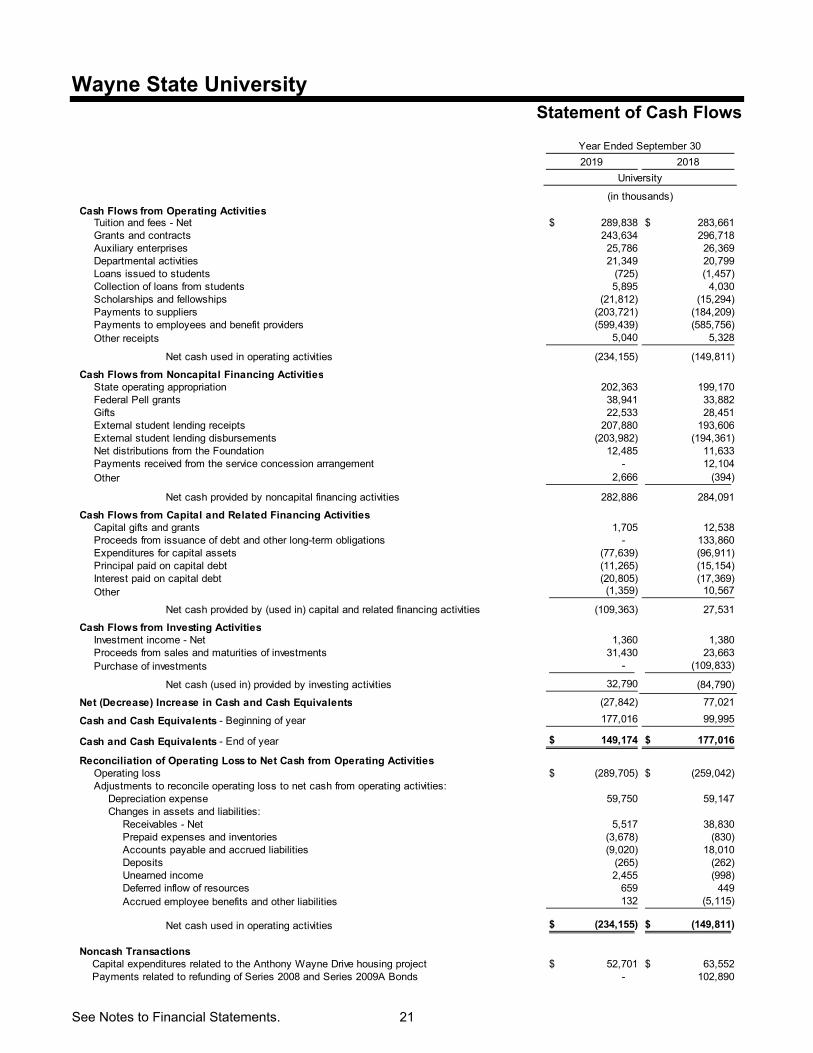
Statement of Cash Flows The statement of cash flows provides information about the University’s cash receipts and cash disbursements during the fiscal year. Unlike the statement of revenues, expenses, and changes in net position, which reports revenue when it is earned and expenses when they are incurred regardless of when cash is received or disbursed, the statement of cash flows reports actual cash received and disbursed during the period. The focus of the statement of cash flows is on the resulting increase or decrease in cash and cash equivalents. The statement of cash flows assists the users in assessing the University’s ability to meet its obligations as they come due and the needs for external financing. A comparative summary of the statement of cash flows for the years ended September 30, 2019, 2018, and 2017 is as follows:
2019 2018 2017
Cash and cash equivalents (used in) provided by:
Operating activities (234.2)$ (149.8)$ (197.4)$
Noncapital financing activities 282.9 284.1 264.1
Capital and related financing activities (109.3) 27.5 (54.7)
Investing activities 32.8 (84.8) 32.6
Net increase (decrease) in cash and cash equivalents (27.8) 77.0 44.6
Cash and cash equivalents - Beginning of year 177.0 100.0 55.4
Cash and cash equivalents - End of year 149.2$ 177.0$ 100.0$
(in millions)
Cash flows used in operating activities reflect tuition and fees, grants and contracts, and auxiliary and departmental activities. Major uses include payment of wages, employee benefits, supplies, utilities, and scholarships. The most significant source of cash flows provided by noncapital financing activities is the state operating appropriation, which totaled $202.4 million in 2019, compared to $199.2 million and $196.1 million in 2018 and 2017, respectively. Cash flows from capital and related financing activities represent Plant Fund and related long-term debt activities and capital gifts. Cash flows from investing activities include uses of cash to purchase investments, increases in cash and cash equivalents as a result of selling investments, and income earned on cash and cash equivalents. Investing activities also include cash proceeds from the sale of bond-related investments to finance construction expenditures.

Wayne State University
17
Management’s Discussion and Analysis - Unaudited (Continued)
Economic Factors That Will Affect the Future Higher Education Industry The United States higher education industry remains stable as demand continues to be strong and enrollment is steady. The long-term outlook for higher education is favorable as the number of careers requiring degrees and advanced degrees continues to grow. The lifetime earnings disparity between degreed and non-degreed individuals strongly supports the value of higher education. Despite the strong demand, the sector continues to face a multi-faceted set of challenges. There are continuous pressures on institutions regarding affordability, accountability, and competition. Also, there is uncertainty surrounding the federal policy for higher education and concern regarding the growth in unfunded pension liabilities. Research funding is expected to have moderate increases from both federally funded and non-federally funded agencies, with funding likely to shift to comprehensive universities that offer cross-discipline collaboration. In the short-term, institutions of higher education are experiencing very modest increases in tuition revenue. State support across the country has varied significantly from state-to-state over the last 5-years with some states still below pre-recession funding levels. Constrained revenue sources require institutions to continuously manage operating costs while balancing the competitive recruitment and retention of its faculty and staff. Universities continue to utilize debt financing and philanthropy to provide the necessary investments in campus infrastructure.
State of Michigan – Local Economy The State of Michigan budget for fiscal year 2020 included a 0.5 percent increase in operating appropriations for public universities which falls below the inflation rate of the higher education price index (HEPI). The increase in fiscal year 2020 funding is at a lower rate in comparison to the previous two fiscal years of 2 percent, respectively. While state appropriations has continued to increase in recent years, the total support for public universities remains well below historical amounts in nominal value. Michigan continues to forecast a shortage of degreed graduates emphasizing the importance of higher education for the State. Of the top 50 good paying and growing occupations in Michigan through 2024, 43 require some level of higher education and 36 require a bachelor’s degree or higher. The Michigan economy is expected to remain stable over the next two years. Moderate growth is expected in state-level gross domestic product but slower than the national average. Employment is forecasted to remain flat. Wage and salary growth is anticipated to increase at a rate slightly under the national average. Wayne State University The University is positioning itself to address the challenges and opportunities guided by its strategic plan, Distinctively Wayne State University. The strategic plan sets forth seven pillars of focus:
Student success – Students remain the University’s top priority, and it will provide students with the tools and experience that they need to learn and succeed. Academic excellence, innovative pedagogies, collaborative and interdisciplinary research, career preparation, global experiences, and deep engagement in cultural diversity within a dynamic urban environment all create a “Distinctively Wayne State” student experience.

Wayne State University
18
Management’s Discussion and Analysis - Unaudited (Continued)
Teaching excellence – The University will use both proven and thoughtfully innovative, evidence-based, high-impact practices, and culturally responsive and reflective pedagogies to increase the levels of student engagement and learning outcomes, as well as promote greater academic performance and achievement.
Research – The University will increase strategic integrative research and nurture the broad ecosystem for scholarly inquiry, discovery, creativity, and urban location. The University believes the research ecosystem is a key driver for economic growth, for revitalization in Detroit, and for addressing real-world challenges in a rapidly evolving urban environment. By engaging students at all levels enhances the research mission as well as their participation with the University and preparation for careers.
Diversity and inclusion – The University strives to have an inclusive environment where diversity is valued broadly and appreciate the ability of every person to contribute to over diversity of thought. The University’s rich multicultural experiences enable us to develop exportable programs and curricula, which provide leadership in a multicultural society.
Entrepreneurship – The University strives to become a bustling hub of innovation, where new ideas are constantly developed into new ventures; students and faculty collaborate through TechTown Detroit to mentor community, urban, and minority entrepreneurs; and industry leaders and startup CEOs seek innovative resources. The lively exchange of new ideas and the innovative collaboration both on and off campus will allow the translation of research and development into entrepreneurship, which will permeate the campus culture and increase the growth and vitality of the University, the city, and region.
Community engagement – The University encourages every faculty member, administrator, and student to participate in meaningful, sustainable, and mutually beneficial relationships with the community. The experiential learning and community service are vital to the academic mission.
Financial and operational – The University is committed to grow revenue and increase the efficiency and effectiveness of business processes in order to provide adequate resources to support the University’s mission while maintaining a value-based tuition structure.

Wayne State University
See Notes to Financial Statements. 19
Statement of Net Position
University
Wayne State
University
Foundation
(DCU) Total University
Wayne State
University
Foundation
(DCU) Total
Assets
Current AssetsCash and cash equivalents 149,174$ 4,716$ 153,890$ 177,016$ 3,630$ 180,646$ Investments 267,876 - 267,876 249,088 - 249,088 Current receivables - Net (Note 4) 124,212 736 124,948 127,308 253 127,561 Inventories 1,131 - 1,131 1,204 - 1,204 Prepaid expenses and deposits 44,948 - 44,948 41,270 - 41,270
Total current assets 587,341 5,452 592,793 595,886 3,883 599,769
Noncurrent AssetsEndowment investments 6,213 394,329 400,542 5,183 388,023 393,206 Restricted investments 72,533 - 72,533 101,664 - 101,664 Noncurrent receivables - Net (Note 4) 30,731 30 30,761 33,503 38 33,541 Derivative instruments (Note 7) 677 - 677 265 - 265 Capital assets - Net (Note 5) 996,321 - 996,321 926,169 - 926,169
Total noncurrent assets 1,106,475 394,359 1,500,834 1,066,784 388,061 1,454,845
Total assets 1,693,816 399,811 2,093,627 1,662,670 391,944 2,054,614
Deferred Outflows of Resources 13,735 - 13,735 14,405 - 14,405
LiabilitiesCurrent Liabilities
Accounts payable and accrued liabilities 111,163 591 111,754 115,502 290 115,792 Unearned revenue 179,981 - 179,981 176,265 - 176,265 Deposits 6,480 - 6,480 6,461 - 6,461 Long-term debt - Current portion (Note 6) 16,026 - 16,026 14,092 - 14,092
Total current liabilities 313,650 591 314,241 312,320 290 312,610
Noncurrent LiabilitiesFederal portion of student loan funds 29,092 - 29,092 28,097 - 28,097 Accrued employee benefits and other liabilities 27,934 - 27,934 28,282 - 28,282 Long-term debt - Net of current portion (Note 6) 448,816 - 448,816 464,735 - 464,735
Total noncurrent liabilities 505,842 - 505,842 521,114 - 521,114
Total liabilities 819,492 591 820,083 833,434 290 833,724
Deferred Inflows of Resources (Note 1) 226,237 - 226,237 176,967 - 176,967
Net Position
Net investment in capital assets 391,506 - 391,506 391,412 - 391,412 Restricted nonexpendable:
Scholarships, research, academic support, and other 2,290 228,178 230,468 2,234 214,134 216,368 Loans 9,022 - 9,022 8,883 - 8,883
Restricted expendable:
Scholarships, research, academic support, and other 65,426 163,218 228,644 66,287 169,893 236,180 Capital projects 8,994 - 8,994 7,007 - 7,007
Unrestricted 184,584 7,824 192,408 190,851 7,627 198,478
Total net position 661,822$ 399,220$ 1,061,042$ 666,674$ 391,654$ 1,058,328$
(in thousands)
September 30, 2019 September 30, 2018
Wayne State University
See Notes to Financial Statements. 20
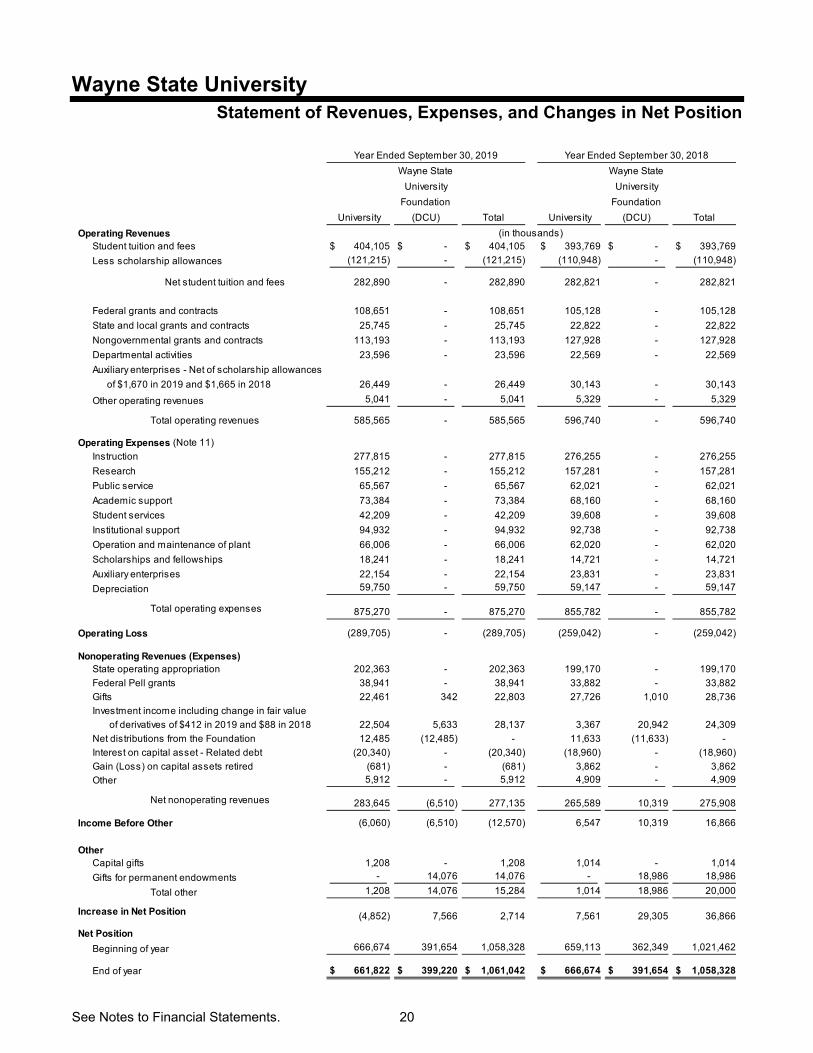
Statement of Revenues, Expenses, and Changes in Net Position
University
Wayne State
University
Foundation
(DCU) Total University
Wayne State
University
Foundation
(DCU) Total
Operating RevenuesStudent tuition and fees 404,105$ - $ 404,105$ 393,769$ - $ 393,769$
Less scholarship allowances (121,215) - (121,215) (110,948) - (110,948)
Net student tuition and fees 282,890 - 282,890 282,821 - 282,821
Federal grants and contracts 108,651 - 108,651 105,128 - 105,128
State and local grants and contracts 25,745 - 25,745 22,822 - 22,822
Nongovernmental grants and contracts 113,193 - 113,193 127,928 - 127,928
Departmental activities 23,596 - 23,596 22,569 - 22,569
Auxiliary enterprises - Net of scholarship allowances
of $1,670 in 2019 and $1,665 in 2018 26,449 - 26,449 30,143 - 30,143
Other operating revenues 5,041 - 5,041 5,329 - 5,329
Total operating revenues 585,565 - 585,565 596,740 - 596,740
Operating Expenses (Note 11)
Instruction 277,815 - 277,815 276,255 - 276,255
Research 155,212 - 155,212 157,281 - 157,281
Public service 65,567 - 65,567 62,021 - 62,021
Academic support 73,384 - 73,384 68,160 - 68,160
Student services 42,209 - 42,209 39,608 - 39,608
Institutional support 94,932 - 94,932 92,738 - 92,738
Operation and maintenance of plant 66,006 - 66,006 62,020 - 62,020
Scholarships and fellowships 18,241 - 18,241 14,721 - 14,721
Auxiliary enterprises 22,154 - 22,154 23,831 - 23,831
Depreciation 59,750 - 59,750 59,147 - 59,147
Total operating expenses 875,270 - 875,270 855,782 - 855,782
Operating Loss (289,705) - (289,705) (259,042) - (259,042)
Nonoperating Revenues (Expenses)State operating appropriation 202,363 - 202,363 199,170 - 199,170
Federal Pell grants 38,941 - 38,941 33,882 - 33,882
Gifts 22,461 342 22,803 27,726 1,010 28,736
Investment income including change in fair value
of derivatives of $412 in 2019 and $88 in 2018 22,504 5,633 28,137 3,367 20,942 24,309
Net distributions from the Foundation 12,485 (12,485) - 11,633 (11,633) -
Interest on capital asset - Related debt (20,340) - (20,340) (18,960) - (18,960)
Gain (Loss) on capital assets retired (681) - (681) 3,862 - 3,862
Other 5,912 - 5,912 4,909 - 4,909
Net nonoperating revenues 283,645 (6,510) 277,135 265,589 10,319 275,908
Income Before Other (6,060) (6,510) (12,570) 6,547 10,319 16,866
Other Capital gifts 1,208 - 1,208 1,014 - 1,014
Gifts for permanent endowments - 14,076 14,076 - 18,986 18,986
Total other 1,208 14,076 15,284 1,014 18,986 20,000
Increase in Net Position (4,852) 7,566 2,714 7,561 29,305 36,866
Net Position
Beginning of year 666,674 391,654 1,058,328 659,113 362,349 1,021,462
End of year 661,822$ 399,220$ 1,061,042$ 666,674$ 391,654$ 1,058,328$
(in thousands)
Year Ended September 30, 2018Year Ended September 30, 2019
Wayne State University
See Notes to Financial Statements. 21
Statement of Cash Flows
2019 2018
Cash Flows from Operating ActivitiesTuition and fees - Net 289,838$ 283,661$ Grants and contracts 243,634 296,718 Auxiliary enterprises 25,786 26,369 Departmental activities 21,349 20,799 Loans issued to students (725) (1,457) Collection of loans from students 5,895 4,030 Scholarships and fellowships (21,812) (15,294) Payments to suppliers (203,721) (184,209) Payments to employees and benefit providers (599,439) (585,756) Other receipts 5,040 5,328
Net cash used in operating activities (234,155) (149,811)
Cash Flows from Noncapital Financing ActivitiesState operating appropriation 202,363 199,170 Federal Pell grants 38,941 33,882 Gifts 22,533 28,451 External student lending receipts 207,880 193,606 External student lending disbursements (203,982) (194,361) Net distributions from the Foundation 12,485 11,633 Payments received from the service concession arrangement - 12,104 Other 2,666 (394)
Net cash provided by noncapital financing activities 282,886 284,091
Cash Flows from Capital and Related Financing ActivitiesCapital gifts and grants 1,705 12,538 Proceeds from issuance of debt and other long-term obligations - 133,860 Expenditures for capital assets (77,639) (96,911) Principal paid on capital debt (11,265) (15,154) Interest paid on capital debt (20,805) (17,369) Other (1,359) 10,567
Net cash provided by (used in) capital and related financing activities (109,363) 27,531
Cash Flows from Investing ActivitiesInvestment income - Net 1,360 1,380 Proceeds from sales and maturities of investments 31,430 23,663 Purchase of investments - (109,833)
Net cash (used in) provided by investing activities 32,790 (84,790)
Net (Decrease) Increase in Cash and Cash Equivalents (27,842) 77,021
Cash and Cash Equivalents - Beginning of year 177,016 99,995
Cash and Cash Equivalents - End of year 149,174$ 177,016$
Reconciliation of Operating Loss to Net Cash from Operating ActivitiesOperating loss (289,705)$ (259,042)$ Adjustments to reconcile operating loss to net cash from operating activities:
Depreciation expense 59,750 59,147 Changes in assets and liabilities:
Receivables - Net 5,517 38,830 Prepaid expenses and inventories (3,678) (830) Accounts payable and accrued liabilities (9,020) 18,010 Deposits (265) (262) Unearned income 2,455 (998) Deferred inflow of resources 659 449 Accrued employee benefits and other liabilities 132 (5,115)
Net cash used in operating activities (234,155)$ (149,811)$
Noncash Transactions Capital expenditures related to the Anthony Wayne Drive housing project 52,701$ 63,552$ Payments related to refunding of Series 2008 and Series 2009A Bonds - 102,890
Year Ended September 30
(in thousands)
University
Wayne State University Notes to Financial Statements September 30, 2019 and 2018
22
Note 1 - Basis of Presentation and Significant Accounting Policies
Overview
Wayne State University (the “University”) is a state-supported institution with a fall 2019 enrollment of approximately 26,800 students. The financial statements include the individual schools, colleges, and departments of the University (the primary government) and the controlled organization which is a discretely presented component unit (DCU). The controlled organization of the University is the Wayne State University Foundation (the “Foundation”), which manages approximately 99 percent of the University’s endowment funds. The Foundation is a legally separate, tax-exempt entity which meets the criteria set forth for component units under GASB Statement No. 39, Determining Whether Certain Organizations are Component Units, as amended by GASB No. 61. The Foundation provides financial support for the objectives, purposes, and programs of the University. The University controls the timing and amount of its receipts from the Foundation, and the resources (and income thereon) which the Foundation holds and invests are dedicated to benefit the University. Because the resources held by the Foundation can only be used by, or for the benefit of, the University, the Foundation is considered a component unit (DCU) of the University and its statement of net position and statement of revenues, expenses, and changes in net position are discretely presented in the University’s financial statements. The Foundation does not issue its own financial statements.
While the University is a political subdivision of the State of Michigan, it is not a component unit of the State of Michigan, as defined by the provisions of Governmental Accounting Standards Board (GASB) Statement No. 14, The Financial Reporting Entity, as amended by GASB No. 61. The University is classified as a state instrumentality under Internal Revenue Code Section 115 and is also classified as an educational organization under Internal Revenue Code Section 501(c)(3) and is generally exempt from federal and state income taxes. Certain activities of the University may be subject to taxation as unrelated business income under Internal Revenue Code Sections 511 to 514.
Basis of Presentation
The financial statements have been prepared in accordance with generally accepted accounting principles in the United States as prescribed by the Governmental Accounting Standards Board (GASB). The University reports as a special purpose government engaged primarily in business-type activities (BTA), as defined by the GASB using the economic resources measurement focus, on the accrual basis. Business-type activities are those that are financed in whole or in part by fees charged to external parties for goods and services. Summary of Significant Accounting Policies
Scholarships and fellowships applied directly to student accounts are shown as a reduction to gross student tuition and fees and auxiliary enterprises revenue. Scholarships and fellowships disbursed directly to students are presented as scholarship and fellowship expenses. Operating activities, as reported in the statement of revenues, expenses, and changes in net position, are those activities that generally result from exchange transactions, such as revenues received for tuition and fees, grants and contracts revenue for services performed on sponsored programs, or expenses paid for goods or services. Nonoperating revenues are generally nonexchange in nature. State appropriations, Pell grant revenue, gifts, and investment activity are nonexchange transactions.
Wayne State University Notes to Financial Statements September 30, 2019 and 2018
23
Note 1 - Basis of Presentation and Significant Accounting Policies (Continued)
Preparation of financial statements in conformity with accounting principles generally accepted in the United States of America requires management to make estimates and assumptions that affect amounts reported in the financial statements and accompanying notes. Actual results may differ from those estimates. Cash and Cash Equivalents – Cash and cash equivalents include highly liquid, short-term investments (90 days or less) that bear little if no market risk and includes the liquidity pool component of the University’s cash pool. Small allocations to cash and cash equivalents are also held in the liquidity reserve pool and the diversified pool components of the cash pool, and the Foundation’s endowments. Any cash balances held in these funds at the date of these financial statements are due to timing of reinvesting the proceeds in the fund. Investments - Investments in marketable securities are recorded at market value as established by the major securities markets. Purchases and sales of investments are accounted for on the trade date basis. Realized and unrealized gains and losses are reported as investment income. Nonmarketable investments are valued based on the most recent available data. Investments include the liquidity reserve pool and the diversified pool components of the cash pool and the Foundation’s endowments. Investments also include invested bond proceeds and related earnings.
For donor-restricted endowments, the Uniform Prudent Management of Institutional Funds Acts, as adopted in Michigan on September 15, 2009, permits the board of governors to spend an amount of realized and unrealized endowment appreciation, as they deem prudent. The University’s policy is to retain the realized and unrealized appreciation with the endowment after the spending policy distributions are applied. Effective April 1, 2017, the University completed a transition from annual distributions equal to 5.00 percent of the three-year moving average of the market value of the endowment fund, measured at quarterly intervals, to annual distributions equal to 4.50 percent of a three-year moving average of the market value of endowment assets, measured at quarterly intervals. Of this annual distribution, 4.05 percent is transferred to the beneficiary or operating program accounts and 0.45 percent is used for administration of the University’s development efforts. The Foundation follows the spending policy established by the University. Unearned Revenue - Unearned revenue represents amounts received and/or receivable in advance of an event or in advance of incurring the related costs. This includes 75 percent of the student tuition and fees for the current fall term received or due prior to October 1, with the remaining 25 percent being recognized as revenue during the current fiscal year. It also includes amounts received from grant and contract sponsors which have not yet been earned under the terms of the underlying agreements. Unearned revenue will be recognized as revenue in subsequent periods commensurate with generally accepted accounting principles and/or the applicable grant and contract terms and conditions. Derivative Instruments - Derivative instruments consist of interest rate swap agreements and are stated at fair value based on the proprietary pricing model. Compensated Absences - Certain University employees earn vacation and sick leave benefits based, in part, on length of service. After the completion of the probation period, vacation pay is fully vested when earned. Upon separation from service, employees are paid accumulated vacation and sick pay based upon the nature of separation (death, retirement, or termination). Certain limitations have been placed on the hours of vacation and sick leave that employees may accumulate and carry over for payment at death, retirement, or termination. Unused hours exceeding these limitations are forfeited.
Wayne State University Notes to Financial Statements September 30, 2019 and 2018
24
Note 1 - Basis of Presentation and Significant Accounting Policies (Continued) Inventories - Inventories are stated at the lower of cost or market, determined by the first-in, first-out method. Prepaid Expenses and Deposits - Prepaid expenses and deposits primarily represent cash payments made in advance of when the related expenditures are recognized for financial statement purposes. The balances at fiscal year-end consist primarily of prepaid student financial aid, which is paid to students at the beginning of the fall term each fiscal year, with the expense recognized for accounting purposes over the financial reporting period (fall semester) to which it relates. Capital Assets - Capital assets are recorded at cost or, if acquired by gift, at the fair market value as of the date of donation. Depreciation is computed on the straight-line method over the estimated service lives (5 to 40 years) of the respective assets.
Deferred Outflows of Resources - In addition to assets, the statement of net position reports a separate section for deferred outflows of resources. This separate financial statement element represents a consumption of net position that applies to a future period and so will not be recognized as an outflow of resources (expense) until then. The University reports deferred outflows of resources of $12,400 for OPEB-related amounts discussed in Note 12 and $13,723,000 related to the losses recognized in debt defeasance as of September 30, 2019. The University reported deferred outflows of resources of $9,000 for OPEB-related amounts and $14,396,000 related to the losses recognized in debt defeasance as of September 30, 2018. Deferred Inflows of Resources - In addition to liabilities, the statement of financial position will sometimes report a separate section for deferred inflows of resources. This separate financial statement element represents an acquisition of net position that applies to a future period(s) and will not be recognized as an inflow of resources (revenue) until that time.
The University reports deferred inflows of resources of $1,387,000 for OPEB-related amounts discussed in Note 12, $224,359,000 related to the service concession arrangement discussed in Note 15, and $491,000 related to an irrevocable split-interest agreement at September 30, 2019. The University reports deferred inflows of resources of $840,000 for OPEB-related amounts, $175,720,000 related to the service concession arrangement, and $407,000 related to an irrevocable split-interest agreement at September 30, 2018. Net Position - Consistent with GASB principles, the University reports its net position in four categories as follows:
Net Investment in Capital Assets - The University’s investment in capital assets, net of
accumulated depreciation, and outstanding principal balances of debt issued for the acquisition, construction, or improvement of those assets. Deferred inflows of resources associated with the aforementioned are also included in this component of net position. Changes from year to year result from capital additions, issuance and payments of long-term debt, retirement of assets, amortization of deferred inflows of resources and depreciation expense.
Restricted Nonexpendable - The corpus portion of gifts to the University’s permanent true endowment funds, certain university funds which have been specifically allocated and restricted pursuant to specific agreements with individuals or entities, and the University’s required funding match for federal student loans and donor-restricted university loans.
Wayne State University Notes to Financial Statements September 30, 2019 and 2018
25
Note 1 - Basis of Presentation and Significant Accounting Policies (Continued)
Restricted Expendable - Gifts and sponsored and governmental grants and contracts, which are subject to externally imposed restrictions governing their use (scholarships, academic and research programs, and capital projects). This category of net position also includes undistributed accretion from investments of permanent true endowments and funds functioning as endowments with externally imposed restrictions.
Unrestricted - Funds which are not subject to externally imposed restrictions; however, most of the University’s unrestricted net position is designated by the board of governors and/or management for various academic, research, and administrative programs and capital projects.
It is the University’s policy to apply restricted resources first when an expense is incurred for purposes for which both restricted and unrestricted net position are available.
Revenue Recognition - State operating appropriations are recognized in the period for which they are appropriated. Grants and contract revenue are recognized as the related expenditures are incurred. State capital appropriations, funded through the State Building Authority, are recognized as eligible capital project expenditures are incurred. Pledges and bequests of financial support from corporations, foundations, and individuals are recognized as revenue when a pledge representing an unconditional promise to give is received and all eligibility requirements, including time requirements, have been met. In the absence of such a promise, revenue is recognized when the gift is received. Endowment pledges and conditional promises do not meet eligibility requirements, as defined by GASB Statement No. 33, Financial Reporting for Non-Exchange Transactions, and are not recorded as assets until the related gifts are received. Donor unconditional promises to give that are expected to be collected in future years are recorded at the present value of the estimated future cash flows. The discounts on these amounts are computed using risk-free interest rates applicable to the years in which the promises are made, commensurate with expected future payments. The allowance for uncollectible pledge receivables is provided based on management’s judgment of potential uncollectible amounts. The University disbursed approximately $203,982,000 and $194,361,000 in 2019 and 2018, respectively, for student loans through the U.S. Department of Education federal direct lending and federal guaranteed student loan programs. These disbursements and the related receipts are not included as revenue or expenditures in the accompanying statement of revenues, expenses, and changes in net position. The disbursements and related receipts are reflected in the noncapital financing activities section of the statement of cash flows. Reclassifications – University amounts have been reclassified from cash and temporary investments to cash and cash equivalents or current investments to conform to the current year’s presentation.

Wayne State University Notes to Financial Statements September 30, 2019 and 2018
26
Note 2 - Cash and Investments
Cash and investments, by classification and investment type, at September 30, 2019 and 2018 are as follows (in thousands):
Classification 2019 2018
Cash and cash equivalents, current 149,174$ 177,016$ Investments: Investments, current 267,876 249,088 Endowment Fund, noncurrent 6,213 5,183 Plant Fund - Restricted invested bond proceeds and related earnings 72,533 101,664
Total investments 346,622 355,935
Total cash and investments 495,796$ 532,951$
Type 2019 2018
Cash and cash equivalents 149,174$ 177,016$
Fixed income 274,053 349,437
Equity securities 40,859 -
Hedge funds 9,634 -
Real assets 14,342 - Other 7,734 6,498
Total cash and investments 495,796$ 532,951$ The University’s cash pool, which consists of cash, cash equivalents, and current investments, provided a return of 4.8 and 0.2 for the fiscal years ended September 30, 2019 and 2018, respectively. Investments in the Plant Fund consist of invested bond proceeds and related earnings which are restricted for capital projects. Investment Policies Cash and cash equivalents and bond proceed investments are managed in accordance with the board of governors’ cash management policy. This policy sets a general target allocation for its investments as follows:
Asset Class Liquidity Pool
Liguidity
Reserve Pool Diversified Total Portfolio
Range
(Diversified
Pool)
Actual at
September 30,
2019
Cash 100% 0% 0% 30% 26%
Fixed Income 0% 100% 30% 56% +/- 7% 56%
Equities 0% 0% 45% 9% +/- 7% 11%Hedge Funds 0% 0% 10% 2% +/- 5% 3%Real Assets 0% 0% 15% 3% +/- 5% 4%
The investment policy permits investments in money market funds, U.S. government and government agency obligations, municipal obligations, certificates of deposit, commercial paper, corporate debt and securitized investments, certain additional securitized investments and fixed-income funds with intermediate duration, multi-strategy, and short-term high-yield strategies. In addition, cash pool investments are comprised of equities, hedge funds, and real assets.

Wayne State University Notes to Financial Statements September 30, 2019 and 2018
27
Note 2 - Cash and Investments (Continued)
The cash pool’s three tiers (liquidity pool, liquidity reserve pool, and diversified pool) have different time horizons and liquidity needs, therefore, they have different permissible asset classes, credit quality, and maturity/interest rate risk characteristics. These risks are considered as part of the overall risk versus investment return characteristics of the aggregate investment portfolio when establishing its asset allocation and selecting its investment managers. Investments are managed in accordance with the investment policy and are monitored according to the risk versus investment return characteristics as compared to applicable benchmarks in the investment industry. Custodial Credit Risk For amounts deposited in commercial banks, custodial credit risk is the risk that, in the event of a bank failure, the University’s deposits may not be available or returned. The University does not have a deposit policy governing custodial credit risk. At September 30, 2019 and 2018, the carrying amount of these deposits totaled $136,491,000 and $162,819,000, respectively. Of these amounts, $135,938,000 and $162,017,000 were uninsured and not collateralized at September 30, 2019 and 2018, respectively.
For investments, custodial credit risk is the risk that, in the event of the failure of the counterparty, the University may not be able to recover the value of its investments that are in the possession of an outside party. The counterparty is the firm that sells investments to or buys them from the University. Cash management investment policies do not limit the value of investments that may be held by an outside party. Investments in external investment pools and open-ended mutual funds are not exposed to custodial credit risk because their existence is not evidenced by securities that exist in physical or book entry form. The University’s counterparties held $74,872,000 and $239,762,000 of its portfolio at September 30, 2019 and 2018, respectively. These investments are either held in the name of the University or a nominee’s name for the benefit of the University and would not be subject to any general creditor claims. Credit Risk Credit risk is the risk that an issuer or counterparty to an investment will not fulfill its obligations. Nationally recognized rating organizations, such as Moody’s and Standard & Poor’s, assign credit ratings to security issuers and issues that indicate a measure of potential credit risk to investors. As discussed previously, specific credit standards are applied to each of the three tiers of the Cash Pool based on their ability to take risk which is tied to their time horizon and liquidity needs. The minimum credit quality for the Liquidity Pool is A-/A3 for bank deposits, money market funds shall have at least two of the three NRSRO’s A1/P1/F1, and short term bond funds must have an average credit rating of A or better. The Liquidity Reserve Pool must have a credit rating of BBB-/Baa3 or better. The Diversified Pool must have an average credit rating of B-/B3 or better. For both years, the University was in compliance with its credit risk policy.
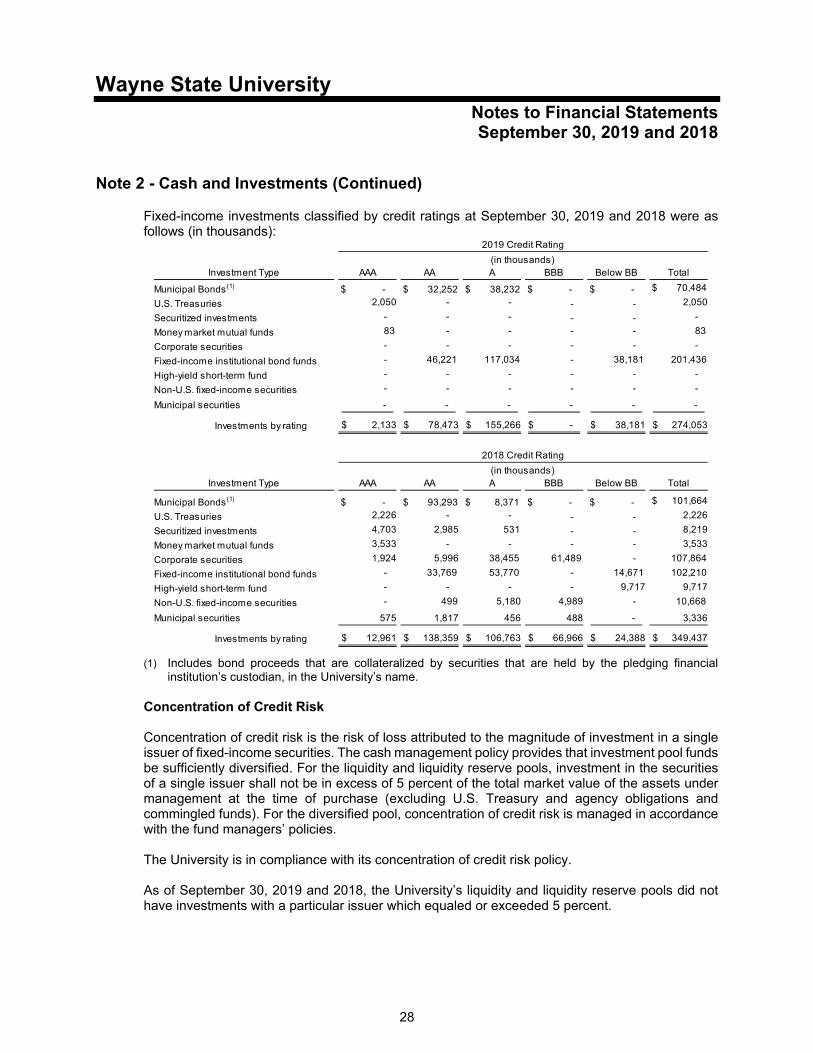
Wayne State University Notes to Financial Statements September 30, 2019 and 2018
28
Note 2 - Cash and Investments (Continued)
Fixed-income investments classified by credit ratings at September 30, 2019 and 2018 were as follows (in thousands):
Investment Type AAA AA A BBB Below BB Total
Municipal Bonds(1) $ - $ 32,252 $ 38,232 $ - $ - $ 70,484
U.S. Treasuries 2,050 - - - - 2,050
Securitized investments - - - - - -
Money market mutual funds 83 - - - - 83
Corporate securities - - - - - -
Fixed-income institutional bond funds - 46,221 117,034 - 38,181 201,436
High-yield short-term fund - - - - - -
Non-U.S. fixed-income securities - - - - - -
Municipal securities - - - - - -
Investments by rating 2,133$ 78,473$ 155,266$ - $ 38,181$ 274,053$
Investment Type AAA AA A BBB Below BB Total
Municipal Bonds(1) $ - $ 93,293 $ 8,371 $ - $ - $ 101,664
U.S. Treasuries 2,226 - - - - 2,226
Securitized investments 4,703 2,985 531 - - 8,219
Money market mutual funds 3,533 - - - - 3,533
Corporate securities 1,924 5,996 38,455 61,489 - 107,864
Fixed-income institutional bond funds - 33,769 53,770 - 14,671 102,210
High-yield short-term fund - - - - 9,717 9,717
Non-U.S. fixed-income securities - 499 5,180 4,989 - 10,668
Municipal securities 575 1,817 456 488 - 3,336
Investments by rating 12,961$ 138,359$ 106,763$ 66,966$ 24,388$ 349,437$
2019 Credit Rating
(in thousands)
2018 Credit Rating
(in thousands)
(1) Includes bond proceeds that are collateralized by securities that are held by the pledging financial institution’s custodian, in the University’s name.
Concentration of Credit Risk Concentration of credit risk is the risk of loss attributed to the magnitude of investment in a single issuer of fixed-income securities. The cash management policy provides that investment pool funds be sufficiently diversified. For the liquidity and liquidity reserve pools, investment in the securities of a single issuer shall not be in excess of 5 percent of the total market value of the assets under management at the time of purchase (excluding U.S. Treasury and agency obligations and commingled funds). For the diversified pool, concentration of credit risk is managed in accordance with the fund managers’ policies. The University is in compliance with its concentration of credit risk policy. As of September 30, 2019 and 2018, the University’s liquidity and liquidity reserve pools did not have investments with a particular issuer which equaled or exceeded 5 percent.
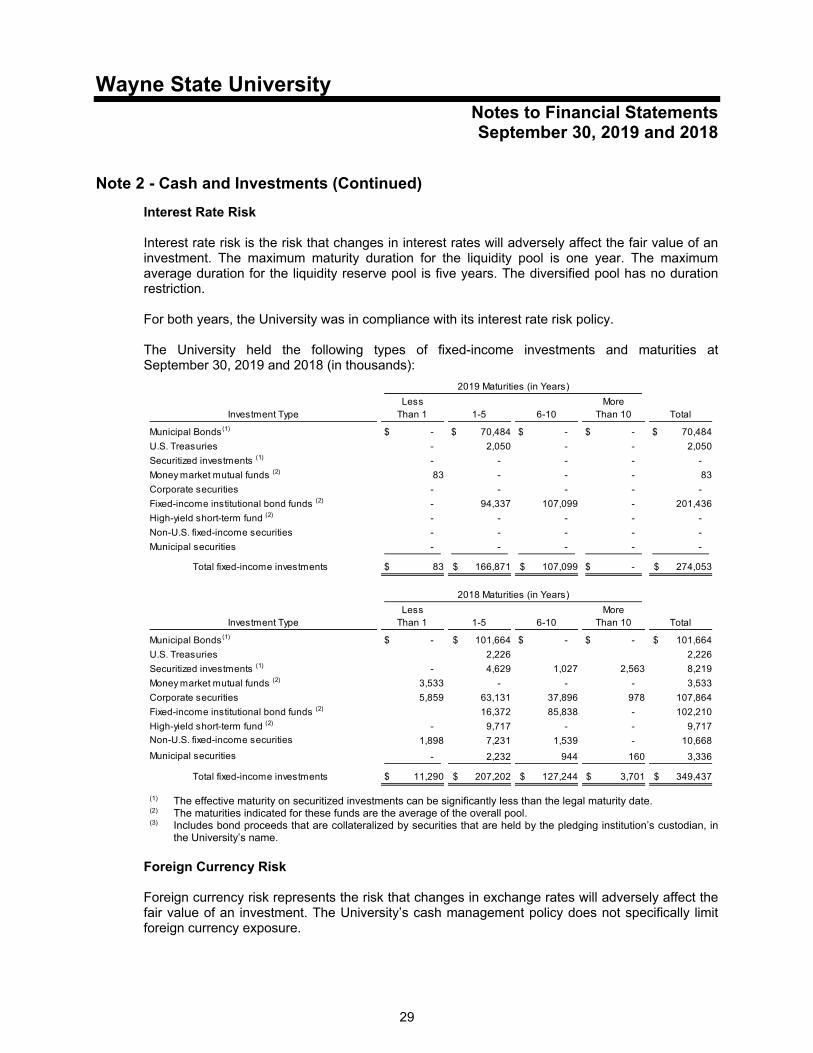
Wayne State University Notes to Financial Statements September 30, 2019 and 2018
29
Note 2 - Cash and Investments (Continued)
Interest Rate Risk Interest rate risk is the risk that changes in interest rates will adversely affect the fair value of an investment. The maximum maturity duration for the liquidity pool is one year. The maximum average duration for the liquidity reserve pool is five years. The diversified pool has no duration restriction. For both years, the University was in compliance with its interest rate risk policy. The University held the following types of fixed-income investments and maturities at September 30, 2019 and 2018 (in thousands):
Less MoreInvestment Type Than 1 1-5 6-10 Than 10 Total
Municipal Bonds(1) - $ 70,484$ - $ - $ 70,484$
U.S. Treasuries - 2,050 - - 2,050
Securitized investments (1) - - - - -
Money market mutual funds (2) 83 - - - 83
Corporate securities - - - - -
Fixed-income institutional bond funds (2) - 94,337 107,099 - 201,436
High-yield short-term fund (2) - - - - -
Non-U.S. fixed-income securities - - - - -
Municipal securities - - - - -
Total fixed-income investments 83$ 166,871$ 107,099$ - $ 274,053$
Less MoreInvestment Type Than 1 1-5 6-10 Than 10 Total
Municipal Bonds(1) - $ 101,664$ - $ - $ 101,664$
U.S. Treasuries 2,226 2,226
Securitized investments (1) - 4,629 1,027 2,563 8,219
Money market mutual funds (2) 3,533 - - - 3,533
Corporate securities 5,859 63,131 37,896 978 107,864
Fixed-income institutional bond funds (2) 16,372 85,838 - 102,210
High-yield short-term fund (2) - 9,717 - - 9,717
Non-U.S. fixed-income securities 1,898 7,231 1,539 - 10,668
Municipal securities - 2,232 944 160 3,336
Total fixed-income investments 11,290$ 207,202$ 127,244$ 3,701$ 349,437$
2019 Maturities (in Years)
2018 Maturities (in Years)
(1) The effective maturity on securitized investments can be significantly less than the legal maturity date. (2) The maturities indicated for these funds are the average of the overall pool. (3) Includes bond proceeds that are collateralized by securities that are held by the pledging institution’s custodian, in
the University’s name. Foreign Currency Risk Foreign currency risk represents the risk that changes in exchange rates will adversely affect the fair value of an investment. The University’s cash management policy does not specifically limit foreign currency exposure.
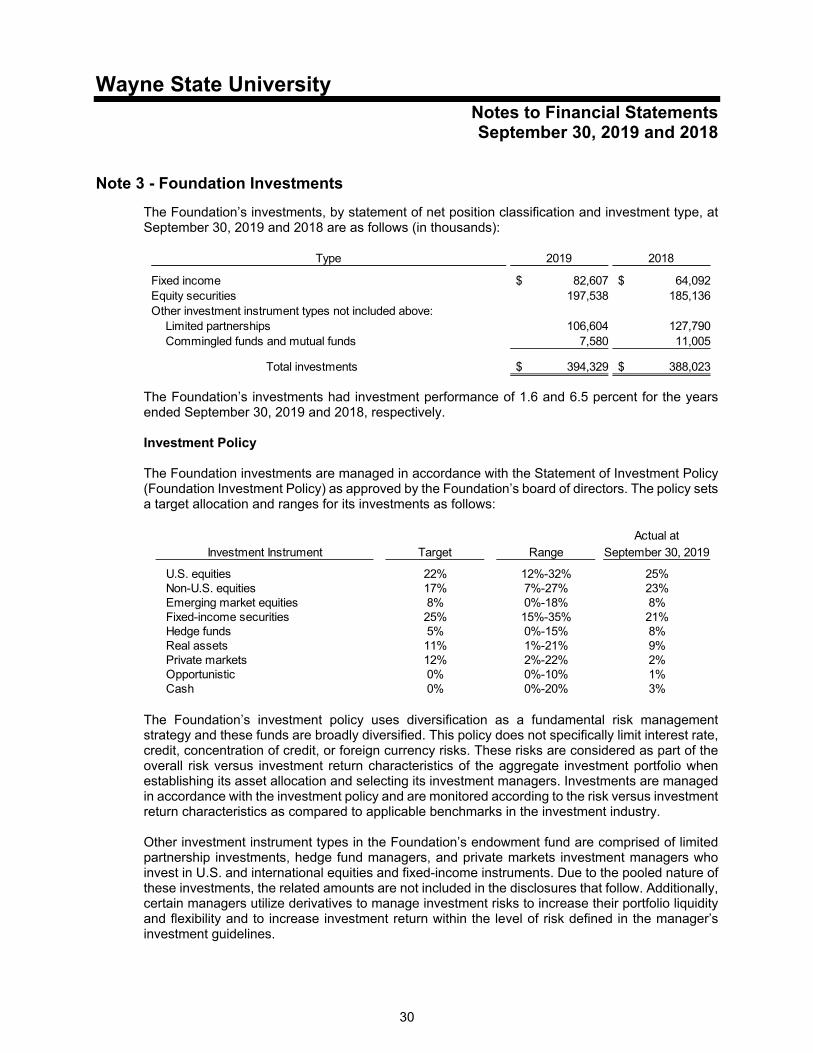
Wayne State University Notes to Financial Statements September 30, 2019 and 2018
30
Note 3 - Foundation Investments
The Foundation’s investments, by statement of net position classification and investment type, at September 30, 2019 and 2018 are as follows (in thousands):
Type 2019 2018
Fixed income 82,607$ 64,092$ Equity securities 197,538 185,136 Other investment instrument types not included above:
Limited partnerships 106,604 127,790 Commingled funds and mutual funds 7,580 11,005
Total investments 394,329$ 388,023$
The Foundation’s investments had investment performance of 1.6 and 6.5 percent for the years ended September 30, 2019 and 2018, respectively. Investment Policy The Foundation investments are managed in accordance with the Statement of Investment Policy (Foundation Investment Policy) as approved by the Foundation’s board of directors. The policy sets a target allocation and ranges for its investments as follows:
Actual at
Investment Instrument Target Range September 30, 2019
U.S. equities 22% 12%-32% 25%Non-U.S. equities 17% 7%-27% 23%Emerging market equities 8% 0%-18% 8%Fixed-income securities 25% 15%-35% 21%Hedge funds 5% 0%-15% 8%Real assets 11% 1%-21% 9%Private markets 12% 2%-22% 2%Opportunistic 0% 0%-10% 1%Cash 0% 0%-20% 3%
The Foundation’s investment policy uses diversification as a fundamental risk management strategy and these funds are broadly diversified. This policy does not specifically limit interest rate, credit, concentration of credit, or foreign currency risks. These risks are considered as part of the overall risk versus investment return characteristics of the aggregate investment portfolio when establishing its asset allocation and selecting its investment managers. Investments are managed in accordance with the investment policy and are monitored according to the risk versus investment return characteristics as compared to applicable benchmarks in the investment industry. Other investment instrument types in the Foundation’s endowment fund are comprised of limited partnership investments, hedge fund managers, and private markets investment managers who invest in U.S. and international equities and fixed-income instruments. Due to the pooled nature of these investments, the related amounts are not included in the disclosures that follow. Additionally, certain managers utilize derivatives to manage investment risks to increase their portfolio liquidity and flexibility and to increase investment return within the level of risk defined in the manager’s investment guidelines.
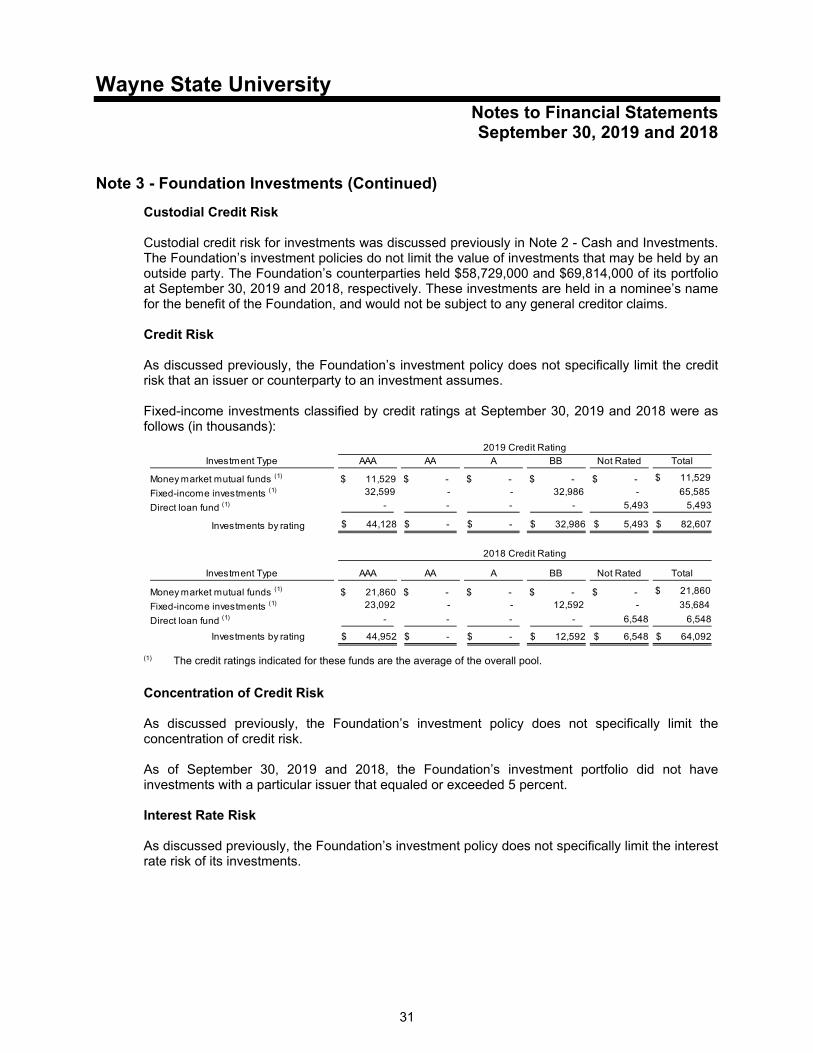
Wayne State University Notes to Financial Statements September 30, 2019 and 2018
31
Note 3 - Foundation Investments (Continued)
Custodial Credit Risk Custodial credit risk for investments was discussed previously in Note 2 - Cash and Investments. The Foundation’s investment policies do not limit the value of investments that may be held by an outside party. The Foundation’s counterparties held $58,729,000 and $69,814,000 of its portfolio at September 30, 2019 and 2018, respectively. These investments are held in a nominee’s name for the benefit of the Foundation, and would not be subject to any general creditor claims. Credit Risk As discussed previously, the Foundation’s investment policy does not specifically limit the credit risk that an issuer or counterparty to an investment assumes. Fixed-income investments classified by credit ratings at September 30, 2019 and 2018 were as follows (in thousands):
Investment Type AAA AA A BB Not Rated Total
Money market mutual funds (1) $ 11,529 $ - $ - $ - $ - $ 11,529
Fixed-income investments (1) 32,599 - - 32,986 - 65,585
Direct loan fund (1) - - - - 5,493 5,493
Investments by rating 44,128$ - $ - $ 32,986$ 5,493$ 82,607$
Investment Type AAA AA A BB Not Rated Total
Money market mutual funds (1) $ 21,860 $ - $ - $ - $ - $ 21,860
Fixed-income investments (1) 23,092 - - 12,592 - 35,684
Direct loan fund (1) - - - - 6,548 6,548
Investments by rating 44,952$ - $ - $ 12,592$ 6,548$ 64,092$
2019 Credit Rating
2018 Credit Rating
(1) The credit ratings indicated for these funds are the average of the overall pool.
Concentration of Credit Risk As discussed previously, the Foundation’s investment policy does not specifically limit the concentration of credit risk. As of September 30, 2019 and 2018, the Foundation’s investment portfolio did not have investments with a particular issuer that equaled or exceeded 5 percent. Interest Rate Risk As discussed previously, the Foundation’s investment policy does not specifically limit the interest rate risk of its investments.
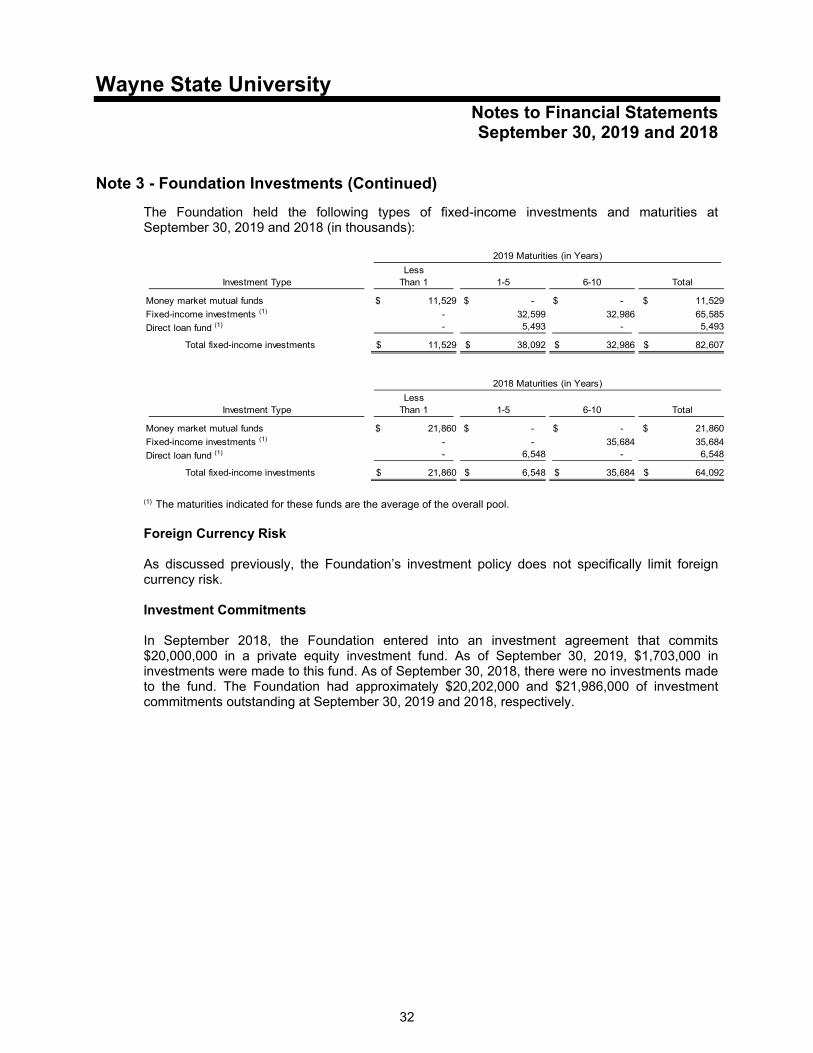
Wayne State University Notes to Financial Statements September 30, 2019 and 2018
32
Note 3 - Foundation Investments (Continued)
The Foundation held the following types of fixed-income investments and maturities at September 30, 2019 and 2018 (in thousands):
LessInvestment Type Than 1 1-5 6-10 Total
Money market mutual funds 11,529$ - $ - $ 11,529$
Fixed-income investments (1) - 32,599 32,986 65,585
Direct loan fund (1) - 5,493 - 5,493
Total fixed-income investments 11,529$ 38,092$ 32,986$ 82,607$
LessInvestment Type Than 1 1-5 6-10 Total
Money market mutual funds 21,860$ - $ - $ 21,860$
Fixed-income investments (1) - - 35,684 35,684
Direct loan fund (1) - 6,548 - 6,548
Total fixed-income investments 21,860$ 6,548$ 35,684$ 64,092$
2019 Maturities (in Years)
2018 Maturities (in Years)
(1) The maturities indicated for these funds are the average of the overall pool. Foreign Currency Risk As discussed previously, the Foundation’s investment policy does not specifically limit foreign currency risk. Investment Commitments In September 2018, the Foundation entered into an investment agreement that commits $20,000,000 in a private equity investment fund. As of September 30, 2019, $1,703,000 in investments were made to this fund. As of September 30, 2018, there were no investments made to the fund. The Foundation had approximately $20,202,000 and $21,986,000 of investment commitments outstanding at September 30, 2019 and 2018, respectively.

Wayne State University Notes to Financial Statements September 30, 2019 and 2018
33
Note 4 - Receivables At September 30, 2019 and 2018, receivables consisted of the following (in thousands):
2019 2018
Grants and contracts receivable 46,736$ 31,193$ Pledged gifts receivable 5,577 9,375 Student notes receivable 23,352 26,468 Student accounts receivable 74,003 76,901 Other 50,246 36,344
Total 199,914 180,281
Less:Provision for loss on receivables (44,798) (19,203) Unamortized discount to present value on
pledged gifts receivable (173) (267)
Total 154,943 160,811
Less net current portion of receivables (124,212) (127,308)
Net noncurrent receivables 30,731$ 33,503$ Payments on pledged gifts receivable at September 30, 2019 are expected to occur in the following fiscal years (in thousands):
2020 3,507$ 2021-2051 2,070
Total 5,577$
Student notes receivable consist of loans to students made from both federal and university resources. Principal repayment and interest rate terms on these loans vary considerably. The provision for loss on receivables does not apply to the federal portion of federal student notes receivable, since federal regulations do not require the University to provide reserves on the federal portion of uncollectible student loans. Federal loan programs are funded principally with federal advances to the University from the Perkins and various health profession loan programs. The Federal Perkins loan program expired on September 30, 2017, which ended the issuance of new loans under this program. Pending additional information from the federal government, the University will continue to service all outstanding loans in accordance with program specifications.
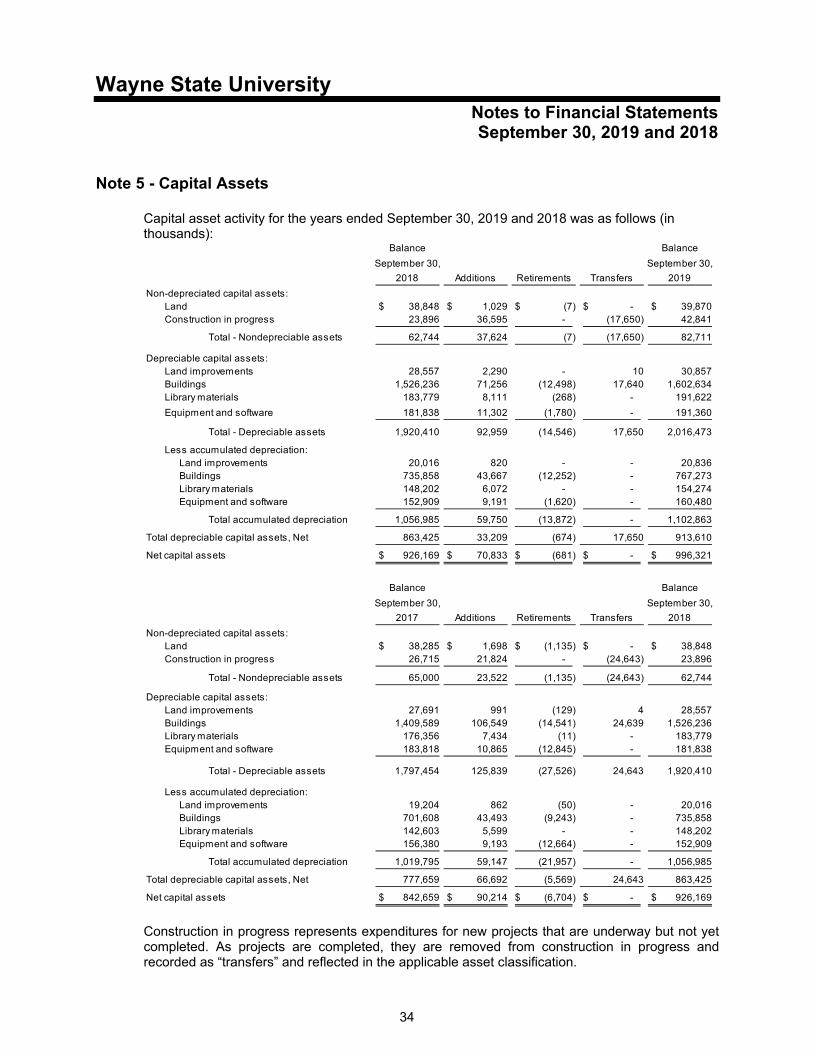
Wayne State University Notes to Financial Statements September 30, 2019 and 2018
34
Note 5 - Capital Assets
Capital asset activity for the years ended September 30, 2019 and 2018 was as follows (in thousands):
Balance Balance
September 30, September 30,
2018 Additions Retirements Transfers 2019
Non-depreciated capital assets:Land 38,848$ 1,029$ (7)$ - $ 39,870$ Construction in progress 23,896 36,595 - (17,650) 42,841
Total - Nondepreciable assets 62,744 37,624 (7) (17,650) 82,711
Depreciable capital assets:Land improvements 28,557 2,290 - 10 30,857 Buildings 1,526,236 71,256 (12,498) 17,640 1,602,634 Library materials 183,779 8,111 (268) - 191,622
Equipment and software 181,838 11,302 (1,780) - 191,360
Total - Depreciable assets 1,920,410 92,959 (14,546) 17,650 2,016,473
Less accumulated depreciation: Land improvements 20,016 820 - - 20,836 Buildings 735,858 43,667 (12,252) - 767,273 Library materials 148,202 6,072 - - 154,274 Equipment and software 152,909 9,191 (1,620) - 160,480
Total accumulated depreciation 1,056,985 59,750 (13,872) - 1,102,863
Total depreciable capital assets, Net 863,425 33,209 (674) 17,650 913,610
Net capital assets 926,169$ 70,833$ (681)$ - $ 996,321$
Balance Balance
September 30, September 30,
2017 Additions Retirements Transfers 2018
Non-depreciated capital assets:Land 38,285$ 1,698$ (1,135)$ - $ 38,848$ Construction in progress 26,715 21,824 - (24,643) 23,896
Total - Nondepreciable assets 65,000 23,522 (1,135) (24,643) 62,744
Depreciable capital assets:Land improvements 27,691 991 (129) 4 28,557 Buildings 1,409,589 106,549 (14,541) 24,639 1,526,236 Library materials 176,356 7,434 (11) - 183,779 Equipment and software 183,818 10,865 (12,845) - 181,838
Total - Depreciable assets 1,797,454 125,839 (27,526) 24,643 1,920,410
Less accumulated depreciation: Land improvements 19,204 862 (50) - 20,016 Buildings 701,608 43,493 (9,243) - 735,858 Library materials 142,603 5,599 - - 148,202 Equipment and software 156,380 9,193 (12,664) - 152,909
Total accumulated depreciation 1,019,795 59,147 (21,957) - 1,056,985
Total depreciable capital assets, Net 777,659 66,692 (5,569) 24,643 863,425
Net capital assets 842,659$ 90,214$ (6,704)$ - $ 926,169$
Construction in progress represents expenditures for new projects that are underway but not yet completed. As projects are completed, they are removed from construction in progress and recorded as “transfers” and reflected in the applicable asset classification.

Wayne State University Notes to Financial Statements September 30, 2019 and 2018
35
Note 5 - Capital Assets (Continued)
Several buildings on campus were financed through the issuance of bonds by the State of Michigan Building Authority (SBA). The SBA bonds are secured by a pledge of rentals to be received from the State of Michigan pursuant to a lease agreement entered into among the SBA, the State of Michigan, and the University. During the lease term, the SBA holds title to the buildings, the State of Michigan makes all lease payments directly to the SBA, and the University is responsible for all operating and maintenance costs. At the expiration of the lease, the SBA will transfer title to the buildings to the University.
Note 6 - Long-term Debt
Long-term debt activity for the years ended September 30, 2019 and 2018 was as follows (in thousands):
Beginning
Balance Additions Reductions
Ending
Balance
Current
Portion
General Revenue Bonds, Series 2018A, with interestranging from 3.375% to 5.0%, maturing on November15, 2049 122,225$ - $ - $ 122,225$ 1,855$
General Revenue and Refunding Bonds, Series2016A, with interest ranging from 2.5% to 5.0%,maturing on November 15, 2037 89,975 - - 89,975 355
General Revenue and Refunding Bonds, Series2016B, with interest ranging from 1.5% to 4.0%,maturing on November 15, 2037 11,285 - 970 10,315 600
General Revenue and Refunding Bonds, Series2015A, with interest ranging from 3.0% to 5.0%,maturing on November 15, 2036 48,300 - 1,590 46,710 1,680
General Revenue Bonds, Series 2013A, with interestranging from 3.0% to 5.0%, maturing on November15, 2044 79,375 - 1,580 77,795 1,645
General Revenue Bonds, Series 2009A, with interestranging from 3.25% to 5.0%, maturing on November15, 2029 36,505 - 3,715 32,790 3,905
Taxable General Revenue Build America Bonds,Series 2009B, with interest ranging from 4.844% to6.536%, maturing on November 15, 2039 25,500 - 755 24,745 780
General Revenue Bonds, Series 2008, with interest at5.0%, maturing on November 15, 2019 4,555 - 2,220 2,335 2,335
Taxable General Revenue Bonds, Series 2007B, withinterest at 6.01%, maturing on November 15, 2030 4,220 - - 4,220 -
Taxable General Revenue Bonds, Series 2003B, withinterest at 5.02%, maturing on November 15, 2018 435 - 435 - -
Capital lease payable, with interest at 3.8%, expiringon March 11, 2038 and 2.9% expiring on April 13,2023 19,915 - 870 19,045 900
Various notes payable with varying interest ratesmaturing through 2024 70 63 - 133 57
Gross long-term debt 442,360 63 12,135 430,288 14,112
Plus unamortized bond premium - Net 36,467 81 1,994 34,554 1,914
Total long-term debt 478,827$ 144$ 14,129$ 464,842$ 16,026$
2019

Wayne State University Notes to Financial Statements September 30, 2019 and 2018
36
Note 6 - Long-term Debt (Continued)
Beginning
Balance Additions Reductions
Ending
Balance
Current
Portion
General Revenue Bonds, Series 2018A, with interestranging from 3.375% to 5.0%, maturing on November15, 2049 - $ 122,225$ - $ 122,225$ - $
General Revenue and Refunding Bonds, Series2016A, with interest ranging from 2.5% to 5.0%,maturing on November 15, 2037 89,975 - - 89,975 -
General Revenue and Refunding Bonds, Series2016B, with interest ranging from 1.5% to 4.0%,maturing on November 15, 2037 11,285 - - 11,285 970
General Revenue and Refunding Bonds, Series2015A, with interest ranging from 3.0% to 5.0%,maturing on November 15, 2036 49,820 - 1,520 48,300 1,590
General Revenue Bonds, Series 2013A, with interestranging from 3.0% to 5.0%, maturing on November15, 2044 80,870 - 1,495 79,375 1,580
General Revenue Bonds, Series 2009A, with interestranging from 3.25% to 5.0%, maturing on November15, 2029 61,060 - 24,555 36,505 3,715
Taxable General Revenue Build America Bonds,Series 2009B, with interest ranging from 4.844% to6.536%, maturing on November 15, 2039 26,230 - 730 25,500 755
General Revenue Bonds, Series 2008, with interest at5.0%, maturing on November 15, 2019 88,485 - 83,930 4,555 2,220
General Revenue Bonds, Series 2007A, with interestranging from 4.0% to 5.0%, maturing on November15, 2037 820 - 820 - -
Taxable General Revenue Bonds, Series 2007B, withinterest at 6.01%, maturing on November 15, 2030 4,220 - - 4,220 -
Taxable General Revenue Bonds, Series 2003B, withinterest at 5.02%, maturing on November 15, 2018 845 - 410 435 435
Capital lease payable, with interest at 3.8%, expiringon March 11, 2038 and 2.9% expiring on April 13,2023 19,452 1,121 658 19,915 870
Various notes payable with varying interest ratesmaturing through 2020 111 - 41 70 44
Gross long-term debt 433,173 123,346 114,159 442,360 12,179
Plus unamortized bond premium - Net 30,107 11,220 4,860 36,467 1,913
Total long-term debt 463,280$ 134,566$ 119,019$ 478,827$ 14,092$
2018
When economically feasible, the University considers defeasance or refunding of prior debt issuances to reduce borrowing costs. The total amount of defeased bonds outstanding at September 30, 2019 and 2018 was $42,299,000 and $186,902,000, respectively.
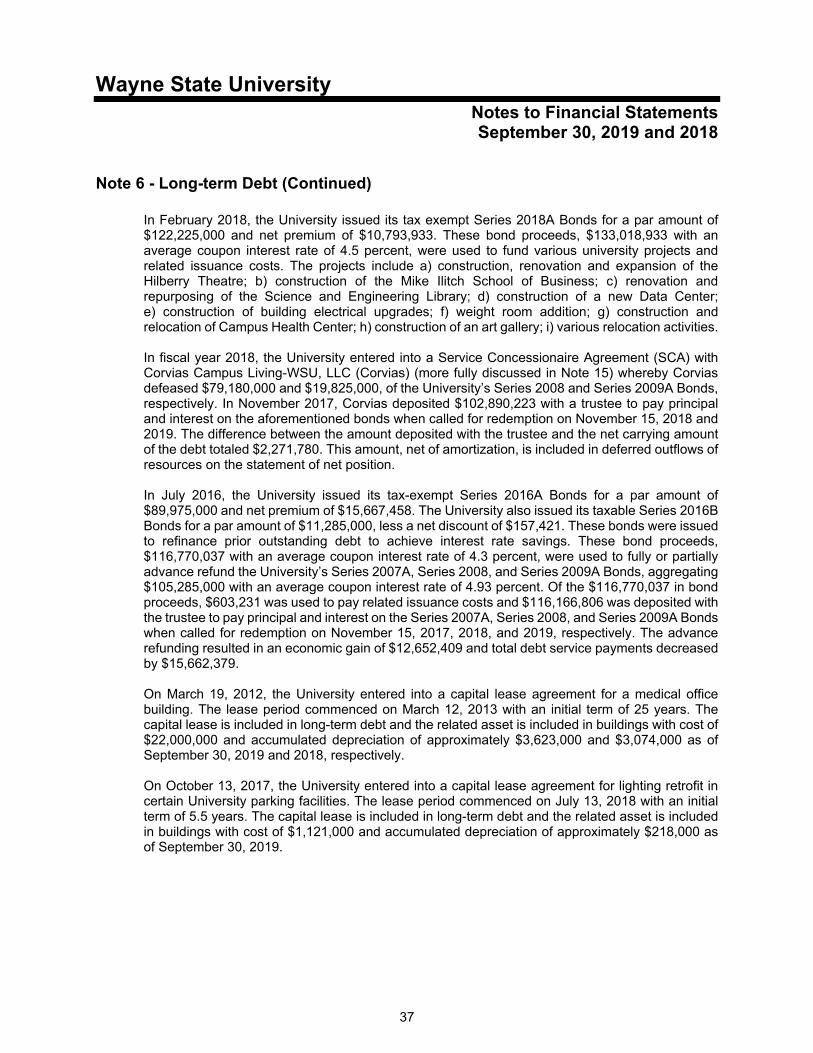
Wayne State University Notes to Financial Statements September 30, 2019 and 2018
37
Note 6 - Long-term Debt (Continued)
In February 2018, the University issued its tax exempt Series 2018A Bonds for a par amount of $122,225,000 and net premium of $10,793,933. These bond proceeds, $133,018,933 with an average coupon interest rate of 4.5 percent, were used to fund various university projects and related issuance costs. The projects include a) construction, renovation and expansion of the Hilberry Theatre; b) construction of the Mike Ilitch School of Business; c) renovation and repurposing of the Science and Engineering Library; d) construction of a new Data Center; e) construction of building electrical upgrades; f) weight room addition; g) construction and relocation of Campus Health Center; h) construction of an art gallery; i) various relocation activities.
In fiscal year 2018, the University entered into a Service Concessionaire Agreement (SCA) with Corvias Campus Living-WSU, LLC (Corvias) (more fully discussed in Note 15) whereby Corvias defeased $79,180,000 and $19,825,000, of the University’s Series 2008 and Series 2009A Bonds, respectively. In November 2017, Corvias deposited $102,890,223 with a trustee to pay principal and interest on the aforementioned bonds when called for redemption on November 15, 2018 and 2019. The difference between the amount deposited with the trustee and the net carrying amount of the debt totaled $2,271,780. This amount, net of amortization, is included in deferred outflows of resources on the statement of net position. In July 2016, the University issued its tax-exempt Series 2016A Bonds for a par amount of $89,975,000 and net premium of $15,667,458. The University also issued its taxable Series 2016B Bonds for a par amount of $11,285,000, less a net discount of $157,421. These bonds were issued to refinance prior outstanding debt to achieve interest rate savings. These bond proceeds, $116,770,037 with an average coupon interest rate of 4.3 percent, were used to fully or partially advance refund the University’s Series 2007A, Series 2008, and Series 2009A Bonds, aggregating $105,285,000 with an average coupon interest rate of 4.93 percent. Of the $116,770,037 in bond proceeds, $603,231 was used to pay related issuance costs and $116,166,806 was deposited with the trustee to pay principal and interest on the Series 2007A, Series 2008, and Series 2009A Bonds when called for redemption on November 15, 2017, 2018, and 2019, respectively. The advance refunding resulted in an economic gain of $12,652,409 and total debt service payments decreased by $15,662,379. On March 19, 2012, the University entered into a capital lease agreement for a medical office building. The lease period commenced on March 12, 2013 with an initial term of 25 years. The capital lease is included in long-term debt and the related asset is included in buildings with cost of $22,000,000 and accumulated depreciation of approximately $3,623,000 and $3,074,000 as of September 30, 2019 and 2018, respectively. On October 13, 2017, the University entered into a capital lease agreement for lighting retrofit in certain University parking facilities. The lease period commenced on July 13, 2018 with an initial term of 5.5 years. The capital lease is included in long-term debt and the related asset is included in buildings with cost of $1,121,000 and accumulated depreciation of approximately $218,000 as of September 30, 2019.
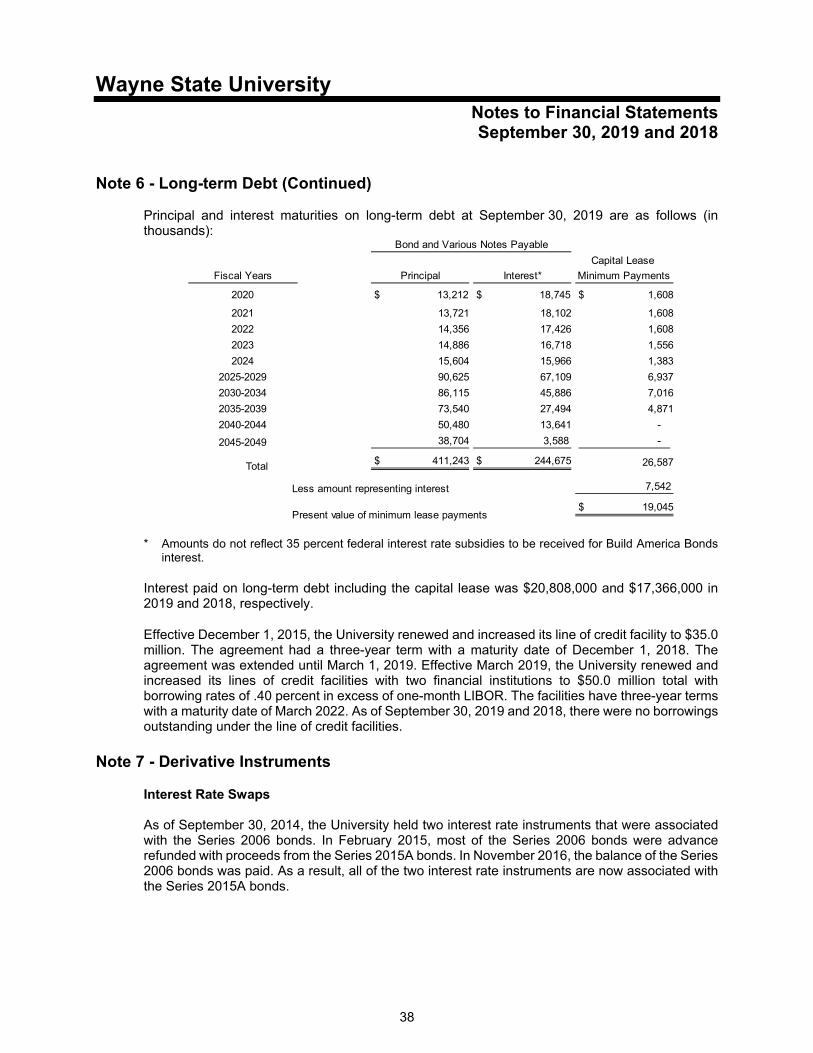
Wayne State University Notes to Financial Statements September 30, 2019 and 2018
38
Note 6 - Long-term Debt (Continued) Principal and interest maturities on long-term debt at September 30, 2019 are as follows (in thousands):
Capital Lease
Fiscal Years Principal Interest* Minimum Payments
2020 $ 13,212 $ 18,745 $ 1,608
2021 13,721 18,102 1,608
2022 14,356 17,426 1,608
2023 14,886 16,718 1,556
2024 15,604 15,966 1,383
2025-2029 90,625 67,109 6,937
2030-2034 86,115 45,886 7,016
2035-2039 73,540 27,494 4,871
2040-2044 50,480 13,641 -
2045-2049 38,704 3,588 -
Total 411,243$ 244,675$ 26,587
Less amount representing interest 7,542
Present value of minimum lease payments19,045$
Bond and Various Notes Payable
* Amounts do not reflect 35 percent federal interest rate subsidies to be received for Build America Bonds interest.
Interest paid on long-term debt including the capital lease was $20,808,000 and $17,366,000 in 2019 and 2018, respectively.
Effective December 1, 2015, the University renewed and increased its line of credit facility to $35.0 million. The agreement had a three-year term with a maturity date of December 1, 2018. The agreement was extended until March 1, 2019. Effective March 2019, the University renewed and increased its lines of credit facilities with two financial institutions to $50.0 million total with borrowing rates of .40 percent in excess of one-month LIBOR. The facilities have three-year terms with a maturity date of March 2022. As of September 30, 2019 and 2018, there were no borrowings outstanding under the line of credit facilities.
Note 7 - Derivative Instruments
Interest Rate Swaps As of September 30, 2014, the University held two interest rate instruments that were associated with the Series 2006 bonds. In February 2015, most of the Series 2006 bonds were advance refunded with proceeds from the Series 2015A bonds. In November 2016, the balance of the Series 2006 bonds was paid. As a result, all of the two interest rate instruments are now associated with the Series 2015A bonds.

Wayne State University Notes to Financial Statements September 30, 2019 and 2018
39
Note 7 - Derivative Instruments (Continued)
The University initially entered into these swap agreements at the same time and for the same amount as the issuance of the Series 2006 bonds, with the intent of lowering its borrowing cost by creating a cash flow hedge, at a net interest rate that is lower than the fixed rate on the debt that was issued. The swap agreements are not effective hedges. They were ineffective swap agreements because they did not have consistent critical terms. In accordance with GASB Statement No. 53, an interest rate swap is considered an effective cash flow hedge if the swap payments received substantially offset the payments made on the associated debt, and then such changes in fair value are deferred. An interest rate swap that is not considered an effective cash flow hedge, in accordance with the provisions of this statement, is deemed to be an investment derivative instrument, and changes in fair value are recorded as a component of the change in net investment income (loss) in the statement of revenues, expenses, and changes in net position. The fair value balances and notional amounts of the derivative instruments outstanding at September 30, 2019 and 2018, classified by type and the change in fair value, are shown below (in thousands):
(in thousands) Investment Derivative Instrument Classification Amount Classification Amount Notional
Series 2015A# - Pay-variable, receive variable/fixed annuity Net investment income (loss) 412$ Asset 677$ 39,570$
(in thousands)
Investment Derivative Instrument Classification Amount Classification Amount Notional
Series 2015A# - Pay-variable, receive variable/fixed annuity Net investment income (loss) 88$ Asset 265$ 40,900$
Change in Fair Value Fair Value at September 30, 2019
Change in Fair Value Fair Value at September 30, 2018
The fair value of the swaps was estimated using the proprietary pricing model of an independent derivative valuation service. Terms for the years ended September 30, 2019 and 2018 were as follows:
Associated
Bond Issue
Effective
Date Type Objective
Pay
Terms Receive Terms Maturity Date
Counterparty
Credit Rating*
Series 2006 and Series 2015A# (2 swaps) 2/5/2015
Pay variable, receive variable plus fixed annuity
Cash flow hedge for associated bond issue SIFMA
67% LIBOR plus 40.73 bps 11/15/2036 AA-/A
# The associated bond issue was substantially changed from the Series 2006 bonds to the Series 2015A bonds effective February 5, 2015 as a result of an advance refunding of most of the Series 2006 bonds in 2015 and a subsequent refunding of the balance of the 2006 bonds in November 2016. As of September 30, 2016, almost all of the two interest rate instruments were associated with the Series 2015A bonds, and only a small portion was associated with the Series 2006 bonds. In November 2016, the balance of the Series 2006 bonds was paid.
* Effective March 1, 2012, one of the original counterparties transferred by novation all the rights, liabilities, duties, and obligations to a new counterparty.
LIBOR - London Interbank Offered Rate SIFMA - Securities Industry and Financial Markets Association bps - basis points
Associated Risk - The associated risks of the outstanding swaps as of September 30, 2019 and 2018 were as follows: The swaps are tax basis swaps, which were executed with the objective of reducing the financing cost of the Series 2006 bonds and their related refunding bonds, the series 2015A bonds. Changes in interest rates as well as the SIFMA/LIBOR ratio cause the fair value of these swaps to rise and fall with financial market conditions. Due to changes in these market factors since inception, these swaps have a positive fair value at September 30, 2019 and September 30, 2018.

Wayne State University Notes to Financial Statements September 30, 2019 and 2018
40
Note 7 - Derivative Instruments (Continued)
Credit Risk - As of September 30, 2019 and 2018, the University was exposed to some credit risk from swap counterparties because the existing swaps had a positive fair value $677,000 and $265,000, respectively. The University executes swap transactions with various counterparties. At September 30, 2018, there were two outstanding swaps with two counterparties. The first counterparty held one swap that represented approximately 70 percent of the notional amount of swaps outstanding. This counterparty is rated "AA-" by Standard & Poor's (downgraded from AA+ in May 2016) and "Aa2" by Moody's (downgraded from Aa1 in June 2012). A second counterparty held one swap that represented approximately 30 percent of the notional amount of the swaps outstanding. This counterparty was rated "A+" by Fitch, "A" by Standard & Poor's (downgraded from A+ in December 2011), and "A2" by Moody’s (down from A1 in November 2010). Basis Risk - The swaps expose the University to basis risk. This is the risk that arises when the variable interest rates of a derivative instrument and a hedged item are based upon different interest rate reference indices. For the basis swaps, the University is exposed to the risk that the SIFMA interest rate, which it pays to the counterparties, will be more than the amount that it receives from the counterparties, which is based upon 67 percent of LIBOR plus an additional fixed annuity amount of 40.73 basis points (0.4073 percent). Termination - The swap termination date is November 2036. The derivative contracts are documented by the International Swap Dealers Associations (ISDA) Master Agreement, which includes standard termination events such as failure to pay and bankruptcy. The schedule to the master agreement also provides that the swaps may be terminated by the University if the counterparty's credit quality rating falls below certain specified levels. The University or the counterparty may terminate the swap if the other party fails to perform under the terms of the contract. If at the time of termination the swap has a negative fair value, the University is liable for a payment equal to the swap's fair value. Futures Contract The Foundation utilizes derivative financial instruments in a “portable alpha” investment strategy. This investment strategy provides broad exposure to several equity and fixed income target markets while adding potential for additional return through a separate investment product. The portable alpha investment strategy utilizes futures contracts, which aid in obtaining incremental income or profit on the underlying investment exposures.
As of September 30, 2019 and 2018, the notional value of these contracts was $37,610,000 and $9,975,000, respectively. The notional values associated with these derivative financial instruments are generally not recorded on the financial statements; however, the 2018 amounts for exposure (realized gains/losses and investment income) on these instruments have been recorded. The fair value of these derivative instruments as of September 30, 2019 and 2018 was $2,302,000 and $784,000, respectively, which are recorded as endowment investment in the statement of net position.
The use of derivative financial instruments reduces certain investment risks and generally adds value to the portfolio. The instruments themselves, however, do involve some investment and counterparty risk not fully reflected in the financial statements.
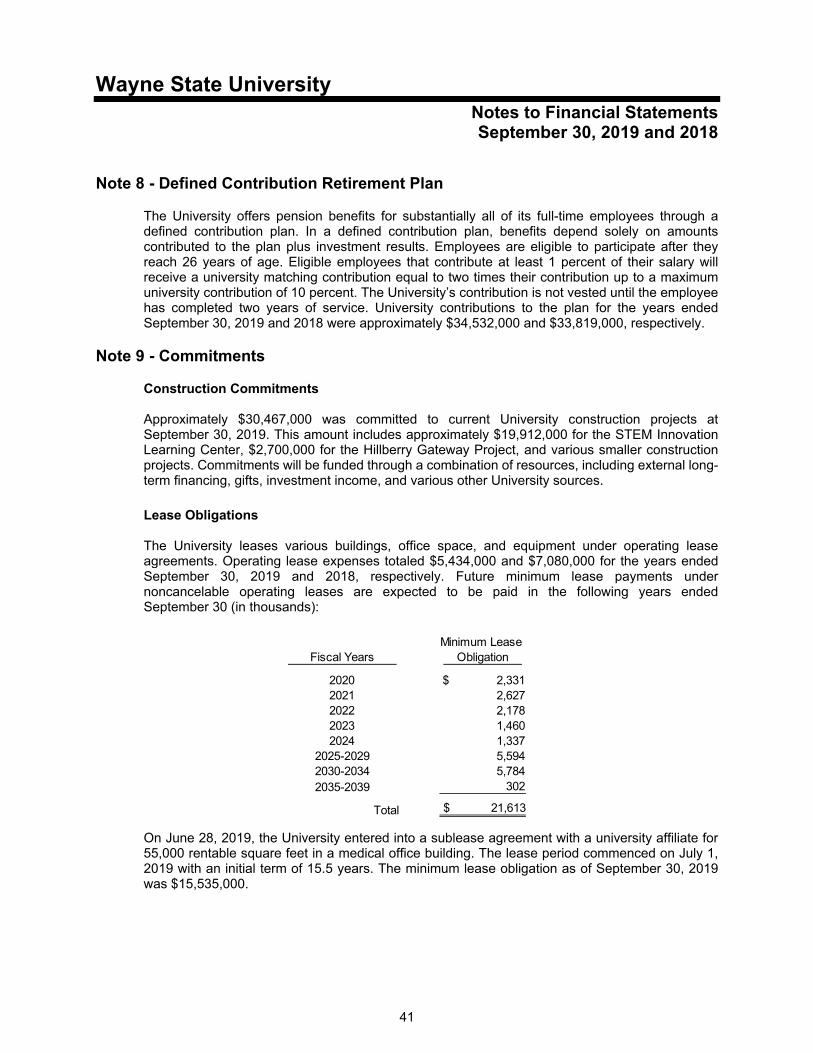
Wayne State University Notes to Financial Statements September 30, 2019 and 2018
41
Note 8 - Defined Contribution Retirement Plan
The University offers pension benefits for substantially all of its full-time employees through a defined contribution plan. In a defined contribution plan, benefits depend solely on amounts contributed to the plan plus investment results. Employees are eligible to participate after they reach 26 years of age. Eligible employees that contribute at least 1 percent of their salary will receive a university matching contribution equal to two times their contribution up to a maximum university contribution of 10 percent. The University’s contribution is not vested until the employee has completed two years of service. University contributions to the plan for the years ended September 30, 2019 and 2018 were approximately $34,532,000 and $33,819,000, respectively.
Note 9 - Commitments
Construction Commitments Approximately $30,467,000 was committed to current University construction projects at September 30, 2019. This amount includes approximately $19,912,000 for the STEM Innovation Learning Center, $2,700,000 for the Hillberry Gateway Project, and various smaller construction projects. Commitments will be funded through a combination of resources, including external long-term financing, gifts, investment income, and various other University sources.
Lease Obligations
The University leases various buildings, office space, and equipment under operating lease agreements. Operating lease expenses totaled $5,434,000 and $7,080,000 for the years ended September 30, 2019 and 2018, respectively. Future minimum lease payments under noncancelable operating leases are expected to be paid in the following years ended September 30 (in thousands):
Minimum Lease
Fiscal Years Obligation
2020 $ 2,3312021 2,6272022 2,1782023 1,4602024 1,337
2025-2029 5,5942030-2034 5,7842035-2039 302
Total 21,613$
On June 28, 2019, the University entered into a sublease agreement with a university affiliate for 55,000 rentable square feet in a medical office building. The lease period commenced on July 1, 2019 with an initial term of 15.5 years. The minimum lease obligation as of September 30, 2019 was $15,535,000.
Wayne State University Notes to Financial Statements September 30, 2019 and 2018
42
Note 10 - Contingencies
Insurance Program
In conjunction with the conduct of its operations, the University is exposed to various risks of loss and legal actions. To mitigate such risks, the University participates with 10 other Michigan public universities in the Michigan Universities Self-Insurance Corporation (MUSIC). This corporation provides comprehensive general liability, errors and omissions, property and vehicle liability, and excess liability insurance. The University participates in all of the aforementioned insurance programs except property insurance. The University maintains property insurance with FM Global. MUSIC loss coverages are structured on a three-layer basis with each member retaining a portion of its losses, MUSIC covering the second layer, and commercial carriers covering the third. Comprehensive general liability coverage is provided on an occurrence basis, errors and omissions coverage is provided on a claims-made basis, and property coverage is provided on a blanket basis. Each MUSIC member university is responsible for its regular anticipated losses, determined actuarially, for both general liability and errors and omissions. The aggregate retention amounts for each member are actuarially determined annually. MUSIC provides coverage for claims in excess of these retentions. By agreements with MUSIC, in the event the insurance reserves established by MUSIC are insufficient to meet its second-tier obligations, each of the participating universities shares this obligation. Participating universities are subject to additional assessments if the obligations and expenses (claims) of MUSIC exceed the combined periodic payments and accumulated operational reserves for any given year. The maximum possible additional assessment for the University for the year ended September 30, 2018, which is the most current data available, was approximately $1,652,000. The University has not been subjected to additional assessments since the formation of MUSIC in 1987.
The University is self-insured for certain employee benefits. Claim expenditures and liabilities are recorded when it is probable that a loss has occurred and the amount of that loss can be reasonably estimated. This would include an estimate of any significant claims that have been incurred but not reported. The University’s recorded reserves for its self-insured workers’ compensation, dental, and certain medical insurance programs at September 30 2019 and 2018, totaled approximately $3,512,000 and $3,484,000, respectively. Specific excess (umbrella) coverage has been purchased by the University for its self-insured workers’ compensation and medical insurance programs. For those risks that the University has purchased commercial insurance, settled claims have not exceeded the commercial coverage in any of the past three years.
Pending Litigation
The University is named as a defendant in certain civil actions. The University is of the opinion that the resulting disposition of these actions will not have a significant effect on the financial statements.

Wayne State University Notes to Financial Statements September 30, 2019 and 2018
43
Note 10 - Contingencies (Continued)
Derivative Instruments
One of the University’s derivative instrument agreements requires the University to post collateral when the University credit rating is suspended, withdrawn, or downgraded to BBB+ or below by Standard & Poor’s or Baa1 or below by Moody’s in order to preclude an additional termination event from occurring. The collateral would be posted in the amount of the fair value of the hedging instrument in a liability position over a specified threshold, which varies with the University's credit rating. The collateral could be posted in the form of cash, U.S. Treasury securities, agency notes, or other securities to which the parties may agree, and the valuation percentage allowed would vary by the creditworthiness and maturities of the underlying securities used for collateral. An additional termination event would occur if the University's rating is suspended, withdrawn, or downgraded to BBB- or below by Standard & Poor’s or Baa3 or below by Moody's. The other university derivative instrument agreement does not require the University to post collateral. However, this agreement provides that an additional termination event occurs when the University’s credit rating is suspended, withdrawn, or downgraded below BBB- by Standard & Poor’s or below Baa3 by Moody’s. In order to preclude this additional termination event from terminating the swap, the University would need to provide the counterparty with an acceptable credit support document.
At September 30, 2019 and 2018, the aggregate positive fair value of all hedging derivative instruments with these collateral posting provisions is $677,000 and $265,000, respectively. There were no posting requirements because the University maintained credit ratings above the thresholds.
Note 11 - Natural Classification of Expenses
Operating expenses by natural classification for the years ended September 30, 2019 and 2018 are summarized as follows (in thousands):
2019 2018
Compensation and benefits 600,650$ 583,685$ Supplies, services, and other 196,629 198,229 Depreciation 59,750 59,147
Scholarships and fellowships 18,241 14,721
Total operating expenses875,270$ 855,782$
Note 12 - Postemployment Benefits Other Than Pensions
The University offers a postemployment benefit of a fixed payout life insurance policy to its retirees. The University’s annual postemployment benefits is actuarially determined in accordance with GASB Statement No. 75. For the year ended September 30, 2019, the University’s reported OPEB liability was estimated based on an actuarial valuation date of October 1, 2017 and measurement date of September 30, 2018. For the year ended September 30, 2018, the University’s reported OPEB liability was estimated based on an actuarial valuation date of October 1, 2017 and measurement date of September 30, 2017.

Wayne State University Notes to Financial Statements September 30, 2019 and 2018
44
Note 12 - Postemployment Benefits Other Than Pensions (Continued) The total OPEB accrued liability, which has been recorded as accrued employee benefits on the statement of net position, was $7,530,000 and $7,932,000 at September 30, 2019 and 2018, respectively. The discount rates used in determining the total reported OPEB liability were 4.18 percent and 3.64 percent for fiscal year 2019 and 2018, respectively. The increase in the discount rate resulted in a decrease in the liability and a credit to expense of $402,000 and $2,900,000 in fiscal year 2019 and 2018, respective. There are no OPEB assets set-aside to fund the liability amount disclosed. In addition, the University makes available a plan under which certain retirees may receive healthcare coverage. There is no implicit rate subsidy and the employees pay 100 percent of the cost. As a result, there is no required or recorded liability relating to the retiree healthcare plan.
Note 13 – Related Party Transaction
The University guaranteed an operating line of credit of $2.25 million and a term loan of $6.0 million for the Research and Technology Park in the City of Detroit, Inc., a 501(c)(3) organization. During fiscal year 2016, the University paid the outstanding balances on the Research and Technology Park debt, which eliminated the guarantee, in exchange for a mortgage loan payable to the University in the amount of $5,820,000. During fiscal year 2019, the mortgage loan was refinanced and the University provided additional funding of $1,000,000. The outstanding mortgage receivable amount of $6,149,000 and $5,361,000 as of September 30, 2019 and 2018, respectively, is included in current and noncurrent receivables in the statement of net position.
Note 14 - Fair Value
The University categorizes its fair value measurements within the fair value hierarchy established by generally accepted accounting principles. The hierarchy is based on the valuation inputs used to measure the fair value of the asset. Level 1 inputs are quoted prices in active markets for identical assets; Level 2 inputs are significant other observable inputs; Level 3 inputs are significant unobservable inputs. Investments that are measured at fair value using the net asset value per share (or its equivalent) as a practical expedient are not classified in the fair value hierarchy below. In instances whereby inputs used to measure fair value fall into different levels in the above fair value hierarchy, fair value measurements in their entirety are categorized based on the lowest level input that is significant to the valuation. The University’s assessment of the significance of particular inputs to these fair value measurements requires judgment and considers factors specific to each asset or liability.
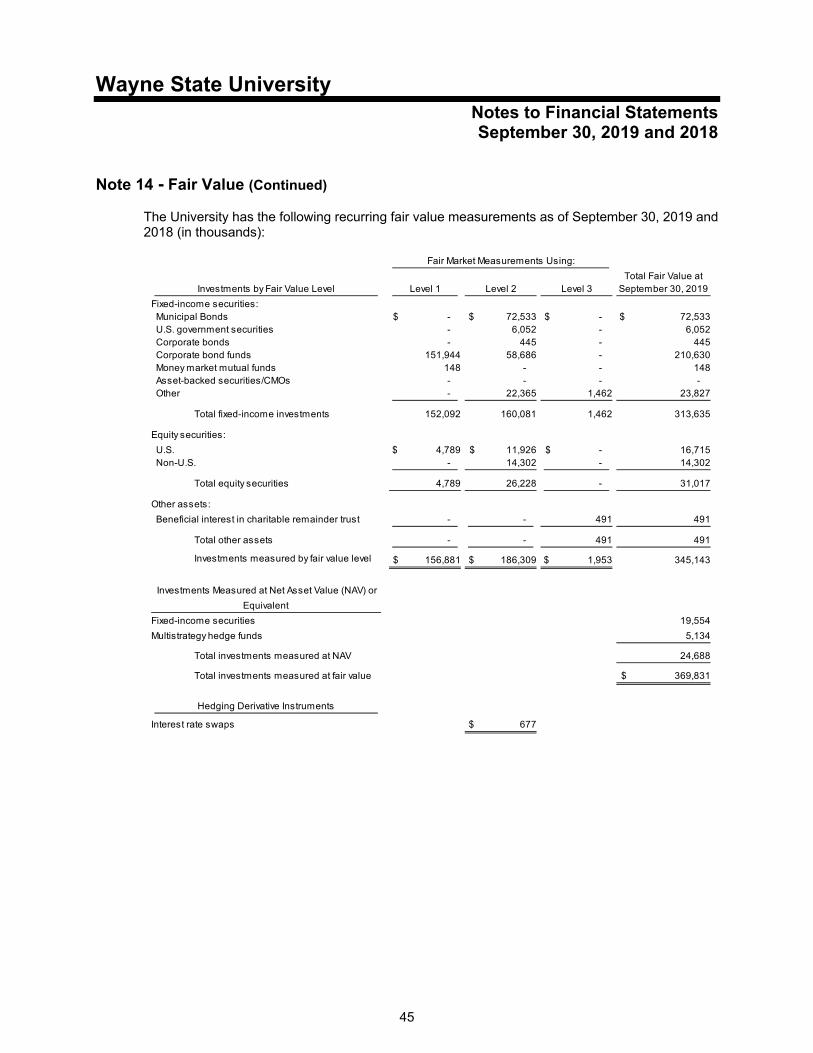
Wayne State University Notes to Financial Statements September 30, 2019 and 2018
45
Note 14 - Fair Value (Continued) The University has the following recurring fair value measurements as of September 30, 2019 and 2018 (in thousands):
Total Fair Value atInvestments by Fair Value Level Level 1 Level 2 Level 3 September 30, 2019
Fixed-income securities: Municipal Bonds - $ 72,533$ - $ 72,533$ U.S. government securities - 6,052 - 6,052 Corporate bonds - 445 - 445 Corporate bond funds 151,944 58,686 - 210,630 Money market mutual funds 148 - - 148 Asset-backed securities/CMOs - - - - Other - 22,365 1,462 23,827
Total fixed-income investments 152,092 160,081 1,462 313,635
Equity securities:
U.S. 4,789$ 11,926$ - $ 16,715 Non-U.S. - 14,302 - 14,302
Total equity securities 4,789 26,228 - 31,017
Other assets:
Beneficial interest in charitable remainder trust - - 491 491
Total other assets - - 491 491
Investments measured by fair value level 156,881$ 186,309$ 1,953$ 345,143
Investments Measured at Net Asset Value (NAV) or
Equivalent
Fixed-income securities 19,554
Multistrategy hedge funds 5,134
Total investments measured at NAV 24,688
Total investments measured at fair value 369,831$
Hedging Derivative Instruments
Interest rate swaps 677$
Fair Market Measurements Using:

Wayne State University Notes to Financial Statements September 30, 2019 and 2018
46
Note 14 - Fair Value (Continued)
Total Fair Value atInvestments by Fair Value Level Level 1 Level 2 Level 3 September 30, 2018
Fixed-income securities: Municipal Bonds - $ 101,664$ - $ 101,664$ U.S. government securities 2,226 - - 2,226 Corporate bonds - 122,823 - 122,823 Corporate bond funds 91,224 - - 91,224 Money market mutual funds 3,616 - - 3,616 Asset-backed securities/CMOs - 7,688 - 7,688 Other - - 1,200 1,200
Total fixed-income investments 97,066 232,175 1,200 330,441
Equity securities:
U.S. 3,960 - - 3,960
Total equity securities 3,960 - - 3,960
Other assets:
Beneficial interest in charitable remainder trust - - 407 407
Total other assets - - 407 407
Investments measured by fair value level 101,026$ 232,175$ 1,607$ 334,808
Investments Measured at Net Asset Value (NAV) or
Equivalent
Fixed-income securities 43,486
Multistrategy hedge funds 309
Total investments measured at NAV 43,795
Total investments measured at fair value 378,603$
Hedging Derivative Instruments
Interest rate swaps 265$
Fair Market Measurements Using:

Wayne State University Notes to Financial Statements September 30, 2019 and 2018
47
Note 14 - Fair Value (Continued)
The Foundation has the following recurring fair value measurements as of September 30, 2019 and 2018 (in thousands):
Investments by Fair Value Level Level 1 Level 2 Level 3
Total Fair Value at
September 30, 2019
Fixed-income securities: U.S. government securities 32,599$ - $ - $ 32,599$ Money market mutual funds 11,529 - - 11,529
Total fixed-income investments 44,128 - - 44,128
Equity securities:
U.S. 10,379 - - 10,379 Non-U.S. 407 - - 407
Total equity securities 10,786 - - 10,786
Exchange traded funds:
Exchange traded funds 2,279 - - 2,279
Total exchange traded funds 2,279 - - 2,279
Investments measured by fair value level 57,193$ - $ - $ 57,193
Investments Measured at Net Asset Value (NAV) or Equivalent
Equity and fixed-income securities 216,355
Credit and loan private investments 11,281
Multistrategy hedge funds 68,533
Equity private investments 6,136
Real assets comingled funds and private investments 34,831
Total investments measured at NAV 337,136
Total investments measured at fair value 394,329$
Investments by Fair Value Level Level 1 Level 2 Level 3
Total Fair Value at
September 30, 2018
Fixed-income securities: U.S. government securities 23,092$ - $ - $ 23,092$ Money market mutual funds 21,860 - - 21,860
Total fixed-income investments 44,952 - - 44,952
Equity securities:
U.S. 15,526 - - 15,526 Non-U.S. 6,830 - - 6,830
Total equity securities 22,356 - - 22,356
Investments measured by fair value level 67,308$ - $ - $ 67,308
Investments Measured at Net Asset Value (NAV) or Equivalent
Equity and fixed-income securities 172,867
Credit and loan private investments 17,224
Multistrategy hedge funds 92,947
Equity private investments 5,049
Real assets comingled funds and private investments 32,628
Total investments measured at NAV 320,715
Total investments measured at fair value 388,023$
Fair Market Measurements Using:
Fair Market Measurements Using:

Wayne State University Notes to Financial Statements September 30, 2019 and 2018
48
Note 14 - Fair Value (Continued)
The fair value of the University’s and the Foundation’s fixed-income and equity securities classified in Level 1 at September 30, 2019 and 2018 were valued using prices quoted in active markets for those securities. The fair value of the University’s fixed-income securities and equity securities classified in Level 2 at September 30, 2019 and 2018 were valued using other inputs such as interest rates and yield curves that are observable at commonly quoted intervals. The fair value of the University’s fixed-income securities classified in Level 3 at September 30, 2019 and 2018 were valued using otherwise unobservable inputs. The securities (primarily donated life insurance policies and gifted investments that are not actively traded in public markets) were valued using their cash surrender values or book values. The fair value of the University’s other assets classified in Level 3 at September 30, 2019 and 2018 were valued using otherwise unobservable inputs. The University’s beneficial interest in the charitable remainder trust was valued based on the trust asset details. The valuation method for investments measured at the net asset value (NAV) per share (or its equivalent) is presented in the table that follows. Investments in Entities that Calculate Net Asset Value per Share The University and the Foundation hold shares or interests in investment companies whereby the fair value of the investments is measured on a recurring basis using net asset value per share (or its equivalent) of the investment companies as a practical expedient. At September 30, 2019 and 2018, the University’s fair value, unfunded commitments, and redemption policies of those investments is as follows (in thousands):
2019 2018
Outstanding
Commitments at
September 30, 2019
Redemption Policy at
September 30, 2019
Equity and fixed-income securities 19,554$ 43,486$ - $ Primarily daily/monthlyMultistrategy hedge funds 5,134 309 - Redemptions are not permitted
Total investments measured at the NAV 24,688$ 43,795$ - $
Total Fair Value at September 30
At September 30, 2019 and 2018, the Foundation’s fair value, unfunded commitments, and redemption policies of those investments is as follows (in thousands):
2019 2018
Outstanding
Commitments at
September 30, 2019
Redemption Policy at
September 30, 2019
Equity and fixed-income securities 216,354$ 172,867$ - $ Primarily monthly with a maximum of 30
days notice Credit and loan private investments 11,281 17,224 1,625 Redemptions are not permittedMultistrategy hedge funds 68,533 92,947 - Quarterly with 90 days noticeEquity private investments 6,136 5,049 18,577 Redemptions are not permittedCommodities private investments 34,831 32,628 - Maximum of quarterly with 90 days notice
Total investments measured at the NAV 337,135$ 320,715$ 20,202$
Total Fair Value at September 30
Wayne State University Notes to Financial Statements September 30, 2019 and 2018
49
Note 14 - Fair Value (Continued)
The University’s and the Foundation’s equity and fixed-income investments include limited partnership investments and commingled investment funds that invest primarily in publicly traded domestic and publicly traded international long only equity investments and domestic fixed-income securities and instruments. These are investments in long only publicly listed equity securities. The fair values of the investments in this class have been estimated using the net asset value per share of the investments. A majority of these investments can typically be liquidated on a monthly basis, with a 30-day notification period. The Foundation’s September 30, 2019 and 2018 credit and loan private investments include investments in private limited partnership investments that invest in domestic and European loan funds. The fair values of these investments have been estimated using the net asset values of the investments. The remaining investment period of these investments is less than five years. The nature of these investments involve capital calls and distributions being made throughout the investment period based upon the activity of the underlying investments. Because no public market exists for selling these types of investments, they are viewed as long-term investments in nature with funds being committed over the life of the investment. The University’s and the Foundation’s September 30, 2019 and 2018 multi-strategy hedge funds class includes investments in hedge funds that pursue a variety of strategies to diversify risks and reduce volatility. The strategies may include equity long/short strategies, equity market-neutral strategies, fixed-income relative value, credit long/short, and global macro strategies, risk parity strategies, short bias, even driven, and fixed-income arbitrage positions. The fair values of the multi-strategy hedge funds investments have been estimated using the net asset value per share of the investments. The redemption policy is quarterly, with a 90-day notification period. The University’s small hedge fund investment in this class is held within a trust in which the University is a minority beneficiary. Therefore, the University cannot request redemptions. The Foundation’s September 30, 2019 and 2018 equity private investments include investments in private equity funds that invest in venture capital, growth equity, buyout funds, and direct lending strategies. The fair values of the investments in this class have been estimated using the net asset value of the University’s ownership interest in partners’ capital. The investment period for the equity private investment is between three and twenty years. The nature of these investments involves capital calls being made throughout the investment period, as well as income distributions being received as underlying investments are bought and sold. Because no public market exists for selling these types of investments, they are viewed as long-term in nature with funds being committed over the life of the investment. The Foundation’s September 30, 2019 and 2018 real assets investments include investments in comingled funds and private investments that invest in inflation-linked fixed-income instruments, commodity derivative instruments, and real estate funds. The fair values of the investments in this class have been estimated using the net asset value of the University’s ownership interest in partners’ capital. The Foundation’s real assets investments have a variety of redemption policies and notification periods, the most restrictive of which permit quarterly redemptions with a 90-day notification period.

Wayne State University Notes to Financial Statements September 30, 2019 and 2018
50
Note 15 - Service Concession Arrangement
On November 30, 2017, the University entered into a Service Concessionaire Agreement (SCA) with Corvias Campus Living-WSU, LLC (Corvias), whereby Corvias will manage, maintain, and operate housing resources on campus for a 40-year term, which ends in November 2057. As part of the SCA, the University retains ownership of the housing projects and the ability, with certain limitations, to modify and approve rates, and specify or limit to whom services may be provided. In accordance with the SCA, Corvias will construct and renovate housing projects on campus. The budget for these housing projects is $151,350,000, and all projects are planned for completion by 2020. In 2019, Corvias provided $53,272,000 for construction of the Anthony Wayne Drive housing project (substantially Phase II), which is recorded in capital assets as of September 30, 2019. In 2018, Corvias provided $63,552,000 for construction of the Anthony Wayne Drive housing project (Phase 1) which is recorded in capital assets at September 30, 2018, $102,890,000 to cover the total debt defeased by the project (see Note 6), and $12,104,000 in up-front cash proceeds for additional transactional and housing expenses. The total consideration provided by Corvias of $53,272,000 and $178,546,000, in 2019 and 2018, respectively, was reflected as deferred inflow of resources. The University amortized $4,633,000 and $2,826,000 of the deferred inflow in 2019 and 2018, respectively, leaving a remaining deferred inflow of resources balance of $224,359,000 and $175,720,000 at September 30, 2019 and 2018, respectively.
Note 16 – Subsequent Event
Debt In October 2019, the University issued its tax exempt Series 2019A Bonds for a par amount of $62,450,000 and net premium of $13,831,885 and its taxable Series 2019B Bonds for a par amount of $25,685,000. The tax-exempt bond proceeds, $76,281,885 with an average coupon interest rate of 4.8 percent, were used to fund various university projects and related issuance costs. The tax- exempt proceeds also current refunded the Series 2009A bonds par amount of $28,885.000 and the Series 2009B bonds par amount of $23,965,000. The taxable proceeds, $25,685,000 with an average coupon of 3.5 percent, were issued to fund a basketball arena for the men’s and women’s basketball teams. Related Party In October 2019, the University entered into a loan and security agreement with a University affiliate in which the University agreed to provide certain financing to support the affiliate organization exit bankruptcy. The financing support includes a term loan of $7,319,576 and a revolving loan (tranche A and tranche B) not to exceed $7,759,165 with interest rates ranging from zero to 4.0 percent and a maturity date of September 30, 2034.
Note 17 - Future Accounting Pronouncements
In January 2017, the Governmental Accounting Standards Board issued GASB Statement No. 84, Fiduciary Activities, which establishes criteria for identifying fiduciary activities of governments and improves guidance for accounting and financial reporting related to how these activities should be reported. The University is currently evaluating the impact this standard will have on the financial statements when adopted. The provisions of this statement are effective for the University’s financial statements for the year ending September 30, 2020.
Wayne State University Notes to Financial Statements September 30, 2019 and 2018
51
Note 17 - Future Accounting Pronouncements (Continued) In June 2017, the Governmental Accounting Standards Board issued GASB Statement No. 87, Leases, which aims to improve accounting and financial reporting for leases. It establishes a single model for lease accounting based on the foundational principle that leases are financings of the right to use an underlying asset. The University is currently evaluating the impact this standard will have on the financial statements when adopted. The provisions of this statement are effective for the University’s financial statements for the year ending September 30, 2021.

52
Required Supplementary Information

Wayne State University Schedule of Changes in the University’s Total
OPEB Liability and Related Ratios September 30, 2019
53
The historical reconciliation of the total reported liability for postemployment benefits obligations for the year ended September 30 is summarized as follows:
2019 2018
Service cost 215,000$ 380,000$ Interest cost 296,000 254,000 Effect of economic/demographic gains or losses (393,000) (385,000) Changes in assumptions (510,000) (627,000) Difference between expected and actual plan experience - - Benefit payments (10,000) (11,000)
Net changes (402,000)$ (389,000)$
Total liability - Beginning of year 7,932,000$ 8,321,000$
Total liability - End of year 7,530,000$ 7,932,000$
Covered employee payroll Not applicable Not applicable
Total liability as a percentage of covered employee payroll Not applicable Not applicable Discount rates used in determining the total reported liability for postemployment benefits obligations were 4.18 percent and 3.64 percent at the measurement dates of September 30, 2019 and 2018, respectively.

54
Supplemental Information

Wayne State University
Combining Statement of Net Position (Deficit) September 30, 2019
(with comparative total for the year ended September 30, 2018) (in thousands)
55
2018
Auxiliary Independent Expendable Subtotal Student Endowment Wayne State
General Designated Activities Operations Restricted Current Plant Loan and Similar Agency University University Foundation Fund Fund Fund Fund Fund Funds Fund Fund Funds Fund Total Total Total Total
Asse ts
Curre nt Asse ts Cash, cash equivalents, and investments $ 206,883 $ 67,729 $ 8,705 $ - $ 55,767 $ 339,084 $ 38,428 $ 16,609 $ 1,478 $ 21,451 $ 417,050 $ 4,716 $ 421,766 $ 429,734
Current receivables - Net 68,922 19,030 3,878 767 25,732 118,329 1,514 104 - 4,265 124,212 736 124,948 127,561
Inventories 863 - 268 - - 1,131 - - - - 1,131 - 1,131 1,204
Prepaid expenses and deposits 44,124 142 131 4 82 44,483 141 - - 324 44,948 - 44,948 41,270
Total current assets 320,792 86,901 12,982 771 81,581 503,027 40,083 16,713 1,478 26,040 587,341 5,452 592,793 599,769
Nonc urre nt Asse ts
Investments - - - - - - 72,533 - 6,213 - 78,746 394,329 473,075 494,870
Noncurrent receivables - Net - 6,616 - 4 877 7,497 267 22,967 - 30,731 30 30,761 33,541
Derivative instruments - - - - - - 677 - - - 677 - 677 265
Capital assets - Net - - - - - - 996,321 - - - 996,321 - 996,321 926,169 -
Total noncurrent assets - 6,616 - 4 877 7,497 1,069,798 22,967 6,213 - 1,106,475 394,359 1,500,834 1,454,845
Total assets 320,792 93,517 12,982 775 82,458 510,524 1,109,881 39,680 7,691 26,040 1,693,816 399,811 2,093,627 2,054,614
De fe rre d Outflows of Re sourc e s 12 - - - - 12 13,723 - - - 13,735 - 13,735 14,405
Lia bilitie s Curre nt Lia bilitie s
Accounts payable and accrued liabilities 49,551 3,883 2,235 206 8,910 64,785 24,372 - 107 21,899 111,163 591 111,754 115,792
Unearned revenue 165,500 1,233 2,571 - 10,625 179,929 52 - - - 179,981 - 179,981 176,265
Deposits 2,080 200 56 - 3 2,339 - - - 4,141 6,480 - 6,480 6,461
Long- term debt - Current portion - - - - - - 16,026 - - - 16,026 - 16,026 14,092
Total current liabilities 217,131 5,316 4,862 206 19,538 247,053 40,450 - 107 26,040 313,650 591 314,241 312,610
Nonc urre nt Lia bilitie s Federal portion of student loan funds - - - - - - - 29,092 - - 29,092 - 29,092 28,097
Accrued employee benefits and other liabilities 21,336 - 4,301 - - 25,637 - - 2,297 - 27,934 - 27,934 28,282
Long- term debt - Net of current portion - - - - - - 448,816 - - - 448,816 - 448,816 464,735
Total noncurrent liabilities 21,336 - 4,301 - - 25,637 448,816 29,092 2,297 - 505,842 - 505,842 521,114
Total liabilities 238,467 5,316 9,163 206 19,538 272,690 489,266 29,092 2,404 26,040 819,492 591 820,083 833,724
De fe rre d Inflow of Re sourc e s 1,387 - 11,524 - - 12,911 212,835 - 491 - 226,237 - 226,237 176,967
Ne t Position (De fic it)
Net investment in capital assets - - - - - - 391,506 - - - 391,506 - 391,506 391,412
Restricted:
Nonexpendable - - - - - - - 9,022 2,290 - 11,312 228,178 239,490 225,251
Expendable 62,920 62,920 8,994 - 2,506 - 74,420 163,218 237,638 243,187
Unrestricted 80,950 88,201 (7,705) 569 - 162,015 21,003 1,566 - - 184,584 7,824 192,408 198,478
Total net position (defic it) 8 0 ,9 5 0$ 8 8 ,2 0 1$ (7 ,7 0 5 )$ 5 6 9$ 6 2 ,9 2 0$ 2 2 4 ,9 3 5$ 4 2 1,5 0 3$ 10 ,5 8 8$ 4 ,7 9 6$ - $ 6 6 1,8 2 2$ 3 9 9 ,2 2 0$ 1,0 6 1,0 4 2$ 1,0 5 8 ,3 2 8$
2019
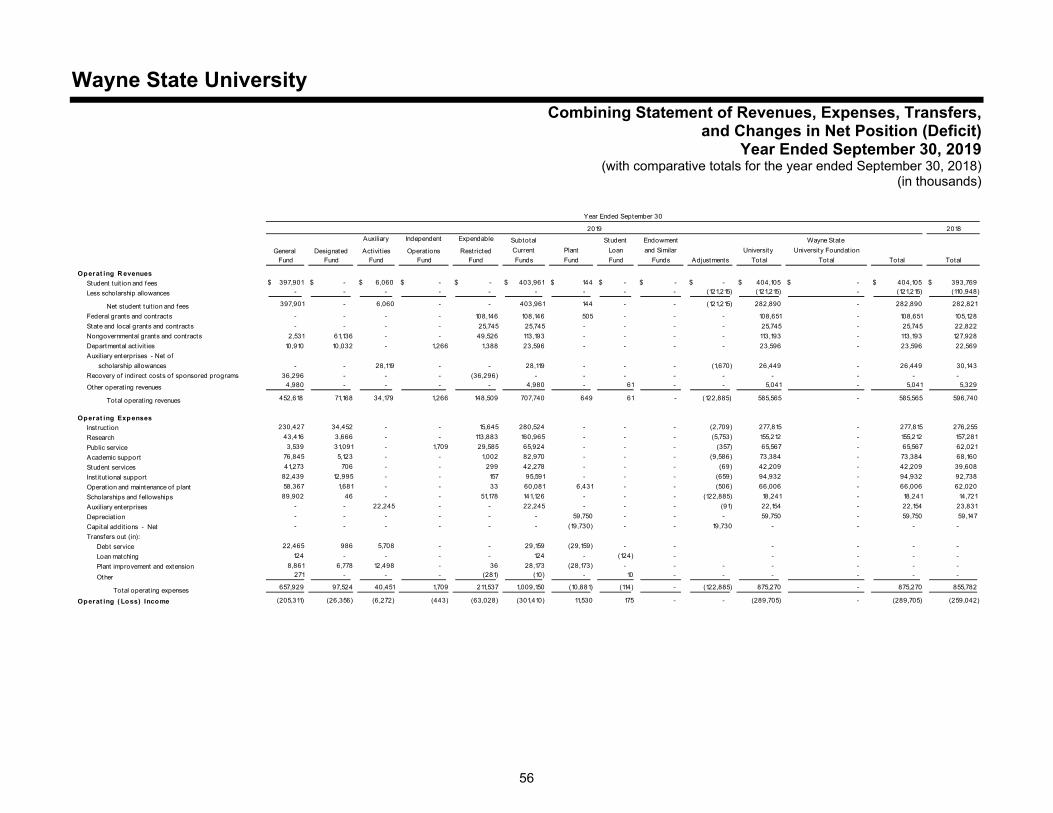
Wayne State University
Combining Statement of Revenues, Expenses, Transfers, and Changes in Net Position (Deficit)
Year Ended September 30, 2019 (with comparative totals for the year ended September 30, 2018)
(in thousands)
56
2018
Auxiliary Independent Expendable Subtotal Student Endowment Wayne State
General Designated Activit ies Operat ions Restricted Current Plant Loan and Similar University University Foundat ion
Fund Fund Fund Fund Fund Funds Fund Fund Funds Adjustments Total Total Total Total
Operat ing R evenues
Student tuit ion and fees $ 397,901 $ - $ 6,060 $ - $ - $ 403,961 $ 144 $ - $ - $ - $ 404,105 $ - $ 404,105 $ 393,769
Less scholarship allowances - - - - - - - - - (121,215) (121,215) - (121,215) (110,948)
Net student tuit ion and fees 397,901 - 6,060 - - 403,961 144 - - (121,215) 282,890 - 282,890 282,821
Federal grants and contracts - - - - 108,146 108,146 505 - - - 108,651 - 108,651 105,128
State and local grants and contracts - - - - 25,745 25,745 - - - - 25,745 - 25,745 22,822
Nongovernmental grants and contracts 2,531 61,136 - - 49,526 113,193 - - - - 113,193 - 113,193 127,928
Departmental act ivit ies 10,910 10,032 - 1,266 1,388 23,596 - - - - 23,596 - 23,596 22,569
Auxiliary enterprises - Net of
scholarship allowances - - 28,119 - - 28,119 - - - (1,670) 26,449 - 26,449 30,143
Recovery of indirect costs of sponsored programs 36,296 - - - (36,296) - - - - - - - - -
Other operat ing revenues 4,980 - - - - 4,980 - 61 - - 5,041 - 5,041 5,329
Total operat ing revenues 452,618 71,168 34,179 1,266 148,509 707,740 649 61 - (122,885) 585,565 - 585,565 596,740
Operat ing Exp enses
Instruct ion 230,427 34,452 - - 15,645 280,524 - - - (2,709) 277,815 - 277,815 276,255
Research 43,416 3,666 - - 113,883 160,965 - - - (5,753) 155,212 - 155,212 157,281
Public service 3,539 31,091 - 1,709 29,585 65,924 - - - (357) 65,567 - 65,567 62,021
Academic support 76,845 5,123 - - 1,002 82,970 - - - (9,586) 73,384 - 73,384 68,160
Student services 41,273 706 - - 299 42,278 - - - (69) 42,209 - 42,209 39,608
Inst itut ional support 82,439 12,995 - - 157 95,591 - - - (659) 94,932 - 94,932 92,738
Operat ion and maintenance of plant 58,367 1,681 - - 33 60,081 6,431 - - (506) 66,006 - 66,006 62,020
Scholarships and fellowships 89,902 46 - - 51,178 141,126 - - - (122,885) 18,241 - 18,241 14,721
Auxiliary enterprises - - 22,245 - - 22,245 - - - (91) 22,154 - 22,154 23,831
Depreciat ion - - - - - - 59,750 - - - 59,750 - 59,750 59,147
Capital addit ions - Net - - - - - - (19,730) - - 19,730 - - - -
Transfers out (in):
Debt service 22,465 986 5,708 - - 29,159 (29,159) - - - - - -
Loan matching 124 - - - - 124 - (124) - - - - -
Plant improvement and extension 8,861 6,778 12,498 - 36 28,173 (28,173) - - - - - - -
Other 271 - - - (281) (10) - 10 - - - - - -
Total operat ing expenses 657,929 97,524 40,451 1,709 211,537 1,009,150 (10,881) (114) - (122,885) 875,270 - 875,270 855,782
Operat ing ( Loss) Income (205,311) (26,356) (6,272) (443) (63,028) (301,410) 11,530 175 - - (289,705) - (289,705) (259,042)
Year Ended September 30
2019

Wayne State University
Combining Statement of Revenues, Expenses, Transfers, and Changes in Net Position (Deficit) (Continued)
Year Ended September 30, 2019 (with comparative totals for the year ended September 30, 2018)
(in thousands)
57
2018
Auxiliary Independent Expendable Subtotal Student Endowment Wayne State
General Designated Activities Operations Restricted Current Plant Loan and Similar University University FoundationFund Fund Fund Fund Fund Funds Fund Fund Funds Adjustments Total Total Total Total
Nonope ra ting Re ve nue s (Expe nse s)
State operating appropriation $ 202,115 $ - $ - $ - $ 248 $ 202,363 $ - $ - $ - $ - $ 202,363 $ - $ 202,363 $ 199,170
Federal Pell grant - - - - 38,941 38,941 - - - - 38,941 - 38,941 33,882
Gifts - 8,866 16 2,035 10,590 21,507 - 3 951 - 22,461 342 22,803 28,736
Investment income (loss):
Change in fair value of derivatives - - - - - - 412 - - - 412 - 412 88
Endowment and similar funds - - - - 120 120 - - (120) - - - - -
Other 5,017 13,370 12 - 689 19,088 2,550 131 323 - 22,092 5,633 27,725 24,221
Net distributions from the Foundation 932 40 - 6 11,532 12,510 39 10 (74) - 12,485 (12,485) - -
Interest on capital asset - Related debt - - - - - - (20,340) - - - (20,340) - (20,340) (18,960)
Gain (loss) on capital assets retired - - - - - - (681) - - - (681) - (681) 3,862
Other - - - - - - 7,011 (122) (977) - 5,912 - 5,912 4,909
Net nonoperating revenues (expenses) 208,064 22,276 28 2,041 62,120 294,529 (11,009) 22 103 - 283,645 (6,510) 277,135 275,908
Inc ome (Loss) Be fore Othe r 2,753 (4,080) (6,244) 1,598 (908) (6,881) 521 197 103 - (6,060) (6,510) (12,570) 16,866
Othe r
Capital gifts - - - - - - 1,208 - - - 1,208 - 1,208 1,014
Gifts for permanent endowments - - - - - - - - - - - 14,076 14,076 18,986
Total other - - - - - - 1,208 - - - 1,208 14,076 15,284 20,000
Inc re a se (De c re a se ) in Ne t P osition 2,753 (4,080) (6,244) 1,598 (908) (6,881) 1,729 197 103 - (4,852) 7,566 2,714 36,866
Ne t P osition (De fic it) - Be ginning of ye a r 78,197 92,281 (1,461) (1,029) 63,828 231,816 419,774 10,391 4,693 - 666,674 391,654 1,058,328 1,021,462
Ne t P osition (De fic it) - End of ye a r 8 0 ,9 5 0$ 8 8 ,2 0 1$ (7 ,7 0 5 )$ 5 6 9$ 6 2 ,9 2 0$ 2 2 4 ,9 3 5$ 4 2 1,5 0 3$ 10 ,5 8 8$ 4 ,7 9 6$ - $ 6 6 1,8 2 2$ 3 9 9 ,2 2 0$ 1,0 6 1,0 4 2$ 1,0 5 8 ,3 2 8$
Year Ended September 30
2019
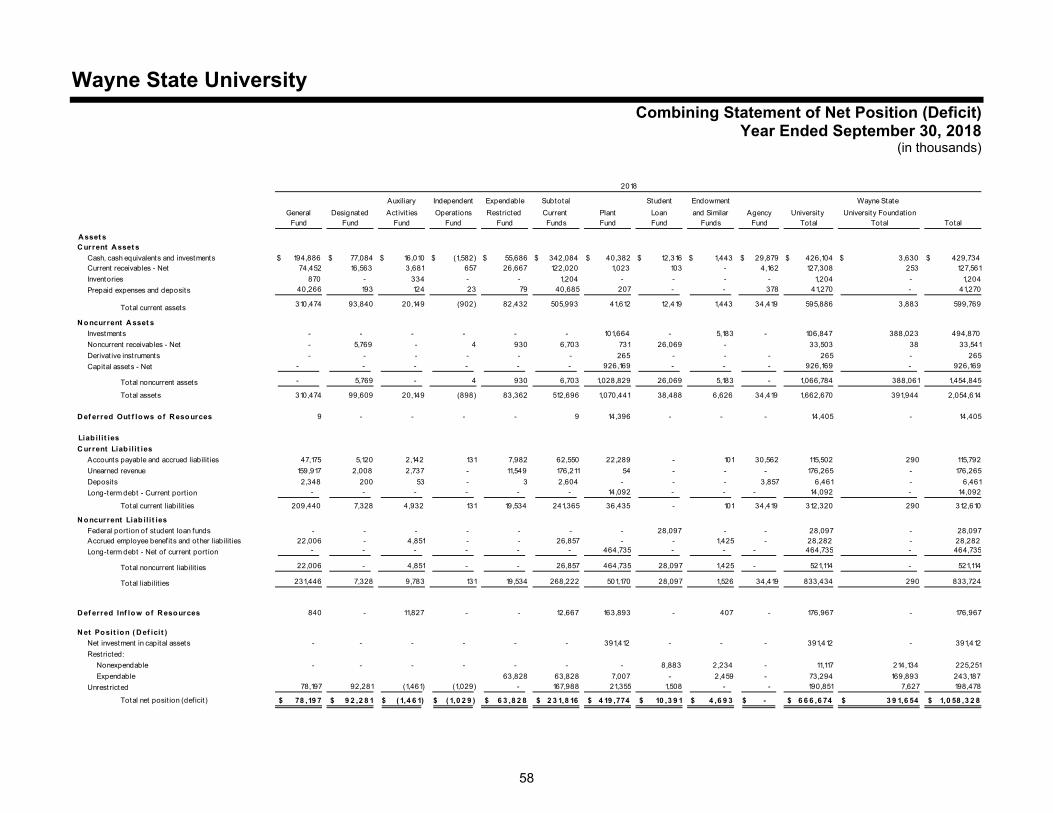
Wayne State University
Combining Statement of Net Position (Deficit) Year Ended September 30, 2018
(in thousands)
58
Auxiliary Independent Expendable Subtotal Student Endowment Wayne State
General Designated Act ivit ies Operations Restricted Current Plant Loan and Similar Agency University University Foundation Fund Fund Fund Fund Fund Funds Fund Fund Funds Fund Total Total Total
A sset s C urrent A sset s
Cash, cash equivalents and investments $ 194,886 $ 77,084 $ 16,010 $ (1,582) $ 55,686 $ 342,084 $ 40,382 $ 12,316 $ 1,443 $ 29,879 $ 426,104 $ 3,630 $ 429,734 Current receivables - Net 74,452 16,563 3,681 657 26,667 122,020 1,023 103 - 4,162 127,308 253 127,561
Inventories 870 - 334 - - 1,204 - - - - 1,204 - 1,204
Prepaid expenses and deposits 40,266 193 124 23 79 40,685 207 - - 378 41,270 - 41,270
Total current assets 310,474 93,840 20,149 (902) 82,432 505,993 41,612 12,419 1,443 34,419 595,886 3,883 599,769
N oncurrent A sset s
Investments - - - - - - 101,664 - 5,183 - 106,847 388,023 494,870
Noncurrent receivables - Net - 5,769 - 4 930 6,703 731 26,069 - 33,503 38 33,541
Derivat ive instruments - - - - - - 265 - - - 265 - 265
Capital assets - Net - - - - - - 926,169 - - - 926,169 - 926,169
Total noncurrent assets - 5,769 - 4 930 6,703 1,028,829 26,069 5,183 - 1,066,784 388,061 1,454,845
Total assets 310,474 99,609 20,149 (898) 83,362 512,696 1,070,441 38,488 6,626 34,419 1,662,670 391,944 2,054,614
D ef erred Out f lows o f R eso urces 9 - - - - 9 14,396 - - - 14,405 - 14,405
Liab il it ies
C urrent Liab il it ies
Accounts payable and accrued liabilit ies 47,175 5,120 2,142 131 7,982 62,550 22,289 - 101 30,562 115,502 290 115,792
Unearned revenue 159,917 2,008 2,737 - 11,549 176,211 54 - - - 176,265 - 176,265
Deposits 2,348 200 53 - 3 2,604 - - - 3,857 6,461 - 6,461
Long-term debt - Current port ion - - - - - - 14,092 - - - 14,092 - 14,092
Total current liabilit ies 209,440 7,328 4,932 131 19,534 241,365 36,435 - 101 34,419 312,320 290 312,610
N oncurrent Liab il i t ies
Federal port ion of student loan funds - - - - - - - 28,097 - - 28,097 - 28,097 Accrued employee benef its and other liabilit ies 22,006 - 4,851 - - 26,857 - - 1,425 - 28,282 - 28,282
Long-term debt - Net of current port ion - - - - - - 464,735 - - - 464,735 - 464,735
Total noncurrent liabilit ies 22,006 - 4,851 - - 26,857 464,735 28,097 1,425 - 521,114 - 521,114
Total liabilit ies 231,446 7,328 9,783 131 19,534 268,222 501,170 28,097 1,526 34,419 833,434 290 833,724
D ef erred Inf low o f R esources 840 - 11,827 - - 12,667 163,893 - 407 - 176,967 - 176,967
N et Posit ion ( D ef icit )
Net investment in capital assets - - - - - - 391,412 - - - 391,412 - 391,412
Restricted:
Nonexpendable - - - - - - - 8,883 2,234 - 11,117 214,134 225,251
Expendable 63,828 63,828 7,007 - 2,459 - 73,294 169,893 243,187
Unrestricted 78,197 92,281 (1,461) (1,029) - 167,988 21,355 1,508 - - 190,851 7,627 198,478
Total net posit ion (deficit ) 78 ,19 7$ 9 2 ,2 8 1$ ( 1,4 6 1)$ ( 1,0 2 9 )$ 6 3 ,8 2 8$ 2 3 1,8 16$ 4 19 ,774$ 10 ,3 9 1$ 4 ,6 9 3$ - $ 6 6 6 ,6 74$ 3 9 1,6 54$ 1,0 58 ,3 2 8$
2018

Wayne State University
Combining Statement of Revenues, Expenses, Transfers, and Changes in Net Position (Deficit)
Year Ended September 30, 2018 (in thousands)
59
Auxiliary Independent Expendable Subtotal Student Endowment Wayne State
General Designated Act ivit ies Operat ions Restricted Current Plant Loan and Similar University University Foundation
Fund Fund Fund Fund Fund Funds Fund Fund Funds Adjustments Total Total Total
Operat ing R evenues
Student tuit ion and fees $ 387,558 $ - $ 6,066 $ - $ - $ 393,624 $ 145 $ - $ - $ - $ 393,769 $ - $ 393,769
Less scholarship allowances - - - - - - - - - (110,948) (110,948) - (110,948)
Net student tuit ion and fees 387,558 - 6,066 - - 393,624 145 - - (110,948) 282,821 - 282,821
Federal grants and contracts - - - - 104,613 104,613 515 - - 105,128 - 105,128
State and local grants and contracts - - - - 22,822 22,822 - - - 22,822 - 22,822
Nongovernmental grants and contracts 1,836 76,831 - - 49,261 127,928 - - - 127,928 - 127,928
Departmental act ivit ies 10,483 9,798 - 1,149 1,139 22,569 - - - 22,569 - 22,569
Auxiliary enterprises - Net of
scholarship allowances - - 31,808 - - 31,808 - - - (1,665) 30,143 - 30,143
Recovery of indirect costs of sponsored programs 36,136 - - - (36,136) - - - - - - - -
Other operat ing revenues 5,263 - - - - 5,263 - 66 - - 5,329 - 5,329
Total operat ing revenues 441,276 86,629 37,874 1,149 141,699 708,627 660 66 - (112,613) 596,740 - 596,740
Operat ing Exp enses
Instruct ion 223,516 40,536 - - 13,841 277,893 - - - (1,638) 276,255 - 276,255
Research 46,842 2,083 - - 112,864 161,789 - - - (4,508) 157,281 - 157,281
Public service 1,933 30,869 - 2,873 27,032 62,707 - - - (686) 62,021 - 62,021
Academic support 70,641 5,156 - - 800 76,597 - - - (8,437) 68,160 - 68,160
Student services 38,538 794 - - 311 39,643 - - - (35) 39,608 - 39,608
Inst itut ional support 85,533 7,226 - - 129 92,888 - - - (150) 92,738 - 92,738
Operat ion and maintenance of plant 55,073 1,161 - - 7 56,241 6,593 - - (814) 62,020 - 62,020
Scholarships and fellowships 81,930 245 - - 45,159 127,334 - - - (112,613) 14,721 - 14,721
Auxiliary enterprises - - 23,895 - - 23,895 - - - (64) 23,831 - 23,831
Depreciat ion - - - - - - 59,147 - - - 59,147 - 59,147
Capital addit ions - Net - - - - - - (16,332) - - 16,332 - - -
Transfers out (in):
Debt service 17,667 986 5,441 - - 24,094 (24,094) - - - - -
Loan matching - - - - - - - - - - - -
Plant improvement and extension 10,882 (1,313) 2,852 - (42) 12,379 (12,379) - - - - - -
Other 3 11 - - (49) (35) - 35 - - - - -
Total operat ing expenses 632,558 87,754 32,188 2,873 200,052 955,425 12,935 35 - (112,613) 855,782 - 855,782
Operat ing ( Lo ss) Inco me (191,282) (1,125) 5,686 (1,724) (58,353) (246,798) (12,275) 31 - - (259,042) - (259,042)
2018
Year Ended September 30
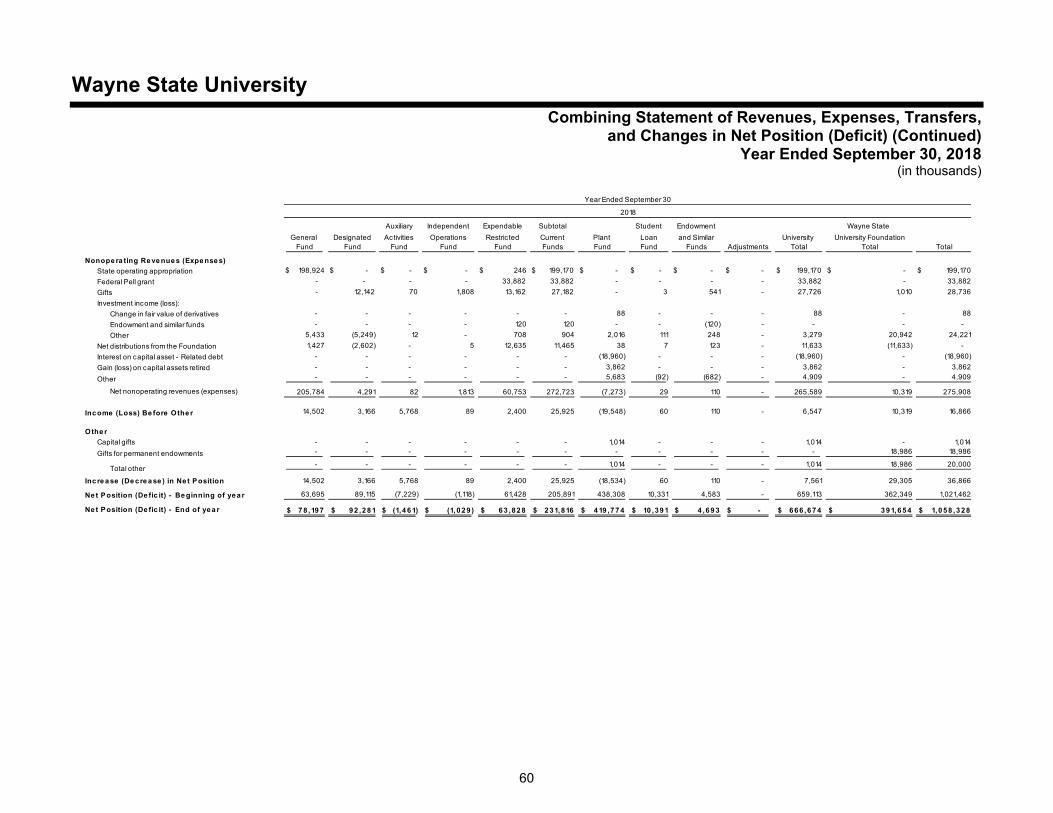
Wayne State University
Combining Statement of Revenues, Expenses, Transfers, and Changes in Net Position (Deficit) (Continued)
Year Ended September 30, 2018 (in thousands)
60
Auxiliary Independent Expendable Subtotal Student Endowment Wayne State
General Designated Activities Operations Restric ted Current Plant Loan and Similar University University FoundationFund Fund Fund Fund Fund Funds Fund Fund Funds Adjustments Total Total Total
Nonope ra ting Re ve nue s (Expe nse s)
State operating appropriation $ 198,924 $ - $ - $ - $ 246 $ 199,170 $ - $ - $ - $ - $ 199,170 $ - $ 199,170
Federal Pell grant - - - - 33,882 33,882 - - - - 33,882 - 33,882
Gifts - 12,142 70 1,808 13,162 27,182 - 3 541 - 27,726 1,010 28,736
Investment income (loss):
Change in fair value of derivatives - - - - - - 88 - - - 88 - 88
Endowment and similar funds - - - - 120 120 - - (120) - - - -
Other 5,433 (5,249) 12 - 708 904 2,016 111 248 - 3,279 20,942 24,221
Net distributions from the Foundation 1,427 (2,602) - 5 12,635 11,465 38 7 123 - 11,633 (11,633) -
Interest on capital asset - Related debt - - - - - - (18,960) - - - (18,960) - (18,960)
Gain (loss) on capital assets retired - - - - - - 3,862 - - - 3,862 - 3,862
Other - - - - - - 5,683 (92) (682) - 4,909 - 4,909
Net nonoperating revenues (expenses) 205,784 4,291 82 1,813 60,753 272,723 (7,273) 29 110 - 265,589 10,319 275,908
Income (Loss) Be fore Other 14,502 3,166 5,768 89 2,400 25,925 (19,548) 60 110 - 6,547 10,319 16,866
Othe r
Capital gifts - - - - - - 1,014 - - - 1,014 - 1,014
Gifts for permanent endowments - - - - - - - - - - - 18,986 18,986
Total other - - - - - - 1,014 - - - 1,014 18,986 20,000
Inc re a se (De cre a se ) in Ne t Position 14,502 3,166 5,768 89 2,400 25,925 (18,534) 60 110 - 7,561 29,305 36,866
Net Position (De fic it) - Be ginning of yea r 63,695 89,115 (7,229) (1,118) 61,428 205,891 438,308 10,331 4,583 - 659,113 362,349 1,021,462
Net Position (De fic it) - End of yea r 7 8 ,19 7$ 92 ,2 8 1$ (1,4 6 1)$ (1,0 2 9 )$ 6 3 ,82 8$ 2 3 1,816$ 4 19 ,7 7 4$ 10 ,39 1$ 4 ,6 9 3$ - $ 6 66 ,6 7 4$ 3 9 1,6 5 4$ 1,05 8 ,3 28$
2018
Year Ended September 30

wayne.edu877-WSU-INFO

Wayne State University
Federal AwardsSupplemental Information
September 30, 2019
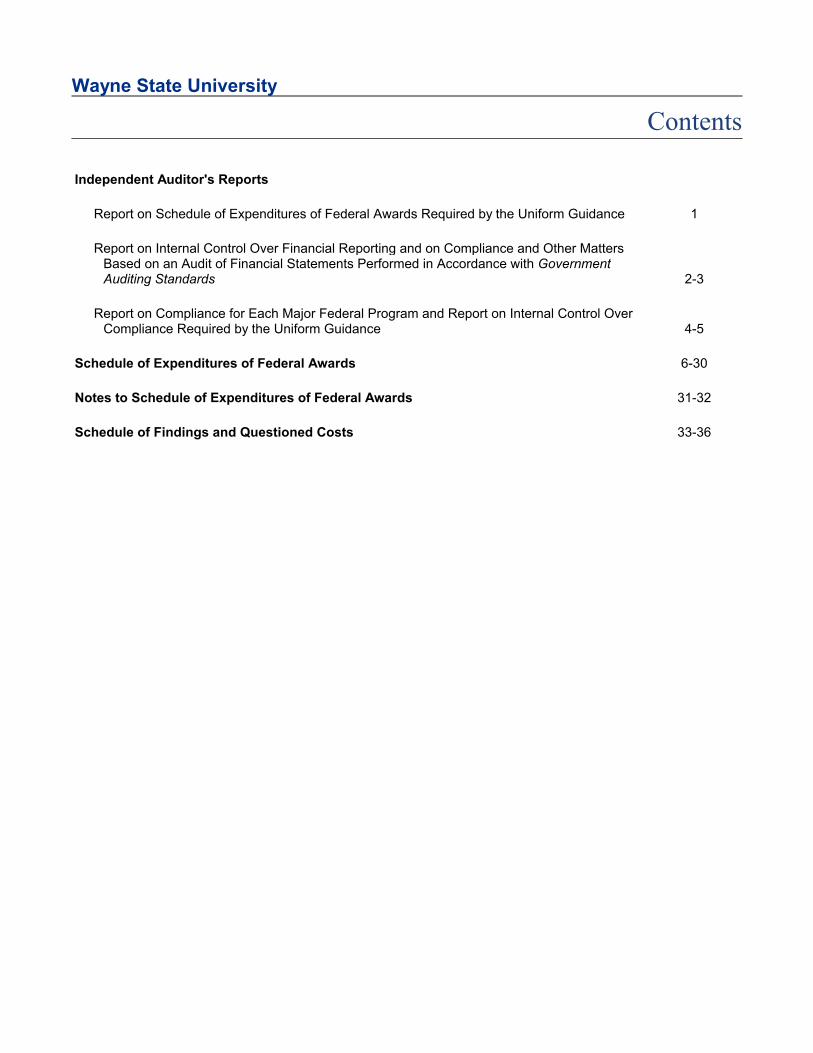
Wayne State University
Contents
Independent Auditor's Reports
Report on Schedule of Expenditures of Federal Awards Required by the Uniform Guidance 1
Report on Internal Control Over Financial Reporting and on Compliance and Other MattersBased on an Audit of Financial Statements Performed in Accordance with GovernmentAuditing Standards 2-3
Report on Compliance for Each Major Federal Program and Report on Internal Control OverCompliance Required by the Uniform Guidance 4-5
Schedule of Expenditures of Federal Awards 6-30
Notes to Schedule of Expenditures of Federal Awards 31-32
Schedule of Findings and Questioned Costs 33-36

Report on Schedule of Expenditures of Federal Awards Required by the Uniform Guidance
Independent Auditor's Report
To the Board of GovernorsWayne State University
We have audited the financial statements of the business-type activities and the discretely presented componentunit of Wayne State University (the "University") as of and for the year ended September 30, 2019 and the relatednotes to the financial statements, which collectively comprise Wayne State University's basic financial statements.We issued our report thereon dated February 13, 2020, which contained unmodified opinions on those basicfinancial statements of the University. Our audit was conducted for the purpose of forming opinions on thefinancial statements that collectively comprise the basic financial statements. We have not performed anyprocedures with respect to the audited financial statements subsequent to February 13, 2020.
The accompanying schedule of expenditures of federal awards is presented for the purpose of additional analysis,as required by the Uniform Guidance, and is not a required part of the basic financial statements. Such informationis the responsibility of management and was derived from and relates directly to the underlying accounting andother records used to prepare the basic financial statements. The information has been subjected to the auditingprocedures applied in the audit of the financial statements and certain additional procedures, including comparingand reconciling such information directly to the underlying accounting and other records used to prepare the basicfinancial statements or to the basic financial statements themselves, and other additional procedures inaccordance with auditing standards generally accepted in the United States of America. In our opinion, theinformation is fairly stated in all material respects in relation to the basic financial statements as a whole.
February 13, 2020
1
Sharice.McClendon
East Lansing
Sharice.McClendon
Praxity

Report on Internal Control Over Financial Reporting and on Compliance and Other Matters Based on an Audit ofFinancial Statements Performed in Accordance with Government Auditing Standards
Independent Auditor's Report
To Management and the Board of GovernorsWayne State University
We have audited, in accordance with auditing standards generally accepted in the United States of America andthe standards applicable to financial audits contained in Government Auditing Standards issued by the ComptrollerGeneral of the United States, the financial statements of the business-type activities and the discretely presentedcomponent unit of Wayne State University (the "University") as of and for the year ended September 30, 2019 andthe related notes to the financial statements, which collectively comprise Wayne State University's basic financialstatements, and have issued our report thereon dated February 13, 2020.
Internal Control Over Financial Reporting
In planning and performing our audit of the financial statements, we considered the University's internal controlover financial reporting (internal control) to determine the audit procedures that are appropriate in thecircumstances for the purpose of expressing our opinions on the financial statements, but not for the purpose ofexpressing an opinion on the effectiveness of the University's internal control. Accordingly, we do not express anopinion on the effectiveness of the University's internal control.
A deficiency in internal control exists when the design or operation of a control does not allow management oremployees, in the normal course of performing their assigned functions, to prevent, or detect and correct,misstatements on a timely basis. A material weakness is a deficiency, or a combination of deficiencies, in internalcontrol such that there is a reasonable possibility that a material misstatement of the University's financialstatements will not be prevented, or detected and corrected, on a timely basis. A significant deficiency is adeficiency, or a combination of deficiencies, in internal control that is less severe than a material weakness, yetimportant enough to merit attention by those charged with governance.
Our consideration of internal control was for the limited purpose described in the first paragraph of this section andwas not designed to identify all deficiencies in internal control that might be material weaknesses or significantdeficiencies. Given these limitations, during our audit we did not identify any deficiencies in internal control that weconsider to be material weaknesses. However, material weaknesses may exist that have not been identified.
Compliance and Other Matters
As part of obtaining reasonable assurance about whether the University's financial statements are free frommaterial misstatement, we performed tests of its compliance with certain provisions of laws, regulations, contracts,and grant agreements, noncompliance with which could have a direct and material effect on the determination offinancial statement amounts. However, providing an opinion on compliance with those provisions was not anobjective of our audit, and, accordingly, we do not express such an opinion. The results of our tests disclosed noinstances of noncompliance or other matters that are required to be reported under Government AuditingStandards.
2
Sharice.McClendon
Praxity
Sharice.McClendon
East Lansing

To Management and the Board of GovernorsWayne State University
Purpose of This Report
The purpose of this report is solely to describe the scope of our testing of internal control and compliance and theresults of that testing and not to provide an opinion on the effectiveness of the University's internal control or oncompliance. This report is an integral part of an audit performed in accordance with Government AuditingStandards in considering the University's internal control and compliance. Accordingly, this communication is notsuitable for any other purpose.
February 13, 2020
3
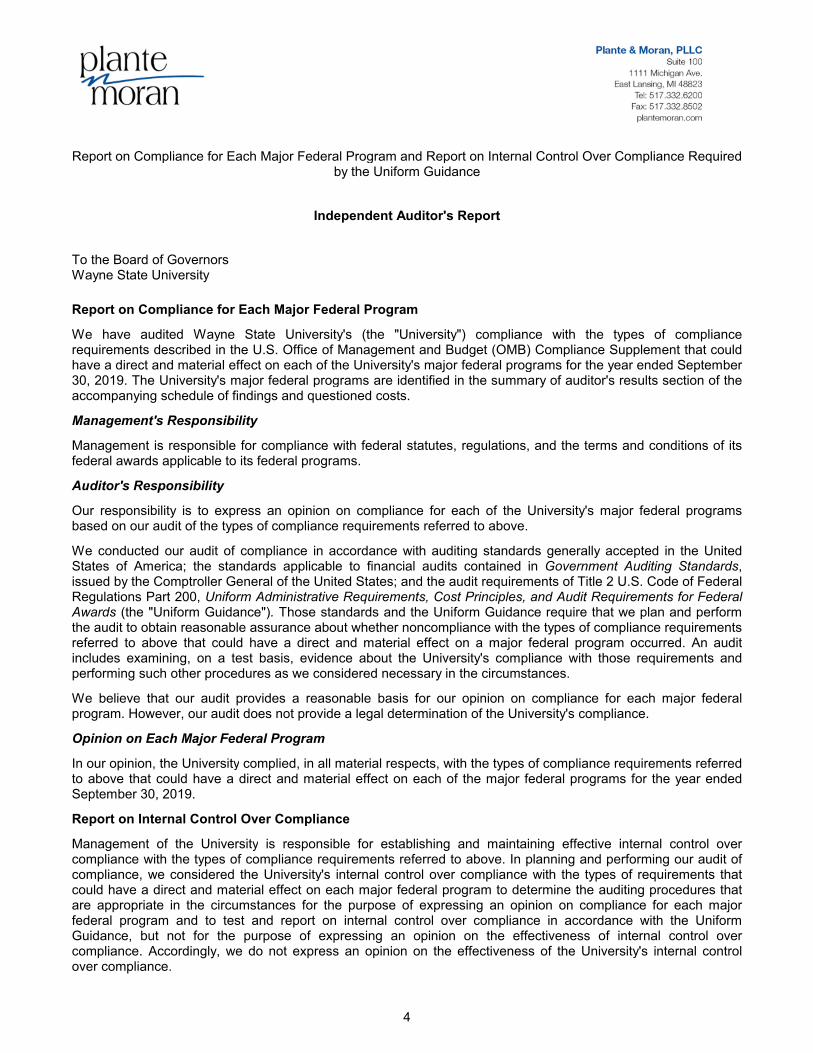
Report on Compliance for Each Major Federal Program and Report on Internal Control Over Compliance Requiredby the Uniform Guidance
Independent Auditor's Report
To the Board of GovernorsWayne State University
Report on Compliance for Each Major Federal Program
We have audited Wayne State University's (the "University") compliance with the types of compliancerequirements described in the U.S. Office of Management and Budget (OMB) Compliance Supplement that couldhave a direct and material effect on each of the University's major federal programs for the year ended September30, 2019. The University's major federal programs are identified in the summary of auditor's results section of theaccompanying schedule of findings and questioned costs.
Management's Responsibility
Management is responsible for compliance with federal statutes, regulations, and the terms and conditions of itsfederal awards applicable to its federal programs.
Auditor's Responsibility
Our responsibility is to express an opinion on compliance for each of the University's major federal programsbased on our audit of the types of compliance requirements referred to above.
We conducted our audit of compliance in accordance with auditing standards generally accepted in the UnitedStates of America; the standards applicable to financial audits contained in Government Auditing Standards,issued by the Comptroller General of the United States; and the audit requirements of Title 2 U.S. Code of FederalRegulations Part 200, Uniform Administrative Requirements, Cost Principles, and Audit Requirements for FederalAwards (the "Uniform Guidance"). Those standards and the Uniform Guidance require that we plan and performthe audit to obtain reasonable assurance about whether noncompliance with the types of compliance requirementsreferred to above that could have a direct and material effect on a major federal program occurred. An auditincludes examining, on a test basis, evidence about the University's compliance with those requirements andperforming such other procedures as we considered necessary in the circumstances.
We believe that our audit provides a reasonable basis for our opinion on compliance for each major federalprogram. However, our audit does not provide a legal determination of the University's compliance.
Opinion on Each Major Federal Program
In our opinion, the University complied, in all material respects, with the types of compliance requirements referredto above that could have a direct and material effect on each of the major federal programs for the year endedSeptember 30, 2019.
Report on Internal Control Over Compliance
Management of the University is responsible for establishing and maintaining effective internal control overcompliance with the types of compliance requirements referred to above. In planning and performing our audit ofcompliance, we considered the University's internal control over compliance with the types of requirements thatcould have a direct and material effect on each major federal program to determine the auditing procedures thatare appropriate in the circumstances for the purpose of expressing an opinion on compliance for each majorfederal program and to test and report on internal control over compliance in accordance with the UniformGuidance, but not for the purpose of expressing an opinion on the effectiveness of internal control overcompliance. Accordingly, we do not express an opinion on the effectiveness of the University's internal controlover compliance.
4
Sharice.McClendon
East Lansing
Sharice.McClendon
Praxity

To the Board of GovernorsWayne State University
A deficiency in internal control over compliance exists when the design or operation of a control over compliancedoes not allow management or employees, in the normal course of performing their assigned functions, toprevent, or detect and correct, noncompliance with a type of compliance requirement of a federal program on atimely basis. A material weakness in internal control over compliance is a deficiency, or a combination ofdeficiencies, in internal control over compliance such that there is a reasonable possibility that materialnoncompliance with a type of compliance requirement of a federal program will not be prevented, or detected andcorrected, on a timely basis. A significant deficiency in internal control over compliance is a deficiency, or acombination of deficiencies, in internal control over compliance with a type of compliance requirement of a federalprogram that is less severe than a material weakness in internal control over compliance, yet important enough tomerit attention by those charged with governance.
Our consideration of internal control over compliance was for the limited purpose described in the first paragraphof this section and was not designed to identify all deficiencies in internal control over compliance that might bematerial weaknesses or significant deficiencies, and, therefore, material weaknesses or significant deficienciesmay exist that were not identified. We did not identify any deficiencies in internal control over compliance that weconsider to be material weaknesses. However, we identified a certain deficiency in internal control overcompliance, as described in the accompanying schedule of findings and questioned costs as Finding 2019-001,that we consider to be a significant deficiency.
The University's response to the internal control over compliance finding identified in our audit is described in theaccompanying schedule of findings and questioned costs. The University's response was not subjected to theauditing procedures applied in the audit of compliance, and, accordingly, we express no opinion on the response.
The purpose of this report on internal control over compliance is solely to describe the scope of our testing ofinternal control over compliance and the results of that testing based on the requirements of the UniformGuidance. Accordingly, this report is not suitable for any other purpose.
February 13, 2020
5
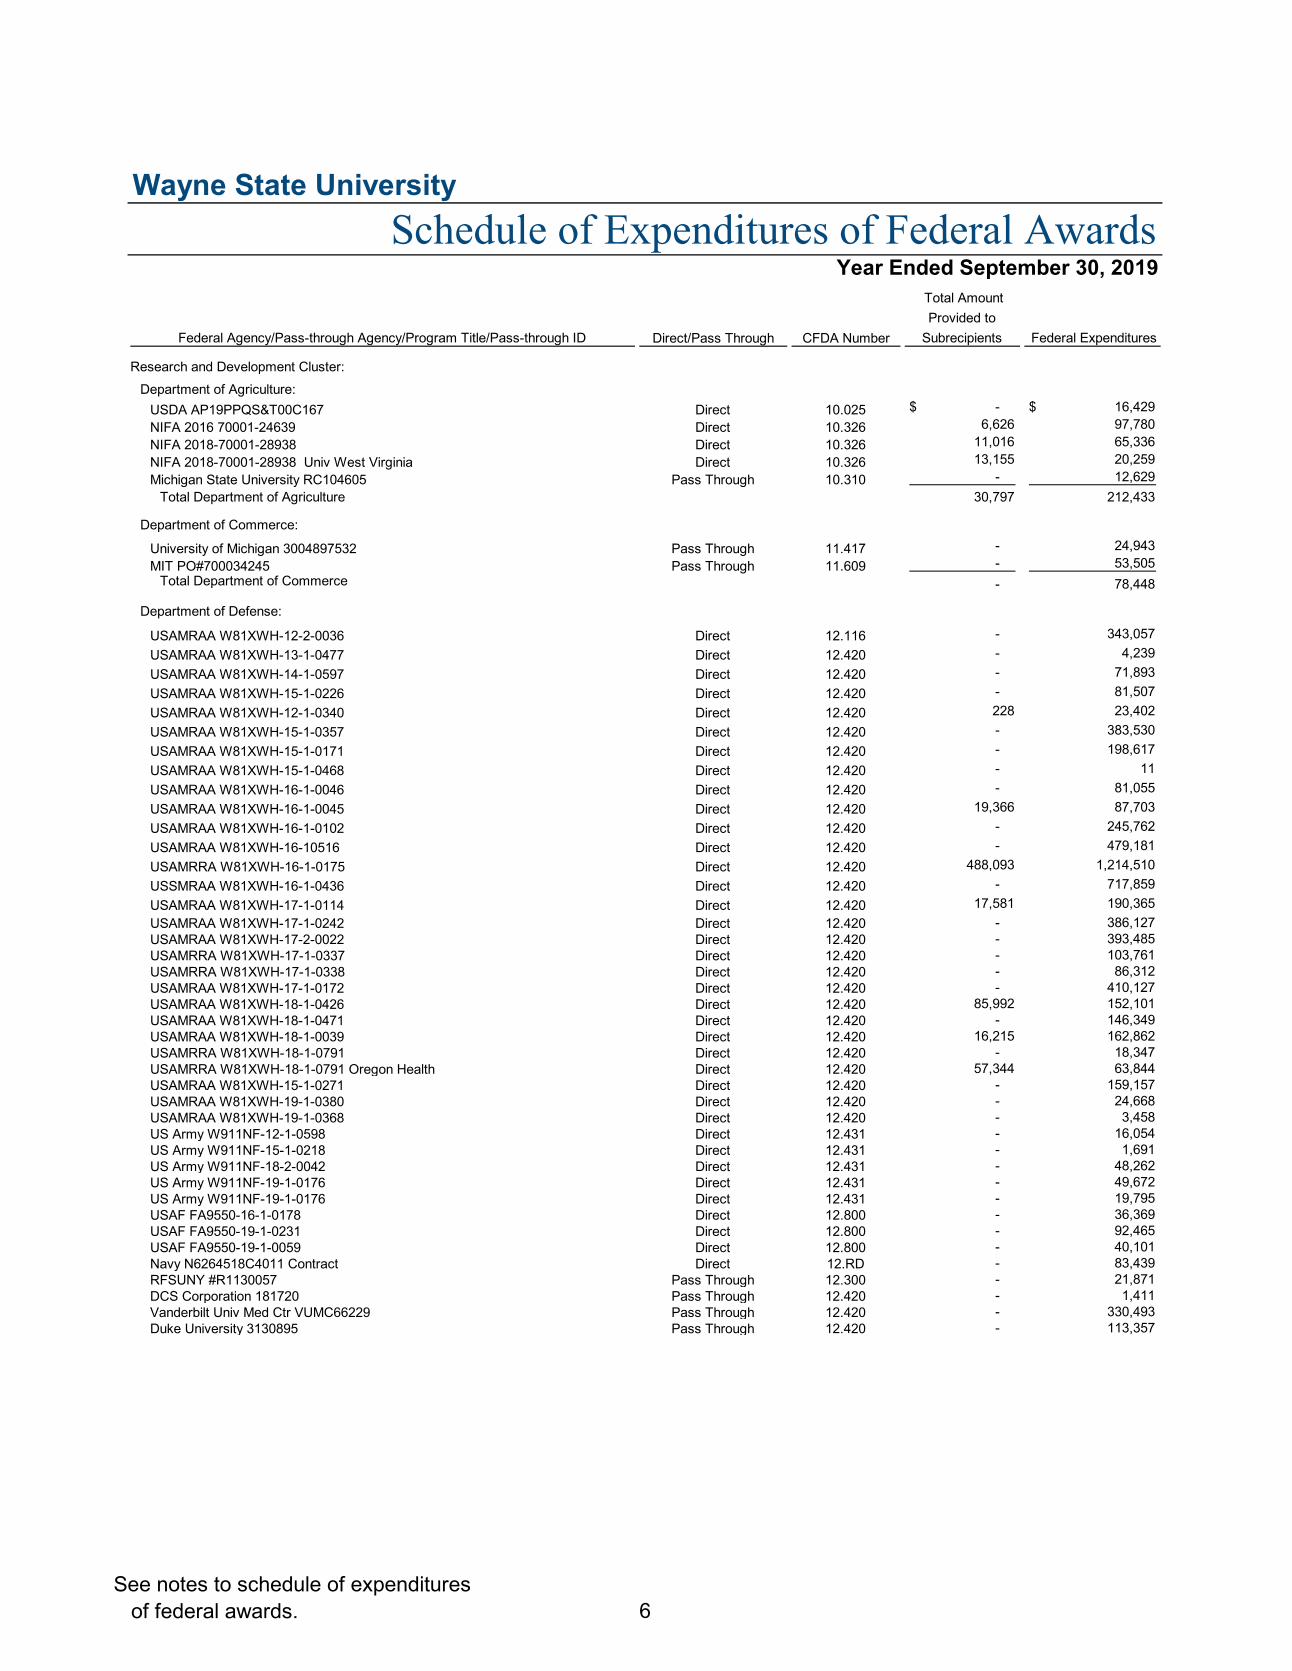
Wayne State University
Federal Agency/Pass-through Agency/Program Title/Pass-through ID Direct/Pass Through CFDA Number
Total Amount Provided to
Subrecipients Federal Expenditures
Research and Development Cluster:Department of Agriculture:
USDA AP19PPQS&T00C167 Direct 10.025 -$ 16,429$ NIFA 2016 70001-24639 Direct 10.326 6,626 97,780 NIFA 2018-70001-28938 Direct 10.326 11,016 65,336 NIFA 2018-70001-28938 Univ West Virginia Direct 10.326 13,155 20,259 Michigan State University RC104605 Pass Through 10.310 - 12,629
Total Department of Agriculture 30,797 212,433
Department of Commerce:
University of Michigan 3004897532 Pass Through 11.417 - 24,943 MIT PO#700034245 Pass Through 11.609 - 53,505
Total Department of Commerce - 78,448
Department of Defense:
USAMRAA W81XWH-12-2-0036 Direct 12.116 - 343,057 USAMRAA W81XWH-13-1-0477 Direct 12.420 - 4,239 USAMRAA W81XWH-14-1-0597 Direct 12.420 - 71,893 USAMRAA W81XWH-15-1-0226 Direct 12.420 - 81,507 USAMRAA W81XWH-12-1-0340 Direct 12.420 228 23,402 USAMRAA W81XWH-15-1-0357 Direct 12.420 - 383,530 USAMRAA W81XWH-15-1-0171 Direct 12.420 - 198,617 USAMRAA W81XWH-15-1-0468 Direct 12.420 - 11 USAMRAA W81XWH-16-1-0046 Direct 12.420 - 81,055 USAMRAA W81XWH-16-1-0045 Direct 12.420 19,366 87,703 USAMRAA W81XWH-16-1-0102 Direct 12.420 - 245,762 USAMRAA W81XWH-16-10516 Direct 12.420 - 479,181 USAMRRA W81XWH-16-1-0175 Direct 12.420 488,093 1,214,510 USSMRAA W81XWH-16-1-0436 Direct 12.420 - 717,859 USAMRAA W81XWH-17-1-0114 Direct 12.420 17,581 190,365 USAMRAA W81XWH-17-1-0242 Direct 12.420 - 386,127 USAMRAA W81XWH-17-2-0022 Direct 12.420 - 393,485 USAMRRA W81XWH-17-1-0337 Direct 12.420 - 103,761 USAMRRA W81XWH-17-1-0338 Direct 12.420 - 86,312 USAMRAA W81XWH-17-1-0172 Direct 12.420 - 410,127 USAMRAA W81XWH-18-1-0426 Direct 12.420 85,992 152,101 USAMRAA W81XWH-18-1-0471 Direct 12.420 - 146,349 USAMRAA W81XWH-18-1-0039 Direct 12.420 16,215 162,862 USAMRRA W81XWH-18-1-0791 Direct 12.420 - 18,347 USAMRRA W81XWH-18-1-0791 Oregon Health Direct 12.420 57,344 63,844 USAMRAA W81XWH-15-1-0271 Direct 12.420 - 159,157 USAMRAA W81XWH-19-1-0380 Direct 12.420 - 24,668 USAMRAA W81XWH-19-1-0368 Direct 12.420 - 3,458 US Army W911NF-12-1-0598 Direct 12.431 - 16,054 US Army W911NF-15-1-0218 Direct 12.431 - 1,691 US Army W911NF-18-2-0042 Direct 12.431 - 48,262 US Army W911NF-19-1-0176 Direct 12.431 - 49,672 US Army W911NF-19-1-0176 Direct 12.431 - 19,795 USAF FA9550-16-1-0178 Direct 12.800 - 36,369 USAF FA9550-19-1-0231 Direct 12.800 - 92,465 USAF FA9550-19-1-0059 Direct 12.800 - 40,101 Navy N6264518C4011 Contract Direct 12.RD - 83,439 RFSUNY #R1130057 Pass Through 12.300 - 21,871 DCS Corporation 181720 Pass Through 12.420 - 1,411 Vanderbilt Univ Med Ctr VUMC66229 Pass Through 12.420 - 330,493 Duke University 3130895 Pass Through 12.420 - 113,357
Schedule of Expenditures of Federal AwardsYear Ended September 30, 2019
See notes to schedule of expenditures of federal awards. 6
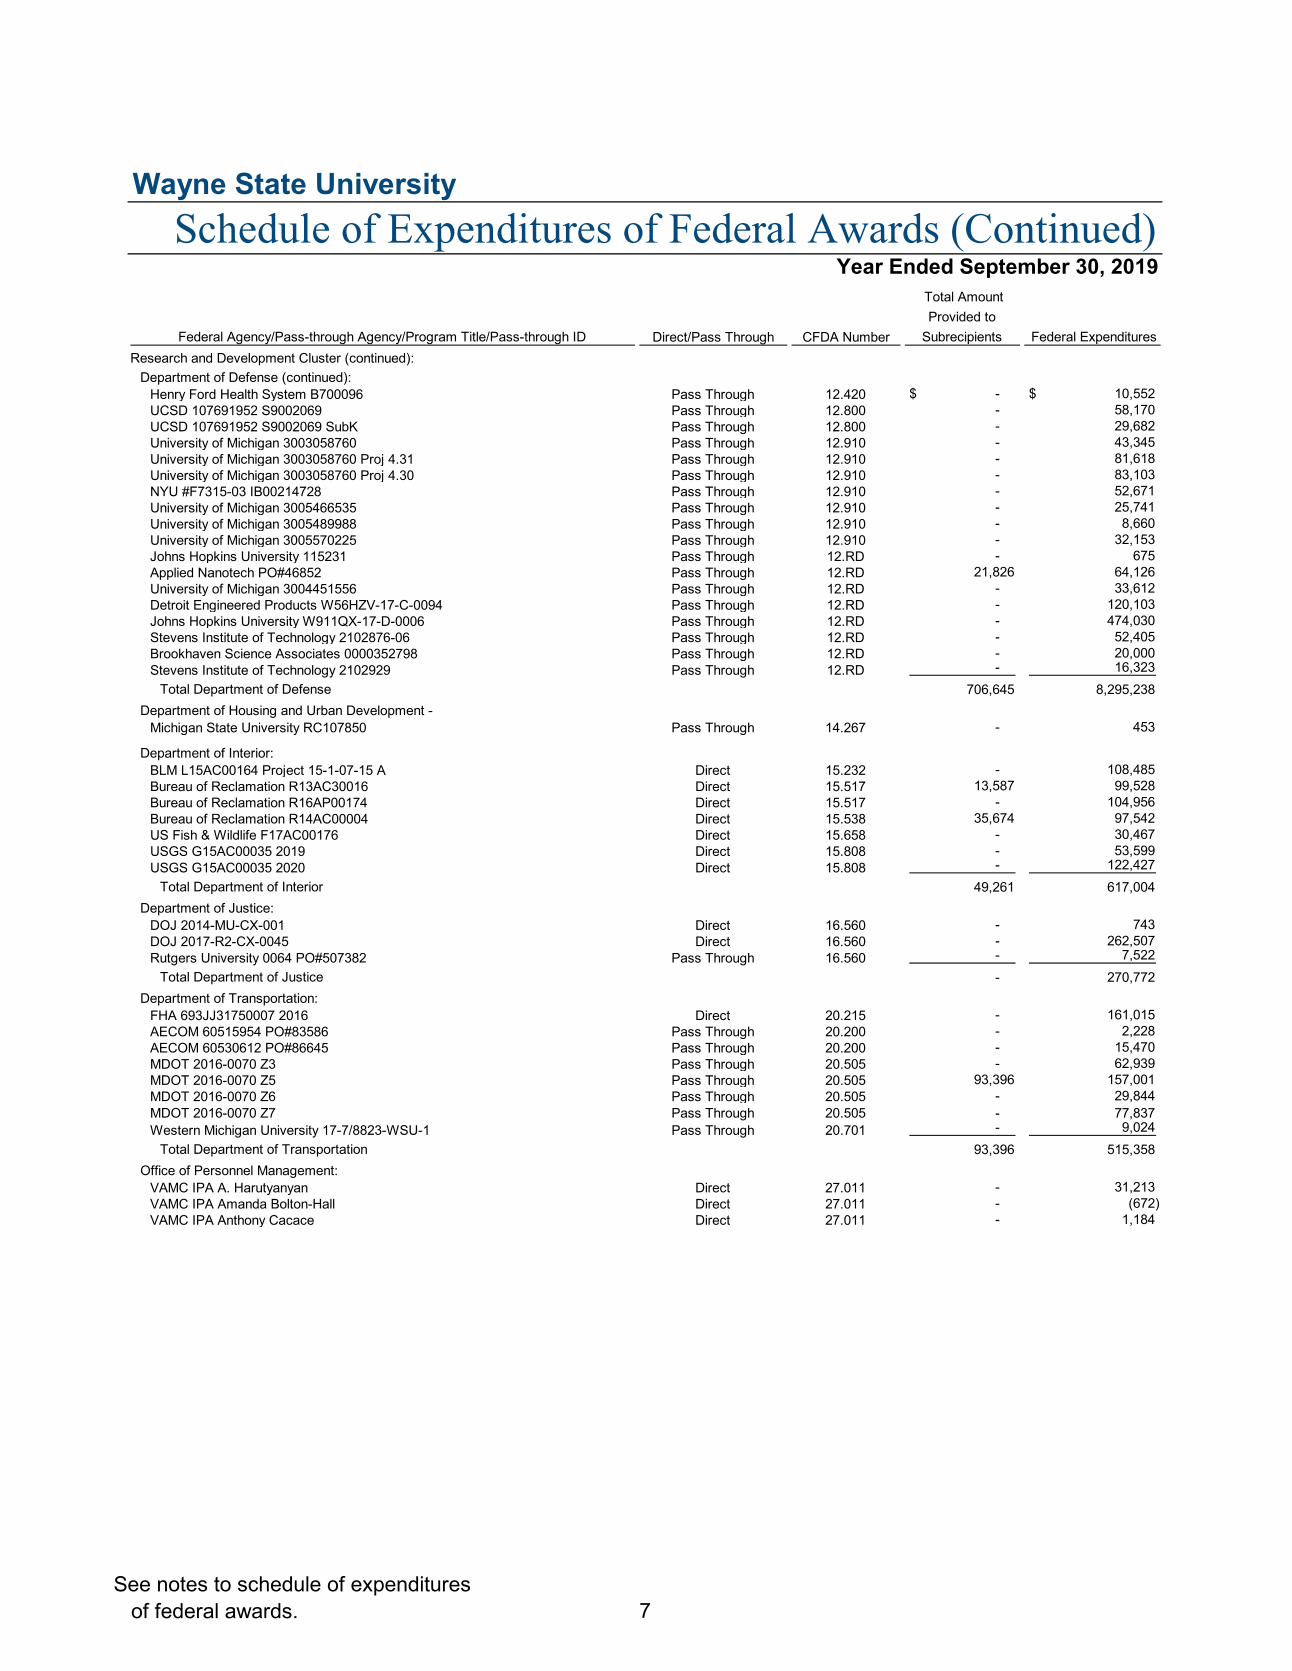
Wayne State University
Federal Agency/Pass-through Agency/Program Title/Pass-through ID Direct/Pass Through CFDA Number
Total Amount Provided to
Subrecipients Federal Expenditures Research and Development Cluster (continued):
Department of Defense (continued):Henry Ford Health System B700096 Pass Through 12.420 -$ 10,552$ UCSD 107691952 S9002069 Pass Through 12.800 - 58,170 UCSD 107691952 S9002069 SubK Pass Through 12.800 - 29,682 University of Michigan 3003058760 Pass Through 12.910 - 43,345 University of Michigan 3003058760 Proj 4.31 Pass Through 12.910 - 81,618 University of Michigan 3003058760 Proj 4.30 Pass Through 12.910 - 83,103 NYU #F7315-03 IB00214728 Pass Through 12.910 - 52,671 University of Michigan 3005466535 Pass Through 12.910 - 25,741 University of Michigan 3005489988 Pass Through 12.910 - 8,660 University of Michigan 3005570225 Pass Through 12.910 - 32,153 Johns Hopkins University 115231 Pass Through 12.RD - 675 Applied Nanotech PO#46852 Pass Through 12.RD 21,826 64,126 University of Michigan 3004451556 Pass Through 12.RD - 33,612 Detroit Engineered Products W56HZV-17-C-0094 Pass Through 12.RD - 120,103 Johns Hopkins University W911QX-17-D-0006 Pass Through 12.RD - 474,030 Stevens Institute of Technology 2102876-06 Pass Through 12.RD - 52,405 Brookhaven Science Associates 0000352798 Pass Through 12.RD - 20,000 Stevens Institute of Technology 2102929 Pass Through 12.RD - 16,323
Total Department of Defense 706,645 8,295,238 Department of Housing and Urban Development -
Michigan State University RC107850 Pass Through 14.267 - 453
Department of Interior:BLM L15AC00164 Project 15-1-07-15 A Direct 15.232 - 108,485 Bureau of Reclamation R13AC30016 Direct 15.517 13,587 99,528 Bureau of Reclamation R16AP00174 Direct 15.517 - 104,956 Bureau of Reclamation R14AC00004 Direct 15.538 35,674 97,542 US Fish & Wildlife F17AC00176 Direct 15.658 - 30,467 USGS G15AC00035 2019 Direct 15.808 - 53,599 USGS G15AC00035 2020 Direct 15.808 - 122,427
Total Department of Interior 49,261 617,004 Department of Justice:
DOJ 2014-MU-CX-001 Direct 16.560 - 743 DOJ 2017-R2-CX-0045 Direct 16.560 - 262,507 Rutgers University 0064 PO#507382 Pass Through 16.560 - 7,522
Total Department of Justice - 270,772 Department of Transportation:
FHA 693JJ31750007 2016 Direct 20.215 - 161,015 AECOM 60515954 PO#83586 Pass Through 20.200 - 2,228 AECOM 60530612 PO#86645 Pass Through 20.200 - 15,470 MDOT 2016-0070 Z3 Pass Through 20.505 - 62,939 MDOT 2016-0070 Z5 Pass Through 20.505 93,396 157,001 MDOT 2016-0070 Z6 Pass Through 20.505 - 29,844 MDOT 2016-0070 Z7 Pass Through 20.505 - 77,837 Western Michigan University 17-7/8823-WSU-1 Pass Through 20.701 - 9,024
Total Department of Transportation 93,396 515,358 Office of Personnel Management:
VAMC IPA A. Harutyanyan Direct 27.011 - 31,213 VAMC IPA Amanda Bolton-Hall Direct 27.011 - (672) VAMC IPA Anthony Cacace Direct 27.011 - 1,184
Schedule of Expenditures of Federal Awards (Continued)Year Ended September 30, 2019
See notes to schedule of expenditures of federal awards. 7

Wayne State University
Federal Agency/Pass-through Agency/Program Title/Pass-through ID Direct/Pass Through CFDA Number
Total Amount Provided to
Subrecipients Federal Expenditures Research and Development Cluster (continued):
Office of Personnel Management (continued):VAMC IPA Bo Hu Direct 27.011 -$ 43,101$ VAMC IPA Brandy Schneider Direct 27.011 - 14,107 VAMC IPA Branislava Zagorac Direct 27.011 - 20,773 VAMC IPA Branislava Zagorac Direct 27.011 - 26,679 VAMC IPA Changya Peng Direct 27.011 - 49,603 VAMC IPA Chen Liang Direct 27.011 - 60,744 VAMC IPA D. Moiseev Direct 27.011 - 43,537 VAMC IPA Dina Francescutti Direct 27.011 - 76,391 VAMC IPA Dragana Komnenov Direct 27.011 - 27,663 VAMC IPA Dragana Komnenov Direct 27.011 - 55,640 VAMC IPA E. Kruppe Direct 27.011 - 309 VAMC IPA Fayi Yao Direct 27.011 - 3,239 VAMC IPA Geoffrey Ginter Direct 27.011 - 720 VAMC IPA Gino Panza Direct 27.011 - 56,495 VAMC IPA Harvinder Talwar Direct 27.011 - 13,656 VAMC IPA J. Venkatesh Direct 27.011 - 46,521 VAMC IPA James Warila Direct 27.011 - 365 VAMC IPA Janet Wolforth Direct 27.011 - 43,504 VAMC IPA Kelly Bosse Direct 27.011 - 28,815 VAMC IPA Kelsey Arvai Direct 27.011 - 53,516 VAMC IPA Krystal Bakkila Direct 27.011 - 28,273 VAMC IPA Lauren Chaby Direct 27.011 - 68,550 VAMC IPA Li Tao Direct 27.011 - 14,611 VAMC IPA Li Tian Direct 27.011 - 5,290 VAMC IPA Longfei Guan Direct 27.011 - 53,934 VAMC IPA Lulu Farhana Direct 27.011 - 8,620 VAMC IPA Mallika Somayajulu Direct 27.011 - 39,205 VAMC IPA Mansour, Wafee Direct 27.011 - 521 VAMC IPA Mariana Angoa Perez Direct 27.011 - 70,556 VAMC IPA Mehdi Eshraghi Direct 27.011 - 69,218 VAMC IPA Min Wu Direct 27.011 - 68,058 VAMC IPA Ming Shuo Chen Direct 27.011 - 30,144 VAMC IPA Nawar Aljundi Direct 27.011 - 766 VAMC IPA Pershang Farshi Direct 27.011 - 33,584 VAMC IPA Peter Levanovich Direct 27.011 - 40,268 VAMC IPA Raichel Alex Direct 27.011 - 51,054 VAMC IPA Rajib Barua Direct 27.011 - 17,552 VAMC IPA Raqhuel Williams Direct 27.011 - 18,394 VAMC IPA Rodney Braun Direct 27.011 - 17,753 VAMC IPA Ruchi Rastogi Direct 27.011 - 67,787 VAMC IPA S. Kallakuri Direct 27.011 - 32,647 VAMC IPA S. Sau Direct 27.011 - 31,140 VAMC IPA S. Kiousis Direct 27.011 - 35,264 VAMC IPA Scott Alan Mares Direct 27.011 - 66,458 VAMC IPA Scott Lloyd Direct 27.011 - 26,684 VAMC IPA Sean Carroll Direct 27.011 - 64,366 VAMC IPA Sichao Guo Direct 27.011 - 50,629 VAMC IPA Sreeja Sekhar Direct 27.011 - 20,295 VAMC IPA Suhadinie Ga Direct 27.011 - 29,754 VAMC IPA Tong Shi Direct 27.011 - 45,936 VAMC IPA Toni Azar Direct 27.011 - 14,547 VAMC IPA V. Thamilselvan Direct 27.011 - 63,095 VAMC IPA Veronica Piggott(Chiu) Direct 27.011 - 21,096 VAMC IPA Wharram Direct 27.011 - 23,428 VAMC IPA Xin Jin Direct 27.011 - (39,781)
Schedule of Expenditures of Federal Awards (Continued)Year Ended September 30, 2019
See notes to schedule of expenditures of federal awards. 8

Wayne State University
Federal Agency/Pass-through Agency/Program Title/Pass-through ID Direct/Pass Through CFDA Number
Total Amount Provided to
Subrecipients Federal Expenditures Research and Development Cluster (continued):
Office of Personnel Management (continued):VAMC IPA Yanni Zhuang Direct 27.011 -$ 30,128$
Total Office of Personnel Management - 1,916,927
National Aeronautics and Space Administration:NASA NNX17AB66G Direct 43.001 - 487 NASA 80NSSC19K0150 Direct 43.001 - 28,254 Arizona State University 17212 NNX17AF70G Pass Through 43.001 - 144,508 Space Telescope Science HST-GO-14121.001 Pass Through 43.RD - 4,281 Space Telescope Science HST-GO-15413.001 Pass Through 43.RD - 37,757
Total National Aeronautics and Space Administration - 215,287 National Endowment for the Arts and Humanities:
NEA-1856087-38-19 Direct 45.024 - 2,532 NEH RZ-51674-14 Direct 45.161 - 34,307
Total National Endowment for the Arts and Humanities - 36,839 National Science Foundation:
NSF CBET-1236764 Direct 47.041 - 2,815 NSF CBET-1350623 Direct 47.041 - 83,941 NSF CBET-1350623 Direct 47.041 - 7,937 NSF CBET-1350623 Direct 47.041 - 4,000 NSF CBET-1434696 Direct 47.041 - 3,256 NSF CBET-1436193 Direct 47.041 - 79,241 NSF CBET-1512544 Direct 47.041 - 67,609 NSF CBET-1604756 Direct 47.041 - 115,432 NSF CBET-1642400 Direct 47.041 - 12,482 NSF CBET-1642400 Direct 47.041 - (10,363) NSF CBET-1748363 Direct 47.041 - 48,763 NSF CBET-1750607 Direct 47.041 - 74,192 NSF CBET-1751472 Direct 47.041 - 57,521 NSF CBET-1839675 Direct 47.041 - 43,285 NSF CBET-1903329 Direct 47.041 - 37,599 NSF CBET-1903329 Sub Direct 47.041 - 1,200 NSF CBET-1926983 Direct 47.041 - 3,840 NSF CBET-1926983 Direct 47.041 - 4,000 NSF CMMI-1404276 Direct 47.041 - 394 NSF CMMI-1761418 Direct 47.041 - 42,045 NSF CMMI-1761418 Direct 47.041 - 6,024 NSF CMMI-1832692 Direct 47.041 - 141,500 NSF CMMI-1832692 Direct 47.041 - 40,030 NSF CMMI-1832692 Direct 47.041 - 47,783 NSF CMMI-1914436 Direct 47.041 - 2,286 NSF ECCS-1232226 Direct 47.041 - 225 NSF ECCS-1507096 Direct 47.041 - 33,346 NSF ECCS-1507096 Direct 47.041 - 36,094 NSF ECCS-1507096 Direct 47.041 - 35,009 NSF ECCS-1508910 Direct 47.041 - 5,940 NSF ECCS-1849578 Direct 47.041 - 501,200 NSF EEC-1461031 Direct 47.041 - 9,144 NSF EEC-1461031 Huang Part. Supp. Direct 47.041 - (706) NSF EEC-1461031 Huang Sub Direct 47.041 - 815 NSF EEC-1461031 Rickli Part. Supp. Direct 47.041 - (2,706) NSF IIP-1338780 Direct 47.041 - 40,855 NSF IIP-1338780 Direct 47.041 - 27 NSF IIP-1338780 Direct 47.041 - 36,316
Schedule of Expenditures of Federal Awards (Continued)Year Ended September 30, 2019
See notes to schedule of expenditures of federal awards. 9

Wayne State University
Federal Agency/Pass-through Agency/Program Title/Pass-through ID Direct/Pass Through CFDA Number
Total Amount Provided to
Subrecipients Federal Expenditures Research and Development Cluster (continued):
National Science Foundation (continued):NSF IIP-1500253 Direct 47.041 -$ 13,727$ NSF IIP-1500253 Direct 47.041 - 2,386 NSF IIP-1500253 Direct 47.041 - 15,739 NSF IIP-1500253 Direct 47.041 - 34,034 NSF IIP-1925692 Direct 47.041 - 10,871 NSF AST-1351222 Direct 47.049 - 84,494 NSF CHE-1349048 Direct 47.049 - 94,928 NSF CHE-1361741 Direct 47.049 - 153 NSF CHE-1404285 Direct 47.049 - 153,108 NSF CHE-1464450 Direct 47.049 - 33,753 NSF CHE-1500201 Direct 47.049 - 99,191 NSF CHE-1554752 Direct 47.049 - 270,902 NSF CHE-1564755 Direct 47.049 - 98,547 NSF CHE-1607973 Direct 47.049 - 74,169 NSF CHE-1665331 Direct 47.049 - 172,010 NSF CHE-1709776 Direct 47.049 - 173,562 NSF CHE-1709789 Direct 47.049 - 162,702 NSF CHE-1836308 Direct 47.049 - 87,518 NSF CHE-1855681 Direct 47.049 - 11,411 NSF CHE-1856437 Direct 47.049 - 28,901 NSF CHE-1904584 Direct 47.049 - 6,285 NSF CHE-1904775 Direct 47.049 - 19,988 NSF CHE-1904780 Direct 47.049 - 6,284 NSF DMR-1410302 Direct 47.049 - 7,329 NSF DMR-1410853 Direct 47.049 - 1,061 NSF DMR-1606917 Direct 47.049 - 43,564 NSF DMR-1609625 Direct 47.049 - 64,574 NSF DMR-1609625 Direct 47.049 - 1,950 NSF DMR-1652316 Direct 47.049 - 106,215 NSF DMR-1743041 Direct 47.049 - 56,512 NSF DMR-1809229 Direct 47.049 - 42,605 NSF DMR-1809229 Direct 47.049 - 2,448 NSF DMS-1207667 Direct 47.049 - (6,743) NSF DMS-1207667 Direct 47.049 - 6,088 NSF DMS-1512846 Direct 47.049 - 61,759 NSF DMS-1606290 Direct 47.049 - 51,726 NSF DMS-1710827 Direct 47.049 - 129,450 NSF DMS-1808978 Direct 47.049 - 44,885 NSF DMS-1819041 Direct 47.049 - 11,621 NSF PHY-1460853 Direct 47.049 - (357) NSF PHY-1460853 Participant support Direct 47.049 - 2,300 NSF EAR-1454829 Direct 47.050 - 54,861 NSF EAR-1755722 Direct 47.050 - 4,287 NSF OCE-1923014 Direct 47.050 - 29,177 NSF PLR-1434578 Direct 47.050 - 27,925 NSF PLR-1434578 Direct 47.050 - 8,803 NSF ACI-1550300 Direct 47.070 - 321,087 NSF ACI-1550300 Direct 47.070 - 12,277 NSF ACI-1550300 Additional funding Direct 47.070 2,890 3,642 NSF ACI-1642406 Direct 47.070 - 189,788 NSF ACI-1657364 Direct 47.070 - 59,614 NSF CCF-1561216 Direct 47.070 - 62,318 NSF CCF-1563728 Direct 47.070 - 49,046 NSF CFF-1850475 Direct 47.070 - 25,819
Schedule of Expenditures of Federal Awards (Continued)Year Ended September 30, 2019
See notes to schedule of expenditures of federal awards. 10
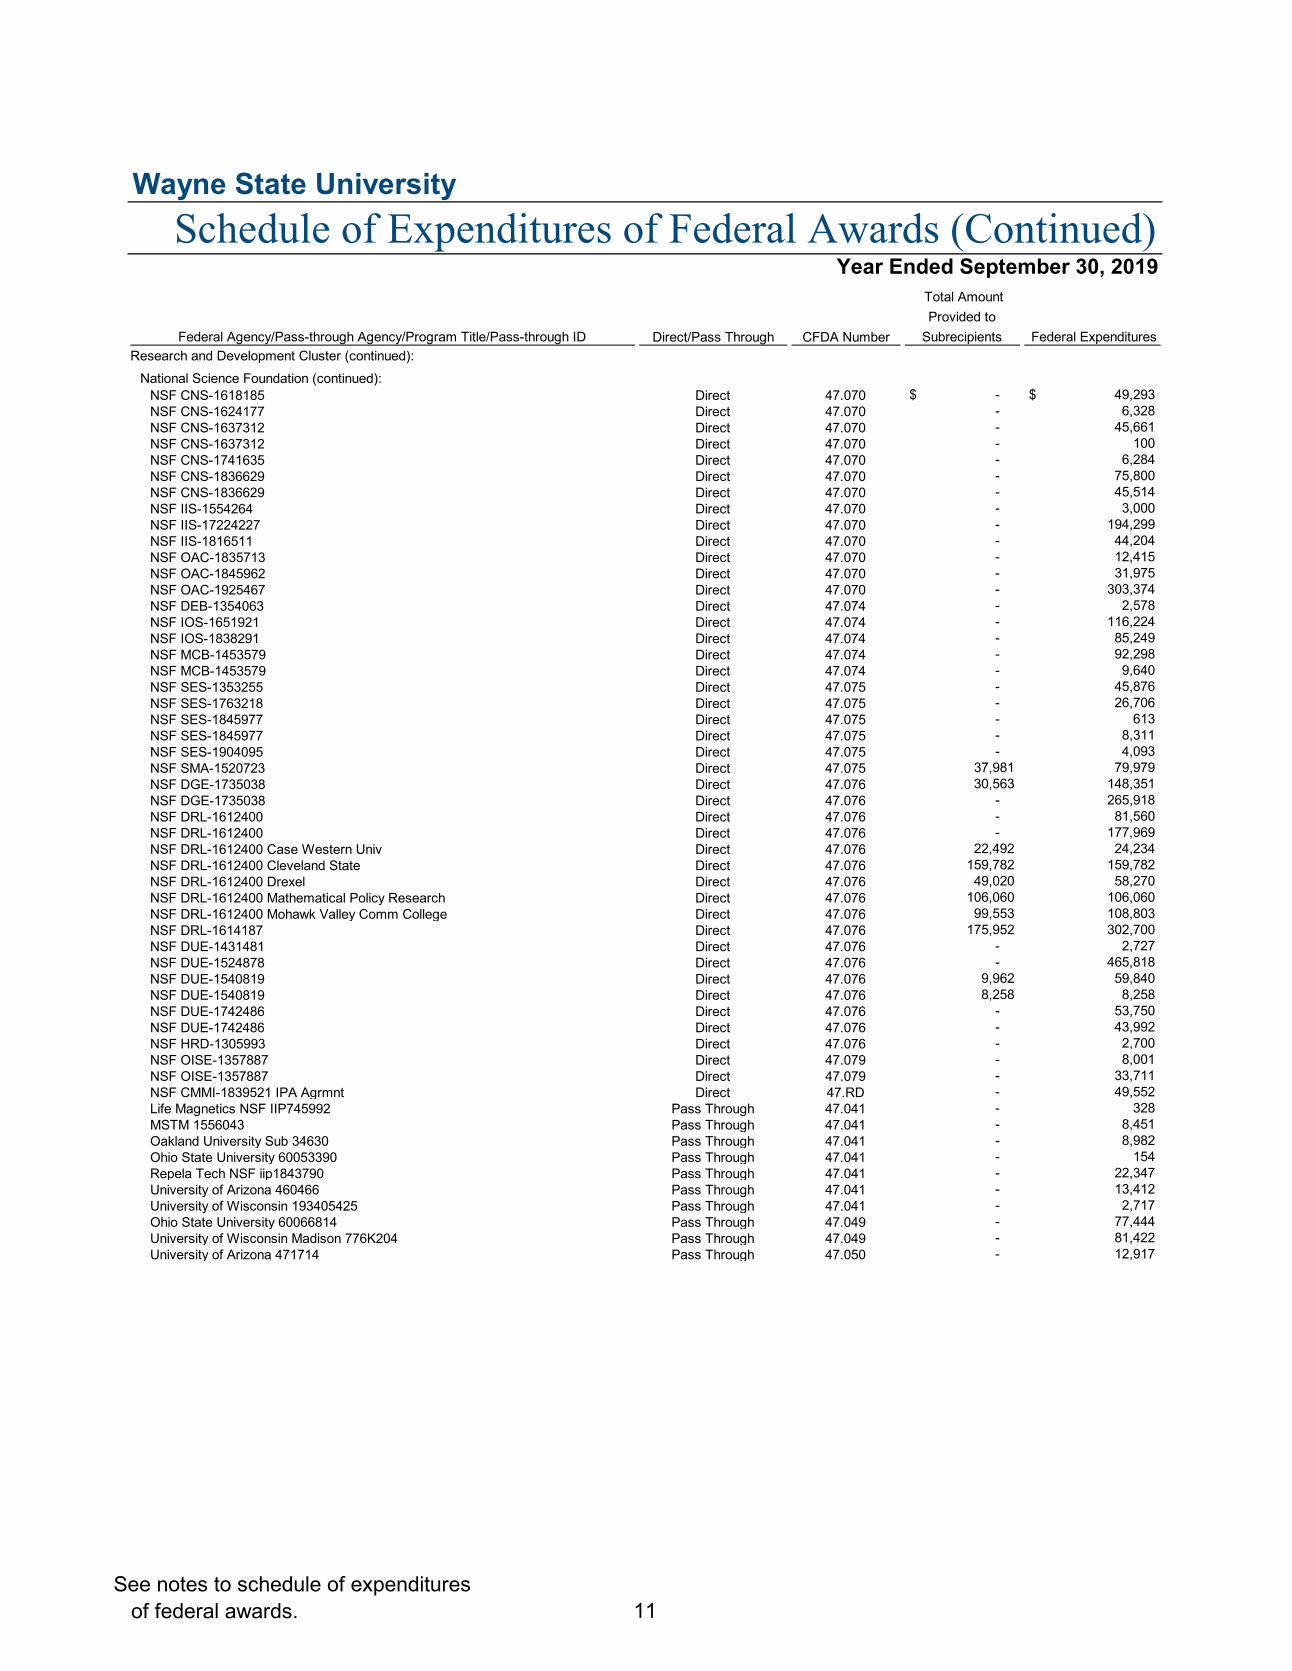
Wayne State University
Federal Agency/Pass-through Agency/Program Title/Pass-through ID Direct/Pass Through CFDA Number
Total Amount Provided to
Subrecipients Federal Expenditures Research and Development Cluster (continued):
National Science Foundation (continued):NSF CNS-1618185 Direct 47.070 -$ 49,293$ NSF CNS-1624177 Direct 47.070 - 6,328 NSF CNS-1637312 Direct 47.070 - 45,661 NSF CNS-1637312 Direct 47.070 - 100 NSF CNS-1741635 Direct 47.070 - 6,284 NSF CNS-1836629 Direct 47.070 - 75,800 NSF CNS-1836629 Direct 47.070 - 45,514 NSF IIS-1554264 Direct 47.070 - 3,000 NSF IIS-17224227 Direct 47.070 - 194,299 NSF IIS-1816511 Direct 47.070 - 44,204 NSF OAC-1835713 Direct 47.070 - 12,415 NSF OAC-1845962 Direct 47.070 - 31,975 NSF OAC-1925467 Direct 47.070 - 303,374 NSF DEB-1354063 Direct 47.074 - 2,578 NSF IOS-1651921 Direct 47.074 - 116,224 NSF IOS-1838291 Direct 47.074 - 85,249 NSF MCB-1453579 Direct 47.074 - 92,298 NSF MCB-1453579 Direct 47.074 - 9,640 NSF SES-1353255 Direct 47.075 - 45,876 NSF SES-1763218 Direct 47.075 - 26,706 NSF SES-1845977 Direct 47.075 - 613 NSF SES-1845977 Direct 47.075 - 8,311 NSF SES-1904095 Direct 47.075 - 4,093 NSF SMA-1520723 Direct 47.075 37,981 79,979 NSF DGE-1735038 Direct 47.076 30,563 148,351 NSF DGE-1735038 Direct 47.076 - 265,918 NSF DRL-1612400 Direct 47.076 - 81,560 NSF DRL-1612400 Direct 47.076 - 177,969 NSF DRL-1612400 Case Western Univ Direct 47.076 22,492 24,234 NSF DRL-1612400 Cleveland State Direct 47.076 159,782 159,782 NSF DRL-1612400 Drexel Direct 47.076 49,020 58,270 NSF DRL-1612400 Mathematical Policy Research Direct 47.076 106,060 106,060 NSF DRL-1612400 Mohawk Valley Comm College Direct 47.076 99,553 108,803 NSF DRL-1614187 Direct 47.076 175,952 302,700 NSF DUE-1431481 Direct 47.076 - 2,727 NSF DUE-1524878 Direct 47.076 - 465,818 NSF DUE-1540819 Direct 47.076 9,962 59,840 NSF DUE-1540819 Direct 47.076 8,258 8,258 NSF DUE-1742486 Direct 47.076 - 53,750 NSF DUE-1742486 Direct 47.076 - 43,992 NSF HRD-1305993 Direct 47.076 - 2,700 NSF OISE-1357887 Direct 47.079 - 8,001 NSF OISE-1357887 Direct 47.079 - 33,711 NSF CMMI-1839521 IPA Agrmnt Direct 47.RD - 49,552 Life Magnetics NSF IIP745992 Pass Through 47.041 - 328 MSTM 1556043 Pass Through 47.041 - 8,451 Oakland University Sub 34630 Pass Through 47.041 - 8,982 Ohio State University 60053390 Pass Through 47.041 - 154 Repela Tech NSF iip1843790 Pass Through 47.041 - 22,347 University of Arizona 460466 Pass Through 47.041 - 13,412 University of Wisconsin 193405425 Pass Through 47.041 - 2,717 Ohio State University 60066814 Pass Through 47.049 - 77,444 University of Wisconsin Madison 776K204 Pass Through 47.049 - 81,422 University of Arizona 471714 Pass Through 47.050 - 12,917
Schedule of Expenditures of Federal Awards (Continued)Year Ended September 30, 2019
See notes to schedule of expenditures of federal awards. 11
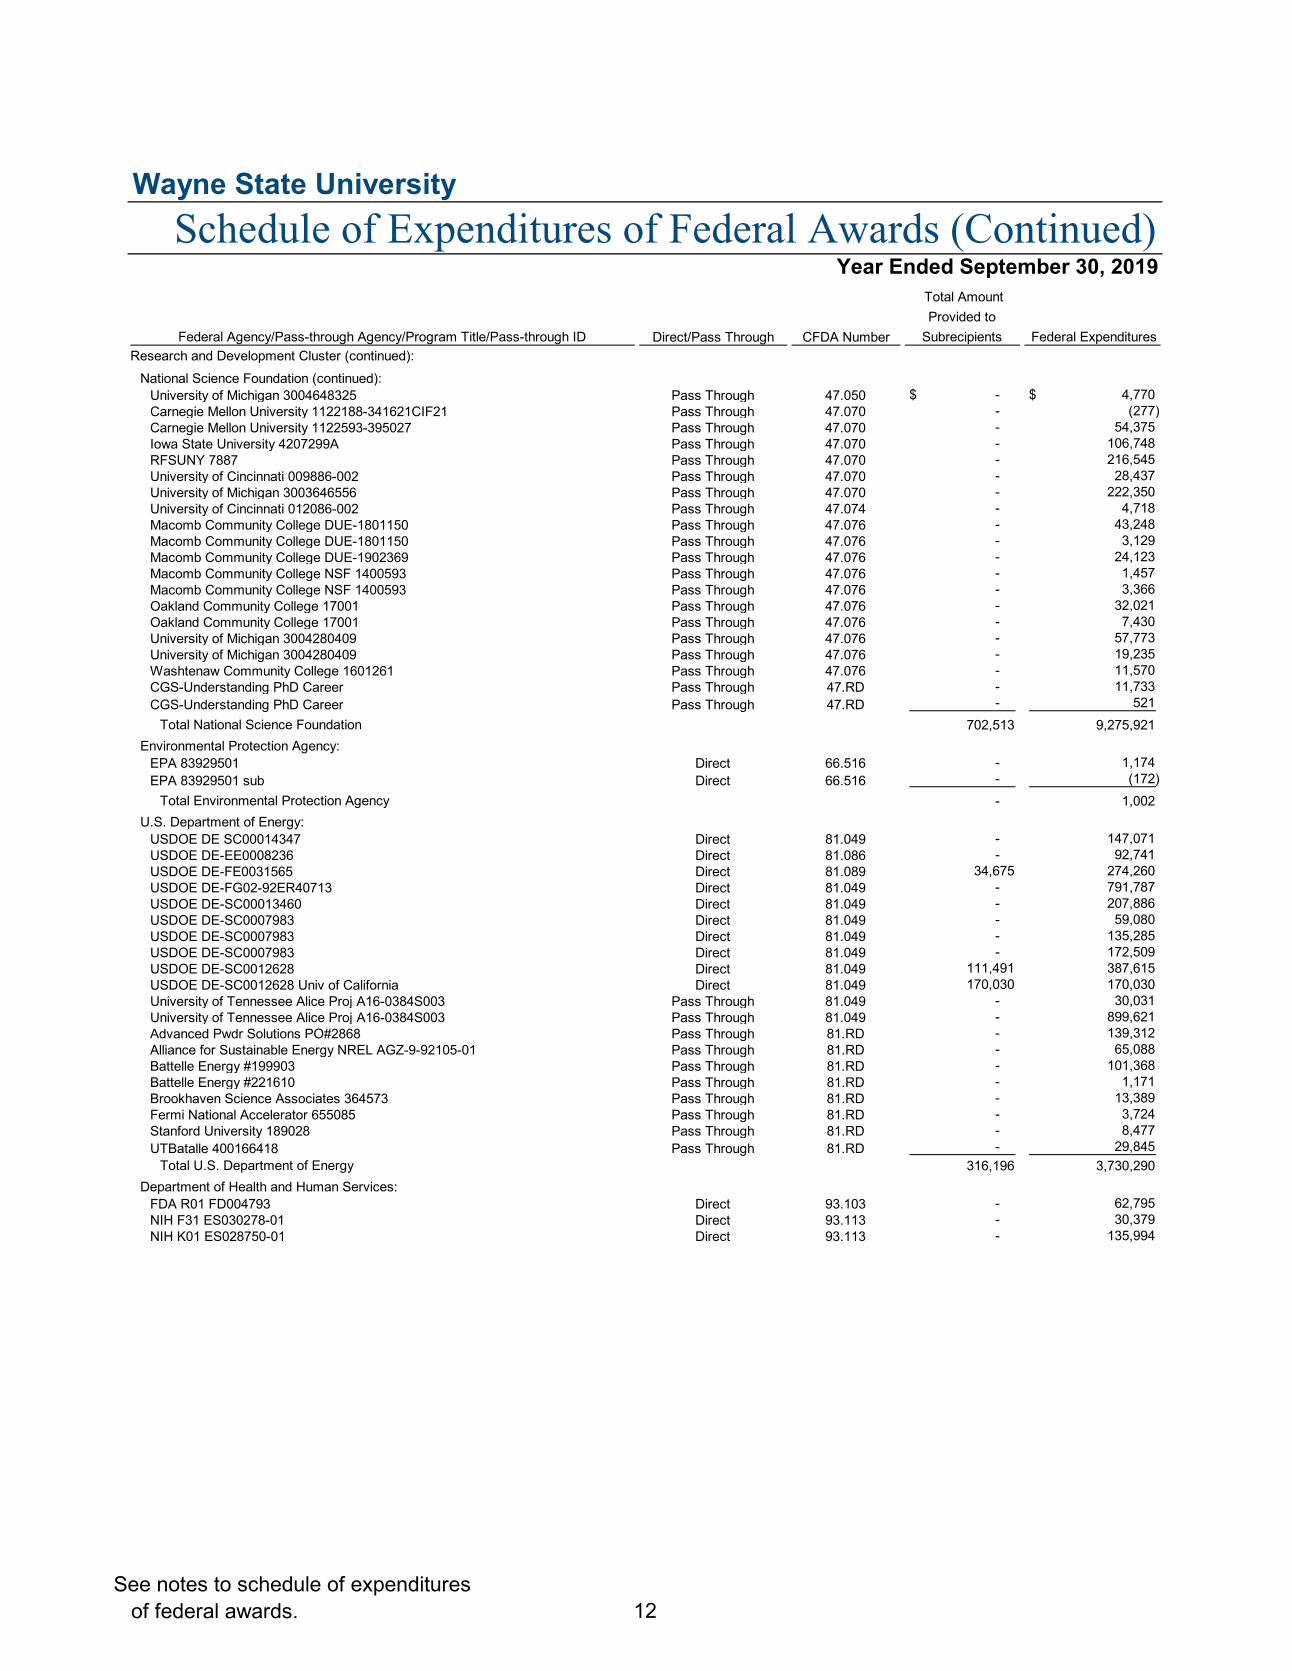
Wayne State University
Federal Agency/Pass-through Agency/Program Title/Pass-through ID Direct/Pass Through CFDA Number
Total Amount Provided to
Subrecipients Federal Expenditures Research and Development Cluster (continued):
National Science Foundation (continued):University of Michigan 3004648325 Pass Through 47.050 -$ 4,770$ Carnegie Mellon University 1122188-341621CIF21 Pass Through 47.070 - (277) Carnegie Mellon University 1122593-395027 Pass Through 47.070 - 54,375 Iowa State University 4207299A Pass Through 47.070 - 106,748 RFSUNY 7887 Pass Through 47.070 - 216,545 University of Cincinnati 009886-002 Pass Through 47.070 - 28,437 University of Michigan 3003646556 Pass Through 47.070 - 222,350 University of Cincinnati 012086-002 Pass Through 47.074 - 4,718 Macomb Community College DUE-1801150 Pass Through 47.076 - 43,248 Macomb Community College DUE-1801150 Pass Through 47.076 - 3,129 Macomb Community College DUE-1902369 Pass Through 47.076 - 24,123 Macomb Community College NSF 1400593 Pass Through 47.076 - 1,457 Macomb Community College NSF 1400593 Pass Through 47.076 - 3,366 Oakland Community College 17001 Pass Through 47.076 - 32,021 Oakland Community College 17001 Pass Through 47.076 - 7,430 University of Michigan 3004280409 Pass Through 47.076 - 57,773 University of Michigan 3004280409 Pass Through 47.076 - 19,235 Washtenaw Community College 1601261 Pass Through 47.076 - 11,570 CGS-Understanding PhD Career Pass Through 47.RD - 11,733 CGS-Understanding PhD Career Pass Through 47.RD - 521
Total National Science Foundation 702,513 9,275,921 Environmental Protection Agency:
EPA 83929501 Direct 66.516 - 1,174 EPA 83929501 sub Direct 66.516 - (172)
Total Environmental Protection Agency - 1,002 U.S. Department of Energy:
USDOE DE SC00014347 Direct 81.049 - 147,071 USDOE DE-EE0008236 Direct 81.086 - 92,741 USDOE DE-FE0031565 Direct 81.089 34,675 274,260 USDOE DE-FG02-92ER40713 Direct 81.049 - 791,787 USDOE DE-SC00013460 Direct 81.049 - 207,886 USDOE DE-SC0007983 Direct 81.049 - 59,080 USDOE DE-SC0007983 Direct 81.049 - 135,285 USDOE DE-SC0007983 Direct 81.049 - 172,509 USDOE DE-SC0012628 Direct 81.049 111,491 387,615 USDOE DE-SC0012628 Univ of California Direct 81.049 170,030 170,030 University of Tennessee Alice Proj A16-0384S003 Pass Through 81.049 - 30,031 University of Tennessee Alice Proj A16-0384S003 Pass Through 81.049 - 899,621 Advanced Pwdr Solutions PO#2868 Pass Through 81.RD - 139,312 Alliance for Sustainable Energy NREL AGZ-9-92105-01 Pass Through 81.RD - 65,088 Battelle Energy #199903 Pass Through 81.RD - 101,368 Battelle Energy #221610 Pass Through 81.RD - 1,171 Brookhaven Science Associates 364573 Pass Through 81.RD - 13,389 Fermi National Accelerator 655085 Pass Through 81.RD - 3,724 Stanford University 189028 Pass Through 81.RD - 8,477 UTBatalle 400166418 Pass Through 81.RD - 29,845
Total U.S. Department of Energy 316,196 3,730,290 Department of Health and Human Services:
FDA R01 FD004793 Direct 93.103 - 62,795 NIH F31 ES030278-01 Direct 93.113 - 30,379 NIH K01 ES028750-01 Direct 93.113 - 135,994
Schedule of Expenditures of Federal Awards (Continued)Year Ended September 30, 2019
See notes to schedule of expenditures of federal awards. 12

Wayne State University
Federal Agency/Pass-through Agency/Program Title/Pass-through ID Direct/Pass Through CFDA Number
Total Amount Provided to
Subrecipients Federal Expenditures Research and Development Cluster (continued):
Department of Health and Human Services (continued):NIH P30 ES020957-04 Direct 93.113 -$ (2,921)$ NIH P30 ES020957-04 CAREER Direct 93.113 - 878 NIH P30 ES020957-04 COEC Direct 93.113 - (332) NIH P30 ES020957-04 ESFC Direct 93.113 - (1,721) NIH P30 ES020957-04 IHSFC Direct 93.113 - 1,678 NIH P30 ES020957-04 PILOT Direct 93.113 - 17,798 NIH P30 ES020957-04 PILOT Direct 93.113 - (6,896) NIH P30 ES020957-04 PILOT Direct 93.113 - (3,202) NIH P30 ES020957-04 Supplement Direct 93.113 - (373) NIH P30 ES020957-05 Direct 93.113 32,101 171,194 NIH P30 ES020957-05 COEC Direct 93.113 - 142,618 NIH P30 ES020957-05 Henry Ford Health System Direct 93.113 29,959 29,959 NIH P30 ES020957-05 IHSFC Direct 93.113 - 81,577 NIH P30 ES020957-05 PILOT Direct 93.113 - 139,832 NIH P30 ES020957-05 PILOT Direct 93.113 - 24,268 NIH P30 ES020957-05 PILOT Direct 93.113 - (10,040) NIH P30 ES020957-05 PILOT Direct 93.113 - 1,906 NIH P30 ES020957-05 PILOT Direct 93.113 - (131) NIH P30 ES020957-05 PILOT Direct 93.113 - 16,405 NIH P30 ES020957-05 PILOT Direct 93.113 - 30,000 NIH P30 ES020957-05 PILOT Direct 93.113 - 28,430 NIH P30 ES020957-05 PILOT Direct 93.113 - 10,000 NIH P30 ES020957-05 Univ of Detroit Mercy Direct 93.113 23,163 35,671 NIH P30 ES020957-06 Direct 93.113 9,332 144,157 NIH P30 ES020957-06 COEC Direct 93.113 - 99,903 NIH P30 ES020957-06 IHSFC Direct 93.113 - 54,509 NIH P30 ES020957-06 PILOT Direct 93.113 - 12,267 NIH P30 ES020957-06 PILOT Direct 93.113 - 1,831 NIH P30 ES020957-06 PILOT Direct 93.113 - 980 NIH P30 ES020957-06 PILOT Direct 93.113 - 12,358 NIH P30 ES020957-06 PILOT Direct 93.113 - 549 NIH P30 ES020957-06 Univ of Detroit Mercy Direct 93.113 3,776 3,776 NIH P30 ES02957-05 ESFC Direct 93.113 - 157,808 NIH P30 ES02957-06 ESFC Direct 93.113 - 79,497 NIH R00 ES028734-02 Direct 93.113 - 2,318 NIH R01 ES020137-05 Direct 93.113 - 26,933 NIH R01 ES022606-05 Univ of Pittsburgh Direct 93.113 6,374 6,374 NIH R01 ES022606A-05 Direct 93.113 8,166 118,830 NIH R01 ES028335-01 Direct 93.113 - 131,016 NIH R01 ES029484-02 Direct 93.113 - 463,566 NIH R01 ES28263-03 Direct 93.113 - 612,008 NIH R56 ES027500-01 Direct 93.113 - 48,508 CDC U01 CE002843 002843CE16 2018 Direct 93.136 4,242 10,430 CDC U01 CE002843 002843CE16 2019 Direct 93.136 22,382 434,349 NIH R01 DC013275-03 Direct 93.173 - 317,459 NIH R03 DC015329-03 Direct 93.173 9,404 84,505 NIH R01 AT007566-05 Direct 93.213 107,979 172,493 AHRQ R01 HS022955 Direct 93.226 - 107,364 AHRQ P30 HS021641-05 (UNMex) Direct 93.226 - 9,705 AHRQ R21 HS024750-01 Direct 93.226 - 16,495 AHRQ R21 HS024750-01 SubK Direct 93.226 - 3,042 NIH R21 HL140447-01 Direct 93.233 33,110 114,582 NIH R56 HL142757-01 Direct 93.233 - 153,331 NIH R01 HL142757-01 Direct 93.233 - 34,265
Schedule of Expenditures of Federal Awards (Continued)Year Ended September 30, 2019
See notes to schedule of expenditures of federal awards. 13
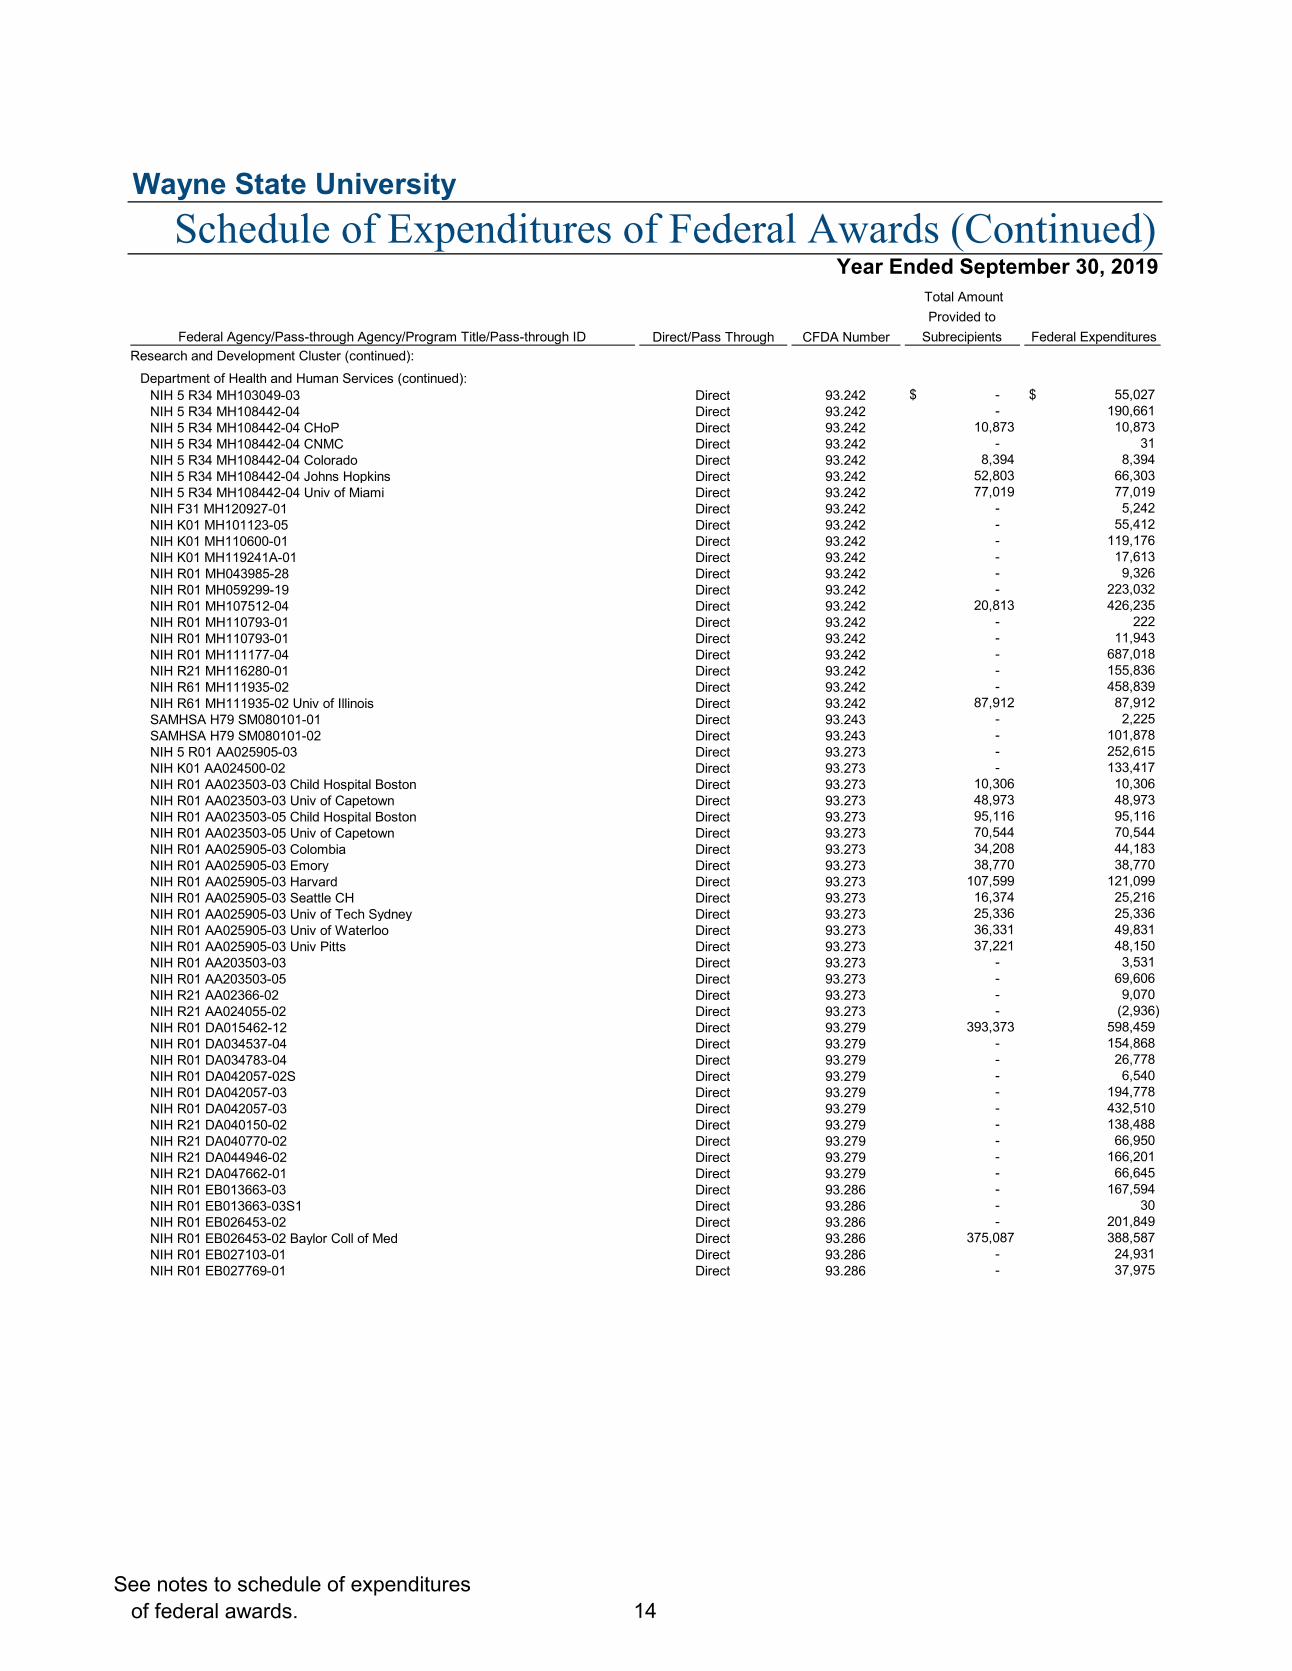
Wayne State University
Federal Agency/Pass-through Agency/Program Title/Pass-through ID Direct/Pass Through CFDA Number
Total Amount Provided to
Subrecipients Federal Expenditures Research and Development Cluster (continued):
Department of Health and Human Services (continued):NIH 5 R34 MH103049-03 Direct 93.242 -$ 55,027$ NIH 5 R34 MH108442-04 Direct 93.242 - 190,661 NIH 5 R34 MH108442-04 CHoP Direct 93.242 10,873 10,873 NIH 5 R34 MH108442-04 CNMC Direct 93.242 - 31 NIH 5 R34 MH108442-04 Colorado Direct 93.242 8,394 8,394 NIH 5 R34 MH108442-04 Johns Hopkins Direct 93.242 52,803 66,303 NIH 5 R34 MH108442-04 Univ of Miami Direct 93.242 77,019 77,019 NIH F31 MH120927-01 Direct 93.242 - 5,242 NIH K01 MH101123-05 Direct 93.242 - 55,412 NIH K01 MH110600-01 Direct 93.242 - 119,176 NIH K01 MH119241A-01 Direct 93.242 - 17,613 NIH R01 MH043985-28 Direct 93.242 - 9,326 NIH R01 MH059299-19 Direct 93.242 - 223,032 NIH R01 MH107512-04 Direct 93.242 20,813 426,235 NIH R01 MH110793-01 Direct 93.242 - 222 NIH R01 MH110793-01 Direct 93.242 - 11,943 NIH R01 MH111177-04 Direct 93.242 - 687,018 NIH R21 MH116280-01 Direct 93.242 - 155,836 NIH R61 MH111935-02 Direct 93.242 - 458,839 NIH R61 MH111935-02 Univ of Illinois Direct 93.242 87,912 87,912 SAMHSA H79 SM080101-01 Direct 93.243 - 2,225 SAMHSA H79 SM080101-02 Direct 93.243 - 101,878 NIH 5 R01 AA025905-03 Direct 93.273 - 252,615 NIH K01 AA024500-02 Direct 93.273 - 133,417 NIH R01 AA023503-03 Child Hospital Boston Direct 93.273 10,306 10,306 NIH R01 AA023503-03 Univ of Capetown Direct 93.273 48,973 48,973 NIH R01 AA023503-05 Child Hospital Boston Direct 93.273 95,116 95,116 NIH R01 AA023503-05 Univ of Capetown Direct 93.273 70,544 70,544 NIH R01 AA025905-03 Colombia Direct 93.273 34,208 44,183 NIH R01 AA025905-03 Emory Direct 93.273 38,770 38,770 NIH R01 AA025905-03 Harvard Direct 93.273 107,599 121,099 NIH R01 AA025905-03 Seattle CH Direct 93.273 16,374 25,216 NIH R01 AA025905-03 Univ of Tech Sydney Direct 93.273 25,336 25,336 NIH R01 AA025905-03 Univ of Waterloo Direct 93.273 36,331 49,831 NIH R01 AA025905-03 Univ Pitts Direct 93.273 37,221 48,150 NIH R01 AA203503-03 Direct 93.273 - 3,531 NIH R01 AA203503-05 Direct 93.273 - 69,606 NIH R21 AA02366-02 Direct 93.273 - 9,070 NIH R21 AA024055-02 Direct 93.273 - (2,936) NIH R01 DA015462-12 Direct 93.279 393,373 598,459 NIH R01 DA034537-04 Direct 93.279 - 154,868 NIH R01 DA034783-04 Direct 93.279 - 26,778 NIH R01 DA042057-02S Direct 93.279 - 6,540 NIH R01 DA042057-03 Direct 93.279 - 194,778 NIH R01 DA042057-03 Direct 93.279 - 432,510 NIH R21 DA040150-02 Direct 93.279 - 138,488 NIH R21 DA040770-02 Direct 93.279 - 66,950 NIH R21 DA044946-02 Direct 93.279 - 166,201 NIH R21 DA047662-01 Direct 93.279 - 66,645 NIH R01 EB013663-03 Direct 93.286 - 167,594 NIH R01 EB013663-03S1 Direct 93.286 - 30 NIH R01 EB026453-02 Direct 93.286 - 201,849 NIH R01 EB026453-02 Baylor Coll of Med Direct 93.286 375,087 388,587 NIH R01 EB027103-01 Direct 93.286 - 24,931 NIH R01 EB027769-01 Direct 93.286 - 37,975
Schedule of Expenditures of Federal Awards (Continued)Year Ended September 30, 2019
See notes to schedule of expenditures of federal awards. 14
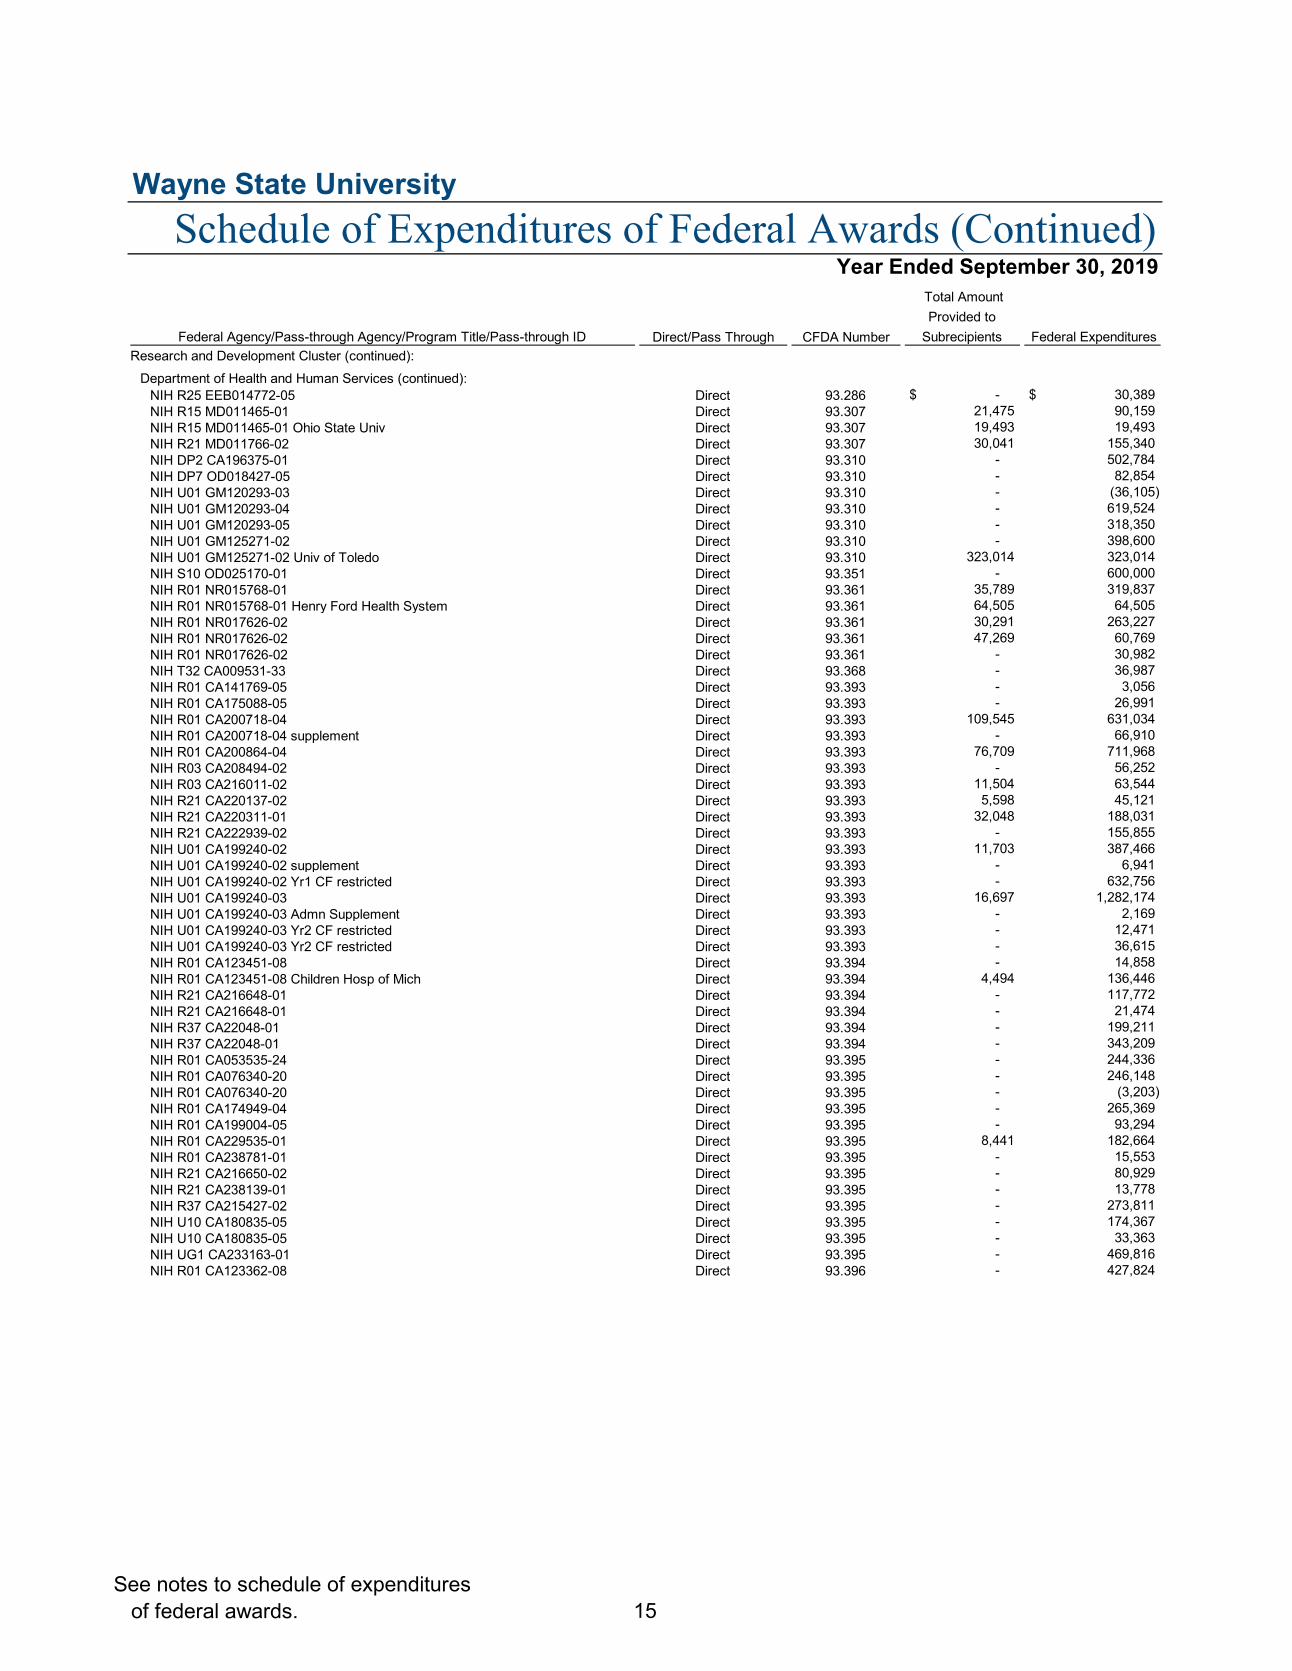
Wayne State University
Federal Agency/Pass-through Agency/Program Title/Pass-through ID Direct/Pass Through CFDA Number
Total Amount Provided to
Subrecipients Federal Expenditures Research and Development Cluster (continued):
Department of Health and Human Services (continued):NIH R25 EEB014772-05 Direct 93.286 -$ 30,389$ NIH R15 MD011465-01 Direct 93.307 21,475 90,159 NIH R15 MD011465-01 Ohio State Univ Direct 93.307 19,493 19,493 NIH R21 MD011766-02 Direct 93.307 30,041 155,340 NIH DP2 CA196375-01 Direct 93.310 - 502,784 NIH DP7 OD018427-05 Direct 93.310 - 82,854 NIH U01 GM120293-03 Direct 93.310 - (36,105) NIH U01 GM120293-04 Direct 93.310 - 619,524 NIH U01 GM120293-05 Direct 93.310 - 318,350 NIH U01 GM125271-02 Direct 93.310 - 398,600 NIH U01 GM125271-02 Univ of Toledo Direct 93.310 323,014 323,014 NIH S10 OD025170-01 Direct 93.351 - 600,000 NIH R01 NR015768-01 Direct 93.361 35,789 319,837 NIH R01 NR015768-01 Henry Ford Health System Direct 93.361 64,505 64,505 NIH R01 NR017626-02 Direct 93.361 30,291 263,227 NIH R01 NR017626-02 Direct 93.361 47,269 60,769 NIH R01 NR017626-02 Direct 93.361 - 30,982 NIH T32 CA009531-33 Direct 93.368 - 36,987 NIH R01 CA141769-05 Direct 93.393 - 3,056 NIH R01 CA175088-05 Direct 93.393 - 26,991 NIH R01 CA200718-04 Direct 93.393 109,545 631,034 NIH R01 CA200718-04 supplement Direct 93.393 - 66,910 NIH R01 CA200864-04 Direct 93.393 76,709 711,968 NIH R03 CA208494-02 Direct 93.393 - 56,252 NIH R03 CA216011-02 Direct 93.393 11,504 63,544 NIH R21 CA220137-02 Direct 93.393 5,598 45,121 NIH R21 CA220311-01 Direct 93.393 32,048 188,031 NIH R21 CA222939-02 Direct 93.393 - 155,855 NIH U01 CA199240-02 Direct 93.393 11,703 387,466 NIH U01 CA199240-02 supplement Direct 93.393 - 6,941 NIH U01 CA199240-02 Yr1 CF restricted Direct 93.393 - 632,756 NIH U01 CA199240-03 Direct 93.393 16,697 1,282,174 NIH U01 CA199240-03 Admn Supplement Direct 93.393 - 2,169 NIH U01 CA199240-03 Yr2 CF restricted Direct 93.393 - 12,471 NIH U01 CA199240-03 Yr2 CF restricted Direct 93.393 - 36,615 NIH R01 CA123451-08 Direct 93.394 - 14,858 NIH R01 CA123451-08 Children Hosp of Mich Direct 93.394 4,494 136,446 NIH R21 CA216648-01 Direct 93.394 - 117,772 NIH R21 CA216648-01 Direct 93.394 - 21,474 NIH R37 CA22048-01 Direct 93.394 - 199,211 NIH R37 CA22048-01 Direct 93.394 - 343,209 NIH R01 CA053535-24 Direct 93.395 - 244,336 NIH R01 CA076340-20 Direct 93.395 - 246,148 NIH R01 CA076340-20 Direct 93.395 - (3,203) NIH R01 CA174949-04 Direct 93.395 - 265,369 NIH R01 CA199004-05 Direct 93.395 - 93,294 NIH R01 CA229535-01 Direct 93.395 8,441 182,664 NIH R01 CA238781-01 Direct 93.395 - 15,553 NIH R21 CA216650-02 Direct 93.395 - 80,929 NIH R21 CA238139-01 Direct 93.395 - 13,778 NIH R37 CA215427-02 Direct 93.395 - 273,811 NIH U10 CA180835-05 Direct 93.395 - 174,367 NIH U10 CA180835-05 Direct 93.395 - 33,363 NIH UG1 CA233163-01 Direct 93.395 - 469,816 NIH R01 CA123362-08 Direct 93.396 - 427,824
Schedule of Expenditures of Federal Awards (Continued)Year Ended September 30, 2019
See notes to schedule of expenditures of federal awards. 15
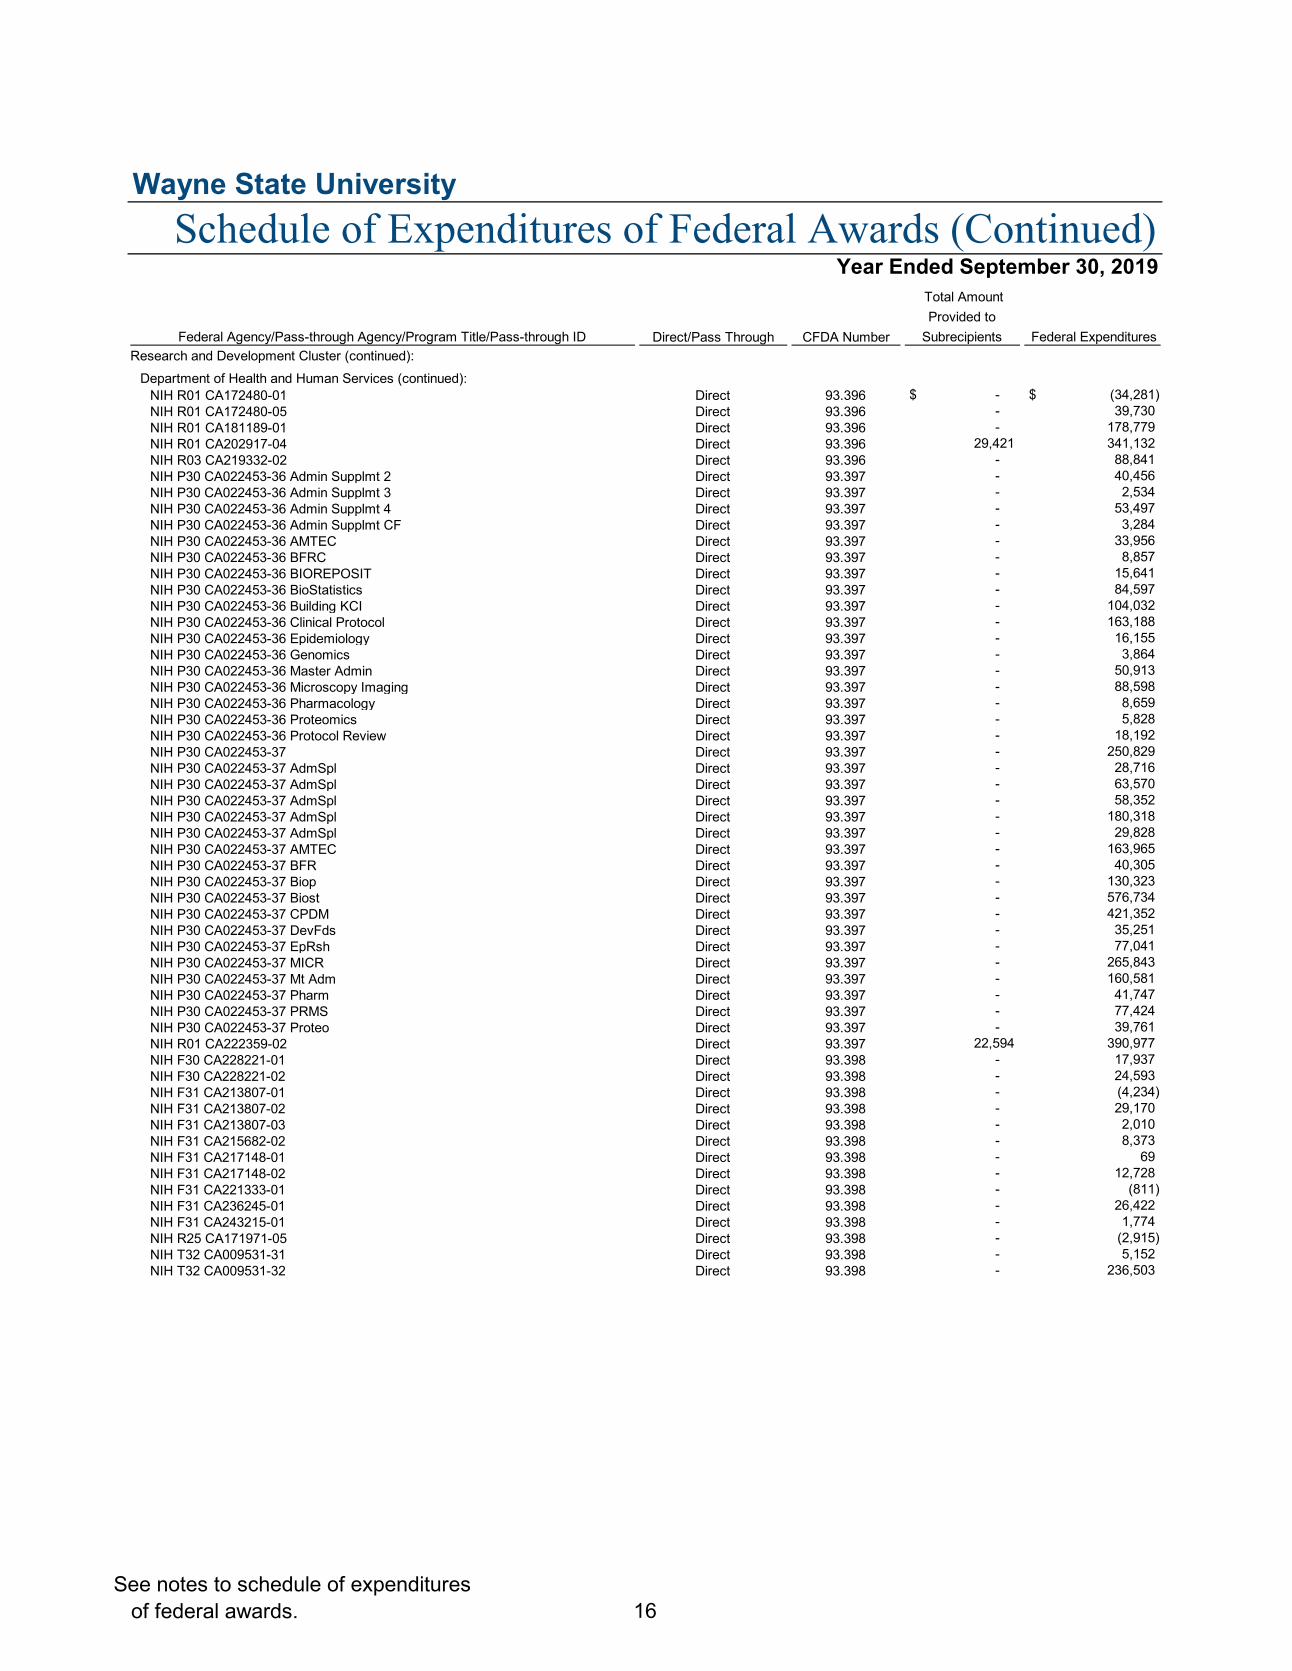
Wayne State University
Federal Agency/Pass-through Agency/Program Title/Pass-through ID Direct/Pass Through CFDA Number
Total Amount Provided to
Subrecipients Federal Expenditures Research and Development Cluster (continued):
Department of Health and Human Services (continued):NIH R01 CA172480-01 Direct 93.396 -$ (34,281)$ NIH R01 CA172480-05 Direct 93.396 - 39,730 NIH R01 CA181189-01 Direct 93.396 - 178,779 NIH R01 CA202917-04 Direct 93.396 29,421 341,132 NIH R03 CA219332-02 Direct 93.396 - 88,841 NIH P30 CA022453-36 Admin Supplmt 2 Direct 93.397 - 40,456 NIH P30 CA022453-36 Admin Supplmt 3 Direct 93.397 - 2,534 NIH P30 CA022453-36 Admin Supplmt 4 Direct 93.397 - 53,497 NIH P30 CA022453-36 Admin Supplmt CF Direct 93.397 - 3,284 NIH P30 CA022453-36 AMTEC Direct 93.397 - 33,956 NIH P30 CA022453-36 BFRC Direct 93.397 - 8,857 NIH P30 CA022453-36 BIOREPOSIT Direct 93.397 - 15,641 NIH P30 CA022453-36 BioStatistics Direct 93.397 - 84,597 NIH P30 CA022453-36 Building KCI Direct 93.397 - 104,032 NIH P30 CA022453-36 Clinical Protocol Direct 93.397 - 163,188 NIH P30 CA022453-36 Epidemiology Direct 93.397 - 16,155 NIH P30 CA022453-36 Genomics Direct 93.397 - 3,864 NIH P30 CA022453-36 Master Admin Direct 93.397 - 50,913 NIH P30 CA022453-36 Microscopy Imaging Direct 93.397 - 88,598 NIH P30 CA022453-36 Pharmacology Direct 93.397 - 8,659 NIH P30 CA022453-36 Proteomics Direct 93.397 - 5,828 NIH P30 CA022453-36 Protocol Review Direct 93.397 - 18,192 NIH P30 CA022453-37 Direct 93.397 - 250,829 NIH P30 CA022453-37 AdmSpl Direct 93.397 - 28,716 NIH P30 CA022453-37 AdmSpl Direct 93.397 - 63,570 NIH P30 CA022453-37 AdmSpl Direct 93.397 - 58,352 NIH P30 CA022453-37 AdmSpl Direct 93.397 - 180,318 NIH P30 CA022453-37 AdmSpl Direct 93.397 - 29,828 NIH P30 CA022453-37 AMTEC Direct 93.397 - 163,965 NIH P30 CA022453-37 BFR Direct 93.397 - 40,305 NIH P30 CA022453-37 Biop Direct 93.397 - 130,323 NIH P30 CA022453-37 Biost Direct 93.397 - 576,734 NIH P30 CA022453-37 CPDM Direct 93.397 - 421,352 NIH P30 CA022453-37 DevFds Direct 93.397 - 35,251 NIH P30 CA022453-37 EpRsh Direct 93.397 - 77,041 NIH P30 CA022453-37 MICR Direct 93.397 - 265,843 NIH P30 CA022453-37 Mt Adm Direct 93.397 - 160,581 NIH P30 CA022453-37 Pharm Direct 93.397 - 41,747 NIH P30 CA022453-37 PRMS Direct 93.397 - 77,424 NIH P30 CA022453-37 Proteo Direct 93.397 - 39,761 NIH R01 CA222359-02 Direct 93.397 22,594 390,977 NIH F30 CA228221-01 Direct 93.398 - 17,937 NIH F30 CA228221-02 Direct 93.398 - 24,593 NIH F31 CA213807-01 Direct 93.398 - (4,234) NIH F31 CA213807-02 Direct 93.398 - 29,170 NIH F31 CA213807-03 Direct 93.398 - 2,010 NIH F31 CA215682-02 Direct 93.398 - 8,373 NIH F31 CA217148-01 Direct 93.398 - 69 NIH F31 CA217148-02 Direct 93.398 - 12,728 NIH F31 CA221333-01 Direct 93.398 - (811) NIH F31 CA236245-01 Direct 93.398 - 26,422 NIH F31 CA243215-01 Direct 93.398 - 1,774 NIH R25 CA171971-05 Direct 93.398 - (2,915) NIH T32 CA009531-31 Direct 93.398 - 5,152 NIH T32 CA009531-32 Direct 93.398 - 236,503
Year Ended September 30, 2019Schedule of Expenditures of Federal Awards (Continued)
See notes to schedule of expenditures of federal awards. 16

Wayne State University
Federal Agency/Pass-through Agency/Program Title/Pass-through ID Direct/Pass Through CFDA Number
Total Amount Provided to
Subrecipients Federal Expenditures Research and Development Cluster (continued):
Department of Health and Human Services (continued):ACL 90DPTB0006-01 Direct 93.433 50,515$ 53,943$ ACL 90DPTB0006-02-00 Direct 93.433 182,775 491,448 ACL 90IF0092-03 Direct 93.433 17,264 32,073 DHHS-ACF-90YR0092-03 Direct 93.600 7,423 12,356 DHHS-ACF-90YR0092-03 Mich State Univ Direct 93.600 17,257 17,348 DHHS-ACF-90YR0092-04 Direct 93.600 49,514 416,605 DHHS-ACF-90YR0092-04 Mich State Univ Direct 93.600 53,906 53,906 NIH K22 HL126842-03 Direct 93.837 - 23,243 NIH R01 HL 109090-04 Direct 93.837 - 781 NIH R01 HL 109090-04 Albert Einstein College Med Direct 93.837 13,608 13,608 NIH R01 HL 109090-04 Child Hosp Boston Direct 93.837 1,005 1,005 NIH R01 HL 109090-04 Child Hosp Med Ctr Direct 93.837 17,042 17,042 NIH R01 HL 109090-04 CHOP Direct 93.837 11,337 11,337 NIH R01 HL 109090-04 New England Res Inst. Direct 93.837 186,972 186,972 NIH R01 HL 109090-04 Univ of Pittsburgh Direct 93.837 762 762 NIH R01 HL 109090-04 Washington Univ Direct 93.837 11,952 11,952 NIH R01 HL050710-19 Direct 93.837 - 294,024 NIH R01 HL055473-21 Direct 93.837 - 241,023 NIH R01 HL096787-08 Direct 93.837 5,508 356,034 NIH R01 HL109090-04 Direct 93.837 - 131,355 NIH R01 HL114097-08 Direct 93.837 - 444,798 NIH R01 HL114097-08 Direct 93.837 - 237,958 NIH R01 HL117880-02 Direct 93.837 - 33,853 NIH R01 HL117880-02 Direct 93.837 - 1,468 NIH R01 HL119815-04 Direct 93.837 - 107,922 NIH R01 HL126706-04 Direct 93.837 - 457,042 NIH R01 HL126706-04 Direct 93.837 - (278) NIH R01 HL127691-01 Direct 93.837 205,303 344,697 NIH R01 HL130552-01 Direct 93.837 - 262,714 NIH R01 HL131740-03 Direct 93.837 13,115 454,864 NIH R01 HL133506-03 Direct 93.837 32,988 577,784 NIH R01 HL133506-03 Direct 93.837 - 127,168 NIH R01 HL133506-03 Univ of Massachusetts Direct 93.837 17,393 26,556 NIH R01 HL134787-01 Direct 93.837 92,651 347,750 NIH R01 HL137558-02 Direct 93.837 7,894 37,868 NIH R01 HL137558-02 Bronx Direct 93.837 11,520 17,427 NIH R01 HL137558-02 Child Hosp of Boston Direct 93.837 16,107 23,937 NIH R01 HL137558-02 CHOC Direct 93.837 5,445 8,386 NIH R01 HL137558-02 Drexel Direct 93.837 1,671 2,573 NIH R01 HL137558-02 Frontier Sci & Tech Direct 93.837 12,840 13,791 NIH R01 HL137558-02 Harvard Direct 93.837 22,402 31,064 NIH R01 HL137558-02 Hawaii Direct 93.837 54,648 54,648 NIH R01 HL137558-02 NY City Health Hosp Direct 93.837 7,620 11,735 NIH R01 HL137558-02 St. Jude Direct 93.837 27,045 40,545 NIH R01 HL137558-02 Univ of Colorado Direct 93.837 932 1,435 NIH R01 HL137558-02 Westat Direct 93.837 12,352 13,265 NIH R01 HL138007-01 Direct 93.837 - 188,865 NIH R01 HL138007-01 Direct 93.837 - 43,773 NIH R01 HL139968-01 Direct 93.837 25,154 48,462 NIH R01 HL139968-01 NERI Direct 93.837 22,563 34,746 NIH R01 HL139968-01 Univ Colorado Direct 93.837 114,162 114,162 NIH R01 HL139968-01 Vanderbilt Direct 93.837 11,747 17,058 NIH R01 HL142956-01 Direct 93.837 - 353,956 NIH R21 HL148089-07 Direct 93.837 - 12,049 NIH T32 HL120822-04 Direct 93.837 - 28,390
Schedule of Expenditures of Federal Awards (Continued)Year Ended September 30, 2019
See notes to schedule of expenditures of federal awards. 17
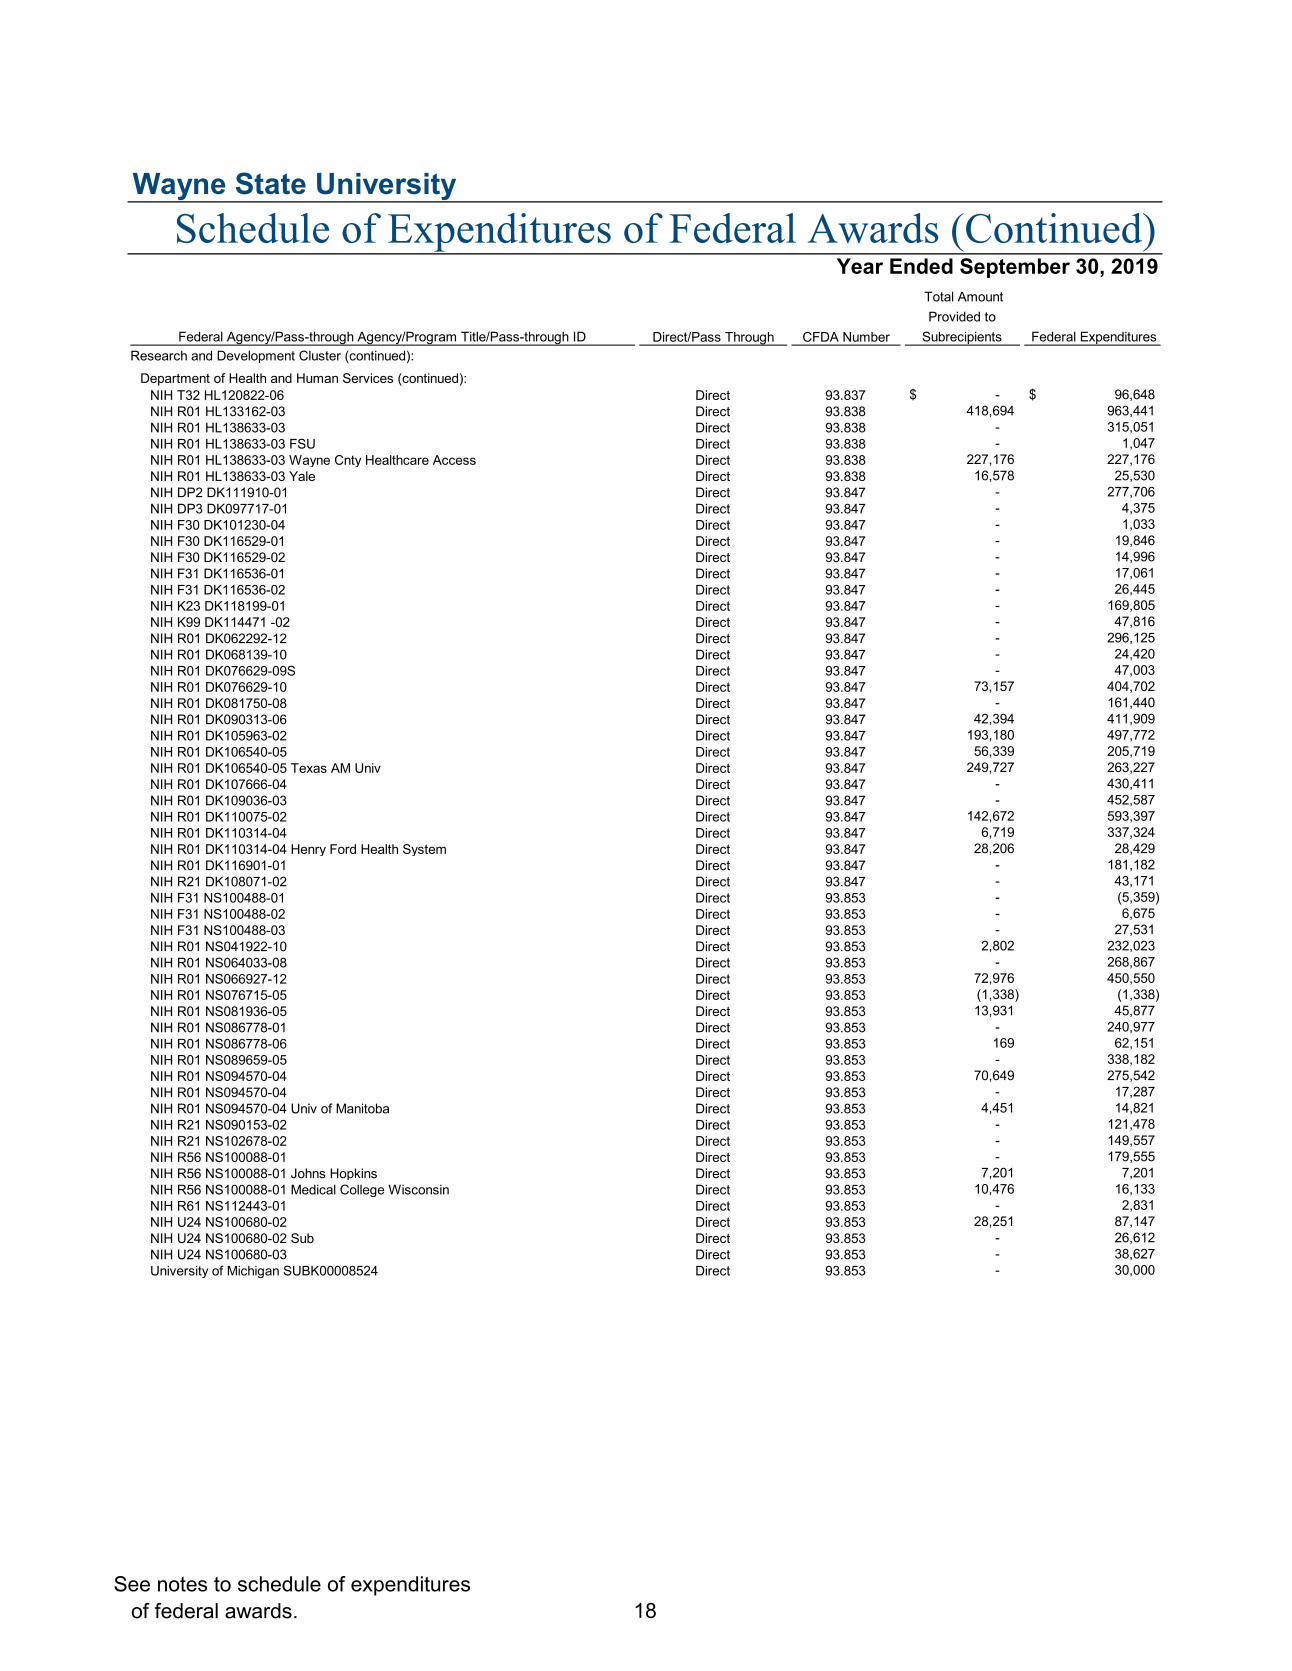
Wayne State University
Federal Agency/Pass-through Agency/Program Title/Pass-through ID Direct/Pass Through CFDA Number
Total Amount Provided to
Subrecipients Federal Expenditures Research and Development Cluster (continued):
Department of Health and Human Services (continued):NIH T32 HL120822-06 Direct 93.837 -$ 96,648$ NIH R01 HL133162-03 Direct 93.838 418,694 963,441 NIH R01 HL138633-03 Direct 93.838 - 315,051 NIH R01 HL138633-03 FSU Direct 93.838 - 1,047 NIH R01 HL138633-03 Wayne Cnty Healthcare Access Direct 93.838 227,176 227,176 NIH R01 HL138633-03 Yale Direct 93.838 16,578 25,530 NIH DP2 DK111910-01 Direct 93.847 - 277,706 NIH DP3 DK097717-01 Direct 93.847 - 4,375 NIH F30 DK101230-04 Direct 93.847 - 1,033 NIH F30 DK116529-01 Direct 93.847 - 19,846 NIH F30 DK116529-02 Direct 93.847 - 14,996 NIH F31 DK116536-01 Direct 93.847 - 17,061 NIH F31 DK116536-02 Direct 93.847 - 26,445 NIH K23 DK118199-01 Direct 93.847 - 169,805 NIH K99 DK114471 -02 Direct 93.847 - 47,816 NIH R01 DK062292-12 Direct 93.847 - 296,125 NIH R01 DK068139-10 Direct 93.847 - 24,420 NIH R01 DK076629-09S Direct 93.847 - 47,003 NIH R01 DK076629-10 Direct 93.847 73,157 404,702 NIH R01 DK081750-08 Direct 93.847 - 161,440 NIH R01 DK090313-06 Direct 93.847 42,394 411,909 NIH R01 DK105963-02 Direct 93.847 193,180 497,772 NIH R01 DK106540-05 Direct 93.847 56,339 205,719 NIH R01 DK106540-05 Texas AM Univ Direct 93.847 249,727 263,227 NIH R01 DK107666-04 Direct 93.847 - 430,411 NIH R01 DK109036-03 Direct 93.847 - 452,587 NIH R01 DK110075-02 Direct 93.847 142,672 593,397 NIH R01 DK110314-04 Direct 93.847 6,719 337,324 NIH R01 DK110314-04 Henry Ford Health System Direct 93.847 28,206 28,429 NIH R01 DK116901-01 Direct 93.847 - 181,182 NIH R21 DK108071-02 Direct 93.847 - 43,171 NIH F31 NS100488-01 Direct 93.853 - (5,359) NIH F31 NS100488-02 Direct 93.853 - 6,675 NIH F31 NS100488-03 Direct 93.853 - 27,531 NIH R01 NS041922-10 Direct 93.853 2,802 232,023 NIH R01 NS064033-08 Direct 93.853 - 268,867 NIH R01 NS066927-12 Direct 93.853 72,976 450,550 NIH R01 NS076715-05 Direct 93.853 (1,338) (1,338) NIH R01 NS081936-05 Direct 93.853 13,931 45,877 NIH R01 NS086778-01 Direct 93.853 - 240,977 NIH R01 NS086778-06 Direct 93.853 169 62,151 NIH R01 NS089659-05 Direct 93.853 - 338,182 NIH R01 NS094570-04 Direct 93.853 70,649 275,542 NIH R01 NS094570-04 Direct 93.853 - 17,287 NIH R01 NS094570-04 Univ of Manitoba Direct 93.853 4,451 14,821 NIH R21 NS090153-02 Direct 93.853 - 121,478 NIH R21 NS102678-02 Direct 93.853 - 149,557 NIH R56 NS100088-01 Direct 93.853 - 179,555 NIH R56 NS100088-01 Johns Hopkins Direct 93.853 7,201 7,201 NIH R56 NS100088-01 Medical College Wisconsin Direct 93.853 10,476 16,133 NIH R61 NS112443-01 Direct 93.853 - 2,831 NIH U24 NS100680-02 Direct 93.853 28,251 87,147 NIH U24 NS100680-02 Sub Direct 93.853 - 26,612 NIH U24 NS100680-03 Direct 93.853 - 38,627 University of Michigan SUBK00008524 Direct 93.853 - 30,000
Schedule of Expenditures of Federal Awards (Continued)Year Ended September 30, 2019
See notes to schedule of expenditures of federal awards. 18
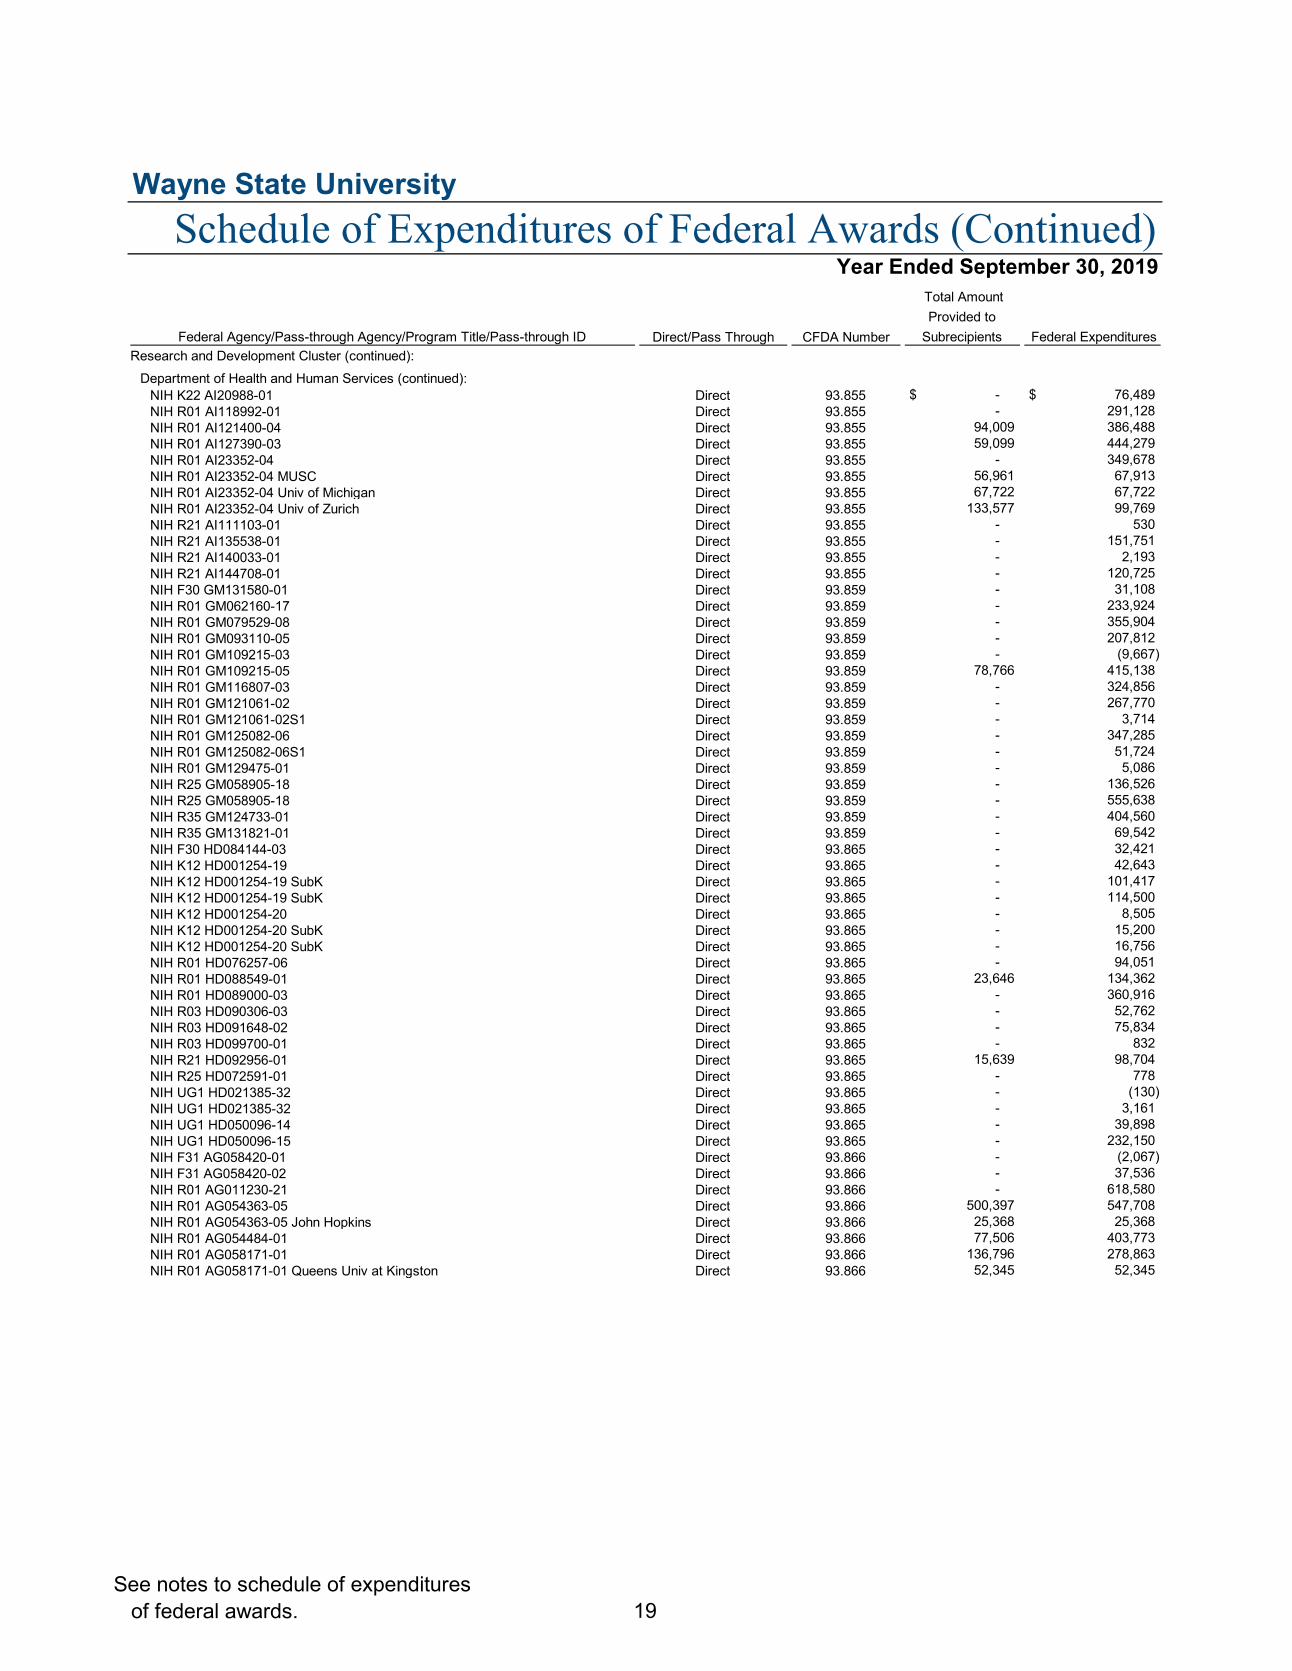
Wayne State University
Federal Agency/Pass-through Agency/Program Title/Pass-through ID Direct/Pass Through CFDA Number
Total Amount Provided to
Subrecipients Federal Expenditures Research and Development Cluster (continued):
Department of Health and Human Services (continued):NIH K22 AI20988-01 Direct 93.855 -$ 76,489$ NIH R01 AI118992-01 Direct 93.855 - 291,128 NIH R01 AI121400-04 Direct 93.855 94,009 386,488 NIH R01 AI127390-03 Direct 93.855 59,099 444,279 NIH R01 AI23352-04 Direct 93.855 - 349,678 NIH R01 AI23352-04 MUSC Direct 93.855 56,961 67,913 NIH R01 AI23352-04 Univ of Michigan Direct 93.855 67,722 67,722 NIH R01 AI23352-04 Univ of Zurich Direct 93.855 133,577 99,769 NIH R21 AI111103-01 Direct 93.855 - 530 NIH R21 AI135538-01 Direct 93.855 - 151,751 NIH R21 AI140033-01 Direct 93.855 - 2,193 NIH R21 AI144708-01 Direct 93.855 - 120,725 NIH F30 GM131580-01 Direct 93.859 - 31,108 NIH R01 GM062160-17 Direct 93.859 - 233,924 NIH R01 GM079529-08 Direct 93.859 - 355,904 NIH R01 GM093110-05 Direct 93.859 - 207,812 NIH R01 GM109215-03 Direct 93.859 - (9,667) NIH R01 GM109215-05 Direct 93.859 78,766 415,138 NIH R01 GM116807-03 Direct 93.859 - 324,856 NIH R01 GM121061-02 Direct 93.859 - 267,770 NIH R01 GM121061-02S1 Direct 93.859 - 3,714 NIH R01 GM125082-06 Direct 93.859 - 347,285 NIH R01 GM125082-06S1 Direct 93.859 - 51,724 NIH R01 GM129475-01 Direct 93.859 - 5,086 NIH R25 GM058905-18 Direct 93.859 - 136,526 NIH R25 GM058905-18 Direct 93.859 - 555,638 NIH R35 GM124733-01 Direct 93.859 - 404,560 NIH R35 GM131821-01 Direct 93.859 - 69,542 NIH F30 HD084144-03 Direct 93.865 - 32,421 NIH K12 HD001254-19 Direct 93.865 - 42,643 NIH K12 HD001254-19 SubK Direct 93.865 - 101,417 NIH K12 HD001254-19 SubK Direct 93.865 - 114,500 NIH K12 HD001254-20 Direct 93.865 - 8,505 NIH K12 HD001254-20 SubK Direct 93.865 - 15,200 NIH K12 HD001254-20 SubK Direct 93.865 - 16,756 NIH R01 HD076257-06 Direct 93.865 - 94,051 NIH R01 HD088549-01 Direct 93.865 23,646 134,362 NIH R01 HD089000-03 Direct 93.865 - 360,916 NIH R03 HD090306-03 Direct 93.865 - 52,762 NIH R03 HD091648-02 Direct 93.865 - 75,834 NIH R03 HD099700-01 Direct 93.865 - 832 NIH R21 HD092956-01 Direct 93.865 15,639 98,704 NIH R25 HD072591-01 Direct 93.865 - 778 NIH UG1 HD021385-32 Direct 93.865 - (130) NIH UG1 HD021385-32 Direct 93.865 - 3,161 NIH UG1 HD050096-14 Direct 93.865 - 39,898 NIH UG1 HD050096-15 Direct 93.865 - 232,150 NIH F31 AG058420-01 Direct 93.866 - (2,067) NIH F31 AG058420-02 Direct 93.866 - 37,536 NIH R01 AG011230-21 Direct 93.866 - 618,580 NIH R01 AG054363-05 Direct 93.866 500,397 547,708 NIH R01 AG054363-05 John Hopkins Direct 93.866 25,368 25,368 NIH R01 AG054484-01 Direct 93.866 77,506 403,773 NIH R01 AG058171-01 Direct 93.866 136,796 278,863 NIH R01 AG058171-01 Queens Univ at Kingston Direct 93.866 52,345 52,345
Schedule of Expenditures of Federal Awards (Continued)Year Ended September 30, 2019
See notes to schedule of expenditures of federal awards. 19

Wayne State University
Federal Agency/Pass-through Agency/Program Title/Pass-through ID Direct/Pass Through CFDA Number
Total Amount Provided to
Subrecipients Federal Expenditures Research and Development Cluster (continued):
Department of Health and Human Services (continued):NIH R01 AG058171-01 Univ of Kentucky Direct 93.866 83,870$ 83,870$ NIH R01 AG058171-01 William Beaumont Hosp Direct 93.866 90,858 90,858 NIH R21 AG050741-01 Direct 93.866 - 205,928 NIH R21 AG055712-01 Direct 93.866 - 152,349 NIH R21 AG059160-02 Direct 93.866 - 153,997 NIH R56 AG060822-01 Direct 93.866 135,979 316,843 NIH F30 EY025923-02 Direct 93.867 - 21,105 NIH F30 EY025923-03 Direct 93.867 - 18,138 NIH P30 EY004068-34 Direct 93.867 - (2,991) NIH P30 EY004068-35 Direct 93.867 - 452,103 NIH P30 EY004068-36 Direct 93.867 - 14,948 NIH R01 EY010869-23 Direct 93.867 - 362,595 NIH R01 EY014370-10 Direct 93.867 - 126,544 NIH R01 EY017313-07 Direct 93.867 - 301,955 NIH R01 EY017960-08 Direct 93.867 33,978 441,161 NIH R01 EY022230-05 Direct 93.867 - 363,930 NIH R01 EY022330-04 Direct 93.867 - 141,407 NIH R01 EY022417-06 Direct 93.867 - 55,987 NIH R01 EY022687-04 Direct 93.867 14,643 158,799 NIH R01 EY023226-04 Direct 93.867 14,106 (3,583) NIH R01 EY023992-05 Direct 93.867 - 362,947 NIH R01 EY026059-02S1 Direct 93.867 - 29,655 NIH R01 EY026059-03 Direct 93.867 - 319,772 NIH R01 EY026551-01 Direct 93.867 - 406,205 NIH R01 EY026551-01 Direct 93.867 - 1,751 NIH R01 EY026584-04 Direct 93.867 103,104 314,710 NIH R01 EY026964-02S1 Direct 93.867 - 48,500 NIH R01 EY026964-03 Direct 93.867 81,502 405,211 NIH R01 EY027381-01 Direct 93.867 - 433,731 NIH R01 EY028442-01 Direct 93.867 - 302,794 NIH R01 EY028915-01 Direct 93.867 - 379,691 NIH R01 EY029690-01 Direct 93.867 - 163,606 NIH R01 EY029836-01 Direct 93.867 - 247,682 NIH R01 AG059683-01 Direct 93.966 - 206,571 CDC 200-2016-M-90293 Direct 93.RD - 284 CDC 75D30118C02647 Direct 93.RD - 85,662 CDC 75D30118C02647 Direct 93.RD - 24,529 NCI HHSH250201000014C Direct 93.RD - 43,546 NCI HHSN26100009 Direct 93.RD - 1,934 NCI HHSN26100010 Direct 93.RD - 550 NCI HHSN261201300011I Direct 93.RD - 1,911 NCI HHSN261201800699P Direct 93.RD - 24,900 NCI IPA Assignment A. Shields Direct 93.RD - 5,218 NICHD HHSN275201300006C Activity #2 Direct 93.RD - 3,095,061 NICHD HHSN275201300006C-Activity #1 Direct 93.RD 41,019 3,325,353 NICHD HHSN275201300006C-Activity #3 Direct 93.RD - 1,087,662 NICHD HHSN275201300006C-Activity #4 Direct 93.RD - 1,000,532 NICHD HHSN275201300006C-Activity #5 Direct 93.RD - 3,157,674 NICHD HHSN275201300006C-Activity #6 Direct 93.RD - 2,710,620 NICHD HHSN275201300006C-Activity #8 Direct 93.RD - 252,085 NICHD HHSN275201300006C-Space Alloc Direct 93.RD - 1,350,000 Henry Ford Health System B11191 Pass Through 93.073 - 142,021 MDHHS E20192744 Federal 100% Pass Through 93.110 - 13,298 Reproductive Stress R41ES02899 Pass Through 93.113 - 50,022 UMass 18-010120-A00 Pass Through 93.113 - 49,753
Schedule of Expenditures of Federal Awards (Continued)Year Ended September 30, 2019
See notes to schedule of expenditures of federal awards. 20
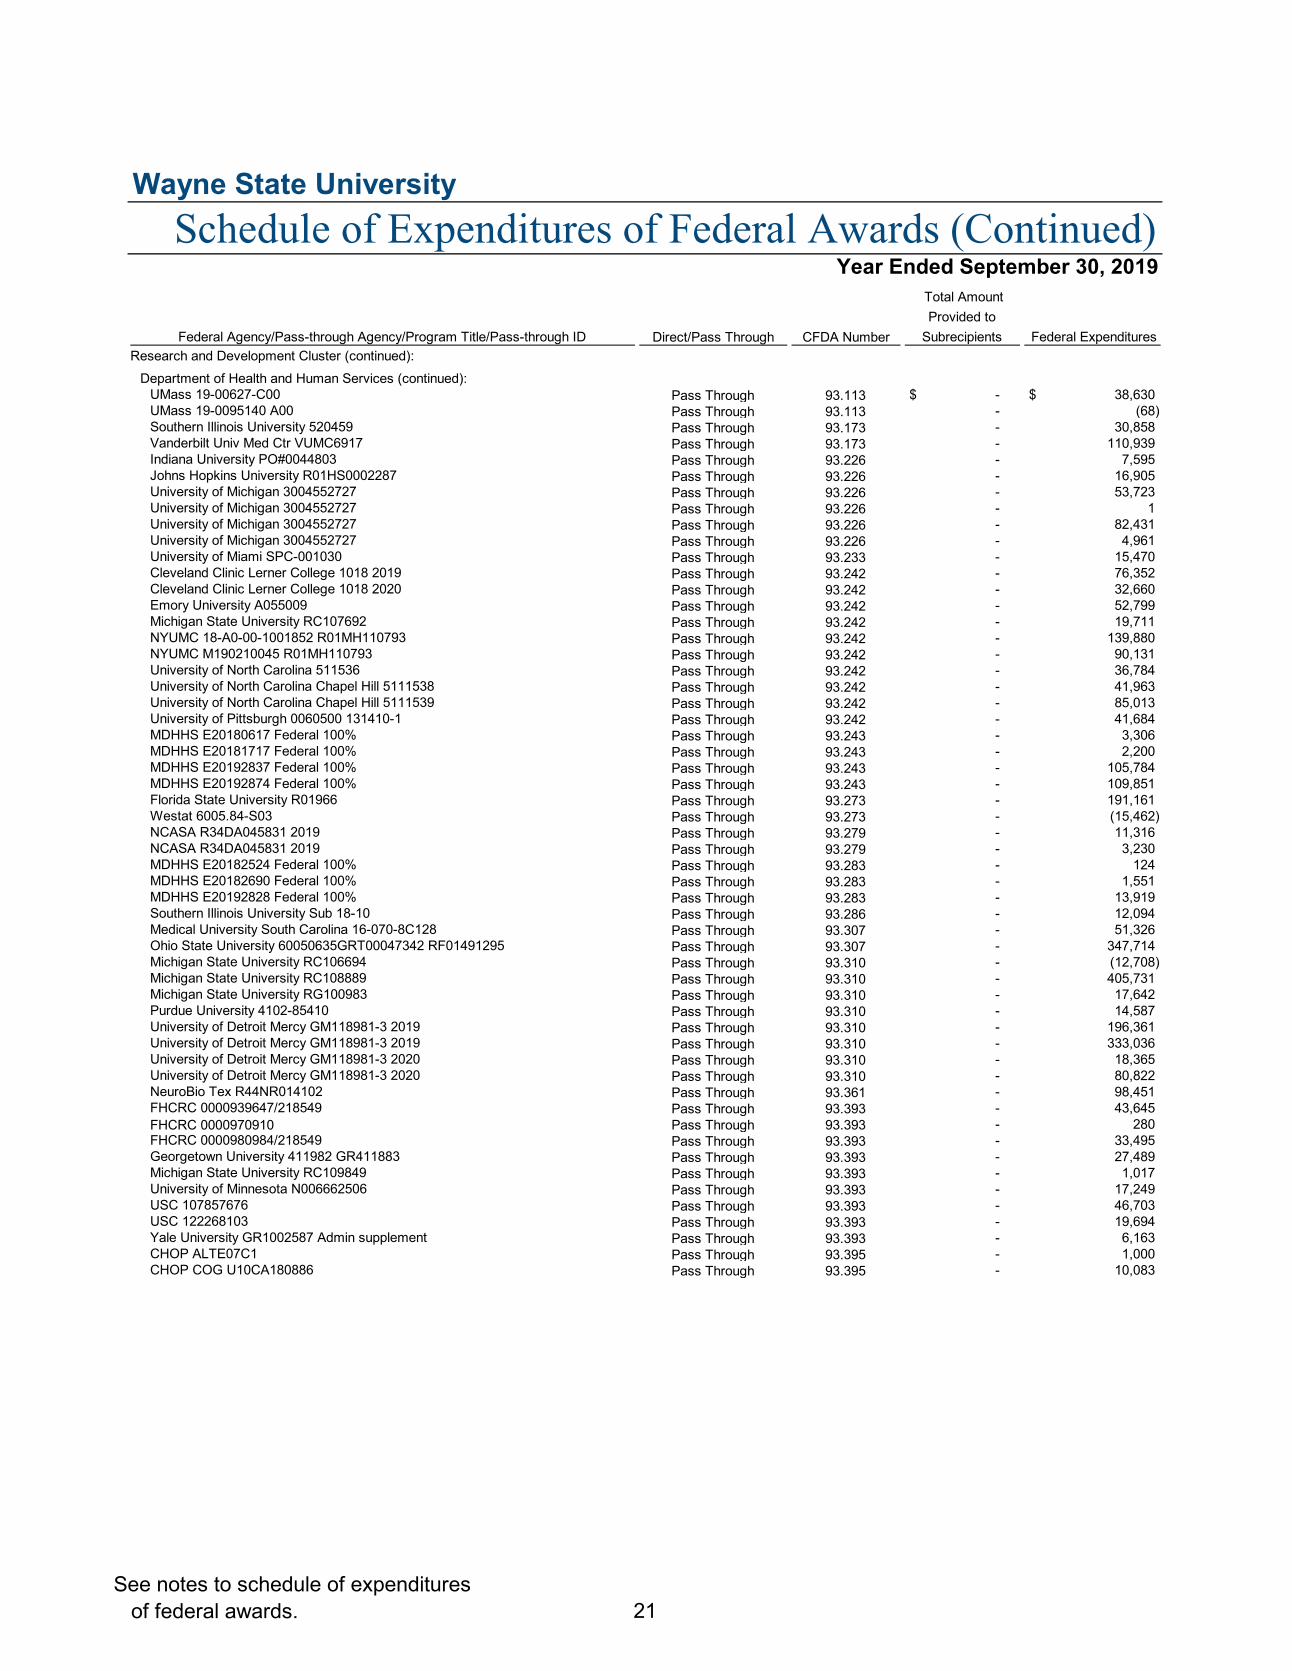
Wayne State University
Federal Agency/Pass-through Agency/Program Title/Pass-through ID Direct/Pass Through CFDA Number
Total Amount Provided to
Subrecipients Federal Expenditures Research and Development Cluster (continued):
Department of Health and Human Services (continued):UMass 19-00627-C00 Pass Through 93.113 -$ 38,630$ UMass 19-0095140 A00 Pass Through 93.113 - (68) Southern Illinois University 520459 Pass Through 93.173 - 30,858 Vanderbilt Univ Med Ctr VUMC6917 Pass Through 93.173 - 110,939 Indiana University PO#0044803 Pass Through 93.226 - 7,595 Johns Hopkins University R01HS0002287 Pass Through 93.226 - 16,905 University of Michigan 3004552727 Pass Through 93.226 - 53,723 University of Michigan 3004552727 Pass Through 93.226 - 1 University of Michigan 3004552727 Pass Through 93.226 - 82,431 University of Michigan 3004552727 Pass Through 93.226 - 4,961 University of Miami SPC-001030 Pass Through 93.233 - 15,470 Cleveland Clinic Lerner College 1018 2019 Pass Through 93.242 - 76,352 Cleveland Clinic Lerner College 1018 2020 Pass Through 93.242 - 32,660 Emory University A055009 Pass Through 93.242 - 52,799 Michigan State University RC107692 Pass Through 93.242 - 19,711 NYUMC 18-A0-00-1001852 R01MH110793 Pass Through 93.242 - 139,880 NYUMC M190210045 R01MH110793 Pass Through 93.242 - 90,131 University of North Carolina 511536 Pass Through 93.242 - 36,784 University of North Carolina Chapel Hill 5111538 Pass Through 93.242 - 41,963 University of North Carolina Chapel Hill 5111539 Pass Through 93.242 - 85,013 University of Pittsburgh 0060500 131410-1 Pass Through 93.242 - 41,684 MDHHS E20180617 Federal 100% Pass Through 93.243 - 3,306 MDHHS E20181717 Federal 100% Pass Through 93.243 - 2,200 MDHHS E20192837 Federal 100% Pass Through 93.243 - 105,784 MDHHS E20192874 Federal 100% Pass Through 93.243 - 109,851 Florida State University R01966 Pass Through 93.273 - 191,161 Westat 6005.84-S03 Pass Through 93.273 - (15,462) NCASA R34DA045831 2019 Pass Through 93.279 - 11,316 NCASA R34DA045831 2019 Pass Through 93.279 - 3,230 MDHHS E20182524 Federal 100% Pass Through 93.283 - 124 MDHHS E20182690 Federal 100% Pass Through 93.283 - 1,551 MDHHS E20192828 Federal 100% Pass Through 93.283 - 13,919 Southern Illinois University Sub 18-10 Pass Through 93.286 - 12,094 Medical University South Carolina 16-070-8C128 Pass Through 93.307 - 51,326 Ohio State University 60050635GRT00047342 RF01491295 Pass Through 93.307 - 347,714 Michigan State University RC106694 Pass Through 93.310 - (12,708) Michigan State University RC108889 Pass Through 93.310 - 405,731 Michigan State University RG100983 Pass Through 93.310 - 17,642 Purdue University 4102-85410 Pass Through 93.310 - 14,587 University of Detroit Mercy GM118981-3 2019 Pass Through 93.310 - 196,361 University of Detroit Mercy GM118981-3 2019 Pass Through 93.310 - 333,036 University of Detroit Mercy GM118981-3 2020 Pass Through 93.310 - 18,365 University of Detroit Mercy GM118981-3 2020 Pass Through 93.310 - 80,822 NeuroBio Tex R44NR014102 Pass Through 93.361 - 98,451 FHCRC 0000939647/218549 Pass Through 93.393 - 43,645 FHCRC 0000970910 Pass Through 93.393 - 280 FHCRC 0000980984/218549 Pass Through 93.393 - 33,495 Georgetown University 411982 GR411883 Pass Through 93.393 - 27,489 Michigan State University RC109849 Pass Through 93.393 - 1,017 University of Minnesota N006662506 Pass Through 93.393 - 17,249 USC 107857676 Pass Through 93.393 - 46,703 USC 122268103 Pass Through 93.393 - 19,694 Yale University GR1002587 Admin supplement Pass Through 93.393 - 6,163 CHOP ALTE07C1 Pass Through 93.395 - 1,000 CHOP COG U10CA180886 Pass Through 93.395 - 10,083
Schedule of Expenditures of Federal Awards (Continued)Year Ended September 30, 2019
See notes to schedule of expenditures of federal awards. 21
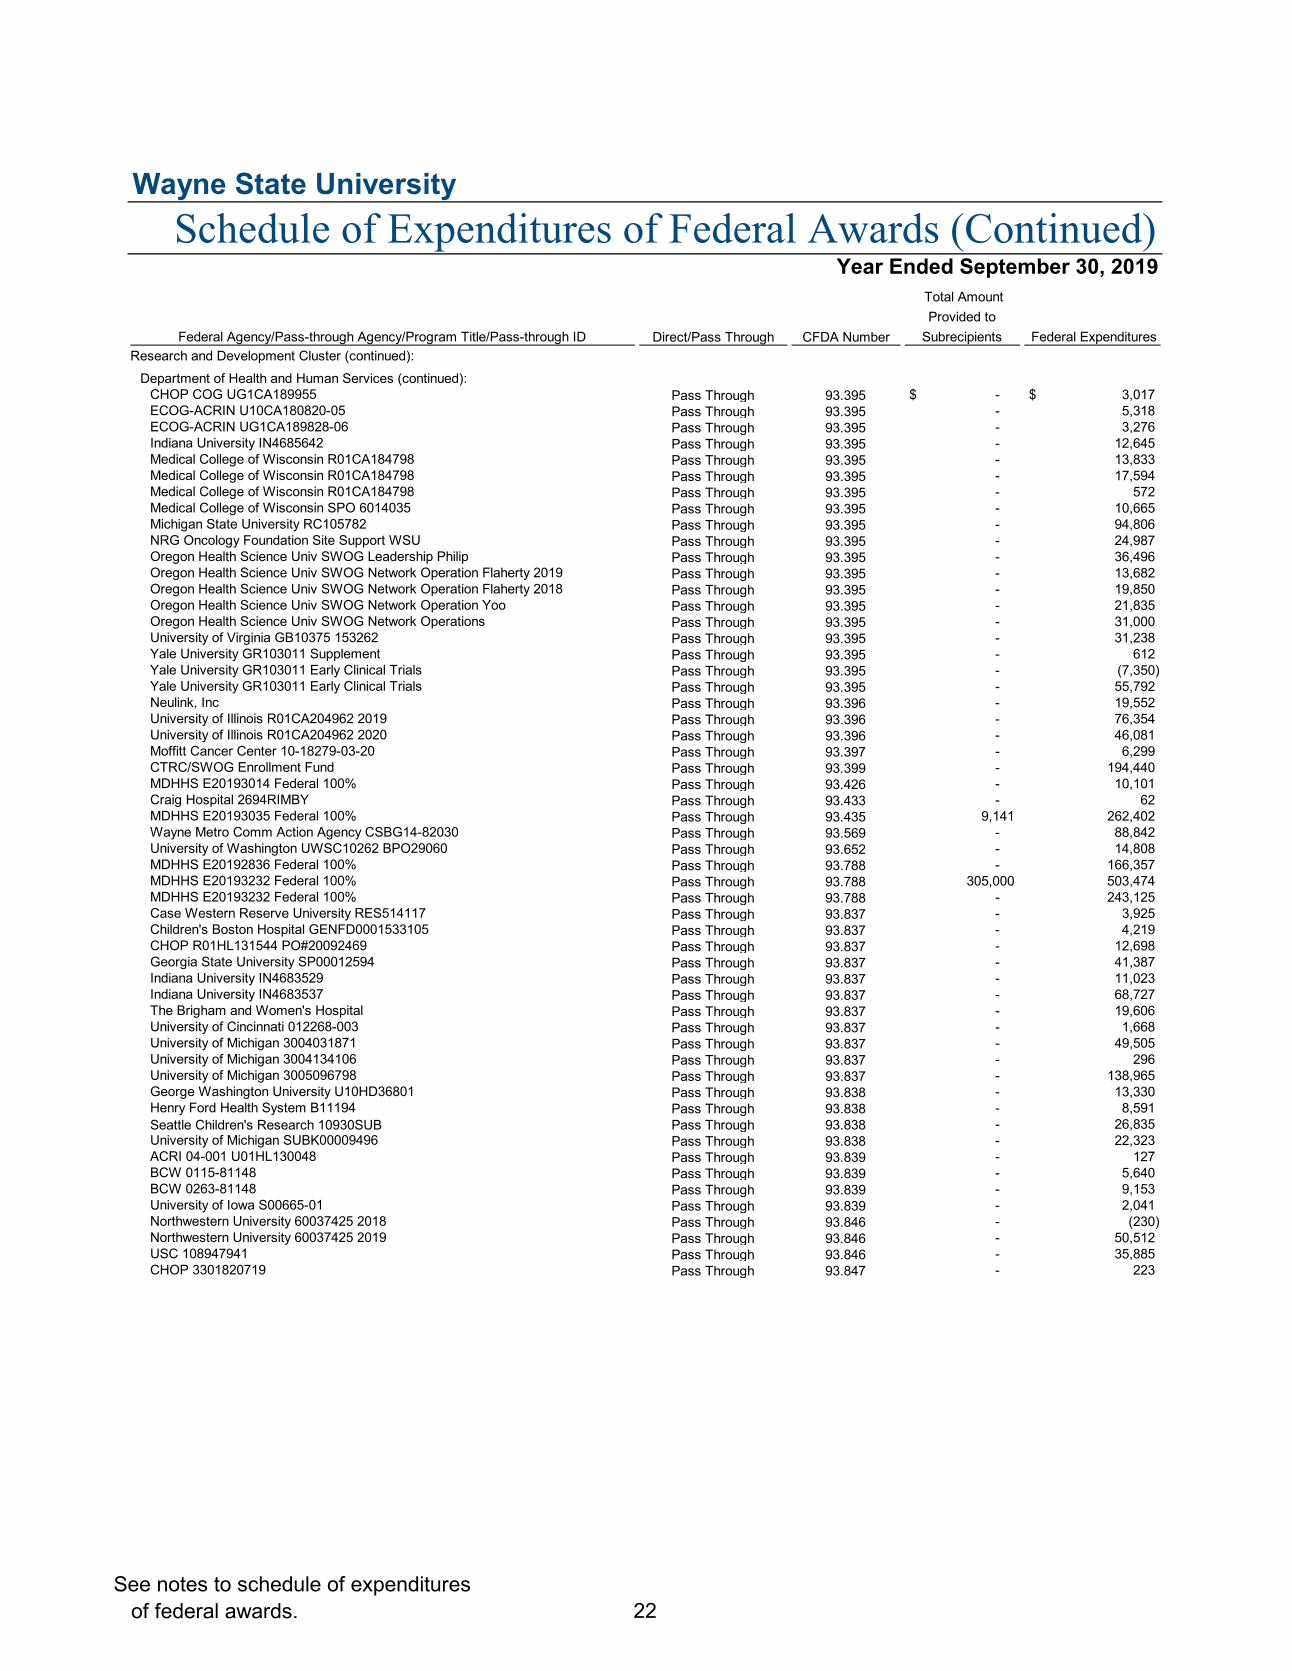
Wayne State University
Federal Agency/Pass-through Agency/Program Title/Pass-through ID Direct/Pass Through CFDA Number
Total Amount Provided to
Subrecipients Federal Expenditures Research and Development Cluster (continued):
Department of Health and Human Services (continued):CHOP COG UG1CA189955 Pass Through 93.395 -$ 3,017$ ECOG-ACRIN U10CA180820-05 Pass Through 93.395 - 5,318 ECOG-ACRIN UG1CA189828-06 Pass Through 93.395 - 3,276 Indiana University IN4685642 Pass Through 93.395 - 12,645 Medical College of Wisconsin R01CA184798 Pass Through 93.395 - 13,833 Medical College of Wisconsin R01CA184798 Pass Through 93.395 - 17,594 Medical College of Wisconsin R01CA184798 Pass Through 93.395 - 572 Medical College of Wisconsin SPO 6014035 Pass Through 93.395 - 10,665 Michigan State University RC105782 Pass Through 93.395 - 94,806 NRG Oncology Foundation Site Support WSU Pass Through 93.395 - 24,987 Oregon Health Science Univ SWOG Leadership Philip Pass Through 93.395 - 36,496 Oregon Health Science Univ SWOG Network Operation Flaherty 2019 Pass Through 93.395 - 13,682 Oregon Health Science Univ SWOG Network Operation Flaherty 2018 Pass Through 93.395 - 19,850 Oregon Health Science Univ SWOG Network Operation Yoo Pass Through 93.395 - 21,835 Oregon Health Science Univ SWOG Network Operations Pass Through 93.395 - 31,000 University of Virginia GB10375 153262 Pass Through 93.395 - 31,238 Yale University GR103011 Supplement Pass Through 93.395 - 612 Yale University GR103011 Early Clinical Trials Pass Through 93.395 - (7,350) Yale University GR103011 Early Clinical Trials Pass Through 93.395 - 55,792 Neulink, Inc Pass Through 93.396 - 19,552 University of Illinois R01CA204962 2019 Pass Through 93.396 - 76,354 University of Illinois R01CA204962 2020 Pass Through 93.396 - 46,081 Moffitt Cancer Center 10-18279-03-20 Pass Through 93.397 - 6,299 CTRC/SWOG Enrollment Fund Pass Through 93.399 - 194,440 MDHHS E20193014 Federal 100% Pass Through 93.426 - 10,101 Craig Hospital 2694RIMBY Pass Through 93.433 - 62 MDHHS E20193035 Federal 100% Pass Through 93.435 9,141 262,402 Wayne Metro Comm Action Agency CSBG14-82030 Pass Through 93.569 - 88,842 University of Washington UWSC10262 BPO29060 Pass Through 93.652 - 14,808 MDHHS E20192836 Federal 100% Pass Through 93.788 - 166,357 MDHHS E20193232 Federal 100% Pass Through 93.788 305,000 503,474 MDHHS E20193232 Federal 100% Pass Through 93.788 - 243,125 Case Western Reserve University RES514117 Pass Through 93.837 - 3,925 Children's Boston Hospital GENFD0001533105 Pass Through 93.837 - 4,219 CHOP R01HL131544 PO#20092469 Pass Through 93.837 - 12,698 Georgia State University SP00012594 Pass Through 93.837 - 41,387 Indiana University IN4683529 Pass Through 93.837 - 11,023 Indiana University IN4683537 Pass Through 93.837 - 68,727 The Brigham and Women's Hospital Pass Through 93.837 - 19,606 University of Cincinnati 012268-003 Pass Through 93.837 - 1,668 University of Michigan 3004031871 Pass Through 93.837 - 49,505 University of Michigan 3004134106 Pass Through 93.837 - 296 University of Michigan 3005096798 Pass Through 93.837 - 138,965 George Washington University U10HD36801 Pass Through 93.838 - 13,330 Henry Ford Health System B11194 Pass Through 93.838 - 8,591 Seattle Children's Research 10930SUB Pass Through 93.838 - 26,835 University of Michigan SUBK00009496 Pass Through 93.838 - 22,323 ACRI 04-001 U01HL130048 Pass Through 93.839 - 127 BCW 0115-81148 Pass Through 93.839 - 5,640 BCW 0263-81148 Pass Through 93.839 - 9,153 University of Iowa S00665-01 Pass Through 93.839 - 2,041 Northwestern University 60037425 2018 Pass Through 93.846 - (230) Northwestern University 60037425 2019 Pass Through 93.846 - 50,512 USC 108947941 Pass Through 93.846 - 35,885 CHOP 3301820719 Pass Through 93.847 - 223
Year Ended September 30, 2019Schedule of Expenditures of Federal Awards (Continued)
See notes to schedule of expenditures of federal awards. 22
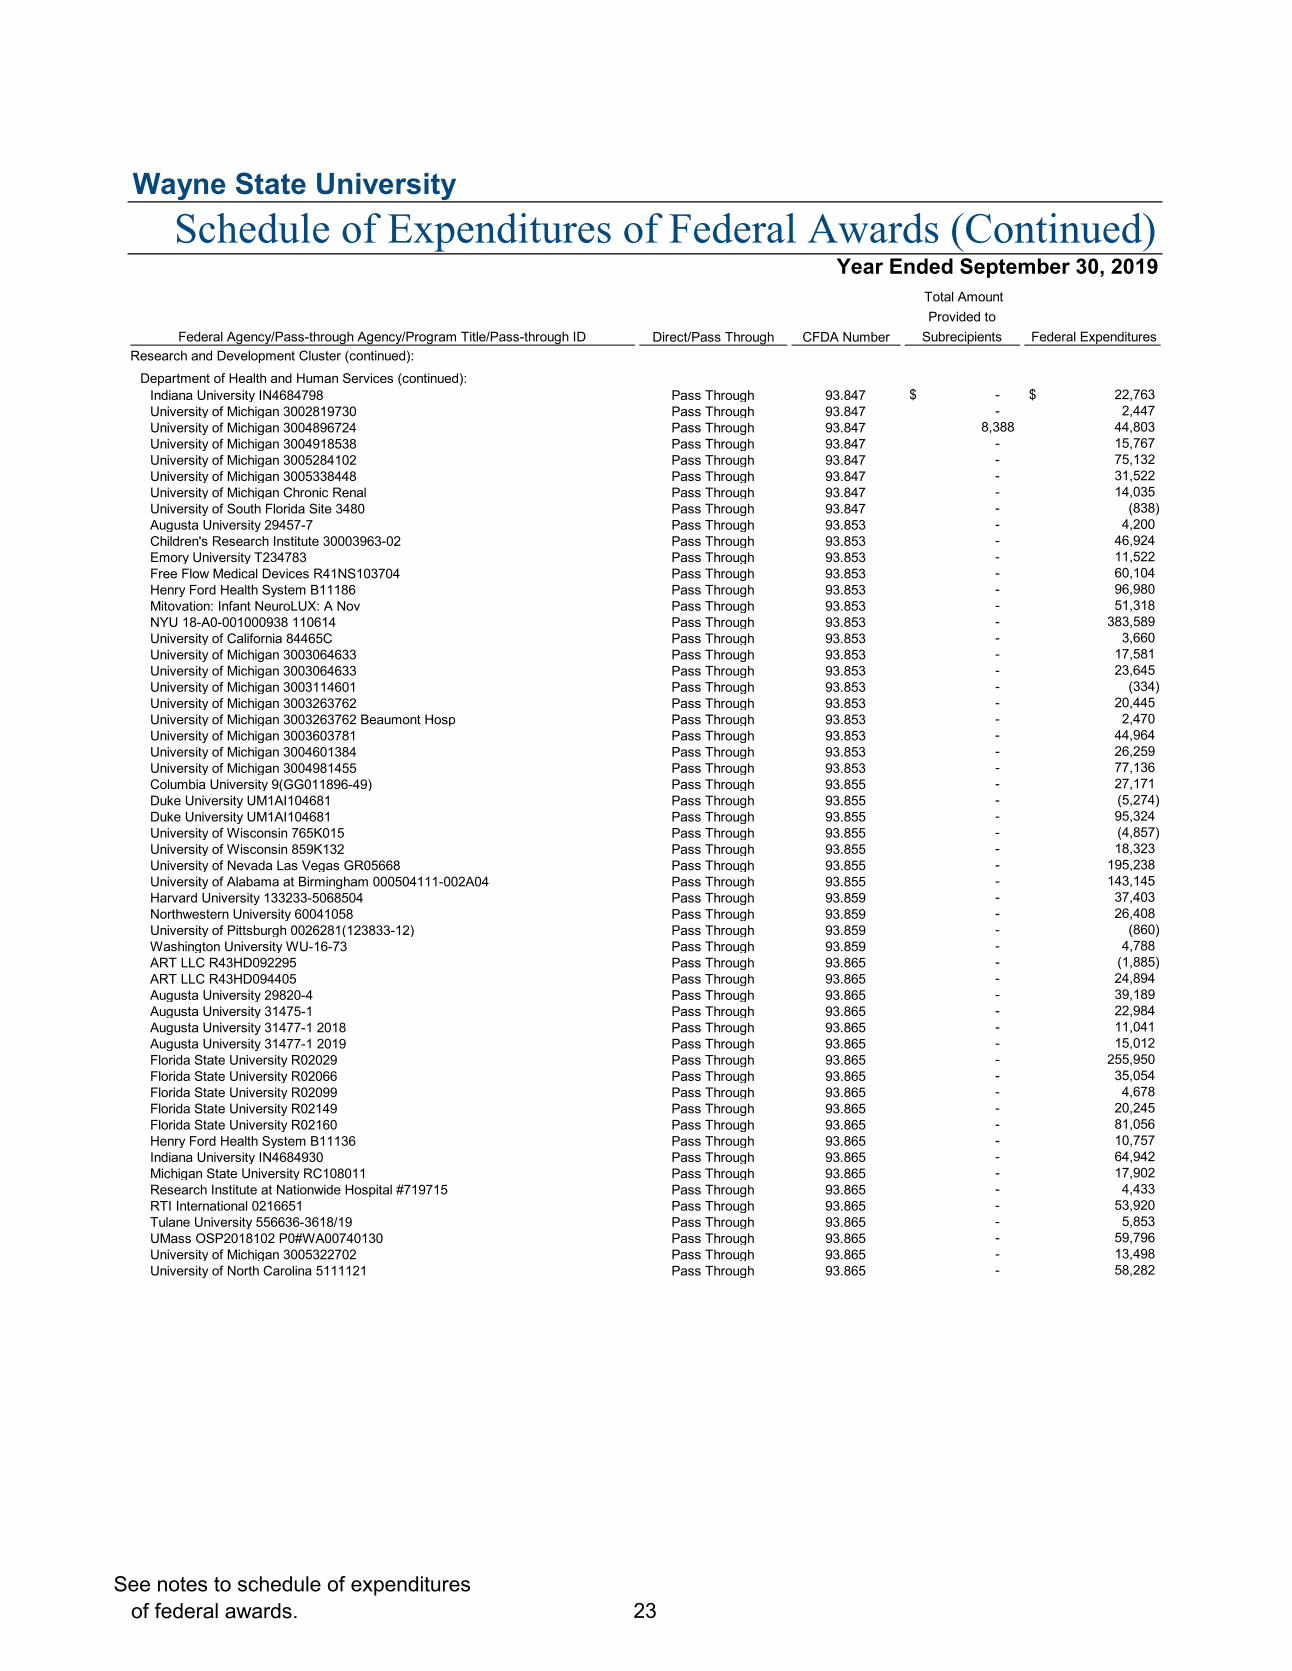
Wayne State University
Federal Agency/Pass-through Agency/Program Title/Pass-through ID Direct/Pass Through CFDA Number
Total Amount Provided to
Subrecipients Federal Expenditures Research and Development Cluster (continued):
Department of Health and Human Services (continued):Indiana University IN4684798 Pass Through 93.847 -$ 22,763$ University of Michigan 3002819730 Pass Through 93.847 - 2,447 University of Michigan 3004896724 Pass Through 93.847 8,388 44,803 University of Michigan 3004918538 Pass Through 93.847 - 15,767 University of Michigan 3005284102 Pass Through 93.847 - 75,132 University of Michigan 3005338448 Pass Through 93.847 - 31,522 University of Michigan Chronic Renal Pass Through 93.847 - 14,035 University of South Florida Site 3480 Pass Through 93.847 - (838) Augusta University 29457-7 Pass Through 93.853 - 4,200 Children's Research Institute 30003963-02 Pass Through 93.853 - 46,924 Emory University T234783 Pass Through 93.853 - 11,522 Free Flow Medical Devices R41NS103704 Pass Through 93.853 - 60,104 Henry Ford Health System B11186 Pass Through 93.853 - 96,980 Mitovation: Infant NeuroLUX: A Nov Pass Through 93.853 - 51,318 NYU 18-A0-001000938 110614 Pass Through 93.853 - 383,589 University of California 84465C Pass Through 93.853 - 3,660 University of Michigan 3003064633 Pass Through 93.853 - 17,581 University of Michigan 3003064633 Pass Through 93.853 - 23,645 University of Michigan 3003114601 Pass Through 93.853 - (334) University of Michigan 3003263762 Pass Through 93.853 - 20,445 University of Michigan 3003263762 Beaumont Hosp Pass Through 93.853 - 2,470 University of Michigan 3003603781 Pass Through 93.853 - 44,964 University of Michigan 3004601384 Pass Through 93.853 - 26,259 University of Michigan 3004981455 Pass Through 93.853 - 77,136 Columbia University 9(GG011896-49) Pass Through 93.855 - 27,171 Duke University UM1AI104681 Pass Through 93.855 - (5,274) Duke University UM1AI104681 Pass Through 93.855 - 95,324 University of Wisconsin 765K015 Pass Through 93.855 - (4,857) University of Wisconsin 859K132 Pass Through 93.855 - 18,323 University of Nevada Las Vegas GR05668 Pass Through 93.855 - 195,238 University of Alabama at Birmingham 000504111-002A04 Pass Through 93.855 - 143,145 Harvard University 133233-5068504 Pass Through 93.859 - 37,403 Northwestern University 60041058 Pass Through 93.859 - 26,408 University of Pittsburgh 0026281(123833-12) Pass Through 93.859 - (860) Washington University WU-16-73 Pass Through 93.859 - 4,788 ART LLC R43HD092295 Pass Through 93.865 - (1,885) ART LLC R43HD094405 Pass Through 93.865 - 24,894 Augusta University 29820-4 Pass Through 93.865 - 39,189 Augusta University 31475-1 Pass Through 93.865 - 22,984 Augusta University 31477-1 2018 Pass Through 93.865 - 11,041 Augusta University 31477-1 2019 Pass Through 93.865 - 15,012 Florida State University R02029 Pass Through 93.865 - 255,950 Florida State University R02066 Pass Through 93.865 - 35,054 Florida State University R02099 Pass Through 93.865 - 4,678 Florida State University R02149 Pass Through 93.865 - 20,245 Florida State University R02160 Pass Through 93.865 - 81,056 Henry Ford Health System B11136 Pass Through 93.865 - 10,757 Indiana University IN4684930 Pass Through 93.865 - 64,942 Michigan State University RC108011 Pass Through 93.865 - 17,902 Research Institute at Nationwide Hospital #719715 Pass Through 93.865 - 4,433 RTI International 0216651 Pass Through 93.865 - 53,920 Tulane University 556636-3618/19 Pass Through 93.865 - 5,853 UMass OSP2018102 P0#WA00740130 Pass Through 93.865 - 59,796 University of Michigan 3005322702 Pass Through 93.865 - 13,498 University of North Carolina 5111121 Pass Through 93.865 - 58,282
Schedule of Expenditures of Federal Awards (Continued)Year Ended September 30, 2019
See notes to schedule of expenditures of federal awards. 23
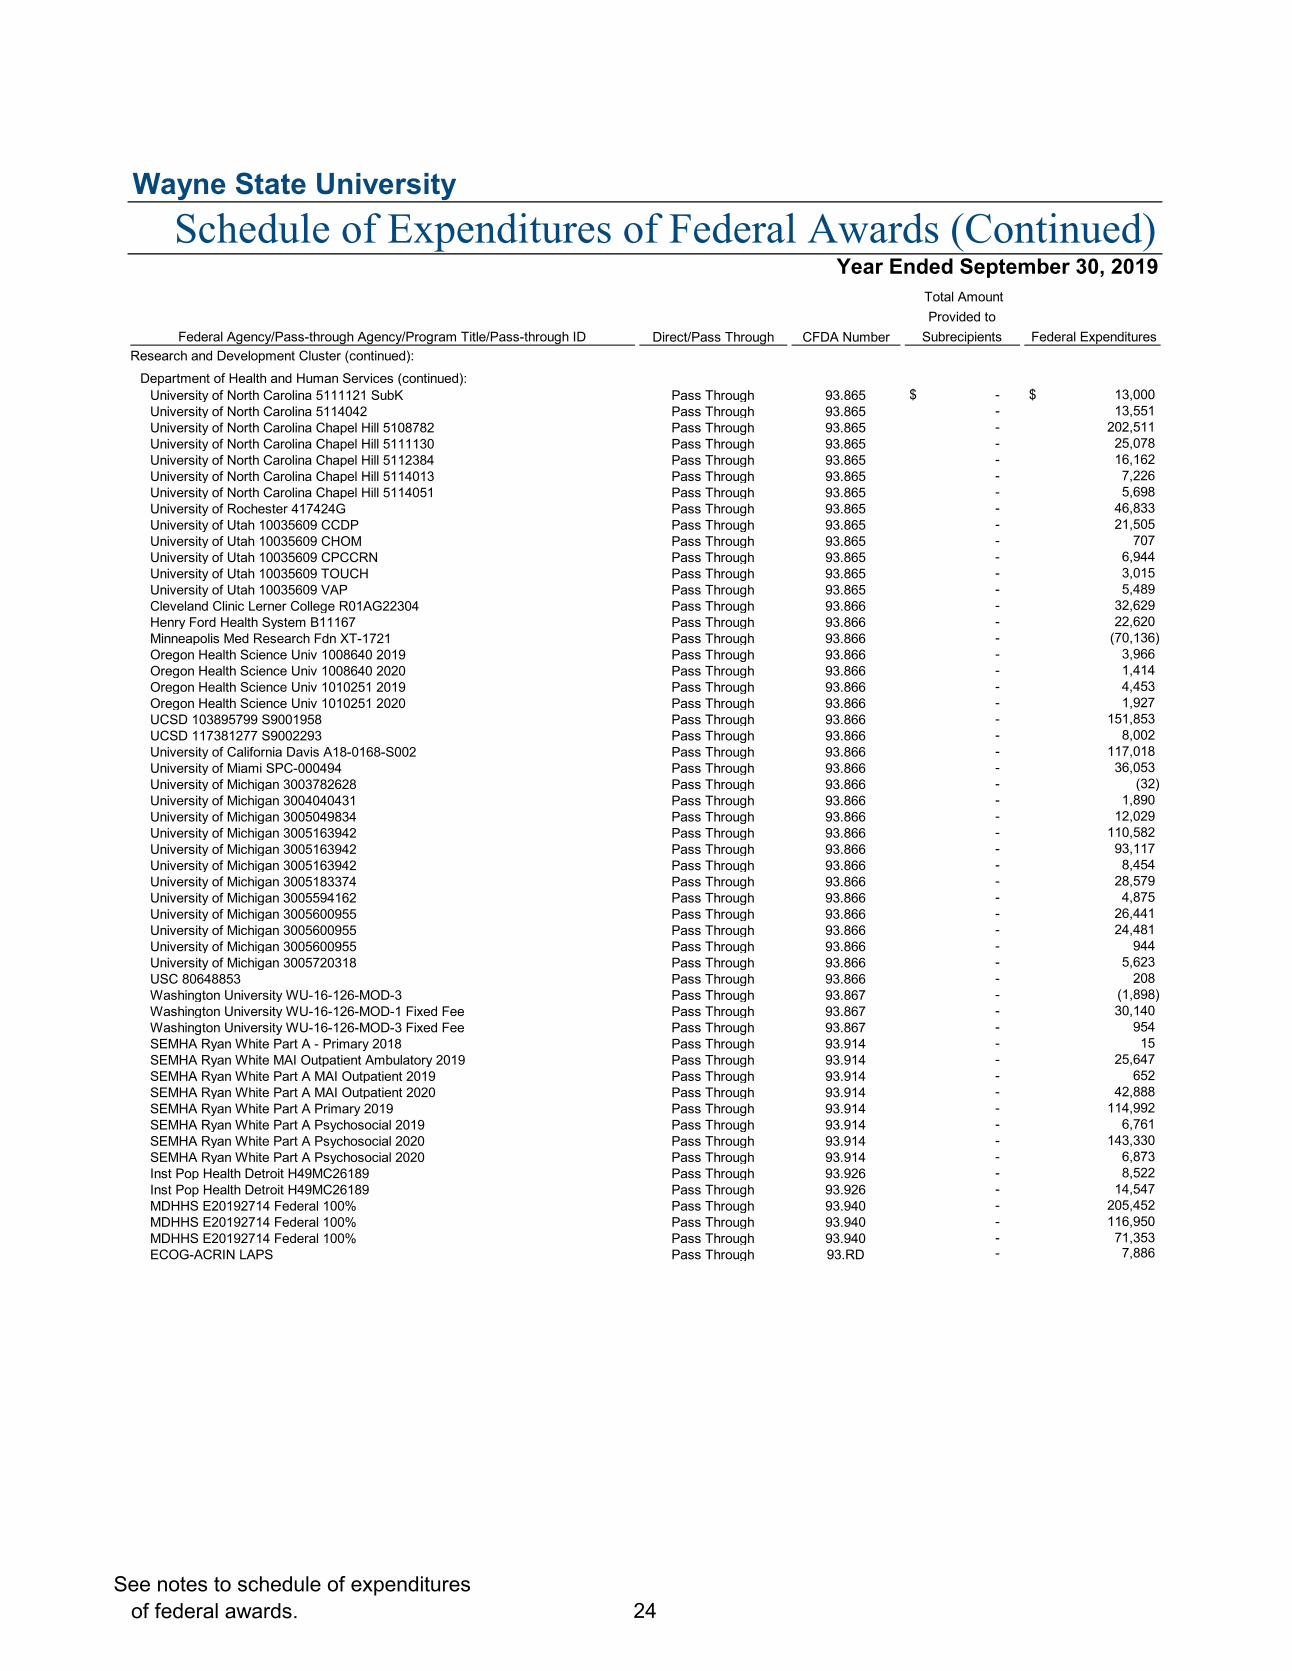
Wayne State University
Federal Agency/Pass-through Agency/Program Title/Pass-through ID Direct/Pass Through CFDA Number
Total Amount Provided to
Subrecipients Federal Expenditures Research and Development Cluster (continued):
Department of Health and Human Services (continued):University of North Carolina 5111121 SubK Pass Through 93.865 -$ 13,000$ University of North Carolina 5114042 Pass Through 93.865 - 13,551 University of North Carolina Chapel Hill 5108782 Pass Through 93.865 - 202,511 University of North Carolina Chapel Hill 5111130 Pass Through 93.865 - 25,078 University of North Carolina Chapel Hill 5112384 Pass Through 93.865 - 16,162 University of North Carolina Chapel Hill 5114013 Pass Through 93.865 - 7,226 University of North Carolina Chapel Hill 5114051 Pass Through 93.865 - 5,698 University of Rochester 417424G Pass Through 93.865 - 46,833 University of Utah 10035609 CCDP Pass Through 93.865 - 21,505 University of Utah 10035609 CHOM Pass Through 93.865 - 707 University of Utah 10035609 CPCCRN Pass Through 93.865 - 6,944 University of Utah 10035609 TOUCH Pass Through 93.865 - 3,015 University of Utah 10035609 VAP Pass Through 93.865 - 5,489 Cleveland Clinic Lerner College R01AG22304 Pass Through 93.866 - 32,629 Henry Ford Health System B11167 Pass Through 93.866 - 22,620 Minneapolis Med Research Fdn XT-1721 Pass Through 93.866 - (70,136) Oregon Health Science Univ 1008640 2019 Pass Through 93.866 - 3,966 Oregon Health Science Univ 1008640 2020 Pass Through 93.866 - 1,414 Oregon Health Science Univ 1010251 2019 Pass Through 93.866 - 4,453 Oregon Health Science Univ 1010251 2020 Pass Through 93.866 - 1,927 UCSD 103895799 S9001958 Pass Through 93.866 - 151,853 UCSD 117381277 S9002293 Pass Through 93.866 - 8,002 University of California Davis A18-0168-S002 Pass Through 93.866 - 117,018 University of Miami SPC-000494 Pass Through 93.866 - 36,053 University of Michigan 3003782628 Pass Through 93.866 - (32) University of Michigan 3004040431 Pass Through 93.866 - 1,890 University of Michigan 3005049834 Pass Through 93.866 - 12,029 University of Michigan 3005163942 Pass Through 93.866 - 110,582 University of Michigan 3005163942 Pass Through 93.866 - 93,117 University of Michigan 3005163942 Pass Through 93.866 - 8,454 University of Michigan 3005183374 Pass Through 93.866 - 28,579 University of Michigan 3005594162 Pass Through 93.866 - 4,875 University of Michigan 3005600955 Pass Through 93.866 - 26,441 University of Michigan 3005600955 Pass Through 93.866 - 24,481 University of Michigan 3005600955 Pass Through 93.866 - 944 University of Michigan 3005720318 Pass Through 93.866 - 5,623 USC 80648853 Pass Through 93.866 - 208 Washington University WU-16-126-MOD-3 Pass Through 93.867 - (1,898) Washington University WU-16-126-MOD-1 Fixed Fee Pass Through 93.867 - 30,140 Washington University WU-16-126-MOD-3 Fixed Fee Pass Through 93.867 - 954 SEMHA Ryan White Part A - Primary 2018 Pass Through 93.914 - 15 SEMHA Ryan White MAI Outpatient Ambulatory 2019 Pass Through 93.914 - 25,647 SEMHA Ryan White Part A MAI Outpatient 2019 Pass Through 93.914 - 652 SEMHA Ryan White Part A MAI Outpatient 2020 Pass Through 93.914 - 42,888 SEMHA Ryan White Part A Primary 2019 Pass Through 93.914 - 114,992 SEMHA Ryan White Part A Psychosocial 2019 Pass Through 93.914 - 6,761 SEMHA Ryan White Part A Psychosocial 2020 Pass Through 93.914 - 143,330 SEMHA Ryan White Part A Psychosocial 2020 Pass Through 93.914 - 6,873 Inst Pop Health Detroit H49MC26189 Pass Through 93.926 - 8,522 Inst Pop Health Detroit H49MC26189 Pass Through 93.926 - 14,547 MDHHS E20192714 Federal 100% Pass Through 93.940 - 205,452 MDHHS E20192714 Federal 100% Pass Through 93.940 - 116,950 MDHHS E20192714 Federal 100% Pass Through 93.940 - 71,353 ECOG-ACRIN LAPS Pass Through 93.RD - 7,886
Schedule of Expenditures of Federal Awards (Continued)Year Ended September 30, 2019
See notes to schedule of expenditures of federal awards. 24
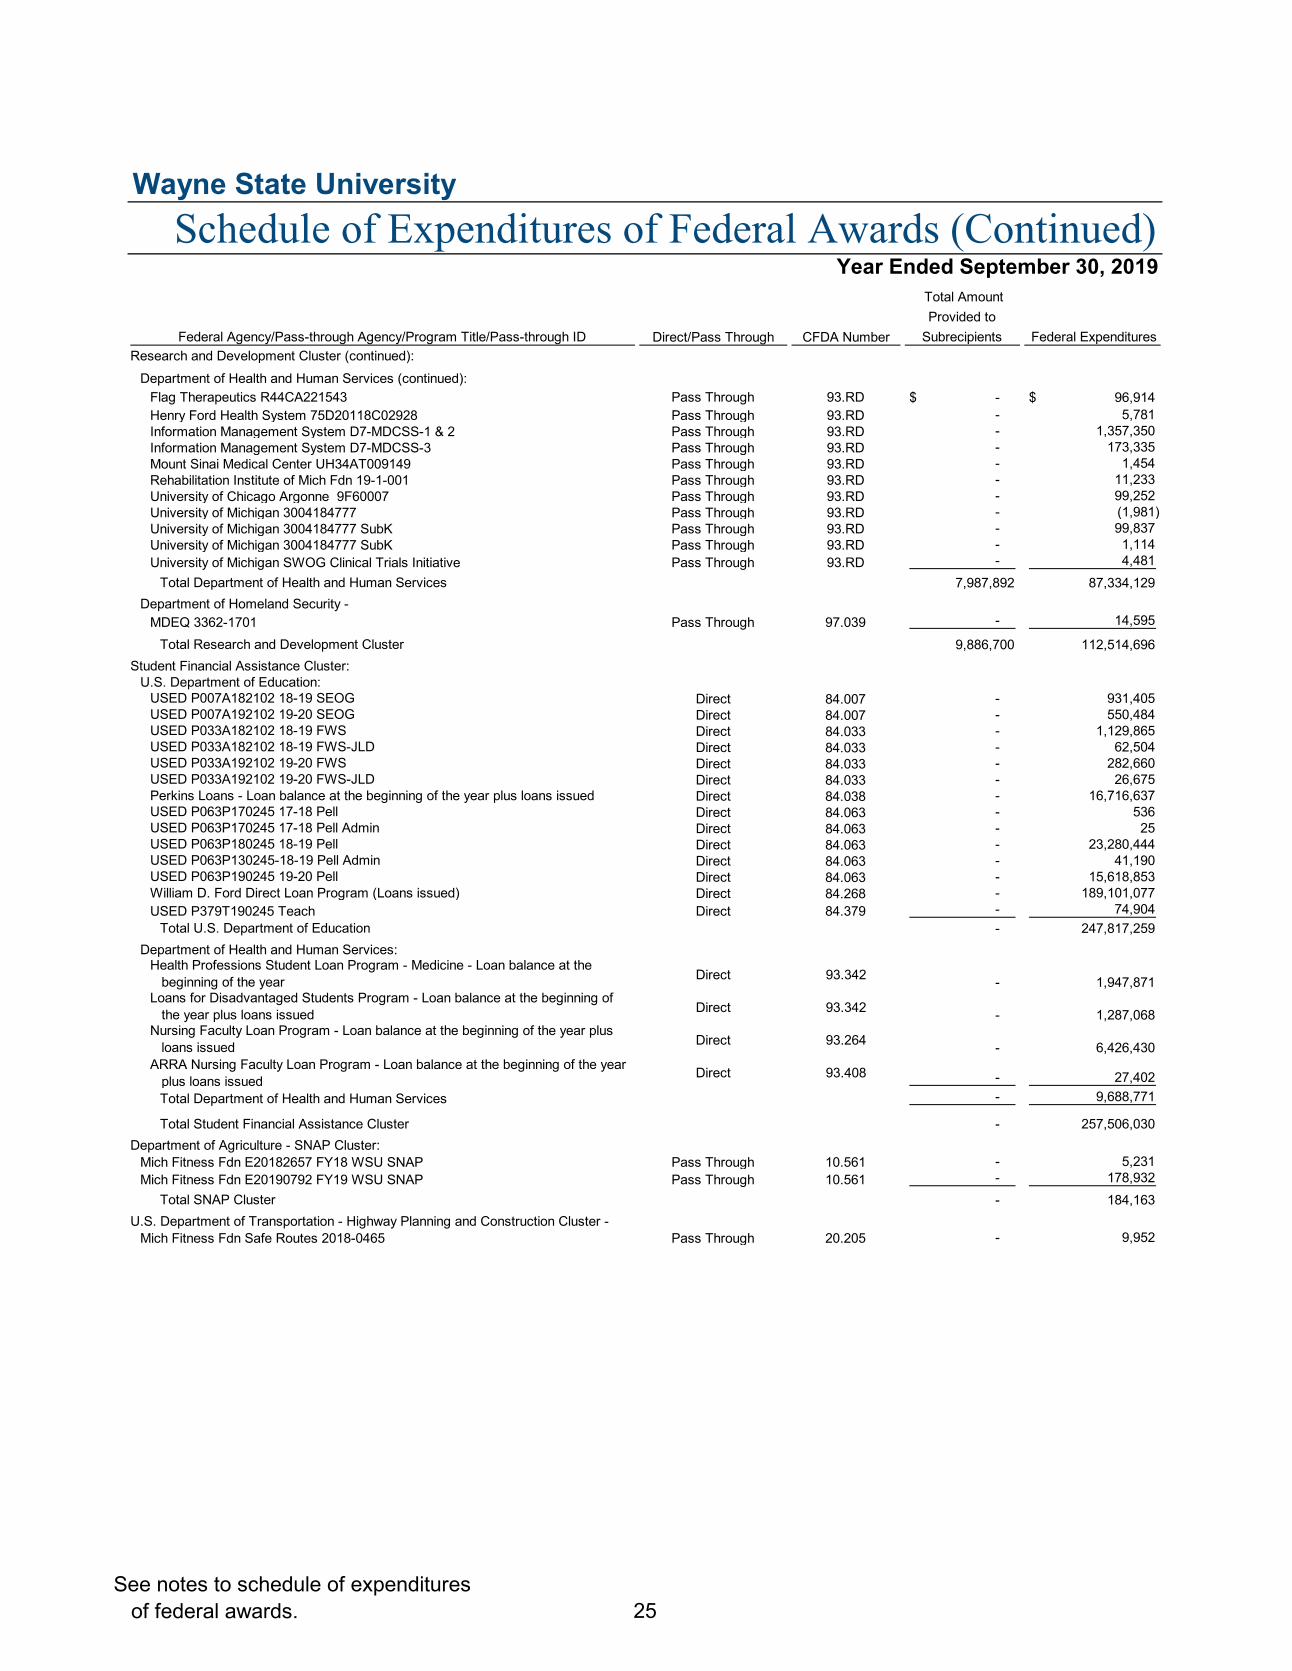
Wayne State University
Federal Agency/Pass-through Agency/Program Title/Pass-through ID Direct/Pass Through CFDA Number
Total Amount Provided to
Subrecipients Federal Expenditures Research and Development Cluster (continued):
Department of Health and Human Services (continued):Flag Therapeutics R44CA221543 Pass Through 93.RD -$ 96,914$ Henry Ford Health System 75D20118C02928 Pass Through 93.RD - 5,781 Information Management System D7-MDCSS-1 & 2 Pass Through 93.RD - 1,357,350 Information Management System D7-MDCSS-3 Pass Through 93.RD - 173,335 Mount Sinai Medical Center UH34AT009149 Pass Through 93.RD - 1,454 Rehabilitation Institute of Mich Fdn 19-1-001 Pass Through 93.RD - 11,233 University of Chicago Argonne 9F60007 Pass Through 93.RD - 99,252 University of Michigan 3004184777 Pass Through 93.RD - (1,981) University of Michigan 3004184777 SubK Pass Through 93.RD - 99,837 University of Michigan 3004184777 SubK Pass Through 93.RD - 1,114 University of Michigan SWOG Clinical Trials Initiative Pass Through 93.RD - 4,481
Total Department of Health and Human Services 7,987,892 87,334,129 Department of Homeland Security -
MDEQ 3362-1701 Pass Through 97.039 - 14,595
Total Research and Development Cluster 9,886,700 112,514,696 Student Financial Assistance Cluster:
U.S. Department of Education:USED P007A182102 18-19 SEOG Direct 84.007 - 931,405 USED P007A192102 19-20 SEOG Direct 84.007 - 550,484 USED P033A182102 18-19 FWS Direct 84.033 - 1,129,865 USED P033A182102 18-19 FWS-JLD Direct 84.033 - 62,504 USED P033A192102 19-20 FWS Direct 84.033 - 282,660 USED P033A192102 19-20 FWS-JLD Direct 84.033 - 26,675 Perkins Loans - Loan balance at the beginning of the year plus loans issued Direct 84.038 - 16,716,637 USED P063P170245 17-18 Pell Direct 84.063 - 536 USED P063P170245 17-18 Pell Admin Direct 84.063 - 25 USED P063P180245 18-19 Pell Direct 84.063 - 23,280,444 USED P063P130245-18-19 Pell Admin Direct 84.063 - 41,190 USED P063P190245 19-20 Pell Direct 84.063 - 15,618,853 William D. Ford Direct Loan Program (Loans issued) Direct 84.268 - 189,101,077 USED P379T190245 Teach Direct 84.379 - 74,904
Total U.S. Department of Education - 247,817,259 Department of Health and Human Services:
Health Professions Student Loan Program - Medicine - Loan balance at the beginning of the year Direct 93.342 - 1,947,871 Loans for Disadvantaged Students Program - Loan balance at the beginning of the year plus loans issued Direct 93.342 - 1,287,068 Nursing Faculty Loan Program - Loan balance at the beginning of the year plus loans issued Direct 93.264 - 6,426,430 ARRA Nursing Faculty Loan Program - Loan balance at the beginning of the year plus loans issued Direct 93.408 - 27,402
Total Department of Health and Human Services - 9,688,771
Total Student Financial Assistance Cluster - 257,506,030 Department of Agriculture - SNAP Cluster:
Mich Fitness Fdn E20182657 FY18 WSU SNAP Pass Through 10.561 - 5,231 Mich Fitness Fdn E20190792 FY19 WSU SNAP Pass Through 10.561 - 178,932
Total SNAP Cluster - 184,163 U.S. Department of Transportation - Highway Planning and Construction Cluster -
Mich Fitness Fdn Safe Routes 2018-0465 Pass Through 20.205 - 9,952
Schedule of Expenditures of Federal Awards (Continued)Year Ended September 30, 2019
See notes to schedule of expenditures of federal awards. 25
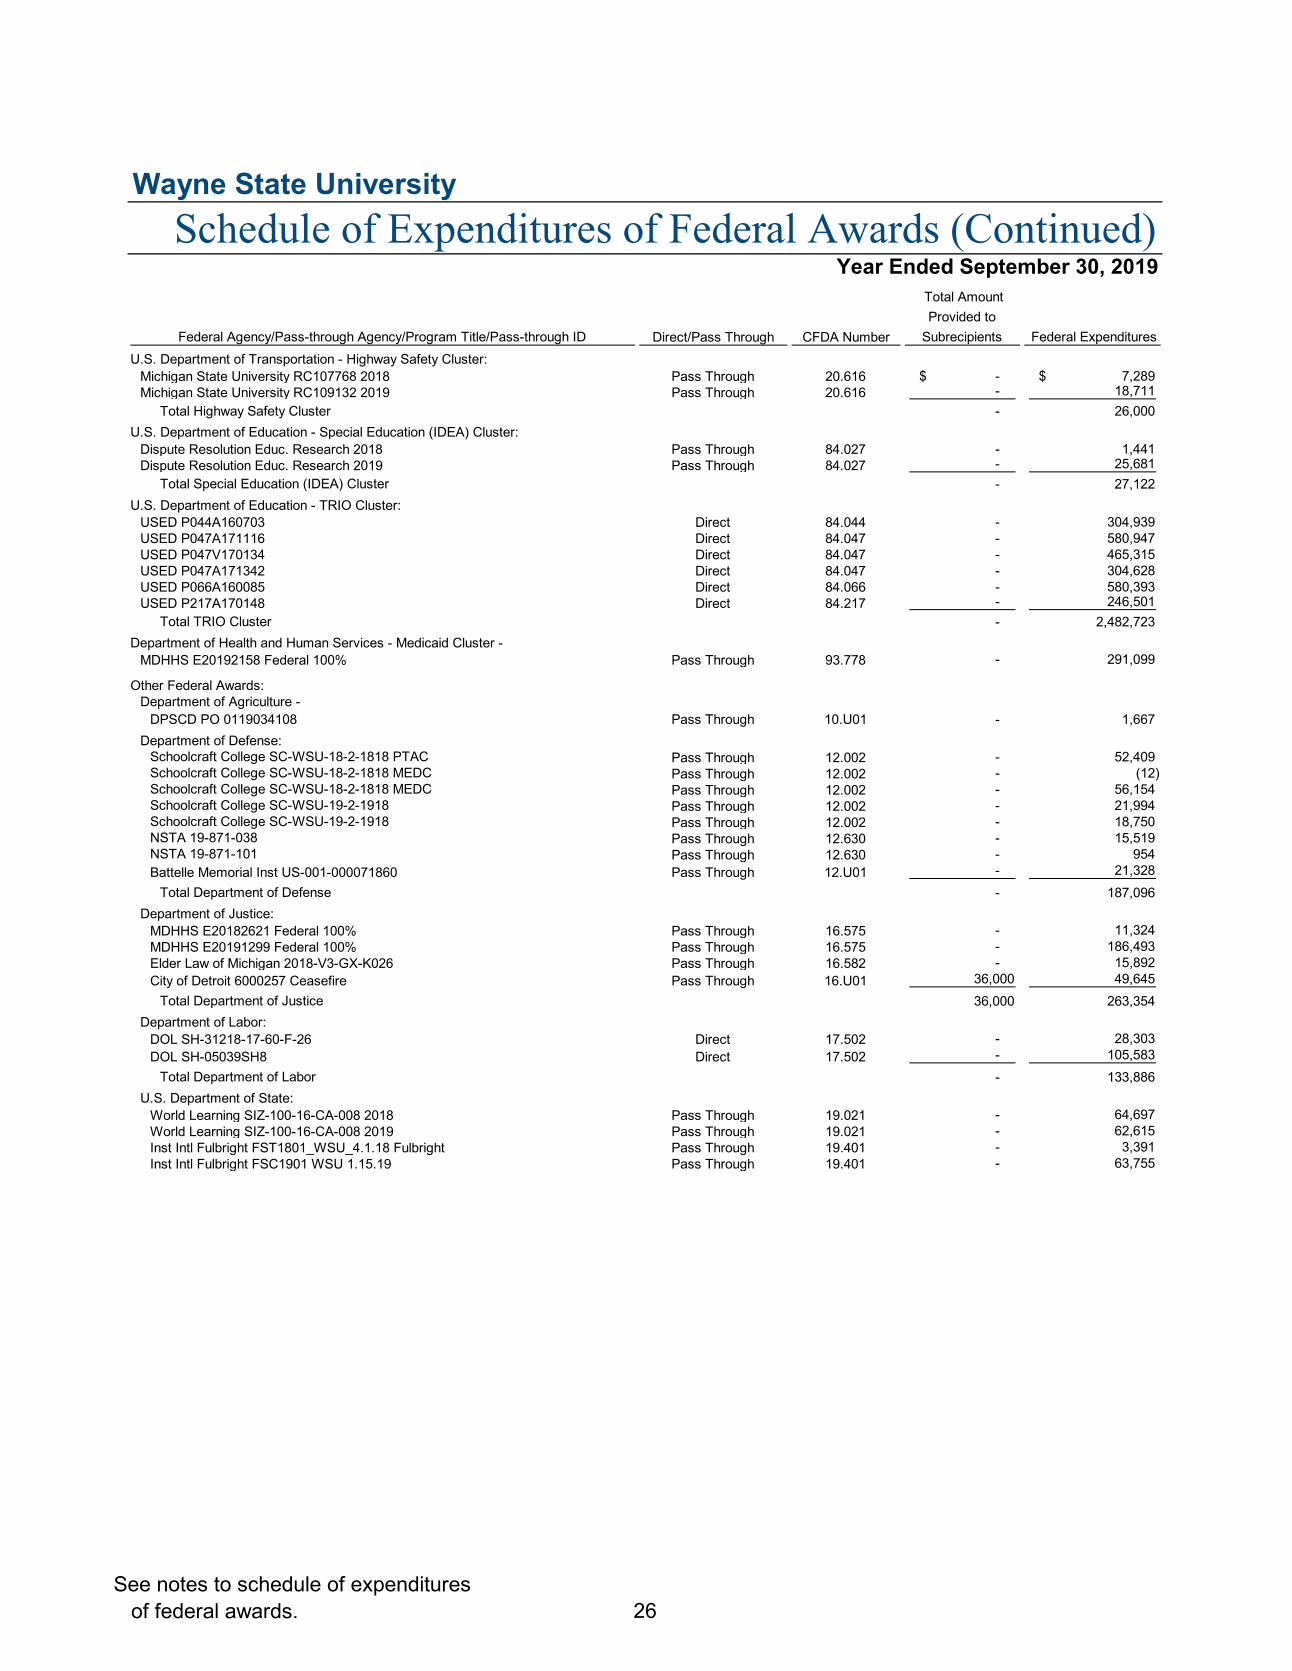
Wayne State University
Federal Agency/Pass-through Agency/Program Title/Pass-through ID Direct/Pass Through CFDA Number
Total Amount Provided to
Subrecipients Federal Expenditures U.S. Department of Transportation - Highway Safety Cluster:
Michigan State University RC107768 2018 Pass Through 20.616 -$ 7,289$ Michigan State University RC109132 2019 Pass Through 20.616 - 18,711
Total Highway Safety Cluster - 26,000 U.S. Department of Education - Special Education (IDEA) Cluster:
Dispute Resolution Educ. Research 2018 Pass Through 84.027 - 1,441 Dispute Resolution Educ. Research 2019 Pass Through 84.027 - 25,681
Total Special Education (IDEA) Cluster - 27,122 U.S. Department of Education - TRIO Cluster:
USED P044A160703 Direct 84.044 - 304,939 USED P047A171116 Direct 84.047 - 580,947 USED P047V170134 Direct 84.047 - 465,315 USED P047A171342 Direct 84.047 - 304,628 USED P066A160085 Direct 84.066 - 580,393 USED P217A170148 Direct 84.217 - 246,501
Total TRIO Cluster - 2,482,723 Department of Health and Human Services - Medicaid Cluster -
MDHHS E20192158 Federal 100% Pass Through 93.778 - 291,099
Other Federal Awards:Department of Agriculture -
DPSCD PO 0119034108 Pass Through 10.U01 - 1,667 Department of Defense:
Schoolcraft College SC-WSU-18-2-1818 PTAC Pass Through 12.002 - 52,409 Schoolcraft College SC-WSU-18-2-1818 MEDC Pass Through 12.002 - (12) Schoolcraft College SC-WSU-18-2-1818 MEDC Pass Through 12.002 - 56,154 Schoolcraft College SC-WSU-19-2-1918 Pass Through 12.002 - 21,994 Schoolcraft College SC-WSU-19-2-1918 Pass Through 12.002 - 18,750 NSTA 19-871-038 Pass Through 12.630 - 15,519 NSTA 19-871-101 Pass Through 12.630 - 954 Battelle Memorial Inst US-001-000071860 Pass Through 12.U01 - 21,328
Total Department of Defense - 187,096 Department of Justice:
MDHHS E20182621 Federal 100% Pass Through 16.575 - 11,324 MDHHS E20191299 Federal 100% Pass Through 16.575 - 186,493 Elder Law of Michigan 2018-V3-GX-K026 Pass Through 16.582 - 15,892 City of Detroit 6000257 Ceasefire Pass Through 16.U01 36,000 49,645
Total Department of Justice 36,000 263,354 Department of Labor:
DOL SH-31218-17-60-F-26 Direct 17.502 - 28,303 DOL SH-05039SH8 Direct 17.502 - 105,583
Total Department of Labor - 133,886 U.S. Department of State:
World Learning SIZ-100-16-CA-008 2018 Pass Through 19.021 - 64,697 World Learning SIZ-100-16-CA-008 2019 Pass Through 19.021 - 62,615 Inst Intl Fulbright FST1801_WSU_4.1.18 Fulbright Pass Through 19.401 - 3,391 Inst Intl Fulbright FSC1901 WSU 1.15.19 Pass Through 19.401 - 63,755
Year Ended September 30, 2019Schedule of Expenditures of Federal Awards (Continued)
See notes to schedule of expenditures of federal awards. 26

Wayne State University
Federal Agency/Pass-through Agency/Program Title/Pass-through ID Direct/Pass Through CFDA Number
Total Amount Provided to
Subrecipients Federal Expenditures Other Federal Awards (continued):
U.S. Department of State (continued):Inst Intl Fulbright FST1901 WSU 4.1.19 Pass Through 19.401 -$ 85,302$
Total U.S. Department of State - 279,760 National Aeronautics and Space Administration -
University of Michigan 3005533896 Pass Through 43.008 - 4,495 National Endowment for the Arts and Humanities:
NEA 1853142-79-19 Direct 45.024 - 10,000 NEH PF-255848-17 Direct 45.130 - 26,278 NEH FEL-257881-18 Direct 45.160 - 34,906 MCACA 18PS4225AC Pass Through 45.025 - 82 MDOE LS-00-16-0023-17 Pass Through 45.310 - 31,528
Total National Endowment for the Arts and Humanities - 102,794 Environmental Protection Agency -
Mich Tech University 1604013Z1 Pass Through 66.951 - 1,825 U.S. Department of Energy -
Brookhaven Science Associates 359161 Pass Through 81.U01 - 35,724 U.S. Department of Education:
USED P335A130090 Direct 84.335 - 5,961 USED P335A170040 Direct 84.335 - 52,850 USED P335A170040 Direct 84.335 - 188,747 MI Dept of Talent & Econ Devl 191130-191929 Pass Through 84.002 - 104,938 MI Dept of Talent & Econ Devl FY20 Pass Through 84.002 - 8,274 MDOE 181320-QCIP5 Pass Through 84.181 - 35,853 MDOE 191320- 1819 Pass Through 84.181 - 337,249 MDOE 192110-I14080 Pass Through 84.287 - 497,249 MDOE 192110-I14081 Pass Through 84.287 - 503,064 MDOE 192110-J17016 Pass Through 84.287 - 403,325 MDOE 192110-K181583 Pass Through 84.287 - 532,372 MDOE 192110-L194312 Pass Through 84.287 - 127,730 MDOE 192110-L194313 Pass Through 84.287 - 148,581 MDOE 192110-L194314 Pass Through 84.287 - 153,114 MDOE 202110-J17016 Pass Through 84.287 - 136,322 MDOE 202110-K181583 Pass Through 84.287 - 143,039 Mi Gear Up (Federal Funds) FY17/18 Pass Through 84.334 - 30,756 MDOE 170290-005 Pass Through 84.367 - 35,006 Arc Mi Family Alliance Evaluation Pass Through 84.U01 - 57,484
Total U.S. Department of Education - 3,501,914 U.S. Department of Health and Human Services:
HRSA U77 HP26852-05 AHEC Central & Eastern Area Health Direct 93.107 19,534 19,534 HRSA U77 HP26852-05 AHEC Covenant Comm Care Direct 93.107 30,954 30,954 HRSA U77 HP26852-05 AHEC Northern Mich Direct 93.107 37,980 37,980 HRSA U77 HP26852-05 AHEC Point Direct 93.107 - (13,085) HRSA U77 HP26852-05 AHEC Western Mich Direct 93.107 21,081 21,081 HRSA U77 HP26852-06 AHEC Direct 93.107 - 252,355 HRSA U77 HP26852-06 AHEC Direct 93.107 - 17,313 HRSA U77 HP26852-06 AHEC Central&Eastern Area Direct 93.107 106,075 106,075 HRSA U77 HP26852-06 AHEC Covenant Care Direct 93.107 83,271 90,015
Schedule of Expenditures of Federal Awards (Continued)Year Ended September 30, 2019
See notes to schedule of expenditures of federal awards. 27
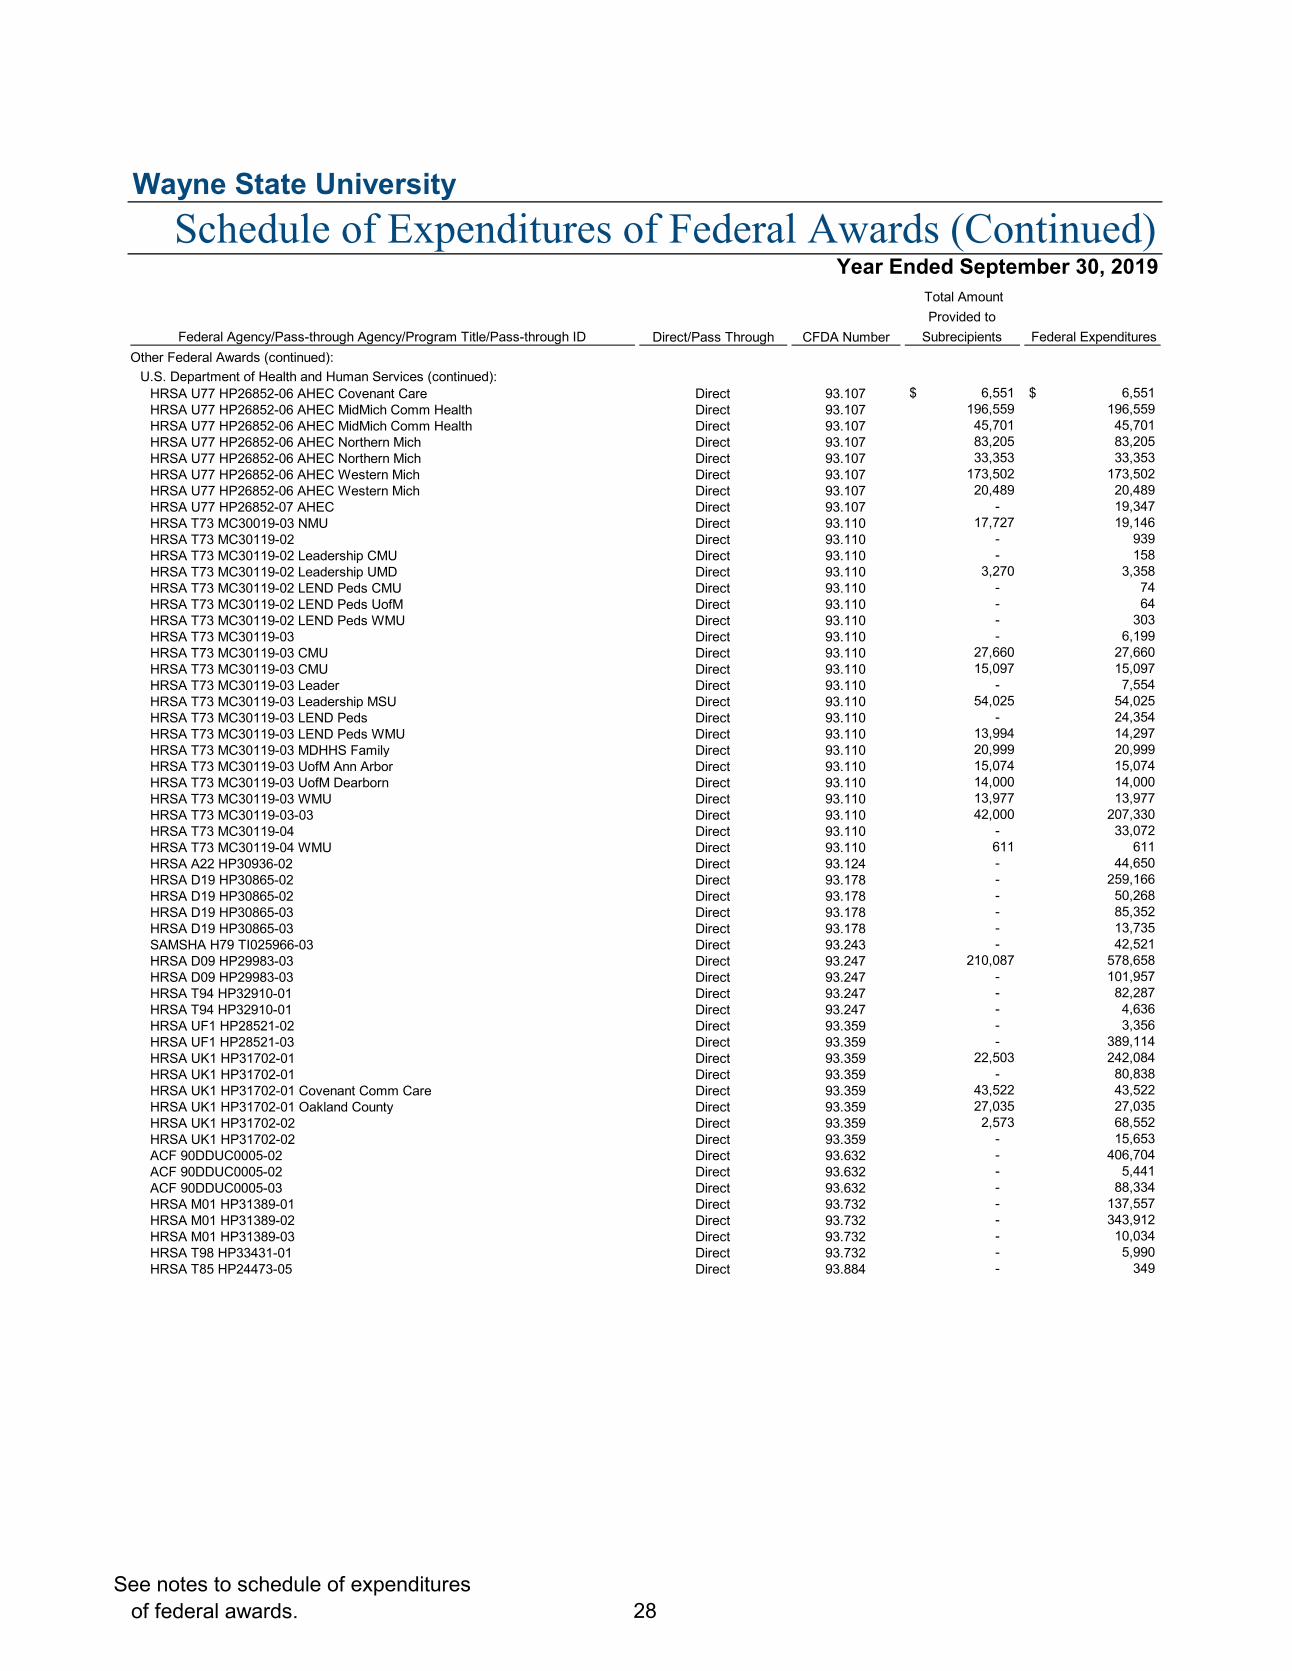
Wayne State University
Federal Agency/Pass-through Agency/Program Title/Pass-through ID Direct/Pass Through CFDA Number
Total Amount Provided to
Subrecipients Federal Expenditures Other Federal Awards (continued):
U.S. Department of Health and Human Services (continued):HRSA U77 HP26852-06 AHEC Covenant Care Direct 93.107 6,551$ 6,551$ HRSA U77 HP26852-06 AHEC MidMich Comm Health Direct 93.107 196,559 196,559 HRSA U77 HP26852-06 AHEC MidMich Comm Health Direct 93.107 45,701 45,701 HRSA U77 HP26852-06 AHEC Northern Mich Direct 93.107 83,205 83,205 HRSA U77 HP26852-06 AHEC Northern Mich Direct 93.107 33,353 33,353 HRSA U77 HP26852-06 AHEC Western Mich Direct 93.107 173,502 173,502 HRSA U77 HP26852-06 AHEC Western Mich Direct 93.107 20,489 20,489 HRSA U77 HP26852-07 AHEC Direct 93.107 - 19,347 HRSA T73 MC30019-03 NMU Direct 93.110 17,727 19,146 HRSA T73 MC30119-02 Direct 93.110 - 939 HRSA T73 MC30119-02 Leadership CMU Direct 93.110 - 158 HRSA T73 MC30119-02 Leadership UMD Direct 93.110 3,270 3,358 HRSA T73 MC30119-02 LEND Peds CMU Direct 93.110 - 74 HRSA T73 MC30119-02 LEND Peds UofM Direct 93.110 - 64 HRSA T73 MC30119-02 LEND Peds WMU Direct 93.110 - 303 HRSA T73 MC30119-03 Direct 93.110 - 6,199 HRSA T73 MC30119-03 CMU Direct 93.110 27,660 27,660 HRSA T73 MC30119-03 CMU Direct 93.110 15,097 15,097 HRSA T73 MC30119-03 Leader Direct 93.110 - 7,554 HRSA T73 MC30119-03 Leadership MSU Direct 93.110 54,025 54,025 HRSA T73 MC30119-03 LEND Peds Direct 93.110 - 24,354 HRSA T73 MC30119-03 LEND Peds WMU Direct 93.110 13,994 14,297 HRSA T73 MC30119-03 MDHHS Family Direct 93.110 20,999 20,999 HRSA T73 MC30119-03 UofM Ann Arbor Direct 93.110 15,074 15,074 HRSA T73 MC30119-03 UofM Dearborn Direct 93.110 14,000 14,000 HRSA T73 MC30119-03 WMU Direct 93.110 13,977 13,977 HRSA T73 MC30119-03-03 Direct 93.110 42,000 207,330 HRSA T73 MC30119-04 Direct 93.110 - 33,072 HRSA T73 MC30119-04 WMU Direct 93.110 611 611 HRSA A22 HP30936-02 Direct 93.124 - 44,650 HRSA D19 HP30865-02 Direct 93.178 - 259,166 HRSA D19 HP30865-02 Direct 93.178 - 50,268 HRSA D19 HP30865-03 Direct 93.178 - 85,352 HRSA D19 HP30865-03 Direct 93.178 - 13,735 SAMSHA H79 TI025966-03 Direct 93.243 - 42,521 HRSA D09 HP29983-03 Direct 93.247 210,087 578,658 HRSA D09 HP29983-03 Direct 93.247 - 101,957 HRSA T94 HP32910-01 Direct 93.247 - 82,287 HRSA T94 HP32910-01 Direct 93.247 - 4,636 HRSA UF1 HP28521-02 Direct 93.359 - 3,356 HRSA UF1 HP28521-03 Direct 93.359 - 389,114 HRSA UK1 HP31702-01 Direct 93.359 22,503 242,084 HRSA UK1 HP31702-01 Direct 93.359 - 80,838 HRSA UK1 HP31702-01 Covenant Comm Care Direct 93.359 43,522 43,522 HRSA UK1 HP31702-01 Oakland County Direct 93.359 27,035 27,035 HRSA UK1 HP31702-02 Direct 93.359 2,573 68,552 HRSA UK1 HP31702-02 Direct 93.359 - 15,653 ACF 90DDUC0005-02 Direct 93.632 - 406,704 ACF 90DDUC0005-02 Direct 93.632 - 5,441 ACF 90DDUC0005-03 Direct 93.632 - 88,334 HRSA M01 HP31389-01 Direct 93.732 - 137,557 HRSA M01 HP31389-02 Direct 93.732 - 343,912 HRSA M01 HP31389-03 Direct 93.732 - 10,034 HRSA T98 HP33431-01 Direct 93.732 - 5,990 HRSA T85 HP24473-05 Direct 93.884 - 349
Schedule of Expenditures of Federal Awards (Continued)Year Ended September 30, 2019
See notes to schedule of expenditures of federal awards. 28
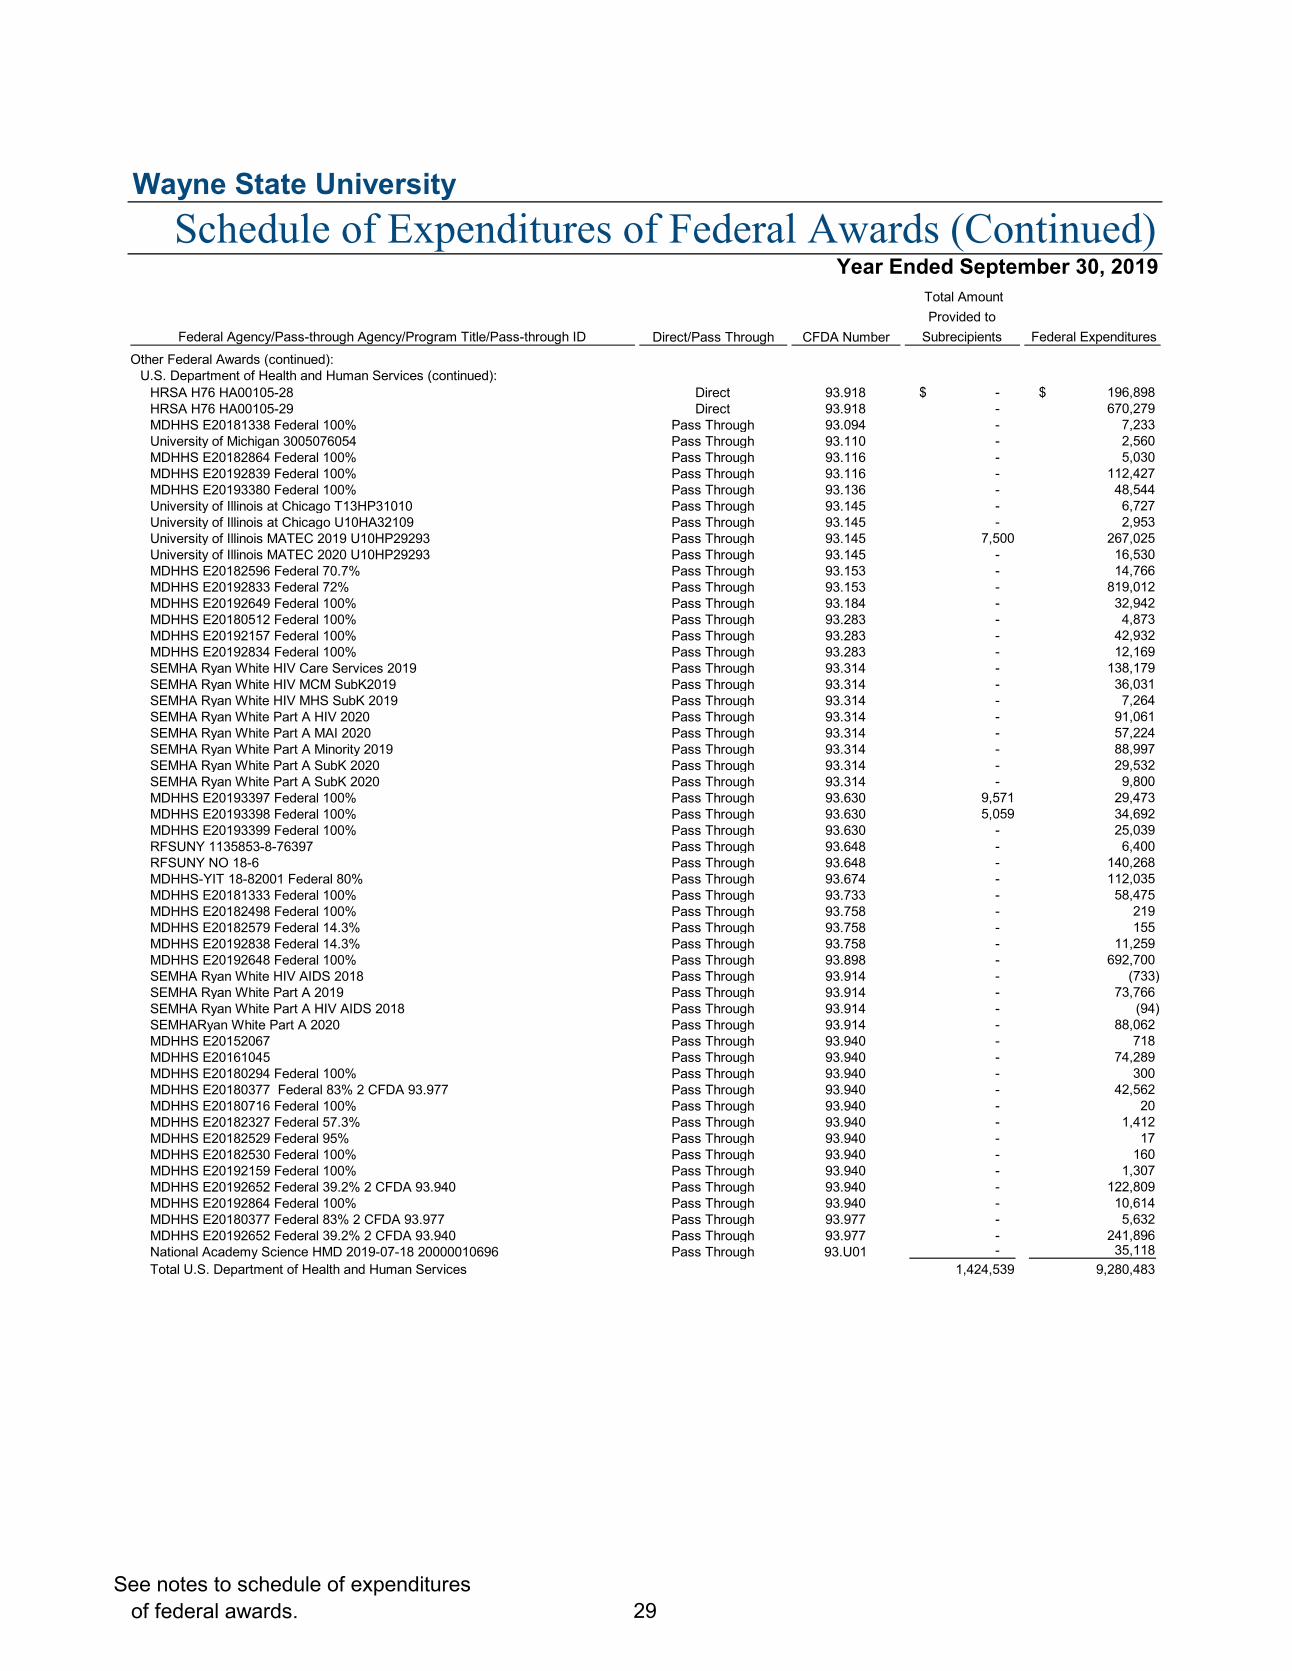
Wayne State University
Federal Agency/Pass-through Agency/Program Title/Pass-through ID Direct/Pass Through CFDA Number
Total Amount Provided to
Subrecipients Federal Expenditures Other Federal Awards (continued):
U.S. Department of Health and Human Services (continued):HRSA H76 HA00105-28 Direct 93.918 -$ 196,898$ HRSA H76 HA00105-29 Direct 93.918 - 670,279 MDHHS E20181338 Federal 100% Pass Through 93.094 - 7,233 University of Michigan 3005076054 Pass Through 93.110 - 2,560 MDHHS E20182864 Federal 100% Pass Through 93.116 - 5,030 MDHHS E20192839 Federal 100% Pass Through 93.116 - 112,427 MDHHS E20193380 Federal 100% Pass Through 93.136 - 48,544 University of Illinois at Chicago T13HP31010 Pass Through 93.145 - 6,727 University of Illinois at Chicago U10HA32109 Pass Through 93.145 - 2,953 University of Illinois MATEC 2019 U10HP29293 Pass Through 93.145 7,500 267,025 University of Illinois MATEC 2020 U10HP29293 Pass Through 93.145 - 16,530 MDHHS E20182596 Federal 70.7% Pass Through 93.153 - 14,766 MDHHS E20192833 Federal 72% Pass Through 93.153 - 819,012 MDHHS E20192649 Federal 100% Pass Through 93.184 - 32,942 MDHHS E20180512 Federal 100% Pass Through 93.283 - 4,873 MDHHS E20192157 Federal 100% Pass Through 93.283 - 42,932 MDHHS E20192834 Federal 100% Pass Through 93.283 - 12,169 SEMHA Ryan White HIV Care Services 2019 Pass Through 93.314 - 138,179 SEMHA Ryan White HIV MCM SubK2019 Pass Through 93.314 - 36,031 SEMHA Ryan White HIV MHS SubK 2019 Pass Through 93.314 - 7,264 SEMHA Ryan White Part A HIV 2020 Pass Through 93.314 - 91,061 SEMHA Ryan White Part A MAI 2020 Pass Through 93.314 - 57,224 SEMHA Ryan White Part A Minority 2019 Pass Through 93.314 - 88,997 SEMHA Ryan White Part A SubK 2020 Pass Through 93.314 - 29,532 SEMHA Ryan White Part A SubK 2020 Pass Through 93.314 - 9,800 MDHHS E20193397 Federal 100% Pass Through 93.630 9,571 29,473 MDHHS E20193398 Federal 100% Pass Through 93.630 5,059 34,692 MDHHS E20193399 Federal 100% Pass Through 93.630 - 25,039 RFSUNY 1135853-8-76397 Pass Through 93.648 - 6,400 RFSUNY NO 18-6 Pass Through 93.648 - 140,268 MDHHS-YIT 18-82001 Federal 80% Pass Through 93.674 - 112,035 MDHHS E20181333 Federal 100% Pass Through 93.733 - 58,475 MDHHS E20182498 Federal 100% Pass Through 93.758 - 219 MDHHS E20182579 Federal 14.3% Pass Through 93.758 - 155 MDHHS E20192838 Federal 14.3% Pass Through 93.758 - 11,259 MDHHS E20192648 Federal 100% Pass Through 93.898 - 692,700 SEMHA Ryan White HIV AIDS 2018 Pass Through 93.914 - (733) SEMHA Ryan White Part A 2019 Pass Through 93.914 - 73,766 SEMHA Ryan White Part A HIV AIDS 2018 Pass Through 93.914 - (94) SEMHARyan White Part A 2020 Pass Through 93.914 - 88,062 MDHHS E20152067 Pass Through 93.940 - 718 MDHHS E20161045 Pass Through 93.940 - 74,289 MDHHS E20180294 Federal 100% Pass Through 93.940 - 300 MDHHS E20180377 Federal 83% 2 CFDA 93.977 Pass Through 93.940 - 42,562 MDHHS E20180716 Federal 100% Pass Through 93.940 - 20 MDHHS E20182327 Federal 57.3% Pass Through 93.940 - 1,412 MDHHS E20182529 Federal 95% Pass Through 93.940 - 17 MDHHS E20182530 Federal 100% Pass Through 93.940 - 160 MDHHS E20192159 Federal 100% Pass Through 93.940 - 1,307 MDHHS E20192652 Federal 39.2% 2 CFDA 93.940 Pass Through 93.940 - 122,809 MDHHS E20192864 Federal 100% Pass Through 93.940 - 10,614 MDHHS E20180377 Federal 83% 2 CFDA 93.977 Pass Through 93.977 - 5,632 MDHHS E20192652 Federal 39.2% 2 CFDA 93.940 Pass Through 93.977 - 241,896 National Academy Science HMD 2019-07-18 20000010696 Pass Through 93.U01 - 35,118 Total U.S. Department of Health and Human Services 1,424,539 9,280,483
Schedule of Expenditures of Federal Awards (Continued)Year Ended September 30, 2019
See notes to schedule of expenditures of federal awards. 29
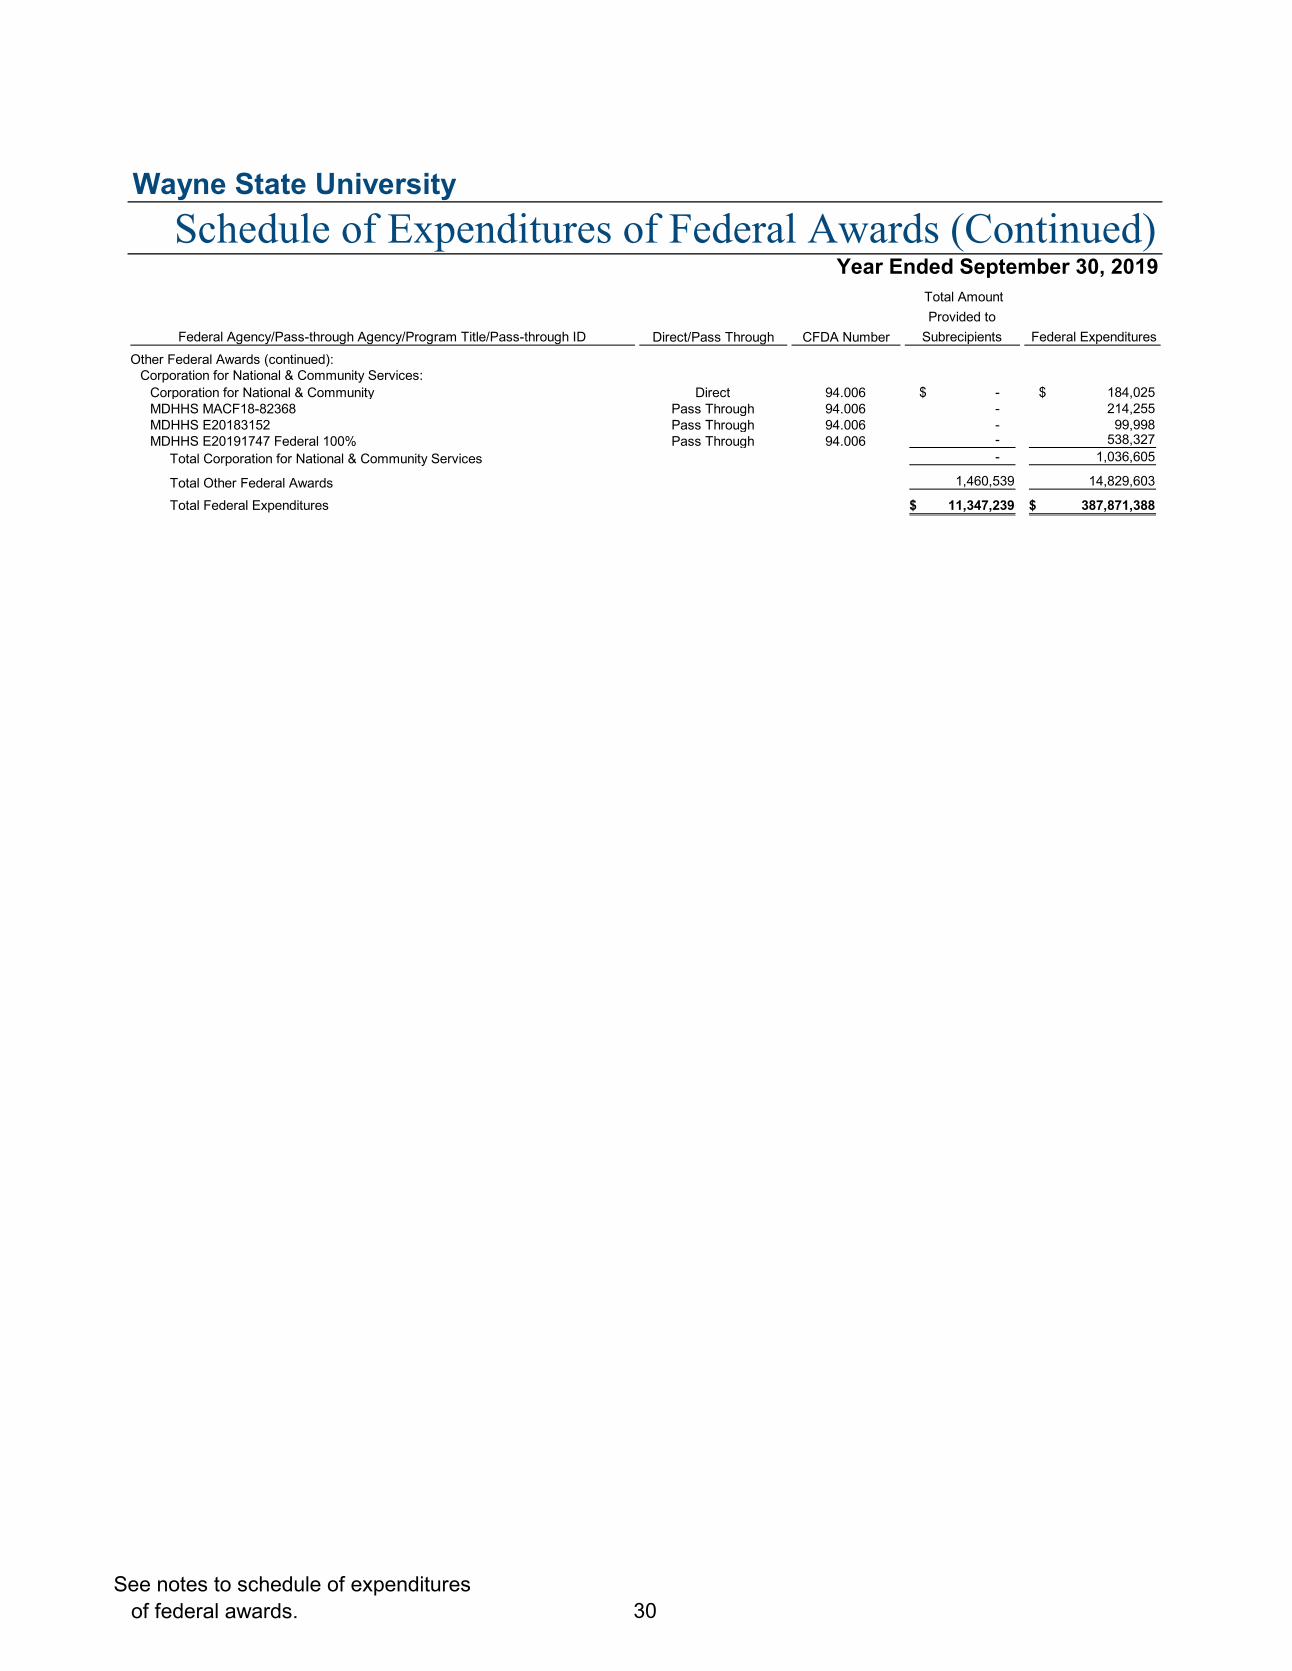
Wayne State University
Federal Agency/Pass-through Agency/Program Title/Pass-through ID Direct/Pass Through CFDA Number
Total Amount Provided to
Subrecipients Federal Expenditures Other Federal Awards (continued):
Corporation for National & Community Services:Corporation for National & Community Direct 94.006 -$ 184,025$ MDHHS MACF18-82368 Pass Through 94.006 - 214,255 MDHHS E20183152 Pass Through 94.006 - 99,998 MDHHS E20191747 Federal 100% Pass Through 94.006 - 538,327
Total Corporation for National & Community Services - 1,036,605
Total Other Federal Awards 1,460,539 14,829,603
Total Federal Expenditures 11,347,239$ 387,871,388$
Schedule of Expenditures of Federal Awards (Continued)Year Ended September 30, 2019
See notes to schedule of expenditures of federal awards. 30
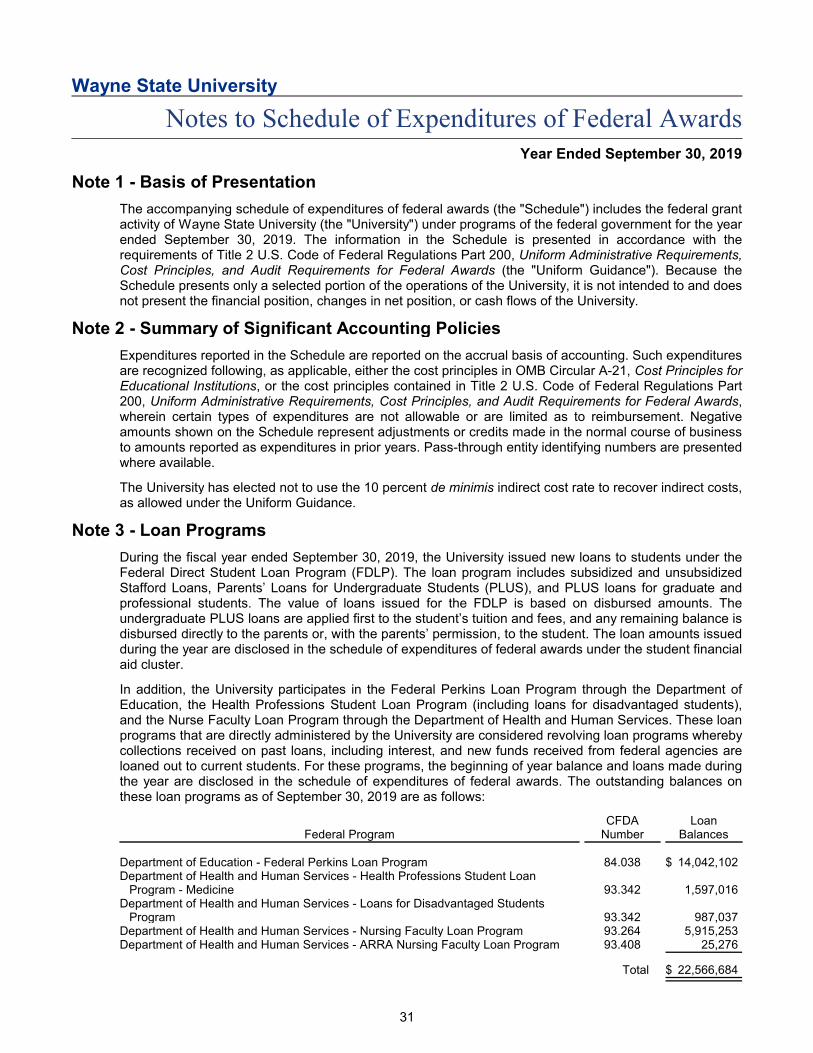
Wayne State University
Notes to Schedule of Expenditures of Federal AwardsYear Ended September 30, 2019
Note 1 - Basis of Presentation
The accompanying schedule of expenditures of federal awards (the "Schedule") includes the federal grantactivity of Wayne State University (the "University") under programs of the federal government for the yearended September 30, 2019. The information in the Schedule is presented in accordance with therequirements of Title 2 U.S. Code of Federal Regulations Part 200, Uniform Administrative Requirements,Cost Principles, and Audit Requirements for Federal Awards (the "Uniform Guidance"). Because theSchedule presents only a selected portion of the operations of the University, it is not intended to and doesnot present the financial position, changes in net position, or cash flows of the University.
Note 2 - Summary of Significant Accounting Policies
Expenditures reported in the Schedule are reported on the accrual basis of accounting. Such expendituresare recognized following, as applicable, either the cost principles in OMB Circular A-21, Cost Principles forEducational Institutions, or the cost principles contained in Title 2 U.S. Code of Federal Regulations Part200, Uniform Administrative Requirements, Cost Principles, and Audit Requirements for Federal Awards,wherein certain types of expenditures are not allowable or are limited as to reimbursement. Negativeamounts shown on the Schedule represent adjustments or credits made in the normal course of businessto amounts reported as expenditures in prior years. Pass-through entity identifying numbers are presentedwhere available.
The University has elected not to use the 10 percent de minimis indirect cost rate to recover indirect costs,as allowed under the Uniform Guidance.
Note 3 - Loan Programs
During the fiscal year ended September 30, 2019, the University issued new loans to students under theFederal Direct Student Loan Program (FDLP). The loan program includes subsidized and unsubsidizedStafford Loans, Parents’ Loans for Undergraduate Students (PLUS), and PLUS loans for graduate andprofessional students. The value of loans issued for the FDLP is based on disbursed amounts. Theundergraduate PLUS loans are applied first to the student’s tuition and fees, and any remaining balance isdisbursed directly to the parents or, with the parents’ permission, to the student. The loan amounts issuedduring the year are disclosed in the schedule of expenditures of federal awards under the student financialaid cluster.
In addition, the University participates in the Federal Perkins Loan Program through the Department ofEducation, the Health Professions Student Loan Program (including loans for disadvantaged students),and the Nurse Faculty Loan Program through the Department of Health and Human Services. These loanprograms that are directly administered by the University are considered revolving loan programs wherebycollections received on past loans, including interest, and new funds received from federal agencies areloaned out to current students. For these programs, the beginning of year balance and loans made duringthe year are disclosed in the schedule of expenditures of federal awards. The outstanding balances onthese loan programs as of September 30, 2019 are as follows:
Federal ProgramCFDA
NumberLoan
Balances
Department of Education - Federal Perkins Loan Program 84.038 $ 14,042,102Department of Health and Human Services - Health Professions Student Loan
Program - Medicine 93.342 1,597,016Department of Health and Human Services - Loans for Disadvantaged Students
Program 93.342 987,037Department of Health and Human Services - Nursing Faculty Loan Program 93.264 5,915,253Department of Health and Human Services - ARRA Nursing Faculty Loan Program 93.408 25,276
Total $ 22,566,684
31
Wayne State University
Notes to Schedule of Expenditures of Federal AwardsYear Ended September 30, 2019
Note 4 - Adjustments and Transfers
As allowable and in accordance with federal regulations issued by the U.S. Department of Education, theUniversity carried forward $198,254 of the 2017-2018 Federal Work Study (FWS) Program (84.033)award, which was spent on the FWS Program in the 2018-2019 award year. The University also carriedforward $254,762 of the 2018-2019 FWS Program award to be expended on the FWS Program in the2019-2020 award year.
The University, pursuant to federal regulations, transferred $636,905 of the 2018-2019 FWS Programaward to the Federal Supplemental Educational Opportunity Grant (FSEOG) Program (84.007), which wasspent in the 2018-2019 year. The University also carried back $89,387 of the 2019-2020 FSEOG Programaward, which was spent in the 2018-2019 award year.
Note 5 - Indirect Costs
The University had approved predetermined indirect cost rates, which are effective from October 1, 2018to September 30, 2022. The approved rates for on-campus and off-campus research were 54 and 26percent, respectively.
32

Schedule of Findings and Questioned Costs
33
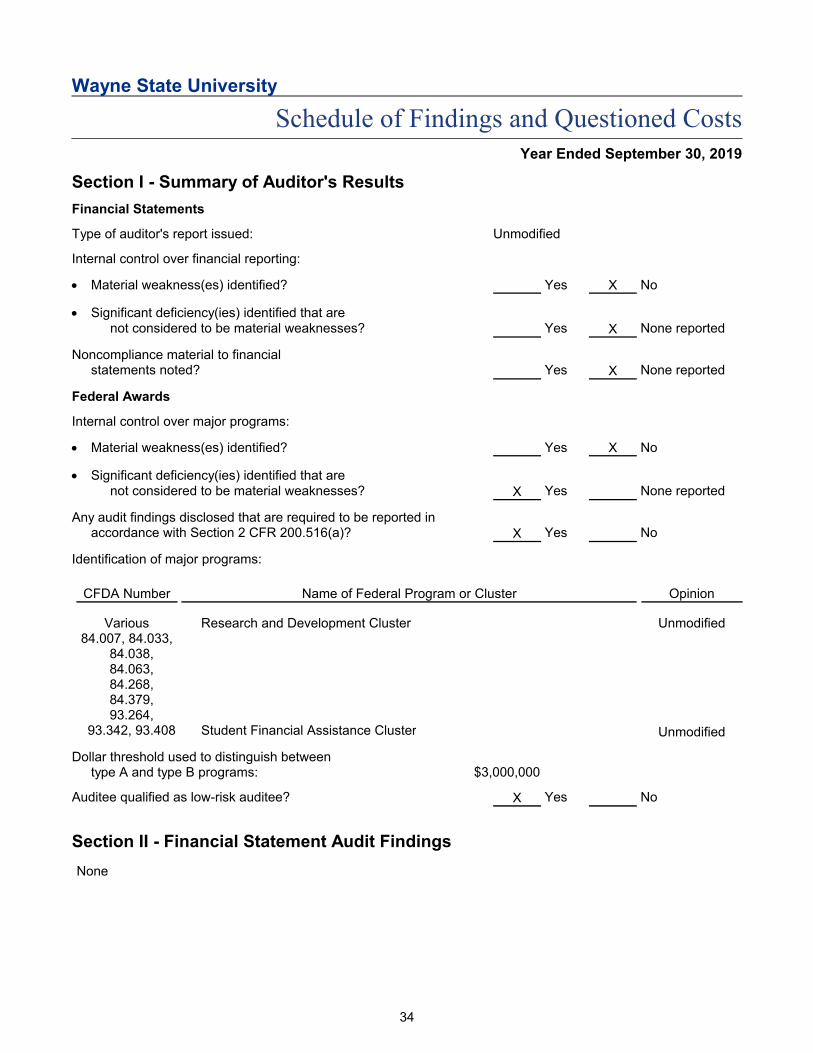
Wayne State University
Schedule of Findings and Questioned CostsYear Ended September 30, 2019
Section I - Summary of Auditor's Results
Financial Statements
Type of auditor's report issued: Unmodified
Internal control over financial reporting:
Material weakness(es) identified? Yes X No
Significant deficiency(ies) identified that arenot considered to be material weaknesses? Yes X None reported
Noncompliance material to financial statements noted? Yes X None reported
Federal Awards
Internal control over major programs:
Material weakness(es) identified? Yes X No
Significant deficiency(ies) identified that arenot considered to be material weaknesses? X Yes None reported
Any audit findings disclosed that are required to be reported in accordance with Section 2 CFR 200.516(a)? X Yes No
Identification of major programs:
CFDA Number Name of Federal Program or Cluster Opinion
Various Research and Development Cluster Unmodified84.007, 84.033,
84.038,84.063,84.268,84.379,93.264,
93.342, 93.408 Student Financial Assistance Cluster Unmodified
Dollar threshold used to distinguish between type A and type B programs: $3,000,000
Auditee qualified as low-risk auditee? X Yes No
Section II - Financial Statement Audit Findings
None
34
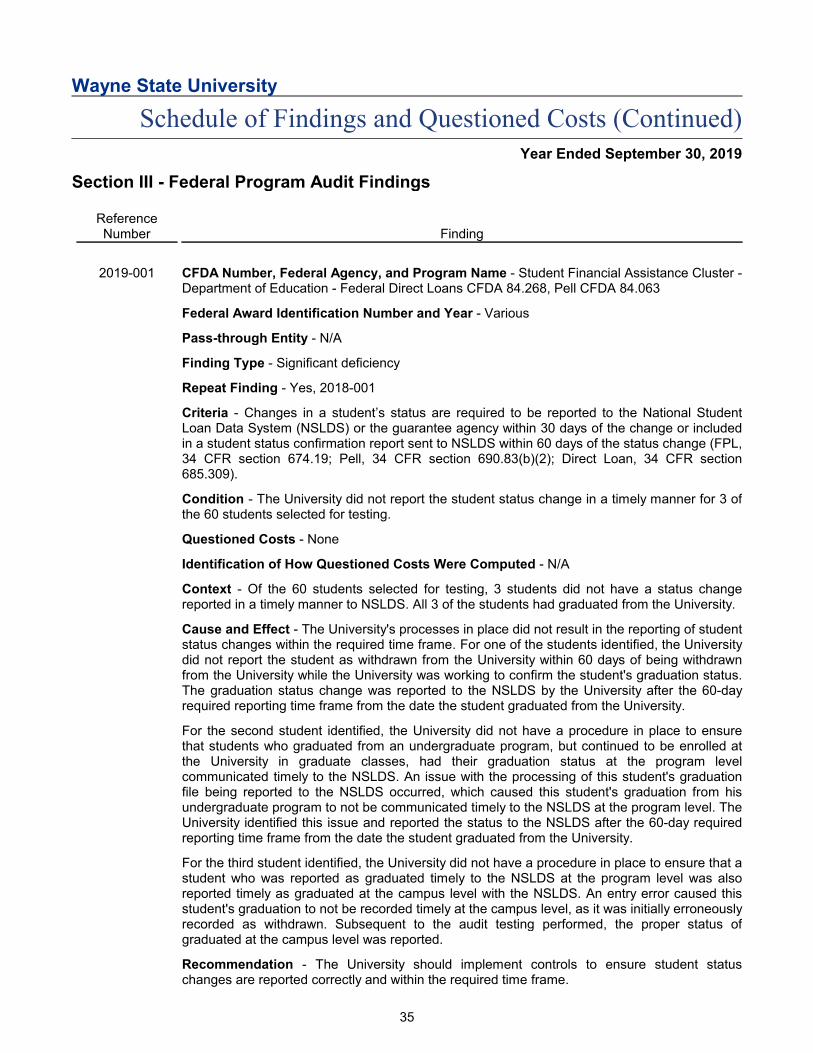
Wayne State University
Schedule of Findings and Questioned Costs (Continued)Year Ended September 30, 2019
Section III - Federal Program Audit Findings
ReferenceNumber Finding
2019-001 CFDA Number, Federal Agency, and Program Name - Student Financial Assistance Cluster -Department of Education - Federal Direct Loans CFDA 84.268, Pell CFDA 84.063
Federal Award Identification Number and Year - Various
Pass-through Entity - N/A
Finding Type - Significant deficiency
Repeat Finding - Yes, 2018-001
Criteria - Changes in a student’s status are required to be reported to the National StudentLoan Data System (NSLDS) or the guarantee agency within 30 days of the change or includedin a student status confirmation report sent to NSLDS within 60 days of the status change (FPL,34 CFR section 674.19; Pell, 34 CFR section 690.83(b)(2); Direct Loan, 34 CFR section685.309).
Condition - The University did not report the student status change in a timely manner for 3 ofthe 60 students selected for testing.
Questioned Costs - None
Identification of How Questioned Costs Were Computed - N/A
Context - Of the 60 students selected for testing, 3 students did not have a status changereported in a timely manner to NSLDS. All 3 of the students had graduated from the University.
Cause and Effect - The University's processes in place did not result in the reporting of studentstatus changes within the required time frame. For one of the students identified, the Universitydid not report the student as withdrawn from the University within 60 days of being withdrawnfrom the University while the University was working to confirm the student's graduation status.The graduation status change was reported to the NSLDS by the University after the 60-dayrequired reporting time frame from the date the student graduated from the University.
For the second student identified, the University did not have a procedure in place to ensurethat students who graduated from an undergraduate program, but continued to be enrolled atthe University in graduate classes, had their graduation status at the program levelcommunicated timely to the NSLDS. An issue with the processing of this student's graduationfile being reported to the NSLDS occurred, which caused this student's graduation from hisundergraduate program to not be communicated timely to the NSLDS at the program level. TheUniversity identified this issue and reported the status to the NSLDS after the 60-day requiredreporting time frame from the date the student graduated from the University.
For the third student identified, the University did not have a procedure in place to ensure that astudent who was reported as graduated timely to the NSLDS at the program level was alsoreported timely as graduated at the campus level with the NSLDS. An entry error caused thisstudent's graduation to not be recorded timely at the campus level, as it was initially erroneouslyrecorded as withdrawn. Subsequent to the audit testing performed, the proper status ofgraduated at the campus level was reported.
Recommendation - The University should implement controls to ensure student statuschanges are reported correctly and within the required time frame.
35

Wayne State University
Schedule of Findings and Questioned Costs (Continued)Year Ended September 30, 2019
ReferenceNumber Finding
2019-001(Cont.)
Views of Responsible Officials and Corrective Action Plan - The University concurs withthe findings and recommendations. The University is taking actions to ensure that studentstatus changes are reported to the National Student Loan Data System (NSLDS) in a timelymanner.
One student was not reported as withdrawn for the period of time the School of Medicine(SOM) was finalizing their degree certification. While the graduation was reported in a timelyfashion from the time the SOM certified the degree, the Office of the Registrar will work with theSOM to report such students as withdrawn and then update their graduation status within therequired time frame once their degree is certified.
The second student graduated from their undergraduate program, but then continued to beenrolled at the University in a graduate program. Due to a procedural error, the student’sgraduation from his undergraduate program was not reported to the NSLDS timely. TheUniversity identified this issue, and corrective measures were put into place at that time. All fileswere correctly updated, and this issue should not reoccur.
The third student was reported as graduated at the program level to the NSLDS, but theircampus level was reported as withdrawn. The student was required to be manually processedon the University’s third-party servicer’s database in order to report their graduation. There is noerror message or report to identify students in this situation. As this is not a problem with data inthe University’s administrative system, the University will work with its servicer to identifystudents in this situation for correction.
36

Summary Schedule of Prior Audit Findings
February 13, 2020
Federal Audit Clearinghouse RE: Wayne State University Summary Schedule of Prior Audit Findings Fiscal Year Ended September 30, 2019
Prior Year Finding Number: 2018‐001
Fiscal Year in Which the Finding Initially Occurred: 2015
Federal Program, CFDA Number and Name: Student Financial Assistance Cluster ‐ Department of Education ‐ Federal Pell Grants CFDA 84.063, Federal Direct Loans CFDA 84.268, Perkins CFDA 84.038
Original Finding Description: The University did not report the student status change in a timely manner for five of the 60 students selected for testing. One of the student's change to graduated status was not communicated to the National Student Loan Data System (NSLDS) until identified during the audit.
Status/Partial Corrective Action (as applicable): Partially Corrected ‐ The Office of the Registrar continues to monitor and manually report leave of absence’ students as withdrawn for the period of the leave to the National Student Clearinghouse (NSC) based on information provided by the School of Medicine (SOM) leave report. In addition, the University initiated a business process analysis of the SOM’s leave of absence policies and procedures. The current process has been documented and areas for streamlining are currently under consideration.
Planned Corrective Action: The University will continue to evaluate other long‐term solutions including the possible conversion from a term‐based to a semester‐based structure within the SOM. Until a long‐term solution is fully implemented, a dedicated staff person will be assigned to manually review all enrollment changes for the School of Medicine and report them to the NSC.
1
February 13, 2020
Wayne State University Corrective Action Plan Related to the Schedule of Findings and Questioned Costs For the Year Ended: September 30, 2019 Name of contact person responsible for planned corrective actions:
Rebecca Cooke Interim Vice President, Finance and Business Operations, Treasurer and CFO 5700 Cass Avenue Suite 4900, Academic Administration Building Detroit, Michigan 48202 Phone: (313) 577‐5580 Fax: (313) 577‐2338 Email: [email protected] Finding Number: 2019‐001 – Student Financial Assistance Cluster ‐ Department of Education ‐ Federal Direct Loans CFDA 84.268, Pell CFDA 84.063 Condition: The University did not report the student status change in a timely manner for 3 of the 60 students selected for testing. Views of Responsible Officials and Planned Corrective Action: The University concurs with the auditor’s findings and recommendations. The University is taking actions to ensure that students’ status changes are reported to the National Student Loan Data System (NSLDS) in a timely manner. One student was not reported as withdrawn for the period of time the School of Medicine (SOM) was finalizing their degree certification. While the graduation was reported in a timely fashion from the time the SOM certified the degree, the Office of the Registrar will work with the SOM to report such students as withdrawn and then update their graduation status within the required timeframe once their degree is certified. The second student graduated from their undergraduate program, but then continued to be enrolled at the University in a graduate program. Due to a procedural error, the student’s graduation from his undergraduate program was not reported to the NSLDS timely. The University identified this issue and corrective measures were put into place at that time. All files were correctly updated and this issue should not reoccur. The third student was reported as graduated at the program level to the NSLDS, but their campus level was reported as withdrawn. The student was required to be manually processed on the University’s third‐party servicer’s database in order to report their graduation. There is no error message or report to identify students in this situation. As this is not a problem with data in the University’s administrative system, the University will work with its servicer to identify students in this situation for correction. Anticipated Completion Date: August 2020