The Prevalence of Essential Hypertension in Kasigau, Kenya
49
Western Kentucky University TopSCHOLAR® Honors College Capstone Experience/esis Projects Honors College at WKU Spring 5-2012 e Prevalence of Essential Hypertension in Kasigau, Kenya Lindsay Williams Western Kentucky University, [email protected] Follow this and additional works at: hp://digitalcommons.wku.edu/stu_hon_theses Part of the Biology Commons , Cardiovascular Diseases Commons , Community Health Commons , Genetic Phenomena Commons , and the International Public Health Commons is esis is brought to you for free and open access by TopSCHOLAR®. It has been accepted for inclusion in Honors College Capstone Experience/ esis Projects by an authorized administrator of TopSCHOLAR®. For more information, please contact [email protected]. Recommended Citation Williams, Lindsay, "e Prevalence of Essential Hypertension in Kasigau, Kenya" (2012). Honors College Capstone Experience/esis Projects. Paper 363. hp://digitalcommons.wku.edu/stu_hon_theses/363
-
Upload
khangminh22 -
Category
Documents
-
view
2 -
download
0
Transcript of The Prevalence of Essential Hypertension in Kasigau, Kenya
Western Kentucky UniversityTopSCHOLAR®Honors College Capstone Experience/ThesisProjects Honors College at WKU
Spring 5-2012
The Prevalence of Essential Hypertension inKasigau, KenyaLindsay WilliamsWestern Kentucky University, [email protected]
Follow this and additional works at: http://digitalcommons.wku.edu/stu_hon_theses
Part of the Biology Commons, Cardiovascular Diseases Commons, Community HealthCommons, Genetic Phenomena Commons, and the International Public Health Commons
This Thesis is brought to you for free and open access by TopSCHOLAR®. It has been accepted for inclusion in Honors College Capstone Experience/Thesis Projects by an authorized administrator of TopSCHOLAR®. For more information, please contact [email protected].
Recommended CitationWilliams, Lindsay, "The Prevalence of Essential Hypertension in Kasigau, Kenya" (2012). Honors College Capstone Experience/ThesisProjects. Paper 363.http://digitalcommons.wku.edu/stu_hon_theses/363
THE PREVALENCE OF ESSENTIAL HYPERTENSION IN KASIGAU, KENYA
A Capstone Experience/Thesis Project
Presented in Partial Fulfillment of the Requirements for
the Degree Bachelor of Science with
Honors College Graduate Distinction at Western Kentucky University
By
Lindsay D. Williams
*****
Western Kentucky University
2012
CE/T Committee:
Professor Nancy Rice, Advisor
Professor Cheryl Davis
Professor Leslie Baylis
Approved by
_______________________
Advisor
Department of Biology

Copyright by
Lindsay D. Williams
2012
ii
ABSTRACT
Hypertension is the leading cause of cardiovascular disease worldwide.
Cardiovascular disease (CVD) is a widespread chronic non-communicable disease (NCD)
which is on the rise in developing countries. Evidence based on extensive research
studies on risk factors for NCDs suggests that they could be easily significantly decreased
by simply controlling their risk factors. Although high blood pressure has been
recognized as a leading risk factor for CVD, little research has been done to document
the prevalence and incidence of essential hypertension (EH) in lower socioeconomic
developing countries. One such country is Kenya. It was found in our research study that
Kasigau has an extremely high prevalence of EH. Sixty seven percent of the population
had stage 1 or stage 2 hypertension. No known risk factors showed a significant
correlation with systolic blood pressure, and therefore it was determined that the high
prevalence of EH in Kasigau could be contributed to ulterior causation; possibly a
genetic mutation that causes salt hypersensitivity.
Keywords: essential hypertension, cardiovascular disease, Kenya, Kasigau, non-
communicable disease, blood pressure

iii
Dedicated to the people of Kasigau and my family and friends
iv
ACKNOWLEDGEMENTS
There are so many people that deserve credit for the success of this project. First
and foremost, I would like to thank my Lord and Savior Jesus Christ for blessing me
beyond compare, and putting the right people in my path and having me exactly where
He wants me so that His plans for me can succeed.
I could not have even fathomed taking this project on without the vision,
encouragement, and direction of my advisor, Dr. Nancy Rice. She not only oversaw my
thesis project, but inspired the entire research endeavor through her tireless work and
commitment to help the people of Kasigau, Kenya. She was keen enough to note the
increased incidence of hypertension in the region on trips prior to the 2012 trip, and
realize the potential for change and instituting health reforms in the region for control
the EH/NCD epidemic. I want to thank her for not only selecting me to be one of the
students privileged enough to take part in “Partner’s in Caring- Medicine in Kenya”, but
also selecting me as an undergraduate research assistant for her ongoing project to
analyze the genetic variation of these Kenyans.
I would like to thank the entire University for supporting me in many ways but
especially monetarily, and placing such an emphasis on research and providing the
funding for incredible learning opportunities such as Medicine in Kenya and the
research component that goes along with it.

v
I would be remiss to not thank my parents for also supporting me in virtually
every endeavor I set my sights on, and instilling in me a thirst for not only knowledge,
but helping others. Mom, thank you for letting me go to Kenya, even in the dangerous
times.
A special thanks also to my friends who stuck with me, even though I spent a
majority of my time spring 2012 in the library.
vi
VITA
June 3rd, 1990………………………………………………………………………….Born, Lexington, Kentucky
May 2008………………………………………………………………………..….West Jessamine High School,
Nicholasville, Kentucky
January 2012……………………………………………………………..……..Study Abroad- Kasigau, Kenya
Western Kentucky University
February 2012………………………………………………………….…………………..Dr. Rice’s research lab,
Western Kentucky University
May 2012…………………………………………………………………………..Western Kentucky University,
Bowling Green, Kentucky
FIELDS OF STUDY
Major Field: Biology
Minor Field: Chemistry
Concentration: Pre-medicine
vii
TABLE OF CONTENTS
Page
Abstract……………………………………………………………………………………………………………...…………ii
Dedication………………………………………………………………………………………………………………….….iii
Acknowledgements……………………………………………………………………………………………………….iv
Vita………………………………………………………………………………………………………………………………..vi
List of Figures……………………………………………………………………………………………………………….viii
List of Tables…………………………………………………………………………………………………..……….…….ix
Chapters
1. Introduction……………………………………………………………………………………………….…..….1
2. Methods…………………………………………………………………………………………………………….8
3. Results……………………………………………………………………………………………………………...11
4. Discussion………………………………………………………………………………………………………...29
Appendix 1: HSRB Approval…………………………………………………………………………………………..34
Appendix 2: Informed Consent……………………………………………………………………………….…….35
References…………………………………………………………………………………………………………….……..36
viii
LIST OF FIGURES
Figure Page
1. Healthcare infrastructure in Kenya……………………………………………………………………………..2
2. Health impact in Kenya, compared to Africa and the rest of the world……………………….3
3. Map of Kenya, Taita Hills…………………………………………………………………………………………….5
4a. Buguta Blood Pressure……………………………………………………………………………………………12
4b. Makwasinyi Blood Pressure……………………………………………………………………………………12
4c. Rukanga Blood Pressure………………………………………………………………………………………….13
4d. Kasigau Blood Pressure…………………………………………………………………………………………..13
5. EH Distribution in Kasigau, Kenya…………………………………………………………………………….17
6. The Percent Prevalence of EH in Kasigau, Kenya by age and sub-location………………..18
7. Body Mass Index Chart for Adults…………………………………………………………………………….19
8. BMI of Individuals in Kasigau based on Sub-location…………………………………………………20
9. Total Percent Distribution of BMI in Kasigau…………………………………………………………….21
ix
LIST OF TABLES
Table Page
1. Analysis of Variance in Blood Pressure based upon
Gender and Sub-location………………………………………………………………………………………….15
2. Analysis of Variance in Blood Pressure based upon Sub-location……………………………..16
3. Correlation data for Systolic blood pressure and BMI
for each Kasigau sublocation…………………………………………………………………………………….23
4. One Way ANOVA data comparing BMI between sub-groups
of the population………………………………………………………………………………………………………24
5. Waist to hip ratio in Kasigau, Kenya………………………………………………………………………….25
6. Correlation data for Systolic blood pressure and WHR
for each Kasigau sub-location……………………………………………………………………………………25
7. Cholesterol levels in Kasigau, Kenya………………………………………………………………………….26
8. Correlation data for Systolic blood pressure and cholesterol
for each Kasigau sub-location……………………………………………………………………………………27
9. Correlation data for systolic blood pressure and diastolic blood pressure
for each Kasigau sub-location……………………………………………………………………………………28
10. The Monthly Income of Kasigau……………………………………………………………………………..29
1
CHAPTER 1
INTRODUCTION
The World Health Organization (WHO) estimates that 36 million of the 57 million
deaths that occurred worldwide in 2008 were due to non-communicable diseases (NCD)
making this the leading cause of death with a 63% mortality rate [1]. Non-communicable
diseases include cardiovascular disease, stroke, cancer, chronic respiratory disease, and
diabetes. They are termed non-communicable, because, unlike infectious diseases such
as HIV, malaria, and tuberculosis, they cannot be passed from individual to individual.
One of the major effects of NCD is premature death i.e. death before the age of 60 with
29% of these deaths occurring in low and middle-income countries in 2008 [2].
Fortunately, according to WHO data, 80% of deaths due to NCD such as cardiovascular
disease (CVD), stroke, and diabetes could be prevented by simply controlling the risk
factors. Known risk factors for NCD include alcohol and tobacco use, obesity, physical
inactivity, unhealthy diet, high blood pressure, high blood glucose levels, and high
cholesterol [2].
The increase of NCD mortality is of particular significance in developing
countries. The WHO estimates that in 10 years global NCD deaths will increase by 17%.
This number is even greater in developing African nations (27% increase), among them,
Kenya [3]. The leading causes of NCD mortality globally were CVD, cancers, and
2
respiratory diseases. CVD comprised 21% of these deaths with a total of 17 million
deaths in 2008. Eighty percent of the NCD deaths due to either diabetes or CVD
occurred in developing countries [2].
Kenya, a sub-Saharan country in east Africa, has a population of approximately
39 million people. Less than one fourth of the population lives in urban centers; the
majority of Kenyans reside in rural areas and exist on less than $1 per day [4]. Kenya
boarders the Indian Ocean and is located on the equator in a mostly arid or semi-arid
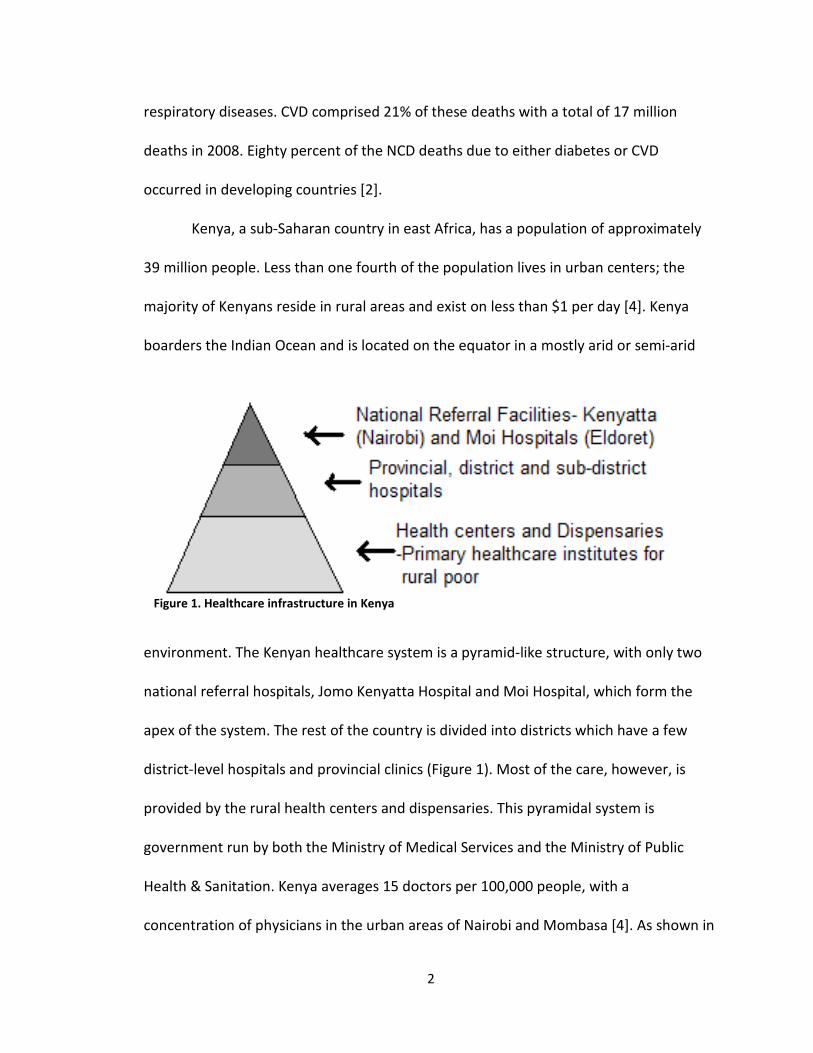
environment. The Kenyan healthcare system is a pyramid-like structure, with only two
national referral hospitals, Jomo Kenyatta Hospital and Moi Hospital, which form the
apex of the system. The rest of the country is divided into districts which have a few
district-level hospitals and provincial clinics (Figure 1). Most of the care, however, is
provided by the rural health centers and dispensaries. This pyramidal system is
government run by both the Ministry of Medical Services and the Ministry of Public
Health & Sanitation. Kenya averages 15 doctors per 100,000 people, with a
concentration of physicians in the urban areas of Nairobi and Mombasa [4]. As shown in
Figure 1. Healthcare infrastructure in Kenya
3
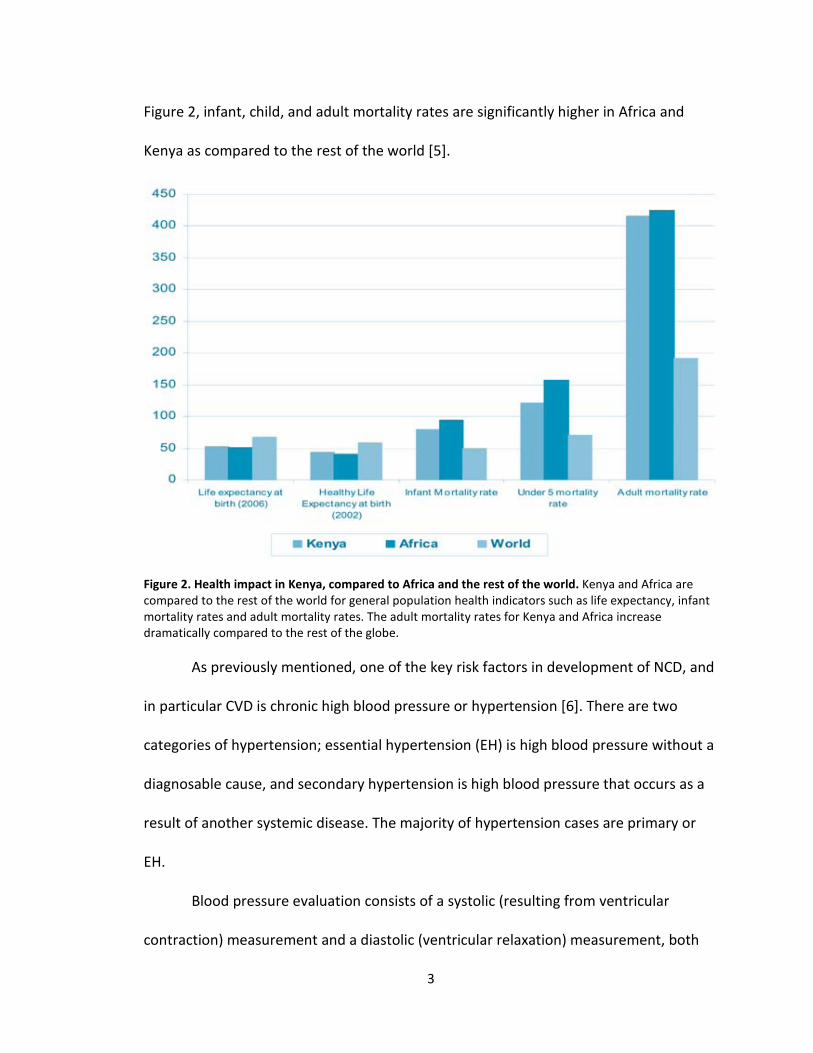
Figure 2, infant, child, and adult mortality rates are significantly higher in Africa and
Kenya as compared to the rest of the world [5].
Figure 2. Health impact in Kenya, compared to Africa and the rest of the world. Kenya and Africa are
compared to the rest of the world for general population health indicators such as life expectancy, infant
mortality rates and adult mortality rates. The adult mortality rates for Kenya and Africa increase
dramatically compared to the rest of the globe.
As previously mentioned, one of the key risk factors in development of NCD, and
in particular CVD is chronic high blood pressure or hypertension [6]. There are two
categories of hypertension; essential hypertension (EH) is high blood pressure without a
diagnosable cause, and secondary hypertension is high blood pressure that occurs as a
result of another systemic disease. The majority of hypertension cases are primary or
EH.
Blood pressure evaluation consists of a systolic (resulting from ventricular
contraction) measurement and a diastolic (ventricular relaxation) measurement, both
4
expressed in mmHg. Normal blood pressure is considered 120/80 mmHg. Pre-
hypertensive is characterized by 120-139 systolic and 80-89 diastolic pressures. This
stage is optimally treated with medication. Stage 1 hypertensive is characterized by 140-
159 systolic and 90-99 diastolic pressures. Levels above the stage 1 range qualify as
Stage 2 hypertensive, and medications are required to avoid a cardiac emergency [7].
Cardiovascular disease has become a pandemic in developing countries that lack the
simple infrastructure, support, and resources to fight NCDs. The WHO and the United
Nations have placed significant importance on the reduction of CVD through combating
its risk factors, including EH. In spite of this, little research has been conducted in these
third world countries with regard to EH prevalence.
The region of Kasigau is located in the Taita-Taveta District of Southern Kenya.
The Taita-Taveta District covers a 17,128 km2 area of land and is subdivided into 7
sections with the most prominent division being that of Voi [8]. According to the 2009
census, Kasigau has a population of 13,696 people comprising 2,742 households [9].
Kasigau can be further divided into 3 sub-locations and 7 total villages. Sub-location
Rukanga contains 29% of the population spread across 4 villages (Rukanga, Jora,
Ngambenyi, and Bungule). Sub-location Makwasinyi makes up 21% of the total
population and is comprised of 3 villages (Makwasinyi, Kisimenyi, and Kiteghe). Finally,
the sub-location Buguta is home to 50% of the Kasigau population [9]. East and West
Tsavo National Parks make up 62% of the land mass in this District with Kasigau
essentially situated between the parks. As a result, residents struggle with wildlife
interaction and conflict as a wide variety of native species, mainly elephants, inhabit and
5
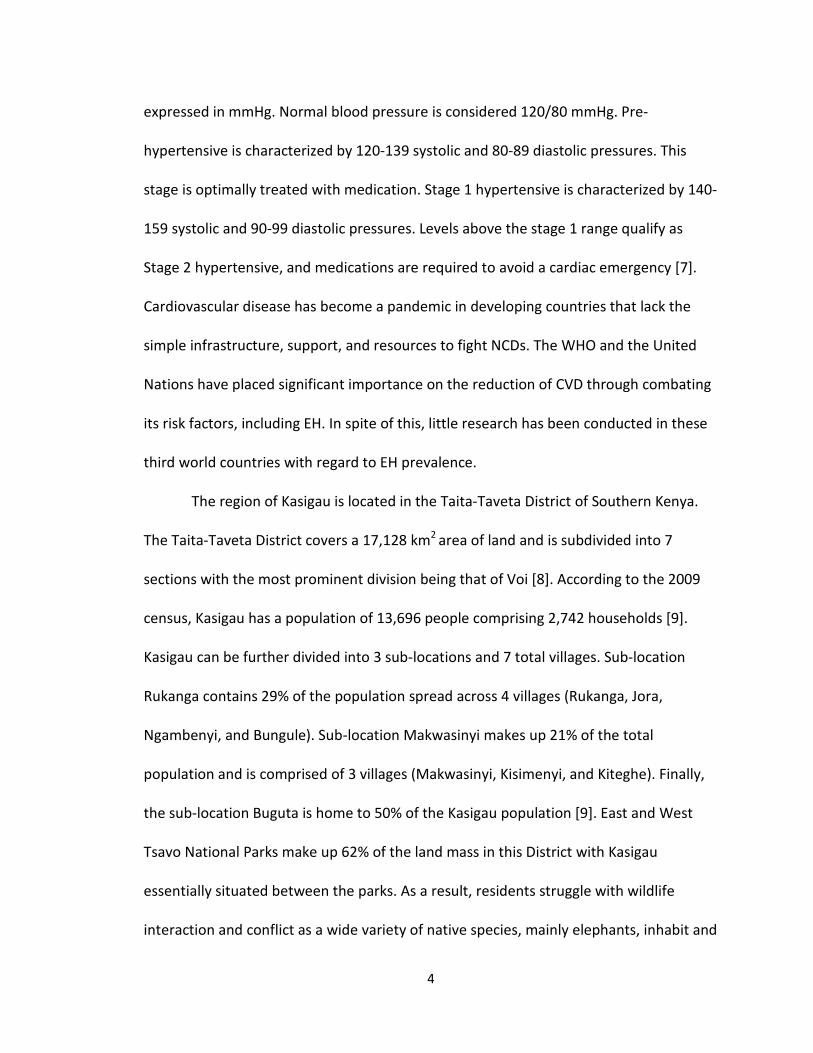
migrate through this biologically diverse ecosystem in the shadow of Mt. Kasigau.
However, the local economy in Kasigau is bolstered due to the proximity of the parks
and the resulting tourism industry [8].
The residents of Kasigau are predominately part of the Taita tribe and are
subsistence farmers. The villages are situated in the Eastern Arc Mountains, one third of
the distance between the Taita Hills and the Indian Ocean (Figure 3). The closest city,
Voi, is located 60 km from Kasigau. Voi is home to the nearest provincial hospital,
although Kasigau residents rely primarily on their local health center (Rukanga) and
Figure 3. Map of Kenya showing the Taita Hills with respect to
Nairobi, Kenya’s capitol city, and Mombasa, their coastal city [10].
6
dispensaries (Buguta and Makwasinyi), as transportation to Voi is unaffordable to most.
The regional farming, and thus livelihood of the Kasigau people, is constantly vulnerable
because of drought and crop destruction by way of elephant migration [8].
“Partners in Caring: Medicine in Kenya” is a service learning program constructed
on the relationships that have been forged between Western Kentucky University’s
Department of Biology, the Kasigau region, and the University of Nairobi. Medicine in
Kenya is a January-term course offered through Western Kentucky University in which a
team of ~18 people (3 doctors, 12 students, 1 faculty member, and 2 volunteers) travel
to Kenya for 2 weeks. The 2012 visit was the fourth trip by this program within the last
five years. The goals of “Partners in Caring” include increasing the promotion of health
and disease prevention with sustainable techniques and community oriented work
while providing a valuable, substantive global experience for premedical undergraduate
students. The participating students garner an increased appreciation and awareness of,
not only Kenyan culture, but developing third-world countries in general and the
epidemiological issues with which they are confronted. Partners in Caring attempts to
not only identify the needs of the Kasigau community and act on those needs through
engaging activities that promote the local quality of life, but also to generate a sense of
social responsibility in the participating pre-professional students.
During the seven day clinical portion of the mission, the physicians and students
conduct patient examinations in the local healthcare facilities with the help of the local
Ministry of Public Health and Sanitation healthcare practitioners. Numerous patients
(typically over 1,000) travel from the surrounding villages to be examined by the team.
7
An additional research component was added to the program in 2012. The goal
of the research component was to quantify the prevalence of hypertension in the
Kasigau area in order to provide a foundation for further research investigating its
cause.
This research will be some of the first of its kind in the field of evolving third
world epidemiology. Even though high priority has been placed on managing NCD risk
factors, including hypertension, by organizations such as the WHO, few reported studies
exist. Long term studies will also investigate the genetic basis of high blood pressure,
hypothesizing that the people have a high prevalence of hypertension that is a result of
polymorphic and/or epigenetic changes in the renin-angiotensin gene system.
Therefore, in this work we will determine if indeed there is an abnormal prevalence of
EH in this region and the anthropometric factors tied to the EH. Follow-up studies will be
conducted to determine if any environmental or behavioral risk factors can be
correlated to the occurrence of EH. Collectively these studies will provide key
epidemiological and genetic information that will help formulate approaches to prevent,
treat, and/or control hypertension leading to higher quality of life, decreased risk of
developing a non-communicable disease such as CVD, and a lessened burden of NCD
upon Kenya and similar countries.
8
CHAPTER 2
METHODS
The purpose of this study was to acquire initial data on EH occurrence in Kasigau,
Kenya, in order to provide a foundation for future research on EH and other NCD risk
factors in this area with the ultimate objective of lowering CVD in this area. A long-term
goal of this study is to inform the Kenyan Ministry of Health of the results and assist
them in developing a cost-effective plan for EH management in Kasigau. In order to
accomplish this, I evaluated the frequency of common risk factors associated with EH
including high body mass index (BMI), high waist to hip ratio (WHR), and high
cholesterol levels. A secondary study is also underway which analyzes the more
intangible risk factors that are based on socio-economic parameters such as income,
stress levels, job, education, diet, etc. Future research that will follow this preliminary
study will be conducted with the goal of providing genetic evidence for the elevated
incidence of EH in Kasigau, Kenya.
The prevalence of hypertension was assessed using a survey based approach in
connection with diagnostic testing in a community-based participatory context.
According to the Centre for Community Based Research, this style of research is
“community situated, collaborative, and action-oriented” [11]. The study site was
Kasigau, Kenya and community members served as both participants and research
9
assistants in this collaboration. Hypertension is a significant health problem identified by
the community. As a characteristic of the community based research method, the study
participants had an active part in dictating the direction and the success of the research
through their input, thus they are empowered and invested in the study.
Participant Selection
Residents of the 7 Kasigau villages (Jora, Rukanga, Makwasinyi, Bungule, Kiteghe,
Ngambenyi, and Buguta) were invited to participate in our research study. The 7 villages
were chosen because: 1) they are the most populous 2) 3 of them have government
supported health centers and 3) they are very accessible. A 2009 population census
dictated the formation of a stratified random sample by the natural population
representation of the 3 sub-locations (29% Rukanga, 21% Makwasinyi, 50% Buguta) [9].
Participants in the study were 45 years of age or older, with 50% males and 50%
females included in the study. Four hundred individuals were recruited to take part in
the study, although only ~200 individuals finally participated in the study. Participants
were required to go to a health assessment interview held in their respective village in
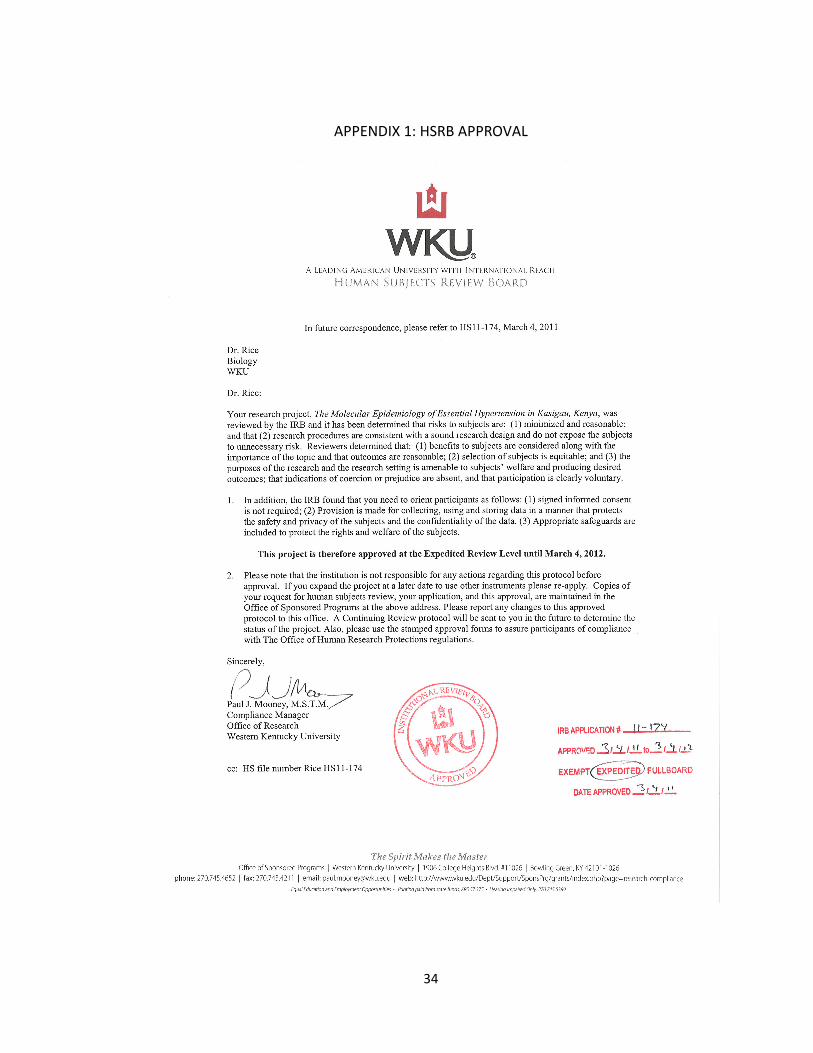
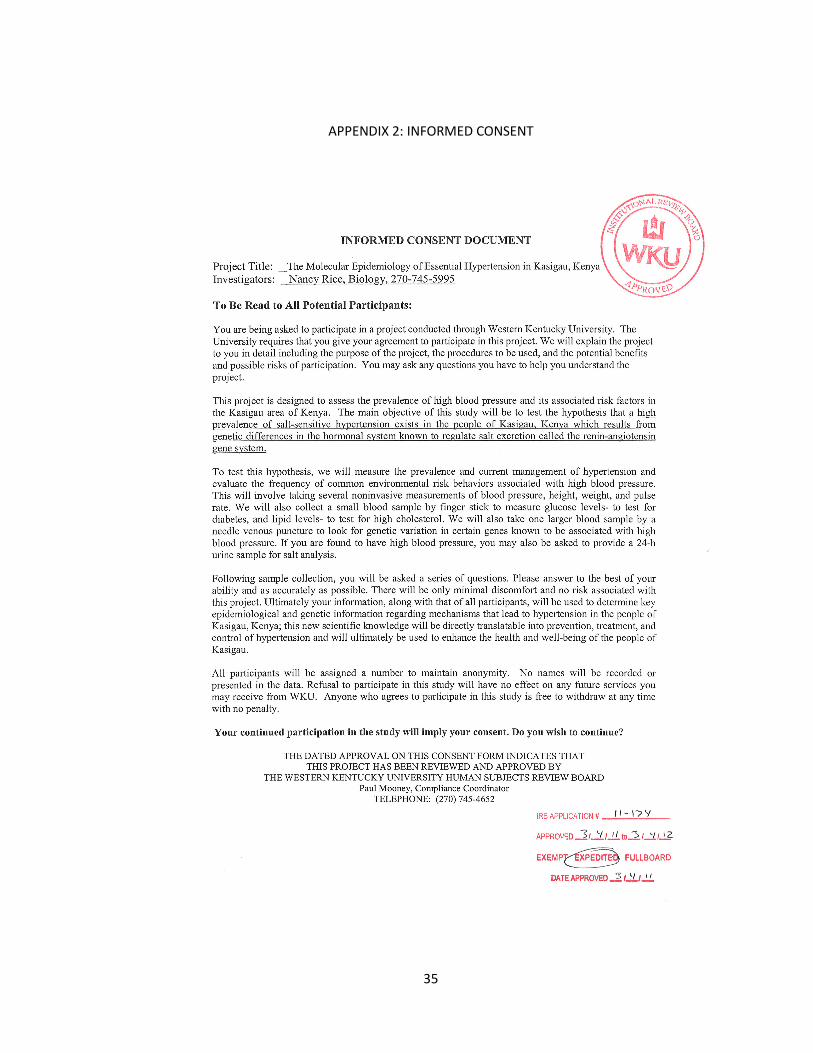
December 2011/January 2012. This study was approved by WKU’s Human Subjects
Review Board and the Taita District Health Officer in Kenya, as well as the village
chiefs/elders (Appendix 1). All investigators completed the CITI Program Training
Modules before any research on human subjects was conducted, and the Human
Subjects Review Board (HSRB) provided an Informed Consent Document to be read to
and agreed upon by all survey participants (Appendix 2).
Data Collected
10
For each participant, the following data were collected: height measured to the
nearest cm; weight measured to the nearest kg in the absence of footwear or heavy
garments; the average of 3 blood pressure readings taken after 5 minutes of sitting;
umbilical waist circumference to the nearest cm and hip circumference to the nearest
cm; blood cholesterol levels determined by a hand held meter (Accutrend plus).
Raw data were analyzed to determine body mass index (BMI), (the percent body
fat of a person), waist/hip circumference ratio (WHR), and cholesterol levels. BMI was
calculated by weight in kg divided by the square of the individual’s height (kg/m2). For
waist to hip ratio data, the waist circumference value was simply placed in the
numerator above the hip circumference. The statistical One-way ANOVA and Pearson
Correlation analyses were performed using the statistical processing package, SigmaPlot
(version 3.5). When normality was not achieved a Dunn’s method One-way ANOVA was
used to determine variance.
11
CHAPTER 3
RESULTS
To quantify the prevalence of EH in the community of Kasigau and correlate the
amount of hypertension to known risk factors including obesity, high BMI, high
cholesterol levels and high WHR, 161 individuals were assessed from 3 sub-locations in
Kasigau; Buguta, Makwasinyi, and Rukanga [6]. The total number of participants from
each sub-location was as follows: Buguta n=67, Makwasinyi n=31, and Rukanga n=63.
Differences in means were analyzed via ANOVA statistical tests, and correlations
between blood pressure and other anthropometric values were determined by Pearson
correlations using SigmaPlot 3.5. This allowed us to look at differences in EH across
village sub-locations, and whether these risk factors significantly contributing to the EH
seen in the region.
EH was defined based on the value given by the Joint National Committee (JNC)
as a blood pressure of 140/90 mmHg or higher [12].
12
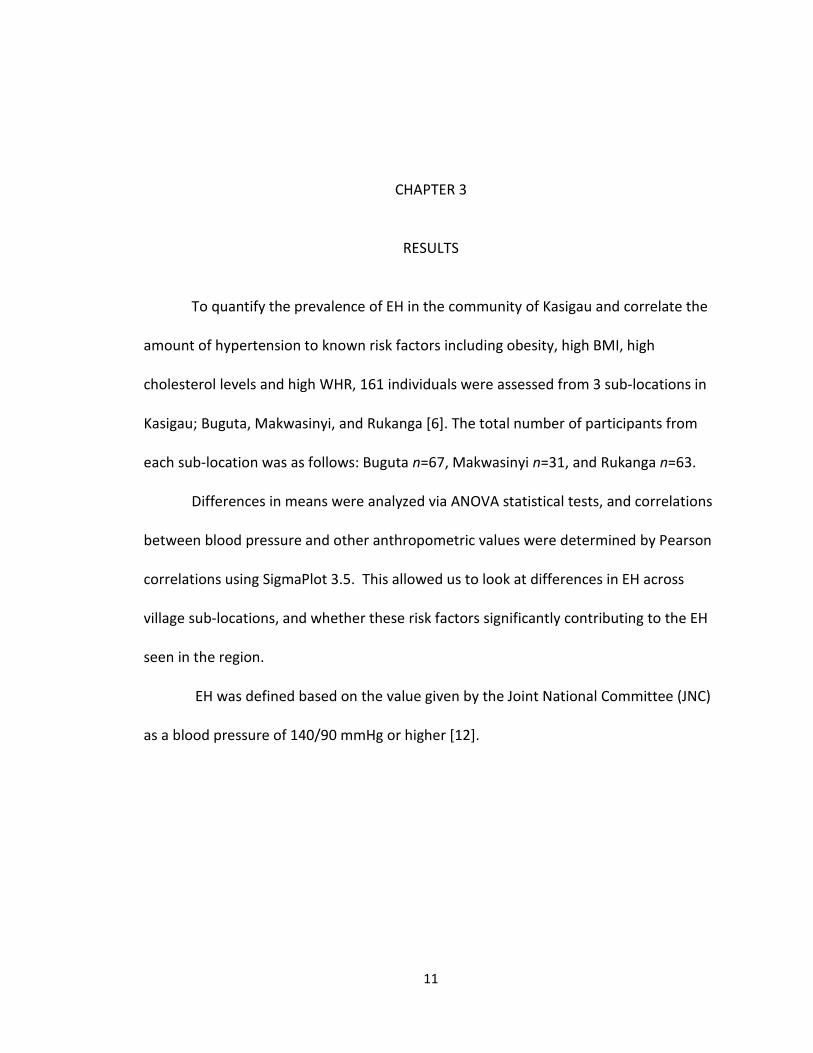
Figure 4a. Buguta Blood Pressure- The average blood pressure of participants from Buguta based on age
and gender. n=67; Error bars represent standard error.
Figure 4b. Makwasinyi Blood Pressure- The average blood pressure of participants from Makwasinyi
based on age and gender. n=31; but no females in the 75+ category. Error bars represent standard error.
130132
146
178
84 86 86
110120 140
138 148
7688 82 86
0
20
40
60
80
100
120
140
160
180
200
45-54 55-64 65-74 75+
mm
Hg
Age Range
Females Systolic Females Diastolic Males Systolic Males Diastolic
148
156
174
100
91
116142
146 148158
90 84 8490
0
20
40
60
80
100
120
140
160
180
200
45-54 55-64 65-74 75+
mm
Hg
Age Range
Females Systolic Females Diastolic Males Systolic Males Diastolic
13
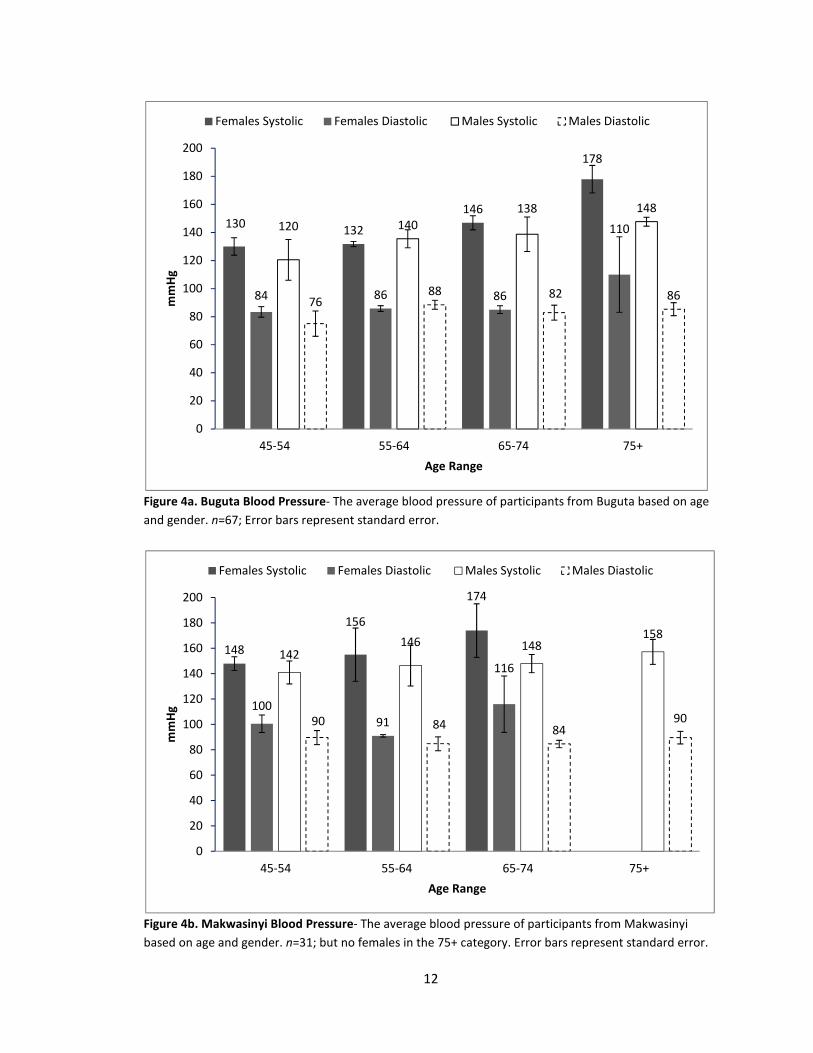
Figure 4c. Rukanga Blood Pressure- The average blood pressure of participants from Rukanga based on
age and gender. n=63; error bars represent standard error.
Figure 4d. Kasigau Blood Pressure.-The average blood pressure of the entire Kasigau region based on age
and gender. n=161 error bars represent standard error.
142
154
166
154
9298
100 96
168156
172160
112
9488
86
0
20
40
60
80
100
120
140
160
180
200
45-54 55-64 65-74 75+
mm
Hg
Age Range
Females Systolic Females Diastolic Males Systolic Males Diastolic
138 140
158 158
90 90 96 98
142 144
148156
92 8884 88
0
20
40
60
80
100
120
140
160
180
200
45-54 55-64 65-74 75+
mm
Hg
Age Range
Female Systolic Female Diastolic Male Systolic Male Diastolic
14
When analyzed based upon sub-location, all female age groups and most male
age groups in our study from Buguta had blood pressures above 120/80 mmHg with the
exception of males between 45-54 years old (120/76mmHg) (Figure 4a). In Makwasinyi,
all averages for each gender and each age range were above the healthy range for blood
pressure. The lowest average was 142/90 mmHg which occurred in the males 45-54
years old (Figure 4b). Rukanga shows a similar trend, with neither gender nor age range
of participant having a healthy blood pressure average (Figure 4c). The lowest average
blood pressure in Rukanga was 142/92 mmHg for the females age 45-54. Figure 4d
shows the averages for the entire community of Kasigau. Their lowest average blood
pressure was 138/90 mmHg for the 45-54 year old females, which is still well over the
healthy blood pressure 120/80 mmHg. Collectively from this work we can determine
that the people of Kasigau do have EH in ranges greater than 140/90 mmHg, also
considered stage 1. The absolute values are higher in older persons as would be
expected (Figure 4d).
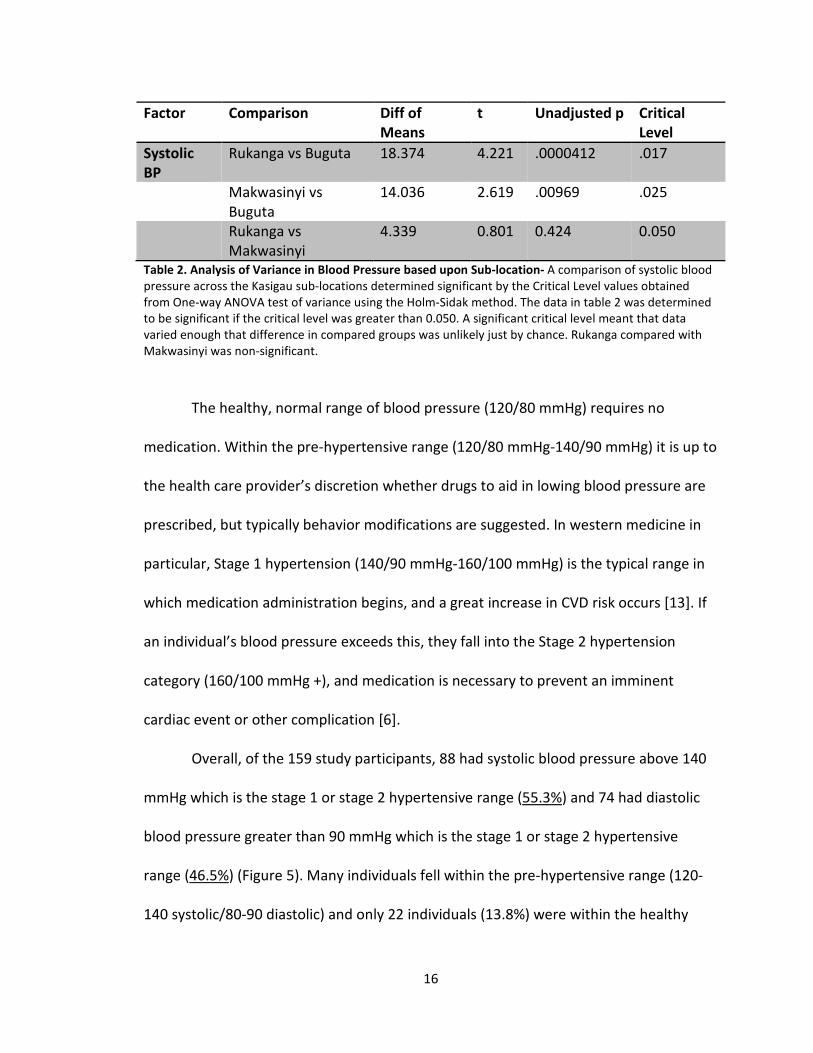
Moreover, based upon One-way ANOVA analyses, males in Rukanga have a
statistically significant variance from males in Buguta when comparing systolic blood
pressures (Table 1). The ANOVA also revealed variance in systolic blood pressure when
comparing Rukanga to Buguta and Makwasinyi to Buguta regardless of gender (Table 2).
The average systolic blood pressure in Buguta was 136 mmHg, while the average systolic
blood pressure for Makwasinyi and Rukanga was 150 mmHg and 156 mmHg,
respectively. Thus, Buguta had a significantly lower blood pressure than the other two
15
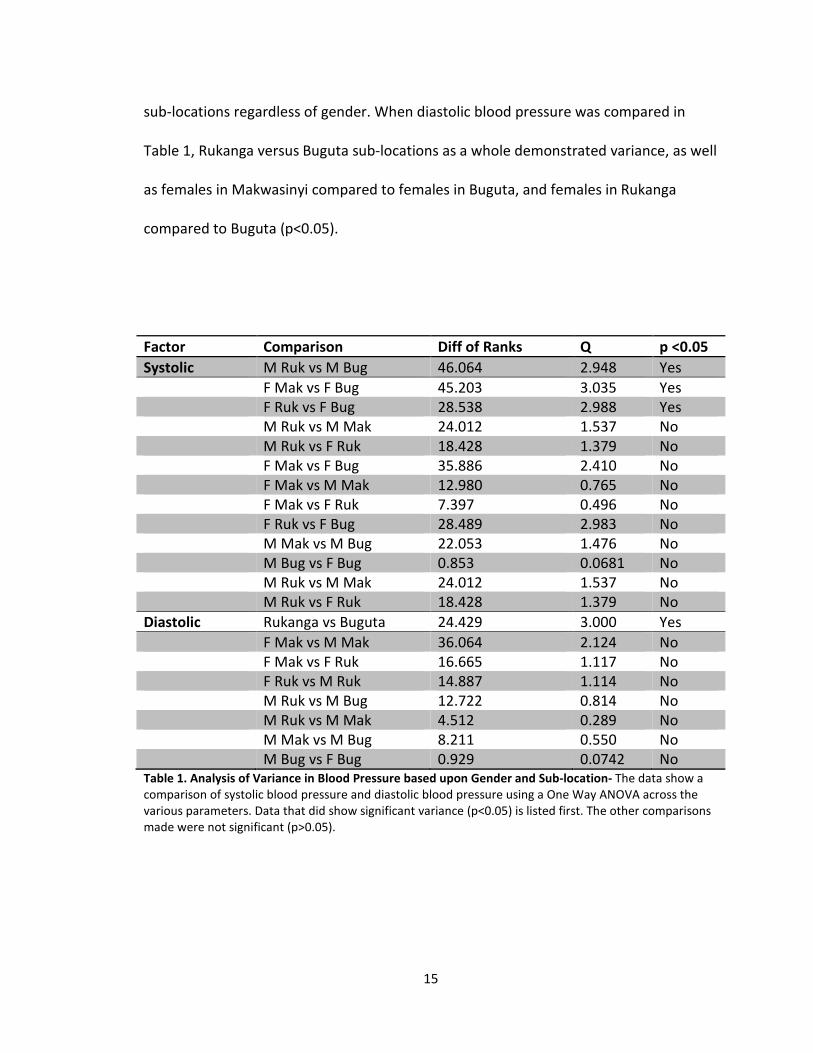
sub-locations regardless of gender. When diastolic blood pressure was compared in
Table 1, Rukanga versus Buguta sub-locations as a whole demonstrated variance, as well
as females in Makwasinyi compared to females in Buguta, and females in Rukanga
compared to Buguta (p<0.05).
Factor Comparison Diff of Ranks Q p <0.05
Systolic M Ruk vs M Bug 46.064 2.948 Yes
F Mak vs F Bug 45.203 3.035 Yes
F Ruk vs F Bug 28.538 2.988 Yes
M Ruk vs M Mak 24.012 1.537 No
M Ruk vs F Ruk 18.428 1.379 No
F Mak vs F Bug 35.886 2.410 No
F Mak vs M Mak 12.980 0.765 No
F Mak vs F Ruk 7.397 0.496 No
F Ruk vs F Bug 28.489 2.983 No
M Mak vs M Bug 22.053 1.476 No
M Bug vs F Bug 0.853 0.0681 No
M Ruk vs M Mak 24.012 1.537 No
M Ruk vs F Ruk 18.428 1.379 No
Diastolic Rukanga vs Buguta 24.429 3.000 Yes
F Mak vs M Mak 36.064 2.124 No
F Mak vs F Ruk 16.665 1.117 No
F Ruk vs M Ruk 14.887 1.114 No
M Ruk vs M Bug 12.722 0.814 No
M Ruk vs M Mak 4.512 0.289 No
M Mak vs M Bug 8.211 0.550 No
M Bug vs F Bug 0.929 0.0742 No Table 1. Analysis of Variance in Blood Pressure based upon Gender and Sub-location- The data show a
comparison of systolic blood pressure and diastolic blood pressure using a One Way ANOVA across the
various parameters. Data that did show significant variance (p<0.05) is listed first. The other comparisons
made were not significant (p>0.05).
16
Factor Comparison Diff of
Means
t Unadjusted p Critical
Level
Systolic
BP
Rukanga vs Buguta 18.374 4.221 .0000412 .017
Makwasinyi vs
Buguta
14.036 2.619 .00969 .025
Rukanga vs
Makwasinyi
4.339 0.801 0.424 0.050
Table 2. Analysis of Variance in Blood Pressure based upon Sub-location- A comparison of systolic blood
pressure across the Kasigau sub-locations determined significant by the Critical Level values obtained
from One-way ANOVA test of variance using the Holm-Sidak method. The data in table 2 was determined
to be significant if the critical level was greater than 0.050. A significant critical level meant that data
varied enough that difference in compared groups was unlikely just by chance. Rukanga compared with
Makwasinyi was non-significant.
The healthy, normal range of blood pressure (120/80 mmHg) requires no
medication. Within the pre-hypertensive range (120/80 mmHg-140/90 mmHg) it is up to
the health care provider’s discretion whether drugs to aid in lowing blood pressure are
prescribed, but typically behavior modifications are suggested. In western medicine in
particular, Stage 1 hypertension (140/90 mmHg-160/100 mmHg) is the typical range in
which medication administration begins, and a great increase in CVD risk occurs [13]. If
an individual’s blood pressure exceeds this, they fall into the Stage 2 hypertension
category (160/100 mmHg +), and medication is necessary to prevent an imminent
cardiac event or other complication [6].
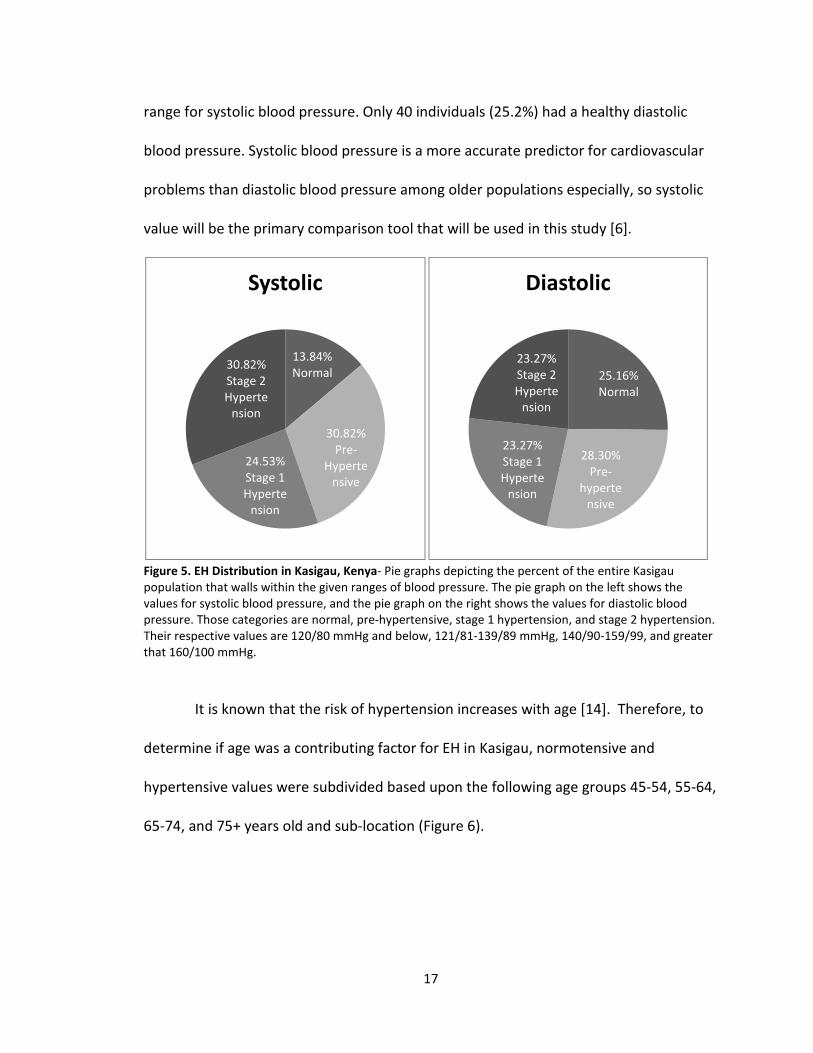
Overall, of the 159 study participants, 88 had systolic blood pressure above 140
mmHg which is the stage 1 or stage 2 hypertensive range (55.3%) and 74 had diastolic
blood pressure greater than 90 mmHg which is the stage 1 or stage 2 hypertensive
range (46.5%) (Figure 5). Many individuals fell within the pre-hypertensive range (120-
140 systolic/80-90 diastolic) and only 22 individuals (13.8%) were within the healthy
17
range for systolic blood pressure. Only 40 individuals (25.2%) had a healthy diastolic
blood pressure. Systolic blood pressure is a more accurate predictor for cardiovascular
problems than diastolic blood pressure among older populations especially, so systolic
value will be the primary comparison tool that will be used in this study [6].
Figure 5. EH Distribution in Kasigau, Kenya- Pie graphs depicting the percent of the entire Kasigau
population that walls within the given ranges of blood pressure. The pie graph on the left shows the
values for systolic blood pressure, and the pie graph on the right shows the values for diastolic blood
pressure. Those categories are normal, pre-hypertensive, stage 1 hypertension, and stage 2 hypertension.
Their respective values are 120/80 mmHg and below, 121/81-139/89 mmHg, 140/90-159/99, and greater
that 160/100 mmHg.
It is known that the risk of hypertension increases with age [14]. Therefore, to
determine if age was a contributing factor for EH in Kasigau, normotensive and
hypertensive values were subdivided based upon the following age groups 45-54, 55-64,
65-74, and 75+ years old and sub-location (Figure 6).
13.84%
Normal
30.82%
Pre-
Hyperte
nsive
24.53%
Stage 1
Hyperte
nsion
30.82%
Stage 2
Hyperte
nsion
Systolic
25.16%
Normal
28.30%
Pre-
hyperte
nsive
23.27%
Stage 1
Hyperte
nsion
23.27%
Stage 2
Hyperte
nsion
Diastolic
18
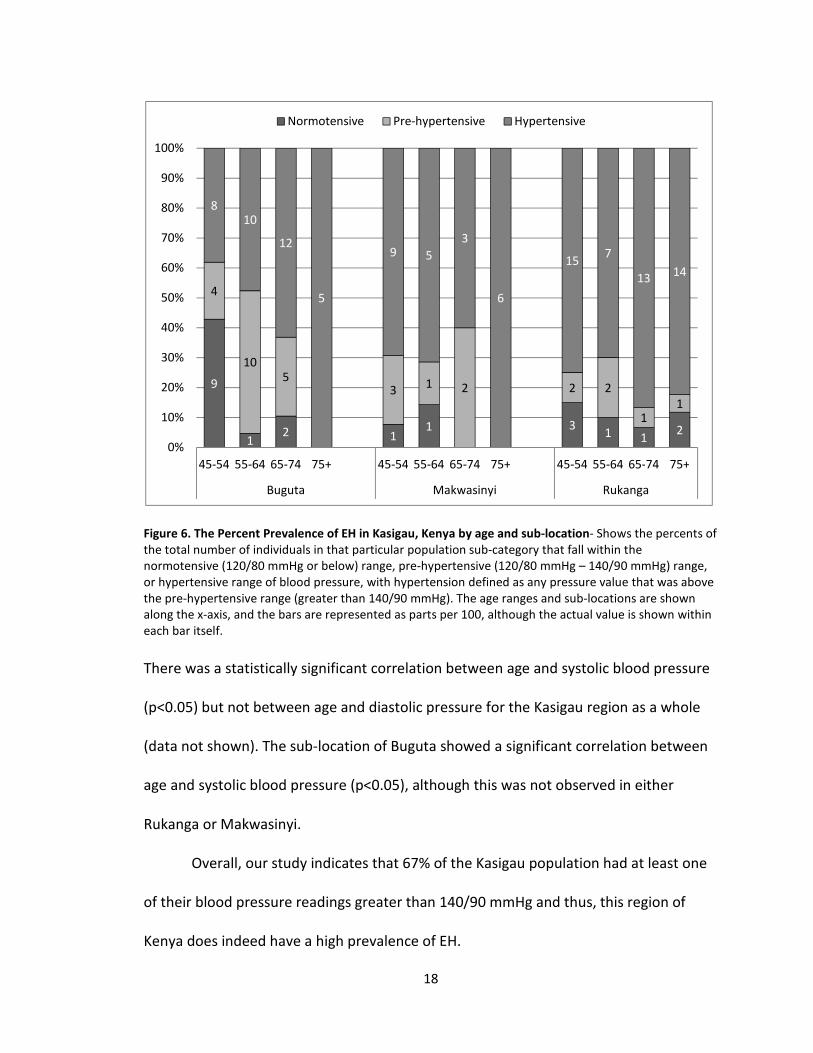
Figure 6. The Percent Prevalence of EH in Kasigau, Kenya by age and sub-location- Shows the percents of
the total number of individuals in that particular population sub-category that fall within the
normotensive (120/80 mmHg or below) range, pre-hypertensive (120/80 mmHg – 140/90 mmHg) range,
or hypertensive range of blood pressure, with hypertension defined as any pressure value that was above
the pre-hypertensive range (greater than 140/90 mmHg). The age ranges and sub-locations are shown
along the x-axis, and the bars are represented as parts per 100, although the actual value is shown within
each bar itself.
There was a statistically significant correlation between age and systolic blood pressure
(p<0.05) but not between age and diastolic pressure for the Kasigau region as a whole
(data not shown). The sub-location of Buguta showed a significant correlation between
age and systolic blood pressure (p<0.05), although this was not observed in either
Rukanga or Makwasinyi.
Overall, our study indicates that 67% of the Kasigau population had at least one
of their blood pressure readings greater than 140/90 mmHg and thus, this region of
Kenya does indeed have a high prevalence of EH.
9
12 1
1 31 1
2
4
105
31 2 2 2
11
810
12
5
9 5
3
6
157
1314
0%
10%
20%
30%
40%
50%
60%
70%
80%
90%
100%
45-54 55-64 65-74 75+ 45-54 55-64 65-74 75+ 45-54 55-64 65-74 75+
Buguta Makwasinyi Rukanga
Normotensive Pre-hypertensive Hypertensive
19
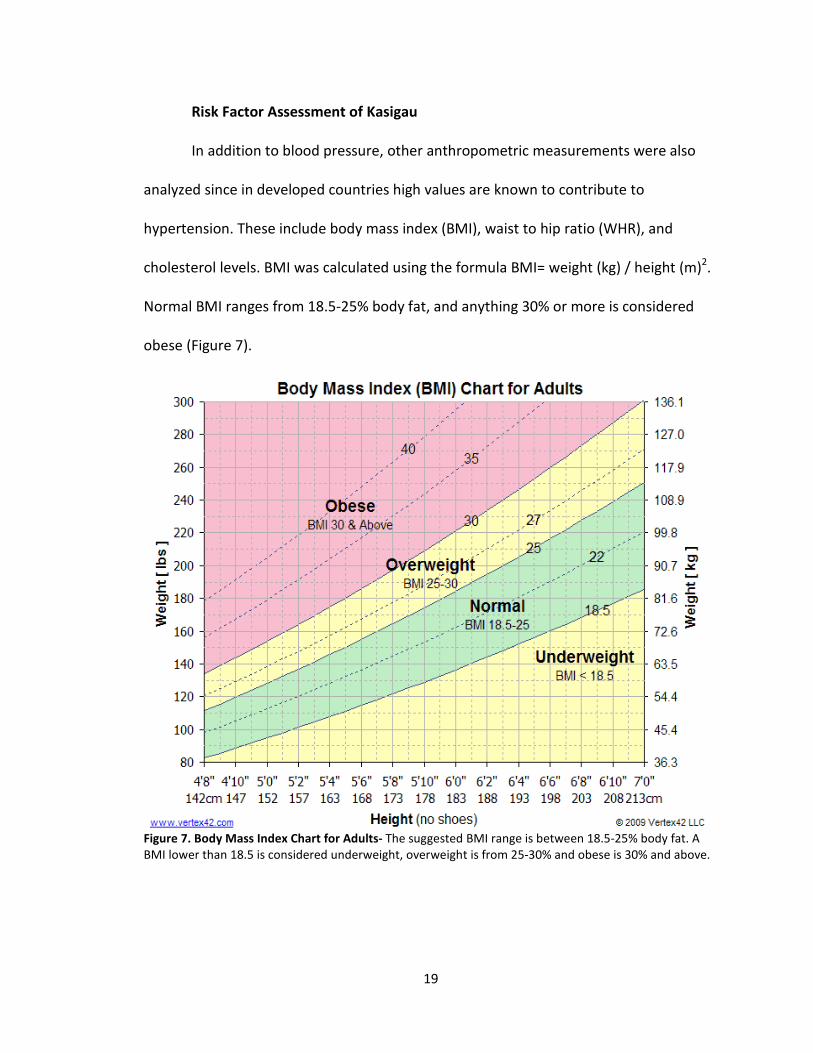
Risk Factor Assessment of Kasigau
In addition to blood pressure, other anthropometric measurements were also
analyzed since in developed countries high values are known to contribute to
hypertension. These include body mass index (BMI), waist to hip ratio (WHR), and
cholesterol levels. BMI was calculated using the formula BMI= weight (kg) / height (m)2.
Normal BMI ranges from 18.5-25% body fat, and anything 30% or more is considered
obese (Figure 7).
Figure 7. Body Mass Index Chart for Adults- The suggested BMI range is between 18.5-25% body fat. A
BMI lower than 18.5 is considered underweight, overweight is from 25-30% and obese is 30% and above.
20
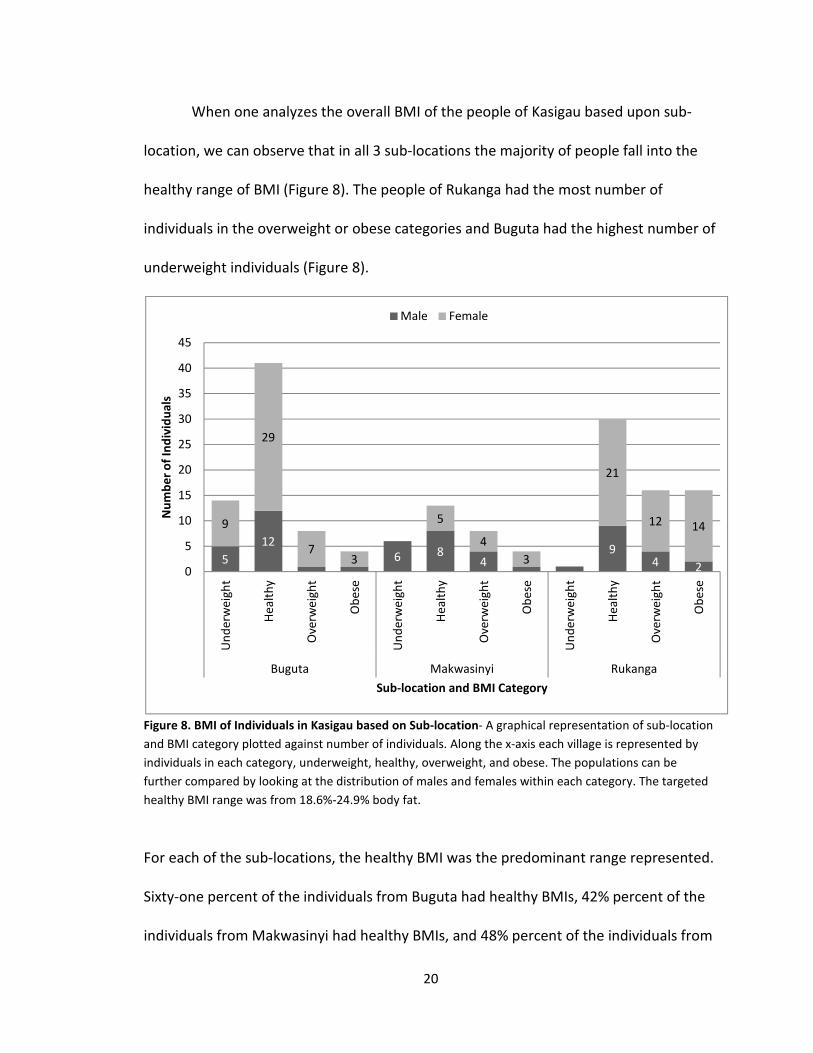
When one analyzes the overall BMI of the people of Kasigau based upon sub-
location, we can observe that in all 3 sub-locations the majority of people fall into the
healthy range of BMI (Figure 8). The people of Rukanga had the most number of
individuals in the overweight or obese categories and Buguta had the highest number of
underweight individuals (Figure 8).
Figure 8. BMI of Individuals in Kasigau based on Sub-location- A graphical representation of sub-location
and BMI category plotted against number of individuals. Along the x-axis each village is represented by
individuals in each category, underweight, healthy, overweight, and obese. The populations can be
further compared by looking at the distribution of males and females within each category. The targeted
healthy BMI range was from 18.6%-24.9% body fat.
For each of the sub-locations, the healthy BMI was the predominant range represented.
Sixty-one percent of the individuals from Buguta had healthy BMIs, 42% percent of the
individuals from Makwasinyi had healthy BMIs, and 48% percent of the individuals from
5
12
6 84
94 2
9
29
73
5
4
3
21
12 14
0
5
10
15
20
25
30
35
40
45
Un
de
rwe
igh
t
He
alt
hy
Ove
rwe
igh
t
Ob
ese
Un
de
rwe
igh
t
He
alt
hy
Ove
rwe
igh
t
Ob
ese
Un
de
rwe
igh
t
He
alt
hy
Ove
rwe
igh
t
Ob
ese
Buguta Makwasinyi Rukanga
Nu
mb
er
of
Ind
ivid
ua
ls
Sub-location and BMI Category
Male Female
21
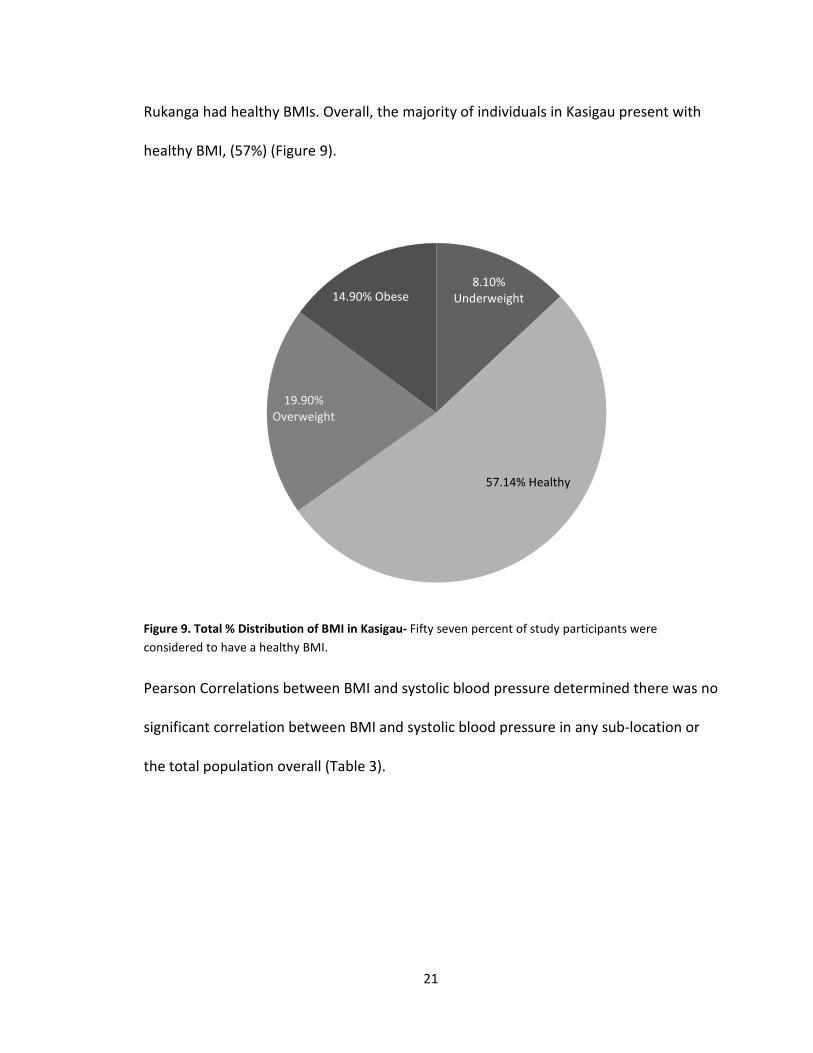
Rukanga had healthy BMIs. Overall, the majority of individuals in Kasigau present with
healthy BMI, (57%) (Figure 9).
Figure 9. Total % Distribution of BMI in Kasigau- Fifty seven percent of study participants were
considered to have a healthy BMI.
Pearson Correlations between BMI and systolic blood pressure determined there was no
significant correlation between BMI and systolic blood pressure in any sub-location or
the total population overall (Table 3).
8.10%
Underweight
57.14% Healthy
19.90%
Overweight
14.90% Obese

22
Systolic BP vs BMI
Sub-location Buguta Makwasinyi Rukanga Kasigau
Correlation coefficient --- .134 .078 .166
P value >0.05 >0.05 >0.05 .0367
Table 3. Correlation data for Systolic blood pressure and BMI for each Kasigau sublocation- A chart
denoting Pearson correlation coefficients (r values) and P values for the comparison of Systolic blood
pressure and BMI. None of the r values were significant (r<0.50) and none of the p values were significant
(p>0.05).
When Rukanga was compared to the other two sub-locations for BMI
differences, it was found to be significantly higher. When these data were further
subdivided by gender, it was found that the females in Buguta were responsible for the
overall village differences in female BMI. Makwasinyi females versus Buguta females
had a p value less than .05 as well as Rukanga females versus Buguta females. This is
because Buguta BMI for females is significantly lower than BMI for females in Rukanga
and Makwasinyi (Table 5). Only 20% of the females in Buguta were overweight or obese,
while 56% of females in Makwasinyi and Rukanga were overweight or obese. Females in
Makwasinyi also showed significant variance from males in Makwasinyi (p<.05) (Table
4). The average BMI for males in Makwasinyi was 20.6, while the average BMI for
females in Makwasinyi was 27.5.

23
Factor Comparison Diff of Ranks Q P <.05
BMI Rukanga vs Buguta 38.312 4.683 Yes
Rukanga vs Makwasinyi 27.416 2.680 Yes
F Mak vs M Mak 66.531 3.87 Yes
F Mak vs F Bug 48 3.19 Yes
F Ruk vs F Bug 39.055 4.082 Yes
Makwasinyi vs Buguta 10.896 1.076 No
F Mak vs F-Ruk 8.945 0.593 No
F Ruk vs M Ruk 17.388 1.289 No
M Ruk vs M Mak 40.197 2.541 No
M Ruk vs M Bug 34.618 2.188 No
F Bug vs M Bug 12.952 1.025 No
M Bug vs M Mak 5.579 0.369 No
Table 4. One Way ANOVA data comparing BMI between sub-groups of the population- A compilation of
comparison parameters determined significant by the P values obtained from One-way ANOVA test of
variance using Dunn’s method. The data in table 4 was all determined to be significant if they varied
enough that difference in compared groups was unlikely just by chance (P<0.05).
Another risk factor for EH is high WHR. In order to determine whether the
prevalence of EH in Kasigau was correlated with this anthropometric value, WHRs were
calculated by dividing the circumference measured at the waist by the circumference
measured at the widest part of the hips. WHR data were obtained for all of our study
participants. According to a study conducted by Mayo Clinic, a normal WHR for women
is <0.85 and <0.90 in men. A high WHR is ≥0.85 in women and ≥0.90 in men [17]. In each
sub-location, females had WHRs above the recommended 0.85 value, approaching the
moderate to high risk ranges for WHR. For males, the Rukanga population was within
the healthy range, but WHR for males across the other sub-locations and overall in
Kasigau had averages higher than 0.90 (Table 5).
24
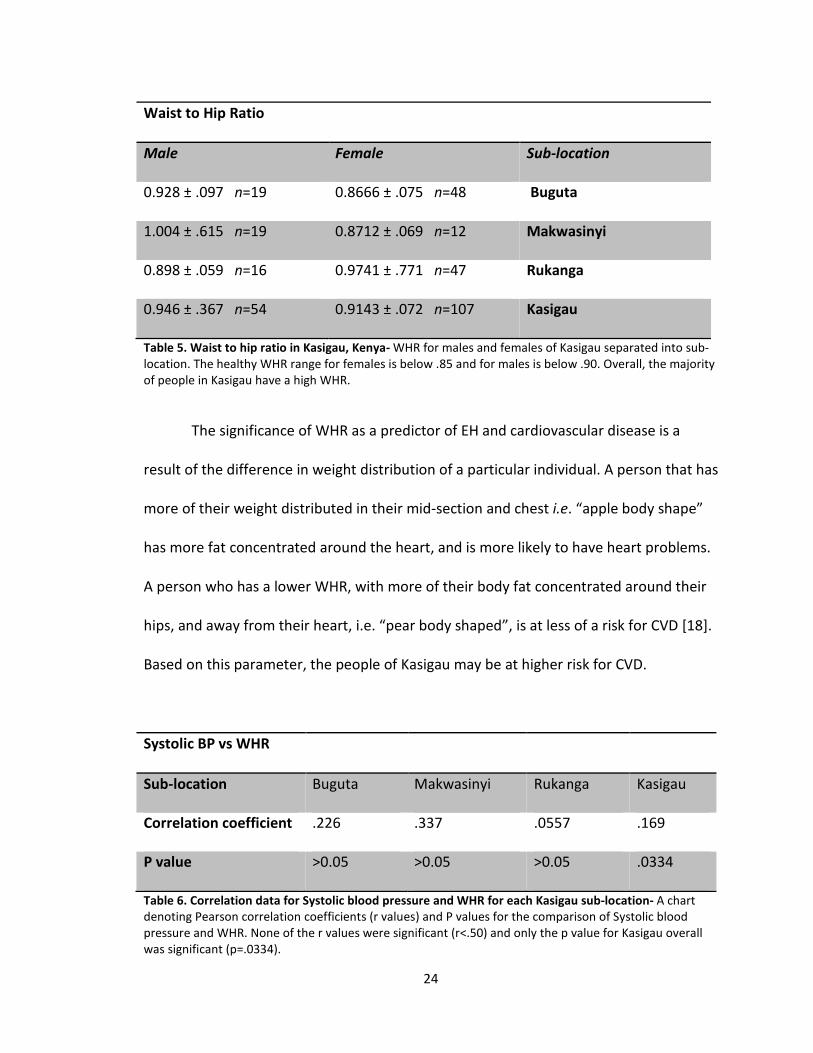
Waist to Hip Ratio
Male Female Sub-location
0.928 ± .097 n=19 0.8666 ± .075 n=48 Buguta
1.004 ± .615 n=19 0.8712 ± .069 n=12 Makwasinyi
0.898 ± .059 n=16 0.9741 ± .771 n=47 Rukanga
0.946 ± .367 n=54 0.9143 ± .072 n=107 Kasigau
Table 5. Waist to hip ratio in Kasigau, Kenya- WHR for males and females of Kasigau separated into sub-
location. The healthy WHR range for females is below .85 and for males is below .90. Overall, the majority
of people in Kasigau have a high WHR.
The significance of WHR as a predictor of EH and cardiovascular disease is a
result of the difference in weight distribution of a particular individual. A person that has
more of their weight distributed in their mid-section and chest i.e. “apple body shape”
has more fat concentrated around the heart, and is more likely to have heart problems.
A person who has a lower WHR, with more of their body fat concentrated around their
hips, and away from their heart, i.e. “pear body shaped”, is at less of a risk for CVD [18].
Based on this parameter, the people of Kasigau may be at higher risk for CVD.
Systolic BP vs WHR
Sub-location Buguta Makwasinyi Rukanga Kasigau
Correlation coefficient .226 .337 .0557 .169
P value >0.05 >0.05 >0.05 .0334
Table 6. Correlation data for Systolic blood pressure and WHR for each Kasigau sub-location- A chart
denoting Pearson correlation coefficients (r values) and P values for the comparison of Systolic blood
pressure and WHR. None of the r values were significant (r<.50) and only the p value for Kasigau overall
was significant (p=.0334).
25
Table 6 indicates that while WHR were high, they did not significantly correlate
with systolic blood pressure; correlation values were less than 0.50. The only significant
p value was p=.0334 for the overall Kasigau population. This means that the data were
significantly different, but because the r value was less than 0.50, it was not a correlated
relationship (Table 6).
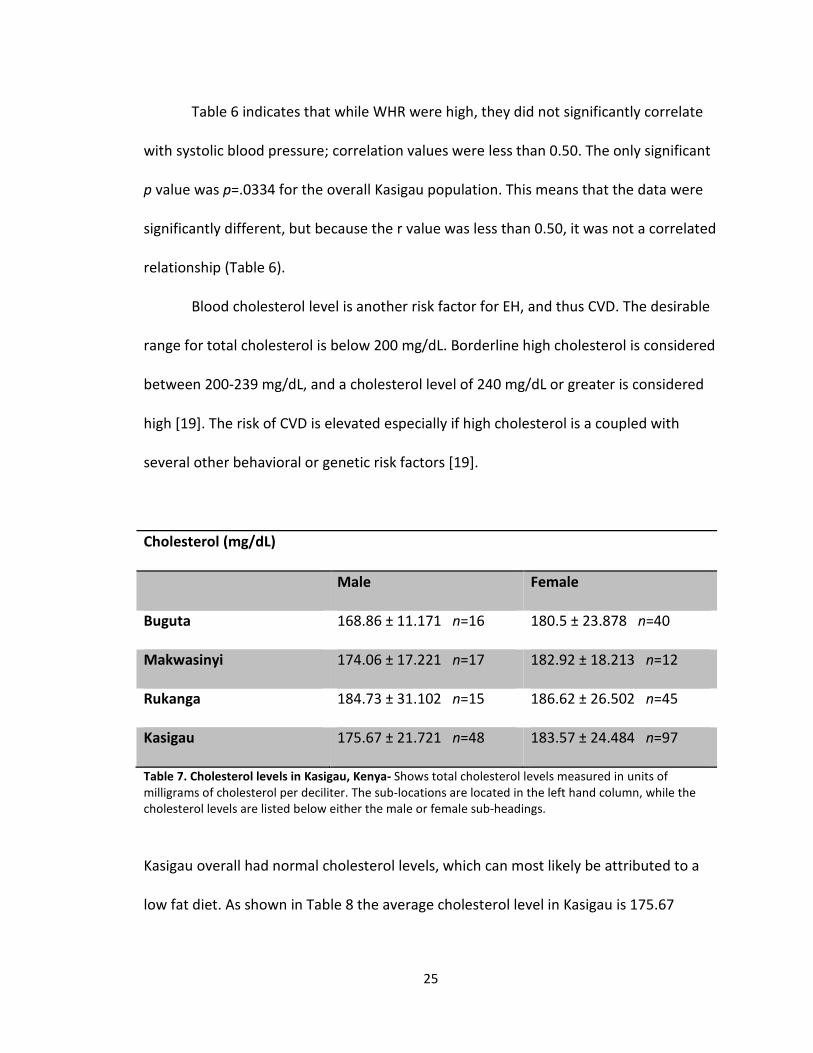
Blood cholesterol level is another risk factor for EH, and thus CVD. The desirable
range for total cholesterol is below 200 mg/dL. Borderline high cholesterol is considered
between 200-239 mg/dL, and a cholesterol level of 240 mg/dL or greater is considered
high [19]. The risk of CVD is elevated especially if high cholesterol is a coupled with
several other behavioral or genetic risk factors [19].
Cholesterol (mg/dL)
Male Female
Buguta 168.86 ± 11.171 n=16 180.5 ± 23.878 n=40
Makwasinyi 174.06 ± 17.221 n=17 182.92 ± 18.213 n=12
Rukanga 184.73 ± 31.102 n=15 186.62 ± 26.502 n=45
Kasigau 175.67 ± 21.721 n=48 183.57 ± 24.484 n=97
Table 7. Cholesterol levels in Kasigau, Kenya- Shows total cholesterol levels measured in units of
milligrams of cholesterol per deciliter. The sub-locations are located in the left hand column, while the
cholesterol levels are listed below either the male or female sub-headings.
Kasigau overall had normal cholesterol levels, which can most likely be attributed to a
low fat diet. As shown in Table 8 the average cholesterol level in Kasigau is 175.67
26
mg/dL for males and 183.57 mg/dL for females, both well below the 200 mg/dL
guideline that marks the beginning of an elevated risk level for CVD and other disease.
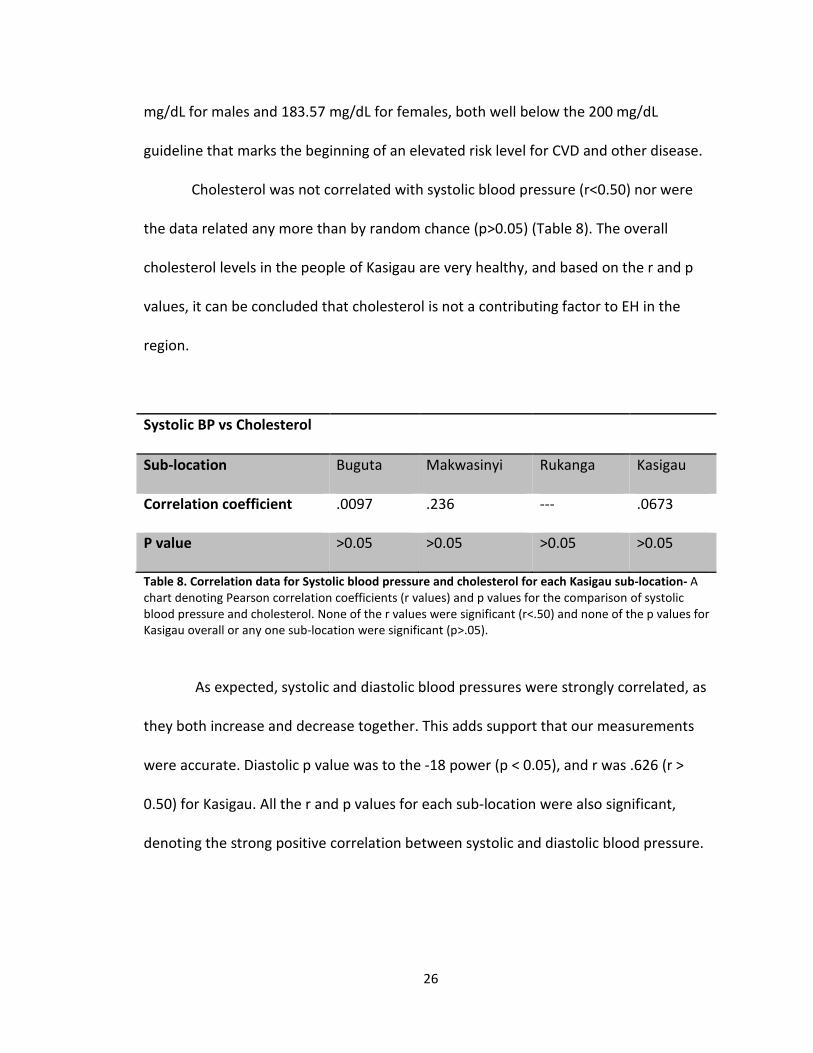
Cholesterol was not correlated with systolic blood pressure (r<0.50) nor were
the data related any more than by random chance (p>0.05) (Table 8). The overall
cholesterol levels in the people of Kasigau are very healthy, and based on the r and p
values, it can be concluded that cholesterol is not a contributing factor to EH in the
region.
Systolic BP vs Cholesterol
Sub-location Buguta Makwasinyi Rukanga Kasigau
Correlation coefficient .0097 .236 --- .0673
P value >0.05 >0.05 >0.05 >0.05
Table 8. Correlation data for Systolic blood pressure and cholesterol for each Kasigau sub-location- A
chart denoting Pearson correlation coefficients (r values) and p values for the comparison of systolic
blood pressure and cholesterol. None of the r values were significant (r<.50) and none of the p values for
Kasigau overall or any one sub-location were significant (p>.05).
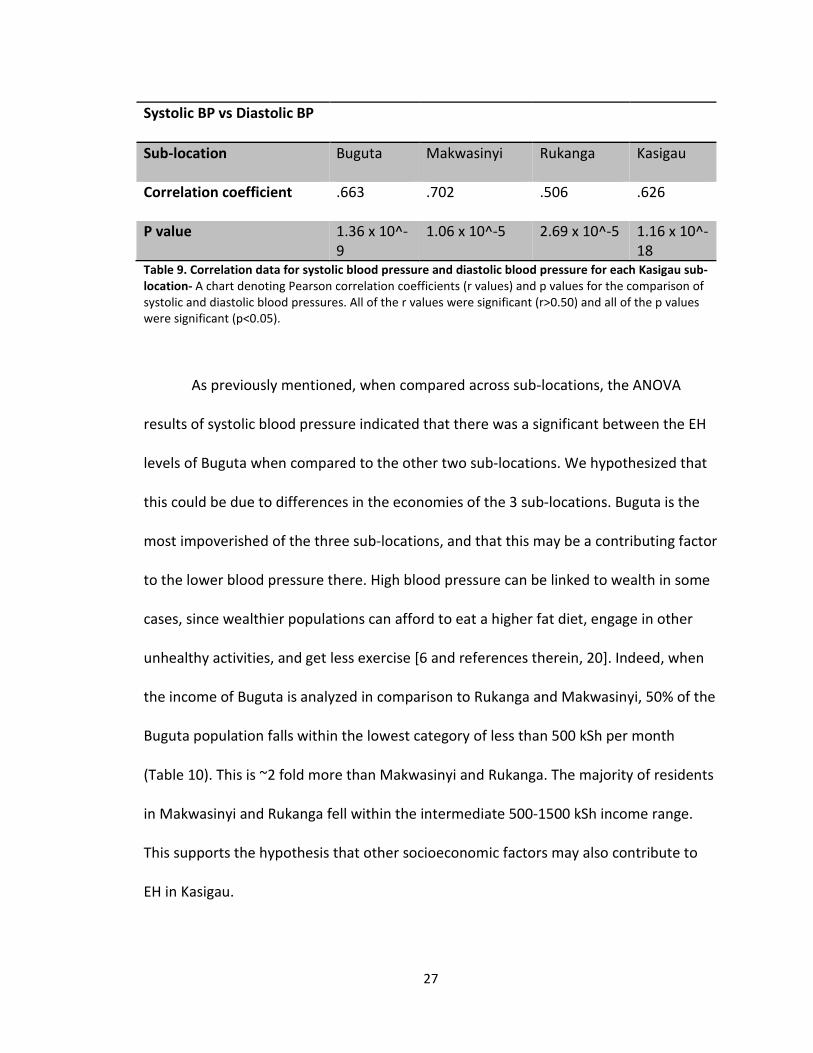
As expected, systolic and diastolic blood pressures were strongly correlated, as
they both increase and decrease together. This adds support that our measurements
were accurate. Diastolic p value was to the -18 power (p < 0.05), and r was .626 (r >
0.50) for Kasigau. All the r and p values for each sub-location were also significant,
denoting the strong positive correlation between systolic and diastolic blood pressure.
27
Systolic BP vs Diastolic BP
Sub-location Buguta Makwasinyi Rukanga Kasigau
Correlation coefficient .663 .702 .506 .626
P value 1.36 x 10^-
9
1.06 x 10^-5 2.69 x 10^-5 1.16 x 10^-
18 Table 9. Correlation data for systolic blood pressure and diastolic blood pressure for each Kasigau sub-
location- A chart denoting Pearson correlation coefficients (r values) and p values for the comparison of
systolic and diastolic blood pressures. All of the r values were significant (r>0.50) and all of the p values
were significant (p<0.05).
As previously mentioned, when compared across sub-locations, the ANOVA
results of systolic blood pressure indicated that there was a significant between the EH
levels of Buguta when compared to the other two sub-locations. We hypothesized that
this could be due to differences in the economies of the 3 sub-locations. Buguta is the
most impoverished of the three sub-locations, and that this may be a contributing factor
to the lower blood pressure there. High blood pressure can be linked to wealth in some
cases, since wealthier populations can afford to eat a higher fat diet, engage in other
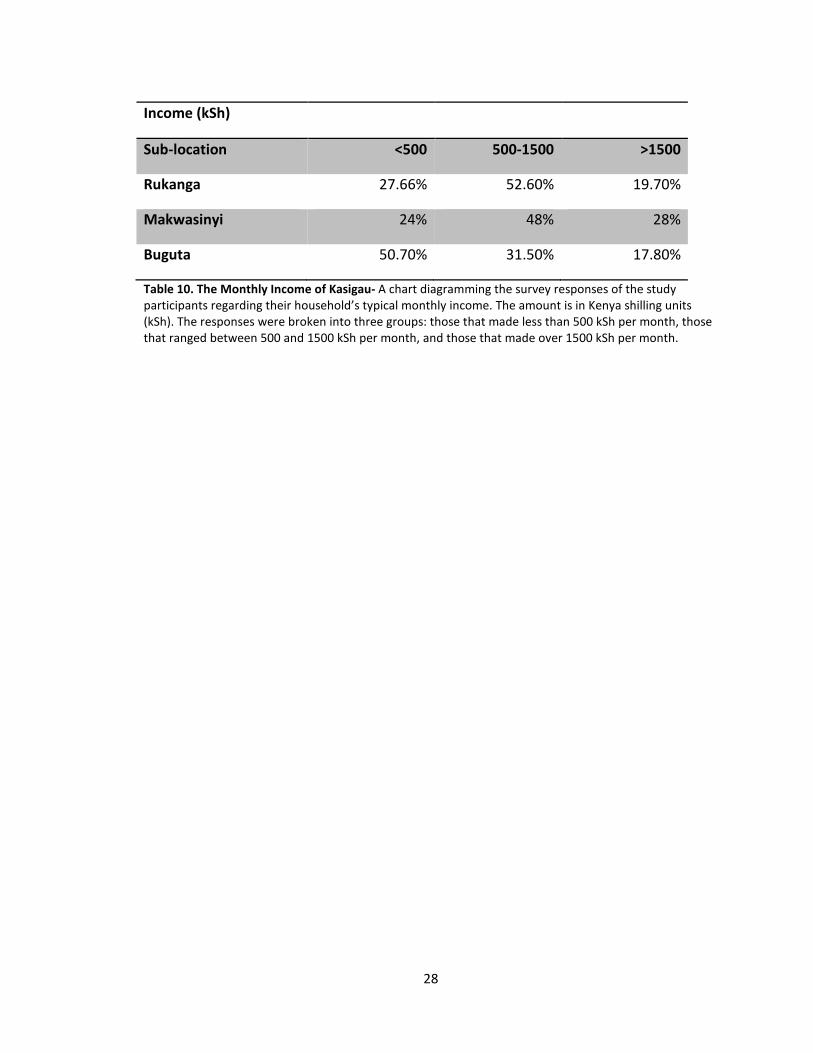
unhealthy activities, and get less exercise [6 and references therein, 20]. Indeed, when
the income of Buguta is analyzed in comparison to Rukanga and Makwasinyi, 50% of the
Buguta population falls within the lowest category of less than 500 kSh per month
(Table 10). This is ~2 fold more than Makwasinyi and Rukanga. The majority of residents
in Makwasinyi and Rukanga fell within the intermediate 500-1500 kSh income range.
This supports the hypothesis that other socioeconomic factors may also contribute to
EH in Kasigau.
28
Income (kSh)
Sub-location <500 500-1500 >1500
Rukanga 27.66% 52.60% 19.70%
Makwasinyi 24% 48% 28%
Buguta 50.70% 31.50% 17.80%
Table 10. The Monthly Income of Kasigau- A chart diagramming the survey responses of the study
participants regarding their household’s typical monthly income. The amount is in Kenya shilling units
(kSh). The responses were broken into three groups: those that made less than 500 kSh per month, those
that ranged between 500 and 1500 kSh per month, and those that made over 1500 kSh per month.
29
CHAPTER 4
DISCUSSION
The three main conclusions that can be drawn from this study of EH prevalence
in Kasigau, Kenya are that EH is indeed prevalent, that the common anthropometric risk
factors of BMI, WHR, and cholesterol are not the main or singular factors responsible for
this increased incidence, and that other socioeconomic factors may contribute to the EH
observed in Kasigau. The latter two findings suggest that other studies should be
conducted using these foundational data to document the socioeconomic factors such
as income, occupation, education level, stress levels, and dietary habits –all information
that can be extracted from the surveys that were given as a component of the research
data collected in this Partner’s in Caring trip to Kenya.
The fact that there is a high prevalence of EH in Kasigau that is not correlated
with normal anthropometric measures, suggests that other genetic factors may be
involved in this multifaceted disease. Our data support the hypothesis that epigenetic
and or polymorphic changes of the renin-angiotension gene system may have occurred
that effect the body’s ability to regulate salt absorption and secretion, thus inducing
salt-sensitive EH. Further research is currently being undertaken using DNA extracted
from the buccal cells of study participants. Genomic DNA is being isolated to see if
polymorphic variation in the ACE, AGT, AT1, and HSD11B2 genes known to correlate
30
with salt-sensitive hypertension, do in fact exist in the Kasigau population. These data
will be used to quantify the global methylation of hypertensive versus normotensive to
correlate epigenetic changes with salt-sensitive hypertension. This gene system is
referred to as RAAS (renin-angiotensin-aldosterone system) and many other studies are
being undertaken to try to determine the genetic modifications that affect RAAS.
Specifically in untreated black South Africans, polymorphisms in the CYP11B2 the
aldosterone synthase gene, have been shown to correlate with a higher systolic blood
pressure [21].
It is also important to consider how this study’s data fit in to the paradigm that
already exists, and to compare this study to ones focused on sub-Saharan Africa as well
as general studies on the global prevalence and impact of EH. Numerous studies have
indicated that people of African descent have a higher prevalence of EH than Caucasians
[20, 22, 23 and references therein, 24]. The National Health and Nutritional Survey
(NHANES) showed that in the US blacks had a 32% rate of hypertension, while whites
had a 23% rate of hypertension [23]. The Kasigau population in this study was
determined to have a 67% rate of EH, a considerably larger portion. Another study
indicates that in the year 2000, sub-Saharan Africa had a 27.7% rate of hypertension,
and established market economies had a 37.7% rate of hypertension. Tanzania, Kenya’s
southern neighbor, was shown to have a 31.3% rate of hypertension by that same study
[24]. Our data have significantly higher values for rates of hypertension than this study
as well. The US population had a 28.6% incidence of EH from 1999-2002 [6], which is a
much smaller number than the EH prevalence figure we found.
31
To improve upon this study, the expanding the sample group size should be
considered. The goal of the study was to conduct the research with approximately ~200
Kenyans. This number was reduced to 161 as many of the volunteers that were
recruited did not show up, a more representative cross section was attempted to be
obtained, and pieces of data were misplaced. If there had been more participants, it
would have more accurately represented the villages, the age categories, and the
genders. More females volunteered and showed up for the study than males and some
of the villages within the sub-locations are so small that it is difficult to obtain a proper
representative sample.
Another aspect to hypertension research that could be added to this project
would be conducting a urinalysis. A mircoalbumin test can be run as part of a urinalysis,
and it indicates overall kidney health. If microalbumin, a protein that is supposed to
remain in the blood, is leaking into the urine, it is a sign of kidney damage. Aside from
patients with diabetes, it is also a useful test for hypertensive individuals because
hypertension can induce long term kidney damage [25]. The degree of albumin in the
urine could indicate the amount of kidney damage which in turn could quantify the
effect of EH on an individual. A urinalysis would provide yet another parameter by which
to measure EH.
Now that a pilot study on essential hypertension in the Kasigau region of Kenya
has been conducted, the next step is to investigate the conclusions made from this
research. The long term goal is not to merely determine the root cause of EH. The
purpose of this research is to get to the source of this endemic disease problem and
32
provide relief for the people suffering from EH which predisposes them to other chronic
NCDs. Hopefully by preventing one of the leading risk factors for NCDs, EH, we will in
effect lesson the burden of NCDs in developing countries such as Kenya by providing
cost-effective therapeutic programs against EH. CVD is one of the many chronic diseases
that are having the greatest impact on developing nations. The successful techniques we
develop for preventing, treating, and controlling chronic high blood pressure in our
model population of Kasigau, Kenya, can be applied to and used by other developing
populations to lessen the impact of the current cardiovascular disease pandemic and
the total global disease burden. It has been suggested that successful programs for
controlling hypertension involve the use of multidisciplinary teams, more inclusion of
community health workers in the process, and more emphasis on getting the patients
involved in their care [11]. Such being the case, just making the community and the
Kenyan Ministry of Health and Sanitation more aware of the seriousness of the problem
of high blood pressure and its implications in other NCDs seems like it would go a long
way. A study in conducted in two rural Kentucky counties that had a high prevalence of
EH analyzed the implementation of a community wide hypertension control program
and noted that over a 5 year period, both blood pressure and CVD death rates
decreased when compared with a control county [26]. This leads me to believe that with
education and the right EH intervention programs put into effect, the same could
happen in this small rural African community. Another study emphasized two low-cost
preventative measures that can be applied to diet in Africans. The first is simply
decreasing sodium intact, and the second is increasing potassium intake, as both of
33
those adjustments have been shown to decrease EH [6]. Education on the detrimental
effects of obesity was also suggested, although it may be tougher to see strides made
BMI, because culturally, being heavy in Kenya is seen as a sign of wealth and status and
is more of an attractive feature.
I think it is clear that progress can be made in this small rural community of
Kasigau without involving an extensive overhaul of any systems the already have in
place. The biggest factor may simply be education in the area of NCDs and high blood
pressure’s relation to diseases like CVD, and modifying their diets. Reducing salt intake
would be of especial importance if it is indeed shown that there are genetic
modifications in this population’s RAAS. Once the genetic research and an extensive
study regarding the socioeconomic factors are completed, and good picture of the
region should be obtainable, and thus a program developed to lessen their NCD and
CVD burden. Hopefully, the results of the work done on this population system can be
applied to other Kenyan and East African communities.
34
APPENDIX 1: HSRB APPROVAL
35
APPENDIX 2: INFORMED CONSENT
36
REFERENCES
1 Causes of Death 2008 Summary Tables. 2011. Health statistics and informatics
Department, World Health Organization, Geneva, Switzerland.
http://www.who.int/evidence/bod
2 Alwan A, et al: Global status report on non-communicable diseases 2010. World
Health Organization, 2011. WHO Library Cataloguing-in-Publication Data. <
http://whqlibdoc.who.int/publications/2011/9789240686458_eng.pdf>
3 World Health Organization. (2008) Action Plan for the Global Strategy for the
Prevention and Control of Noncommunicable Diseases. World Health Assembly
Doc. A61/8.
4 Country Cooperation Strategy. 2009. World Health Organization [online].
<http://www.who.int/countryfocus/cooperation_strategy/ccsbrief_ken_en.pdf>
5 WHO Regional Office for Africa (2009). WHO Country Cooperation Strategy,
2008-2013 Kenya.
<http://www.who.int/countryfocus/cooperation_strategy/ccs_ken_en.pdf>
6 Hajjar I, Kotchen JM, Kotchen TA. Hypertension: Trends in Prevalence, Incidence,
and Control (2006). Annu. Rev. Public Health. 27:465-490.
7 National Heart Lung and Blood Institute (2012). Categories for Blood Pressure
levels in Adults. Retrieved from NHLBI:
http://www.nhlbi.nih.gov/hbp/detect/categ.htm
8 Office of the Prime Minister; Ministry of State for the Development of Northern
Kenya and Other Arid Lands. (2009). Arid Lands Resource Management Project II,
Taita Taveta District Annual Progress Report 2008-2009.
<http://www.aridland.go.ke/semi_annual_reports/semi_arid_08-
09/taita_taveta_08-09.pdf>
9 Census data, Kasigua, Kenya. 2009.
37
10 University of Helsinki Department of Biology (2009). Taita Hills.
http://www.helsinki.fi/science/taita/taitahills.html
11 Centre for Community Based Research (2007). What is Community Based
Research? Retrieved from CCBR: http://www.community
basedresearch.ca/Page/View/CBR_definition.html
12 Chobanian AV, Bakris GL, Black HR, Cishman WC, Green LA, Izzo JL, Jones DW,
Materson BJ, Oparil S, Wright JT, et al: Seventh report of the Joint National
Committee on Prevention, Detection, Evaluation, and Treatment of High Blood
Pressure. Hypertension 2003, 42(6):1206-1252.
13 Mayo Foundation for Medical Education and Research (2012). High blood
pressure (hypertension): Treatment and drugs. Retrieved from Mayo Clinic:
http://www.mayoclinic.com/health/high-blood-
pressure/DS00100/DSECTION=treatments-and-drugs
14 EH increases with age Mayo Foundation for Medical Education and Research
(2012). High blood pressure (hypertension): Causes. Retrieved from Mayo Clinic:
http://www.mayoclinic.com/health/high-blood-
pressure/DS00100/DSECTION=causes
15 Vertex 42, LLC. (2009). BMI chart. Retrieved from vertex42.com.
<http://www.vertex42.com/ExcelTemplates/bmi-chart.html>
16 Republic of Kenya Ministry of Health and Sanitation. 2010. National Clinical
Guidelines for management of Diabetes Mellitus.
<http://www.worlddiabetesfoundation.org/media(9616,1033)/WDF09-
436_National_Clinic_Guidelines_for_Management_of_Diabetes_Melitus_-
_Final_-_Complete.pdf>
17 Trejo-Gutierrez, J. F. (2012). The Obesity Paradox in CAD -How to Assess and
Reduce Obesity-Related CAD Risk. Clinical Challenges in Secondary Prevention of
CAD (pp. 24-31). Chicago : Mayo Clinic.
18 Gillum RF. (1979). Pathophysiology of hypertension in blacks and whites. A
review of the basis of racial blood pressure differences. Hypertension. 1979,
1:468-475.
38
19 Wells J, Treleaven P, Cole T. (2007). BMI compared with 3-dimensional body
shape: the UK National Sizing Survey. Am J Clin Nutr 2007, 85(2):419-425.
20 Mayo Foundation for Medical Education and Research. (2011, June 1).
Cholesterol Levels: What Numbers Should I Aim For? Retrieved from Mayo Clinic:
http://www.mayoclinic.com/health/cholesterol-levels/CL00001
21 Tiago AD, Badenhorst D, Nkeh B, Candy GP, Brooksbank R, Sareli P, Libhaber E,
Samani NJ, Woodiwiss AJ, Norton GR. Impact of renin-angiotensin-aldosterone
system gene variants on the severity of hypertension in patients with newly
diagnosed hypertension. Am J Hypertension. 2003; 16:1006-1010.
22 Colin BA, Adair LS, Poplin BM. Ethnic differences in the association between body
mass index and hypertension. Am J Epidemiol. 2002. 155(4):346-353.
23 Burt VL, Cutler JA, Higgins M, Horan MJ, Labarthe D, Whelton P, Brown C,
Roccella EJ. Trends in the prevalence, awareness, treatment, and control of
hypertension in the adult US population: data from the health examination
surveys, 1960-1991. Hypertension. 1995; 26:60-69.
24 Learney PM, Whelton M, Reynolds K, Muntner P, Whelton PK, He J. Global
burden of hypertension: analysis of worldwide data. Lancet. 2005; 365:217-223.
25 Mayo Foundation for Medical Education and Research. (2011, Aug 2).
Microalbumin test. Retrieved from Mayo Clinic:
<http://www.mayoclinic.com/health/microalbumin/MY00143>
26 Kotchen JM, McKean HE, Jackson-Thayer S, Moore RW, Straus R, Kotchen TA.
Impact of a rural high blood pressure control program on hypertension control
and cardiovascular disease mortality. JAMA. 1986; 255:2177-2182.
27 Opie LH, Seedat YK. Hypertension in Sub-Saharan African Populations.
Circulation. 2005; 112: 3562-3568.