The Power of Unofficial Expectations: Shareholder Value Management Strategies and Long Work Hours in...
29
eScholarship provides open access, scholarly publishing services to the University of California and delivers a dynamic research platform to scholars worldwide. Institute for Research on Labor and Employment UC Berkeley Title: The Power of Unofficial Expectations: Shareholder Value Management Strategies and Long Work Hours in California Author: Fligstein, Neil , University of California, Berkeley Sharone, Ofer , University of California, Berkeley Publication Date: 02-01-2004 Series: Working Paper Series Permalink: http://escholarship.org/uc/item/4gx2g9vk Keywords: Shareholder Value, Hours of Work Copyright Information: All rights reserved unless otherwise indicated. Contact the author or original publisher for any necessary permissions. eScholarship is not the copyright owner for deposited works. Learn more at http://www.escholarship.org/help_copyright.html#reuse
Transcript of The Power of Unofficial Expectations: Shareholder Value Management Strategies and Long Work Hours in...

eScholarship provides open access, scholarly publishingservices to the University of California and delivers a dynamicresearch platform to scholars worldwide.
Institute for Research on Labor andEmploymentUC Berkeley
Title:The Power of Unofficial Expectations: Shareholder Value Management Strategies and Long WorkHours in California
Author:Fligstein, Neil, University of California, BerkeleySharone, Ofer, University of California, Berkeley
Publication Date:02-01-2004
Series:Working Paper Series
Permalink:http://escholarship.org/uc/item/4gx2g9vk
Keywords:Shareholder Value, Hours of Work
Copyright Information:All rights reserved unless otherwise indicated. Contact the author or original publisher for anynecessary permissions. eScholarship is not the copyright owner for deposited works. Learn moreat http://www.escholarship.org/help_copyright.html#reuse

1
THE POWER OF UNOFFICIAL EXPECTATIONS: SHAREHOLDER VALUE MANAGEMENT STRATEGIES AND LONG WORK HOURS IN CALIFORNIA*
Neil Fligstein and Ofer Sharone
Department of Sociology
University of California
Berkeley, Ca.
February 2004
* This research was supported by a grant from the Institute for Labor and Employment, University of California.

2
I. INTRODUCTION
The structure of work has dramatically changed over the past 25 years. The
growing literature on the “new economy” workplace describes the increase in wage
inequality, the growing reliance on temporary and contract employees, and the
diminishment of job security (Osterman 1999, Smith 2001, Reich 2000). Less attention
has been paid to the demise of the forty hour work week and the growing dispersion in
work hours leading some workers to put in extremely long hours while others are not
working enough. The existing literature on work hours has been absorbed in a debate
about whether or not these changes amount to an overall increase in work hours. The
debate about aggregate trends has overlooked the critical question of who is working
longer hours and why? This paper begins to fill the gap in the literature by examining the
causes behind long work hours. We claim that the changes in work hours are best
understood as part of the same underlying transformation of the workplace that has
occurred pursuant to the rise of the shareholder value conception of the corporation. This
conception has replaced the dominant postwar “implicit labor contract” between the
corporation and its various stakeholders with management strategies that focus on
maximizing the financial value of the company’s stocks. As pertaining to work hours,
we will show how the logic of shareholder value management can account for the
elongation of work hours for certain types of workers who cannot be easily replaced with
machines or temporary workers. We will also analyze how and why companies utilize
indirect or “unofficial” management strategies to pressure certain of their employees to
work long hours.
3
II. REVIEW OF THE LITERATURE
The standard forty hour work week is dead. There is a vigorous debate over
whether aggregate work hours have increased over the past 30 years1, but no dispute
about the growing dispersion in work hours. The existing literature, however, is missing
any systematic analysis of the reasons behind the increase in work hours among certain
segments of the workforce. Jacobs and Gerson (1998) showed that long work hours are
associated with certain occupational categories. This paper builds on Jacobs and
Gerson’s findings by looking behind generic occupational categories and exploring the
characteristics of the workplaces where workers put in long work hours as well as the
subjective motivations reported by workers who are putting in long work hours.
With the growing polarization in work hours our society is experiencing both
overwork and underwork, with a simultaneous surge in the number of workers putting in
fifty plus hours per week (Jacobs and Gerson, 1998), and a growing number of
employees working irregular hours and wanting to work more. The existing literature has
shown that the dispersion in work hours follows certain patterns. Men generally work
more hours than women, but over the past 20 years women’s work hours have increased
1 In The Overworked American, Juliet Schor (1991) claimed that from 1969 to 1987 average annual American work hours increased by 163 hours. Supporting Schor, the International Labor Organization (1999) found that during the 1990s, average annual American work hours increased by 36 hours. Robert Reich’s (2000) analysis of 1999 data from the U.S. Department of Labor’s Report on the American Workforce provides further empirical support. Reich found that depending on the method of calculation, average annual work hours increased from 1979 to 1999 by either 71 hours or 142 hours. Using 1999 OECD data, Mishel et al (2001) found that American work hours increased by 61 hours from 1979 to 1998. Pointing in the other direction, Robinson and Godbey’s (1997) time-diary study claims that free time actually increased from 1965 to 1985.Coleman and Pencavel’s (1993) analysis also raises questions about the extent of the aggregate rise in work hours. [Is anyone disputing the rise of work hours in the 1990’s?]. Finally, Hout and Hanley have recently tried to reconcile these conflicting findings by showing that at the level of the household work hours have unambiguously increased.

4
at a faster rate than men’s (Mishel, 2001). To some extent the dispersion in work hours
also follows occupational groupings, with managers and professionals putting in more
hours than blue collar, service or other white collar workers. Fligstein and Shin
(forthcoming) have recently shown that while 50% of managers and 35% of professionals
work more than 40 hours a week, less than 30% of blue collar workers and other white
collar workers work such hours. Rones, Ilg and Gardner (1997) show that managers and
professionals are increasingly more likely than blue collar or service workers to work
over 49 hours per week. Putting together these occupational and gender differences,
Jacobs and Gerson found that among men, 35% of professional, managerial, and
technical employees work more than 50 hours a week, while only 20% of men in other
occupations work such hours. For women, 17% of professional, managerial, and
technical employees work more than 50 hours per week, as compared to 7% for women
in other occupations (Jacobs and Gerson 1998).
The fact that managers and professionals are working more hours than less
economically privileged blue collar and service workers should once and for all lay to
rest neoclassical economics’ myth of the backward bending labor supply curve. Whereas
neoclassical economists predicted that with an increase in the financial rewards of work
employees would choose to decrease their work hours, the empirical literature shows that
the opposite is in fact the case.
How can the long hours among the most privileged groups of workers be
explained? Economists like Schor (1991) and Reich (2000) argue that long work hours
are the result of economic incentives to increase consumption or to avoid the growing
opportunity costs of not working long hours. Sociologists have challenged this view with

5
qualitative case studies that point to management strategies which achieve non-economic
motivations. Arlie Hochschild’s (1997) study of a large manufacturing company
suggests that workers put in long hours because they are seduced by management’s
creation of a cozy home-like workplace which for many workers surpasses the
pleasantness of the home. Ofer Sharone’s (forthcoming) study of a large high tech firm
suggests that long hours are the result of management strategies that foster worker
insecurity and anxiety about their relative professional competence and status. While the
economists’ assumptions and the sociologists’ case studies suggest plausible explanations
for the rise in work hours, until now there has been no systematic survey study examining
the causes of long work hours.
The gap in the existing literature is two fold. First, there is no systematic analysis
of why managers, professionals and some other workers are working more hours. What
is driving an increasing number of them to forgo leisure and stay at work? Second, there
is no systematic examination of differences within groups who put in long hours. What
factors help explain why some managers and professionals put in long hours and others
do not? Is there anything that characterizes the workplaces of blue collar and service
workers who, unlike most others in their occupation, put in long hours?
III. HYPOTHESES
Our exploration of these questions was motivated by the theory that the patterns
in work hours are the result of the same fundamental shift to shareholder value
conception of the corporation that is at the root of the other transformations in the
structure of work. The shareholder value conception of the corporation was a response to
the economic crises of slow growth and low corporate profits during the 1970s.

6
Corporate elites understood these crises to be the result of firms being bloated with too
many workers, and workers having become lazy and complacent due to excessive
protection from the discipline of the labor market (Fligstein, 2001). With this analysis,
in the 1980s corporate executives adopted a new set of understandings about the meaning
and function of a corporation. The focus of the corporation shifted from growth and size
to profits and the value of the corporate stock in financial markets. With this new
corporate orientation came a new relationship between the firm and its workers. The
shareholder value management practices changed the firms’ relation to its workers from
long-term partners to costs that need to be minimized. The drive to minimize labor costs
in turn led to the outsourcing of work to companies paying low wages, hiring temporary
workers instead of new full time employees, and laying off workers. While at first
layoffs mostly affected blue collar workers, eventually, managing for shareholder value
lifted the taboo against laying off white collar workers (Osterman, 1999). In particular,
the recession of the early 1990s made downsizing a reality for middle managers,
professionals and other white collar workers (Fligstein & Shin, forthcoming). Smith’s
(1990) case study of “restructuring” at a large American bank provides a glimpse at the
process that typified that period’s policy of reducing the ranks of middle managers.
We theorize that the increasing work hours of managers, professionals and other
workers is the result of these shareholder value management practices. While the work
performed by laid off blue collar workers was usually replaced by automated production,
temporary workers or offshore workers, the work of laid off white collar workers was
supposed to be replaced through greater “efficiencies” attained by intensifying and
elongating the work for those who remain. The exertion of pressure on remaining

7
workers to work harder and longer flowed from the executive’s analysis of the “problem”
of lazy workers. We suspect that “lean” firms made up their lost white collar labor by
implementing management strategies that pressured workers to increase their work hours.
Because of the difficulties of totally replacing certain white collar workers, we
suspect that employers followed a bifurcated management strategy for achieving the
corporate goal of maximizing shareholder value. The labor costs for one group of
workers, consisting mainly of blue collar workers, service workers and other white collar
workers, are minimized by decreasing necessary full time worker hours through
automation, sending the work offshore, and use of temporary and/or part time shift
workers (who receive no benefits). The labor costs for the second group, mostly
professionals and managers, are minimized by hiring less people and having them work
longer hours. Since the functions of these workers often requires trained human
discretion which cannot be automated or assigned to untrained temporary workers, for
them work is instead intensified and elongated. This analysis suggests our first
hypothesis:
Hypothesis 1: Workers in jobs requiring the exercise of discretion, specifically
managers, professionals and other workers with supervisory authority, will put in longer
hours than blue collar, service or other white collar workers.
We further hypothesize that the management strategies to generate longer work
hours from managers, professionals or other valuable fulltime workers will operate by
indirect means and will not explicitly long hours. Traditionally these high status salaried

8
jobs have not imposed rigid work schedules, or mechanisms like punch-in cards that are
common for hourly workers. Any attempt to dictate a given number of work hours
among managers or professional employees would likely be seen as an affront to their
occupational status and professional autonomy. Faced with this constraint, we suspect
that firms turn to informal or “unofficial” forms of pressures that are built in to the work
process. For example, pressure to work long hours may be generated by the
establishment of tight deadlines for the completion of projects. Unlike dictates about
specific work hours, project deadlines - especially ones that emanate directly from
customers as opposed to bosses - seem to respect the employees’ autonomy while
generating pressure to put in long hours. We suspect another indirect strategy may be to
simply have employees be more accessible to customers or colleagues at odd times
through cell phones or beepers. Again, the employee is not required to work more, but is
available to communicate about work 24/7, predictably leading to more time spent doing
work. These management strategies do not impose explicit requirements, but do convey
management’s unstated expectations regarding long work hours. This analysis suggests
two further hypotheses:
Hypothesis 2: Long work hours are associated with workplaces that are characterized
by tight deadlines, a work pace set by customers, and use of cell phones and beepers.
Hypothesis 3: Workers putting in long hours will report that unofficial expectations, as
opposed to any explicit requirements or other factors, are the most significant reason for
their work hours.
9
Our data confirms these hypotheses. As we will show long work hours are most
strongly associated with workplaces that create “unofficial expectations” which subtly
pressure workers to put in long hours. Such expectations may be conveyed by the
exposure to tight deadlines for projects which come directly from customers as opposed
to superiors, or from the company “wiring” its workers to the workplace for 24/7
accessibility through cell phones and pagers. By contrast to the economists’
assumptions that long work hours are driven by financial concerns, or Hochschild’s case
study focusing on employee enjoyment of their work and work environment, we will
show that workers putting in long work hours tend to do so in response to managerial
pressure.
IV. DESCRIPTION OF THE DATA
The 2001 California Workforce Survey was designed to assess the
state of the California workforce. The survey collected data on California workers'
attitudes toward a range of issues as well as on the status, conditions and practices of
their employment. Interviews were conducted from September, 2001 until December
2001. The survey was sponsored by the Institute for Labor and Employment at the
University of California, Berkeley. Unionized workers were oversampled in this survey
to facilitate comparative analyses of unionized workers and non-unionized workers. Note
that those not currently working were asked most of the
attitudinal questions, but of course the questions about their current jobs were skipped.
There were two California samples for this study: a cross-section sample

10
and a union-member oversample. Both samples cover all telephone exchanges in the
state of Calilfornia. A total of 22 replicates were created to facilitate sample management
-- 12 of the 22 replicates were allocated to the cross-section sample in which all adults in
residential households were eligible, and the other 10 replicates were allocated to the
union-member oversample in which only adult union members currently working full- or
part-time were eligible.
Both samples of telephone numbers for this survey were generated using
a procedure called list-assisted random-digit sampling. This method preserves the
characteristics of a simple random sample but takes advantage of the availability of large
computer databases of telephone directory information to make the sample more efficient.
It allows us to reduce the number of unproductive calls to non-working telephone
numbers and to obtain a higher proportion of households in our sample than we would
achieve by simple random-digit dialing.
Briefly, the method works like this: all possible telephone numbers in the state
of California are divided into two strata -- telephone numbers from series of 100 numbers
with zero or one residential listing in the telephone directories, and telephone numbers
from series with at least two such listings. The sample of telephone numbers used for
this project was then generated with random numbers, in order to include unlisted
numbers, from the stratum containing series of telephone numbers with at least two
residential listings. The stratum containing series of telephone numbers with zero or
one residential listing is unlikely to contain many residential numbers, and therefore was
excluded from the sampling frame. For a detailed description of this sampling method,
see Robert J. Casady and James M. Lepkowski, "Stratified Telephone Survey Designs,"

11
Survey Methodology, Vol. 19 (June 1993), pp. 103-113. This procedure resulted in the
following sample. The survey had a response rate of 50.8% (1255 respondents out of
2471 households).
It is useful to compare some of the aggregate statistics in the survey with
published statistics from the Current Population Surveys (CPS) and the 2000 Census in
order to get an idea about how representative the sample is of California more generally.
According to the 2000 Census, 73.1% of the California population was born in the U.S.
In our sample, 69.3% were born in the U.S. The 2000 Census reports that whites
represent 47.7%, blacks, 6.4%, Latino 32.4%, Asian 10.8%, and Native Americans .5%.
In our survey, whites were 56.7%, blacks were 5.4%, Latinos, were 28.2%, Asian, 8.7%,
and Native Americans were 1.5%. According to the CPS, the California unemployment
rate in 2001 averaged 5.2%. In our survey, the unemployment rate was 5.3%. We note
that unemployment was rising over the year and our survey was done in the last part of
the year. The average education in California according to the 2000 Census was 13.4
years. In our sample it was 13.4 years as well. The 2000 Census reported that 59.6% of
Californians had attended some college and in our sample 63.3% attended college.
The CPS reports that in 2001, unionized workers represented 16.4% of the
employed population. In our sample union workers represented 17.7% of the employed
population. The 2000 Census reports that 35.4% of Californians are managers or
professionals. Our sample contains 34.0% managers/professionals. The 2000 Census also
reports that 15.7% of Californians work for the government while 19.3% of the
respondents in our survey work for the government. Our sample, thus, is less racially and
ethnically mixed than the census, although it contains slightly more foreign born persons.

12
The sample has a similar educational mix to the census. It has people who are slightly
more likely to be in unions. It also contains people who are less likely to be managers and
professionals and more likely to be working for the government.
Our survey does not consistently appear to draw on higher or lower
socioeconomic groups. But there are some differences between the sample and the
datasets that reflect more accurately the whole population of California. The main
discrepancy between our survey and other sources is that our survey draws on more
whites. As with any sample, one always needs to be cautious in drawing inferences for
the population. The main advantage of our survey is its wealth of information on work
settings and working conditions. It is these results that are the focus of the rest of our
discussion.
V. DISCUSSION OF DATA
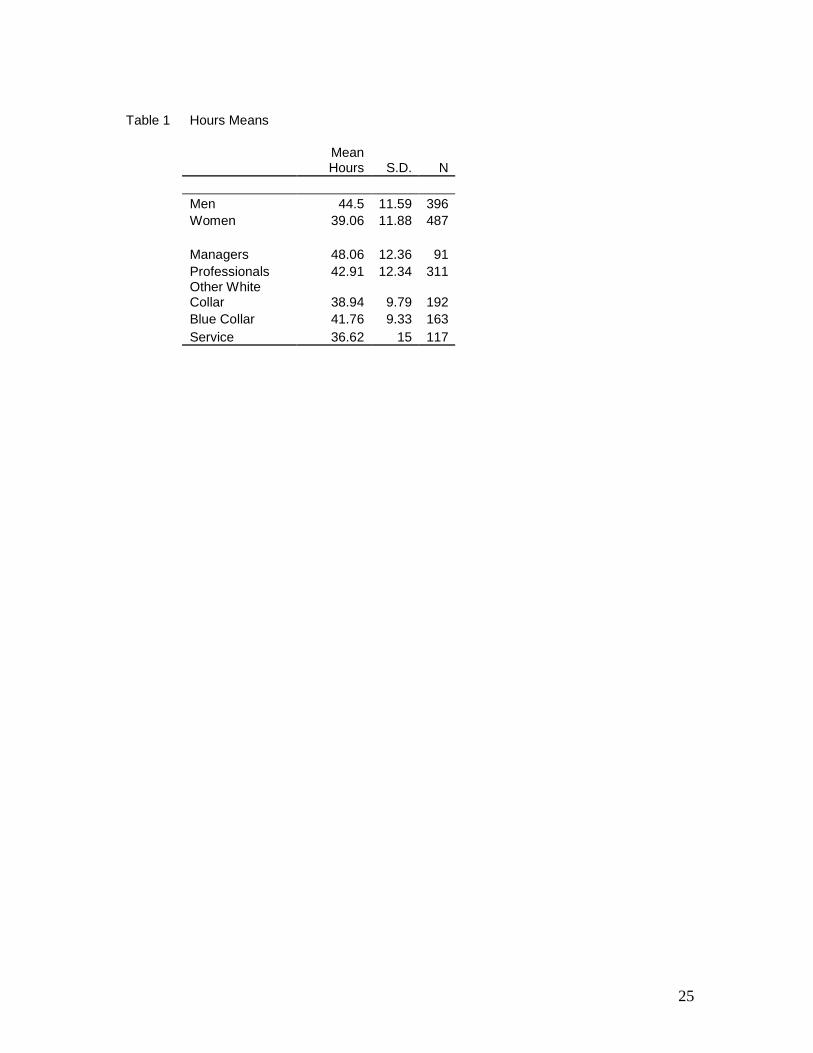
Table 1 and Table 2, Model A, confirm the patterns that are well-documented in
the literature regarding the considerable work hour differences across genders and
occupations. In model 2a, Women work 5.6 hours less, on average, than men. This
gender gap is not attributable to differing occupations since the regression holds
occupational groupings constant. We suspect the gap reflects the persistence of women’s
disproportionate obligation for child rearing. Age is also an important factor. The
relationship between age and work hours is curvilinear. Looking at the coefficients for
age and age-squared together we see that work hours rise an average of 1.4 hours for each
additional year of age, but peak at age 43.9 and decrease thereafter. We hypothesize that
the rise of work hours with age during workers’ twenties and thirties reflects the structure

13
of most jobs which demand an increasing amount of work time from workers who hope
to rise in responsibility, position and pay. By the time most workers reach their mid-
forties the most competitive phase for advancement to elite positions may be over and
they settle in for more comfortable work-hour patterns. This prevalent job structure,
which demands most hours precisely during the time of life when workers have young
children, may partly explain the public outcry about “a time crunch” for families.
(Table 1 about here)
The findings presented in Table 2-A regarding occupational differences in work
hours also fits the existing literature. Workers were divided among 5 occupational
groupings: managers, professionals, other white collar workers, blue collar workers and
service workers. We created 4 dummy variables, with service workers (the group with
the least average weekly hours) being the reference group. Table 2-A shows that, holding
gender constant, in comparison to service workers managers put in the most average
hours, with 6 hours more than service workers, followed by professionals with 4.3 more
hours. Blue collar workers and other white collar workers worked 2.2 hours more per
week than service workers, but the difference was not statistically significant.
(Table 2 about here)
As previously discussed we interpret the greater work hours of managers and
professionals to reflect the corporate strategy to maximize shareholder value by
elongating the work day for employees with functions that cannot be automated or
assigned to temporary workers. This interpretation of the data is bolstered by looking at
another variable in table 2-A which explores the relationship between work hours and
work function. Workers were asked whether they supervise other workers. Those who
14
hold a supervisory position work an average of 4.1 more hours a week than workers who
do not. This finding supports our hypothesis that the workers who are putting in longer
hours are performing functions that cannot be easily automated, temporized or outsourced.
While the existing literature has mostly focused on occupational groupings, it is striking
that having a supervisory function can mean a greater difference to average work hours
than occupational differences. For example, the 4.1 hour difference between a
professional who supervises and one who does not is almost double the 2.1 hour
difference between a professional and a blue collar worker. To appreciate the extent of
work hours polarization by occupational grouping and function, consider that most
managers are also supervisors creating a combined effect of working 9 hours more per
week than a non-supervisory service worker.
Thus far our regression data have confirmed the finding of other work hour
studies that the dispersion of work hours is patterned by some personal characteristics
such as gender and age, as well as occupational grouping. We additionally noted the
importance of having a supervisory position, which shares with most management and
professional jobs the quality of requiring trained human discretion. In our next
regression Model B, we consider an additional set of variables which have hitherto not
received much attention in the work hours literature, but which we believe shed some
light on the corporate strategies to generate longer work hours. Because the type of
workers which companies seek to have work longer hours tend to be in high status
occupational categories and positions within these occupations, we hypothesize that
attaining long work hours from these employees cannot be achieved by hierarchical
dictates that offend the workers’ sense of autonomous professionalism. Rather, long

15
hours are expected to result from an organization of work that exerts subtle pressures.
Indeed, as regression model 2-B will show, workplace organization variables turned out
to also be extremely important and provide a glimpse at how long hours workplaces
operate. As suspected, they do not coerce long work hours or intense work by
management dictates, but foster intensification through tight deadlines, often conveyed
directly by customers, and by keeping their workers wired to the workplace at all times.
Looking at Table 2-B, it can be seen that one of the most important determinants
of work hours is whether or not a job involves tight deadlines. Workers at workplaces
with tight deadlines on average work 2.9 hours more per week. To appreciate the relative
importance of this variable, note that working under tight deadlines has a virtually the
same impact on work hours as the difference between being a professional and a service
worker. In general, the relative importance of the tight deadlines variable suggests that
work hours are not simply determined by the general demands of certain occupational
categories or ones’ position within such category, but to a significant extent vary
depending on how management organizes the work process. Organizing work in a
manner that regularly imposes tight deadlines leads to greater work hours not only for
managers and professionals, but also among other occupational categories. These tight
deadlines do not seem to function like traditional speedups where bosses demand more
work in less time.
We get a fuller sense of how the typical long hours workplace is organized by
examining a set of variables which asked workers what factors determine the pace of
their work. The pace variables reveal that long work hours are associated with
workplaces where deadlines are not set by dictatorial bosses, but in more indirect way. In

16
fact, the regression shows that workers who report being at a workplace where “orders of
boss” are important in determining their work pace tend to work shorter hours. Of all
the various determinants of work pace the only one that was statistically significant and
positively associated with long work hours was being determined by “requests from
customers.” All else equal, workers whose work pace is set by customers tend to work
2.3 hours more than other workers. Rather than a hierarchical command and control
management system with a boss telling workers how fast they have to work, long work
hours are most typically found at workplaces that expose workers in an unmediated way
to the demands of customers. These data suggest that one indirect but effective way to
pressure workers to put in more hours may be simply to increase the number of customer
accounts for which they are responsible. Waiting customers pestering workers to provide
prompt service may be more effective than the employer directly asking workers to put in
extra hours. Consistent Putting this together with the previously discussed tight
deadlines variables we conclude that the long work hours workplace are organized by
management strategies that maintain tight deadlines by removing any shields between
workers and the demands of customers for prompt performance.
Regression model 2-B further reveals that another significant variable in
determining work hours was whether the respondent has cell phone or pager that makes
him/her available after normal work hours. Being “wired” to the office through the
possession of such cell phone or pager, in addition to making any time or place a
potential work moment, in fact increased average work hours by 3.4 per week. This
finding confirms the common impression that possession of these new
telecommunication devices does in fact lead to working more hours. Whether at the park

17
for a Saturday picnic with the family or vacationing on the beach, work is only a ring
away. We can only speculate that email has likewise increased the reach of work.
Like tight deadlines emanating from customers, the possession of a cell phone or pager is
not an explicit management demand for more work hours but an indirect means of
attaining the same goal simply by making the worker available to colleagues, customers
or the boss.
Looking at these variables in aggregate, we begin to see the outline of the long-
hours workplace. It does not directly coerce long work hours but fosters long hours in
more subtle ways such as exposing workers to tight deadlines directly from customers, or
by making workers accessible through new forms of telecommunications. While these
variables provide some hints about what the long-hours work place looks like, the overall
causal mechanism becomes clear upon examining the results of the survey’s battery of
questions regarding the causes of overtime work.
The ILE survey asked respondents to rank the importance, or lack thereof, of
seven specific factors that may motivate them to work overtime. This unique set of
questions enables us to analyze the issue of causation in a more systematic and nuanced
manner than has been thus far possible in the existing literature. The seven motivation
questions embody some of the leading hypotheses about the causes of long work hours.
To test the economists’ focus on material motivation, employees were asked whether
they work extra hours because they want extra pay or because they are seeking to
advance within the company. To find out whether there is direct employer coercion to
work more hours workers were asked whether they work extra hours because they are
“required to” do so, or need to do so “to get the work done.” To examine Hochschild’s

18
thesis, employees were asked whether they work extra hours because they “enjoy the
work,” or because the respondent “enjoy the workplace and co-workers.” Finally, to test
our own hypothesis that long work hours are the product of shareholder value
management strategies which seek to pressure employees without appearing coercive,
employees were asked whether they put in extra hours because they are “unofficially
expected to” by the company or boss.
In regression model 2-C, we added to the previous model this set of 7 possible
reasons to work extra hours. When regressing these 7 factors against hours worked, and
holding constant all the other independent variables that we previously discussed, it is a
striking finding that only one factor is statistically significant and positively correlated to
working more hours: working extra hours because the employee is “unofficially expected
to” do so. The importance of being “unofficially expected” to work overtime by your
supervisor or company supports our earlier findings regarding the organization of work
that correspond to long work hours. The significance of tight deadlines, cell phones and
pagers, and a pace set by customers, neatly fit together with unofficial expectations to
present a portrait of the long-hours workplace as one that does not directly require long
hours by managerial fiat, but utilizes indirect and subtle managerial tactics to pressure
workers to work such hours.
The unique importance of indirect and unofficial forms of managerial pressures to
work long hours is further supported by considering the meanings of the negative
coefficients for other reasons workers may work extra hours. Working overtime for
extra pay has a negative coefficient of -2.4 hours. This means that respondents who are
motivated to work long hours for direct financial gain on average work less hours than

19
workers for whom this is not an important reason. This finding is not surprising since the
workers most motivated to work long work hours by financial concerns are those who are
not working enough hours.2 Furthermore, the negative coefficient of 1.1 hours for being
“required to” work extra hours also supports our prior findings regarding management
practices at long hours workplaces. Just as workplaces where the pace of work is set by
dictates of the boss are not associated with long hours, these data show that long work
hours are also not typically the result of direct managerial coercion to work extra time.
The negative coefficient to being “required” to work extra hours (though not statistically
significant) indicates that those who work overtime because they are “required to” on
average work less hours than those for whom this is not an important reason.
If long work hours are not the result of management coercion, perhaps workers
put in extra hours out of enjoyment of their work? It is commonly thought that workers,
and especially professionals and managers, work long hours because they are enjoyably
engrossed in their work or find the work environment pleasant to linger in. For example,
in her well-known book the Time Bind Hochschild claimed that long work hours are
partly attributable to the familial atmosphere at the workplace where colleagues enjoy
being with each other. Regression model 2-C, however, shows that enjoyment of work
and enjoyment of colleagues do not have a statistically significant relationship to work
hours. In other words, those who said that enjoyment of work or of colleagues is an
important reason for working overtime were not different in their work hours, in a
statistically significant way, than those who said that enjoyment of work or colleagues is
2 This finding is also borne out by our analysis of the relationship between financial difficulties and work hours. Respondents who reported to be having a tough time financially are working shorter hours than those who are doing fine.

20
not an important reason. While many workers reported enjoying their work and work
environment, this fact did not distinguish among those who actually did work more hours.
The singular importance of “unofficial expectations” as the only factor that is
positively and significantly associated with long work hours can be seen in even starker
terms by looking at the relationship between the 7 various reasons to work extra hours
and the likelihood of an employee working overtime.
(Table 3 about here)
In table 3, the same independent variables were regressed against a new binary
dependent variable labeled “overtime.” This dependent variable divides the respondents
into those who reported usually or frequently working overtime (coded with value =1)
and those who reported only doing so sometimes or never (value = 0). When looking at
what factors make it more likely that a worker will in fact work overtime, we can see that
the only statistically significant reason was being “unofficially expected to” work
overtime. The 0.19 positive coefficient means that workers who reported that unofficial
managerial expectations was an important reason to work overtime were 19% more likely,
all else equal, to usually or frequently work overtime. Astonishingly, in this regression
“unofficial expectations” are the second most powerful predictor, following being a
manager, of whether an employee is likely to usually or frequently work overtime. It is a
more important predictor than gender, being a professional or a supervisor, among others.
This finding strongly supports our prior conclusion regarding the importance of
management strategies that seek to extract long work hours through creating subtle and
indirect pressures.

21
VI. CONCLUSION
This paper explored the causes of long work hours among Californians. Our
findings suggest that long work hours are not merely the result of a gendered division of
labor or occupation specific work hour patterns. Whiles these factors are clearly
important, they do not explain variations within gender and occupational groupings.
Further analysis of the data suggested that long work hours are not typically the result of
employee enjoyment or their work or workplace, of direct employer coercion, or of a
desire to earn more money. Instead, our findings support the hypothesis that workers
putting in longer hours are subject to managerial regimes where they face “unofficial
expectations” to work extra hours.
As discussed at the start of this paper we believe these management strategies can
be traced to the rise of the shareholder value conception of the corporation. Under this
conception, executives seek to minimize all labor costs in order to maximize financial
returns for shareholders. For workers who cannot be replaced by machines or temporary
workers because their work involves trained human discretion, the strategy is to hire
fewer of them and to pressure them to work longer hours. In this way employers
perceive themselves to be eliminating the unnecessary “fat” and making sure that those
who remain do not fall into the complacent laziness characteristic of the 1970s economic
malaise.
Since the employees that companies seek to motivate to work harder and longer
are typically salaried professionals, managers and/or in supervisory positions, employers
cannot simply obtain greater work hours through dictatorial measures. Such a step would
undoubtedly elicit resistance by offending these employees’ sense of professional

22
autonomy. Instead, as the data in this paper show, employers implement strategies that
create “unofficial expectations” which subtly pressure employees to put in more work
hours. Such unofficial expectations may, for example, be conveyed through tight
deadlines coming directly from customers (not bosses). Alternatively, making colleagues
available to each other and to customers for calling after-hours with an urgent work
related question is not experienced as a coercive requirement to work. Yet, as our data
show, is it quite effective in achieving this goal.
Ultimately this study raises more questions than it answers. Nevertheless, it
points the direction for the much needed further research. Future studies could fruitfully
explore how unofficial expectations are conveyed to workers? Or, how are new
telecommunication devices being used to increase work hours? This kind of analysis
could help workers, citizens and policymakers consider the optimal measures for dealing
with the social problems associated with overwork.

23
BIBLIOGRAPHY
Fligstein, Neil. 2001. The Architecture of Markets. Princeton, N.J: Princeton University Press.
Fligstein, Neil, and Taek-Jin Shin. “The Shareholder Value Society: A Review of the Changes in Working Conditions and Inequality in the U.S. 1976-2000.”
Hochschild, Arlie. 1997. The Time Bind. New York: Metropolitan Books.
International Labor Organization. 1999. Key Indicators of the Labour Market, 1999. International Labour Office.
Jacobs, Jerry, and Kathleen Gerson. 1998. “Who Are the Overworked Americans?” Review of Social Economy. 56 (4): 442-459
Kunda, Gideon. 1992. Engineering Culture: Control and Commitment in a High-Tech Corporation. Philadelphia: Temple University Press.
Mishel, Lawrence, Jared Bernstein, and John Schmidt. 2001. The State of Working America: 2000-2001. Washington DC: Economic Policy Institute.
Osterman, Paul. 1999. Securing Prosperity. Princeton, NJ: Princeton University Books.
Perlow, Leslie. 1996. Finding Time: How Corporations, Individuals and Families Can Benefit from New Work Practices. Ithaca, NY: Cornell University Press.
Reich, Robert. 2000. The Future of Success. New York: Knoff.
Robinson, J. and Godbey G. 1997. Time for Life. State College: Pennsylvania State University Press.
Rones, Philip, Randy Ilg, Jennifer Gardner. 1997. “Trends in Hours of Work since the Mid 1970's.” Monthly Labor Review. 120: 3-14.
Schor, Juliet. 1991. The Overworked American: The Unexpected Decline of Leisure. New York: Basic Books.
Smith, Vicki. 2001. Crossing the Great Divide: Worker Risk and Opportunity in the New Economy. Cornell University Press.

24
--------------. 1990. Managing in the Corporate Interest: Control and Resistance in an American Bank. Berkeley: University of California Press.
25
Table 1 Hours Means
Mean Hours S.D. N
Men 44.5 11.59 396Women 39.06 11.88 487
Managers 48.06 12.36 91Professionals 42.91 12.34 311Other White Collar 38.94 9.79 192Blue Collar 41.76 9.33 163Service 36.62 15 117

26
Table 2 Hours - how many hours per week usually work
Independent Variables Model A (hours) Model B (hours)Model
C (hours)Coef. (S.E.) Coef. (S.E.) Coef. (S.E.)
gender (Women = 1) ** -5.60 0.809 **-4.82 0.813 **-3.14 0.901age ** 1.17 0.172 **1.16 0.17 **1.08 0.211agesq ** -.01 0.002 **-.01 0.002 **-0.01 0.002
managers ** 6.04 1.549 **4.91 1.56 **4.61 1.711professionals **4.30 1.244 **3.05 1.27 1.61 1.524other white collar 2.17 1.26 1.28 1.27 1.48 1.645blue collar 2.23 1.24 **2.66 1.25 1.68 1.506supervise **4.15 0.809 **2.94 0.83 **2.07 0.915
tight deadlines **2.96 0.78 **3.82 0.887cell or pager **3.38 0.92 **2.94 0.941pace set by:
customers **2.31 1.04 1.43 1.24boss -1.6 0.86 **-3.55 0.989coworkers -1.51 0.79 -1.66 -1.66
Work extra hours because:required to -1.17 0.961unofficially expected to **2.80 0.957want extra pay **-2.43 0.975want advance in company 1.08 0.993need to get work done -1.59 1.426enjoy work 1.58 1.27enjoy workplace/colleagues 0.845 1.058
Constant **16.26 3.316 **15.06 3.4 **20.81 4.496R Squared 0.205 0.245 0.241
* P < .05**P < .01

27
Table 3 Overtime How often work overtime0 = sometimes or never work overtime1 = usually or frequenty work overtime
Independet Variables Model A (overtime)) Model B (overtime)Model
C (overtime)Coef. (S.E.) Coef. (S.E.) Coef. (S.E.)
gender (Women = 1) **-0.74 0.158 **-0.63 0.165 -0.36 0.193age *0.09 0.037 *0.08 0.038 0.037 0.049
agesq *-0.001 0.005*-
0.0009 0.0004 -0.0006 0.0006
managers **1.2 0.329 **1.08 0.343 **1.09 0.421professionals *0.61 0.245 0.5 0.259 0.12 0.318other white collar -0.34 0.273 -0.41 0.285 -0.37 0.352blue collar 0.06 0.27 0.12 0.283 -0.211 0.345supervise **0.65 0.154 **0.44 0.164 0.31 0.192
tight deadlines **0.73 0.162 **0.57 0.193cell or pager **0.5 0.183 0.233 0.212pace set by:
customers 0.19 0.2 0.1 0.242boss *-0.34 0.173 **-0.6 0.213coworkers 0.16 0.163 0.09 0.189
Work extra hours because:required to 0.06 0.215unofficially expected to **0.87 0.21want extra pay -0.22 0.21want advance in company 0.04 0.21need to get work done 0.12 0.308enjoy work 0.2 0.259enjoy workplace/colleagues 0.15 0.224
Constant **-2.2 0.74 **-2.4 0.773 -1.05 1.056
* z < .05**z < .01

28
Table 4 OVER45 0 = work 45 hours or less per week1 = work more than 45 hours per week
Independet Variables Model A (over45)) Model B (over45)Model
C (over45)Coef. (S.E.) Coef. (S.E.) Coef. (S.E.)
gender (Women = 1) **-0.88 0.176 -0.77 0.184 **-0.59 0.205age **0.14 0.045 **.12 0.046 0.1 0.056agesq **-0.002 0.0005 *-0.001 0 -0.001 0
managers **1.04 0.347 **0.98 0.374 *1.04 0.42professionals 0.41 0.292 0.29 0.317 0.03 0.368other white collar 0.003 0.328 -0.21 0.35 0.27 0.412blue collar 0.11 0.322 0.26 0.344 0.19 0.396supervise **0.7 0.178 *0.4 0.19 0.37 0.211
tight deadlines **0.75 0.189 **0.63 0.213cell or pager **0.9 0.189 **0.72 0.208pace set by:
customers 0.08 0.238 -0.02 0.269boss -0.29 0.192 -0.51 0.221coworkers -0.06 0.184 -0.13 0.202
Work extra hours because:required to 0.15 0.224unofficially expected to **0.75 0.217want extra pay **-0.61 0.224want advance in company 0.28 0.229need to get work done -0.55 0.341enjoy work 0.43 0.292enjoy workplace/colleagues -0.03 0.239
Constant **-4.2 0.914 **-4.3 0.955 **-3.4 1.23
* P < .05**P < .01