Planning Annualised Hours with a Finite Set of Weekly Working Hours and Joint Holidays
22
Electronic version of an article published as [Annals of Operations Research, 2004, Vol. 128, No. 1-4, p. 217-233] [DOI: 10.1023/B:ANOR.0000019106.52631.ff] © [copyright Springer Verlag] The original publication is available at www.springerlink.com
-
Upload
independent -
Category
Documents
-
view
4 -
download
0
Transcript of Planning Annualised Hours with a Finite Set of Weekly Working Hours and Joint Holidays

Electronic version of an article published as [Annals of Operations Research, 2004, Vol. 128, No. 1-4, p. 217-233] [DOI: 10.1023/B:ANOR.0000019106.52631.ff] © [copyright Springer Verlag] The original publication is available at www.springerlink.com

1
Planning annualised hours with a finite set of weekly
working hours and cross-trained workers1
Albert Corominas, Amaia Lusa and Rafael Pastor2
Research Institute IOC / School of Industrial Engineering of Barcelona (ETSEIB)
Technical University of Catalonia (UPC), Barcelona, Spain
{albert.corominas/amaia.lusa/rafael.pastor}@upc.edu
Abstract
Annualising working hours (i.e., the possibility of irregularly distributing a total number
of working hours over a year) permits companies to adapt capacity to fluctuations in
demand, thus reducing overtime, temporary workers and inventory costs. Since annual
hours can lead to a worsening of the staff’s working conditions, many laws and
collective bargaining agreements contain constraints that affect the distribution of
working time. This paper proposes a MILP model to solve an annualised working hours
planning problem in which workers are considered to be cross-trained, and in which the
number of weekly working hours must belong to a previously agreed finite set. A
computational experiment demonstrates the effectiveness of the model.
Keywords: human resources, manpower planning, annualised hours, integer programming.
1. Introduction
Annualising working hours (AH) consists of hiring workers for a certain number of
hours per year and distributing those hours irregularly over the year in order to
accommodate fluctuations in demand. It allows for a better use of potential capacity
1 Supported by the Spanish MCyT projects DPI2001-2176 and DPI2004-05797, co-financed by FEDER. 2 Corresponding author: Rafael Pastor, Research Institute IOC, Av. Diagonal 647 (edif. ETSEIB), p.11, 08028 Barcelona, Spain; Tlf. + 34 93 401 17 01; Fax. + 34 93 401 66 05 ; e-mail: [email protected]

2
because one can better adapt capacity to demand throughout the year. This flexibility in
the use of human resources is especially useful in service organizations and in
manufacturing organizations where products cannot be inventoried (e.g. are perishable).
The major advantage of annualising working hours is the reduced economic cost in
comparison to other options. By using AH, costs due to a lack of capacity can be
diminished and, in some cases, eliminated. Vila and Astorino (2001) give an example of
a real AH scenario: an agricultural machinery manufacturer that introduced AH was
able to reduce the overtime and the use of temporary workers by 94% and 53%
respectively. A reduction in the use of temporary workers can also lead to an
improvement in productivity and in the quality of the product or service. Furthermore,
the service level can be improved, since demand can be covered on time.
However, AH often implies a worsening of the staff’s working conditions (e.g. an
irregular schedule can affect workers’ private lives) and the need to solve a complicated
working time planning problem.
To minimise the negative effects on the workers, the annualisation of working time has
to be negotiated and may be accompanied by some sort of compensation or incentive:
additional holidays, financial compensation, etc. At the same time, legal constraints or
constraints drawn from a collective bargaining agreement must be respected.
The importance of annualising hours, as a source of flexibility, is increasing (Oke,
2000). The number of firms that are signing AH contracts is rising. However, and in
spite of its growing importance, the manpower planning and scheduling problems
generated by AH have not been widely studied up to now.
Corominas and Pastor (2000) and Campbell and Diaby (2002) propose a three-phase
method in which planning, scheduling and task-assignment or allocation problems are
successively solved.
This paper deals with the first phase: solving a working time planning problem. Though
several models have been created to solve it, the annualisation of working hours is a
subject that remains largely unexplored. Several papers discuss AH (e.g., Clutterbuck,

3
1982; Curran, 1992; Lynch, 1995; MacMeeking, 1995; and Mazur, 1995), but only from
a qualitative point of view. Other authors emphasize that the concept of annualised
hours is surprisingly absent from the literature on planning and scheduling (Hung,
1999a; Hung, 1999b; Grabot and Letouzey, 2000; and Azmat and Widmer, 2004).
Corominas and Pastor (2000) propose the use of MILP for solving an annualised
working hours planning problem, but they also point out that there are many different
types of problems, each of which requires a specific approach to modelling and
solution.
In Corominas et al. (2004a), the characteristics of a planning problem are discussed and
a classification scheme is proposed, which gives rise to thousands of different cases.
Some of these types of problems are solved in other papers (see Corominas et al., 2002,
2003, 2004b) and the obtained solutions show that when an AH system is compared to a
traditional system (regular working hours), the costs due to overtime, temporary
workers, subcontracting, lost demand and, in some cases, inventory, are diminished. Up
to now, MILP has proved to be an efficient tool for solving this kind of problem, even
for large size models. However, as it is known, MILP algorithms are very sensitive to
changes in the structure, in the objective function and, of course, in the size of the
models. Thus, further research has still to be done to verify whether MILP is a suitable
technique to solve other different cases or not.
Some of the aforementioned papers deal with manufacturing companies and the
problem of planning the production and the working time of an industrial process (and
not the working time of each worker). This paper solves an annualised hours planning
problem based on a real case which is a chain of clothing department stores. The main
contributions of this paper, compared to previous research dealing with planning
working time in service companies, are: i) overtime and temporary workers are not
permitted, hence a capacity shortage is possible during certain weeks and a new utility
function based on the service level is proposed; ii) workers are considered to be cross-
trained: there are different sets of worker categories who can perform different types of
tasks, with different efficiencies for each type of task and each category; and iii) the
number of weekly working hours must belong to a previously agreed finite set that may
be different for every worker and the holiday weeks are individualised.

4
The layout of the rest of this paper is as follows: Section 2 introduces the problem;
Section 3 discusses the objective function; Section 4 describes the planning model;
Section 5 describes the computational experiment and Section 6 presents the
conclusions.
2. Problem description
Computing the solution of a planning problem implies determining the number of
weekly working hours for each member of the staff at a service centre (assuming
different types of tasks and levels of seasonal demand) and for each non-holiday week
of the planning horizon (a year, for instance), with the objective of optimising a utility
function. It is assumed that workers do not take their holidays at the same time, as it
commonly happens in many work centres.
Numerous collective bargaining agreements do not permit overtime. In a number of
other cases, tasks are too difficult to be performed by temporary workers. For the
purposes of this paper, as the possibilities of overtime or hiring temporary workers are
not considered, a capacity shortage is possible during certain weeks.
There are a specified number of worker categories and a predetermined number of tasks
to be performed. Though a worker of a given category may be able to perform one or
more types of tasks, it is possible that he or she performs them with different
efficiencies. Therefore, workers in different categories may be able to meet the demand
for a task, but certain categories of workers may need more time to do so than others.
To model this, a relative efficiency is considered for each type of task and each
category. A value of 0.9 signifies that a worker in a given category needs to work 1/0.9
hours to meet a demand that a worker with a relative efficiency equal to 1 would meet
in 1 hour.
The conditions to be met by the solution may stem from a legal resolution, such as the
French 35 hours law (which establishes a general reduction in the total amount of
annual working hours, without a reduction in wages, and permits an irregular
5
distribution of hours over the year, provided that the rules stipulated by the law itself are
observed; see MES, 2003), or from a collective bargaining agreement between
management and workers. Due to the impossibility of establishing an exhaustive list of
conditions a priori, the most common conditions are considered in order to build a basic
model for the problem. Note that constraints can be added or deleted in order to adapt
this model to any specific case.
One way to constrain the solutions is by specifying that the number of weekly working
hours must belong to a finite set (of the types of working weeks), which may be
different for each worker and for each week. In addition, the number of annual working
weeks of each type must be previously established and may also be different for each
worker.
The types of working weeks and the annual number of each type are established by the
collective bargaining agreement. However, the planning procedure proposed here could
be useful for evaluating different sets of working week types; therefore, managers and
workers would be able to negotiate the most appropriate set for both. Furthermore, an
extension of this paper could consider the different types of working weeks as variables
in the planning model.
These conditions, added to individualised holidays, force us to consider each worker
separately. Of course, this increases the size of the problem and therefore makes it
difficult to solve.
In the case of the French 35 hours law, the weekly numbers of working hours must fall
within an interval defined by a lower and an upper bound; the total number of annual
working hours is upper bounded (these two conditions must be considered when
creating the set of weekly working hours and establishing the number of annual weeks
of each type); and the average number of weekly working hours, for any set of twelve
consecutive weeks, is upper bounded (though it is assumed that this condition applies
only to sets of twelve consecutive non-holiday weeks).
The characteristics of the problem are summarized below:

6
– The number of weekly working hours must belong to a previously agreed finite set,
which may be different for each worker (for instance, working weeks of 25, 35 and
45 hours).
– The number of annual working weeks of each type is established and could be
different for each worker (for instance, 11, 24 and 11 weeks of working weeks of
25, 35 and 45 hours respectively).
– The average number of working hours for a group of 12 consecutive non-holiday
weeks cannot be larger than 44 hours/week.
– Each worker has two consecutive holiday weeks in winter and four consecutive
holiday weeks in summer. The holiday weeks for each worker are agreed to
previously.
– There are different categories of workers and different types of tasks. Certain
categories of workers can perform different types of tasks and thus have different
relative efficiencies associated to them.
– Overtime is not permitted.
– Hiring temporary workers is not possible.
– A utility function has to be optimised.
These conditions are not difficult to model as linear constraints. Hence, the model can
be formalised in mathematical terms.
According to the assumptions of the problem (that overtime and temporary workers are
not permitted), the cost of the staff is the same for any feasible solution. Thus, capacity
has to be distributed in order to optimise the service level.
3. Objective function
All customers are supposed to be served when they go to the service centre: demand is
met during each period, but if there is a capacity shortage, then the service level will not
be as good as desirable (workers may spend too little time assisting customers). That is
to say, if the required capacity (which is fixed according to foreseen demand and the
optimal service level, as in a queue system) is larger than the actual capacity, then the

7
service level worsens. Of course, to suppose that the demand is always covered would
be unsustainable if the relative capacity shortages (i.e., capacity shortage related to the
required capacity) were large.
Large shortages in relative capacity must be avoided: in a real case, if a capacity
shortage represented a small proportion of the required capacity—although less
attention would be paid to some customers—workers, with a little extra effort, could
meet the demand.
The maximum relative capacity shortage, a function that is relatively simple to
minimise, can be considered (the service level during the worst period is thus
optimised). This function avoids large capacity shortages and, as it is known, tends to
equilibrate and distribute capacity over the course of the year in a regular way.
The main inconvenience of this objective function is that once the maximum relative
capacity shortage has been minimised, it is indifferent whether there is a capacity
shortage in other weeks or not, given that relative capacity shortages are not higher than
the maximum (Figure 1 shows the demand, capacity and shortage profiles obtained by
solving an example using this objective function). Obviously, if possible, it is more
desirable to have a smaller shortage (that is to say, if it is possible to choose between
different optimal solutions).
It is possible to break the tie between optimal solutions (in order to obtain small relative
capacity shortages for every week) by considering a secondary objective function
(which is weighted and then added to the first one): the sum of weekly relative capacity
shortages. Following this, the objective function to minimise is the weighted sum of two
terms: (i) the maximum relative capacity shortage; and (ii) the sum of the weekly
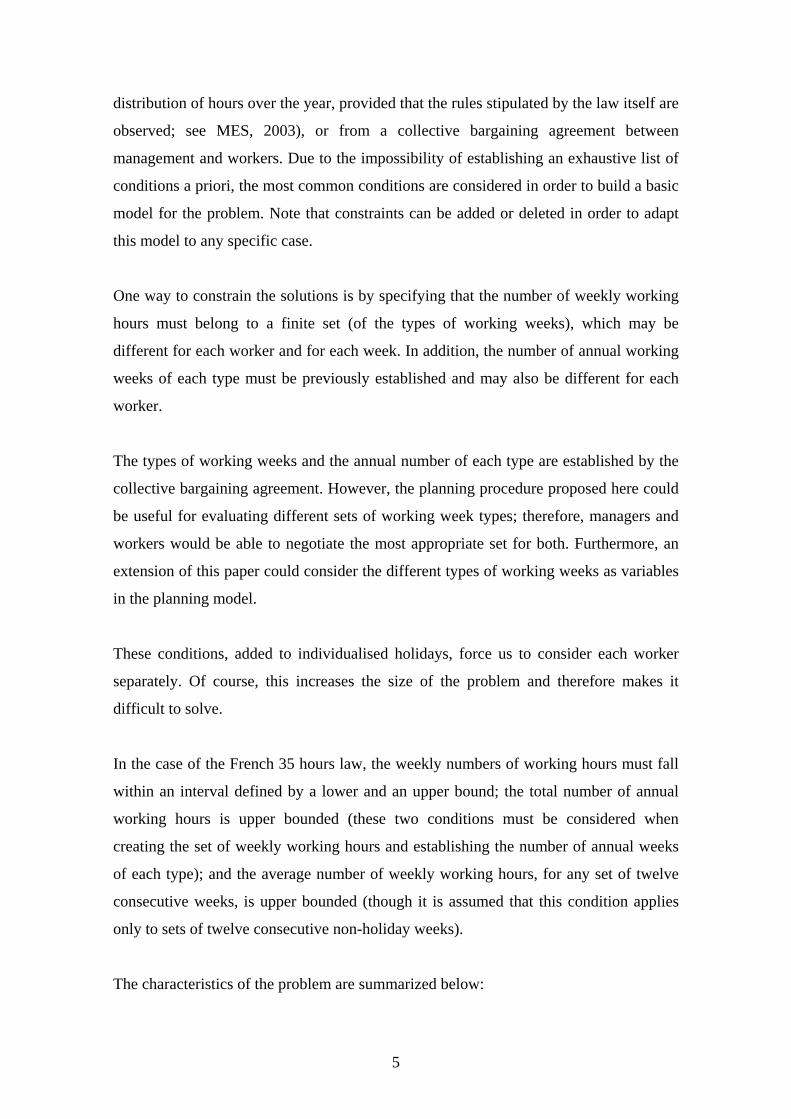
relative capacity shortages. Figure 2 shows the demand, capacity and shortage profiles
obtained by considering this objective function using the same data as in Figure 1: one
can see how capacity is adapted to demand, thus improving the service level.
[INSERT FIGURE 1] Figure 1. Demand, capacity and shortage profiles obtained when the objective function to minimise
is the maximum relative capacity shortage
8
[INSERT FIGURE 2] Figure 2. Demand, capacity and shortage profiles obtained when the objective function to minimise
is the weighted sum of two terms: (i) the maximum relative capacity shortage; and (ii) the
sum of the weekly relative capacity shortages
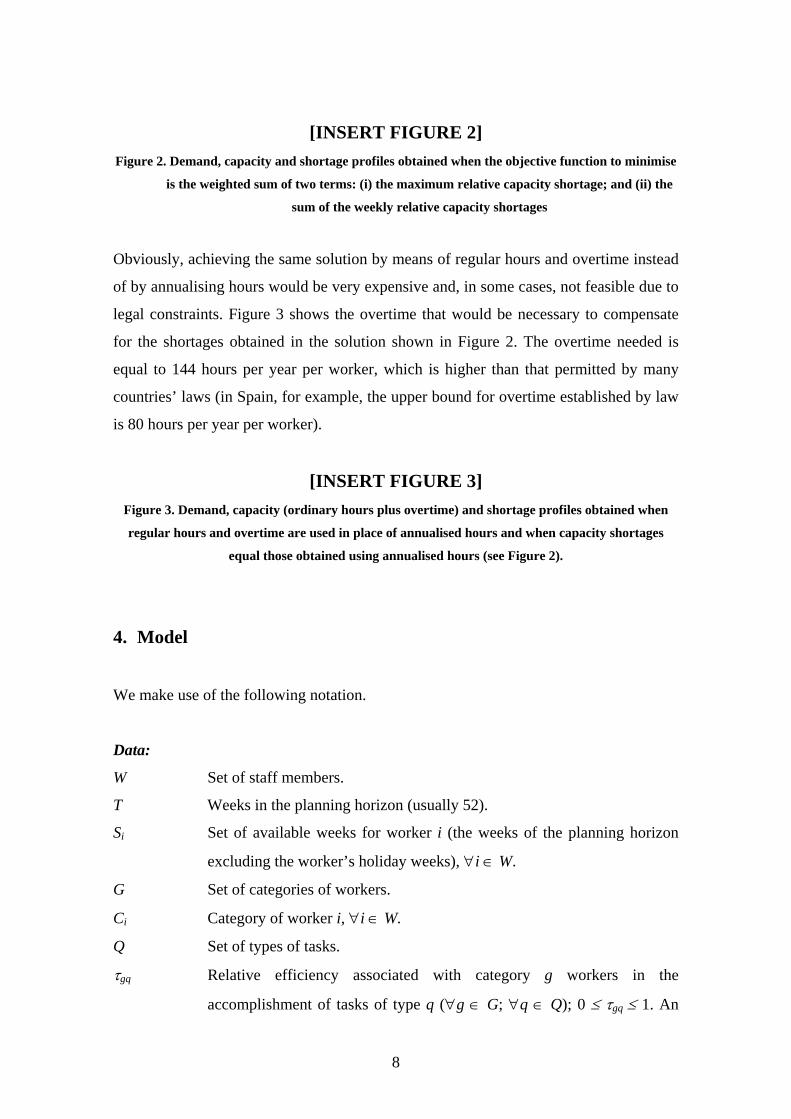
Obviously, achieving the same solution by means of regular hours and overtime instead
of by annualising hours would be very expensive and, in some cases, not feasible due to
legal constraints. Figure 3 shows the overtime that would be necessary to compensate
for the shortages obtained in the solution shown in Figure 2. The overtime needed is
equal to 144 hours per year per worker, which is higher than that permitted by many
countries’ laws (in Spain, for example, the upper bound for overtime established by law
is 80 hours per year per worker).
[INSERT FIGURE 3] Figure 3. Demand, capacity (ordinary hours plus overtime) and shortage profiles obtained when
regular hours and overtime are used in place of annualised hours and when capacity shortages
equal those obtained using annualised hours (see Figure 2).
4. Model
We make use of the following notation.
Data:
W Set of staff members.
T Weeks in the planning horizon (usually 52).
Si Set of available weeks for worker i (the weeks of the planning horizon
excluding the worker’s holiday weeks), ∀i ∈ W.
G Set of categories of workers.
Ci Category of worker i, ∀i ∈ W.
Q Set of types of tasks.
τgq Relative efficiency associated with category g workers in the
accomplishment of tasks of type q (∀g ∈ G; ∀q ∈ Q); 0 ≤ τgq ≤ 1. An

9
efficiency τgq = 0 indicates that category g workers are not able to
perform type q tasks.
Jit Set of types of working weeks, expressed in working hours, that worker i
can perform during week t (∀i ∈ W, ∀t ∈ Si).
JWi Set of types of working weeks that worker i can perform over the year
(i
i itt
JW JS∈
= U ), ∀i ∈ W.
JT Set of types of working weeks ( ii
JT JWW∈
= U ).
HJk Number of hours corresponding to working week type k (∀k ∈ JT).
nik Number of working weeks of type k that must be performed by worker i
(∀i ∈ W, ∀k ∈ JWi).
L, hL The average number of working hours in a group of L consecutive weeks,
which cannot be larger than hL (with L = 12 and hL = 44 hours).
eqt Working hours required for type q tasks during week t (∀q ∈ Q;
t=1,...,T), considering the time that a worker (with a relative efficiency of
1) would need to complete the task, and fixed according to foreseen
demand and the desired service level.
Variables:
xikt ∈ {0,1} Binary variable that indicates whether worker i performs a type k
working week during week t (∀i ∈ W, ∀t ∈ Si, ∀k ∈ Jit); the number of
variables of this type is equal to .i
iti t
JW S∈ ∈∑ ∑
ugqt Non-negative real variable that indicates the number of working hours
that category g employees dedicate to task q during week t (∀g ∈ G; ∀q
∈ Q; t=1,...,T | τgq > 0). The upper bound of the number of variables is
equal to |G|·|Q|·T.
dqt- Non-negative real variable that indicates the capacity shortage, that is to
say, the forecasted need for task q that cannot be met by the staff during
week t (∀q ∈ Q; t=1,..., T); the number of variables of this type is equal
to |Q|·T.
D Non-negative real variable that indicates the maximum shortage, as
related to the demand.

10
Model:
[ ]1
Tqt
q Q t qt
dMIN Z De
α β−
∀ ∈ =
= ⋅ + ⋅ ∑ ∑ (1)
; 1,..., qt
qt
q Q t TdDe
−
∈ =≥ ∀ (2)
; 1 it
iiktk
i W t SxJ∀ ∈
∀ ∈ ∀ ∈=∑ (3)
( ) ( ) |
; i it
iikt ikt k
i W k JWx nS J∀ ∈ ∈
∀ ∈ ∀ ∈=∑ (4)
( ) ( ) | 0
; 1,..., gq
gq gqt qt qt
g G
q Q t Tu d eττ
−
∀ ∈ >
∀ ∈ =⋅ + ≥∑ (5)
( ) ( ) ( ) | | 0
; 1,..., iti igq
gqt k iktki W g tq Q JC S
g G t Tu HJ xτ ∀ ∈⎡ ⎤∀ ∈ = ∧ ∈∀ ∈ > ⎣ ⎦
∀ ∈ == ⋅∑ ∑ ∑ (6)
[ ]1
; ,..., | 1,..., it
j
ik ikt Lt j L k J
i W j L T j L j SLHJ x h= − + ∀ ∈
∀ ∈ = − + ∈⋅ ≤ ⋅∑ ∑ (7)
The objective function to minimise (1) is the weighted sum of: (i) the maximum relative
capacity shortage and (ii) the sum of weekly relative capacity shortages, with α, β > 0;
(2) expresses that D is the maximum relative capacity shortage; (3) imposes, for each
worker and for each available week, the assignment of one type of working; (4) implies
that each worker performs the stipulated number of working weeks of each type; (5)
imposes, for each week and for each type of task, that the number of working hours
performed by the staff added to the capacity shortage must be larger than or equal to the
required number of working hours, according to the forecasted demand and the desired
service level; (6) assigns, for each category and each week, the number of working
hours of the category to the different types of tasks; and finally, (7) imposes an upper
bound on the average of weekly working hours for any subset of L consecutive non-
holiday weeks.
5. Computational experiment

11
A computational experiment was performed in order to evaluate the effectiveness of the
model. Overall, these results can be considered very satisfactory.
The basic data used for the experiment are as follows:
– |W| = staff sizes of 10, 40, 70, 100 and 250 workers.
– T = 52 (considering 46 working weeks and 6 holiday weeks).
– The number of holiday weeks for each worker is constrained to six, distributed
into two non-interrupted periods of two and four weeks, respectively. The
holiday weeks are fixed at random for each worker (the two weeks of the first
period in winter and the four weeks of the second in summer). Note that even
though this way of generating holiday weeks might be not very realistic, it does
not make solving the models any easier.
– There are three categories of workers: 50% of the workers belongs to Category
1, 30% belongs to Category 2 and 20% belongs to Category 3.
– There are three types of tasks.
– There are three patterns of relative efficiency. Tables 1, 2 and 3 show the
relative efficiency values for each pattern.
Task 1 Task 2 Task 3
Category 1 1 0.9 0
Category 2 0 1 0.9
Category 3 0 0 1 Table 1. Relative efficiency values for Pattern 1 of relative efficiency
Task 1 Task 2 Task 3
Category 1 1 0.9 0.8
Category 2 0 1 0.9
Category 3 0 0 1 Table 2. Relative efficiency values for Pattern 2 of relative efficiency
Task 1 Task 2 Task 3
Category 1 1 0 0

12
Category 2 0.9 1 0
Category 3 0.8 0 1 Table 3. Relative efficiency values for Pattern 3 of relative efficiency
– There are three types of working weeks for each week and each worker (Jit). The
number of hours of each type (HJk) and the number of weeks of each type in a
year (nik) are
– Type 1: HJ1 = 25 hours, ni1 = 15 weeks
– Type 2: HJ2 = 35 hours, ni2 = 21 weeks
– Type 3: HJ3 = 50 hours, ni3 = 10 weeks
– There are three different patterns of required capacity (in working hours) during
the year. Demand Type 1 corresponds to non-seasonal capacity pattern (the
required capacity is the same for all weeks in the planning horizon) with noise.
Demand Type 2 corresponds to a seasonality pattern with one peak, with noise.
Demand Type 3 corresponds to a seasonality pattern with two peaks, with noise.
In each case, total demand is equal to total capacity (it is supposed that the
number of workers was fixed according to annual demand).
– α = 0.99 and β = 0.01/(T·|Q|). Note that the weight of each term is divided by its
upper bound (1 for the first term (D) and T·|Q| for the second term (1
Tqt
q Q t qt
de
−
∀ ∈ =∑ ∑ )).
The weight of the maximum relative capacity shortage is significantly larger
than the weight that corresponds to the sum of relative capacity shortages.
For each combination of staff size |W|, type of demand and pattern of relative efficiency,
60 instances were generated (varying the demand noise and holiday weeks at random),
giving an amount of 2,700 instances.
In spite of the large size of some of the models, these were solved to optimality using
the ILOG CPLEX 8.1 optimiser and a Pentium IV PC at 1.8 GHz with 512 Mb of
RAM. The absolute and relative MIP gap tolerances were set to 0.0001.
Computing times (expressed in seconds) and model size (which, according to the data,
depends only on W) are given in Table 4. For each problem size (|W| = 10, 40, 70, 100

13
or 250 workers), one can see the minimum computing time (tmin), the average
computing time ( t ) and the maximum computing time (tmax).
|W| tmin t tmax Number of
binary variables
Number of real
variables (average)
Number of
constraints (average)
10 9 11 16 1,380 434 1,118
40 11 13 64 5,520 434 3,068
70 12 19 292 9,660 434 5,018
100 13 27 380 13,800 434 6,968
250 24 82 1,224 34,500 434 16,718
Table 4. Computing times (in seconds) by |W|
As shown in Table 4, solving the model is relatively fast, even in the case of the longest
solution time (1,224 seconds ≈ 20 minutes), which occurred when planning annual
hours for two hundred and fifty workers.
In Figure 4, the influence of the type of demand (TD) on computing times (t) can be
observed. It may appear that times are shorter for Patterns 1 and 2 than for Pattern 3, but
this tendency is only clear when |W| is equal to 100 or 250.
[INSERT FIGURE 4] Figure 4. Influence of type of demand (TD) on the average solution time
Figures 2 and 5 show how the capacity provided by the staff adapts to the demand. This
is due to the flexibility provided by annualising working time. Due to the constraints, it
is possible, in the same year, to have weeks with capacity surplus and others with
capacity shortage (note that these appear mainly during holiday periods).
[INSERT FIGURE 5] Figure 5. Demand, capacity and shortage profiles
6. Conclusions

14
Annualising working hours is a good and economical way of adjusting productive
capacity to seasonal demand and obtaining flexibility in the distribution of annual
working hours. Annualising entails new problems to be faced, particularly those
associated with planning the weekly number of working hours for an annual horizon.
This paper presents a specific problem of planning working hours in the service
industry. Its main characteristics are that the number of weekly working hours, for any
worker and any week, must belong to a finite set; that holiday weeks are individualised;
that there are different sets of workers who can perform different types of tasks (with
different efficiencies); and that overtime and temporary workers are not permitted. It
also presents an optimization model for solving the problem, whose main objective is to
minimise the weighted sum of two terms: (i) the maximum relative capacity shortage;
and (ii) the sum of weekly relative capacity shortages.
Despite the large size of the model (especially in terms of its number of binary
variables), a computational experiment has shown that MILP is an efficient tool to solve
the problem in an optimal way.
The proposed planning procedure could be useful for evaluating different sets of types
of working weeks; hence, managers and workers might negotiate the most appropriate
set for both. Furthermore, an extension of this paper could be to include in the planning
model, as variables, the types of working weeks that each worker could do in each
week.
References
Azmat, C., Widmer, M., 2004. A case study of single shift planning and scheduling
under annualized hours: A simple three step approach. European Journal of
Operational Research 153 (1), 148-175.
Campbell, G.M., Diaby, M., 2002. Development and evaluation of an assignment
heuristic for allocation cross-trained workers. European Journal of Operational
Research 138, 9-20.

15
Clutterbuck, D., 1982. After flexible hours, now it’s flexiyears. International
Management, 37 (3), 31-36.
Corominas, A., Pastor, R., 2000. Manpower planning and scheduling in services with
seasonal demand. Proceedings of the First World Conference on Production and
Operations Management. Machuca, J.A.D. and Mandakovic, T., eds. Sevilla.
Corominas, A., Lusa, A., Pastor, R., 2002. Using MILP to plan annualised working
hours. Journal of the Operational Research Society 53, 1101-1108.
Corominas, A., Lusa, A., Pastor, R., 2003. Using a MILP model to establish a
framework for an annualised hours agreement. Working paper, IOC-DT-P-2003-01,
Technical University of Catalonia (UPC), Barcelona.
Corominas, A., Lusa, A., Pastor, R., 2004a. Characteristics and classification of the
annualised working hours planning problems. International Journal of Services
Technology and Management 5/6, 435-447.
Corominas, A., Lusa, A., Pastor, R., 2004b. Planning annualised hours with a finite set
of weekly working hours and joint holidays. Annals of Operations Research 128,
217-233.
Curran, P., 1992. Annual hours brings productivity boost to Spicers. Management
Services July, 32-33.
Grabot, B., Letouzey, A., 2000. Short-term manpower management in manufacturing
systems: new requirements and DSS prototyping. Computer Industries 3 (1), 11-29.
Hung, R., 1999a. A multiple-shift workforce scheduling model under annualized hours.
Naval Research Logistic 46 (6), 726-736.
Hung, R., 1999b. Scheduling a workforce under annualized hours. International Journal
of Production Research 37 (11), 2419-2427.
Lynch, P., 1995. Annual Hours: An idea whose time has come. Personnel Management
November, 46-50.
MacMeeking, J,. 1995. Why Tesco’s new composite distribution needed annual hours.
International Journal Retail Distribution Management 23 (9), 36-38.
Mazur, L., 1995. Coming: the annual workweeks. Across the Board 32 (4), 42-45.
MES: Ministère de l'Emploi et de la Solidarité (2003): www.35h.travail.gouv.fr.
02/09/2003. France.
Oke, A., 2000. Linking human resource flexibility with manufacturing flexibility:
enablers of labour capacity flexibility in manufacturing plants. Proceedings of the

16
First World Conference on Production and Operations Management. Machuca, J.A.D.
and Mandakovic, T., eds. Sevilla.
Vila, G.F.E., Astorino, J. M., 2001. Annualized hours as a capacity planning tool in
make-to-order or assemble-to-order environment: an agricultural implements
company case. Production Planning & Control 12 (4), 388-398.

17
FIGURE 1
0
500
1000
1500
2000
2500
3000
3500
4000
4500
1 3 5 7 9 11 13 15 17 19 21 23 25 27 29 31 33 35 37 39 41 43 45 47 49 51
Capacity Shortage Demand
Figure 1. Demand, capacity and shortage profiles obtained when the objective function to minimise
is the maximum relative capacity shortage

18
FIGURE 2
0
500
1000
1500
2000
2500
3000
3500
4000
4500
1 3 5 7 9 11 13 15 17 19 21 23 25 27 29 31 33 35 37 39 41 43 45 47 49 51
Capacity Shortage Demand
Figure 2. Demand, capacity and shortage profiles obtained when the objective function to minimise
is the weighted sum of two terms: (i) the maximum relative capacity shortage; and (ii) the
sum of the weekly relative capacity shortages

19
FIGURE 3
0
500
1000
1500
2000
2500
3000
3500
4000
4500
1 3 5 7 9 11 13 15 17 19 21 23 25 27 29 31 33 35 37 39 41 43 45 47 49 51
Ordinary hours Overtime Shortage Demand
Figure 3. Demand, capacity (ordinary hours plus overtime) and shortage profiles obtained when
regular hours and overtime are used in place of annualised hours and when capacity shortages
equal those obtained using annualised hours (see Figure 2).

20
FIGURE 4
0
20
40
60
80
100
120
140
160
10 50 90 130 170 210 250
Staff workers
Ave
rage
solv
ing
time
(sec
onds
)
TD=1TD=2TD=3
Figure 4. Influence of type of demand (TD) on the average solution time

21
FIGURE 5
0
500
1000
1500
2000
2500
3000
3500
4000
4500
1 5 9 13 17 21 25 29 33 37 41 45 49
Capacity Shortage Demand
Figure 5. Demand, capacity and shortage profiles