Convertible Weekly
22
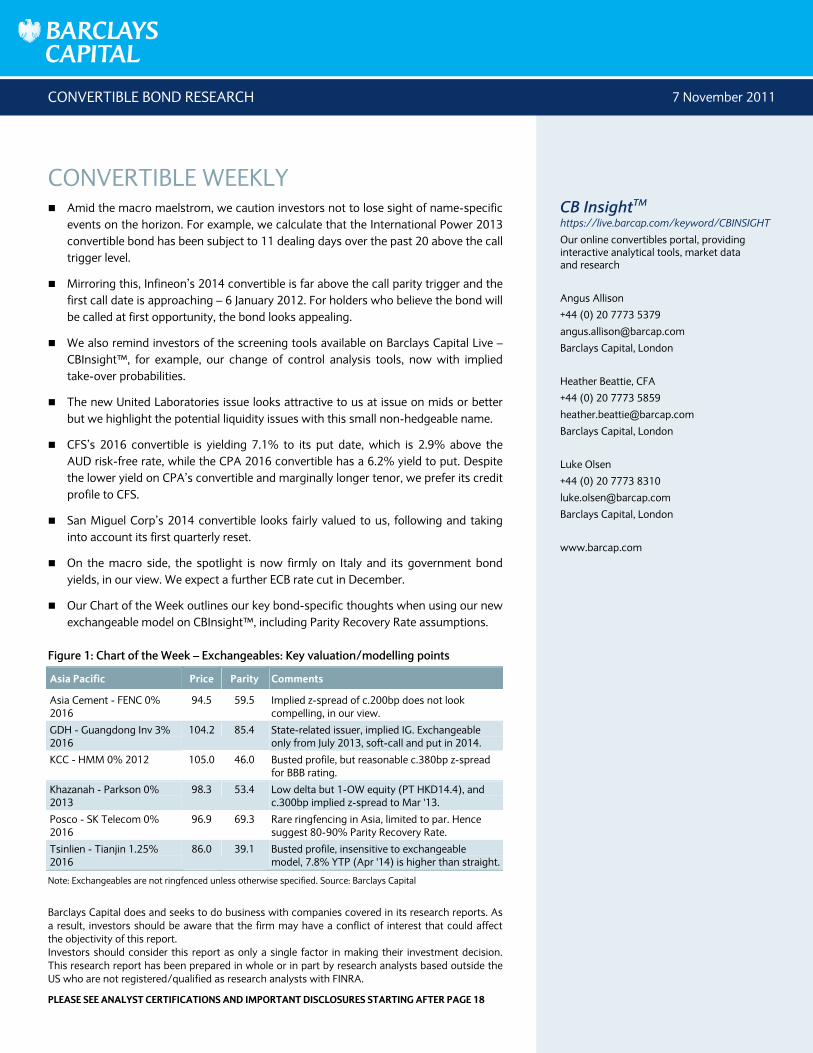
CONVERTIBLE BOND RESEARCH 7 November 2011 PLEASE SEE ANALYST CERTIFICATIONS AND IMPORTANT DISCLOSURES STARTING AFTER PAGE 18 CONVERTIBLE WEEKLY Amid the macro maelstrom, we caution investors not to lose sight of name-specific events on the horizon. For example, we calculate that the International Power 2013 convertible bond has been subject to 11 dealing days over the past 20 above the call trigger level. Mirroring this, Infineon’s 2014 convertible is far above the call parity trigger and the first call date is approaching – 6 January 2012. For holders who believe the bond will be called at first opportunity, the bond looks appealing. We also remind investors of the screening tools available on Barclays Capital Live – CBInsight™, for example, our change of control analysis tools, now with implied take-over probabilities. The new United Laboratories issue looks attractive to us at issue on mids or better but we highlight the potential liquidity issues with this small non-hedgeable name. CFS’s 2016 convertible is yielding 7.1% to its put date, which is 2.9% above the AUD risk-free rate, while the CPA 2016 convertible has a 6.2% yield to put. Despite the lower yield on CPA’s convertible and marginally longer tenor, we prefer its credit profile to CFS. San Miguel Corp’s 2014 convertible looks fairly valued to us, following and taking into account its first quarterly reset. On the macro side, the spotlight is now firmly on Italy and its government bond yields, in our view. We expect a further ECB rate cut in December. Our Chart of the Week outlines our key bond-specific thoughts when using our new exchangeable model on CBInsight™, including Parity Recovery Rate assumptions. Figure 1: Chart of the Week – Exchangeables: Key valuation/modelling points Asia Pacific Price Parity Comments Asia Cement - FENC 0% 2016 94.5 59.5 Implied z-spread of c.200bp does not look compelling, in our view. GDH - Guangdong Inv 3% 2016 104.2 85.4 State-related issuer, implied IG. Exchangeable only from July 2013, soft-call and put in 2014. KCC - HMM 0% 2012 105.0 46.0 Busted profile, but reasonable c.380bp z-spread for BBB rating. Khazanah - Parkson 0% 2013 98.3 53.4 Low delta but 1-OW equity (PT HKD14.4), and c.300bp implied z-spread to Mar '13. Posco - SK Telecom 0% 2016 96.9 69.3 Rare ringfencing in Asia, limited to par. Hence suggest 80-90% Parity Recovery Rate. Tsinlien - Tianjin 1.25% 2016 86.0 39.1 Busted profile, insensitive to exchangeable model, 7.8% YTP (Apr '14) is higher than straight. Note: Exchangeables are not ringfenced unless otherwise specified. Source: Barclays Capital Barclays Capital does and seeks to do business with companies covered in its research reports. As a result, investors should be aware that the firm may have a conflict of interest that could affect the objectivity of this report. Investors should consider this report as only a single factor in making their investment decision. This research report has been prepared in whole or in part by research analysts based outside the US who are not registered/qualified as research analysts with FINRA. CB Insight TM https://live.barcap.com/keyword/CBINSIGHT Our online convertibles portal, providing interactive analytical tools, market data and research Angus Allison +44 (0) 20 7773 5379 [email protected] Barclays Capital, London Heather Beattie, CFA +44 (0) 20 7773 5859 [email protected] Barclays Capital, London Luke Olsen +44 (0) 20 7773 8310 [email protected] Barclays Capital, London www.barcap.com
-
Upload
khangminh22 -
Category
Documents
-
view
1 -
download
0
Transcript of Convertible Weekly
CONVERTIBLE BOND RESEARCH 7 November 2011
PLEASE SEE ANALYST CERTIFICATIONS AND IMPORTANT DISCLOSURES STARTING AFTER PAGE 18
CONVERTIBLE WEEKLY Amid the macro maelstrom, we caution investors not to lose sight of name-specific
events on the horizon. For example, we calculate that the International Power 2013 convertible bond has been subject to 11 dealing days over the past 20 above the call trigger level.
Mirroring this, Infineon’s 2014 convertible is far above the call parity trigger and the first call date is approaching – 6 January 2012. For holders who believe the bond will be called at first opportunity, the bond looks appealing.
We also remind investors of the screening tools available on Barclays Capital Live – CBInsight™, for example, our change of control analysis tools, now with implied take-over probabilities.
The new United Laboratories issue looks attractive to us at issue on mids or better but we highlight the potential liquidity issues with this small non-hedgeable name.
CFS’s 2016 convertible is yielding 7.1% to its put date, which is 2.9% above the AUD risk-free rate, while the CPA 2016 convertible has a 6.2% yield to put. Despite the lower yield on CPA’s convertible and marginally longer tenor, we prefer its credit profile to CFS.
San Miguel Corp’s 2014 convertible looks fairly valued to us, following and taking into account its first quarterly reset.
On the macro side, the spotlight is now firmly on Italy and its government bond yields, in our view. We expect a further ECB rate cut in December.
Our Chart of the Week outlines our key bond-specific thoughts when using our new exchangeable model on CBInsight™, including Parity Recovery Rate assumptions.
Figure 1: Chart of the Week – Exchangeables: Key valuation/modelling points
Asia Pacific Price Parity Comments
Asia Cement - FENC 0% 2016
94.5 59.5 Implied z-spread of c.200bp does not look compelling, in our view.
GDH - Guangdong Inv 3% 2016
104.2 85.4 State-related issuer, implied IG. Exchangeable only from July 2013, soft-call and put in 2014.
KCC - HMM 0% 2012 105.0 46.0 Busted profile, but reasonable c.380bp z-spread for BBB rating.
Khazanah - Parkson 0% 2013
98.3 53.4 Low delta but 1-OW equity (PT HKD14.4), and c.300bp implied z-spread to Mar '13.
Posco - SK Telecom 0% 2016
96.9 69.3 Rare ringfencing in Asia, limited to par. Hence suggest 80-90% Parity Recovery Rate.
Tsinlien - Tianjin 1.25% 2016
86.0 39.1 Busted profile, insensitive to exchangeable model, 7.8% YTP (Apr '14) is higher than straight.
Note: Exchangeables are not ringfenced unless otherwise specified. Source: Barclays Capital
Barclays Capital does and seeks to do business with companies covered in its research reports. As a result, investors should be aware that the firm may have a conflict of interest that could affect the objectivity of this report. Investors should consider this report as only a single factor in making their investment decision. This research report has been prepared in whole or in part by research analysts based outside the US who are not registered/qualified as research analysts with FINRA.
CB InsightTM
https://live.barcap.com/keyword/CBINSIGHT
Our online convertibles portal, providing interactive analytical tools, market data and research
Angus Allison
+44 (0) 20 7773 5379
Barclays Capital, London
Heather Beattie, CFA
+44 (0) 20 7773 5859
Barclays Capital, London
Luke Olsen
+44 (0) 20 7773 8310
Barclays Capital, London
www.barcap.com

Barclays Capital | Convertible Weekly
7 November 2011 2
Figure 1: Chart of the Week – Exchangeables: Key valuation/modelling points (cont’d)
EMEA Price Parity Comments
Aabar - Daimler 4% 2016 93.0 56.1 Attractive Abu Dhabi exposure. Not ringfenced but Daimler option is only worth a few pts currently.
Artemis - PPR 3.25% 2016 147.5 108.5 PPR is highly correlated to Artemis, in our view. Prefer Artemis/Vinci '15 or PPR equity.
Artemis - Vinci 4.25% 2015 52.2 34.4 Ringfenced, suggest 90-100% Parity Recovery Rate. Parity effectively bolsters the bond 'floor'.
BCP - Portugal Telecom 3% 2015
69.0 59.3 Ringfencing is a key positive, European-exercise, 16% YTM. Suggest 80-90% Parity Recovery Rate.
BES - Bradesco 1.625% 2013 85.9 82.1 Currently exchangeable, but concern around potential for higher BES versus BBD correlation.
BES - EDP 3% 2015 83.7 59.7 16% YTP (May '13) but we prefer Portugal exposure via BCP/Por Tel or Parpublica/Galp.
Eurazeo - Danone 6.25% 2014
57.1 51.8 Ringfenced, adding significant value. Suggest 90-100% Parity Recovery Rate. Balanced profile.
KfW - Deutsche Post 1.5% 2014
107.1 77.2 Top equity pick in freight transportation (1-UW, PT €14) but not a cheap bond.
KfW - Deutsche Telekom 3.25% 2013
102.7 65.3 AAA-rated, yet implies c.20-30bp spread to Euribor, cheap versus KfW straight bonds, but low delta.
MNV - Gideon Richter 4.4% 2014
90.1 65.4 Implied z-spread 690bp vs Hungary 5y CDS 545bp but may not be deliverable. Low delta.
Parpublica - EDP 3.25% 2014 83.0 33.9 Busted profile, 22% YTP (Dec '12), alternative for Parpublica exposure is the Galp exchangeable.
Parpublica - Galp 5.25% 2017
90.0 97.5 Galp equity is 1-OW (PT €19.65), with catalysts. Exchangeable from Mar '13. Issuer event put.
Salzgitter - Aurubis 2% 2017 104.8 88.8 Stretched valuation, but balanced profile and fairly volatile sector.
Temasek - Standard Chartered 0% 2014
102.7 79.2 AAA credit, with rare positive multi-year convexity on bank equity.
TUI - TUI Travel 4.5% 2013 91.7 59.1 Ringfenced, but high correlation suggests using a c.60-70% Parity Recovery Rate. TUI AG credit link.
Note: Exchangeables are not ringfenced unless otherwise specified. Source: Barclays Capital

Barclays Capital | Convertible Weekly
7 November 2011 3
MARKET MOVERS
Figure 2: Global equity indices (rebased as of 28 October 2011)
Figure 3: Cumulative change in global government bond yields (bp)
94
96
98
100
102
104
106
108
28-Oct 31-Oct 01-Nov 02-Nov 03-Nov 04-Nov
S&P 500 €STOXX 50FTSE 100 Hang SengNikkei
-35
-30
-25
-20
-15
-10
-5
0
28- Oct 31- Oct 01- Nov 02- Nov 03- Nov 04- Nov
Gilt 5 yr UST 5 yr
Bund 5 yr HK 5 yr
bp
Figure 4: Global currency moves over the past week (vs USD)
Figure 5: Commodity price moves over the past week
-3.0%
-2.0%
-1.0%
0.0%
1.0%
2.0%
3.0%
4.0%
EUR GBP SGD INR JPY
-6%
-4%
-2%
0%
2%
Oil Gold Aluminium Copper Palm Oil Zinc
Figure 6: Global credit spreads (bp)
Figure 7: Term structure of €STOXX - implied volatility
220
260
300
340
380
28-Oct 31-Oct 01-Nov 02-Nov 03-Nov 04-Nov 600
620
640
660
680
700
720
740
€BBB z-spreads (left)JACI Quasi-Sov spread (left)iTraxx Xover (right)
12%
16%
20%
24%
28%
32%
36%
40%
44%
48%
1M 3M 6M 1YR 3YR 5YR
Min (6M) Max (6M)
Week ago Current
Source: Bloomberg, Barclays Capital
For details of the major economic releases due this week, please refer to the Global Traders' Guide, 4 November 2011, and The week ahead: Emerging Asia, 7 November 2011.

Barclays Capital | Convertible Weekly
7 November 2011 4
Macro update: Italian sovereign debt now firmly in the spotlight Italian sovereign spreads are the chief concern for risky assets now. Even with the requisite fiscal and structural reforms, Italian debt dynamics can only move towards a stable equilibrium if Italian government bond yields are contained, in our economists’ opinion. In their view, the G20 meeting outcome disappointed in terms of tangible details on how to best leverage the EFSF to address this key issue. Against a currently fluid political backdrop in Italy, investors should focus intently on: (a) progress on governmental approval of pro-growth structural reforms; (b) progress in implementation and IMF monitoring of such reforms (the IMF involvement here is a positive, in our view); and (c) ECB interventions (ie, purchases) in the government bond market, augmenting potential EFSF/IMF contributions. Indeed, as the Greek situation now looks to be moving towards a resolution, risky assets would look more vulnerable if Italian and potentially Spanish yields were to rise further. For details, please see Greece: a new unity government and near-term expectations, 6 November 2011, and G20 communiqué: Focus on Europe, 4 November 2011.
Italian banks’ equities are impacted by multiple pressures: the widening in sovereign spreads, translating directly into higher funding costs, and lower profitability/return on tangible equity. This is exacerbated by competition for deposits and also potential capital raisings – please see Italian Banks: Deposit war?, 7 November 2011.
The ECB’s surprise 25bp rate cut last week will likely be followed by another 25bp cut in December, in the opinion of our rates strategists. The ECB’s press conference indicated deep concern about a sharp deterioration in the outlook for economic activity in the euro area – please see Euro Weekly, 4 November 2011.
Figure 8: Selected 10Y spreads versus Germany (bp)
300
350
400
450
21-Oct 23-Oct 25-Oct 27-Oct 29-Oct 31-Oct 02-Nov80
90
100
110
120
Italy Spain France (RHS)
Note: Extracted from Euro Weekly, 4 November 2011. Source: Bloomberg, Barclays Capital
Key issue for risky assets is now the containment of Italian
government bond yields
Italian banks pressured by funding, competition for deposits
and potential capital raisings
Last week’s 25bp ECB rate cut likely to be followed by another
in December
Barclays Capital | Convertible Weekly
7 November 2011 5
Market commentary
EMEA activity Amid the macro maelstrom, we caution investors not to lose sight of name-specific events potentially on the horizon. For example, we calculate that the International Power 2013 convertible bond has been subject to 11 dealing days over the past 20, with the share price above the call-triggering level of 330p. As we noted in International Power (IPR) 3.25% 2013: Opportunity ahead of dividend, 16 September 2011, the prospectus language states that the closing share prices must exceed the call trigger level for 20 dealing days in a 30-day period. 30 additional days of notice must be given before the redemption date, and the last conversion date is then 10 days prior to this. We note that “30-day period” seems to imply calendar days, equivalent to c.22 dealing days.
Mirroring this, Infineon’s 2014 convertible is well above the call parity trigger (parity closed Friday at 282), and the first call date is approaching, 6 January 2012. Upon a call, the company would be required to pay the present value (discounted at German Bund rates) of future coupons when holders simultaneously convert. Currently, the present value equals 18.6 points and the bond was indicated this morning at 299.7 versus parity of 282.6, or a premium of 17.0 points. This would leave a surplus of 1.6 points from the coupon make-whole. Stock borrow costs on a full delta hedge are minimal (0.2 points) to the first call date. Taken together with the 0.4 points of coupon (less accrued) to the November 2012 coupon date, this amounts to an additional 0.2 points; full current value above price of 1.8 points. Therefore, the bond might have some appeal for those that believe it will be called at the first opportunity. If there is no call, then the bond also embeds a long-term embedded put option for hedged investors. Stacked against this, however, is the possibility that rates could increase, which would lower the coupon present value to future call dates.
Maurel & Prom announced that the AMF granted its visa in relation to the spin off and listing of Maurel’s Nigerian unit. Maurel previously unveiled the plan in May, commenting that it was designed to bring out the value of its assets, and that the shares would be distributed via a special dividend. The company has also previously announced (Bloomberg, 1 September 2011), that “If someone came with an offer that satisfied shareholder interests and gave a future to the company we would consider it.”
We remind investors of the change-of-control screening and analysis functionality on our website, CBInsight™. On a bond-specific level, the change-of-control calculator now includes Implied Takeover Probability for both the convertible and the underlying equity
We also remind investors of our EMEA convertible trade ideas first published in Convertible Outlook Q4 2011 EMEA and Asia Pacific: Tectonic shifts, 12 October:
Air France 2020 (Short-dated yield)
Inmarsat 2017 (short-term security and long-term optionality)
WPP 2014 (Cheap convexity)
Subsea 2013 (Large offshore beneficiary of oil spending)
Aquarius Platinum (Risks, but our new coverage identifies potential rewards)
IAG 2014 (High potential upside and positive fundamental views)
Fortis Bank CASHES (Attractive beta and cheap versus Ageas FRESH)
We calculate that the International Power 2013
convertible bond has been subject to 11 dealing days over
the past 20, above the call trigger level
Infineon’s 2014 convertible is well above the call parity trigger,
and the first call date is approaching - 6 January 2012.
For holders that believe the bond will be called at first opportunity,
the bond seems appealing
We also remind investors of the screening tools available on
Barclays Capital Live, CBInsight™, for example our new change of control tools,
now with Implied Takeover Probabilities…
… and our Trade Ideas
Barclays Capital | Convertible Weekly
7 November 2011 6
Our equity and credit analysts provided the following updates to their views on convertible-related names, in the past few days:
Alcatel-Lucent reported weakening revenue for Q3/Q4, in line with the telecom infrastructure space, but Alcatel's thinner margin structure, weaker balance sheet and the pending sale of one of its main profit drivers causes us to become more cautious. We lower our estimates and price target, to EUR2.0. We remain 2-Equalweight. Details: Alcatel-Lucent: 3Q/4Q weakness highlights margin risk, 7 November 2011.
Our call on Anglo American: we maintain our 1-Overweight rating and 12-month price target of £29. Anglo reported strong H1 11 results, has a progressive dividend policy and a significant project pipeline - most recently demonstrated at the recent Australian metallurgical coal site visit. Details: Anglo American: acquisition of Oppenheimer stake in De Beers, positive, 4 November 2011.
IAG Q3 results come in slightly weaker than expected. However, we think the quarter is less important than the full year 2011 outlook, which we believe remains largely in line with expectations. Moreover, we view the preliminary BMI deal as a long-term positive for IAG. Details: International Consolidated Airlines Group: 3Q slightly misses, but the broader story unchanged, 4 November 2011.
Overall we think that Aegis did a good job of highlighting its strengths in M&A, why it is important to the strategy and its strong track record. However, it is worth noting that excluding acquisitions, underlying operating profit has been growing at a significantly lower growth rate since 2004. Details: Aegis - M&A Investor day encouraging, 3 November 2011.
ArcelorMittal's results and weak outlook were in line with our expectations. Global leading indicators continued to decline through Q3, while the European sovereign debt crisis and global growth concerns have continued to hurt confidence. In the face of a weakening macroeconomic outlook, we see scope for Moody's and S&P to, at minimum, cut the ratings outlook from Stable to Negative. Details: ArcelorMittal - Ratings at risk as management warns of weakness ahead, 3 November 2011.
Inmarsat has rallied 20% from its lows following the Q2 11 warning. Despite this move, we remain strong buyers of the stock with our price target offering a further 50% potential upside. Significantly, while the current share price implies no growth for MSS, we believe the company will return to growth in 2012 (and beyond). We see growth supported by continued strong KPI's and new product launches, and we reiterate our 1-OW rating. Details: Inmarsat plc: 3Q reprieve, targeting growth in 2012, 3 November 2011.
Petroplus could not offset the bleak refining Q3, even with good operational availability, and reported a larger-than-anticipated net loss and yet another breach of covenants. We are cutting our earnings forecast by c40-50% to reflect a lower level of underlying profitability and have correspondingly cut our price target to CHF7, primarily reflecting the value of the Ingolstadt and Coryton refineries. The good news is that the group now has a covenant waiver in place through to the end of Q1 2012 securing liquidity needs. Petroplus is not the best refining company under our coverage but it does offer potentially significant upside and is certainly the "risk-on" trade in the sector given its extreme gearing to any uptick in margins. We rate the stock 1-Overweight with 42% potential upside to our CHF7/share price target. Details: Petroplus Holdings: The distressed option, 3 November 2011.
Sainsbury will report its H1 11/12 results on Wednesday 9 November. We expect c6% EBIT growth in H1, perhaps not exciting but certainly respectable. The 36ppt differential in share price performance between Sainsbury and Morrison this year is hard to justify and we

Barclays Capital | Convertible Weekly
7 November 2011 7
expect this to narrow over the months ahead as Sainsbury continues to generate good sales growth, helped in part by its new 'Brand Match' campaign. Details: Sainsbury: Operating performance exceeding share price performance (1H preview), 3 November 2011.
Asia Pacific activity This morning CFS Retail Property Trust (CFS) issued its September 2011 quarterly update. CFS has negotiated the refinancing of a A$125mn bank facility, which was due to expire in December 2011 and now expires in September 2014. The company also refinanced a A$100mn bank facility, which was due to expire in February 2012 and now expires in October 2015. CFS also announced it has “commenced work on our debt expiries in the 2013 financial year” and it “remains confident of delivering on the distribution guidance of 13.0-13.1 cents per unit for the 12 months ending 30 June 2012”. CFS’s 5.075% 2014 and 5.75% 2016 convertible bonds offer dividend protection above 14.59 cents and 13.39 cents, respectively, for FY ending 30 June 2012 and hence we do not envisage any adjustment to the bond.
CFS is rated A by S&P. As of 30 June 2011, CFS has A$5.4mn in cash and cash equivalents. Given the capital management initiatives above, CFS’s debt maturity profile (excluding the convertible bonds) is as follows: A$275mn in FY 13 (A$225mn in MTNs and A$50mn in bank debt), A$348mn in FY 14 (A$160mn in MTNs, A$150mn in bank debt and A$38mn in US Private Placement), A$575mn in FY 15 (A$475mn in bank debt and A$100mn in MTNs), A$640mn in FY 16 (A$200mn in bank debt and A$440mn in MTNs) and A$178mn in FY 17 (US Private Placement). The A$295mn 2014 convertible is puttable at par in August 2012 and the more liquid A$300mn 2016 convertible is puttable at par in August 2014. CFS also has undrawn debt facilities of A$233mn. 3y/5y CDS is trading at 200/235bp, while its A$100mn 6.25% 2014 (maturing December 2014) and A$440mn 7.25% 2016 straight bonds are implying z-spreads of 150/155bp, respectively. We calculate that A$623mn is due prior to the July 2014 put date of the 2016 convertible. We use 180bp as our credit spread.
CFS's 100-, 260-, 520- and 999-day realised volatilities are currently 26%, 20%, 19% and 34%, respectively. These metrics were as low as 12%, 15%, 15% and 17%, respectively, between 2004 and 2006. Median 90- and 260-day historical volatilities over the past five years are 25%. We take 18% as our volatility assumption. Stock borrow is indicated at 50bp. The proposed dividend of A$0.131 translates into a dividend yield of 7.2%. We value the convertible at 101.3 versus a current mid price of 96.9 and parity of 75.6 with a bond floor of 99.7. The bond is yielding 7.1% to its put date, which equates to 2.9% above the AUD risk-free rate.
CPA also this morning issued its September 2011 quarterly update. As part of the statement the company announced it had received the balance of the proceeds from the sale of 259 George Street, Sydney. This has allowed CPA to terminate a A$220mn bank facility due in June 2015, extend the term of a A$300mn bank facility from February 2014 to February 2016, terminate A$625mn of interest rate swaps and begin an off-market buy-back of up to 10% of its units. There was no definitive decision on the amount of any potential special distribution, which was first mentioned in August 2011. The company’s core distribution guidance remains at 5.65 cents per unit for the 12 months ending 30 June 2012. CPA’s 5.25% 2016 convertible bond offers dividend protection above 5.84 cents for FY ending 30 June 2012 and, hence, without an additional special distribution we do not envisage any adjustment to the bond.
CFS has refinanced its FY 12 bank facilities
We calculate that A$623mn is due prior to the July 2014 put
date of it’s a$300mn 2016 convertible with A$5.4mn in
cash and undrawn debt facilities of A$233mn
The 2016 convertible is yielding 7.1% to its put date, which
equates to 2.9% above the risk-free rate
CPA announced the extension of a A$300mn bank facility from
February 2014 to February 2016 using the proceeds of the sale of
259 George Street, Sydney

Barclays Capital | Convertible Weekly
7 November 2011 8
CPA is rated A3/A- by Moody's/S&P. As of 30 June 2011, CPA has A$5.5mn in cash and cash equivalents. Given the capital management initiatives above, CPA’s debt maturity profile (excluding the convertible bond) is as follows: A$83mn in FY 13 (US Private Placement), A$155mn in FY 14 (bank debt), A$651mn in FY 16 (A$300mn in bank debt, A$200mn in MTNs and A$151mn in US Private Placement) and AUD33mn in FY 18 (US Private Placement). The A$200mn convertible is puttable at par in December 2014. CPA also has undrawn debt facilities of A$395mn. It’s A$200mn 7.25% straight bond due March 2016 is implying a credit spread of 155bp versus a current market price of 104.9. Global A-rated REITS are implying a z-spread to maturity of between 105bp and 210bp for a 3y tenor. Given that the A$238mn due prior to the convertible’s put date, in addition to the $200mn convertible, is almost matched by CPA’s cash and undrawn bank facility, we use 130bp as our credit spread.
CPA's 100-, 260-, 520- and 999-day realised volatilities are currently 25%, 21%, 23% and 43%, respectively, with longer-term realised volatility in the mid-teens prior to early 2007. We take 22% as our volatility assumption. Stock borrow is indicated at 1.5%. The proposed dividend of A$0.0565 translates into a dividend yield of 6.1%. We value the convertible at 104.5 versus a current mid price of 97.3 and parity of 82.6 with a bond floor of 99.5. The bond is yielding 6.2% to its put date which equates to 2.0% yield the AUD risk-free rate.
Despite the lower yield to put on CPA’s convertible and marginally longer tenor, we prefer its credit profile to CFS. We also view as positive the room for an adjustment to the CPA’s convertible for any special distribution.
San Miguel Corp’s 2% 2014 exchangeable bond was resettable on Saturday 5 November. Our calculations show that the 20 consecutive trading day averaging period began on 6 October, which resulted in a reset price of PHP113.98. This would increase the conversion ratio to 76048.43 from 63040.00. The bond is indicated today at 109.1 versus a share price of PHP118, making parity following the reset at 104.7. Using 500bp credit, 23% volatility (28% in a credit-calibrated model) and 5% stock borrow, we value the exchangeable at 109.4 excluding the remaining quarterly resets, which equates to a 22% implied volatility and a 91.8 bond floor. Delta is 66%. Including the remaining quarterly resets, the theoretical valuation would increase to 110.5, with an implied volatility of 20% and delta of 63%. Hence, our model attributes 1.1 points of value to the remaining resets. Given the reset floor of PHP110, future resets could only reduce the conversion price by a further 3.5%.
The bond looks fairly valued to us and offers investors a balanced profile with a low premium. San Miguel Corp Global Power (SMCGP) was consolidated into SMC in 2010, which resulted in approximately PHP200bn of finance lease obligations now being reflected in SMC’s balance sheet. In addition to the finance leases, long-term debt has increased from PHP72bn at the end of 2009 to PHP177bn as of 30 June 2011. Set against this is the significant rise in revenues due to the further business diversification; revenues as of 30 June 2011 were PHP263bn vs a 2010 total of PHP246bn.
Index joiners and leavers
Leavers from our Barclays Capital EMEA Convertibles Index at the end of October were Autonomy 2015, Nobel Biocare 2011 and Swiss Re 2021. The new joiner was Temasek- Standard Chartered 2014.
The only leaver from our Barclays Capital Asia-Pacific Convertibles Index at the end of October was Yue Yuen 2011. The new joiner was Temasek-Standard Chartered 2014.
Given that the A$238mn due prior to the convertible’s
December 2014 put date, in addition to the $200mn
convertible, is almost matched by CPA’s cash and undrawn
bank facility (A$400mn), we use 130bp as our credit spread
CPA’s convertible is yielding 6.2% to its put date which
equates to 2.0% above the risk-free rate
We prefer CPA 2016 to CFS 2016
San Miguel Corp ’14 looks fairly valued to us following its first
quarterly reset

Barclays Capital | Convertible Weekly
7 November 2011 9
Figure 9: Corporate actions
Date Company/issue Action Details
04 Nov UMC 0% 2016 Repurchase Repurchased $20mn of its convertible bonds due 2016. $450mn remains outstanding.
Source: Bloomberg, Reuters, listing exchanges
Figure 10: Ratings actions
Date Company/Issue Agency Rating Action
07 Nov Sawai Pharmaceutical R&I Upgrade issuer rating to BBB+. The Outlook is Stable.
03 Nov Franshion Properties S&P Placed BBB- long-term corporate credit rating and BB+ senior unsecured rating on CreditWatch Negative.
03 Nov Posco Moody's Revised down the Outlook on A3 rating to Negative from Stable.
02 Nov Berlian Laju Tanker S&P Revised Outlook to Negative from Stable.
Source: Bloomberg, Reuters, listing exchanges

Barclays Capital | Convertible Weekly
7 November 2011 10
LOOKING AHEAD
7 November 2011 – Yue Yuen 0% 2011: Final conversion. The bond closed today at 112.9 versus parity of 80.2. Maturity is 17 November 2011 at 113.2.
8 November 2011 – Nobel Biocare 1% 2011: Maturity. The bond redeems at 102.05, meaning CHF 307mn will be returned to investors, including the coupon.
10 November 2011 – Aldar sukuk 2011: Maturity. The bond redeems at par, meaning $1.14bn will be returned to holders, including the final coupon.
16 November 2011 – E-Ton Solar 0% 2011: Maturity. The bond redeems at par and is indicated at 97.5 on mids versus parity of 10.0.
24 November 2011 – Glencore 5% 2014: End of cornerstone investor share lock-up. This could result in an easing in stock borrow, in our view. See Convertible Weekly, 24 October 2011 for details.
3 December 2011 – IOI 0% 2011: Final conversion. The bond redeems at 116.05 and is indicated at 127.6 on mids versus parity of 128.7.
7 December 2011 – Colonia Real Estate 1.875% 2011: Maturity. The bond redeems at 110.81, meaning €60.9mn will be returned to investors.
21 December 2011 – Financial Technologies 0% 2011: Maturity. The bond redeems at 147.14, meaning $133.2mn will be returned to investors.

Barclays Capital | Convertible Weekly
7 November 2011 11
COST OF CONVERTIBLE ISSUANCE (CCITM)
Lower 5y swap rates drove the cost of convertible issuance, as measured by our CCITM, lower in the euro area and the US; wider credit spreads reduced the impact in the UK and Hong Kong. CCI levels at the end of last week were: 3.80% (down 24bp), 0.58% (down 30bp), 3.82% (flat) and 2.87% (up 15bp) in the euro area, US, UK, and Hong Kong, respectively.
Figure 11: Global CCI performance for the past month
Euro area US
3.5%
4.0%
4.5%
5.0%
5.5%
6.0%
6.5%
07-Oct 14-Oct 21-Oct 28-Oct 04-Nov1.40%
1.50%
1.60%
1.70%
1.80%
1.90%
0.5%
1.0%
1.5%
2.0%
2.5%
3.0%
07-Oct 14-Oct 21-Oct 28-Oct 04-Nov1.6%
1.7%
1.8%
1.9%
2.0%
UK HK
3.5%
4.0%
4.5%
5.0%
5.5%
6.0%
07-Oct 14-Oct 21-Oct 28-Oct 04-Nov1.50%
1.60%
1.70%
1.80%
1.90%
2.5%
3.0%
3.5%
4.0%
4.5%
5.0%
5.5%
07-Oct 14-Oct 21-Oct 28-Oct 04-Nov1.2%
1.3%
1.4%
1.5%
1.6%
1.7%
1.8%
1.9%
Cost of issuing convertible bond Cost of issuing equivalent straight debt Interest savingCost of issuing convertible bond Cost of issuing equivalent straight debt Interest savingCost of issuing convertible bond Cost of issuing equivalent straight debt Interest savingCost of issuing convertible bond Cost of issuing equivalent straight debt Interest saving Source: Bloomberg, Barclays Capital
INTELLECTUAL PROPERTY NOTICE: The Convertible Cost Index (CCI) contains intellectual property rights of Barclays Bank PLC, including database rights and copyright. Barclays Bank PLC reserves all rights in the Convertible Cost Index. Redistribution of the Convertible Cost Index is prohibited. ‘Convertible Cost Index’ is a trade mark of Barclays Bank PLC.
Wider credit, higher volatility and lower rates drove the CCI

Barclays Capital | Convertible Weekly
7 November 2011 12
NEW ISSUES Figure 12: New convertible issuance 2011 YTD
Size
Senior unsecured
issuer rating Issue rating
Date Issuer-underlying Country Ccy Coupon Maturity Yield Premium (mn) S&P Moody’s S&P Moody’s
07 Nov United Laboratories Hong Kong RMB 6.5-7.5%
14 Nov 2016 6.5-7.5%
20-30% 790 NR NR NR NR
17 Oct Temasek-Standard Chartered Singapore SGD 0.00% 24 Oct 2014 0.00% 27.0% 790 AAA Aaa NR NR
21 Sep REXLot Hong Kong HKD 6.00% 28 Sep 2016 6.00% 30.0% 817 NR NR NR NR
04 Aug POSCO-SK Telecom Korea JPY 0.00% 18 Aug 2016 1.00% 32.0% 24526 A A3 NR NR
21 Jul Taiwan Glass Taiwan USD 0.00% 28 Jul 2014 0.00% 26.0% 300 NR NR NR NR
14 Jul Radiant Opto-electronic Taiwan USD 0.00% 21 Jul 2016 0.00% 30.0% 100 NR NR NR NR
08 Jul Solar Applied Materials Taiwan USD 0.00% 22 Jul 2016 0.00% 28.0% 115 NR NR NR NR
06 Jul Hanjin Shipping Korea USD 4.00% 20 Jul 2016 4.00% 20.0% 150 NR NR NR NR
29 Jun Osung Korea USD 4.00% 07 Jul 2016 4.00% 20.0% 70 NR NR NR NR
28 Jun Assystem France EUR 4.00% 01 Jan 2017 4.00% 27.4% 80 NR NR NR NR
23 Jun GDH-Guangdong Inv Hong Kong USD 3.00% 21 Jul 2016 3.00% 30.0% 300 NR NR NR NR
21 Jun CFS Retail Property Australia AUD 5.75% 04 Jul 2016 5.75% 27.7% 250 A NR NR NR
16 Jun Sekisui House Japan JPY 0.00% 05 Jul 2016 -0.50% 31.6% 50000 NR A3 NR NR
15 Jun Lotte Shopping Korea JPY 0.00% 05 Jul 2016 -0.25% 23.8% 32500 NR A3 NR NR
15 Jun Lotte Shopping Korea USD 0.00% 05 Jul 2016 0.00% 23.8% 500 NR A3 NR NR
07 Jun Swiss Prime Switzerland CHF 1.88% 21 Jun 2016 1.88% 15.0% 190 NR NR NR NR
07 Jun OSIM Singapore SGD 2.75% 05 Jul 2016 2.75% 25.0% 120 NR NR NR NR
03 Jun Asia Cement Taiwan USD 0.00% 07 Jun 2016 0.30% 24.5% 173 NR NR NR NR
03 Jun Horizon Oil Australia USD 5.50% 17 Jun 2016 7.00% 29.0% 80 NR NR NR NR
26 May Sporting Bet UK GBP 7.00% 08 Jun 2016 7.00% 20.0% 65 NR NR NR NR
24 May Aabar - Daimler UAE EUR 4.00% 27 May 2016 4.00% 30.0% 1250 NR NR NR NR
17 May Derwent UK GBP 2.75% 15 Jul 2016 2.75% 30.0% 175 BBB NR BBB NR
17 May Wharf Holdings Hong Kong HKD 2.30% 07 Jun 2014 2.30% 65.0% 6220 NR NR NR NR
17 May UMC Taiwan USD 0.00% 24 May 2016 -0.25% 29.0% 500 NR NR NR NR
16 May Fonciere Des Regions France EUR 3.34% 01 Jan 2017 3.34% 20.0% 550 NR NR NR NR
20 Apr San Miguel Corp Philippines USD 2.00% 05 May 2014 2.00% 25.0% 600 BB- Ba3 NR NR
19 Apr Mingfa Hong Kong HKD 5.25% 23 May 2016 9.50% 20.0% 1560 NR NR NR NR
15 Apr Cofinimmo Belgium EUR 3.13% 28 Apr 2016 3.13% 15.0% 173 BBB NR BBB NR
14 Apr TPK Taiwan USD 0.00% 20 Apr 2014 0.00% 32.0% 400 NR NR NR NR
13 Apr China Power Intl Hong Kong RMB 2.25% 17 May 2016 2.25% 25.0% 982 NR NR NR NR
12 Apr Pescanova Spain EUR 5.13% 20 Apr 2017 6.75% 30.0% 180 NR NR NR NR
12 Apr Polarcus Norway USD 2.88% 27 Apr 2016 2.88% 32.5% 125 NR NR NR NR
08 Apr China Huiyuan Juice Hong Kong USD 4.00% 29 Apr 2016 5.00% 30.0% 150 NR NR NR NR
07 Apr Shangri-La Asia Hong Kong USD 0.00% 12 May 2016 2.25% 35.0% 500 NR NR NR NR
06 Apr Agile Property Hong Kong USD 4.00% 28 Apr 2016 4.00% 40.0% 500 BB Ba3 NR NR
04 Apr Suzlon India USD 5.00% 13 Apr 2016 6.50% 10.0% 175 NR NR NR NR
31 Mar Tsinlien - Tianjin Hong Kong CNY 1.25% 13 Apr 2016 1.25% 32.0% 1638 NR NR NR NR
31 Mar Sacyr Spain EUR 6.50% 01 May 2016 6.50% 25.0% 200 NR NR NR NR
29 Mar Celesio Germany EUR 2.50% 07 Apr 2018 2.50% 30.0% 350 NR NR NR NR
22 Mar Tatung Taiwan USD 0.00% 25 Mar 2014 0.00% 20.0% 150 NR NR NR NR
10 Mar CapitaMall Trust Singapore SGD 2.13% 19 Apr 2014 2.13% 24.0% 350 NR A2 NR NR

Barclays Capital | Convertible Weekly
7 November 2011 13
Size
Senior unsecured
issuer rating Issue rating
Date Issuer-underlying Country Ccy Coupon Maturity Yield Premium (mn) S&P Moody’s S&P Moody’s
10 Mar IHI Japan JPY 0.00% 29 Mar 2016 -0.50% 35.4% 23000 NR NR NR NR
10 Mar Steinhoff Sth Africa EUR 4.50% 31 Mar 2018 5.75% 32.0% 450 NR Ba1 NR NR
08 Mar TUI Germany EUR 2.75% 24 Mar 2016 2.75% 30.0% 339 B- Caa1 B- NR
03 Mar Ingenico France EUR 2.75% 01 Jan 2017 2.75% 40..0% 220 NR NR NR NR
03 Mar Immofinanz Austria EUR 4.25% 08 Mar 2018 4.25% 32.5% 515 NR NR NR NR
17 Feb Yamato Japan JPY 0.00% 07 Mar 2016 -0.50% 40.9% 20000 NR NR NR NR
02 Feb Ship Finance Bermuda USD 3.75% 10 Feb 2016 3.75% 35.0% 125 BB Ba3 NR NR
31 Jan London Mining UK USD 8.00% 15 Feb 2016 8.00% 38.0% 110 NR NR NR NR
25 Jan Pierre et Vacances France EUR 4.00% 01 Oct 2015 4.00% 25.0% 115 NR NR NR NR
20 Jan Asia Cement - FENC Taiwan USD 0.00% 27 Jan 2016 0.00% 30.0% 375 NR NR NR NR
19 Jan CGGVeritas France EUR 1.75% 01 Jan 2016 1.75% 25.0% 315 BB- Ba3 NR NR
18 Jan Epistar Taiwan USD 0.00% 27 Jan 2016 0.00% 30.0% 280 NR NR NR NR
18 Jan BTS Thailand THB 1.00% 25 Jan 2016 1.00% 13.0% 10,000 NR NR NR NR
18 Jan Essar Energy UK USD 4.25% 01 Feb 2016 4.25% 30.0% 500 NR NR NR NR
11 Jan Industrivarden Sweden EUR 1.88% 27 Feb 2017 1.88% 35.0% 550 A NR NR NR
Note: Ratings at time of issue. Source: Bloomberg, Barclays Capital
This morning, United Laboratories, a HK$7.8bn market cap manufacturer of pharmaceutical products, launched a RMB790mn 5y convertible bond. The bond is USD settled and may be upsized by RMB410mn. The coupon/yield is indicated at 6.5-7.5% with the initial conversion premium at 20-30% above the HK$6.00 reference share price. The bond is callable after two years subject to a 140% parity trigger and is puttable at par on its second anniversary. The new issue provides full dividend protection and, in the event of a takeover, there is a change of control put and a linear ratchet. United Laboratories said proceeds would be used to refinance existing debt and to fund capex.
As of 30 June 2011 United Laboratories has cash and cash equivalent of HK$687mn with total debt of HK$3308mn all of which is short-term. Total debt/EBITDA is 1.3x having improved from 1.7x at the end of 2010. United Laboratories’ 100-, 260-, 520- and 999-day realised volatilities are currently 61%, 51%, 54% and 61%, respectively. Median 90- and 260-day historical volatilities since its listing in June 2007 are 60% and 57%, respectively. The fully upsized bond could convert into 43 days of average 12-month trading volume. Stock borrow is indicated in the market in the high single digits. The bond provides full dividend protection.
Using a 950bp credit spread, 33% volatility (20% in a non credit calibrated model) and 5% borrow we value the new issue at 99.6 to 103.9 on best to worst for investors. This equates to implied volatility of 25-34%, a bond floor of 93.5-95.3 with delta of 45-54%. Hence on a theoretical basis this new issue looks attractive at issue towards mids or better. However, we highlight the potential liquidity issues with this small non-hedgeable name.
New 5y RMB790mn issue from United Laboratories
On a theoretical basis this new issue looks attractive at issue on
mids or better but we highlight the potential liquidity issues with this small non-hedgeable name

Barclays Capital | Convertible Weekly
7 November 2011 14
Figure 13: Monthly (left) and cumulative monthly (right) convertible issuance
EMEA (€ bn) Asia Pacific ($ bn)
0
1
2
3
4
5
6
7
Jan Feb Mar Apr May Jun Jul Aug Sep Oct Nov* Dec0
2
4
6
8
10
12
14
16
2011 2010
2011 Cumulative (RHS) 2010 Cumulative (RHS)
0
1
2
3
4
5
6
7
Jan Feb Mar Apr May Jun Jul Aug Sep Oct Nov* Dec0
2
4
6
8
10
12
14
16
2011 2010
2011 Cumulative (RHS) 2010 Cumulative (RHS)
Note: *Denotes month to date. Source: Barclays Capital

Barclays Capital | Convertible Weekly
7 November 2011 15
Figure 14: Top and bottom EMEA convertible performers
Top convertible performers Closing
price Weekly %
chg Weekly DN
% chg Parity Weekly %
chg Conversion
premium Weekly
chg Crncy Amount
out (mn)
Q-Cells 6.75% 2015 1.60 25.8 -5.1 1.17 94.3 37.23 -74.8 EUR 129 Q-Cells 1.375% 2012 44.00 14.3 14.3 2.06 94.3 2,036.60 -1,496.5 EUR 211
Q-Cells 5.75% 2014 24.50 6.5 3.7 5.99 94.3 308.71 -336.9 EUR 247
SGL Carbon 3.5% 2016 169.57 2.1 0.0 158.81 2.7 6.78 -0.6 EUR 190 SGL Carbon 0.75% 2013 128.22 2.1 0.0 127.81 2.7 0.32 -0.7 EUR 200
Tamweel sukuk 2013 93.00 1.6 1.6 8.78 -0.7 959.46 24.4 USD 300 Maurel et Prom 7.125% 2014 18.52 1.5 1.2 15.31 0.6 20.96 1.0 EUR 298
Air Berlin 1.5% 2027 98.00 1.0 1.0 11.28 -5.4 768.66 55.4 EUR 124
Marine Harvest 4.5% 2015 81.33 0.9 1.0 51.96 -0.4 56.54 1.9 EUR 225 Shire 2.75% 2014 116.16 0.6 -0.2 97.98 1.7 18.55 -1.4 USD 1,100
Bottom convertible performers Closing
price Weekly %
chg Weekly DN
% chg Parity Weekly %
chg Conversion
premium Weekly
chg Crncy Amount
out (mn)
Subsea 7 3.5% 2014 133.54 -11.1 -1.4 117.14 -14.3 14.00 4.2 USD 275
Frontline 4.5% 2015 43.08 -10.7 -10.6 12.87 -17.4 234.75 25.4 USD 225 Alcatel 5% 2015 2.89 -9.5 -3.7 1.67 -18.6 73.44 17.4 EUR 1,000
Petroplus 4% 2015 59.63 -8.2 -7.1 16.85 -19.1 253.89 42.2 USD 150
Fortis CASHES 40.00 -8.0 -7.6 5.81 -8.4 588.43 2.8 EUR 3,000 Suedzucker 2.5% 2016 127.03 -7.2 -0.7 112.10 -10.6 13.33 4.0 EUR 283
Theolia 2.7% 2015 9.00 -7.2 -5.8 8.21 -4.0 9.65 -3.8 EUR 193 Ageas FRESH 40.00 -7.0 -6.7 4.42 -8.4 805.82 14.1 EUR 1,250
REC 6.5% 2014 56.00 -6.7 -7.4 20.56 50.8 172.34 -167.8 EUR 320
Subsea 7 2.25% 2013 110.43 -6.7 -0.3 88.39 -14.3 24.93 10.2 USD 500 Note: Based on closing prices on 4 November 2011. Source: Barclays Capital
Figure 15: Top and bottom Asia Pacific convertible performers
Top convertible performers Closing
price Weekly %
chg Weekly DN
% chg Parity Weekly %
chg Conversion
premium Weekly
chg Crncy Amount
out (mn)
China Power Int 2.25% 2016 95.87 4.6 4.3 75.63 0.9 26.76 4.5 CNY 982
Anritsu Corporation 0% 2015 151.33 3.6 -0.0 150.24 4.0 0.72 -0.4 JPY 10,000 China Unicom 0.75% 2015 117.62 2.0 -0.7 104.33 4.6 12.73 -2.9 USD 1,839
Bakrieland Development 8.625% 2015 75.91 1.6 2.3 46.03 -6.7 64.91 13.5 USD 155 Hynix 2.65% 2015 98.95 1.6 0.1 73.25 7.1 35.10 -7.2 USD 500
Tulip IT 0% 2012 130.00 1.6 1.6 54.84 0.0 137.05 3.6 USD 97
Oceana 5.75% 2012 106.21 1.5 1.0 60.28 3.7 76.18 -4.0 AUD 53 Unicharm 0% 2015 109.38 1.3 -0.4 94.38 3.8 15.89 -2.9 JPY 46,000
Tata Power 1.75% 2014 96.80 1.2 1.2 67.50 0.3 43.42 1.3 USD 300 CFS Retail Property Trust 5.75% 2016 96.00 1.2 1.1 76.25 1.1 25.90 0.1 AUD 300
Bottom convertible performers Closing
price Weekly %
chg Weekly DN
% chg Parity Weekly %
chg Conversion
premium Weekly
chg Crncy Amount
out (mn)
Hidili 1.5% 2015 86.00 -11.3 -11.3 23.73 -7.0 262.35 -17.8 CNY 1,707
KCC - Hyundai Heavy Inds 3.5% 2014 143.63 -7.6 -1.8 143.12 -7.6 0.35 0.0 USD 55
Tata Motors 4% 2014 149.02 -5.6 2.2 145.82 -9.9 2.19 4.7 USD 120 Hongkong Land 2.75% 2012 129.33 -4.2 -0.3 130.65 -4.2 -1.01 -0.0 USD 105
GOME Electrical 3% 2014 105.84 -4.0 -1.4 78.37 -7.8 35.05 5.3 CNY 2,357 Soho China 3.75% 2014 111.03 -3.5 -0.8 98.71 -5.0 12.49 1.8 HKD 2,800
Kaisa 8% 2015 74.66 -3.1 -2.9 54.32 -1.6 37.45 -2.2 CNY 1,500
Orix 1% 2014 113.92 -2.7 -0.1 100.11 -4.9 13.80 2.5 JPY 149,988 Noble 0% 2014 149.23 -2.7 -0.5 125.43 -6.1 18.98 4.1 USD 250
Olam 6% 2016 118.95 -2.7 0.2 94.04 -5.6 26.49 3.7 USD 500 Note: Based on closing prices on 4 November 2011. Source: Barclays Capital

Barclays Capital | Convertible Weekly
7 November 2011 16
CALENDAR Monday, 7 November 2011 GMT Data/event Previous Market F/C BarCap F/C
Ageas FRESH Coupon
Anglo American 4% 2014 Coupon
Pescanova Q3
Core Projects 7% 2015 Coupon
Suzuki Motor H1
E17 - Eurogroup meeting
E17 10:00 Retail sales, % m/m (y/y) 0.1 (-0.1) 0.0 (-0.3) -0.6 (-1.1)
Germany 11:00 Industrial production, % m/m (y/y) -1.0 (7.9) -0.9 (7.0) -1.1 (7.1)
Tuesday, 8 November 2011 GMT Data/event Previous Market F/C BarCap F/C
Adecco Q3
Cap Gemini Q3
Nobel Biocare 1% 2011 Maturity
Richter Gedeon Nyrt Q3 (Est)
Salzgitter - Aurubis 2% 2017 Coupon
SAS AB Q3
Firstsource Solutions Q2
E27 - ECOFIN meeting
Italy - Confidence vote in the Senate on the measures decided to be approved in response to renewed market tensions (tentative)
UK 09:30 Industrial output, % m/m (y/y) 0.2 (-1.0) 0.1 (-0.8) 0.3 (-0.5)
UK 09:30 Manufacturing output, % m/m (y/y) -0.3 (1.5) 0.1 (1.9) 0.1 (1.9)
Wednesday, 9 November 2011 GMT Data/event Previous Market F/C BarCap F/C
Air France-KLM Q2
AngloGold Ashanti Q3
CA Immobilien 4.125% 2014 Coupon
CGG-Veritas Q3
Colonia Real Estate Q3
Dana Gas PJSC Q3 (Est)
Deutsche Post Q3
ITV 4% 2016 Coupon
J Sainsbury H1
Kloeckner & Co Q3
PetroBakken Energy Q3
Shire 2.75% 2014 Coupon
Talvivaara Mining Co Q3
Noble Group Q3
Wilmar International Q3
Yamada Denki Co H1
US 14:30 Fed Chairman Bernanke speaks at Fed conference on small business
China - Industrial production, % y/y 13.8 13.4 13.3
China - Fixed asset investments, YTD % y/y 24.9 24.8 24.6
China - Retail sales, % y/y 17.7 17.5 17.5
China 02:00 CPI, % y/y 6.1 5.4 5.4
China 02:00 PPI, % y/y 6.5 5.8 5.6
Japan 23:50 Core machinery order, % m/m 11 -7.1 -12.2

Barclays Capital | Convertible Weekly
7 November 2011 17
Thursday, 10 November 2011 GMT Data/event Previous Market F/C BarCap F/C
Ageas Q3 (Est)
Aldar sukuk 2011 Maturity
Banca Monte dei Paschi di Sien Q3
Deutsche Telekom Q3
Hera Q3
Immobiliare Grande Distribuzio Q3
Risanamento Q3
Vedanta Resources H1
Home Inns & Hotels Management Q3
Melco Crown Entertainment Q3
Tata Steel Q2
Yanlord Land Group Q3 (Est)
Sawai Pharmaceutical Co H1
Italy 09:00 Industrial production, % m/m (y/y) 4.3 (3.8) -2.5 -4.0 (1.2)
US 13:30 Trade balance, $ bn -45.6 -46 -45.8
US 13:30 Initial jobless claims, k (4wma) 397 (406) - 395 (401)
Japan 23:50 Corporate goods price index, % y/y 2.5 2.2 2.3
Japan 23:50 Index of tertiary industry activity, % m/m -0.2 -0.5 -0.6
Friday, 11 November 2011 GMT Data/event Previous Market F/C BarCap F/C
Celesio Q3 (Est)
FCC Q3
IVG Immobilien Q3 (Est)
Salzgitter Q3
Solon Q3 (Est)
TMK 5.25% 2015 Coupon
Educomp Solutions Q2
Plethico Pharmaceuticals Q3 (Est)
Reliance Communications Q2 (Est)
Rolta India Ex-Dividend
Sterling Biotech Q3 (Est)
Ying Li International Real Est Q3 (Est)
Bank of Kyoto Ltd/The H1
Matsumotokiyoshi Holdings Co H1
China - M2 growth, % y/y (to 15/11) 13 13.1 13.3
UK 09:30 Input prices, % m/m (y/y) 1.7 (17.5) 0.1 (14.8) 0.0 (14.7)
UK 09:30 Output prices, % m/m (y/y) 0.3 (6.3) 0.2 (5.9) 0.2 (5.9)
UK 09:30 Core output prices, % m/m (y/y) 0.3 (3.8) 0.1 (3.6) 0.2 (3.7)
Source: Bloomberg, Reuters, Barclays Capital’s Global Traders' Guide, 4 November 2011
Barclays Capital | Convertible Weekly
7 November 2011 18
CONVERTIBLE BOND RESEARCH ANALYSTS
Barclays Capital 5 The North Colonnade London E14 4BB
Luke Olsen +44 (0)20 7773 8310 [email protected] Barclays Capital, London
Heather Beattie, CFA +44 (0)20 7773 5859 [email protected] Barclays Capital, London
Angus Allison +44 (0)20 7773 5379 [email protected] Barclays Capital, London

Barclays Capital | Convertible Weekly
7 November 2011 19
Analyst Certification(s) We, Angus Allison, Luke Olsen and Heather Beattie, hereby certify (1) that the views expressed in this research report accurately reflect our personal views about any or all of the subject securities or issuers referred to in this research report and (2) no part of our compensation was, is or will be directly or indirectly related to the specific recommendations or views expressed in this research report. Important Disclosures For current important disclosures regarding companies that are the subject of this research report, please send a written request to: Barclays Capital Research Compliance, 745 Seventh Avenue, 17th Floor, New York, NY 10019 or refer to https://ecommerce.barcap.com/research/cgi-bin/all/disclosuresSearch.pl or call 1-212-526-1072. The analysts responsible for preparing this research report have received compensation based upon various factors including the firm’s total revenues, a portion of which is generated by investment banking activities. Research analysts employed outside the US by affiliates of Barclays Capital Inc. are not registered/qualified as research analysts with FINRA. These analysts may not be associated persons of the member firm and therefore may not be subject to NASD Rule 2711 and incorporated NYSE Rule 472 restrictions on communications with a subject company, public appearances and trading securities held by a research analyst’s account. Barclays Capital produces a variety of research products including, but not limited to, fundamental analysis, equity-linked analysis, quantitative analysis, and trade ideas. Recommendations contained in one type of research product may differ from recommendations contained in other types of research products, whether as a result of differing time horizons, methodologies, or otherwise. Barclays Capital, the Investment Banking Division of Barclays Bank PLC, is acting as corporate broker to Subsea 7 S.A. Barclays Capital, the Investment Banking Division of Barclays Bank PLC, is acting as corporate broker to International Consolidated Airlines Group SA. Barclays Capital is providing investment banking services to Hewlett-Packard Company in connection with its proposed approach for Autonomy Corporation Plc. Risk Disclosure(s) The convertible valuations are based on Barclays Capital proprietary convertible valuation model, under which key assumptions relate to credit spread and equity volatility metrics. Material changes in any of these variables can have a significant impact on valuation. Upside/downside analysis takes into consideration likely future valuation and expected trading patterns, among others. It is based on a total return participation of the convertible relative to a +/- 25% (unless otherwise specified) change in the common stock’s price over a one‐year investment horizon. A material change in the company’s financial situation can significantly alter this assessment. Mentioned Stocks (Ticker, Date, Price) Alcatel-Lucent (ALUA.PA, 07-Nov-2011, EUR 1.54), 2-Equal Weight/2-Neutral Anglo American plc (AAL.L, 07-Nov-2011, GBP 23.70), 1-Overweight/2-Neutral Deutsche Post AG (DPWGn.DE, 07-Nov-2011, EUR 10.68), 1-Overweight/1-Positive Galp Energia (GALP.LS, 07-Nov-2011, EUR 14.65), 1-Overweight/2-Neutral Inmarsat plc (ISA.L, 07-Nov-2011, GBP 4.61), 1-Overweight/1-Positive Parkson Retail Group Ltd. (3368.HK, 07-Nov-2011, HKD 9.86), 1-Overweight/2-Neutral Petroplus Holdings (PPHN.VX, 07-Nov-2011, CHF 4.52), 1-Overweight/3-Negative Guide to the Barclays Capital Fundamental Equity Research Rating System: Our coverage analysts use a relative rating system in which they rate stocks as 1-Overweight, 2- Equal Weight or 3-Underweight (see definitions below) relative to other companies covered by the analyst or a team of analysts that are deemed to be in the same industry sector (“the sector coverage universe”). To see a list of companies that comprise a particular sector coverage universe, please go to http://publicresearch.barcap.com. In addition to the stock rating, we provide sector views which rate the outlook for the sector coverage universe as 1-Positive, 2-Neutral or 3-Negative (see definitions below). A rating system using terms such as buy, hold and sell is not the equivalent of our rating system. Investors should carefully read the entire research report including the definitions of all ratings and not infer its contents from ratings alone. Stock Rating 1-Overweight - The stock is expected to outperform the unweighted expected total return of the sector coverage universe over a 12-month investment horizon. 2-Equal Weight - The stock is expected to perform in line with the unweighted expected total return of the sector coverage universe over a 12-month investment horizon. 3-Underweight - The stock is expected to underperform the unweighted expected total return of the sector coverage universe over a 12-month investment horizon. RS-Rating Suspended - The rating and target price have been suspended temporarily due to market events that made coverage impracticable or to comply with applicable regulations and/or firm policies in certain circumstances including when Barclays Capital is acting in an advisory capacity in a merger or strategic transaction involving the company. comcom

Barclays Capital | Convertible Weekly
7 November 2011 20
Sector View 1-Positive - sector coverage universe fundamentals/valuations are improving. 2-Neutral - sector coverage universe fundamentals/valuations are steady, neither improving nor deteriorating. 3-Negative - sector coverage universe fundamentals/valuations are deteriorating. Distribution of Ratings: Barclays Capital Inc. Equity Research has 1907 companies under coverage. 44% have been assigned a 1-Overweight rating which, for purposes of mandatory regulatory disclosures, is classified as a Buy rating; 57% of companies with this rating are investment banking clients of the Firm. 42% have been assigned a 2-Equal Weight rating which, for purposes of mandatory regulatory disclosures, is classified as a Hold rating; 50% of companies with this rating are investment banking clients of the Firm. 12% have been assigned a 3-Underweight rating which, for purposes of mandatory regulatory disclosures, is classified as a Sell rating; 38% of companies with this rating are investment banking clients of the Firm. Guide to the Barclays Capital Price Target: Each analyst has a single price target on the stocks that they cover. The price target represents that analyst's expectation of where the stock will trade in the next 12 months. Upside/downside scenarios, where provided, represent potential upside/potential downside to each analyst's price target over the same 12-month period. Barclays Capital offices involved in the production of equity research: London Barclays Capital, the investment banking division of Barclays Bank PLC (Barclays Capital, London) New York Barclays Capital Inc. (BCI, New York) Tokyo Barclays Capital Japan Limited (BCJL, Tokyo) São Paulo Banco Barclays S.A. (BBSA, São Paulo) Hong Kong Barclays Bank PLC, Hong Kong branch (Barclays Bank, Hong Kong) Toronto Barclays Capital Canada Inc. (BCC, Toronto) Johannesburg Absa Capital, a division of Absa Bank Limited (Absa Capital, Johannesburg) Mexico City Barclays Bank Mexico, S.A. (BBMX, Mexico City) Taiwan Barclays Capital Securities Taiwan Limited (BCSTW, Taiwan) Seoul Barclays Capital Securities Limited (BCSL, Seoul) Mumbai Barclays Capital Securities (India) Private Limited (BSIPL, Mumbai) Singapore Barclays Bank PLC, Singapore branch (Barclays Bank, Singapore)
Disclaimer This publication has been prepared by Barclays Capital, the investment banking division of Barclays Bank PLC, and/or one or more of its affiliates asprovided below. It is provided to our clients for information purposes only, and Barclays Capital makes no express or implied warranties, and expresslydisclaims all warranties of merchantability or fitness for a particular purpose or use with respect to any data included in this publication. Barclays Capital will not treat unauthorized recipients of this report as its clients. Prices shown are indicative and Barclays Capital is not offering to buy or sell or solicitingoffers to buy or sell any financial instrument. Without limiting any of the foregoing and to the extent permitted by law, in no event shall Barclays Capital,nor any affiliate, nor any of their respective officers, directors, partners, or employees have any liability for (a) any special, punitive, indirect, orconsequential damages; or (b) any lost profits, lost revenue, loss of anticipated savings or loss of opportunity or other financial loss, even if notified of thepossibility of such damages, arising from any use of this publication or its contents. Other than disclosures relating to Barclays Capital, the information contained in this publication has been obtained from sources that Barclays Capital believes to be reliable, but Barclays Capital does not represent orwarrant that it is accurate or complete. The views in this publication are those of Barclays Capital and are subject to change, and Barclays Capital has noobligation to update its opinions or the information in this publication. The analyst recommendations in this publication reflect solely and exclusively those of the author(s), and such opinions were prepared independently of any other interests, including those of Barclays Capital and/or its affiliates. This publication does not constitute personal investment advice or take intoaccount the individual financial circumstances or objectives of the clients who receive it. The securities discussed herein may not be suitable for allinvestors. Barclays Capital recommends that investors independently evaluate each issuer, security or instrument discussed herein and consult any independent advisors they believe necessary. The value of and income from any investment may fluctuate from day to day as a result of changes inrelevant economic markets (including changes in market liquidity). The information herein is not intended to predict actual results, which may differ substantially from those reflected. Past performance is not necessarily indicative of future results. This communication is being made available in the UK and Europe primarily to persons who are investment professionals as that term is defined in Article

Barclays Capital | Convertible Weekly
7 November 2011 21
19 of the Financial Services and Markets Act 2000 (Financial Promotion Order) 2005. It is directed at, and therefore should only be relied upon by, personswho have professional experience in matters relating to investments. The investments to which it relates are available only to such persons and will beentered into only with such persons. Barclays Capital is authorized and regulated by the Financial Services Authority ('FSA') and member of the LondonStock Exchange. Barclays Capital Inc., U.S. registered broker/dealer and member of FINRA (www.finra.org), is distributing this material in the United States and, inconnection therewith accepts responsibility for its contents. Any U.S. person wishing to effect a transaction in any security discussed herein should do so only by contacting a representative of Barclays Capital Inc. in the U.S. at 745 Seventh Avenue, New York, New York 10019. Non-U.S. persons should contact and execute transactions through a Barclays Bank PLC branch or affiliate in their home jurisdiction unless localregulations permit otherwise. This material is distributed in Canada by Barclays Capital Canada Inc., a registered investment dealer and member of IIROC (www.iiroc.ca). To accessBarclays Capital policy on the dissemination of research reports, please go to http://www.barcap.com/Client+offering/Research/Research+Policy. Subjectto the conditions of this publication as set out above, Absa Capital, the Investment Banking Division of Absa Bank Limited, an authorised financial services provider (Registration No.: 1986/004794/06), is distributing this material in South Africa. Absa Bank Limited is regulated by the South African ReserveBank. This publication is not, nor is it intended to be, advice as defined and/or contemplated in the (South African) Financial Advisory and IntermediaryServices Act, 37 of 2002, or any other financial, investment, trading, tax, legal, accounting, retirement, actuarial or other professional advice or servicewhatsoever. Any South African person or entity wishing to effect a transaction in any security discussed herein should do so only by contacting arepresentative of Absa Capital in South Africa, 15 Alice Lane, Sandton, Johannesburg, Gauteng 2196. Absa Capital is an affiliate of Barclays Capital. InJapan, foreign exchange research reports are prepared and distributed by Barclays Bank PLC Tokyo Branch. Other research reports are distributed toinstitutional investors in Japan by Barclays Capital Japan Limited. Barclays Capital Japan Limited is a joint-stock company incorporated in Japan with registered office of 6-10-1 Roppongi, Minato-ku, Tokyo 106-6131, Japan. It is a subsidiary of Barclays Bank PLC and a registered financial instruments firmregulated by the Financial Services Agency of Japan. Registered Number: Kanto Zaimukyokucho (kinsho) No. 143. Barclays Bank PLC, Hong Kong Branchis distributing this material in Hong Kong as an authorised institution regulated by the Hong Kong Monetary Authority. Registered Office: 41/F, Cheung Kong Center, 2 Queen's Road Central, Hong Kong. This material is issued in Taiwan by Barclays Capital Securities Taiwan Limited. This material onsecurities not traded in Taiwan is not to be construed as 'recommendation' in Taiwan. Barclays Capital Securities Taiwan Limited does not accept orders from clients to trade in such securities. This material may not be distributed to the public media or used by the public media without prior written consentof Barclays Capital. All equity research material is distributed in India by Barclays Securities (India) Private Limited (SEBI Registration No: INB/INF231292732 (NSE), INB/INF 011292738 (BSE), Registered Office: 208 | Ceejay House | Dr. Annie Besant Road | Shivsagar Estate | Worli | Mumbai - 400 018 | India, Phone: + 91 22 67196363). Other research reports are distributed in India by Barclays Bank PLC, India Branch. Barclays Bank PLC Frankfurt Branchdistributes this material in Germany under the supervision of Bundesanstalt für Finanzdienstleistungsaufsicht (BaFin). This material is distributed in Malaysia by Barclays Capital Markets Malaysia Sdn Bhd. This material is distributed in Brazil by Banco Barclays S.A. This material is distributed in Mexico byBarclays Bank Mexico, S.A. Barclays Bank PLC in the Dubai International Financial Centre (Registered No. 0060) is regulated by the Dubai Financial ServicesAuthority (DFSA). Barclays Bank PLC-DIFC Branch, may only undertake the financial services activities that fall within the scope of its existing DFSA licence. Barclays Bank PLC in the UAE is regulated by the Central Bank of the UAE and is licensed to conduct business activities as a branch of acommercial bank incorporated outside the UAE in Dubai (Licence No.: 13/1844/2008, Registered Office: Building No. 6, Burj Dubai Business Hub, Sheikh Zayed Road, Dubai City) and Abu Dhabi (Licence No.: 13/952/2008, Registered Office: Al Jazira Towers, Hamdan Street, PO Box 2734, Abu Dhabi).Barclays Bank PLC in the Qatar Financial Centre (Registered No. 00018) is authorised by the Qatar Financial Centre Regulatory Authority (QFCRA).Barclays Bank PLC-QFC Branch may only undertake the regulated activities that fall within the scope of its existing QFCRA licence. Principal place ofbusiness in Qatar: Qatar Financial Centre, Office 1002, 10th Floor, QFC Tower, Diplomatic Area, West Bay, PO Box 15891, Doha, Qatar. This material isdistributed in Dubai, the UAE and Qatar by Barclays Bank PLC. Related financial products or services are only available to Professional Clients as defined by the DFSA, and Business Customers as defined by the QFCRA. This material is distributed in Saudi Arabia by Barclays Saudi Arabia ('BSA'). It is not theintention of the Publication to be used or deemed as recommendation, option or advice for any action (s) that may take place in future. Barclays SaudiArabia is a Closed Joint Stock Company, (CMA License No. 09141-37). Registered office Al Faisaliah Tower | Level 18 | Riyadh 11311 | Kingdom of SaudiArabia. Authorised and regulated by the Capital Market Authority, Commercial Registration Number: 1010283024. This material is distributed in Russia by OOO Barclays Capital, affiliated company of Barclays Bank PLC, registered and regulated in Russia by the FSFM. Broker License #177-11850-100000; Dealer License #177-11855-010000. Registered address in Russia: 125047 Moscow, 1st Tverskaya-Yamskaya str. 21. This material is distributed in Singapore by the Singapore branch of Barclays Bank PLC, a bank licensed in Singapore by the Monetary Authority of Singapore. For matters in connectionwith this report, recipients in Singapore may contact the Singapore branch of Barclays Bank PLC, whose registered address is One Raffles Quay Level 28,South Tower, Singapore 048583. Barclays Bank PLC, Australia Branch (ARBN 062 449 585, AFSL 246617) is distributing this material in Australia. It is directed at 'wholesale clients' as defined by Australian Corporations Act 2001. IRS Circular 230 Prepared Materials Disclaimer: Barclays Capital and its affiliates do not provide tax advice and nothing contained herein should beconstrued to be tax advice. Please be advised that any discussion of U.S. tax matters contained herein (including any attachments) (i) is not intended orwritten to be used, and cannot be used, by you for the purpose of avoiding U.S. tax-related penalties; and (ii) was written to support the promotion or marketing of the transactions or other matters addressed herein. Accordingly, you should seek advice based on your particular circumstances from anindependent tax advisor. Barclays Capital is not responsible for, and makes no warranties whatsoever as to, the content of any third-party web site accessed via a hyperlink in this publication and such information is not incorporated by reference. © Copyright Barclays Bank PLC (2011). All rights reserved. No part of this publication may be reproduced in any manner without the prior written permission of Barclays Capital or any of its affiliates. Barclays Bank PLC is registered in England No. 1026167. Registered office 1 Churchill Place, London,E14 5HP. Additional information regarding this publication will be furnished upon request.

EU17558