THE POWER OF MANY - Bidvest
230
The Bidvest Group Limited ANNUAL INTEGRATED REPORT 2011 THE POWER OF MANY The Bidvest Group Limited ANNUAL INTEGRATED REPORT 2011
-
Upload
khangminh22 -
Category
Documents
-
view
1 -
download
0
Transcript of THE POWER OF MANY - Bidvest
Th
e Bid
vest Gro
up
Lim
ited A
nn
uA
L in
Te
Gr
AT
ed
re
po
rT
2011
THE POWER OF MANY
The Bidvest Group Limited
ANNUAL INTEGRATED REpoRT 2011

PASSION / VITALITY / PRECISION
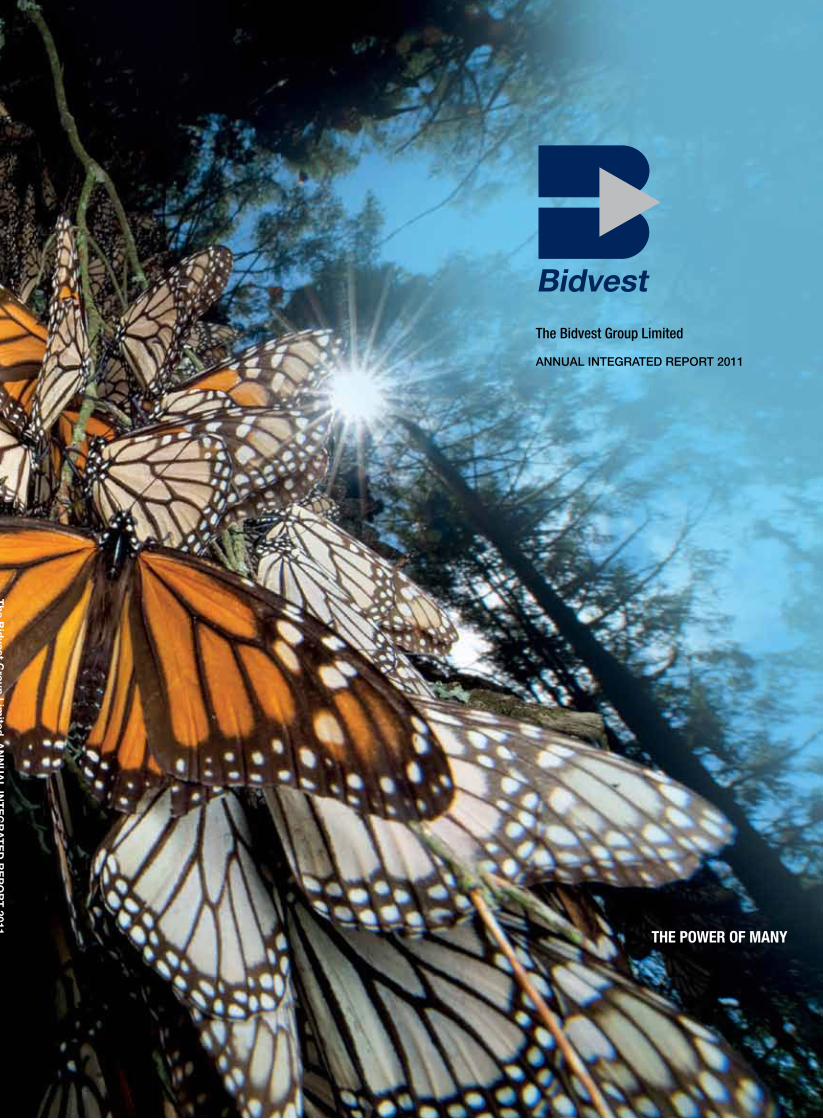
Bidvest is a family of 105 057 people.The vitality of each individual generates the life force of the whole.Our passion and energy translates into action. Our expression is unique.We are proudly Bidvest.
We have used the butterfly to illustrate this report
because its characteristics epitomise the Bidvest
group – passion, vitality, precision, unity, energy,
strength and the power of many.
www.bidvest.com
Scope and boundariesThe Bidvest world is a dynamic one. The power of many people and many businesses operating within a variety of industries and geographies underpins the decentralised entrepreneurial mindset of the Group and creates exciting opportunities.
We continue to integrate our social, environmental and governance performance with our financial performance and are progressing on the journey outlined in King III. This is our eighth year of reporting sustainability issues and the fourth successive year that we have included sustainability information in our integrated annual report. This report includes links to additional information on the Bidvest website. The annual integrated report covers the financial year from July 1 2010 to June 30 2011.
The annual financial statements are prepared in accordance with the International Financial Reporting Standards (IFRS), the Companies Act of South Africa and the JSE listings requirements. Our ESG (environmental, social and governance) information is collated in accordance with the GRI (Global Reporting Initiative) guidelines. The GRI (G3) indicator index can be found on our website at www.bidvest.com/ar/bidvest_ar2011/001.php
Group-wide sustainability information has been maintained, collated and captured by individual companies using a common online data collation tool.
While no significant changes were made to the scope, boundaries or measurement methods, restructuring of the Bidvest South Africa divisions and their constituent business required restatement of some of the data at divisional level for the 2010 year. 2009 data is no longer comparable and has been omitted from this report, but is available with other historical information on the Bidvest website. From 2012, the report will include three years’ data for improved trend analysis.
Structural changes, realignment of management responsibilities and acquisitions affect the comparability of some data. The effect of these data inclusions or exclusions is noted.
The Bidvest Group Limited annual integrated report for the year ended June 30 2011

FINANCIAL STATEMENTSAND OTHER INFORMATION
01
GROUP OVERVIEW PERFORMANCE OVERVIEW
THE BIDVEST GROUP LIMITED / ANNUAL INTEGRATED REPORT 2011
The Group financials and other useful information
Audited financial statements 125
Shareholder information 222
Shareholders’ diary 224
Glossary 225
Administration 226
Our company logos IBC
The chairman’s report, our board and management structures and the overall performance of our market segments as reviewed by the chief executive, financial director and divisional chief executives
Chairman’s review 26
Strategy 29
Chief executive’s statement 30
Financial director’s review 36
Governance for a sustainable business 40
Operational reviews 51
A description of the business activities including overviews of our markets, the Group’s strategy, measures of performance and the outlook for 2012
Highlights 02
Bidvest at a glance: our structure 07
Consolidated segmental analysis 10
Our history 13
Our global footprint 14
Group financial history 16
Directorate 18
We are an international services, trading and distribution company, listed on the JSE, South Africa and operating on four continents.
We employ 105 057 people worldwide, but our roots remain South African.
In a big business environment we run our company with the determination and commitment evident in a small business heart.
We believe in empowering people, building relationships and improving lives. Entrepreneurship, incentivisation, decentralised management and communication are the keys.
We subscribe to a philosophy of transparency, accountability, integrity, excellence and innovation in all our business dealings.
We turn ordinary companies into extraordinary performers, delivering strong and consistent shareholder returns in the process.
But most importantly, we understand that people create wealth and that companies only report it.

PASSION/VITALITY/PRECISION
02
Highlights
Revenue
+7,9%R118,5 billion
Trading profit
+9,1%R6,1 billion
Headline earnings per share +8,2%1 157,4 cents
Dividend per share +11,1%480,0 cents
Teamwork and managerial competence; this is what underpins any success at Bidvest.A quote from a Moneyweb article, articulates this as follows; “What sets a multi-faceted business apart is exceptional management; Bidvest seems to demonstrate that”.
0
5 000
10 000
15 000
20 000
03 04 05 06 07 08 09 10 11
4 30
0
5 25
0 7 27
0 9 87
5
14 1
23
9 83
8
9 67
4 12 1
89 15 0
50
Share price(Cents)
0
100
200
300
400
500
190,
0
220,
0
250,
2
306,
0 369,
0 446,
4
495,
0
380,
0
432,
0
480,
0
0302 04 05 06 07 08 09 10 11
Distributions per share(Cents)
+11,1%
0
200
400
600
800
1 000
1 200
0302 04 05 06 07 08 09 10 11
432,
8
463,
5
544,
0
656,
4
804,
6 970,
0
1 06
8,0
930,
0
1 07
0,0
1 15
7,4
Headline earnings per share
(Cents)
+8,2%
R1 000 invested at the start of Bidvest
in 1988 with capital and dividend
distributions reinvested, would be
worth an estimated R558 236, a
compound return of 32% per annum.
In a recent survey, Bidvest’s compound
annual growth rate in total shareholder
return over three years was 133%
when compared to a peer group of
companies.
03 THE BIDVEST GROUP LIMITED / ANNUAL INTEGRATED REPORT 2011
GROUP OVERVIEW
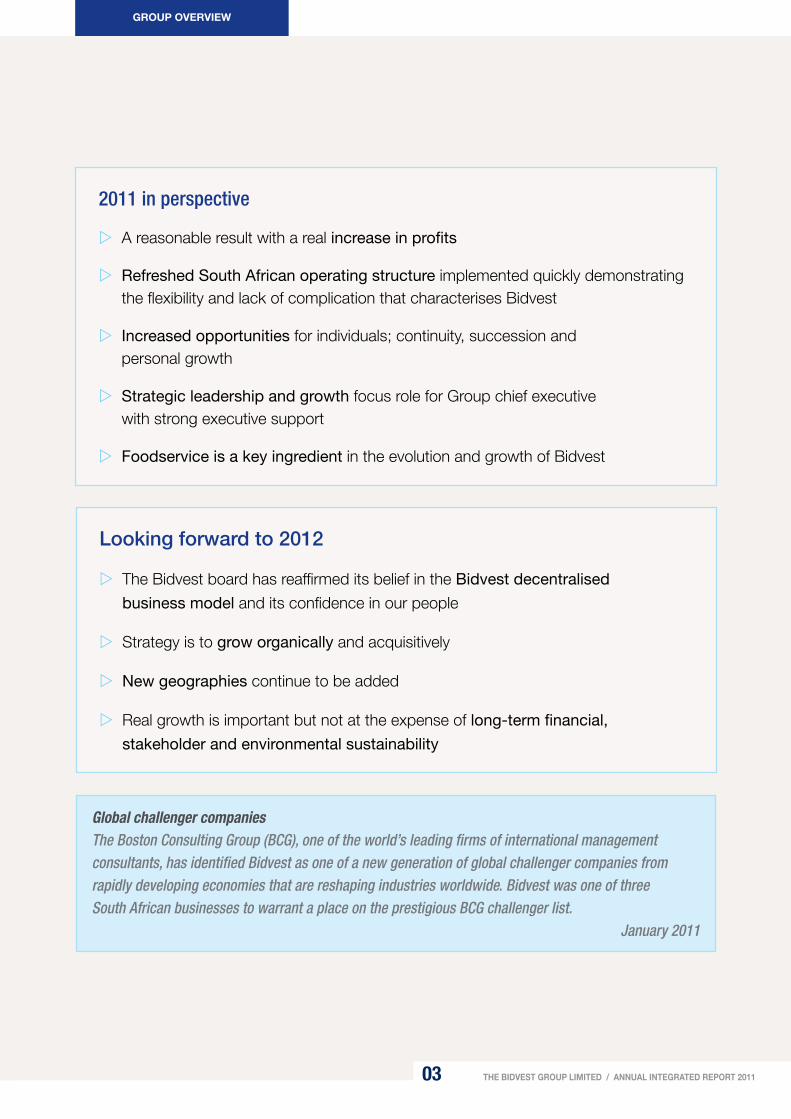
2011 in perspective
A reasonable result with a real increase in profits
Refreshed South African operating structure implemented quickly demonstrating the flexibility and lack of complication that characterises Bidvest
Increased opportunities for individuals; continuity, succession and personal growth
Strategic leadership and growth focus role for Group chief executive with strong executive support
Foodservice is a key ingredient in the evolution and growth of Bidvest
Global challenger companiesThe Boston Consulting Group (BCG), one of the world’s leading firms of international management consultants, has identified Bidvest as one of a new generation of global challenger companies from rapidly developing economies that are reshaping industries worldwide. Bidvest was one of three South African businesses to warrant a place on the prestigious BCG challenger list.
January 2011
Looking forward to 2012
The Bidvest board has reaffirmed its belief in the Bidvest decentralised
business model and its confidence in our people
Strategy is to grow organically and acquisitively
New geographies continue to be added
Real growth is important but not at the expense of long-term financial,
stakeholder and environmental sustainability

PASSION/VITALITY/PRECISION
04
Social upliftment in NamibiaBidvest Namibia is involved in sourcing brown and white beans from rural Namibian women who are involved in subsistence farming. These beans are canned – at a Bidvest Namibia canning factory – and sold to the commercial market.
We are proudly Bidvest
Bidvest Unity WalkThe Proudly Bidvest family in Johannesburg came out in full force on Sunday, August 14 2011 when we regained our Guinness world record title for the largest charity walk. More than 24 000 Bidvest people and their families enjoyed a beautiful sunny Sunday morning while raising money for charity. A donation of R180 000 was made to the Reach for a Dream Foundation.
Bidvest World Chefs’ Tour Against Hunger250 chefs from 44 countries participated in this wonderful event which raised R8 million over the 10 days of the tour. All funds raised will go directly into providing 821 250 meals to needy children over a five year-period.
Endorsed by Wor ld Assoc iat ion o f Chefs S oc iet iesPre s e nte d by S o u t h Af r i ca n Ch e f s A s s o c i at i o n
Carbon Disclosure Project 2011The United Nations-sponsored Carbon Disclosure Project provides investors with information about carbon emissions and climate change exposure of the world’s major corporations. Bidvest’s disclosure was ranked highly in South Africa.
JSE Social Responsibility Investment IndexBased on an assessment of the Group’s policies, performance and reporting on economic, social and environmental sustainability, the JSE has reaffirmed Bidvest as a founding constituent of the SRI Index. Bidvest, one of 30 best performers out of 109 listed companies included in the research, is one of 67 constituents of the index. Bidvest was assessed as having a low environmental impact. The index is the first of its kind in an emerging market and the first to be launched by a stock exchange.
Renewable energySince July 2008, over 97% of 3663’s electricity has been from renewable sources via sustainable suppliers to the UK national grid.

05
GROUP OVERVIEW
THE BIDVEST GROUP LIMITED / ANNUAL INTEGRATED REPORT 2011
Operational highlights
Strategic review of Foodservice business highlighted the value of this asset.
Realignment of South African businesses and executive responsibilities provides a
platform for the pursuit of new opportunities.
The inherent value of Proudly Bidvest people recognised and celebrated with
senior posts being filled by people from within the businesses.
Businesses grouped via similar product and services offerings.
Asset management and cost efficiency remain focus areas.
Real value created for B-BBEE partners Dinatla with a fully paid shareholding
valued in excess of R2,0 billion.
Bidvest South Africa businesses adjusted smoothly to the new Consumer
Protection Act which underpins a strong reputation and existing high standards of
quality and customer service.
Renewal of approach to risk management.
Information technology governance plan developed in line with King III principles.
Corporate social investment spend continues to increase.
New best practice online sustainability data collation tool enabling improved
accountability and accuracy in reporting.
In South Africa Bidvest achieved level 3 B-BBEE status reflecting the
commitment to achieve transformation objectives.
Formal environmental policies and targets developed at many of the businesses.
High standards of food safety further improved in many of the Foodservice
businesses.

06 THE BIDVEST GROUP LIMITED / ANNUAL INTEGRATED REPORT 2011
ENERGY
07 Bidvest at a glance: our structure
10 Consolidated segmental analysis
13 Our history
14 Our global footprint
16 Group financial history
18 Directorate
One of nature’s most magical events occurs when a slow-moving caterpillar transforms into a colourfully winged, beautiful butterfly – a transformation that ensures the survival of the species, a torrent of energy focused on a single goal. It is the same, focused energy that drives Bidvest.

07
PASSION/VITALITY/PRECISION
Description of business Incorporating Results and prospects Sustainable development and commentary
Bidvest Corporate
Provides strategic direction, financial, risk and sustainability management, marketing, investor relations, corporate communications, corporate finance, houses investments and provides executive training to the Group. Adds value by identifying opportunities and implementing Bidvest’s decentralised entrepreneurial business model.
Bidvest Corporate Services; Bidvest Properties; Ontime Automotive; Bidvest Wits Football Club; Bidvest Procurement.
Bidvest’s strategic property holdings contributed R207,2m in income, up 17,3%. A state-of-the-art “World of Yamaha” facility in Johannesburg opened for business. Subject to certain formalities, 50% of economic interest in Mumbai International Airport has been sold. A $13,5m investment has been made into Icelandic Water Holdings (makers of “Icelandic Glacial”) an initial stake of 14,6%.
A new database tool developed and implemented towards year-end demonstrates that Bidvest is taking measurement seriously. The new tool is based on a globally recognised system with powerful customising capacity. This represents a major step towards more powerful data management, monitoring and reporting against targets. It offers a platform that will allow us to build in custom indicators for individual companies to gather more meaningful data relevant to particular industries.
Bidvest Automotive One of South Africa’s largest motor vehicle groups offering leading motor brands through 116 dealerships, as well as vehicle auctioneering. McCarthy Motor group; Burchmore’s.
A focused vehicle retailer with results driven by new vehicle demand. Margins overall remain under pressure. Anticipate an increased return on sales while realigning the cost base to the new slimmed-down division.Revenue up 17,4% to R18,6bn. Profit up 10,7% to R255,4m. New vehicle sales up 22%. Parts and service contribution affected by stock shortages and deferral of maintenance due to rising living costs. Strike action and the Japanese natural disasters resulted in stock shortages. Costs experienced due to rationalisation of Value Centres and Call-a-Car outlets. Burchmore’s auctioneers affected by reduced repossessions and lower used-car values.Management changes implemented with a new invigorated team in place. Additional productivity improvements identified. Stable vehicle pricing and low interest rates beneficial for customer affordability but negative for dealer margin.
Systems implemented to facilitate and measure sustainability activities. Restructuring factors influenced revenue and trading profit. Training spend rises to R93,1m despite lower staff numbers and challenging trading conditions. A target to reduce electricity consumption by 10% by 2012 has been implemented. The carbon footprint exercise identified two key focus areas: reducing our impacts on climate change (by electricity reduction and water savings) and improving our waste management (implementing the concepts of reduce, reuse and recycle).
Bidvest Electrical A leading distributor of electrical products and services.
Voltex; Atlas Cable Supplies; Versalec Cables; Bellco Electrical; Litecor Electrical; Keens Electrical; Waco Industries; Globe Electrical; Sanlic International; Electric Centre; Voltex Retail Supplies; Eastman Staples; Cabstrut, Voltex Lightning
There was a sharp downturn in construction. The division has been right-sized for a depressed market with strict cost control in place. Anticipated construction will remain weak but business remains alert to opportunity.Revenue up 3,1% to R4,1bn and profit down 6,2% to R181,8m. Benefits to be realised within the new structure and sharpened focus. Businesses right-sized for new lower market with debtors being tightly monitored. Proactively alert to opportunity. Will continue to engage closely with customers and suppliers. No material improvement in market conditions expected.
Retrenchments were kept to a minimum. R25,0m was committed to new IT systems. Implementation across all wholesale branches helped management achieve further efficiencies. HIV training increased. Fuel prices and toll charges also create risk for a distribution company. Our multi-branch distribution model creates opportunities to manage costs by strategic stockholding at key points. Unfortunately one fatality was reported.
Bidvest Financial Services
A comprehensive range of banking and insurance products and services, specialising in foreign exchange and insurance.
Bidvest Bank Limited; Bidvest Financial Services; Master Currency; Rennies Foreign Exchange Botswana; Namibia Bureau de Change.
Growth across all activities. Increased market penetration with strategically well-placed key sites. Revenue up 13,7% to R1,7bn and profit up 15,1% to R641,6m. Fleet Services successfully integrated with leasing fleet exceeding 11 500 vehicles. Diversification and expansion of income-producing activities boosted result. Rand strength, much reduced rand volatility and low interest rates put pressure on profitability. Customers cautious regarding spending. Increased policy volumes across all insurance lines.Increased market penetration across insurance and life products. Yamaha Financial Services, incorporating a finance and insurance offering, being rolled out. Anticipating organic and acquisitive growth.
Improved efficiency, productivity and the elimination of expense waste. Training spend increased. The bank made substantial investment in information technology during the year in the form of technical skills, infrastructure and systems. Disaster recovery was enhanced and successfully tested. Bidvest Bank is conscious of its environmental responsibilities. While the business has a fairly low direct impact, we are working towards paperless administrative systems as we develop new products in our niche markets. We recycle waste paper.
Bidvest FreightThe leading private sector freight management group in sub-Saharan Africa, consisting of several independent businesses focusing on terminal operations and logistics, international clearing and freight forwarding, logistics and marine ships agency and insurance services.
Bulk Connections; Island View Storage; Bidfreight Port Operations; Rennies Distribution Services; SACD Freight; South African Bulk Terminals; Naval; Safcor Panalpina; Rennies Ships Agencies; Rennie Murray; Freight Bulk; P & I Associates; Manica Africa.
Strong bulk commodity activity, although low margin billings at Safcor Panalpina, elevated top line. Capex over R300m, with R200m capex programme at Bulk Connections. Continued Transnet freight rail underperformance. Budgeting for growth. Buoyant bulk activity, particularly in exports of commodities. Automotive volumes improve. Revenue up 20,8% to R19,3bn and profit up 11,6% to R886,2m. Island View Storage higher volumes driven by new Sasol business through Richards Bay; South African Bulk Terminals had record volumes up 40% due to huge maize exports; Rennies Distribution Services profits were up on higher revenue; SACD in Durban put in strong performance; Bidfreight Port Operations showed real growth. Challenging business conditions for Manica. Commodities demand is anticipated to remain strong with ongoing investment in facilities and people. Strategically very well positioned at key sites. Expecting profit growth.
Training investment rose from R23,9m to R25,9m. Emphasis on safety training although, despite efforts, three fatalities were reported. Environmental risk relating to the possibility of contamination via water run-off from our facilities is well managed via settling ponds. Rigorous processes ensure no spills into harbours and streams. Expansion of Island View facilities planned in 2012. Dust suppression a priority. BPO Stevedoring efficiencies have been achieved along with safety improvements. Bidvest Freight has a record of sustained investment in HIV/Aids awareness and training.
Bidvest Industrial Offers a full range of Yamaha products, Nissan forklifts and imports, electrical appliances, houseware products, packaging closures and catering equipment.
Yamaha; Bidvest Materials Handling; Afcom; Buffalo Executape; Ramfasteners; Vulcan Catering Equipment; Berzack Brothers; Bloch and Levitan.
In a challenging manufacturing environment with cash generation remaining strong, Buffalo Executape performed well and Yamaha increased profits significantly off flat revenue. While manufacturing and consumer activity remain uncertain, acquisitions continue to be considered.Revenue up 3,6% to R1,5bn and profit down 11,7% to R118,5m. Revenue increased for Berzacks – a pleasing result. Afcom turnover slightly down. Vulcan showed a decline in revenue and profits post soccer world cup and reduced exports.Manufacturing and consumer spending have a strong bearing on the results. New focus allows the division to explore industrial acquisitions. The World of Yamaha presents exciting opportunities.
Training investment rose 211,4% to R5,0m (2010: R1,6m). Thirty new jobs were created at the World of Yamaha. A state-of-the-art training centre was established for Buffalo Executape. All businesses intensified efforts to improve energy and fuel efficiency. Talent retention benefited from sturdy succession planning. Yamaha Dealer training was a focus area.
Bidvest OfficeA leading distributor of office products, including stationery, furniture (seating and desking) and technology (copying, digital printing and cash-handling systems).
Konica Minolta South Africa; Océ; Develop; Waltons Office Products; Cecil Nurse Business Furniture; Dauphin; Ditulo; Seating; Global Payment Technologies.
Technology businesses continued to perform well. Waltons stationery revenue flat but profit improved. Measures in place to optimise furniture value chain. Growth in profits anticipated.Revenue up 5,3% to R3,7bn and profit up 9,2% to R215,4m. Strong mix of technology businesses, stationery and furniture focused on industry needs. Konica Minolta remained strongly profitable with pleasing growth in revenue while Océ produced a good result. GPT’s good results driven by machine sales and service. Waltons profits improved. Contract business to be merged with Waltons. Furniture restructures and streamlining expected to result in a return to profitability. Strong positioning in tough markets.
Konica Minolta ‘green leader’ in office equipment. Polymerised toners reduce environmental impact as their production relies on plant-based rather than petro-chemical inputs. Seating’s Form Chair is 95% recyclable and contains 25% recycled materials. Continued market education on eco-friendly furniture products. Divisional water usage decreased by 22%. Divisional electricity usage decreased by 16,8%. Steep rises in energy costs drove renewed focus on energy efficiency at all businesses. Higher environmental awareness and standards are regarded as opportunity rather than risk.
Bidvest PaperplusA leading manufacturer, supplier and distributor of commercial office products, printer products, services, and stationery and packaging products, through a wide network of outlets in southern Africa, and provider of outsourced customer communication services.
Lithotech; Blesston Printing; Silveray Manufacturing; Kolok; Ozalid; E-Mail Connection; Lufil Packaging; Rotolabel; Silveray Statmark Company; Pretoria Wholesale Stationers; Lithotech Afric Mail; Sprint Packaging.
General print and packaging markets were keenly competitive, while mature and new technology offerings were ongoing. Sprint Packaging acquired. Modest but good quality earnings growth anticipated.Revenue up 7% to R3,7bn and profit up 4,2% to R325,6m. Expenses well controlled. Further rationalisation expected in mature print market. The Sprint Packaging acquisition contributed positively. Silveray held its market share at lower margins in a weak market while Email Connection delivered strong results. Successful strategy of adapting to shifts in technology. Project-based export activities actively pursued. Food-related packaging prospects favourable. In a cost-competitive environment further progress expected.
Innovative voter registration solution with solar-powered kits for on-site production of voter registration cards. We remain major users of power and water and have focused our attention on energy-saving. Managed reductions of 18,3% in water and 13% in electricity. Training spend increased by 200% to R19,9m greatly contributed by the addition of Kolok. Total carbon emissions reduction of 12,3%. Improving our lighting systems represents a major opportunity to improve our energy efficiency. More efficient lighting installed in one of our Lithotech facilities has enabled us to run an extra multi-colour full-production printing press. Natural light utilised to reduce electricity usage.
Bidvest Rental and Products
Products and services designed to enhance the working environment through hygiene rental equipment, consumables, laundries, indoor plants, drinking water, water coolers and specialised clothing.
Bidvest Steiner; G. Fox and Company; Clockwork Giant Clothing; First Garment Rental; Boston Launderers; Montana Laundries; Puréau Fresh Water Company; Silk by Design; Bidvest Execuflora; Hotel Amenities Suppliers; Promo Sachets; Steri Pic; Liqui-Pak.
Satisfactory trading except for the hotel supply trade. Steiner Hygiene and G.Fox and Company returned exceptional results. An improved performance anticipated in Laundries. An acquisition in safety wear was incorporated. A good year is anticipated.Revenue up 9,7% to R1,7bn and profit increased 16,3% to R325,9m. Strong overall result at a higher level of profitability. A weaker hotel market influenced Hotel Amenities and Laundries. Steiner Hygiene produced a good result at a better margin; Puréau joint venture performing well and Execuflora results improving. Silk by Design a small contributor with good promise. G.Fox and Company produced exceptional results, assisted by improved garment manufacturing and asset management.Ongoing progress is anticipated. G.Fox and Company acquisition with further acquisitions anticipated in the water and plant businesses. Initiatives being implemented at Laundries to improve results.
Training investment rose to R4,5m (2010: R2,6m). Staff numbers rose by 10%. Laundries invested a further R6 million in heat exchangers, part of the ongoing drive to improve energy efficiency and reduce coal consumption. ABET is a major focus area. Commitment to internal development. Efforts to reduce our carbon footprint are ongoing with use of biodiesel and optimising distribution routes. Low-energy lighting is being fitted in certain warehouses.
Bidvest Services A range of outsourced services in cleaning, security and landscaping as well as specialised services to the industrial sector.
Bidvest Prestige; Bidvest TMS; Bidvest Magnum; BidTrack; A.C.T.S.; Bidvest Topturf.
Excellent results from Prestige benefiting from the soccer world cup and good cost control. Strong improvement from Magnum and BidTrack. TMS management relooking business model to return to profitability. TopTurf remained profitable while operations scaled back in line with reduced activity. Strong performances anticipated from cleaning and security.Revenue up 2,2% to R2,9bn and profit increased 2,4% to R187,6m. Excellent results from Prestige and Magnum counteracted by a loss at TMS and a reduction in profits at TopTurf. Market share gains for the security businesses and expenses well controlled. Anticipated TMS will return to profitability. TopTurf well placed although market smaller.
Recycling initiatives, waste removal and responsible disposal are also monitored. The quantity of paper recycled increased by 347,1% to 21 201kg (2010: 4 741kg), and the number of batteries recycled increased by 243,7% to 220 batteries (2010: 64 batteries). Social investment and enterprise development programmes, expenditure of R1,1m. Safety is a material issue as there were five fatalities in 2011. Multiple awards were received from clients in addition to accreditation by the Green Building Council.
Bidvest Travel and Aviation
Provides travel-management services, aviation services, airport lounge access and car rental through its extensive locations and distribution channels.
BCD Travel; Carlson Wagonlit Travel; Harvey World Travel; HRG Rennies Travel; mymarket.com; Travelwise Botswana; Travel Connections; World Travel; BidAir Cargo; BidAir Services; Bidvest Premier Lounges; Budget Chauffeur Drive; Budget Coach Charters; Budget Door2Door; Budget Rent a Car; Budget Van Rental.
A strong result for all the businesses. Reduced cost base at Travel. Car rental benefited from better utilisation, pricing and procurement. Aviation result doubled on cost-saving initiatives. Revenue up 8,1% to R1,9bn and profits up 32,3% to R274,2m. Disciplined trading (particularly at Budget) and a focus on leveraging good market position. Volumes up for Bidtravel with strong growth driven by new technology, achievement of targets and improved deals from preferred airlines. Bidair produced a significantly improved result through management focus on costs, restricting at the ramp handling business and improved pricing. Plans to build on the gains of the past year.
Tight regulatory environment proves challenging in terms of improving environmental performance. Focus on training yielded excellent results with division applying for the IATA safety audit for ground operations accreditation (ISAGO). Continued utilisation of world-class technology in travel solutions.
Asia PacificComprises Bidvest Australia, Bidvest New Zealand, Angliss Singapore and Angliss Greater China. Leads the foodservice industry and offers a full end-to-end national distribution service.
Bidvest Australia; Bidvest New Zealand; Angliss Singapore; Angliss Greater China.
All territories recorded strong and real growth although the natural disasters in Australia and New Zealand presented challenges. Australia reported market share gains; New Zealand had a record result; Greater China demonstrated increased momentum and presence, while Singapore adopted a cautious strategy. Entry into Chile an exciting springboard into South America.Revenue up 11,5% to R19,6bn and profit up 14,2% to R833,1m. A positive contribution from all businesses. Floods in Australia and earthquakes in New Zealand had minimal effect on results and customers supplied in spite of challenges. Continued strong progress in Greater China and Singapore. Bidvest Procurement Company in China offers exciting potential. Bidvest Australia continues to outperform the local market with New Zealand exploring complementary activities.
Training investment rose to R2,3m. Food and foodservices are highly regulated. As a well-capitalised and well-resourced business we try to anticipate regulatory and quality requirements. Our high level of certification has become a source of competitive advantage. Cooperation between teams and willingness to put in extra effort to help others enabled the Christchurch New Zealand business to recover at a surprisingly rapid rate. People development and talent retention are strategic imperatives.
Europe
Comprises market-leading foodservice product distributors in the United Kingdom, Belgium, the Netherlands, Czech Republic, Slovakia, Poland, Saudi Arabia and the United Arab Emirates, sources and processes highly regarded own brands and provides products, quality ingredients, finished products, equipment and logistics to the catering and hospitality industry.
3663 Wholesale; Bidvest Logistics; Seafood Holdings; Deli XL Belgium; Deli XL Netherlands; Nowaco; Farutex; Horeca Trade; Al Diyafa.
Challenging environment with sluggish economies. Back to basics for 3663 in the UK. The Netherlands and Belgium produced a steady result. Adverse weather conditions affected results from Czech Republic and Slovakia; a solid year from Poland, while the UAE and Saudi delivered a respectable profit. Anticipating an improved result. 3663 Wholesale has rebranded the business and has renewed enthusiasm; new investments in Poland. Egypt and Baltic acquisitions planned.Revenue down 2,2% to R34,7bn and profits down 6,2% to R842,5m. Acquisition of Seafood Holdings settled in well. Slightly improved results in Deli XL Netherlands. Deli XL Belgium experiencing margin pressure. Horeca produced a record profit. Flat sales at Nowaco while Farutex has strategy in place to increase its margin.3663 Wholesale has measures in place to secure quality business. The Netherlands and Belgium anticipate competitive trading particularly in institutional areas. Foodservice in Europe has the right fundamentals in place and remains a good business.
Electricity generated from renewable resources continued to gain momentum. Market risk remains a critical issue for our businesses. 3663 saved 13m litres of rainwater through harvesting and recycling. Collected two million litres of waste oil for conversion into biodiesel for trucks. Cut CO
2 emissions by 16% in four years and recently achieved the Carbon Trust Standard. Seafood Holdings is differentiated by quality service.
External awards include a BRC 5A grading and MSC certification for sustainability management and recognition from Soil Conservation for organic management and from the Manchester United ‘In Safe Hands’ supplier audit.
Southern AfricaA leading multi-range manufacturer and distributor of food products and ingredients. Bidvest operates through strategically located independent business units, aimed at servicing the catering, hospitality, leisure, bakery, poultry, meat and food processing industries.
Bidvest Foodservice SA; Bidfood Ingredients; Patleys.
Businesses aligned with international model and reinvestment in infrastructure and logistics. Challenges include competitive market for shelf space, deflation and negative food inflation versus input cost inflation. Foodservice being repositioned for more competitive times with foodsafety a strategic focus.Revenue up 0,7% to R5,4bn and profits down 15% to R356,1m. Rebranding and restructuring bring renewed vigour to the businesses. A small acquisition for Bidvest Foodservice South Africa; selective portfolio rationalisation in Speciality and continued focus on growth in own-brand and a strong market presence through high-quality products and brand extensions for the Ingredients business.
Divisional CSI increased 84%. Training spend overall rose to R9,9m. Employees attending HIV training increased by 41%. Environmental and climatic factors took on particular importance as drought, floods and natural disasters in several parts of the world had knock-on effects on food production. Food safety is a critical area for us. Risks are managed by sustained investment in modern systems and equipment.
Bidvest NamibiaBidvest Namibia is the holding company for Bidvest’s interests in Namibia, which include fishing and similar commercial businesses to those of Bidvest in South Africa.
Namsov; Twafika; Tetelestai Mariculture; Namibian Sea Products; Pesca Fresca; HRG Rennies Travel; Budget Rent a Car; Minolco; Blue Marine; Voltex; Waltons; Cecil Nurse; Kolok; Manica.
A healthy marine resource with fishing conditions remaining very favourable. BidCom underperformed in a competitive market. Continued investment in training and managerial capacity while remaining alert to acquisitive opportunities. Net revenue, after disbursements, increased by 19,3% to R2,1bn with trading profit increasing 46,8% to R540,2m. Fishing contributed 87% of trading profit. BidCom underperformance continues to be addressed. Total allowable catch (a function of biomass and sustainability) and currency are key variables. Fish is a desirable protein in good demand and Bidvest Namibia is well positioned to benefit.
Bean canning concept supports rural women’s progress into small-scale commercial farming. Fish exports remained buoyant, a function of sustained recovery by fish stocks and strong demand for horse-mackerel. Training investment rose from R2,2m to R2,9m. Leadership and management training are focus areas. At year-end, work was nearing completion on a R2m training centre at Walvis Bay for use by both BidCom and BidFish.
BIDVEST AT A GLANCE: OUR STRUCTURE
South Africa

08 THE BIDVEST GROUP LIMITED / ANNUAL INTEGRATED REPORT 2011
Description of business Incorporating Results and prospects Sustainable development and commentary
Bidvest Corporate
Provides strategic direction, financial, risk and sustainability management, marketing, investor relations, corporate communications, corporate finance, houses investments and provides executive training to the Group. Adds value by identifying opportunities and implementing Bidvest’s decentralised entrepreneurial business model.
Bidvest Corporate Services; Bidvest Properties; Ontime Automotive; Bidvest Wits Football Club; Bidvest Procurement.
Bidvest’s strategic property holdings contributed R207,2m in income, up 17,3%. A state-of-the-art “World of Yamaha” facility in Johannesburg opened for business. Subject to certain formalities, 50% of economic interest in Mumbai International Airport has been sold. A $13,5m investment has been made into Icelandic Water Holdings (makers of “Icelandic Glacial”) an initial stake of 14,6%.
A new database tool developed and implemented towards year-end demonstrates that Bidvest is taking measurement seriously. The new tool is based on a globally recognised system with powerful customising capacity. This represents a major step towards more powerful data management, monitoring and reporting against targets. It offers a platform that will allow us to build in custom indicators for individual companies to gather more meaningful data relevant to particular industries.
Bidvest Automotive One of South Africa’s largest motor vehicle groups offering leading motor brands through 116 dealerships, as well as vehicle auctioneering. McCarthy Motor group; Burchmore’s.
A focused vehicle retailer with results driven by new vehicle demand. Margins overall remain under pressure. Anticipate an increased return on sales while realigning the cost base to the new slimmed-down division.Revenue up 17,4% to R18,6bn. Profit up 10,7% to R255,4m. New vehicle sales up 22%. Parts and service contribution affected by stock shortages and deferral of maintenance due to rising living costs. Strike action and the Japanese natural disasters resulted in stock shortages. Costs experienced due to rationalisation of Value Centres and Call-a-Car outlets. Burchmore’s auctioneers affected by reduced repossessions and lower used-car values.Management changes implemented with a new invigorated team in place. Additional productivity improvements identified. Stable vehicle pricing and low interest rates beneficial for customer affordability but negative for dealer margin.
Systems implemented to facilitate and measure sustainability activities. Restructuring factors influenced revenue and trading profit. Training spend rises to R93,1m despite lower staff numbers and challenging trading conditions. A target to reduce electricity consumption by 10% by 2012 has been implemented. The carbon footprint exercise identified two key focus areas: reducing our impacts on climate change (by electricity reduction and water savings) and improving our waste management (implementing the concepts of reduce, reuse and recycle).
Bidvest Electrical A leading distributor of electrical products and services.
Voltex; Atlas Cable Supplies; Versalec Cables; Bellco Electrical; Litecor Electrical; Keens Electrical; Waco Industries; Globe Electrical; Sanlic International; Electric Centre; Voltex Retail Supplies; Eastman Staples; Cabstrut, Voltex Lightning
There was a sharp downturn in construction. The division has been right-sized for a depressed market with strict cost control in place. Anticipated construction will remain weak but business remains alert to opportunity.Revenue up 3,1% to R4,1bn and profit down 6,2% to R181,8m. Benefits to be realised within the new structure and sharpened focus. Businesses right-sized for new lower market with debtors being tightly monitored. Proactively alert to opportunity. Will continue to engage closely with customers and suppliers. No material improvement in market conditions expected.
Retrenchments were kept to a minimum. R25,0m was committed to new IT systems. Implementation across all wholesale branches helped management achieve further efficiencies. HIV training increased. Fuel prices and toll charges also create risk for a distribution company. Our multi-branch distribution model creates opportunities to manage costs by strategic stockholding at key points. Unfortunately one fatality was reported.
Bidvest Financial Services
A comprehensive range of banking and insurance products and services, specialising in foreign exchange and insurance.
Bidvest Bank Limited; Bidvest Financial Services; Master Currency; Rennies Foreign Exchange Botswana; Namibia Bureau de Change.
Growth across all activities. Increased market penetration with strategically well-placed key sites. Revenue up 13,7% to R1,7bn and profit up 15,1% to R641,6m. Fleet Services successfully integrated with leasing fleet exceeding 11 500 vehicles. Diversification and expansion of income-producing activities boosted result. Rand strength, much reduced rand volatility and low interest rates put pressure on profitability. Customers cautious regarding spending. Increased policy volumes across all insurance lines.Increased market penetration across insurance and life products. Yamaha Financial Services, incorporating a finance and insurance offering, being rolled out. Anticipating organic and acquisitive growth.
Improved efficiency, productivity and the elimination of expense waste. Training spend increased. The bank made substantial investment in information technology during the year in the form of technical skills, infrastructure and systems. Disaster recovery was enhanced and successfully tested. Bidvest Bank is conscious of its environmental responsibilities. While the business has a fairly low direct impact, we are working towards paperless administrative systems as we develop new products in our niche markets. We recycle waste paper.
Bidvest FreightThe leading private sector freight management group in sub-Saharan Africa, consisting of several independent businesses focusing on terminal operations and logistics, international clearing and freight forwarding, logistics and marine ships agency and insurance services.
Bulk Connections; Island View Storage; Bidfreight Port Operations; Rennies Distribution Services; SACD Freight; South African Bulk Terminals; Naval; Safcor Panalpina; Rennies Ships Agencies; Rennie Murray; Freight Bulk; P & I Associates; Manica Africa.
Strong bulk commodity activity, although low margin billings at Safcor Panalpina, elevated top line. Capex over R300m, with R200m capex programme at Bulk Connections. Continued Transnet freight rail underperformance. Budgeting for growth. Buoyant bulk activity, particularly in exports of commodities. Automotive volumes improve. Revenue up 20,8% to R19,3bn and profit up 11,6% to R886,2m. Island View Storage higher volumes driven by new Sasol business through Richards Bay; South African Bulk Terminals had record volumes up 40% due to huge maize exports; Rennies Distribution Services profits were up on higher revenue; SACD in Durban put in strong performance; Bidfreight Port Operations showed real growth. Challenging business conditions for Manica. Commodities demand is anticipated to remain strong with ongoing investment in facilities and people. Strategically very well positioned at key sites. Expecting profit growth.
Training investment rose from R23,9m to R25,9m. Emphasis on safety training although, despite efforts, three fatalities were reported. Environmental risk relating to the possibility of contamination via water run-off from our facilities is well managed via settling ponds. Rigorous processes ensure no spills into harbours and streams. Expansion of Island View facilities planned in 2012. Dust suppression a priority. BPO Stevedoring efficiencies have been achieved along with safety improvements. Bidvest Freight has a record of sustained investment in HIV/Aids awareness and training.
Bidvest Industrial Offers a full range of Yamaha products, Nissan forklifts and imports, electrical appliances, houseware products, packaging closures and catering equipment.
Yamaha; Bidvest Materials Handling; Afcom; Buffalo Executape; Ramfasteners; Vulcan Catering Equipment; Berzack Brothers; Bloch and Levitan.
In a challenging manufacturing environment with cash generation remaining strong, Buffalo Executape performed well and Yamaha increased profits significantly off flat revenue. While manufacturing and consumer activity remain uncertain, acquisitions continue to be considered.Revenue up 3,6% to R1,5bn and profit down 11,7% to R118,5m. Revenue increased for Berzacks – a pleasing result. Afcom turnover slightly down. Vulcan showed a decline in revenue and profits post soccer world cup and reduced exports.Manufacturing and consumer spending have a strong bearing on the results. New focus allows the division to explore industrial acquisitions. The World of Yamaha presents exciting opportunities.
Training investment rose 211,4% to R5,0m (2010: R1,6m). Thirty new jobs were created at the World of Yamaha. A state-of-the-art training centre was established for Buffalo Executape. All businesses intensified efforts to improve energy and fuel efficiency. Talent retention benefited from sturdy succession planning. Yamaha Dealer training was a focus area.
Bidvest OfficeA leading distributor of office products, including stationery, furniture (seating and desking) and technology (copying, digital printing and cash-handling systems).
Konica Minolta South Africa; Océ; Develop; Waltons Office Products; Cecil Nurse Business Furniture; Dauphin; Ditulo; Seating; Global Payment Technologies.
Technology businesses continued to perform well. Waltons stationery revenue flat but profit improved. Measures in place to optimise furniture value chain. Growth in profits anticipated.Revenue up 5,3% to R3,7bn and profit up 9,2% to R215,4m. Strong mix of technology businesses, stationery and furniture focused on industry needs. Konica Minolta remained strongly profitable with pleasing growth in revenue while Océ produced a good result. GPT’s good results driven by machine sales and service. Waltons profits improved. Contract business to be merged with Waltons. Furniture restructures and streamlining expected to result in a return to profitability. Strong positioning in tough markets.
Konica Minolta ‘green leader’ in office equipment. Polymerised toners reduce environmental impact as their production relies on plant-based rather than petro-chemical inputs. Seating’s Form Chair is 95% recyclable and contains 25% recycled materials. Continued market education on eco-friendly furniture products. Divisional water usage decreased by 22%. Divisional electricity usage decreased by 16,8%. Steep rises in energy costs drove renewed focus on energy efficiency at all businesses. Higher environmental awareness and standards are regarded as opportunity rather than risk.
Bidvest PaperplusA leading manufacturer, supplier and distributor of commercial office products, printer products, services, and stationery and packaging products, through a wide network of outlets in southern Africa, and provider of outsourced customer communication services.
Lithotech; Blesston Printing; Silveray Manufacturing; Kolok; Ozalid; E-Mail Connection; Lufil Packaging; Rotolabel; Silveray Statmark Company; Pretoria Wholesale Stationers; Lithotech Afric Mail; Sprint Packaging.
General print and packaging markets were keenly competitive, while mature and new technology offerings were ongoing. Sprint Packaging acquired. Modest but good quality earnings growth anticipated.Revenue up 7% to R3,7bn and profit up 4,2% to R325,6m. Expenses well controlled. Further rationalisation expected in mature print market. The Sprint Packaging acquisition contributed positively. Silveray held its market share at lower margins in a weak market while Email Connection delivered strong results. Successful strategy of adapting to shifts in technology. Project-based export activities actively pursued. Food-related packaging prospects favourable. In a cost-competitive environment further progress expected.
Innovative voter registration solution with solar-powered kits for on-site production of voter registration cards. We remain major users of power and water and have focused our attention on energy-saving. Managed reductions of 18,3% in water and 13% in electricity. Training spend increased by 200% to R19,9m greatly contributed by the addition of Kolok. Total carbon emissions reduction of 12,3%. Improving our lighting systems represents a major opportunity to improve our energy efficiency. More efficient lighting installed in one of our Lithotech facilities has enabled us to run an extra multi-colour full-production printing press. Natural light utilised to reduce electricity usage.
Bidvest Rental and Products
Products and services designed to enhance the working environment through hygiene rental equipment, consumables, laundries, indoor plants, drinking water, water coolers and specialised clothing.
Bidvest Steiner; G. Fox and Company; Clockwork Giant Clothing; First Garment Rental; Boston Launderers; Montana Laundries; Puréau Fresh Water Company; Silk by Design; Bidvest Execuflora; Hotel Amenities Suppliers; Promo Sachets; Steri Pic; Liqui-Pak.
Satisfactory trading except for the hotel supply trade. Steiner Hygiene and G.Fox and Company returned exceptional results. An improved performance anticipated in Laundries. An acquisition in safety wear was incorporated. A good year is anticipated.Revenue up 9,7% to R1,7bn and profit increased 16,3% to R325,9m. Strong overall result at a higher level of profitability. A weaker hotel market influenced Hotel Amenities and Laundries. Steiner Hygiene produced a good result at a better margin; Puréau joint venture performing well and Execuflora results improving. Silk by Design a small contributor with good promise. G.Fox and Company produced exceptional results, assisted by improved garment manufacturing and asset management.Ongoing progress is anticipated. G.Fox and Company acquisition with further acquisitions anticipated in the water and plant businesses. Initiatives being implemented at Laundries to improve results.
Training investment rose to R4,5m (2010: R2,6m). Staff numbers rose by 10%. Laundries invested a further R6 million in heat exchangers, part of the ongoing drive to improve energy efficiency and reduce coal consumption. ABET is a major focus area. Commitment to internal development. Efforts to reduce our carbon footprint are ongoing with use of biodiesel and optimising distribution routes. Low-energy lighting is being fitted in certain warehouses.
Bidvest Services A range of outsourced services in cleaning, security and landscaping as well as specialised services to the industrial sector.
Bidvest Prestige; Bidvest TMS; Bidvest Magnum; BidTrack; A.C.T.S.; Bidvest Topturf.
Excellent results from Prestige benefiting from the soccer world cup and good cost control. Strong improvement from Magnum and BidTrack. TMS management relooking business model to return to profitability. TopTurf remained profitable while operations scaled back in line with reduced activity. Strong performances anticipated from cleaning and security.Revenue up 2,2% to R2,9bn and profit increased 2,4% to R187,6m. Excellent results from Prestige and Magnum counteracted by a loss at TMS and a reduction in profits at TopTurf. Market share gains for the security businesses and expenses well controlled. Anticipated TMS will return to profitability. TopTurf well placed although market smaller.
Recycling initiatives, waste removal and responsible disposal are also monitored. The quantity of paper recycled increased by 347,1% to 21 201kg (2010: 4 741kg), and the number of batteries recycled increased by 243,7% to 220 batteries (2010: 64 batteries). Social investment and enterprise development programmes, expenditure of R1,1m. Safety is a material issue as there were five fatalities in 2011. Multiple awards were received from clients in addition to accreditation by the Green Building Council.
Bidvest Travel and Aviation
Provides travel-management services, aviation services, airport lounge access and car rental through its extensive locations and distribution channels.
BCD Travel; Carlson Wagonlit Travel; Harvey World Travel; HRG Rennies Travel; mymarket.com; Travelwise Botswana; Travel Connections; World Travel; BidAir Cargo; BidAir Services; Bidvest Premier Lounges; Budget Chauffeur Drive; Budget Coach Charters; Budget Door2Door; Budget Rent a Car; Budget Van Rental.
A strong result for all the businesses. Reduced cost base at Travel. Car rental benefited from better utilisation, pricing and procurement. Aviation result doubled on cost-saving initiatives. Revenue up 8,1% to R1,9bn and profits up 32,3% to R274,2m. Disciplined trading (particularly at Budget) and a focus on leveraging good market position. Volumes up for Bidtravel with strong growth driven by new technology, achievement of targets and improved deals from preferred airlines. Bidair produced a significantly improved result through management focus on costs, restricting at the ramp handling business and improved pricing. Plans to build on the gains of the past year.
Tight regulatory environment proves challenging in terms of improving environmental performance. Focus on training yielded excellent results with division applying for the IATA safety audit for ground operations accreditation (ISAGO). Continued utilisation of world-class technology in travel solutions.
Asia PacificComprises Bidvest Australia, Bidvest New Zealand, Angliss Singapore and Angliss Greater China. Leads the foodservice industry and offers a full end-to-end national distribution service.
Bidvest Australia; Bidvest New Zealand; Angliss Singapore; Angliss Greater China.
All territories recorded strong and real growth although the natural disasters in Australia and New Zealand presented challenges. Australia reported market share gains; New Zealand had a record result; Greater China demonstrated increased momentum and presence, while Singapore adopted a cautious strategy. Entry into Chile an exciting springboard into South America.Revenue up 11,5% to R19,6bn and profit up 14,2% to R833,1m. A positive contribution from all businesses. Floods in Australia and earthquakes in New Zealand had minimal effect on results and customers supplied in spite of challenges. Continued strong progress in Greater China and Singapore. Bidvest Procurement Company in China offers exciting potential. Bidvest Australia continues to outperform the local market with New Zealand exploring complementary activities.
Training investment rose to R2,3m. Food and foodservices are highly regulated. As a well-capitalised and well-resourced business we try to anticipate regulatory and quality requirements. Our high level of certification has become a source of competitive advantage. Cooperation between teams and willingness to put in extra effort to help others enabled the Christchurch New Zealand business to recover at a surprisingly rapid rate. People development and talent retention are strategic imperatives.
Europe
Comprises market-leading foodservice product distributors in the United Kingdom, Belgium, the Netherlands, Czech Republic, Slovakia, Poland, Saudi Arabia and the United Arab Emirates, sources and processes highly regarded own brands and provides products, quality ingredients, finished products, equipment and logistics to the catering and hospitality industry.
3663 Wholesale; Bidvest Logistics; Seafood Holdings; Deli XL Belgium; Deli XL Netherlands; Nowaco; Farutex; Horeca Trade; Al Diyafa.
Challenging environment with sluggish economies. Back to basics for 3663 in the UK. The Netherlands and Belgium produced a steady result. Adverse weather conditions affected results from Czech Republic and Slovakia; a solid year from Poland, while the UAE and Saudi delivered a respectable profit. Anticipating an improved result. 3663 Wholesale has rebranded the business and has renewed enthusiasm; new investments in Poland. Egypt and Baltic acquisitions planned.Revenue down 2,2% to R34,7bn and profits down 6,2% to R842,5m. Acquisition of Seafood Holdings settled in well. Slightly improved results in Deli XL Netherlands. Deli XL Belgium experiencing margin pressure. Horeca produced a record profit. Flat sales at Nowaco while Farutex has strategy in place to increase its margin.3663 Wholesale has measures in place to secure quality business. The Netherlands and Belgium anticipate competitive trading particularly in institutional areas. Foodservice in Europe has the right fundamentals in place and remains a good business.
Electricity generated from renewable resources continued to gain momentum. Market risk remains a critical issue for our businesses. 3663 saved 13m litres of rainwater through harvesting and recycling. Collected two million litres of waste oil for conversion into biodiesel for trucks. Cut CO
2 emissions by 16% in four years and recently achieved the Carbon Trust Standard. Seafood Holdings is differentiated by quality service.
External awards include a BRC 5A grading and MSC certification for sustainability management and recognition from Soil Conservation for organic management and from the Manchester United ‘In Safe Hands’ supplier audit.
Southern AfricaA leading multi-range manufacturer and distributor of food products and ingredients. Bidvest operates through strategically located independent business units, aimed at servicing the catering, hospitality, leisure, bakery, poultry, meat and food processing industries.
Bidvest Foodservice SA; Bidfood Ingredients; Patleys.
Businesses aligned with international model and reinvestment in infrastructure and logistics. Challenges include competitive market for shelf space, deflation and negative food inflation versus input cost inflation. Foodservice being repositioned for more competitive times with foodsafety a strategic focus.Revenue up 0,7% to R5,4bn and profits down 15% to R356,1m. Rebranding and restructuring bring renewed vigour to the businesses. A small acquisition for Bidvest Foodservice South Africa; selective portfolio rationalisation in Speciality and continued focus on growth in own-brand and a strong market presence through high-quality products and brand extensions for the Ingredients business.
Divisional CSI increased 84%. Training spend overall rose to R9,9m. Employees attending HIV training increased by 41%. Environmental and climatic factors took on particular importance as drought, floods and natural disasters in several parts of the world had knock-on effects on food production. Food safety is a critical area for us. Risks are managed by sustained investment in modern systems and equipment.
Bidvest NamibiaBidvest Namibia is the holding company for Bidvest’s interests in Namibia, which include fishing and similar commercial businesses to those of Bidvest in South Africa.
Namsov; Twafika; Tetelestai Mariculture; Namibian Sea Products; Pesca Fresca; HRG Rennies Travel; Budget Rent a Car; Minolco; Blue Marine; Voltex; Waltons; Cecil Nurse; Kolok; Manica.
A healthy marine resource with fishing conditions remaining very favourable. BidCom underperformed in a competitive market. Continued investment in training and managerial capacity while remaining alert to acquisitive opportunities. Net revenue, after disbursements, increased by 19,3% to R2,1bn with trading profit increasing 46,8% to R540,2m. Fishing contributed 87% of trading profit. BidCom underperformance continues to be addressed. Total allowable catch (a function of biomass and sustainability) and currency are key variables. Fish is a desirable protein in good demand and Bidvest Namibia is well positioned to benefit.
Bean canning concept supports rural women’s progress into small-scale commercial farming. Fish exports remained buoyant, a function of sustained recovery by fish stocks and strong demand for horse-mackerel. Training investment rose from R2,2m to R2,9m. Leadership and management training are focus areas. At year-end, work was nearing completion on a R2m training centre at Walvis Bay for use by both BidCom and BidFish.
GROUP OVERVIEW

09
FINANCIAL STATEMENTSAND OTHER INFORMATION
THE BIDVEST GROUP LIMITED / ANNUAL INTEGRATED REPORT 2011
Description of business Incorporating Results and prospects Sustainable development and commentary
Bidvest Corporate
Provides strategic direction, financial, risk and sustainability management, marketing, investor relations, corporate communications, corporate finance, houses investments and provides executive training to the Group. Adds value by identifying opportunities and implementing Bidvest’s decentralised entrepreneurial business model.
Bidvest Corporate Services; Bidvest Properties; Ontime Automotive; Bidvest Wits Football Club; Bidvest Procurement.
Bidvest’s strategic property holdings contributed R207,2m in income, up 17,3%. A state-of-the-art “World of Yamaha” facility in Johannesburg opened for business. Subject to certain formalities, 50% of economic interest in Mumbai International Airport has been sold. A $13,5m investment has been made into Icelandic Water Holdings (makers of “Icelandic Glacial”) an initial stake of 14,6%.
A new database tool developed and implemented towards year-end demonstrates that Bidvest is taking measurement seriously. The new tool is based on a globally recognised system with powerful customising capacity. This represents a major step towards more powerful data management, monitoring and reporting against targets. It offers a platform that will allow us to build in custom indicators for individual companies to gather more meaningful data relevant to particular industries.
Bidvest Automotive One of South Africa’s largest motor vehicle groups offering leading motor brands through 116 dealerships, as well as vehicle auctioneering. McCarthy Motor group; Burchmore’s.
A focused vehicle retailer with results driven by new vehicle demand. Margins overall remain under pressure. Anticipate an increased return on sales while realigning the cost base to the new slimmed-down division.Revenue up 17,4% to R18,6bn. Profit up 10,7% to R255,4m. New vehicle sales up 22%. Parts and service contribution affected by stock shortages and deferral of maintenance due to rising living costs. Strike action and the Japanese natural disasters resulted in stock shortages. Costs experienced due to rationalisation of Value Centres and Call-a-Car outlets. Burchmore’s auctioneers affected by reduced repossessions and lower used-car values.Management changes implemented with a new invigorated team in place. Additional productivity improvements identified. Stable vehicle pricing and low interest rates beneficial for customer affordability but negative for dealer margin.
Systems implemented to facilitate and measure sustainability activities. Restructuring factors influenced revenue and trading profit. Training spend rises to R93,1m despite lower staff numbers and challenging trading conditions. A target to reduce electricity consumption by 10% by 2012 has been implemented. The carbon footprint exercise identified two key focus areas: reducing our impacts on climate change (by electricity reduction and water savings) and improving our waste management (implementing the concepts of reduce, reuse and recycle).
Bidvest Electrical A leading distributor of electrical products and services.
Voltex; Atlas Cable Supplies; Versalec Cables; Bellco Electrical; Litecor Electrical; Keens Electrical; Waco Industries; Globe Electrical; Sanlic International; Electric Centre; Voltex Retail Supplies; Eastman Staples; Cabstrut, Voltex Lightning
There was a sharp downturn in construction. The division has been right-sized for a depressed market with strict cost control in place. Anticipated construction will remain weak but business remains alert to opportunity.Revenue up 3,1% to R4,1bn and profit down 6,2% to R181,8m. Benefits to be realised within the new structure and sharpened focus. Businesses right-sized for new lower market with debtors being tightly monitored. Proactively alert to opportunity. Will continue to engage closely with customers and suppliers. No material improvement in market conditions expected.
Retrenchments were kept to a minimum. R25,0m was committed to new IT systems. Implementation across all wholesale branches helped management achieve further efficiencies. HIV training increased. Fuel prices and toll charges also create risk for a distribution company. Our multi-branch distribution model creates opportunities to manage costs by strategic stockholding at key points. Unfortunately one fatality was reported.
Bidvest Financial Services
A comprehensive range of banking and insurance products and services, specialising in foreign exchange and insurance.
Bidvest Bank Limited; Bidvest Financial Services; Master Currency; Rennies Foreign Exchange Botswana; Namibia Bureau de Change.
Growth across all activities. Increased market penetration with strategically well-placed key sites. Revenue up 13,7% to R1,7bn and profit up 15,1% to R641,6m. Fleet Services successfully integrated with leasing fleet exceeding 11 500 vehicles. Diversification and expansion of income-producing activities boosted result. Rand strength, much reduced rand volatility and low interest rates put pressure on profitability. Customers cautious regarding spending. Increased policy volumes across all insurance lines.Increased market penetration across insurance and life products. Yamaha Financial Services, incorporating a finance and insurance offering, being rolled out. Anticipating organic and acquisitive growth.
Improved efficiency, productivity and the elimination of expense waste. Training spend increased. The bank made substantial investment in information technology during the year in the form of technical skills, infrastructure and systems. Disaster recovery was enhanced and successfully tested. Bidvest Bank is conscious of its environmental responsibilities. While the business has a fairly low direct impact, we are working towards paperless administrative systems as we develop new products in our niche markets. We recycle waste paper.
Bidvest FreightThe leading private sector freight management group in sub-Saharan Africa, consisting of several independent businesses focusing on terminal operations and logistics, international clearing and freight forwarding, logistics and marine ships agency and insurance services.
Bulk Connections; Island View Storage; Bidfreight Port Operations; Rennies Distribution Services; SACD Freight; South African Bulk Terminals; Naval; Safcor Panalpina; Rennies Ships Agencies; Rennie Murray; Freight Bulk; P & I Associates; Manica Africa.
Strong bulk commodity activity, although low margin billings at Safcor Panalpina, elevated top line. Capex over R300m, with R200m capex programme at Bulk Connections. Continued Transnet freight rail underperformance. Budgeting for growth. Buoyant bulk activity, particularly in exports of commodities. Automotive volumes improve. Revenue up 20,8% to R19,3bn and profit up 11,6% to R886,2m. Island View Storage higher volumes driven by new Sasol business through Richards Bay; South African Bulk Terminals had record volumes up 40% due to huge maize exports; Rennies Distribution Services profits were up on higher revenue; SACD in Durban put in strong performance; Bidfreight Port Operations showed real growth. Challenging business conditions for Manica. Commodities demand is anticipated to remain strong with ongoing investment in facilities and people. Strategically very well positioned at key sites. Expecting profit growth.
Training investment rose from R23,9m to R25,9m. Emphasis on safety training although, despite efforts, three fatalities were reported. Environmental risk relating to the possibility of contamination via water run-off from our facilities is well managed via settling ponds. Rigorous processes ensure no spills into harbours and streams. Expansion of Island View facilities planned in 2012. Dust suppression a priority. BPO Stevedoring efficiencies have been achieved along with safety improvements. Bidvest Freight has a record of sustained investment in HIV/Aids awareness and training.
Bidvest Industrial Offers a full range of Yamaha products, Nissan forklifts and imports, electrical appliances, houseware products, packaging closures and catering equipment.
Yamaha; Bidvest Materials Handling; Afcom; Buffalo Executape; Ramfasteners; Vulcan Catering Equipment; Berzack Brothers; Bloch and Levitan.
In a challenging manufacturing environment with cash generation remaining strong, Buffalo Executape performed well and Yamaha increased profits significantly off flat revenue. While manufacturing and consumer activity remain uncertain, acquisitions continue to be considered.Revenue up 3,6% to R1,5bn and profit down 11,7% to R118,5m. Revenue increased for Berzacks – a pleasing result. Afcom turnover slightly down. Vulcan showed a decline in revenue and profits post soccer world cup and reduced exports.Manufacturing and consumer spending have a strong bearing on the results. New focus allows the division to explore industrial acquisitions. The World of Yamaha presents exciting opportunities.
Training investment rose 211,4% to R5,0m (2010: R1,6m). Thirty new jobs were created at the World of Yamaha. A state-of-the-art training centre was established for Buffalo Executape. All businesses intensified efforts to improve energy and fuel efficiency. Talent retention benefited from sturdy succession planning. Yamaha Dealer training was a focus area.
Bidvest OfficeA leading distributor of office products, including stationery, furniture (seating and desking) and technology (copying, digital printing and cash-handling systems).
Konica Minolta South Africa; Océ; Develop; Waltons Office Products; Cecil Nurse Business Furniture; Dauphin; Ditulo; Seating; Global Payment Technologies.
Technology businesses continued to perform well. Waltons stationery revenue flat but profit improved. Measures in place to optimise furniture value chain. Growth in profits anticipated.Revenue up 5,3% to R3,7bn and profit up 9,2% to R215,4m. Strong mix of technology businesses, stationery and furniture focused on industry needs. Konica Minolta remained strongly profitable with pleasing growth in revenue while Océ produced a good result. GPT’s good results driven by machine sales and service. Waltons profits improved. Contract business to be merged with Waltons. Furniture restructures and streamlining expected to result in a return to profitability. Strong positioning in tough markets.
Konica Minolta ‘green leader’ in office equipment. Polymerised toners reduce environmental impact as their production relies on plant-based rather than petro-chemical inputs. Seating’s Form Chair is 95% recyclable and contains 25% recycled materials. Continued market education on eco-friendly furniture products. Divisional water usage decreased by 22%. Divisional electricity usage decreased by 16,8%. Steep rises in energy costs drove renewed focus on energy efficiency at all businesses. Higher environmental awareness and standards are regarded as opportunity rather than risk.
Bidvest PaperplusA leading manufacturer, supplier and distributor of commercial office products, printer products, services, and stationery and packaging products, through a wide network of outlets in southern Africa, and provider of outsourced customer communication services.
Lithotech; Blesston Printing; Silveray Manufacturing; Kolok; Ozalid; E-Mail Connection; Lufil Packaging; Rotolabel; Silveray Statmark Company; Pretoria Wholesale Stationers; Lithotech Afric Mail; Sprint Packaging.
General print and packaging markets were keenly competitive, while mature and new technology offerings were ongoing. Sprint Packaging acquired. Modest but good quality earnings growth anticipated.Revenue up 7% to R3,7bn and profit up 4,2% to R325,6m. Expenses well controlled. Further rationalisation expected in mature print market. The Sprint Packaging acquisition contributed positively. Silveray held its market share at lower margins in a weak market while Email Connection delivered strong results. Successful strategy of adapting to shifts in technology. Project-based export activities actively pursued. Food-related packaging prospects favourable. In a cost-competitive environment further progress expected.
Innovative voter registration solution with solar-powered kits for on-site production of voter registration cards. We remain major users of power and water and have focused our attention on energy-saving. Managed reductions of 18,3% in water and 13% in electricity. Training spend increased by 200% to R19,9m greatly contributed by the addition of Kolok. Total carbon emissions reduction of 12,3%. Improving our lighting systems represents a major opportunity to improve our energy efficiency. More efficient lighting installed in one of our Lithotech facilities has enabled us to run an extra multi-colour full-production printing press. Natural light utilised to reduce electricity usage.
Bidvest Rental and Products
Products and services designed to enhance the working environment through hygiene rental equipment, consumables, laundries, indoor plants, drinking water, water coolers and specialised clothing.
Bidvest Steiner; G. Fox and Company; Clockwork Giant Clothing; First Garment Rental; Boston Launderers; Montana Laundries; Puréau Fresh Water Company; Silk by Design; Bidvest Execuflora; Hotel Amenities Suppliers; Promo Sachets; Steri Pic; Liqui-Pak.
Satisfactory trading except for the hotel supply trade. Steiner Hygiene and G.Fox and Company returned exceptional results. An improved performance anticipated in Laundries. An acquisition in safety wear was incorporated. A good year is anticipated.Revenue up 9,7% to R1,7bn and profit increased 16,3% to R325,9m. Strong overall result at a higher level of profitability. A weaker hotel market influenced Hotel Amenities and Laundries. Steiner Hygiene produced a good result at a better margin; Puréau joint venture performing well and Execuflora results improving. Silk by Design a small contributor with good promise. G.Fox and Company produced exceptional results, assisted by improved garment manufacturing and asset management.Ongoing progress is anticipated. G.Fox and Company acquisition with further acquisitions anticipated in the water and plant businesses. Initiatives being implemented at Laundries to improve results.
Training investment rose to R4,5m (2010: R2,6m). Staff numbers rose by 10%. Laundries invested a further R6 million in heat exchangers, part of the ongoing drive to improve energy efficiency and reduce coal consumption. ABET is a major focus area. Commitment to internal development. Efforts to reduce our carbon footprint are ongoing with use of biodiesel and optimising distribution routes. Low-energy lighting is being fitted in certain warehouses.
Bidvest Services A range of outsourced services in cleaning, security and landscaping as well as specialised services to the industrial sector.
Bidvest Prestige; Bidvest TMS; Bidvest Magnum; BidTrack; A.C.T.S.; Bidvest Topturf.
Excellent results from Prestige benefiting from the soccer world cup and good cost control. Strong improvement from Magnum and BidTrack. TMS management relooking business model to return to profitability. TopTurf remained profitable while operations scaled back in line with reduced activity. Strong performances anticipated from cleaning and security.Revenue up 2,2% to R2,9bn and profit increased 2,4% to R187,6m. Excellent results from Prestige and Magnum counteracted by a loss at TMS and a reduction in profits at TopTurf. Market share gains for the security businesses and expenses well controlled. Anticipated TMS will return to profitability. TopTurf well placed although market smaller.
Recycling initiatives, waste removal and responsible disposal are also monitored. The quantity of paper recycled increased by 347,1% to 21 201kg (2010: 4 741kg), and the number of batteries recycled increased by 243,7% to 220 batteries (2010: 64 batteries). Social investment and enterprise development programmes, expenditure of R1,1m. Safety is a material issue as there were five fatalities in 2011. Multiple awards were received from clients in addition to accreditation by the Green Building Council.
Bidvest Travel and Aviation
Provides travel-management services, aviation services, airport lounge access and car rental through its extensive locations and distribution channels.
BCD Travel; Carlson Wagonlit Travel; Harvey World Travel; HRG Rennies Travel; mymarket.com; Travelwise Botswana; Travel Connections; World Travel; BidAir Cargo; BidAir Services; Bidvest Premier Lounges; Budget Chauffeur Drive; Budget Coach Charters; Budget Door2Door; Budget Rent a Car; Budget Van Rental.
A strong result for all the businesses. Reduced cost base at Travel. Car rental benefited from better utilisation, pricing and procurement. Aviation result doubled on cost-saving initiatives. Revenue up 8,1% to R1,9bn and profits up 32,3% to R274,2m. Disciplined trading (particularly at Budget) and a focus on leveraging good market position. Volumes up for Bidtravel with strong growth driven by new technology, achievement of targets and improved deals from preferred airlines. Bidair produced a significantly improved result through management focus on costs, restricting at the ramp handling business and improved pricing. Plans to build on the gains of the past year.
Tight regulatory environment proves challenging in terms of improving environmental performance. Focus on training yielded excellent results with division applying for the IATA safety audit for ground operations accreditation (ISAGO). Continued utilisation of world-class technology in travel solutions.
Asia PacificComprises Bidvest Australia, Bidvest New Zealand, Angliss Singapore and Angliss Greater China. Leads the foodservice industry and offers a full end-to-end national distribution service.
Bidvest Australia; Bidvest New Zealand; Angliss Singapore; Angliss Greater China.
All territories recorded strong and real growth although the natural disasters in Australia and New Zealand presented challenges. Australia reported market share gains; New Zealand had a record result; Greater China demonstrated increased momentum and presence, while Singapore adopted a cautious strategy. Entry into Chile an exciting springboard into South America.Revenue up 11,5% to R19,6bn and profit up 14,2% to R833,1m. A positive contribution from all businesses. Floods in Australia and earthquakes in New Zealand had minimal effect on results and customers supplied in spite of challenges. Continued strong progress in Greater China and Singapore. Bidvest Procurement Company in China offers exciting potential. Bidvest Australia continues to outperform the local market with New Zealand exploring complementary activities.
Training investment rose to R2,3m. Food and foodservices are highly regulated. As a well-capitalised and well-resourced business we try to anticipate regulatory and quality requirements. Our high level of certification has become a source of competitive advantage. Cooperation between teams and willingness to put in extra effort to help others enabled the Christchurch New Zealand business to recover at a surprisingly rapid rate. People development and talent retention are strategic imperatives.
Europe
Comprises market-leading foodservice product distributors in the United Kingdom, Belgium, the Netherlands, Czech Republic, Slovakia, Poland, Saudi Arabia and the United Arab Emirates, sources and processes highly regarded own brands and provides products, quality ingredients, finished products, equipment and logistics to the catering and hospitality industry.
3663 Wholesale; Bidvest Logistics; Seafood Holdings; Deli XL Belgium; Deli XL Netherlands; Nowaco; Farutex; Horeca Trade; Al Diyafa.
Challenging environment with sluggish economies. Back to basics for 3663 in the UK. The Netherlands and Belgium produced a steady result. Adverse weather conditions affected results from Czech Republic and Slovakia; a solid year from Poland, while the UAE and Saudi delivered a respectable profit. Anticipating an improved result. 3663 Wholesale has rebranded the business and has renewed enthusiasm; new investments in Poland. Egypt and Baltic acquisitions planned.Revenue down 2,2% to R34,7bn and profits down 6,2% to R842,5m. Acquisition of Seafood Holdings settled in well. Slightly improved results in Deli XL Netherlands. Deli XL Belgium experiencing margin pressure. Horeca produced a record profit. Flat sales at Nowaco while Farutex has strategy in place to increase its margin.3663 Wholesale has measures in place to secure quality business. The Netherlands and Belgium anticipate competitive trading particularly in institutional areas. Foodservice in Europe has the right fundamentals in place and remains a good business.
Electricity generated from renewable resources continued to gain momentum. Market risk remains a critical issue for our businesses. 3663 saved 13m litres of rainwater through harvesting and recycling. Collected two million litres of waste oil for conversion into biodiesel for trucks. Cut CO
2 emissions by 16% in four years and recently achieved the Carbon Trust Standard. Seafood Holdings is differentiated by quality service.
External awards include a BRC 5A grading and MSC certification for sustainability management and recognition from Soil Conservation for organic management and from the Manchester United ‘In Safe Hands’ supplier audit.
Southern AfricaA leading multi-range manufacturer and distributor of food products and ingredients. Bidvest operates through strategically located independent business units, aimed at servicing the catering, hospitality, leisure, bakery, poultry, meat and food processing industries.
Bidvest Foodservice SA; Bidfood Ingredients; Patleys.
Businesses aligned with international model and reinvestment in infrastructure and logistics. Challenges include competitive market for shelf space, deflation and negative food inflation versus input cost inflation. Foodservice being repositioned for more competitive times with foodsafety a strategic focus.Revenue up 0,7% to R5,4bn and profits down 15% to R356,1m. Rebranding and restructuring bring renewed vigour to the businesses. A small acquisition for Bidvest Foodservice South Africa; selective portfolio rationalisation in Speciality and continued focus on growth in own-brand and a strong market presence through high-quality products and brand extensions for the Ingredients business.
Divisional CSI increased 84%. Training spend overall rose to R9,9m. Employees attending HIV training increased by 41%. Environmental and climatic factors took on particular importance as drought, floods and natural disasters in several parts of the world had knock-on effects on food production. Food safety is a critical area for us. Risks are managed by sustained investment in modern systems and equipment.
Bidvest NamibiaBidvest Namibia is the holding company for Bidvest’s interests in Namibia, which include fishing and similar commercial businesses to those of Bidvest in South Africa.
Namsov; Twafika; Tetelestai Mariculture; Namibian Sea Products; Pesca Fresca; HRG Rennies Travel; Budget Rent a Car; Minolco; Blue Marine; Voltex; Waltons; Cecil Nurse; Kolok; Manica.
A healthy marine resource with fishing conditions remaining very favourable. BidCom underperformed in a competitive market. Continued investment in training and managerial capacity while remaining alert to acquisitive opportunities. Net revenue, after disbursements, increased by 19,3% to R2,1bn with trading profit increasing 46,8% to R540,2m. Fishing contributed 87% of trading profit. BidCom underperformance continues to be addressed. Total allowable catch (a function of biomass and sustainability) and currency are key variables. Fish is a desirable protein in good demand and Bidvest Namibia is well positioned to benefit.
Bean canning concept supports rural women’s progress into small-scale commercial farming. Fish exports remained buoyant, a function of sustained recovery by fish stocks and strong demand for horse-mackerel. Training investment rose from R2,2m to R2,9m. Leadership and management training are focus areas. At year-end, work was nearing completion on a R2m training centre at Walvis Bay for use by both BidCom and BidFish.

PASSION/VITALITY/PRECISION
10
BIDVEST SOUTH AFRICA
Bidvest FreightConsolidated segmental analysisfor the year ended June 30
Revenue Trading profit Operating profit Operating assets Operating liabilities Depreciation Capital expenditure
Amortisation and
impairments
of intangible assets
Goodwill and intangible
assets
Employee
benefits and remuneration Number of employees Total carbon emissions*
Carbon emissions per*
employee
Trading division2011
R’0002010
R’000%
change2011
R’0002010
R’000%
change2011
R’0002010
R’000%
change2011
R’0002010
R’000%
change2011
R’0002010
R’000%
change2011
R’0002010
R’000%
change2011
R’0002010
R’000%
change2011
R’0002010
R’000%
change2011
R’0002010
R’000%
change2011
R’0002010
R’000%
change2011 2010 %
change2011
tonnes2010
tonnes%
change2011
tonnes2010
tonnes%
change
Bidvest South Africa 59 020 824 51 791 014 14,0 3 412 191 3 091 230 10,4 3 370 794 3 061 808 10,1 17 677 428 16 404 526 7,8 9 114 687 8 236 127 10,7 909 814 926 009 (1,7) 1 668 230 1 751 060 (4,7) 41 820 43 874 (4,7) 1 031 350 985 114 4,7 7 435 928 6 911 420 7,6 83 900 84 789 (1,0) 316 218 32 496 (2,5) 3,8 3,8 (1,4)
Automotive 18 608 261 15 849 758 17,4 255 420 230 787 10,7 253 920 230 787 10,0 2 668 439 2 398 569 11,3 1 772 057 1 419 875 24,8 56 443 59 689 (5,4) 52 033 46 996 10,7 – – 229 132 229 132 – 1 242 035 1 163 695 6,7 5 869 5 922 (0,9) 67 858 62 997 7,7 11,6 10,6 9,4
Electrical 4 100 368 3 978 286 3,1 181 832 193 933 (6,2) 181 832 193 933 (6,2) 1 744 524 1 588 435 9,8 742 931 775 364 (4,2) 15 309 15 086 1,5 23 344 9 774 138,8 2 725 657 314,8 76 003 53 169 42,9 360 603 357 670 0,8 2 184 2 181 0,1 14 890 14 418 3,3 6,8 6,6 3,0
Financial Services 1 676 700 1 474 441 13,7 641 621 557 604 15,1 639 489 550 951 16,1 3 007 813 2 571 045 17,0 1 901 713 1 640 318 15,9 249 042 302 455 (17,7) 767 956 689 594 11,4 9 242 5 572 65,9 50 956 51 710 (1,5) 253 857 228 428 11,1 1 228 1 253 (2,0) 14 800 5 569 165,7 12,1 4,4 171,2
Freight 19 253 273 15 941 865 20,8 886 248 794 284 11,6 883 929 794 322 11,3 3 467 649 3 162 680 9,6 2 313 862 2 089 986 10,7 169 176 144 672 16,9 314 620 503 313 (37,5) 6 341 9 164 (30,8) 91 496 75 231 21,6 915 524 847 417 8,0 4 761 4 860 (2,0) 65 636 71 757 (8,5) 13,8 14,8 (6,8)
Industrial 1 486 371 1 434 758 3,6 118 445 134 154 (11,7) 118 445 134 154 (11,7) 736 819 736 502 – 253 781 226 774 11,9 13 685 9 496 44,1 22 516 10 143 122,0 985 179 450,3 28 637 26 844 6,7 222 088 198 649 11,8 1 375 1 236 11,2 10 595 9 994 6,0 7,7 8,1 (4,9)
Office 3 684 598 3 497 605 5,3 215 388 197 274 9,2 213 808 197 269 8,4 1 301 946 1 277 758 1,9 680 079 652 105 4,3 51 666 52 227 (1,1) 48 216 43 440 11,0 6 098 9 411 (35,2) 90 523 90 654 (0,1) 707 588 699 922 1,1 4 256 4 241 0,4 24 067 27 959 (13,9) 5,7 6,6 (13,6)
Paperplus 3 705 374 3 464 184 7,0 325 609 312 629 4,2 325 609 312 629 4,2 1 427 191 1 254 618 13,8 496 403 448 426 10,7 59 073 55 846 5,8 81 854 41 883 95,4 7 823 5 654 38,4 151 946 146 716 3,6 597 580 558 267 7,0 4 418 4 730 (6,6) 32 330 36 879 (12,3) 7,3 7,8 (6,1)
Rental and Products 1 730 074 1 576 391 9,7 325 872 280 205 16,3 325 838 275 395 18,3 780 855 833 931 (6,4) 202 332 214 153 (5,5) 149 189 134 956 10,5 159 850 168 602 (5,2) 1 509 3 591 (58,0) 52 656 53 194 (1,0) 373 637 335 882 11,2 5 981 5 414 10,5 52 204 58 683 (11,0) 8,7 10,8 (19,4)
Services 2 901 383 2 840 059 2,2 187 577 183 190 2,4 155 736 165 502 (5,9) 699 889 779 678 (10,2) 240 868 312 864 (23,0) 88 943 80 392 10,6 152 640 142 852 6,9 2 989 2 964 0,8 192 124 187 719 2,3 2 025 752 1 908 696 6,1 48 620 49 952 (2,7) 20 612 22 109 (6,8) 0,4 0,4 –
Travel and Aviation 1 874 422 1 733 667 8,1 274 179 207 170 32,3 272 188 206 866 31,6 1 842 303 1 801 310 2,3 510 661 456 262 11,9 57 288 71 190 (19,5) 45 201 94 463 (52,1) 4 108 6 682 (38,5) 67 877 70 745 (4,1) 737 264 612 794 20,3 5 208 5 000 4,2 13 226 13 831 (4,4) 2,5 2,8 (10,7)
Bidvest Foodservice 59 645 556 58 389 859 2,2 2 031 705 2 046 017 (0,7) 1 835 187 1 964 999 (6,6) 14 323 890 12 784 864 12,0 9 833 303 8 786 341 11,9 569 799 600 595 (5,1) 716 020 642 745 11,4 223 350 70 016 219,0 5 881 820 5 253 128 12,0 5 188 838 5 236 824 (0,9) 17 880 17 804 0,4 262 431 248 959 5,4 14,7 14,0 5,0
Asia Pacific 19 563 066 17 547 642 11,5 833 125 729 375 14,2 833 125 729 375 14,2 5 083 565 4 232 804 20,1 2 860 502 2 333 212 22,6 152 517 138 199 10,4 317 506 253 930 25,0 6 982 4 719 48,0 1 183 288 1 012 611 16,9 1 480 276 1 473 101 0,5 4 056 4 149 (2,2) 76 641 70 439 8,8 18,9 17,0 11,1
Europe 34 664 912 35 460 797 (2,2) 842 455 897 771 (6,2) 648 120 816 753 (20,6) 7 571 029 6 784 403 11,6 6 132 658 5 483 203 11,8 355 238 405 281 (12,3) 337 849 314 428 7,4 213 753 62 642 241,2 4 673 511 4 210 999 11,0 3 182 117 3 248 546 (2,0) 10 285 10 115 1,7 125 072 121 031 3,3 12,2 12,0 1,7
Southern Africa 5 417 578 5 381 420 0,7 356 125 418 871 (15,0) 353 942 418 871 (15,5) 1 669 296 1 767 657 (5,6) 840 143 969 926 (13,4) 62 044 57 115 8,6 60 665 74 387 (18,4) 2 615 2 655 (1,5) 25 021 29 519 (15,2) 526 445 515 177 2,2 3 539 3 540 0,0 60 718 57 488 5,6 17,2 16,2 6,2
Bidvest Namibia 2 133 749 1 949 205 9,5 540 154 367 891 46,8 556 290 360 868 54,2 1 055 967 1 012 138 4,3 383 970 399 625 (3,9) 47 179 39 318 20,0 75 402 313 261 (75,9) 5 339 8 724 (38,8) 103 874 111 495 (6,8) 365 669 315 896 15,8 2 700 2 574 4,9 100 353 97 006 3,5 37,2 37,7 (1,3)
Bidvest Corporate 683 238 730 687 (6,5) 140 263 128 612 9,1 148 292 154 722 (4,2) 3 405 967 2 657 680 28,2 352 396 224 074 57,3 29 501 33 590 (12,2) 276 454 26 225 954,2 1 806 2 513 (28,1) 9 886 10 526 (6,1) 255 505 253 267 0,9 577 585 (1,4) 14 338 14 237 0,7 24,8 24,3 2,1
Properties 212 270 175 015 21,3 207 153 176 637 17,3 215 719 180 628 19,4 1 462 287 1 082 830 35,0 19 998 5 556 259,9 3 063 4 147 (26,1) 179 858 13 866 1 197,1 – – 142 142 – 7 496 5 252 42,7 11 9 22,2
Corporate and
investments 470 968 555 672 (15,2) (66 890) (48 025) (67 427) (25 906) 1 943 680 1 574 850 23,4 332 398 218 518 52,1 26 438 29 443 (10,2) 96 596 12 359 681,6 1 806 2 513 (28,1) 9 744 10 384 (6,2) 248 009 248 015 – 566 576 (1,7)
121 483 367 112 860 765 7,6 6 124 313 5 633 750 8,7 5 910 563 5 542 397 6,6 36 463 252 32 859 208 11,0 19 684 356 17 646 167 11,6 1 556 293 1 599 512 (2,7) 2 736 106 2 733 291 0,1 272 315 125 127 117,6 7 026 930 6 360 263 10,5 13 245 940 12 717 407 4,2 105 057 105 752 (0,7) 693 340 684 398 1,3 6,6 6,5 1,5
Inter-group eliminations (3 000 631) (3 071 558) (488 324) (440 095) (488 324) (440 095)
Share-based payment expense
(62 652) (79 054) (62 652) (79 054) (62 652) (62 066)
118 482 736 109 789 207 7,9 6 061 661 5 554 696 9,1 5 847 911 5 463 343 7,0 35 974 928 32 419 113 11,0 19 196 032 17 206 072 11,6 13 308 592 12 779 473 4,1 * Carbon emissions have not been audited and do not form part of the
independent auditors report

11 THE BIDVEST GROUP LIMITED / ANNUAL INTEGRATED REPORT 2011
GROUP OVERVIEW
Revenue Trading profit Operating profit Operating assets Operating liabilities Depreciation Capital expenditure
Amortisation and
impairments
of intangible assets
Goodwill and intangible
assets
Employee
benefits and remuneration Number of employees Total carbon emissions*
Carbon emissions per*
employee
Trading division2011
R’0002010
R’000%
change2011
R’0002010
R’000%
change2011
R’0002010
R’000%
change2011
R’0002010
R’000%
change2011
R’0002010
R’000%
change2011
R’0002010
R’000%
change2011
R’0002010
R’000%
change2011
R’0002010
R’000%
change2011
R’0002010
R’000%
change2011
R’0002010
R’000%
change2011 2010 %
change2011
tonnes2010
tonnes%
change2011
tonnes2010
tonnes%
change
Bidvest South Africa 59 020 824 51 791 014 14,0 3 412 191 3 091 230 10,4 3 370 794 3 061 808 10,1 17 677 428 16 404 526 7,8 9 114 687 8 236 127 10,7 909 814 926 009 (1,7) 1 668 230 1 751 060 (4,7) 41 820 43 874 (4,7) 1 031 350 985 114 4,7 7 435 928 6 911 420 7,6 83 900 84 789 (1,0) 316 218 32 496 (2,5) 3,8 3,8 (1,4)
Automotive 18 608 261 15 849 758 17,4 255 420 230 787 10,7 253 920 230 787 10,0 2 668 439 2 398 569 11,3 1 772 057 1 419 875 24,8 56 443 59 689 (5,4) 52 033 46 996 10,7 – – 229 132 229 132 – 1 242 035 1 163 695 6,7 5 869 5 922 (0,9) 67 858 62 997 7,7 11,6 10,6 9,4
Electrical 4 100 368 3 978 286 3,1 181 832 193 933 (6,2) 181 832 193 933 (6,2) 1 744 524 1 588 435 9,8 742 931 775 364 (4,2) 15 309 15 086 1,5 23 344 9 774 138,8 2 725 657 314,8 76 003 53 169 42,9 360 603 357 670 0,8 2 184 2 181 0,1 14 890 14 418 3,3 6,8 6,6 3,0
Financial Services 1 676 700 1 474 441 13,7 641 621 557 604 15,1 639 489 550 951 16,1 3 007 813 2 571 045 17,0 1 901 713 1 640 318 15,9 249 042 302 455 (17,7) 767 956 689 594 11,4 9 242 5 572 65,9 50 956 51 710 (1,5) 253 857 228 428 11,1 1 228 1 253 (2,0) 14 800 5 569 165,7 12,1 4,4 171,2
Freight 19 253 273 15 941 865 20,8 886 248 794 284 11,6 883 929 794 322 11,3 3 467 649 3 162 680 9,6 2 313 862 2 089 986 10,7 169 176 144 672 16,9 314 620 503 313 (37,5) 6 341 9 164 (30,8) 91 496 75 231 21,6 915 524 847 417 8,0 4 761 4 860 (2,0) 65 636 71 757 (8,5) 13,8 14,8 (6,8)
Industrial 1 486 371 1 434 758 3,6 118 445 134 154 (11,7) 118 445 134 154 (11,7) 736 819 736 502 – 253 781 226 774 11,9 13 685 9 496 44,1 22 516 10 143 122,0 985 179 450,3 28 637 26 844 6,7 222 088 198 649 11,8 1 375 1 236 11,2 10 595 9 994 6,0 7,7 8,1 (4,9)
Office 3 684 598 3 497 605 5,3 215 388 197 274 9,2 213 808 197 269 8,4 1 301 946 1 277 758 1,9 680 079 652 105 4,3 51 666 52 227 (1,1) 48 216 43 440 11,0 6 098 9 411 (35,2) 90 523 90 654 (0,1) 707 588 699 922 1,1 4 256 4 241 0,4 24 067 27 959 (13,9) 5,7 6,6 (13,6)
Paperplus 3 705 374 3 464 184 7,0 325 609 312 629 4,2 325 609 312 629 4,2 1 427 191 1 254 618 13,8 496 403 448 426 10,7 59 073 55 846 5,8 81 854 41 883 95,4 7 823 5 654 38,4 151 946 146 716 3,6 597 580 558 267 7,0 4 418 4 730 (6,6) 32 330 36 879 (12,3) 7,3 7,8 (6,1)
Rental and Products 1 730 074 1 576 391 9,7 325 872 280 205 16,3 325 838 275 395 18,3 780 855 833 931 (6,4) 202 332 214 153 (5,5) 149 189 134 956 10,5 159 850 168 602 (5,2) 1 509 3 591 (58,0) 52 656 53 194 (1,0) 373 637 335 882 11,2 5 981 5 414 10,5 52 204 58 683 (11,0) 8,7 10,8 (19,4)
Services 2 901 383 2 840 059 2,2 187 577 183 190 2,4 155 736 165 502 (5,9) 699 889 779 678 (10,2) 240 868 312 864 (23,0) 88 943 80 392 10,6 152 640 142 852 6,9 2 989 2 964 0,8 192 124 187 719 2,3 2 025 752 1 908 696 6,1 48 620 49 952 (2,7) 20 612 22 109 (6,8) 0,4 0,4 –
Travel and Aviation 1 874 422 1 733 667 8,1 274 179 207 170 32,3 272 188 206 866 31,6 1 842 303 1 801 310 2,3 510 661 456 262 11,9 57 288 71 190 (19,5) 45 201 94 463 (52,1) 4 108 6 682 (38,5) 67 877 70 745 (4,1) 737 264 612 794 20,3 5 208 5 000 4,2 13 226 13 831 (4,4) 2,5 2,8 (10,7)
Bidvest Foodservice 59 645 556 58 389 859 2,2 2 031 705 2 046 017 (0,7) 1 835 187 1 964 999 (6,6) 14 323 890 12 784 864 12,0 9 833 303 8 786 341 11,9 569 799 600 595 (5,1) 716 020 642 745 11,4 223 350 70 016 219,0 5 881 820 5 253 128 12,0 5 188 838 5 236 824 (0,9) 17 880 17 804 0,4 262 431 248 959 5,4 14,7 14,0 5,0
Asia Pacific 19 563 066 17 547 642 11,5 833 125 729 375 14,2 833 125 729 375 14,2 5 083 565 4 232 804 20,1 2 860 502 2 333 212 22,6 152 517 138 199 10,4 317 506 253 930 25,0 6 982 4 719 48,0 1 183 288 1 012 611 16,9 1 480 276 1 473 101 0,5 4 056 4 149 (2,2) 76 641 70 439 8,8 18,9 17,0 11,1
Europe 34 664 912 35 460 797 (2,2) 842 455 897 771 (6,2) 648 120 816 753 (20,6) 7 571 029 6 784 403 11,6 6 132 658 5 483 203 11,8 355 238 405 281 (12,3) 337 849 314 428 7,4 213 753 62 642 241,2 4 673 511 4 210 999 11,0 3 182 117 3 248 546 (2,0) 10 285 10 115 1,7 125 072 121 031 3,3 12,2 12,0 1,7
Southern Africa 5 417 578 5 381 420 0,7 356 125 418 871 (15,0) 353 942 418 871 (15,5) 1 669 296 1 767 657 (5,6) 840 143 969 926 (13,4) 62 044 57 115 8,6 60 665 74 387 (18,4) 2 615 2 655 (1,5) 25 021 29 519 (15,2) 526 445 515 177 2,2 3 539 3 540 0,0 60 718 57 488 5,6 17,2 16,2 6,2
Bidvest Namibia 2 133 749 1 949 205 9,5 540 154 367 891 46,8 556 290 360 868 54,2 1 055 967 1 012 138 4,3 383 970 399 625 (3,9) 47 179 39 318 20,0 75 402 313 261 (75,9) 5 339 8 724 (38,8) 103 874 111 495 (6,8) 365 669 315 896 15,8 2 700 2 574 4,9 100 353 97 006 3,5 37,2 37,7 (1,3)
Bidvest Corporate 683 238 730 687 (6,5) 140 263 128 612 9,1 148 292 154 722 (4,2) 3 405 967 2 657 680 28,2 352 396 224 074 57,3 29 501 33 590 (12,2) 276 454 26 225 954,2 1 806 2 513 (28,1) 9 886 10 526 (6,1) 255 505 253 267 0,9 577 585 (1,4) 14 338 14 237 0,7 24,8 24,3 2,1
Properties 212 270 175 015 21,3 207 153 176 637 17,3 215 719 180 628 19,4 1 462 287 1 082 830 35,0 19 998 5 556 259,9 3 063 4 147 (26,1) 179 858 13 866 1 197,1 – – 142 142 – 7 496 5 252 42,7 11 9 22,2
Corporate and
investments 470 968 555 672 (15,2) (66 890) (48 025) (67 427) (25 906) 1 943 680 1 574 850 23,4 332 398 218 518 52,1 26 438 29 443 (10,2) 96 596 12 359 681,6 1 806 2 513 (28,1) 9 744 10 384 (6,2) 248 009 248 015 – 566 576 (1,7)
121 483 367 112 860 765 7,6 6 124 313 5 633 750 8,7 5 910 563 5 542 397 6,6 36 463 252 32 859 208 11,0 19 684 356 17 646 167 11,6 1 556 293 1 599 512 (2,7) 2 736 106 2 733 291 0,1 272 315 125 127 117,6 7 026 930 6 360 263 10,5 13 245 940 12 717 407 4,2 105 057 105 752 (0,7) 693 340 684 398 1,3 6,6 6,5 1,5
Inter-group eliminations (3 000 631) (3 071 558) (488 324) (440 095) (488 324) (440 095)
Share-based payment expense
(62 652) (79 054) (62 652) (79 054) (62 652) (62 066)
118 482 736 109 789 207 7,9 6 061 661 5 554 696 9,1 5 847 911 5 463 343 7,0 35 974 928 32 419 113 11,0 19 196 032 17 206 072 11,6 13 308 592 12 779 473 4,1 * Carbon emissions have not been audited and do not form part of the
independent auditors report

FINANCIAL STATEMENTSAND OTHER INFORMATION
12 THE BIDVEST GROUP LIMITED / ANNUAL INTEGRATED REPORT 2011
Revenue Trading profit Operating profit Operating assets Operating liabilities Depreciation Capital expenditure
Amortisation and
impairments
of intangible assets
Goodwill and intangible
assets
Employee
benefits and remuneration Number of employees Total carbon emissions*
Carbon emissions per*
employee
Trading division2011
R’0002010
R’000%
change2011
R’0002010
R’000%
change2011
R’0002010
R’000%
change2011
R’0002010
R’000%
change2011
R’0002010
R’000%
change2011
R’0002010
R’000%
change2011
R’0002010
R’000%
change2011
R’0002010
R’000%
change2011
R’0002010
R’000%
change2011
R’0002010
R’000%
change2011 2010 %
change2011
tonnes2010
tonnes%
change2011
tonnes2010
tonnes%
change
Bidvest South Africa 59 020 824 51 791 014 14,0 3 412 191 3 091 230 10,4 3 370 794 3 061 808 10,1 17 677 428 16 404 526 7,8 9 114 687 8 236 127 10,7 909 814 926 009 (1,7) 1 668 230 1 751 060 (4,7) 41 820 43 874 (4,7) 1 031 350 985 114 4,7 7 435 928 6 911 420 7,6 83 900 84 789 (1,0) 316 218 32 496 (2,5) 3,8 3,8 (1,4)
Automotive 18 608 261 15 849 758 17,4 255 420 230 787 10,7 253 920 230 787 10,0 2 668 439 2 398 569 11,3 1 772 057 1 419 875 24,8 56 443 59 689 (5,4) 52 033 46 996 10,7 – – 229 132 229 132 – 1 242 035 1 163 695 6,7 5 869 5 922 (0,9) 67 858 62 997 7,7 11,6 10,6 9,4
Electrical 4 100 368 3 978 286 3,1 181 832 193 933 (6,2) 181 832 193 933 (6,2) 1 744 524 1 588 435 9,8 742 931 775 364 (4,2) 15 309 15 086 1,5 23 344 9 774 138,8 2 725 657 314,8 76 003 53 169 42,9 360 603 357 670 0,8 2 184 2 181 0,1 14 890 14 418 3,3 6,8 6,6 3,0
Financial Services 1 676 700 1 474 441 13,7 641 621 557 604 15,1 639 489 550 951 16,1 3 007 813 2 571 045 17,0 1 901 713 1 640 318 15,9 249 042 302 455 (17,7) 767 956 689 594 11,4 9 242 5 572 65,9 50 956 51 710 (1,5) 253 857 228 428 11,1 1 228 1 253 (2,0) 14 800 5 569 165,7 12,1 4,4 171,2
Freight 19 253 273 15 941 865 20,8 886 248 794 284 11,6 883 929 794 322 11,3 3 467 649 3 162 680 9,6 2 313 862 2 089 986 10,7 169 176 144 672 16,9 314 620 503 313 (37,5) 6 341 9 164 (30,8) 91 496 75 231 21,6 915 524 847 417 8,0 4 761 4 860 (2,0) 65 636 71 757 (8,5) 13,8 14,8 (6,8)
Industrial 1 486 371 1 434 758 3,6 118 445 134 154 (11,7) 118 445 134 154 (11,7) 736 819 736 502 – 253 781 226 774 11,9 13 685 9 496 44,1 22 516 10 143 122,0 985 179 450,3 28 637 26 844 6,7 222 088 198 649 11,8 1 375 1 236 11,2 10 595 9 994 6,0 7,7 8,1 (4,9)
Office 3 684 598 3 497 605 5,3 215 388 197 274 9,2 213 808 197 269 8,4 1 301 946 1 277 758 1,9 680 079 652 105 4,3 51 666 52 227 (1,1) 48 216 43 440 11,0 6 098 9 411 (35,2) 90 523 90 654 (0,1) 707 588 699 922 1,1 4 256 4 241 0,4 24 067 27 959 (13,9) 5,7 6,6 (13,6)
Paperplus 3 705 374 3 464 184 7,0 325 609 312 629 4,2 325 609 312 629 4,2 1 427 191 1 254 618 13,8 496 403 448 426 10,7 59 073 55 846 5,8 81 854 41 883 95,4 7 823 5 654 38,4 151 946 146 716 3,6 597 580 558 267 7,0 4 418 4 730 (6,6) 32 330 36 879 (12,3) 7,3 7,8 (6,1)
Rental and Products 1 730 074 1 576 391 9,7 325 872 280 205 16,3 325 838 275 395 18,3 780 855 833 931 (6,4) 202 332 214 153 (5,5) 149 189 134 956 10,5 159 850 168 602 (5,2) 1 509 3 591 (58,0) 52 656 53 194 (1,0) 373 637 335 882 11,2 5 981 5 414 10,5 52 204 58 683 (11,0) 8,7 10,8 (19,4)
Services 2 901 383 2 840 059 2,2 187 577 183 190 2,4 155 736 165 502 (5,9) 699 889 779 678 (10,2) 240 868 312 864 (23,0) 88 943 80 392 10,6 152 640 142 852 6,9 2 989 2 964 0,8 192 124 187 719 2,3 2 025 752 1 908 696 6,1 48 620 49 952 (2,7) 20 612 22 109 (6,8) 0,4 0,4 –
Travel and Aviation 1 874 422 1 733 667 8,1 274 179 207 170 32,3 272 188 206 866 31,6 1 842 303 1 801 310 2,3 510 661 456 262 11,9 57 288 71 190 (19,5) 45 201 94 463 (52,1) 4 108 6 682 (38,5) 67 877 70 745 (4,1) 737 264 612 794 20,3 5 208 5 000 4,2 13 226 13 831 (4,4) 2,5 2,8 (10,7)
Bidvest Foodservice 59 645 556 58 389 859 2,2 2 031 705 2 046 017 (0,7) 1 835 187 1 964 999 (6,6) 14 323 890 12 784 864 12,0 9 833 303 8 786 341 11,9 569 799 600 595 (5,1) 716 020 642 745 11,4 223 350 70 016 219,0 5 881 820 5 253 128 12,0 5 188 838 5 236 824 (0,9) 17 880 17 804 0,4 262 431 248 959 5,4 14,7 14,0 5,0
Asia Pacific 19 563 066 17 547 642 11,5 833 125 729 375 14,2 833 125 729 375 14,2 5 083 565 4 232 804 20,1 2 860 502 2 333 212 22,6 152 517 138 199 10,4 317 506 253 930 25,0 6 982 4 719 48,0 1 183 288 1 012 611 16,9 1 480 276 1 473 101 0,5 4 056 4 149 (2,2) 76 641 70 439 8,8 18,9 17,0 11,1
Europe 34 664 912 35 460 797 (2,2) 842 455 897 771 (6,2) 648 120 816 753 (20,6) 7 571 029 6 784 403 11,6 6 132 658 5 483 203 11,8 355 238 405 281 (12,3) 337 849 314 428 7,4 213 753 62 642 241,2 4 673 511 4 210 999 11,0 3 182 117 3 248 546 (2,0) 10 285 10 115 1,7 125 072 121 031 3,3 12,2 12,0 1,7
Southern Africa 5 417 578 5 381 420 0,7 356 125 418 871 (15,0) 353 942 418 871 (15,5) 1 669 296 1 767 657 (5,6) 840 143 969 926 (13,4) 62 044 57 115 8,6 60 665 74 387 (18,4) 2 615 2 655 (1,5) 25 021 29 519 (15,2) 526 445 515 177 2,2 3 539 3 540 0,0 60 718 57 488 5,6 17,2 16,2 6,2
Bidvest Namibia 2 133 749 1 949 205 9,5 540 154 367 891 46,8 556 290 360 868 54,2 1 055 967 1 012 138 4,3 383 970 399 625 (3,9) 47 179 39 318 20,0 75 402 313 261 (75,9) 5 339 8 724 (38,8) 103 874 111 495 (6,8) 365 669 315 896 15,8 2 700 2 574 4,9 100 353 97 006 3,5 37,2 37,7 (1,3)
Bidvest Corporate 683 238 730 687 (6,5) 140 263 128 612 9,1 148 292 154 722 (4,2) 3 405 967 2 657 680 28,2 352 396 224 074 57,3 29 501 33 590 (12,2) 276 454 26 225 954,2 1 806 2 513 (28,1) 9 886 10 526 (6,1) 255 505 253 267 0,9 577 585 (1,4) 14 338 14 237 0,7 24,8 24,3 2,1
Properties 212 270 175 015 21,3 207 153 176 637 17,3 215 719 180 628 19,4 1 462 287 1 082 830 35,0 19 998 5 556 259,9 3 063 4 147 (26,1) 179 858 13 866 1 197,1 – – 142 142 – 7 496 5 252 42,7 11 9 22,2
Corporate and
investments 470 968 555 672 (15,2) (66 890) (48 025) (67 427) (25 906) 1 943 680 1 574 850 23,4 332 398 218 518 52,1 26 438 29 443 (10,2) 96 596 12 359 681,6 1 806 2 513 (28,1) 9 744 10 384 (6,2) 248 009 248 015 – 566 576 (1,7)
121 483 367 112 860 765 7,6 6 124 313 5 633 750 8,7 5 910 563 5 542 397 6,6 36 463 252 32 859 208 11,0 19 684 356 17 646 167 11,6 1 556 293 1 599 512 (2,7) 2 736 106 2 733 291 0,1 272 315 125 127 117,6 7 026 930 6 360 263 10,5 13 245 940 12 717 407 4,2 105 057 105 752 (0,7) 693 340 684 398 1,3 6,6 6,5 1,5
Inter-group eliminations (3 000 631) (3 071 558) (488 324) (440 095) (488 324) (440 095)
Share-based payment expense
(62 652) (79 054) (62 652) (79 054) (62 652) (62 066)
118 482 736 109 789 207 7,9 6 061 661 5 554 696 9,1 5 847 911 5 463 343 7,0 35 974 928 32 419 113 11,0 19 196 032 17 206 072 11,6 13 308 592 12 779 473 4,1 * Carbon emissions have not been audited and do not form part of the
independent auditors report
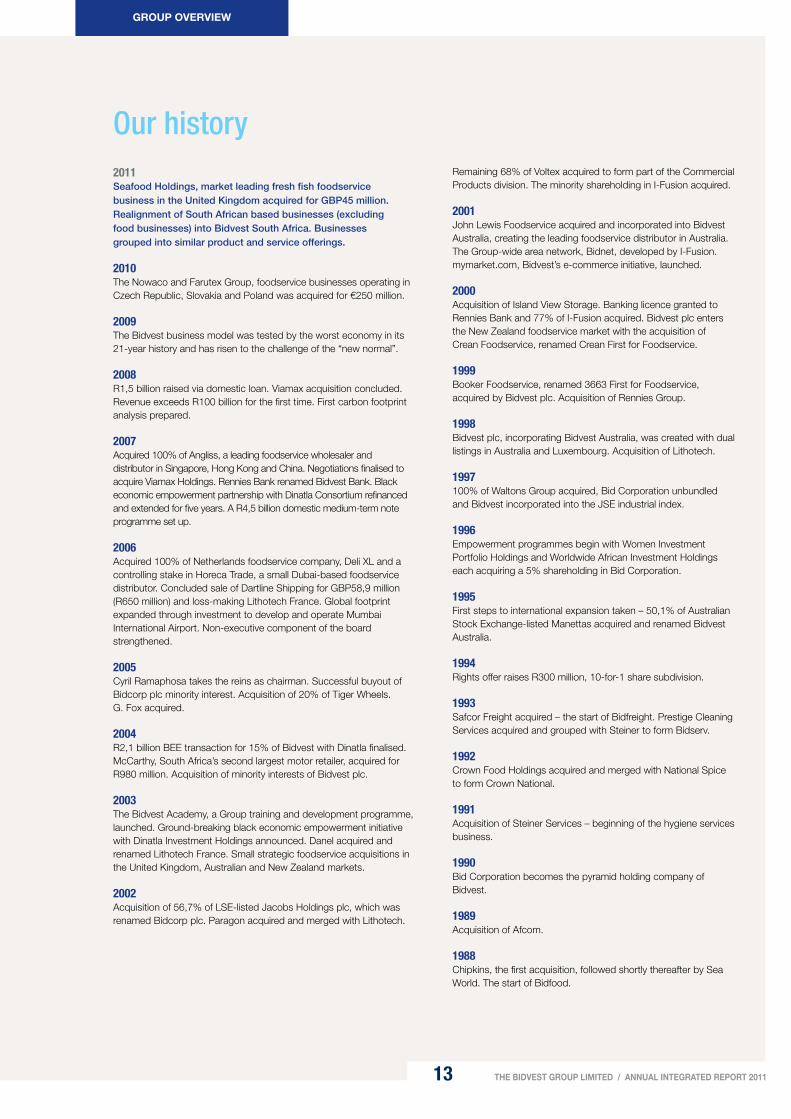
GROUP OVERVIEW
13 THE BIDVEST GROUP LIMITED / ANNUAL INTEGRATED REPORT 2011
Our historyRemaining 68% of Voltex acquired to form part of the Commercial Products division. The minority shareholding in I-Fusion acquired.
2001John Lewis Foodservice acquired and incorporated into Bidvest Australia, creating the leading foodservice distributor in Australia. The Group-wide area network, Bidnet, developed by I-Fusion. mymarket.com, Bidvest’s e-commerce initiative, launched.
2000Acquisition of Island View Storage. Banking licence granted to Rennies Bank and 77% of I-Fusion acquired. Bidvest plc enters the New Zealand foodservice market with the acquisition of Crean Foodservice, renamed Crean First for Foodservice.
1999Booker Foodservice, renamed 3663 First for Foodservice, acquired by Bidvest plc. Acquisition of Rennies Group.
1998Bidvest plc, incorporating Bidvest Australia, was created with dual listings in Australia and Luxembourg. Acquisition of Lithotech.
1997100% of Waltons Group acquired, Bid Corporation unbundled and Bidvest incorporated into the JSE industrial index.
1996Empowerment programmes begin with Women Investment Portfolio Holdings and Worldwide African Investment Holdings each acquiring a 5% shareholding in Bid Corporation.
1995First steps to international expansion taken – 50,1% of Australian Stock Exchange-listed Manettas acquired and renamed Bidvest Australia.
1994Rights offer raises R300 million, 10-for-1 share subdivision.
1993 Safcor Freight acquired – the start of Bidfreight. Prestige Cleaning Services acquired and grouped with Steiner to form Bidserv.
1992 Crown Food Holdings acquired and merged with National Spice to form Crown National.
1991Acquisition of Steiner Services – beginning of the hygiene services business.
1990Bid Corporation becomes the pyramid holding company of Bidvest.
1989Acquisition of Afcom.
1988 Chipkins, the first acquisition, followed shortly thereafter by Sea World. The start of Bidfood.
2011Seafood Holdings, market leading fresh fish foodservice business in the United Kingdom acquired for GBP45 million. Realignment of South African based businesses (excluding food businesses) into Bidvest South Africa. Businesses grouped into similar product and service offerings.
2010The Nowaco and Farutex Group, foodservice businesses operating in Czech Republic, Slovakia and Poland was acquired for €250 million.
2009The Bidvest business model was tested by the worst economy in its 21-year history and has risen to the challenge of the “new normal”.
2008 R1,5 billion raised via domestic loan. Viamax acquisition concluded. Revenue exceeds R100 billion for the first time. First carbon footprint analysis prepared.
2007Acquired 100% of Angliss, a leading foodservice wholesaler and distributor in Singapore, Hong Kong and China. Negotiations finalised to acquire Viamax Holdings. Rennies Bank renamed Bidvest Bank. Black economic empowerment partnership with Dinatla Consortium refinanced and extended for five years. A R4,5 billion domestic medium-term note programme set up.
2006Acquired 100% of Netherlands foodservice company, Deli XL and a controlling stake in Horeca Trade, a small Dubai-based foodservice distributor. Concluded sale of Dartline Shipping for GBP58,9 million (R650 million) and loss-making Lithotech France. Global footprint expanded through investment to develop and operate Mumbai International Airport. Non-executive component of the board strengthened.
2005Cyril Ramaphosa takes the reins as chairman. Successful buyout of Bidcorp plc minority interest. Acquisition of 20% of Tiger Wheels. G. Fox acquired.
2004R2,1 billion BEE transaction for 15% of Bidvest with Dinatla finalised. McCarthy, South Africa’s second largest motor retailer, acquired for R980 million. Acquisition of minority interests of Bidvest plc.
2003The Bidvest Academy, a Group training and development programme, launched. Ground-breaking black economic empowerment initiative with Dinatla Investment Holdings announced. Danel acquired and renamed Lithotech France. Small strategic foodservice acquisitions in the United Kingdom, Australian and New Zealand markets.
2002Acquisition of 56,7% of LSE-listed Jacobs Holdings plc, which was renamed Bidcorp plc. Paragon acquired and merged with Lithotech.
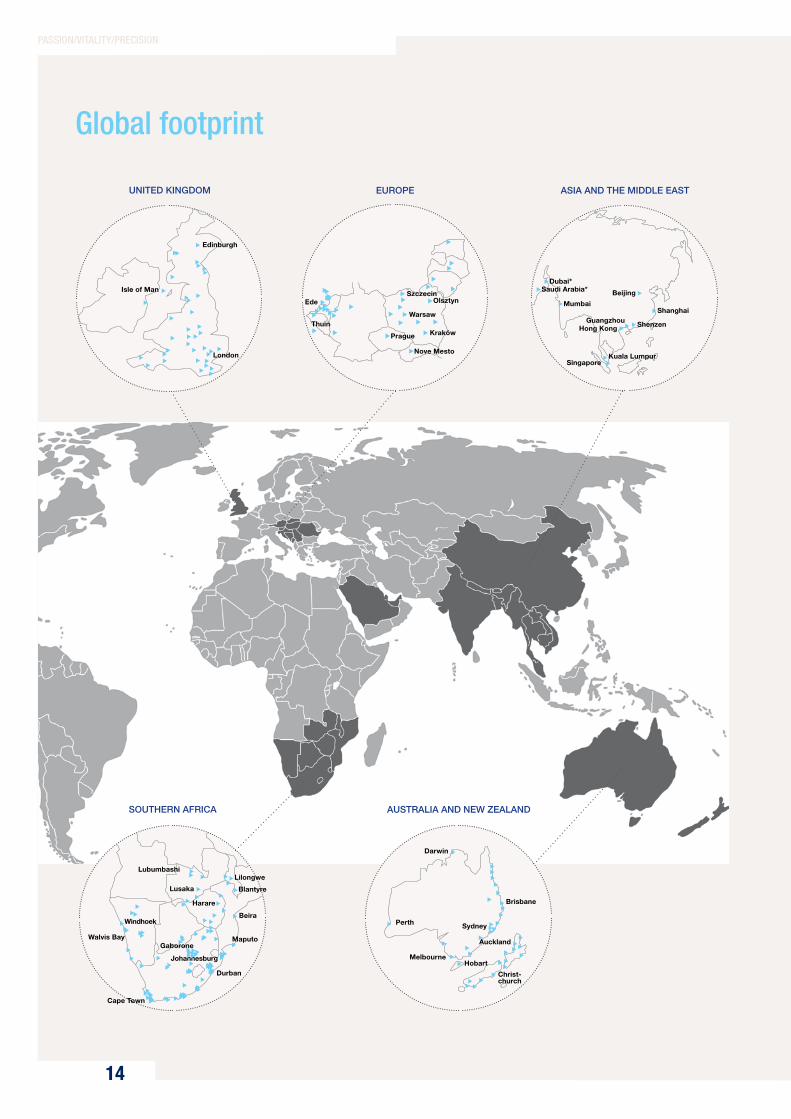
PASSION/VITALITY/PRECISION
14
Global footprint
Edinburgh
Isle of Man
London
UNITED KINGDOm EUROPE
SOUTHERN AFRICA
Johannesburg
Cape Town
Maputo
Durban
Beira
Lilongwe
Blantyre
Walvis Bay
Harare
Lusaka
Lubumbashi
Gaborone
Windhoek
AUSTRALIA AND NEW zEALAND
Melbourne
Perth
Brisbane
Sydney
Auckland
Christ-church
Darwin
Hobart
ASIA AND THE mIDDLE EAST
Mumbai
Dubai*Saudi Arabia*
Kuala LumpurSingapore
Hong KongGuangzhou Shenzen
Shanghai
BeijingEde
Thuin
Prague
Nove Mesto
SzczecinOlsztyn
Warsaw
Kraków
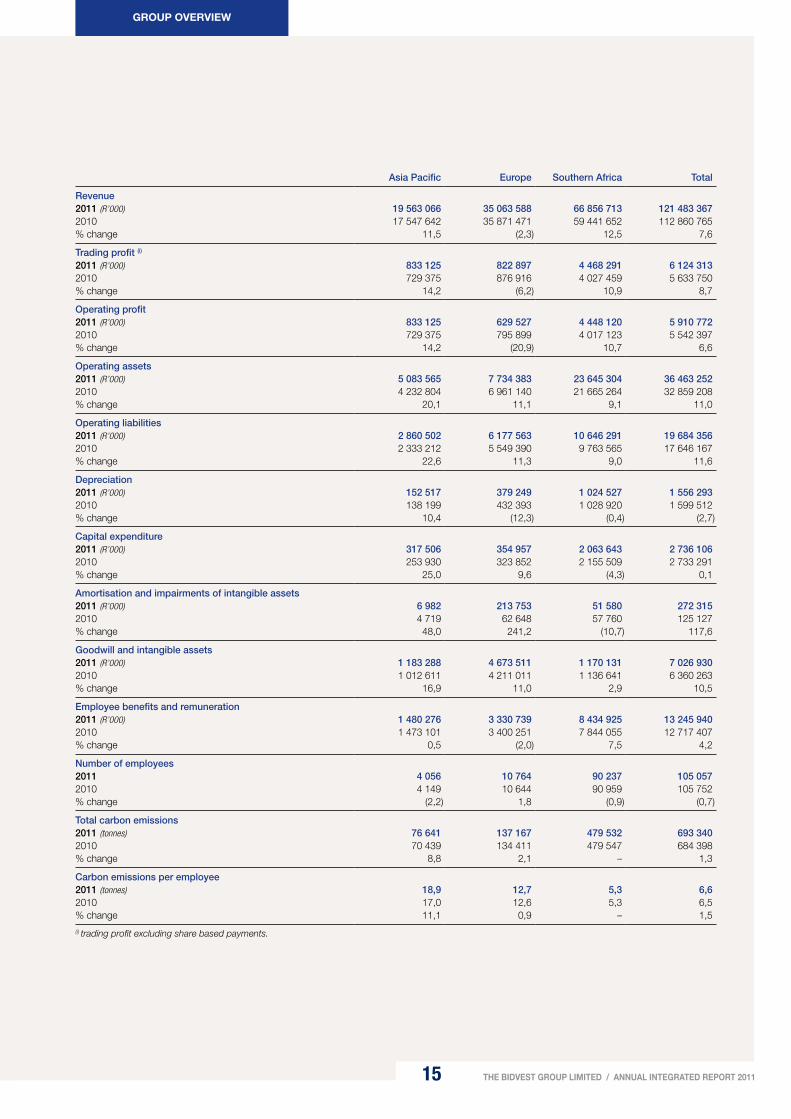
15
GROUP OVERVIEW
THE BIDVEST GROUP LIMITED / ANNUAL INTEGRATED REPORT 2011
Asia Pacific Europe Southern Africa Total
Revenue2011 (R’000) 19 563 066 35 063 588 66 856 713 121 483 3672010 17 547 642 35 871 471 59 441 652 112 860 765% change 11,5 (2,3) 12,5 7,6
Trading profit (i)
2011 (R’000) 833 125 822 897 4 468 291 6 124 3132010 729 375 876 916 4 027 459 5 633 750% change 14,2 (6,2) 10,9 8,7
Operating profit2011 (R’000) 833 125 629 527 4 448 120 5 910 7722010 729 375 795 899 4 017 123 5 542 397% change 14,2 (20,9) 10,7 6,6
Operating assets2011 (R’000) 5 083 565 7 734 383 23 645 304 36 463 2522010 4 232 804 6 961 140 21 665 264 32 859 208% change 20,1 11,1 9,1 11,0
Operating liabilities2011 (R’000) 2 860 502 6 177 563 10 646 291 19 684 3562010 2 333 212 5 549 390 9 763 565 17 646 167% change 22,6 11,3 9,0 11,6
Depreciation2011 (R’000) 152 517 379 249 1 024 527 1 556 2932010 138 199 432 393 1 028 920 1 599 512% change 10,4 (12,3) (0,4) (2,7)
Capital expenditure2011 (R’000) 317 506 354 957 2 063 643 2 736 1062010 253 930 323 852 2 155 509 2 733 291% change 25,0 9,6 (4,3) 0,1
Amortisation and impairments of intangible assets2011 (R’000) 6 982 213 753 51 580 272 3152010 4 719 62 648 57 760 125 127% change 48,0 241,2 (10,7) 117,6
Goodwill and intangible assets2011 (R’000) 1 183 288 4 673 511 1 170 131 7 026 9302010 1 012 611 4 211 011 1 136 641 6 360 263% change 16,9 11,0 2,9 10,5
Employee benefits and remuneration2011 (R’000) 1 480 276 3 330 739 8 434 925 13 245 9402010 1 473 101 3 400 251 7 844 055 12 717 407% change 0,5 (2,0) 7,5 4,2
Number of employees2011 4 056 10 764 90 237 105 0572010 4 149 10 644 90 959 105 752% change (2,2) 1,8 (0,9) (0,7)
Total carbon emissions2011 (tonnes) 76 641 137 167 479 532 693 3402010 70 439 134 411 479 547 684 398% change 8,8 2,1 – 1,3
Carbon emissions per employee2011 (tonnes) 18,9 12,7 5,3 6,62010 17,0 12,6 5,3 6,5% change 11,1 0,9 – 1,5
(i) trading profit excluding share based payments.

PASSION/VITALITY/PRECISION
16
In accordance with IFRS In terms of previous GAAP(2)
20-year compound
growth rates % per annum(1)
10-year compound
growth rates % per annum 2011 2010 2009 2008 2007 2006 2005 2004 2003 2002 2001
Extracts from financial statements (R’m)Revenue 32,7 14,9 118 483 109 789 112 428 110 478 95 656 77 276 62 812 51 262 47 073 41 950 29 415 Trading profit 29,3 15,6 6 062 5 555 5 137 5 335 4 547 3 657 3 046 2 544 2 240 2 013 1 422 Net finance charges 644 758 1 029 931 566 342 285 169 111 80 –Attributable profit 30,6 13,1 3 539 3 345 2 802 3 253 2 700 2 389 1 961 1 532 1 335 1 231 1 035 Shareholders' interest 17 669 16 737 13 929 13 468 10 627 8 929 7 469 5 998 5 353 5 564 3 860 Total assets 28,4 17,2 47 830 43 345 38 484 41 861 32 848 27 995 21 123 18 021 14 592 15 117 9 742 Net debt 5 030 3 863 4 072 5 547 3 764 1 452 989 674 – – – Funds employed 16 779 15 213 13 924 14 503 10 658 7 456 6 093 5 345 4 577 4 577 3 178Cash generated by operations 34,1 18,0 8 187 7 984 6 749 6 087 4 237 4 490 4 200 3 761 2 667 2 752 1 559 Wealth created by trading operations 30,8 16,1 22 525 21 465 20 708 19 595 16 777 14 049 11 955 10 231 9 247 7 441 5 080 Employee benefits and remuneration 13 309 12 779 12 817 11 701 9 967 8 311 7 304 6 512 6 091 4 995 3 411
Share statisticsHeadline earnings per share (cents)(3) 21,0 12,2 1 157,4 1 070,0 930,0 1 068,0 970,0 804,6 656,4 544,0 463,5 432,8 365,2 Distribution per share (cents)(4) 20,5 11,0 480,0 432,0 380,0 495,0 446,4 369,0 306,0 250,2 220,0 190,0 169,2 Distribution cover (times)(4) 2,4 2,5 2,4 2,2 2,2 2,2 2,1 2,2 2,1 2,3 2,2 Distribution yield (%) 3,2 3,5 3,9 5,0 3,2 3,7 4,2 4,8 5,1 4,1 3,4 Earnings yield (%) 7,7 8,8 9,6 10,9 6,9 8,1 9,0 10,4 10,8 9,4 7,3 Net tangible asset value per share (cents) 18,7 11,2 3 444 3 253 3 098 2 803 2 135 1 814 1 542 1 330 1 549 1 569 1 186 Share price (cents) high 16 100 14 664 11 808 15 100 14 780 11 650 8 100 5 620 4 800 5 200 5 200 low 12 000 9 250 7 750 9 400 9 430 7 200 5 195 4 100 3 970 3 980 4 075 closing (June 30) 22,0 11,6 15 050 12 189 9 674 9 838 14 123 9 875 7 270 5 250 4 300 4 600 5 010 Net market capitalisation (R’m)(5) 29,3 12,1 46 508 38 884 29 505 29 571 42 772 29 541 21 768 16 570 13 462 14 316 14 821
Volumes traded (’000) 232 095 285 279 243 051 265 157 233 306 206 156 166 720 160 233 156 731 125 566 99 096 Volumes traded as % of weighted number of shares 72,8 90,7 80,6 87,5 77,7 68,7 55,1 53,3 50,9 42,0 34,0
Ratios and statisticsReturn on total shareholders’ interest (%)(10) 21,1 24,0 20,8 30,6 30,2 32,0 0,0 28,6 24,0 31,9 34,2 Return on average funds employed (%)(6) 37,9 38,7 36,4 48,6 50,2 54,0 53,5 53,6 48,9 56,8 43,6 Trading profit margin (%) 5,1 5,1 4,6 4,8 4,8 4,7 4,8 5,0 4,8 4,8 4,8 Interest cover(9) 9,4 7,4 5,0 5,7 8,0 10,7 10,7 15,1 20,2 25,1 3 637,4 Debt equity ratio (%)(8) 28,5 23,1 29,2 41,2 35,4 16,3 13,2 11,2 – – – Current asset ratio 1,1 1,1 1,1 1,1 1,1 1,1 1,1 1,1 1,3 1,2 1,2 Quick asset ratio 0,7 0,7 0,7 0,7 0,7 0,8 0,7 0,8 1,0 0,9 0,9 Number of employees 105 057 105 752 103 449 106 225 104 184 93 325 89 737 81 931 70 754 66 879 54 251 Revenue per employee (R’000) 1 127,7 1 038,2 1 086,8 1 040,0 918,1 828,0 700,0 625,7 665,3 627,3 542,2 Value added per employee (R’000) 214,4 203,0 200,2 184,5 161,0 150,5 133,2 124,9 130,7 111,3 93,6 Number of shares in issue (’000)(7) 309 021 319 006 304 995 300 576 302 852 299 154 299 421 302 156 302 679 311 217 295 821 Number of weighted shares in issue (’000)(7) 318 665 314 510 301 462 303 159 300 206 299 976 302 700 300 643 308 116 299 089 291 599
Exchange rate comparisonsRand/sterling Closing rate 10,97 11,53 13,02 15,89 14,18 13,20 11,96 11,29 12,46 15,91 11,34 Average rate 11,18 12,05 14,47 14,64 13,95 11,44 11,53 11,94 14,29 14,54 11,01 Rand/euro Closing rate 9,84 9,34 11,05 12,51 9,54 9,16 8,07 7,57 8,60 Average rate 9,56 10,60 12,35 10,76 9,41 7,82 7,89 8,19 9,40 Rand/Australian dollar Closing rate 7,25 6,56 6,34 7,66 6,01 5,31 5,09 4,32 5,03 5,26 4,10 Average rate 6,94 6,71 6,67 6,56 5,67 4,81 4,67 4,89 5,21 5,86 4,04
Notes(1) Based on growth from 1991 the first year of Bidvest in its current form.(2) Information for the periods 2000 to 2004 has not been restated on the adoption of IFRS in the 2005 year and is provided for information and comparative purposes only.(3) Based on weighted average number of shares in issue.(4) Includes interim distributions paid and final distributions approved after year-end. Distributions include capitalisation issues at market value, distributions of share premium
and dividends.(5) Market capitalisation is shown net of treasury shares. Total market capitalisation was R49,3 billion (2010: R42,7 billion).
(6) Return on average funds employed is calculated using the weighted average of the Group’s funds employed and trading profit.(7) The number of shares in issue has been adjusted for treasury shares.(8) Debt equity ratio is the net debt of the Group divided by shareholders’ interest.(9) Interest cover is the trading profit divided by net finance charges. (10) Return on shareholders’ interest is calculated by dividing attributable profit by the prior year’s shareholders’ interest.
Group financial history

17 THE BIDVEST GROUP LIMITED / ANNUAL INTEGRATED REPORT 2011
In accordance with IFRS In terms of previous GAAP(2)
20-year compound
growth rates % per annum(1)
10-year compound
growth rates % per annum 2011 2010 2009 2008 2007 2006 2005 2004 2003 2002 2001
Extracts from financial statements (R’m)Revenue 32,7 14,9 118 483 109 789 112 428 110 478 95 656 77 276 62 812 51 262 47 073 41 950 29 415 Trading profit 29,3 15,6 6 062 5 555 5 137 5 335 4 547 3 657 3 046 2 544 2 240 2 013 1 422 Net finance charges 644 758 1 029 931 566 342 285 169 111 80 –Attributable profit 30,6 13,1 3 539 3 345 2 802 3 253 2 700 2 389 1 961 1 532 1 335 1 231 1 035 Shareholders' interest 17 669 16 737 13 929 13 468 10 627 8 929 7 469 5 998 5 353 5 564 3 860 Total assets 28,4 17,2 47 830 43 345 38 484 41 861 32 848 27 995 21 123 18 021 14 592 15 117 9 742 Net debt 5 030 3 863 4 072 5 547 3 764 1 452 989 674 – – – Funds employed 16 779 15 213 13 924 14 503 10 658 7 456 6 093 5 345 4 577 4 577 3 178Cash generated by operations 34,1 18,0 8 187 7 984 6 749 6 087 4 237 4 490 4 200 3 761 2 667 2 752 1 559 Wealth created by trading operations 30,8 16,1 22 525 21 465 20 708 19 595 16 777 14 049 11 955 10 231 9 247 7 441 5 080 Employee benefits and remuneration 13 309 12 779 12 817 11 701 9 967 8 311 7 304 6 512 6 091 4 995 3 411
Share statisticsHeadline earnings per share (cents)(3) 21,0 12,2 1 157,4 1 070,0 930,0 1 068,0 970,0 804,6 656,4 544,0 463,5 432,8 365,2 Distribution per share (cents)(4) 20,5 11,0 480,0 432,0 380,0 495,0 446,4 369,0 306,0 250,2 220,0 190,0 169,2 Distribution cover (times)(4) 2,4 2,5 2,4 2,2 2,2 2,2 2,1 2,2 2,1 2,3 2,2 Distribution yield (%) 3,2 3,5 3,9 5,0 3,2 3,7 4,2 4,8 5,1 4,1 3,4 Earnings yield (%) 7,7 8,8 9,6 10,9 6,9 8,1 9,0 10,4 10,8 9,4 7,3 Net tangible asset value per share (cents) 18,7 11,2 3 444 3 253 3 098 2 803 2 135 1 814 1 542 1 330 1 549 1 569 1 186 Share price (cents) high 16 100 14 664 11 808 15 100 14 780 11 650 8 100 5 620 4 800 5 200 5 200 low 12 000 9 250 7 750 9 400 9 430 7 200 5 195 4 100 3 970 3 980 4 075 closing (June 30) 22,0 11,6 15 050 12 189 9 674 9 838 14 123 9 875 7 270 5 250 4 300 4 600 5 010 Net market capitalisation (R’m)(5) 29,3 12,1 46 508 38 884 29 505 29 571 42 772 29 541 21 768 16 570 13 462 14 316 14 821
Volumes traded (’000) 232 095 285 279 243 051 265 157 233 306 206 156 166 720 160 233 156 731 125 566 99 096 Volumes traded as % of weighted number of shares 72,8 90,7 80,6 87,5 77,7 68,7 55,1 53,3 50,9 42,0 34,0
Ratios and statisticsReturn on total shareholders’ interest (%)(10) 21,1 24,0 20,8 30,6 30,2 32,0 0,0 28,6 24,0 31,9 34,2 Return on average funds employed (%)(6) 37,9 38,7 36,4 48,6 50,2 54,0 53,5 53,6 48,9 56,8 43,6 Trading profit margin (%) 5,1 5,1 4,6 4,8 4,8 4,7 4,8 5,0 4,8 4,8 4,8 Interest cover(9) 9,4 7,4 5,0 5,7 8,0 10,7 10,7 15,1 20,2 25,1 3 637,4 Debt equity ratio (%)(8) 28,5 23,1 29,2 41,2 35,4 16,3 13,2 11,2 – – – Current asset ratio 1,1 1,1 1,1 1,1 1,1 1,1 1,1 1,1 1,3 1,2 1,2 Quick asset ratio 0,7 0,7 0,7 0,7 0,7 0,8 0,7 0,8 1,0 0,9 0,9 Number of employees 105 057 105 752 103 449 106 225 104 184 93 325 89 737 81 931 70 754 66 879 54 251 Revenue per employee (R’000) 1 127,7 1 038,2 1 086,8 1 040,0 918,1 828,0 700,0 625,7 665,3 627,3 542,2 Value added per employee (R’000) 214,4 203,0 200,2 184,5 161,0 150,5 133,2 124,9 130,7 111,3 93,6 Number of shares in issue (’000)(7) 309 021 319 006 304 995 300 576 302 852 299 154 299 421 302 156 302 679 311 217 295 821 Number of weighted shares in issue (’000)(7) 318 665 314 510 301 462 303 159 300 206 299 976 302 700 300 643 308 116 299 089 291 599
Exchange rate comparisonsRand/sterling Closing rate 10,97 11,53 13,02 15,89 14,18 13,20 11,96 11,29 12,46 15,91 11,34 Average rate 11,18 12,05 14,47 14,64 13,95 11,44 11,53 11,94 14,29 14,54 11,01 Rand/euro Closing rate 9,84 9,34 11,05 12,51 9,54 9,16 8,07 7,57 8,60 Average rate 9,56 10,60 12,35 10,76 9,41 7,82 7,89 8,19 9,40 Rand/Australian dollar Closing rate 7,25 6,56 6,34 7,66 6,01 5,31 5,09 4,32 5,03 5,26 4,10 Average rate 6,94 6,71 6,67 6,56 5,67 4,81 4,67 4,89 5,21 5,86 4,04
Notes(1) Based on growth from 1991 the first year of Bidvest in its current form.(2) Information for the periods 2000 to 2004 has not been restated on the adoption of IFRS in the 2005 year and is provided for information and comparative purposes only.(3) Based on weighted average number of shares in issue.(4) Includes interim distributions paid and final distributions approved after year-end. Distributions include capitalisation issues at market value, distributions of share premium
and dividends.(5) Market capitalisation is shown net of treasury shares. Total market capitalisation was R49,3 billion (2010: R42,7 billion).
(6) Return on average funds employed is calculated using the weighted average of the Group’s funds employed and trading profit.(7) The number of shares in issue has been adjusted for treasury shares.(8) Debt equity ratio is the net debt of the Group divided by shareholders’ interest.(9) Interest cover is the trading profit divided by net finance charges. (10) Return on shareholders’ interest is calculated by dividing attributable profit by the prior year’s shareholders’ interest.
GROUP OVERVIEW

PASSION/VITALITY/PRECISION
18
Directorate
Matamela Cyril Ramaphosa
Brian Joffe
Non-executive chairmanmatamela Cyril Ramaphosa (58)BProc Non-executive chairman, appointed July 6 2004.Executive chairman of Shanduka Group (Pty) Limited. Joint non-executive chairman of Mondi plc and non-executive chairman of MTN Group Limited and SASRIA Limited. Non-executive director of SAB Miller plc, Lonmin plc, Macsteel Global BV, Alexander Forbes Equity Holdings Limited and The Standard Bank Group Limited. Cyril is the past chairman of the Black Economic Empowerment Commission and has received several honorary doctorates.Board committee membership: nominations
Chief executiveBrian Joffe (64)CA(SA) Chief executive, appointed March 1 1989.Director of numerous Bidvest subsidiaries. Since founding Bid Corporation in 1988, Brian served as executive chairman until his appointment as chief executive in 2004. He has over 32 years of South African and international commercial experience. Brian was one of the Sunday Times’ top five businessmen in 1992 and is a past recipient of the Jewish Business Achiever of the Year award, was listed as one of the Top 100 Africans of the Year in the Africa Almanac in 2001, was voted South Africa’s Top Manager of the Year in 2002 in the Corporate Research Foundation’s publication “South Africa’s Leading Managers”, represented South Africa at the coveted “Ernst & Young World Entrepreneur of the Year” award in 2003, voted the Sunday Times’ Businessman of the Year in 2007, awarded an honorary doctorate in May 2008 by Unisa and selected in 2010 by Wits Business School Journal as one of South Africa’s top 25 business leaders, having made a significant impact on business in South Africa over the last five years.Board committee membership: risk and sustainability, acquisition, nominations and transformation
Lindsay Peter RalphsDavid Edward Cleasby
Bernard Larry Berson
Executive directors
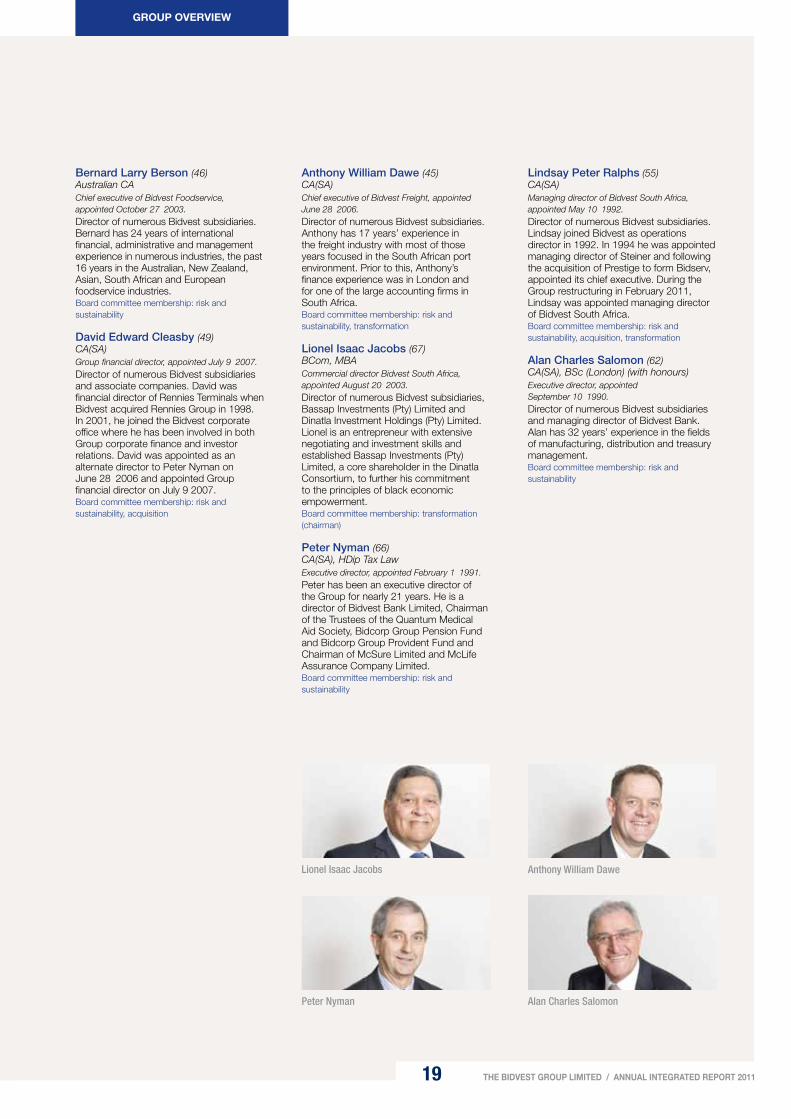
19
GROUP OVERVIEW
THE BIDVEST GROUP LIMITED / ANNUAL INTEGRATED REPORT 2011
Bernard Larry Berson (46) Australian CAChief executive of Bidvest Foodservice, appointed October 27 2003. Director of numerous Bidvest subsidiaries. Bernard has 24 years of international financial, administrative and management experience in numerous industries, the past 16 years in the Australian, New Zealand, Asian, South African and European foodservice industries.Board committee membership: risk and sustainability
David Edward Cleasby (49) CA(SA) Group financial director, appointed July 9 2007. Director of numerous Bidvest subsidiaries and associate companies. David was financial director of Rennies Terminals when Bidvest acquired Rennies Group in 1998. In 2001, he joined the Bidvest corporate office where he has been involved in both Group corporate finance and investor relations. David was appointed as an alternate director to Peter Nyman on June 28 2006 and appointed Group financial director on July 9 2007.Board committee membership: risk and sustainability, acquisition
Anthony William Dawe (45)CA(SA)Chief executive of Bidvest Freight, appointed June 28 2006.Director of numerous Bidvest subsidiaries. Anthony has 17 years’ experience in the freight industry with most of those years focused in the South African port environment. Prior to this, Anthony’s finance experience was in London and for one of the large accounting firms in South Africa.Board committee membership: risk and sustainability, transformation
Lionel Isaac Jacobs (67)BCom, MBACommercial director Bidvest South Africa, appointed August 20 2003.Director of numerous Bidvest subsidiaries, Bassap Investments (Pty) Limited and Dinatla Investment Holdings (Pty) Limited. Lionel is an entrepreneur with extensive negotiating and investment skills and established Bassap Investments (Pty) Limited, a core shareholder in the Dinatla Consortium, to further his commitment to the principles of black economic empowerment.Board committee membership: transformation (chairman)
Peter Nyman (66) CA(SA), HDip Tax Law Executive director, appointed February 1 1991.Peter has been an executive director of the Group for nearly 21 years. He is a director of Bidvest Bank Limited, Chairman of the Trustees of the Quantum Medical Aid Society, Bidcorp Group Pension Fund and Bidcorp Group Provident Fund and Chairman of McSure Limited and McLife Assurance Company Limited.Board committee membership: risk and sustainability
Lindsay Peter Ralphs (55)CA(SA) Managing director of Bidvest South Africa, appointed May 10 1992.Director of numerous Bidvest subsidiaries. Lindsay joined Bidvest as operations director in 1992. In 1994 he was appointed managing director of Steiner and following the acquisition of Prestige to form Bidserv, appointed its chief executive. During the Group restructuring in February 2011, Lindsay was appointed managing director of Bidvest South Africa.Board committee membership: risk and sustainability, acquisition, transformation
Alan Charles Salomon (62) CA(SA), BSc (London) (with honours) Executive director, appointed September 10 1990. Director of numerous Bidvest subsidiaries and managing director of Bidvest Bank. Alan has 32 years’ experience in the fields of manufacturing, distribution and treasury management.Board committee membership: risk and sustainability
Alan Charles Salomon
Anthony William Dawe
Peter Nyman
Lionel Isaac Jacobs

PASSION/VITALITY/PRECISION
20
Directorate
Frederick John Barnes
Alfred Anthony da Costa
Non-executive directors Rachel mathabo Kunene (71) BA (English Lit) (UCLA) Appointed December 8 2003. Director of PMB Petroleum Services (Pty) Limited, Dinatla Investment Holdings (Pty) Limited, Ikhwezi Lomso Laundries (Pty) Limited and Ilembe Airport Construction Services (Pty) Limited (King Shaka Airport). Managing Trustee of Mazisi Kunene Foundation Trust. Mathabo is the founder and chief executive officer of Nandi Heritage (Pty) Limited and president of Kunene Manuscript Museum (Durban South Africa).
Tania Slabbert (44) BA, MBA Appointed December 8 2003. Non-executive director of BP South Africa (Pty) Limited, Discovery Holdings (Pty) Limited, Dinatla Investment Holdings (Pty) Limited and the Business Women’s Association. Since 2001, Tania has been the chief executive officer of WDB Investment Holdings (Pty) Limited, a company that funds the small businesses of over 47 000 rural female entrepreneurs across South Africa. Board committee membership: nominations, transformation
Alfred Anthony da Costa (46) BCom (Hons)Appointed December 8 2003. Director of the IQUAD Group Limited, chairman of the boards of RGT Smart Limited, Dinatla Investment Holdings (Pty) Limited and Bidvest Wits University Football Club (Pty) Limited. Alfred is chief executive officer of Ukuvula Investment Holdings (Pty) Limited, council member of the University of South Africa and past president of the Nelson Mandela Bay Business Chamber and is also a trustee of the Bidvest Dinatla Trust. He is a director of various subsidiary and associate companies of the Ukuvula group. Alfred has 21 years’ experience in top management.
Frederick John Barnes (60) BritishThe previous chief executive of Bidvest Europe and 3663 First for Foodservice. Fred has extensive international foodservice and distribution experience.
Rachel Mathabo Kunene
Tania Slabbert

21 THE BIDVEST GROUP LIMITED / ANNUAL INTEGRATED REPORT 2011
Independent non-executive directorsDouglas Denoon Balharrie Band (67)BCom, CA(SA) Appointed October 27 2003. Non-executive director of The Standard Bank Group Limited and MIH Holdings Limited. Doug has extensive experience in both commerce and industry and has served in an executive position in various blue-chip listed companies. Board committee membership: Chairman of the remuneration, acquisition and nominations committees
Lilian Garner Boyle (64)BritishMA, Econ (Glasgow), MBA
Non-executive director, appointed January 23 2001. Non-executive chairperson of South African Express Airways. Lilian has 42 years of diverse business experience including seven years in the freight management industry and 21 years in the travel industry.
muriel Betty Nicolle Dube (38)BA (Hons), MSc (Oxon), Finance Executive Programme (SAID, Oxford), Executive Programme (Harvard).Appointed October 27 2003. Muriel has senior strategic management and operational experience in the public sector and with multi-nationals in the private sector. Muriel is currently with Investec in London and is responsible for originating and structuring financing transactions and for originating other value generating opportunities for the Bank in emerging markets.
Stephen Koseff (60) BCom, CA(SA), HDip BDP, MBAAppointed June 17 1997. Chief executive officer of Investec Limited and Investec plc. Stephen has 35 years of financial experience and is the recipient of numerous business awards. He is a former member of the Financial Markets Advisory Board and former chairman of the Independent Banks Association. He is the current chairman of the Banking Association. His directorships include Rensburg Sheppards plc.
Nkateko Peter mageza (56)ACCA (UK) Appointed August 28 2009. Former group chief operations officer and executive director of Absa Group Limited. Peter started his career within the audit environment at Coopers & Lybrand and worked as an audit manager within Transnet Limited’s group internal audit services. He became chief executive officer of Autonet in 1995, the road passenger and freight logistics division of Transnet. Peter is a director of Sappi Group Limited, MTN Group Limited, Rainbow Chicken Limited, Clover Industries Limited and Remgro Group Limited.Board committee membership: audit
Nigel George Payne (51)BCom (Hons), CA(SA), MBL Appointed June 28 2006. Director of a number of companies including the JSE Limited, Mr Price Limited and BSi Steel Limited and chairman of Bidvest Bank Limited. Nigel is a leading authority on corporate governance and risk management and is a member of the King Committee.Board committee membership: Chairman of the audit, risk and sustainability committees
Nkateko Peter Mageza
Nigel George Payne
Douglas Denoon Balharrie Band
Lilian Garner Boyle Stephen Koseff
Muriel Betty Nicolle Dube
GROUP OVERVIEW

PASSION/VITALITY/PRECISION
22
Directorate
Joseph Leon Pamensky
Donald Masson
Lebogang Joseph Mokoena
Adv Faith Dikeledi Pansy Tlakula
Independent non-executive directors continuedJoseph Leon Pamensky (81) CA(SA), OMSG Appointed January 8 1990. Director of Schindler Lifts (SA) (Pty) Limited, Worldwide African Investment Holdings (Pty) Limited, Stonehage Financial Services (Pty) Limited and Bidvest Bank Limited. Joe is the longest serving non-executive director of Bidvest with over 53 years’ experience in the financial, insurance and banking industries and the recipient of a number of business and public awards, including the highest civil award obtainable in South Africa. He serves as a non-executive director of companies and is a member of a number of audit and remuneration committees. Originally also a director of Bid Corporation Limited.Board committee membership: audit, remuneration, acquisition, nominations
Donald masson (80)ACISAppointed March 10 1992. Director of numerous Bidvest subsidiaries, Cashbuild Limited and Valley Irrigation Limited. Trustee of various pension funds. Donald is a former president of the Afrikaanse Handelsinstituut and a former member of the President’s Economic Advisory Council and chairman of the SA Post Office. He has 44 years of diverse business experience in senior executive positions at listed, unlisted and parastatal organisations.Board committee membership: audit, risk and sustainability, remuneration, acquisition
Adv Faith Dikeledi Pansy Tlakula (54)DTech (Legal Studies) Honoris Causu (VUT), BProc, LLB, LLM (Harvard) Appointed June 28 2006. Chief electoral officer of the Independent Electoral Commission. Director of Lehotsa Holdings (Pty) Limited, MMRT (Pty) Limited and Khomanani Women’s Investment (Pty) Limited, Chairperson of Board of the National Credit Regulator and Chancellor of the Vaal University of Technology. Pansy is a member of the African Commission on Human and Peoples Rights, part of the African Union, for which she is the Special Rapporteur on Freedom of Expression and Access to Information in Africa. Board committee membership: transformation
Alternate non-executive directorLebogang Joseph Mokoena (52) BSc (Med Sci), MBAAppointed as alternate to AA da Costa on December 8 2003. Non-executive director of Ten Alliance Holdings (Pty) Limited, Sesiu Investment Holdings (Pty) Limited, Bloemfontein Correctional Contracts (Pty) Limited, Culca Investments (Pty) Limited and Dinatla Investment Holdings (Pty) Limited. Currently Chairman of Bloemfontein Correctional Contracts (Pty) Limited. Lebogang has a number of years’ experience as a director of private companies. Over the years he provided management consultancy services to SMMEs, the public and private sectors. In recent years he devoted most of his time to investment management and strategy development.
ResignationsMyron Cyril Berzack resigned as a director of the company on September 7 2011.

23 THE BIDVEST GROUP LIMITED / ANNUAL INTEGRATED REPORT 2011
CommitteesAudit committeeNG Payne (chairman), NP Mageza, D Masson, JL Pamensky
Risk and sustainability committeeNG Payne (chairman), BL Berson, NW Birch, DE Cleasby,
AW Dawe, B Joffe, D Masson, P Nyman, LP Ralphs, AC Salomon,
CE Singer
Sustainability committee (subcommittee of the risk and sustainability committee)JA Davidson (chairman), H Angove, I Botha, DE Cleasby, L Coetzer,
K Cunningham, CA de Villiers, SA Duncalf, DL Gillfillan, HD Hunkin,
A Kotze, NT Madisa, NJ Mbongwa, MJ Nienaber, JM Russill,
RP Stanley, B Smith, SA Thwala, SW Walters
Board composition Number %
Male 17 77,3
Female 5 22,7
Total 22 100,0
White 15 68,2
Black• 7 31,8
Total 22 100,0
Local 20 90,9
Foreign based 2 9,1
Total 22 100,0
Executive 8 36,4
Non-executive 5 22,7
Independent non-executive 9 40,9
Total 22 100,0
•Indicates African, Indian and coloured in terms of the dti Codes
Remuneration committeeDDB Band (chairman), D Masson, JL Pamensky
Acquisition committeeDDB Band (chairman), DE Cleasby, B Joffe, D Masson,
JL Pamensky, LP Ralphs
Nominations committeeDDB Band (chairman), B Joffe, JL Pamensky, MC Ramaphosa,
T Slabbert
Social and ethics committee (formerly transformation committee)LI Jacobs (chairman), NW Birch, AW Dawe, MJ Finger, B Joffe,
GC McMahon, LP Ralphs, CE Singer, T Slabbert, SA Thwala,
FDP Tlakula
GROUP OVERVIEW

PASSION/VITALITY/PRECISION
24

GROUP OVERVIEW
25 THE BIDVEST GROUP LIMITED / ANNUAL INTEGRATED REPORT 2011
VITALITY
26 Chairman’s review
29 Strategy
30 Chief executive’s statement
36 Financial director’s review
40 Governance for a sustainable business
It takes great vitality to complete an annual cycle that covers continents, and spans generations, with each individual going through various stages to reach a common goal. It is all about growth, adaptation and commitment – qualities we at Bidvest understand well.

PASSION/VITALITY/PRECISION
26
Chairman’s statement
IntroductionRecovery strengthened in 2011 and so
did Bidvest. Our turnaround was
maintained thanks to the efforts of our
people, managers and business model.
As a result, distributions totalling
480,0 cents a share were made to
shareholders, an increase of 11,1%.
Dividends are not the only yardstick. Solid
performance also enables Bidvest to
maintain its record as a contributor to the
material wellbeing of families and
communities – a critical factor in an
increasingly uncertain world. In 2011, the
Group sustained 105 057 jobs.
ValuesSuccessful businesses are not only driven
by managers and workers, but values.
What you believe shapes what you do
and how you do it.
You will not find Bidvest values hanging
from an office wall. We display our values
by living them.
Bidvest believes in fair dealing and honest
effort. We believe that rewards have to be
earned; that people create profits while
businesses report them; that every
individual warrants respect and everyone
deserves a chance to grow. We empower
people and teams out of principle, not out
of policy considerations.
We also believe in being open about what
we do. We are straightforward and not
afraid to make ourselves accountable.
A core board responsibility is to ensure
these values are reflected in everything
we do. To this end, we have consistently
strengthened board structures and
reporting systems.
We have little difficulty adjusting to King III
requirements, which we accept. As an
entrepreneurial company, risk
appreciation and management have
always been core considerations. As a
Group committed to long-term growth,
business sustainability has always been
paramount. And as straightforward
people we have no difficulty applying
integrated, open reporting.
African solutionsLegislation to raise and enforce high
standards is necessary, but it is important
to challenge the assumption that offshore
jurisdictions have a monopoly when it
comes to defining quality. On occasion,
African solutions have to be developed
for African situations. A European or
American template cannot always be
applied to our market.
Highlights
Bidvest people power continued growth
Proudly Bidvest profile reinforced by South African restructure
Dinatla deal highlights strategic importance attached to empowerment
Training investment at record high of R253,2 million
Procurement with empowered suppliers tops R23,8 billion
Our solid performance also enables Bidvest to maintain its record as a contributor to the material wellbeing of families and communities – a critical factor in an increasingly uncertain world.

PERFORMANCE OVERVIEW
27 THE BIDVEST GROUP LIMITED / ANNUAL INTEGRATED REPORT 2011
For example, European building
standards demand costly features to
satisfy northern hemisphere standards of
insulation and climate control. These add
significantly to the cost of materials, the
complexity of construction and the speed
of building. Are these standards
necessary locally? Surely we have to set
our own priorities and deliver standards
appropriate to our circumstances.
In future, our legislators and regulators
should give increased attention to the
appropriateness of new standards to
ensure they speed up quality delivery
without imposing requirements that have
little local relevance.
TransformationWe are an international business, but
have never used this status as an excuse
for being tardy when it comes to the need
for transformation. The board’s social and
ethics committee (transformation
committee) ensures robust, proactive
engagement with the work of
empowerment.
Operations redoubled their B-BBEE efforts
in 2011, moving the Group from Level 4
status to Level 3. This means customers
can claim 110% of their expenditure with us
for the purposes of procurement scoring.
Heightened status creates a halo effect
for all our businesses. To their credit,
individual businesses are determined not
to hide behind the ‘halo’. They are all
striving to match or better the Group’s
overall ranking.
DinatlaThis habit of going further and faster than
generally expected is also apparent in the
Group’s Dinatla relationship. A R1,6 billion
share repurchase agreement finalised in
May allowed our empowerment partners
to realise value and repay funding
arrangements well ahead of settlement
date. Since 2003, when the relationship
was formed, Dinatla constituents have
realised real value of more than
R2,0 billion.
Once transformed always transformedThis latest transaction has moved the
need for the national debate that must
take place about ‘once empowered
always empowered’ to a more elevated
level – ‘once transformed always
transformed’.
Progress since 2003 makes it plain that
Bidvest is committed to ongoing
transformation and fully embraces the
broad-based empowerment model that
delivers benefits to all stakeholders.
Ongoing Dinatla participation is assured.
Empowerment and transformation are
100% entrenched (or 110% if scorecard
arithmetic is used).
Other figures underline the point. In 2011,
Bidvest’s training investment reached
R253,2 million (up from R252,5 million)
while we spent R23,8 billion with
empowered suppliers.
ChallengesThe importance of paying your own way
and honouring your commitments has
been spotlighted starkly by the unfolding
sovereign debt crisis. The need for
prudence – personal, commercial and
governmental – is clear.
Bidvest’s largely conservative attitude to
debt and the conduct of business stands
us in good stead and will continue.
Within South Africa, the issue of
corruption and the abuse of tenders for
personal enrichment are areas of growing
concern. Bidvest applauds government
plans to tighten up the tender system and
prevent transgressors doing business
with official departments for 10 years.
Cyril Ramaphosa Non-executive chairman
PASSION/VITALITY/PRECISION
28
Chairman’s statementAction is urgently needed. Once
corruption takes hold, the grip is hard to
shake. Aside from moral questions, the
challenges of doing business multiply,
costs soar and consumers find
themselves paying inflated prices for
inferior delivery. Our international standing
is also endangered and the task of
attracting long-term direct foreign
investment becomes that much harder.
RecognitionBidvest remains committed to best
practice in all it does and is content to be
measured by objective external
observers.
Happily, appraisals remain positive.
Our ability to report in a clear, open
fashion is also prized. Bidvest won
category honours in the last Investment
Analysts Society awards for corporate
reporting.
RestructureSustained growth demands broad,
robust structures and in 2011 Bidvest
responded by expanding its South African
operations into 10 focused divisions while
re-emphasising its commitment to
decentralised operations driven by highly
entrepreneurial teams.
Structural change was accompanied by
renewed growth of the Bidvest brand as
businesses within Bidvest South Africa
successfully leveraged the Group
connection.
Internationally, growth of brand Bidvest
continued; sometimes in the face of
mounting uncertainty.
FutureBidvest is a people-powered business.
In all markets, recovery has been less
buoyant than expected, yet our people
maximised local opportunities to achieve
continued growth.
The world remains an uncertain place.
European and US debt concerns will
persist for some time. In general, Bidvest
relies on a single ‘currency’ – our people.
In 2012 we will continue to place our trust
in the value created by our staff
members.
Despite continuing certainties, we believe
our people will achieve sustained growth
in all geographies.
Cyril Ramaphosa
Non-executive chairman
Ask Africa Trust Barometer 2010
The 2010 Ask Africa Trust Barometer
(in collaboration with Finweek
magazine) put Bidvest in the top
three in the category for ‘most
trusted company in entrepreneurial/
founder companies’. Bidvest was
seventh among the 375 measured
companies and first in the
‘industrials’ segment. My colleague
Brian Joffe was named South Africa’s
second most trusted chief executive.
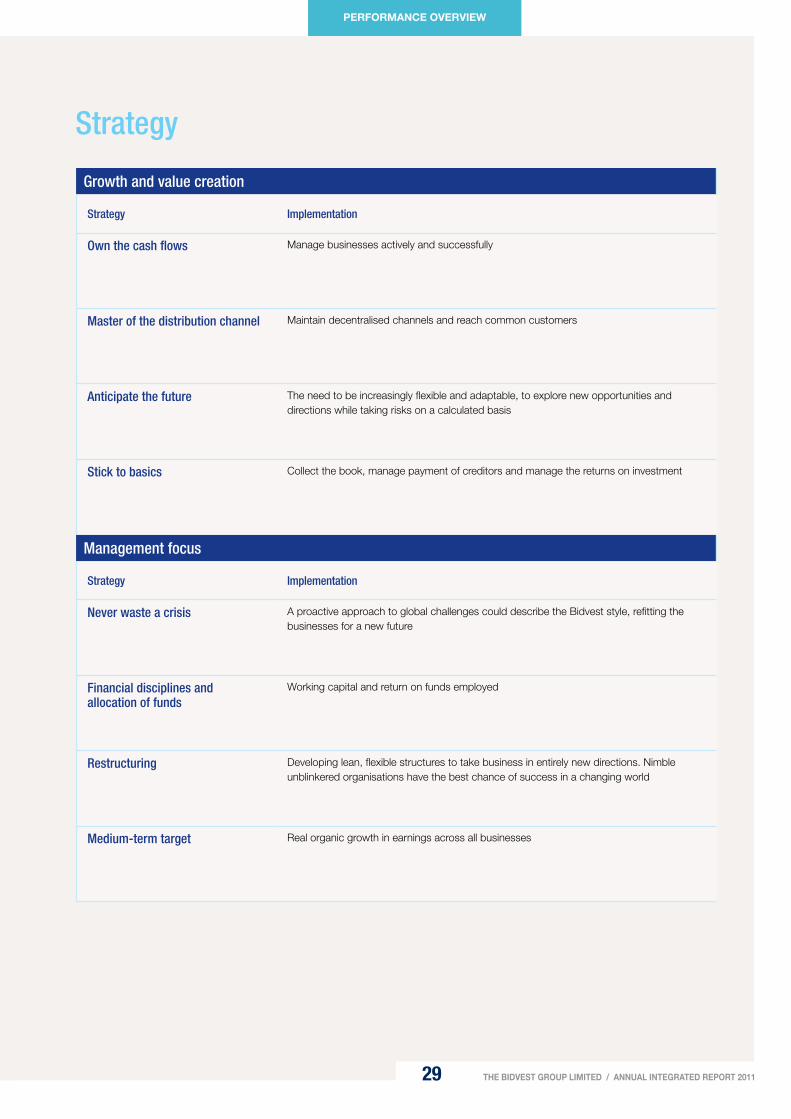
PERFORMANCE OVERVIEW
29 THE BIDVEST GROUP LIMITED / ANNUAL INTEGRATED REPORT 2011
Growth and value creation
Strategy Implementation
Own the cash flows Manage businesses actively and successfully
Master of the distribution channel Maintain decentralised channels and reach common customers
Anticipate the future The need to be increasingly flexible and adaptable, to explore new opportunities and directions while taking risks on a calculated basis
Stick to basics Collect the book, manage payment of creditors and manage the returns on investment
Management focus
Strategy Implementation
Never waste a crisis A proactive approach to global challenges could describe the Bidvest style, refitting the businesses for a new future
Financial disciplines and allocation of funds
Working capital and return on funds employed
Restructuring Developing lean, flexible structures to take business in entirely new directions. Nimble unblinkered organisations have the best chance of success in a changing world
Medium-term target Real organic growth in earnings across all businesses
Strategy
PASSION/VITALITY/PRECISION
30
Chief executive’s statement
Headline earnings per share (HEPS) increased by 8,2% to 1 157,4 cents after headline results were impacted by a R132,0 million increase in the tax charge as a result of Secondary Tax on Companies (STC) on the 2010 final and 2011 interim dividends. This charge, which did not apply in the prior year, reduced HEPS by 3,9%.
Currency fluctuations also had an impact on headline results. Rand strength versus sterling and the euro had a negative effect. The rand softened, however, against the Australian dollar. On the translation of our international earnings, the net effect was equivalent to a reduction of 1,3% in HEPS.
Basic earnings per share increased by 4,4% to 1 110,5 cents, impacted by the write-off of capital items and the STC. The most material impairment related to the cancellation of an IT project at 3663 Wholesale in the UK.
Business conditionsTrading conditions were challenging. Economic recovery was hesitant in Bidvest geographies, with the exception of Asia.
At the start of Bidvest’s financial year there was a general expectation that recovery would gradually gain traction. These hopes went largely unrealised as economic conditions in most markets tended to deteriorate in the fourth quarter, notably in South Africa.
In these circumstances, Bidvest businesses continued to maintain their strong focus on asset and cash-flow management. A concerted effort was made to minimise debtor delinquencies. Growth was largely a function of market-share gains in the face of intense competition.
The challenge for our people was to achieve success despite macro-
economic factors, rather than on the back of them.
Strategic reinventionBidvest maintained its long-term strategy of constantly reinventing the business. Following the successful realignment of our foodservice interests in the prior year, we developed new structures across our South African non-food businesses.
The new structures are designed for sustained growth in uncertain times and soon delivered significant benefits as our people showed their ability to manage change and their talent for reinvention.
Operational overviewBidvest’s entrepreneurial business model again demonstrated its fitness for purpose across international markets in which trading conditions could differ significantly.
Highlights
Resilient performance by Bidvest people
Headline earnings per share (HEPS) up 8,2% to 1 157,4 cents
Talent for reinvention reflected in continued growth in tough conditions
Reinvigorated Bidvest SA divisions positioned for sustainability and growth
Net R2,8 billion capital investment for the future
Bidvest put in a robust performance and achieved both organic and acquisitive growth, despite weak economic activity in a number of the geographic regions in which the Group operates.

PERFORMANCE OVERVIEW
31 THE BIDVEST GROUP LIMITED / ANNUAL INTEGRATED REPORT 2011
All territories across Asia Pacific made a positive contribution.
The region was affected by a series of natural disasters. But Bidvest people in all the affected markets demonstrated their resilience and ability to cope under pressure.
Floods in Australia had minimal effect on our business and highlighted the benefit of the strategic effort to build a robust national footprint. Strong countrywide representation enabled Bidvest Australia to maintain supply channels to all affected areas.
In New Zealand, earthquakes caused devastation, dislocation and substantial loss of life in Christchurch. Our people responded magnificently, supporting local community initiatives while maintaining strong business momentum. The financial result was impressive; so was the community commitment.
The economies of mainland China, Hong Kong and Singapore remained strong and our local teams optimised the resulting opportunities.
In the UK, economic conditions remained difficult as government austerity measures began to take effect. 3663 Wholesale has adopted a back-to-basics strategy that is well suited to an environment characterised
by low levels of confidence and spending. Opportunities for acquisitive growth were not neglected, however.
Most of mainland Europe also experienced low or no growth. The exception was Poland, where our operations maintained good momentum.
Business conditions were also difficult in the Middle East.
The sale of 13,5% of the equity of Mumbai International Airport for a profit of between R300,0 million and R400,0 million was not timeously completed as certain formalities remain outstanding. No accrual has been made for profit in the results.
Trading conditions in South Africa showed some improvement, though challenges intensified as the year drew to a close. Businesses in many sectors were challenged to replace 2010 volumes that were briefly buoyed by World-Cup effects.
Corporate spending has begun to revive, albeit slowly and discretionary consumer spending remained under pressure, though automotive retailing continued to show growth.
Activity levels were weak across businesses exposed to the infrastructure, construction and
hospitality sectors. Many consumer-facing businesses and those exposed to the construction industry experienced difficulties, resulting in branch consolidation and stringent expense management.
However, Bidvest continued to invest in infrastructure to ensure medium-term growth and sustainability.
In Namibia, the slow economic upturn created trading challenges, though the continued recovery of fishing resources was highly positive.
Bidvest PropertiesThe property sales and rental industry is experiencing increasing pressure, both nationally and internationally, as standards are continually raised and laws tightened. Rentals have remained fairly static over the last two years owing to an oversupply which was compounded by the economic downturn. Energy costs look set to rise worldwide with carbon taxes imminent. All these factors create an incentive for greener approaches to building in the form of energy-efficient lighting and air conditioning, in addition to the environmental justifications.
High basic rental and property rates coupled with the requirements of standards for green building, fire safety, employee health and safety and the
Brian Joffe Chief executive
PASSION/VITALITY/PRECISION
32
Chief executive’s statementenvironment are becoming increasingly demanding in South Africa, making it more complicated to deliver affordable developments. This creates consequential demands on our capital development programme into the future.
AcquisitionTough times produce acquisition opportunities and every Bidvest operation remained alert for them. Both strategic and bolt-on acquisitions took place.
In the UK, the acquisition of Seafood Holdings complements existing operations and creates a new area of growth. In addition, a hospitality wholesaler was acquired by Deli XL in Belgium.
I welcome the Seafood team and all the other newcomers to Bidvest. You join us in interesting times and I look forward to your contribution.
ReinventionBidvest does not engage in stop-start strategic change. We continually reassess and reinvent.
Realignments within our foodservice businesses were well advanced at the start of Bidvest’s 2011 year. In the third quarter, a fundamental realignment of non-food businesses within South Africa was carried out.
Ten focused divisions were created under the Bidvest South Africa banner. Areas of activity were defined and reinvigorated teams were given the task of seeking renewed growth in areas of core competence.
Structural change is not accompanied by changes in business philosophy.
Reinvention across both our food and non-food businesses has largely been driven by rededication to core elements of the strategy that has shaped Bidvest since inception.
Our strategy, as before, is to invest in diversified trading, distribution and
services businesses, with limited involvement in light manufacturing. A decentralised business model is retained while growth is entrusted to autonomous teams that are close to local markets and opportunities.
The strategic goal, in the main, remains 100% ownership of businesses, ensuring full control of cash flows. This enables further investment in acquisitions and infrastructure with the aim of achieving leadership in chosen areas of activity.
We empower and incentivise our managers and people to encourage personal growth along with business growth. In this process, returns on funds employed and profitability are the key benchmarks as we prefer sustained development to a one-off ‘win’.
We continue to prefer simplicity to complexity and build businesses by disciplined application of the basics. This includes the prudent use of debt.
This approach is well understood by Bidvest people. They have implemented new structures at pace without dislocation and I congratulate them on their success.
Internal strengthStaff numbers Group-wide remained relatively stable at 105 057.
A characteristic common to both the Bidvest Foodservice and Bidvest South Africa realignments is recourse to internal talent. Bidvest directors, managers and staff developed Proudly Bidvest solutions that enjoyed general buy-in from the outset.
Expansion into 10 South African divisions was achieved with only one exception from outside the ranks of Bidvest people. This is an important signal to all staff members, not only managers and supervisors. Their development into senior positions is a strategic priority. As Bidvest grows, they can grow with it.
Bidvest has never neglected succession planning and talent identification. The
proof came through strongly in our recent acts of reinvention.
We are very disappointed at this year’s increase in fatalities and have expressed our condolances to the families concerned. Enquiries into the causes of these fatalities have been conducted.
Building for the futureChange at Bidvest reflects a changing world. We are putting building blocks in place which will support continued, long-term growth. We are entering a period in which businesses will not be able to rely on favourable economic conditions to drive future growth. The primary drivers will be innovation and the competitive advantage created by resourceful teams that respond rapidly to changing demands.
In a challenging business climate, staying lean and nimble is a prerequisite for staying successful.
Bidvest is dedicated to sustained growth. In our view, adverse economic factors can never become a justification for poor results. They may prompt reassessments and foster new initiatives; they do not enforce a standstill.
If underlying conditions in some areas of activity will not support continued growth, it is up to our managers to identify the dead-end, avoid it and move the business in a new direction.
Happily, I can report that our managers and their teams successfully applied these principles to reduce costs, improve asset utilisation and achieve overall growth.
Dinatla transactionBidvest strengthened its cash position even after committing R1,6 billion to repurchase 12 million shares from our Dinatla empowerment partners. The arrangement has enabled Dinatla consortium members to repay their total bank loans well ahead of settlement date in March 2012.

PERFORMANCE OVERVIEW
33 THE BIDVEST GROUP LIMITED / ANNUAL INTEGRATED REPORT 2011
Our relationship with Dinatla began in 2003 when Bidvest shareholders gave up a net 27 million shares at a value of R60 per share for a total consideration of R1,6 billion – a farsighted decision that has enabled Bidvest to entrench its position within South African communities while supporting long-term sustainability through broad-based empowerment.
In the last eight years, it is estimated that real value in excess of R2 billion has been delivered to Dinatla stakeholders, a considerable transfer of wealth. Benefits, however, extend beyond accounting calculations. Lives and communities have been transformed as well.
More than 40 000 small businesses and micro-enterprises are supported by Dinatla consortium members. On average, each entrepreneur supports an immediate family of four members, which means 160 000 broad-based beneficiaries are assisted in communities across South Africa.
We take pride in this achievement and in the growing impact of our corporate social responsibility initiatives.
In 2011, corporate social investment across the Group amounted to R59,3 million, up from R47,2 million, while our enterprise development contribution rose from R51,9 million to R118,8 million.
Broad-based empowerment remains a key strategic objective of our South African businesses. The Group attained Level 3 B-BBEE status in the first half, laying the groundwork for further transformation gains.
Development of black managers at senior level remains a challenge. As this problem is experienced by many businesses, a common approach will be investigated, allowing all operations to share experience and ideas.
New world, old valuesOur businesses work in a new world where established economic powers are fading and new economic powers are emerging fast. It may be a new world, but it is one in which the old values of
prudence, hard work and living within one’s means have been rediscovered.
In this changing world, South Africa is positioned as the Gateway to Africa, a continent with huge growth potential, not only thanks to its commodities, but because of the growth in sub-Saharan consumer markets. Africa now has a population of more than one billion, supporting growth in many service categories.
South Africa remains Africa’s largest economy and its importance was underlined by recent membership to the BRICS bloc of Brazil, Russia, India and China. Within this new club of emerging nations we should acknowledge that South Africa has the smallest economy, lowest population and most modest rate of economic growth. South Africa also has serious rivals for African leadership.
A recent African Economic Outlook report by the African Development Bank put South Africa among the continent’s 10 slowest growing economies while highlighting Nigeria’s position among the top 10.
South Africa’s main natural assets – platinum, gold and coal – will be depleted over time. If South Africa really is serious about its status as an emerging economic power, it has to develop a sustainable asset that adds enduring value. This means developing South Africa’s people through an effective system of education.
Bidvest AcademySince 2003, 550 graduates have benefited from Academy exposure. As the business landscape has undergone radical change it was decided to institute a comprehensive review of course content and the Academy’s overall structure. Divisional heads are being consulted about the needs of their businesses as the first step in the development of a new curriculum.
Education the building blockAs a business with a growing base in Asia Pacific, we know that this region’s economic success is underpinned by the
spirit of innovation and the unremitting effort of an extremely well-educated population. Commitment to education is total across Asia, not just by governments but by families and the children themselves.
In contrast, education in South Africa is in crisis. The ill-fated experiment with outcomes-based education was scrapped early in our 2011 financial year to be replaced by a new approach, Schooling 2025.
Hopefully, this approach marks the beginning of significant improvement in educational standards. Improvement is long overdue. For years, pass marks have moved lower while pass rates have fallen. There is now a danger that a ‘pass’ at school simply passes on the job of education to an employer.
Bidvest’s South African businesses continue to invest large sums in training, not only to develop skills but to fill fundamental gaps in the state education of our staff members.
Investment in adult basic education and training (Abet) for our staff was absolutely vital to address the damage to our young people inflicted by apartheid-era education. The Abet effort continues and in many cases is being stepped up.
The need should be falling away. Unfortunately, the need persists because of continuing problems within the state education system.
Bidvest will continue to invest in the development of our people. Our companies will continue to make educational projects a priority in their social investment initiatives.
At the same time, South Africa’s public education system has to fulfil its mandate and give young people the start in life they deserve. At the moment, substantial investment goes into state education, but poor results come out. This situation cannot continue if South Africa hopes to succeed as a nation. Excuses don’t build businesses and they don’t build nations.

PASSION/VITALITY/PRECISION
34
Chief executive’s statementThe education system must do better and the time to start is now.
Nationalisation debateDebate on nationalisation has been reignited in South Africa. These discussions give the business community an opportunity to communicate its view on the role of government and how best to realise national potential.
In my opinion, government has an absolutely vital role in the economy, but as an investor in infrastructure rather than as a participant for profit.
Government can make a telling contribution as a provider of capital for major projects that are unlikely to attract private sector investment, at least at the outset.
The creation of major items of national infrastructure costs billions. To obtain a return takes years. Very few commercial enterprises have the necessary resources for such projects. Therefore, government has to give a lead, make the necessary investment and build these assets.
Once infrastructure is in place, government has fulfilled its primary role by creating strategic assets or laying the groundwork for the development of new industries.
The challenge then becomes how best to optimise economic opportunities and create jobs.
After state capital has been committed and viability assured, it is in the interest of government to encourage private sector participation by limiting its own role. Government should be a partner of business, not a competitor.
Business should be encouraged to create profits and jobs, thereby driving sustained economic growth while adding to government’s tax income. This then enables the state to make further investment in national infrastructure, schools, hospitals and social services.
At the moment, South Africa’s nationalisation debate focuses solely on the nationalisation of assets in private hands. Presumably, it is assumed government will make better returns, create more jobs and manage these assets better than the current owners. There is scant evidence of this, in South Africa or elsewhere.
In contrast, there is strong evidence that governments which intervene to build and maintain modern infrastructure create the wherewithal for sustained economic growth. Ground-up ‘nationalisation’ on this model has much to be said for it.
Regulatory rigourA raft of new legislation affecting business in South Africa also creates an opportunity for the business community to express a view on the role of regulation in an emerging market.
I, for one, believe in the need to modernise our laws and make them fit for purpose in a dynamic environment where markets, technologies and customer needs are changing rapidly.
We have recently witnessed the phased roll-out of various elements of the Consumer Protection Act, the introduction of a new Companies Act (with new tests of solvency and liquidity among other material changes), along with new corporate governance requirements embodied in King III, the proclamation of the Second Hand Goods Act, the enactment (without implementation so far) of the Competition Law Amendment, the formulation of the Protection of Personal Information Bill and amendments to the Income Tax Act.
Measures to protect the public and prevent abuse are obviously necessary. Conditions change; so must laws. But provisions have to be simple and easy to implement without adding unduly to the cost of doing business.
Corruption concernFraudulent and corrupt practices are cause for growing concern. Individual acts of bribery are bad enough, but the cancer becomes worse once a climate of corruption is created or perceived. Leaders – in business and elsewhere – have a duty to head off this danger by taking a stand and making it clear that corrupt practices will not be tolerated.
Bidvest applauds the introduction of new South African regulations to ensure better control of government procurement processes while promoting greater transparency and accountability. However, the test is not how well these anti-fraud measures are drafted but how well they are applied. Good intentions have to be supported by effective implementation.
Our approach to responsible businessAt Bidvest, the way we behave is a way of life rather than a set of rules. This report and its predecessors show, through our reporting, that our business is founded on honesty, integrity, accountability and transparency.
While we have taken a fresh approach to the identification and management of risk, we maintain that our most fundamental risk-management mechanism is the multi-faceted and geographically diverse Bidvest business model. We make entrepreneurial managers accountable for all aspects of performance and delivery.
Our ‘living the values’ approach has also anticipated King III, which encourages companies to incorporate an understanding of all stakeholder issues, both risks and opportunities, into their strategic thinking as well as reporting. Individual business and divisional reports, both in this report and on the web, illustrate how we incorporate all facets of sustainability thinking into the way we deal with our customers, employees, suppliers and broader society.

PERFORMANCE OVERVIEW
35 THE BIDVEST GROUP LIMITED / ANNUAL INTEGRATED REPORT 2011
We are heartened by outside confirmation that our foodservice assets are highly regarded. The decision not to sell in no way diminishes their value. Our strategic position remains that a de-merger of a significant part of Bidvest’s assets should not take place at the expense of critical mass and financial strength.
The strategic benefits that are likely to flow from Bidvest’s current structure outweigh any short-term cash considerations.
FutureIn effect, the strategic review at board level created a blueprint for the Bidvest future.
Our business model has been closely scrutinised and endorsed as a robust vehicle that will enable the Group to build further value by the continued pursuit of both organic and acquisitive growth.
We see potential for substantial growth in the long-term value of our foodservice assets and this opportunity will be strongly pursued, notwithstanding current trading challenges.
Acquisition targets have already been identified. We have signed memoranda of understanding to buy foodservice businesses in Egypt, the Baltic States and Chile – the first time the Group has sought entry to the South American market.
These are exciting developments and underline our confidence in the ability of our people to deliver future growth, even in weak markets.
We are similarly upbeat about prospects in non-food sectors. Reinvigoration of our South African businesses sets the scene for continued improvement. Business conditions in South Africa became increasingly challenging in the fourth quarter and may remain difficult for the immediate future. However, Bidvest businesses have a remarkable record for achieving their objectives in the face of difficult conditions.
AppreciationOur growth is driven by our customers. Whatever the market or geography, our customers are the reason we are in business. I thank you for making use of our products and services and pledge that we will do all in our power to justify your faith in Bidvest.
I also extend our thanks to our suppliers. We build momentum by building relationships. The support of our suppliers is greatly appreciated and we look forward to extending and broadening the relationships that underpin our growth.
The people of Bidvest showed their worth yet again. If financial results are the only yardstick for assessing performance, 2011 was merely an average Bidvest year. In fact, performance was pleasing in difficult conditions and the most pleasing factor of all was the effort put in by our people. We’re all Proudly Bidvest and I am especially proud of our people. At board level, I benefit from the knowledge and support of a resourceful group of executive and non-executive directors. Your advice, experience and insights are invaluable. I thank you all for your unstinting efforts in a challenging environment.
Unsolicited proposalsAs a result of the unsolicited proposals relating to our foodservice interests made by external parties, we informed shareholders and issued a cautionary announcement a week after the close of our 2011 year, stressing the need for care in any dealings in Bidvest shares.
A board sub-committee was appointed to consider whether value could be optimised for our shareholders by any sale. Simultaneously, the sub-committee conducted a strategic review of our foodservice businesses.
In August, we removed the cautionary statement and announced that the unsolicited proposals had been turned down by the board.
In the UK and across Europe, economic conditions are also difficult. Growth projections have recently been revised downwards. Business and consumer confidence has been severely dented and may take some time to recover. Our nimble, entrepreneurial teams will continue to seek growth, however.
While re-aligning our structures we were careful to maintain our investment in infrastructure and our people. We increased net capital expenditure on property, plant and equipment and intangibles from R2,5 billion to R2,8 billion – a significant investment in Bidvest’s future.
Our 2012 objective is to maintain momentum and secure continued growth in market share, revenue and trading profit.
Brian Joffe Chief executive
BusinessWeek top company
ranking
Bidvest was ranked 37th on
BusinessWeek’s list of the world’s
top 40 companies, one of only three
South African companies to feature
on the list. The global rankings were
published by management consulting
firm AT Kearney and BusinessWeek.
IAS awards
Bidvest won the Investment Analysts
Society award for 2010/2011 in the
consumer services category.
Forbes Global 2000 – the world’s
2 000 largest public companies
Forbes Global 2000 is a list of the
world’s largest and most influential
companies in terms of US dollars
based on a composite ranking which
includes sales, market value, assets
and profits. Bidvest is currently
ranked 969th.

PASSION/VITALITY/PRECISION
36
Financial director’s review
Macro-conditionsIn the geographies in which Bidvest is
active, interest rates remained relatively
stable, but many other variables did not.
Trading conditions were uncertain and
business confidence brittle while
economic recovery tended to be slow.
Concerns over the US economy and
European sovereign debt added to
general nervousness.
The rand remained stable while capital
markets continued to offer reasonable
value. The switch from deflation to
inflation was apparent in several markets.
Trading environment Trading conditions were extremely
challenging in the UK and western Europe
as a result of austerity measures and low
business and consumer confidence. In
central Europe conditions were mixed.
Australia’s underlying economy remains
robust, despite challenges early in the
calendar year. New Zealand’s gross
domestic product (GDP) growth
strengthened but remained modest.
Singapore’s economy stalled in the
fourth quarter, reversing previous strong
gains. Chinese growth remained strong.
South Africa’s recovery continued, though
consumers remained under pressure and
performance across industry sectors was
mixed. A softening of conditions became
apparent in the fourth quarter of our
financial year.
During the second half, our South African
non-food businesses were restructured
into 10 focused divisions. The smaller,
more focused divisions are well
positioned for the future.
Markets remained highly competitive.
Our businesses imposed stringent credit
management discipline. As a result, fewer
additional bad debt problems were
experienced. However, intense focus on
the creditworthiness of customers remains
a priority. Overall working capital
management remained a focus area.
Financial performance and cash generationRevenue grew 7,9% to R118,5 billion
(2010: R109,8 billion), driven mainly by
the improved cargo flows in Safcor
Panalpina and higher new vehicle sales
revenues in Bidvest Automotive. Gross
margin was largely maintained. Operating
expenses were well controlled across the
Group, increasing by 5,9%.
Trading profit of R6,1 billion (2010:
R5,6 billion) was up 9,1%. Overall trading
margin improved slightly to 5,12% (2010:
5,06%). Trading profit for the first half
grew at 8,0%, which accelerated in the
second half despite the slowdown
experienced in the fourth quarter. Net
finance charges fell by 15,1% to
R644,0 million.
Highlights
Revenue rises 7,9% to R118,5 billion
Trading profit up 9,1% to R6,1 billion
Headline earnings per share increase 8,2% to 1 157,4 cents
Cash from operations improves 6,6% to R7,8 billion
Balance sheet remains strong
Net finance charges fall 15,1% to R644,0 million
Net debt rises to R5,0 billion on the back of R1,6 billion share buy-back
Interest cover improves
Acquisitive growth continues
The Bidvest balance sheet remains strong and is appropriately capitalised.

PERFORMANCE OVERVIEW
37 THE BIDVEST GROUP LIMITED / ANNUAL INTEGRATED REPORT 2011
Further restructure of Bidvest
Automotive’s dealer network was
completed during the year. These costs
were fully expensed in the 2011 year.
Internationally, the continued rightsizing of
operations at our UK foodservice
businesses necessitated the impairment
of certain assets. In addition, capitalised
software costs in relation to an IT project
were impaired following a decision to
discontinue the project. This impairment
totalled £13,3 million.
The Bidvest balance sheet remains strong
and is appropriately capitalised.
Net debt increased to R5,0 billion (2010:
R3,9 billion), impacted principally by the
R1,6 billion of cash utilised to implement
the share buy-back from Dinatla in May
2011. Ongoing utilisation of the short end
of the funding market in South Africa’s
stable interest rate environment was
beneficial.
Debt to equity climbed to 29% (2010:
23%) as a result of the Dinatla share
buy-back. The overall debt to equity
target remains at 40%. However, this is
not reflective of debt capacity across the
Group. Interest cover, a truer measure of
funding capacity for the Group, improved
markedly – up to 9,4 times versus
7,4 times in 2010.
Our businesses remained strongly cash
generative, reflecting intense focus on
expense management and volume
growth driven by market-share gains.
Cash generated by operations before
working capital changes improved by
6,6% to R7,8 billion.
Working capital generation of R0,4 billion
was encouraging, showing the value of
ongoing focus on asset management.
Over the past two years, approximately
R1,1 billion has been generated through
reduced working capital requirements.
Net capital expenditure on property, plant
and equipment and intangibles of
R2,8 billion (2010: R2,5 billion) included
significant investment into asset-based
leasing and terminal assets.
(R’billion)
Net market capitalisation
0
10
20
30
40
50
14,3
13,5 16
,6 21,8
29,5
42,8
29,6
29,5
38,9
46,5
0302 04 05 06 07 08 09 10 11
+19,5%
Credit ratingsBidvest’s long-term outlook improved
from stable to positive as Fitch Ratings
affirmed our long-term rating as A+(zaf)
and our national short-term rating as
F1(zaf). Moody’s maintained the Group
rating at A1.za and P1.za throughout the
year.
Fitch said our positive outlook reflected
the faster than expected improvement in
Bidvest’s financial profile as a result of
increased funds from profitable
operations, stronger operating cash flow
and moderate net leverage. A+ (zaf)
ratings indicate strong credit risk relative
to other issuers of debt in the same
national market.
Strong rand’s impactSouth Africa’s resilient currency versus
the euro and sterling inhibited the
contribution of our international
foodservice businesses, which now
account for 27% of Bidvest trading profit.
The net effect versus the average rand
position in 2010 was to cut our headline
earnings by 1,3% on translation into rand.
Despite a prolonged period of consistent
rand strength, it remains Bidvest policy
to take forward cover or a derivative
equivalent on foreign exposures.
David Cleasby Group financial director

PASSION/VITALITY/PRECISION
38
Financial director’s reviewBusiness risksAt an operational level, credit risk remains
acute. However, our businesses reacted
appropriately to changes in the business
climate and applied stringent measures to
manage credit extension. As a result, our
debtors remain well managed. However,
continued vigilance is required.
Market risk, natural catastrophe and
political upheaval have emerged as risk
factors for an internationally diversified
Group such as Bidvest.
An earthquake and tsunami in Japan
influenced the performance of our
automotive and office products business
in South Africa. The Fukushima meltdown
and subsequent decision by the German
government to phase out its nuclear
reactors raised questionmarks in
Namibia about the possible impact on
FDI linked to uranium mine development.
The earthquake in Christchurch,
New Zealand, had a direct impact on
our New Zealand business and
customers.
You cannot ringfence a tsunami or
earthquake and, in an inter-connected
world, you cannot escape the trading and
economic impacts of major changes in
important national markets.
Market risk was spotlighted by sovereign
debt concerns and subsequent financial
fallout across Europe and the USA.
In addition, the political upheaval in the
Middle East contributed to oil price
volatility and general uncertainty.
Buoyant business conditions in the East
underpin performance at several of our
operations in this region. However, if
European and US economic conditions
deteriorate further, trading conditions
could be affected in Asia Pacific. Falling
demand in the East would have an effect
on South Africa, Australia and
New Zealand.
Another concern relates to the time it now
takes for adverse effects to work their
way through economies. Belt-tightening
by northern hemisphere tourists and
business travellers since 2008 affects our
catering, travel and tourism operations to
this day.
Our responseWe cannot manage the creditworthiness
and deficits of nation states, but we can
manage our own credit exposure.
We therefore maintain our prudent
approach to debt and ensure strong cash
generation at an operational level.
Another form of risk management is to
ensure our business model remains fit for
purpose. Since the global financial crisis,
business has taken to heart two key
lessons – that elaborate structures are
the first to collapse when fissures appear
in markets and that all costs have to be
interrogated. If investment produces no
prospect of adequate returns, why
engage in it?
Bidvest’s decentralised and
entrepreneurial business model continues
to prove itself. Our corporate office
structures remain lean. We are a big
business, but we have a small business
culture.
SustainabilityWe are well aware that the value of
Bidvest is not reflected in financial
statements alone. Bidvest has an
enduring commitment to sustainable
business practice and, since inception,
has behaved with a sense of
responsibility to the community, the
environment and our people.
We are a responsible corporate citizen
and emphasise the need for
accountability, fairness and transparency
in our dealings with all stakeholders.
In our view, strategy, sustainability and
risk are inseparable.
Within South Africa, the King III report on
good corporate governance enshrines
many of the principles that have long
underpinned our approach to building a
sustainable business, especially the focus
on effective risk management and the
regard that must be paid to economic,
social and environmental impacts.
As a group that makes it a priority to
integrate long-term sustainability and
robust governance philosophies into our
business, we are enthusiastic about the
key governance principles and
recommendations set out in King III.
It brings additional clarity to key issues
surrounding reporting, responsibilities and
standards. King III sets out a process and
signposts a journey. We have made
important strides along the King III road
and we are determined to achieve
continued progress.
As an internationally diversified company
we operate in many jurisdictions.
Obviously, domestic statutes dictate local
compliance. Corporate office in
Johannesburg provides a framework and
support services, but hands-on
responsibility for driving many aspects of
sustainable business practice devolves to
our divisions and individual businesses on
the ground.
Our people live our values and apply our
policy by doing the right thing. The latest
example occurred in the aftermath of the
Christchurch earthquake. Our
New Zealand staff responded instantly to
needs within their communities. They
joined local initiatives and provided help
to families.
Similar community orientation is evident in
all geographies.
Stakeholder engagementWe have robust governance structures
across all businesses, but Bidvest culture
drives organisational behaviour day by
day rather than a centralised compliance
department.

PERFORMANCE OVERVIEW
39 THE BIDVEST GROUP LIMITED / ANNUAL INTEGRATED REPORT 2011
these arrangements, adequate capital
was allocated to ensure continued growth
through infrastructure investment and
certain bolt-on acquisitions.
In June, we paid US$13,5 million for an
initial stake of 14,6% of Icelandic Water
Holdings, the Icelandic spring water
producer. We view the investment as a
value opportunity.
Opportunistic investments of this nature
may well continue as prevailing
business conditions in several markets
create potential for long-term capital
appreciation by carefully selected
assets.
FutureMarket risk remains substantial. Low
growth remains entrenched in many of
the markets in which we are active. This
eventuality may present opportunities for
strategic or bolt-on acquisitions. We are a
well-capitalised business with
considerable capacity for raising debt in
both South African and international
capital markets. Where appropriate, we
will apply these resources to facilitate
continued growth.
Internally, we will continue to pursue
savings and efficiencies while retaining
our strong focus on debtors
management. Investment in infrastructure
and modern IT systems will be maintained
to improve efficiency while creating
capacity.
Our objective is continued real growth in
earnings in all divisions and all
geographies.
David Cleasby
Group financial director
Stakeholder engagement is both a
national and local responsibility,
complemented by interventions at Group
level when appropriate. We report
regularly to the investment community, to
our people and to communities. Within
South Africa, stakeholder engagement is
assisted by our BEE partners at Dinatla.
We complement regular printed reports
by digital communication, enabling
interested parties to drill down to
comprehensive detail on all aspects of
our business.
Significant transactionsIn December, we acquired 100% of the
share capital of UK-based Seafood
Holdings Limited for an enterprise value
of £45 million (R473 million). The
acquisition is strategic as this leading
national fresh fish producer and
distributor finds a complementary fit with
our existing UK foodservice businesses.
In March, we entered into an agreement,
subject to various regulatory approvals, to
sell half our interest in Mumbai
International Airport Private Ltd to a
subsidiary of the Indian company, GVK
Power & Infrastructure. The sale, if
successfully concluded, is expected to
realise a net R300 million to R400 million.
In April and May, we concluded a
R1,6 billion share repurchase agreement
with our Dinatla empowerment partners,
buying back 12 million Bidvest shares at
a net repurchase price of R131,75 per
Bidvest ordinary share. The price
represented an 11,3% discount on the
30-day volume weighted average price of
Bidvest to April 5.
The transaction facilitated the early
settlement of bank loans by Dinatla and
ensured they were not exposed to equity
market risk for any longer than was
necessary – a material risk for BEE
entities in view of increased share market
volatility in recent years. Notwithstanding
0
10
20
30
40
50
15,1
14,6 18
,0 21,1
28,0 32
,8
41,9
38,5 43
,3 47,8
(R’billion)
Total assets
0302 04 05 06 07 08 09 10 11
+10.4%
Credit ratingsFitch Ratings revised its long-term outlook to positive from stable. Bidvest’s national long-term rating was affirmed at A+ (A plus) (zaf) and its national short-term rating at F1 (zaf). Fitch said the positive outlook primarily reflected the faster-than-expected-pace of improvement in Bidvest’s financial profile given increased funds from operations profitability, stronger operating cash flow and moderate net leverage. A+ (zaf) ratings denote a strong credit risk relative to other issuers in the same country.
Moody’s Investors Service assigned Bidvest a first-time national scale short-term rating of P1.za and an A1.za national scale long-term issuer rating, with a stable outlook.
FTSE/JSE Africa Index Series rankingIn the June 2011 FTSE/JSE Africa Index Series quarterly review, Bidvest is a Top 40 Index constituent, ranked 23rd in the FTSE/JSE All Share Index and ninth in the FTSE/JSE Industrial 25, with a total market capitalisation of R50,6 billion.
Morgan Stanley International Emerging Market Index 2010Bidvest is considered to have a 95% free float for the MSCI SA Index and a weighting of 2,27% in the MSCI SA Index and 0,17% in the MSCI Emerging Markets Index.

PASSION/VITALITY/PRECISION
40
Governance for a sustainable businessBidvest’s entrepreneurial flair has been a driving force that has fostered growth in a variety of sectors, creating the Group as we know it
today. Clear vision about the way forward has become essential.
An appropriate structure that can capture the talent and unleash the energy needed for continued growth without becoming unwieldy or
unfocused is the core rationale behind the restructure of Bidvest into Bidvest South Africa (made up of 10 divisions) and Bidvest
Foodservice (locally and globally), Bidvest Namibia and Bidvest Corporate.
Bidvest prizes simplicity. Better focus makes it easier to manage your business which is the key focus in understanding Governance.
This new structure has also facilitated addressing of previously identified, seemingly insurmountable risks such as succession planning.
Within Bidvest South Africa there are 10 new CEs each running substantial businesses, supported by their respective financial directors.
Within Bidvest Foodservice globally there are CEs and FDs appointed to run and manage geographically grouped businesses, so too
within Bidvest Namibia. Each division within this overall structure has as divisionally central assurance team being an internal audit and
risk management team. Each division is managed through a corporate governance structure consisting of quarterly committees being
independently chaired audit committee and a risk and sustainability committee. Each of these divisional committees collates and
reports back into the Group structure to ensure adequate focus is brought to each risk and business that exists within the Bidvest
Group structure.
QUICK LINK: Bidvest at a glancePages 07 – 09
Ethical leadershipEthical philosophy
At Bidvest, corporate governance is a way of life rather than a set of rules. Stakeholders can only derive full, sustained value from a
business founded on honesty, integrity, accountability and transparency. Bidvest is committed to applying good corporate governance
principles in a manner that complements its entrepreneurial flair.
Code of conduct
A focus area for the board, its committees, directors, officers and managers of the Group is to ensure our code of conduct is honoured.
The code demands highest standards of integrity, ethics and behaviour in all conduct and dealings; non-discriminatory employment and
promotion practices; supporting employees through training and development to reach their full potential; and proactive engagement on
environmental, social and sustainability matters.
Our value system
Accountability to employees and shareholders
Business growth
Decentralisation
Entrepreneurship and innovation
Non-discrimination and equal opportunity
Fairness and honesty in stakeholder interaction
Respect for human dignity, human rights, social justice and environment
Service excellence, creating an exceptional place in which to work and do business
Transparency and open lines of communications
QUICK LINK: Chief executive’s statementPages 30 – 35
Governance for a sustainable business
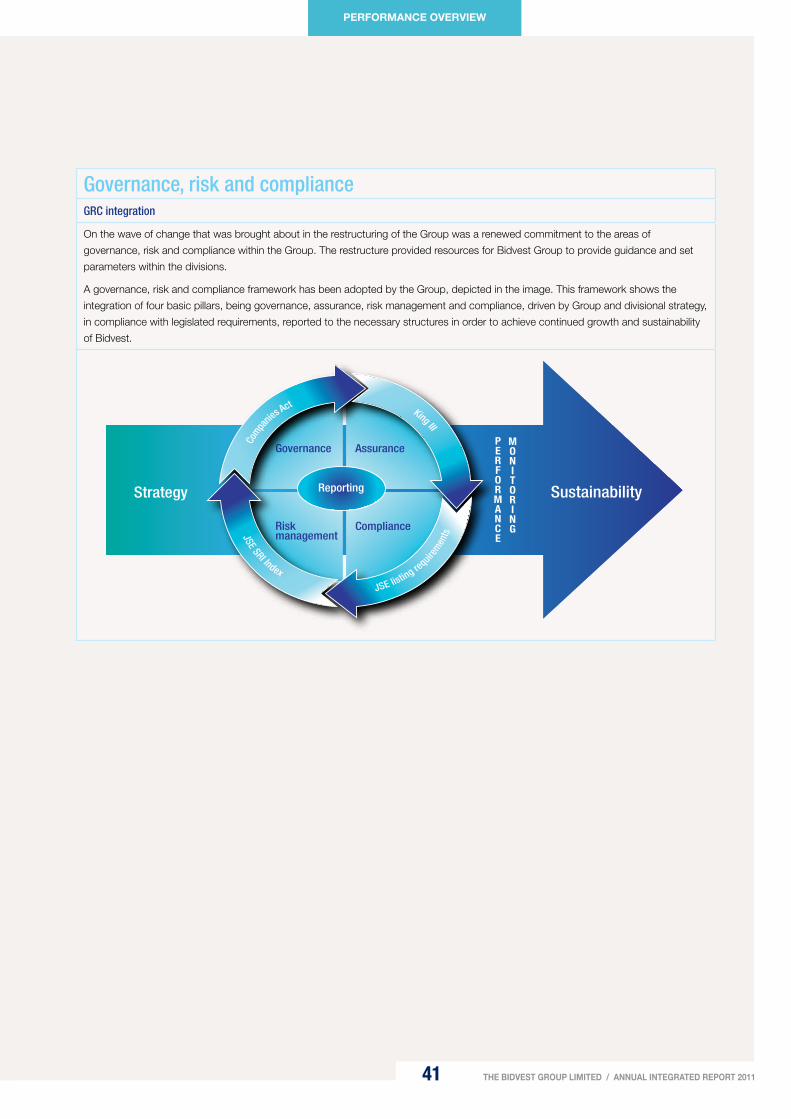
PERFORMANCE OVERVIEW
41 THE BIDVEST GROUP LIMITED / ANNUAL INTEGRATED REPORT 2011
Governance, risk and complianceGRC integration
On the wave of change that was brought about in the restructuring of the Group was a renewed commitment to the areas of
governance, risk and compliance within the Group. The restructure provided resources for Bidvest Group to provide guidance and set
parameters within the divisions.
A governance, risk and compliance framework has been adopted by the Group, depicted in the image. This framework shows the
integration of four basic pillars, being governance, assurance, risk management and compliance, driven by Group and divisional strategy,
in compliance with legislated requirements, reported to the necessary structures in order to achieve continued growth and sustainability
of Bidvest.
Governance Assurance
Risk management
Compliance
Strategy SustainabilityReporting
PERFORMANCE
MONITORING
Compa
nies A
ct
JSE listing requir
emen
tsJSE SRI Index
King III

PASSION/VITALITY/PRECISION
42
Governance for a sustainable business
GovernanceBoard of directors
The board comprises nine independent non-executive directors, five non-executive directors, eight executive directors and one alternate, non-executive director. In line with King III recommendations, we have nominated a Lead Independent Director, the appointment of which will be ratified by the board in November 2011 and the board confirms the independence of the long-serving directors following a review of their independence. The roles of chairman and chief executive are distinct.
Executive directors implement strategies and operational decisions. Non-executive directors provide an independent perspective and complement the skills and experience of executive directors. They objectively assess strategy, budgets, performance, resources, transformation, diversity, employment equity and standards of conduct. They also contribute to strategy formulation and decision making. The board and committees evaluation process of annual self-assessment continues with no significant changes to report, but a review of this process against best practice is planned.
QUICK LINK: Directors’ reportPages 132 – 141
QUICK LINK: Board chartershttp://www.bidvest.com/ar/bidvest_ar2011/002.php
Bidvest board has appointed a subcommittee structure, empowered with the tasks required to govern an organisation as diverse, geographically spread and of the size that Bidvest is. These committees include Group audit committee, Group risk and sustainability committee, transformation social and ethics committee (transformation committee); remuneration committee, nomination committee and acquisitions committee. Charters and terms of reference for the board and subcommittees have been updated in line with King III and the new Companies Act 2008.
QUICK LINK: Directors’ reportPages 132 – 141
Audit committee
The audit committee has an updated charter defining their responsibilities, including but not limited to review of the financial information, assessment of significant statutory and financial risks, scope and function of internal audit, review of internal and external audit reports and the appointment of external auditors.
QUICK LINK: Audit committee reportPages 129 – 131
QUICK LINK: Audit committee charterhttp://www.bidvest.com/ar/bidvest_ar2011/003.php
Divisional committee structure
The newly restructured Bidvest South Africa has spread the burden of responsibility carried by the Group board and Group board committees down into the new divisional structures where divisional committee structures exist that are able to focus on the needs and strategies within the division itself. Each division has its own audit committee and risk and sustainability committee operating under a delegated authority of the Group committees. This is consolidated and reported to a Group level where the board is able to focus on the high-risk, high-impact areas.
Social and ethics committee
In line with the Companies Act, 2008 (as amended) and King III, Bidvest has established a social and ethics committee using the previously constituted transformation committee as a base structure. Responsibilities of this committee have been expanded to be in line with the legislated requirements, building on the existing transformation committee terms of reference and a review of the membership constitution.
Remuneration
Our remuneration philosophy promotes the Group’s entrepreneurial culture within a decentralised environment with the aim of achieving sustainable growth within all businesses. Our philosophy emphasises the fundamental value of our people and their role in attaining this objective. Deliberations of the remuneration committee are informed by performance reviews – from individual, divisional and Group perspectives.
Delivery-specific short-term incentives are viewed as strong drivers of performance. A significant portion of top management’s reward is variable and is determined by the achievement of realistic profit targets together with an individual’s personal contribution to the growth and development of their immediate business and the wider Group.
Long-term incentives align the objectives of management and shareholders for a sustained period.
QUICK LINK: Directors reportPages 132 – 141
QUICK LINK: Remuneration policyhttp://www.bidvest.com/ar/bidvest_ar2011/004.php
Company Secretariat
The board is assisted by a suitably qualified Company Secretary, in line with legislated requirements. All directors have access to the advice and services of the Company Secretariat, who are responsible for ensuring the Board complies with all applicable procedures, statutes and regulations.

PERFORMANCE OVERVIEW
43 THE BIDVEST GROUP LIMITED / ANNUAL INTEGRATED REPORT 2011
Risk managementThe board has raised the profile of the risk committees, a ‘hearts and minds’ campaign is underway within the Group, selling the vision
where Bidvest intends to take risk management. Management is accountable to the board for implementing and monitoring the
processes of risk management and integrating this into day-to-day activities. We have integrated King III recommendations and
committed dedicated personnel to the risk process. Renewed efforts are being put into revitalising the risk and sustainability
management plans and communicating these to a Group level. Progress is monitored by the Group risk and sustainability committee,
and the outcome will provide a clarified path for our risk management process.
QUICK LINK: Audit committee reportPages 129 – 131
QUICK LINK: Risk committee charter on webhttp://www.bidvest.com/ar/bidvest_ar2011/005.php
Information technology governance
Bidvest has approved an IT governance Framework in order to “support the effective and efficient management of information resources
(eg people, funding and information) to facilitate the achievement of the organisations objectives”. The Group has adopted the COBiT
standards recognised worldwide as best practice. The framework supports the principles and provides guidance to the Group in
determining maturity and application of these principles as appropriate.
QUICK LINK: IT Governance framework on webhttp://www.bidvest.com/ar/bidvest_ar2011/006.php
Sustainability
Progress can only be credibly reported if indicators are identified, monitored, measured and recorded. A new database tool
implemented towards year-end represents a major step towards more powerful data management, monitoring and reporting.
A major focus will be to create defined targets for sustainability performance.
AssuranceCombined assurance
Group governance, risk and compliance framework is effectively co-ordinating the efforts of management, internal and independent
assurance providers, increasing their collaboration and developing a shared and holistic view of the group’s risk profile. This model
provides an outline for an annual assurance plan that reduces duplication in audit processes while preventing assurance providers from
overlooking key controls.
Internal audit
In line with King III, internal audit is creating a programme for quality assurance and improvement that is informed by strategy and risk. In
this, the role of internal audit is to challenge the issues identified by the business at unit and divisional level, and the way these are
governed and controlled.
Divisionally there are quarterly audit committee meetings, chaired by independent non-executive directors. These committees approve
and monitor the progress of the internal audit function within the division. Each divisional internal audit manager has a direct line of
contact with the independent divisional audit committee chair to raise any concerns or issues as and when required.
QUICK LINK: Audit committee reportPages 129 – 131
External audit
The Group uses external auditors in combination with the internal audit function to achieve combined assurance. Management
encourages unrestricted consultation between internal and external auditors.
QUICK LINK: Independent auditors reportPage 128

PASSION/VITALITY/PRECISION
44
Assurance continued
Ethics
In addition to other compliance and enforcement activities, the board continues to support the process of confidential reporting
(whistle-blowing) of fraud, theft, breach of ethics and other risks. Whistle-blowing procedures and our 24-hour call centre ensure formal
reporting and feedback. We encourage employees to report any activity they believe to be in breach of the code of ethics.
ComplianceRegulatory compliance
Bidvest recognises that its greatest risk of non-compliance stems from a weakness within the practical impact of the legislation on their
business. Each company is required to identify legislation that applies to the environments in which it operates, as well as the categories
of information held relating to this legislation. Awareness programmes, through various forums, are run from a Group level to update
management on legislative change and how it applies to the business.
QUICK LINK: Audit committee reportPages 129 – 131
Corporate governance
The Group corporate governance manual lists the charters, codes, policies and documents which have to be formulated by divisional
governing bodies. These are categorised into matters the Group deems as mandatory, recommended or optional. In line with Bidvest’s
decentralised structure divisional management will establish additional policies and procedures as are applicable to their governing
structures.
Stakeholder engagementStakeholder engagement to inform material issues
Because Bidvest’s structure is highly diversified and decentralised, stakeholder engagement happens at divisional and company level.
An operation engages with stakeholders on matters considered material to its business, which helps identify many of the important
commercial and sustainable development issues facing the operation.
Bidvest continues to engage with Deloitte & Touche to facilitate a process to:
reassess who the key stakeholders are, principally considering the level of influence, dependence and representation;
evaluate existing forms of engagement to ensure they include social, ethical and environmental issues; and
introduce additional engagement forums, as necessary.
Engagement with shareholders
We regularly meet investors and analysts to foster dialogue and communicate Group strategy and performance. Information is
distributed via numerous communication channels, including the internet. The security and integrity of information is carefully maintained
while ensuring that critical financial information reaches all shareholders simultaneously.
Bidvest is mindful that King III encourages companies to inform their investors about important non-financial issues. Continued inclusion
of these issues in the Group’s annual report is indicative of the Group’s commitment to this principle.
Engagement with employees
Bidvest and operational companies engage with employees in many ways. Employee representation through trade unions stands at
16,5% internationally and at 28,7% in South Africa. Union representation varies widely. The Group’s policy is to ensure good employee
relationships. We offer market-related remuneration.
Bidvest South Africa divisions use employment equity forums to deal with issues on site. All affected stakeholders are kept informed.
A survey of employee opinion regarding Bidvest’s efforts towards sustainability showed that our staff were keen to contribute and proud
their company was working for positive change. Key challenges and opportunities were also identified, in particular the need to move
from awareness to action.
Governance for a sustainable business
PERFORMANCE OVERVIEW
45 THE BIDVEST GROUP LIMITED / ANNUAL INTEGRATED REPORT 2011
Stakeholder engagement continuedMany Group companies operate heavy equipment and handle hazardous products. Bidvest is acutely aware of the health and safety
risks faced by employees and contractors and places the utmost importance on a safe and healthy working environment.
Responsibility for health and safety is assigned to dedicated senior managers in all operations where safety and health are material
issues. South African companies comply with the Occupational Health and Safety Act. International businesses meet relevant standards
in their jurisdictions.
The number of fatalities increased to nine. Each fatal incident was fully investigated in conjunction with the relevant authorities. Training to
entrench safety awareness and reinforce safe behaviour is a constant focus for companies at risk.
Engagement with customers
Operating largely in service industries, Bidvest forms part of the supply chain for our customers, who are mostly major businesses with
important reputations at stake. Our customers regularly engage us regarding compliance with social, environmental and human rights
standards.
In those industries where our companies engage consumers directly, we monitor call centres and independent complaint channels to
find ways to improve our service. The Group ethics line, the general Bidvest e-mail address, the Bidvest website and direct calls to the
Group chief executive are key feedback tools facilitating our continual improvement.
South Africa’s Consumer Protection Act became effective in March 2011. Companies conducted staff training to ensure provisions have
been met. In general, our status as leaders in service and product quality meant that we were already well prepared for the new
legislation.
Engagement with government, authorities and regulators
Our engagement with national authorities and regulators occurs mainly at divisional level, and is proactive across the Group.
Engagement with relevant government authorities occurs only at Group level for overarching issues such as tax. However, at Bidvest
South Africa, engagement with the Department of Labour on employment equity plans, for example, is devolved to the divisions.
Consultations occur as needs arise.
Engagement with communities, community-based organisations and non-governmental organisations
As a large, transcontinental organisation, the Bidvest Group’s diverse companies operate in very different social and cultural
environments. Our decentralised management policy is thus particularly appropriate with respect to how our operations engage with
local communities. We may impact communities in a number of ways; primarily by providing employment. Across the Group, companies
take pride in contributing to social and educational initiatives through donations and other forms of support. In South Africa our
engagement is often a response to large disparities in wealth and opportunity. In the UK and Europe, programmes include healthy eating
campaigns, while in other regions, disaster response is a focus.
CSI takes on a different flavour in different regions where we operate. For example, while senior citizens are a focus in some European
companies, disaster management was a focus in New Zealand this year, and education and poverty alleviation are recurrent issues in
South Africa.
Bidvest has a three-tiered CSI strategy which accommodates the need for a flexible approach according to region:
Tier one – Corporate supports a number of overarching worthy causes
Tier two – individual divisions support their own flagship projects
Tier three – individual businesses support community-based projects in their operational areas
Staff members responsible for these programmes assess the impact and outcomes of each programme and adjust investment
accordingly.
Corporate encourages and guides CSI by sharing success stories in Bidvoice, on the website, the intranet, in reports, at roadshows and
at company gatherings.
Rally to Read is one example of a South African CSI flagship programme.
QUICK LINK: Bidvest at a glancePages 07 – 09
QUICK LINK: Financial director’s reviewPages 36 – 39
PASSION/VITALITY/PRECISION
46
Environmental performanceClimate change
Bidvest has identified climate change as an important issue and we continue to look for opportunities to improve our competitive
position with respect to climate change.
Positioning Bidvest as a green company
Bidvest recognises that these threats also contain opportunities. In response, our companies are building environmental excellence into
our reputation for quality, service, health and safety.
Not only do Bidvest companies measure their consumption of fuel, electricity and other carbon-costly resources, they also increasingly
monitor other processes that affect the quality and efficiency of operations. By sharing best practices through Bidvoice and quarterly
sustainability committee meetings, companies are learning how to apply new technologies to their businesses.
Carbon footprint
This year, Bidvest conducted its fifth greenhouse gas emissions inventory (carbon footprint), which included all Bidvest businesses. Data
was collected in accordance with the Greenhouse Gas Protocol, compatible with other GHG standards such as the ISO 14064.
Emitting activities include: direct greenhouse (GHG) emissions resulting from fuel used by vehicles and equipment owned or controlled
by Bidvest; indirect emissions from purchased electricity (Scope 1 and 2); and selected indirect emissions, for example resulting from
business travel in corporate aircraft, or methane and nitrous oxide emitted by equipment not owned or controlled by Bidvest (Scope 3
emissions). Emissions within Bidvest car rental operations resulting from client usage of Bidvest owned cars are not included.
QUICK LINK: Group issues and GRI tablehttp://www.bidvest.com/ar/bidvest_ar2011/007.php
JSE Social Responsibility Investment Index
Based on an assessment of the Group’s policies, performance and reporting on economic, social and environmental sustainability, the
JSE has reaffirmed Bidvest as a founding constituent of the SRI Index. Bidvest, one of 30 best performers out of 109 listed companies
included in the research, is one of 67 constituents of the index. Bidvest was assessed as having a low environmental impact. The index
is the first of its kind in an emerging market and the first to be launched by a stock exchange.
Carbon Disclosure Project 2011
The United Nations-sponsored Carbon Disclosure Project provides investors with information about carbon emissions and climate
change exposure of the world’s major corporations. Bidvest’s disclosure was ranked highly in South Africa.
Excellence in reporting awards 2010
Bidvest received an excellent rating in the Ernst & Young excellence in sustainability reporting awards and a merit at the ACCA
(Association of Chartered Certified Accountants)/JSE sustainability reporting awards.
Governance for a sustainable business

PERFORMANCE OVERVIEW
47 THE BIDVEST GROUP LIMITED / ANNUAL INTEGRATED REPORT 2011
Transformation in South AfricaIn South Africa, Bidvest continues its drive towards economic equity through broad-based black economic empowerment and scores show further improvement. Transformation is managed at the operational level in our decentralised structure and some companies are ahead of others. The best measure of our overall success is reflected in the Bidvest Group BEE rating, which has improved again, reaching level 3 contributor status under the DTI Codes.
Summary of DTI Codes scores for the GroupElement Indicator June 2011 June 2010 Target
Management control Percentage black executive directors 30,0 24,0 50,0
Employment equity
Black disabled employees as a percentage of all employees
0,4 – 2,0
Percentage black employees at senior management 22,0 19,0 43,0
Percentage black employees at middle management 36,0 38,0 63,0
Percentage black employees at junior management 58,0 52,0 68,0
Skills development
Skills development expenditure on learning programmes for black employees as percentage of leviable amount
3,1 2,5 3,0
Number of black employees participating in learnerships or category B, C and D as percentage of total employees
11,0 11,3 5,0
Preferential procurement B-BBEE procurement spend from all suppliers based on B-BBEE procurement recognition levels as a percentage of total measured procurement spend
65,0 51,0 50,0
Enterprise development Average annual value of all enterprise development contributions and sector-specific programmes made by the measured entity as a percentage of NPAT
3,0 2,0 3,0
Socio-economic development
Average annual value of all socio-economic development contributions and sector-specific programmes made by the measured entity as a percentage of the NPAT
1,6 1,0 1,0
Ownership Percentage exercisable voting rights and economic interest of black people
14,5 28,4 25,0
Bidvest’s approach to BEE has moved away from a compliance mindset towards adopting transformation as a change management process and a commercially driven priority.
While many BEE pillars such as corporate social investment, preferential procurement and enterprise development are in place, we recognise that employment equity needs continued attention. The topic is discussed at every board meeting and over time we expect to achieve broad-based employment equity throughout our organisation.
Bidvest is a desirable employer, with generally low turnover rates, especially among senior management. Scope for growth at higher levels is limited and opportunities for new people in senior positions are rare. In dealing with this challenge, our strategy is to encourage every business to look at its own needs and ensure that when opportunities do become available, diverse applicants are considered and given preference if they are the right people for the position.
To foster senior level transformation in South Africa, Bidvest will continue to focus on training and skills development as part of its succession planning programmes, aiming its training at particularly promising individuals.
QUICK LINK: Chairman’s statementPages 26 – 28
QUICK LINK: Transformationhttp://www.bidvest.com/ar/bidvest_ar2011/008.php

PASSION/VITALITY/PRECISION
48
Sustainable development performance data
2011 2010
Economic(1)
Value added statement
Refer to financial statements, page 126.
Black economic empowerment procurement
BEE procurement (R’000, adjusted in terms of the dti codes) 23 791 182 17 282 697
Corporate social investment
CSI (R’000) 59 332 47 229
South Africa 44 787 35 197
International 14 545 12 032
CSI as % of pre-taxation profit 1,1 1,0
South Africa 1,4 1,2
International 0,7 0,6
Enterprise development spend (R million) – South Africa 118,8 51,9
Environmental parameters(2)
Total water usage (litres ’000) 2 577 700 2 428 711
Total electricity usage (including electricity from renewable sources) (kWh ’000) 421 384 416 341
Petrol (litres) 21 825 909 22 190 205
Diesel and biodiesel (litres) 106 552 642 103 343 121
Total carbon emissions (tonnes)(3) 693 341 684 398
Carbon emissions per employee (tonnes)(3) 6,6 6,5
Labour practices
Number of disabled employees 890 326
South Africa 824 266
International 66 60
Trade unionisation (%) 26,4 27,2
South Africa 28,7 29,3
International 16,5 18,0
Training
Training spend (R’000) 253 196 252 548
South Africa 234 156 233 263
International 19 040 19 285
Training spend per employee (R)(4) 2 410 2 388
South Africa 2 750 2 706
International 957 987
Training hours 1 594 040 1 796 815
South Africa 1 371 764 1 436 027
International 222 276 360 788
Training hours per employee 15,2 17,0
South Africa 16,1 16,7
International 11,2 18,5
(1) Economic performance describes and quantifies how we distribute the value channelled through the business, the opportunities created and takes into account our economic contribution to society. This is distinct from financial performance which is extensively reported.
(2) 2010 environmental figures restated.(3) The GHG Protocol
The GHG (greenhouse gas) Protocol is the most widely used tool for quantifying and managing GHG emissions, converting six main greenhouse gases into carbon dioxide equivalent units (CO2e) and separating GHG-producing activities into “scopes” according to the level of corporate control over activities.
(4) Includes learnerships.

PERFORMANCE OVERVIEW
49 THE BIDVEST GROUP LIMITED / ANNUAL INTEGRATED REPORT 2011
2011 2010
Health and safety
Lost-time injury frequency rate (%) 6,6 5,5
South Africa 4,7 4,5
International 15,3 11,2
Work-related fatalities 9 4
South Africa 9 3
International – 1
HIV/Aids
Percentage employees participating in HIV/Aids awareness programmes (%) 26,80 22,90
Employees and their composition
Number of employees 105 057 105 752
Southern Africa 90 239 91 033
International 14 818 14 719
Employment by gender profile (%)
Group 100,0 100,0
Male 56,9 56,2
Female 43,1 43,8
South Africa 100,0 100,0
Male 53,4 52,5
Female 46,6 47,5
International 100,0 100,0
Male 71,7 72,3
Female 28,3 27,7
Female employment by management level(1) 100,0 100,0
Executive directors 16,6 16,8
Management 38,1 39,1
Other 45,3 44,1
Employment equity profile by race – South Africa (%) 100,0 100,0
Black 69,5 71,8
White 15,5 13,8
Indian 5,8 5,2
Coloured 9,2 9,2
Employment equity by race and gender – South Africa (%)(2) 100,0 100,0
Black male 48,0 45,80
White male 8,2 6,70
Black female 36,5 40,20
White female 7,3 7,30
(1) This is accumulation of data across the Group.(2) Black indicates African, Indian and Coloured as defined in terms of dti codes.
QUICK LINK: Sustainable development datahttp://www.bidvest.com/ar/bidvest_ar2011/009.php

PASSION/VITALITY/PRECISION
50

51 THE BIDVEST GROUP LIMITED / ANNUAL INTEGRATED REPORT 2011
PASSIONMost people believe butterflies simply make the world more beautiful. But this beauty has purpose and passion. That same passion has been a Bidvest hallmark since inception.
Operational reviews
52 Bidvest Corporate
54 Bidvest South Africa
60 Bidvest Automotive
64 Bidvest Electrical
68 Bidvest Financial Services
72 Bidvest Freight
76 Bidvest Industrial
80 Bidvest Office
84 Bidvest Paperplus
88 Bidvest Rental and Products
92 Bidvest Services
96 Bidvest Travel and Aviation
100 Bidvest Foodservice
106 Asia Pacific
110 Europe
114 Southern Africa
118 Bidvest Namibia

PASSION/VITALITY/PRECISION
52
Provides strategic direction, financial, risk and sustainability management, marketing, investor, relations, corporate communications, corporate finance, houses investments and provides executive training to the Group. Adds value by identifying opportunities and implementing Bidvest’s decentralised entrepreneurial business model.
Highlights
Transformation gains continue
Bidvest Properties completes World of Yamaha and other projects
Ontime Automotive makes progress in difficult conditions
Further capital committed to Mumbai International Airport development plan
Our communicators win reporting awards
Bidvest Wits grows fan base and youth development
Revenue
R683,2 million6,5% decrease
Trading profit
R140,3 million9,1% increase
Contribution to Group revenue
0,6%
(Divisional contribution %)
32,2%R19,1m
Divisional CSI spend (% of Group CSI spend)
Employee numbers as a percentage of headcount
0,53%577
Brian JoffeChief executive
Operational reviewBIDVEST CORPORATE
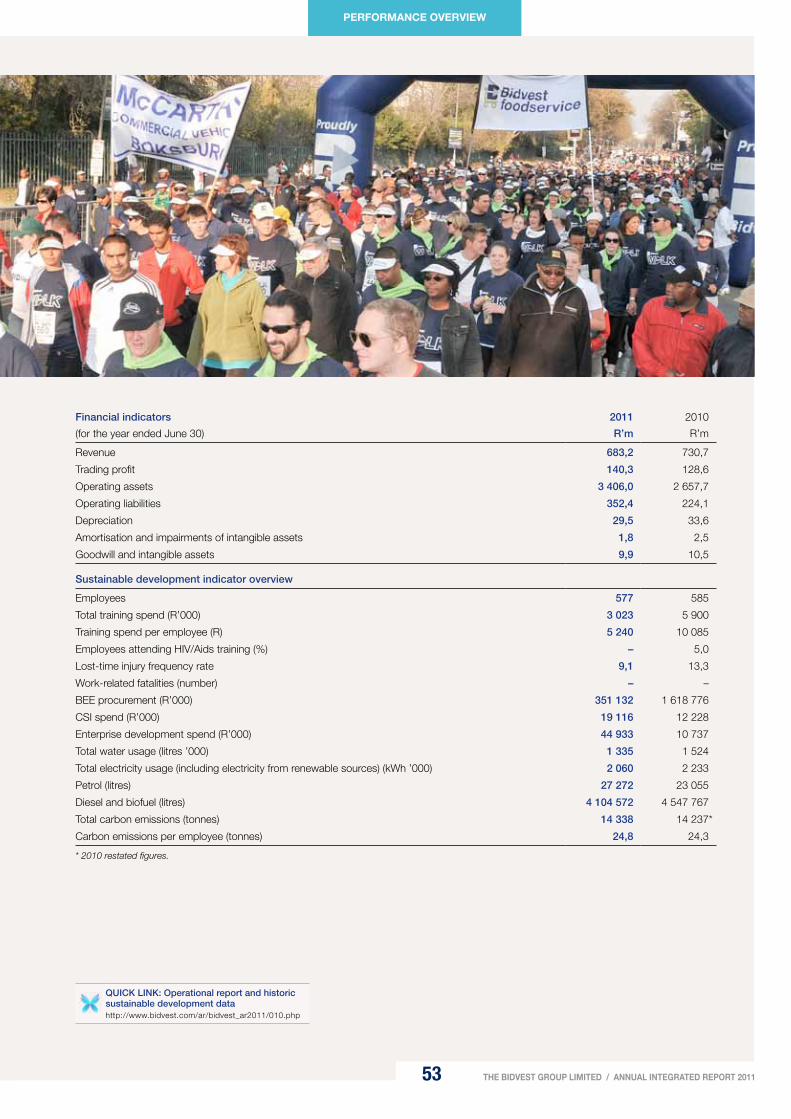
53
PERFORMANCE OVERVIEW
THE BIDVEST GROUP LIMITED / ANNUAL INTEGRATED REPORT 2011
Financial indicators
(for the year ended June 30)
2011
R’m
2010
R’m
Revenue 683,2 730,7
Trading profit 140,3 128,6
Operating assets 3 406,0 2 657,7
Operating liabilities 352,4 224,1
Depreciation 29,5 33,6
Amortisation and impairments of intangible assets 1,8 2,5
Goodwill and intangible assets 9,9 10,5
Sustainable development indicator overview
Employees 577 585
Total training spend (R’000) 3 023 5 900
Training spend per employee (R) 5 240 10 085
Employees attending HIV/Aids training (%) – 5,0
Lost-time injury frequency rate 9,1 13,3
Work-related fatalities (number) – –
BEE procurement (R’000) 351 132 1 618 776
CSI spend (R’000) 19 116 12 228
Enterprise development spend (R’000) 44 933 10 737
Total water usage (litres ’000) 1 335 1 524
Total electricity usage (including electricity from renewable sources) (kWh ’000) 2 060 2 233
Petrol (litres) 27 272 23 055
Diesel and biofuel (litres) 4 104 572 4 547 767
Total carbon emissions (tonnes) 14 338 14 237*
Carbon emissions per employee (tonnes) 24,8 24,3
* 2010 restated figures.
QUICK LINK: Operational report and historic sustainable development datahttp://www.bidvest.com/ar/bidvest_ar2011/010.php

PASSION/VITALITY/PRECISION
54
Realignment into 10 focused divisions was successfully implemented. Performance was mixed, reflecting a patchy, hesitant recovery and ongoing weak demand in construction and hospitality. Freight and Rental performed strongly, Travel staged a good recovery, Automotive optimised opportunities and Paperplus and Services coped well. Banking operations showed good growth. All teams showed resilience, driving revenue 14,0% higher to R59,0 billion (2010: R51,8 billion), while trading profit reached R3,4 billion (2010: R3,1 billion).
The division includes a variety of service and product offerings across South Africa.
Highlights
Successful restructure into 10 focused divisions
Pleasing revenue and profit growth in the face of challenging conditions
Depth of internal talent confirmed as senior positions in an expanded structure are filled by Bidvest managers
Capital expenditure of R1,63 billion as ‘refreshed’ business invests in South Africa’s future
Proudly Bidvest strategy gains impetus as divisions and operational units leverage the strength of the Bidvest brand
Operational reviewBIDVEST SOUTH AFRICA
Revenue
R59,0 billion14,0% increase
Trading profit
R3,4 billion10,4% increase
South Africa
Contribution to Group revenue(Divisional contribution %)
48,6%
39,1%R23,2m
Divisional CSI spend (% of Group CSI spend)
Employee numbers as a percentage of headcount
79,9%83 900
Lindsay RalphsChief executive

55
PERFORMANCE OVERVIEW
THE BIDVEST GROUP LIMITED / ANNUAL INTEGRATED REPORT 2011
Financial indicators
(for the year ended June 30)
2011
R’m
2010
R’m
Revenue 59 020,8 51 791,0
Trading profit 3 412,2 3 091,2
Operating assets 17 677,4 16 404,5
Operating liabilities 9 114,7 8 236,1
Depreciation 909,8 926,0
Amortisation and impairments of intangible assets 41,8 43,9
Goodwill and intangible assets 1 031,4 985,1
Sustainable development indicator overview
Employees 83 900 84 789
Total training spend (R’000) 222 594 220 104
Training spend per employee (R) 2 653 2 596
Employees attending HIV/Aids training (%) 30,8 30,4
Lost-time injury frequency rate 4,7 4,4
Work-related fatalities (number) 9 3
BEE procurement (R’000) 21 654 250 14 924 292
CSI spend (R’000) 23 213 22 238
Enterprise development spend (R’000) 69 124 34 157
Total water usage (litres ’000) 1 850 674 1 834 966
Total electricity usage (including electricity from renewable sources) (kWh ’000) 183 405 183 778
Petrol (litres) 17 684 486 17 985 917
Diesel and biofuel (litres) 20 138 068 19 015 909
Total carbon emissions (tonnes) 316 219 324 196
Carbon emissions per employee (tonnes) 3,8 3,8

PASSION/VITALITY/PRECISION
56
Operational reviewBIDVEST SOUTH AFRICA continued
Strategic factorsThe 10 divisions of Bidvest South Africa
operate in distinct, although dissimilar
sectors. Though a measure of economic
recovery is evident in most areas, the rate
of recovery differs markedly and
recessionary conditions continue in the
construction sector. In many of our
businesses, significant improvements in
trading volumes did not come through
until quarters three and four, suggesting
that recovery is under way, but progress
is slow.
Increases in the rate of inflation since our
second quarter can be marginally positive
for some trading activities, but price
resistance is stiff in both the business-to-
business environment and the retail
economy. The net effect at Bidvest South
Africa is continued margin pressure. High
levels of inflation are a concern as we are
a major employer and rising grocery bills
translate into mounting pressure for wage
increases.
PerformanceOverall performance was pleasing.
Revenue of R59,0 billion (2010:
R51,8 billion) was up 14,0%. Trading
profit rose to R3,4 billion from R3,1 billion
in 2010.
The major contributors were Bidvest
Freight, Bidvest Travel and Aviation,
Bidvest Rental and Products, Bidvest
Financial Services, Bidvest Services and
Bidvest Paperplus.
A robust performance was put in by all
the people at our realigned divisions.
Returns on funds employed (ROFE) was
40,8%, a result of continued focus on
efficiency and inventory management
at divisions firmly focused on core
competence in industries they know well.
Margins remained flat, a pleasing
performance in a highly competitive
trading environment. Our people did well
to optimise growth opportunities as
buoyant trading conditions on the
pre-recession pattern were not evident.
Performance by sectorThe automotive industry enjoyed relatively
buoyant demand for new vehicles, though
the rate of industry growth may be
starting to slow. However, margin
pressure was intense while belt-tightening
by consumers impacted parts and service
volumes.
A low interest rate environment and stable
rand are generally negative for the
financial services industry. Nevertheless,
our financial services division performed
exceptionally well and maintained strong
growth, benefiting from an expanded
range of services.
Bidvest Electrical faced particular
challenges as a major supplier to a
construction sector in recession. Low
tender activity compounded the trading
challenge. Teams did well to maintain
sales and market share.
Demand for resources and agricultural
products was positive for our freight
management businesses, which put in a
strong showing. An increase in container
traffic was especially encouraging as it
suggests recovery of the retail economy
may be under way. Infrastructure
investment in recent years allowed
management to optimise the
opportunities presented by the uptick in
trading activities.
Pressure on the manufacturing sector
and the impact of the strong rand on
exporters had significant knock-on effects
at Bidvest Industrial. Margins narrowed,
but revenue growth was achieved.
Office supplies were impacted by the
reluctance to spend of both consumers
and business. Furniture and stationery
faced continuing pressure, but technology
businesses seized new growth
opportunities.
Printing and related activities faced
trading challenges in South Africa’s
generally weak economy, but continued
migration to new technology and export
Material issues
Recessionary conditions continue in the construction sector
Price resistance in business-to-business environment and retail
High levels of inflation
Health and safety training
Continued education on HIV/Aids
Rising energy and fuel costs
Challenge of developing black management at senior level

57
PERFORMANCE OVERVIEW
THE BIDVEST GROUP LIMITED / ANNUAL INTEGRATED REPORT 2011
growth enabled Bidvest Paperplus to
cushion industry pressures.
Bidvest Rental and Products did well by
delivering solutions in a business-to-
business environment that is increasingly
characterised by the corporate quest for
efficiencies and savings.
Pressure on important customer groups
in construction and hospitality was
negative for services such as cleaning,
security, industrial cleaning and green
services. But Bidvest Services proved
resilient thanks to niche market gains and
strong performance by industry-leading
teams.
In the travel industry, volumes began to
revive from a depressed base while
price-driven competition in the car rental
sector remained intense. Despite the
challenges, Bidvest Travel and Aviation
put in an excellent performance, winning
new contracts from the airlines while
taking advantage of corporate demand
for travel management cost efficiencies.
Risk and sustainabilityRisks have not changed, but may have
sharpened. The business impact of
volcanic ash clouds in northern Europe
and earthquake and tsunami in Japan is a
reminder that some risks are difficult to
avoid or predict. Thankfully, our
geographic base of operations did not
experience natural disaster.
Though our division is rooted in South
Africa, our operations – especially in the
freight business – are far from insular.
Worldwide catastrophe highlighted the
inter-connectedness of geographic
markets. For example, in Japan the
closure of some tsunami-affected
automotive parts and electronic
component plants subsequently led to
supply problems at Bidvest Office and
Bidvest Automotive.
We therefore appreciate the effects of
climate and environmental factors on
business. Risk and sustainability
processes are in place at all divisions of
Bidvest South Africa. Improved
reporting on sustainable business
performance is a priority.
When risks cannot be tackled at source,
energetic measures are taken to lessen
the impacts. Many businesses were
adversely affected by rising energy
prices. All have programmes in place to
reduce fuel and power usage.
Unfortunately the level of price
increases was such that it proved
impossible to offset these impacts.
PeopleWe entrenched our position as one of
the largest employers in the South
African private sector, with a headcount
of 83 900.
Employee engagement
We monitor staff turnover and
absenteeism as indicators of employee
satisfaction and some divisions conduct
employment satisfaction surveys.
One benefit of the recent restructure is
that divisional management remains
close to worker concerns and there
were no major disputes at any division
in the 12 months to June 2011.
Unfortunately, early in the year, South
Africa witnessed a wave of strike action
and businesses in several of our
divisions were affected.
Working relations with unions remained
positive and effective.
Training and skills
Finding and retaining skilled employees,
particularly at senior level, remains an
on-going focus. Continual training and
development is integral to our
employment strategy, which includes
on-the-job training and formal classes.
Constant training helps boost staff
enthusiasm and work ethic.
Training spend continues to rise, with
strong focus on the upskilling of
historically disadvantaged individuals.
Skills spend on black people reached
R197,6 million.
Adult basic education and training is a
focus area at many divisions. Further
investment was channelled into training
in technical, sales and general upskilling.
Management training was also stepped
up.
While all training is tailored to the needs
of particular businesses, there is also a
move to refocus training spend to gain
more leverage by investing in selected,
high-potential employees.
We are committed to developing
tomorrow’s managers and supervisors
from within. The benefits of this strategy
were demonstrated during the creation of
Bidvest South Africa and expansion of the
structure. The establishment of 10 distinct
divisions created a need for seven new
CEs and seven FDs, with knock-on
effects throughout each business. With
only one exception, we did not look to the
outside for new leaders and were able to
fill new senior posts with internal talent
without dislocation or delay.
This indicated that our succession
planning is robust and the priority given to
‘people risk’ is warranted.

PASSION/VITALITY/PRECISION
58
Operational reviewBIDVEST SOUTH AFRICA continued
The development of BEE candidates into
senior management remains a challenge.
We continue to improve or entrench gains
across all pillars of the broad-based black
economic empowerment scorecard. The
sole exception is the senior management
area of our employment equity plans. This
will continue to receive focused
management attention as our strong BEE
credentials are a key differentiator and
point of competitive advantage.
Health and safety
Employee health and safety continues to
be a key focus area. Responsibility is
decentralised, with various initiatives
focused on compliance, raising
awareness and procedural training.
Companies monitor and report health and
safety and constantly strive for
improvement. Lost-time injury frequency
rates remain low.
Despite these efforts, we are
disappointed to report nine fatalities. Five
were at Bidvest Services, three at Bidvest
Freight and one at Bidvest Electrical.
Full investigations were conducted and
measures taken to prevent any further
fatalities. Work to improve safety
awareness is continuous.
HIV/Aids awareness, prevention and
treatment
The proportion of employees in southern
Africa who are HIV positive is estimated
to be as high as 15%, although out of
respect for privacy, exact numbers are
not available. Our businesses run various
HIV/Aids programmes. Many offer
voluntary counselling and testing.
Economic equityWe continued our drive towards
economic equity through broad-based
black economic empowerment.
Our scores show further improvement.
Transformation is managed at operational
level in our decentralised structure. Some
companies are ahead of others.
EnvironmentWe are aware of the need to improve our
environmental impact. Initiatives at
divisional and operational level are
reported in divisional reports and in more
detail on our website.
All divisions have taken steps to monitor
water and electricity consumption and
their carbon footprint. There is a
widespread move to develop and highlight
environmentally friendly products.
Examples include the eco-friendly Form
chair and paperless electronic products at
Bidvest Office, the Solo low-pressure solar
geyser system soon to be launched at
Bidvest Electrical and the energy-saving
heat exchangers for Laundries at Bidvest
Rental and Products.
Increasing energy costs sharpen the
ecological imperative to reduce fuel and
electricity consumption. Our businesses
are working to streamline processes,
re-assess logistics and move to newer,
more energy-efficient technologies.
Divisions continue to increase their waste
reduction and recycling.
Product responsibilityThe new Consumer Protection Act (CPA)
has wide-ranging product responsibility
repercussions, particularly relating to
product safety and accurate labelling.
Both retailers and suppliers can be held
responsible by end-users.
With the exception of consumer-facing
businesses such as Bidvest Financial
Services and Bidvest Automotive, most
of our companies operate predominantly
in business-to-business markets where
their business partners are credible and
product lines stable. These operations
have limited exposure to product
responsibility issues such as fair product
labelling and the integrity of customer
information. We monitor our supply
chains and limit our risk exposure by
only supporting approved, reputable
brands.
We are confident of the quality of our
products and services and were well
prepared for the CPA.
ProcurementBEE procurement remains a priority.
Procurement spend overall was
R33,3 billion, of which R21,7 billion was
with empowered suppliers.
Innovation and investmentNo major acquisitions or business
disposals occurred, though the process
of streamlining and rationalisation
continued at Bidvest Automotive.
Infrastructure investment continued and
capital expenditure of R1,7 billion was
committed. Investment at ports to
support Bidvest Freight was an area of
focus. Substantial investment was
channelled on behalf of Bidvest Industrial
into the Bidvest World of Yamaha, a
Bidvest Properties development in
support of one of the division’s flagship
brands.
The creation of Bidvest South Africa gave
added impetus to the development of
Brand Bidvest. Each division carries the
Bidvest name in full while many individual
businesses within the divisions are
engaged in rebranding programmes and
logo redesign to emphasise the Bidvest
connection.

59
PERFORMANCE OVERVIEW
THE BIDVEST GROUP LIMITED / ANNUAL INTEGRATED REPORT 2011
Feedback from operational management
is that Bidvest branding is strongly
positive. Recession and post-recession
trading conditions have placed many
under-resourced competitors under
pressure. Some have struggled to
maintain service standards. Service-led
businesses under the Bidvest banner
provide a reassurance of quality and
reliability. Rebranding initiatives will
continue.
In some cases, a division works within a
single industry (eg Bidvest Automotive
and Bidvest Electrical). Alternatively,
businesses may be grouped together
because they share the same business
model (eg Bidvest Rental and Products).
On other occasions, businesses within a
division straddle sectors with strong
affinity (eg Bidvest Travel and Aviation and
Bidvest Services). This permits synergies
through improved service to shared
customers.
The structure has been expanded,
complexity avoided. There is no clutter.
Clear focus makes it easier to manage
the business, identify growth
opportunities while enabling management
to take rapid remedial action when areas
of under-performance emerge.
The new structure is about renewal.
It empowers our managers to do the
things they know best in the sectors they
understand best. Without distraction,
there is no reason not to do well.
FutureThe pattern of inconsistent rather than
general recovery is expected to continue.
It is doubtful, however, whether
construction activity will rebound in the
short term.
It should also be pointed out that some
adverse factors had growing impact in
the second half of the year, notably
significantly higher electricity tariffs.
High fuel prices are also a concern.
Some economists believe the period of
rand strength may be coming to an end.
If so, fuel prices can be expected to rise
further, impacting our costs and the
disposable income of the underlying
consumer.
On the upside, strong management
teams are in place at all divisions.
Each division is alert for opportunities.
Where appropriate, acquisitions will be
made to close any gaps in our service
offering.
Increased attention will be given to
collaboration and synergies.
All management teams will drive
increased cross-divisional support and
procurement.
We are cautiously optimistic the still
fragile recovery will be maintained and in
2012 have targeted real growth in both
revenue and trading profit.
Empowerment rating 2010
Bidvest, a Level 3 contributor,
with an unconstrained operational
capacity, has a verified rating from
Empowerdex and is positioned fourth
in the services sector.

PASSION/VITALITY/PRECISION
60
One of South Africa’s largest motor vehicle groups offering leading motor brands through 116 dealerships, as well as vehicle auctioneering.
Highlights
McCarthy celebrates 100 years in business
Revenue rises to R18,6 billion across a more streamlined business
Trading profit 10,7% higher at R255,4 million
ROFE up to 27,2%
New vehicle sales up 22,1% to 36 269 units
Concerted B-BBEE effort lifts division to Level 3 status
Systems implemented to facilitate and measure sustainability activities
VW/Audi remains top motor franchise profit contributor
Training spend rises to R93,1 million despite lower staff numbers and challenging trading conditions
Operational review
Revenue
R18,6 billion17,4% increase
Trading profit
R255,4 million10,7% increase
Contribution to Group revenue
15,3%
(Divisional contribution %)
Divisional CSI spend(% of Group CSI spend)
12,7% R7,5m
Employee numbers as a percentage of headcount
5,6% 5 869
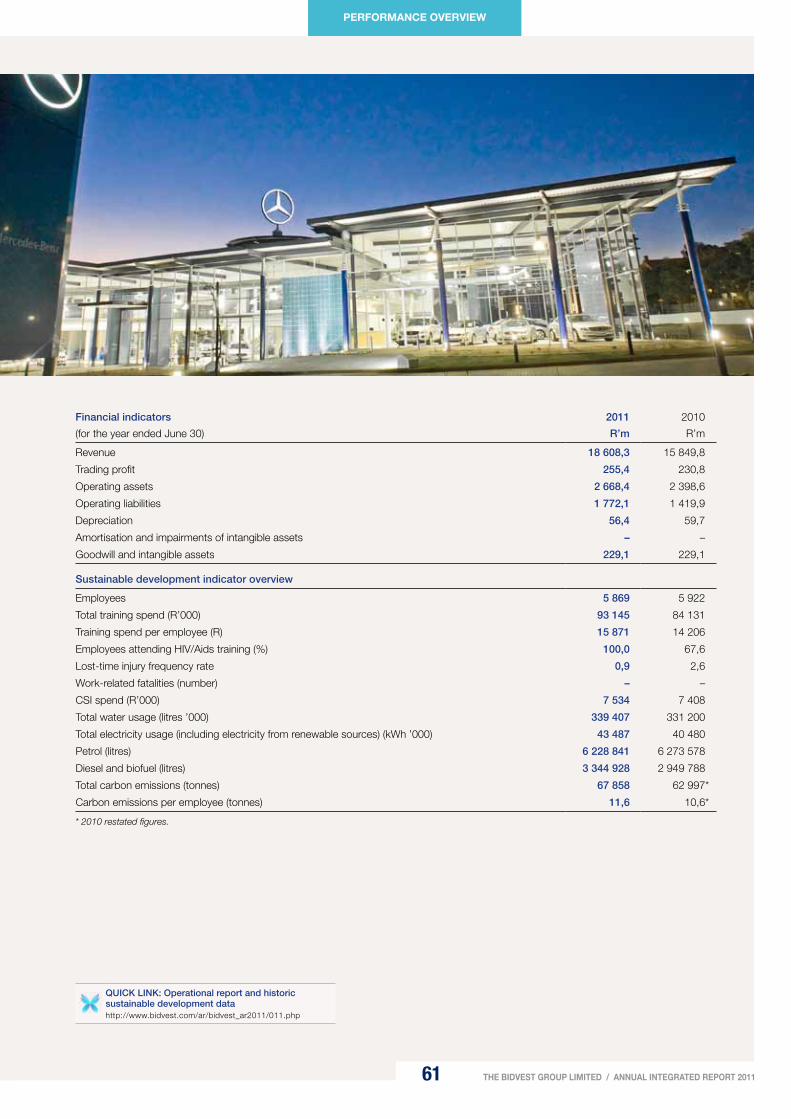
61
PERFORMANCE OVERVIEW
THE BIDVEST GROUP LIMITED / ANNUAL INTEGRATED REPORT 2011
Financial indicators
(for the year ended June 30)
2011
R’m
2010
R’m
Revenue 18 608,3 15 849,8
Trading profit 255,4 230,8
Operating assets 2 668,4 2 398,6
Operating liabilities 1 772,1 1 419,9
Depreciation 56,4 59,7
Amortisation and impairments of intangible assets – –
Goodwill and intangible assets 229,1 229,1
Sustainable development indicator overview
Employees 5 869 5 922
Total training spend (R’000) 93 145 84 131
Training spend per employee (R) 15 871 14 206
Employees attending HIV/Aids training (%) 100,0 67,6
Lost-time injury frequency rate 0,9 2,6
Work-related fatalities (number) – –
CSI spend (R’000) 7 534 7 408
Total water usage (litres ’000) 339 407 331 200
Total electricity usage (including electricity from renewable sources) (kWh ’000) 43 487 40 480
Petrol (litres) 6 228 841 6 273 578
Diesel and biofuel (litres) 3 344 928 2 949 788
Total carbon emissions (tonnes) 67 858 62 997*
Carbon emissions per employee (tonnes) 11,6 10,6*
* 2010 restated figures.
QUICK LINK: Operational report and historic sustainable development datahttp://www.bidvest.com/ar/bidvest_ar2011/011.php

PASSION/VITALITY/PRECISION
62
Operational review
Bidvest Automotive continued
Business context and trading conditionsTrading was highly competitive. Intense
price-based competition put motor
retailing margins under constant
pressure.
A strong rand contributed to new vehicle
price deflation in real terms. Corporate
customers remained cautious.
Slower retail activity in the second half
was the result of steady dissipation in
the strength of replacement demand,
supply shortages after the Japanese
tsunami and growing pressure on
disposable income.
Supply challenges were sharpened by
strike action affecting both local
manufacturers and component-makers.
Industry projections are that new car
sales for calendar year 2011 will rise
12%. To capitalise on this expected
market improvement, we launched a
focused effort to improve the conversion
rate of leads into sales using the Client
For Life management tool and the
Call-a-Car online dealership platform.
Results were encouraging.
Used vehicle prices were depressed by
de-fleeting after the Soccer world cup.
Used vehicle volumes were down 11,2%
and used vehicle profitability fell
substantially. Deflationary pricing
narrowed the price gap between new
and used vehicles, prompting a major
swing towards new units.
CO2 emissions taxes were introduced on
new vehicles in October 2010 and a
dramatic increase in perks tax on
company vehicles took effect in March
2011. Both led to buying-down.
The introduction of the Gautrain from
Johannesburg to Pretoria represents a
risk as it will reduce vehicle mileage and
wear and tear, impacting service
revenue.
We anticipate the introduction of e-tolling
in Gauteng will prompt a noticeable shift
from vehicle ownership.
The most significant change was our
restructure to become a dedicated
automotive business. Focusing on core
competences helped us achieve
continued efficiencies, while giving
further impetus to rationalisation. Our
streamlined business proved well-
adapted to an industry now
characterised by strong competitive
pressures. As we are no longer in the
vehicle import business, currency risk
eased.
Rationalisation resulted in the closure of
eight dealerships, but we opened new
dealerships in Hatfield and Midrand.
Capital expenditure was R52 million, up
from R47 million.
Material issues
Japanese earthquake and tsunami have adverse effects on the supply of new vehicles and parts
Declining vehicle parc (the number of vehicles on the road) resulting in lower contributions from parts sales and workshop services
Share of the national dealer market remained flat
Extreme reliance on business and consumer confidence, which has declined since 2008
Effect of economic downturn and legislation on turnover and business practices
Retaining customer loyalty through responsible business practices
Difficulty in attracting and retaining senior level HDIs
Talent attraction and retention
Impact of increasing fuel prices and stricter emission standards on sales in certain vehicle categories
Imperative to grow the value segment of the vehicle market
Management of workplace HIV/Aids
Impact of crime on dealerships
Effect of fringe benefit tax increase

63
PERFORMANCE OVERVIEW
THE BIDVEST GROUP LIMITED / ANNUAL INTEGRATED REPORT 2011
Performance
In the restructure, income was lost from
several entities realigned to sister
divisions, and dealership closure and
retrenchment costs of R18,1 million were
absorbed.
In these circumstances, the division put
in a satisfactory showing and
demonstrated renewed vigour as
McCarthy celebrated 100 years in
business.
Revenue rose 17,4% to R18,6 billion
(2010: R15,9 billion) while trading profit
moved 10,7% higher to R255,4 million
(2010: R230,8 million).
Expense management remained intense
and ROFE increased to 27,2%. Trading
margin narrowed from 1,5% to 1,4%.
New vehicle sales rose 22,1% to almost
36 300 units (up from 29 700). Used
vehicle sales fell 11,2% from
approximately 42 600 to 37 800.
Challenges related to vehicle auction
activities, used vehicle sales and parts
and service volumes.
SustainabilityWe approach sustainability holistically,
based on a balanced scorecard that
addresses compliance, social,
environmental and economic impacts.
Our sustainability strategy and action
plan is based on a GAP analysis
comparing our performance to global
trends and actions linked to GRI
guidelines. We gathered employee input
and developed a business case for
sustainability.
We approved a sustainability charter,
established a sustainability committee
and assigned sustainability champions.
We conducted an initial carbon footprint
assessment and have begun to upgrade
systems to obtain more accurate data
for future reporting. The exercise
identified two focus areas: climate
change and waste management. We
developed a sustainability awareness
strategy to mobilise employees.
Our targets are:
• toreduceelectricityconsumptionby
10% by 2012;
• actionplansatallbusinessesbythe
end of the 2011 calendar year for
electricity reduction, water savings
and waste management; and
• toimplementasustainabilitystructure
and monitoring by the end of the 2011
calendar year.
Various initiatives are already being
pursued to reduce energy and water
consumption.
For the first time, we are using budgetary
processes to drive sustainability-related
efficiencies. Operational managers will
not be allowed to pass on electricity, fuel
and water price increases when
preparing budgets. Only a portion of the
increase will be admitted into cost
calculations, incentivising efficiency.
The number of employees attending HIV/
Aids training increased and the lost-time
injury frequency rate fell by 67%,
reflecting improved health and safety
awareness.
We invested over R7,5 million in various
social initiatives. Our main focus
continues to be the Rally to Read
programme to improve the quality of
literacy teaching. The programme
supports 134 rural primary schools. We
contributed approximately R4,7 million
this year, benefiting more than
43 200 learners and 1 400 teachers.
We also contributed to community
development projects and programmes
addressing HIV/Aids.

PASSION/VITALITY/PRECISION
64
A leading manufacturer and distributor of electrical products and services.
Highlights
Market share maintained in difficult market conditions
National representation and broad stock availability maintained while rationalising structures
New computer system implemented in wholesale business
Leaner structure and dedicated electrical focus a catalyst for closer integration with Versalec
Continued B-BBEE commitment resulted in AAA rating and status as a Level 2 contributor
Voltex wins empowerment award
Operational review
Revenue
R4,1 billion3,1% increase
Trading profit
R181,8 million6,2% decrease
Contribution to Group revenue
3,4%
(Divisional contribution %)
Divisional CSI spend (% of Group CSI spend)
0,3%R0,2m
Employee numbers as a percentage of headcount
2,1%2 184
Stanley GreenChief executive

65
PERFORMANCE OVERVIEW
THE BIDVEST GROUP LIMITED / ANNUAL INTEGRATED REPORT 2011
Financial indicators
(for the year ended June 30)
2011
R’m
2010
R’m
Revenue 4 100,4 3 978,3
Trading profit 181,8 193,9
Operating assets 1 744,5 1 588,4
Operating liabilities 742,9 775,4
Depreciation 15,3 15,1
Amortisation and impairments of intangible assets 2,7 0,7
Goodwill and intangible assets 76,0 53,2
Sustainable development indicator overview
Employees 2 184 2 181
Total training spend (R’000) 10 158 40 585
Training spend per employee (R) 4 651 18 608
Employees attending HIV/Aids training (%) 9,2 3,3
Lost-time injury frequency rate 3,7 1,2
Work-related fatalities (number) 1 –
CSI spend (R’000) 161 341
Total water usage (litres ’000) 63 296 67 240
Total electricity usage (including electricity from renewable sources) (kWh ’000) 6 109 6 278
Petrol (litres) 1 684 624 1 550 786
Diesel and biofuel (litres) 1 738 664 1 615 255
Total carbon emissions (tonnes) 14 890 14 418
Carbon emissions per employee (tonnes) 6,8 6,6
QUICK LINK: Operational reporthttp://www.bidvest.com/ar/bidvest_ar2011/012.php
PASSION/VITALITY/PRECISION
66
Operational review
Bidvest Electrical continued
Business context and trading conditionsBidvest Electrical is the largest electrical
distributor in South Africa. The division
comprises 73 general electrical
distributors and eight specialised
divisions, including energy services,
power sources, power distribution and
engineering and project management.
Our exclusive electrical focus after
restructuring has enabled us to
concentrate on core challenges and
opportunities. Clearer operational focus
across our streamlined division was
good for team spirit at a time when the
construction industry was at a 40-year
low. Collaboration at regional
management level shows continued
improvement.
No major capital expenditure was
incurred and rationalisation of the branch
structure continued. The number of
branches fell by three to 73; the result of
consolidation rather than outright
closure. This enabled us to relocate staff
whenever possible. Despite
downscaling, the business maintained its
national representation.
The construction industry contracted in
some regions while zero growth was
reported in others. Both government
tender activity and private sector
developments were at a low ebb.
Demand from contractors for cable,
electrical fittings and other products was
extremely low. Volumes and margins
remained depressed for a second year.
Trading activity was also down.
Previously, speculative buying of
additional cable inventory was a feature
of buying patterns by some customers,
but firm copper prices and doubts about
the ability to on-sell cable stock inhibited
this type of purchasing.
The only sign of recovery occurred in the
retail sector among some stockists of
building and home improvement
supplies.
Business failures among wholesalers and
contractors highlighted the severity of
the slump in construction activity.
Exports to Botswana and Swaziland
were disappointing, but some
encouraging successes were achieved in
Zambia.
Fuel prices and toll charges are a risk.
Our multi-branch distribution model
creates opportunities to manage costs
by strategic stockholding at key points,
an advantage over more centralised
competitors. Stockholding and
distribution routes and frequencies will
be re-examined as we anticipate new toll
fees on greater Johannesburg highways.
Bidvest Electrical spent R25 million
completing new IT systems.
Implementation across all wholesale
branches was completed and roll-out
began in specialist branches. The fully
integrated real-time system helped
management achieve further efficiencies.
The Western Cape region used its
database to launch a direct marketing
campaign, also achieving closer
interaction with its market through
meet-the-customer events, supplier
functions and product launches.
PerformanceWith the construction industry still in
recession, teams did well to retain
market share and maintain revenue at
R4,1 billion (2010: R4,0 billion). Trading
profit dipped by 6,2% to R181,8 million
(2010: R193,9 million). Operational
performance was satisfactory in such
challenging conditions.
Teams focused on internal efficiencies
and working capital management.
Branch consolidation and rationalisation
continued, without leaving significant
gaps in network coverage. Our
reputation for providing national
availability of the widest range of
electrical supplies was maintained.
Despite a protracted strike, Atlas Cables
achieved record sales in a shrinking
market. Certain regions were hit harder
than others, with some branches
Material issues
Challenges of operating in recessionary economic conditions
Changes in nationwide policies, including government pledges to reduce carbon emissions and Eskom energy-efficiency rebates
Skills development
Succession planning
Educating customers and staff on sustainability

67
PERFORMANCE OVERVIEW
THE BIDVEST GROUP LIMITED / ANNUAL INTEGRATED REPORT 2011
reporting poor results. Improvements
were seen at Voltex Retail and Waco
performed at acceptable levels, but
Sanlic results were disappointing.
ROFE of 20% was achieved. Rigorous
focus on credit management was
maintained.
Our sustained commitment to
transformation was recognised at the
10th annual Metropolitan ‘Oliver’
Empowerment Awards, at which Voltex
was saluted as top empowerment
achiever in the retail category.
SustainabilityBidvest Electrical is constantly seeking
ways to use resources more efficiently
and reduce waste. We are exploring a
cross-divisional initiative to assist other
Bidvest companies with energy-saving
programmes and demonstrate the
benefits of moving to low-consumption
equipment. Lighting is one area in which
we can make a substantial difference,
both through our own interventions and
through engaging with suppliers on
energy-saving equipment.
Many of our products are designed to
improve energy efficiency and increase
the use of renewable sources. Examples
include our solar products and energy-
saving equipment such as efficient heat
pumps. Our upcoming economical
low-pressure geyser system represents a
major step forward in energy
management and solar power. The
product is targeted at low-cost housing
developments and addresses both
energy and social issues.
We also recognise the need to educate
customers about sustainability. Our
people contribute to this, helping
customers choose more sustainable
products. We have also initiated
‘customer evenings’ that enable us to
host product-related discussions and
convey information to our support base.
We deeply regret that there was one
fatality at Bidvest Electrical this year, in a
car accident. We send our condolences
to Ben VusuMuzi’s family. Full enquiries
were conducted in accordance with
regulations, and all efforts are being
taken to further enhance safety
awareness throughout the division.
Training spend fell, reflecting the fact that
only five Voltex candidates entered
management development training this
year compared to 20 in 2010. Owing to
recessionary conditions social
investment also fell. Lost-time injury
frequency rate increased, highlighting the
importance of continued emphasis on
safety awareness. Health campaigns led
to a significant increase in staff
attendance of HIV/Aids training.

PASSION/VITALITY/PRECISION
68
A comprehensive range of banking products and services, specialising in foreign exchange and insurance.
Highlights
Revenue up 13,7% to R1,7 billion while trading profit moves 15,1% higher to R641,6 million
Total assets at refocused insurance business rise to R884,4 billion
Deposits up from R1,18 billion to R1,36 billion
Level 3 status achieved after sustained improvement in B-BBEE scores
Wider customer-base includes an increasing number of listed companies
Business strongly cash generative
Strong capital position ensures bank qualifies well ahead of Basel III deadline
String of awards for quality performance
Operational review
Revenue
R1,7 billion13,7% increase
Trading profit
R641,6 million15,1% increase
Contribution to Group revenue
1,4%
(Divisional contribution %)
3,3% R2,0m
Divisional CSI spend (% of Group CSI spend)
Employee numbers as a percentage of headcount
1,2% 1 228
Alan SalomonChief executive

69
PERFORMANCE OVERVIEW
THE BIDVEST GROUP LIMITED / ANNUAL INTEGRATED REPORT 2011
Financial indicators
(for the year ended June 30)
2011
R’m
2010
R’m
Revenue 1 676,7 1 474,4
Trading profit 641,6 557,6
Operating assets 3 007,8 2 571,0
Operating liabilities 1 901,7 1 640,3
Depreciation 249,0 302,5
Amortisation and impairments of intangible assets 9,2 5,6
Goodwill and intangible assets 51,0 51,7
Sustainable development indicator overview
Employees 1 228 1 253
Total training spend (R’000) 16 465 15 146
Training spend per employee (R) 13 408 12 088
Employees attending HIV/Aids training (%) 94,5 72,9
Lost-time injury frequency rate – –
Work-related fatalities (number) – –
CSI spend (R’000) 1 956 1 130
Total water usage (litres ’000) 11 557 10 903
Total electricity usage (including electricity from renewable sources) (kWh ’000) 13 621 4 723
Petrol (litres) 303 968 286 762
Diesel and biofuel (litres) 58 503 55 192
Total carbon emissions (tonnes) 14 800 5 569
Carbon emissions per employee (tonnes) 12,1 4,4
QUICK LINK: Operational report and historic sustainable development datahttp://www.bidvest.com/ar/bidvest_ar2011/013.php

PASSION/VITALITY/PRECISION
70
Operational review
Bidvest Financial Services continued
Business context and trading conditionsAt Bidvest Financial Services, we
understand that sustainable business
means returning to the basics and
ensuring sound business policies and
practices.
The core of our business has always
been foreign exchange, in which we
have a 150-year history, itself a
demonstration of long-term sustainability.
Acquiring our banking licence in 2000
signified entry into a highly regulated
environment with associated costs and
administrative commitments.
In 2005, we extended our offering into
specialist fields by supplying foreign
corporate exchange services through the
internet, leading to rebranding as Bidvest
Bank. This enhanced image enabled us to
move into more traditional banking, growing
our deposits and specialist lending
business in a process that has gained
momentum over the last three years. The
growth and new product offerings of our
insurance business has also been an area
of focus.
Our core revenue generators remain in
corporate foreign exchange. We have
developed a sales force of almost 100
people to drive our penetration of this
large market. We have developed a card
division that offers a range of products
linked to foreign exchange, including our
world currency card. We recognise
significant market opportunities in our
core areas and rather than look to other
types of banking, we drive this core
potential in a way that broadens our
revenue streams.
Thanks to appropriate training
investment and adaptable teams, the
challenge of bedding down the 2010
acquisition of the vehicle fleet and asset
financial service business was
successfully met while adhering to all
regulatory requirements.
The economic downturn since 2008 has
been accompanied by a trend towards
increasingly stringent regulation of many
sectors, banking in particular. Bidvest
Bank is deeply committed to ensuring
its compliance with all acts and
regulations. We have built a team of
over 70 governance and compliance
specialists.
Following the international financial crisis
that started in 2007, a Basel III
framework has been developed that
includes an enhanced Basel II and
apparatus to limit system-wide financial
distress. Bidvest Bank already complies
with Basel III, demonstrating strong
compliance commitments as the
requirements only come into force in
2015 and 2018.
Employees receive regular training on
all policies and procedures relevant to
their roles and responsibilities. Line
management is responsible for
ensuring compliance by employees
with laws, regulations, policies and
procedures. Compliance is monitored
by the compliance, internal audit and
forensic investigations and security
departments. All instances of non-
compliance are reported and
disciplinary action taken.
Strategic widening of the scope of our
business was the major change, initially
driven by the integration of the fleet
services business. The process was
reinforced by the Bidvest South Africa
restructure which positioned us as an
autonomous banking and insurance
services business.
Capital expenditure increased to
R768,0 million (2010: R689,6 million),
reflecting the increased size of the
business after the acquisition of the
vehicle fleet and asset finance business.
The number of retail banking branches
rose from 88 to 90.
Material issues
Ensuring full and current compliance with all regulations and responsible banking practices across all levels of the company
Finding ways to continue to diversify our revenue streams and broaden our customer base
Continued focus to reduce losses to crime
Attracting and retaining senior historically disadvantaged individuals
Improved efficiency, productivity and the elimination of expense waste
Succession planning
Challenging trading conditions in a strong rand, low-interest rate environment
Slow economy due to impact of worldwide recession

71
PERFORMANCE OVERVIEW
THE BIDVEST GROUP LIMITED / ANNUAL INTEGRATED REPORT 2011
The bank made substantial investment in
information technology in the form of
technical skills, infrastructure and
systems. Disaster recovery was
enhanced and successfully tested.
Expansion of the product range
continued. Bidvest Bank became the
first South African financial institution to
include Chinese yuan as a standard
offering in its range of foreign banknotes.
Our range of currency cards was
continually expanded while a growing
number of depositors opened seven-day
call accounts.
We also launched a private client foreign
exchange service, taking advantage of
the quality profile of our core customer
base.
The bank built on its lead as the South
African pioneer of internet-based foreign
payment and receipt technology by
further collaboration with our global
payments partner at Travelex. By
year-end, we were preparing to launch a
rebranded, updated web-based
corporate settlement service – Bidvest
Bank Global Payments Online™.
PerformanceThe division put in an exceptionally
strong performance, benefiting from a
much-expanded range of activities.
We achieved significant diversification
without taking on bad debt. By year-end,
the division had emerged as one of the
largest corporate vehicle and asset
leasing businesses in South Africa as
well as a leading foreign exchange
specialist.
Operating profit rose 16,1% to R639,5
million (2010: R551,0 million). There
were no significant write-downs or
write-offs.
Deposits showed pleasing growth to
R1,3 billion (2010: R1,1 billion), reflecting
the success of efforts to widen the
customer base. Our business customers
include growing numbers of listed
companies.
Total assets at our refocused insurance
business increased from R723,6 million
to R884,4 million. Insurance policy
volumes grew.
Our teams were tasked with achieving
stronger marketplace positioning and by
year-end the business enjoyed
increasing recognition for creating the
most effective pre-paid foreign currency
debit and ATM card for overseas
travellers, providing the sector’s widest
range of foreign bank notes and offering
the lowest cost bank account for
unlimited banking transactions.
Our reputation as the bank offering the
longest banking hours became a strong
differentiator.
Bidvest Bank won the ACSA Feather
Award as best landside retailer at
Johannesburg’s OR Tambo International
Airport – one of the most coveted
awards in the airports industry. The bank
also took the ACSA Feather Award as
best financial services provider at Cape
Town International Airport.
The bank currently carries the Moody’s
rating of A3.za/P-2/za, with a stable
outlook.
SustainabilityOur workplace environment continues to
expand as our business grows. We
launched a successful effort to create a
unified culture as the business moved
from its Rivonia premises to larger offices
in Braamfontein. To support our people,
our human resources function was
significantly strengthened.
Teams from an automotive asset-based
finance and insurance background
rapidly adjusted to a much broader role.
Without losing the benefits of their
vehicle retailing roots, they increasingly
grasp the wider potential offered by new
positioning as providers of a wide range
of insurance services to a broader
customer base.
In line with our goal to improve BEE
scores, we increased training initiatives,
with spend per employee rising by
almost 11%. We also increased our
social investment spend, helping the
division achieve Level 3 BEE contributor
status.
Bidvest Bank is conscious of its
environmental responsibilities. While the
business has a fairly low direct impact,
we are working towards paperless
administrative systems as we develop
new products in our niche markets. We
recycle waste paper.

PASSION/VITALITY/PRECISION
72
The leading private sector freight management group in sub-Saharan Africa, consisting of several independent businesses focusing on terminal operations and logistics, international clearing and freight forwarding, logistics and marine ships agency and insurance services.
Highlights
Trading profit rises 11,6% to R886,2 million
Bulk commodities drive high-capacity utilisation
Record volumes of agricultural products handled
Strong turnaround in the clearing and forwarding business
R314,6 million in new investment
Resourceful teams compensate for rail challenge by record truck throughput
Efficiency drive at harbour-based operations to optimise space and combat the effects of limited berth capacity
Operational review
Revenue
R19,3 billion20,8% increase
Trading profit
R886,2 million11,6% increase
Contribution to Group revenue
15,8%
(Divisional contribution %)
8,5% R5,1m
Divisional CSI spend (% of Group CSI spend)
Employee numbers as a percentage of headcount
4,5% 4 761
Anthony DaweChief executive

73
PERFORMANCE OVERVIEW
THE BIDVEST GROUP LIMITED / ANNUAL INTEGRATED REPORT 2011
Financial indicators
(for the year ended June 30)
2011
R’m
2010
R’m
Revenue 19 253,3 15 941,9
Trading profit 886,2 794,3
Operating assets 3 467,6 3 162,7
Operating liabilities 2 313,9 2 090,0
Depreciation 169,2 144,7
Amortisation and impairments of intangible assets 6,3 9,2
Goodwill and intangible assets 91,5 75,2
Sustainable development indicator overview
Employees 4 761 4 860
Total training spend (R’000) 25 883 23 926
Training spend per employee (R) 5 436 4 923
Employees attending HIV/Aids training (%) 37,9 33,3
Lost-time injury frequency rate 6,9 6,5
Work-related fatalities (number) 3 2
CSI spend (R’000) 5 052 4 938
Total water usage (litres ’000) 382 693 332 477
Total electricity usage (including electricity from renewable sources) (kWh ’000) 45 953 49 836
Petrol (litres) 571 970 542 642
Diesel and biofuel (litres) 6 808 363 6 081 342
Total carbon emissions (tonnes) 65 636 71 757
Carbon emissions per employee (tonnes) 13,8 14,8
QUICK LINK: Operational report and historic sustainable development datahttp://www.bidvest.com/ar/bidvest_ar2011/014.php

PASSION/VITALITY/PRECISION
74
Operational review
Bidvest Freight continued
Business context and trading conditionsThe financial year was buoyant. The
freight business is volume-driven and
congestion can be a significant problem,
both in harbour areas and on roads. The
quality and limited capacity of roads and
harbours has a major impact on our
business. A modal shift from rail to road
transport has led to an increase in
congestion at our terminals. This
necessitates ongoing engagements with
Transnet Freight Rail. Our employees did
well to expedite higher volumes in this
difficult working environment.
This year we began to set sustainability
targets for the division.
International demand for commodities
remained strong while the beginning of a
revival in South Africa’s retail economy
was positive for the import of
manufactured goods. Air freight volumes
improved and it was another year of
good maize harvests.
Bulk commodities were in demand and
our throughput of bulk liquids and
vegetable oils increased significantly. The
full-year effect of the 60 000m³
expansion of our Island View Storage
tankage at Richards Bay was also
beneficial.
There was little uniformity in demand
patterns as import and export volumes
for automotive components and fully
built vehicles rose but wine exports
stalled in the face of the strong rand.
Forestry product volumes were again
sluggish and aid cargoes into other parts
of Africa were down.
Capital expenditure of R314,6 million
was committed. We are half way through
a R200 million two-year investment
programme at Bulk Connections in
Durban. This programme will convert
under-used capacity, allowing Bulk
Connections to handle copper
concentrates, manganese, sized coal
and other bulk products.
A R20 million investment was made in
Safcor Panalpina’s CargoWise software,
driving efficiencies throughout the
business.
PerformancePerformance was strong following the
previous year’s dip in volumes. Trading
profit rose 11,6% to R886,2 million (2010:
R794,3 million) while revenue moved
20,8% higher to R19,3 billion (2010:
R15,9 billion).
The performance of our people was
particularly noteworthy. Rail bottlenecks,
road congestion and pressure on national
ports infrastructure created knock-on
challenges for operational teams. Despite
these difficulties, the people of Bidvest
Freight put in a sterling effort to optimise
the opportunities presented by economic
recovery and rising trade volumes. Bulk
businesses did particularly well, especially
SABT. Pleasing performance was
registered at IVS, BPO and Safcor
Panalpina.
SustainabilityBidvest Freight has invested to manage
the environmental impact of bulk handling,
as demonstrated by our awards success
and upgrades to our terminals. Several
initiatives underline our environmental
commitment:
• atBulkConnections,aR200million
terminal and environmental upgrade is
in progress. This has cut water
consumption and reduced dust from
operations, improving air quality;
• thenewSACDFreightCapeTown
building incorporated various
sustainability initiatives, including the
Material issues
Congestion at ports, restricting volumes of freight moved
The sustainability of profits and the business
The need to minimise our impact on the environment
The safety of our employees in a potentially hazardous working environment
Investing in skills and ensuring they are transferred and retained within the business
Transformation of our workforce and businesses
The health and wellness of our staff
Compliance with laws and regulations of countries in which we operate
Effective and timely reporting

75
PERFORMANCE OVERVIEW
THE BIDVEST GROUP LIMITED / ANNUAL INTEGRATED REPORT 2011
reuse of building materials and
increased use of natural light to
reduce power usage;
• SouthAfricanBulkTerminalsinvested
significantly to maintain surrounding
areas and regulate traffic flow around
our terminals;
• IslandViewStoragehas
ISO 14001:2004 accreditation at all its
terminals; and
• ongoingenvironmentaltrainingand
awareness programmes for
employees.
Overall diesel consumption increased by
12,0% as new trucks and equipment
were purchased to handle volumes. We
implemented various initiatives to reduce
diesel consumption, focusing on greener,
more efficient technologies, improved
monitoring and driver training to
maximise fuel efficiency.
The division’s overall electricity
consumption fell. A number of initiatives
were implemented, focusing on
operational and energy efficiency,
particularly lighting.
Operations continue to focus on
minimising waste sent to landfills while
increasing the amount recycled. Rennies
Distribution Services achieved its target
of recycling at least 60% of waste.
Growing maize volumes underline the
challenge of reducing dust levels, which
affect air quality. At South African Bulk
Terminals, a R160 million upgrade for
Durban Bulk Shipping (Island View) is in
the final stages of planning. This will
replace current equipment and enable
the terminal to handle grain in an
environmentally friendly manner at the
normal speed. Other initiatives include
monitoring the environmental impact of
dust and an upgraded water mist
suppression system to further reduce
airborne dust.
Bulk Connections has launched a variety
of initiatives to combat the dust
generated from handling bulk products.
Despite our stringent training and safety
measures, Bidvest Freight regrettably
recorded three fatalities including the
death of one contract worker. Full
investigations were conducted into these
fatalities, and we are taking additional
measures to reinforce safety awareness.
We are a significant employer integral to
certain port communities, especially in
Durban. Beyond the employment
opportunities we offer, we aim to have a
positive impact wherever possible and
have an overarching corporate social
investment policy that focuses on
education and HIV/Aids.
Each business implements CSI initiatives
to address needs in the communities in
which it operates. Most Bidvest Freight
companies contribute to education
initiatives. Businesses assist soup kitchens
and street shelters, sponsor HIV/Aids
projects and raise funds for cancer
sufferers. We contributed R5 million to our
projects.

PASSION/VITALITY/PRECISION
76
Offers a full range of Yamaha products, materials handling and imports, electrical appliances, houseware products, packaging closures and catering equipment.
Highlights
Revenue rises 3,6% to R1,5 billion (2010: R1,4 billion) despite tough industry conditions
The new Bidvest World of Yamaha opened
New materials handling business was quick to build momentum
Buffalo Executape achieves sales and profit growth
Capital expenditure rises 122% to R22,5 million
Collaborative, executive-led sales drive achieves early success
Operational review
Revenue
R1,5 billion3,6% increase
Trading profit
R118,4 million11,7% decrease
Contribution to Group revenue
1,2%
(Divisional contribution %)
0,2% R0,1m
Divisional CSI spend (% of Group CSI spend)
Employee numbers as a percentage of headcount
1,3% 1 375
Howard GreensteinChief executive

77
PERFORMANCE OVERVIEW
THE BIDVEST GROUP LIMITED / ANNUAL INTEGRATED REPORT 2011
Financial indicators
(for the year ended June 30)
2011
R’m
2010
R’m
Revenue 1 486,4 1 434,8
Trading profit 118,4 134,2
Operating assets 736,8 736,5
Operating liabilities 253,8 226,8
Depreciation 13,7 9,5
Amortisation and impairments of intangible assets 1,0 0,2
Goodwill and intangible assets 28,6 26,8
Sustainable development indicator overview
Employees 1 375 1 236
Total training spend (R’000) 4 986 1 601
Training spend per employee (R) 3 626 1 295
Employees attending HIV/Aids training (%) 7,8 0,7
Lost-time injury frequency rate 6,7 6,4
Work-related fatalities (number) – –
CSI spend (R’000) 132 221
Total water usage (litres ’000) 36 862 36 471
Total electricity usage (including electricity from renewable sources) (kWh ’000) 7 016 6 312
Petrol (litres) 789 234 825 656
Diesel and biofuel (litres) 557 041 399 600
Total carbon emissions (tonnes) 10 595 9 994
Carbon emissions per employee (tonnes) 7,7 8,1
QUICK LINK: Operational reporthttp://www.bidvest.com/ar/bidvest_ar2011/015.php
PASSION/VITALITY/PRECISION
78
Operational review
Bidvest Industrial continued
Business context and trading conditionsBidvest Industrial comprises both
manufacturing and trading businesses,
which means we are sensitive to a wide
range of macro-economic and political
developments.
Business conditions were difficult from
the outset. Competition was intense and
discounting rife. Some competitors
made heavy price cuts to reduce stock.
‘Grey market’ imports added further
pressure. The rand and yen were strong
throughout the year, compounding the
trading challenge.
Some areas of the business saw
improvements. Certain segments of the
automotive industry showed continued
recovery, but general manufacturing
remained depressed.
As local representatives of strong global
brands, we are exposed to the risk of
brand principal loss. We address this
through continued infrastructure and
training investment in support of our
brands and maintain a high profile
nationwide.
We face currency risk (both rand and
yen), but this exposure has traditionally
been well managed. We have robust
processes to manage credit risk. No
significant losses were experienced.
We are exposed to knock-on effects
when a downturn in industry sectors
reduces demand among our business-
to-business customers. This risk is
mitigated by diversification. Yamaha is a
strong retail brand and Buffalo
Executape has penetrated the retail
market with selected self-adhesive
products.
The Bidvest South Africa restructuring
that created our focused industrial
division was a highly positive
development. Each business within
Bidvest Industrial has a well-defined role
in a distinct field of operations. Our
challenge is to build from this base by
leveraging core competencies.
Businesses in our division have not
traditionally shared customers. This
presented us with potential for new
growth. Senior managers in each
business launched a cross-selling drive
to secure new contracts by introducing
prospective customers to other
companies in our division. This
executive-led referral approach is
delivering promising results.
Close collaboration to achieve sustained
sales and efficiency gains is ongoing.
Capital investment rose from R20 million
to R110 million. The largest commitment
was the R65 million invested in the
Bidvest World of Yamaha project at the
M1 Gateway to Johannesburg. The
Marlboro facility was officially opened in
May. The concept is a world first. We are
the only distributor worldwide (including
Japan) to carry all Yamaha’s products
from musical instruments to jet skis – an
indication of the strength of this
relationship. The project reportedly
represents the largest single investment
in South Africa’s motorcycle industry.
We invested R12 million on the
refurbishment and expansion of Vulcan
Catering Equipment’s facilities in Cape
Town and Johannesburg.
Bidvest Materials Handling bedded in
well after being transferred between
Bidvest divisions. The business holds the
exclusive South African rights for the
distribution of the Nissan range of forklift
trucks and warehousing equipment.
PerformanceDivisional revenue increased 3,6% to
R1,5 billion (2010: R1,4 billion), a
satisfactory performance in adverse
industry conditions. Trading profit fell by
11,7% to R118,4 million (2010:
R134,2 million). Trading margins
narrowed to 7,9% (2010: 9,3%) while
ROFE dipped to 23,9%. Inventory
management was rigorous across all
teams, especially Yamaha.
Material issues
Challenge of succeeding in difficult economic and political conditions
Improving our B-BBEE performance across the business
Reducing our consumption of water, fuel and electricity
Attracting and retaining the necessary skill-sets at senior levels

79
PERFORMANCE OVERVIEW
THE BIDVEST GROUP LIMITED / ANNUAL INTEGRATED REPORT 2011
The Yamaha distribution business put in
a steady performance.
It was our first full year in materials
handling. The new addition to our
division did well to build and maintain
early momentum.
SustainabilityEmployee numbers increased from
1 236 to 1 375. Although we had to
retrench a small number of people,
30 new jobs were created at the Bidvest
World of Yamaha and additional people
were hired by our new materials handling
business.
In July Afcom and Vulcan were affected
by an industry-wide two-week strike.
Deliveries were impacted. A new
three-year wage agreement was
subsequently reached.
Owing to reduced net profit, corporate
social investment spend fell significantly
this year. However, training efforts were
boosted at several companies and the
growth of the materials handling
business also contributed to a large
increase in training spend.
While energy supply has been stable, the
high cost is a continuing concern. All
businesses intensified their efforts to
improve energy and fuel efficiency. At our
manufacturing plants, we have switched
to low-voltage lighting systems and
reduced load pressure by starting
machines gradually, one by one.
However, machines for manufacturing
remain heavy users of power. Efforts to
improve the efficiency of these and other
processes are ongoing.
Wherever possible, we recycle water and
waste materials. Scrap plastic (mostly
polypropylene and PET) is chipped and
reprocessed.

PASSION/VITALITY/PRECISION
80
A leading distributor of office products, including stationery, furniture (seating and desking) and technology (copying, digital printing and cash handling systems).
Highlights
Trading profit 9,2% higher at R215 million
Konica Minolta enters radiology market
Océ creates bridgehead into digital full-colour printing
Cecil Nurse brand reintroduced
Furniture manufacturing centralised and consolidated
Global Payment Technologies drives strategic expansion of customer base
Konica Minolta is ‘green leader’ in office equipment
Seating’s Form concept is now the preferred ‘green chair’ for corporates
Operational review
Revenue
R3,7 billion5,3% increase
Trading profit
R215,4 million9,2% increase
3,0%
Contribution to Group revenue(Divisional contribution % )
4,6%R2,7m
Divisional CSI spend (% of Group CSI spend)
Employee numbers as a percentage of headcount
4,1%4 256
Alan GriffithChief executive

81
PERFORMANCE OVERVIEW
THE BIDVEST GROUP LIMITED / ANNUAL INTEGRATED REPORT 2011
Financial indicators
(for the year ended June 30)
2011
R’m
2010
R’m
Revenue 3 684,6 3 497,6
Trading profit 215,4 197,3
Operating assets 1 301,9 1 277,8
Operating liabilities 680,1 652,1
Depreciation 51,7 52,2
Amortisation and impairments of intangible assets 6,1 9,4
Goodwill and intangible assets 90,5 90,7
Sustainable development indicator overview
Employees 4 256 4 241
Total training spend (R’000) 11 993 15 538
Training spend per employee (R) 2 818 3 664
Employees attending HIV/Aids training (%) 45,4 38,5
Lost-time injury frequency rate 8,7 4,9
Work-related fatalities (number) – –
CSI spend (R’000) 2 718 2 600
Total water usage (litres ’000) 78 712 101 564
Total electricity usage (including electricity from renewable sources) (kWh ’000) 15 679 18 852
Petrol (litres) 1 770 957 2 041 354
Diesel and biofuel (litres) 1 267 278 1 290 186
Total carbon emissions (tonnes) 24 067 27 959
Carbon emissions per employee (tonnes) 5,7 6,6
QUICK LINK: Operational reporthttp://www.bidvest.com/ar/bidvest_ar2011/016.php

PASSION/VITALITY/PRECISION
82
Operational review
Bidvest Office continued
Business context and trading conditionsThe Bidvest South Africa restructuring
and the creation of our new Bidvest Office
division was welcomed by all teams and
introduced a new sense of purpose. Tight
focus on areas of traditional expertise is
balanced by efforts to maximise growth
opportunities in new markets.
We see higher environmental awareness
and standards as an opportunity and the
Form Chair’s marketplace successes
spotlight our commitment in this area.
Our partnership with technology leaders
such as Konica Minolta and Océ helps
keep us at the forefront of international
environmental developments.
As representatives of international
principals we acknowledge our exposure
to currency risk. This is mitigated by the
fact that exposure is distributed among a
number of currencies. Océ benefited from
rand strength versus the euro. In contrast,
the strong yen kept pressure on margins
at Konica Minolta.
The business environment remained
extremely competitive. However, after
three years of sweating assets and
delayed capital goods replacement there
were welcome indications that
businesses were again investing in new
office equipment, though the uptick is a
recent one. Improved demand was not
uniform across all sectors and remained
sluggish in some parts of the economy.
Technology companies benefited more
from reviving demand than the furniture
and stationery businesses, which
continued to trade in a challenging
environment.
Margins stayed under pressure and
corporate expense control was stringent.
PerformanceRevenue rose only marginally, easing
5,3% higher to R3,7 billion (2010:
R3,5 billion). Trading profit rose 9,2% to
R215,4 million (2010: R197,3 million).
ROFE was 34,5%. Trading margins
stayed thin at 5,8%.
Technology businesses optimised
opportunities, while furniture teams were
often under pressure to mitigate loss. Unit
sales grew in stationery, but sales growth
and margins were muted as a result of
price erosion.
SustainabilitySteep rises in energy costs drove
renewed focus on energy efficiency at all
businesses. Last year’s efficiencies have
translated into further improvements.
Waltons KZN is being centralised and will
be moving to a new energy-efficient
facility by November.
Konica Minolta leads the industry in
energy efficiency and green office
equipment through its use of polymerised
toner technology. These toners reduce
environmental impact, being composed
of plant-based substances rather than
petrochemicals, leading to significantly
lower electricity consumption.
Konica Minolta uses a variety of other
green innovations to reuse excess toner,
reducing consumption and CO2
emissions. The company also continues
to reclaim and recycle end-of-life
electronic equipment.
Bidvest Office launched a new business
unit, Konica Minolta Medical South Africa,
through the introduction of new digital
X-ray products with a flat panel detector
system. This development heralds a new
wave of innovation in radiology; it enables
radiologists to migrate from analogue to
digital imaging without total replacement
of existing hardware, reducing the
ecological impact; X-rays can be taken at
higher resolutions using 15 to 20% lower
radiation doses and the use of a new
lithium ion capacitor rather than a lithium
battery reduces the ecological impact of
battery disposal.
New radiology hardware exhibited at the
SORSA-RSSA show in Durban was well
received.
Our furniture businesses have taken great
strides towards greening their products.
Seating’s Form Chair incorporates 25%
recycled materials, 81% local content and
is 95% recyclable. The Form Chair was
Material issues
Challenges of operating in an extremely competitive environment in difficult economic circumstances
A need to improve employment equity and management scores for BEE
Challenges of making progress with skills development following rationalisation
83
PERFORMANCE OVERVIEW
THE BIDVEST GROUP LIMITED / ANNUAL INTEGRATED REPORT 2011
developed in South Africa and is made to
strict ergonomic and environmental
standards at a plant with ISO 9001,
18001 and 14001 accreditations. The
chair sets the benchmark for eco-design
and contracts from major players in the
banking sector have been secured. It has
become the preferred chair of
environmentally aware corporates and is
the best-selling product in Seating’s
range.
Total training spend fell mainly due to
restructuring and rationalising. Some
training initiatives were put on hold while
we focused only on critical skill
requirements.
Each Bidvest Office company runs
independent corporate social investment
programmes. Approximately 52% of our
CSI spend supports educational
institutions in disadvantaged areas.
Community development accounted for a
further 19% and 14% was spent on
environmental projects.
Our single biggest contribution was to
Conquest for Life, an initiative to
empower youth through programmes that
foster a safe and structured environment
in which young people can realise their
potential and build life skills.
PASSION/VITALITY/PRECISION
84
A leading manufacturer, supplier and distributor of commercial office products, printer products, services and stationery and packaging products, through a wide network of outlets in southern Africa, and provider of outsourced customer communication services.
Highlights
Kolok’s integration underlines multi-media positioning
Strategic packaging expansion through Sprint Packaging acquisition
Export project successes in Africa
Industry leadership in full-colour digital printing drives increased volumes innovative solar-powered kit for on-site production of voter registration cards
Strong BEE credentials a source of competitive advantage
Operational review
Revenue
R3,7 billion7,0% increase
Trading profit
R325,6 million4,2% increase
Contribution to Group revenue
3,1%
(Divisional contribution %)
2,8%R1,6m
Divisional CSI spend (% of Group CSI spend)
Employee numbers as a percentage of headcount
4,2%4 418
Neil BirchChief executive
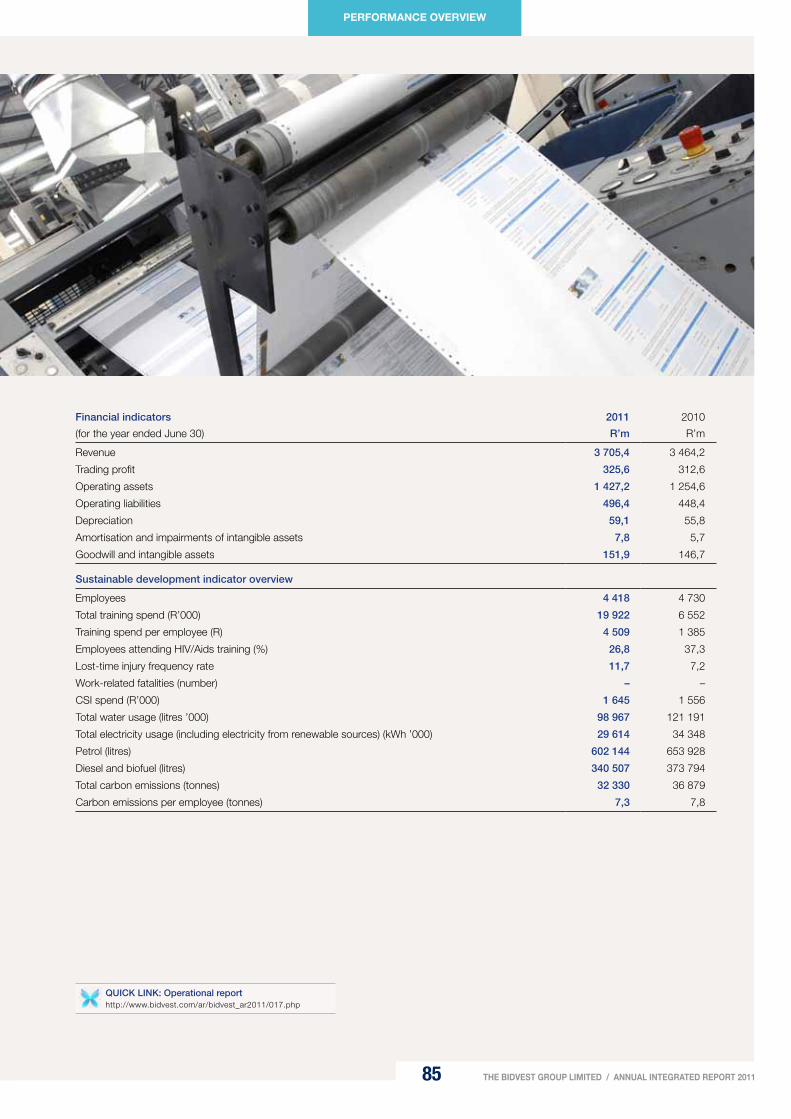
85
PERFORMANCE OVERVIEW
THE BIDVEST GROUP LIMITED / ANNUAL INTEGRATED REPORT 2011
Financial indicators
(for the year ended June 30)
2011
R’m
2010
R’m
Revenue 3 705,4 3 464,2
Trading profit 325,6 312,6
Operating assets 1 427,2 1 254,6
Operating liabilities 496,4 448,4
Depreciation 59,1 55,8
Amortisation and impairments of intangible assets 7,8 5,7
Goodwill and intangible assets 151,9 146,7
Sustainable development indicator overview
Employees 4 418 4 730
Total training spend (R’000) 19 922 6 552
Training spend per employee (R) 4 509 1 385
Employees attending HIV/Aids training (%) 26,8 37,3
Lost-time injury frequency rate 11,7 7,2
Work-related fatalities (number) – –
CSI spend (R’000) 1 645 1 556
Total water usage (litres ’000) 98 967 121 191
Total electricity usage (including electricity from renewable sources) (kWh ’000) 29 614 34 348
Petrol (litres) 602 144 653 928
Diesel and biofuel (litres) 340 507 373 794
Total carbon emissions (tonnes) 32 330 36 879
Carbon emissions per employee (tonnes) 7,3 7,8
QUICK LINK: Operational reporthttp://www.bidvest.com/ar/bidvest_ar2011/017.php

PASSION/VITALITY/PRECISION
86
Operational review
Bidvest Paperplus continued
Business context and trading conditionsBidvest Paperplus is shifting away from
traditional paper-related products and
moving towards integrated electronic
solutions. This transition is a response to
market demand and environmental
imperatives.
Industry conditions remained
challenging. Demand for traditional print
and long-run forms manufacture is in
serious decline, with continued pressure
on margins. Diversification into laser,
digital and personalised formats cannot
totally negate the impacts of the decline
in paper products.
Competition intensified in the labels
business and the strong rand adversely
affected some customers. Exchange rate
pressure was also negative for Kolok,
which is new to the division.
Volumes from some segments of the
retail industry were depressed by a trend
toward the import of fully pre-packed,
shelf-ready goods requiring no local print
component.
Customer billing activities for credit
retailers showed good growth, with a
continuing strong trend towards
personalisation. Data repository services
also emerged as a growth area as
retailers, financial institutions and other
businesses require ready archive access
for prompt responses to customer
queries.
Within the printing industry, the strong
rand was generally positive as it put a
brake on import parity-based cost rises
from paper suppliers.
Kolok was recently incorporated into
Bidvest Paperplus and we acquired
nationally represented Sprint Packaging.
We launched a new scholastics supplies
brand, Soluxions.
Capital expenditure on new and
replacement plants totalled R81,9 million
while approximately R10 million was
spent on computer software.
PerformanceRevenue rose 7% to R3,7 billion (2010:
R3,4 billion) while trading profit of
R325,6 million (2010: R312,6 million)
was up 4,2%. The target of a 9%
increase in trading profit was not
realised, although trading profit
increased by 13% before inclusion of
Kolok with prior year comparatives.
A stronger recovery and revival of
consumer spending did not occur as
expected. In the context of challenging
industry conditions, performance was
satisfactory. Overall volumes were
boosted by Kolok’s incorporation into
the division.
ROFE increased to 37,5%. The trading
margin eased higher to 37% (2010:
36,5%), reflecting continued migration
into new technology areas and away
from low-margin traditional print.
Technology investment and acquisition
enabled the pursuit of market-share
gains in the industry’s growth sectors.
Product innovation and the introduction
of a wider range of hardware by Kolok’s
brand principals helped to drive an
increase in unit sales.
Our ability to win contracts for exports to
other parts of Africa became an
important means of offsetting lost
volumes associated with last year’s
Soccer world cup. We supplied solar
voter registration solutions to Liberia and
Tanzania and ballot papers for elections
in Uganda.
Lithotech Conversion and Distribution
faced continued challenges as a result of
the shift away from traditional print and
rationalisation continued with 85 jobs
lost.
Material issues
Challenges associated with the shift away from traditional print/paper products and development of new integrated electronic solutions
Continuing difficult economic conditions
Economic hardship of employees in the economic downturn
Increasingly volatile demand patterns
Skills shortages, particularly in technical roles
Risk of injury when working with equipment
Reducing consumption of electricity and water

87
PERFORMANCE OVERVIEW
THE BIDVEST GROUP LIMITED / ANNUAL INTEGRATED REPORT 2011
SustainabilityBidvest Paperplus is developing
paperless solutions. The move away
from paper has positive environmental
implications.
We remain major users of power and
water. Our driers consume a significant
amount of electricity and hefty increases
in power tariffs have focused our
attention on energy-saving.
Improving our lighting systems
represents a major opportunity to
improve our energy efficiency. Savings
from more efficient lighting installed in
one of our Lithotech facilities equates to
the power needed to run an extra
multi-colour full-production printing
press. As we refurbish another plant we
will open parts of the roof to natural light
to further reduce electricity use.
Various efficiency initiatives and greater
awareness led to division-wide
reductions in fuel, electricity and water
consumption. In manufacturing,
operations have cut power use by
reducing overtime worked and adjusting
shift structures for better utilisation of
equipment.
One product innovation is our solar
voting solution for rural areas where
electricity is not always available. This
portable solar-powered kit enables
people to produce durable voter
registration cards in rural areas at voting
stations that are independent of external
power sources. Given the scale of
national elections, we see substantial
potential for related product
development.
We maintained our responsible waste
disposal practices while offering our
customers a wide range of recycled
paper products.
The impact of these different initiatives
and improved environmental awareness
contributed to an overall reduction in our
consumption of resources and total
carbon emissions.
The Lithotech Conversion and
Distribution Durban factory reduced its
dependence on mains water by drilling
its own borehole. Rotolabel achieved
ISO 14002 accreditation thanks to its
sophisticated environmental
management systems and six-sigma
quality measurement standards are now
applied at four plants.
This year has seen a focus on staff
training with spend increasing
significantly, particularly with the
inclusion of Kolok into the division.
Despite continued focus on safety
awareness, we recorded an increase in
the lost-time injury frequency rate,
highlighting the need for ongoing safety
training.
We focus our socio-economic
development efforts on the country’s
future education needs, each company
adopting disadvantaged local schools
and donating education materials. We
encourage our companies to assist the
communities where we operate by
dedicating a pro rata amount of their
budgets to CSI. We encourage staff to
get involved in running the programmes
and visit schools to present donated
materials.

PASSION/VITALITY/PRECISION
88
Products and services designed to enhance the working environment through hygiene rental equipment, consumables, laundries, indoor plants, drinking water, water coolers and specialised clothing.
Highlights
Revenue up 9,7% to R1,7 billion while trading profit rises 16,3% to R325,9 million
Strong performance at Steiner and record results at G. Fox & Co.
Staff numbers rise to 5 981
B-BBEE scores improve at all businesses
Laundry heat exchanger investment drives energy efficiency gains
Training investment rises to R3,76 million
Operational review
Revenue
R1,7 billion9,7% increase
Trading profit
R325,9 million16,3% increase
Contribution to Group revenue
1,4%
(Divisional contribution %)
2,8%R1,7m
Divisional CSI spend (% of Group CSI spend)
Employee numbers as a percentage of headcount
5,7%5 981
Alan FainmanChief executive

89
PERFORMANCE OVERVIEW
THE BIDVEST GROUP LIMITED / ANNUAL INTEGRATED REPORT 2011
Financial indicators
(for the year ended June 30)
2011
R’m
2010
R’m
Revenue 1 730,1 1 576,4
Trading profit 325,9 280,2
Operating assets 780,9 833,9
Operating liabilities 202,3 214,2
Depreciation 149,2 135,0
Amortisation and impairments of intangible assets 1,5 3,6
Goodwill and intangible assets 52,7 53,2
Sustainable development indicator overview
Employees 5 981 5 414
Total training spend (R’000) 4 475 2 600
Training spend per employee (R) 748 480
Employees attending HIV/Aids training (%) 14,0 25,5
Lost-time injury frequency rate 2,2 0,4
Work-related fatalities (number) – –
CSI spend (R’000) 1 652 1 746
Total water usage (litres ’000) 639 184 686 250
Total electricity usage (including electricity from renewable sources) (kWh ’000) 10 157 11 685
Petrol (litres) 1 318 313 1 127 821
Diesel and biofuel (litres) 2 148 990 1 778 878
Total carbon emissions (tonnes) 52 204 58 683
Carbon emissions per employee (tonnes) 8,7 10,8
BidvestExecuFlora
QUICK LINK: Operational reporthttp://www.bidvest.com/ar/bidvest_ar2011/018.php

PASSION/VITALITY/PRECISION
90
Operational review
Bidvest Rental and Products continued
Business context and trading conditionsBidvest Rental and Products is a product
of this year’s restructuring of Bidvest
South Africa. The division forms a leaner
business with numerous synergies. The
close fit between G. Fox & Company and
Steiner was one positive outcome while
bringing water, laundry, hygiene and
plants under one banner created a
variety of opportunities to broaden
services to similar customers, offering
significant efficiencies to a commercial
sector in need of savings and smart
solutions.
Our businesses tend to be industry
leaders, making reputational risk a key
issue. Risk is mitigated by rigorous
governance and audit processes and
hands-on control by operational
managers with significant experience in
their industries.
Business conditions were mixed. Overall,
the division grew in double digits but
performance varied in different sectors.
Retailing faced challenging conditions. In
hospitality, trading remained depressed.
In response, we diversified our customer
base by offering our services to other
sectors. For example, we concentrated
hotel amenity expansion on the smaller
bed-and-breakfast market which has
proven more resilient than traditional
hotels. Similarly, we shifted some of our
laundry business towards healthcare,
which is less volatile than tourism.
The economic downturn has highlighted
the advantages of our division’s overall
diversification. While the mining industry
stabilised after a difficult start to the year,
volumes in the commercial and industrial
sectors improved.
Capital expenditure rose to
R159,9 million (2010: R168,6 million).
One major initiative involved relocating
Puréau’s water purification plant,
creating the most modern plant of its
kind in South Africa. Another was
G. Fox & Company’s investment of
R5 million in a new garment
manufacturing plant in Swaziland.
PerformanceOur businesses put in a pleasing
performance. Revenue rose 9,7% to
R1,7 billion (2010: R1,6 billion), with
trading profit moving 16,3% higher to
R325,9 million (2010: R280,2 million).
ROFE improved to 54,4% and trading
margins rose to 18,8% (2010: 16,7%).
Divisional performance was underpinned
by strong results at our two largest
businesses, the hygiene solution-
providers at Steiner and the industrial
supplies company, G. Fox & Company.
In difficult economic conditions, we
applied stringent expense management
without a cost to our people. Divisional
staff numbers increased around 10%,
rising from 5 414 (2010) to 5 981 (2011).
Headcount increased at G. Fox &
Company in particular.
Credit management remained stringent.
Our businesses entrenched their
positioning as industry leaders. Steiner’s
Western Cape business won a
PMR Diamond Award as top performer
in hygiene services and Execuflora
received recognition at the Next Awards
for innovative and creative indoor
displays.
SustainabilityOur efforts to reduce our carbon
footprint include running some of the
division’s vehicles on biodiesel while new
software is developing optimum
distribution routes to cut emissions and
contain fuel costs. Low-energy lighting is
being fitted in certain warehouses.
Laundries invested a further R6 million in
heat exchangers. These retain the heat
from used hot water and transfer it to
incoming water, reducing energy input
for water heating by at least 12% and
lessening consumption of coal. Heat
exchangers are now fully operational at
all main plants and big laundries.
Together, these initiatives resulted in a
12% reduction in total carbon emissions.
Material issues
Reducing our consumption of water and electricity
Improving employment equity and skills development
Offering improved adult basic education and training to staff
Ensuring the safety of our drivers
Operating successfully in difficult economic conditions
Maintaining our reputation as an industry leader

91
PERFORMANCE OVERVIEW
THE BIDVEST GROUP LIMITED / ANNUAL INTEGRATED REPORT 2011
Laundries is planning to install
technology to recycle 80% of the water a
facility uses, starting with our biggest
laundry in Johannesburg. We will report
quantities of water saved next year.
All company offices recycle waste paper.
Steiner has embarked on a major rental
assets refurbishment programme. Items
such as plastic soap dispensers and
rubbish bins are now extensively
refurbished rather than replaced. Costing
about R10 million, the initiative has had
such an impact that suppliers have
commented on our reduced purchases.
This year we will also use recycled
plastics and instal recycled hand dryers.
Safely disposing of liquid waste is an
expensive aspect of our Puréau and
laundry operations. We are developing
methods to measure and monitor our
effluent.
This year’s inclusion of figures from Giant
Swaziland largely accounts for the
recorded rise in lost-time injury
frequency rate.
Training spend increased significantly
owing to enhanced training focus at
several companies, with particular
attention at management level and on
uplifting previously disadvantaged
individuals.
Our corporate social investment efforts
are decentralised and company-specific.
Education is a major theme. Every
branch in each business sponsors at
least two local schools, helping fill skills
gaps. The programme now impacts
more than 50 schools. These
relationships build community
involvement in education while creating
favourable awareness of our brands.

PASSION/VITALITY/PRECISION
92
A range of outsourced services in cleaning, security and landscaping as well as specialised services to the industrial sector.
Highlights
Revenue rose to R2,9 billion despite tough trading conditions
Prestige and Magnum perform exceptionally well in a challenging environment
Businesses achieve B-BBEE scorecard success in anticipation of strategic growth opportunities in the public sector
Multiple awards from clients in addition to accreditation by the Green Building Council
Operational review
Revenue
R2,9 billion2,2% increase
Trading profit
R187,6 million2,4% increase
Contribution to Group revenue
2,4%
(Divisional contribution %)
2,0%R1,2m
Divisional CSI spend (% of Group CSI spend)
Employee numbers as a percentage of headcount
46,3%48 620
John TaylorChief executive

93
PERFORMANCE OVERVIEW
THE BIDVEST GROUP LIMITED / ANNUAL INTEGRATED REPORT 2011
Financial indicators
(for the year ended June 30)
2011
R’m
2010
R’m
Revenue 2 901,4 2 840,1
Trading profit 187,6 183,2
Operating assets 699,9 779,7
Operating liabilities 240,9 312,9
Depreciation 88,9 80,4
Amortisation and impairments of intangible assets 3,0 3,0
Goodwill and intangible assets 192,1 187,7
Sustainable development indicator overview
Employees 48 620 49 952
Total training spend (R’000) 26 670 23 909
Training spend per employee (R) 549 479
Employees attending HIV/Aids training (%) 26,2 27,2
Lost-time injury frequency rate 3,9 4,5
Work-related fatalities (number) 5 1
CSI spend (R’000) 1 180 1 522
Total water usage (litres ’000) 89 166 64 100
Total electricity usage (including electricity from renewable sources) (kWh ’000) 4 202 3 495
Petrol (litres) 3 991 100 4 220 386
Diesel and biofuel (litres) 2 473 569 2 942 858
Total carbon emissions (tonnes) 20 612 22 109
Carbon emissions per employee (tonnes) 0,4 0,4
QUICK LINK: Operational reporthttp://www.bidvest.com/ar/bidvest_ar2011/019.php
PASSION/VITALITY/PRECISION
94
Operational review
Bidvest Services continued
Business context and trading conditionsIn this year’s restructuring, the old
Bidserv was unbundled and the new
Bidvest Services division formed to focus
on our labour-intensive companies.
These companies form part of a ‘soft
service’ package for the outsource
market, focused on the range of services
offered by the four companies making up
Bidvest Services: Bidvest TMS, Bidvest
Magnum, Bidvest Prestige and
Bidvest TopTurf. Restructuring coincided
with a rebranding exercise to make
‘Bidvest’ more prominent throughout the
division.
Some Bidvest Services companies are
dominant players in their industries. We
intend to further grow our market share
and widen the service package we offer,
enhancing our services and entrenching
customer retention. This strategy
involves working to make our outsourced
services as integral to clients’
businesses as possible.
The business traded in a no-growth
environment across all areas of activity:
cleaning, security, industrial cleaning and
greens services. Any growth was a
function of hard-won market-share gains
as trading became increasingly
competitive.
Compensating for lost Soccer world cup
volumes created another challenge. The
short-term upsurge turned out to be a
false dawn rather than a catalyst for
sustained growth. In many sectors, the
temporary benefit was soon cancelled
out, some client businesses then cutting
back even further.
In response to improved fund
management, the division’s capital
expenditure increased to R152,6 million
(2010: R142,9 million).
The installation of new technologies has
enabled businesses in our division to
measure productivity and suggest
optimum value-added solutions to
clients. This improved ability to measure
has contributed to high customer
retention and new contract successes.
Innovation at TMS and TopTurf led to
fundamental changes to their business
models. TMS, which previously
depended heavily on long-term
contracts from major petro-chemical
companies, is looking to widen its
customer base. The company is
investigating the broader deployment of
its industrial cleaning skills and
specialised equipment to service the
food, manufacturing and bulk-handling
and storage industries.
PerformanceRevenue increased by 2,2% to
R2,9 billion while trading profit rose 2,4%
to R187,6 million (2010: R183,2 million).
Overall performance was impacted by
the difficult trading environment faced by
TopTurf and continued challenges at
TMS, where revenue and profit were well
below expectation. Prestige exceeded
targets and our security businesses
performed well.
Divisional ROFE was 40,5%. Trading
margins narrowed to 6,47% (2010:
6,45%).
Businesses received several
accreditations and numerous awards.
Prestige became the first cleaning
company to join the Green Building
Council while TopTurf received the
South African Landscaping Industry
award as best specialised landscape
construction company for the 2010 FIFA
Soccer world cup hospitality project.
TopTurf received Sali awards for
excellence in landscape and turf
maintenance in six categories, with two
category awards for environmental
landscapes.
SustainabilityBusiness units monitor resource use by
measuring water and electricity
consumption and collaborate to achieve
savings. Recycling initiatives, waste
removal and responsible disposal are
also monitored. The quantity of paper
recycled increased by 347,1% to
21 202kg (2010: 4 741kg) and the
number of batteries (commercial and
industrial) recycled increased by 243,7%
to 220 batteries (2010: 64 batteries).
Material issues
Challenges of operating successfully in difficult economic conditions
Increasing competition
Skills development
Succession planning at senior level
Continuing to improve our health and safety performance

95
PERFORMANCE OVERVIEW
THE BIDVEST GROUP LIMITED / ANNUAL INTEGRATED REPORT 2011
Bidvest Services views the need to save
energy and reduce carbon footprints as
an opportunity for differentiation as we
have the resources to function as
eco-friendly partners of our customers.
The reported increases in electricity and
water consumption are primarily due to
an increase in the number of Prestige
sites reporting on these sustainability
indicators, combined with the growth of
Magnum Security and TMS.
We deeply regret that there were five
fatalities at Bidvest Services. Not only
have we lost valued team members, but
their passing is a tragic loss to their
families, to whom we offer our sincere
condolences. Full investigations have
been carried out in each case, and we
continue with rigorous safety training to
maintain adherence to safe practices.
As a large employer with 48 620 staff,
Bidvest Services has a large impact on
communities. We support a number of
social investment and enterprise
development programmes and total
expenditure on these came to
R8,8 million.
Initiatives include contributions towards
the construction of a youth development
sports centre for the Zandspruit and
surrounding informal settlements;
financial assistance toward tuition fees
for orphaned children and soccer field
ground levelling and layout for schools in
informal areas.

PASSION/VITALITY/PRECISION
96
Provides travel-management services, aviation services, airport lounge access and car rental through its extensive locations and distribution channels.
Highlights
Trading profit rose 32,3% to R274,2 million despite tough industry conditions
ROFE to 20,5%, reflecting rigorous asset management and higher profitability
Cash generation improved
Quest for corporate savings highlight Bidtravel’s role as a cost-effective business travel solution-finder
BEE scores improve, with four businesses achieving Level 3 status or better
Bidvest Premier Lounges invest R7 million in new OR Tambo international facility and enjoy increased passenger numbers
Bidair wins additional ground-handling contracts
Operational review
Revenue
R1,9 billion8,1% increase
Trading profit
R274,2 million32,3% increase
Contribution to Group revenue
1,5%
(Divisional contribution %)
2,0%R1,2m
Divisional CSI spend (% of Group CSI spend)
Employee numbers as a percentage of headcount
5,0%5 208
Kevin WakefordChief executive

97
PERFORMANCE OVERVIEW
THE BIDVEST GROUP LIMITED / ANNUAL INTEGRATED REPORT 2011
Financial indicators
(for the year ended June 30)
2011
R’m
2010
R’m
Revenue 1 874,4 1 733,7
Trading profit 274,2 207,2
Operating assets 1 842,3 1 801,3
Operating liabilities 510,7 456,3
Depreciation 57,3 71,2
Amortisation and impairments of intangible assets 4,1 6,7
Goodwill and intangible assets 67,9 70,7
Sustainable development indicator overview
Employees 5 208 5 000
Total training spend (R’000) 8 897 6 117
Training spend per employee (R) 1 708 1 223
Employees attending HIV/Aids training (%) 1,2 16,7
Lost-time injury frequency rate 9,6 6,1
Work-related fatalities (number) – –
CSI spend (R’000) 1 183 776
Total water usage (litres ’000) 110 830 83 569
Total electricity usage (including electricity from renewable sources) (kWh ’000) 7 567 7 771
Petrol (litres) 423 335 463 003
Diesel and biofuel (litres) 1 400 224 1 529 016
Total carbon emissions (tonnes) 13 226 13 831
Carbon emissions per employee (tonnes) 2,5 2,8
QUICK LINK: Operational reporthttp://www.bidvest.com/ar/bidvest_ar2011/020.php

PASSION/VITALITY/PRECISION
98
Operational review
Bidvest Travel and Aviation continued
Business context and trading conditionsThe new Bidvest Travel and Aviation
division brings together existing
ground-handling operations, airport
lounges, the air cargo business, our
travel management brands and Budget
Car and Van Rental.
Our main focus was developing
sustainability in business terms, including
sustainable growth, profitability and
sound business practices. We
reorganised Bidair, creating a leaner,
better-structured business that can
focus on its operating efficiencies and
client service and our bottom line
increased significantly as a result.
The reorganisation resulted in enhanced
focus on training. For our ground-
handling operation this sets the scene
for a focused effort to achieve an IATA
Safety Audit for Ground Handling
Operations (ISAGO) accreditation this
year.
PerformanceResults in the context of challenging
industry conditions were very pleasing.
Revenue of R1,9 billion (2010:
R1,7 billion) was up by 8,1%. Trading
profit of R274,2 million (2010:
R207,2 million) was 32,3% higher.
Despite competitor pressures, margins
improved through better procurement
and rationalisation activities. ROFE
improved to 20,5%.
Rationalisation within our travel
management business continued. All
teams engaged in focused efforts to
manage expenses and drive efficiencies.
Quality standards were not compromised
in pursuit of savings.
Bidair won new ground-handling
contracts, including two with African
carriers, complementing our positioning
as a supplier to some of the world’s
leading airlines. Bidair’s service-level
agreements involve measuring, among
other things, the extent to which we
deliver our services on time and how far
we may be responsible for a given delay.
Our on-time performance is very high,
scoring well over 99% – illustrating the
quality of our service.
For the third year in succession, Bidair
teams at Cape Town International Airport
won the ACSA Feather Award as the
best ground-handling service provider
– testimony to the quality of our people
and the effectiveness of the training
effort.
Bidvest Premier airport lounges, part of
Bidair, invested R7 million to completely
refurbish its international lounge at
O.R. Tambo international airport. This
brings total investment in the lounges
over recent years to almost R40 million.
Our product offering and service
standards were dramatically improved
and a hospitality mindset was introduced
to all our lounges. Bidvest Premier is the
only commercial lounge brand that has
truly national representation.
SustainabilityBidair employs over 3 000 people and
works with international airlines in a
highly regulated environment,
necessitating world-class quality
operation. In the air travel industry, safety
is of paramount importance. This
requires a very high level of training and
strict adherence to procedure. Significant
training spend is non-negotiable in our
sector. Training investment measured as
courses conducted increased by 50% in
our ground-handling operation. All
training is designed to meet our
requirement of “safe, reliable service”.
Our cargo operation successfully
implemented a ‘people’s flight plan’
designed to increase investment in all
aspects of staff development.
We focused all training efforts internally
and ceased providing any training to
external parties. Tighter focus and
increased spend yielded excellent
results.
Bidtravel’s customers are South Africa’s
major corporates and government
departments and training focuses on
Material issues
Challenges of operating in a difficult economic climate
Ensuring optimum utilisation of technology in travel
Ensuring Bidair remains an industry leader in safety procedures and compliance
Importance of ongoing training and development
Continued drive for efficiencies at Budget Rent a Car in highly competitive market
99
PERFORMANCE OVERVIEW
THE BIDVEST GROUP LIMITED / ANNUAL INTEGRATED REPORT 2011
ensuring our travel consultants are able
to meet customer service expectations
and requirements. Budget Rent a Car is
primarily end-user facing. Skills and
training required for Budget employees
include strong emphasis on customer
service. Training includes modules such
as induction, personal mastery and
development, specific skills for specific
market segments and adherence to
regulatory requirements such as the
Consumer Protection Act and
Occupational Health and Safety. Training
in the travel and car rental industries is
essential in order to remain competitive.
The lost-time injury frequency rate
increased, partly a result of improved
record keeping. We continue to prioritise
ongoing safety awareness and training.
The high level of regulation within which
Bidair operates leaves relatively little
room to manoeuvre in terms of changing
practices towards more environmentally
friendly methods. We endeavour to
reduce idling times of our equipment and
maintain it on site where possible to
minimise unnecessary transport. Care is
taken to dispose of tyres in the most
environmentally sensitive manner. To
ensure the highest possible levels of
safety, regulations require that equipment
is used only for a predetermined period
before it is replaced.
In our offices, managers are taking the
initiative to limit their use of paper and to
maximise the proportion of waste that is
recycled. Recorded water consumption
rose, reflecting more accurate record
keeping and the growth of the Bidair
Hospitality business. Initiatives are in
place to reduce electricity, fuel, paper
and water consumption and to recycle
paper and tyres in an environmentally
responsible manner. All businesses have
stepped up these efforts.
Corporate social investment spend
increased significantly in line with growth
in profit at some companies, and also
reflected the introduction of new
enterprise development projects.
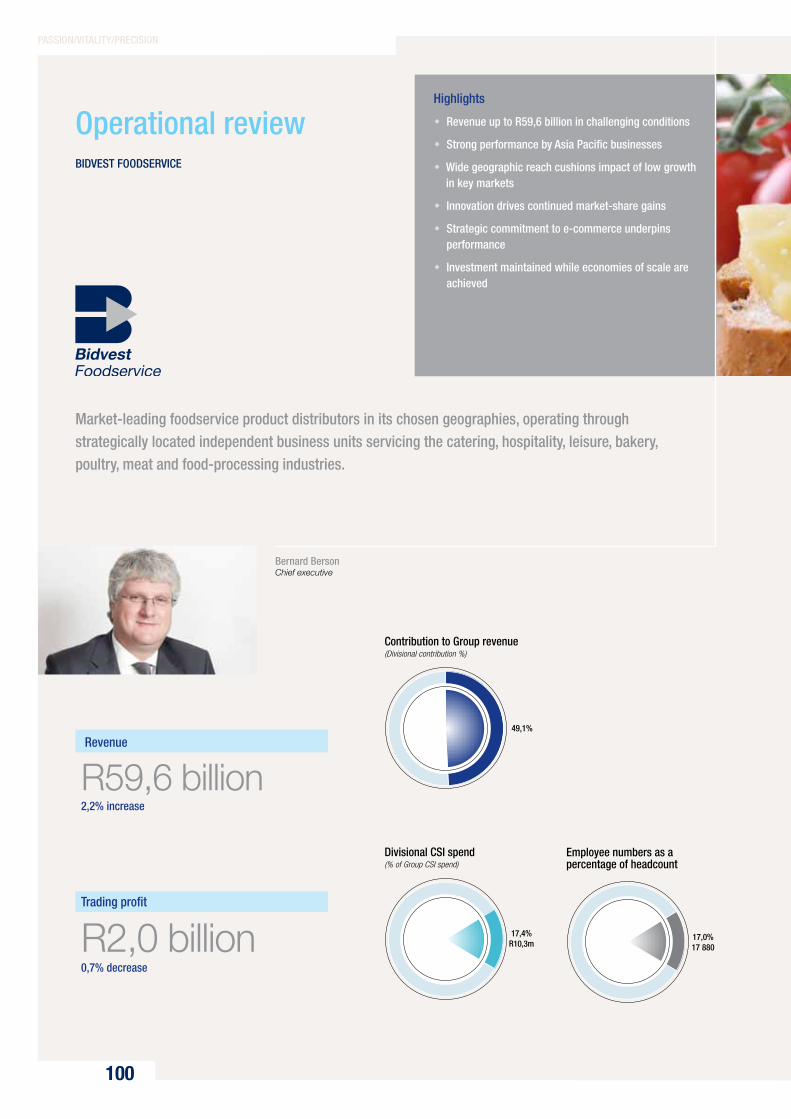
PASSION/VITALITY/PRECISION
100
Revenue
R59,6 billion2,2% increase
Trading profit
R2,0 billion0,7% decrease
Highlights
Revenue up to R59,6 billion in challenging conditions
Strong performance by Asia Pacific businesses
Wide geographic reach cushions impact of low growth in key markets
Innovation drives continued market-share gains
Strategic commitment to e-commerce underpins performance
Investment maintained while economies of scale are achieved
Operational reviewBIDVEST FOODSERVIcE
Bernard BersonChief executive
Market-leading foodservice product distributors in its chosen geographies, operating through strategically located independent business units servicing the catering, hospitality, leisure, bakery, poultry, meat and food-processing industries.
Contribution to Group revenue
49,1%
(Divisional contribution %)
17,4%R10,3m
Divisional CSI spend (% of Group CSI spend)
Employee numbers as a percentage of headcount
17,0% 17 880

101
PERFORMANCE OVERVIEW
THE BIDVEST GROUP LIMITED / ANNUAL INTEGRATED REPORT 2011
Financial indicators
(for the year ended June 30)
2011
R’m
2010
R’m
Revenue 59 645,6 58 389,9
Trading profit 2 031,7 2 046,0
Operating assets 14 323,9 12 784,9
Operating liabilities 9 833,3 8 786,3
Depreciation 569,8 600,6
Amortisation and impairments of intangible assets 223,4 70,0
Goodwill and intangible assets 5 881,8 5 253,1
Sustainable development indicator overview
Employees 17 880 17 804
Total training spend (R’000) 24 697 24 376
Training spend per employee (R) 1 381 1 369
Employees attending HIV/Aids training (%) 3,0 2,2
Lost-time injury frequency rate 17,1 9,8
Work-related fatalities (number) – 1
CSI spend (R’000) 10 318 8 674
Total water usage (litres ’000) 634 301 547 597
Total electricity usage (including electricity from renewable sources) (kWh ’000) 230 039 225 603*
Petrol (litres) 3 695 481 3 702 779
Diesel and biofuel (litres) 46 628 393 44 176 228
Total carbon emissions (tonnes) 262 431 248 958*
Carbon emissions per employee (tonnes) 14,7 14,0*
* 2010 restated figures.
QUICK LINK: Historic sustainable development datahttp://www.bidvest.com/ar/bidvest_ar2011/021.php
PASSION/VITALITY/PRECISION
102
Operational reviewBIDVEST FOODSERVIcE continued
Business context and trading conditionsVolatility and great disparity in trading
conditions across international markets
were key characteristics in a challenging
year. Food inflation was high at various
periods for commodities like grain and
wheat, but significant food deflation was
apparent in some other categories.
The world’s changing balance of
economic power was also material to
market performance. Suppliers of
primary products like Australia and
New Zealand achieved a measure of
recovery as demand for resources
remained high in China and other Asian
countries. Minerals from Australia found
a ready market, as did agricultural goods
from New Zealand. The net effect was to
put money in the pockets of Australian
and New Zealand workers and support
domestic demand.
Asia’s tourism market continued to
develop, driven by Asian tourists.
Australia’s effective marketing to Asian
tourists helped soften the impact of
declining Western tourist numbers. Hotel
sectors like those in South Africa are still
dependent on tourist inflows from
Europe and North America. This creates
a strategic challenge as hotel
occupancies may remain depressed for
some time, with knock-on effects for
foodservice suppliers.
Asia Pacific markets able to draw
advantage from a new wave of short-
haul tourists from mainland China and
elsewhere in Asia may have better
prospects.
Asian investment in tourist infrastructure
supports continued growth in tourism
numbers. For Bidvest Foodservice this
creates opportunities for volume gains
into the hotel channel. Singapore and
Macau have established major casino
resorts.
The Macau experience highlights shifts in
regional spending power. The port city’s
gaming revenues surpassed those of
Las Vegas five years ago. This year
those revenues are expected to be five
times those of the American
‘benchmark’. In the first four months of
2011, the Macau authorities tracked 6,4
million tourist arrivals, with 3,6 million
from mainland China. The numbers are
10% up on the same period last year.
Statistics from other markets are less
encouraging.
The UK foodservice market is declining
in real terms. Recent research indicates
meal numbers and food purchases are
down year on year. Consumers are
looking for value, a trend that is sure to
continue as UK public sector cutbacks
take their toll. Western Europe and parts
of Central Europe faced continuing
pressure as a result of low growth, low
consumer and business confidence,
consumer belt-tightening and
government spending cuts.
South Africa faced similar challenges as
indebted consumers downtraded,
unemployment remained high and
trading conditions remained tough in all
areas of operation – supplies to the food
industry, hotels, caterers, retailers and
restaurants.
Diversification across dissimilar markets
in various regions helps to balance
market risk and contributed to continued
overall growth.
In areas of the world where little or no
growth has become the norm, large
companies increasingly look to leverage
their market power by seeking the lowest
possible prices, resulting in continued
pressure on margins.
In the UK, 3663 Wholesale will part with
a major customer in the second half of
the new period because lower margins
and lower volumes made the contract
unviable. Our UK business decided not
to compete for the contract as even
lower margins were in prospect.
The long-term effect of such leverage will
be industry casualties followed by a
Material issues
Increasing volatility in trading conditions
Declining markets in Europe and South Africa
Increasing demand and legislative pressure for accurate labelling and product information
Continuing need to maintain and upgrade food safety standards and procedures
Continuing need to improve energy efficiency and reduce carbon emissions through new technologies and routing efficiencies
Focus on ongoing staff training for career development, succession planning and safety

103
PERFORMANCE OVERVIEW
THE BIDVEST GROUP LIMITED / ANNUAL INTEGRATED REPORT 2011
gradual return to more acceptable
margins. We have the resources to
withstand these challenges and will
continue to make business-like decisions
to ensure profit rather than loss.
These risks are managed by continued
focus on new business gains to create a
sustainable, balanced customer mix.
Another method of risk management is
to become the partner of our customers,
thereby creating relationships that are
not solely based on price. For example,
3663 Wholesale has stepped up its
collaboration with customers.
A focus area across Bidvest Foodservice
is e-commerce. Major gains have been
made by the Australian and New Zealand
businesses. Sister companies are now
looking to replicate these successes. In
the UK, 3663 Wholesale is trialling an
e-commerce trading site, creating an
opportunity for strategic growth as we
foresee wider adoption of the
e-commerce model in the British
foodservice market.
A new margin management and pricing
tool is also being rolled out in the UK. It
has been developed in partnership with
a world leader in business-to-business
pricing software. The tool will be used by
both the sales force and margin analysts.
The 3663 Wholesale sales force is now
fully e-enabled.
Product innovation is a feature of all
markets and a key driver of market-share
growth. In Asia, the need for constant
innovation is showcased by strategic
trends. A major development is the
growing appeal of Western cuisine –
a positive trend for our businesses.
However, it is evident that upwardly
mobile Asian consumers do not embrace
Western food offerings without
modification. Global fast food chains
have penetrated Eastern markets, but
often make numerous menu changes to
do so. It is a continuing challenge to find
the optimum mix of food offerings that
will feed this ‘Western’ trend while
appealing to Asian palates.
PerformancePerformance was mixed, with a
satisfactory result overall, driven largely
by continued growth of our Asia Pacific
businesses.
At R59,6 billion (2010: R58,4 billion),
revenue was up 2,2%. Trading profit
fell 0,7% to R2,0 billion.
Strong performances were put in by
Australia, New Zealand and our Asian
operations. European and South African
performances were below expectations,
but all teams achieved efficiency gains.
Returns on funds employed (ROFE)
increased to 47,9%. However, trading
margins came under mounting pressure.
PeopleEmployee engagement
At 17 880, our headcount was largely
stable. Bidvest Foodservices comprises
prestigious companies with an excellent
reputation and there is a high rate of
employee satisfaction reflected in the
annual satisfaction surveys conducted
by many companies.
Bidvest Foodservice companies are all
equal opportunity employers and do not
discriminate on the basis of race or
gender. They offer employment to any
candidate with the appropriate skills and
willingness to work. (Al Diyafa is an
exception, bound by Saudi law to permit
only male employees.) Our companies
generally maintain a level of remuneration
above the industry sector standard.
Every Foodservice subdivision reports on
staff turnover and retrenchments, and
while there was some variation among
companies, there were no notable
negative trends. A low level of
retrenchments has continued to occur in
some companies since the economic
downturn and as a result of acquisitions
and restructuring in South Africa. Bidvest
New Zealand has proved remarkably
resilient to both the economic crisis and
two earthquakes, and recorded zero
retrenchments. Numbers of employees
at Bidvest Europe companies have
generally risen this year.
The extent of unionisation varies by
company and region, but is often high.
Bidvest companies engage regularly with
unions and maintain positive working
relationships. In Europe and Asia Pacific
there were no industrial actions, but one
South African company experienced
limited strikes in one province as a result
of a fall in staff numbers in the process
of rationalisation.
Training and skills
All Bidvest Foodservice companies have
ongoing commitments to continually
train their employees. Training comprises
both on-the-job training and dedicated
classes, with some divisions such as
Bidvest Australia having their own
Academy, offering a wide range of
courses to eligible staff.

PASSION/VITALITY/PRECISION
104
Operational reviewBIDVEST FOODSERVIcE continued
In South Africa, skills development
continues to be a critical challenge.
Investment in training enables Bidvest
Foodservice SA to promote talent from
within, address succession planning and
improve employment equity. The division
has ongoing programmes to develop
staff at all levels.
At Bidvest Europe, 3663 Wholesale
offered more than 10 000 person days of
training. More than 520 person days
focused on the environment.
Health and safety
Rigorous health and safety controls are
in place at Bidvest Foodservice
companies, with a focus on training to
create and maintain a safe working
environment. Many companies have
dedicated safety teams and have
developed safety plans to improve
performance. In general, accident and
injury rates have decreased. There were
no fatalities to report at any Bidvest
Foodservice companies.
EnvironmentEnvironmental initiatives are in place at
all Foodservice companies. In Europe,
these are a priority as environmental
responsibility tops the public and political
agenda, putting pressure on the food
industry.
Systems are in place at most operations
to monitor environmental performance,
measuring energy and fuel usage and
recycling.
While some companies already have
environmental policies, others such as
Bidvest Foodservice SA and Angliss
Hong Kong are currently developing
formal policies including targets and
performance indicators.
We continue to investigate ways of
reducing electricity usage and carbon
footprint. An increasing number of
energy-efficiency installations, including
efficient lighting, account for significant
savings.
Companies across the division are
installing refrigeration and freezer units
with a more environmentally friendly
cooling agent. Most companies are also
working to reduce fuel use by updating
fleets with more efficient vehicles and
developing more effective routing.
Operations involved with seafood
participate in relevant schemes such as
the South African Sustainable Seafood
Initiative and Marine Stewardship Council
(MSC) certification, and educate
customers about seafood sustainability.
Product responsibilityBidvest Foodservice takes food safety
very seriously and our companies have
an excellent reputation in this regard.
Customer health and safety are
paramount. Most companies comply
with the international Hazard Analysis
and Critical Control Points (HACCP)
standard and many with ISO 9001:2008.
Dedicated quality assurance and
HACCP-trained employees ensure food
quality and safety standards are met.
Key customers conduct periodic food
quality audits.
Fair and accurate product labelling is an
increasing concern in our markets all
over the world. As a high-quality supplier
of reputable brands, Bidvest Foodservice
is well positioned to lead by example.
For the most part, our Foodservice
companies only handle products prior to
distribution. Although we acknowledge
our responsibility as part of the supply
chain, the onus for labelling falls mostly
on our suppliers, with whom we actively
engage to ensure compliance with
regulations.
In South Africa, the new Consumer
Protection Act (CPA) came into force in
March 2011 as the latest manifestation
of a trend toward more stringent
regulation of food safety. The CPA places
greater demands on us in terms of
labelling standards, choice of suppliers
and supply chain integrity. Foodservice
SA companies have started to achieve
stringent British Retail Council (BRC)
certification in some facilities and will be
rolling this out.
In addition to food safety, we ensure we
manage data responsibly through careful
IT management. This includes the
security of customer data and customer
privacy.
Some companies also carry out
customer satisfaction surveys and for
the most part companies track
complaints and have procedures for
dealing with them swiftly and effectively.
FutureMarket risk rose at the start of our new
financial year. Growth may remain low in
the UK and Europe. Austerity measures
and efforts to cut national deficits may
also affect the rate of Asian growth, with
knock-on effects for countries like
Australia, New Zealand and South Africa
that supply commodities to Asia.
105
PERFORMANCE OVERVIEW
THE BIDVEST GROUP LIMITED / ANNUAL INTEGRATED REPORT 2011
Signals are mixed. Some signs of an
uptick in consumer spending are evident
in certain markets, but uncertainty
remains. Our businesses are well-
resourced, however, and are strongly
cash generative. All teams have shown
resilience in tough trading conditions.
Our UK operations were impacted by
abnormal expenses, but have continued
to invest in new product offerings and
better systems while achieving
acquisitive growth. We believe solid
sales gains can be achieved and plan to
grow both revenue and trading profit.
Our Benelux businesses also face
intense competitive pressures, but
expect to achieve renewed growth, as
do our operations in Central Europe.
Our base in the Middle East remains
small, but continued gains are forecast.
Bidvest Foodservice SA faces similar
trading challenges to our businesses in
Europe, but has maintained its
investment in technology and warehouse
management systems. Efficiency gains
are coming through. After two difficult
years, a gradual but sustained recovery
in revenue and trading profit is expected.
Asia Pacific will remain the engine of
growth in the coming year. Bidvest
Australia has achieved a leadership
position in its national market and has
shown itself capable of sustained gains
on the back of product and operational
innovation. New Zealand has also built
strong momentum, widened its base and
looks forward to continued growth.
Singapore has achieved good growth,
along with Hong Kong and our
businesses on the Chinese mainland.
Though challenges will continue, we also
look forward to continued real trading
profit growth – in Asia Pacific and across
Bidvest Foodservice as a whole.

PASSION/VITALITY/PRECISION
106
Contribution to Group revenue
16,1%
(Divisional contribution %)
comprises Bidvest Australia, Bidvest New Zealand, Angliss Singapore and Angliss Greater china. Bidvest leads the foodservice industry and offers a full end-to-end national distribution service.
Highlights
Bidvest Australia maintains its strong run with exceptional effort despite natural disasters
Strong showing by New Zealand and tremendous post-earthquake response by teams
Innovation and e-commerce underpin continued gains
capital expenditure tops R345 million
Singapore and Greater china show continued growth
Revenue
R19,6 billion11,5% increase
Trading profit
R833,1 million14,2% increase
1,8%R1,0m
Divisional CSI spend (% of Group CSI spend)
Employee numbers as a percentage of headcount
3,9%4 056
Operational review
Bidvest AustraliaRachel RuggieroChief operating officer
Bidvest New ZealandNigel BoswellManaging director
Angliss SingaporeBeng Fong LokeManaging director
Angliss Greater chinaJohnny KangManaging director
Asia Pacific

107
PERFORMANCE OVERVIEW
THE BIDVEST GROUP LIMITED / ANNUAL INTEGRATED REPORT 2011
Financial indicators
(for the year ended June 30)
2011
R’m
2010
R’m
Revenue 19 563,1 17 547,6
Trading profit 833,1 729,4
Operating assets 5 083,6 4 232.8
Operating liabilities 2 860,5 2 333,2
Depreciation 152,5 138,2
Amortisation and impairments of intangible assets 7,0 4,7
Goodwill and intangible assets 1 183,3 1 012,6
Sustainable development indicator overview
Employees 4 056 4 149
Total training spend (R’000) 2 308 2 117
Training spend per employee (R) 569 510
Employees attending HIV/Aids training (%) – –
Lost-time injury frequency rate 39,3 21,3
Work-related fatalities (number) – –
CSI spend (R’000) 1 049 855
Total water usage (litres ’000) 70 835 77 222
Total electricity usage (including electricity from renewable sources) (kWh ’000) 70 535 64 045
Petrol (litres) 1 188 327 1 123 541
Diesel and biofuel (litres) 8 168 426 6 960 761
Total carbon emissions (tonnes) 76 641 70 439
Carbon emissions per employee (tonnes) 18,9 17,0
QUICK LINK: Operational report and historic sustainable development datahttp://www.bidvest.com/ar/bidvest_ar2011/022.php
PASSION/VITALITY/PRECISION
108
Operational review
Bidvest Foodservice Asia Pacific continued
Business context and trading conditionsAcross such a vast geographical area,
trading conditions can differ markedly. In
the core Australian territory, confidence
and growth are strong in those areas in
which mining is a major employer. Other
areas often see no or low growth.
The tourism industry remains under
pressure in Australia, but enjoys robust
growth in Singapore thanks to
successful promotion of its new casino
resort hotels. Continued expansion of
the resorts business in Macau also
proved beneficial.
Fragile consumer confidence for much of
the year in Australia was negative, but
the restaurant sector showed continued
resilience.
In New Zealand, economic recovery
gathered traction on the back of strong
demand for agricultural commodities
from Asian customers. Unemployment
decreased to 6,6%. Overall inflation and
food inflation are again on the rise, with
generally positive effects for a trading
business.
The Singaporean economy maintained
exceptionally strong growth for the first
three quarters, only for growth to cool
rapidly in the final quarter, largely a result
of a big slowdown in demand for
manufactured goods.
Economic growth remained robust in
Greater China until the closing months of
the year. Again, inflation is becoming a
concern for the authorities.
E-commerce emerged as a major growth
area. Both the Australian and
New Zealand businesses made
increasing use of this route to market.
We have established our own software
development team, based in
New Zealand, to ensure continued
industry leadership in this area.
Bidvest Australia and Bidvest
New Zealand continued their permanent
loyalty programme for foodservice
customers, offering customers the
chance to earn and redeem loyalty
programme dollars.
Our Asian businesses optimised the
growth of tourism and the trend to
western-style eating through constant
expansion and amendment of their
product ranges.
Expansion and modernisation of the
branch network is constant at all
operations. Capital expenditure topped
R300 million.
Tight labour markets are likely to affect
all our operations. Training and our
leading reputation help manage ‘people
risk’ as we strive to retain and develop
talent.
The Christchurch earthquake in February
was New Zealand’s largest ever natural
disaster and showcased how our people
and Bidvest team spirit can be risk
management tools. Cooperation
between teams and willingness to put in
extra effort to help others enabled the
New Zealand business to recover at a
surprisingly rapid rate.
Food and foodservices are highly
regulated. As a well-capitalised and
well-resourced business we try to
anticipate regulatory and quality
requirements. Our high level of
certification has become a source of
competitive advantage.
PerformanceDivisional performance was satisfactory
overall, trading margins were in line with
budget and expenses were well
managed.
Growth was a function of market-share
gains, acquisition, innovation and
e-commerce expansion.
Bidvest Australia maintained its strong
run, reflecting exceptional effort in
challenging conditions. Bidvest
New Zealand performed strongly despite
the impact on trading of the Christchurch
earthquake. New distribution centres
were built at Tauranga and Dunedin while
Plymouth facilities were expanded.
Angliss Singapore exceeded trading
profit targets. Angliss Greater China put
in a pleasingly strong performance, with
Material issues
The challenge of maintaining success in difficult economic conditions
Increasingly tight labour markets
The challenge of attracting and retaining talent
Risks associated with increasing frequency of natural disasters
Continuing need to further reduce carbon emissions

109
PERFORMANCE OVERVIEW
THE BIDVEST GROUP LIMITED / ANNUAL INTEGRATED REPORT 2011
good contributions from the core
Hong Kong business.
SustainabilityAt Bidvest Australia, ISO AS/NZS 14001
certification is being processed.
Bidvest continues to investigate ways of
reducing electricity and power usage.
Our ongoing growth means that our
electricity usage continues to increase,
but energy-efficient installations have
reduced overall impact.
Bidvest Australia used approximately
367 terajoules of energy, establishing a
baseline to measure our progress in the
control of carbon emissions.
In late 2010, Bidvest Australia embarked
on a joint investigation with the NSW
government to find ways of reducing
electricity usage. A number of initiatives
have been identified for our freezers and
cold rooms, which we will implement
starting this year.
Our Melbourne distribution centre has
reduced its energy consumption by
17% (from 350 800kWh (2010) to
292 000kWh (2011)) by installing
energy-efficient lighting. Similar
replacements are being rolled out to
other centres in Australia and
New Zealand.
Bidvest Australia has introduced
management plans to improve water
efficiency, as well as new truck washing
facilities that use collected rainwater
and/or filter water before disposal.
Across Bidvest Asia-Pacific, companies
are working to reduce fuel use by
purchasing more efficient delivery
vehicles and developing more effective
routing.
Bidvest Australia’s recycling programmes
continue to increase. Our Hervey Bay
centre reports that they have halved
general waste by recycling.
Ice cream trucks at both Bidvest
New Zealand and Bidvest Australia use
eutectic refrigeration which, after
charging at night, requires no energy use
during the day despite constant access
to product as deliveries are made.
Angliss Hong Kong is drafting an
environmental policy, including targets
and performance indicators.
Each year, part of the profit from Bidvest
New Zealand’s own-brand products is
donated to Project K, part of the
Foundation for Youth Development.
The project mentors young people,
boosting confidence. This year we
contributed NZ$46 000. The company
also sponsors local schools and sports
teams.
Bidvest and its employees donated over
NZ$100 000 to support employees and
their relatives affected by the past year’s
earthquakes in Christchurch.

PASSION/VITALITY/PRECISION
110
comprises market leading foodservice product distributors in the United Kingdom, Belgium, Netherlands, czech Republic, Slovakia, Poland, Saudi Arabia and the United Arab Emirates. Sources and processes highly regarded own brands and provides products, quality ingredients, finished products, equipment and logistics to the catering and hospitality industry.
Highlights
3663 achieves profit growth in tough market
Bidvest Logistics renews ageing fleet
Seafood Holdings responds well to ownership change
Deli XL Belgium maintains strategic growth
Deli XL Netherlands grows profit in a tough market
Excellent cash generation at Nowaco
Farutex achieves pleasing growth in profit and sales
Good Middle East growth off low base
Revenue
R34,7 billion2,2% decrease
11,1% R6,6m
Divisional CSI spend (% of Group CSI spend)
Employee numbers as a percentage of headcount
9,8%10 285
Contribution to Group revenue
28,5%
(Divisional contribution %)
Operational review
3663 WholesaleAlex FisherManaging director
Deli XL NetherlandsDick SlootwegManaging director
Bidvest LogisticsAndrew SelleyManaging director
NowacoBohumil VolfGeneral manager
Seafood HoldingsStephen OswaldManaging director
Horeca Trade and Al DiyafaHisham Al JamilManaging director
Deli XL BelgiumThierry LegatManaging director
FarutexPawel SwiechowiczAdministration director
´
Trading profit
R842,5 million6,2% decrease
Europe

111
PERFORMANCE OVERVIEW
THE BIDVEST GROUP LIMITED / ANNUAL INTEGRATED REPORT 2011
Financial indicators
(for the year ended June 30)
2011
R’m
2010
R’m
Revenue 34 664,9 35 460,8
Trading profit 842,5 897,8
Operating assets 7 571,0 6 784,4
Operating liabilities 6 132,7 5 483,2
Depreciation 355,2 405,3
Amortisation and impairments of intangible assets 213,8 62,6
Goodwill and intangible assets 4 673,5 4 211,0
Sustainable development indicator overview
Employees 10 285 10 115
Total training spend (R’000) 12 442 14 146
Training spend per employee (R) 1 210 1 398
Employees attending HIV/Aids training (%) – –
Lost-time injury frequency rate 11,5 7,6
Work-related fatalities (number) – 1
CSI spend (R’000) 6 557 6 346
Total water usage (litres ’000) 246 457 202 401
Total electricity usage (including electricity from renewable sources) (kWh ’000) 122 231 126 831*
Petrol (litres) 659 776 514 521
Diesel and biofuel (litres) 32 546 956 31 280 887
Total carbon emissions (tonnes) 125 072 121 031*
Carbon emissions per employee (tonnes) 12,1 12,0*
* 2010 restated figures.
QUICK LINK: Operational report and historic sustainable development datahttp://www.bidvest.com/ar/bidvest_ar2011/023.php

PASSION/VITALITY/PRECISION
112
Operational review
Bidvest Foodservice Europe continued
Business context and trading conditionsFears of a double-dip recession meant
fewer UK families eating out. Teams had
to contend with down-trading and
margin pressure. Trading conditions
were also challenging in the Benelux
countries.
Official figures reflect continued recovery
by the Dutch economy with GDP growth
of 1,5%, but unemployment is falling
only gradually and inflation has moved
higher. Our Netherlands operations did
well to achieve budgeted profit despite
tough trading conditions and continued
investment in IT and e-commerce.
Competition intensified in Belgium as
industry players focused on low-risk
customers. Similar trends were evident
in the Netherlands.
Growth remained hesitant in the Czech
Republic and Slovakia. Nowaco was
also impacted by a poor summer,
resulting in sluggish ice-cream sales.
Operations in the Czech Republic were
also affected by a 2% national reduction
in retail food sales.
The Polish economy avoided recession
and continues to do well, though
unemployment remains high at 9,6%.
Farutex maximised opportunities, taking
sales to record levels.
In the Middle East, recovery is under way
and tourist revenues moved higher in the
United Arab Emirates. Several hotel
developments in Saudi Arabia create
opportunities for continued growth.
Strategic growth continued. In December
we acquired 100% of the share capital of
Seafood Holdings for an enterprise value
of £45 million. UK-based Seafood
Holdings is a leading national fresh fish
processor and distributor to the catering
and hospitality sectors.
In the Netherlands, Deli XL swapped its
majority interest in two produce
businesses (Verhaaren and Stavasius) for
a minority stake in Van Gelder (a much
larger specialist produce business).
PerformancePerformance was disappointing. Trading
profit of R842,5 million (2010:
R897,8 million) was significantly below
prior year and budget. Revenue
amounted to R34,7 billion (2010:
R35,5 billion). Performance was
impacted by abnormal costs, largely in
the UK. The most material impairment
related to the cancellation of a major
IT project at 3663 Wholesale.
Though financial results were well below
expectation, the efforts by our people
were outstanding. Many work in
economies that still feel the aftermath of
recession while the threat of a second
downturn continues to plague an
important national market like the UK.
In these circumstances, our teams have
to achieve constant efficiency gains and
make vital savings without compromising
the quality standards that create
competitive advantage. Our people did
well to maintain this effort and their own
morale in difficult conditions.
SustainabilityEnvironmental responsibility tops the
public and political agenda in Europe
with strong pressure being applied to the
food industry. In general customers
demand fresh, seasonal products of
known provenance.
3663 continues to provide a substantial
range of locally sourced products. This
year, 3663 has increased its range of
British produce to 120 products. The
company has retained ISO 14001
certification at all sites since 2003.
Further innovations in branding
standards are becoming a priority.
Product innovations include new ranges
of more sustainable products. Deli XL
Belgium has developed its organic
range, and Deli XL Netherlands has
Material sustainable development issues
Demand for reduction of environmental impacts, particularly carbon performance impacted by food miles, fuel and energy use, and packaging and water use
Demand for healthier and more sustainable foods
Demand for accurate and robust information on food labelling including nutritional and calorific data, and food origin (provenance)
Demand for local and seasonal produce
Managing and minimising environmental impacts, including resource consumption, water and energy usage
Compliance with tightening environmental legislation, regulations and risk management

113
PERFORMANCE OVERVIEW
THE BIDVEST GROUP LIMITED / ANNUAL INTEGRATED REPORT 2011
launched its “Naturally Sustainable”
range which includes organic, fairtrade
and animal welfare eco-labels.
Systems are in place to monitor
environmental performance, measuring
packaging waste, recycled packaging,
and energy and fuel usage. Recorded
increases in water and petrol
consumption are largely a reflection of
improved measurement at some
companies. Resource monitoring has
enabled 3663 to submit carbon footprint
data to the Carbon Disclosure Project
(CDP) supply chain initiative for the third
year running.
Addressing climate change, 3663 and
Deli XL Netherlands are improving
routing systems to reduce total distance
travelled, and 3663 trained drivers in
fuel-efficient techniques.
Both 3663 and Bidvest Logistics run
successful waste oil recycling schemes
converting customers’ used cooking oil
to biodiesel to fuel vehicles. 3663
achieved ISO 14064 assurance for its
scheme. Logistics converted its entire
trucking fleet to double-deck trailers,
reducing trucking movements by 40%.
In addition, Logistics improved its
efficiency substantially, transporting
14% more cases per mile travelled than
last year.
Further programmes at 3663 include a
green travel initiative, voltage
optimisation equipment (reducing
electricity use by 8%), LED lighting,
green specifications for new buildings,
heat-recovery components for
refrigeration, and sourcing over 97% of
electricity from renewable sources.
In addition to reducing paper use, Deli
XL Belgium has implemented the use of
Forest Stewardship Council-certified
paper.
3663 has effective recycling policies in
place at all sites and tracks packaging
material used, proactively exploring ways
to reduce this. Nowaco, in the Czech
Republic, is a member of EKO-KOM, a
company that recovers packaging waste
for recycling.
3663 works with suppliers to continually
improve the environmental performance
of the entire supply chain.
In addition to Marine Stewardship
Council certification, Seafood Holdings is
pursuing a number of strategies to
maximise sustainability. These include
focused customer education and an
initiative to market locally abundant
by-catch species usually discarded.
The recorded increase in lost-time injury
frequency rate is the result of more
accurate data this year.
Corporate social investment includes
Deli XL Netherlands’ employees’
participation in the annual Roparun relay
race raising funds for cancer patients,
and supporting the elderly. Nowaco is an
official partner of the Czech National
Theatre and also sponsors animals in the
Prague Zoo. Horeca supported the Child
Foundation Dubai and the Dubai Autism
Centre, among other social projects.

PASSION/VITALITY/PRECISION
114
A leading multi-range manufacturer and distributor of food products and ingredients. Bidvest operates through strategically located independent business units, aimed at servicing the catering, hospitality, leisure, bakery, poultry, meat and food processing industries.
Highlights
Market-share gains achieved in tough market
Revenue eases to R5,4 billion
Businesses remain strongly cash-generative
Efficiency gains through deployment of new technology
Acquisitive growth continues with purchase of A&S businesses
Bidvest Foodservice SA branches transition to multi-temperature model
Bidvest Ingredients grows sales in tough trading environment
Speciality achieves strategic widening of customer-base
Operational review
Revenue
R5,4 billion0,7% increase
Trading profit
R356,1 million15,0% decrease
4,6%R2,7m
Divisional CSI spend (% of Group CSI spend)
Employee numbers as a percentage of headcount
3,4%3 539
Contribution to Group revenue
4,5%
(Divisional contribution %)
Bidvest FoodserviceBrent VarcoeManaging director
Bidfood Ingredientscharles SingerChief executive
SpecialityMasly NotricaManaging director
Southern Africa
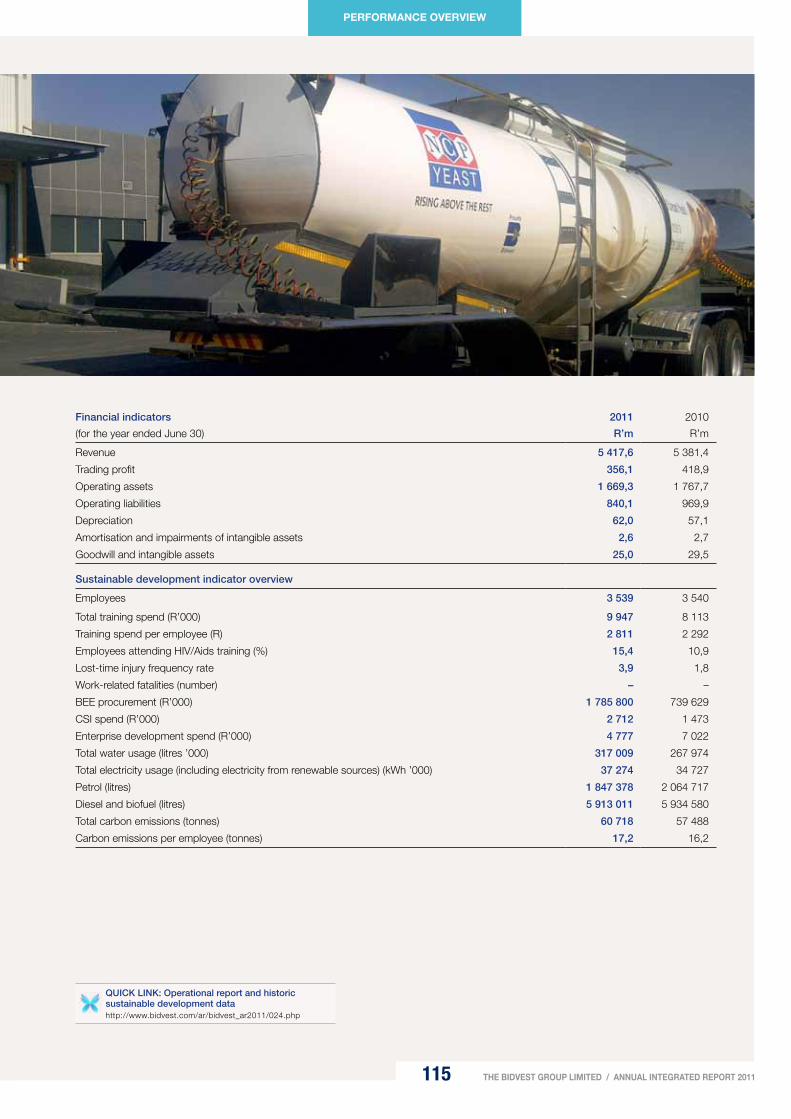
115
PERFORMANCE OVERVIEW
THE BIDVEST GROUP LIMITED / ANNUAL INTEGRATED REPORT 2011
Financial indicators
(for the year ended June 30)
2011
R’m
2010
R’m
Revenue 5 417,6 5 381,4
Trading profit 356,1 418,9
Operating assets 1 669,3 1 767,7
Operating liabilities 840,1 969,9
Depreciation 62,0 57,1
Amortisation and impairments of intangible assets 2,6 2,7
Goodwill and intangible assets 25,0 29,5
Sustainable development indicator overview
Employees 3 539 3 540
Total training spend (R’000) 9 947 8 113
Training spend per employee (R) 2 811 2 292
Employees attending HIV/Aids training (%) 15,4 10,9
Lost-time injury frequency rate 3,9 1,8
Work-related fatalities (number) – –
BEE procurement (R’000) 1 785 800 739 629
CSI spend (R’000) 2 712 1 473
Enterprise development spend (R’000) 4 777 7 022
Total water usage (litres ’000) 317 009 267 974
Total electricity usage (including electricity from renewable sources) (kWh ’000) 37 274 34 727
Petrol (litres) 1 847 378 2 064 717
Diesel and biofuel (litres) 5 913 011 5 934 580
Total carbon emissions (tonnes) 60 718 57 488
Carbon emissions per employee (tonnes) 17,2 16,2
QUICK LINK: Operational report and historic sustainable development datahttp://www.bidvest.com/ar/bidvest_ar2011/024.php
PASSION/VITALITY/PRECISION
116
Operational review
Bidvest Foodservice Southern Africa continued
Business context and trading conditionsThe trading environment was
exceptionally competitive and
replacement of world cup year volumes
was a challenge. Food deflation for most
of the year was negative for us. When
price rises occurred, it became
increasingly difficult to pass them on
in full.
The retail sector came under pressure
from price-sensitive shoppers, with
severe knock-on effects for a food
brands distributor like Speciality.
Retailers reported an 8,4% drop in sales
of food, beverages and tobacco.
Belt-tightening by consumers impacted
Bidvest Foodservice in key areas such
as the restaurant and industrial catering
sectors. Even so, the business managed
to grow its sales through market-share
gains.
Lower tourist volumes contributed to
falling hotel occupancy, another negative
for our foodservice business.
Our businesses continued to invest in
the future with capital expenditure of
R60,7 million.
The food and foodservice industries are
exposed to a wide range of risks.
Environmental and climatic factors such
as drought, floods and natural disasters
in several parts of the world had
knock-on effects on food production.
Food safety is a critical area for us. Risks
are managed by sustained investment in
modern systems and equipment.
Continually changing legislation is
another challenge. The Consumer
Protection Act creates new demands on
us and our suppliers. We liaise closely
with suppliers to ensure they are aware
of new standards while stepping up our
own resources. Labels are a focus area
as claims and nutritional information are
stringently regulated.
Our sector is highly dynamic, and we
monitor all new developments. One
trend is the growth of private label
ranges in the retail sector. Some retailers
have also begun to bring in their own
imports. This has obvious impact on a
food brand distributor such as Speciality.
This risk is managed by maintaining a
quality profile in Speciality’s brand basket
while ensuring that leaders with a strong
consumer following are well represented.
The business has also been successful
in widening its customer base, thereby
reducing any reliance on one channel to
market.
PerformanceRevenue eased 0,7% higher to
R5,4 billion (2010: R5,4 billion), but
trading profit fell 15,0% to R356,1 million
(2010: R418,9 million).
Despite severe margin erosion, the
business remained highly cash
generative. Management of funds
employed was a focus area. Strict credit
control was maintained.
Market-share gains were achieved in a
highly competitive environment while
efficiency improvements were secured
through technological innovation.
Acquisitive growth continued with the
purchase of the A&S businesses by
foodservice subject to regulatory
approval.
Material issues
Food safety, product integrity (managing the cold chain) and compliant product labelling
Sustainability of seafood species through responsible seafood procurement
Management of credit risk as tough economic conditions increase business failures in our industry
Reducing energy consumption, waste and the impact of business activities on the environment
Employee engagement
Staff skills development, retention of management and succession planning
Impact of crime on stock shrinkage
Broad-based black economic empowerment through employment equity and procurement
Occupational health and safety compliance
Customer service

117
PERFORMANCE OVERVIEW
THE BIDVEST GROUP LIMITED / ANNUAL INTEGRATED REPORT 2011
By year-end the first signs of
improvement in the restaurant channel
suggested consumer pressures may be
easing.
Branch consolidation and the
transitioning of operations into multi-
temperature businesses continued along
with ERP system integration across a
unified platform. Bidfood Ingredients
grew sales, but margin pressure
intensified and trading profit fell.
SustainabilityWe are moving toward a more integrated
approach to the management of our
environmental impact. Bidvest
Foodservice SA has drafted an
environmental management policy to be
approved in October 2011.
This policy proposes environmental
targets for July 2013. These include
reducing emissions of CO2 equivalent by
5%, and cutting energy use and water
consumption by 5%. We aim to recycle
90% of all waste. Performance indicators
will be included in our internal audits and
reported quarterly.
Other initiatives address climate change
concerns. All new refrigeration and
freezer installations use a more
environmentally friendly cooling agent.
Only specific brand vehicles are
purchased for our distribution fleet,
owing to their lower emissions. All
vehicles lighter than six tonnes are
replaced after 350 000km and heavier
vehicles after 600 000km. Diesel
consumption remained constant, and
petrol consumption fell by 10,5% at
Bidvest Foodservice Southern Africa.
We recycle about 60% of our waste,
though Johannesburg facilities come
closer to 80%. As we only handle
products just prior to distribution, we
must engage with our suppliers to
significantly reduce packaging waste.
Water use increased significantly with the
addition of a new facility in Cape Town.
Last year we participated in the South
African Sustainable Seafood Initiative
(SASSI). We are considering an eco-label
such as Marine Stewardship Council
(MSC) certification, and educating
customers about seafood sustainability.
We also have a formal policy to procure
and promote sustainable seafood.
Bidvest Speciality runs schemes to
reduce fuel, electricity and water
consumption and manage waste. All
solid waste is sorted and recycled.
Bidvest Ingredients continues to increase
the number of efficiency indicators
measured.
The increase in lost-time injury frequency
rate is primarily the result of improved
reporting.
This year we offered more bursaries and
learnerships to employees, reflected in
increased training spend.
Total corporate social investment spend
rose significantly this year. Bidvest
Speciality, for example, donates
R1,2 million in stock to various NGOs as
part of its social commitment.
Foodservice SA also supports
McCarthy’s Rally to Read and Reach for
a Dream programmes and various
orphanages and homes for the elderly
and infirm.

PASSION/VITALITY/PRECISION
118
Bidvest Namibia is the holding company for Bidvest’s interests in Namibia, which include fishing and similar commercial businesses to those of Bidvest in South Africa.
Highlights
Trading profit doubles in two years – beating the strategic objective of doubling in three
continued organic growth highlights the resourcefulness of our people
Exceptional performance by our fishing business
cash generated by operations reaches NAD564,6 million
Quality Namsov catches now SADc’s preferred horse mackerel purchase
Trachurus proves its value in fishing quota policy environment
First national management conference a success
Operational review
Bidvest Namibia
Revenue
R2,1 billion9,5% increase
Trading profit
R540,1 million46,8% increase
Sebulon KankondiChief executive
Contribution to Group revenue
1,8%
(Divisional contribution %)
11,3%R6,7m
Divisional CSI spend (% of Group CSI spend)
Employee numbers as a percentage of headcount
2,6%2 700

119
PERFORMANCE OVERVIEW
THE BIDVEST GROUP LIMITED / ANNUAL INTEGRATED REPORT 2011
Financial indicators
(for the year ended June 30)
2011
R’m
2010
R’m
Revenue 2 133,7 1 949,2
Trading profit 540,2 367,9
Operating assets 1 056,0 1 012,1
Operating liabilities 384,0 399,6
Depreciation 47,2 39,3
Amortisation and impairments of intangible assets 5,3 8,7
Goodwill and intangible assets 103,9 111,5
Sustainable development indicator overview
Employees 2 700 2 574
Total training spend (R’000) 2 882 2 168
Training spend per employee (R) 1 068 842
Employees attending HIV/Aids training (%) 65,9 34,3
Lost-time injury frequency rate 4,9 16,3
Work-related fatalities (number) – –
CSI spend (R’000) 6 685 4 089
Total water usage (litres ’000) 91 390 44 624*
Total electricity usage (including electricity from renewable sources) (kWh ’000) 5 880 4 727
Petrol (litres) 418 670 478 454
Diesel and biofuel (litres) 35 681 609 35 603 217
Total carbon emissions (tonnes) 100 353 97 006
Carbon emissions per employee (tonnes) 37,2 37,7
* 2010 restated numbers.
QUICK LINK: Historic sustainable development datahttp://www.bidvest.com/ar/bidvest_ar2011/025.php

PASSION/VITALITY/PRECISION
120
Operational review
Bidvest Namibia continued
Business context and trading conditionsThe Namibian economy recovered strongly during the 2010 calendar year with the official real GDP growth rate amounting to 6,6%. The expected growth for 2011 is about 4,0%. Strong performances from the manufacturing, construction, wholesale and retail and a strong recovery in diamond production, underpinned the strong GDP growth recovery. However, concern has grown at the effects of the Fukushima meltdown and the German government’s decision to close all the country’s nuclear power plants by 2022. However, development of new uranium mines in Namibia is proceeding as planned.
Although the majority of sectors showed positive performances, tourism remained under pressure. In the business-to-business environment, volumes were affected by stringent expense management and deferred investment.
A strong Namibian dollar inhibited some export activities, but assisted distribution and commercial fishing businesses by containing fuel costs.
Fish exports remained buoyant; a function of sustained recovery by fish stocks and strong demand for horse mackerel. The decision by the Ministry of Fisheries and Marine Resources to bestow further fishing rights suggests government is confident fish stocks will continue to rise.
Calls for new investment by government intensified after official figures put unemployment close to 50%. With unemployment high, retail competition intensified for the disposable income of those in work.
The business has made good progress in formalising enterprise risk management processes. A dual approach is taken: risk mitigation and opportunity identification.
Key challenges relate to climate change, environmental concerns and growing focus on good corporate citizenship. Within Namibia, our business is building a reputation for proactive engagement in these areas as our responses frequently exceed compliance with current regulations by some margin.
The recent invitation for new applications for fishing quotas made it clear that
government’s intention is to encourage new entrants to the fishing industry. Existing quota-holders such as Namsov cannot expect further rights allocations.
This policy direction has been clear for some time, enabling us to put structures in place that respect government strategy, facilitate wider industry participation and enable us to achieve enhanced returns from our investment in vessels, expertise and onshore facilities.
Our Trachurus structure is a ready-made partnership vehicle for any new quota recipient lacking the capital to invest in vessels. Trachurus provides a total fishing solution. We achieve improved asset utilisation while industry entrants earn a return on their quota that could not have been achieved by merely selling it off to a well-resourced player.
Regulatory risk exists, but sturdy institutions and legal processes are in place to ensure proper management of such issues. Risks associated with any government licensing process were showcased in Angola when changes to licensing terms rendered our vessel too big for Angolan operations. With slight modifications, the vessel was allowed to resume operations.
High fixed costs create risk as under-utilisation of assets could impact our balance sheet. We mitigate risk by taking a proactive approach to maintenance, keeping unplanned downtime to a minimum while optimising vessel availability for maximum catch rates. Initiatives such as Trachurus also mitigate this risk.
Capital investment totalled R75,4 million. Investment in on-board freezing and processing capacity is ongoing. Continued investment is made in dry-dock repairs and vessel refitting.
Material issues
BidFish
Dependence on natural fish resources, especially shared stocks, which can be affected by natural disasters and poor resource management
The welfare of our crews and of the local communities affected by our operations
Dependence on a stable legal framework in Namibia and the other countries in which we operate
BidCom
Employment equity, skills attraction and retention
The HIV/Aids pandemic
Reducing the environmental impact of our operations
Expanding the product portfolio to support not only BidCom’s sustainable development initiatives but also those of our clients and customers

121
PERFORMANCE OVERVIEW
THE BIDVEST GROUP LIMITED / ANNUAL INTEGRATED REPORT 2011
Our state-of-the-art fishmeal plant at Baia Farta in Benguela province has been completed – part of our support for our Angolan joint venture, Pesca Fresca.
A new country director has been appointed for Angola, with the primary task of overseeing our fishing interest in Benguela. Work began at our canning factory in Walvis Bay to enable production lines to be used for the canning of beans as well as pilchards. This increases asset utilisation while contributing to enterprise development and community support.
Capital has been committed for a modern, fully integrated refrigerated, chilled and dry goods distribution centre in Windhoek to support continued growth by our foodservice business.
Training investment rose from R2,2 million to R2,8 million. Leadership and management training are focus areas.
At year-end, work was nearing completion on a R2 million training centre at Walvis Bay for use by both BidCom and BidFish.
Our first management conference (in November) proved a success and will become an annual event.
Weaknesses have been identified in strategic decision-making and solution-finding. Until 2008, many of our businesses were regional offshoots of Bidvest divisions in South Africa. Senior managers in Johannesburg took strategic decisions. Pre- and post-listing there was little time to foster strategic management skills and turn yesterday’s branch managers into today’s business leaders. Internal development of these skills is now a priority.
PerformanceOverall performance was strong. Revenue rose 9,5% to R2,1 billion (2010: R1,9 billion) while trading profit moved
46,8% higher at R540,2 million (2010: R367,9 million). Proceeds from the sale of the fishing vessel ‘Mars’ amounted to R18,0 million.
Ahead of our 2009 listing, senior management set the strategic target of doubling profits in three years. Our second set of results as a separate company shows we achieved this target in only two years. There were no acquisitions during this time. All growth was organic, demonstrating the resourcefulness of our people as the period coincided with slow recovery from recessionary conditions.
Cash generated by operations rose 26,2% to R564,6 million.
Trading margins increased from 22,9% to 28,4%.
Horse mackerel performance reflects high catch rates and firm prices. Results are underpinned by the success of our long-term strategy of differentiating Namsov fish by consistently delivering high quality.
Areas of under-performance resided in some of our commercial businesses and within our Angolan joint venture.
Our commercial businesses stepped up the quest for efficiencies in the face of tough trading conditions. No jobs were lost and overall staff numbers increased.
PeopleEmployee engagement
At BidFish, employee numbers have increased, with the horse mackerel operations now employing 592 people. The monkfish operations were restructured to catch hake, but the vessel still employs 21 people. The oyster farm, despite crippling oyster mortalities due to severe natural sulphur eruptions, also employs 21 people. The pilchard cannery still has 76 permanent and 753 seasonal
employees, but this year we expect that the seasonal workers could be employed for longer due to the increased volumes available to this facility. Our Angolan operation employs 118 people. Total employment in Namibia and Angola could reach 1 581 permanent and temporary staff in the peak of the season. All BidFish crew members, who form the vast majority of our workforce, are unionised. We engage with staff regularly through shop steward meetings and other means.
At BidCom, our employee numbers have remained stable from 2010 to 2011 at approximately 910 people. We have adopted various approaches to employment equity, and conduct periodic self-assessments. Some companies, such as Manica, are guided by a policy closely aligned to the South African model. In BidCom, the staff of stevedoring is unionised. Our continuous communication and attentive approach contributed to the fact that there was no industrial action during the year.
Manica and Namsov conducted an employee satisfaction survey during the year under review. A benchmark of a 68% satisfaction rate was set for this first year. Any areas achieving less than a 68% satisfaction rate are now actively managed. Altogether 50% of employees participated in the survey. Results were satisfactory, and management is addressing areas for improvement.
Targets for the 2012 financial year are to improve satisfaction levels to 70% and achieve an employee participation rate of 70%.
Maintaining employee satisfaction and our role as a preferred employer will always be among our main objectives and will continue to be an item at every management and board meeting.
PASSION/VITALITY/PRECISION
122
Operational review
Bidvest Namibia continued
Training and skills
A major business risk in Namibia relates to the enduring challenge of skills and talent retention. Our response is to invest continually in training. Following the successful conclusion of the Ovanhu BEE transaction, Bidvest Namibian operations are renewing efforts to attract the best employees through leading-edge skills programmes and training spend increased significantly this year. We are addressing how best to retain trained employees by identifying high-potential individuals and grooming them for senior positions, thereby encouraging a long-term commitment.
We continue to respond to the challenge of promoting Namibian seagoing employees to officer rankings. Because the vessels are of Russian origin, officers have traditionally been Russian. Our objective is to graduate crew at the Namibian Maritime and Fisheries Institute (NAMFI) who can then go on to officer training at recognised institutions outside Namibia. There are currently two students enrolled through Namsov’s training programme at the Cape Peninsula University of Technology (CPUT) and another two students at the Project Management Training Centre (PMT) at Saldanha, South Africa. This process will take 13 to 15 years at a cost of R500 000 per student. A further two students will be introduced into the officer training school system in 2012. Altogether 10 students will also go to Russia for a three and a half year course to prepare them for promotion to officer rank.
Health and safety
The welfare and safety of our crews at sea is an ongoing concern.
Two government observers per vessel monitor operations at sea on a 24/7 basis. Separate teams of inspectors monitor transhipments and discharges. Namsov adheres to all international maritime regulations, with special emphasis on those relating to safety. No serious
incidents were recorded, and the lost-time injury frequency rate decreased by 70% in 2011. This is primarily a result of the strict safety procedures that are enforced by officers on board the vessels.
The most significant health and safety issues in the BidCom division affect stevedoring due to its involvement in moving freight in the Walvis Bay harbour. No fatalities were experienced during the year under review. We have further improved our safety preparedness this year by appointing a safety officer to address employee safety matters.
HIV/Aids
HIV/Aids is a major concern at Bidvest Namibia. While management of this condition is an ongoing challenge, continued efforts appear to be yielding positive results, with a lower incidence of new cases as well as reduced health-related absenteeism. We continue to offer counselling and education at both company and national level.
Bidvest Namibia has an ongoing programme to help employees establish their HIV status and to assist sufferers with treatment. Extensive use is made of peer educators to talk to employees and facilitate access to antiretroviral drugs through a carefully managed programme. The identity of employees on the ARV programme is protected, and numbers are therefore not available to measure the uptake and success of this programme.
Economic equityThe Ovanhu Transaction has continued to be a success, securing local ownership of 14,8% of the shares in Bidvest Namibia. This local ownership promotes awareness of Bidvest and its brands in the Namibian market and contributes to our good reputation.
EnvironmentThe harvesting of horse mackerel for African markets continues to account for approximately 85% of our fishing business.
Reliance on fish resources has been mitigated by close cooperation with the Ministry of Fisheries and Marine Resources and our long-term approach to resource management. We supported government’s sharp reduction in the TAC to 230 000 tonnes three years ago. As a result, horse mackerel, hake and monkfish have recovered strongly, though the pilchard resource presents a continuing challenge. We monitor catching capacity, markets and prices, enabling us to optimise quotas and commercial opportunities without depleting stock. This year we landed our full quota for horse mackerel and 85% of our quota for pilchards.
We are investigating Marine Stewardship Council (MSC) certification for Namibian horse mackerel; possibly a first for this species worldwide. Although this initiative has temporarily been put on hold, we still anticipate the process will reach fruition in 2012.
Collateral damage is minimised at Namsov through targeted mid-water trawling and gear restrictions designed to avoid excessive harvesting of juveniles. Gear losses are minimal and our by-catch remained around 1% of total catches; still among the best percentages internationally. We have created a target of maintaining this by-catch performance at 1% of total catch, and aim not to process more than 5% into fishmeal.
Our vessels consumed approximately 30 000 tonnes of fuel this year (2010: 28 000 tonnes). The conversion of the fleet to run on cheaper fuel grades is expected to be complete by the end of 2011. This is a cost-saving initiative, and we are aware that heavier intermediate fuel types are more polluting. However, we are of the opinion that the benefits to society and the environment of our other sustainability initiatives outweigh the negative impact of using these heavier fuels.

123
PERFORMANCE OVERVIEW
THE BIDVEST GROUP LIMITED / ANNUAL INTEGRATED REPORT 2011
BidCom is continuing with initiatives to optimise fuel use, including the installation of a tracking system for our vehicles, which monitors driving behaviour and fuel consumption.
Increased water consumption reflects the expansion of Bidvest Namibia this year, including the addition of Manica’s new divisions.
The increase in reported electricity consumption reflects the inclusion of new divisions this year as well as more accurate reporting.
Manica handles approximately 12 000 metric tonnes of imported sulphur every second month, and 14 000 metric tonnes of zinc are exported every month. The company is ISO 9001:2008 compliant. No spills were reported nor fines levied for non-compliance with local or international environmental regulations during this reporting period.
Fire detectors and alarm systems are installed and tested on a regular basis. Fire drills and evacuations are frequently practised, involving various third parties such as the hospital and Namport. After such exercises feedback sessions are conducted and learning points shared with all relevant parties.
The risk of injury or property damage in handling these materials is actively managed by a dedicated Environmental Health and Safety (EHS) officer.
Corporate social investmentThis year Bidvest Namibia spent NAD6,6 million on corporate social investment projects (2010: NAD4,08 million). This included Namsov Community Trust projects to help people and communities in need, bringing the total since 1990 to NAD$33,9 million. The trust is directed by five trustees; two non-executive trustees representing the local communities and three company-
appointed trustees with executive functions.
Namsov is using its capital and expertise in a joint venture with four other rights-holding companies. The resulting entity, Trachurus Fishing (Pty) Limited, is 50,1% owned by Namsov. The company owns two vessels and continues to perform well under Namsov’s management in the harvesting of its horse mackerel quotas. Namsov is actively seeking to secure an additional horse mackerel quota.
The Namsov Community Trust is exploring the possibility of distributing horse mackerel in Namibia at the community micro-level, which would create job opportunities for community-level entrepreneurs.
Employees of the Manica group established the Pandula Trust and contributed NAD84 000 towards a number of projects.
In conjunction with the Office of the Prime Minister, United Fishing Enterprises (UFE) embarked on an initiative to uplift rural women through its Namsea canning facility, by offering them the opportunity to progress from subsistence farming to establishing small enterprises. During this financial year, the programme created opportunities for between 300 and 400 women to market their excess bean crop. In total, 50 000 tins of beans have been produced and marketed in the first year of this initiative.
The pilchard cannery is now in its third year after reopening, with significantly increased volumes available for processing, providing permanent and temporary employment for over 800 people.
Product responsibilityThe division acknowledges its responsibility to provide healthy and safe products. Food health and safety are particularly important for BidFish and
BidCom. Budget Rent A Car is responsible for a different set of product responsibility concerns with respect to the safety of their rental vehicles.
Bidvest Namibia complies with all regulations relating to branding and labelling of our products and services. BidCom relies on strong links with internationally recognised brands and adheres to all requirements of the manufacturers and suppliers of its products.
Independent quality surveyance of BidFish products ensures that we have preferred supplier status in the markets where we operate. BidCom entities have strict internal policies and procedures, supplier rules, quality prescriptions and a continuous drive to comply with health and safety regulations. These have all contributed to the fact that there are, as far as we are aware, no significant health and safety issues associated with our products and services.
FutureGDP growth in 2012 is officially projected to reach 5%. A concerted government effort to grow jobs is expected. Government has earmarked R9 billion for investment in infrastructure, transport, agriculture and education. Stimulation will not only benefit the targeted sectors, but the retail economy.
Licensing difficulties in Angola have been resolved, setting the scene for improved performance by our joint venture.
Training investment and enhanced support for local managers or, in some cases, their replacement will enable improved performance at our commercial businesses.
Our cash position remains strong, enabling the pursuit of strategic acquisition opportunities.
We are committed to continued growth – both acquisitive and organic.

PASSION/VITALITY/PRECISION
124

125 THE BIDVEST GROUP LIMITED / ANNUAL INTEGRATED REPORT 2011
126 Value added statement
126 Exchanges with governments
127 Directors’ responsibility for the financial statements
127 Declaration by company secretary
127 Preparer of financial statements
128 Independent auditors’ report
129 Audit committee report
132 Directors’ report
142 Accounting policies
154 Consolidated income statement
155 Consolidated statement of other comprehensive income
156 Consolidated statement of cash flows
157 Consolidated statement of changes in equity
158 Consolidated statement of financial position
159 Notes to the consolidated financial statements
210 Company income statement
210 Company statement of cash flows
211 Company statement of changes in equity
211 Company statement of financial position
212 Notes to the Company financial statements
215 Interest in subsidiaries, joint ventures and associates
PRECISIONTo complete an annual migration of some thousands of kilometres, the butterfly makes the homeward journey to the precise point of departure, drawing on inherited flight patterns and orientation by the earth’s magnetic field. Incredible ingenuity and precision are attributes for which our group is renowned.

PASSION/VITALITY/PRECISION
126
2011%
2010%
■ Employees■ Governments■ Providers of capital■ Retained for growth
58%59%
6%
10%
25%
10%
25%
7%
Value added statement
“Value added” is the value which the Group has added to purchased materials and goods by process of manufacture and conversion, and the sale of its products and services. This statement shows how the value so added has been distributed.
2011 2010
R’000 % R’000 %
Revenue 118 482 736 109 789 207
Net cost of raw materials, goods and services (95 731 194) (88 314 088)
Wealth created by trading operations 22 751 542 21 475 119
Finance income 162 425 193 386
Dividend income 49 977 44 411
Total wealth created 22 963 944 100,0 21 712 916 100,0
Distributed as follows
Employees
Benefits and remuneration 13 308 592 58,0 12 779 474 58,9
Governments
Current taxation 1 528 169 6,6 1 301 059 6,0
Providers of capital 2 337 387 10,2 2 168 348 10,0
Finance charges 777 650 3,4 866 803 4,0
Distribution to shareholders 1 559 737 6,8 1 301 545 6,0
Retained for growth 5 789 796 25,2 5 464 035 25,1
Depreciation and amortisation 1 811 698 7,9 1 870 465 8,6
Impairments 439 350 1,9 248 395 1,1
Profit for the year attributable to shareholders of the Company 3 538 748 15,4 3 345 175 15,4
22 963 944 100,0 21 712 916 100,0
South African Foreign
2011
R’000
2010
R’000
2011
R’000
2010
R’000
Employee taxes 1 064 824 975 875 1 219 132 1 183 573
Company taxes 1 015 922 782 913 512 247 518 146
Value added tax and sales tax 5 153 935 3 739 474 401 451 417 325
Customs and excise duty 9 201 091 8 012 461 900 642 470 965
Other 258 988 250 236 267 725 265 712
16 694 760 13 760 959 3 301 197 2 855 721
Exchanges with governmentsincluding amounts collected on their behalf

127
AUDITED FINANCIAL STATEMENTS
THE BIDVEST GROUP LIMITED / ANNUAL INTEGRATED REPORT 2011
To the shareholders of The Bidvest Group Limited
The directors are responsible for the preparation and fair presentation of the Group and Company financial statements in accordance with
International Financial Reporting Standards, the interpretations adopted by the International Accounting Standards Board, South African
interpretations of Statements of Generally Accepted Accounting Practice, and in the manner required by the Companies Act of South Africa.
The directors’ responsibility includes: designing, implementing and maintaining internal control relevant to the preparation and fair
presentation of these financial statements that are free from material misstatement, whether due to fraud or error; selecting and applying
appropriate accounting policies; and making accounting estimates that are reasonable in the circumstances.
The directors acknowledge their responsibility to ensure the integrity of the integrated report and are of the opinion that the integrated report
addresses all material issues and presents fairly the integrated performance of the organisation and its impacts.
The directors’ responsibility also includes maintaining adequate accounting records and an effective system of risk management.
The directors have made an assessment of the Group and Company’s ability to continue as a going concern and there is no reason to
believe that the Group and Company will not be going concerns in the year ahead.
The auditors are responsible for reporting on whether the Group and Company financial statements are fairly presented in accordance with
the applicable financial reporting framework.
The Group financial statements and financial statements of the Company as identified in the first paragraph, were approved by the board of
directors and are signed on its behalf by:
Cyril Ramaphosa Brian Joffe
Chairman Chief executive
August 27 2011
Declaration by company secretary
In my capacity as company secretary, I hereby confirm, in terms of the Companies Act of South Africa, that for the year ended June 30 2011,
the Company has lodged with the Registrar of Companies, all such returns as are required in terms of this Act and that all such returns are
true, correct and up to date.
Craig Andrew Brighten
Company secretary
August 27 2011
Preparer of financial statements
The Group and Company financial statements have been prepared under the supervision of NEJ Goodwin CA(SA).
Directors’ responsibility for the financial statements
PASSION/VITALITY/PRECISION
128
Independent auditors’ report
To the shareholders of The Bidvest Group Limited
We have audited the Group annual financial statements and annual financial statements of The Bidvest Group Limited, which comprise
the consolidated and separate statements of financial position as at June 30 2011, the consolidated and separate income statements
and the consolidated and separate statements of other comprehensive income, the consolidated and separate statements of changes in
equity and consolidated and separate statements of cash flows for the year then ended, and a summary of significant accounting policies
and other explanatory notes, and the directors’ report, as set out on pages 10 to 12 and 129 to 221.
Directors’ responsibility for the financial statements
The directors are responsible for the preparation and fair presentation of these financial statements in accordance with International Financial
Reporting Standards and the requirements of the Companies Act of South Africa, and for such internal control as the directors determine is
necessary to enable the preparation of financial statements that are free from material misstatement, whether due to fraud or error.
Auditors’ responsibility
Our responsibility is to express an opinion on these financial statements based on our audit. We conducted our audit in accordance with
International Standards on Auditing. Those standards require that we comply with ethical requirements and plan and perform the audit to
obtain reasonable assurance about whether the financial statements are free from material misstatement.
An audit involves performing procedures to obtain audit evidence about the amounts and disclosures in the financial statements. The
procedures selected depend on the auditors’ judgement, including the assessment of the risks of material misstatement of the financial
statements, whether due to fraud or error. In making those risk assessments, the auditors consider internal control relevant to the entity’s
preparation and fair presentation of the financial statements in order to design audit procedures that are appropriate in the circumstances,
but not for the purpose of expressing an opinion on the effectiveness of the entity’s internal control. An audit also includes evaluating the
appropriateness of accounting principles used and the reasonableness of accounting estimates made by management, as well as evaluating
the overall presentation of the financial statements.
We believe that the audit evidence we have obtained is sufficient and appropriate to provide a basis for our audit opinion.
Opinion
In our opinion, these financial statements present fairly, in all material respects, the consolidated and separate financial positions of The
Bidvest Group Limited as at June 30 2011, and its consolidated and separate financial performance and consolidated and separate cash
flows for the year then ended in accordance with International Financial Reporting Standards, and the requirements of the Companies Act
of South Africa.
Deloitte & Touche
Registered Auditors
Per Trevor J Brown
Partner
August 27 2011

129
AUDITED FINANCIAL STATEMENTS
THE BIDVEST GROUP LIMITED / ANNUAL INTEGRATED REPORT 2011
Audit committee report
This is the report of the audit committee (committee) of The Bidvest Group Limited appointed for the financial year ended June 30 2011 in
compliance with the Companies Act, 2008 as amended (the Act) and in terms of the JSE listing requirements.
The committee has detailed terms of reference that comply with the Act and King III and are approved by the board. Copies of the terms of
reference are available from the company secretary on request.
Membership
The board of directors appointed the committee for the 2011 financial year. At the annual general meeting scheduled for
November 21 2011, shareholders will be asked to approve the appointment of the chairman and members of the committee for the
2012 financial year.
The committee consists solely of independent non-executive directors who are all financially literate.
The members are NG Payne (chairman), D Masson, NP Mageza and JL Pamensky.
Purpose
The purpose of the committee is:
• To assist the board in discharging its duties relating to the safeguarding of assets, the operation of adequate systems, control and
reporting processes, and the preparation of accurate reporting and financial statements in compliance with the applicable legal
requirements and accounting standards,
• To provide management, external and internal auditors access to the chairman or any other member of the committee about any matter
within the committee’s scope,
• To meet separately with the external and internal auditors at least once a year,
• To provide a forum for discussing business risk and control issues and developing recommendations for consideration by the board,
• To monitor enterprise-wide, operational, market, regulatory, safety and other risks, and to monitor controls designed to minimise risk,
• To review the Company’s integrated annual report, including the annual financial statements, as well as its interim report and any other
public reports or announcements containing financial information,
• To consider and recommend to the board whether external assurance should be provided on the sustainability report and, in conjunction
with the risk committee, to ensure that the report is consistent with the annual financial statements,
• To oversee the activities of, and to ensure coordination between, the activities of internal and external audit,
• To perform duties assigned to it under the Act and other legislation, including statutory audit committee functions for subsidiary
companies,
• To receive and deal with any complaints concerning the accounting practices, internal audit or the content and audit of its financial
statements or related matters, and
• To annually review the committee’s work and terms of reference and to make recommendations to the board to ensure its effectiveness.
Duties carried out
The committee has performed its duties and responsibilities during the financial year according to its terms of reference.
External audit
The committee:
• Nominated Deloitte & Touche as auditors and TJ Brown as the independent auditor and designated audit partner, respectively to the
shareholders for appointment as auditors for the financial year ended June 30 2011, and ensured that the appointments complied with
legal and regulatory requirements for the appointment of an auditor,
• Confirmed that the independent auditor and the designated audit partner are accredited by the JSE,
• Approved the external audit engagement letter, the audit plan and the budgeted audit fees payable to the external auditors,

PASSION/VITALITY/PRECISION
130
Audit committee report
• Reviewed the audit and evaluated the effectiveness of the independent auditors,
• Obtained a statement from the independent auditors confirming that its independence was not impaired,
• Determined the nature and extent of all non-audit services provided by the independent auditors and preapproved all non-audit services
undertaken,
• Obtained assurances from the independent auditors that adequate accounting records were being maintained,
• Confirmed that no reportable irregularities had been identified or reported by the independent auditors under the Auditing Profession Act,
and
• Nominated the independent auditors and the designated audit partner for each of Bidvest’s South African subsidiary companies.
Financial statements
The committee:
• Confirmed, based on management’s review, that the interim and annual financial statements were prepared on the going concern basis,
• Examined the interim and annual financial statements and other financial information made public, prior to their approval by the board,
• Considered accounting treatments, significant or unusual transactions and accounting judgements,
• Considered the appropriateness of accounting policies and any changes made,
• Reviewed the independent auditor’s audit report,
• Reviewed the representation letter relating to the annual financial statements signed by management,
• Considered any problems identified as well as any legal and tax matters that could materially affect the financial statements,
• Met separately with management, external audit and internal audit, and
• Concluded that the annual financial statements fairly present the financial position of the Group and Company at the end of the financial
year and the results of its operations and cash flows for the financial year then ended.
Internal control and internal audit
The committee:
• Reviewed and approved the annual internal audit plans and evaluated the independence, effectiveness and performance of the internal
audit providers. The three year rolling internal audit and combined assurance plans are designed to enable full reporting in terms of King III
by the end of the 2012 financial year,
• Considered the reports of the internal auditors and independent auditors on the Group’s systems of internal control including financial,
controls, business risk management and maintenance of effective internal control systems,
• Received assurances that proper accounting records were maintained and that the systems safeguarded the Group’s assets against
unauthorised use or disposal,
• Reviewed issues raised by internal audit and the adequacy of corrective action taken by management in response,
• Assessed the adequacy of the performance of the internal audit function and found it satisfactory, and
• Based on the above, the committee formed the opinion that the business units which have a high dependancy on internal financial
controls have been assessed as being adequate and effective.
Risk management and information technology
The committee:
• Reviewed the Group’s policies on risk assessment and risk management, including fraud risks and information technology risks and found
them to be sound, and
• Received written assessments of the effectiveness of the Group’s system of internal controls and risk management from the internal
auditors.
Legal and regulatory requirements
The committee:
• Reviewed with management legal matters that could have a material impact on the Group,
• Reviewed with the Company’s legal counsel the adequacy and effectiveness of the Group’s procedures to ensure compliance with legal
and regulatory responsibilities, and
• Considered reports provided by management, internal audit and the independent auditors regarding compliance with legal and regulatory
requirements.

131
AUDITED FINANCIAL STATEMENTS
THE BIDVEST GROUP LIMITED / ANNUAL INTEGRATED REPORT 2011
Combined assurance
The committee reviewed the plans and reports of the external and internal auditors and other assurance providers including management,
and concluded that these were adequate to address all significant financial risks facing the business. Our intention in future is to show a
separate report on combined assurance.
Financial director and finance function
The committee:
• Considered the appropriateness of the experience and expertise of the Group financial director and concluded that these were
appropriate, and
• Considered the expertise, resources and experience of the finance function and concluded that these were appropriate.
Independence of independent auditors
The committee is satisfied that Deloitte & Touche is independent of the Group after taking the following factors into account:
• Representations made by Deloitte & Touche to the committee,
• The auditors do not, except as independent auditors or in rendering permitted non-audit services, receive any remuneration or other
benefit from the Group,
• The auditors’ independence was not impaired by any consultancy, advisory or other work undertaken,
• The auditors’ independence was not prejudiced as a result of any previous appointment as auditors, and
• The criteria specified for independence by the Independent Regulatory Board for Auditors and international regulatory bodies.
Annual financial statements
Following the review by the committee of the annual financial statements of The Bidvest Group Limited for the year ended June 30 2011,
the committee is of the view that, in all material respects, it complies with the relevant provisions of the Act and IFRS and fairly presents the
financial position at that date and the results of its operations and cash flows for the year then ended. In conjunction with the risk committee,
the committee has also satisfied itself as to the integrity of the remainder of the integrated annual report. Having achieved its objectives
for the financial year, the committee recommended the annual financial statements and annual integrated report for the year ended
June 30 2011 for approval to The Bidvest Group Limited board.
Signed on behalf of the committee by:
NG Payne
Chairman

PASSION/VITALITY/PRECISION
132
Directors’ report
The directors have pleasure in presenting their report for the year ended June 30 2011.
Nature of business
The Company is an investment holding company with subsidiaries operating in the services, trading and distribution industries. Details of the
Group’s activities are included in Bidvest at a glance: Our structure, and Operational review.
Financial reporting
The directors are required by the Companies Act 71 of 2008, as amended (the Act), to produce financial statements, which fairly present the
state of affairs of the Company and the Group as at the end of the financial year and the profit or loss for that financial year, in conformity
with International Financial Reporting Standards (IFRS) and the Act.
The financial statements as set out in this report have been prepared by management in accordance with IFRS and the Act, and are based
on appropriate accounting policies supported by reasonable and prudent judgements and estimates.
The directors are of the opinion that the financial statements fairly present the financial position of the Company and of the Group as at
June 30 2011 and the results of their operations and cash flows for the year then ended.
The directors are satisfied that the Group has adequate resources to continue in operational existence for the foreseeable future.
Accordingly, the directors continue to adopt the going-concern basis in preparing the financial statements.
Share capital
No shares were issued during the year. (2010: 13 860 179 shares were issued at premiums of between R17,50 and R119,95 per share)
The Company acquired and cancelled 22 796 174 shares on December 15 2010. The shares were acquired from a subsidiary at
R151,51 per share in terms of a special resolution passed at the annual general meeting held on November 15 2010.
Acquisitions and disposal
The Group announced on December 22 2010 that it had acquired 100% of the issued share capital of Seafood Holdings Limited, a leading
fresh fish foodservice business in the United Kingdom, for an enterprise value of GBP45 million. The Group also undertook a number of
smaller acquisitions during the year. Details of assets acquired and liabilities assumed are contained in note 11 to these financial statements.
The sale of 13,5% of the equity of Mumbai International Airport Private Limited for a profit of between R300 million and R400 million was not
completed as certain formalities remained outstanding.
Subsequent events
No reportable events took place subsequent to the year-end.
Results of operations
The results of operations are dealt with in the consolidated income statement, segmental analysis and operational review.
Movement in treasury shares
In terms of general authorities granted to the Company to repurchase its ordinary shares, the latest being shareholder authority obtained at
the annual general meeting of shareholders held on November 15 2010, a maximum of 65 469 714 ordinary shares may be acquired by the
Company of which 32 734 857 may be acquired by its subsidiaries.
In accordance with a specific authority passed at a general meeting of shareholders held on May 23 2011, a subsidiary company acquired
12 000 000 shares at a price of R131,75 per share.
A total of 1 388 460 ordinary shares were disposed of at an average price of R80,05 per share in settlement of share options exercised by
staff.

133
AUDITED FINANCIAL STATEMENTS
THE BIDVEST GROUP LIMITED / ANNUAL INTEGRATED REPORT 2011
Dividends
An interim cash dividend of 225,0 cents per share (2010: 207,0 cents per share) was awarded to shareholders recorded in the register at the
close of business on April 1 2011.
Subsequent to year-end, a final cash dividend of 255,0 cents per share (2010: 225,0 cents per share) was awarded to shareholders
recorded In the register at the close of business on Friday, September 23 2011. The salient dates are:
Distribution dates:
Last day to trade cum-distribution Friday, September 16 2011
Trading ex-distribution commences Monday, September 19 2011
Record date Friday, September 23 2011
Payment date Monday, September 26 2011
Payments to shareholders
Approval was obtained at the last annual general meeting for the Company to make payments which would reduce its share capital, share
premium, and/or reserves in terms of the Act.
Special resolutions
Special resolutions were passed at the annual general meeting of shareholders held on November 15 2010 in regard to a general authority
to enable the Company to acquire its own shares and at a general meeting of shareholders held on May 23 2011 to approve a specific
buy-back of Bidvest shares.
Subsequent to year-end, further special resolutions relating to financial assistance to related or inter-related entities of the Company, financial
assistance for subscription of securities to related or inter-related entities of the Company and the approval of the non-executive directors’
remuneration were passed at a general meeting of shareholders held on July 15 2011. The directors have complied with all sections of the
Act.
Special resolutions were passed by certain subsidiaries to accommodate the acquisition of various businesses, to amend their articles of
association and to change their names.
Strategic realignment of executive management responsibilities
To sharpen the focus of executive responsibilities and create capacity for expansion, the Group announced in March 2011 that Lindsay
Ralphs would become managing director of all core South African operations, excluding Bidvest Foodservices and Bidvest Namibia.
Businesses in South Africa have been realigned into new divisions. Senior positions in the new structure were all filled by internal staff. It was
announced during the previous financial year that Bernard Berson was appointed as managing director of Bidvest Foodservice (including all
the international and local foodservice businesses). Each managing director has his own executive committee.
Directorate
Mr SG Pretorius retired as an executive director with effect from March 1 2011.
In terms of the Company’s articles of association the directors who retire by rotation at the forthcoming annual general meeting are
DDB Band, BL Berson, DE Cleasby, AW Dawe, RM Kunene, P Nyman and LP Ralphs. All retiring directors are eligible and available for
re-election.

PASSION/VITALITY/PRECISION
134
Directors’ report
The names of the directors who were in office during the period August 28 2010 to August 26 2011 and the details of board meetings attended by each of the directors are:
DirectorDate of
appointmentNovember 12
2010February 25
2011May 26
2011August 17
2011August 25
2011
ChairmanMC Ramaphosa July 6 2004 ^ ^ Apol ^ ^
Independent non-executive directorsDDB Band October 27 2003 ^ ^ ^ ^ ^LG Boyle January 23 2001 Apol ^ Apol ^ ^MBN Dube October 27 2003 ^ ^ ^ Apol ^S Koseff June 17 1997 Apol ^ ^ Apol ^NP Mageza August 28 2009 ^ ^ ^ ^ ApolD Masson March 10 1992 ^ ^ ^ ^ ^JL Pamensky January 8 1990 ^ ^ ^ ^ ^NG Payne June 30 2006 ^ ^ ^ ^ ^FDP Tlakula June 30 2006 Apol ^ ^ Apol Apol
Non-executive directorsFJ Barnes October 27 2003 ^ ^ ^ ^ ^AA da Costa December 8 2003 ^ ^ ^ ^ ^RM Kunene December 8 2003 ^ ^ Apol Apol ApolT Slabbert August 20 2007 ^ ^ ^ ^ ^
Executive directorsB Joffe March 1 1989 ^ ^ ^ ^ ^BL Berson October 27 2003 ^ ^ ^ ^ ^MC Berzack April 29 2002 ^ ^ ^ ^ ^DE Cleasby July 9 2007 ^ ^ ^ ^ ^AW Dawe June 30 2006 ^ ^ ^ ^ ^LI Jacobs October 27 2003 ^ ^ ^ ^ ^P Nyman February 1 1991 ^ ^ ^ ^ ^SG Pretorius February 19 2004 ^ ^ * * *LP Ralphs May 19 1992 ^ ^ ^ ^ ^AC Salomon September 10 1990 ^ ^ ^ ^ ^
AlternateLJ Mokoena (alternate to AA da Costa) December 8 2003
^ Attended in person, by video-conference or tele-conference.
Apol – Apologies tendered.
* Retired March 1 2011
Audit committee The names of the members who were in office during the period August 28 2010 to August 26 2011 and the details of audit committee meetings attended by each of the members are:
DirectorNovember 12
2010February 24
2011May 23
2011August 22
2011August 23
2011
NG Payne (Chairman) ^ ^ ^ ^ ^NP Mageza ^ ^ ^ ^ ^D Masson ^ ^ ^ ^ ^JL Pamensky ^ ^ ^ ^ ^
^ Attended in person, by video-conference or tele-conference.Apol – Apologies tendered.

135
AUDITED FINANCIAL STATEMENTS
THE BIDVEST GROUP LIMITED / ANNUAL INTEGRATED REPORT 2011
Nominations committee The names of the members who were in office during the period August 28 2010 to August 26 2011 and the details of nominations committee meetings attended by each of the members are:
DirectorAugust 25
2011
DDB Band (Chairman) ^JL Pamensky ^MC Ramaphosa ^T Slabbert ^B Joffe Apol
^ Attended in person, by video-conference or tele-conference.
Apol – Apologies tendered.
Remuneration committee The names of the members who were in office during the period August 28 2010 to August 26 2011 and the details of remuneration committee meetings attended by each of the directors are:
DirectorMarch 13
2011June 2 2011
August 25 2011
DDB Band (Chairman) ^ ^ ^D Masson ^ ^ ^JL Pamensky ^ ^ ^
^ Attended in person, by video-conference or tele-conference.
Risk committee The names of the members who were in office during the period August 28 2010 to August 26 2011 and the details of the risk committee meetings attended by each of the members are:
October 212010
January 272011
May 262011
July 282011
DirectorsNG Payne (Chairman) ^ ^ ^ ^D Masson ^ ^ ^ ^BL Berson Apol ^ ^ ^MC Berzack ^ ^ # #DE Cleasby ^ ^ ^ ^AW Dawe Apol ^ ^ ^B Joffe ^ ^ ^ ApolP Nyman ^ ^ ^ ^SG Pretorius ^ ^ * *LP Ralphs ^ ^ ^ ^AC Salomon ^ ^ ^ ^
Other executivesNW Birch ^ ^ ^ ^CE Singer ^ ^ ^ ^
^ Attended in person, by video-conference or tele-conference.
Apol – Apologies tendered.
* Retired March 1 2011
# Resigned from risk committee in February 2011

PASSION/VITALITY/PRECISION
136
Directors’ report
Acquisition committee
The names of the members who were in office during the period August 28 2010 to August 26 2011 and the details of acquisition committee meetings attended by each of the members are:
DirectorMay 26
2011June 2 2011
August 12 2011
DDB Band (Chairman) ^ ^ ^D Masson ^ ^ ^JL Pamensky ^ ^ ^MC Berzack ^ ^ ApolDE Cleasby ^ ^ ^B Joffe ^ ^ ^LP Ralphs ^ ^ ^
^ Attended in person, by video-conference or tele-conference.
Transformation committee The names of the members who were in office during the period August 28 2010 to August 26 2011 and the number of transformation committee meetings attended by each of the members are:
November 112011
May 202011
August 192011
DirectorsLI Jacobs (Chairman) ^ ^ ^T Slabbert ^ ^ ^FDP Tlakula Apol Apol ^MC Berzack ^ # #AW Dawe ^ ^ ^B Joffe ^ Apol ^SG Pretorius ^ * *LP Ralphs ^ ^ ^
Other executivesNW Birch ^ ^ ^MJ Finger ^ ^ ^GC McMahon ^ ^ ^CE Singer Apol Apol ^SA Thwala ^ ^ ^
^ Attended in person, by video-conference or tele-conference.
Apol – Apologies tendered.
* Retired March 1 2011
# Resigned from transformation committee in February 2011
Directors’ interestsThe aggregate interests of the directors in the capital of the Company at June 30 2011 were:
Number of shares
2011 2010
Beneficial 2 981 663 5 130 863Non-beneficial 15 607 278 25 654 244Held in terms of The Bidvest Share Incentive Scheme Options 912 500 1 381 750 Shares 922 038 1 140 362
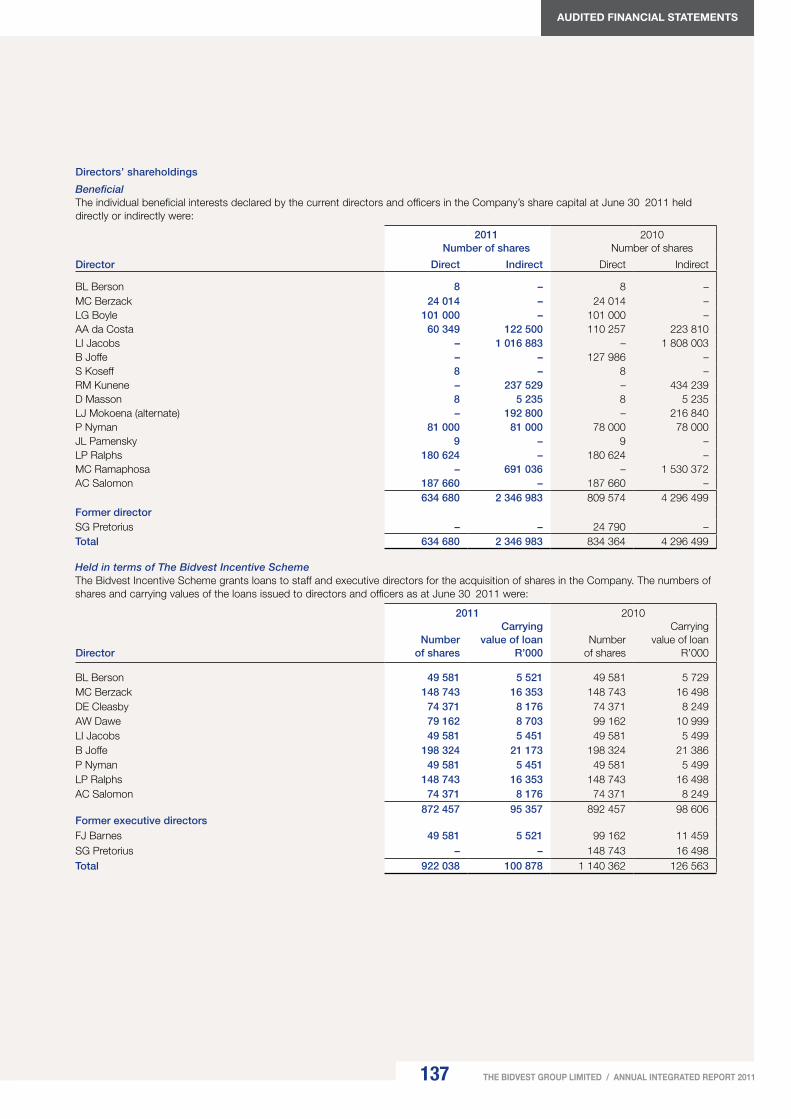
137
AUDITED FINANCIAL STATEMENTS
THE BIDVEST GROUP LIMITED / ANNUAL INTEGRATED REPORT 2011
Directors’ shareholdings
BeneficialThe individual beneficial interests declared by the current directors and officers in the Company’s share capital at June 30 2011 held directly or indirectly were:
2011Number of shares
2010Number of shares
Director Direct Indirect Direct Indirect
BL Berson 8 – 8 –MC Berzack 24 014 – 24 014 –LG Boyle 101 000 – 101 000 –AA da Costa 60 349 122 500 110 257 223 810LI Jacobs – 1 016 883 – 1 808 003B Joffe – – 127 986 –S Koseff 8 – 8 –RM Kunene – 237 529 – 434 239D Masson 8 5 235 8 5 235LJ Mokoena (alternate) – 192 800 – 216 840P Nyman 81 000 81 000 78 000 78 000JL Pamensky 9 – 9 –LP Ralphs 180 624 – 180 624 –MC Ramaphosa – 691 036 – 1 530 372AC Salomon 187 660 – 187 660 –
634 680 2 346 983 809 574 4 296 499Former directorSG Pretorius – – 24 790 –Total 634 680 2 346 983 834 364 4 296 499
Held in terms of The Bidvest Incentive SchemeThe Bidvest Incentive Scheme grants loans to staff and executive directors for the acquisition of shares in the Company. The numbers of shares and carrying values of the loans issued to directors and officers as at June 30 2011 were:
2011 2010
DirectorNumber
of shares
Carrying value of loan
R’000Number
of shares
Carrying value of loan
R’000
BL Berson 49 581 5 521 49 581 5 729MC Berzack 148 743 16 353 148 743 16 498DE Cleasby 74 371 8 176 74 371 8 249AW Dawe 79 162 8 703 99 162 10 999LI Jacobs 49 581 5 451 49 581 5 499B Joffe 198 324 21 173 198 324 21 386P Nyman 49 581 5 451 49 581 5 499LP Ralphs 148 743 16 353 148 743 16 498AC Salomon 74 371 8 176 74 371 8 249
872 457 95 357 892 457 98 606Former executive directorsFJ Barnes 49 581 5 521 99 162 11 459SG Pretorius – – 148 743 16 498Total 922 038 100 878 1 140 362 126 563

PASSION/VITALITY/PRECISION
138
Non-beneficialIn addition to the aforementioned holdings:– B Joffe is a trustee and potential beneficiary of a discretionary trust holding 3 335 296 (2010: 3 335 296) shares;– P Nyman is a trustee of various trusts holding 4 163 674 (2010: 4 163 215) shares but has no beneficial interest in these shares;– P Nyman and CA Brighten (company secretary) are trustees of the Group’s retirement funds which hold 858 760 (2010: 863 260) shares; and – AA da Costa, LI Jacobs and RM Kunene are directors and shareholders of Dinatla Investment Holdings (Pty) Limited (Dinatla) and their
indirect beneficial holdings have been included in the table of holdings. P Nyman and T Slabbert are also directors of Dinatla but have no beneficial interest in Dinatla’s shares. Dinatla holds 14 510 312 (2010: 26 510 312) shares.
The only director who was directly or indirectly interested in excess of 1% of the Company’s issued share capital was B Joffe.
Number of shares
2011 2010
Beneficial – Direct – 127 986
Held in terms of The Bidvest Incentive Scheme 198 324 198 324
Non-beneficial 3 335 296 3 335 296
3 533 620 3 661 606
The interests of the directors remained unchanged from the end of the financial year to the date of this report.
Prescribed officersDue to the nature and structure of the Group and the number of executive directors on the board of the Company, the directors have concluded that there are no prescribed officers of the Company.
Directors’ remunerationThe remuneration paid to executive directors while in office of the Company during the year ended June 30 2011 can be analysed as follows:
Director
Basic remuneration
R’000
Other benefits
R’000
Retirement/medicalbenefits
R’000
Cash incentives
R’000
Totalemoluments
R’000
BL Berson 5 853 176 174 5 800 12 003
MC Berzack 3 699 431 446 3 300 7 876
DE Cleasby 2 525 293 285 3 000 6 103
AW Dawe 2 896 108 304 3 300 6 608
LI Jacobs 1 532 122 205 1 000 2 859
B Joffe 9 602 808 593 11 737 22 740
P Nyman 1 905 299 171 650 3 025
LP Ralphs 3 838 397 459 4 400 9 094
AC Salomon 2 709 – 291 3 000 6 000
34 559 2 634 2 928 36 187 76 308
Former executive director
SG Pretorius* 2 257 518 321 1 509 4 605
2011 Total 36 816 3 152 3 249 37 696 80 913
Certain executive directors serve as non-executive directors of companies outside of the Group. Directors’ fees in this regard, are generally paid to the Group.
* Retired March 1 2011.
Directors’ report

139
AUDITED FINANCIAL STATEMENTS
THE BIDVEST GROUP LIMITED / ANNUAL INTEGRATED REPORT 2011
For comparative purposes the remuneration paid to executive directors while in office of the Company during the year ended June 30 2010 can be analysed as follows:
Director
Basic remuneration
R’000
Other benefits
R’000
Retirement/medicalbenefits
R’000
Cash incentives
R’000
Totalemoluments
R’000
FJ Barnes 2 936 3 856 1 174 1 205 9 171
BL Berson 4 515 174 168 4 917 9 774
MC Berzack 3 463 564 98 3 700 7 825
DE Cleasby 2 180 231 234 2 500 5 145
AW Dawe 2 530 107 270 3 000 5 907
LI Jacobs 1 415 119 189 1 000 2 723
B Joffe 8 049 765 525 9 168 18 507
P Nyman 1 905 182 171 600 2 858
SG Pretorius 2 425 134 355 2 000 4 914
LP Ralphs 3 470 391 418 4 000 8 279
AC Salomon 2 416 114 270 2 750 5 550
2010 Total 35 304 6 637 3 872 34 840 80 653
Directors’ long-term incentives
Director2011
R’0002010
R’000
Share-based payment expense
BL Berson 4 685 2 178
MC Berzack 3 499 2 257
DE Cleasby 2 590 1 546
AW Dawe 2 360 1 886
LI Jacobs 1 794 473
B Joffe 5 225 3 304
P Nyman 45 207
LP Ralphs 3 499 2 257
AC Salomon 2 254 636
25 951 14 744
Former executive directors
FJ Barnes 152 993
SG Pretorius 135 575
26 238 16 312

PASSION/VITALITY/PRECISION
140
The remuneration paid to non-executive directors while in office of the Company during the year ended June 30 2011 can be analysed as follows:
Director
Directors’fees
R’000
Otherservices
as directorsof subsidiary
companiesR’000
Totalemolu-mentsR’000
Share- based
paymentexpense
R’000
2011Total
R’000
2010Total
R’000
DDB Band 484 – 484 – 484 305
FJ Barnes – 4 971# 4 971 152 5 123 –
LG Boyle 90 – 90 – 90 135
AA da Costa 130 – 130 – 130 103
MBN Dube 110 – 110 – 110 103
S Koseff 110 – 110 – 110 89
RM Kunene 130 – 130 – 130 103
NP Mageza 264 – 264 – 264 176
D Masson 501 238 739 – 739 650
LJ Mokoena 45 – 45 – 45 45
JL Pamensky 428 237 665 – 665 427
NG Payne 670 233 903 – 903 753
MC Ramaphosa 580 – 580 – 580 530
T Slabbert 166 – 166 – 166 97
FDP Tlakula 110 – 110 – 110 122
2011 Total 3 818 5 679 9 497 152 9 649 3 638
2010 Total 3 091 515 3 606 32 3 638# Includes amounts paid in respect of a compromise agreement entered into with Mr FJ Barnes in March 2010 based on certain terms and conditions.
Details of the directors’ and officers’ outstanding share options
Share options at June 30 2010 Share options exercised
Share options at June 30 2011
Director/officer Number
Average price
R Number
Average price
R
Benefit arising on
exerciseof options
R’000 Number
Average price
R
BL Berson 30 000 51,51 – – – 30 000 51,51
MC Berzack 187 500 53,60 45 000 39,10 4 892 142 500 58,17
DE Cleasby 50 000 61,58 50 000 61,58 4 681 – –
AW Dawe 44 250 62,89 44 250 62,89 3 491 – –
LI Jacobs 35 000 71,99 35 000 71,99 2 641 – –
B Joffe 150 000 65,16 – – – 150 000 65,16
P Nyman 290 000 44,77 115 000 42,28 12 298 175 000 46,40
LP Ralphs 425 000 46,83 180 000 42,25 18 742 245 000 50,19
Former executive directors
MBN Dube 35 000 71,99 – – – 35 000 71,99
SG Pretorius 135 000 58,11 – – – 135 000 58,11
1 381 750 47,21 469 250 48,18 46 745 912 500 52,83
These options were granted to directors prior to April 30 2005 and are exercisable over the period July 1 2011 to April 30 2015. A detailed register of options outstanding by tranche is available for inspection at the Company’s registered office.
Directors’ report

141
AUDITED FINANCIAL STATEMENTS
THE BIDVEST GROUP LIMITED / ANNUAL INTEGRATED REPORT 2011
Details of the directors’ and officers’ conditional share awardsNo movement in the conditional share awards have taken place during the period July 1 2010 to June 30 2011.
Director/officer30 June
2011
B Joffe 150 000
BL Berson 100 000
MC Berzack 100 000
DE Cleasby 75 000
AW Dawe 75 000
LI Jacobs 40 000
LP Ralphs 100 000
AC Salomon 50 000
CA Brighten 10 000
Total 700 000
A conditional award is a conditional right to a share, which is awarded subject to performance and vesting conditions.
Directors’ service contractsDirectors do not have fixed-term contracts.
Directors’ and officers’ disclosure of interest in contractsDuring the financial year no contracts were entered into in which directors and officers of the Company had an interest and which significantly affected the business of the Group. The directors had no interest in any third party or company responsible for managing any of the business activities of the Group.
SecretaryMr CA Brighten is the company secretary. The business and postal addresses of the secretary, which are also the registered addresses of the Company, are Bidvest House, 18 Crescent Drive, Melrose Arch, Melrose, Johannesburg, 2196 and PO Box 87274, Houghton, Johannesburg, 2041, respectively.

PASSION/VITALITY/PRECISION
142
Accounting policies
The consolidated and separate financial statements (financial statements) have been prepared in accordance with International Financial
Reporting Standards (IFRS), the interpretations adopted by the International Accounting Standards Board and South African interpretations
of Statements of Generally Accepted Accounting Practice.
1. Basis of preparation
The financial statements are prepared on the historical cost basis except that derivative financial instruments, financial instruments
held-for-trading and financial instruments classified as available-for-sale are stated at their fair value.
Non-current assets and disposal Group’s held-for-sale are stated at the lower of carrying amount and fair value less costs to sell.
The preparation of financial statements in conformity with IFRS requires management to make judgements, estimates and
assumptions that affect the application of policies and reported amounts of assets and liabilities, income and expenses. Although
estimates and associated assumptions are based on historical experience and various other factors that are believed to be reasonable
under the circumstances (the results of which form the basis of making the judgements about carrying values of assets and liabilities
that are not readily apparent from other sources), the actual outcome may differ from these estimates.
The estimates and underlying assumptions are reviewed on an ongoing basis. Revisions to accounting estimates are recognised in the
period in which the estimate is revised, if the revision affects only that period, or in the period of the revision and future periods if the
revision affects both current and future periods.
Judgements made in the application of IFRS that have had an effect on the financial statements and estimates with a risk of
adjustment in the next year are discussed in note 39.
The accounting policies have been applied consistently to all periods presented in these financial statements. The financial statements
are presented in South African rand, which is the Group’s functional currency. All financial information has been rounded to the nearest
thousand unless stated otherwise.
2. Adoption of new and revised accounting standards
The Group has adopted the following new and modified standards and interpretations, in response to changes to IFRS: IAS 39
(revised) – Financial Instruments: Recognition and Measurement, IAS 24 (revised) – Related Party Disclosure, IAS 32 (revised) –
Financial Instruments: Presentation, IFRIC 14 – The Limit on a Defined Benefit Asset, Minimum Funding Requirements and their
Interaction, and IFRIC 19 – Extinguishing Financial Liabilities with Equity Instruments. The adoption of the new and modified standards
and interpretations has had no impact on the Group’s results.
3. Basis of consolidation
The consolidated financial statements include the financial statements of the Company and its subsidiaries. Subsidiaries are entities
controlled by the Company. Control exists when the Company has the power, directly or indirectly, to govern the financial and
operating policies of an entity so as to obtain benefits from its activities. In assessing control, potential voting rights that presently are
exercisable or convertible are taken into account. Operating results of businesses acquired or disposed of during the year are included
from or to the effective date of acquisition or disposal, being the date that control commences until the date control ceases. The
assets and liabilities of companies acquired are assessed and included in the statement of financial position at their estimated fair
values to the Group at acquisition date.
Any increases and decreases in ownership interests in subsidiaries without a change in control are recognised as equity transactions in
the Group financial statements. Accordingly, any premiums or discounts on subsequent purchases of equity instruments from, or sales
of equity instruments to non-controlling shareholders are recognised directly in the equity of the Group.
Transaction costs that the Group incurs with respect to an acquisition of a business are expensed as incurred.
Inter-group transactions and balances are eliminated on consolidation. Unrealised gains arising from transactions with jointly controlled
entities and equity accounted associates are eliminated to the extent of the Group’s interest in the entity. Unrealised losses are
eliminated in the same way as unrealised gains, but only to the extent that there is no evidence of impairment.
The Company carries its investments in subsidiaries at cost less accumulated impairment losses.

143
AUDITED FINANCIAL STATEMENTS
THE BIDVEST GROUP LIMITED / ANNUAL INTEGRATED REPORT 2011
4. Revenue
Revenue comprises amounts invoiced to customers for goods and services and includes finance charges, insurance premiums, gross
billings, and commissions related to clearing and forwarding transactions and excludes value added tax. Revenue is net of returns and
allowances, trade discounts and volume rebates. Total revenue also includes dividends received and finance income.
5. Revenue recognition
The sale of goods is recognised when significant risks and rewards of ownership of the goods are transferred to the buyer, recovery of
the consideration is considered probable, the associated costs and possible return of goods can be estimated reliably, and there is no
continuing management involvement with the goods.
Revenue from services rendered is recognised in the income statement in proportion to the stage of completion of the transaction at
the statement of financial position date. The stage of completion is assessed by reference to the terms of the contracts.
Revenue relating to banking activities consists primarily of margins earned on the purchase and sale of foreign exchange products and
general commissions and transaction fees and is recognised when the services are provided. Net profits or losses on the revaluation of
foreign currency denominated assets and liabilities are also included in revenue.
In the event that a profit or loss arises from full maintenance motor contracts, this is recognised on termination of individual contracts
after taking cognisance of any additional costs required. Provision is made for known losses during the contract period on an
individual contract basis.
Insurance premiums are stated before deducting reinsurance and commission. Gross premiums are accounted for when they become
due.
Finance income comprises interest receivable on funds invested and dividend income on preference shares.
Interest is recognised on an accrual basis, taking account of the principal outstanding and the effective rate over the period to maturity,
when it is determined that such income will accrue to the Group.
Dividends are recognised when the right to receive payment is established.
6. Non-current assets held-for-sale and discontinued operations
Non-current assets (or disposal groups comprising assets and liabilities) that are expected to be recovered primarily through sale
rather than through continuing use are classified as held-for-sale and are carried at the lower of carrying value and fair value less cost
to sell. Immediately before classification as assets held-for-sale, the measurement of the assets (and all assets and liabilities in a
disposal group) is determined in accordance with applicable IFRS. Then, on initial classification as assets held-for-sale, non-current
assets and disposal groups are recognised at the lower of the carrying amounts and fair value less costs to sell. Any impairment loss
on a disposal group is first allocated to goodwill, and then to remaining assets and liabilities on a pro rata basis, except that no loss is
allocated to inventories, financial assets, deferred tax assets, and employee benefit assets, which continue to be measured in
accordance with the Group’s accounting policies. Impairment losses on initial classification as held-for-sale and subsequent gains
or losses on remeasurement are recognised in the income statement. Gains are not recognised in excess of any cumulative
impairment loss.
A discontinued operation results from the sale or abandonment of an operation that represents a separate major line of business or
geographical area of operations and of which the assets, net profit or loss and activities can be distinguished physically, operationally
and for financial reporting purposes. A subsidiary acquired exclusively with the view to resale is also classified as a discontinued
operation. Classification as a discontinued operation occurs upon disposal or when the operation meets the criteria to be classified as
held-for-sale, if earlier. When an operation is classified as a discontinued operation, the comparative income statement is restated as if
the operation had been discontinued from the start of the comparative period.
7. Distributions to shareholders
Distributions to shareholders are accounted for once they have been approved by the board of directors.

PASSION/VITALITY/PRECISION
144
Accounting policies
8. Finance income and charges
Finance charges comprise interest payable on borrowings calculated using the effective interest rate method. The interest expense
component of finance lease payments is recognised in the income statement using the effective interest rate method.
9. Capitalisation of expenditure/borrowing costs
Borrowing costs directly attributable to the acquisition, construction or production of assets that necessarily take a substantial period
of time to prepare for their intended use or sale, are added to the cost of those assets, until such time as the assets are substantially
complete. Capitalisation is suspended during extended periods in which active development is interrupted. All other borrowing costs
are expensed in the period in which they are incurred.
10. Cash and cash equivalents
For the purpose of the statement of cash flows, cash and cash equivalents comprise cash on hand, deposits held on call with banks
net of bank overdrafts, investment in money market instruments and variable rate cumulative redeemable preference shares, all of
which are available for use by the Group unless otherwise stated.
11. Property, plant and equipment
Property, plant and equipment are reflected at cost to the Group, less accumulated depreciation and accumulated impairment losses.
Land is stated at cost. The present value of the estimated cost of dismantling and removing items and restoring the site in which they
are located is provided for as part of the cost of the asset. Depreciation is provided for on the straight-line basis over the estimated
useful lives of the property, plant and equipment which are as follows:
Buildings Up to 50 years
Leasehold premises Over the period of the lease
Plant and equipment 5 to 20 years
Office equipment, furniture and fittings 3 to 15 years
Vehicles and craft 3 to 10 years
Vessels 28 to 55 years
Rental assets 3 to 5 years
Capitalised leased assets The same basis as owned assets
Residual values, depreciation method and useful lives are reassessed annually.
Where parts of an item of property, plant and equipment have different useful lives, they are accounted for as separate items of
property, plant and equipment.
The Group recognises in the carrying amount of an item of property, plant and equipment the cost of replacing part of such an item
when that cost is incurred if it is probable that the future economic benefits embodied in the item will flow to the Group and the cost of
the item can be measured reliably. All other costs are recognised in the income statement as an expense when incurred.
12. Leases
Leases that transfer substantially all the risks and rewards of ownership of the underlying asset to the Group are classified as finance
leases. Assets acquired in terms of finance leases are capitalised at the lower of fair value and the present value of the minimum lease
payments at inception of the lease, and depreciated over the estimated useful life of the asset. The capital element of future obligations
under the leases is included as a liability in the balance sheet. Lease payments are allocated using the effective interest rate method to
determine the lease finance cost, which is charged against income over the lease period, and the capital repayment, which reduces
the liability to the lessor.
Leases where the lessor retains the risks and rewards of ownership of the underlying asset are classified as operating leases.
Operating leases, which have a fixed determinable escalation, are charged against income on a straight-line basis. Leases with
contingent escalations are expensed as and when incurred.

145
AUDITED FINANCIAL STATEMENTS
THE BIDVEST GROUP LIMITED / ANNUAL INTEGRATED REPORT 2011
13. Goodwill
Goodwill represents amounts arising on acquisition of subsidiaries, associates and joint ventures. All business combinations are
accounted for by applying the purchase method. In respect of business acquisitions that have occurred since March 31 2004,
goodwill represents the difference between the cost of the acquisition and the fair value of the identifiable assets, liabilities and
contingent liabilities acquired.
Goodwill is stated at deemed cost or cost less any accumulated impairment losses. Goodwill is allocated to cash-generating units and
is tested annually for impairment. In respect of associates, the carrying amount of goodwill is included in the carrying amount of the
investment in the associate.
Negative goodwill arising on an acquisition is recognised immediately in the income statement.
14. Intangible assets
Software development costs are capitalised and are stated at cost less accumulated amortisation and accumulated impairment
losses.
Other intangible assets that are acquired by the Group are stated at cost less accumulated amortisation and accumulated impairment
losses.
Expenditure on research, internally generated goodwill and brands is recognised in the income statement as an expense as incurred.
Subsequent expenditure on capitalised intangible assets is capitalised only when it increases the future economic benefits embodied
in the specific asset to which it relates. All other expenditure is expensed as incurred.
Amortisation is charged to the income statement on a straight-line basis over the estimated useful lives of intangible assets unless
such lives are indefinite. Intangible assets with an indefinite useful life are systematically tested for impairment at each statement of
financial position date. Other intangible assets are amortised from the date they are available for use. The estimated useful lives are
currently:
Patents, trademarks, tradenames and other intangibles 3 to 12 years
Computer software 3 to 8 years
Useful lives are also examined on an annual basis and adjustments, where applicable, are made on a prospective basis.
15. Impairment of assets
The carrying value of assets is reviewed annually to assess whether there is any indication of impairment. If any such indication exists,
the recoverable amount of the asset is estimated. Where the carrying value exceeds the estimated recoverable amount, such assets
are written down to their recoverable amount.
The recoverable amount of cash-generating units to which goodwill is allocated is estimated annually on March 31 each year. For
assets that have an indefinite useful life and intangible assets that are not yet available for use, the recoverable amount is estimated at
each statement of financial position date.
Impairment losses are recognised whenever the carrying amount of the asset or a cash-generating unit exceeds its recoverable
amount. Impairment losses are recognised in the income statement.
Impairment losses recognised in respect of cash-generating units are allocated first to reduce the carrying amount of any goodwill
allocated to cash-generating units and then to reduce the carrying amount of the other assets in the unit on a pro rata basis.

PASSION/VITALITY/PRECISION
146
Accounting policies
15. Impairment of assets (continued)
A cash-generating unit is the smallest identifiable asset group that generates cash flows that largely are independent from other assets
and groups.
Financial assets are impaired where there is objective evidence that, as a result of one or more events that occurred after the initial
recognition of the financial asset, the estimated future cash flows of the investment have been impacted.
An impairment loss in respect of an available-for-sale financial asset is calculated by reference to its current fair value. For unlisted
shares classified as available-for-sale, a significant or prolonged decline in the fair value of the security below its cost is considered to
be objective evidence of impairment.
For all other financial assets, objective evidence of impairment could include:
– significant financial difficulty of the counterparty; or
– default in interest or principal payments; or
– it becoming probable that the counterparty will enter bankruptcy or financial re-organisation
When a decline in the fair value of an available-for-sale financial asset has been recognised directly in equity and there is objective
evidence that the asset is impaired, the cumulative loss that had been recognised directly in equity is recognised in the income
statement even though the financial asset has not been derecognised. The amount of the cumulative loss that is recognised in the
income statement is the difference between the acquisition cost and current fair value, less any impairment loss on that financial asset
previously recognised in the income statement.
The recoverable amount of the Group’s investments in held-to-maturity securities and receivables carried at amortised cost is
calculated as the present value of estimated future cash flows, discounted at the original effective interest rate (the effective interest
rate is computed on initial recognition of these financial assets). Receivables with a short duration are not discounted. Individually
significant financial assets are tested for impairment on an individual basis. The remaining financial assets are assessed collectively in
groups that share similar credit risk characteristics.
In respect of trade receivables, receivables that are assessed not to be impaired individually are subsequently assessed for impairment
on a collective basis. Objective evidence of impairment for a portfolio of receivables could include the Group’s past experience of
collecting payments, an increase in the number of delayed payments in the portfolio past the average credit period, as well as
observable changes in national or local economic conditions that correlate with default on receivables.
The recoverable amount of other assets is the greater of their fair value less costs to sell and their value in use. In assessing their value
in use, the estimated future cash flows are discounted to their present value using a pre-tax discount rate that reflects current market
assessments of the time value of money and the risks specific to the asset.
An impairment loss in respect of a held-to-maturity security or receivable carried at amortised cost is reversed if the subsequent
increase in recoverable amount can be related objectively to an event occurring after the impairment loss was recognised.
An impairment loss in respect of an investment in an equity instrument classified as available-for-sale is not reversed through the
income statement. If the fair value of a debt instrument classified as available-for-sale increases and the increase can be objectively
related to an event occurring after the impairment loss was recognised in the income statement, the impairment loss is reversed, with
the amount of the reversal recognised in the income statement.
The carrying amount of the financial asset is reduced by the impairment loss directly for all financial assets with the exception of trade
receivables and banking advances, where the carrying amount is reduced through the use of an impairment allowance account. When
a trade receivable or banking advance is considered uncollectible, it is written off against the impairment allowance account.
Subsequent recoveries of amounts previously written off are credited against the allowance account. Changes in the carrying amount
of the impairment allowance account are recognised in the income statement.
Impairment losses in respect of goodwill are not reversed.

147
AUDITED FINANCIAL STATEMENTS
THE BIDVEST GROUP LIMITED / ANNUAL INTEGRATED REPORT 2011
In respect of other assets, impairment losses recognised in prior periods are assessed at each reporting date for any indications that
the loss has decreased or no longer exists. Impairment losses are reversed if there has been a change in the estimates used to
determine the recoverable amount.
Impairment losses are reversed only to the extent that the asset’s carrying amount does not exceed the carrying amount that would
have been determined, net of depreciation or amortisation, if no impairment loss had been recognised.
16. Taxation
Income taxation comprises current and deferred tax. Income tax expense is recognised in profit or loss except to the extent that it
relates to items recognised directly in equity, in which case it is recognised in equity.
Current taxation comprises tax payable calculated on the basis of the expected taxable income for the year, using the tax rates
enacted or substantially enacted at the balance sheet date, and any adjustment of tax payable for previous years.
Deferred taxation is recognised using the statement of financial position liability method based on temporary differences between the
tax base of an asset or liability and its balance sheet carrying amount. Temporary differences are differences between the carrying
amount of assets and liabilities for financial reporting purposes and their tax base. The amount of deferred tax provided is based on
the expected manner of realisation or settlement of the carrying amount of assets and liabilities using tax rates enacted or substantively
enacted at the statement of financial position date. The following temporary differences are not provided for: initial recognition of
goodwill, the initial recognition of assets or liabilities in a transaction that is not a business combination and that affects neither
accounting nor taxable profit, and differences relating to investments in subsidiaries to the extent that they will probably not reverse in
the foreseeable future. Deferred taxation is charged to the income statement except to the extent that it relates to a transaction that is
recognised directly in equity, or a business combination that is an acquisition. The effects on deferred taxation of any changes in tax
rates is recognised in the income statement, except to the extent that it relates to items previously charged or credited directly to
equity.
A deferred taxation asset is recognised to the extent that it is probable that future taxable profits will be available against which the
associated unused tax losses and deductible temporary differences can be utilised. Deferred tax assets are reviewed at each reporting
date and are reduced to the extent that it is no longer probable that the related tax benefit will be realised.
Secondary taxation on companies is accounted for as a tax charge in the income statement as incurred.
17. Associates
An associate is a company over which the Group has the ability to exercise significant influence, but not control, over its financial and
operating policies.
The equity method of accounting for associates is adopted in the Group financial statements. In applying the equity method, account
is taken of the Group’s share of accumulated retained earnings and movements in reserves from the effective dates on which the
companies became associates and up to the effective dates of disposal. In the event of associates making losses, the Group
recognises the losses to the extent of the Group’s exposure.
The Company carries its investment in associates at cost less any accumulated impairment losses.
18. Joint ventures
Joint ventures are those entities over whose activities the Group has joint control, established by contractual agreement. The Group’s
interests in joint ventures are accounted for using the proportionate consolidation method and its shares of the underlying assets,
liabilities, income, expenditures and cash flows are included in the consolidated financial statements on a line-by-line basis from the
date that joint control commences until the date joint control ceases.
The Company carries its investments in joint ventures at cost less accumulated impairment losses.
PASSION/VITALITY/PRECISION
148
Accounting policies
19. Foreign operations
Assets and liabilities of foreign operations, including goodwill and fair value adjustments arising on consolidation, are translated into
South African rand at rates of exchange ruling at the statement of financial position date. Income, expenditure and cash flow items are
translated into South African rand at rates approximating to the foreign exchange rates ruling at the dates of the transactions. Since
July 1 2004, the Group’s date of transition to IFRS, foreign exchange differences arising on translation are recognised directly in equity
as a foreign currency translation reserve. When a foreign operation is disposed of, in part or in full, the relevant amount in the foreign
currency translation reserve is transferred to the income statement.
The revenues and expenses of foreign operations in hyperinflationary economies are translated to South African rand at the foreign
exchange rates ruling at the statement of financial position date. Foreign exchange differences arising on retranslation are recognised
directly in a separate component of equity.
Acquisitions and disposals of foreign operations are accounted for at the rate ruling on the date of the transaction.
20. Financial instruments
Financial instruments are recognised when the Group or Company becomes party to the contractual provisions of the arrangement.
Financial instruments are initially measured at fair value plus, for instruments not carried at fair value through profit and loss, any directly
attributable transaction costs.
An instrument is classified as at fair value through profit or loss if it is held-for-trading, is a derivative or is designated as such upon
initial recognition.
A financial asset is classified as held-for-trading if it has been acquired principally for the purpose of selling in the near future or it has
been part of an identified portfolio of financial instruments that the Group manages together and has a recent actual pattern of
short-term profit-making.
Financial instruments at fair value through profit or loss are measured at fair value, with any resultant gain or loss being recognised in
the income statement. The gain or loss recognised in the income statement excludes the interest and dividends earned on the financial
asset, which are separately disclosed as such in the income statement. Held-for-trading financial instruments are measured at
amortised cost if the fair value cannot be determined.
Financial instruments classified as available-for-sale financial assets are carried at fair value with any resultant gain or loss, other than
impairment losses and foreign exchange gains and losses on monetary items, being recognised directly in equity. When these
investments are derecognised, the cumulative gain or loss previously recognised directly in equity is recognised in profit or loss. Where
these investments are interest bearing, interest calculated using the effective interest rate method is recognised in profit or loss.
Listed government bonds held in terms of statutory requirements are accounted for as available-for-sale financial assets.
If the Group has the positive intent and ability to hold debt securities to maturity, then they are classified as held-to-maturity.
Investments that meet the criteria for classification as held-to-maturity financial assets are carried at amortised cost.
Where the instrument is not classified as one of the above, it is carried at amortised cost.
Listed and unlisted investments are classified as investments at fair value through profit or loss or available-for-sale financial assets.
Fair value of listed investments is calculated by reference to stock exchange quoted selling prices at the close of business on the
statement of financial position date. Fair value of unlisted investments is determined by using appropriate valuation models.
Trade and other receivables originated by the Group or Company are stated at amortised cost less an allowance for impairment losses.

149
AUDITED FINANCIAL STATEMENTS
THE BIDVEST GROUP LIMITED / ANNUAL INTEGRATED REPORT 2011
Cash and cash equivalents are measured at fair value, based on the relevant exchange rates at statement of financial position date.
Financial liabilities other than derivatives are recognised at amortised cost using the effective interest rate method.
Derivative instruments are measured at fair value through profit and loss.
Where a derivative financial instrument is used to economically hedge the foreign exchange exposure of a recognised financial asset or
liability, no hedge accounting is applied and any gain or loss on the hedging instrument is recognised in the income statement. It is the
policy of the Group not to trade in derivative financial instruments for speculative purposes.
Gains or losses arising from measuring the hedging instruments relating to a fair value hedge at fair value are recognised in the income
statement. The hedged item is also stated at fair value in respect of the risk being hedged, with any gains or losses recognised in the
income statement.
Where a derivative is designated as a cash flow hedge, the effective part of the gains or losses from remeasuring the hedging
instruments to fair value are initially recognised directly in equity. If the hedged firm commitment or forecast transaction results in the
recognition of a non-financial asset or liability, the cumulative amount recognised in equity up to the transaction date is adjusted
against the initial measurement of the non-financial asset or liability. The ineffective part of any gain or loss is recognised in the income
statement immediately. For other cash flow hedges, the cumulative amount recognised in equity is included in net profit or loss in the
period when the commitment or forecast transaction affects profit or loss.
Where the hedging instrument or hedge relationship is terminated but the hedged transaction is still expected to occur, the cumulative
unrealised gain or loss at that point remains in equity and is recognised in accordance with the aforementioned policy when the
transaction occurs. If the hedged transaction is no longer expected to occur, the cumulative unrealised gain or loss is recognised in the
income statement immediately.
A financial asset is derecognised (or, where applicable, a part of a financial asset or a part of a group of similar financial assets is
derecognised) if the Group’s contractual rights to the cash flows from the financial asset expire or if the Group transfers the financial
assets to another party without retaining control or substantially all risks and rewards of the asset.
Where the Group has transferred its right to receive cash flows from an asset and has neither transferred nor retained substantially all the risks
and rewards of the asset nor transferred control of the asset, the asset is recognised to the extent of the Group’s continuing involvement in the
asset. Continuing involvement that takes the form of a guarantee over the transferred asset is measured at the lower of the original carrying
amount of the asset and the maximum amount of consideration that the Group could be required to repay.
A financial liability is derecognised when the obligation under the liability is discharged or cancelled or expires. Where an existing
liability is replaced by another from the same lender on substantially different terms, or the terms of an existing liability are substantially
modified, such an exchange or modification is treated as a derecognition of the original liability and a recognition of a new liability, and
the difference in the respective carrying amounts is recognised in profit and loss.
Financial assets and financial liabilities are offset and the net amount reported in the statement of financial position when the Company
has a legally enforceable right to set off the recognised amounts, and intends either to settle on a net basis, or to realise the asset and
settle the liability simultaneously.
Financial instruments have been grouped into classes for the purpose of financial instrument risk disclosure. The classes are the
segments as disclosed in the segmental report as the operations within each segment have similar types of risks.

PASSION/VITALITY/PRECISION
150
Accounting policies
21. Banking advances
Advances are stated at amortised cost after the deduction of amounts that, in the opinion of the directors, are required as specific and
general impairments. Specific impairments are raised for doubtful advances, including amounts in respect of interest not being
serviced and after taking security values into account, and are deducted from advances where the outstanding balance exceeds the
value of the security held. A general impairment based on historic experience is raised to cover doubtful advances, which may not be
specifically identified at the statement of financial position date. The specific and general impairments made during the year are
charged to the income statement.
22. Vehicle rental fleet
Vehicle rental fleet is stated at cost less accumulated depreciation. Depreciation is provided on a straight-line basis to write off the
cost of the vehicles to their residual value over their estimated useful life of between nine and 12 months.
23. Inventories
Inventories are stated at the lower of cost and estimated net realisable value. Estimated net realisable value is the estimated selling
price in the ordinary course of business, less the estimated costs of completion and selling expenses. The cost of raw materials,
finished goods, parts and accessories is determined on either the first in, first out or average cost basis. New vehicles, motorcycles,
power and marine products are stated on an actual unit cost basis. Used and demonstrator vehicles are stated at the lower of actual
cost or net realisable value. The cost of manufactured inventory and work in progress includes materials and parts, direct labour, other
direct costs and includes an appropriate portion of overheads, but excludes interest expense.
Vehicles and vehicle parts purchased in terms of manufacturers’ standard franchise agreements or floorplan facilities are recognised as
assets when received as this is when significant risks and rewards have been transferred. This policy is applied irrespective of the fact
that certain agreements provide that the legal ownership of this inventory shall remain with the supplier or floorplan provider until the
purchase price has been paid.
24. Treasury shares
Shares in the Company, held by its subsidiary and the Bidvest Incentive Scheme are classified in the Group’s shareholders’ interest as
treasury shares. These shares are treated as a deduction from the issued and weighted average number of shares. The cost price of
the shares is presented as a deduction from total equity. Distributions received on treasury shares are eliminated on consolidation.
25. Foreign currencies
Transactions in foreign currencies are translated at the rates of exchange ruling at the transaction date. Monetary assets and liabilities
in foreign currencies are translated at the rates of exchange ruling at the statement of financial position date. Translation differences are
recognised in the income statement.
Non-monetary assets and liabilities that are measured in terms of historical cost in a foreign currency are translated using the
exchange rate at the date of the transaction. Non-monetary assets and liabilities denominated in foreign currencies that are stated at
fair value are translated to South African rand at foreign exchange rates ruling at the dates that the fair value was determined.
26. Share-based payments
The Bidvest Incentive Scheme grants options to acquire shares in the Company to executive directors and staff. The fair value of
options granted is recognised as an employee expense with a corresponding increase in equity. The fair value is measured at grant
date and spread over the period during which the employees become unconditionally entitled to the options. The fair value of the
options is measured using a binomial model, taking into account the terms and conditions upon which the options were granted. The
amount recognised as an expense is adjusted to reflect the actual number of share options that vest except where staff are unable to
meet the scheme’s employment requirements.
The Bidvest Incentive Scheme grants loans to staff for the acquisition of shares in the Company. The fair value of services received in return for
shares allotted is measured based on a binomial model taking into account the expected contractual life of the loan obligation.

151
AUDITED FINANCIAL STATEMENTS
THE BIDVEST GROUP LIMITED / ANNUAL INTEGRATED REPORT 2011
27. Employee benefits
Leave benefits due to employees are recognised as a liability in the financial statements.
The Group’s liability for post-retirement benefits, accruing to past and current employees in terms of defined benefit schemes, is
actuarially calculated. Where the plan is funded, the obligation is reduced by the fair value of the plan assets. Unfunded obligations are
recognised as a liability in the financial statements.
The Group’s obligation for post-retirement medical aid to past and current employees is actuarially determined and provided for in full.
The projected unit-credit method is used to determine the present value of the defined benefit obligations and the related current
service cost and, where applicable, past service cost.
Actuarial gains or losses in respect of defined benefit plans are recognised in the income statement if the net cumulative unrecognised
actuarial gains or losses at the end of the previous reporting period exceed the greater of:
– 10% of the present value of the defined benefit obligation at that date, before deducting plan assets; or
– 10% of the fair value of any plan assets at that date.
However, when the actuarial calculation results in a benefit to the Group, the recognised asset is limited to the net total of any
unrecognised past service costs and the present value of any future refunds from the plan or reductions in future contributions to the
plan.
The amount recognised is the excess in terms of the aforementioned formula, divided by the expected average remaining working lives
of the employees participating in that plan.
Past service costs are recognised as an expense on a straight-line basis over the average period until the benefits become vested. To
the extent that the benefits have vested, past service costs are recognised immediately.
Liabilities for employee benefits which are not expected to be settled within 12 months are discounted using the market yields at the
statement of financial position date on high quality bonds with terms that most closely match the terms of maturity of the related liabilities.
Contributions to defined contribution pension plans are recognised as an expense in the income statement as incurred.
28. Short-term insurance
Insurance contracts are those contracts under which the Group (as insurer) accepts significant insurance risk from another party (the
policyholder) by agreeing to compensate the policyholder or other beneficiary if a specified uncertain future event (the insured event)
adversely affects them. Short-term insurance is provided in terms of benefits under short-term policies which cover motor, property
and warranty.
Premiums are earned from the date the risk attaches, over the indemnity period, based on the pattern of the risk underwritten.
Unearned premiums, which represent the proportion of premiums written in the current year which relate to risks that have not expired
by the end of the financial year, are calculated on a time proportionate basis.
Receipts and payments under investment contracts are not classified as insurance transactions in the income statement but instead
are deposit accounted in the statement of financial position in accordance with IAS 39. The deposits liability recognised in the
statement of financial position represents the expected amounts payable to the holders of the insurance contract. Claims incurred
consists of claims paid during the financial year, together with the movement in the provision for outstanding claims and are charged to
income as incurred. The provision for outstanding claims comprise the Group’s estimate of the undiscounted ultimate cost of settling
all claims incurred but unpaid at statement of financial position date, whether reported or not. Related anticipated reinsurance
recoveries are disclosed separately as assets.

PASSION/VITALITY/PRECISION
152
Accounting policies
28. Short-term insurance (continued)
A provision for claims incurred but not reported, is maintained at 7% of net premium income, for claims arising from events that
occurred before the close of the accounting period, but which have not been reported to the Company by that date. A contingency
reserve is maintained at 10% of the net premium income. The reserve can be utilised in the case of catastrophe, subject to the
approval of the Financial Services Board. Transfers to this reserve are reflected in the statement of changes in equity.
29. Life assurance
Insurance contracts are those contracts under which the Group (as insurer) accepts significant insurance risk from another party (the
policyholder) by agreeing to compensate the policyholder or other beneficiary if a specified uncertain future event (the insured event)
adversely affects them. Life assurance benefits are provided in terms of individual credit life contracts. These contracts are decreasing
term assurance designed to pay outstanding loans provided by finance houses to purchasers of motor vehicles. The outstanding loan
is settled (subject to certain limits) following death or disability of the contract holder. In addition, there is a dread disease, retrenchment
and funeral benefit. Policyholder liabilities under insurance contracts, representing the liability in respect of unmatured policies, are
valued in terms of the Financial Soundness Valuation (FSV) basis contained in PGN104.
Receipts and payments under investment contracts are not classified as insurance transactions in the income statement but instead
are deposit accounted in the statement of financial position, in accordance with IAS 39. The deposits liability recognised in the
statement of financial position represents the expected amounts payable to the holders of the insurance contract. Claims expenses
are charged to the income statement as incurred based on the liability in terms of the policy at the date of the claim.
Contracts entered into by the Group with reinsurers under which the Group is compensated for losses on one or more contracts
issued by the Group are classified as reinsurance contracts held. The benefits to which the Group is entitled under its reinsurance
contracts are recognised as reinsurance assets. These consist of short-term balances due to/from reinsurers, as well as longer-term
receivables (classified as reinsurance assets) that are dependent on the expected claims and benefits arising under the related
insurance contracts. Amounts recoverable from/due to reinsurers are measured consistently with the amounts associated with the
insurance contracts and in accordance with the terms of each contract. Reinsurance liabilities are primarily premiums payable and are
recognised as an expense when due. The Group assesses its reinsurance assets for impairment on an annual basis. If there is
objective evidence that the reinsurance asset is impaired, the Group reduces the carrying amount of the reinsurance asset to its
recoverable amount and recognises the impairment loss in the income statement. The Group gathers the objective evidence that a
reinsurance asset is impaired using the same basis adopted for financial assets held at amortised cost.
30. Provisions
Provisions are recognised when the Group has a legal or constructive obligation as a result of past events, for which it is probable that
an outflow of economic benefits will occur, and where a reliable estimate can be made of the amount of the obligation. Where the
effect of discounting is material, provisions are discounted. The discount rate used is a pre-tax rate that reflects current market
assessments of the time value of money and, where appropriate, the risks specific to the liability.
A provision for restructuring is recognised when the Group has approved a detailed and formal restructuring plan and the restructuring
has either commenced or has been announced publicly. Future operating costs are not provided for.
The Group recognises a provision calculated as the present value of the estimated cost of dismantling and removing items and
restoring the site in which they are located when the legal or constructive obligation arises or when the damage to the site occurs.
A provision for onerous contracts is recognised when the expected benefits to be derived by the Group from a contract are lower than
the unavoidable cost of meeting its obligations under the contract. The provision is measured at the present value of the lower of the
expected cost of terminating the contract and the expected net costs of continuing the contract. Before a provision is established, the
Group recognises any impairment loss on the assets associated with that contract.
153
AUDITED FINANCIAL STATEMENTS
THE BIDVEST GROUP LIMITED / ANNUAL INTEGRATED REPORT 2011
Customer loyalty points are accounted for at fair value of the consideration received or receivable in respect of the initial sale, and are
allocated between the loyalty points and the other components of the sale. The consideration allocated to the customer loyalty points
is measured by reference to their fair value, which is the amount for which the loyalty points could be sold at, multiplied by the
probability of their redemption. This amount is recognised as a provision until such time as the customer loyalty points are redeemed.
Once the loyalty points are redeemed, the amount will be recognised as revenue.
31. Segmental reporting
The reportable segments of the Group have been identified based on the nature of the businesses. This basis is representative of the
internal structure for management purposes. Information is also supplied for the various geographies in which the Group operates.
“Segmental operating profit” includes revenue and expenses directly relating to a business segment but exclude net finance charges
and taxation which cannot be allocated to any specific segment. Share-based payment costs are also excluded from the result as this
is not a criteria used in the management of the reportable segments.
“Segmental trading profit” is defined as operating profit excluding items of a capital nature and is the basis on which management’s
performance is assessed.
Segment operating assets and liabilities include property, plant and equipment, investments, inventories, trade and other receivables,
trade and other payables, banking assets and liabilities, insurance funds and post-retirement obligations but excludes cash,
borrowings, current taxation, and deferred taxation. Intangible assets are allocated to the cash-generating unit in the segment to
which they relate.

PASSION/VITALITY/PRECISION
154
Note 2011
R’000 2010
R’000
Revenue 1 118 482 736 109 789 207
Cost of revenue (93 930 778) (86 778 366)
Gross profit 24 551 958 23 010 841
Other income 451 623 424 725
Operating expenses (18 941 920) (17 880 870)
Sales and distribution expenses (12 541 784) (12 115 597)
Administration expenses (4 263 910) (4 069 739)
Other expenses (2 136 226) (1 695 534)
Trading profit 6 061 661 5 554 696
Acquisition costs (24 297) (61 202)
Net capital items 5 (189 453) (30 151)
Operating profit 2 5 847 911 5 463 343
Net finance charges 3 (644 010) (758 479)
Finance income 69 905 64 408
Finance charges (713 915) (822 887)
Share of profit of associates 98 417 40 983
Dividends received 32 948 30 785
Share of current year earnings 65 469 10 198
Profit before taxation 5 302 318 4 745 847
Taxation 4 (1 528 169) (1 301 059)
Current and deferred taxation (1 395 682) (1 298 744)
Secondary taxation on companies (132 487) (2 315)
Profit for the year 3 774 149 3 444 788
Attributable to
Shareholders of the Company 3 538 748 3 345 175
Minority shareholders 235 401 99 613
3 774 149 3 444 788
Basic earnings per share (cents) 5 1 110,5 1 063,6
Diluted earnings per share (cents) 5 1 107,2 1 057,1
Headline earnings per share (cents) 5 1 157,4 1 070,0
Diluted headline earnings per share (cents) 5 1 153,9 1 063,4
Distributions per share (cents) 6 480,0 432,0
Consolidated income statementfor the year ended June 30

155
AUDITED FINANCIAL STATEMENTS
THE BIDVEST GROUP LIMITED / ANNUAL INTEGRATED REPORT 2011
Consolidated statement of other comprehensive incomefor the year ended June 30
2011 R’000
2010 R’000
Profit for the year 3 774 149 3 444 788
Shareholders of the Company 3 538 748 3 345 175
Minority shareholders 235 401 99 613
Other comprehensive income (expense) net of tax
Increase (decrease) in foreign currency translation reserve 224 774 (675 601)
Shareholders of the Company 228 303 (671 219)
Minority shareholders (3 529) (4 382)
Decrease in fair value of available for sale financial assets (1 732) (12 831)
Decrease in fair value of available for sale financial assets before tax (1 732) (17 877)
Tax relief – 5 046
Total comprehensive income for the year 3 997 191 2 756 356
Attributable to
Shareholders of the Company 3 765 319 2 661 125
Minority shareholders 231 872 95 231
3 997 191 2 756 356

PASSION/VITALITY/PRECISION
156
Consolidated statement of cash flowsfor the year ended June 30
Note 2011R’000
2010R’000
Cash flows from operating activities 4 490 872 4 856 127
Cash generated by operations 7 8 187 234 7 984 220
Finance income 69 905 64 408
Finance charges 8 (629 119) (724 042)
Taxation paid 9 (1 577 411) (1 166 914)
Distributions to shareholders 10 (1 559 737) (1 301 545)
Cash effects of investment activities (3 877 688) (4 846 526)
Amounts repaid by (advanced to) associates 4 113 (5 680)
Investments disposed of 163 027 149 099
Investments acquired (572 007) (244 445)
Additions to property, plant and equipment (2 733 592) (2 730 411)
Additions to vehicle rental fleet (1 177 255) (1 150 070)
Additions to intangible assets (241 185) (149 880)
Proceeds on disposal of property, plant and equipment 210 361 398 169
Proceeds on disposal of vehicle rental fleet 894 315 767 248
Proceeds on disposal of intangible assets 3 796 9 762
Acquisition of businesses, subsidiaries and associates 11 (459 955) (1 951 556)
Proceeds on disposal of interests in subsidiaries and associates, and disposal and closure of businesses 12 30 694 61 238
Cash effects of financing activities (735 423) 1 732 990
Proceeds from share issues
– Company – 1 233 119
– subsidiaries – 300 772
Purchase of shares (1 581 285) (24 975)
Costs incurred on cancelation of treasury shares (11 980)
Sale of treasury shares 154 739 48 689
Borrowings raised 6 497 065 7 513 034
Borrowings repaid (5 793 962) (7 337 649)
Net increase (decrease) in cash and cash equivalents (122 239) 1 742 591
Cash and cash equivalents at beginning of year 2 905 453 1 239 538
Effects of exchange rate fluctuations on cash and cash equivalents 25 829 (76 676)
Cash and cash equivalents at end of year 2 809 043 2 905 453
Cash and cash equivalents comprise
Cash and cash equivalents 24 4 437 268 4 138 722
Bank overdrafts included in short-term portion of borrowings 28 (1 628 225) (1 233 269)
2 809 043 2 905 453

157
AUDITED FINANCIAL STATEMENTS
THE BIDVEST GROUP LIMITED / ANNUAL INTEGRATED REPORT 2011
Consolidated statement of changes in equityfor the year ended June 30
2011R’000
2010R’000
EquITy ATTRIBuTABLE TO SHAREHOLDERS OF THE COMPANy 17 669 264 16 736 503
Share capital 16 367 17 507
Balance at beginning of the year 17 507 16 814
Shares issued during the year – 693
Cancellation of treasury shares (1 140) –
Share premium 81 258 81 258
Balance at beginning of the year 81 258 228 301
Shares issued during the year – 1 236 462
Share issue costs – (4 036)
Refund of share premium to shareholders – (1 379 469)
Foreign currency translation reserve 248 830 20 527
Balance at beginning of the year 20 527 691 746
Arising during the year 228 303 (671 219)
Statutory reserves 15 894 15 215
Balance at beginning of the year 15 215 13 033
Transfer from retained earnings 679 2 182
Equity-settled share-based payment reserve 391 430 328 640
Balance at beginning of the year 328 640 253 936
Arising during the year 62 790 74 704
Movement in retained earnings 19 101 358 18 619 202
Balance at beginning of the year 18 619 202 15 206 432
Attributable profit 3 538 748 3 345 175
Change in fair value of available for sale financial assets (1 732) (12 831)
Net dividends paid (1 452 491) –
Transfer of reserves as a result of changes in shareholding of subsidiaries (4 331) 82 608
Cancellation of treasury shares and related costs (1 597 359) –
Transfer to statutory reserves (679) (2 182)
Treasury shares (2 185 873) (2 345 846)
Balance at beginning of the year (2 345 846) (2 481 130)
Purchase of shares (1 581 285) (24 975)
Shares disposed of in terms of share incentive scheme 154 739 48 689
Cancellation of treasury shares 1 586 519 –
Refund of share premium received by subsidiaries – 111 570
EquITy ATTRIBuTABLE TO MINORITy SHAREHOLDERS 787 728 656 434
Balance at beginning of the year 656 434 368 495
Attributable profit 235 401 99 613
Movement in foreign currency translation reserve (3 529) (4 382)
Dividends paid (107 246) (33 646)
Movement in equity-settled share-based payment reserve 60 5 525
Capital invested – 300 772
Changes in shareholding 2 277 2 665
Transfer of reserves as a result of changes in shareholding of subsidiaries 4 331 (82 608)
TOTAL EquITy 18 456 992 17 392 937

PASSION/VITALITY/PRECISION
158
Consolidated statement of financial positionat June 30
Note 2011
R’000 2010
R’000
ASSETS
Non-current assets 21 860 236 19 371 091
Property, plant and equipment 13 11 603 183 10 367 571
Intangible assets 14 672 105 651 094
Goodwill 15 6 354 825 5 709 169
Deferred taxation assets 16 390 792 426 822
Defined benefit pension surplus 29 111 692 129 850
Interest in associates 18 684 405 656 865
Investments 19 1 749 577 1 157 190
Banking and other advances 20 293 657 272 530
Current assets 25 969 682 23 973 829
Vehicle rental fleet 21 1 063 371 915 042
Inventories 22 8 750 609 8 030 752
Short-term portion of banking and other advances 20 154 279 350 086
Trade and other receivables 23 11 564 155 10 539 227
Cash and cash equivalents 24 4 437 268 4 138 722
Total assets 47 829 918 43 344 920
EquITy AND LIABILITIES
Capital and reserves 18 456 992 17 392 937
Capital and reserves attributable to shareholders of the Company 25 17 669 264 16 736 503
Minority shareholders 787 728 656 434
Non-current liabilities 5 769 111 4 669 207
Deferred taxation liabilities 16 507 505 378 992
Life assurance fund 27 34 014 13 734
Long-term portion of borrowings 28 4 391 429 3 448 501
Post-retirement obligations 29 381 332 394 527
Long-term portion of provisions 33 272 400 235 253
Long-term portion of operating lease liabilities 31 182 431 198 200
Current liabilities 23 603 815 21 282 776
Trade and other payables 32 16 812 487 15 032 357
Short-term portion of provisions 33 237 471 251 635
Vendors for acquisition 539 539
Taxation 201 313 364 558
Banking liabilities 30 1 275 897 1 080 366
Short-term portion of borrowings 28 5 076 108 4 553 321
Total equity and liabilities 47 829 918 43 344 920

159
AUDITED FINANCIAL STATEMENTS
THE BIDVEST GROUP LIMITED / ANNUAL INTEGRATED REPORT 2011
Notes to the consolidated financial statements for the year ended June 30
2011 R’000
2010 R’000
1. Total revenue
Sale of goods 91 919 771 87 005 106
Rendering of services 11 564 643 10 698 035
Commissions and fees earned 927 376 991 589
Gross billings relating to clearing and forwarding transactions 16 779 446 13 985 042
Insurance 292 131 180 993
121 483 367 112 860 765
Inter-group eliminations (3 000 631) (3 071 558)
Revenue 118 482 736 109 789 207
2. Operating profit
Determined after charging (crediting)
Auditors' remuneration 68 528 67 493
Audit fees 52 065 52 624
Audit related expenses 1 227 512
Taxation services 4 834 4 546
Other services 10 402 9 811
Depreciation of property, plant and equipment 1 556 293 1 599 512
Buildings 55 180 60 423
Leasehold premises 58 011 66 729
Plant and equipment 455 279 425 924
Office equipment, furniture and fittings 280 148 263 310
Vehicles, vessels and craft 365 315 411 589
Rental assets 116 325 62 656
Capitalised leased assets 4 976 6 947
Full maintenance lease assets 221 059 301 934
Depreciation of vehicle rental fleet 134 611 151 985
Amortisation of intangible assets 120 794 118 968
Patents, trademarks, tradenames and other intangibles 39 177 33 182
Computer software 81 617 85 786
Impairment of assets 439 350 248 395
Property, plant and equipment 27 027 30 271
Intangible assets 151 521 6 158
Goodwill 3 571 5 528
Banking and other advances – 2 552
Trade receivables 257 231 203 886
Reversal of impairment of associates – (25 900)
Directors' emoluments
Executive directors 80 913 80 653
Basic remuneration 36 816 35 304
Other benefits 3 152 6 637
Retirement and medical benefits 3 249 3 872
Cash incentives 37 696 34 840
Non-executive directors 9 497 3 606
Fees 3 818 3 091
Emoluments for other services 5 679 515
Employer contributions to 796 277 760 356
Defined contribution pension funds 137 429 148 535
Provident funds 375 919 347 559
Retirement funds 50 348 42 668
Medical aid funds 232 581 221 594

PASSION/VITALITY/PRECISION
160
Notes to the consolidated financial statementsfor the year ended June 30
2011 R’000
2010 R’000
2. Operating profit (continued)
Income related to post-retirement obligations (33 882) (98 479)
Defined benefit pension plans (11 064) (68 803)
Post-retirement medical aid obligations (997) 292
Defined benefit early retirement plan (21 821) (29 968)
Share-based payment expense 62 652 79 054
Staff 36 414 45 754
Executive directors 25 951 15 319
Former executive directors 287 993
In respect of empowerment transaction of subsidiary – 16 988
Staff costs excluding directors' emoluments and employer contributions 12 393 729 11 971 272
Fees for administrative, managerial and technical services 6 468 5 308
Research and development expenditure 723 1 649
Foreign exchange losses (gains) on hedging activities 1 467 (20 216)
Forward exchange contracts 1 869 (18 605)
Foreign bank accounts (402) (1 611)
Other foreign exchange losses (gains) (22 799) (10 925)
Realised (30 531) (9 785)
Unrealised 7 732 (1 140)
Dividends received (17 029) (13 626)
Listed investments (17 029) (13 609)
Unlisted investments – (17)
Fair value adjustments on investments held-for-trading (200 867) (192 383)
Net capital loss 7 334 10 525
Loss on disposal of property, plant and equipment 5 642 8 814
Loss on disposal of intangible assets 1 399 1 711
Loss on disposal of interests in subsidiaries and associates, and disposal and closure of businesses 293 –
JSE fees 185 189
Operating lease charges 1 692 499 1 467 884
Land and buildings 1 396 580 1 035 728
Equipment and vehicles 295 919 432 156

161
AUDITED FINANCIAL STATEMENTS
THE BIDVEST GROUP LIMITED / ANNUAL INTEGRATED REPORT 2011
2011 R’000
2010 R’000
3. Net finance charges
Finance income 162 425 193 386
Preference dividends – 4 566
Interest income on banking and other advances 62 417 100 635
Interest income on bank balances 96 584 85 049
Interest income on unimpaired available for sale financial investments 3 424 3 136
Finance charges (777 650) (866 803)
Interest expense on banking liabilities (53 245) (42 695)
Interest expense on bank overdrafts (165 935) (251 944)
Interest expense on financed assets (5 951) (7 029)
Interest expense on vehicle lease creditors and floorplan creditors (26 199) (23 681)
Interest expense on other borrowings (486 908) (492 827)
Interest imputed on post-retirement obligations (41 926) (51 507)
Less borrowing costs capitalised to property, plant and equipment 2 514 2 880
(615 225) (673 417)
Less net finance income from banking operations included in operating profit (28 785) (85 062)
Income (92 520) (128 978)
Charges 63 735 43 916
(644 010) (758 479)
The applicable weighted average interest rate is used to determine the amount of borrowing costs eligible for capitalisation.
4. Taxation
Current taxation 1 263 985 1 246 025
Current year 1 288 810 1 223 563
Prior years under (over) provision (24 825) 22 462
Deferred taxation 121 764 44 803
Current year 145 456 54 155
Prior years over provision (23 156) (8 171)
Change in rate of taxation (536) (1 181)
Secondary taxation on companies 132 487 2 315
Foreign withholding taxation 9 933 7 916
Total taxation per consolidated income statement 1 528 169 1 301 059
Comprising
South African taxation 1 015 922 782 913
Foreign taxation 512 247 518 146
1 528 169 1 301 059
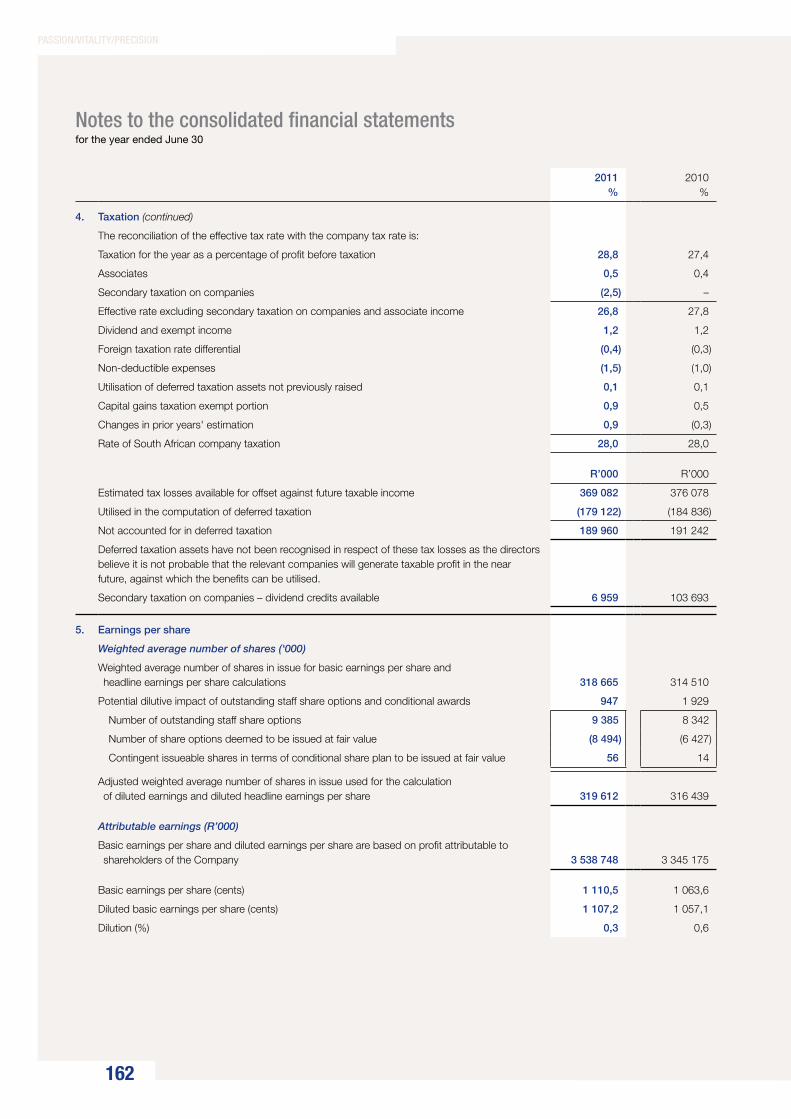
PASSION/VITALITY/PRECISION
162
Notes to the consolidated financial statementsfor the year ended June 30
2011%
2010%
4. Taxation (continued)
The reconciliation of the effective tax rate with the company tax rate is:
Taxation for the year as a percentage of profit before taxation 28,8 27,4
Associates 0,5 0,4
Secondary taxation on companies (2,5) –
Effective rate excluding secondary taxation on companies and associate income 26,8 27,8
Dividend and exempt income 1,2 1,2
Foreign taxation rate differential (0,4) (0,3)
Non-deductible expenses (1,5) (1,0)
Utilisation of deferred taxation assets not previously raised 0,1 0,1
Capital gains taxation exempt portion 0,9 0,5
Changes in prior years' estimation 0,9 (0,3)
Rate of South African company taxation 28,0 28,0
R’000 R’000
Estimated tax losses available for offset against future taxable income 369 082 376 078
Utilised in the computation of deferred taxation (179 122) (184 836)
Not accounted for in deferred taxation 189 960 191 242
Deferred taxation assets have not been recognised in respect of these tax losses as the directors believe it is not probable that the relevant companies will generate taxable profit in the near future, against which the benefits can be utilised.
Secondary taxation on companies – dividend credits available 6 959 103 693
5. Earnings per share
Weighted average number of shares ('000)
Weighted average number of shares in issue for basic earnings per share and headline earnings per share calculations 318 665 314 510
Potential dilutive impact of outstanding staff share options and conditional awards 947 1 929
Number of outstanding staff share options 9 385 8 342
Number of share options deemed to be issued at fair value (8 494) (6 427)
Contingent issueable shares in terms of conditional share plan to be issued at fair value 56 14
Adjusted weighted average number of shares in issue used for the calculation of diluted earnings and diluted headline earnings per share 319 612 316 439
Attributable earnings (R’000)
Basic earnings per share and diluted earnings per share are based on profit attributable to shareholders of the Company 3 538 748 3 345 175
Basic earnings per share (cents) 1 110,5 1 063,6
Diluted basic earnings per share (cents) 1 107,2 1 057,1
Dilution (%) 0,3 0,6

163
AUDITED FINANCIAL STATEMENTS
THE BIDVEST GROUP LIMITED / ANNUAL INTEGRATED REPORT 2011
2011 R’000
2010 R’000
5. Earnings per share (continued)
Headline earnings
Profit attributable to shareholders of the Company 3 538 748 3 345 175
Impairment of property, plant and equipment; goodwill and intangible assets 140 004 41 070
Property, plant and equipment 27 027 30 271
Goodwill 3 571 5 528
Intangible assets 151 521 6 158
Tax relief (42 115) (816)
Minority shareholders – (71)
Net loss on disposal of interests in subsidiaries and disposal and closure of businesses 84 –
Profit (loss) on disposal, and impairment of investment in associate 209 (22 331)
Net loss on disposal of associates 209 3 569
Reversal of impairment of investment in associate – (25 900)
Net loss on disposal of property, plant and equipment and intangible assets 9 114 1 208
Property, plant and equipment 5 642 8 814
Intangible assets 1 399 1 711
Tax relief (5 760) (4 076)
Minority shareholders 7 833 (5 241)
Headline earnings 3 688 159 3 365 122
Headline earnings per share (cents) 1 157,4 1 070,0
Diluted headline earnings per share (cents) 1 153,9 1 063,4
Dilution (%) 0,3 0,6
6. Distribution per share
Interim distribution (cents)
Dividend paid to shareholders on April 4 2011 (2010: Refund of share premium per share in lieu of dividend paid on March 29 2010) 225,0 207,0
Final distribution (cents)
Dividend payable to shareholders on September 26 2011 (2010: Dividend payable to shareholders on September 27 2010) 255,0 225,0
480,0 432,0
It is expected that the final dividend declared for payment on September 26 2011 will result in a secondary taxation on companies tax charge of R83,0 million.

PASSION/VITALITY/PRECISION
164
Notes to the consolidated financial statementsfor the year ended June 30
2011 R’000
2010 R’000
7. Cash generated by operations
Profit before taxation 5 302 318 4 745 847
Costs incurred in respect of acquisitions 24 297 61 202
Net finance charges 644 010 758 479
Share of current year earnings of associates (65 469) (10 198)
Adjustment for depreciation and amortisation 1 811 698 1 870 465
Adjustment for other non-cash items 51 238 (83 176)
Reduction in post-retirement obligations (6 865) (36 431)
Increase (decrease) in life assurance fund 20 280 (6 938)
Utilised to finance working capital 405 727 684 970
Increase in inventories (571 119) (487 076)
Increase in trade and other receivables (688 710) (39 806)
Decrease in banking and other advances 168 081 14 004
Increase in trade and other payables and provisions 1 301 945 708 681
Increase in banking liabilities 195 530 489 167
Cash generated by operations 8 187 234 7 984 220
8. Finance charges
Charge per income statement (713 915) (822 887)
Amounts capitalised to borrowings 87 310 101 725
Amounts capitalised to property, plant and equipment (2 514) (2 880)
Amounts paid (629 119) (724 042)
9. Taxation paid
Amounts payable at beginning of year (364 558) (262 080)
Current taxation charge (1 406 405) (1 256 256)
Businesses acquired 1 009 (19 952)
Businesses disposed of (2 386) –
Exchange rate adjustments (6 384) 6 816
Amounts payable at end of year 201 313 364 558
Amounts paid (1 577 411) (1 166 914)
10. Distributions to shareholders
Dividends paid to shareholders (1 524 360) –
Dividends received by subsidiaries on treasury shares 71 869 –
Refund of share premium to shareholders in lieu of dividend – (1 379 469)
Refund of share premium received by subsidiary on treasury shares – 111 570
Dividends paid to minority shareholders (107 246) (33 646)
Amounts paid (1 559 737) (1 301 545)

165
AUDITED FINANCIAL STATEMENTS
THE BIDVEST GROUP LIMITED / ANNUAL INTEGRATED REPORT 2011
2011 R’000
2010 R’000
11. Acquisition of businesses, subsidiaries and associates
Property, plant and equipment (195 856) (623 231)
Deferred taxation 16 242 27 884
Interest in associates 23 257 (180 419)
Investments and advances (22) 11 444
Inventories (56 409) (410 932)
Trade and other receivables (207 980) (391 503)
Cash and cash equivalents 18 748 (45 784)
Borrowings 237 152 1 374 270
Trade and other payables and provisions 261 506 703 233
Taxation (1 009) 19 952
Fair value of liabilities acquired 95 629 484 914
Goodwill (470 608) (2 167 927)
Intangible assets (44 207) (179 927)
Minority shareholders 2 276 (58 108)
Total value of acquisitions (416 910) (1 921 048)
Less cash and cash equivalents acquired (18 748) 45 784
Vendors for acquisition at beginning of year (539) (15 629)
Vendors for acquisition at end of year 539 539
Costs incurred in respect of acquisitions (24 297) (61 202)
Net amounts paid (459 955) (1 951 556)
The Group announced on December 22 2010 that it had acquired 100% of the issued capital of Seafood Holdings Limited, a leading fresh fish foodservice business in the United Kingdom, for an enterprise value of GBP45 million.
The Group also undertook a number of other smaller acquisitions during the year.
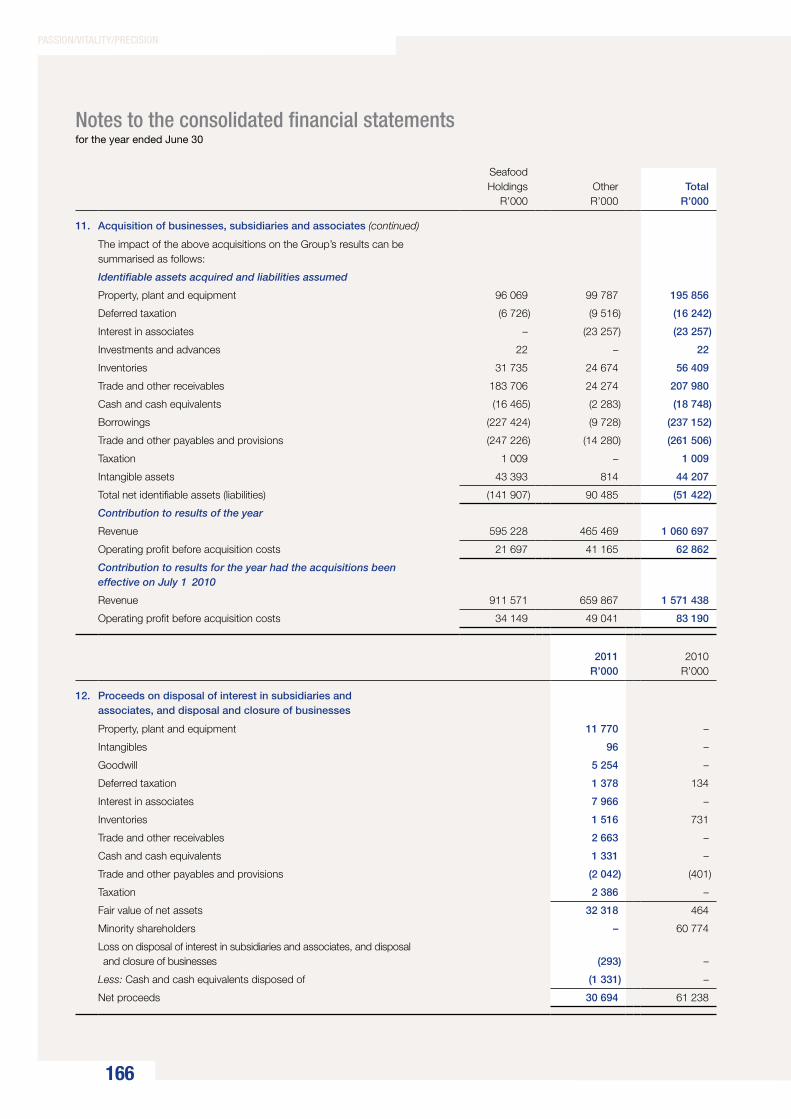
PASSION/VITALITY/PRECISION
166
Notes to the consolidated financial statementsfor the year ended June 30
Seafood Holdings
R’000 OtherR’000
TotalR’000
11. Acquisition of businesses, subsidiaries and associates (continued)
The impact of the above acquisitions on the Group’s results can be summarised as follows:
Identifiable assets acquired and liabilities assumed
Property, plant and equipment 96 069 99 787 195 856
Deferred taxation (6 726) (9 516) (16 242)
Interest in associates – (23 257) (23 257)
Investments and advances 22 – 22
Inventories 31 735 24 674 56 409
Trade and other receivables 183 706 24 274 207 980
Cash and cash equivalents (16 465) (2 283) (18 748)
Borrowings (227 424) (9 728) (237 152)
Trade and other payables and provisions (247 226) (14 280) (261 506)
Taxation 1 009 – 1 009
Intangible assets 43 393 814 44 207
Total net identifiable assets (liabilities) (141 907) 90 485 (51 422)
Contribution to results of the year
Revenue 595 228 465 469 1 060 697
Operating profit before acquisition costs 21 697 41 165 62 862
Contribution to results for the year had the acquisitions been effective on July 1 2010
Revenue 911 571 659 867 1 571 438
Operating profit before acquisition costs 34 149 49 041 83 190
2011 R’000
2010 R’000
12. Proceeds on disposal of interest in subsidiaries and associates, and disposal and closure of businesses
Property, plant and equipment 11 770 –
Intangibles 96 –
Goodwill 5 254 –
Deferred taxation 1 378 134
Interest in associates 7 966 –
Inventories 1 516 731
Trade and other receivables 2 663 –
Cash and cash equivalents 1 331 –
Trade and other payables and provisions (2 042) (401)
Taxation 2 386 –
Fair value of net assets 32 318 464
Minority shareholders – 60 774
Loss on disposal of interest in subsidiaries and associates, and disposal and closure of businesses (293) –
Less: Cash and cash equivalents disposed of (1 331) –
Net proceeds 30 694 61 238

167
AUDITED FINANCIAL STATEMENTS
THE BIDVEST GROUP LIMITED / ANNUAL INTEGRATED REPORT 2011
2011 R’000
2010 R’000
13. Property, plant and equipment
Freehold land and buildings 3 383 533 2 894 264
Cost 4 121 365 3 538 144 Accumulated depreciation and impairments (737 832) (643 880)
Leasehold premises 934 820 853 528
Cost 1 370 459 1 250 551 Accumulated depreciation and impairments (435 639) (397 023)
Plant and equipment 2 502 025 2 412 013
Cost 5 501 074 5 054 345 Accumulated depreciation and impairments (2 999 049) (2 642 332)
Office equipment, furniture and fittings 809 766 782 189
Cost 2 458 147 2 255 190 Accumulated depreciation and impairments (1 648 381) (1 473 001)
Vehicles, vessels and craft 1 727 274 1 693 001
Cost 3 742 068 3 627 601 Accumulated depreciation and impairments (2 014 794) (1 934 600)
Rental assets 270 203 258 528
Cost 633 262 550 683 Accumulated depreciation and impairments (363 059) (292 155)
Capitalised leased assets 13 896 18 062
Cost 52 691 49 277 Accumulated depreciation and impairments (38 795) (31 215)
Full maintenance leased assets 1 765 421 1 263 241
Cost 2 455 622 2 029 010 Accumulated depreciation and impairments (690 201) (765 769)
Capital work in progress 196 245 192 745
11 603 183 10 367 571
Movement in property, plant and equipment
Carrying value at beginning of year 10 367 571 9 409 702
Capital expenditure 2 736 106 2 733 291
Freehold land and buildings 422 579 399 854
Leasehold premises 90 269 209 348
Plant and equipment 545 370 838 272
Office equipment, furniture and fittings 306 727 309 301
Vehicles, vessels and craft 452 746 611 092
Rental assets 135 540 129 380
Capitalised leased assets – 852
Full maintenance leased assets 782 806 529 363
Capital work in progress 69 (294 171)
Expenditure 363 182 257 008
Transfers to other categories (363 113) (551 179)
Balance carried forward 13 103 677 12 142 993

PASSION/VITALITY/PRECISION
168
Notes to the consolidated financial statementsfor the year ended June 30
2011 R’000
2010 R’000
13. Property, plant and equipment (continued)
Movement in property, plant and equipment (continued)
Balance brought forward 13 103 677 12 142 993
Acquisition of businesses 195 856 623 231
Freehold land and buildings 43 973 339 208
Leasehold premises 85 248 5 298
Plant and equipment 32 980 96 395
Office equipment, furniture and fittings 4 922 43 234
Vehicles, vessels and craft 28 440 100 392
Rental assets – 11 927
Capitalised leased assets 293 –
Capital work in progress – 26 777
Disposals (216 002) (406 982)
Freehold land and buildings (10 682) (17 696)
Leasehold premises (8 499) –
Plant and equipment (42 590) (37 024)
Office equipment, furniture and fittings (4 621) (15 933)
Vehicles, vessels and craft (82 653) (76 984)
Rental assets (7 391) (36 440)
Capitalised leased assets – (7 326)
Full maintenance leased assets (59 566) (195 277)
Capital work in progress – (20 302)
Disposal of businesses (11 770) –
Freehold land and buildings (3 425) –
Plant and equipment (5 008) –
Office equipment, furniture and fittings (467) –
Vehicles, vessels and craft (2 791) –
Rental assets (79) –
Exchange rate adjustments 114 742 (361 888)
Freehold land and buildings 92 003 (143 208)
Leasehold premises (10 402) (30 045)
Plant and equipment 19 339 (66 803)
Office equipment, furniture and fittings 2 244 (7 138)
Vehicles, vessels and craft 7 679 (89 875)
Rental assets (69) (325)
Capitalised leased assets 517 (2 774)
Capital work in progress 3 431 (21 720)
Depreciation (refer note 2) (1 556 293) (1 599 512)
Impairments (27 027) (30 271)
Carrying value at end of year 11 603 183 10 367 571
Property, plant and equipment with an estimated carrying value of R88,8 million (2010: R68,4 million) were pledged as security for borrowings of R77,3 million (2010: R61,8 million) (refer note 28).
A register of land and buildings is available for inspection by members at the registered office of the Company.

169
AUDITED FINANCIAL STATEMENTS
THE BIDVEST GROUP LIMITED / ANNUAL INTEGRATED REPORT 2011
2011 R’000
2010 R’000
14. Intangible assets
Patents, trademarks, tradenames and other intangibles 252 916 241 871
Cost 1 154 870 1 123 420
Accumulated amortisation and impairments (901 954) (881 549)
Computer software 380 297 218 040
Cost 1 085 739 716 227
Accumulated amortisation and impairments (705 442) (498 187)
Capital work in progress 38 892 191 183
672 105 651 094
Movement in intangible assets
Carrying value at beginning of year 651 094 512 286
Additions 241 185 149 880
Patents, trademarks, tradenames and other intangibles 4 520 17 909
Computer software 383 115 123 957
Capital work in progress (146 450) 8 014
Expenditure 67 344 13 646
Transfers to other categories (213 794) (5 632)
Acquisition of businesses 44 207 179 927
Patents, trademarks, tradenames and other intangibles 34 532 174 928
Computer software 9 675 4 842
Capital work in progress – 157
Disposals (5 194) (11 473)
Patents, trademarks, tradenames and other intangibles (90) (7 747)
Computer software (5 104) (3 322)
Capital work in progress – (404)
Disposal of businesses
Computer software (96) –
Exchange rate adjustments 13 224 (54 400)
Patents, trademarks, tradenames and other intangibles 12 920 (18 491)
Computer software 6 145 (13 293)
Capital work in progress (5 841) (22 616)
Amortisation (refer note 2) (120 794) (118 968)
Impairments (151 521) (6 158)
Carrying value at end of year 672 105 651 094
The amortisation and impairment charges are included in other expenses in the income statement.

PASSION/VITALITY/PRECISION
170
Notes to the consolidated financial statementsfor the year ended June 30
2011 R’000
2010 R’000
15. Goodwill
Carrying value at beginning of year 5 709 169 3 966 950
Acquisition of businesses 470 608 2 167 927
Disposal of businesses (5 254) –
Impairment of goodwill (3 571) (5 528)
Exchange rate adjustments 183 873 (420 180)
Carrying value at end of year 6 354 825 5 709 169
Goodwill acquired through business combinations has been attributed to individual cash-generating units. The carrying amount of goodwill was subject to an annual impairment test as at March 31 using either the discounted cash flow basis or at fair value less costs to sell method. An amount of R3,6 million (2010: R5,5 million) was identified as being impaired for the current financial year.
The most significant portion of the Group’s goodwill, R5,1 billion (2010: R4,8 billion), relates to operations in Bidvest Europe and Asia Pacific. The recoverable amount of each cash-generating units within these divisions was determined using the fair value less costs to sell method and exceeds the carrying value by some R13,5 billion. These calculations use projected annualised earnings based on actual operating results. A price earnings ratio was applied to obtain the recoverable amount for each business unit. The earning yields are considered to be consistent with similar companies within the industry and geographic segments. Attributable earnings for these operations amounted to R961,6 million (2010: R996,9 million) for the year.
The remaining goodwill of R1,3 billion (2010: R0,9 billion) is allocated across multiple cash-generating units. The recoverable amount for these remaining units was calculated on the aforementioned basis. For those units where the carrying amount was in excess of the recoverable amount and a permanent diminution had taken place, an impairment was recognised.
16. Deferred taxation
Deferred taxation assets 390 792 426 822
Deferred taxation liabilities (507 505) (378 992)
Net deferred taxation asset (liability) (116 713) 47 830
Movement in net deferred taxation assets and liabilities
Balance at beginning of year 47 830 123 201
Per consolidated income statement (121 764) (44 803)
Items recognised directly in other comprehensive income – 5 046
On acquisition of businesses (16 242) (27 884)
On disposal of businesses (1 378) (134)
Exchange rate adjustments (25 159) (7 596)
Balance at end of year (116 713) 47 830

171
AUDITED FINANCIAL STATEMENTS
THE BIDVEST GROUP LIMITED / ANNUAL INTEGRATED REPORT 2011
AssetsR’000
LiabilitiesR’000
NetR’000
16. Deferred taxation (continued)Temporary differences2011Differential between carrying values and tax values of property, plant and equipment 4 250 (621 696) (617 446)Differential between carrying values and tax values of intangible assets (411) (37 055) (37 466)Estimated taxation losses 32 406 12 843 45 249 Staff related allowances and liabilities 166 933 106 470 273 403 Operating lease liabilities 58 548 7 096 65 644 Inventories 64 890 (4 758) 60 132 Investments (623) (44 493) (45 116)Trade and other receivables 30 535 21 786 52 321 Trade, other payables and provisions 34 264 52 302 86 566
390 792 (507 505) (116 713)2010Differential between carrying values and tax values of property, plant and equipment 1 141 (473 089) (471 948)Differential between carrying values and tax values of intangible assets 324 (31 750) (31 426)Estimated taxation losses 42 686 8 943 51 629 Staff related allowances and liabilities 181 003 84 564 265 567 Operating lease liabilities 55 054 8 442 63 496 Inventories 68 043 (16 115) 51 928 Investments 7 643 (31 749) (24 106)Trade and other receivables 38 614 18 116 56 730 Trade, other payables and provisions 32 314 53 646 85 960
426 822 (378 992) 47 830
Deferred taxation has been provided at rates ranging between 10% – 36% (2010: 10% – 36%). The variance in rates arises as a result of the differing tax and capital gains tax rates present in the various countries in which the Group operates.
2011 R’000
2010 R’000
17. Interest in joint ventures
The Group’s proportional interest in joint ventures has been incorporated in the Group’s assets, liabilities and results, as follows:
Income statement
Revenue 22 947 26 481
Operating profit 4 531 6 200
Net finance charges (1 134) (1 250)
Profit before taxation 3 397 4 950
Taxation (1 738) (1 437)
Profit for the year 1 659 3 513
Balance sheet
Assets
Property, plant and equipment 7 312 9 062
Intangibles 11 4
Deferred taxation 2 218 1 824
Net current assets 4 136 9 511
13 677 20 401 Equity and liabilities
Capital and reserves 5 967 11 808
Borrowings 7 710 8 593
13 677 20 401
Details of major joint ventures are reflected on page 221 of this report.
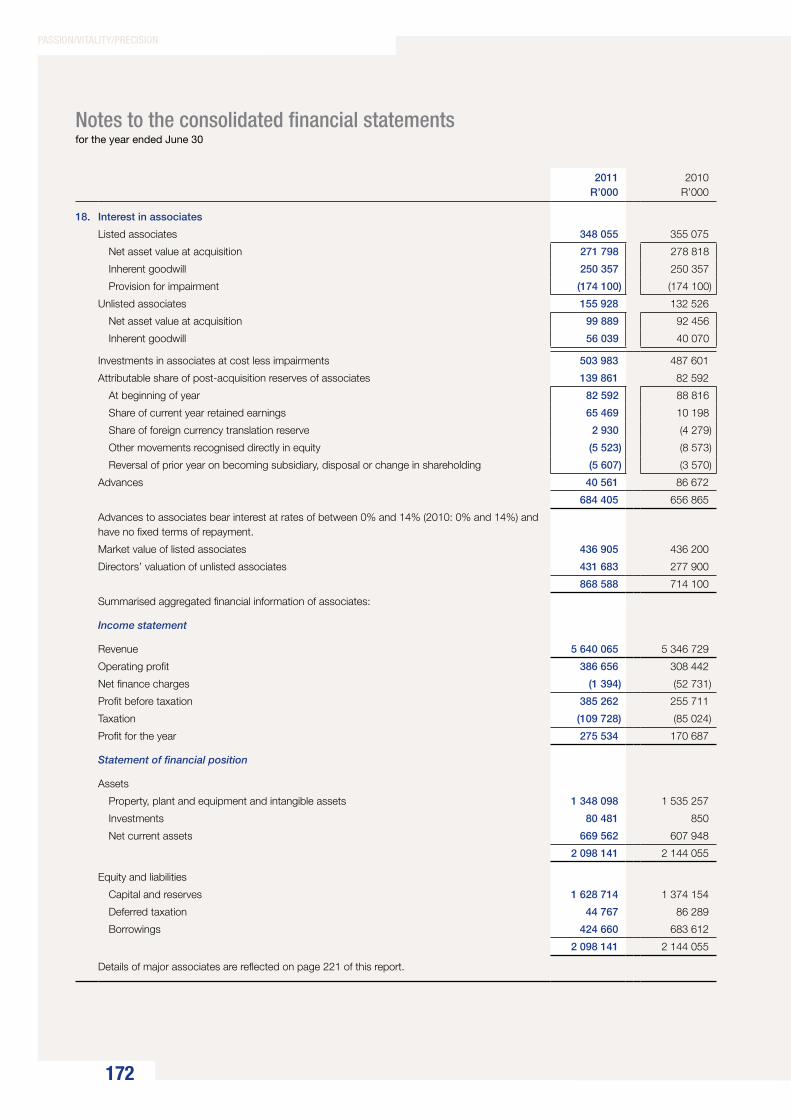
PASSION/VITALITY/PRECISION
172
Notes to the consolidated financial statementsfor the year ended June 30
2011 R’000
2010 R’000
18. Interest in associates
Listed associates 348 055 355 075
Net asset value at acquisition 271 798 278 818
Inherent goodwill 250 357 250 357
Provision for impairment (174 100) (174 100)
Unlisted associates 155 928 132 526
Net asset value at acquisition 99 889 92 456
Inherent goodwill 56 039 40 070
Investments in associates at cost less impairments 503 983 487 601
Attributable share of post-acquisition reserves of associates 139 861 82 592
At beginning of year 82 592 88 816
Share of current year retained earnings 65 469 10 198
Share of foreign currency translation reserve 2 930 (4 279)
Other movements recognised directly in equity (5 523) (8 573)
Reversal of prior year on becoming subsidiary, disposal or change in shareholding (5 607) (3 570)
Advances 40 561 86 672
684 405 656 865
Advances to associates bear interest at rates of between 0% and 14% (2010: 0% and 14%) and have no fixed terms of repayment.
Market value of listed associates 436 905 436 200
Directors’ valuation of unlisted associates 431 683 277 900
868 588 714 100
Summarised aggregated financial information of associates:
Income statement
Revenue 5 640 065 5 346 729
Operating profit 386 656 308 442
Net finance charges (1 394) (52 731)
Profit before taxation 385 262 255 711
Taxation (109 728) (85 024)
Profit for the year 275 534 170 687
Statement of financial position
Assets
Property, plant and equipment and intangible assets 1 348 098 1 535 257
Investments 80 481 850
Net current assets 669 562 607 948
2 098 141 2 144 055
Equity and liabilities
Capital and reserves 1 628 714 1 374 154
Deferred taxation 44 767 86 289
Borrowings 424 660 683 612
2 098 141 2 144 055
Details of major associates are reflected on page 221 of this report.

173
AUDITED FINANCIAL STATEMENTS
THE BIDVEST GROUP LIMITED / ANNUAL INTEGRATED REPORT 2011
2011 R’000
2010 R’000
19. Investments
Listed held-for-trading 758 158 492 635
Unlisted held-for-trading 874 464 571 288
Listed available-for-sale 82 370 58 672
Unlisted available-for-sale 34 585 34 595
1 749 577 1 157 190
The Group accounts for its effective beneficial interest in Mumbai International Airport as an unlisted investment held for trading. The carrying value of this investment, based on a conservative directors valuation at June 30 2011, is R671,5 million (2010: R499,9 million).
Included in listed investments are available for sale interest bearing listed bonds which amount to R62,6 million (2010: R37,9 million), with coupon interest rates of between 13,0% to 13,5% (2010: 13,0% to 13,5%) which mature in one to five years (2010: one to six years). These investments may be realised prior to their maturity date.
Fair value and hierarchy of investments
The table below analyses investments by valuation method:
Investments held at cost 159 252 32 118
Investments held at fair value as determined on inputs based on: 1 590 325 1 125 072
Unadjusted quoted prices in an active market for identical assets 872 389 521 795
Factors that are observable for the asset either as prices or derived from prices 679 468 564 959
Factors that are not based on observable market data 38 468 38 318
1 749 577 1 157 190
A register of investments is available for inspection by members at the registered office of the Company.
20. Banking and other advances
Instalment finance and vehicle lease receivables 325 092 266 727
Call and term loans 89 900 156 972
Other 62 121 221 494
477 113 645 193
Impairment allowance (29 177) (22 577)
447 936 622 616
Maturity analysis
Maturing in one year 154 279 350 086
Maturing after one year but within five years 253 746 272 530
Maturing after five years 39 911 –
447 936 622 616
Interest rates are based on contractual agreements with customers.
Refer note 36 for further disclosure.

PASSION/VITALITY/PRECISION
174
Notes to the consolidated financial statementsfor the year ended June 30
2011 R’000
2010 R’000
21. Vehicle rental fleet
Cost 1 123 432 1 001 864
Accumulated depreciation (60 061) (86 822)
1 063 371 915 042
Movement in vehicle rental fleet
Carrying value at beginning of year 915 042 684 205
Additions 1 177 255 1 150 070
Disposals (894 315) (767 248)
Depreciation (134 611) (151 985)
Carrying value at end of year 1 063 371 915 042
22. Inventories
Raw materials 326 573 323 505
Work in progress 47 666 99 398
Finished goods 5 955 556 5 353 692
New vehicles and motor cycles 844 376 748 740
Used vehicles 636 263 627 369
Demonstration vehicles 645 122 550 527
Power and marine products 79 663 111 595
Parts and accessories 215 390 215 926
8 750 609 8 030 752
Ownership of inventory, acquired under floorplan arrangements, remains with the respective floorplan provider until the purchase price has been paid.
Amounts included in borrowings relating to these assets (refer note 28) 519 355 560 035
Amounts included in trade and other payables relating to these assets (refer note 32) 628 924 406 300
1 148 279 966 335
Write-down of inventory charged to the income statement 57 623 104 201
23. Trade and other receivables
Trade receivables 10 907 039 10 044 178
Impairment allowance (427 446) (426 848)
Net trade receivables 10 479 593 9 617 330
Forward exchange contracts asset 1 444 8 959
Prepayments and other receivables 1 083 118 912 938
11 564 155 10 539 227
The majority of trade and other receivables are fixed in the subsidiaries’ local currency. Since trade and other receivables have limited exposure to exchange rate fluctuations, a currency analysis has not been included.
Refer note 36 for further disclosure on trade receivables and impairment allowances.

175
AUDITED FINANCIAL STATEMENTS
THE BIDVEST GROUP LIMITED / ANNUAL INTEGRATED REPORT 2011
2011 R’000
2010 R’000
24. Cash and cash equivalents
Cash on hand and at bank 4 437 268 4 138 722
Amounts included in cash and cash equivalents relating to banking and insurance subsidiaries where the balances form part of the reserving requirements as required by the Financial Services Act 236 132 1 160 553
25. Capital and reserves attributable to shareholders of the Company
Share capital and premium 97 625 98 765
Issued share capital 16 367 17 507
Share premium 81 258 81 258
Reserves 19 757 512 18 983 584
Foreign currency translation reserve 248 830 20 527
Statutory reserves 15 894 15 215
Equity-settled share-based payment reserve 391 430 328 640
Retained earnings 19 101 358 18 619 202
19 855 137 19 082 349
Less: Shares held by subsidiary as treasury shares (2 185 873) (2 345 846)
Capital and reserves attributable to shareholders of the Company 17 669 264 16 736 503
Reserves comprise
Company and subsidiaries 19 612 185 18 889 685
Joint ventures 5 466 11 307
Associates 139 861 82 592
19 757 512 18 983 584
Foreign currency translation reserveThe translation reserve comprises all foreign exchange differences arising from the translation of the financial statements of foreign operations.
Statutory reservesA contingency reserve is maintained at 10% of the net premium income. The reserve can be utilised in the case of a catastrophe, subject to the approval of the Financial Services Board.
A statutory reserve is maintained by a banking subsidiary to meet the minimum general provision against advances as prescribed by the Banks Act.
Equity-settled share-based payment reserveThe equity-settled share-based payment reserve includes the fair value of the options granted and conditional share awards made, to executive directors and staff, which have been recognised over the vesting period at fair value with a corresponding expense to the income statement. The reserve also includes a share-based cost resulting from an empowerment transaction entered into by a subsidiary.

PASSION/VITALITY/PRECISION
176
Notes to the consolidated financial statementsfor the year ended June 30
2011 R’000
2010 R’000
25. Capital and reserves attributable to shareholders of the Company
Share capital
Authorised
540 000 000 (2009: 540 000 000) ordinary shares of 5 cents each 27 000 27 000
Number Number
Issued
Number of shares issued 327 348 572 350 144 746
Balance at beginning of year 350 144 746 336 284 567
Cancellation of treasury shares (22 796 174) –
Issue for cash – 9 970 240
Shares issued in terms of the share incentive scheme – 3 889 939
Less: Shares held by subsidiary as treasury shares (15 658 596) (27 843 230)
Balance at beginning of year (27 843 230) (27 571 595)
Cancellation of treasury shares 22 796 174 –
Purchase of shares by subsidiary (12 000 000) (658 202)
Sale of shares by subsidiary to staff in terms of share incentive scheme 1 388 460 386 567
Less: Shares held by share purchase scheme (2 669 432) (3 295 121)
Balance at beginning of year (3 295 121) (3 717 917)
Shares acquired by staff in terms of share incentive scheme 590 120 287 074
Shares repurchased from staff 35 569 135 722
Net shares in issue 309 020 544 319 006 395
30 000 000 of the unissued ordinary shares are under the control of the directors until the next annual general meeting.
26. Share-based payments
The Bidvest Share Incentive Scheme (Scheme) grants options and advances loans to employees of the Group to acquire shares in the Company. Both the share options scheme and share purchase scheme have been classified as equity-settled schemes, and therefore an equity-settled share-based payment reserve has been recognised.
A conditional share plan, which awards employees a conditional right to receive shares in the Company, free of any cost, is also operated by the Group. As it is anticipated that the participants will receive shares in settlement of their awards, a share-based payment reserve has been recognised.
Share options schemeThe Group elected to account only for the cost of options granted subsequent to November 7 2002 which had not vested by January 1 2005 in terms of the transitional provisions on conversion to IFRS.
The terms and conditions of the options are:
Option holders are only entitled to exercise their options if they are in the employment of the Group in accordance with the terms referred to hereafter, unless otherwise recommended by the board of the Company to the trustees of the Bidvest Share Incentive Trust.
Option holders in the Scheme may exercise the options at such times as the option holder deems fit, but not so as to result in the following proportions of the holder’s total number of instruments being purchased prior to: 50% of total number of instruments at the expiry of three years; 75% of total number of instruments at the expiry of four years; and 100% of total number of instruments at the expiry of five years from the date of the holder’s acceptance of an option. All options must be exercised no later than the tenth anniversary on which they were granted unless approval is obtained from the trustees.

177
AUDITED FINANCIAL STATEMENTS
THE BIDVEST GROUP LIMITED / ANNUAL INTEGRATED REPORT 2011
26. Share-based payments (continued)
Share options scheme (continued)
The number and weighted average exercise prices of share options are:
2011 2010
Number
Average price
R Number
Average price
R
Beginning of the year 5 047 057 55,72 8 804 506 51,36 Granted 3 413 860 135,11 63 000 100,00 Lapsed (320 481) 54,17 (28 510) 55,37 Exercised (1 424 029) 52,30 (3 791 939) 47,17
End of the year 6 716 407 96,51 5 047 057 55,72
The options outstanding at June 30 2011 have an exercise price in the range of R39,10 to R135,15 (2010: R35,03 to R112,00) and a weighted average contractual life of 1,0 to 9,5 years (2010: 1,0 to 8,5 years). The average share price of The Bidvest Group Limited during the year was R147,07 (2010: R123,28).
Share options outstanding at June 30 by year of grant are:
2003 and prior 923 171 39,68 1 769 920 40,53 2004 1 051 145 50,57 1 384 350 50,53 2005 1 132 731 69,37 1 637 537 69,18 2006 112 500 89,44 157 250 89,61 2008 20 000 112,00 35 000 112,00 2010 63 000 100,00 63 000 100,00 2011 3 413 860 135,11
6 716 407 96,51 5 047 057 55,72
The fair value of services received in return for shares allotted is measured based on a binomial model. The contractual life of the option is used as an input into this model.
The fair value of the shares allotted during the year and the assumptions used were:
2011 2010
Fair value at measurement date (rand) 55,62 – 53,68 19,01 Exercise price (rand) 135,15 – 126,50 100,00 Expected volatility (%) 39,07 – 39,03 31,21 Option life (years) 3,50 – 5,50 3,25 – 4,25 Distribution yield (%) 2,76 – 3,07 4,72 Risk-free interest rate (based on national government bonds) (%) 7,01 – 7,88 7,19
The volatility is based on the historic volatility.

PASSION/VITALITY/PRECISION
178
Notes to the consolidated financial statementsfor the year ended June 30
26. Share-based payments (continued)
Share purchase schemeIn terms of the share purchase scheme, the Scheme advances loans to employees to acquire shares in the Company. Interest is charged on the loans at interest rates determined by the board of directors of the Company, the loans must be settled no later than the tenth anniversary on which the shares were allotted and the shares are held by the Scheme as security for the loans.
The employees are entitled to settle the loans at such times as they deem fit, but not so as to result in the following proportions of the employees’ total number of allotted shares being paid for prior to: 50% of total number of allotted shares at the expiry of three years; 75% of total number of allotted shares at the expiry of four years; and 100% of total number of allotted shares at the expiry of five years from the date of the holder’s acceptance of the allotted share, unless otherwise determined by the board.
Distributions arising on the allotted shares are utilised to settle any interest or income tax obligations with any excess being applied to settle the outstanding liability.
The number and weighted average exercise prices of shares allotted in terms of the share purchase scheme are:
2011 2010
Number
Average price
R Number
Averageprice
R
Beginning of the year 3 295 090 110,76 3 717 917 111,03Repurchased (35 538) 110,51 (135 722) 111,00Shares taken up by staff (590 120) 117,55 (287 105) 112,60
End of the year 2 669 432 109,26 3 295 090 110,76
The fair value of services received in return for shares allotted is measured based on a binomial model. The expected contractual life of the loan obligation is used as an input into this model.
No shares were allotted during the year (2010: Nil).
Conditional share planIn terms of the conditional share plan scheme, a conditional right to a share is awarded to employees subject to performance and vesting conditions. The vesting period is as follows: 50% of total number of awards vest at the expiry of three years; 75% of total number of awards vest at the expiry of four years; and 100% of total number of allotted awards vest at the expiry of five years from the date of the holder’s acceptance of the award, unless otherwise determined by the board. These share awards do not carry voting rights attributable to ordinary shareholders. A total number of 3 273 486 (2010: 3 501 447) conditional share awards are available to be granted to employees in the forthcoming year.
The fair value of services received in return for the conditional share awards has been determined by multiplying the number of conditional share awards expected to vest, by the share price at the date of the award less discounted by anticipated future distribution flows. A total number of 622 725 of the 1 045 000 shares are expected to vest, taking into account the performance of the various operations to date and forecasts to the end of the performance period, against the targets set at the time of the award. The average discounted share price used in the calculation is R119,81 per share. These awards will vest in the next two years.
1 730 600 (2010: nil) conditional share awards were forfeited as a result of performance conditions not being met.
The number of conditional share awards allotted in terms of the conditional share award scheme are:
2011Number
2010Number
Beginning of the year 2 785 600 800 000 Allotted during the year – 2 085 600 Forfeited during the year (1 730 600) – Lapsed during the year (10 000) (100 000)
End of the year 1 045 000 2 785 600
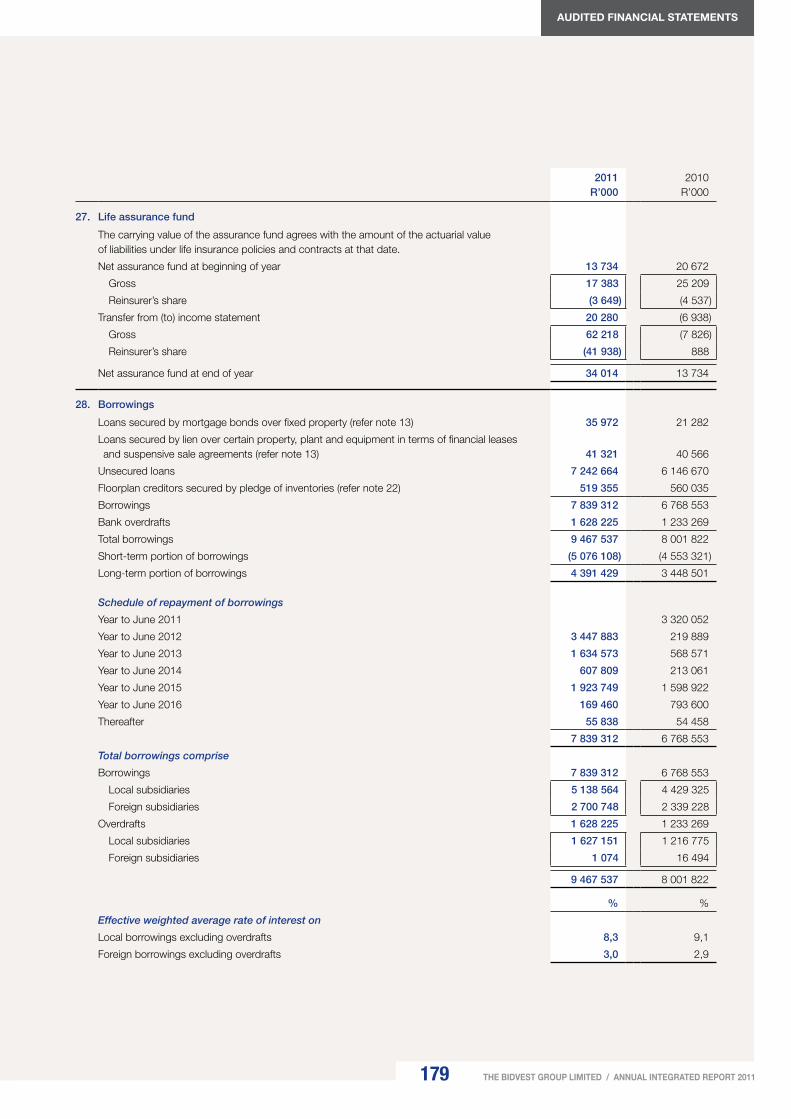
179
AUDITED FINANCIAL STATEMENTS
THE BIDVEST GROUP LIMITED / ANNUAL INTEGRATED REPORT 2011
2011R’000
2010R’000
27. Life assurance fund
The carrying value of the assurance fund agrees with the amount of the actuarial value of liabilities under life insurance policies and contracts at that date.
Net assurance fund at beginning of year 13 734 20 672
Gross 17 383 25 209
Reinsurer’s share (3 649) (4 537)
Transfer from (to) income statement 20 280 (6 938)
Gross 62 218 (7 826)
Reinsurer’s share (41 938) 888
Net assurance fund at end of year 34 014 13 734
28. Borrowings
Loans secured by mortgage bonds over fixed property (refer note 13) 35 972 21 282
Loans secured by lien over certain property, plant and equipment in terms of financial leases and suspensive sale agreements (refer note 13) 41 321 40 566
Unsecured loans 7 242 664 6 146 670
Floorplan creditors secured by pledge of inventories (refer note 22) 519 355 560 035
Borrowings 7 839 312 6 768 553
Bank overdrafts 1 628 225 1 233 269
Total borrowings 9 467 537 8 001 822
Short-term portion of borrowings (5 076 108) (4 553 321)
Long-term portion of borrowings 4 391 429 3 448 501
Schedule of repayment of borrowings
Year to June 2011 3 320 052
Year to June 2012 3 447 883 219 889
Year to June 2013 1 634 573 568 571
Year to June 2014 607 809 213 061
Year to June 2015 1 923 749 1 598 922
Year to June 2016 169 460 793 600
Thereafter 55 838 54 458
7 839 312 6 768 553
Total borrowings comprise
Borrowings 7 839 312 6 768 553
Local subsidiaries 5 138 564 4 429 325
Foreign subsidiaries 2 700 748 2 339 228
Overdrafts 1 628 225 1 233 269
Local subsidiaries 1 627 151 1 216 775
Foreign subsidiaries 1 074 16 494
9 467 537 8 001 822
% %
Effective weighted average rate of interest on
Local borrowings excluding overdrafts 8,3 9,1
Foreign borrowings excluding overdrafts 3,0 2,9

PASSION/VITALITY/PRECISION
180
Notes to the consolidated financial statementsfor the year ended June 30
2011 2010Currency Nominal
interest rate%
Year of maturity
CarryingvalueR’000
Carryingvalue
R’000
28. Borrowings (continued)
Terms and debt repayment schedule
Terms and conditions of outstanding loans were:
Borrowings of local subsidiaries 5 138 564 4 429 325
Loans secured by lien over certain property, plant and equipment in terms of financial leases and suspensive sale agreements ZAR 5,0 – 10,0 – 127
Unsecured loans ZAR 5,0 – 11,3 2012 – 2018 4 619 209 3 869 163
Floorplan creditors secured by pledge of inventories ZAR 7,25 – 9,0 2012 519 355 560 035
Borrowings of foreign subsidiaries 2 700 748 2 339 228
Loans secured by mortgage bonds over fixed property GBP 4.5 2015 18 682 –
PLN 6,4 – 6,5 2013 – 2016 17 290 21 282
Loans secured by lien over certain property, plant and equipment in terms of financial leases and suspensive sale agreements GBP 5,0 – 8,0 2013 – 2014 14 511 24 756
PLN 5,2 2014 – 2015 14 676 14 739
EUR 3,7 – 5,0 2012 – 2017 11 084 616
Other 3,5 – 17,8 2011 – 2014 1 050 328
Unsecured loans GBP 4,5 2015 548 296 –
EUR 2,5 – 3,6 2013 – 2016 19 511 13 062
USD 1,5 – 1,7 2011 74 307 196 434
HKD 1,2 – 2,0 2011 – 2013 592 569 551 083
SGD 1,3 – 1,38 2011 524 743 479 659
CZK 3,5 – 4,5 2011 – 2015 861 122 974 023
Other 4,7% 2012 2 907 63 246
Total interest-bearing borrowings 7 839 312 6 768 553
The expected maturity dates are not expected to differ from the contractual maturity dates.
Refer note 36 for further disclosure.

181
AUDITED FINANCIAL STATEMENTS
THE BIDVEST GROUP LIMITED / ANNUAL INTEGRATED REPORT 2011
2011 R’000
2010 R’000
29. Post-retirement obligations
Defined benefit pension surplus (111 692) (129 850)
Post-retirement obligations 381 332 394 527
Post-retirement medical aid obligations 163 861 174 465
Unfunded defined benefit early retirement plan 217 471 220 062
269 640 264 677
Pension and provident fundsThe Group provides retirement benefits for its permanent employees through pension funds with defined benefit and defined contribution categories and defined contribution provident funds or appropriate industry funds.
There are also a number of small funds within various employers of the Group. All funds are administered independently of the Group and are subject to the relevant pension fund legislation.
Employer contributions are set out in note 2.
Summarised details of the defined benefit funds
Number of members at June 30 986 1 020
R’000 R’000
Employer contribution 3 524 5 036
Employee contribution 1 005 1 041
Total pension fund asset (unfunded pension liability)
Actuarial present value of defined benefit obligations (471 499) (444 957)
Fair value of plan assets 714 098 709 702
Surplus in the plans 242 599 264 745
Unrecognised actuarial gains (89 589) (54 266)
Surplus in the plans not recognised due to the uncertainties relating to the apportionment of these surpluses (41 318) (71 754)
Reversal of previous limitation of surplus to the extent it has been allocated to the employer – (8 875)
111 692 129 850
Movement in the liability for defined benefit obligations
Balance at beginning of year (444 957) (468 574)
Benefits paid by plans 52 992 52 107
Current service costs (9 016) (8 868)
Interest (33 978) (38 506)
Member contributions (1 005) (1 041)
Actuarial gains (losses) (24 318) 7 601
Past service costs (19 377) –
Exchange rate adjustments on foreign plans 8 160 12 324
Balance at end of year (471 499) (444 957)

PASSION/VITALITY/PRECISION
182
Notes to the consolidated financial statementsfor the year ended June 30
2011 R’000
2010 R’000
29. Post-retirement obligations (continued)
Pension and provident funds (continued)
Movement in the plans’ assets
Balance at beginning of year 709 702 668 804
Contributions paid into the plans 4 529 6 077
Benefits paid by the plans (52 992) (52 107)
Expected return on plans’ assets 61 123 57 485
Actuarial gains 2 054 44 628
Exchange rate adjustments on foreign plans (10 318) (15 185)
Balance at end of year 714 098 709 702
The plans’ assets comprise
Cash 133 004 131 216
Equity securities 330 197 266 879
Bonds 204 643 232 847
Property 10 297 23 655
Other 35 957 55 105
714 098 709 702
Amounts recognised in income statement
Current service costs 9 016 8 868
Interest on obligations 33 978 38 506
Expected return on plans’ assets (61 123) (57 485)
Net actuarial (gains) losses recognised in current year 31 377 (45 977)
Net amounts not recognised in income statement or statement of financial position of the Group due to the uncertainties relating to the apportionment of the pension fund surpluses 9 666 25 791
22 914 (30 297)
Actual return on plan assets 59 973 (24 610)
Key actuarial assumptions % %
Expected rate of return on plan assets 5,8 – 9,8 5,8 – 9,8
Discount rate 2,6 – 9,3 2,5 – 9,3
Inflation rate 2,5 – 6,1 2,5 – 6,1
Salary increase rate 4,0 – 6,8 4,0 – 6,8
Pension increase allowance 3,6 – 5,0 3,6 – 5,0
Date of valuation June 30 2011 June 30 2010
Assumptions regarding future mortality are based on published statistics and mortality tables.
The expected long-term rate of return is based on the expected rate of returns on the individual asset categories. The return is based exclusively on historical returns, without adjustments.

183
AUDITED FINANCIAL STATEMENTS
THE BIDVEST GROUP LIMITED / ANNUAL INTEGRATED REPORT 2011
2011R’000
2010R’000
2009R’000
2008R’000
2007R’000
29. Post-retirement obligations (continued)
Pension and provident funds (continued)
The Group expects to pay R7,3 million (2010: R10,1 million) in contributions to defined benefit plans in the year ending June 30 2012.Historical information Actuarial present value of the defined benefit obligations (471 499) (444 957) (468 574) (474 008) (419 090) Fair value of plans’ assets 714 098 709 702 668 804 728 892 653 920 Surpluses in the plans 242 599 264 745 200 230 254 884 234 830 Experience adjustments arising on plans’ liabilities – losses (gains) (24 318) 7 601 4 763 (44 057) 11 606 Experience adjustments arising on plans’ assets – losses (gains) 2 054 44 628 (98 448) 41 789 57 838
2011R’000
2010R’000
Post-retirement medical aid obligations
The Group provides post-retirement medical benefit subsidies to certain retired employees and is responsible for the provision of post-retirement medical benefit subsidies to a limited number of current employees.
Provision for post-retirement medical aid obligations
Opening provision raised against unfunded obligation 174 465 182 884
Expense recognised in income statement (997) 292
Payments charged against provisions (9 607) (8 711)
Closing provision raised against unfunded obligation 163 861 174 465
Actuarially determined present value of total obligation using projected unit credit valuation method 163 861 174 465
Key actuarial assumptions % %
Discount rate 8,8 9,3
Inflation rate (CPI) 5,8 5,5
Healthcare cost inflation 7,9 8,0
A change in the medical inflation rates will not have a significant impact on the post-retirement medical aid costs and relating obligations.
2011R’000
2010R’000
2009R’000
2008R’000
2007R’000
Historical information
Present value of the unfunded obligations (163 861) (174 465) (182 884) (174 649) (160 663) Experience adjustments arising on plans’ liabilities – losses (gains) (18 686) 1 816 148 (392) (21 059)
Unfunded defined benefit early retirement plan
A subsidiary provides an early retirement plan for its employees. The liability recognised is based on the actuarial valuation performed as at June 30.
2011 2010
Number of members June 30 555 539
R’000 R’000
Total unfunded pension liability
Actuarial present value of defined benefit obligations 182 450 177 190
Unrecognised actuarial gains 35 021 42 872
217 471 220 062

PASSION/VITALITY/PRECISION
184
Notes to the consolidated financial statementsfor the year ended June 30
2011 R’000
2010 R’000
29. Post-retirement obligations (continued)
Unfunded defined benefit early retirement plan (continued)
Movement in the liability for unfunded defined benefit early retirement plan
Balance at beginning of year 177 190 210 715
Benefits paid by employer (22 821) (30 060)
Current service costs 4 859 5 383
Interest 7 948 13 001
Actuarial gains (losses) 6 276 10 543
Exchange rate adjustments on foreign plans 8 998 (32 392)
Balance at end of year 182 450 177 190
Amounts recognised in income statement
Current service costs 4 859 5 383
Interest on obligations 7 948 13 001
Net actuarial gains recognised in current year (26 680) (35 351)
(13 873) (16 967)
Key actuarial assumptions % %
Discount rate 4,0 4,6
Salary increase rate 1,5 2,0
Date of valuation June 30 2011 June 30 2010
2011R’000
2010R’000
2009R’000
2008R’000
2007R’000
Historical informationPresent value of the unfunded obligations (182 450) (177 190) (210 715) (261 127) (183 557)
Experience adjustments arising on plans’ liabilities – gains (6 276) (10 543) (35 940) 3 283 (29 870)
2011R’000
2010 R’000
30. Banking liabilities
Call deposits 754 304 649 897
Fixed and notice deposits 521 593 430 469
1 275 897 1 080 366
All banking liabilities mature within one year
Effective rates of interest % %
Call deposits 2,5 3,6
Fixed and notice deposits 6,6 7,3
Banking liabilities other than fixed and notice deposits are at floating interest rates.
Refer note 36 for further disclosure.

185
AUDITED FINANCIAL STATEMENTS
THE BIDVEST GROUP LIMITED / ANNUAL INTEGRATED REPORT 2011
2011 R’000
2010 R’000
31. Operating leases
The Group has entered into various operating lease agreements in respect of premises.
Leases which have fixed determinable escalations are charged to the income statement on a straight-line basis and liabilities are raised for the difference between the actual lease expense and the charge recognised in the income statement. The liabilities are classified based on the timing of the reversal which will occur when the actual cash flow exceeds the income statement amounts.
Operating lease liabilities 235 619 225 787
Less short-term portion included in trade and other payables (53 188) (27 587)
Long-term portion 182 431 198 200
Operating lease commitments
Land and buildings 7 172 951 7 183 619
Due in one year 1 009 424 884 116
Due after one year but within five years 2 762 136 2 598 564
Due after five years 3 401 391 3 700 939
Equipment and vehicles 393 960 224 311
Due in one year 155 413 61 402
Due after one year but within five years 221 556 162 909
Due after five years 16 991 –
7 566 911 7 407 930
Less: Amounts raised as liabilities (235 619) (225 787)
7 331 292 7 182 143
32. Trade and other payables
Trade payables 11 540 396 10 626 644
Non-interest bearing floorplan creditors 628 924 406 300
Forward exchange contracts liability 7 239 8 666
Other payables and accrued expenses 4 635 928 3 990 747
16 812 487 15 032 357
The majority of trade and other payables are fixed in the subsidiaries’ local currency. Since trade and other payables have limited exposure to exchange rate fluctuations, a currency analysis has not been included.
Refer note 36 for further disclosure.

PASSION/VITALITY/PRECISION
186
Notes to the consolidated financial statementsfor the year ended June 30
2011 R’000
2010 R’000
33. Provisions
Short-term portion 237 471 251 635
Long-term portion 272 400 235 253
509 871 486 888
Onerous contracts
R’000
Insurance liabilities
R’000
Dismantling and site
restorationR’000
Customerloyalty
programmeR’000
OtherR’000
TotalR’000
Balance at June 30 2009 134 964 201 978 131 482 22 015 25 613 516 052
Created 39 597 93 470 4 893 26 434 185 292 349 686
Utilised (75 085) (105 085) (13 103) (17 907) (145 236) (356 416)
Net acquisition of businesses – – 541 – 247 788
Exchange rate adjustments (10 942) – (11 629) 545 (1 196) (23 222)
Balance at June 30 2010 88 534 190 363 112 184 31 087 64 720 486 888
Created 59 537 126 062 20 112 26 320 101 652 333 683
Utilised (58 757) (104 547) (606) (23 625) (123 496) (311 031)
Net acquisition of businesses 213 – 16 015 – (15 087) 1 141
Exchange rate adjustments (1 362) – (2 467) 3 429 (410) (810)
Balance at June 30 2011 88 165 211 878 145 238 37 211 27 379 509 871
Onerous contractsOnerous contracts are identified through regular reviews of the terms and conditions of contracts as well as on acquisition of businesses. A provision for onerous contracts is calculated as the present value of the portion which management deem to be onerous in light of the current market conditions, discounted using market-related rates. An annual expense is recognised over the life of the contracts.
Insurance liabilitiesInsurance liabilities include unearned premiums that represent that part of the current year’s premiums that relate to risk periods that extend to the following year; claims are calculated on the settlement amount outstanding at year-end; and claims incurred but not reported are maintained at 7% of net premium income, for claims arising from events that occurred before the close of the accounting period, but which had not been reported to the Group by that date.
Provision for cost of dismantling and restoration of siteA provision is raised for the estimated costs of dismantling and removing items and restoring the site on which they are located. The change in the liability arising as a result of unwinding the discount is recognised in the income statement as a finance charge. The dismantling of the plant and recommissioning of buildings is expected to coincide with the end of the useful life of the plant and lease periods.
Customer loyalty programmeThis is a customer loyalty programme introduced by certain operations within the Group, whereby customers can earn points for redemption in the form of gift certificates and products of the operations. The provision is calculated based on the points outstanding at year-end.
OtherConsists of various individually insignificant provisions.

187
AUDITED FINANCIAL STATEMENTS
THE BIDVEST GROUP LIMITED / ANNUAL INTEGRATED REPORT 2011
2011 R’000
2010 R’000
34. Commitments
Capital expenditure approved
Contracted for 756 368 506 384
Not contracted for 388 383 247 226
1 144 751 753 610
Capital expenditure amounting to R1 066,9 million (2009: R673,8 million) is in respect of property, plant and equipment and the remaining balance is in respect of computer software.
It is anticipated that capital expenditure will be financed out of existing cash resources.
35. Contingent liabilities
Guarantees issued in respect of obligations of associates and investments 56 000 117 295
The Group has outstanding legal and other claims arising out of its normal ongoing operating activities which have to be resolved. None of these claims is significant.
Refer note 36 for further disclosure in respect of guarantees.
36. Financial instruments
36.1 Risk management overview
The Group has exposure to the following risks from its use of financial instruments: credit risk; liquidity risk; interest rate risk; foreign currency risk and market price risk.
This note presents information about the Group’s exposure to each of the aforementioned risks, the Group’s objectives, policies and processes for measuring and managing risk, and the Group’s management of capital. IFRS 7 requires certain disclosures by class of instrument. The Group has determined that its classes of instruments would be the segments as disclosed in the segmental report.
The Group’s major financial risks are mitigated in the way that it operates firstly through diversification of industry and geography and secondly through decentralisation. Bidvest is an international group with operations in South Africa, United Kingdom, Europe, the Far East, Australia, New Zealand, Namibia and various other southern African countries. The Group also comprises a variety of businesses within the services, trading and distribution industries. As a result of this diversification in terms of industry and geographical location, the Group is exposed to a range of financial risks, each managed in appropriate ways. However, the impact of any one particular financial risk within any of these geographies or industries, is not considered to be material to the Group.
The Group’s philosophy has always been to empower management through a decentralised structure thereby making them responsible for the management and performance of their operations, including managing the financial risks of the operation. The operational management report to divisional management who in turn report to the Group’s board of directors. The divisional management are also held responsible for managing financial risks of the operations within the divisions. Operational management’s remuneration is based on their operation’s performance and divisional management based on their division’s performance resulting in a decentralised and entrepreneurial environment.
Due to the diverse structure and decentralised management of the Group, the Group risk management committee (“the Group risk committee”) has implemented guidelines of acceptable practices and basic procedures to be followed by divisional and operational management. The information provided below for each financial risk has been collated for disclosure based on the manner in which the business is managed and what is believed to be useful information for shareholders.
The total process of risk management in the Bidvest Group, which includes the related system of control, is the responsibility of the board of directors. The Group risk committee has been constituted as a sub-committee of the group board of directors in the discharge of its duties and responsibilities in this regard. The risk committee has a charter and reports regularly to the board of directors on its activities.

PASSION/VITALITY/PRECISION
188
Notes to the consolidated financial statementsfor the year ended June 30
36. Financial instruments (continued)
36.1 Risk management overview (continued)
The primary purposes of the Group risk committee are to:– establish and maintain a common understanding of the risk universe (framework), which needs to be addressed in order to meet
Bidvest Corporate objectives;– identify the risk profile and agree the risk appetite of the Group;– satisfy the risk management reporting requirements;– coordinate the Group’s risk management and assurance efforts;– report to the board of directors on the risk management work undertaken and the extent of any action taken by management to
address areas identified for improvement; and– report to the board of directors on the company’s process for monitoring compliance with laws and regulations.
The Group risk committee has documented a formal policy framework in order to achieve the following:– place accountability on management for designing, implementing and monitoring the process of risk management;– place responsibility on management for integrating the risk management process into the day-to-day activities and operations of
the Group; and– ensure that the risk strategy is communicated to all stakeholders so that it may be incorporated into the culture of the Group.
The Group has operations trading in the banking, short-term insurance and life assurance industries (included in the financial services segment). These operations are exposed to financial risks which are unique to these industries and differ significantly to the remainder of the Group’s operations operating within the services, trading and distribution sectors. While the financial risks to which these particular operations are exposed could have a significant effect on the individual operations, they would not have a significant impact on the Group. For this reason, the information provided below mainly provides qualitative and quantitative information regarding the management and exposure to financial risks to which the trading operations of the Group are exposed, based on what is believed to be useful to shareholders. Bidvest Bank Limited is a public company for which financial statements are prepared including detailed disclosure in accordance with the requirements of IFRS 7.
The Bidvest Group has, due to the diversity of its operations in nature and geography, determined that it would be better to develop an in-house strategy, as opposed to adopting a recognised strategy and forcing its operations to adapt to the constraints of the strategy selected. The Group has determined that utilising a common framework for the identification of risk would assist the divisions to reduce the implementation time and cost and would give some assurance that all inherent risks have been considered. The Group’s risk management policies are established to identify and analyse the risks faced by the Group, to set appropriate risk limits and controls, and to monitor risks and adherence to limits. Risk management policies and systems are reviewed regularly to reflect changes in market conditions and Group activities. The Group, through its training and management standards and procedures, aims to develop a disciplined and constructive control environment in which all employees understand their roles and responsibilities.
To assist the Group risk committee in discharging its responsibilities, it has:– assigned risk management responsibilities to divisional/operational risk committees; and– determined that each division should appoint risk/compliance officers on a divisional (operational) level as nominated by the
divisional risk committees. The role of the risk officer is to develop, communicate, coordinate and monitor the enterprise-wide risk management.
Through the divisional risk committees, each division has a forum for the discussion and identification of risks relevant to the particular division. Only risk matters that affect the Group as a whole are escalated to the Group risk committee. The minutes of the divisional risk committees are submitted to the Group risk committee. The Group risk manager is authorised to attend the divisional risk committee meetings, or the segment of the divisional audit committee dealing with risk management if a separate committee has not been established, and to provide guidance to and coordinate the efforts of these committees in providing the Group adequate risk management.
Each division has its own audit committee, which subscribes to the same Group audit committee philosophy and practice. The divisional audit committees report to both the divisional board and the Group audit committee. The Group audit committee reviews the divisional audit committee reports. The divisional audit committees oversee how divisional management monitors compliance with the Group’s policies and guidelines in respect of the financial reporting process, the system of internal control, the management of financial risks, the audit process (both internal and external) and code of business conduct. The divisional audit committees are assisted in their oversight role by the Group’s internal audit department. Divisional internal audit undertakes both regular and ad hoc reviews of financial and operational risk management controls and procedures, the results of which are reported to the divisional audit committee.
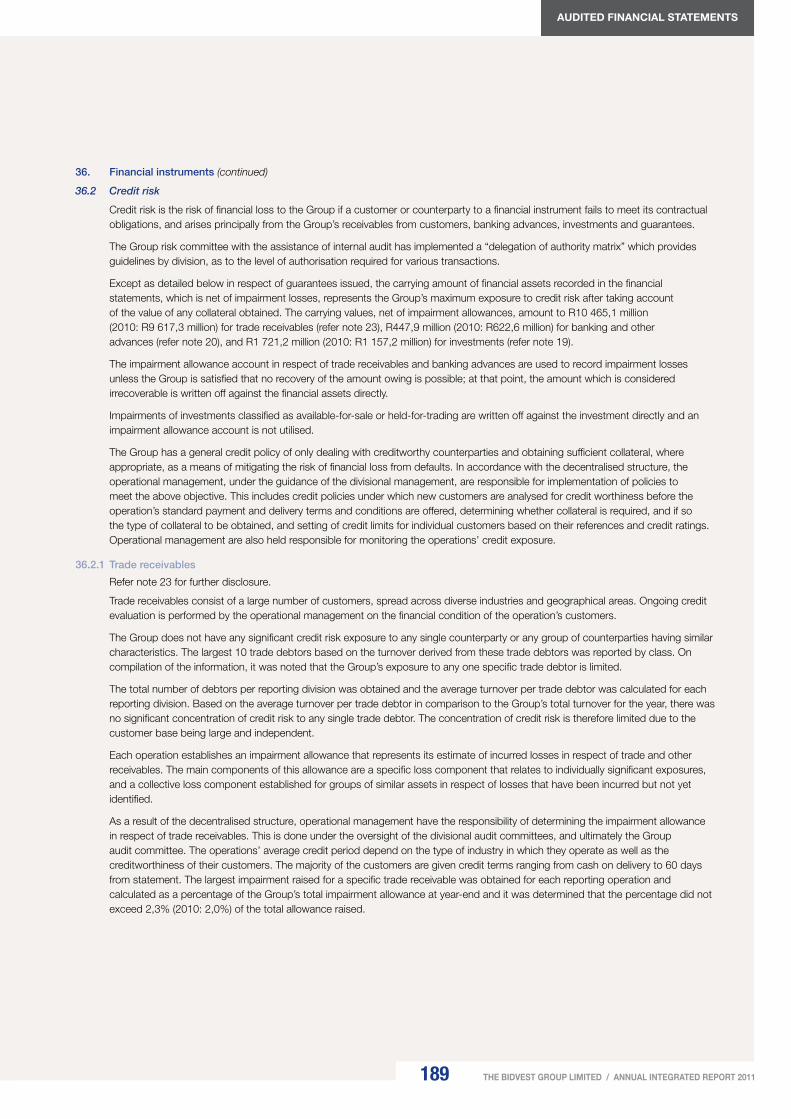
189
AUDITED FINANCIAL STATEMENTS
THE BIDVEST GROUP LIMITED / ANNUAL INTEGRATED REPORT 2011
36. Financial instruments (continued)
36.2 Credit risk
Credit risk is the risk of financial loss to the Group if a customer or counterparty to a financial instrument fails to meet its contractual obligations, and arises principally from the Group’s receivables from customers, banking advances, investments and guarantees.
The Group risk committee with the assistance of internal audit has implemented a “delegation of authority matrix” which provides guidelines by division, as to the level of authorisation required for various transactions.
Except as detailed below in respect of guarantees issued, the carrying amount of financial assets recorded in the financial statements, which is net of impairment losses, represents the Group’s maximum exposure to credit risk after taking account of the value of any collateral obtained. The carrying values, net of impairment allowances, amount to R10 465,1 million (2010: R9 617,3 million) for trade receivables (refer note 23), R447,9 million (2010: R622,6 million) for banking and other advances (refer note 20), and R1 721,2 million (2010: R1 157,2 million) for investments (refer note 19).
The impairment allowance account in respect of trade receivables and banking advances are used to record impairment losses unless the Group is satisfied that no recovery of the amount owing is possible; at that point, the amount which is considered irrecoverable is written off against the financial assets directly.
Impairments of investments classified as available-for-sale or held-for-trading are written off against the investment directly and an impairment allowance account is not utilised.
The Group has a general credit policy of only dealing with creditworthy counterparties and obtaining sufficient collateral, where appropriate, as a means of mitigating the risk of financial loss from defaults. In accordance with the decentralised structure, the operational management, under the guidance of the divisional management, are responsible for implementation of policies to meet the above objective. This includes credit policies under which new customers are analysed for credit worthiness before the operation’s standard payment and delivery terms and conditions are offered, determining whether collateral is required, and if so the type of collateral to be obtained, and setting of credit limits for individual customers based on their references and credit ratings. Operational management are also held responsible for monitoring the operations’ credit exposure.
36.2.1 Trade receivables
Refer note 23 for further disclosure.
Trade receivables consist of a large number of customers, spread across diverse industries and geographical areas. Ongoing credit evaluation is performed by the operational management on the financial condition of the operation’s customers.
The Group does not have any significant credit risk exposure to any single counterparty or any group of counterparties having similar characteristics. The largest 10 trade debtors based on the turnover derived from these trade debtors was reported by class. On compilation of the information, it was noted that the Group’s exposure to any one specific trade debtor is limited.
The total number of debtors per reporting division was obtained and the average turnover per trade debtor was calculated for each reporting division. Based on the average turnover per trade debtor in comparison to the Group’s total turnover for the year, there was no significant concentration of credit risk to any single trade debtor. The concentration of credit risk is therefore limited due to the customer base being large and independent.
Each operation establishes an impairment allowance that represents its estimate of incurred losses in respect of trade and other receivables. The main components of this allowance are a specific loss component that relates to individually significant exposures, and a collective loss component established for groups of similar assets in respect of losses that have been incurred but not yet identified.
As a result of the decentralised structure, operational management have the responsibility of determining the impairment allowance in respect of trade receivables. This is done under the oversight of the divisional audit committees, and ultimately the Group audit committee. The operations’ average credit period depend on the type of industry in which they operate as well as the creditworthiness of their customers. The majority of the customers are given credit terms ranging from cash on delivery to 60 days from statement. The largest impairment raised for a specific trade receivable was obtained for each reporting operation and calculated as a percentage of the Group’s total impairment allowance at year-end and it was determined that the percentage did not exceed 2,3% (2010: 2,0%) of the total allowance raised.

PASSION/VITALITY/PRECISION
190
Notes to the consolidated financial statementsfor the year ended June 30
2010 R’000
2009 R’000
36. Financial instruments (continued)
36.2 Credit risk (continued)
36.2.1 Trade receivables (continued)
Movement in impairment allowance in respect of trade receivables
Balance at July 1 426 848 389 935
Allowance raised during the year 251 968 242 413
Bidvest South Africa
Automotive 22 208 24 557
Electrical 12 210 34 928
Financial Services 32 434 12 399
Freight 4 160 22 458
Industrial 7 046 6 730
Office Products 9 009 5 674
Paper Plus 7 209 8 429
Rental and Products 5 070 8 797
Services 12 644 6 958
Travel and Aviation 22 800 6 519
Bidvest Foodservice
Asia Pacific 47 234 37 981
Europe 21 791 44 278
Southern Africa 15 969 16 357
Bidvest Namibia 7 162 4 083
Bidvest Corporate 25 022 2 265
Allowance utilised during the year (137 516) (142 567)
Bidvest South Africa
Automotive (3 210) (6 955)
Electrical (13 889) (18 240)
Financial Services (20 478) (1 498)
Freight (2 705) (2 314)
Industrial (668) (119)
Office Products (4 112) (3 427)
Paper Plus (3 156) (6 048)
Rental and Products (2 894) (5 094)
Services (3 408) (373)
Travel and Aviation (718) –
Bidvest Foodservice
Asia Pacific (24 126) (22 328)
Europe (47 059) (53 303)
Southern Africa (7 460) (20 000)
Bidvest Namibia (1 028) (1 913)
Bidvest Corporate (2 605) (955)
Balance carried forward 541 300 489 781
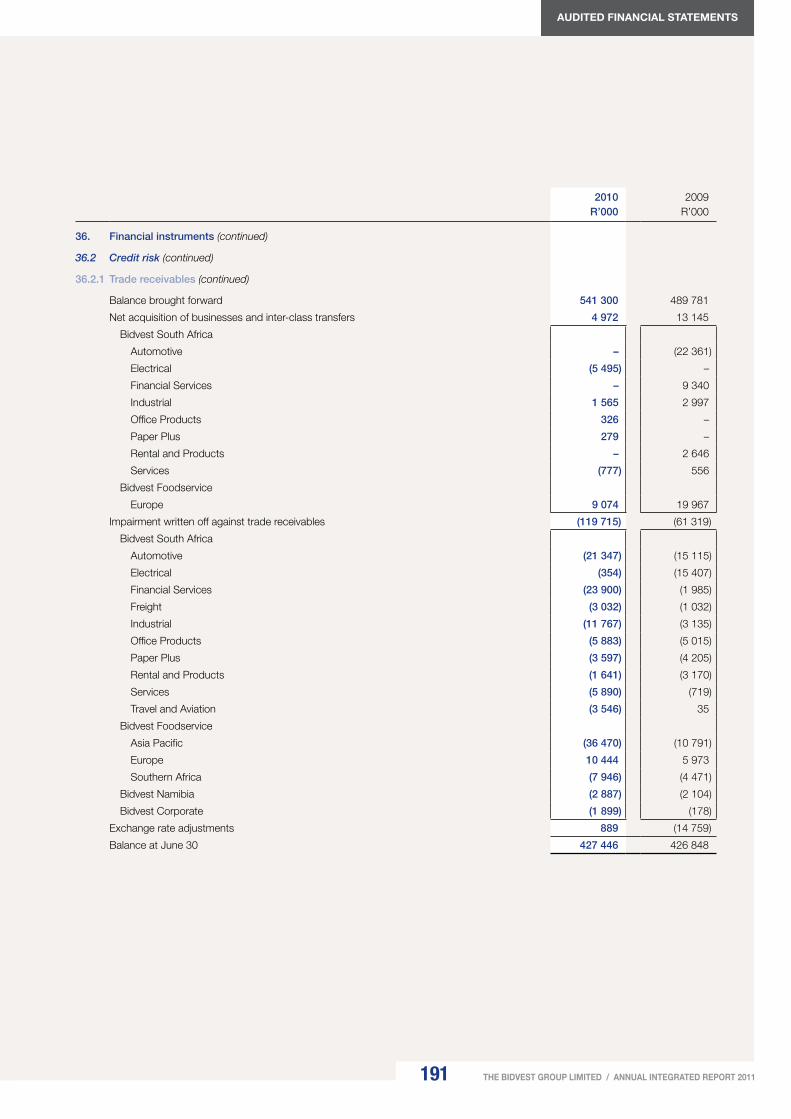
191
AUDITED FINANCIAL STATEMENTS
THE BIDVEST GROUP LIMITED / ANNUAL INTEGRATED REPORT 2011
2010 R’000
2009 R’000
36. Financial instruments (continued)
36.2 Credit risk (continued)
36.2.1 Trade receivables (continued)
Balance brought forward 541 300 489 781
Net acquisition of businesses and inter-class transfers 4 972 13 145
Bidvest South Africa
Automotive – (22 361)
Electrical (5 495) –
Financial Services – 9 340
Industrial 1 565 2 997
Office Products 326 –
Paper Plus 279 –
Rental and Products – 2 646
Services (777) 556
Bidvest Foodservice
Europe 9 074 19 967
Impairment written off against trade receivables (119 715) (61 319)
Bidvest South Africa
Automotive (21 347) (15 115)
Electrical (354) (15 407)
Financial Services (23 900) (1 985)
Freight (3 032) (1 032)
Industrial (11 767) (3 135)
Office Products (5 883) (5 015)
Paper Plus (3 597) (4 205)
Rental and Products (1 641) (3 170)
Services (5 890) (719)
Travel and Aviation (3 546) 35
Bidvest Foodservice
Asia Pacific (36 470) (10 791)
Europe 10 444 5 973
Southern Africa (7 946) (4 471)
Bidvest Namibia (2 887) (2 104)
Bidvest Corporate (1 899) (178)
Exchange rate adjustments 889 (14 759)
Balance at June 30 427 446 426 848

PASSION/VITALITY/PRECISION
192
Notes to the consolidated financial statementsfor the year ended June 30
36. Financial instruments (continued)
36.2 Credit risk (continued)
36.2.1 Trade receivables (continued)
Ageing of trade receivables at June 30
2011 2010Gross tradereceivables
R’000
Impairmentallowance
R’000
Net tradereceivables
R’000
Gross tradereceivables
R’000
Impairmentallowance
R’000
Net tradereceivables
R’000
Not past due 8 421 922 (31 758) 8 390 164 7 489 164 (24 724) 7 464 440
Bidvest South Africa
Automotive 165 328 (6 879) 158 449 227 970 (5 837) 222 133
Electrical 458 464 (3) 458 461 595 033 – 595 033
Financial Services 44 900 (2 557) 42 343 42 469 (56) 42 413
Freight 1 233 170 (11 668) 1 221 502 1 078 209 (713) 1 077 496
Industrial 148 777 (53) 148 724 110 404 (2 010) 108 394
Office Products 331 491 – 331 491 336 586 (224) 336 362
Paper Plus 288 864 (11) 288 853 265 710 – 265 710
Rental and Products 106 769 (187) 106 582 115 182 (86) 115 096
Services 139 828 (410) 139 418 163 477 (4 561) 158 916
Travel and Aviation 194 525 – 194 525 232 052 – 232 052
Bidvest Foodservice
Asia Pacific 1 808 378 (5 108) 1 803 270 1 154 697 (4 484) 1 150 213
Europe 2 783 645 (3 819) 2 779 826 2 407 262 (6 539) 2 400 723
Southern Africa 571 061 (1 053) 570 008 602 103 (168) 601 935
Bidvest Namibia 110 082 (8) 110 074 122 590 (46) 122 544
Bidvest Corporate 36 640 (2) 36 638 35 420 – 35 420
Past due
0 – 30 days 1 479 919 (20 937) 1 458 982 1 496 615 (29 061) 1 467 554
Bidvest South Africa
Automotive 153 053 (2 904) 150 149 67 245 (6 991) 60 254
Electrical 194 736 – 194 736 49 960 (143) 49 817
Financial Services 8 883 (6) 8 877 6 928 (2 198) 4 730
Freight 71 996 (6 525) 65 471 70 475 (9 821) 60 654
Industrial 17 463 (1 429) 16 034 34 887 (1 309) 33 578
Office Products 90 760 (1 831) 88 929 87 028 (499) 86 529
Paper Plus 102 621 (322) 102 299 109 700 – 109 700
Rental and Products 32 441 (228) 32 213 28 144 (48) 28 096
Services 99 780 (16) 99 764 105 959 (128) 105 831
Travel and Aviation 181 512 (33) 181 479 158 924 (1 039) 157 885
Bidvest Foodservice
Asia Pacific 214 064 (4 221) 209 843 507 544 (5 199) 502 345
Europe 200 391 (1 707) 198 684 186 716 (753) 185 963
Southern Africa 61 551 (56) 61 495 46 008 (230) 45 778
Bidvest Namibia 29 804 (1 659) 28 145 19 015 (703) 18 312
Bidvest Corporate 20 864 – 20 864 18 082 – 18 082
Balance carried forward 9 901 841 (52 695) 9 849 146 8 985 779 (53 785) 8 931 994

193
AUDITED FINANCIAL STATEMENTS
THE BIDVEST GROUP LIMITED / ANNUAL INTEGRATED REPORT 2011
36. Financial instruments (continued)
36.2 Credit risk (continued)
36.2.1 Trade receivables (continued)
Ageing of trade receivables at June 30
2011 2010Gross tradereceivables
R’000
Impairmentallowance
R’000
Net tradereceivables
R’000
Gross tradereceivables
R’000
Impairmentallowance
R’000
Net tradereceivables
R’000
Balance brought forward 9 901 841 (52 695) 9 849 146 8 985 779 (53 785) 8 931 994
31 – 180 days 744 155 (165 630) 578 525 758 648 (196 565) 562 083
Bidvest South Africa
Automotive 30 301 (11 466) 18 835 25 769 (8 514) 17 255
Electrical 200 390 (5 027) 195 363 147 479 (24 543) 122 936
Financial Services 18 438 (3 750) 14 688 22 585 (16 002) 6 583
Freight 32 227 (3 548) 28 679 31 309 (6 526) 24 783
Industrial 13 584 (1 759) 11 825 15 720 (2 336) 13 384
Office Products 24 865 (8 030) 16 835 29 302 (7 930) 21 372
Paper Plus 31 226 (6 025) 25 201 23 790 (6 063) 17 727
Rental and Products 15 972 (6 127) 9 845 11 759 (6 047) 5 712
Services 32 963 (9 182) 23 781 27 515 (3 320) 24 195
Travel and Aviation 40 954 (952) 40 002 44 809 (2 824) 41 985
Bidvest Foodservice
Asia Pacific 104 415 (26 313) 78 102 213 394 (40 192) 173 202
Europe 72 150 (27 366) 44 784 75 312 (39 497) 35 815
Southern Africa 66 681 (27 303) 39 378 54 352 (24 994) 29 358
Bidvest Namibia 23 741 (5 612) 18 129 10 377 (4 849) 5 528
Bidvest Corporate 36 248 (23 170) 13 078 25 176 (2 928) 22 248
181 + days 261 043 (209 121) 51 922 299 751 (176 498) 123 253
Bidvest South Africa
Automotive 1 783 (959) 824 5 119 (3 215) 1 904
Electrical 37 085 (32 116) 4 969 55 798 (20 068) 35 730
Freight 33 275 (23 179) 10 096 43 141 (31 510) 11 631
Industrial 667 (586) 81 6 644 (1 995) 4 649
Office Products 8 662 (3 853) 4 809 15 958 (5 719) 10 239
Paper Plus 1 287 (563) 724 128 (124) 4
Rental and Products 1 167 (561) 606 1 694 (394) 1 300
Services 10 735 (3 765) 6 970 8 961 (2 796) 6 165
Travel and Aviation 35 307 (27 178) 8 129 35 010 (5 805) 29 205
Bidvest Foodservice
Asia Pacific 46 234 (39 109) 7 125 50 939 (36 170) 14 769
Europe 76 855 (71 633) 5 222 67 903 (62 398) 5 505
Southern Africa 1 758 (799) 959 3 662 (3 263) 399
Bidvest Namibia 4 850 (4 278) 572 4 099 (2 715) 1 384
Bidvest Corporate 1 378 (542) 836 695 (326) 369
Total 10 907 039 (427 446) 10 479 593 10 044 178 (426 848) 9 617 330

PASSION/VITALITY/PRECISION
194
Notes to the consolidated financial statementsfor the year ended June 30
36. Financial instruments (continued)
36.2 Credit risk (continued)
36.2.1 Trade receivables (continued)
Collateral held on past due amounts
2011 2010
Fair value ofcollateral held
R’000
Tradereceivables
net ofimpairmentallowance
R’000
Fair value ofcollateral held
R’000
Tradereceivables
net ofimpairmentallowance
R’000
Personal surety * 56 670 * 63 712
Bidvest South Africa
Automotive 5 341 5 639
Electrical – 37 693
Freight 30 5 218
Industrial 882 182
Office Products 8 722 171
Bidvest Foodservice
Europe 29 977 12 963
Southern Africa 1 505 –
Bidvest Namibia 2 945 1 596
Bidvest Corporate 7 268 250
Cover by credit insurance 401 732 400 919 252 369 257 298
Bidvest South Africa
Electrical 276 281 275 468 150 037 154 966
Freight 5 129 5 129 5 564 5 564
Industrial 12 976 12 976 18 565 18 565
Office Products – – 11 11
Bidvest Foodservice
Asia Pacific 60 689 60 689 49 587 49 587
Europe 44 923 44 923 27 218 27 218
Southern Africa 1 705 1 705 1 387 1 387
Bidvest Namibia 29 29 – –
Pledge of assets 15 204 15 204 19 019 19 019
Bidvest South Africa
Automotive 452 452 403 403
Office Products 371 371 469 469
Travel and Aviation 13 187 13 187 16 226 16 226
Bidvest Foodservice
Southern Africa 1 194 1 194 1 921 1 921
Other 9 440 3 672 15 333 15 333
Bidvest South Africa
Automotive 9 440 3 672 13 599 13 599
Industrial – – 1 642 1 642
Bidvest Namibia – – 92 92
Total 426 376 476 465 286 721 355 362
* An accurate fair value cannot be attached to personal surety.
In certain instances the Group’s operations reserve the right to collect inventory sold when the outstanding debt is not settled by the customer. Where it is the business of the operation to finance assets, the assets are held as collateral in respect of the outstanding debt. The collateral detailed above is in addition to these aforementioned measures taken to reduce credit risk in respect of trade receivables.

195
AUDITED FINANCIAL STATEMENTS
THE BIDVEST GROUP LIMITED / ANNUAL INTEGRATED REPORT 2011
36. Financial instruments (continued)
36.2 Credit risk (continued)
36.2.2 Banking and other advances
Refer note 20 for further disclosure.
The impairment allowance account comprises a specific and general impairment allowance. Specific impairments are raised for doubtful advances, including amounts in respect of interest not being serviced and after taking security values into account, and are deducted from advances where the outstanding balance exceeds the value of the security held. A general impairment allowance based on historic experience is raised to cover doubtful advances, which may not be specifically identified at the statement of financial position date. The specific and general impairments made during the year are charged to the income statement.
Movement in impairment allowance in respect of banking and other advances
2011R’000
2010R’000
Financial Services
Balance at July 1 22 577 7 072
Allowance raised during the year 6 600 18 057
Allowance utilised during the year – (1 587)
Impairment written off against banking and other advances – (965)
Balance at June 30 29 177 22 577
Ageing of banking and other advances at June 30
2011 2010
Grossbanking
and otheradvances
R’000
Impairmentallowance
R’000
Netbanking
and otheradvances
R’000
Grossbanking
and otheradvances
R’000
Impairmentallowance
R’000
Netbanking
and otheradvances
R’000
Not past due 418 157 (3 290) 414 867 644 631 (22 478) 622 153
Past due 58 956 (25 887) 33 069 563 (99) 464
0 – 30 days 5 092 (1 799) 3 293 71 – 71
31 – 180 days 53 335 (23 705) 29 630 492 (99) 393
181 + days 529 (383) 146 – – –
Total 477 113 (29 177) 447 936 645 194 (22 577) 622 617
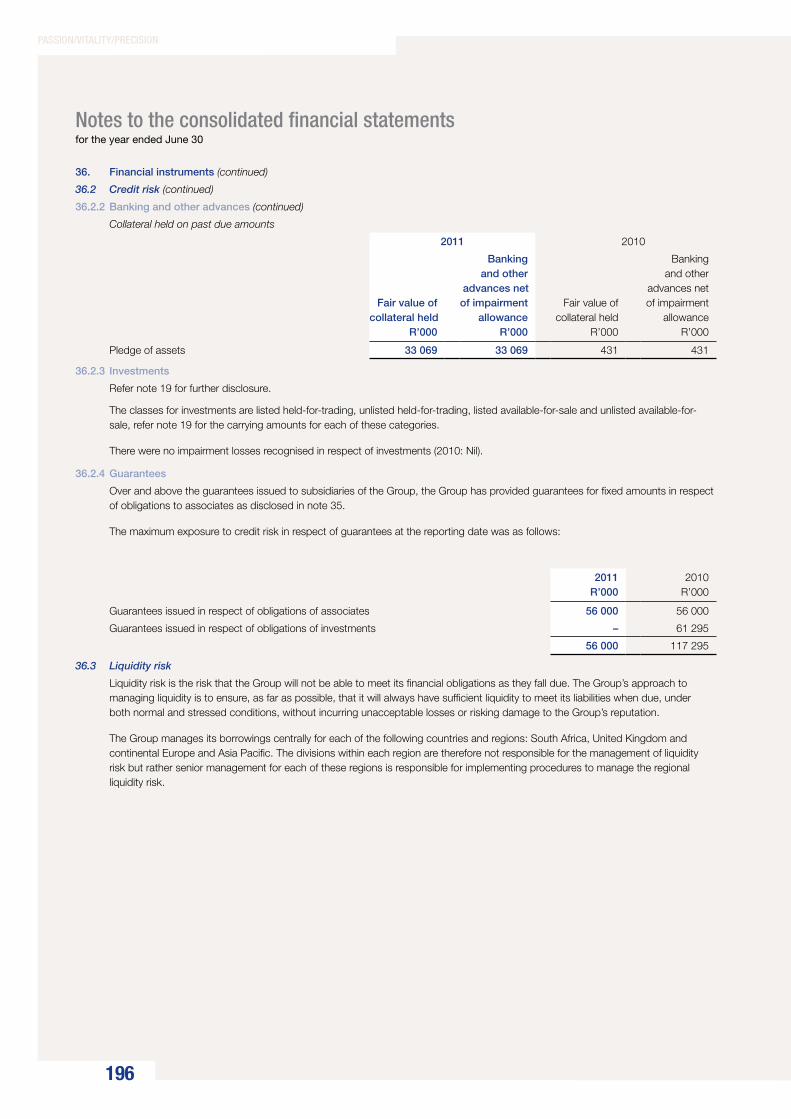
PASSION/VITALITY/PRECISION
196
Notes to the consolidated financial statementsfor the year ended June 30
36. Financial instruments (continued)
36.2 Credit risk (continued)
36.2.2 Banking and other advances (continued)
Collateral held on past due amounts
2011 2010
Fair value ofcollateral held
R’000
Bankingand other
advances netof impairment
allowanceR’000
Fair value ofcollateral held
R’000
Bankingand other
advances netof impairment
allowanceR’000
Pledge of assets 33 069 33 069 431 431
36.2.3 Investments
Refer note 19 for further disclosure.
The classes for investments are listed held-for-trading, unlisted held-for-trading, listed available-for-sale and unlisted available-for-sale, refer note 19 for the carrying amounts for each of these categories.
There were no impairment losses recognised in respect of investments (2010: Nil).
36.2.4 Guarantees
Over and above the guarantees issued to subsidiaries of the Group, the Group has provided guarantees for fixed amounts in respect of obligations to associates as disclosed in note 35.
The maximum exposure to credit risk in respect of guarantees at the reporting date was as follows:
2011R’000
2010R’000
Guarantees issued in respect of obligations of associates 56 000 56 000
Guarantees issued in respect of obligations of investments – 61 295
56 000 117 295
36.3 Liquidity risk
Liquidity risk is the risk that the Group will not be able to meet its financial obligations as they fall due. The Group’s approach to managing liquidity is to ensure, as far as possible, that it will always have sufficient liquidity to meet its liabilities when due, under both normal and stressed conditions, without incurring unacceptable losses or risking damage to the Group’s reputation.
The Group manages its borrowings centrally for each of the following countries and regions: South Africa, United Kingdom and continental Europe and Asia Pacific. The divisions within each region are therefore not responsible for the management of liquidity risk but rather senior management for each of these regions is responsible for implementing procedures to manage the regional liquidity risk.
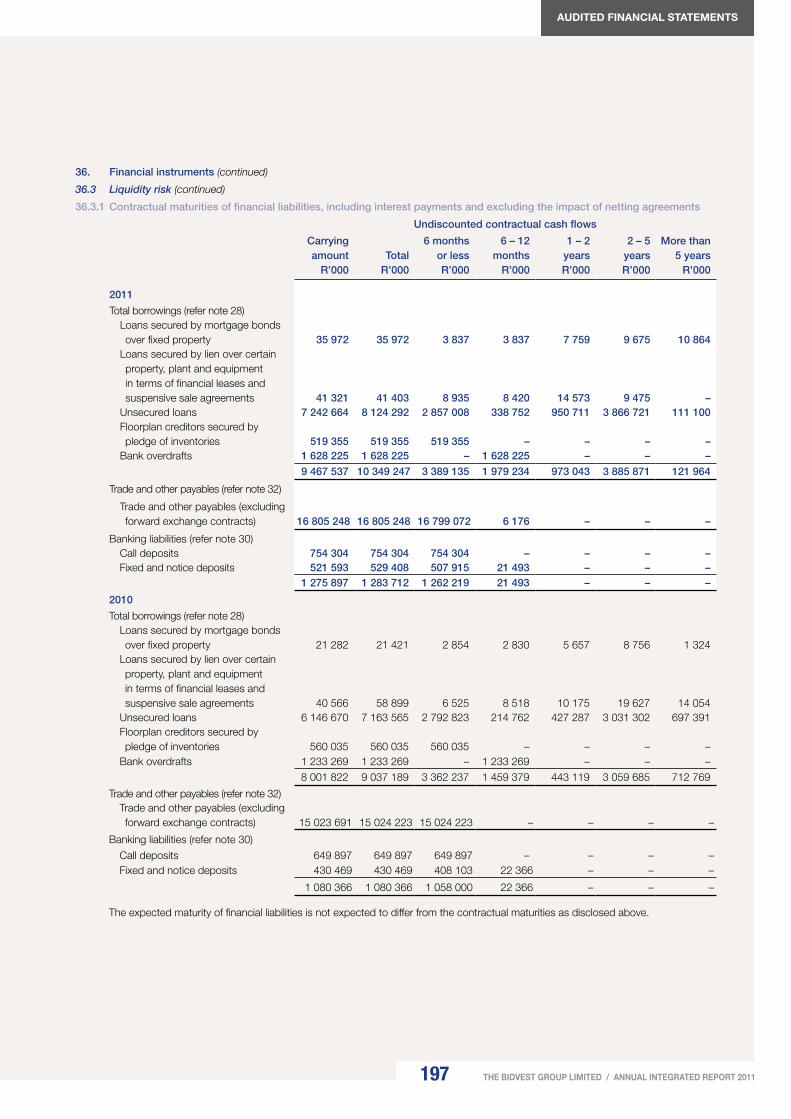
197
AUDITED FINANCIAL STATEMENTS
THE BIDVEST GROUP LIMITED / ANNUAL INTEGRATED REPORT 2011
36. Financial instruments (continued)
36.3 Liquidity risk (continued)
36.3.1 Contractual maturities of financial liabilities, including interest payments and excluding the impact of netting agreements
Undiscounted contractual cash flows
Carryingamount
R’000Total
R’000
6 monthsor lessR’000
6 – 12months
R’000
1 – 2yearsR’000
2 – 5yearsR’000
More than5 years
R’000
2011
Total borrowings (refer note 28) Loans secured by mortgage bonds
over fixed property 35 972 35 972 3 837 3 837 7 759 9 675 10 864 Loans secured by lien over certain
property, plant and equipment in terms of financial leases and suspensive sale agreements 41 321 41 403 8 935 8 420 14 573 9 475 –
Unsecured loans 7 242 664 8 124 292 2 857 008 338 752 950 711 3 866 721 111 100 Floorplan creditors secured by
pledge of inventories 519 355 519 355 519 355 – – – – Bank overdrafts 1 628 225 1 628 225 – 1 628 225 – – –
9 467 537 10 349 247 3 389 135 1 979 234 973 043 3 885 871 121 964
Trade and other payables (refer note 32)
Trade and other payables (excluding forward exchange contracts) 16 805 248 16 805 248 16 799 072 6 176 – – –
Banking liabilities (refer note 30) Call deposits 754 304 754 304 754 304 – – – – Fixed and notice deposits 521 593 529 408 507 915 21 493 – – –
1 275 897 1 283 712 1 262 219 21 493 – – –
2010
Total borrowings (refer note 28) Loans secured by mortgage bonds
over fixed property 21 282 21 421 2 854 2 830 5 657 8 756 1 324 Loans secured by lien over certain
property, plant and equipment in terms of financial leases and suspensive sale agreements 40 566 58 899 6 525 8 518 10 175 19 627 14 054
Unsecured loans 6 146 670 7 163 565 2 792 823 214 762 427 287 3 031 302 697 391 Floorplan creditors secured by
pledge of inventories 560 035 560 035 560 035 – – – – Bank overdrafts 1 233 269 1 233 269 – 1 233 269 – – –
8 001 822 9 037 189 3 362 237 1 459 379 443 119 3 059 685 712 769
Trade and other payables (refer note 32) Trade and other payables (excluding
forward exchange contracts) 15 023 691 15 024 223 15 024 223 – – – –
Banking liabilities (refer note 30)
Call deposits 649 897 649 897 649 897 – – – – Fixed and notice deposits 430 469 430 469 408 103 22 366 – – –
1 080 366 1 080 366 1 058 000 22 366 – – –
The expected maturity of financial liabilities is not expected to differ from the contractual maturities as disclosed above.

PASSION/VITALITY/PRECISION
198
Notes to the consolidated financial statementsfor the year ended June 30
2011R’000
2010 R’000
36. Financial instruments (continued)
36.3 Liquidity risk (continued)
36.3.2 Trade and other payables by class
Trade payables Bidvest South Africa
Automotive 525 234 404 489 Electrical 595 770 655 958 Financial Services 157 742 139 066 Freight 1 866 644 1 695 036 Industrial 145 442 122 881 Office Products 341 993 346 802 Paper Plus 320 240 258 261 Rental and Products 92 607 118 222 Services 68 905 79 369 Travel and Aviation 258 034 231 876 Bidvest Foodservice
Asia Pacific 2 332 686 1 850 487 Europe 4 101 029 3 848 396
Southern Africa 519 725 570 362 Bidvest Namibia 170 911 233 008 Bidvest Corporate 43 434 72 431
11 540 396 10 626 644
Refer note 32 for further disclosure.
36.3.3 Undrawn facilities
The Group has the following undrawn facilities at its disposal to further reduce liquidity risk:Unsecured bank overdraft facility, reviewed annually and payable on 364 days’ notice Utilised 1 623 592 1 229 760 Unutilised 10 227 557 10 289 044
11 851 149 11 518 804 Secured bank overdraft facility, reviewed annually and payable on call Utilised 4 633 3 509 Unutilised 1 162 1 380
5 795 4 889 Unsecured loan facility with various maturity dates through to 2016 and which may be extended by mutual agreement Utilised 7 319 957 6 146 670 Unutilised 3 803 446 3 937 903
11 123 403 10 084 573 Secured loan facilities with various maturity dates through to 2012 and which may be extended by mutual agreement Utilised 519 355 621 883 Unutilised 1 004 645
1 524 000 621 883 Total facilities Utilised 9 467 537 8 001 822 Unutilised 15 036 810 14 228 327
24 504 347 22 230 149

199
AUDITED FINANCIAL STATEMENTS
THE BIDVEST GROUP LIMITED / ANNUAL INTEGRATED REPORT 2011
36. Financial instruments (continued)
36.4 Market risk
Market risk is the risk that changes in market price, such as foreign exchange rates, interest rates and equity prices will affect the Group’s income or the value of its holdings of financial instruments. The objective of market risk management is to manage and control market risk exposures within acceptable parameters, while optimising the return on risk.
36.4.1 Currency risk
The Group’s financial instruments are not exposed to currency risk for the reasons provided below. A sensitivity analysis has therefore not been performed.
Borrowings are matched to the same foreign currency as the division raising the loan thereby limiting the divisions’ exposure to changes in a foreign currency which differs to their functional currency. Interest on borrowings is denominated in currencies that match the cash flows generated by the underlying divisions of the Group thereby providing an economic hedge for each class of borrowing.
Banking advances (refer note 20), banking liabilities (refer note 30) and investments (refer note 19) are all fixed in the same foreign currency as the operation in which it is held, thus these financial instruments are not exposed to currency risk.
The Group incurs currency risk as a result of purchases and sales which are denominated in a currency other than the Group entities’ functional reporting currency. It is Group policy that Group entities hedge all trade receivables and trade payables denominated in a foreign currency which differs to its functional currency. At any point in time the entities also take out economic hedges over their estimated foreign currency exposure resulting from sales and purchases. The Group entities hedge their foreign currency risk exposure either by taking out forward exchange contracts (FECs) or alternatively by purchasing in advance the foreign currency, which will be required to settle the trade payables. Most of the forward exchange contracts have maturities of less than one year after the statement of financial position date. Where necessary, the forward exchange contracts are rolled over at maturity. It is the Group’s policy not to trade in derivative financial instruments for speculative purposes with the exception of Bidvest Bank Limited whose business is to trade in derivatives.
Changes in the fair value of forward exchange contracts that economically hedge monetary assets and liabilities in foreign currencies (in relation to the operations’ functional currency) and for which no hedge accounting is applied are recognised in the income statement. Both the changes in fair value of the forward exchange contracts and the foreign exchange gains and losses relating to the monetary items are recognised in operating profit (refer note 2).
The periods in which the cash flows associated with the forward exchange contracts are expected to occur are detailed below under the heading “Settlement”. The periods in which the cash flows are expected to impact the income statement are believed to be in the same timeframe as when the actual cash flows occur.

PASSION/VITALITY/PRECISION
200
Notes to the consolidated financial statementsfor the year ended June 30
36. Financial instruments (continued)
36.4 Market risk (continued)
36.4.1 Currency risk (continued)
Contract value
Settlement Foreign amount
000’sRand amount
000’s
2011
In respect of forward exchange contracts relating to foreign liabilities as at June 30 2011
Japanese yen July 2011 to October 2011 (2 344 362) (199 258)
US dollar July 2011 to October 2011 (37 409) (246 700)
Euro July 2011 to November 2011 (13 128) (129 576)
Sterling July 2011 to October 2011 (299) (3 342)
AUD July 2011 to October 2011 (1 461) (10 608)
Other July 2011 to August 2011 (2 534) (3 949)
(593 433)
In respect of forward exchange contracts relating to foreign assets as at June 30 2011
US dollar July 2011 to August 2011 22 148
In respect of forward exchange contracts relating to goods and services ordered not accounted for as at June 30 2011
Japanese yen July 2011 to August 2011 (33 890) (2 867)
US dollar July 2011 to January 2013 (53 447) (364 872)
Euro July 2011 to November 2011 (3 208) (31 538)
Sterling July 2011 to January 2012 (262) (2 941)
Norwegian Krone July 2011 to September 2011 (3 554) (4 411)
AUD July 2011 to November 2011 (1 047) (7 569)
Other July 2011 to September 2011 (894) (492)
(414 690)
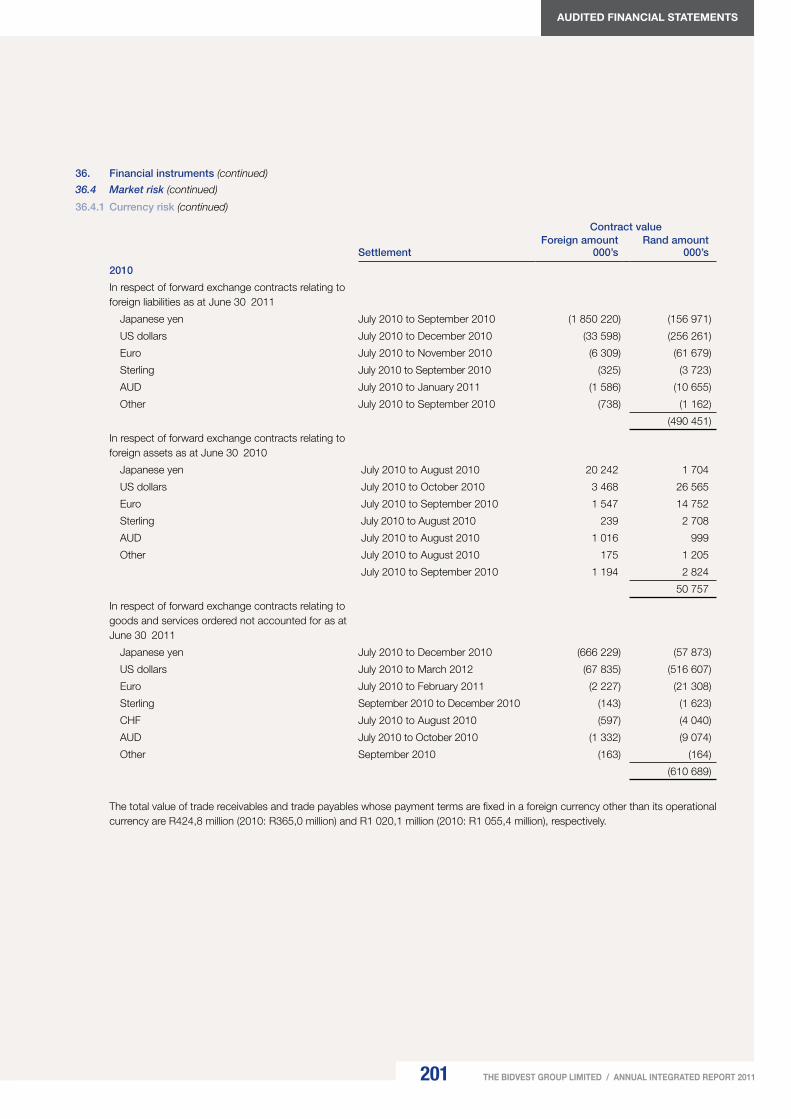
201
AUDITED FINANCIAL STATEMENTS
THE BIDVEST GROUP LIMITED / ANNUAL INTEGRATED REPORT 2011
36. Financial instruments (continued)
36.4 Market risk (continued)
36.4.1 Currency risk (continued)
Contract value
Settlement Foreign amount
000’sRand amount
000’s
2010
In respect of forward exchange contracts relating to foreign liabilities as at June 30 2011
Japanese yen July 2010 to September 2010 (1 850 220) (156 971)
US dollars July 2010 to December 2010 (33 598) (256 261)
Euro July 2010 to November 2010 (6 309) (61 679)
Sterling July 2010 to September 2010 (325) (3 723)
AUD July 2010 to January 2011 (1 586) (10 655)
Other July 2010 to September 2010 (738) (1 162)
(490 451)
In respect of forward exchange contracts relating to foreign assets as at June 30 2010
Japanese yen July 2010 to August 2010 20 242 1 704
US dollars July 2010 to October 2010 3 468 26 565
Euro July 2010 to September 2010 1 547 14 752
Sterling July 2010 to August 2010 239 2 708
AUD July 2010 to August 2010 1 016 999
Other July 2010 to August 2010 175 1 205
July 2010 to September 2010 1 194 2 824
50 757
In respect of forward exchange contracts relating to goods and services ordered not accounted for as at June 30 2011
Japanese yen July 2010 to December 2010 (666 229) (57 873)
US dollars July 2010 to March 2012 (67 835) (516 607)
Euro July 2010 to February 2011 (2 227) (21 308)
Sterling September 2010 to December 2010 (143) (1 623)
CHF July 2010 to August 2010 (597) (4 040)
AUD July 2010 to October 2010 (1 332) (9 074)
Other September 2010 (163) (164)
(610 689)
The total value of trade receivables and trade payables whose payment terms are fixed in a foreign currency other than its operational currency are R424,8 million (2010: R365,0 million) and R1 020,1 million (2010: R1 055,4 million), respectively.
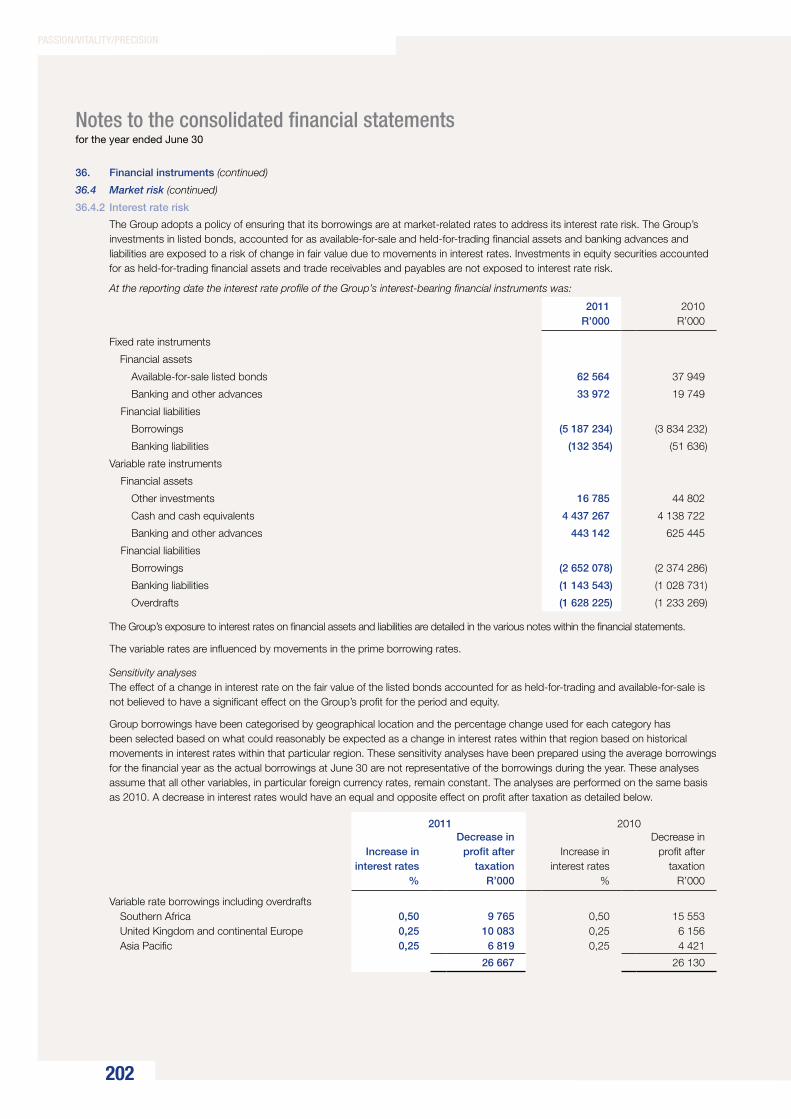
PASSION/VITALITY/PRECISION
202
Notes to the consolidated financial statementsfor the year ended June 30
36. Financial instruments (continued)
36.4 Market risk (continued)
36.4.2 Interest rate risk
The Group adopts a policy of ensuring that its borrowings are at market-related rates to address its interest rate risk. The Group’s investments in listed bonds, accounted for as available-for-sale and held-for-trading financial assets and banking advances and liabilities are exposed to a risk of change in fair value due to movements in interest rates. Investments in equity securities accounted for as held-for-trading financial assets and trade receivables and payables are not exposed to interest rate risk.
At the reporting date the interest rate profile of the Group’s interest-bearing financial instruments was:
2011R’000
2010R’000
Fixed rate instruments
Financial assets
Available-for-sale listed bonds 62 564 37 949
Banking and other advances 33 972 19 749
Financial liabilities
Borrowings (5 187 234) (3 834 232)
Banking liabilities (132 354) (51 636)
Variable rate instruments
Financial assets
Other investments 16 785 44 802
Cash and cash equivalents 4 437 267 4 138 722
Banking and other advances 443 142 625 445
Financial liabilities
Borrowings (2 652 078) (2 374 286)
Banking liabilities (1 143 543) (1 028 731)
Overdrafts (1 628 225) (1 233 269)
The Group’s exposure to interest rates on financial assets and liabilities are detailed in the various notes within the financial statements.
The variable rates are influenced by movements in the prime borrowing rates.
Sensitivity analysesThe effect of a change in interest rate on the fair value of the listed bonds accounted for as held-for-trading and available-for-sale is not believed to have a significant effect on the Group’s profit for the period and equity.
Group borrowings have been categorised by geographical location and the percentage change used for each category has been selected based on what could reasonably be expected as a change in interest rates within that region based on historical movements in interest rates within that particular region. These sensitivity analyses have been prepared using the average borrowings for the financial year as the actual borrowings at June 30 are not representative of the borrowings during the year. These analyses assume that all other variables, in particular foreign currency rates, remain constant. The analyses are performed on the same basis as 2010. A decrease in interest rates would have an equal and opposite effect on profit after taxation as detailed below.
2011 2010
Increase ininterest rates
%
Decrease inprofit after
taxation R’000
Increase ininterest rates
%
Decrease inprofit after
taxation R’000
Variable rate borrowings including overdrafts Southern Africa 0,50 9 765 0,50 15 553 United Kingdom and continental Europe 0,25 10 083 0,25 6 156 Asia Pacific 0,25 6 819 0,25 4 421
26 667 26 130

203
AUDITED FINANCIAL STATEMENTS
THE BIDVEST GROUP LIMITED / ANNUAL INTEGRATED REPORT 2011
36. Financial instruments (continued)
36.4 Market risk (continued)
36.4.3 Market price risk
Equity price risk arises from investments classified as held for trading and available for sale (refer note 19). Available-for-sale financial assets comprise listed bonds held by the Group’s wholly owned subsidiary Bidvest Bank Limited. Held-for-trading investments comprise a listed share portfolio whose performance is monitored closely by senior management and the Group actively trades in these shares. The Group’s subsidiaries McSure Limited and McLife Assurance Company Limited hold investment portfolios with a fair value of R343,3 million (2010: R225,0 million) and R162,1 million (2010: R141,4 million), respectively for the purpose of being utilised to cover liabilities arising under the life assurance fund. These portfolios comprise domestic equity investments and international equity and money market funds. Unlisted investments comprise unlisted shares and loans which are classified as held-for-trading and are valued at fair value using a price earnings (PE) model.
36.5 Fair values
The carrying amount of all financial assets and liabilities approximate fair value with the exception of borrowings (which have been accounted for at amortised cost and certain investments where fair value cannot be determined). The fair value of borrowings, together with the carrying amounts shown in the statement of financial position, classified by class (being geographical location), are as follows:
2011 2010Carryingamount
R’000Fair value
R’000
Carryingamount
R’000Fair value
R’000
Borrowings (refer note 28)
Southern Africa 6 767 235 6 767 235 5 725 435 5 650 699
Loans secured by lien over certain property, plant and equipment in terms of financial leases and suspensive sale agreements 445 445 523 523
Unsecured loans 4 619 210 4 619 210 3 931 608 3 856 872
Floor plan creditors secured by a pledge of inventories 519 355 519 355 560 035 560 035
Bank overdrafts 1 628 225 1 628 225 1 233 269 1 233 269
Europe 1 505 172 1 514 569 1 048 410 1 048 410
Loans secured by mortgage bonds over fixed property 35 972 35 972 21 282 21 282
Loans secured by lien over certain property, plant and equipment in terms of financial leases and suspensive sale agreements 40 272 40 272 40 043 40 043
Unsecured loans 1 428 928 1 438 325 987 085 987 085
Asia Pacific 1 195 130 1 195 130 1 227 976 1 227 976
Loans secured by lien over certain property, plant and equipment in terms of financial leases and suspensive sale agreements 604 604 – –
Unsecured loans 1 194 526 1 194 526 1 227 976 1 227 976
9 467 537 9 476 934 8 001 821 7 927 085
Unrecognised gain (loss) (9 397) 74 736
The methods used to estimate the fair values of financial instruments are discussed in note 40.
The interest rates used to discount cash flows, in order to determine fair values, are based on market related rates at June 30 2011 plus an adequate constant credit spread, and range from 1.2% to 17.8% (2010: 1.1% to 18.0%).
PASSION/VITALITY/PRECISION
204
Notes to the consolidated financial statementsfor the year ended June 30
37. Capital management
The board of directors’ policy is to maintain a strong capital base so as to maintain investor, supplier and market confidence while also being able to sustain future development of the businesses. The Board of directors monitors both the demographic spread of shareholders, as well as the return on capital, which the Group defines as total shareholders’ equity, excluding minority interests and the level of distributions to ordinary shareholders. The Group’s objective is to maintain a distribution cover of approximately two-and-a-half-times headline earnings for the foreseeable future. The methods of distribution include dividends, return of share premium, capitalisation issues as well as share buy-backs in lieu of distributions. The level of cover of distributions takes into account prevailing market conditions, future cash requirements of the businesses, Group liquidity requirements, as well as capital adequacy ratios.
The board seeks to maintain a balance between the higher returns that might be possible with higher levels of gearing and the advantages and security afforded by a sound equity position. The Group’s target is to achieve a return on shareholders’ interest of between 25% and 30%. In 2011 the return was 21,1% (2010: 24,0%). Refer to page 16 of the annual report for the historical return on total shareholders’ interest since 2000.
In the early days of the Group, acquisition activity was generally funded via the raising of equity capital. However, over the past five years, far more favourable credit markets have enabled the use of debt as a far more effective tool of capital. The current credit markets have fundamentally changed, increasing the cost of debt in the weighted average cost of capital for the Group thereby enabling a potential return to tapping the equity markets to fund future growth.
From time to time the Group purchases its own shares on the market, the timing of these purchases depends on market prices. Primarily the shares are intended to be used for issuing shares under the Bidvest Share Incentive Scheme (refer note 26). The maximum number of share options which can be issued to employees under the Bidvest Share Incentive Scheme is limited to 10% of the issued share capital. The Group does not have a defined share buy-back plan. A specific buy-back transaction was completed during the financial year, in order to assist the Company’s empowerment shareholder, Dinatla Investment Holdings (Proprietary) Limited, with early settlement of their funding arrangement. These shares are currently held as treasury shares.
There were no changes in the Group’s approach to capital management during the year.
Neither the Company nor any of its subsidiaries are subject to externally imposed capital requirements. The Group has principally a target debt/equity ratio of 40%, however in a trading and services business, the debt/equity ratio is a poor measure of the funding capacity of the Group. In order to ensure a more reflective measure of debt capacity is utilised, the Group has adopted an interest cover target of between five to six times. Interest cover for the year to June 30 2011 was nine times (2010: seven times).
38. Related parties
Identification of related partiesThe Group has a related party relationship with its subsidiaries, associates and joint ventures. Key management personnel have been defined as the executive and non-executive directors of the Company. The definition of key management includes the close members of family of key management personnel and any other entity over which key management exercises control. Close members of family are those family members who may be expected to influence, or be influenced by that individual in their dealings with the Group. They may include the individual’s domestic partner and children, the children of the individual’s domestic partner, and dependants of the individual or the individual’s domestic partner.
Transactions with key management personnelDirectors of the Company and their immediate relatives beneficially control 1% (2010: 2%) of the voting shares of the Company.
Independent non-executive directors do not participate in the Group’s share option, share purchase schemes or conditional share awards.
Details pertaining to executive directors’ compensations are set out in the directors’ report. Directors’ remuneration in total is included in note 2.
The Group encourages its employees to purchase goods and services from Group companies. These transactions are generally conducted on terms no more favourable than those entered into with third parties on an arm’s-length basis, although in some cases nominal discounts are granted. Transactions with key management personnel are conducted on similar terms. No abnormal or non-commercial credit terms are allowed, and no impairments were recognised in relation to any transactions with key management personnel during the year, nor have they resulted in any non-performing debts at the year-end.

205
AUDITED FINANCIAL STATEMENTS
THE BIDVEST GROUP LIMITED / ANNUAL INTEGRATED REPORT 2011
38. Related parties (continued)
Transactions with key management personnel (continued)Similar policies are applied to key management personnel at subsidiary level who are not defined as key management personnel at Group level.
Certain of the directors of the Group are also non-executive directors of other public companies which may transact with the Group. The relevant directors do not believe they have significant influence over the financial or operational policies of those companies. Those companies are thus not regarded as related parties.
The following transactions were made on terms equivalent to those that prevail in arm’s-length transactions between subsidiaries of the Group and key management personnel (as defined above) and/or organisations in which key management personnel have significant influence:
2011R’000
2010R’000
Sales and services provided by the Group 4 049 22 148
Purchases 17 719 3 598
Outstanding amounts due to the Group at year-end included in respect of the share purchase scheme 100 878 126 563
Outstanding amounts due to the Group at year-end included in trade receivables 34 3 721
Outstanding amounts due by the Group at year-end included in banking liabilities 7 372 –
Transactions with associatesThe following transactions were made on terms equivalent to those that prevail in arm’s-length transactions between subsidiaries and associates of the Group:
Sales and services provided by the Group 9 180
Purchases 152 781 123 755
Outstanding amounts due to the Group at year-end included in advances to associates 40 561 86 672
Outstanding amounts due to the Group at year-end included in trade receivables 866 1 011
Outstanding amounts due by the Group at year-end included in borrowings 47 787 68 486
Outstanding amounts due by the Group at year-end included in trade payables 38 795 27 819
Guarantees issued 56 000 56 000
Details of effective interest, investments and loans to associates are disclosed in note 18.
39. Accounting estimates and judgements
The board of directors has considered the Group’s critical accounting policies, key sources of uncertainty and areas where critical accounting judgements were required in applying the Group’s accounting policies.
Critical accounting policiesThe audit committee is satisfied that the critical accounting policies are appropriate to the Group.
Key sources of uncertaintyKey sources of uncertainty relate to the liabilities to the benefit funds or related assets due to the surplus apportionment in terms of the Pensions Fund Act which have yet to be finalised and approved. Details relating to the current surpluses and deficits are included in note 29.
Critical accounting judgements in applying the Group’s accounting policiesJudgements made in the application of IFRS that have a significant risk of causing a material adjustment to the carrying amounts of assets and liabilities within the next financial year are discussed below.
Property, plant and equipmentThe residual values of the property, plant and equipment are reviewed annually after considering future market conditions, the remaining life of the asset and projected disposal values. The estimation of the useful lives is based on historic performance as well as expectation about future use and, therefore, requires a degree of judgement to be applied. The depreciation rates represent management’s current best estimate of the useful lives of the assets. The properties held in Bidvest Properties segment are accounted for as own use assets and are thus held at cost less depreciation. Market indicators reflect, that these properties could realise more than their carrying values, if disposed of.

PASSION/VITALITY/PRECISION
206
Notes to the consolidated financial statementsfor the year ended June 30
39. Accounting estimates and judgements (continued)
GoodwillThe Group has assessed the carrying value of goodwill to determine whether any of the amounts have been impaired. The carrying values were assessed using a combination of discounted cash flow and price earnings methods, the actual results and forecasts for future years.
Deferred taxationDeferred taxation assets are recognised to the extent it is probable that the taxable income will be available against which they can be utilised. Future taxable profits are estimated based on business plans which include estimates and assumptions regarding economic growth, interest, inflation and taxation rates and competitive forces.
InvestmentsThe Group reflects its held-for-trade and available-for-sale investments at fair value. The directors’ value of unlisted investments was determined using a combination of discounted cash flow, net asset value and price earnings methods. Investments held are of a long- term nature and uncertainty surrounds their valuation, which may result in a significant change in value.
InventoriesImpairment allowances are raised against inventory when it is considered that the amount realisable from such inventory’s sale is considered to be less than its carrying amount. The impairment allowance is made with reference to an inventory age analysis.
Trade receivablesManagement identifies impairment of trade receivables on an ongoing basis. An impairment allowance in respect of doubtful debts is raised against trade receivables when their collectibility is considered to be doubtful. Management believes that the impairment adjustment is conservative and there are no significant trade receivables that are doubtful and have not been impaired or allowance provided for. In determining whether a particular receivable could be doubtful, the age, customer’s current financial status and disputes with the customer are taken into consideration.
ProvisionsRefer note 33 for further disclosure.
Post-retirement obligationsThe Group provides retirement benefits for its permanent employees through pension funds with defined benefit and defined contribution categories. Actuarial valuations are based on assumptions which include the discount rate, inflation rate, salary increase rate, expected return on plan assets and the pension increase allowance rate.
40. Determination of fair values
A number of the Group’s accounting policies and disclosures require the determination of fair values, for both financial and non-financial assets and liabilities. Fair values have been determined for measurement and/or disclosure purposes based on the following methods. Where applicable, further information about the assumptions made in determining fair values is disclosed in the notes specific to that asset or liability.
Property, plant and equipmentThe fair value of property, plant and equipment recognised as a result of a business combination is based on market values. The market value of property is the estimated amount for which a property could be exchanged on the date of valuation between a willing buyer and a willing seller in an arm’s-length transaction after proper marketing wherein the parties had each acted knowledgeably, prudently and without compulsion. The market values of other assets are based on the quoted market prices for similar items.
Intangible assetsThe fair value of intangible assets is based on the discounted cash flows expected to be derived from the use and eventual sale of the assets.
InventoryThe fair value of inventory acquired in a business combination is determined based on its estimated selling price in the ordinary course of business less the estimated costs of completion and sale, and a reasonable profit margin based on the efforts required to complete and sell the inventory.
InvestmentsFair value of listed investments is calculated by reference to stock exchange quoted selling prices at the close of business on the statement of financial position date. Fair value of unlisted investments is determined by using appropriate valuation models.
Forward exchange contractsThe fair value of forward exchange contracts is based on their listed market prices.

207
AUDITED FINANCIAL STATEMENTS
THE BIDVEST GROUP LIMITED / ANNUAL INTEGRATED REPORT 2011
40. Determination of fair values
BorrowingsFair value, which is determined for disclosure purposes, is calculated based on the present value of future principal and interest cash flows, discounted at the market rate of interest at the reporting date. For finance leases the market rate of interest is determined by reference to similar lease agreements. The carrying value of the bank overdrafts is the fair value.
Share-based paymentsThe fair value of the share options is measured using a binomial model. Measurement inputs include share price at measurement date, exercise price of the instrument, expected volatility (based on the historic volatility), option life, distribution yield and the risk-free interest rate (based on national government bonds).
41. Accounting standards and interpretations not effective at June 30 2010
At the date of approval of the annual financial statements, the following new standards and interpretations that apply to the Group were in issue but not yet effective:
Standard/interpretation Description Effective dateIFRS 9 Financial Instruments January 1 2013IFRS 10 Consolidated Financial Statements January 1 2013IFRS 11 Joint Arrangements January 1 2013IFRS 12 Disclosure of Interests in Other Entities January 1 2013IFRS 13 Fair Value Measurement January 1 2013IAS 12 Income Taxes: Recovery of Underlying Assets January 1 2012IAS 19 Employee Benefits January 1 2013IAS 24 Related Party Disclosures January 1 2011IFRIC 14 The Limit on a Defined Benefit Asset, Minimum Funding Requirements and their
InteractionJanuary 1 2011
IFRS 9
IFRS 9 addresses the initial measurement and classification of financial assets and will replace the relevant sections of IAS 39. Under IFRS 9 there are two options in respect of classification of financial assets, namely, financial assets measured at amortised cost or at fair value. Financial assets are measured at amortised cost when the business model is to hold assets in order to collect contractual cash flows and when they give rise to cash flows that are solely payments of principal and interest on the principal outstanding. All other financial assets are measured at fair value.
Management does not expect any significant impact on the financial results.
IFRS 10IFRS 10 addresses the divergence arising from the control based principles in IAS 27 and the risks and rewards based approach in SIC 12, and in addition, provides greater guidance on ‘de facto’ control.
Management does not expect any significant impact on the financial results.
IFRS 11IFRS 11 identifies two types of joint arrangements, joint operations and joint ventures, and prohibits the use of proportionate consolidation for joint ventures.
Management does not expect any significant impact on the financial results.
IFRIC 12In order to provide greater transparency, IFRS 12 requires disclosure of the nature, risks and financial impact of consolidated and unconsolidated entities.
Management does not expect any significant impact on the financial results.
IFRS 13IFRS 13 is a single cohesive standard consolidating the principles of fair value measurement and disclosures for financial reporting. Fair value measurements of a non-financial asset will take into account a market participant’s ability to generate economic benefits by using the asset in its highest and best use or by selling it to another market participant that would use the asset in its highest and best use.
Management does not expect any significant impact on the financial results.

PASSION/VITALITY/PRECISION
208
Notes to the consolidated financial statementsfor the year ended June 30
41. Standards and interpretations not effective at June 30 2010 (continued)
IAS 12For the purposes of measuring deferred tax, the amendments introduce a rebuttable presumption that the carrying amount of investment property measured using the fair value model in terms of IAS 40, will be recovered entirely through sale and thus deferred tax is raised at the capital gains tax rate. The presumption can be rebutted if the investment property is depreciable and is held within a business model whose objective is to consume substantially all of the economic benefits over time, rather than through sale, and where investment property acquired in a business combination is measured using the fair value model subsequent to the business combination. In these circumstances, deferred tax is raised at the corporate tax rate.
Management does not expect any significant impact on the financial results.
IAS 19The elimination of the corridor method will require entities to recognise changes in defined obligations and plan assets immediately through Other Comprehensive Income. The amendments in Comprehensive Income presentation result in the consistent treatment of changes in the defined obligation and plan assets.
Management does not expect any significant impact on the financial results.
IAS 24IAS 24 has simplified the definition of a related party to a person or entity that is related to the entity that is preparing its financial statements, eliminating inconsistencies which existed in the previous definition.
Management does not expect any significant impact on the financial results.
IFRIC 14The amendment applies in limited circumstances when an entity is subject to minimum funding requirements and makes an early payment of contributions to cover those requirements. The amendments permit such an entity to treat the benefit of such early payment as an asset.
Management does not expect any significant impact on the financial results.
IASB 2009 and 2010 annual improvements projectThe amendments embodied in the IFRS 2009 improvement project are effective for the Group for the year ending June 30 2011.
The amendments embodied in the IFRS 2010 improvement project are effective for the Group for the year ending June 30 2012.
As part of its annual improvements project, the International Accounting Standards (IASB) made amendments to a number of accounting standards. These amendments were primarily made to resolve conflicts and remove inconsistencies between standards, clarify the status of application guidance in standards, clarify existing IFRS requirements, as well as conforming the terminology used in standards with that used in other standards and to those more widely used.
Management’s assessment of the improvements has not revealed any material impact on the Group’s results.
42. Restatement of segmental information
During the year, operations in South Africa were reorganised under new management, resulting in the creation of new segments and the reorganisation of operations within others. The comparative year’s segmental information has been restated to reflect these changes.
The above reorganisation had no impact on the results of the Group as previously reported, and as such, a restated consolidated financial position for the year to June 30 2009 has not been included with this report.
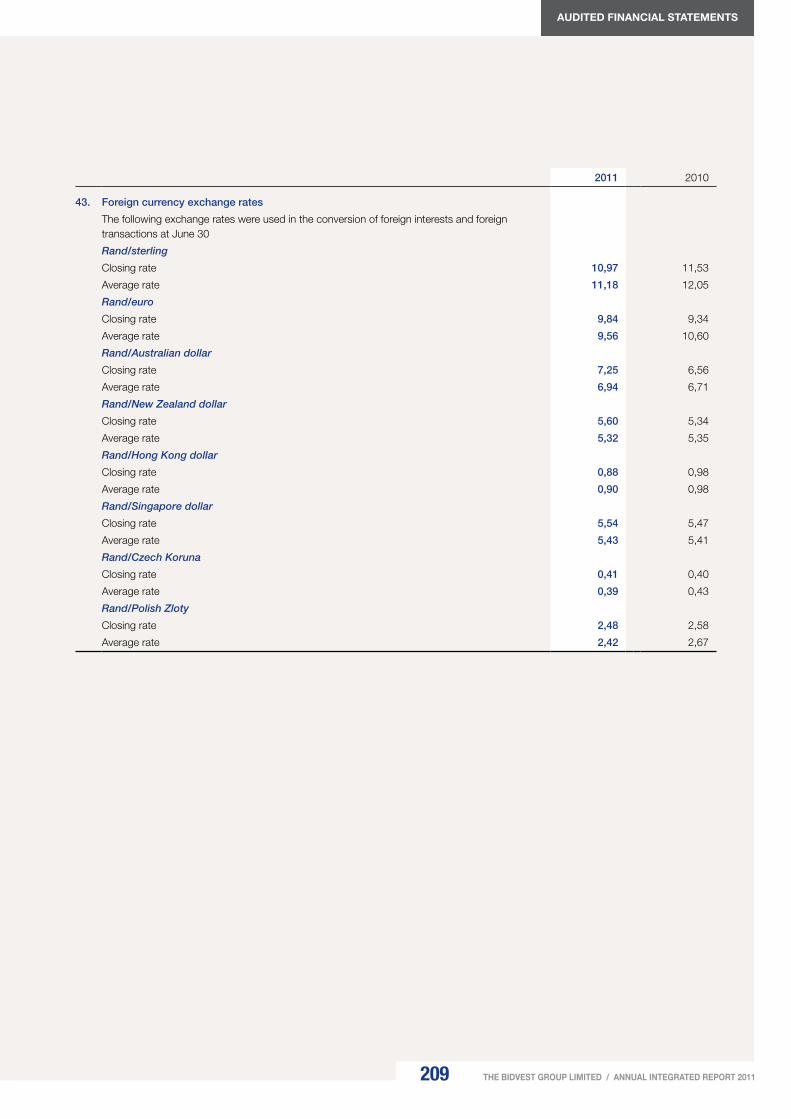
209
AUDITED FINANCIAL STATEMENTS
THE BIDVEST GROUP LIMITED / ANNUAL INTEGRATED REPORT 2011
2011 2010
43. Foreign currency exchange rates
The following exchange rates were used in the conversion of foreign interests and foreign transactions at June 30
Rand/sterling
Closing rate 10,97 11,53
Average rate 11,18 12,05
Rand/euro
Closing rate 9,84 9,34
Average rate 9,56 10,60
Rand/Australian dollar
Closing rate 7,25 6,56
Average rate 6,94 6,71
Rand/New Zealand dollar
Closing rate 5,60 5,34
Average rate 5,32 5,35
Rand/Hong Kong dollar
Closing rate 0,88 0,98
Average rate 0,90 0,98
Rand/Singapore dollar
Closing rate 5,54 5,47
Average rate 5,43 5,41
Rand/Czech Koruna
Closing rate 0,41 0,40
Average rate 0,39 0,43
Rand/Polish Zloty
Closing rate 2,48 2,58
Average rate 2,42 2,67

PASSION/VITALITY/PRECISION
210
Company income statementfor the year ended June 30
Company statement of cash flowsfor the year ended June 30
Note
2011
R’000
2010
R’000
Dividends received 4 849 752 984 682
Subsidiaries and joint ventures 4 823 121 957 841
Associates 26 631 26 824
Unlisted investments – 17
Fair value adjustments and impairment of investment in subsidiaries,
joint ventures and associates (50 878) (16 985)
Profit on disposal of subsidiaries, joint ventures and associates 136 376 200 088
Profit before taxation 4 935 250 1 167 785
Taxation 1 (129 462) (802)
Profit for the year attributable to shareholders of the Company 4 805 788 1 166 983
Total comprehensive income for the year 4 805 788 1 166 983
Note
2011
R’000
2010
R’000
Cash flows from operating activities 3 196 878 (131 600)
Cash generated by operations 2 4 850 700 1 248 672
Taxation paid 3 (129 462) (803)
Refunds of share premium to shareholders in lieu of dividends – (1 379 469)
Dividends paid (1 524 360) –
Cash effects of investment activities 249 891 (1 037 103)
Decrease (increase) in advances to subsidiaries 75 621 (1 113 044)
Acquisition of subsidiaries and associates 4 (175 522) (540 820)
Proceeds on disposal of subsidiaries, joint ventures and associates 5 349 792 616 761
Cash effects of financing activities (3 465 829) 1 233 119
Proceeds from share issues – 1 233 119
Buy-back of shares (3 465 829) –
Net increase (decrease) in cash and cash equivalents (19 060) 64 416
Cash and cash equivalents at beginning of year 116 073 51 657
Cash and cash equivalents at end of year 97 013 116 073

211
audited FiNaNCiaL StateMeNtS
tHe BidVeSt GROuP LiMited / aNNuaL iNteGRated RePORt 2011
2011
R’000
2010
R’000
Share capital 16 367 17 507
Balance at beginning of the year 17 507 16 814
Shares issued during the year – 693
Buy-back and cancellation of shares (1 140) –
Share premium 81 258 81 258
Balance at beginning of the year 81 258 228 301
Shares issued during the year – 1 236 462
Share issue costs – (4 036)
Refund of share premium to shareholders – (1 379 469)
Equity-settled share-based payment reserve 390 144 283 594
Balance at beginning of year 283 594 254 483
Arising during the year 106 550 29 111
Movement in retained earnings 7 306 023 7 489 284
Balance at beginning of the year 7 489 284 6 322 301
Total comprehensive income for the year 4 805 788 1 166 983
Buy-back and cancellation of shares (3 464 689) –
Dividends paid (1 524 360) –
Equity attributable to shareholders of the Company 7 793 792 7 871 643
Note
2011
R’000
2010
R’000
ASSETS
Non-current assets 7 707 370 7 765 213
Interest in subsidiaries 6 7 595 826 7 664 668
Interest in joint ventures 7 4 540 4 540
Interest in associates 8 106 654 95 655
Investments 9 350 350
Current assets
Cash and cash equivalents 97 013 116 073
Total assets 7 804 383 7 881 286
EQUITY AND LIABILITIES
Capital and reserves 10 7 793 792 7 871 643
Current liabilities
Trade and other payables 10 591 9 643
Total equity and liabilities 7 804 383 7 881 286
Company statement of changes in equityfor the year ended June 30
Company statement of financial positionat June 30

PASSION/VITALITY/PRECISION
212
Notes to the Company financial statements for the year ended June 30
2011
R’000 2010
R’000
1. Taxation
Current taxation 34 (8)
Current year – –
Prior year 34 (8)
Secondary taxation on companies 126 346 –
Foreign withholdings tax 3 082 810
Total taxation per income statement 129 462 802
The reconciliation of the effective tax rate with the Company tax rate is as follows: % %
Taxation for the year as a percentage of profit before taxation 2,7 0,1
Dividend and exempt income 28,3 28,0
Withholding taxes (0,1) (0,1)
Secondary taxation on companies (2,6) –
Expenses not taxable or allowed (0,3) –
Rate of South African company taxation 28,0 28,0
R’000 R’000
Secondary taxation on companies – dividend credits available – 100 569
2. Cash generated by operations
Profit before taxation 4 935 250 1 167 785
Adjustment for non-cash items (85 498) (174 274)
Retained to finance working capital
Increase (decrease) in trade and other payables 948 (1 365)
Decrease in trade and other receivables – 256 526
Cash generated by operations 4 850 700 1 248 672
3. Taxation paid
Amount payable at beginning of year – (1)
Per income statement (129 462) (802)
Amount payable at end of year – –
Amount paid (129 462) (803)
4. Acquisition of subsidiaries and associates
Interest in subsidiaries (158 822) (525 191)
Interest in associates (16 700) –
Total value of acquisitions (175 522) (525 191)
Vendors for acquisition at beginning of year – (15 629)
Amounts paid (175 522) (540 820)

213
audited FiNaNCiaL StateMeNtS
tHe BidVeSt GROuP LiMited / aNNuaL iNteGRated RePORt 2011
2010
R’000 2009
R’000
5. Proceeds on disposal of subsidiaries, joint ventures and associates
Interest in subsidiaries – Net carrying value 213 416 416 673
Profit on disposal 136 376 200 088
Net proceeds 349 792 616 761
6. Interest in subsidiaries
Shares 3 740 905 3 734 126
Due by subsidiaries 4 280 247 4 245 030
Due to subsidiaries (425 326) (314 488)
7 595 826 7 664 668
Details of major subsidiaries are reflected on pages 215 to 221 of this report.
7. Interest in joint ventures
Shares at cost 4 540 4 540
Details of major joint ventures are reflected on page 221 of this report.
8. Interest in associates
Listed 5 742 5 742
Unlisted 80 817 69 818
86 559 75 560
Interest-free advances 20 095 20 095
106 654 95 655
Market value of listed associates 29 700 24 700
Directors’ value of unlisted associates 342 400 277 900
372 100 302 600
Details of major associates are reflected on page 221 of this report.
9. Investments
Unlisted shares 350 350
Directors’ value of unlisted investments 350 350
10. Capital and reserves
Share capital
Authorised
540 000 000 (2010: 540 000 000) ordinary shares of 5 cents each 27 000 27 000
Number Number
Issued
Balance at beginning of year 350 144 746 336 284 567
Buy-back and cancellation of shares (22 796 174) –
Shares issued for cash – 9 970 240
Shares issued in terms of the share incentive scheme – 3 889 939
Balance at end of year 327 348 572 350 144 746
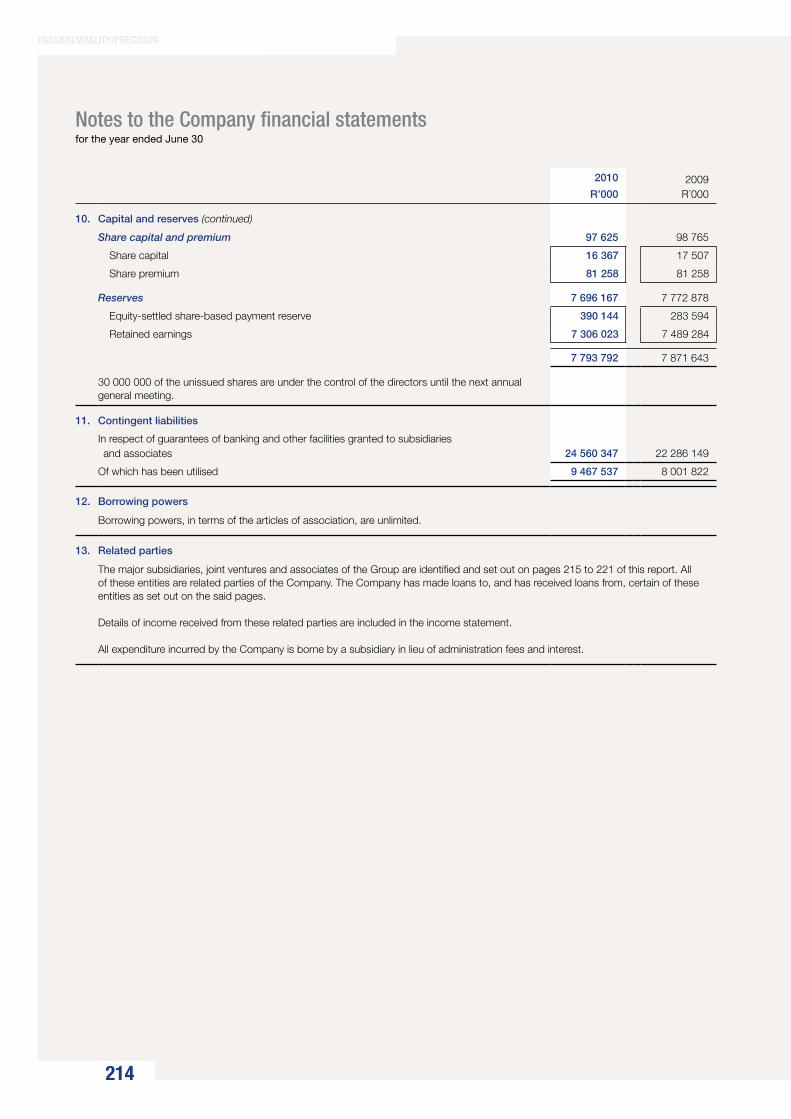
PASSION/VITALITY/PRECISION
214
Notes to the Company financial statements for the year ended June 30
2010
R’000 2009
R’000
10. Capital and reserves (continued)
Share capital and premium 97 625 98 765
Share capital 16 367 17 507
Share premium 81 258 81 258
Reserves 7 696 167 7 772 878
Equity-settled share-based payment reserve 390 144 283 594
Retained earnings 7 306 023 7 489 284
7 793 792 7 871 643
30 000 000 of the unissued shares are under the control of the directors until the next annual general meeting.
11. Contingent liabilities
In respect of guarantees of banking and other facilities granted to subsidiaries and associates 24 560 347 22 286 149
Of which has been utilised 9 467 537 8 001 822
12. Borrowing powers
Borrowing powers, in terms of the articles of association, are unlimited.
13. Related parties
The major subsidiaries, joint ventures and associates of the Group are identified and set out on pages 215 to 221 of this report. All of these entities are related parties of the Company. The Company has made loans to, and has received loans from, certain of these entities as set out on the said pages.
Details of income received from these related parties are included in the income statement.
All expenditure incurred by the Company is borne by a subsidiary in lieu of administration fees and interest.
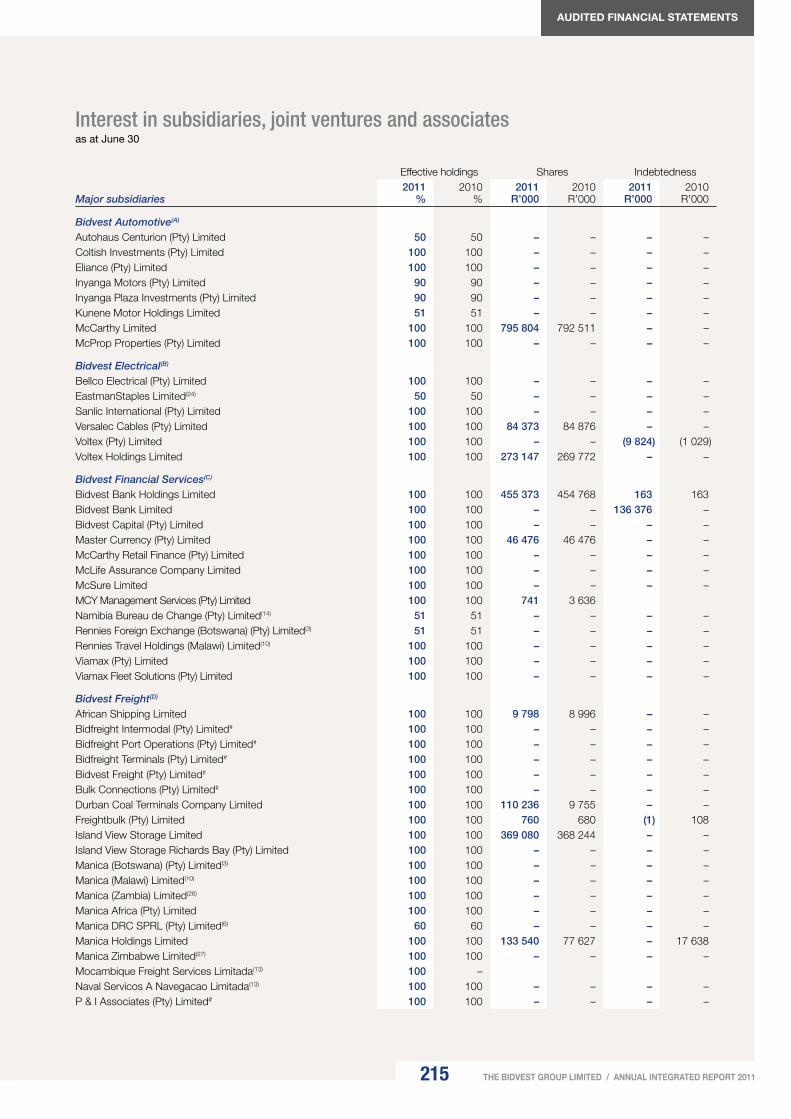
215
audited FiNaNCiaL StateMeNtS
tHe BidVeSt GROuP LiMited / aNNuaL iNteGRated RePORt 2011
Interest in subsidiaries, joint ventures and associatesas at June 30
Effective holdings Shares Indebtedness
Major subsidiaries2011
%2010
%2011
R’0002010
R’0002011
R’0002010
R’000
Bidvest Automotive(A)
Autohaus Centurion (Pty) Limited 50 50 – – – – Coltish Investments (Pty) Limited 100 100 – – – – Eliance (Pty) Limited 100 100 – – – – Inyanga Motors (Pty) Limited 90 90 – – – – Inyanga Plaza Investments (Pty) Limited 90 90 – – – – Kunene Motor Holdings Limited 51 51 – – – – McCarthy Limited 100 100 795 804 792 511 – – McProp Properties (Pty) Limited 100 100 – – – –
Bidvest Electrical(B)
Bellco Electrical (Pty) Limited 100 100 – – – – EastmanStaples Limited(24) 50 50 – – – – Sanlic International (Pty) Limited 100 100 – – – – Versalec Cables (Pty) Limited 100 100 84 373 84 876 – – Voltex (Pty) Limited 100 100 – – (9 824) (1 029)Voltex Holdings Limited 100 100 273 147 269 772 – –
Bidvest Financial Services(C)
Bidvest Bank Holdings Limited 100 100 455 373 454 768 163 163 Bidvest Bank Limited 100 100 – – 136 376 – Bidvest Capital (Pty) Limited 100 100 – – – – Master Currency (Pty) Limited 100 100 46 476 46 476 – – McCarthy Retail Finance (Pty) Limited 100 100 – – – – McLife Assurance Company Limited 100 100 – – – – McSure Limited 100 100 – – – – MCY Management Services (Pty) Limited 100 100 741 3 636 Namibia Bureau de Change (Pty) Limited(14) 51 51 – – – – Rennies Foreign Exchange (Botswana) (Pty) Limited(3) 51 51 – – – – Rennies Travel Holdings (Malawi) Limited(10) 100 100 – – – – Viamax (Pty) Limited 100 100 – – – – Viamax Fleet Solutions (Pty) Limited 100 100 – – – –
Bidvest Freight(D)
African Shipping Limited 100 100 9 798 8 996 – – Bidfreight Intermodal (Pty) Limited# 100 100 – – – – Bidfreight Port Operations (Pty) Limited# 100 100 – – – – Bidfreight Terminals (Pty) Limited# 100 100 – – – – Bidvest Freight (Pty) Limited# 100 100 – – – – Bulk Connections (Pty) Limited# 100 100 – – – – Durban Coal Terminals Company Limited 100 100 110 236 9 755 – – Freightbulk (Pty) Limited 100 100 760 680 (1) 108 Island View Storage Limited 100 100 369 080 368 244 – – Island View Storage Richards Bay (Pty) Limited 100 100 – – – – Manica (Botswana) (Pty) Limited(3) 100 100 – – – – Manica (Malawi) Limited(10) 100 100 – – – – Manica (Zambia) Limited(26) 100 100 – – – – Manica Africa (Pty) Limited 100 100 – – – – Manica DRC SPRL (Pty) Limited(6) 60 60 – – – – Manica Holdings Limited 100 100 133 540 77 627 – 17 638 Manica Zimbabwe Limited(27) 100 100 – – – – Mocambique Freight Services Limitada(13) 100 – Naval Servicos A Navegacao Limitada(13) 100 100 – – – – P & I Associates (Pty) Limited# 100 100 – – – –

PASSION/VITALITY/PRECISION
216
Interest in subsidiaries, joint ventures and associatesas at June 30
Effective holdings Shares Indebtedness
Major subsidiaries2011
%2010
%2011
R’0002010
R’0002011
R’0002010
R’000
Bidvest Freight(D) (continued)Renfreight (Pty) Limited 100 100 96 559 95 554 (108) (108)Rennie Murray and Company (Pty) Limited# 100 100 – – – – Rennies Distribution Services (Pty) Limited# 100 100 – – – – Rennies Property Holdings (Pty) Limited 100 100 54 000 54 000 – – Rennies Ships Agency (Pty) Limited# 100 100 – – – – Safcor Freight (Pty) Limited 100 100 108 274 108 786 – – South African Bulk Terminals Limited 100 100 52 475 51 766 – – South African Container Depots (Pty) Limited# 100 100 – – – – South African Container Stevedores (Pty) Limited 82 82 91 77 – –
Bidvest Industrial(E)
Afcom Group Limited 100 100 12 496 12 496 31 587 31 587 African Commerce Developing Company (Pty) Limited# 100 100 – – – – Berzack Brothers (Jhb) (Pty) Limited 100 100 – – – – Berzack Brothers (Pty) Limited 100 100 – – – – Bidvest Materials Handling (Pty) Limited 100 100 – – – – Bloch & Levitan (Pty) Limited 100 100 – – – – Buffalo Executape (Pty) Limited# 100 100 – – – – Buffalo Tapes (Pty) Limited# 100 100 – – – – Ram Fasteners (Pty) Limited 100 100 3 525 3 525 4 806 6 806 Sellotape (Pty) Limited# 100 100 – – – – Tuning Fork (Pty) Limited 100 100 – – – – Vulcan Catering Supplies (Pty) Limited 100 100 – – – –
Bidvest Office(F)
Back To School Supplies (Pty) Limited 100 100 36 36 (36) (36)Bid Information Exchange (Pty) Limited# 100 100 – – – – Bidoffice (Pty) Limited 100 100 – – – – Bonanza Holdings (Pty) Limited 100 100 – – 25 25 Budget Desks And Chairs (Pty) Limited# 100 100 – – – – Cecil Nurse (Pty) Limited# 100 100 – – – – Contract Office Products (Pty) Limited# 100 100 – – – – Dauphin Office Seating S.A. (Pty) Limited 71 71 1 908 1 872 – – Ditulo Office (Pty) Limited 43 43 143 143 – – Global Payment Technologies (Pty) Limited# 100 100 44 301 44 301 – – Hortors Stationery (Pty) Limited# 100 100 – – – – Minolco (Pty) Limited# 100 100 – – – – Nuclear Corporate Furniture (Pty) Limited# 100 100 – – – – Offurn Clearance House (Pty) Limited# 100 100 5 963 5 963 (6 551) (6 551)Pago Designs (Pty) Limited 100 100 – – 600 600 Seating (Pty) Limited# 100 100 – – – – South African Diaries (Pty) Limited# 100 100 – – – – Waltons (Pty) Limited# 100 100 31 31 (31) (31)
Bidvest Paperplus(G)
Bidpaper Plus (Pty) Limited 100 100 – – – – Bidpaper Plus Holdings Limited 100 100 145 425 142 776 – – Blesston Printing and Associates (Pty) Limited 100 100 – – – – Email Connection (Pty) Limited 100 100 1 708 1 708 – – Expressed Solutions (Pty) Limited 100 100 – – – – Globe Stationery Manufacturing Company (Pty) Limited 100 100 – – – – Kolok (Pty) Limited# 100 100 – – – – Kolok Africa (Pty) Limited 100 100 – – – –

217
audited FiNaNCiaL StateMeNtS
tHe BidVeSt GROuP LiMited / aNNuaL iNteGRated RePORt 2011
Effective holdings Shares Indebtedness
Major subsidiaries2011
%2010
%2011
R’0002010
R’0002011
R’0002010
R’000
Bidvest Paperplus(G) (continued)Lithotech Afric Mail Cape (Pty) Limited 100 100 – – – – Lithotech Afric Mail JHB (Pty) Limited 100 100 – – – – Lithotech Afric Mail Pinetown (Pty) Limited 100 100 – – – – Lithotech Corporate (Pty) Limited 100 100 – – – – Lithotech Group Services (Pty) Limited 100 100 – – – – Lithotech Imaging Data Solutions (Pty) Limited 100 100 – – – – Lithotech International Limited 100 100 – – – – Lithotech Labels (Pty) Limited 100 100 – – – – Lithotech Listing and Logistics (Pty) Limited 100 100 – – – – Lithotech Manufacturing Cape (Pty) Limited 100 100 – – – – Lithotech Manufacturing Pinetown (Pty) Limited 100 100 – – – – Lithotech Sales Bloemfontein (Pty) Limited 100 100 – – – – Lithotech Sales Cape (Pty) Limited 100 100 – – – – Lithotech Sales East London (Pty) Limited 100 100 – – – – Lithotech Sales Johannesburg (Pty) Limited 100 100 – – – – Lithotech Sales KwaZulu-Natal (Pty) Limited 100 100 – – – – Lithotech Sales Port Elizabeth (Pty) Limited 100 100 – – – – Lithotech Sales Pretoria (Pty) Limited 100 100 – – – – Lithotech Solutions (Pty) Limited 100 100 – – – – Lufil Packaging (Pty) Limited 100 100 59 244 59 244 – – Mocobe Properties (Pty) Limited 100 100 – – – – Ozalid South Africa (Pty) Limited 100 100 – – – – Paragon Business Communications Limited 100 100 58 893 55 819 – – Phakama Print (Pty) Limited 40 40 – – – – Rotolabel (Tvl) (Pty) Limited 100 100 – – – – Silveray Manufacturers (Pty) Limited 100 100 – – – – Silveray Statmark Company (Pty) Limited 100 100 6 848 6 848 (3 089) (3 089)
Bidvest Rental and Products(H)
Bidserv Industrial Products (Pty) Limited# 100 100 – – – – Bidserv Mozambique Limitada(13) 70 70 – – – – Bidvest (Zambia) (Pty) Limited(26) 100 100 – – – – Bosnandi Laundry (Pty) Limited 51 51 – – – – Clockwork Giant Clothing (Pty) Limited(22) 100 100 – – – – Execuflora (Pty) Limited# 100 100 – – – – First Garment Rental (Pty) Limited# 100 100 – – – – Giant Clothing Limited(10) 100 100 – – – – Hotel Amenities Suppliers (Pty) Limited# 100 100 – – – – Industro-Clean Botswana (Pty) Limited(3) 75 80 – – – – Masterguard Fabric Protection Africa (Pty) Limited 100 50 2 597 16 – – Pureau Fresh Water Company (Pty) Limited 82 82 24 570 24 570 – – Rochester Midlands Industries SA (Pty) Limited 50 50 167 167 – – Silk By Design (Pty) Limited# 100 100 – – – – Steiner Environmental Solutions (Pty) Limited# 100 100 – – – – Steiner Hygiene (Pty) Limited# 100 100 – – – – Steiner Hygiene Swaziland (Pty) Limited# (22) 100 100 – – – – Umoja Property Solutions (Pty) Limited 51 51 – – – –
Bidvest Services(I)
African Consultancy For Transportation Security (Pty) Limited 50 50 – – – – Bidserv (Pty) Limited# 100 100 – – – – Bidtrack (Pty) Limited# 100 100 – – – – Bidvest Magnum (Pty) Limited# 100 100 – – – – Bidvest Magnum Mining Security (Pty) Limited 58 51 – – – –

PASSION/VITALITY/PRECISION
218
Interest in subsidiaries, joint ventures and associatesas at June 30
Effective holdings Shares Indebtedness
Major subsidiaries2011
%2010
%2011
R’0002010
R’0002011
R’0002010
R’000
Bidvest Services(I) (continued)Dinatla Property Services (Pty) Limited 50 50 9 948 17 109 – – First In Staffing Solutions (Pty) Limited 100 100 – – – – Langa Status Property Services (Pty) Limited 90 90 – – – – Nomtsalane Property Services (Pty) Limited 86 86 – – – – Prestige Cleaning Services (Pty) Limited# 100 100 – – – – Setsebi Property Services (Pty) Limited 100 100 – – – – Taemane Cleaning Services (Pty) Limited 100 70 – – – – TMS Group (Pty) Limited# 100 100 – – – – TMS Group Industrial Services (Pty) Limited 100 100 – – 32 32 Top Turf Botswana (Pty) Limited(3) 100 100 – – – – Top Turf Group (Pty) Limited# 100 100 4 4 (4) (4)Top Turf Mauritius (Pty) Limited(12) 100 100 – – – – Top Turf Seychelles (Pty) Limited(19) 100 100 – – – – Top Turf Lesotho (Pty) Limited(9) 100 100 – – – – Total Manpower Solutions (Pty) Limited 100 100 – – – – Total Outdoors (Swaziland) (Pty) Limited(22) 100 100 – – – – Vericon Outsourcing (Pty) Limited# 100 100 – – – – Vericon Outsourcing (Pty) Limited# 100 100 – – – – Veriserv (Pty) Limited# 100 100 – – – –
Bidvest Travel and Aviation(J)
Bidair Services (Pty) Limited 100 100 921 921 59 291 3 326 Bidtravel (Pty) Limited# 100 100 – – – – Commuter Handling Services (Pty) Limited 60 60 – – – – Concorde Travel (Pty) Limited t/a Carlson Wagonlit Travel 90 90 47 644 47 654 – – Connex Travel (Pty) Limited t/a BCD Travel 61 61 18 146 28 176 5 513 5 513 Express Air Services (Namibia) (Pty) Limited(14) 90 90 – – – – Express Air Services (Pty) Limited 100 100 – – – – Harvey World Travel Southern Africa (Pty) Limited 50 50 3 464 3 464 – – Macardo Lodge (Pty) Limited t/a Travelwise Travel(3) 51 51 – – – – McCarthy Car Hire (Botswana) (Pty) Limited(3) 100 100 – – – – MyMarketdot Com (Pty) Limited# 100 100 – – – – Rennies Travel (Pty) Limited t/a HRG Rennies Travel# 100 100 2 054 2 054 (8 431) (10 335)Travel Connections (Pty) Limited 60 60 9 195 9 216 – – World Travel (Pty) Limited# 100 100 7 407 7 407 – –
Bidvest Foodservice Asia Pacific(K)
Amosco Pte Limited(20) 100 100 – – – – Angliss (Shenzhen) Food Service Company Limited(4) 100 100 – – – – Angliss Beijing Food Service Limited(4) 70 70 – – – – Angliss China Limited (Acl)(7) 100 100 – – – – Angliss Guangzhou Food Service Limited(4) 90 90 – – – – Angliss Hong Kong Food Service Limited(7) 100 100 – – – – Angliss International Investment Limited(7) 100 100 – – – – Angliss Macau Food Service Limited(4) 100 100 – – – – Angliss Seafood Pte Limited(20) 100 100 – – – – Angliss Shanghai Food Service Limited(4) 70 70 – – – – Angliss Shanghai International Trading Limited(4) 100 100 – – – – Angliss Singapore Pte Limited(20) 100 100 – – – – Angliss USA Inc.(25) 100 100 – – – – Avid Foodservice Sdn Bhd(11) 100 100 – – – – Bidvest (N.S.W) Limited(1) 100 100 – – – – Bidvest (Victoria) (Pty) Limited(1) 100 100 – – – – Bidvest (W.A.) (Pty) Limited(1) 100 100 – – – – Bidvest Australia Limited(1) 100 100 – – – – Bidvest New Zealand Limited(16) 100 100 – – – –
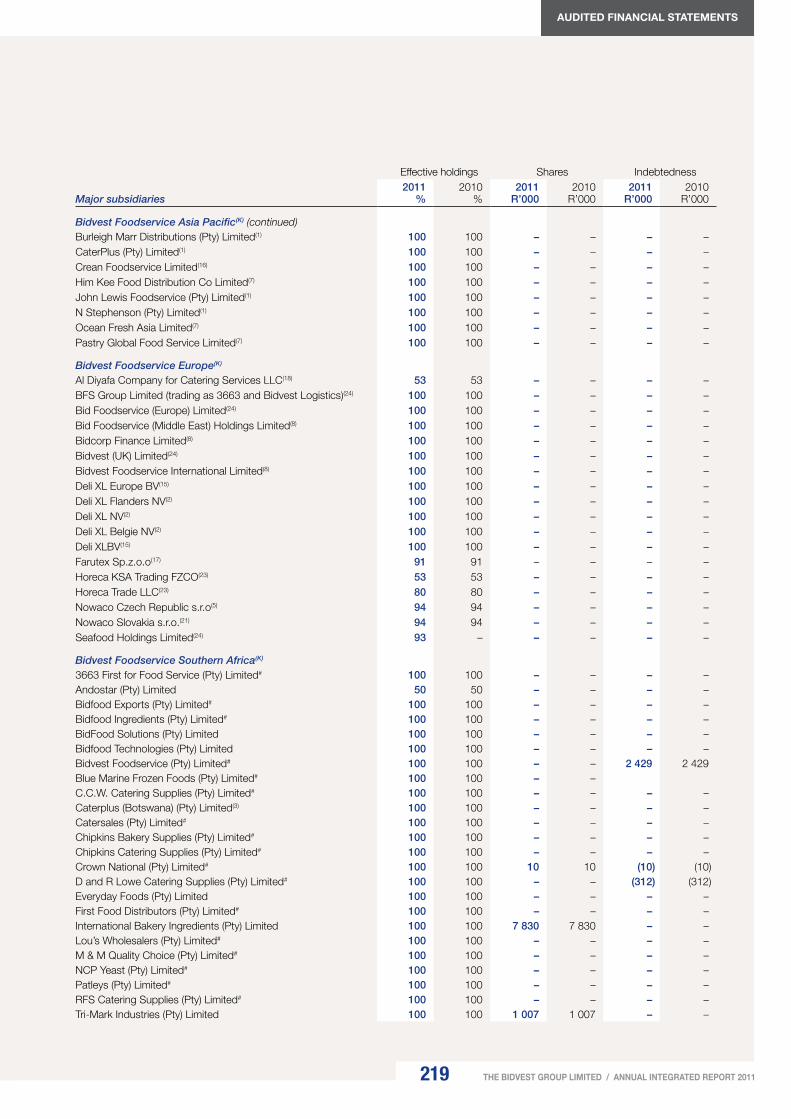
219
audited FiNaNCiaL StateMeNtS
tHe BidVeSt GROuP LiMited / aNNuaL iNteGRated RePORt 2011
Effective holdings Shares Indebtedness
Major subsidiaries2011
%2010
%2011
R’0002010
R’0002011
R’0002010
R’000
Bidvest Foodservice Asia Pacific(K) (continued)Burleigh Marr Distributions (Pty) Limited(1) 100 100 – – – – CaterPlus (Pty) Limited(1) 100 100 – – – – Crean Foodservice Limited(16) 100 100 – – – – Him Kee Food Distribution Co Limited(7) 100 100 – – – – John Lewis Foodservice (Pty) Limited(1) 100 100 – – – – N Stephenson (Pty) Limited(1) 100 100 – – – – Ocean Fresh Asia Limited(7) 100 100 – – – – Pastry Global Food Service Limited(7) 100 100 – – – –
Bidvest Foodservice Europe(K)
Al Diyafa Company for Catering Services LLC(18) 53 53 – – – – BFS Group Limited (trading as 3663 and Bidvest Logistics)(24) 100 100 – – – – Bid Foodservice (Europe) Limited(24) 100 100 – – – – Bid Foodservice (Middle East) Holdings Limited(8) 100 100 – – – – Bidcorp Finance Limited(8) 100 100 – – – – Bidvest (UK) Limited(24) 100 100 – – – – Bidvest Foodservice International Limited(8) 100 100 – – – – Deli XL Europe BV(15) 100 100 – – – – Deli XL Flanders NV(2) 100 100 – – – – Deli XL NV(2) 100 100 – – – – Deli XL Belgie NV(2) 100 100 – – – – Deli XLBV(15) 100 100 – – – – Farutex Sp.z.o.o(17) 91 91 – – – – Horeca KSA Trading FZCO(23) 53 53 – – – – Horeca Trade LLC(23) 80 80 – – – – Nowaco Czech Republic s.r.o(5) 94 94 – – – – Nowaco Slovakia s.r.o.(21) 94 94 – – – – Seafood Holdings Limited(24) 93 – – – – –
Bidvest Foodservice Southern Africa(K)
3663 First for Food Service (Pty) Limited# 100 100 – – – – Andostar (Pty) Limited 50 50 – – – – Bidfood Exports (Pty) Limited# 100 100 – – – – Bidfood Ingredients (Pty) Limited# 100 100 – – – – BidFood Solutions (Pty) Limited 100 100 – – – – Bidfood Technologies (Pty) Limited 100 100 – – – – Bidvest Foodservice (Pty) Limited# 100 100 – – 2 429 2 429 Blue Marine Frozen Foods (Pty) Limited# 100 100 – – C.C.W. Catering Supplies (Pty) Limited# 100 100 – – – – Caterplus (Botswana) (Pty) Limited(3) 100 100 – – – – Catersales (Pty) Limited# 100 100 – – – – Chipkins Bakery Supplies (Pty) Limited# 100 100 – – – – Chipkins Catering Supplies (Pty) Limited# 100 100 – – – – Crown National (Pty) Limited# 100 100 10 10 (10) (10)D and R Lowe Catering Supplies (Pty) Limited# 100 100 – – (312) (312)Everyday Foods (Pty) Limited 100 100 – – – – First Food Distributors (Pty) Limited# 100 100 – – – – International Bakery Ingredients (Pty) Limited 100 100 7 830 7 830 – – Lou’s Wholesalers (Pty) Limited# 100 100 – – – – M & M Quality Choice (Pty) Limited# 100 100 – – – – NCP Yeast (Pty) Limited# 100 100 – – – – Patleys (Pty) Limited# 100 100 – – – – RFS Catering Supplies (Pty) Limited# 100 100 – – – – Tri-Mark Industries (Pty) Limited 100 100 1 007 1 007 – –

PASSION/VITALITY/PRECISION
220
Interest in subsidiaries, joint ventures and associatesas at June 30
Effective holdings Shares Indebtedness
Major subsidiaries2011
%2010
%2011
R’0002010
R’0002011
R’0002010
R’000
Bidvest Namibia(B,D,F,J,K,L)
Bidvest Fisheries Holdings (Pty) Limited(14) 52 52 – – – – Bidvest Namibia Commercial Holdings (Pty) Limited(14) 52 52 – – – – Bidvest Namibia Information Technology (Pty) Limited(14) 52 52 – – – – Bidvest Namibia Limited(14) 52 52 224 534 212 806 (1) (1)Bidvest Namibia Property Holdings (Pty) Limited(14) 52 52 – – – – Budget Rent a Car (Pty) Limited(14) 52 52 – – – – Caterplus Namibia (Pty) Limited(14) 52 52 – – – – Cecil Nurse Namibia (Pty) Limited(14) 52 52 – – – – Elzet Development (Pty) Limited(14) 52 52 – – – – Kolok (Namibia) (Pty) Limited(14) 52 52 – – – – Lubrication Specialists (Pty) Limited(14) 52 52 – – – – Luderitz Bay Shipping & Forwarding (Pty) Limited(14) 52 52 – – – – Manica Group Namibia (Pty) Limited(14) 52 52 – – – – Minolco (Namibia) (Pty) Limited(14) 52 52 – – – – Namibian Sea Products Limited(14) 36 36 – – – – Namsov Fishing Enterprises (Pty) Limited(14) 36 36 – – – – Namsov Industrial Properties (Pty) Limited(14) 36 36 – – – – Rennies Travel (Namibia) (Pty) Limited(14) 52 52 – – – – Trachurus Fishing (Pty) Limited(14) 27 27 – – – – Twafika Fishing Enterprises (Pty) Limited(14) 39 39 – – – – Voltex Namibia (Pty) Limited(14) 52 52 – – – – Waltons Namibia (Pty) Limited(14) 52 52 – – – – Walvis Bay Airport Services (Pty) Limited(14) 52 52 – – – – Walvis Bay Stevedoring Company (Pty) Limited(14) 29 29 – – – – Woker Freight Services (Pty) Limited(14) 52 52 – – – – Bidvest Corporate(L)
Abland North (Pty) Limited 50 50 – – – – Airport Logistics Property Holdings (Pty) Limited 50 50 142 142 – – BB Investment Company (Pty) Limited 100 100 – – – – BICP Offshore Holdings (Pty) Limited 100 100 – – 2 018 2 018 Bid Corporation (Pty) Limited 100 100 33 208 3 001 2 700 757 2 706 967 Bid Financial Services (Pty) Limited 100 100 – – 14 252 14 252 Bid Industrial and Commercial Products (IOM) Limited(8) 100 100 – – – – Bid Industrial Holdings (Pty) Limited 100 100 241 611 159 527 306 455 671 497 Bid Services Division (IOM) Limited(8) 100 100 – – – – Bid Services Division (Pty) Limited 100 100 921 419 690 003 643 448 Bid Services Division (UK) Limited(24) 100 100 – – – – Bid Services Division Mauritius Limited(12) 100 100 – – – – Bidcorp Limited 100 100 – – – – Bidcorp Outsourced Services Limited(24) 100 100 – – – – Bidcorp Property Limited(24) 100 100 – – – – Bidvest Corporate Services (Pty) Limited# 100 100 – – 52 52 Bidvest International Limited(8) 100 100 – – – – Bidvest Procurement (Pty) Limited# 100 100 – – – – Bidvest Properties (Pty) Limited 100 100 – – 19 180 66 Bidvest Properties International Limited(8) 100 100 – – – – Bidvest Wits University Football Club (Pty) Limited 60 60 – – 40 453 33 383 Bidvestco Limited 100 100 44 059 44 059 (44 068) (44 068)Brentwood Technical Services Limited(24) 100 100 – – – – Gerlan Properties (Pty) Limited 50 50 5 700 5 700 – – Ontime Automotive (Specialist Operations) Limited(24) 100 100 – – – – Ontime Automotive Limited(24) 100 100 – – – –

221
audited FiNaNCiaL StateMeNtS
tHe BidVeSt GROuP LiMited / aNNuaL iNteGRated RePORt 2011
Effective holdings Shares Indebtedness
Major subsidiaries2011
%2010
%2011
R’0002010
R’0002011
R’0002010
R’000
Bidvest Corporate(L) (continued)Ontime Parking Solutions Limited(24) 100 100 – – – – Ontime Rescue & Recovery Limited(24) 100 100 – – – – Primeinvest 5 (Pty) Limited 100 100 – – 30 051 30 053 Siki Fox Properties (Pty) Limited 100 100 1 002 1 002 – – Silveray Properties (Pty) Limited 100 100 8 833 8 833 – – Skillion Limited(24) 100 100 – – – – Trustone Investments (Pty) Limited 100 100 – – – – Other 114 683 386 746 (116 656) (173 847)
3 740 905 3 734 126 3 854 921 3 930 542Major joint ventures Cape Town Bulk Storage (Pty) Limited(D) 50 50 – – – – Ensimbini Terminals (Pty) Limited(D) 50 50 4 540 4 540 – –
4 540 4 540 – – Major associates “K” Line Shipping (South Africa) (Pty) Limited (December 31 year-end)(D) 49 49 – – – Amalgamated Appliance Holdings Limited(E) 28 28 – – – – Amalgamated Automobile Distributors (Pty) Limited(A) 50 50 10 000 – – – Bidsport (Pty) Limited (trading as MSC Sports)(L) 50 50 9 636 9 363 – – Comair Limited(J) 26 26 – – – – Compu-Clearing Outsourcing Limited(D) 21 21 5 742 5 742 – – CSAV Group Agencies (South Africa) (Pty) Limited(D) 40 40 – – – – Imperial McCarthy (Pty) Limited(A) 50 50 – – – – Sebenza Forwarding & Shipping (Pty) Limited (March 31 year-end)(D) 45 45 5 011 5 011 – – Silapha Office Products (Pty) Limited(F) 40 40 20 20 – – Stellar Africa (Pty) Limited(L) 25 25 – 172 Supaswift (Pty) Limited(D) 36 36 – – 20 000 20 000 Ubuhle Be Dauphin Office Seating (Pty) Limited(F) 28 28 – – – – Waltons Mozambique Limitada (December 31 year-end)(F) (13) 50 50 – – – – Yeastpro (Pty) Limited (April 30 year-end)(K) 25 25 32 381 32 381 – – Other 23 769 22 871 95 95
86 559 75 560 20 095 20 095
Amounts owing by or to subsidiaries, joint ventures and associates are unsecured, interest free and have no fixed terms of repayment.
*Less than R1 000#Trading as an agent Country of incorporation if not South Africa(1) Australia(2) Belgium(3) Botswana(4) China(5) Czech Republic(6) Democratic Republic
of Congo(7) Hong Kong(8) Isle of Man(9) Lesotho(10) Malawi(11) Malaysia(12) Mauritius(13) Mozambique
(14) Namibia (15) Netherlands (16) New Zealand (17) Poland (18) Saudi Arabia(19) Seychelles(20) Singapore(21) Slovakia(22) Swaziland(23) United Arab Emirates(24) United Kingdom(25) United States of America(26) Zambia(27) Zimbabwe
Nature of business(A) Motor vehicle retailing and related services (B) Manufacturer and distributor of electrical products and services (C)Banking products and services, foreign exchange and insurance (D) Freight, forwarding, clearing, distribution, warehousing and allied activities(E) Distributor of forklifts, power and marine products, music and sound equipment,
electrical appliances, packaging closures and catering equipment(F) Distributor of office stationery; furniture and office automation products and
related services(G)Manufacturer, supplier and distributor of commercial office products, printer
products, services, stationery and packaging products(H)Rental hygiene equipment, garments and water coolers; suppliers of
consumables, specialised clothing and laundry services(I) Cleaning, hygiene, security, and interior and exterior landscaping services(J) Travel management services, aviation services and car rental (K) Catering supplies, food and allied products (L) Group services, investment and property holding
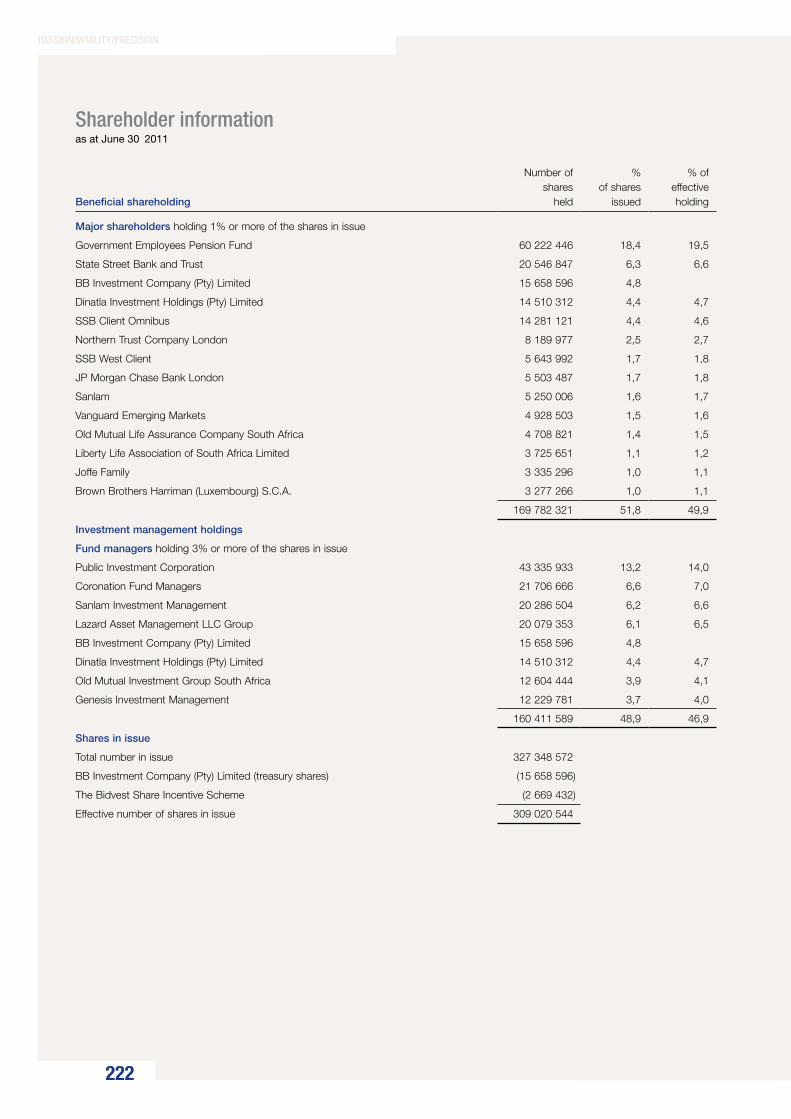
PASSION/VITALITY/PRECISION
222
Shareholder informationas at June 30 2011
Beneficial shareholding
Number ofshares
held
% of shares
issued
% of effectiveholding
Major shareholders holding 1% or more of the shares in issue
Government Employees Pension Fund 60 222 446 18,4 19,5
State Street Bank and Trust 20 546 847 6,3 6,6
BB Investment Company (Pty) Limited 15 658 596 4,8
Dinatla Investment Holdings (Pty) Limited 14 510 312 4,4 4,7
SSB Client Omnibus 14 281 121 4,4 4,6
Northern Trust Company London 8 189 977 2,5 2,7
SSB West Client 5 643 992 1,7 1,8
JP Morgan Chase Bank London 5 503 487 1,7 1,8
Sanlam 5 250 006 1,6 1,7
Vanguard Emerging Markets 4 928 503 1,5 1,6
Old Mutual Life Assurance Company South Africa 4 708 821 1,4 1,5
Liberty Life Association of South Africa Limited 3 725 651 1,1 1,2
Joffe Family 3 335 296 1,0 1,1
Brown Brothers Harriman (Luxembourg) S.C.A. 3 277 266 1,0 1,1
169 782 321 51,8 49,9
Investment management holdings
Fund managers holding 3% or more of the shares in issue
Public Investment Corporation 43 335 933 13,2 14,0
Coronation Fund Managers 21 706 666 6,6 7,0
Sanlam Investment Management 20 286 504 6,2 6,6
Lazard Asset Management LLC Group 20 079 353 6,1 6,5
BB Investment Company (Pty) Limited 15 658 596 4,8
Dinatla Investment Holdings (Pty) Limited 14 510 312 4,4 4,7
Old Mutual Investment Group South Africa 12 604 444 3,9 4,1
Genesis Investment Management 12 229 781 3,7 4,0
160 411 589 48,9 46,9
Shares in issue
Total number in issue 327 348 572
BB Investment Company (Pty) Limited (treasury shares) (15 658 596)
The Bidvest Share Incentive Scheme (2 669 432)
Effective number of shares in issue 309 020 544
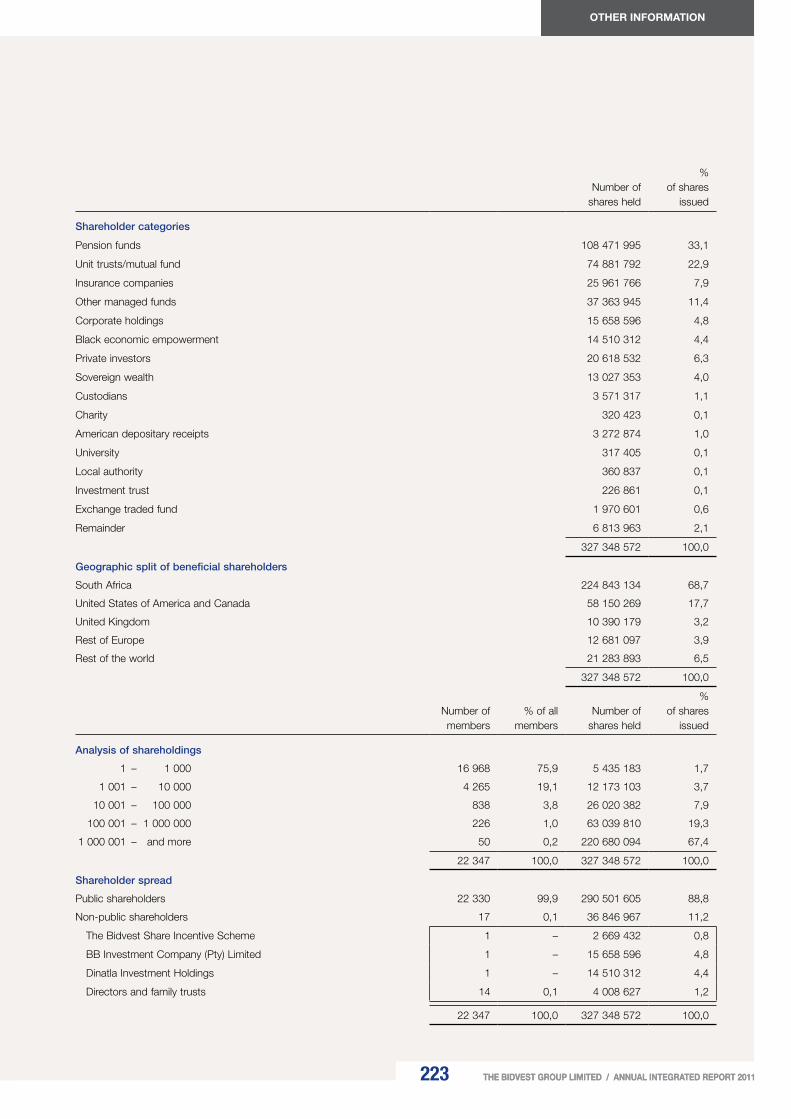
223 THE BIDVEST GROUP LIMITED / ANNUAL INTEGRATED REPORT 2011THE BIDVEST GROUP LIMITED / ANNUAL INTEGRATED REPORT 2011
OTHER INFORMATION
Number ofshares held
% of shares
issued
Shareholder categories
Pension funds 108 471 995 33,1
Unit trusts/mutual fund 74 881 792 22,9
Insurance companies 25 961 766 7,9
Other managed funds 37 363 945 11,4
Corporate holdings 15 658 596 4,8
Black economic empowerment 14 510 312 4,4
Private investors 20 618 532 6,3
Sovereign wealth 13 027 353 4,0
Custodians 3 571 317 1,1
Charity 320 423 0,1
American depositary receipts 3 272 874 1,0
University 317 405 0,1
Local authority 360 837 0,1
Investment trust 226 861 0,1
Exchange traded fund 1 970 601 0,6
Remainder 6 813 963 2,1
327 348 572 100,0
Geographic split of beneficial shareholders
South Africa 224 843 134 68,7
United States of America and Canada 58 150 269 17,7
United Kingdom 10 390 179 3,2
Rest of Europe 12 681 097 3,9
Rest of the world 21 283 893 6,5
327 348 572 100,0
Number ofmembers
% of allmembers
Number ofshares held
% of shares
issued
Analysis of shareholdings
1 – 1 000 16 968 75,9 5 435 183 1,7
1 001 – 10 000 4 265 19,1 12 173 103 3,7
10 001 – 100 000 838 3,8 26 020 382 7,9
100 001 – 1 000 000 226 1,0 63 039 810 19,3
1 000 001 – and more 50 0,2 220 680 094 67,4
22 347 100,0 327 348 572 100,0
Shareholder spread
Public shareholders 22 330 99,9 290 501 605 88,8
Non-public shareholders 17 0,1 36 846 967 11,2
The Bidvest Share Incentive Scheme 1 – 2 669 432 0,8
BB Investment Company (Pty) Limited 1 – 15 658 596 4,8
Dinatla Investment Holdings 1 – 14 510 312 4,4
Directors and family trusts 14 0,1 4 008 627 1,2
22 347 100,0 327 348 572 100,0

PASSION/VITALITY/PRECISION
224
Shareholders’ diary
Financial year-end June 30
Annual general meeting November
Report and accounts
Interim report for the half year ending December 31 February/March
Announcement of annual results August/September
Annual report October
Distributions Declaration Payment
Interim distribution February/March March
Final distribution August/September September

225 THE BIDVEST GROUP LIMITED / ANNUAL INTEGRATED REPORT 2011
Glossary
ART antiretroviral treatment for those suffering from or exposed to HIV/Aids
B-BBEE broad-based black economic empowerment
BEE black economic empowerment
CDP carbon disclosure project
CO2e Carbon dioxide emissions
COBiT control objectives for information and related technology
CPI consumer price index
CPA Consumer Protection Act
CSI Corporate Social Investment
DTI South Africa’s Department of Trade and Industry
EMS environmental management system
Eskom South African national electricity supply company
ERP enterprise resource planning
FTE Full-time employee
GDP gross domestic product
GHG greenhouse gas
GRI Global Reporting Initiative
HACCP hazard analysis critical control point
HDI historically disadvantaged individual
IAS International Auditing Standards
IFRS International Financial Reporting Standards
Industry charter(s) voluntary, wide commitments to black economic empowerment goals
ISO International Organisation for Standardisation quality management and quality assurance series of standards (9000) and environmental management series of standards (14001)
JSE the Johannesburg Stock Exchange
KZN KwaZulu-Natal
LTIFR lost-time injury frequency rate (number of lost-time injuries per million manhours worked)
LRA Labour Relations Act
NUMSA National Union of Metal Workers of South Africa
OEM original equipment manufacturer
OHS Occupational Health and Safety Act (No. 85 of 1993), South Africa
PPP public-private partnership
QMS quality management system
QSR quick-service restaurant
SADC Southern African Development Community
SARB South African Reserve Bank
SED socio-economic development
SETA sectoral education and training authorities
SHERQ Safety, health, environment, risk, quality
SRI Index Socially Responsible Investment Index
STC secondary taxation on companies
the Codes/the DTI Codes
codes of good practice for broad-based black economic empowerment as published by the Department of Trade and Industry, South Africa
TNPA Transnet National Ports Authority
VCT voluntary counselling and testing (HIV/Aids-related)
World Cup 2010 FIFA World CupTM
OTHER INFORMATION

PASSION/VITALITY/PRECISION
226
Administration The Bidvest Group LimitedIncorporated in the Republic of South AfricaRegistration number: 1946/021180/06ISIN: ZAE000050449Share code: BVT
Secretary Craig Brighten
Auditors Deloitte & Touche
Legal advisersEdward Nathan SonnenbergsBaker & McKenzieMaitland & CoWerksmans Inc
BankersThe Standard Bank of South Africa LimitedStandard Bank London plcNedbank LimitedInvestec Bank LimitedHSBC Bank plcFirstRand Group LimitedCommonwealth Bank of Australia LimitedBarclays Bank LimitedASB Bank LimitedAbsa Bank Limited
Share transfer secretariesComputershare Investor Services (Pty) LimitedPO Box 61051Marshalltown21070861 100 950
SponsorsInvestec Securities Limited Group financial director, Group corporate finance and investor relationsDavid Cleasby
CommunicationsJunette Davidson
Registered officeBidvest House18 Crescent DriveMelrose ArchMelrose2196South Africa
PO Box 87274Houghton2041South Africa
Telephone +27 (11) 772 8700Facsimile +27 (11) 772 8970
Website and intranet www.bidvest.come-mail [email protected] or
[email protected] [email protected]
Bidvest call line0860 BIDVEST
Ethics lineFreecall 0800 50 60 90Freefax 0800 00 77 88e-mail [email protected] Tip-offs Anonymous
KwaZulu-Natal 138 Umhlanga Rocks, 4320 South Africa
Bidvest publications:
Annual report (including sustainable development and black economic empowerment)Our businesses and productsBidvoice (quarterly)Report to our peopleTransformation and empowerment Corporate video – Young at heartTelevision and print advertisementsA practical guide to sustainable developmentGreen office guideAll aboard (welcome to Bidvest)
Message to employeesPlease ensure that you are registered on the Bidvest intranet, accessed via the Bidvest website www.bidvest.com
OUR COMPANY LOGOS
BASTION GRAPHICS
BidvestExecuFlora
Rennies Ships AgencyRennie Murray
Namibia Commercial
South Africa

The Monarch butterfly (Danaus plexippus) is considered by many to be the most beautiful of all butterflies, perhaps even the ‘king’ of the order Lepidoptera, hence the name. It is also known for its evolutionary ingenuity, perseverance and value to man.
www.bidvest.com
Th
e Bid
vest Gro
up
Lim
ited A
nn
uA
L in
Te
Gr
AT
ed
re
po
rT
2011