The potential impacts of the songbird trade on mixed-species ...
42
1 The potential impacts of the songbird trade on mixed-species flocking 1 2 Abstract Mixed-species flocking is an important avian social system that supports a large 3 number of species. Current reviews of threats to mixed flocks have only examined two types of 4 anthropogenic pressures: different land use intensity and fragmentation. We highlight the bird 5 trade as another major potential threat for many mixed-species flocking species in Southeast 6 Asia. We examine the potential indirect impact of the bird trade by comparing social networks 7 of flocking data collected over two periods nearly 20 years apart (1997 and 2016) from the 8 same site in Sumatra, Indonesia. We find that the structure of the two networks were 9 significantly correlated. However, of the 90 species observed, 49 had previously been identified 10 as part of the bird trade. These species experienced a significantly greater decrease in network 11 centrality over time compared to the non-traded species, resulting in a loss of structure in the 12 mixed-species flocking network. Simulating further disturbances suggests that flocks may not 13 be resilient to the complete loss of two or more traded species. Our results suggest that 14 trapping is likely to be contributing to the degradation of flocks, and ultimately could lead to 15 the widespread declines in those other species that also rely on mixed-species flocking. 16 17 Key words: mixed-species flocks, community ecology, illegal wildlife trade, IUCN, resilience, 18 TRAFFIC 19
-
Upload
khangminh22 -
Category
Documents
-
view
1 -
download
0
Transcript of The potential impacts of the songbird trade on mixed-species ...
1
The potential impacts of the songbird trade on mixed-species flocking 1
2
Abstract Mixed-species flocking is an important avian social system that supports a large 3
number of species. Current reviews of threats to mixed flocks have only examined two types of 4
anthropogenic pressures: different land use intensity and fragmentation. We highlight the bird 5
trade as another major potential threat for many mixed-species flocking species in Southeast 6
Asia. We examine the potential indirect impact of the bird trade by comparing social networks 7
of flocking data collected over two periods nearly 20 years apart (1997 and 2016) from the 8
same site in Sumatra, Indonesia. We find that the structure of the two networks were 9
significantly correlated. However, of the 90 species observed, 49 had previously been identified 10
as part of the bird trade. These species experienced a significantly greater decrease in network 11
centrality over time compared to the non-traded species, resulting in a loss of structure in the 12
mixed-species flocking network. Simulating further disturbances suggests that flocks may not 13
be resilient to the complete loss of two or more traded species. Our results suggest that 14
trapping is likely to be contributing to the degradation of flocks, and ultimately could lead to 15
the widespread declines in those other species that also rely on mixed-species flocking. 16
17
Key words: mixed-species flocks, community ecology, illegal wildlife trade, IUCN, resilience, 18
TRAFFIC 19

2
Introduction 20
There is increasing awareness of the need to conserve ecological networks. Interactions 21
between species, such as pollinator-plant networks (Burkle, Marlin, & Knight, 2013) and 22
predator-prey food webs (Dunne, Williams, & Martinez, 2002), are widespread and form an 23
essential part of ecosystem functioning. One very common, but often overlooked system of 24
interactions are mixed-species groups. For example, mixed-species bird flocks (‘mixed flocks’ 25
hereafter) have been reported in many parts of the world (Munn 1985; Hutto 1994; Develey & 26
Peres 2000; Lee et al. 2005; Sridhar & Shanker 2014). They can represent a significant 27
proportion of the avifauna (e.g. over 50% of species reported in Madagascar, Eguchi et al. 1993; 28
in Australia, Bell 1983; and in the Dominican Republic, Latta & Wunderle 1996) and many 29
species are obligate flock members. In mixed flocks, participants (two or more species) travel 30
together in search of dispersed food (Buskirk 1976; Bell 1983), actively maintaining group 31
cohesion with both conspecifics and heterospecifics (Farine et al. 2014). Doing so can bring 32
important fitness benefits for participants (Dolby & Grubb 1998), and the survival rates of 33
obligate mixed flock members has been shown to be significantly higher than for species 34
feeding alone or in pairs (Jullien & Clobert 2000). Thus, conserving mixed-species flocks is likely 35
to be important for maintaining the presence and abundance of many species. 36
37
Mixed flock formation can be highly sensitive to environmental change (Mokross et al. 2014), 38
and, in particular, the loss of key species can fundamentally alter the dynamics of mixed flock 39
composition (e.g., Maldonado-Coelho & Marini 2000). This could be because flocking can 40
facilitate transfer of information about food resources among individuals (Aplin et al. 2012), 41

3
with some species playing a keystone role in spreading information about new food resources 42
(Suzuki 2012; Farine et al. 2015). Flocking can also confer anti-predator benefits (e.g., Thiollay 43
1999), with certain species providing significant vigilance benefits (Goodale & Kotagama 2005, 44
Martinez & Zenil 2002, Martinez et al. 2016). Species in mixed flocks are typically thought to 45
take on one of two different roles: nuclear species (the initiator of mixed flocks) and attendant 46
species (Moynihan 1962); and nuclear species have been shown to provide important benefits 47
for attendant species that cannot be gained in their absence (Dolby & Grubb 1998). However, in 48
terms of ecosystem function, the loss of a common attendant species could be equally severe if 49
these bring survival benefits to nuclear species via group augmentation or by providing foraging 50
benefits (e.g. Satischandra et al. 2007). Thus, identifying species that are central in their 51
communities, both nuclear or attendant, and identifying key threats they face is an important 52
goal for conservation biologists (Goodale, Beauchamp, & Ruxton, 2017). 53
54
Human disturbances are a major source of threats for ecosystems worldwide. Two main 55
anthropogenic disturbance impacts to mixed flocks have been studied: forest fragmentation 56
and different land-use intensity (see review by Goodale et al. 2015). Across studies, evidence 57
suggests that disturbed areas typically contain smaller flocks with reduced species richness 58
(Goodale et al. 2015). A few recent studies have also suggested that community structure (i.e. 59
the network of interactions among species) can also be affected (Mokross et al. 2014), with the 60
changing composition of species in the landscape impacting how species interact with one-61
another (Mammides et al. 2015). This community-centric approach is important because it 62
more directly links anthropogenic disturbances to functional change in the communities 63

4
involved. Such an approach is likely to be particularly important for disturbances in which the 64
impacts may be as severe as those caused by habitat disturbances, but where the cues much 65
less noticeable. One such potential threat, that has yet to be examined in the context of 66
conservation of avian communities, is bird trapping. 67
68
The wild bird trade is widespread in South-east Asia. Thousands of birds are sold to fulfill 69
various purposes: as pets or household ornaments, for food, religious release, traditional 70
medicine (Jepson & Ladle 2009; Shepherd 2012), or for bird singing competitions (where bird 71
owners use species such as White-rumped Shama Kittacincla malabarica and compete for the 72
best song; Eaton et al. 2015). Birds are sourced both locally and more widely. A recent 73
assessment in the three largest bird markets in Jakarta shows that 98% of the total volume of 74
birds traded (182 species) are native to Indonesia (Chng et al. 2015). However, the enormous 75
demand for birds (the wildlife trade is worth an estimated US$2.5 billion/year in East Asia and 76
the Pacific, and perhaps up to USD$1 billion/year in Indonesia alone; UNODC 2013) has severely 77
depleted animal populations in local forests. For example, many of the wild bird species that 78
are sold in the markets of Jakarta (on Java) are becoming very rare and now being sourced from 79
neighbouring Sumatra (Jepson & Laddle 2009, Shepherd 2012, Chng et al. 2016). If the same 80
species that are being trapped and traded are also species that are central in mixed flocks, for 81
example drongos are among the most commonly traded species (Shepherd 2012, Chng et al. 82
2016) and often considered as being nuclear in mixed flocks (Satischandra et al. 2007), then the 83
loss of these species could alter the entire structure of communities. Subsequently, this could 84

5
have significant repercussions on the behaviour of remaining species in the community (Dolby 85
& Grubb 1999), with potential carry-over effects into foraging and reproductive success. 86
87
In this study, we investigate the potential indirect effects of bird trapping to have an impact on 88
the formation and maintenance of mixed-species flocks. We conducted two surveys (1997 and 89
2016) in Lampung Province, in southwest Sumatra, Indonesia, where birds are actively being 90
targeted for the bird trade (see Fig. 1 for example). We use social network analysis to 91
investigate changes in the community structure over time. Social network analysis provides a 92
powerful toolbox for quantifying structural properties of multi-species communities, thus 93
moving beyond simple descriptors of flocking propensity. Specifically, it provides quantitative 94
measures of the importance of each species (i.e. its centrality, determined by the extent of co-95
occurrences in flocks with other species) as well as modelling tools (i.e. null models similar to 96
those used in community ecology, Gottelli & Graves 1996, Miller et al. 2017) to evaluate 97
whether mixed flock communities show non-random structural patterns. The latter question is 98
particularly important for determining the presence of interspecific relationships that are 99
important for the ongoing functioning of the system. 100
101
The aim of our study is to assess the changes in flocking structure in a protected area that has 102
experienced ongoing illegal bird trapping. Specifically, we use mixed flock networks generated 103
from our two surveys to test (i) whether networks in the two years are more structured than 104
expected under indiscriminate flocking (showing preferred associations between certain 105
species), (ii) whether the propensities for species to flock together (and thus the resulting 106

6
network structure) are correlated over the two survey periods spanning 19 years, (iii) whether 107
traded species and non-traded species differ in their social network centrality, (iv) whether the 108
centrality of traded and non-traded species changed over time, and (v) whether the mixed flock 109
networks are resilient to the complete removal of traded species. Our study also represents the 110
first major dataset on mixed flocks from Sumatra. 111
112
Study area 113
The Way Canguk Research Station (Lat. -5.658643, Long. 104.407098; Fig. 2) is located inside 114
the Bukit Barisan Selatan National Park (325,000 ha) and was established in 1997. The national 115
park is the third largest protected area in Sumatra, and contains some of the last intact areas of 116
lowland rainforest on this island (O’Brien & Kinnaird 1996). Our study was conducted along a 117
trail system covering an area of approximately 380-ha of intact lowland forest contained within 118
the Way Canguk Research Station area. The study area, and the research station, are 119
surrounded by a larger contiguous primary forest (the national park), while the national park is 120
surrounded by matrix of intact forest, burned forest, areas disturbed by illegal logging, and 121
agricultural lands. Illegal logging and encroachment for agricultural expansion are the main 122
threats to the national park, but this is not a threat inside the research station itself (Gaveau et 123
al. 2007). Two main anthropogenic disturbances occur in the Way Canguk Research Station: 124
forest fires and bird trapping. Forest fires occurred twice: 165 ha were burned in 1997/1998 125
(Kinnaird & O’Brien 1998) and in 2015, 7 ha of this previously damaged forest was burned a 126
second time (William Marthy pers. obs.). However, we conducted all surveys in areas more than 127
600m (beyond the impact of fire in this community, Adeney et al. 2006) and buffered by a river 128
7
from areas affected by fire, and thus do not believe it has a confounding effect. By contrast, 129
trapping of birds for trade has persisted on Way Canguk Research Station, and in our specific 130
study area, since the late 1990’s (O’Brien & Kinnaird 1996, Harris et al. 2017), and continues to 131
occur despite the presence of the research station staff and increased patrolling efforts in the 132
larger Bukit Barisan Selatan National Park (unpublished data based on interviews of research 133
station and national parks staff). For example, between 2014 and early 2017, the research 134
station staff recorded 13 incidents of bird trapping: in 10 instances the staff found evidence 135
that bird trapping had occurred (i.e. dead birds, camps, poles for nets), and in three instances 136
the staff met directly with the perpetrators (in two instances the perpetrators were arrested). 137
As a consequence of trapping, two of targeted species, the White-rumped shama and the Grey-138
cheeked bulbul Alophoixus bres are now extremely rare, although a recent study by Harris et al. 139
(2017) suggests that abundances of birds in the study area have remained relatively stable. 140
Trappers active in the research station area typically use a lure (e.g. a male Blue-winged 141
Leafbird Chloropsis moluccensis; Fig. 1) to attract and capture target birds in mist-nets or with 142
bird-lime (an adhesive made from tree sap; Sheppard et al. 2004). During the capture process, 143
other species can also be caught (i.e. as ‘bycatch’). Individuals of these species can be released, 144
die or be killed (e.g. Fig. 1), or kept by trappers. 145
146
147
Data collection 148
Field observations 149
8
We conducted two surveys, the first between July and October 1997 for a total of 24 150
observation days, and the second between August and November 2016 for a total of 18 151
observation days. Observations were made by the same observer (WM) and along the same 152
trail system, which had been cut and mapped through the forest in order to facilitate 153
observation of the avifauna. Both surveys were done during the non-breeding season for most 154
species (van Marle & Voous 1988), and the habitat (primary forest) remained the same across 155
both surveys. 156
157
Mixed flocks were broadly defined as two or more bird species moving together in the same 158
general direction (Buskirk 1976; Hutto 1994), and within the relative vicinity of each other – 159
approximately 10-25 metres of each other (Bell 1983; Hutto 1987). Each day, we walked 160
through the study area from 07.00 to 17.00 h to search for flocks. For each flock we collected: 161
time, location of flock in the study area, participating species, and the number of individuals. 162
Flocks were followed for as long as possible (maximum one hour) to record all species present. 163
During observations, the observer briefly recounted species every 10 minutes to check for 164
species that had been missed. Upon leaving a flock, the observer moved several hundred 165
meters in a different direction to the flock trajectory before counting any new flocks, and aimed 166
to cover a large area each day to avoid re-encountering the same flock twice. Both surveys used 167
identical methodology. Our approaches are consistent with previous studies, e.g. mixed flocks 168
observed in similar locations but on different days are considered as different (e.g. Sridhar et al. 169
2013). We did not apply filtering techniques to remove species with few observations as we 170
used weighted network metrics (see below). 171

9
172
Trade status 173
Because raw data on the trapping effort for the bird trade are not available, we sourced data 174
from market surveys to identify which species in our dataset are regularly traded. We used 175
literature from markets in both Sumatra and Jakarta as many of the wild birds sold in the Javan 176
markets are now sourced from Sumatra (Jepson & Laddle 2009; Shepherd 2012; Chng et al. 177
2016) and there is clear evidence that the bird trade is a large market spanning the entire 178
region (with birds being illegally shipped to neighbouring countries, 179
http://www.traffic.org/home). As raw data on trapping takes were not available, we created a 180
scoring system to estimate the likelihood for each species to be regularly traded. Species that 181
have been directly identified as being harvested from the forests of Sumatra (using Shepherd et 182
al. 2004; Shepherd 2006; Harris et al. 2017) were given a score of 1. Because species traded in 183
Java are now frequently sourced from Sumatra (Jepson & Laddle 2009, Shepherd 2012, Chng et 184
al. 2016), including from Bukit Barisan Selatan National Park, we added 0.5 to the score for 185
species identified in bird markets in Java (using data from Jepson & Ladle 2009; Chng et al. 186
2015). For species recorded in bird markets in multiple published surveys (our cited sources 187
span approximately 10 years), we added 1 to the score (continuous impact). Hence, the highest 188
score for a species was 2.5. While we were unable to account for intensity at which each 189
species is traded, our system aims to increase the weighting of species that have been 190
repeatedly reported in markets, known to be traded locally (observed in markets in Sumatra), 191
and found to be traded in several regions (suggesting that they are commonly traded). We 192
developed the scoring system based on our own observations (e.g. we have independently 193

10
noted that species are traded across Indonesian islands), and validated the scores in 194
consultation with park rangers and local conservation staff. For example, species with the 195
highest trade scores are commonly known to be traded (e.g. Greater racket-tailed drongo 196
Dicrurus paradiseus and Blue-winged leafbird, which were noted as among the most common 197
in Sumatran markets by Shepherd 2006 during our study period, both scored 2.5 using our 198
framework), although we do not strictly interpret the trade scores in this way. However, 199
because of potential limitations of our trade score in evaluating the trade pressure on a given 200
species, we also discuss our results in terms of traded versus non-traded (i.e. binary) status and 201
perform several analyses that support our findings independently of using the trade score 202
(based mostly on Harris et al. 2017, a study conducted at the same study site). 203
204
Data analysis 205
For each sampling period (1997 and 2016), we generated an undirected social network for each 206
observation period. Each node in this network represents a species. The edges between nodes 207
represent the probability that the two species are observed in the same mixed flock given that 208
at least one was observed in the flock. We used the “gambit of the group” approach, meaning 209
that all species within a particular mixed flock are considered to be connected (Whitehead & 210
Dufault 1999, Franks et al. 2010, Mokross et al. 2014). We then used the “get_network” 211
function in the asnipe R package (Farine 2013) to calculate the edge weights and create the 212
network. The sum of the edge weights connected to a given node (species) is called its 213
weighted degree. This measure of centrality that represents that node’s structural importance 214

11
in the community (Farine & Whitehead 2015). All computations were conducted in R version 215
3.1.2. (R Core Team 2014). 216
217
Are networks more structured than expected under indiscriminate flocking? 218
To determine if mixed flocks represent non-random co-occurrences, we compared each 219
network to an expectation by chance constructed using a permutation test (see Farine 2017). In 220
this analysis, we created a null model using a pre-network randomisation where we swapped 221
the observation of species among groups (Farine & Whitehead 2015). That is, for each step in 222
the permutation process, we selected two species from two flocks in which the species did not 223
co-occur, swapped them (following the algorithm first described by Bejder et al. 1998), and 224
recalculated the network (herein called a randomised network). We then compared the 225
Coefficient of Variation (CV: the standard deviation of the edge weights divided by the mean of 226
the edge weights) of the observed network (CVobserved) to the CV of 1500 randomized 227
networks (CVrandom). A CVobserved larger than 95% of the values of CVrandom suggests that 228
the observed network contains more preferred/avoided relationships than expected under a 229
scenario in which species form the same size flocks, but associate with other species at random 230
(Farine & Whitehead 2015). P values were calculated by taking the number of times the value 231
from the random networks were larger than the values from the observed network, divided by 232
the number of permutations (Farine 2017). Our permutation test is an important part of our 233
analyses as it controls for the observed abundance of each species in each sample by keeping 234
the total number of observations per species constant in both the observed and the 235
randomized networks. Thus, any differences arising are only due to the patterns in mixed flock 236
12
composition and not potential changes in abundance of each species participating in mixed 237
flocks over the two time periods. 238
239
Are the 1997 and 2016 networks correlated? 240
To establish whether there was some baseline similarities across our two sampling periods, we 241
used a Mantel test to determine whether the edge weights in the two networks (in the form of 242
two NxN matrices containing the edge weights) were correlated (Farine 2018). We compared 243
the result with the same test applied to the permuted networks (described above). To illustrate 244
the network structure over the two periods, we also created a graph of each network (Fig. 3; 245
left 1997 and right 2016). For the purpose of plotting the networks, we used the same 246
permutation procedure (described above) to identify edges (co-occurrence between two 247
species) that were significantly stronger than expected by chance. That is, for each edge we 248
determined whether the observed edge weight was greater than 95% of the weights in the 249
randomized networks (following Whitehead 1999), and removed non-significant edges. All 250
analyses were conducted on the complete network. 251
252
Are traded species more central in the networks than non-traded species? 253
We tested whether traded species were more central in their network (for each year 254
separately). Centrality was measured using the weighted degree, which refers to the structural 255
importance based on position in the network (Farine & Whitehead 2015). A greater propensity 256
to participate in mixed flocks, or occur in more species-diverse flocks, results in a higher 257
weighted degree. We fitted a linear model to evaluate the relationship between the species 258
13
centrality values and their trade scores. Because networks data are inherently non-259
independent, the P value was again derived using our permutation test (described above), this 260
time comparing the observed slope of the linear model to the 95% range of the slopes 261
calculated using the randomised networks (Farine & Whitehead 2015). As an alternative test, 262
we compared the means for all traded species versus all non-traded species, calculating the P 263
value by comparing the observed difference in means to the differences in means after 1000 264
permutations of the data. 265
266
Has the centrality of traded and non-traded species changed over time? 267
To test whether traded and non-traded species changed in their centrality over the 19 years, 268
we subtracted the weighted degree of each species in the 1997 network from their weighted 269
degree in the 2016 network. We then fitted a linear model with change in degree as a function 270
of trade score, using the same permutation approach described above to calculate significance 271
(Farine & Whitehead 2015). We also conducted a simpler analysis in which we compared the 272
proportion of species that increased versus decreased their centrality (as a binary measure) 273
against trade score (as a binary measure), calculating the P value by comparing the difference in 274
the proportion of species that decreased in their centrality in the observed data versus the 275
randomised networks. 276
277
Are mixed-species flocks resilient to the loss of central species? 278
We conducted a simulated removal experiment to determine how losing central traded species 279
from the system would impact community structure. In many networks, the majority of the 280
14
structure is determined by a few central nodes, and losing these nodes could reduce the 281
viability of the network. In this simulation, we sequentially removed species with the highest 282
overall centrality values (i.e. summing the centrality values from the 1997 and the 2016 283
networks) and a trade score of 1 or more, starting with the species that was the most central. 284
Removing a species involved removing it from both of the observed networks as well as all of 285
the corresponding randomised networks. We then calculated the correlation between the 1997 286
and 2016 networks, having removed those species, using the same Mantel test procedure 287
described above (including comparing the results of the Mantel test applied to the observed 288
network with those using the randomised networks). We avoided calculating properties of the 289
networks resulting from the node removals, as the biological relevance of metrics such as 290
average centrality are unclear. Instead we focused on using this test to ask about how many 291
species have contributed towards maintaining consistent structure (i.e. correlations) in the 292
network across the 20 year period, and ultimately determine whether the mixed flock networks 293
are robust to the loss of central species. By restricting our analysis to removing the same 294
species from the paired networks and measuring the correlation between these, we also aim to 295
minimize the limitations drawn by the fact that networks are likely to re-wire in response to 296
changes in species’ presence or abundance (assuming they would rewire in approximately the 297
same way). 298
299
Results 300
In total, we observed 184 flocks in 1997 and 135 flocks in 2016. Flocks were comprised of 90 301
species in total (78 species in 1997 and 59 species in 2016; Table A1). Of the 90 species that 302
15
were recorded participating in mixed flocks, one species has a Vulnerable status (Ruby-throated 303
Bulbul Pycnonotus dispar) and 23 species are listed as Near-Threatened. The dominant foraging 304
guild was insectivore (60 species). A further 25 species fed on insects but also include fruits and 305
or nectar in their diet. Three species were frugivores, one was a predator of small vertebrates, 306
and one was a terrestrial omnivore. 307
308
A total of 47 species were observed participating in mixed flocks in both sampling periods, with 309
31 species only recorded in 1997 and 12 species only recorded in 2016. The number of species 310
detected in a single mixed flock ranged from 2 to 15 species in 1997 with a mean of 5.15 ± 2.8 311
SD, and 2 to 22 species in 2016 with a mean of 4.46 ± 2.77 SD. The total number of edges 312
(species co-occurrence in mixed flocks) was 962 in the 1997 network and 572 in 2016. Using 313
information from the published literature on bird trade, we identified 49 species that were 314
part, or very likely to be part, of the bird trade in Sumatra. Of these, 44 were previously 315
identified by Harris et al. (2017) from the same study site (see Table A2), and our study added 316
an additional 5 species that were not observed in that study. 317
318
Are communities more structured than expected under indiscriminate flocking? 319
We constructed a separate social network for each of the two sampling periods (1997 and 320
2016). Summary statistics for these networks can be found in Table A3. We then tested 321
whether the structure of these networks differed from networks formed by species flocking 322
indiscriminately with others (but maintaining the same flock sizes). In the 1997 network, the 323
comparison of the coefficient of variation (CVobserved) with the coefficient of variation from 324
16
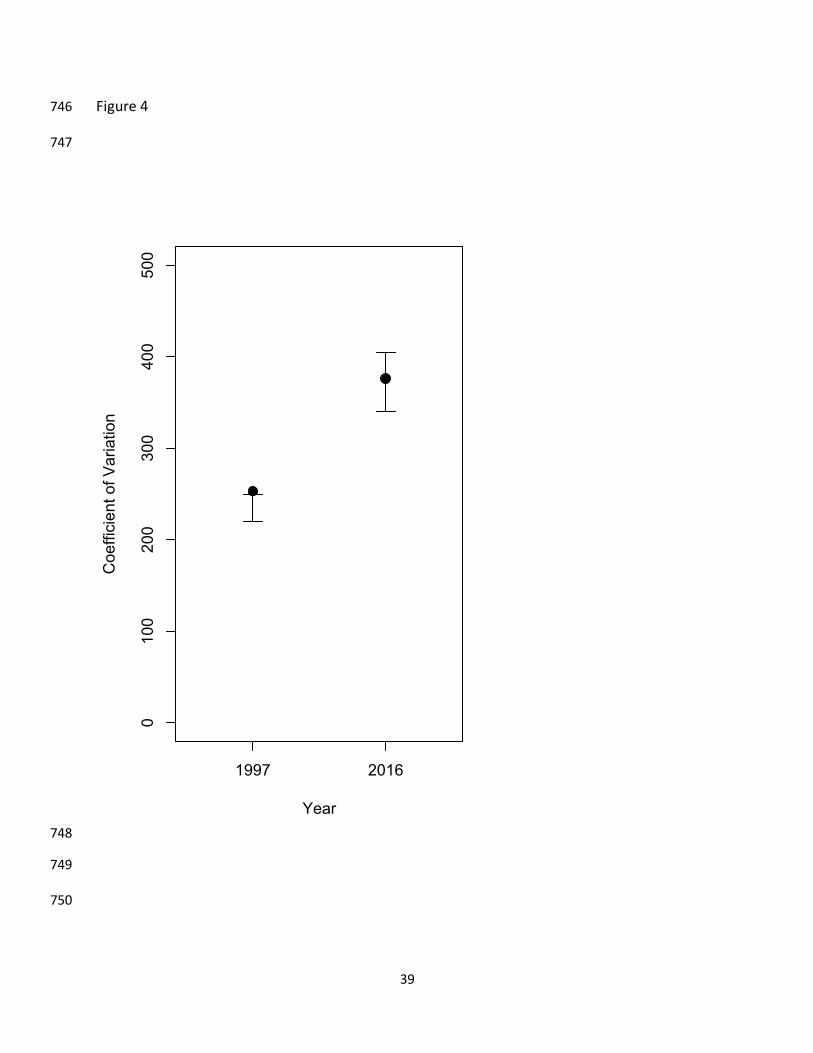
the randomization process (CVrandom) was significantly higher than random (CVobserved=253, 325
Prand=0.003; Fig. 4). By contrast, the 2016 network did not differ from chance (CVobserved=376, 326
Prand=0.145; Fig. 4), meaning that we cannot say that the species differentiate in their mixed 327
flock attendance more than expected by chance (i.e. species participated in mixed flocks 328
randomly with respect to species composition). 329
330
Are the 1997 and 2016 networks correlated? 331
Assuming that no anthropogenic disturbances occurred in the study site, we predicted that the 332
1997 and 2016 networks should be correlated. Despite the fact that the 2016 network did not 333
differ from indiscriminate flocking (see above), the correlation in the edge weights between the 334
two networks was greater than expected by chance (Mantel r=0.14, Prand=0.007). This reflects 335
some general stability in terms of flock membership. However, the correlation was relatively 336
low and we observed some major shifts. From five species with the highest weighted degree 337
values in 1997, only two species were in the top five species in 2016: the Blue-winged Leafbird 338
and the Bronzed Drongo Dicrurus aeneus (Appendix S1). In 2016, the Asian Fairy-bluebird was 339
the most central (weighted degree=5.49), despite being peripheral in the 1997 network 340
(weighted degree=0.82). 341
342
Are traded species more central in the networks than non-traded species? 343
From the total of 90 species observed in mixed flocks (combined from the two samples), slightly 344
more than half (54.4%) were identified as traded species (i.e. trade score > 0). In both networks, 345
we found that the traded species had significantly higher centrality values (weighted degree) 346

17
than the non-traded species (β ± SE=0.126 ± 0.153, Prand=0.019 for the 1997 network, and β ± 347
SE=0.356 ± 0.173, Prand=0.002 for the 2016 network; Fig. 5). For example, the most central 348
species in both years (1997: Blue-winged Leafbird, weighted degree=5.40; 2016: Asian Fairy 349
Bluebird Irena puella, weighted degree=5.49) were traded species. The most central non-traded 350
species were Raffless Malkoha Rhinortha chlorophaeus (1997, weighted degree=4.76) and 351
Black-winged Flycatcher-shrike Hemipus hirundinaceus (2016, weighted degree=4.20). These 352
results were confirmed when using a binary score for trade status: in 1997 the mean degree for 353
traded species was 1.88 versus 1.58 for untraded species (Prand=0.008), while in 2016 the mean 354
for traded species was 1.83 versus 1.17 for untraded species (Prand=0.004). This latter analysis 355
also reveals that the steeper relationship between trade score and centrality in 2016 (β=0.356) 356
versus 1997 (β=0.126) is driven by a lower centrality in non-traded species in the latter year, 357
rather than an absolute increase in centrality in traded species (see also Fig. 5). 358
359
Has the centrality of traded and non-traded species changed over time? 360
By substracting the weighted degree for each species in 2016 from their weighted degree in 361
1997, we calculated the change in centrality over time. We found that species with higher trade 362
scores had a significantly larger reduction in their weighted degree than non-traded species, 363
and this reduction was larger than expected when compared to the randomised networks (β ± 364
SE=-0.231 ± 0.196, Prand=0.035; Fig. 6). Although this effect is relatively small, it does suggest 365
that the species with the highest trade score have an approximately 36% reduction in degree 366
relative to the non-traded species. From 49 traded species, we found a reduction in centrality in 367
20 species (41%), whereas only 12 species out of 41 non-trade species (29%) decreased in 368

18
centrality, which was a larger difference than expected when compared to the randomised 369
networks (Prand=0.020). 370
371
Are mixed-species flocks resilient to the loss of central species? 372
We simulated the sequential removal of 10 traded species (from all networks) with the highest 373
combined centrality values to test how resilient this correlation was to the further loss of 374
central species. The simulation revealed a decrease in correlation between the network in 1997 375
and 2016 (black points in Fig. 7). After removal of the most central traded species (Blue-winged 376
Leafbird), the network correlation was still different from random (i.e. the network still 377
contained more consistent preferred/avoided relationships across the two samples than 378
expected by chance). However, the correlation across the two networks became inseparable 379
from random after removal of the second species onwards. This suggests that the further loss 380
of just two traded species, on top of the existing changes already experienced in the system, 381
could be sufficient to completely break down the structure of mixed-species flocking that was 382
observed in the system prior to the onset of the bird trade in the study area. 383
384
Discussion 385
Mixed flocks represent an important social system in bird communities (Buskirk 1976; Munn 386
1985). To date, two main anthropogenic disturbances– forest fragmentation and land-use 387
intensity – have been identified as causing negative effects on mixed flocking community 388
structure (e.g., on species richness; Goodale et al. 2015). In this study, we demonstrate an 389
additional potential effect–trapping for the bird trade–on structure in an avian community. 390

19
Using data collected from the same forest subject to bird trapping almost 20 years apart, we 391
found that mixed-species flocks observed in 2016 did not show evidence for containing 392
preferred associations between species, unlike flocks observed in 1997. Flock sizes typically 393
contained fewer species (but the same number of individuals per species), meaning that the 394
resulting networks were less densely connected and with a lower mean degree, despite 395
maintaining similar characteristics such as local clustering (see Table A2). Together, our finding 396
suggest that the overall system has been disturbed. We then show evidence that changes in the 397
network centrality of species was linked with their status in the bird trade. Finally, using 398
simulations, we also showed that the current system may not be resilient to the complete loss 399
of two or more of the currently traded species. Our results suggest that trapping is likely to be 400
contributing to the degradation of mixed-species flocking patterns, affecting both traded and 401
non-traded species, and therefore could lead to widespread declines in the broader community 402
structure of species that rely on mixed flocks for survival. 403
404
More than half of the species that participated in mixed flocks were traded. In both 1997 and 405
2016, these traded species had significantly higher centrality values than non-traded species. 406
This finding suggests that, by being regular participants in flocks, traded species are likely to be 407
important contributors to the maintenance of mixed flocks in this community. The fact that 408
traded species were central in both periods is perhaps testament to having received some 409
protection at the study site. However, despite this protection trapping remained active and we 410
found that traded species had a significantly greater decrease in centrality over the two time 411
periods than did non-traded species. While this could seemingly have arisen because the traded 412

20
species have become less common, all of our analysis were based on permutation tests that 413
only swap the identities of species observed in mixed flock (rather than generating flocks at 414
random), thus maintaining constant the number of observations per species (i.e. the abundance 415
in mixed flocks) in our statistical testing. Thus, if a pattern differs from chance, it differs from 416
the distribution of the null hypothesis that is drawn using exactly the same number of 417
observations, and therefore represents a significant change independent of changes in how 418
often each species was observed. The hypothesis that changes occurred due to declines in 419
abundance therefore seems unlikely. Rather it appears that the bird trade has driven a change 420
in behaviour of several, or many, species. 421
422
The changes in species’ flocking behaviour could be because being targeted by bird traders 423
changes their behaviour, or their perceived value by other species. For example, associating 424
with Blue-winged Leafbirds may now be less beneficial or more risky than it was 20 years ago. 425
While this process remains speculative, changes in behaviour in relation to risk has been noted 426
in a number of relevant studies. For example, Hua et al. (2013) conducted playbacks of 427
predators in habitat patches and found that while some species reduced in abundance 428
(suggesting they left those patches), others instead became more cryptic (i.e. they reduced in 429
their observability). A more directly relevant example is the White-rumped Shama, a species 430
that is valued for its song and easily trapped (including in Sumatra) because of its combative 431
response to playback (Eaton et al. 2015). During surveys conducted in Way Kambas National 432
Park, Lampung (Sumatra), birds were noted as being silent when discovered, and only sang very 433
quietly in response to playback (Eaton et al. 2015). This change in behaviour may have evolved 434

21
because combative individuals are more easily caught, and thus trapping has generated strong 435
selection against responding to vocalisations. Vocalisations have been widely reported as being 436
important for the formation and maintenance of mixed flocks (Goodale & Kotagama, 2006; 437
Pagani-Núñez et al., 2018). Selecting for reduced vocalizing could change the attractiveness of 438
the species. Thus, the pursuit of highly prized species in the bird trade could affect communities 439
not just directly as a result of removal of birds and mortality during bycatch, but also if the 440
effect of being caught drives behavioural changes in species (both targeted and non-targeted) 441
within the community. 442
443
We also conducted simulations to investigate the effect of complete removal of traded species, 444
and found that the overall community is potentially not very resilient to the loss of important 445
species (i.e. those species that interact with many species and were observed to be central). 446
Although this is the worst case scenario (i.e. extinction of species from the forest) and a 447
relatively simplistic simulation (i.e. it does not account for re-structuring of the network in case 448
of a loss of a species), it at least indicates the urgency to protect traded species that are 449
important contributors to mixed flocks. In an effort to initiate conservation efforts, the first 450
Songbird crisis summit was held in 2015 in response to the songbird trade in the Greater Sunda 451
region, and tried to identify the most threatened songbirds and propose actions to save them 452
from extinction (Lee et al. 2016). The second meeting was held at the beginning of 2017. They 453
identified 28 priority species, in which three species have been identified as forming mixed 454
flocks: White-rumped Shama, Grey-cheeked Bulbul, and Asian Fairy Bluebird. The latter is 455
particularly important as we found that it had replaced other species as the most central in the 456

22
2016 mixed flock network. Thus, the protection of species will need to be dynamic if the 457
behaviour of the traders and of the species are both responding to the changing dynamics in 458
these songbird communities. 459
460
The capture of species in flocks arising from the wildlife trade could have additional broader 461
impacts. From the 90 species recorded participating in mixed flocks, 21 species include fruits as 462
part of their diet where 17 species were categorized as traded species (had been recorded in 463
the bird market). Considering their potential roles in seed dispersal and the potential impact of 464
bird trade to their population, the bird trade might also affect seed dispersal within these 465
systems. Several flock-attending species, such as Red-throated Barbet Psilopogon 466
mystacophanos, Spectacled Bulbul Pycnonotus erythropthalmos, and Yellow-bellied Bulbul 467
Alophoixus phaeocepahlus, incorporate a large amount of fruit in their diet. Declines in these 468
species could potentially limit their effectiveness at dispersing some fruits, as has been shown 469
in other studies (e.g. McConkey & O’Farril 2016). However, whether any fruiting species rely 470
heavily on species that form mixed flocks for seed dispersal in our study area is unknown, and 471
warrants further investigation. 472
473
Social network analysis is a powerful tool for wildlife conservation (Snijders et al. 2017). 474
Although the impact of anthropogenic disturbances (fragmentation or different land-use 475
intensity) on mixed-species flocking has been widely documented (e.g., Stouffer & Bierregaard 476
1995, Maldonado-Coelho & Marini 2000, Sridhar & Sankar 2008, Goodale et al. 2015), only one 477
previous study used network analysis; examining the impact of forest fragmentation on mixed 478

23
flock characteristics (Mokross et al. 2014). In that study, the associations among species, as 479
shown by weighted degree, declined with increasing level of forest fragmentation and 480
secondary forest (Mokross et al. 2014). This means that there was a reduction in mixed flock 481
attendance with increasing habitat disturbance (Mokross et al. 2014). This result was also not 482
attributed to a reduction in species abundance: despite several species having lower 483
abundance, they still persisted in the degraded habitats (Stouffer et al. 1995; Mokross et al. 484
2014). Social network analysis allowed us to find almost identical evidence of changes in mixed 485
flock composition, with reduced richness and reduced weighted degree in 2016 compared to 486
1997. However, unlike in the previous study that focused on habitat effects, our changes arose 487
from trapping from the bird trade. 488
489
It is becoming increasingly clear that mixed-species flocking plays an important part in the 490
social system of many bird species. By using network analysis we evaluated the potential 491
impact of bird trapping to mixed flocks in Sumatra. We note that the bird trade is notoriously 492
difficult and dangerous to study. We made use of the best available and most local data we 493
could find, and these data match the sentiment based on our, and others’, experience of the 494
study area. Traded species are important component of mixed flocks in our study area. By 495
comparing data on mixed flocks from surveys almost 20 years apart, we have shown a 496
degradation of the structure of mixed species flocks over time (measured independently of the 497
trade score), and significant reductions in the centrality of traded species in mixed flock 498
networks (both in terms of their score and a simple traded versus non-traded status, and using 499
a permutation test that controlled for potential changes in abundance over the two sampling 500

24
periods). Although the mechanisms leading to reduced attendance of species in mixed flocks 501
are still not clear, our data suggests that bird trapping could have impacts beyond reductions in 502
abundance alone. It is well established that the absence of nuclear species can significantly 503
impact the behaviour of remaining species (Dolby & Grub 1998; Dolby & Grub 2000). We add 504
the suggestion that the perceived value of traded species to other attendant species in their 505
flocks might also be reduced as a result of changes in behaviour or due to the higher risk of 506
being caught as bycatch, even if they are not completely absent. Thus, both direct and indirect 507
effects of the bird trade on other flock participants may occur, and require urgent investigation. 508
Further, protection and enforcement will need to be strengthened to protect not only species 509
that have been identified as being in decline, but also to protect species that play an important 510
role in the broader avian community (i.e. those that are central in mixed flocks, contributing 511
either functionally or as attendant species contributing towards group augmentation). 512
513
Supporting Information 514
Additional supporting tables including: Table A1: a table of bird species observed in mixed 515
flocks with their trade scores and respective weighted degree values in 1997 and 2016 516
(Appendix S1), Table A2: table of species identified as traded by Harris et al. 2017, a study 517
conducted at the same study site as us, and Table A3: a table containing summary statistics of 518
the survey data and the resulting networks. The authors are solely responsible for the content 519
and functionality of these materials. Queries should be directed to the corresponding author. 520
521

25
Data accessibility 522
Raw data and R scripts can be downloaded from: https://dx.doi.org/10.17617/3.1a 523
524
Literature cited 525
Adeney JM, Ginsberg JR, Russell GJ, Kinnaird MF (2006). Effects of an ENSO-related fire on birds 526
of a lowland tropical forest in Sumatra. Animal conservation 9: 292-301. 527
Aplin LM, Farine DR, Morand-Ferron J, Sheldon BC. 2012. Social networks predict patch 528
discovery in a wild population of songbirds. Proceedings of the Royal Society of London B 529
279: 4199-4205. 530
Arbeláez-Cortés E, Rodríguez-Correa HA, Restrepo-Chica M. 2011. Mixed bird flocks: patterns of 531
activity and species composition in a region of the Central Andes of Colombia. Revista 532
Mexicana de Biodiversidad 82: 639-651. 533
Bejder L, Fletcher D, Brager S. 1998. A method for testing association patterns of social animals. 534
Animal Behaviour 56: 719-725. 535
Bell HL. 1983. A bird community of lowland rainforest in New Guinea. 5, mixed- species feeding 536
flocks. Emu 82:256-275. 537
Burkle LA, Marlin JC, Knight TM. 2013. Plant-Pollinator Interactions over 120 Years: Loss of 538
Species, Co-Occurrence, and Function. Science, 339(6127), 1611-1615. 539

26
Buskirk WH. 1976. Social systems in a tropical forest avifauna. The American Naturalist 110: 540
293-310. 541
Chng SCL, Eaton JA, Krishnasamy K, Shepherd CR, Nijman V. 2015. In the market for extinction: 542
An inventory of Jakarta’s bird markets. TRAFFIC, Petaling Jaya, Selangor, Malaysia. 543
Chng SCL, Eaton JA. 2016. In the Market for Extinction: Eastern and Central Java. TRAFFIC. 544
Petaling Jaya, Selangor, Malaysia. 545
Develey PF, Peres CA. 2000. Resource seasonality and the structure of mixed species bird flocks 546
in a coastal Atlantic forest of south-eastern Brazil. Journal of Tropical Ecology 16: 33-53. 547
Dolby AS, Grubb TC. 1998. Benefits to satellite members in mixed-species foraging groups: an 548
experimental analysis. Animal Behavior 56: 501-509. 549
Dunne JA, Williams RJ, Martinez, ND. 2002. Network structure and biodiversity loss in food 550
webs: robustness increases with connectance. Ecology Letters, 5(4), 558-567. 551
Eaton JA, Shepherd CR, Rheindt FE, Harris JBC, van Balen S, Wilcove DS, Collar NJ. 2015. Trade-552
driven extinctions and near-extinctions of avian taxa in Sundaic Indonesia. Forktail 31: 1-553
12. 554
Eguchi K, Yamagishi S, & Randrianasolo V. 1993. The Composition and Foraging Behavior of 555
Mixed-Species Flocks of Forest-Living Birds in Madagascar. Ibis 135: 91-96. 556

27
Farine DR, Aplin LM, Garroway CJ, Mann RP, Sheldon BC. 2014. Collective decision making and 557
social interaction rules in mixed-species flocks of songbirds. Animal Behaviour 95: 173-558
182. 559
Farine DR, Aplin LM, Sheldon BC, Hoppitt W. 2015. Interspecific social networks promote 560
information transmission in wild songbirds. Proceedings of the Royal Society of London B 561
282: 20142804. 562
Farine DR. 2013. Animal social network inference and permutations for ecologists in R using 563
asnipe. Methods in Ecology and Evolution 4: 1187-1194. 564
Farine DR. 2017. A guide to null models for animal social network analysis. Methods in Ecology 565
and Evolution 8: 1309-1320. 566
Farine DR. 2018. When to choose dynamic vs. static social network analysis. Journal of Animal 567
Ecology 87: 128-138. 568
Farine DR, Whitehead H. 2015. Constructing, conducting and interpreting animal social network 569
analysis. Journal of Animal Ecology 84: 1144-1163. 570
Franks DW, Ruxton GD, James R. 2010. Sampling animal association networks with the gambit 571
of the group. Behavioral Ecology and Sociobiology 64: 493-503. 572
Gaveau DL, Wandono H, Setiabudi F. 2007. Three decades of deforestation in southwest 573
Sumatra: Have protected areas halted forest loss and logging, and promoted re-growth? 574
Biological Conservation 134: 495-504. 575

28
Goodale E, Beauchamp G, Ruxton GD 2017. Mixed-species groups of animals: Behavior, 576
Community Structure, and Conservation. London, United Kingdom: Academic Press. 577
Goodale E, Ding P, Liu X, Martínez A, Si X, Walters M, Robinson SK. 2015. The structure of 578
mixed-species bird flocks, and their response to anthropogenic disturbance, with special 579
reference to East Asia. Avian Research 6: 1. 580
Goodale E, Kotagama SW. 2005. Alarm calling in Sri Lankan mixed-species bird flocks. Auk 122: 581
108-120. 582
Goodale E, Kotagama SW. 2006. Vocal mimicry by a passerine bird attracts other species 583
involved in mixed-species flocks. Animal Behaviour, 72, 471-477. 584
Gotelli NJ, Graves GR. 1996. Null models in ecology. Washington, DC, USA: Smithsonian 585
Institution Press. 586
Harris JBC, Tingley MW, Hua F, Yong DL, Adeney JM, Lee TM, Marthy W, Prawiradilaga DM, 587
Sekercioglu CH, Suyadi, Winarni N, Wilcove DS. 2017. Measuring the impact of the pet 588
trade on Indonesian birds. Conservation Biology 31: 394-405. 589
Herzog SK, Soria R, Troncoso A, Matthysen E. 2002. Composition and structure of avian mixed-590
species flocks in a high-Andean Polylepis forest in Bolivia. Ecotropica 8: 133-143. 591
Hua FY, Fletcher RJ, Sieving KE, Dorazio RM. 2013. Too risky to settle: avian community 592
structure changes in response to perceived predation risk on adults and offspring. 593
Proceedings of the Royal Society B-Biological Sciences, 280: 20130762. 594

29
Hutto RL. 1987. A description of mixed-species insectivorous bird flocks in western Mexico. 595
Condor 89: 282-292. 596
Hutto RL. 1994. The composition and social organization of mixed-species flocks in a tropical 597
deciduous forest in Western Mexico. Condor 96: 105-118. 598
Jepson P, Ladle RJ. 2009. Governing bird-keeping in Java and Bali: evidence from a household 599
survey. Oryx 43: 364-374. 600
Jullien M, Clobert J. 2000. The survival value of flocking in Neotropical birds: reality or 601
fiction? Ecology 81: 3416-3430. 602
Kotagama SW, Goodale E. 2004. The composition and spatial organization of mixed-species 603
flocks in a Sri Lankan rainforest. Forktail 20: 63-70. 604
Kinnaird MF, O'Brien TG. 1998. Ecological effects of wildfire on lowland rainforest in Sumatra. 605
Conservation Biology 12: 954-956. 606
Latta SC, Wunderle JM. 1996. The composition and foraging ecology of mixed-species flocks in 607
pine forests of Hispaniola. Condor 98: 595-607. 608
Lee TM, Soh MCK, Sodhi N, Koh LP, Lim SLH. 2005. Effects of habitat disturbance on mixed 609
species bird flocks in a tropical sub-montane rainforest. Biological Conservation 122: 193-610
204. 611
30
Lee JGH, Chng SCL, Eaton JA (eds). 2016. Conservation strategy for Southeast Asian songbirds in 612
trade. Recommendations from the first Asian Songbird Trade Crisis Summit 2015 held in 613
Jurong Bird Park, Singapore, 27–29 September 2015. 614
Maldonado-Coelho M., Marini MA. 2000. Effects of forest fragment size and successional stage 615
on mixed-species bird flocks in south-eastern Brazil. Condor 102: 585-594. 616
Mammides C, Chen J, Goodale UM, Kotagama SW, Sidhu S, Goodale E. 2015. Does mixed-617
species flocking influence how birds respond to a gradient of land-use intensity? 618
Proceedings of the Royal Society B-Biological Sciences 282: 20151118. 619
Martinez AE, Gomez JP, Ponciano JM, Robinson SK. 2016. Functional Traits, Flocking Propensity, 620
and Perceived Predation Risk in an Amazonian Understory Bird Community. The American 621
Naturalist 187: 607-619. 622
Martinez AE, Zenil RT. 2012. Foraging guild influences dependence on heterospecific alarm calls 623
in Amazonian bird flocks. Behavioral Ecology 23: 544-550. 624
McConkey KR, O'Farrill G. 2016. Loss of seed dispersal before the loss of seed dispersers. 625
Biological Conservation 201: 38-49. 626
Mokross K, Ryder TB, Côrtes MC, Wolfe JD, Stouffer PC. 2014. Decay of interspecific avian flock 627
networks along a disturbance gradient in Amazonia. Proceedings of the Royal Society of 628
London B 281: 20132599. 629
Moynihan M. 1962. The organization and probable evolution of some mixed species flocks of 630
Neotropical birds. The Smithsonian Miscellaneous Collection 143: 1-140. 631

31
Miller ET, Farine DR, Trisos CH. 2017. Phylogenetic community structure metrics and null 632
models: a review with new methods and software. Ecography 40: 461-477. 633
Munn CA. 1985. Permanent canopy and understorey flocks in Amazonia: species composition 634
and population density. Ornithological Monographs 36:683-712. 635
O’Brien TG, Kinnaird MF. 1996. Birds and mammals of the Bukit Barisan Selatan National Park, 636
Sumatra, Indonesia. Oryx 30: 207-217. 637
Pagani-Núñez E, Xia X, Beauchamp G, He R, Husson JHD, Liang D, Goodale E. in press. Are vocal 638
characteristics related to leadership patterns in mixed-species bird flocks? Journal of 639
Avian Biology. doi:10.1111/jav.01674 640
R Core Team. 2014. R: A language and environment for statistical computing. R Foundation for 641
Statistical Computing, Vienna, Austria. URL http://www.R-project.org/. 642
Satischandra SHK, Kudavidanage EP, Kotagama SW, Goodale E. 2007. The benefits of joining 643
mixed-species flocks for a sentinel nuclear species, the Greater Racket-tailed Drongo 644
Dicrurus paradiseus. Forktail 23: 145-148. 645
Shepherd CR, Sukumaran J, Wich SA. 2004. Open season: an analysis of the pet trade in Medan, 646
Sumatra 1997-2001. TRAFFIC Southeast Asia, Petaling Jaya, Selangor, Malaysia. 647
Shepherd CR. 2006. The bird trade in Medan, north Sumatra: an overview. Birding Asia 5:16-24. 648
Shepherd CR. 2012. The owl trade in Jakarta, Indonesia: a spot check on the largest bird 649
markets. Birding Asia 18:58-59. 650

32
Snijders, L., Blumstein, D.T., Stanley, C.R., Franks, D.W. 2017. Animal Social Network Theory Can 651
Help Wildlife Conservation. Trends in Ecology & Evolution 32:567-577. 652
Sridhar H, Sankar K. 2008. Effects of habitat degradation on mixed-species bird flocks in Indian 653
rain forests. Journal of Tropical Ecology 24:135–47. 654
Sridhar H, Beauchamp G, Shanker K. 2009. Why do birds participate in mixed-species foraging 655
flocks? A large-scale synthesis. Animal Behaviour 78: 337-347. 656
Sridhar H, Jordán F, Shanker K. 2013. Species importance in a heterospecific foraging 657
association network. Oikos 122: 1325-1334. 658
Sridhar H, Shanker K. 2014. Using intra-flock association patterns to understand why birds 659
participate in mixed-species foraging flocks in terrestrial habitats. Behavioral ecology and 660
sociobiology 68: 185-196. 661
Stouffer PC, Bierregaard Jr RO. 1995. Use of Amazonian forest fragments by understory 662
insectivorous birds. Ecology 76: 2429-2445. 663
Suzuki TN. 2012. Long-Distance calling by the Willow Tit, Poecile montanus, facilitates formation 664
of mixed-species foraging flocks. Ethology 118.1: 10-16. 665
Thiollay JM. 1999. Frequency of mixed species flocking in tropical forest birds and correlates of 666
predation risk: an intertropical comparison. Journal of Avian Biology 30:282-294. 667
UNODC. 2013. Transnational Organized Crime in East Asia and the Pacific. A threat assessment. 668
United Nations Office on Drugs and Crime. 669

33
van Marle JG, Voous KH. 1988. The birds of Sumatra: an annotated check-list (No. 10). British 670
Ornithologists' Union. 671
Whitehead H. 1999. Testing association patterns of social animals. Animal Behaviour 57: F26-672
F29. 673
Whitehead H, Dufault S. 1999. Techniques for analyzing vertebrate social structure using 674
identified individuals: review. Advances in the Study of Behavior 28: 33-74. 675
676
677
678
34
FigureLegends 679
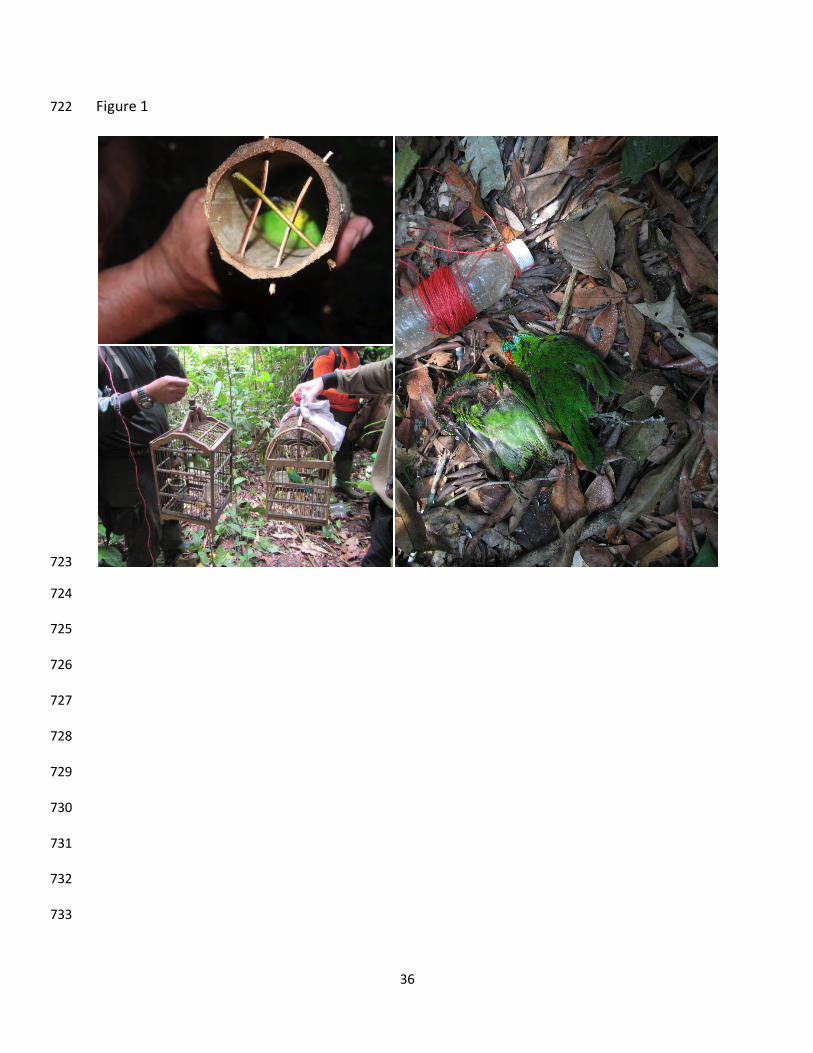
Figure 1. Confiscated Blue-winged Leafbird Chloropsis moluccensis that was used as bait to 680
attract birds by the illegal bird trappers and examples of birds that died or were killed during the 681
capturing process Photos were taken at the study site. Copyright: WCSIP/Fahrudin Surahmat. 682
683
Figure 2. Location of this study site in the Way Canguk Research Station within the Bukit Barisan 684
Selatan National Park, Lampung-Sumatra, Indonesia. 685
686
Figure 3. Networks of significant relationships in each of the two periods, 1997 (left) and 2016 687
(right). In each network, nodes represent species and the edges represent the probability of 688
observing both species in a flock given that one was observed. The size of the node represents 689
the weighted degree for each species in the network comprising only non-random co-690
memberships in mixed flocks. The colour of the nodes represents the species’ trade scores 691
(brightest red = 2.5, lightest blue = 0, and grey = 1.5). 692
693
Figure 4. Comparison of the observed network structure to the structure expected under 694
indiscriminate flock membership. Points shows the coefficient of variation values (black dots) 695
from the 1997 and 2016 networks. Bars show the expected values (95% range of the Coefficient 696
of Variation) based on a permutation test in which each species occurs the same number of 697
times but are randomly allocated to flocks. While the 1997 network differs from random (the 698
point is above the upper 95% quantile), the 2016 network does not. 699
700
Figure 5. In both years, there was a significant relationship between trade score and centrality in 701
the network. Plots show the relationship between the observed trade score and the centrality 702
value (weighted degree) for each species in mixed flock networks in 1997 (left) and 2016 (right). 703
We calculated P values by comparing the observed coefficient value (red line) with a distribution 704
of 1500 coefficient values drawn from a permutation test (see text). 705
706

35
Figure 6. Species with a high trade score had a significantly greater decrease in network 707
centrality between 1997 and 2016. Plot shows the relationship between the observed change in 708
centrality value for each species in mixed flocks and their trade score. We calculated the P value 709
by comparing the observed coefficient value (red line) with a distribution of 1500 coefficients 710
drawn from a permutation test (see text). 711
712
Figure 7. The structure of the 2016 mixed-species flocking network is not resilient to the loss of 713
more than one central traded species. Plot shows the correlation between the 1997 and 2016 714
networks (black dots) in the original network (x=0), and after the simulated removal of up to 10 715
species with the highest degree that are part of the songbird trade. The bars represent the 95% 716
range of the expected correlations based on the permutation test. Correlations where the black 717
points overlap with the bars are not significantly different from random. 718
719
720
721
36
Figure 1 722
723
724
725
726
727
728
729
730
731
732
733

37
Figure 2 734
735
736
737
738
739
740
741
742
743

38
Figure 3 744
745
39
Figure 4 746
747
748
749
750
Year
Coe
ffici
ent o
f Var
iatio
n
1997 2016
0100
200
300
400
500

40
Figure 5 751
752
753
754
755
756
757
758
759
0.0 0.5 1.0 1.5 2.0 2.5
01
23
45
Trade score
Wei
ghte
d de
gree
0.0 0.5 1.0 1.5 2.0 2.5
01
23
45
Trade score
Wei
ghte
d de
gree
1997 2016

41
Figure 6 760
761
762
763
0.0 0.5 1.0 1.5 2.0 2.5
-4-2
02
4
Trade score
Cha
nge
in w
eigh
ted
degr
ee (1
997-
2016
)

42
Figure 7 764
765
766
767
768
769
770
771
772
773
774