The political economy of development assistance: peril to government quality dynamics in Africa
35
1 AFRICAN GOVERNANCE AND DEVELOPMENT INSTITUTE A G D I Working Paper WP/12/008 The political economy of development assistance: peril to government quality dynamics in Africa Simplice A. Asongu African Governance and Development Institute, P.O. Box 18 SOA/ 1365 Yaoundé, Cameroon. E-mail: [email protected]
Transcript of The political economy of development assistance: peril to government quality dynamics in Africa
1
AFRICAN GOVERNANCE AND DEVELOPMENT
INSTITUTE
A G D I Working Paper
WP/12/008
The political economy of development assistance: peril to government quality
dynamics in Africa
Simplice A. Asongu
African Governance and Development Institute,
P.O. Box 18 SOA/ 1365 Yaoundé, Cameroon.
E-mail: [email protected]
2
© 2012 African Governance and Development Institute WP/12/008
AGDI Working Paper
Research Department
The political economy of development assistance: peril to government quality
dynamics in Africa
Simplice A. Asongu1
February 2012
Abstract
This paper assesses the effectiveness of foreign aid in improving government institutions
in 52 African countries using updated data (1996-2010). Findings suggest development
assistance deteriorates government quality dynamics of corruption-control, political-stability,
rule of law, regulation quality, voice and accountability and government effectiveness. It is
therefore a momentous epoque to solve the second tragedy of foreign aid; high time economists
and policy makers start rethinking the models and theories on which foreign aid is based. In the
meantime, it is up to people who really care about the poor to hold aid agencies accountable for
results.
JEL Classification: B20; F35; F50; O10; O55
Keywords: Foreign Aid; Political Economy; Development; Africa
1 Simplice A. Asongu is Lead economist in the Research Department of the AGDI ([email protected]).
3
1. Introduction
For over five decades the political economy of foreign aid has been widely debated in
academic and policy-making circles. A large literature on institutions and development suggests
that Africa is poor because it has poor institutions: dictatorship, lack of property rights, weak
courts and contract enforcement, high corruption, political instability, violence and hostile
regulatory environment for private business. According to this view, in order to end African
poverty, the West needs to promote good institutions. In 2005 the West tried hardest to salvage
Africa. In July of that year, the G8 agreed to double foreign aid to Africa from $25 billion a year
to $50 billion to finance the ‘Big push’, as well as scrap African aid loans contracted during
previous attempts at a ‘Big push’. Prior to this effort, Africa was already the most aid-intensive
continent in the world. In September of that same year, world leaders met at the United Nations
to further discuss progress on ending poverty in Africa. To point out some alarming statistics,
sub-Saharan Africa makes-up 11% of the world’s population, but produces only 1% of the
worlds GDP(Easterly,2005a). In the median African nation, 43% of the population survive on
less than one dollar a day. On the World Food Program list, of the twenty-three countries with
more than 35% of the population malnourished, seventeen are in Africa. The long and brutal
civil wars in Angola, Chad, Somalia, Sierra Leon, Liberia…etc, not to mention Rwanda’s
genocide and recent carnages in Darfur-Sudan and the Democratic Republic of Congo
(registering the world’s highest war casualties since World War Two). In fact, seven of the 8
recent cases of total societal breakdown into anarchy in the world known to literature have been
in Africa: Angola, Burundi, Liberia, Sudan, Sierra Leone, Somalia and Zaire/Congo(beside
Afghanistan).
4
In assessing the impact of development assistance, a great bulk of studies have focused
on the effect of aid flows on GDP growth and other macroeconomic variables (investment or
public consumption). The underlying assumption here is that aid is destined to bridge the saving-
investment gap poor countries face(Rostow,1960; Chenery & Strout,1966; Easterly, 2005a).
Surprisingly there has been much less research conducted on the impact of foreign aid on the
evolution of government institutions. More so, a great bulk of research on the African aid-growth
nexus has been premised on data collected before the year 2000 with less emphasis placed on the
role development assistance play in good governance trends. The contribution of this paper to the
literature is threefold. Firstly, we cut adrift the mainstream approach to the aid-development
nexus by assessing government quality effects of development assistance. Secondly, a great bulk
of literature is based on data collected between 1960 and 1995. Thus by using recent data(1996-
2010), this paper provides an updated account of governance trends in the nexus. Thirdly, the
focus on 52 of the 54 African countries provides broad and inclusive views on the continent
where the aid-development debate is most tensed. The remainder of this paper is presented as
follows. Section 2 thoroughly examines existing literature on the aid-development nexus. Data
and methodology are respectively presented and outlined in Section 3. Empirical analysis,
corresponding discussion, policy implications and limitations are covered in Section 4. Section 5
concludes.
2. Literature review
2.1 Conflicts in the literature
The literature on the effectiveness of aid has almost exclusively been oriented towards
the macroeconomic impacts of aid; assessing the effects of aid on economic savings, investment
and growth. The low-depth of analytical framework, heavy reliance on empirical evidence(which
5
is often ambiguous at best) and inconclusive results with recently refined methodologies(Masud
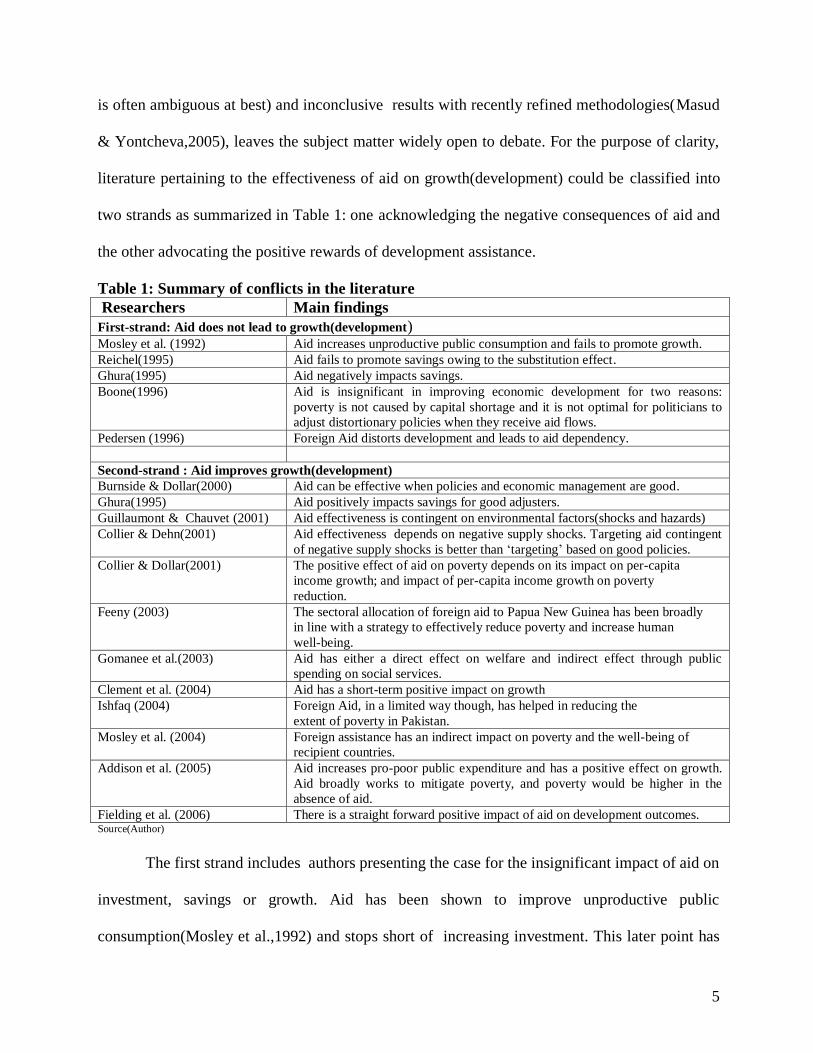
& Yontcheva,2005), leaves the subject matter widely open to debate. For the purpose of clarity,
literature pertaining to the effectiveness of aid on growth(development) could be classified into
two strands as summarized in Table 1: one acknowledging the negative consequences of aid and
the other advocating the positive rewards of development assistance.
Table 1: Summary of conflicts in the literature
Researchers Main findings
First-strand: Aid does not lead to growth(development) Mosley et al. (1992) Aid increases unproductive public consumption and fails to promote growth.
Reichel(1995) Aid fails to promote savings owing to the substitution effect.
Ghura(1995) Aid negatively impacts savings.
Boone(1996) Aid is insignificant in improving economic development for two reasons:
poverty is not caused by capital shortage and it is not optimal for politicians to
adjust distortionary policies when they receive aid flows.
Pedersen (1996) Foreign Aid distorts development and leads to aid dependency.
Second-strand : Aid improves growth(development)
Burnside & Dollar(2000) Aid can be effective when policies and economic management are good.
Ghura(1995) Aid positively impacts savings for good adjusters.
Guillaumont & Chauvet (2001) Aid effectiveness is contingent on environmental factors(shocks and hazards)
Collier & Dehn(2001) Aid effectiveness depends on negative supply shocks. Targeting aid contingent
of negative supply shocks is better than ‘targeting’ based on good policies.
Collier & Dollar(2001) The positive effect of aid on poverty depends on its impact on per-capita
income growth; and impact of per-capita income growth on poverty
reduction.
Feeny (2003) The sectoral allocation of foreign aid to Papua New Guinea has been broadly
in line with a strategy to effectively reduce poverty and increase human
well-being.
Gomanee et al.(2003) Aid has either a direct effect on welfare and indirect effect through public
spending on social services.
Clement et al. (2004) Aid has a short-term positive impact on growth
Ishfaq (2004) Foreign Aid, in a limited way though, has helped in reducing the
extent of poverty in Pakistan.
Mosley et al. (2004) Foreign assistance has an indirect impact on poverty and the well-being of
recipient countries.
Addison et al. (2005) Aid increases pro-poor public expenditure and has a positive effect on growth.
Aid broadly works to mitigate poverty, and poverty would be higher in the
absence of aid.
Fielding et al. (2006) There is a straight forward positive impact of aid on development outcomes. Source(Author)
The first strand includes authors presenting the case for the insignificant impact of aid on
investment, savings or growth. Aid has been shown to improve unproductive public
consumption(Mosley et al.,1992) and stops short of increasing investment. This later point has
6
been confirmed by Boone(1996) and Reichel(1995). Ghura(1995) has pointed to the negative
effect of aid on domestic savings while Pedersen (1996) asserts, foreign aid distorts development
and leads to aid dependency.
In the second strand, we find studies in favor of the positive effects of aid on growth and
development. Among these works, we shall highlight that of Burnside & Dollar(2000) who
conclude on the effectiveness of aid when policies are good. The Burnside & Dollar(2000) paper
has received abundant comments from researchers(Guillaumont & Chauvet, 2001; Colier &
Dehn, 2001; Easterly et al., 2003); comments which have been challenged as being “extremely
data dependent”(Clemens et al.,2004).
2.2 Africa’s needs and Western responses
The bulk of African countries lie quite low on standard international comparisons.
According to Easterly(2005a), they occupy most of the bottom places in income per capita,
percentage of population living in extreme poverty(less than one US dollar a day), life
expectancy, infant mortality, literacy, AIDS prevalence and the HDI. The last four decades have
been those of extreme growth dismay in Africa. The West has reacted to Africa’s tragedy with
intensive involvement of foreign aid agencies and international organizations. On average
African countries receive much more aid in terms of percentage GDP than other developing
countries. The West does more because Africa is poor, however its efforts are supposed to have
positive impacts on GDP and development.
The year 2005 was that during which the West pressed hardest to save Africa. In July of
that year, the G8 agreed to double foreign aid to Africa from $25 billion a year to $50 billion to
finance the ‘Big push’, as well as erase African aid loans contracted during previous attempts at
a ‘Big push’. Before this effort, Africa was already the most aid-intensive region on the planet.
7
In September of that same year, world leaders gathered at the United Nations to further discuss
progress on ending poverty in the continent.
2.3 Theories and effects of Western assistance on Africa
2.3.1 The Big-Push models and foreign aid
In line with Easterly(2005a), “Big-Push” models suggest that Africa is poor because it is
stuck in a “poverty trap”. To emerge from the poverty trap, the continent need’s a large aid-
financed increase in investment; a “Big Push”. Both the Harrod-Domar and the Solow growth
models have been used to discuss the mechanisms of the poverty trap. The first mechanism is
that, savings are quite low for people who are very close to subsistence(as outlined by a Stone-
Geary utility function). In a closed economy, saving and investment are equal, thus investment is
low. In the Harrod-Domar model with the capital constraint binding, per capita growth in GDP is
simply a linear function of the investment(=saving) rate minus the population and depreciation
rates. If the saving is quite low to compensate for population growth and the depreciation of
capita, then per capita growth in GDP will zero or negative. In the 1950s and 1960s, early
development economists postulated a desirable per capita growth rate and calculated the
“investment requirement” to meet this target: the margin between the low domestic saving rate
and the “investment requirement” was termed the “Financing Gap”. The purpose of aid was to
cover the Financing Gap(Rostow,1960; Chenery & Strout,1966). Thus this model foresaw a
strong growth effect for foreign aid through its role in boosting domestic investment above what
domestic savings would finance. Although this model soon went out of favor in the academic
literature on development, it remained somehow relevant in international organizations like the
World Bank. Current policy proponents promoting foreign aid to Africa have explicitly cited this
model(Devarajan et al., 2002 at the World Bank; Blair Commission on Africa,2005; Sachs,
8
2005). Sach(2005) posits: “success in ending the poverty trap will be much easier than it
appears”. He asserts that the increase in foreign aid and debt relief can end Africa’s poverty in
our generation. In a closed economy, saving depends not only on the margin from subsistence
but also on the incentive to save depending on the rate of return to saving and investment. In an
open economy for instance, investment is not only a function of domestic saving but also
depends on the rate of return to investment. As shown by Africa’s extensive capital flight in
which an estimated 39% of African capital stock is held outside the continent(Collier et
al.,2001), domestic investors compare the returns to domestic and foreign investments: since
private foreign investors and bank lenders will invest in the economy if returns are very
attractive. In the Solow model, a strong relationship between income and savings rates could
generate multiple equilibria at low and high benchmarks of capital stock, resurfacing the
possibility of a poverty trap. Again, the low domestic savings do not pose much of an issue in an
open economy in which investment responds to incentives. Kraay & Raddatz(2005) have
shown that the relationship between initial capital and savings must follow an S-shaped curve to
generate a poverty trap; however they stop short of finding evidence for this shape in the data.
The second poverty generating mechanism is some kind of nonconvexity of the
production function in the Solow model. There could be strong external economies to investment
or there maybe high fixed costs to investment projects such that a minimum benchmark must be
surpassed for investment to be productive. This notion inspired the original article that first
proposed a Big Push(Rosentein-Rodan,1943). This strand has had a longer shelf-life in the
academic literature than the “Financing Gap” model(mechanism) because of the great zeal of
theorists in models with multiple equilibira( Murphy et al., 1989). In emphasizing such
nonconvexities, Sach(2005) posits that Africa is in a poverty trap. ‘Big Push’ models foretell
9
strong impacts of aid on investment and growth(development). This prediction has been subject
to a vast empirical literature which this paper has already highlighted and summarized above(see
Section 2.1 and Table 1).
2.3.2 Project interventions: education and health
Another view of Africa’s poverty has been that, it results from low human capital(poor
health and education) and infrastructure. This emphasis which began in the 1960s is still a major
theme in explaining Africa’s poverty. While enrollments have expanded rapidly, the quality of
education is hampered by missing inputs like textbooks and other school material, weak
incentives for teachers, corruption in education bureaucracies and disruption of schooling by
political crisis(Filmer & Pritchett, 1997). In health, some of the initial progress has slowed,
possibly due to corruption in the health system( studies in Cameroon, Guinea, Uganda and
Tanzania estimated that 30 to 70% of government drugs disappeared before reaching patients)
and more complicated health problems cannot be solved with routine methods(Filmer et al.,
2000; Pritchett & Woolcock,2004).
2.3.3 Models of policies and growth
The structural adjustment programs emerged from another perspective of why Africa
remains poor and this gained prominence in the early 1980s with the advent of the “Washington
consensus” and the pro-free markets arguments of people like the World Bank chief economist
Anne Krueger. According to this thesis, Africa is poor because its governments have chosen bad
policies. Indeed, it is obvious that many African governments pursued policies very detrimental
to growth and economic development: artificially overvalued currencies, high black market
premiums on foreign exchange, controls on interest rates that led to negative real interest rates
10
for savers, drastic(radical) restrictions on international trade and reliance on state enterprise. The
“bad policies” view of Africa’s poverty led to a different perception of the role of aid. The role
of Western donors and international institutions in this view was to induce changes in policy in
Africa by making aid contingent on such changes. Structural adjustment loans of the IMF and
the World Bank were thus embodied in this framework: which had as goal an “adjustment with
growth”. How successful were these loans in facilitating macroeconomic “adjustment”, that is to
say: changing policy? How successful was development assistance in inducing appealing
policies? The answer appears to be that Western donors and international institutions have not
been very successful in changing policy(Alesina & Dollar, 2002; Burnside & Dollar, 2000; Van
de Walle, 2001; Easterly,2005b). However these studies are premised on old data. Perhaps using
much recent data(as this paper aims)could provide different trends.
2.3.4 Dysfunctional donors
Concurring with Easterly(2005a), while all the attention in the ‘aid and development’
debate is focused on Africa, it is also interesting to assess how effective donors were in
delivering valuable services to the continent. There have been uncomfortable signs of donor
dysfunction. A case in point is the over 2 billion US dollars spent on roads in Tanzania over the
last 20 years. Yet roads did not improve. Even by bureaucratic standards, foreign aid
bureaucracy is dire. Why? Perhaps it is because efforts and results in aid are largely
unobservable and noticed only by the voiceless and powerless poor. Thus, the lack of visibility
on feed-backs and results makes aid bureaucracies unaccountable. Unlike democratic
governments or private firms in wealthy countries, aid agencies do not face a “voter test” or “ a
market test”. Africa’s poor could be conceived as political orphans; with no voice or feedback on
if aid is helping and nobody accountable to them.
11
2.4 Aids, institutions and development
An extensive literature on institutions and development suggests that Africa is poor
because it has poor institutions: dictatorship, lack of property rights, weak courts and contract
enforcement, violence and political instability, hostile regulatory environment for private
business and high inflation. In a bid to end African poverty, according to this perspective the
West needs to promote good institutions. Svensson(2000) finds that aid increases corruption in
ethnically fractionalized states (which is the situation of most African countries). The findings
of Knack(2001) suggest that higher aid worsens bureaucratic quality, leads to violating the law
with great impunity and more corruption(controlling for potential reverse causality). Similarly,
Djankov et al.(2005) notice that high aid caused setbacks to democracy between 1960 and 1999.
Indeed they found aid’s effect on democracy to be worse than that of the ‘natural resource curse’.
From the interesting literature on aid and institutions, in examining whether donors can
still influence institutions at the margin, three questions have received some attention. First, do
donors give more to poor countries who have better institutions(e.g less corruption, more
democracy)? Second, does aid induce better or worse institutional quality? Third, how would
outsiders engineer a transition from the present state of informal institutions towards more
formal institutional settings? The first question is relevant because donors widely assumed that
aid would be more effective in countries with better institutions. The answer to the first concern
also affects the response to the second. Thus, if donors give more aid to countries with better
institutions, this would create some incentive for reformers in the recipient country to adapt
better institutions. Alesina & Dollar(2000) and Alesina & Weder(2002) find no evidence that
democracies or less corrupt states are rewarded with more aid. The focus of this paper is the
second question. Then there is the thorny third issue about how aid would practically go about
12
changing institutions in the interest of Africa. The transition from informal to formal institutions
is somehow complex. Attempts by Western aid agencies to introduce top-down formal
institutions have not fared well in the complicated maze of bottom-up arrangements. Dixit(2004)
has an interesting argument as to how introducing imperfect rule-based institutions could
actually make things worse, as they create outside opportunities for members of relationship-
based networks. Network members can then cheat on their partners and exit to operate in the
rule-based system. A society could get caught in-between formal and informal institutions with
neither working well. Before closing this section, it is worthwhile noting that this part of the
literature has guided our choice of the government quality determinants we shall use in the
analytical phase of this paper. These include: control of corruption, government effectiveness,
political stability(no violence), voice and accountability, rule of law and regulation quality.
2.5 The scope of the current paper
In line with Clement et al.(2004), aggregate aid could be divided into three categories:
(1) emergency and humanitarian aid(likely to be negatively correlated with growth); (2) aid that
affects growth only over the long-term(if at all), such as aid to support democracy, the
environment, health or education; and (3) aid that plausibly could stimulate growth in the long
term, including budget and balance of payments support, investments in infrastructure and aid
for productive sectors such as agricultural and industrial. Whereas aid effectiveness papers
implicitly define donors’ objective as solely the promotion of economic growth or the reduction
of poverty in the recipient countries, a parallel strand of literature on aid allocation has shown
that most donors often pursue a different underlying agenda by allocating aid according to their
own strategic interest. Masud & Yontcheva(2005) have underlined that if a significant part of aid
is allocated for strategic purposes, no positive impact in terms of growth or poverty alleviation
13
should be expected. We partially negate this claim by asserting that, foreign aid irrespective of
vested interest should contribute to institutional development(degradation) either directly or
indirectly.
The contribution of this paper to the literature is threefold. Firstly, a great chunk of the
literature is based on data collected between 1960 and 1995. By using recent data(1996-2010),
this paper provides an updated account on the trends in the nexus. Secondly, we focus mainly on
Africa where the aid-institutions debate is most tensed. While previous studies have mixed
countries in various continental regions or focused on a restricted set of countries owing to
constraints in data availability, this paper uses data on 52 African countries. Thirdly, the African
geopolitical landscape has been recently marked by a wave of revolutions and social-unrests
owing to popular demands for institutional changes(Jasmine revolution and its contagion).
Findings from this paper could be relevant in providing policy recommendations as to if foreign-
aid could influence government quality in aid-recipient countries.
3. Data and Methodology
3.1 Data
We investigate a panel of 52 African countries with data from African Development
Indicators (ADI) of the World Bank (WB) ranging from 1996 to 2010. Corresponding variables
and countries are presented in the appendices (Appendix 3 and Appendix 4 respectively).
Borrowing from the IMF (2005) definition and the literature in Section 2.4, government quality
dependent variables include: corruption-control, government-effectiveness, voice and
accountability, political stability or no violence, rule of law and regulation quality. The
independent variable is Net Official Development Assistance(NODA). For robustness purposes
we use total NODA, NODA from multilateral donors and NODA from the Development
14
Assistance Committee(DAC) countries. Instrumental variables are: legal-origins, income-levels
and religious-dominations. These instruments have been substantially documented in the
economic development literature (La Porta et al., 1997; Beck et al., 2003; Agbor, 2011; Asongu,
2011ab). In the regressions we control for openness(trade) and population growth at the first-
stage and only for democracy and public investment at the second-stage. The choice of control
variables is also contingent on the degrees of freedom necessary for overidentifying restrictions
tests at second-stage regressions(more than two control variables will result in exact or under-
identification; meaning instruments are either equal to or less than the number of endogenous
explaining variables respectively). Summary statistics and correlation analysis are also presented
in the appendices(Appendix 1 and Appendix 2 respectively). While the former indicates that the
distributions of the variables are comparable, the later guides the empirical analysis in avoiding
issues related to multicolinearity and overparametization.
3.2 Methodology
3.2.1 Endogeneity
While development assistance has a bearing on the development of the recipient
country(Addison et al., 2005; Fielding et al.,2006), the reverse effect cannot be ruled-out as aid
from donor agencies(countries) is contingent on institutional and developmental characteristics.
Such factors maybe environmental(Guillaumont & Chauvet, 2001), supply-shocks(Collier &
Dehn, 2001) or even effective policies and economic management standards(Burnside & Dollar,
2000). We are thus faced with a concern of endogeneity owing to reverse-causality and omitted
variables, as the NODA indicators are correlated with the error term in the equation of interest.
To address this concern we shall assess the presence of endogeneity with the Hausman-test and
hence employ an estimation technique that takes account of the endogeneity issue.
15
3.2.2 Estimation technique
Concurring with Beck et al.(2003) and recent African law-finance literature(Asongu,
2011cd) the paper adopts an Instrumental Variable(IV) estimation method. Estimation by IV
addresses the puzzle of endogeneity and thus avoids the inconsistency of estimated coefficients
by Ordinary Least Squares (OLS) when the exogenous variables are correlated with the error
term in the main equation. In line with Asongu (2011cde), the Two-Stage-Least-Squares (TSLS)
estimation method adopted by this work will entail the following steps.
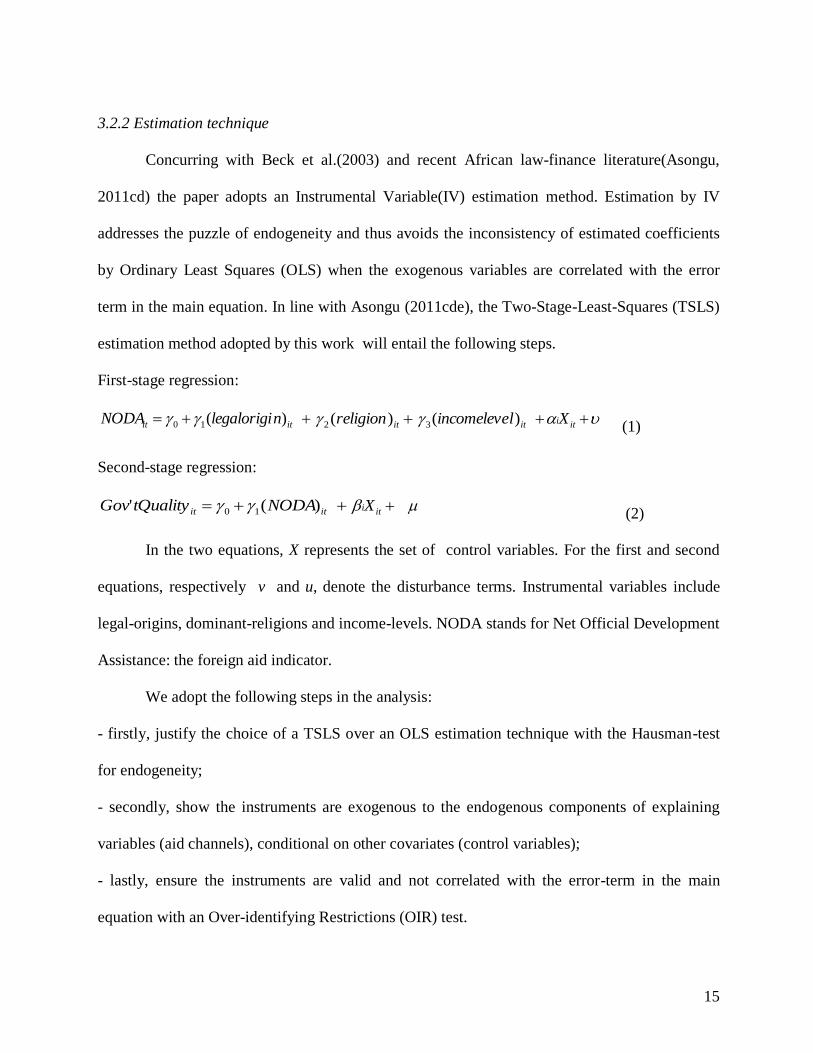
First-stage regression:
itit nlegalorigiNODA )(10 itreligion)(2 itlincomeleve )(3 itiX
(1)
Second-stage regression:
itit NODAtQualityGov )(' 10 itiX
(2)
In the two equations, X represents the set of control variables. For the first and second
equations, respectively v and u, denote the disturbance terms. Instrumental variables include
legal-origins, dominant-religions and income-levels. NODA stands for Net Official Development
Assistance: the foreign aid indicator.
We adopt the following steps in the analysis:
- firstly, justify the choice of a TSLS over an OLS estimation technique with the Hausman-test
for endogeneity;
- secondly, show the instruments are exogenous to the endogenous components of explaining
variables (aid channels), conditional on other covariates (control variables);
- lastly, ensure the instruments are valid and not correlated with the error-term in the main
equation with an Over-identifying Restrictions (OIR) test.
16
3.2.3 Robustness checks
To ensure robustness of the analysis, the following checks will be carried out: (1) usage
of alternative indicators of Government Quality(GQ) dynamics; (2) employment of two distinct
interchangeable sets of moment conditions that encompass every category of the instruments; (3)
usage of alternative aid indicators; (4) account for the concern of endogeneity; (5) estimation
with robust Heteroscedasticity and Autocorrelation Consistent(HAC) standard errors.
4. Empirical Analysis
This section addresses the ability of the exogenous components of NODA dynamics to
account for differences in GQ dynamics; the ability of the instruments to explain variations in the
endogenous components of NODA dynamics and the possibility of the instruments to account
for GQ dynamics beyond NODA dynamic channels. To make these examinations we use the
panel TSLS-IV estimation method with legal-origins, income-levels, and religious-dominations
as instrumental variables.
4.1 Development assistance and instruments
Table 2 below investigates the validity of the instruments in explaining cross-country
differences in NODA dynamics. Clearly, it could be noticed that distinguishing African countries
by legal-origins, income levels and religious-dominations help explain cross-country differences
in NODA. Based on the Fisher-test, the instruments taken collectively enter significantly in all
regressions at the 1% significance level. Broadly the following conclusions could be established.
(1) Christian-dominant countries have benefited more or less in foreign-aid than their Islam-
oriented counterparts depending on the NODA dynamic. (2) In line with common sense and
economic theory, Low-income countries receive more aid than Middle-income countries.
17
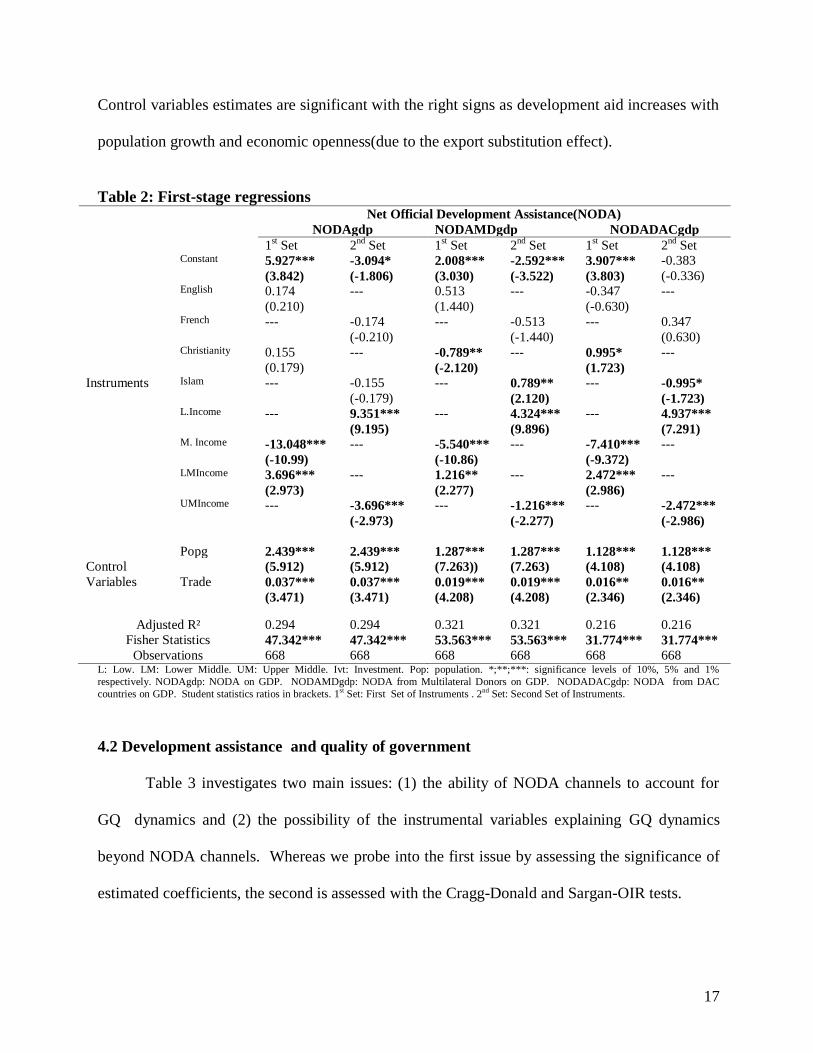
Control variables estimates are significant with the right signs as development aid increases with
population growth and economic openness(due to the export substitution effect).
Table 2: First-stage regressions Net Official Development Assistance(NODA)
NODAgdp NODAMDgdp NODADACgdp
1st Set 2
nd Set 1
st Set 2
nd Set 1
st Set 2
nd Set
Instruments
Constant 5.927*** -3.094* 2.008*** -2.592*** 3.907*** -0.383 (3.842) (-1.806) (3.030) (-3.522) (3.803) (-0.336) English 0.174 --- 0.513 --- -0.347 --- (0.210) (1.440) (-0.630) French --- -0.174 --- -0.513 --- 0.347 (-0.210) (-1.440) (0.630) Christianity 0.155 --- -0.789** --- 0.995* --- (0.179) (-2.120) (1.723) Islam --- -0.155 --- 0.789** --- -0.995* (-0.179) (2.120) (-1.723) L.Income --- 9.351*** --- 4.324*** --- 4.937*** (9.195) (9.896) (7.291) M. Income -13.048*** --- -5.540*** --- -7.410*** --- (-10.99) (-10.86) (-9.372) LMIncome 3.696*** --- 1.216** --- 2.472*** --- (2.973) (2.277) (2.986) UMIncome --- -3.696*** --- -1.216*** --- -2.472*** (-2.973) (-2.277) (-2.986)
Control
Variables
Popg 2.439*** 2.439*** 1.287*** 1.287*** 1.128*** 1.128***
(5.912) (5.912) (7.263)) (7.263) (4.108) (4.108)
Trade 0.037*** 0.037*** 0.019*** 0.019*** 0.016** 0.016**
(3.471) (3.471) (4.208) (4.208) (2.346) (2.346)
Adjusted R² 0.294 0.294 0.321 0.321 0.216 0.216
Fisher Statistics 47.342*** 47.342*** 53.563*** 53.563*** 31.774*** 31.774***
Observations 668 668 668 668 668 668 L: Low. LM: Lower Middle. UM: Upper Middle. Ivt: Investment. Pop: population. *;**;***: significance levels of 10%, 5% and 1%
respectively. NODAgdp: NODA on GDP. NODAMDgdp: NODA from Multilateral Donors on GDP. NODADACgdp: NODA from DAC
countries on GDP. Student statistics ratios in brackets. 1st Set: First Set of Instruments . 2nd Set: Second Set of Instruments.
4.2 Development assistance and quality of government
Table 3 investigates two main issues: (1) the ability of NODA channels to account for
GQ dynamics and (2) the possibility of the instrumental variables explaining GQ dynamics
beyond NODA channels. Whereas we probe into the first issue by assessing the significance of
estimated coefficients, the second is assessed with the Cragg-Donald and Sargan-OIR tests.
18
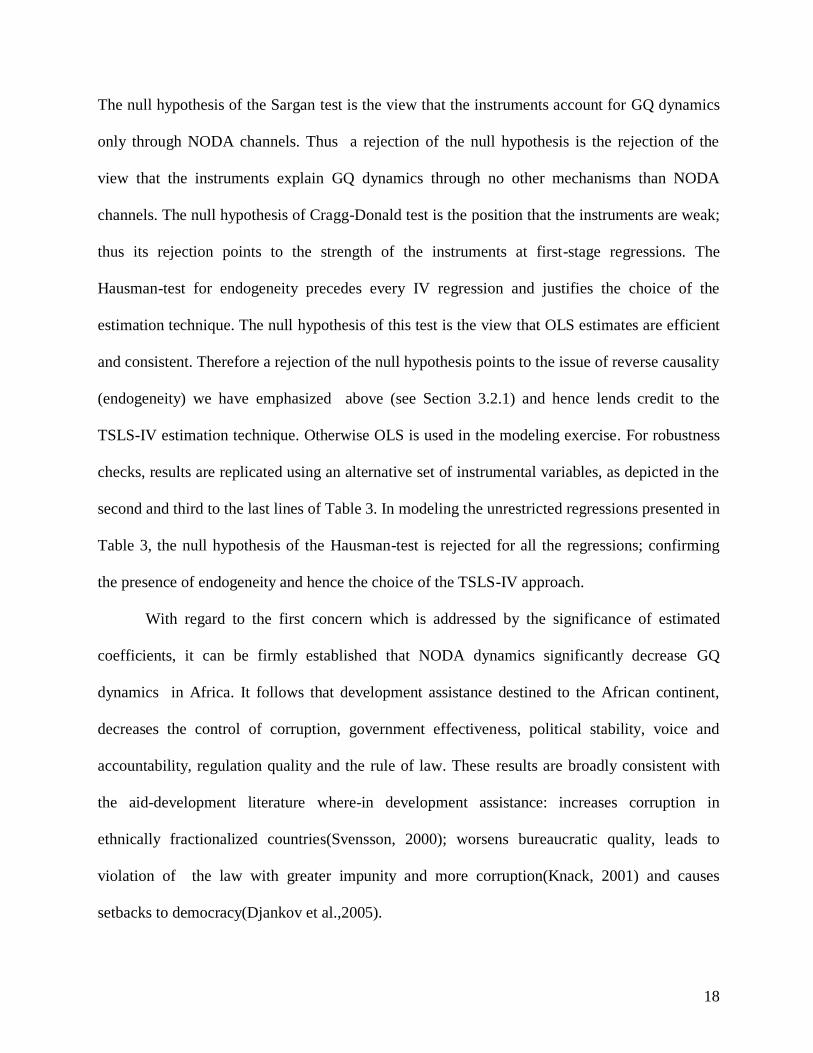
The null hypothesis of the Sargan test is the view that the instruments account for GQ dynamics
only through NODA channels. Thus a rejection of the null hypothesis is the rejection of the
view that the instruments explain GQ dynamics through no other mechanisms than NODA
channels. The null hypothesis of Cragg-Donald test is the position that the instruments are weak;
thus its rejection points to the strength of the instruments at first-stage regressions. The
Hausman-test for endogeneity precedes every IV regression and justifies the choice of the
estimation technique. The null hypothesis of this test is the view that OLS estimates are efficient
and consistent. Therefore a rejection of the null hypothesis points to the issue of reverse causality
(endogeneity) we have emphasized above (see Section 3.2.1) and hence lends credit to the
TSLS-IV estimation technique. Otherwise OLS is used in the modeling exercise. For robustness
checks, results are replicated using an alternative set of instrumental variables, as depicted in the
second and third to the last lines of Table 3. In modeling the unrestricted regressions presented in
Table 3, the null hypothesis of the Hausman-test is rejected for all the regressions; confirming
the presence of endogeneity and hence the choice of the TSLS-IV approach.
With regard to the first concern which is addressed by the significance of estimated
coefficients, it can be firmly established that NODA dynamics significantly decrease GQ
dynamics in Africa. It follows that development assistance destined to the African continent,
decreases the control of corruption, government effectiveness, political stability, voice and
accountability, regulation quality and the rule of law. These results are broadly consistent with
the aid-development literature where-in development assistance: increases corruption in
ethnically fractionalized countries(Svensson, 2000); worsens bureaucratic quality, leads to
violation of the law with greater impunity and more corruption(Knack, 2001) and causes
setbacks to democracy(Djankov et al.,2005).
19
Table 3: Second-stage regressions without HAC standard errors Control of Corruption Government Effectiveness Political Stability
Constant -0.631*** -0.649*** -0.621*** 0.198 -0.155 -0.066 -1.080*** -1.089*** -1.093***
(-9.100) (-9.674) (-8.519) (0.376) (-0.487) (-0.191) (-2.661) (-2.704) (-2.629)
NODAgdp -0.023*** --- --- -0.050*** --- --- -0.026*** --- ---
(-6.010) (-5.904) (-3.938)
NODAMDgdp --- -0.053*** --- --- -0.087*** --- --- -0.062*** ---
(-6.006) (-6.419) (-3.979)
NODADACgdp --- --- -0.041*** --- --- -0.068*** --- --- -0.046***
(-5.781) (-6.131) (-3.778)
Democracy 0.105*** 0.107*** 0.104*** 0.116*** 0.127*** 0.116*** 0.173*** 0.177*** 0.171***
(5.752) (5.892) (5.475) (4.672) (5.766) (4.834) (6.653) (6.907) (6.377)
Public Investment --- --- --- --- -0.068* -0.070* 0.040 0.038 0.043
(-1.766) (-1.686) (0.838) (0.795) (0.880)
Hausman-test 49.346*** 50.302*** 49.910*** 103.89*** 104.11*** 120.05*** 26.843*** 26.922*** 29.052***
OIR-Sargan test 0.039 0.695 0.214 1.603 2.143 0.000 0.199 0.003 0.709
P-value [0.980] [0.706] [0.898] [0.205] [0.143] [0.983] [0.654] [0.950] [0.399]
Cragg-Donald 19.796 19.854 19.641 2.341 4.356 4.389 3.579 3.530 3.616
Adjusted R² 0.177 0.172 0.167 0.102 0.205 0.186 0.325 0.324 0.314
Fisher Statistics 34.280*** 34.523*** 31.793*** 21.992*** 32.020*** 28.389*** 27.534*** 27.823*** 26.081***
Observations 514 514 514 399 443 443 452 452 452
Regulation Quality Rule of Law Voice and Accountability
Constant -0.204 -0.259 -0.180 -0.357 -0.415 -0.334 -0.693** -0.686** -0.706*
(-0.603) (-0.777) (-0.510) (-0.993) (-1.160) (-0.896) (-2.479) (-2.466) (-2.515)
NODAgdp -0.030*** --- --- -0.033*** --- --- -0.008* --- ---
(-5.371) (-5.575) (-1.876)
NODAMDgdp --- -0.068*** --- --- -0.074 --- --- -0.021** ---
(-5.221) (-5.332) (-1.968)
NODADACgdp --- --- -0.054*** --- --- -0.060*** --- --- -0.014*
(-5.263) (-5.512) (-1.772)
Democracy 0.115*** 0.121*** 0.112*** 0.139*** 0.146*** 0.135*** 0.198*** 0.199*** 0.198***
(5.337) (5.712) (4.932) (6.038) (6.399) (5.612) (11.08) (11.26) (10.94)
Public Investment -0.053 -0.052 -0.053 -0.049 -0.048 -0.048 -0.057* -0.058* -0.055*
(-1.323) (-1.301) (-1.267) (-1.137) (-1.115) (-1.080) (-1.704) (-1.746) (-1.657)
Hausman-test 48.153*** 44.185*** 54.739*** 81.226*** 79.312*** 89.942*** 46.888*** 44.846*** 42.808***
OIR-Sargan test 1.890 4.163** 0.612 2.559 5.310** 0.929 0.685 0.338 1.038
P-value [0.169] [0.041] [0.433] [0.109] [0.021] [0.335] [0.407] [0.560] [0.308]
Cragg-Donald 3.568 3.528 3.598 3.579 3.530 3.616 3.579 3.530 3.616
Adjusted R² 0.206 0.208 0.191 0.217 0.209 0.211 0.564 0.565 0.562
Fisher Statistics 26.947*** 26.797*** 25.203*** 31.687*** 30.848*** 29.982*** 52.851*** 53.084*** 52.360***
Observations 450 450 450 452 452 452 452 452 452
First-Set of Instruments Constant; English ; Christianity; Middle Income; Lower Middle Income
Second-Set of Instruments Constant; French; Islam; Lower Income; Upper Middle Income
*;**;***: significance levels of 10%, 5% and 1% respectively. (): z-statistics . []: p-values corresponding to OIR-Sargan test. OIR:
Overidentifying Restrictions test. NODAgdp: NODA on GDP. NODAMDgdp:NODA from Multilateral Donors on GDP. NODADACgdp:
NODA from DAC countries on GDP. For the Cragg-Donald statistics the relative bias is probably less than 5% since the critical value for
TSLS bias over OLS is 0.00 (11.04) when four(three) endogenous variables are used.
As to what concerns the second-issue, failure to reject the null hypothesis of the OIR test
in all regressions signifies that the instruments do not explain GQ dynamics through some other
mechanisms beyond NODA channels. Thus the instruments are valid and not correlated with the
disturbance term in the main equation; the instruments do not suffer-from endogeneity. We also
report the Cragg-Donald statistics for the strength of the instruments at the first stage of the
20
TSLS. The alternative hypothesis for strong instrument is not rejected in all regressions,
confirming the strength of the instruments. The control variables are significant with the right
signs since: democratic institutions improve government quality and public investment is often
associated with poor management and corrupt practices in allocation of contracts. According to
Ndikumana & Baliamoune-Lutz(2008), the positive association between public investment and
corruption supports the view that corrupt bureaucrats aim to increase capital expenditures(over
maintenance expenditure) to maximize private gains(rents-seeking). The analysis in Table 3 is
replicated with the second-set of moment conditions to confirm robustness of results.
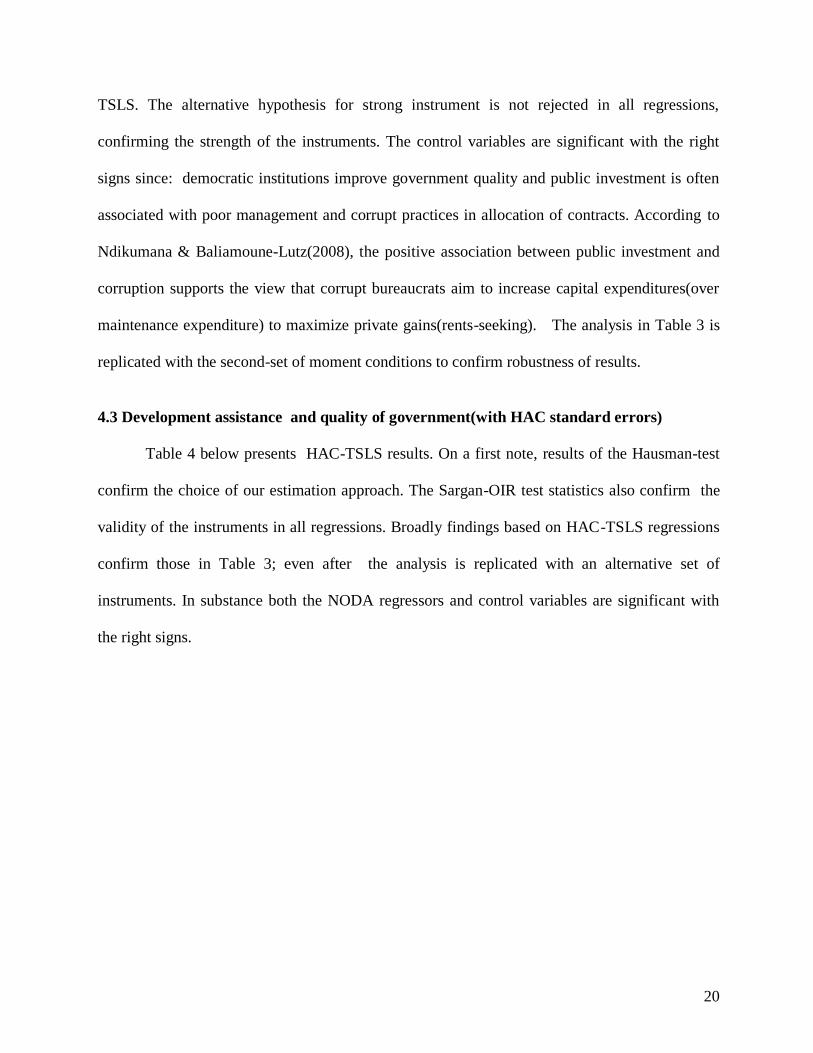
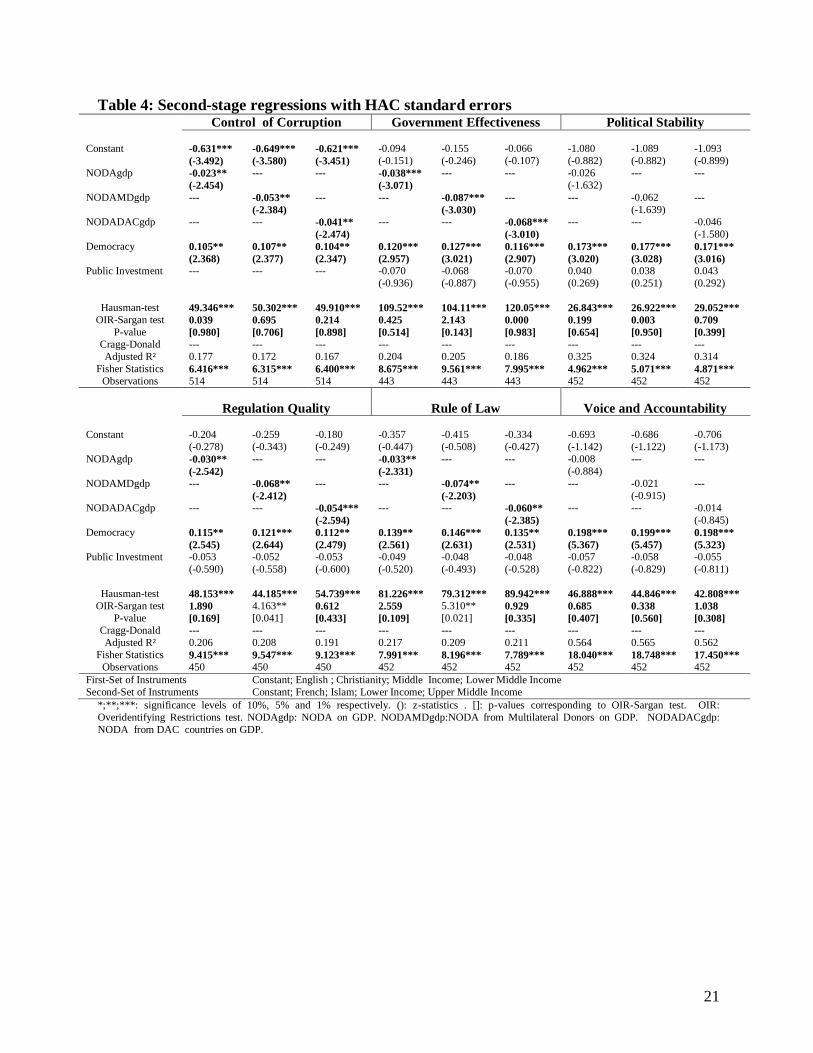
4.3 Development assistance and quality of government(with HAC standard errors)
Table 4 below presents HAC-TSLS results. On a first note, results of the Hausman-test
confirm the choice of our estimation approach. The Sargan-OIR test statistics also confirm the
validity of the instruments in all regressions. Broadly findings based on HAC-TSLS regressions
confirm those in Table 3; even after the analysis is replicated with an alternative set of
instruments. In substance both the NODA regressors and control variables are significant with
the right signs.
21
Table 4: Second-stage regressions with HAC standard errors Control of Corruption Government Effectiveness Political Stability
Constant -0.631*** -0.649*** -0.621*** -0.094 -0.155 -0.066 -1.080 -1.089 -1.093
(-3.492) (-3.580) (-3.451) (-0.151) (-0.246) (-0.107) (-0.882) (-0.882) (-0.899)
NODAgdp -0.023** --- --- -0.038*** --- --- -0.026 --- ---
(-2.454) (-3.071) (-1.632)
NODAMDgdp --- -0.053** --- --- -0.087*** --- --- -0.062 ---
(-2.384) (-3.030) (-1.639)
NODADACgdp --- --- -0.041** --- --- -0.068*** --- --- -0.046
(-2.474) (-3.010) (-1.580)
Democracy 0.105** 0.107** 0.104** 0.120*** 0.127*** 0.116*** 0.173*** 0.177*** 0.171***
(2.368) (2.377) (2.347) (2.957) (3.021) (2.907) (3.020) (3.028) (3.016)
Public Investment --- --- --- -0.070 -0.068 -0.070 0.040 0.038 0.043
(-0.936) (-0.887) (-0.955) (0.269) (0.251) (0.292)
Hausman-test 49.346*** 50.302*** 49.910*** 109.52*** 104.11*** 120.05*** 26.843*** 26.922*** 29.052***
OIR-Sargan test 0.039 0.695 0.214 0.425 2.143 0.000 0.199 0.003 0.709
P-value [0.980] [0.706] [0.898] [0.514] [0.143] [0.983] [0.654] [0.950] [0.399]
Cragg-Donald --- --- --- --- --- --- --- --- ---
Adjusted R² 0.177 0.172 0.167 0.204 0.205 0.186 0.325 0.324 0.314
Fisher Statistics 6.416*** 6.315*** 6.400*** 8.675*** 9.561*** 7.995*** 4.962*** 5.071*** 4.871***
Observations 514 514 514 443 443 443 452 452 452
Regulation Quality Rule of Law Voice and Accountability
Constant -0.204 -0.259 -0.180 -0.357 -0.415 -0.334 -0.693 -0.686 -0.706
(-0.278) (-0.343) (-0.249) (-0.447) (-0.508) (-0.427) (-1.142) (-1.122) (-1.173)
NODAgdp -0.030** --- --- -0.033** --- --- -0.008 --- ---
(-2.542) (-2.331) (-0.884)
NODAMDgdp --- -0.068** --- --- -0.074** --- --- -0.021 ---
(-2.412) (-2.203) (-0.915)
NODADACgdp --- --- -0.054*** --- --- -0.060** --- --- -0.014
(-2.594) (-2.385) (-0.845)
Democracy 0.115** 0.121*** 0.112** 0.139** 0.146*** 0.135** 0.198*** 0.199*** 0.198***
(2.545) (2.644) (2.479) (2.561) (2.631) (2.531) (5.367) (5.457) (5.323)
Public Investment -0.053 -0.052 -0.053 -0.049 -0.048 -0.048 -0.057 -0.058 -0.055
(-0.590) (-0.558) (-0.600) (-0.520) (-0.493) (-0.528) (-0.822) (-0.829) (-0.811)
Hausman-test 48.153*** 44.185*** 54.739*** 81.226*** 79.312*** 89.942*** 46.888*** 44.846*** 42.808***
OIR-Sargan test 1.890 4.163** 0.612 2.559 5.310** 0.929 0.685 0.338 1.038
P-value [0.169] [0.041] [0.433] [0.109] [0.021] [0.335] [0.407] [0.560] [0.308]
Cragg-Donald --- --- --- --- --- --- --- --- ---
Adjusted R² 0.206 0.208 0.191 0.217 0.209 0.211 0.564 0.565 0.562
Fisher Statistics 9.415*** 9.547*** 9.123*** 7.991*** 8.196*** 7.789*** 18.040*** 18.748*** 17.450***
Observations 450 450 450 452 452 452 452 452 452
First-Set of Instruments Constant; English ; Christianity; Middle Income; Lower Middle Income
Second-Set of Instruments Constant; French; Islam; Lower Income; Upper Middle Income
*;**;***: significance levels of 10%, 5% and 1% respectively. (): z-statistics . []: p-values corresponding to OIR-Sargan test. OIR:
Overidentifying Restrictions test. NODAgdp: NODA on GDP. NODAMDgdp:NODA from Multilateral Donors on GDP. NODADACgdp:
NODA from DAC countries on GDP.
22
4.4 Further discussion, caveats, policy implications and limitations
Findings in this paper do not provide much premise for the hope that Western aid can
save Africa. Maybe current views on the roots of poverty in the continent are too simplistic and
attempts to change these root causes have underestimated the difficulty of doing so from the
outside. The failed attempt by the West to rescue Africa through aid does not necessarily imply a
disastrous outlook for the continent. Africans on their own will have to achieve economic and
political changes that promote economic development and some of these changes are already on
course(such as the movement towards freer markets and the expansion of democratic
institutions). There are thus hopeful signs of enterprise growth in Africa. The mushrooming of
cell phones for example has enabled Africa edge the phase of fixed phones in the development
process. Economic development in the continent depends on African private sector entrepreneurs
, African civic activists and African political reformers… not on what ineffective, bureaucratic,
unaccountable, poorly informed and unmotivated outsiders do.
So if anything, what should the West do for Africa? Just because the West cannot save
the continent does not logically imply there is nothing the rich countries can do for the poor
there-in. The evidence in the literature(Easterly, 2005a) suggests that aid has been more
successful at delivering tangible outcomes like health, education and water. The micro
development literature using randomized controlled trails also finds positive effects of some
specific development interventions from development assistance. In summary, the West cannot
save Africa, but foreign aid can still be beneficial to recipient countries in a piecemeal way to
alleviate the sufferings of those desperately poor.
More modest goals from assistance in Africa would make it easier to hold aid agencies
accountable for the results of aid-targeted projects. The sweeping ambitions of the current
23
Western aid efforts in Africa do not lend themselves to accountability, since for the most part the
results are contingent on many other factors beside aid agency efforts. Attempts to isolate the
effects of these efforts have proved fruitless. More accountable agencies could be encouraged to
make greater strides on piecemeal interventions. These modest goals would render the West
much less intrusive in Africa, therefore ending the historical tendency towards ever-increasing
escalation of Western interventions in the continent. This could be a positive prospect because
the intrusive Western role has made African governments accountable to external actors instead
of their own citizens. It follows that insiders(those within Africa) have better information and
incentives to solve their own problems than outsiders do. Arguably, local democracy that eases
citizen feedback have proven to be a more effective vehicle for government quality than outside
pressure. On a final note, the more intrusive large-scale interventions have many unintended
consequences that are hard to evaluate, a great bulk of which could be detrimental.
Maybe the success of action in society depends on more particular facts than anyone can
possibly know. As Hayek(1988) posited “the curious task in economics is to demonstrate to
men how little they know about what they imagine they can design”. The escalation of Western
interventions in the African continent demonstrates an arrogance in the face of very imperfect
knowledge. Once economists discard arrogance, there is hope to hold donors accountable for
such piecemeal outcomes as well-maintained roads, water supply, medicines, textbooks and
nutritional supplements to improve the well-being of the poorest people in the world. It is
therefore a momentous time to solve the second tragedy of foreign aid; it is great time for
economists and policy makers to start rethinking the models and theories on which foreign aid is
based. In the meantime, it is up to people who really care about the poor to hold aid agencies
accountable for results.
24
An important limitation worth mentioning is that this kind of analysis depends to a great
extent on the integrity of the proxy for GQ obtained from perception-based measures. Thus
omitted variables and media-effect could significantly affect perceptions of GQ and
consequently bias the link between the aid indicators and the GQ performance measures.
However, to the best of our knowledge there are no better measures of GQ than those from
African Development Indicators of the World Bank. The paper has limited this setback by using
six different indicators of GQ. Also the employment of a methodology that takes endogeneity
into account addresses concerns of omitted-variables and bias in the perception-based measures.
5. Conclusion
For over five decades the political economy of foreign aid has been widely debated in
academic and policy-making circles. A large literature on institutions and development suggests
that Africa is poor because it has poor institutions: dictatorship, lack of property rights, weak
courts and contract enforcement, high corruption, political instability, violence and hostile
regulatory environment for private business. In assessing the impact of development assistance, a
great bulk of studies have focused on the effect of aid flows on GDP growth and other
macroeconomic variables(investment or public consumption). The underlying assumption here is
that aid is destined to bridge the saving-investment gap poor countries face(Rostow,1960;
Chenery & Strout,1966; Easterly, 2005a). Surprisingly there has been much less research
conducted on the impact of foreign aid on the evolution of government institutions.
This paper has assessed the effectiveness of foreign aid in improving government
institutions in 52 African countries using updated data(1996-2010). Findings suggest
development assistance deteriorates government quality dynamics of corruption-control,
political-stability, rule of law, regulation quality, voice and accountability and government
25
effectiveness. Maybe the success of action in society depends on more particular facts than
anyone can possibly know. As Hayek(1988) posited “the curious task in economics is to
demonstrate to men how little they know about what they imagine they can design”. The
escalation of Western interventions in the African continent demonstrates an arrogance in the
face of very imperfect knowledge. Once economists discard arrogance, there is hope to hold
donors accountable for such piecemeal outcomes as well-maintained roads, water supply,
medicines, textbooks and nutritional supplements to improve the well-being of the poorest
people in the world. It is therefore a momentous time to solve the second tragedy of foreign aid;
it is great time for economists and policy makers to start rethinking the models and theories on
which foreign aid is based. In the meantime, it is up to people who really care about the poor to
hold aid agencies accountable for results.
26
Appendices
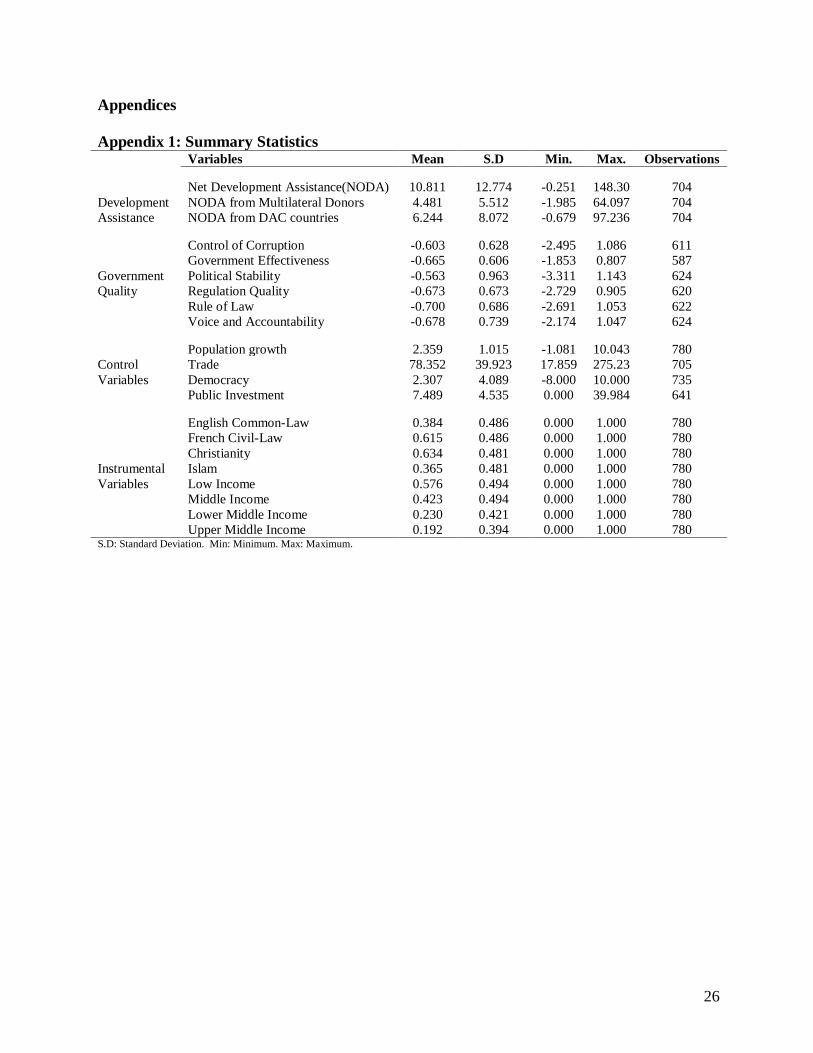
Appendix 1: Summary Statistics Variables Mean S.D Min. Max. Observations
Development
Assistance
Net Development Assistance(NODA) 10.811 12.774 -0.251 148.30 704
NODA from Multilateral Donors 4.481 5.512 -1.985 64.097 704
NODA from DAC countries 6.244 8.072 -0.679 97.236 704
Government
Quality
Control of Corruption -0.603 0.628 -2.495 1.086 611
Government Effectiveness -0.665 0.606 -1.853 0.807 587
Political Stability -0.563 0.963 -3.311 1.143 624
Regulation Quality -0.673 0.673 -2.729 0.905 620
Rule of Law -0.700 0.686 -2.691 1.053 622
Voice and Accountability -0.678 0.739 -2.174 1.047 624
Control
Variables
Population growth 2.359 1.015 -1.081 10.043 780
Trade 78.352 39.923 17.859 275.23 705
Democracy 2.307 4.089 -8.000 10.000 735
Public Investment 7.489 4.535 0.000 39.984 641
Instrumental
Variables
English Common-Law 0.384 0.486 0.000 1.000 780
French Civil-Law 0.615 0.486 0.000 1.000 780
Christianity 0.634 0.481 0.000 1.000 780
Islam 0.365 0.481 0.000 1.000 780
Low Income 0.576 0.494 0.000 1.000 780
Middle Income 0.423 0.494 0.000 1.000 780
Lower Middle Income 0.230 0.421 0.000 1.000 780
Upper Middle Income 0.192 0.394 0.000 1.000 780 S.D: Standard Deviation. Min: Minimum. Max: Maximum.
27
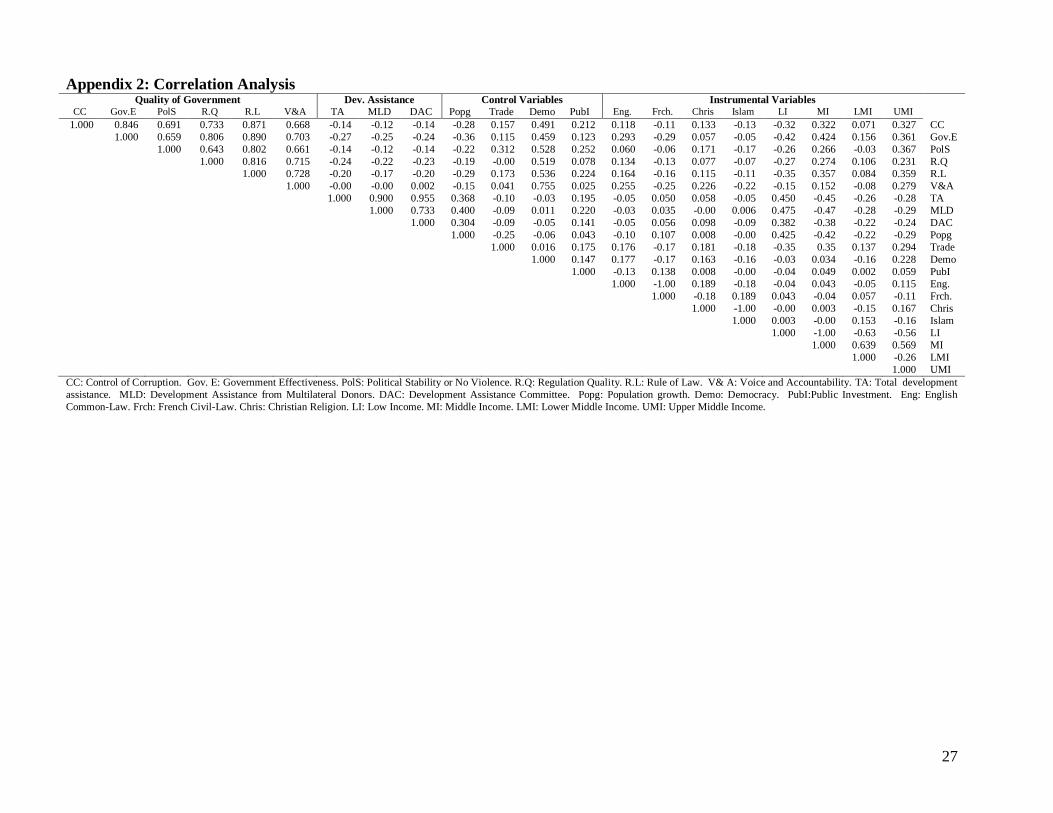
Appendix 2: Correlation Analysis Quality of Government Dev. Assistance Control Variables Instrumental Variables
CC Gov.E PolS R.Q R.L V&A TA MLD DAC Popg Trade Demo PubI Eng. Frch. Chris Islam LI MI LMI UMI
1.000 0.846 0.691 0.733 0.871 0.668 -0.14 -0.12 -0.14 -0.28 0.157 0.491 0.212 0.118 -0.11 0.133 -0.13 -0.32 0.322 0.071 0.327 CC
1.000 0.659 0.806 0.890 0.703 -0.27 -0.25 -0.24 -0.36 0.115 0.459 0.123 0.293 -0.29 0.057 -0.05 -0.42 0.424 0.156 0.361 Gov.E
1.000 0.643 0.802 0.661 -0.14 -0.12 -0.14 -0.22 0.312 0.528 0.252 0.060 -0.06 0.171 -0.17 -0.26 0.266 -0.03 0.367 PolS
1.000 0.816 0.715 -0.24 -0.22 -0.23 -0.19 -0.00 0.519 0.078 0.134 -0.13 0.077 -0.07 -0.27 0.274 0.106 0.231 R.Q
1.000 0.728 -0.20 -0.17 -0.20 -0.29 0.173 0.536 0.224 0.164 -0.16 0.115 -0.11 -0.35 0.357 0.084 0.359 R.L
1.000 -0.00 -0.00 0.002 -0.15 0.041 0.755 0.025 0.255 -0.25 0.226 -0.22 -0.15 0.152 -0.08 0.279 V&A
1.000 0.900 0.955 0.368 -0.10 -0.03 0.195 -0.05 0.050 0.058 -0.05 0.450 -0.45 -0.26 -0.28 TA
1.000 0.733 0.400 -0.09 0.011 0.220 -0.03 0.035 -0.00 0.006 0.475 -0.47 -0.28 -0.29 MLD
1.000 0.304 -0.09 -0.05 0.141 -0.05 0.056 0.098 -0.09 0.382 -0.38 -0.22 -0.24 DAC
1.000 -0.25 -0.06 0.043 -0.10 0.107 0.008 -0.00 0.425 -0.42 -0.22 -0.29 Popg
1.000 0.016 0.175 0.176 -0.17 0.181 -0.18 -0.35 0.35 0.137 0.294 Trade
1.000 0.147 0.177 -0.17 0.163 -0.16 -0.03 0.034 -0.16 0.228 Demo
1.000 -0.13 0.138 0.008 -0.00 -0.04 0.049 0.002 0.059 PubI
1.000 -1.00 0.189 -0.18 -0.04 0.043 -0.05 0.115 Eng.
1.000 -0.18 0.189 0.043 -0.04 0.057 -0.11 Frch.
1.000 -1.00 -0.00 0.003 -0.15 0.167 Chris
1.000 0.003 -0.00 0.153 -0.16 Islam
1.000 -1.00 -0.63 -0.56 LI
1.000 0.639 0.569 MI
1.000 -0.26 LMI
1.000 UMI
CC: Control of Corruption. Gov. E: Government Effectiveness. PolS: Political Stability or No Violence. R.Q: Regulation Quality. R.L: Rule of Law. V& A: Voice and Accountability. TA: Total development
assistance. MLD: Development Assistance from Multilateral Donors. DAC: Development Assistance Committee. Popg: Population growth. Demo: Democracy. PubI:Public Investment. Eng: English
Common-Law. Frch: French Civil-Law. Chris: Christian Religion. LI: Low Income. MI: Middle Income. LMI: Lower Middle Income. UMI: Upper Middle Income.
28
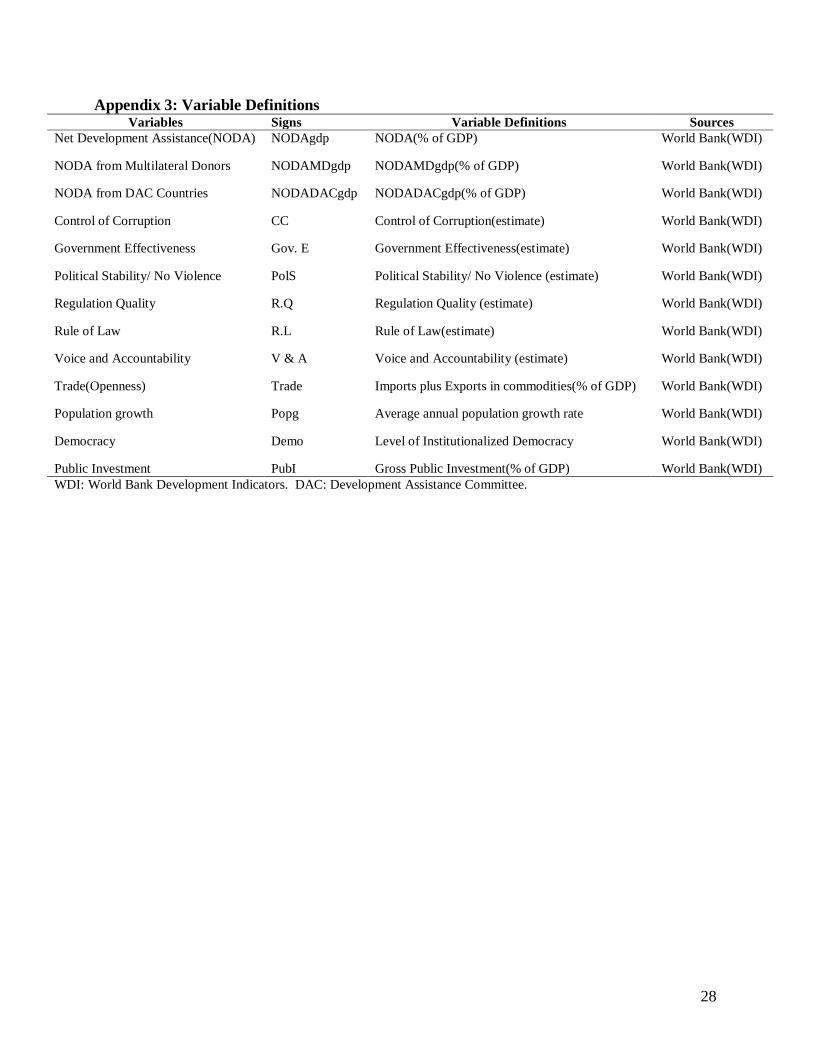
Appendix 3: Variable Definitions Variables Signs Variable Definitions Sources
Net Development Assistance(NODA) NODAgdp NODA(% of GDP) World Bank(WDI)
NODA from Multilateral Donors NODAMDgdp NODAMDgdp(% of GDP) World Bank(WDI)
NODA from DAC Countries NODADACgdp NODADACgdp(% of GDP) World Bank(WDI)
Control of Corruption CC Control of Corruption(estimate) World Bank(WDI)
Government Effectiveness Gov. E Government Effectiveness(estimate) World Bank(WDI)
Political Stability/ No Violence PolS Political Stability/ No Violence (estimate) World Bank(WDI)
Regulation Quality R.Q Regulation Quality (estimate) World Bank(WDI)
Rule of Law R.L Rule of Law(estimate) World Bank(WDI)
Voice and Accountability V & A Voice and Accountability (estimate) World Bank(WDI)
Trade(Openness) Trade Imports plus Exports in commodities(% of GDP) World Bank(WDI)
Population growth Popg Average annual population growth rate World Bank(WDI)
Democracy Demo Level of Institutionalized Democracy World Bank(WDI)
Public Investment PubI Gross Public Investment(% of GDP) World Bank(WDI)
WDI: World Bank Development Indicators. DAC: Development Assistance Committee.

29
Appendix 4: Presentation of Countries Instruments Instrument Category Countries Num.
Legal-origins
English Common-Law Botswana, The Gambia, Ghana, Kenya, Lesotho, Liberia,
Malawi, Mauritius, Namibia, Nigeria, Seychelles, Sierra Leone,
Somalia, South Africa, Sudan, Swaziland, Uganda, Zambia,
Tanzania, Zimbabwe.
20
French Civil-Law Algeria, Angola, Benin, Burkina Faso, Burundi, Cameroon,
Cape Verde, Central African Republic, Chad, Congo Republic,
Congo Democratic Republic, Djibouti, Egypt, Eritrea,
Equatorial Guinea, Ivory Coast, Ethiopia, Gabon, Guinea,
Guinea-Bissau, Libya, Madagascar, Mali, Mauritania, Morocco,
Mozambique, Niger, Rwanda, Sao Tome & Principe, Senegal,
Togo, Tunisia.
32
Religions
Christianity
Angola, Benin ,Botswana, Burundi, Cameroon, Cape Verde,
Central African Republic, Congo Republic, Congo Democratic
Republic, Ivory Coast, Equatorial Guinea, Ethiopia, Eritrea,
Gabon, Ghana, Kenya, Lesotho, Liberia, Madagascar, Malawi,
Mauritius, Mozambique, Namibia, Rwanda, Seychelles, Sao
Tome & Principe, South Africa, Swaziland, Togo, Uganda,
Zambia, Tanzania, Zimbabwe.
33
Islam Algeria, Burkina Faso, Chad, Djibouti, The Gambia, Egypt,
Guinea-Bissau, Guinea, Libya, Mali, Mauritania, Morocco,
Niger, Nigeria, Senegal, Sierra Leone, Somalia, Sudan, Tunisia.
19
Income Levels
Low Income Benin ,Burkina Faso, Burundi, Central African Republic, Chad,
Congo Republic, Congo Democratic Republic, Djibouti,
Ethiopia, Eritrea, The Gambia, Ghana, Guinea-Bissau, Guinea,
Kenya, Liberia, Madagascar, Malawi, Mali, Mauritania,
Mozambique, Niger, Rwanda, Sierra Leone, Somalia, Togo,
Uganda, Zambia, Tanzania, Zimbabwe.
30
Middle Income Algeria, Angola ,Botswana, Cameroon, Cape Verde, Egypt,
Ivory Coast, Equatorial Guinea, Gabon, Lesotho, Libya,
Mauritius, Morocco, Namibia, Nigeria, Senegal, Seychelles,
Sao Tome & Principe, South Africa, Sudan, Swaziland, Tunisia.
22
Lower Middle Income Angola, Cameroon, Cape Verde, Egypt, Ivory Coast, Lesotho,
Morocco, Nigeria, Sudan, Swaziland, Tunisia.
11
Upper Middle Income Algeria, Botswana, Equatorial Guinea, Gabon, Libya, Mauritius,
Namibia, Sao Tome & Principe, Seychelles, South Africa.
10
Num: number of countries
30
References
Addison, T., Mavrotas, G., & McGillivray, M., (2005), “Development Assistance and
Development Finance: Evidence and Global Policy Agendas”, Journal of International
Development, 17, pp.819-836.
Agbor, J.A., (2011), “How Does Colonial Origin Matter for Economic Performance in
Sub-Saharan Africa”, World Institute for Development Economics Research, Working Paper,
No. 2011/27.
Alesina, A., & Weder, B., (2002), “Do Corrupt Governments Receive Less Foreign Aid?”
American Economic Review, 92, pp.1126-1137.
Alesina, A., & Dollar, D., (2000), “ Who gives Foreign Aid to Whom and Why?” Journal of
Economic Growth, 5, pp. 33-64.
Asongu, S. A., (2011a). “Law, finance, economic growth and welfare: why does legal origin
matter?”, MPRA Paper No. 33868.
Asongu, S. A.,(2011b). “Law, finance and investment: does legal origin matter?”, MPRA Paper
No. 34698.
Asongu, S. A., (2011c). “Law and investment in Africa”, MPRA Paper No.34700.
Asongu, S. A.,(2011d). “Law and finance in Africa”, MPRA Paper No. 34080.
Asongu, S.A., (2011e). “Why do French civil-law countries have higher levels of financial
efficiency?”, MPRA Paper No.33950.
Boone, P.,(1996), “Politics and Effectiveness of Foreign Aid,” European Economic Review, 40,
pp.289-329.
Burnside, C., & Dollar, D., (1998), “Aid, the incentive regime and poverty reduction,” Policy
Research Working Paper, No. 1937, The World Bank.
31
Burnside, C., & Dollar, D., (2000), “Aid, Policies and Growth”, American Economic Review,
90(4), pp.847-868.
Beck, T., Demirgüç-Kunt, A., & Levine, R.,(2003). “Law and finance: why does legal origin
matter?”, Journal of Comparative Economics, 31, pp. 653-675.
Chenery, H. B., & Strout, A. M., (1966), “Foreign Assistance and Economic Development”,
American Economic Review, 56, pp. 679-733.
Clemens, M.A., Radelet, S., & Bhavnani, R., (2004), “Counting Chickens When They Hatch: the
Short-Term Effect of Aid on Growth”, Center for Global Development Working Paper No. 44.
Collier, P.,& Dollar, D., (2001), “Can the World Cut Poverty in Half? How Policy Reform and
Effective Aid can Meet International Development Goals,” World Development, 29(111),
pp.1787-1802.
Collier, P., Hoeffler, A., & Pattillo, C.,(2001), “Flight Capital as a Portfolio Choice”, The World
Bank Economic Review, 15, pp. 55-80.
Commission for Africa(2005), “Our Common Interest: Report of the Commission for Africa”,
Blair Commission.
Dalgaard, C., & Hansen, H., (2001), “On Aid, Growth and Good Policies,” Journal of
Development Studies, 37, pp.17-41.
Devarajan, S., Miller, M., & Swanson, E., (2002), “Goals for Development: History, Prospects
and Costs”, World Bank Policy Research Paper No. 2819.
Dixit, A., (2004), Lawlessness and Economics: Alternative Modes of Governance. Princeton:
University Press.
32
Djankov, S., Jose, G.M., Marta, R.,(2005), “The Curse of Aid”, World Bank, Mimeo, April,
2005.
Easterly, W.,(1999), “The Ghost of Financing Gap: Testing the Growth Model Used in the
International Financial Institutions”, Journal of Development Economics, 60, pp. 423-438.
Easterly, W.,(2005a), “Can foreign aid save Africa”, Saint John’s University.
Easterly, W., (2005b), “ What did structural adjustment adjust? The association of policies and
growth with repeated IMF and World Bank adjustment loans,” Journal of Development
Economics, 76, pp. 1-22.
Easterly, W, Levine, R., & Roodman, D., (2003), “ New Data, New Doubts: A Comment on
Burnside and Dollar’s “Aid, Policies and Growth 2000’,” American Economic Review, NBER
Working Paper, No. 9846.
Feeny, S., (2003),“The impact of foreign aid on poverty and human well-being in Papua New
Guinea”, Asia-Pacific Development Journal, 10,(2).
Fielding, D., McGillivray, M., & Torres, S., (2006), “ A Wider Approach to Aid Effectiveness:
Correlated Impacts on Health, Wealth, Fertility and Education”, The World Institute for
Development Economics Research(UNU-WIDER).
Filmer, D & Pritchett, L.,(1997), “What Educational Production Functions Really Show: A
Positve Theory of Education Spending”, World Bank Policy Research Paper, No. 1795.
Filmer, D., Hammer, J., & Pritchett, L., (2000), “Weak Links in the Chain: A Diagnosis of
Health Policy in Poor Countries,” The World Bank Research Observer, 15(2), pp.199-224.
Ghura, D., Hadjimichael, M.T., Mahleisen, M., Nord, R., & Ucer, E.M., (1995), “Sub-Saharan
Africa: Growth, Savings and Investment, 1986-93”, IMF Occasional Paper No. 118.
33
Gomane, K., Morrissey, O., Mosley, P., & Verschoor, A., (2003), “Aid, pro-poor Government
Spending and Welfare”, CREDIT Working Paper 03/01.
Guillaumont, P., & Chauvet, L., (2001), “Aid and Performance: A Reassessment,” Journal of
Development Studies, 37, pp.66-92.
Hayek, F.A.,(1988), The Fatal Conceit: The Errors of Socialism, Edited by W.W. Bartley III,
Chicago: University of Chicago Press.
IMF (2005, June), “The IMF Approach to Promoting Good Governance and Combating
Corruption-A Guide”, International Monetary Fund.
Ishfaq, M.,(2004), “Aid effectiveness, debt capacity and debt management in the economy of
Pakistan”, a PhD dissertation at Quad-e-Azam University, Islamabad.
Knack, S., (2001), “Aid Dependence and the Quality of Governance: Cross-Country Empirical
Tests”, Southern Economic Journal, 68(2), pp.310-329.
Kraay, A., & Raddatz, C., (2005), “Poverty Traps, Aids and Growth”, The World Bank.
La Porta, R., Lopez-de-Silanes, F., Shleifer, A., & Vishny, R.W., (1997). “Legal Determinants of
External Finance”, Journal of Finance, 52, pp. 1131-1150.
Masud, N., & Yontcheva, B., (2005), “Does Foreign Aid Reduce Poverty? Empirical Evidence
from Nongovernmental and Bilateral Aid”, IMF Working Paper, 05/100.
Mosley, P., Hudson, J., & Horrell, S., (1992), “Aid, The Public Sector and The Market in Less
Developed Countries: A Return to The Scene of Crime”, Journal of International Development,
4, pp.139-150.
34
Mosley, P., Hudson, J., & Verschoor, A., (2004), “Aid, Poverty Reduction and the ‘new’
Conditionality”, Economic Journal, 114, F217–F243.
Murphy, K., Shleifer, A., & Vishny, R., (1989), “Industrialization and the Big Push”, Journal of
Political Economy, 97(5), pp.1003-1026.
Ndikumana, L., & Mina Baliamoune-Lutz, M., (2008), “Corruption and Growth: Exploring the
Investment Channel”, University of Massachusetts, Department of Economics, Working Paper,
No. 2008-08.
Pedersen, K. P., (1996), “Aid, Investment and Incentives,” Scandinavian Journal of Economics,
98(3), pp.423-438.
Prichett, L., & Woolcock, M., (2004), “Solutions When the Solution Is the Problem: Arraying
the Disarray in Development”, World Development, 32(2), pp.191-212.
Reichel, R., (1995), “Development, Aid, Savings and Growth in the 1980s: A Cross-Sectional
Analysis,” Savings and Development, 19(3), pp.279-296.
Rosenstein-Rodan, P.,(1943), “Problem of Industrialization in Eastern and South-Eastern
Europe”, Economic Journal, 53, pp.202–211.
Rostow, W.W., (1960), The Stages of Economic Growth: A Non-Communist Manifesto.
Sachs, J.D.,(2005), The End of Poverty: Economic Possibilities for Our Time, New York: The
Penguin Press.
Svensson, J., (2000), “Foreign Aid and Rent-Seeking”, Journal of International Economics,
51(2), pp. 437-461.
35
Stulz, R., (1999), “Globalization, corporate finance, and the cost of capital”, Journal of Applied
Corporate Finance, 12, pp. 8–25.
Van de Walle, N., (2001), African Economics and the Politics of Permanent Crisis, 1979-1999,
Cambridge UK, Cambridge University Press 2001.