Discursive limitations and opportunities in environmental ...
Upload
khangminh22Category
view
1download
0
AN ABSTRACT OF THE THESIS OF
Katharine M. Hunter-Zaworski for the degree of Doctor of Philosophy in CivilEngineering presented on April 7.1988.
Title: The Performance of Drivers with Physical Limitationsat T-Intersections
Redacted for PrivacyAbstract approved:
Robert D. Layton" j
The research examines the effect of restricted head and neck movement on
driving performance as measured by decision time at T-intersections. The traffic
safety and human factors literature was reviewed, and very little was found
concerning drivers with physical limitations. T-intersections were selected for
study because most accidents involving drivers with diminished capacities occur
at intersections, and T-intersections are simpler than four-way intersections. A
laboratory study was selected to provide better experimental control, safety and
repeatability. A unique methodology was used that employed a fixed base driving
simulator which incorporated the use of video recordings of intersections to
provide a 180 degree field of view. Eighteen intersections were studied with
various levels of traffic volume and sight distance. The 72 test subjects were
between the ages of 30-50, or 60-80, and half in each age group had restricted
range of movement of their neck. The task for the subjects was to depress the
brake pedal, watch the video presentations of the T-intersections on three
screens and indicate when it was safe to make a left turn by releasing the brake
pedal. The decision time was a measure of driving performance.
The study results confirmed the hypotheses that;

1. decision time increases with age, and age effects dominated the other
factors which were studied,
2. decision time increases with age and level of impairment indicating that
younger drivers are able to compensate for their impairments, but older
drivers both with and without impairments are unable to make
compensations in their driving performance,
3. traffic volume has a greater impact on decision time at intersections
than sight distance,
4. skewed intersections are hazardous for drivers with neck impairments.
Further laboratory and field studies are recommended to validate the study
results and to examine the problem of skewed intersections.
The Performance of Drivers with Physical Limitations
at T-Intersections
by
Katharine M. Hunter-Zaworski
A THESIS
submitted to
Oregon State University
in partial fulfillment ofthe requirements for the
degree of
Doctor of Philosophy
Completed April 7, 1988
Commencement June 1988

APPROVED:
Redacted for PrivacyProfessor of Civil rigrriferyn charge of major
Redacted for Privacy
Head of y r Trn e n t qt Engineering
Redacted for Privacy
Dean of 4
Date thesis is presented April 7.1988
Typed by researcher for Katharine M. Hunter-Zaworski

cCopyright by Katharine M. Hunter- Zaworski
April 7, 1988
All Rights Reserved

ACKNOWLEDGEMENT
A special thank you to Joseph, my Husband for his helpful suggestions, advice,
support, and encouragement. I thank the Department of Transportation, Federal
Highway Administration Graduate Research Fellowship Program for providing the
opportunity to undertake this research at the Turner Fairbank Highway Research
Center in McLean, Virginia. I acknowledge the guidance and support given to me
by Dr. Truman Mast, at FHWA who supervised the research efforts. I thank Drs.
Robert Layton and Robert Safford for their encouragement, direction and
support of Human Factors in Transportation Research at Oregon State
University.
TABLE OF CONTENTS
1 INTRODUCTION 1
2 BACKGROUND 32.0 Background of the Problem 32.1 Fundamental Concepts 4
2.1.1. Perception Reaction Time 42.1.2. Sight Distance 62.1.3. Gap Acceptance 7
2.2 Background for Research 82.3 Closure 8
3 LITERATURE REVIEW 103.0 Introduction 103.1 Driver 10
3.1.1. Introduction 103.1.2. Physical Limitations 123.1.3. Vision 123.1.4. Sex Differences 143.1.5. Age Problems 153.1.6. Ergonomics 18
3.2 Intersections 183.2.0. Introduction 183.2.1. Stopping Sight Distance 193.2.2. Decision Sight Distance 233.2.3. Intersection Geometrics 24
3.3 Experimental Design 253.4 Driving Simulators 26
3.4.1. Simulator Studies 273.5 Closure 28
4 RESEARCH OBJECTIVES 294.0 Research Objectives 294.1 Purpose 294.2 Problem Statement 304.3 Research Hypothesis 30
5 EXPERIMENTAL METHODOLOGY 315.0 Introduction 315.1 Experimental Design 31
6 EXPERIMENTAL PROCEDURE 396.0 Introduction 396.1 Subjects 396.2 Equipment 40
6.2.1. Camcorders 406.2.1.2. Filming Process 44
6.2.2. Playback Equipment 446.2.2.1. Video Tapes 45
6.2.3. Head Angle Measurement Device 456.2.4. Data Acquisition Equipment 47
6.2.4.1. Black box 50

6.2.4.2. D.A.V.E. 516.3 Experimental Procedure 536.4 Data Collection 55
6.4.1. Preprocessing Analysis 55
7 EXPERIMENTAL RESULTS 567.0 Introduction 567.1 Experimental Results 58
7.1.1. Totals Summary 587.1.2. Intersection Summary 717.1.3. Intersection Geometrics 1037.1.4. Regression Analysis 107
8 DISCUSSION OF RESULTS 1128.0 Introduction 1128.1 Totals Summary 1128.2 Intersection Summary 1148.3 Intersection Geometrics 1178.4 Regression Analysis 1188.5 Experimental Observations 118
9 CONCLUSIONS and RECOMMENDATIONS 1229.0 Conclusions 122
9.0.1. Implications of the Conclusions 1239.1 Recommendations 124
9.1.1. Validation Studies 1249.1.1.1. Laboratory Studies 1249.1.1.2. Field Studies 1269.1.1.3. Applications 126
9.1.2. Medication Studies 1269.1.3. Closure 127
BIBLIOGRAPHY 128
APPENDICES 133Appendix A 133
Instruction Sheet 133Record of Informed Consent 134Subject Information Form 135
Appendix B 136Totals for Subjects and Intersections
ANOVA Analysis 136Summary Means and Standard Deviations 139
Intersection with Poor Sight Distanceand Low VolumeANOVA Analysis 142Summary Means and Standard Deviations 144
Intersection with Mixed Sight Distanceand Low VolumeANOVA Analysis 147Summary Means and Standard Deviations 149

Intersection with Good Sight Distanceand High VolumeANOVA Analysis 152Summary Means and Standard Deviations 153
Intersection with Good Sight Distanceand Low VolumeANOVA Analysis 155Summary Means and Standard Deviations 158
Intersection Data AnalysisSummary of Decision Times 161ANOVA Analysis 161Summary Means and Standard Deviations 162
Regression Analysis 163Total for Subjects and Intersections 163Totals for Four Intersections 163

LIST OF FIGURES
Figure 3-1 Median Driver Reaction Time to Expectedand Unexpected Information 20
Figure 3-2 85th Percentile Driver Reaction Timeto Expected and Unexpected Information 21
Figure 5-1 Histogram of the distribution of subjectsAges in the Two Age Groups 33
Figure 5-2 Intersection Sight Distance at At-Grade Intersections 35Figure 5-3 Case IIIB, Stopped Vehicle Turning Left onto Two-lane
Major Highway 36Figure 5-4 Case IIIC, Stopped Vehicle Turning Right onto
Two-lane Major Highway 37
Figure 6-1 Three Camcorders on Roof Platform 42Figure 6-2 Top View of Roof Platform 42Figure 6-3 Width of Field of Camera 43Figure 6-4 Laboratory Layout 46Figure 6-5 Drivo Trainer and Helmet Assembly 48Figure 6-6 Helmet Assembly 48Figure 6-7 Data Acquisition System Components 49Figure 6-8 Block Diagram for Data Acquisition System 52
Figure 7-1 Histogram of Significance Levels for all Intersections 59Figure 7-2 Average Decision Time Versus Age for all Intersections 61Figure 7-3 Average Decision Time Versus Functional Level for all
Intersections 63Figure 7-4 Average Decision Time Versus Age and Impairment for
all Intersections 64Figure 7-5 Average Decision Time Versus Age and Sex for all
Intersections 66Figure 7-6 Average Decision Time Versus Medication for all
Intersections 67Figure 7-7 Average Decision Time Versus Age and Glasses for all
Intersections 70
Figure 7-8 Histogram of Significance Levels for Intersectionwith Poor Sight Distance and Low Volume 73
Figure 7-9 Average Decision Time Versus Functional Level forIntersection with Poor Sight Distance and Low Volume 74
Figure 7-10 Average Decision Time Versus Age for Intersectionwith Poor Sight Distance and Low Volume 75
Figure 7-11 Average Decision Time Versus Age and Glasses forIntersection with Poor Sight Distance and Low Volume 77
Figure 7-12 Average Decision Time Versus Age and Impairment forIntersection with Poor Sight Distance and Low Volume 78
Figure 7-13 Average Decision Time Versus Age, Sex, and Impairmentfor Intersection with Poor Sight Distance and Low Volume 79
Figure 7-14 Average Decision Time Versus Age and Sex forIntersection with Poor Sight Distance and Low Volume 80
Figure 7-15 Average Decision Time Versus Impairment forIntersection with Poor Sight Distance and Low Volume 82

Figure 7-16 Average Decision Time Versus Glasses forIntersection with Poor Sight Distance and Low Volume 83
Figure 7-17 Average Decision Time Versus Age, Sex, and Medicationfor Intersection with Poor Sight Distance and Low Volume 84
Figure 7-18 Average Decision Time Versus Sex for Intersectionwith Poor Sight Distance and Low Volume 86
Figure 7-19 Histogram of Significance Levels for Intersectionwith Mixed Sight Distance and Low Volume 87
Figure 7-20 Average Decision Time Versus Functional Level forIntersection with Mixed Sight Distance and Low Volume 88
Figure 7-21 Average Decision Time Versus Age, Sex, and Medication forIntersection with Mixed Sight Distance and Low Volume 90
Figure 7-22 Average Decision Time Versus Age and Glasses forIntersection with Mixed Sight Distance and Low Volume 91
Figure 7-23 Average Decision Time Versus Age for Intersectionwith Mixed Sight Distance and Low Volume 93
Figure 7-24 Average Decision Time Versus Medication for Intersectionwith Mixed Sight Distance and Low Volume 94
Figure 7-25 Histogram of Significance Levels for Intersectionwith Good Sight Distance and High Volume 95
Figure 7-26 Average Decision Time Versus Sex for Intersectionwith Good Sight Distance and High Volume 97
Figure 7-27 Histogram of Significance Levels for Intersectionwith Good Sight Distance and Low Volume 98
Figure 7-28 Average Decision Time Versus Age for Intersectionwith Good Sight Distance and Low Volume 99
Figure 7-29 Average Decision Time Versus Age and Glasses forIntersection with Good Sight Distance and Low Volume 101
Figure 7-30 Average Decision Time Versus Glasses for Intersectionwith Good Sight Distance and Low Volume 102
Figure 7-31 Average Decision Time Versus Volume 104Figure 7-32 Average Decision Time Versus Sight Distance 105Figure 7-33 Average Decision Time Versus Volume and Sight Distance 106

LIST OF TABLES
Table 7-1 Average Decision Time Versus Age for all Intersections 61Table 7-2 Average Decision Time Versus Functional Level for all
Intersections 63Table 7-3 Average Decision Time Versus Age and Impairment for all
Intersections 64Table 7-4 Average Decision Time Versus Age and Sex for all
Intersections 66Table 7-5 Average Decision Time Versus Medication for all
Intersections 67Table 7-6 List of Medications Taken by Subjects 69Table 7-7 Average Decision Time Versus Age and Glasses for all
Intersections 70
Table 7-8 Average Decision Time Versus Functional Level forIntersection with Poor Sight Distance and Low Volume 74
Table 7-9 Average Decision Time Versus Age for Intersection withPoor Sight Distance and Low Volume 75
Table 7-10 Average Decision Time Versus Age and Glasses forIntersection with Poor Sight Distance and Low Volume 77
Table 7-11 Average Decision Time Versus Age and Impairment forIntersection with Poor Sight Distance and Low Volume 78
Table 7-12 Average Decision Time Versus Age, Sex, and Impairment forIntersection with Poor Sight Distance and Low Volume 79
Table 7-13 Average Decision Time Versus Age and Sex forIntersection with Poor Sight Distance and Low Volume 80
Table 7-14 Average Decision Time Versus Impairment forIntersection with Poor Sight Distance and Low Volume 82
Table 7-15 Average Decision Time Versus Glasses forIntersection with Poor Sight Distance and Low Volume 83
Table 7-16 Average Decision Time Versus Age, Sex and Medication forIntersection with Poor Sight Distance and Low Volume 84
Table 7-17 Average Decision Time Versus Sex for Intersection withPoor Sight Distance and Low Volume 86
Table 7-18 Average Decision Time Versus Functional Level forIntersection with Mixed Sight Distance and Low Volume 88
Table 7-19 Average Decision Time Versus Age, Sex, and Medication forIntersection with Mixed Sight Distance and Low Volume 90
Table 7-20 Average Decision Time Versus Age and Glasses forIntersection with Mixed Sight Distance and Low Volume 91
Table 7-21 Average Decision Time Versus Age forIntersection with Mixed Sight Distance and Low Volume 93
Table 7-22 Average Decision Time Versus Medication forIntersection with Mixed Sight Distance and Low Volume 94
Table 7-23 Average Decision Time Versus Sex for Intersection with GoodSight Distance and High Volume 97
Table 7-24 Average Decision Time Versus Age for Intersectionwith Good Sight Distance and Low Volume 99

Table 7-25 Average Decision Time Versus Age and Glasses forIntersection with Good Sight Distance and Low Volume 101
Table 7-26 Average Decision Time Versus Glasses for Intersectionwith Good Sight Distance and Low Volume 102
Table 7-27 Average Decision Time Versus Volume 104Table 7-28 Average Decision Time Versus Sight Distance 105Table 7-29 Average Decision Time Versus Volume and Sight Distance 106
Table 7-30 Regression Analysis for Total Subjects and Intersections 108Table 7-31 Regression Analysis for Intersections: with Poor Sight
Distance and Low Volume 110Table 7-32 Regression Analysis for Intersections: with Mixed Sight
Distance and Low Volume 110Table 7-33 Regression Analysis for Intersections: with Good Sight
Distance and High Volume 111Table 7-34 Regression Analysis for Intersections: with Good Sight
Distance and Low Volume 111
THE PERFORMANCE OF DRIVERS WITH PHYSICAL LIMITATIONS
AT T-INTERSECTIONS
CHAPTER 1
INTRODUCTION
"Driving in our society is as important, or moreimportant, to handicapped persons as it is to othersegments of our population. Personal use of anautomobile is often a determinant factor both inemployment and the satisfaction of the basic humanneeds, from food acquisition to the psychological andsocial requirements of every day life. A personunable to drive in our mobile society may lose theopportunity for personal freedom and independence."(Brainin, et al 1977).
The research examines the relationship between physical limitations that
restrict head and neck movement and driving performance. The research has
been initiated as a result of the increased accident rate statistics of drivers with
diminished capacities and the need to determine the relationship between their
driving performance and current road design standards (U.S. DOT Highway
Statistics, 1980). Specifically, the research examines the effects of diminished
range of movement of the neck on decision patterns at T-intersections in drivers
who are between 30-50 and 60-80 years of age, half of which have neck
movement limitations. A unique methodology using a driving simulator, which
incorporated the use of video recordings of intersections, was used for the
research. The facilities for this research are located at the Federal Highway
Administration, Turner Fairbank Highway Research Center in McLean, Virginia.
Chapter 2 presents the background necessary to understand the problems of
drivers with diminished capacities. The current state of knowledge on the
subject is summarized in the literature review in Chapter 3. The research

2
objectives, purpose, and hypothesis are stated in Chapter 4. The research
design and methodology employed are described in Chapter 5. The research
procedures, described in Chapter 6, explain the type of equipment used for the
research. Finally, the research results and observations are summarized in
Chapter 7. These results are discussed in Chapter 8. The research conclusions
and recommendations are presented in Chapter 9.

3
CHAPTER 2
BACKGROUND
2.0 BACKGROUND OF THE PROBLEM
The accident rate statistics document the increase in accident rates of
older drivers and drivers with diminished capacities on a miles driven basis and
indicate the need to study the performance of these drivers (U.S. DOT, Highway
Statistics, 1980). The population demographics show a dramatic increase in the
percentage of older people in the total population in the year 2000 and
beyond(Aging America, 1985). The majority of accidents, involving the older
driver occur at intersections, during lane changing and turning maneuvers.
These facts indicate the need to study the performance of drivers with physical
limitations at intersections. The problems of drivers with diminished capacities
that are related to aging and physical limitations are well documented and are
summarized in the literature review in Chapter 3.
The problems of drivers with diminished capacities need to be understood to
determine safer road design standards and operational and control strategies. A
better understanding of these drivers characteristics will facilitate the design of
education programs for these drivers to help them compensate for their
limitations. Road design standards are used as the basis for the design of
highways and streets. Human factors, vehicle characteristics and road geometric
requirements form the basis of most of the standards. Many of the standards
are based on the sight distance criterion which takes account of human factors

and vehicle characteristics. The sight distance criterion is defined by a two
term equation, a perception reaction term and a braking distance term. The
effect of human factors is included in the perception reaction term, and the
impact of vehicle-roadway characteristics is included in the braking distance
term.
2.1 FUNDAMENTAL CONCEPTS
Perception reaction time, sight distance and gap acceptance, which are
fundamental concepts to this research, are defined and discussed below. The
study examines the behavior of drivers making a left turn in a T-intersection
driving simulation. The left turn maneuver requires the driver to judge when
there is an adequate gap in the traffic flow in both directions. The ability of
the driver to judge gaps is based on the drivers' perception reaction time and
also roadway geometrics, such as sight distance.
2.1.1. Perception Reaction Time
There is considerable variation in the transportation literature concerning
both the definition and utilization of perception reaction time. Some authors
include a factor for decision making, while other authors do not. This leads to
confusion in interpretation of experimental results. Several perception reaction
time definitions are included to provide an understanding of its nature and
magnitude. The definition in the 1965 ITE Traffic Engineering Handbook for
"reaction time" is "the brief interval between seeing, hearing, or feeling and the
beginning of a response to the stimulus". However, it should be remembered
4

5
that the major variations are in the nature and duration of the perception
reaction elements, rather than the total perception reaction time from the initial
stimulus to completion of the reaction.
Reaction times of drivers in traffic are more correctly called perception
reaction times because perception of a situation is usually involved. Reaction
time, according to Henderson (1986), is the interval between the presentation of
a stimulus and a response. Reaction time involves detection, identification,
decision and response. Brake reaction time, which is a component of perception-
reaction time, is the time between when the driver recognizes the existence of a
hazard and the instant the driver applies the brakes. Brake reaction time
includes decision time and depends both on driver and vehicle characteristics.
Under certain conditions, such as an emergency, the driver performs these tasks
almost instantly. Under most other conditions the driver must subconsciously
associate the object ahead with stationary objects adjacent to the roadway to
determine that the object is also stationary or moving at a slow speed. These
determinations take time and are dependent on the characteristics of the object
and the driver. Vehicle speed and the roadway environment also influence
reaction time according to AASHTO, the Policy on Geometric Design of Highways
and Streets, 1984, published by the American Association of State Highway and
Transportation Officials. The time for the brakes to engage is implicit in the
brake reaction time.
Greenshields (1965) introduced the PIEV model of perception reaction time.
This model includes Perception, Intellection, Emotion, and Volition. Perception
(P), means perceiving an event or hazard. Intellection (I) is the understanding
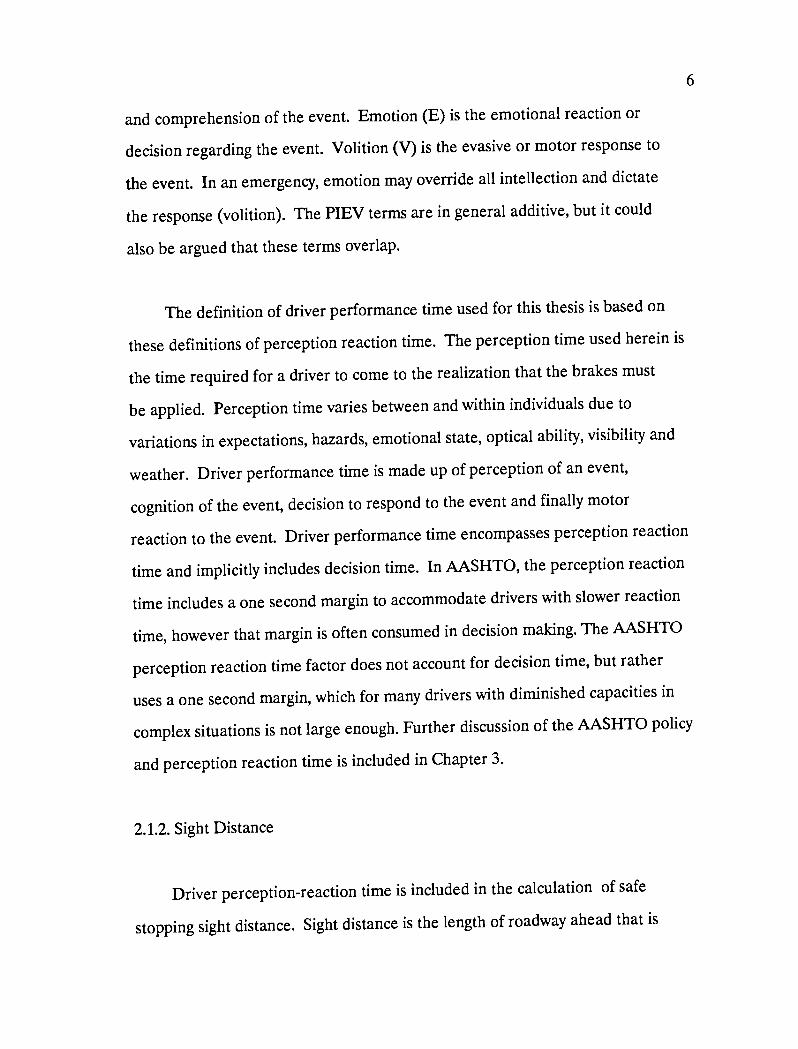
6
and comprehension of the event. Emotion (E) is the emotional reaction or
decision regarding the event. Volition (V) is the evasive or motor response to
the event. In an emergency, emotion may override all intellection and dictate
the response (volition). The PIEV terms are in general additive, but it could
also be argued that these terms overlap.
The definition of driver performance time used for this thesis is based on
these definitions of perception reaction time. The perception time used herein is
the time required for a driver to come to the realization that the brakes must
be applied. Perception time varies between and within individuals due to
variations in expectations, hazards, emotional state, optical ability, visibility and
weather. Driver performance time is made up of perception of an event,
cognition of the event, decision to respond to the event and finally motor
reaction to the event. Driver performance time encompasses perception reaction
time and implicitly includes decision time. In AASHTO, the perception reaction
time includes a one second margin to accommodate drivers with slower reaction
time, however that margin is often consumed in decision making. The AASHTO
perception reaction time factor does not account for decision time, but rather
uses a one second margin, which for many drivers with diminished capacities in
complex situations is not large enough. Further discussion of the AASHTO policy
and perception reaction time is included in Chapter 3.
2.1.2. Sight Distance
Driver perception-reaction time is included in the calculation of safe
stopping sight distance. Sight distance is the length of roadway ahead that is

7
visible to the driver. The minimum sight distance available on a roadway should
be sufficiently long to enable a vehicle traveling at or near the design speed to
stop before reaching a stationary object in its path. Calculations for stopping
sight distance are based on a 3.5 foot height of eye and a 6 inch object height.
Stopping sight distance is the sum of two distances: the distance traversed by
the vehicle from the instant the driver sights an object necessitating a stop to
the instant the brakes are applied, plus the distance required to stop a vehicle
from the instant brake application begins (AASHTO 1984).
2.1.3. Gap Acceptance
The driver must make a judgement on gap length or lag time in order to
complete a crossing or turning maneuver safely at an intersection. Polus (1983)
defines gap acceptance as the minimum gap accepted by 50% of the drivers. Lag
is defined as the time interval between arrival of a vehicle on a minor road at
the STOP sign and the arrival of the next vehicle on the major road to a point
opposite the stopped vehicle. Blumenfeld and Weiss (1979) and other authors
agree that "gap acceptance" is variable between drivers, and individual drivers
exhibit inconsistent gap acceptance behavior. Despite the variation in gap
acceptance behavior, researchers have suggested empirical models of gap
acceptance based on queue length, approach speed, age and sex of the driver,
number of passengers and type of vehicle (Cooper, Storr, and Wenne11,1977;
Cooper and Wenne11,1978; and Wennell and Cooper,1981). Blumenfeld et al,
(1979) suggested that gap acceptance is also a function of major street traffic
volumes. It was observed that males accept shorter gaps than females, and that
drivers who accepted shorter gaps also completed maneuvers faster. The new

8
Highway Capacity Manual,(1985) is consistent with other researchers, citing that
the speed of major street traffic, stop or yield control, type of crossing
maneuver, and number of lanes all determine the minimum acceptable gap length.
However, the manual does not take into consideration street traffic volume as a
factor in gap acceptance.
2.2. BACKGROUND FOR RESEARCH
This research addresses the intersection problem since most serious
accidents occur at intersections (U.S. DOT Highway Statistics, 1980). This
research is very basic to understanding the intersection problem. The behavior
of drivers with diminished capacities at intersections is not well understood due
to the complexity of operation and the numerous factors involved. T-
intersections were selected because; they are simpler than four way intersections,
they permit better control of variables in a laboratory environment, and they
eliminate other confounding variables. A laboratory facility for studying the
behavior of drivers at simple intersections already existed at the Turner Fairbank
Highway Research Center, where the research was undertaken. This equipment
and facility were well suited to the study of T-intersections.
2.3 CLOSURE
The need to study the problems of older drivers and drivers with diminished
capacities has been documented in accident rate and demographic statistics. The
variation in definition of perception reaction time has created ambiguity in the
interpretation of research results. The definition adopted for this intersection

9
research includes factors for perception, cognition, decision and reaction times.
Perception reaction time is important for defining the required sight distance
which directly affects intersection design. Intersection turning maneuvers are
based on gap acceptance. Current standards do not account for major street
volumes despite indications that volume is an important factor. T-intersections
were selected for study because they are simpler than four way intersections
and permit better control of variables. Additional research in the laboratory or
field would extend the results of this study to more complex intersection types.

CHAPTER 3
LITERATURE REVIEW
3.0 INTRODUCTION
10
The study of drivers with diminished capacities at intersections covers a
broad spectrum of literature from human factors, gerontology, ophthalmology, and
ergonomics to traffic engineering and experimental design. Significant studies
have been and are currently being undertaken that examine the psychological and
cognitive aspects of drivers with diminished capacities. These are complimentary
to studies of physical limitations (Staplin, Breton, Haimo, Farber, and Byrnes,
1986). There appears to be a significant void in the literature on the
biomechanical aspects of drivers with diminished capacities, and therefore this
area was selected for the study. Vision is very important for information
gathering in the driving task, and since vision and aging are closely related,
they are included in the literature review. Traffic engineering literature that
concerns intersection geometrics and sight distance is reviewed and summarized.
The study is laboratory based and uses human subjects, therefore the literature
review includes a brief discussion of experimental design and driving simulators.
3.1 DRIVER
3.1.1. Introduction
Drivers with diminished capacities have different sensory, cognitive and
physical thresholds than other members of the driving public (Rees and
11
Botwinick, 1971). The implication of this is that these drivers require more
stimuli for perception, or extra time to react as a result of physical limitations.
Increased stimuli may be provided by higher contrasts or increased letter size on
street signs. Often longer decision making time is required which results in a
lengthened total driver response time. The longer decision time is due to
increased time to gather and process the information. The older driver
performance time has been studied and has been shown to be longer than for
other age groups (Brainin, Naughton, Breedlove, 1977). It has been shown by
Panek, Barrett, Stearns, and Alexander,(1977), that older persons perceive
information and react to information at approximately the same rate as other age
groups. However, they take a much longer time to make a decision, and thus
require a longer perception reaction time (Yanik, 1986). Young drivers use a
trial and error approach for decision making by quickly scanning the environment
to gather information and making a quick decision which may or not be correct.
However, older drivers delay acting until certain of a single correct event. It is
suggested that the decision stage, rather than the perception, cognition and
reaction stages, is the element that contributes to a longer driver performance
time for older drivers (Yanik, 1986). There are a number of researchers who
argue that older persons do not perceive, recognize or react at the same rate as
younger individuals, and that the slower rate is a result of the natural aging
process (Staplin, Breton, Haimo, Farber, and Byrnes, 1986). Part of the decrease
in perception rate is accounted by increased visual accommodation time.

12
3.1.2. Physical Limitations
Many drivers with diminished capacities often have diminished range of
motion or muscle weakness which affects their ability to react quickly. Vehicle
modifications are often required to compensate for the decreased dexterity,
strength, and range of movement. Older drivers have changing medical
conditions that are a direct result of aging, these include changes in posture,
decreased muscle power and coordination, tremors, retarded reflexes and slower
adjustment to stimulus (Brainin, 1980). Many drivers who have sustained neck
injuries have restricted range of movement of their neck as a result of the
initial trauma, and may be more susceptible to further injury or disease. The
decreased range of motion can have direct effect on turning movements such as
lane changing. The accident statistics show that the older driver is much more
likely to have accidents at intersections and during lane changing than under any
other circumstances (Moore, Sedgley, and Sabey, 1982; Planck and Fowler, 1971).
3.1.3 Vision
Information must be gathered to make a decision, and in the driving task
most of the information is visual. To gather visual information the environment
must be scanned by using visual field and head movements. Age related
disorders, trauma, as well as disease processes, affect range of motion of neck
muscles. For example, arthritis can severely restrict head range of movement
which causes increased problems due to blind spots, and thereby also affects
overall driving performance. There are also decreases in visual accommodation
and acuity with increasing age. Visual accommodation is the ability of the eye

13
to adjust to different viewing distances. Visual acuity is the ability of the eye
to discriminate or resolve fine detail. Glasses severely restrict lateral visual
field capabilities, and therefore drivers who wear glasses should be expected to
exhibit greater range of movement of the head and neck when gathering
information at intersections. Eye glasses with heavy frames can further restrict
the visual field.
Many studies have shown the relationship between deterioration in vision
and age (Sivak, Olson, and Pasta lan, 1981; Sivak, and Olson,1982; Freedman,
Davit, Staplin, and Breton, 1985). The eye is a complex interconnection of parts
which all age differently and at different rates. The aqueous and vitreous humor
progressively become more solid from early childhood. The lens ages and causes
several changes in vision. The lens increases in opacity and absorbs more light
and also scatters more light, thereby passing less light to the retina. The lens
grows thicker and is less able to adjust its shape which leads to presbyopia
(long-sightedness). It yellows with age and leads to changes in color
discrimination particularly along the blue yellow axis. All the changes in the
lens characteristics have a direct effect on the driver's ability to read road signs
and other traffic related information. The retina is a multi-layered structure,
and its age related changes are very complex. The most common age related
changes are detachment of the retina layers, decreases in vascular support and
an accumulation of metabolic by-products. The speed of adaptation to darkness
also decreases with age. This can cause problems for older drivers who drive
from bright daylight into tunnels, or from sunlight to shade or from dark
roadways to brightly lit intersections(Staplin et al, 1986).

14
The legibility distance for older drivers is 65-77 percent of those of
younger drivers (Sivak et al, 1982). Legibility distance is the distance from the
eye to a sign that can be read. This implies that the older driver has less
distance and therefore less time to respond. Not only does a person's visual
acuity deteriorate with age but higher illumination levels are required, due to
less light being transmitted by the lens. Older people have inferior nighttime
vision which is a result of visual acuity deficits due to changes in the pathology
of the eye and not a decrease in information processing ability (Sivak et al,
1982; Yanik, 1986). It has also been suggested that the standard visual acuity
tests that are given under high illumination levels during driving examinations
may have questionable validity (Sivak et al, 1981). Visual acuity tests
administered under different lighting conditions would provide a more accurate
assessment of drivers' visual acuity. In recent years researchers have begun to
distinguish between static and dynamic visual acuity. Static visual acuity
represents the clarity of stationary objects, and dynamic acuity is the clarity
with which objects are seen travelling at an angle to the viewer (Panek et al,
1977). Burg (1968) who has studied dynamic visual acuity suggests that dynamic
visual acuity is far more representative of visual performance than static visual
acuity. It has been noted that dynamic visual acuity deteriorates with age
(Yanik, 1986).
3.1.4. Sex Differences
Many studies have noted differences in driving performance between male
and female drivers. These differences first show up in young drivers where
novice female drivers require more confidence in their ability to make decisions

15
on turns and maneuvers. Novice male drivers require more caution and less
recklessness in their driving behavior (Hagan, 1975). Accident data on older
drivers indicates that older male drivers perform better than older female drivers
(Planck and Fowler, 1971). Grubb(1986) observed that there was a marked
increase in female involvement in fatal accidents at age 70 or older, which could
be due either to the higher percentage of women in the over 70 population or
the lack of driving experience by the majority of women in this age group.
Grubb also cited a remark by Burg (1968) that females have a larger visual field
than males across all age groups. The larger visual field that females have is
not reflected in the accident data which imply that there are other factors that
are affecting their driving. It is suspected that in the current generation of
older drivers, the sex differences in the statistics are due to the general lack of
driving experience by older women who generally relied on their spouse to do all
the driving. The medical literature has documented that older women are much
more likely to suffer osteoporosis due to loss of calcium resulting from a
decrease in estrogen levels. Osteoporosis can lead to spinal deformity which in
turn can affect head and trunk movement and posture, which increases the time
required to gather information.
3.1.5 Age Problems
Older drivers have both physical and sensory deterioration which is a direct
result of aging (Brainin, 1980; Rees et al, 1971; Planck et al, 1971). Some of
these changes include changes in posture, muscle power, coordination, tremor,
and retarded reflexes which show slow adjustment to stimuli. Many of these

16
factors are present in younger drivers who are handicapped as a result of
neurological conditions.
The influence of drugs and medication on driving behavior is often
overlooked. Older persons are the highest percentage users of prescription drugs
and also are more likely to suffer adverse drug reactions than any other
population group. Illness and medication have been shown to have a definite
effect on reaction time and therefore affect driving performance (Staplin et al,
1986). The effects of medication can often compound the problems of drivers
with physical limitations.
The most common problems of older drivers are yielding right of way,
turning, changing lanes, passing and failure to read traffic control devices
(Yanik, 1985). Many older drivers also have problems judging speed and
perceiving distance (Malfetti, 1985). Planck et al,(1971), have indicated that
older drivers think they are driving too slowly so they speed up and follow too
closely. This indicates that their perception of actual speed is inadequate.
Aging and many neurological conditions have a very slow onset and are
insidious in nature so that deterioration in physical and sensory ability is very
slow. Many drivers continue to drive as if their reactions and faculties have not
changed, with the result that they are over-driving their capabilities (Brainin,
1980). Aging not only slows down physical responses, but it has been shown to
affect information processing abilities. The decrease in sensory and perceptual
information processing has been attributed to changes in vision and neural
responses. The visual field of young adults is approximately 170 degrees, and it

17
decreases to about 140 degrees in adults who are over fifty (Panek et al, 1977).
Other researchers have found conflicting evidence on the decrease in visual field
with age although the majority support the decrease in visual fields (Hooper and
McGee, 1983). The changes in visual field are attributed to changes in the eye.
There are conflicts in the literature concerning age changes in cognitive
processing, however there are a few areas of agreement. In general, older
persons are more easily distracted and not able to screen out insignificant
information (Welford, 1981). Studies have shown that there is a decrease in long
term memory, information processing and the integration of information (Yanik,
1986). There does not appear to be any significant age difference in short term
memory abilities. There are age differences in time event recall, which indicates
differences in memory retrieval processing. Across all age groups there was no
significant difference in reading speed (Staplin et a1,1986). Driving behavior at
intersections depends primarily on short term memory.
Several theories have been suggested for the increase in decision time for
older drivers. Welford, (1981) has suggested that changes in information
processing result from a difficulty of accepting a new stimulus in the midst of a
current stimulus due to increased internal noise and higher sensory thresholds.
Many older drivers tend to adopt driving strategies which optimize their
performance by driving slower and at times when driving is less stressful, such
as non rush-hour times (Yanik, 1986).
The decision phase is the throughput phase between perception and motor
responses. The decision phase involves the processing of information and is

18
dependent on experience, memory, emotions, and the number of alternative bits
of information to be processed, for example, judgement of gap acceptability
(McGee, Moore, Knapp, Sanders, 1978). There is general agreement in the
literature that there are physical, visual and cognitive changes with age that
individually and cumulatively have an effect on overall driving performance.
3.1.6 Ergonomics
Vehicle brake and accelerator pedal locations have a direct impact on
reaction time, particularly brake reaction time. Differences in pedal height
directly increases response time (Davis and Watts,1970). Ergonomic
considerations on the size and the geometric relationship of the pedals are
important. The brake and accelerator pedal should be separated by at least 2
inches (5.08cm) which is sufficiently far apart to avoid accidental compression of
both pedals at the same time. The recommended distance is 6 inches(15.24cm)
because the male shoe is approximately 5 inches (12.95cm) wide(Snyder, 1976).
The dimensions of the seats were not mentioned as influencing reaction time.
Low seats for older and smaller individuals can add more sight barriers, but
these drivers usually use seat cushions to compensate for their size.
3.2 INTERSECTIONS
3.2.0 Introduction
Intersections require drivers to make decisions with regard to changing
direction and crossing, present conflicting traffic flows, and often present
changing roadway geometries which increase driver workload. Increased accident

19
rates at intersections appear to be related to the implementation of new traffic
control devices, high traffic volumes and low sight distance (David and Norman,
1976; McGee et al, 1983). Polus (1985) points out that more restrictive
signalization does not necessarily result in a decrease in accidents or unsafe
movements.
3.2.1 Stopping Sight Distance
Stopping sight distance as discussed previously involves two basic terms, a
term to account for perception reaction time and a term to account for the
distance it takes for a vehicle to stop. The American Association of State
Highway and Transportation Officials in the Policy on Geometric Design of
Highways and Streets, published in 1984, states that the perception reaction time
of 2.5 seconds, which is adopted for most design applications, is not valid for
complex intersections for a typical driver,i.e. the 85th percentile driver.
However, it does not make any suggestions concerning drivers with limitations.
The study by Johansson and Rumar(1971), which is also referred to in AASHTO,
was performed using able bodied subjects. Older drivers with their slow reaction
times require longer stopping sight distances than are currently recommended in
the design policies. The policies such as, AASHTO(1984), recommend a
perception reaction time of 2.5 seconds, but research involving older subjects
indicates that a perception reaction time of 3.2 seconds is preferred (McGee et
al, 1983; Gordon, McGee, Hooper, 1984; Hooper and McGee 1983; Hostetter,
McGee, Crowley, Seguin, and Dauber, 1986). Figures 3-1 and 3-2 are reproduced
from figures 11-14 and 11-15 in the 1984 AASHTO policy and show the median

20
.2tcr
cr
5.0
4.0
3.0
2,0
1.0
///Una as:meted /
////
//////
Expected
/////
/
0 2 3 4
Information Content (Bits)
5 6
Figure 3-1 Median Driver Reaction Time to Expected and UnexpectedInformation

E
0
8.0
7.0
6.0
5.0
4.0
3.0
2.0
1.0
/Unexpected
Expected
0 2 3
Information Content (13ds1
4 5
Figure 3-2 85th Percentile Driver Reaction Time to Expectedand Unexpected Information
6
21
22
and 85th percentile driver reaction time to expected and unexpected information,
respectively. The figures show information in bits. A bit is a term used to
quantify the amount of information needed to make a decision. Expected
information is similar to anticipated information, for example, at a traffic signal
a green light is expected to follow a red light. A longer perception reaction
time necessarily increases the stopping sight distance since they are directly
related.
There are other components to intersection sight distance that are a
function of the intersection geometrics. For an uncontrolled intersection the
driver must decide whether or not to proceed. This decision time is made up of
the time to detect a situation, the time to decide what to do and the time to
respond by either accelerating, or remaining stopped. At stop controlled
intersections the driver must see the stop sign and prepare to stop. Once the
vehicle is stopped, the driver must then determine if there is an acceptable gap
length to cross the street successfully or complete a turning maneuver. A
turning maneuver requires time to look in both directions, perceive that there is
time to complete the maneuver, prepare to proceed, and complete the maneuver.
There is consensus among researchers that there is a relationship between
increased driver age and increased perception reaction time. The increased
perception reaction time is a result of visual, cognitive and motor response
impairments.
23
3.2.2 Decision Sight Distance
Decision sight distance as defined by Alexander and Lunenfeld(1975) is the
distance required for a driver to detect an unexpected or otherwise difficult-to-
perceive information source or hazard in a roadway environment that may be
visually dulled, to recognize the hazard or its threat potential, select an
appropriate speed and path, and initiate and complete the required maneuver
safely and efficiently. Decision sight distance is much longer than stopping sight
distance due to time required to maneuver the vehicle at speed rather than
simply stopping. Decision sight distance requires the time to comprehend a
complex condition, or one that is difficult to understand. Drivers require
decision sight distance where there is a likelihood of error in information
processing. Decision sight distance is an appropriate design control to evaluate
conditions where a forced lane change is required such as upstream of an off-
ramp.
AASHTO (1984) defines premaneuver time associated with decision sight
distance as the time required for a driver to process information relative to a
hazard. It consists of time to detect and recognize the hazard, time to decide
on the proper maneuvers and to initiate required action. Detection and
recognition times include time periods of latency, which is the delay between the
time a hazard is presented and the time the eyes begin to move. Detection and
recognition time includes eye movement to the hazard, eye fixation, recognition
and perception. Decision and response initiation time occurs after perception
and includes the identification of alternative maneuvers and the implementation
of action. The final component is the time required to accomplish a vehicle

24
maneuver. Decision sight distance is not directly related to this research, since
the test subject is stopped at an intersection. The effects of a driver using
poor judgement and pulling out into traffic at the wrong time require drivers
approaching the intersection to take evasive action that is predicated on decision
sight distance.
3.2.3. Intersection Geometrics
Studies have shown that intersection geometrics do not have as much
influence on accident rates as human factors (David et al, 1976). Many studies
of driver performance use accident data that has been collected using
standardized accident data forms. The accident records are often ambiguous on
causation and therefore careful consideration should be given to the
interpretation of results that rely on this information. Unusual intersection
geometrics can cause conflicts with driver expectancy, and contribute to
decision, comprehension, perception or action failures. These failures contribute
to the human factors failures at intersections which in turn contribute to an
increased number of accidents at intersections (Moore et al, 1982). Accident
data, due to the reporting methods, often obscure the real cause of accidents.
For example, the reported cause of an accident may be human error as a result
of unusual geometrics that conflict with driver expectancy, but the geometrics
and traffic volumes which may be major contributors to the accidents are
unreported. Accident data are often confusing and careful attention should be
given in interpretation. David et al, (1976), have shown that human factors are
involved in 83-93 percent of the accidents and of these, 42 percent are decision

25
failures and 5 percent are action failures. These statistics further emphasize the
importance of decision time in the perception reaction term.
3.3. EXPERIMENTAL DESIGN
There are no standard methods or guidelines for valid, unbiased and
generalized research methods for the older driver. There are several
considerations that should be noted concerning cross sectional and longitudinal
designs. Cross sectional study designs are done at a single point in time and
usually across a range of ages. This can lead to a misinterpretation of
performance due to cultural and historical experience of the age cohorts.
Another example of cross sectional study design is to study a symptom such as
the effect of restricted head movement and to examine both young and old at
the same time. A longitudinal study design tracks the performance over time and
is prone to subject attrition leaving only the healthy subjects and therefore
inflating the performance measures. The sampling strategy employed in this
experiment is cross sectional with the subjects grouped according to age and
level of impairment. The subject pool was very diverse and it was not
anticipated that cultural or historical effects of the age cohorts would affect the
study.

26
3.4. DRIVING SIMULATORS
"An engineering definition of a simulator is a systemor apparatus that has been designed to reproducesome aspects of a more complex system while at thesame time avoiding the encumbering aspects of thatsystem... A driving simulator is a stationaryapparatus that presents to a driver most of thesensory stimulations and vehicle responsecharacteristics that he experiences while driving onthe road" (Hulbert, S., 1961).
The benefits of simulators studies must be weighed against the problems of
validation. Driving simulators enable the study of driving behavior in a
laboratory environment under dynamic yet controlled conditions. Unlike the road
environment, many drivers can be tested under identical and repetitive
conditions, and instrumentation can be used to record their responses
(Mathewson, 1958). Validation is the transfer of training or information between
the simulator and the real world. For research applications, it is the
determination of high functional correspondence between performance results and
real world findings (Moraal and Kraiss, 1981). According to Leonard and
Wierwille,(1975), validation is the problem of obtaining parallel measures in the
real world and the simulator and then making them congruent. The value of a
simulator depends on its ability to elicit from the operator the same sort of
response that he would make in a real situation (Blaauw, 1982). A driving
simulator is used to study the behavior of drivers at T-intersections in order to
provide control and repetition of the driving scenarios.
27
3.4.1. Simulator Studies (after Grubb, 1986)
There are numerous driving simulators available for experimental research.
These simulators may be highly sophisticated moving base simulators (Hicks and
Wierwille, 1979) or various part task simulators. In all simulations visual
processing is a critical component. Some of the more sophisticated simulators
have also attempted to provide the participants with auditory and proprioceptive
(physical) sensations, but these simulators often cause motion sickness due to
discrepancies between proprioceptive feedback and the expectations generated by
the viewed perspective. Subjects in fixed base simulators often experience
motion sickness which may be attributed to feedback discrepancies.
Many methods have been used to study driving behavior at intersections.
These methods include; before and after studies, computer simulation studies,
naturalistic observation studies, field driving experiments, and driving simulator
studies. The method used is dependent on the type of study desired. Before
and after studies are appropriate for studying the effect of signal changes on
intersection operations. Computer simulation studies are particularly useful for
planning purposes, or signal timing. Naturalistic observation studies are useful
for gathering information and data for planning, or validating simulator studies.
Field driving experiments are very limited in value due to safety problems, and
lack of experimental control.
Simulations of intersections have been confounded by the perspective of the
observer. In general, the observer would look down on an intersection, resulting
in a distorted view of gaps. Intersection simulators require a wider field of view

28
than is generally available on most simulators. The driver needs to view at least
180 degrees. The requirement for a wide field of view is very difficult and
expensive to reproduce on an interactive simulator. A simpler method for
presenting the wide field of view is to project the scene just as it was filmed
with no capability for the driver to manipulate the images by the vehicle
"controls". In these studies, the participant is generally asked to mimic the
control movements necessary to follow the image viewed. The basic experimental
equipment and laboratory to project a 180 degree perspective of intersections
for the participants to mimic control movements has been established at the
Turner Fairbank Highway Research Center in McLean, Virginia, therefore this
technique was selected for the study. Chapter 6 includes a discussion of the
equipment and the simulator used in the study.
3.5. CLOSURE
The physical, cognitive and visual abilities of drivers need to be understood
in order to study the driving performance of drivers with diminished capacities
at intersections. The research undertaken focuses on the physical, visual and
aging characteristics of the driver. Sight distance, traffic volumes, and
geometrics influence the function and safety of an intersection. A laboratory
simulation was used to study the intersection problem using a cross sectional
experimental design.
29
CHAPTER 4
RESEARCH OBJECTIVES
PURPOSE, PROBLEM STATEMENT, RESEARCH HYPOTHESIS
4.0 RESEARCH OBJECTIVES
The objective of the research is to gain a better understanding of the
effects of physical limitations on driving behavior and decision making ability.
Specifically, the research addresses the behavior of drivers at T-intersections to
determine the relationships between physical limitations as measured by range of
movement of the head and neck, and visual field, and driving performance as
measured by decision time. Other relationships are examined concerning sight
distance, traffic volumes, number of head turns, medication and glasses.
4.1 PURPOSE:
The purpose of the research is to determine if the "perception reaction" or
driver performance time is adequate to account for the capabilities of drivers
with diminished capacities, such as restricted range of movement of the neck or
head, or visual field limitations. The specific application is the study of the
operation of stop controlled T-intersections.

30
4.2 PROBLEM STATEMENT:
Specifically, the research addresses the performance time at intersections of
drivers with physical limitations of the neck. Unsignalized T-intersections with
varying geometrics and traffic volumes are studied to determine if the design
criteria and sight distances are adequate for drivers with physical limitations to
make decisions.
4.3 RESEARCH HYPOTHESIS:
The hypothesis is that drivers with diminished capacities require increased
decision time at intersections. The physical limitations of the neck require extra
time to gather information. It is anticipated that older drivers require
increased decision time due to aging effects of vision and cognitive processing.

CHAPTER 5
EXPERIMENTAL METHODOLOGY
5.0 INTRODUCTION
31
The study examines the performance time of drivers with physical
limitations at unsignalized intersections to determine the relationship between
physical limitations of the neck and decision time. The T-intersections are
unsignalized and have different geometrics and traffic volumes. The study is
undertaken using a driving simulator in a laboratory environment due to the
hazards and lack of experimental control of a field study. Three screens are
used to provide a 180 degree field of view in the driving simulator. This is a
more realistic method of providing the drivers' perspective of the roadway for
the study of intersections than the other methods of intersection simulation.
Section 3.4.1 discusses various simulator methods for the study of intersections.
The laboratory is located in the Human Factors Section of the Federal Highway
Administration Turner Fairbank Highway Research Facility, in McLean, Virginia.
The study with subjects was undertaken in January and February 1987.
5.1 EXPERIMENTAL DESIGN
The experiment is a 2(age) X 2(impairment) X 3(sight distance) X 2(volume)
factorial design, with repeated measures on sight distance and volume. The
subjects are partitioned according to age and impairment, and there are two
levels of traffic volume, and three levels of restricted sight distance. All the
intersections are T-intersections. The independent variables are age, impairment

32
of subjects, medication and whether they wore glasses. These are repeated over
eighteen intersections with variations in traffic volume and sight distance.
The subjects are divided as follows:
(i) 30 to 50 years impaired, number of subjects =15,
(ii) 30 to 50 years unimpaired, number of subjects =15,
(iii) 60 to 80 years impaired, number of subjects =15,
(iv) 60 to 80 years unimpaired, number of subjects =15.
Figure 5-1 is a histogram of the distribution of subjects ages in the two
groups. The median age for the 30-50 year age group is 40 years, and the
median age for the 60-80 year age group is 67.
For this research, impairment is defined by a combined static range of
movement of the head and visual field of less that 285 degrees, whereas a range
from 285 to 360 degrees is defined as no impairment. There is no definitive
definition of impairment level in the literature, therefore for this study, the
choice of 284 degrees was based on the functional requirements for driving.
The two levels of traffic volumes are measured in terms of average gap
length (g). Traffic volumes were measured in two ways. The highway records
indicated the average daily traffic for the roadways, however the video taping
was done during morning rush hour for some intersections and at midday for
other intersections. Therefore, the traffic volume as measured in the video tape
segment were used rather than the average daily traffic figures. Gap acceptance
is discussed in section 2.1.3. Light traffic volumes consist of gap lengths of 8
seconds or longer on both traffic streams. Moderate traffic volumes had gaps of

33
HISTOGRAM OF SUBJECT'S AGES
6
5
4
21111/ 110140 ill II15?6011
I II eL
SUBJECT'S
Figure 5-1 Histogram of Subject's Ages

34
less than 8 seconds in both traffic streams. Nine intersections had light traffic
volumes, and nine intersections had moderate traffic volumes.
The AASHTO intersection sight distance definitions are used to calculate
the required sight distance at each intersection, (Case Mb). Case III are STOP
controlled intersections on secondary roads. According to AASHTO,
"the driver must have sufficient sight distance for a safe departure fromthe stopped position even though the approaching vehicle comes in view asthe stopped vehicle begins its departure movements."
For a left turn into a intersection, Case III-B holds,
" to turn left into the crossing roadway by first clearing traffic on the leftand then to enter the traffic stream with vehicles from the right."
Figure 5-2 Case III-B shows a vehicle entering a cross road from a stopped
position by clearing vehicles approaching from the left and then by turning left
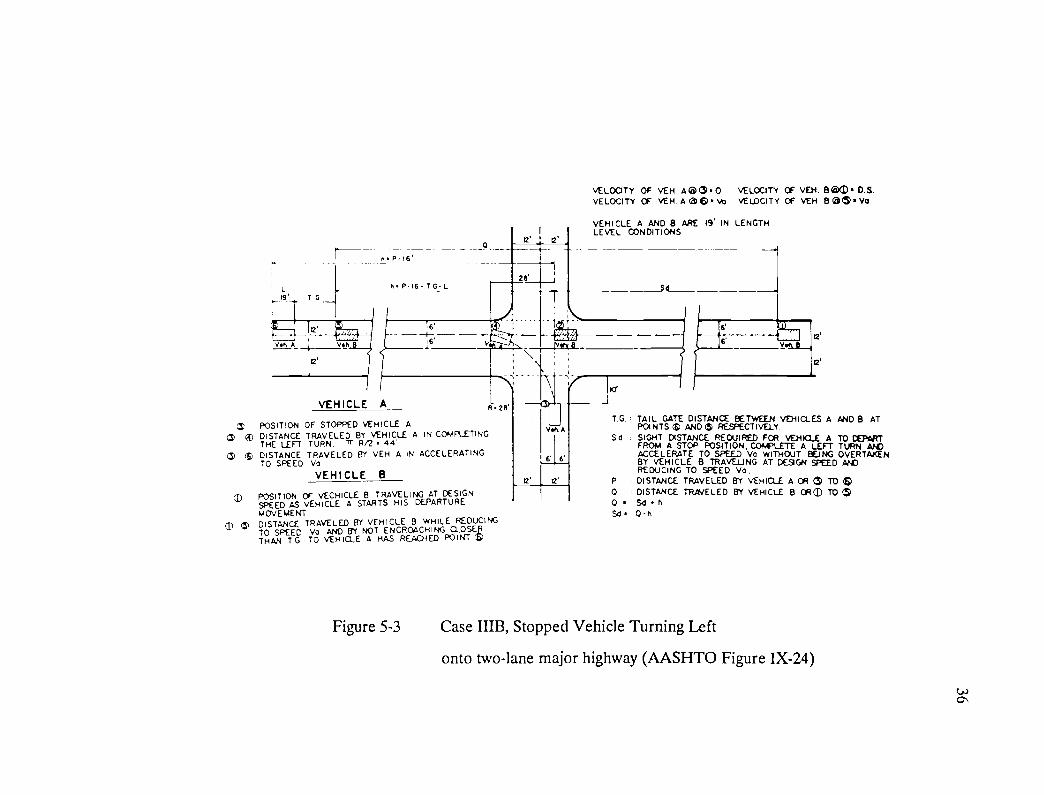
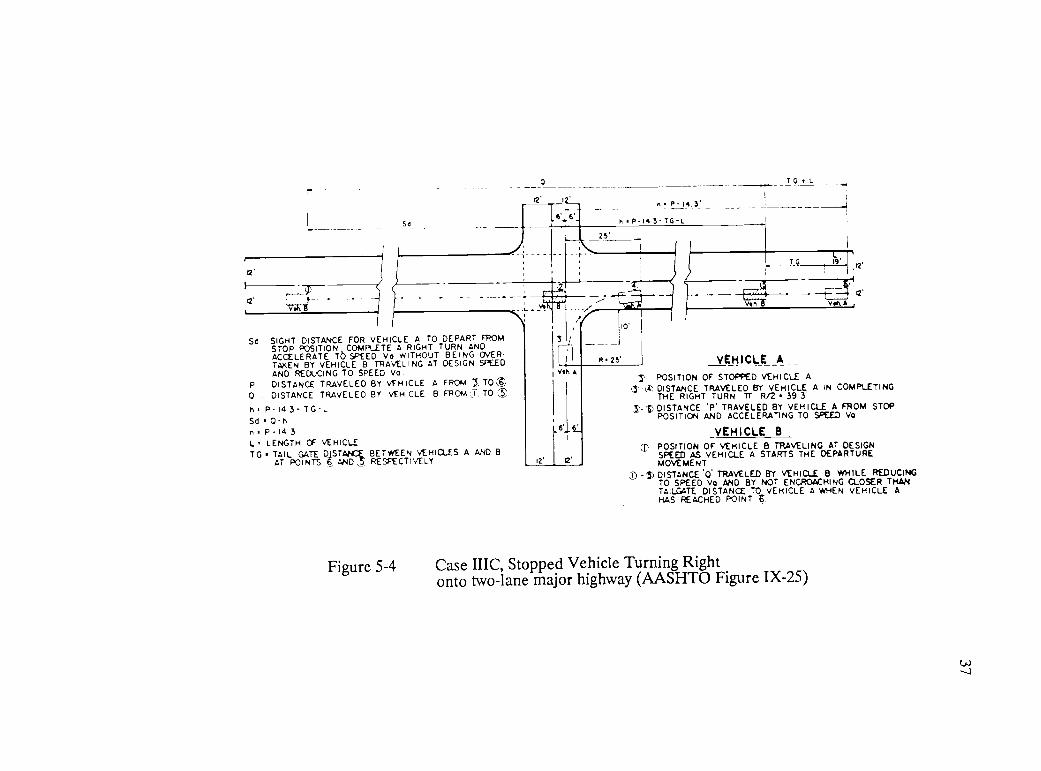
and entering the traffic stream approaching from the right. Figure 5-3 shows
the detail of the criteria used in establishing the stopping sight distances shown
on Figure 5-4. Figures 5-2, 5-3, and 5-4 are Figures IX-23, IX-24, IX-25
respectively, reproduced from the AASHTO Policy on Geometric Design. Field
measurements of sight distance were made for each intersection and then each
intersection was rated as either shorter than, equal to, or longer than the
criteria. The three levels of restricted sight distance include:
(i) 95% or less than criteria, with a sample size of 6,
(ii) 95 to 105% of criteria, with a sample size of 6,
(iii) larger than 105% of criteria, with a sample size of 6.

35
CI
CASE III STOP CONTROL
d, I t-2
CASE 11-A
STOPPED VEHICLE CROSSING AMAJOR HIGHWAY
d,
CASE 2E-8
STOPPED VEHICLE TURING LEFT ONTOTWO LANE MAJOR HIGHWAY
d2
CASE C
d,
STOPPEL VEHICLE TURNING RIC,HT ONTo
TWO LANE MAJOR HIGHWAY OR RIGHTTURN ON A REP SIGNAL.
>,91-11 L)-,,Ionce
Figure 5-2 Intersection Sight Distance at At-grade Intersections(AASHTO Figure IX-23)
POSITION OF STOPPED VEHICLE ADISTANCE TRAVELED BY VEHICLE A IN COMPLETINGTHE LEFT TURN. TT R/2 44'DISTANCE TRAVELED BY %/EH A IN ACCELERATINGTO SPEED Va
VEHICLE B
POSITION OF vECHICLE 8 TRAVELING AT DESIGNSPEED AS VEHICLE A STARTS HIS DEPARTUREMOVE MENTDISTANCE TRAVELED BY VEHICLE B WHILE REDUCING
TTO
SPEED Va AND BY NOT ENCROACHING CLOSEfHAN T G TO VE H ICLE A RAS REACHED POINT bl
Vet A
VELOCITY OF VEH A0C90 VELOCITY OF VEN. Ben. D.S.VELOCITY CF vEH. A a Va VELOCITY OF vEH 8 as Va
VEHICLE A AND B ARE 19' IN LENGTHLEVEL CONDITIONS
Sa
12'
TG. TAIL GATE DISTANCE BETWEEN VDIICLES A AND B ATPOINTS S ANDS RESPECTIVELY.
Sa SIGHT DISTANCE REQUIRED FOR VEHICLE A TO DEPARTFROM A STOP POSITION, COWLS!" A LEFT TURN ANDACCELERATE TO SPEED Va WITHOUT BEING OVERTAKENBY VEHICLE B TRAVELJNG AT DE9GN SPEED ANDREDUCING TO SPEED Va.
P DISTANCE TRAVELED BY VEHICLE A OR TO
o DISTANCE TRAVELED BY VEHICLE B OPT TO $Seen
Sd 0-h
Figure 5-3 Case IIIB, Stopped Vehicle Turning Left
onto two-lane major highway (AASHTO Figure IX-24)
12
12'
s'Sa
n P 14 3'
h P 14 3 TG-L
T G L
25'
2'TG o'
2'
12'
x'12'Yoh Von. A
Sd SIGHT DISTANCE FOR VEHICLE A TO DEPART FROMSTOP POSITION COMPLETE A RIGHT TURN ANDACCELERATE TO SPEED Vo WITHOUT BEING OVERTAKEN BY VEHICLE B TRAVELING AT DESIGN SPEEDAND REDUCING TO SPEED Va
P DISTANCE TRAVELED BY VEHICLE A FROM I. TO it0 DISTANCE TRAVELED BY VEHICLE B FROM j; TO C.
h' P-I4 3- TG-LSd 0 - hn P 14 3
L LENGTH OF VEHICLETG TAIL GATE DISTANCE BETWEEN VEHICLES A AND B
AT POINTS 6 AND 5; RESPECTIVELY
A.25'
io' I
VEHICLEOF STOPPED VEHICLE ATRAVELED BY VEHICLE A IN COMPLETING
RIGHT TURN Tr- R/2 39 3''P' TRAVELED BY VEHICLE A FROM STOP
AND ACCELERATING TO SPEED Vo
VEHICLE B
Vsh
6'
APOSITION
3 -X DISTANCETHE
DISTANCEPOSITION
POSITIONSPEEDMOVEMENTDISTANCE
OF VEHICLE B TRAVELING AT DESIGNAS VEHICLE A STARTS THE DEPARTURE
'0' TRAVELED BY VEHICLE B WHILE REDUCING
Figure 5-4
TO SPEED vo AND BY NOT ENCROACHING CLOSER THANTAILGATE DISTANCE TO VEHICLE A WREN VEHICLE AHAS REACHED POINT t
Case IIIC, Stopped Vehicle Turning Rightonto two-lane major highway (AASHTO Figure IX-25)

38
Eighteen intersections were shown to each subject. Nine had low traffic
volumes and nine had moderate traffic volumes. Of the eighteen intersections'
sight distances, six were below standard, six were approximately at standard and
six were greater than standard. The intersections were all located within a five
mile radius of the Turner Fairbank Highway Research Center. The terrain is
rolling so very few of the intersections were level. With the exception of one
intersection, all intersections were at ninety degrees. All intersections were
filmed in daylight, and on dry pavement.
The independent variables are subjects' age, impairment level, medication,
whether they wore glasses for driving, traffic volume level and intersection sight
distance. The measured or dependent variables are:
1. response time, that is determined by measuring time, from the tone
indicating that an intersection presentation had begun, to the time the
brake pedal was released in preparation for a left turn,
2. number of head turns during the response time for each intersection,
3. range of head movement, which is the maximum angle range from the left
to right or right to left occurring during the response time,
4. static range of motion, which is the maximum head turn angle of each
subject as measured by the goniometer prior to testing. The static range
of motion measurement is the principle measure of impairment.
5. visual field, which is the maximum width of field of vision of each subject
measured on the ortho rater prior to testing.
Response time is the principle dependentvariable for the research.

CHAPTER 6
EXPERIMENTAL PROCEDURE
6.0 INTRODUCTION
39
The experimental procedure section discusses the protocol for the subjects,
the equipment that was used and problems encountered with the equipment, the
experimental procedures that were followed, data collection and pre-processing of
data.
6.1 SUBJECTS
The study involved 72 participants between the ages of 30 and 50, and 60
to 80. Approximately one half of the subjects had some degree of physical
limitation that restricted the range of movement of their head and neck but was
not severe enough to require major vehicle modifications such as additional
mirrors. Subjects were recruited as paid participants through local
advertisements, and contacts with local agencies such as the Arthritis Foundation
and the American Association of Retired Persons. Each participant was
compensated $25.00 for their involvement in the study. All participants were
required to have a valid driver's license and to drive an average of 10 or more
miles per week.

40
The subjects exhibited a wide variety of driving behavior and physical
skills. Many subjects who thought that they were not impaired had static neck
range of movement of less than 105 degrees, and others who had arthritis
showed no impairment in neck range of movement. Many of the subjects with
arthritis were taking anti-inflammatory medication and also participated regularly
in exercise programs sponsored by the Arthritis Foundation. In the 60-80 age
group nearly all the subjects showed limited neck mobility. There was also large
variability in driving skills in this age group. Some of the variability could be
explained by the type of vehicle that they regularly drove, their lifestyle, and
their attitude. The female subjects in both groups, in general, were much more
cautious, and required many more practice intersections. Video film of two extra
intersections were used for practice. The practice intersections had moderate
traffic volumes and mixed sight distance. Most of the male subjects only
required two practice intersections. Twelve of the subjects missed four or more
intersections and therefore the final statistical analysis was performed using the
data from 60 subjects. A missed intersection resulted from the subject
removing his foot from the brake prior to the sound of the tone indicating the
beginning of the measure of response time, as a result no data were collected
for that subject at that intersection.
6.2 EQUIPMENT
6.2.1. Camcorders
A simulation of the driver's perspective of roadway intersections was
constructed in a laboratory. Intersections were videotaped by using three video
camcorders (Panasonic PV-200) mounted on a vehicle. The vehicle was at the

41
stopped position at the T-intersection of a minor road and the major road. The
three video camcorders were mounted on top of a 1979 Dodge at angles that
provided a 180 degree field of view (straight forward, and centered 75 degrees
from straight forward). The three camcorders were fixed to a platform on the
roof of the vehicle. Figure 6-1 shows the vehicle with the mounted
camcorders. Figure 6-2 shows the camcorders on the platform. The platform
was fixed in position and not able to rotate like a driver's head or neck. The
camcorders were fixed with respect to the roadway geometry which caused
distortion in the pictures of intersections that were not at right angles. The
measured and camcorder sight distances were different because the camcorders
could not compensate for elevation changes such as roadway bumps and sags.
The focal point for the three camcorders was in the center of the vehicle at the
same distance back from the front of the vehicle as the driver's eyes.
The center camcorder was a different model than the two side camcorders.
It was intended that the three video tapes would be synchronized by starting and
stopping the camcorders simultaneously using a single switch in the vehicle. The
center camcorder's internal mechanism did not start or stop recording at the
same rate as the two side camcorders so that the three video tapes were not
synchronized. However, all camcorders had the same film speed. The focal
width of the lenses was fixed at 30 degrees and since there were only three
camcorders, 90 degrees or half of the visual field was covered. Figure 6-3
shows the width of field of the camcorders. In future research, more
camcorders could be used to get a broader picture to compensate for the lack of
coverage of visual field, however this increases the cost, complexity, and
problems in synchronization of the films.

Figure 6-1 Vehicle with the Mounted Camcorders
48"
Figure 6-2 Camcorders on Roof Platform
RearA
24"
tFront
42

43
30°
30°
Rear of Roof Platform
Figure 6-3 Width of Field of Cameras

44
6.2.1.2. Filming Process
The filming process consisted of selecting and video taping unsignalized T-
intersections that provided the appropriate combination of sight distance and
traffic volume. The vehicle, with the camcorders mounted for video taping the
intersection, stopped at the stop sign on a minor road in a position to prepare
for a left turn onto the major road. The recording session at each intersection
took a longer time than a vehicle would have normally been required to stop to
make a left turn, and as a result the vehicle was in a vulnerable position. The
vehicle was equipped with a warning flasher, but still there were problems with
vehicles queuing up behind the stopped vehicle. There was no control over
traffic volumes although about half of the intersections were filmed during the
morning rush hour. The length of filming done at each intersection was
approximately proportional to traffic volume(30-90 seconds). As mentioned
previously, the width of visual field was limited by the camera lenses. The
final filming was confined to cloudy, dry weather. The sun caused distortion due
to glare and shadows. The camcorders were not protected from the rain, and
wet roads also caused too much glare. After each intersection was filmed, the
lenses were covered and the camcorders were run for 30 to 50 seconds to
provide a separation on the tape between the intersections.
6.2.2. Playback Equipment
The three video tapes were played back to the participants using three VHS
video-recorders (JVC model HR-D142U), each connected to one of three rear
screen projection systems with 114 cm, diagonal screens (Mitsubishi model

45
VS-459-R). The participants viewed the screens from a fixed based Aetna
Drivotrainer console that was positioned 142 cm. from the center of the middle
screen. The two side screens were positioned at 75 degree angles from the
straight ahead position which corresponded to those of the camcorders that
taped the intersection pictures, and covered 180 degree field of view.
The gaps between the three screens require the subject viewing the display
to fill in the images mentally which reduces the synchronization problem. Figure
6-4 shows the laboratory layout of the screens, drivotrainer, VHS players and
data acquisition equipment.
6.2.2.1. Video Tapes
There was a lack of control of synchronization due to the discrepancies in
the camcorders and the VHS players. The video tapes were very sensitive to
ambient room temperature. When either the VHS players or the room got too
warm, the tapes would stretch, and the synchronization would be lost. There
was significant variation between and within the tapes daily and also over the
six week period of testing with subjects. No equipment or budget existed for
editing the VHS video tapes. The start/stop speeds of the VHS players were
variable since they were designed for domestic rather than scientific use.
6.2.3. Head Angle Measurement Device
Subjects wore a hard hat device that measured dynamic head range of
movement. The hard hat device was equipped with a potentiometer that was

Black Box
D.A.V.E.
VHS Player
Ortho-Rater
ChairSteering Wheel
Brake Pedal
Drivotrainer
Figure 6-4 Laboratory Layout
ProjectionScreens
46

47
calibrated to measure head angles at a resolution of one degree and was sampled
every 0.01 seconds. The hard hat was connected to a horizontal bar that was a
piece of teflon rod that permitted the hat to slide in and out freely. The
horizontal bar was hinged to an adjustable vertical post that was fixed to the
back of a seat but was free to rotate forward and backward so the subject could
bend forward. The only major problem with the head measurement mechanism
was the weight of the hard hat assembly for some of the older female subjects.
The hard hat mechanism did not restrict the subjects' head movement. Figure 6-
5 shows the drivotrainer and helmet assembly. Figure 6-6 shows the head angle
measurement device. The subjects' visual field was tested using the Bausch &
Lomb Orthorater. The static range of movement of the subjects' head and neck
was measured using a standard international SF1R pocket goniometer. The
standard international SPTR pocket goniometer is a device used by physical
therapists and physiatrists for measuring joint angles.
6.2.4. Data Acquisition Equipment
The data acquisition system consisted of two major devices a 'black box',
and D.A.V.E., which is an acronym for Driver Analysis Vehicle Equipment.
Figure 6-7 shows the data acquisition equipment components. D.A.V.E. included
the DC/DC converter, data recorder, control box, power supplies and car battery.
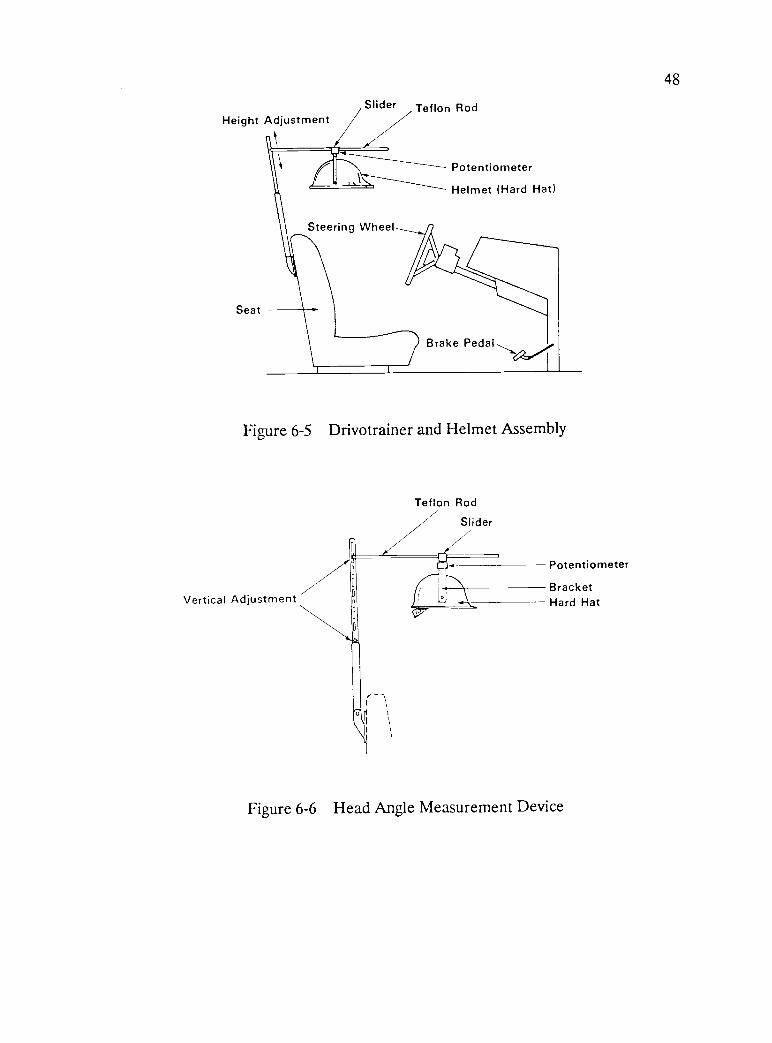
48
Height Adjustment
Seat
Slider Teflon Rod
Steering Wheel
Potentiometer
Helmet (Hard Hat)
Brake Pedal,,,
Figure 6-5 Drivotrainer and Helmet Assembly
Vertical Adjustment
Teflon Rod
Slider/Potentiometer
BracketHard Hat
Figure 6-6 Head Angle Measurement Device

DC/DCConverter
DataRecorder
Black Box
I
Control Box
Computer VHS Players
000
000 000
Ortho Rater
PowerSupplies
000........
Car Battery
Floor
Figure 6-7 Data Acquisition Equipment Components
49

50
6.2.4.1. Black Box
The black box was a small box that was used to collect the head angle
measurements, increment the intersection counter, and measure decision time.
The voltage from the potentiometer on the helmet was fed to the black box for
pre-processing prior to passing on to D.A.V.E. The video tape on the center
screen had an audible beep that was used to signal to the subject and the data
acquisition system that decision timing was beginning. The beep not only started
the timing interval but it also incremented the intersection counter. The
intersection timer voltage increased from 0 volts before the beep to plus 0.5
volts during the timing interval until the brake pedal was released. The beep
consistently started the timing interval, but it did not always increment the
counter, therefore an event switch was used to enter the intersection number
each time manually. Subjects were asked to depress the brake pedal before each
intersection was shown. This in effect closed the switch between the minus 12
volt power supply to the black box. When the subject decided to make a left
turn, he released the brake which opened the switch and caused the timing
voltage to drop back to zero.
There were many problems encountered with the data acquisition system
during testing with subjects. Some of these included, early calibration problems
with the potentiometer, and the timer voltage would not always return to zero at
the end of an intersection. Other problems were a result of the design of the
black box. All intersections had to be given sequentially and without repetition.
Since there were no provisions for backing up and repeating an intersection

51
when a subject forgot to keep the brake depressed until the beep sounded, those
data were lost. As a result many subjects have incomplete records.
6.2.4.2. D.A.V.E.(Driver Analysis Vehicle Equipment)
The D.A.V.E. system functioned as a data recorder. D.A.V.E. is a data
acquisition system that was designed to operate in a vehicle for use on field
trials. Initially D.A.V.E. was plugged into a wall outlet, but after repeated break
downs due to inconsistencies in the building power and D.A.V.E.'s sensitivity to
high frequency noise, power was supplied from a 12 volt car battery. The
battery power was then fed through a D.C. to D.C. converter, since three
different output voltages were required. Other inputs to D.A.V.E., apart from
those from the black box, included a portable computer for entering diagnostic
and header information, the event switch to mark the intersections manually, and
the control box. The black box inputs to D.A.V.E. consisted of the head angle
voltage, the timer interval voltage, and the intersection counter voltage.
D.A.V.E. functioned as an analog to digital converter and converted the input
voltages to digital format output (binary) which was then recorded on
preformatted data cartridge tapes. Figure 6-8 shows the block diagram of the
data acquisition system.
After data collection, the data tapes were taken to a tape reader which was
a mini computer. The data tapes were read and stored on computer disks. A
small program was written to pre-process the data. This eliminated storing
unnecessary data from the intervals between intersections, and permitted simple
statistical analysis to be performed. The preprocessing analysis is discussed in

52
HELMET(head angle)
V.H.S. PLAYER(BEEP)
FILTER
(bandpass)
POWER SUPPLY
(-12 volts)
BRAKE
(switch)
POWER SUPPLY(12 volts)
CONTROL BOX
BLACK BOX
HeadAngle
Timer Counter
PORTABLE
COMPUTER
EVENT
SWITCH
D.A.V.E. SYSTEM
A/0 CONVERTER
DATA RECORDER
DATA TAPE
BATTERY (.12V)
D.C. to D.C.
CONVERTER
Figure 6-8 Block Diagram of the Data Acquisition System

53
section 6.4.1 at the end of the data collection section. Tapes were made of the
preprocessed data. These were transferred to the Computer Center at the
National Institutes of Health, for computer processing of the data and statistical
analysis.
6.3 EXPERIMENTAL PROCEDURE
The participants were pre-screened over the telephone to determine whether
or not they met the criteria for participation, as well as to explain the general
nature of the research and their participation.
At the beginning of the experiment the general purpose of the research was
outlined in the instruction sheets, and each participant was asked to sign an
informed consent form. Appendix A includes copies of the instruction sheet,
informed consent forms and data forms. After the introduction, the following
information was collected as part of the experimental design: participant's age,
sex, description of impairment, whether they wear glasses for driving, head and
neck static range of movement, visual field, and medications and reasons for use.
The questioning was followed by a neck and head range of movement test,
and a visual field test. The initial procedures took approximately 30 minutes to
complete. Afterwards, the participants were allowed a short break. The
participants were then introduced to the simulator, and permitted a few minutes
to become accustomed to the equipment. The participants were also given
instructions for the test and permitted to ask any questions concerning the test
procedures or equipment.

54
The task for the subjects was to watch video presentations of the
intersections on the three screens. Prior to presentation of each intersection,
the intersection was announced at which point the subject depressed the brake
pedal. There were a few seconds of run in of the scene then the audible beep
was heard which signalled to the subject that decision timing was beginning.
The subjects would watch the scene and when they felt it was safe, then they
would indicate they were ready to make a left turn by releasing the brake pedal.
The release of the brake pedal would signal the end of the intersections
presentation and there would be a pause of one to two minutes prior to the
presentation of the next intersection. The video films covered half of the visual
range therefore the test subjects had to mentally fill in the visual image
between the screens. The test subjects had to judge when there were acceptable
gaps in both the left and right traffic streams. In general, the traffic volumes
were low in one or both traffic streams.
Two trial intersections, which were often repeated for practice, were
presented then eighteen test intersections were presented sequentially and
without repetition to each participant. For some participants subjective
responses to each intersection were made during a short period after the
presentation of each intersection. Response information was recorded on a data
sheet and a data acquisition system for analysis at a later time. The data
acquisition system recorded the response time, and the degree of head movement.
After the presentation of the final intersection, each participant was debriefed
and paid.

55
6.4 DATA COLLECTION
The following data were collected as part of the experimental design:
participant's age, sex, description of impairment, whether they wear glasses for
driving, head and neck static range of movement, visual field, and medications
and reasons for use. For each participant at each intersection the following
information was collected: number and degree of head movements, and response
time.
6.4.1. Preprocessing Analysis
The data were analyzed, and the following calculations were made for each
subject and at each intersection: decision time, number of head turns, decision
time divided by the total number of head turns, maximum head angle on the left
and right side, range of angle of movement, mean left and right angle, standard
deviation of left and right angle, and number of right and left head turns.
Calculations were made over all intersections for each subject and include the
following; number of good intersections (n), sum of decision time over good
intersections (n), average decision time, and the sum total number of head turns
over good intersections(n). The zero position for head angle is straight ahead
over the front of the vehicle. At skewed intersections the geometrics of the
intersection are reflected in the discrepancy between the maximum left and right
head angle.

CHAPTER 7
EXPERIMENTAL RESULTS
7.0 INTRODUCTION
56
This chapter includes a summary of the statistical analysis that was
performed on the experimental data. Statistical data are presented in Appendix
B. Appendix B includes analysis of variance (ANOVA) tables and a summary of
means and standard deviations. Regression equations for relationships of average
decision time versus age, and range of motion versus head turn angle are also
included in Appendix B.
The experimental results were split into two segments; totals across all
subjects and all intersections(totals) and individual intersection summaries across
all subjects. The statistical results of the intersections summaries were similar
to the statistical results for the totals of all subjects at all intersections. More
error was introduced into the totals since the decision time was averaged over
all the "correct" intersections for each subject, and each intersection had a
different time interval depending on traffic volume and geometrics. Many of the
older subjects did not follow instructions correctly and misjudged several
intersections. As a result the data could not be used for those intersections,
and the intersections were judged to be "incorrect". Therefore, the totals
results only represent the "correct" intersections driven by each subject. This
introduces bias since there were intersections that were more consistently
"incorrect" than others. Individual intersection statistics were examined in order

57
to eliminate errors resulting from different intersection time intervals, sight
distance, volumes and geometrics. Summary statistics are shown for four
intersections:
(i) poor sight distance and low volume,
(ii) mixed sight distance and low volume,
(iii) good sight distance and high volume,
(iv) good sight distance and low volume.
Data were gathered for all 72 subjects at all 18 intersections through four
channels every 0.01 seconds. The large amount of data and the subsequent
statistical analysis precluded indepth analysis of all eighteen intersections. Four
intersections were selected, for the indepth analysis because they had complete
data sets and were representative of sight distance and traffic volume
combinations. Intersections with high volumes presented the most difficulty for
test subjects. Most of these had incomplete data sets and were not selected for
indepth analysis. Some of the intersections with very difficult geometrics also
had poor video representation and therefore incomplete data sets.
Relationships were considered significant if the probability of a type I
error was 25% or less. The type I error is often referred to as a level of
significance test. Type I error is the error of rejecting a true hypothesis,
whereas a type II error is the error of not rejecting a hypothesis when it is
false. This research is fundamental and unique, and therefore it is more
important to not reject a true hypothesis than to mistakingly accept a false
hypothesis. For example, the costs of type II errors out weigh the costs of a
low level of significance. If the level of significance was set too low for

58
example at 0.05, then it is likely that significant variables would be overlooked
and type H errors would be made. The most significant results are explained
and are related to the literature and results from other sources.
7.1 EXPERIMENTAL RESULTS
7.1.1. Totals Summary
The totals summary statistics give a general impression of the relationships
that are significant. Subject's age was coded into two groups, subjects age 30-
50 years were in group 1, and subjects age 60-80 were in group 2. The totals
summary statistics depict the relationships of decision time versus age code; sex;
impairment; glasses; medication; functional level; age and sex; age and glasses;
age and impairment; age, sex and medication; and age, sex and impairment.
Figure 7-1 is a histogram depicting the statistical significance levels of the
relationships.
Standard statistical terminology is used in summary tables. P-value is the
smallest level of significance for a particular hypothesis and corresponds to a
type I error. For example, a P-value of 0.25 or greater would indicate that the
variable is not significant and that there is very little possibility of making a
type II error.

59
HISTOGRAM OF SIGNIFICANCE LEVELS FOR ALL INTERSECTIONS
AGE
FUNCTIONAL LEVEL
MEDICATION
GLASSES
SEX
IMPAIRMENT
AGE AND SEX
AGE AND GLASSES
AGE AND IMPAIRMENT
AGE, SEX, AND MEDICATION
AGE, SEX, AND IMPAIRMENT
r Aar A
Ad
mF A
.414W
0.0 0.2 0.4 0.6 0.8 1.0
SIGNIFICANCE LEVELS
Figure 7-1 Histogram of Significance Levels for all Intersections
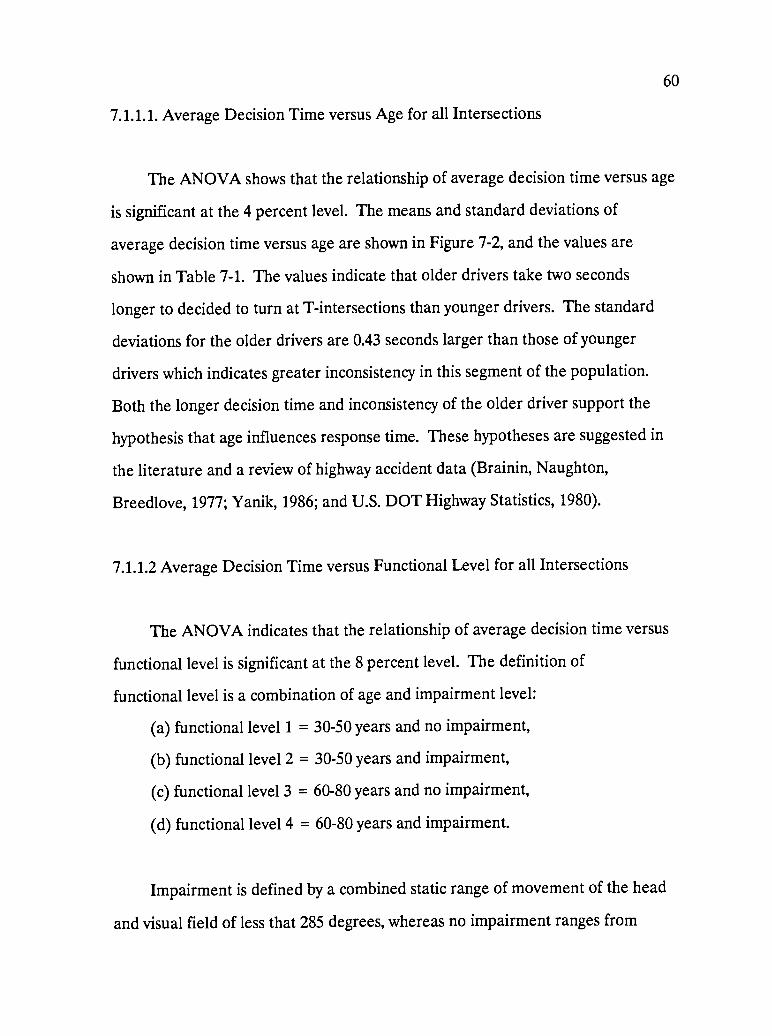
60
7.1.1.1. Average Decision Time versus Age for all Intersections
The ANOVA shows that the relationship of average decision time versus age
is significant at the 4 percent level. The means and standard deviations of
average decision time versus age are shown in Figure 7-2, and the values are
shown in Table 7-1. The values indicate that older drivers take two seconds
longer to decided to turn at T-intersections than younger drivers. The standard
deviations for the older drivers are 0.43 seconds larger than those of younger
drivers which indicates greater inconsistency in this segment of the population.
Both the longer decision time and inconsistency of the older driver support the
hypothesis that age influences response time. These hypotheses are suggested in
the literature and a review of highway accident data (Brainin, Naughton,
Breedlove, 1977; Yanik, 1986; and U.S. DOT Highway Statistics, 1980).
7.1.1.2 Average Decision Time versus Functional Level for all Intersections
The ANOVA indicates that the relationship of average decision time versus
functional level is significant at the 8 percent level. The definition of
functional level is a combination of age and impairment level:
(a) functional level 1 = 30-50 years and no impairment,
(b) functional level 2 = 30-50 years and impairment,
(c) functional level 3 = 60-80 years and no impairment,
(d) functional level 4 = 60-80 years and impairment.
Impairment is defined by a combined static range of movement of the head
and visual field of less that 285 degrees, whereas no impairment ranges from
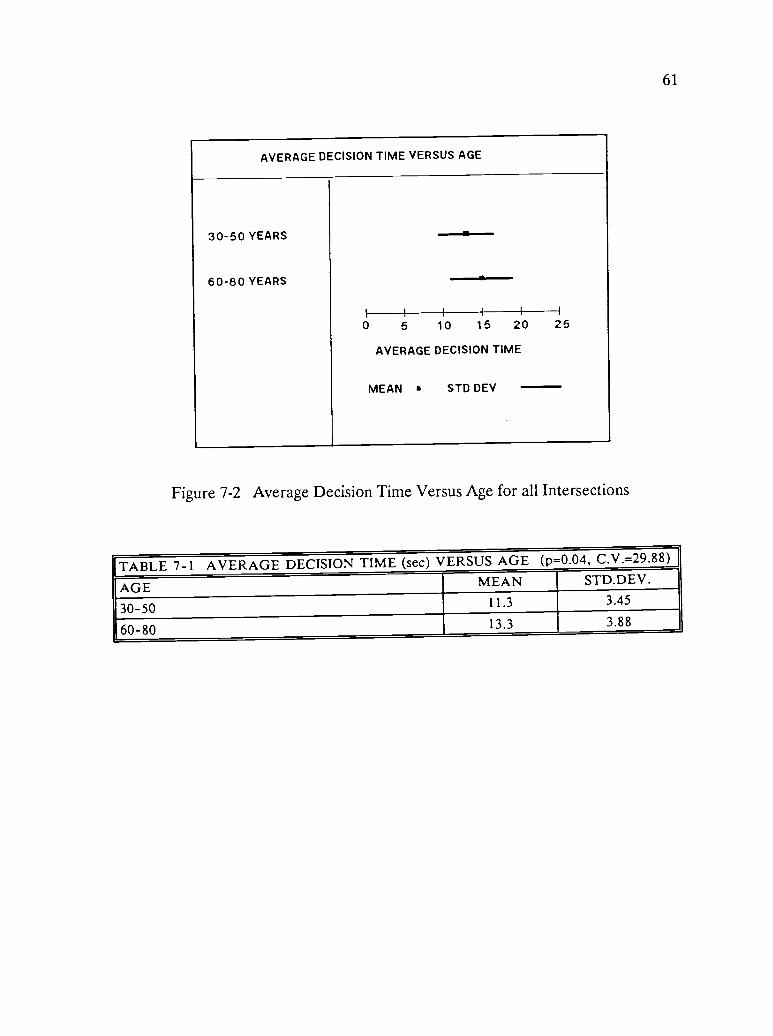
61
AVERAGE DECISION TIME VERSUS AGE
30-50 YEARS
60-80 YEARS
1I 1 1 II
0 5 10 15 20
AVERAGE DECISION TIME
DEV
25
MEAN STD
Figure 7-2 Average Decision Time Versus Age for all Intersections
TABLE 7-1 AVERAGE DECISION TIME (sec) VERSUS AGE (p=0.04, C.V.=29.88)
AGE MEAN STD.DEV.
30-50 11.3 3.45
60-80 13.3 3.88

62
285 to 360 degrees. There is no definitive definition of impairment level in the
literature, therefore for this study, the choice of 284 degrees was arbitrarily
based on the functional requirements for driving. The means and standard
deviations of average decision time versus functional level are shown in Figure
7-3, and the values are shown in Table 7-2.
There is an increase in the mean decision time with functional level,
however the increase in decision time between the younger and older age groups
is approximately two seconds. The 1.25 second increase in standard deviation
with impairment can be explained by the wide diversity of severity of
impairment and the less consistent driving behavior in this subject group. It is
interesting to note that average decision time versus impairment is not
significant (p = 0.85). The implication of these results is that the younger
impaired drivers are able to compensate in their driving behavior for their
impairment, but the older drivers either impaired or unimpaired, are unable to
make the necessary compensations. Average decision time versus age and
impairment is significant at the 22 percent level. The means and standard
deviations of average decision time versus age and impairment are shown in
Figure 7-4 and the values are shown in Table 7-3. The ANOVA also show that
there were no interactions between age and impairment (p = 0.60). Likewise,
there were no interactions between age, sex or impairment.
Table 7-3 is similar to Table 7-2, which is one factor, functional level, at
four levels. Table 7-3 is two factors, age and impairment, at two levels each.
The trends in the two tables are the same but the specific means and standard

63
AVERAGE DECISION TIME VERSUS FUNCTIONAL LEVEL
FUNCTIONAL LEVEL 1
FUNCTIONAL LEVEL 2
FUNCTIONAL LEVEL 3
FUNCTIONAL LEVEL 4
--s---... ----Is-
I II i I
0 5 10 15 20
AVERAGE DECISION TIME
MEAN STD DEV
I
25
Figure 7-3 Average Decision Time Versus Functional Levelfor all Intersections
TABLE 7-2 AVERAGE DECISION TIME (sec) VERSUS FUNCTIONALLEVEL(1-4) (p=0.08, C.V.=29.66)
FUNCTIONAL LEVEL MEAN STD.DEV.
1 30-50, UNIMPAIRED 11.3 2.87
2 30-50, IMPAIRED 11.4 4.09
3 60-80, UNIMPAIRED 12.1 3.08
4 60-80, IMPAIRED 14.4 4.35

64
AVERAGE DECISION TIME VERSUS AGE AND IMPAIRMENT
30-50, UNIMPAIRED
30-50, IMPAIRED
60-80, UNIMPAIRED
60-80, IMPAIRED
61
a
0 5 10 15 20
AVERAGE DECISION TIME
MEAN STD DEV
25
Figure 7-4 Average Decision Time Versus Age and Impairmentfor all Intersections
TABLE 7-3 AVERAGE DECISION TIME (sec) VERSUS AGE AND IMPAIRMENT(p=0.22, C.V.=30.07)
AGE AND IMPAIRMENT MEAN STD.DEV.
30-50, UNIMPAIRED 11.3 2.97
30-50, IMPAIRED 11.3 3.95
60-80, UNIMPAIRED 13.9 3.41
60-80, IMPAIRED 12.9 4.17

65
deviations are different. Both tables indicate increasing mean decision time with
age and increasing dispersion of average decision time.
7.1.1.3. Average Decision Time versus Subjects' Sex for all Intersections
The ANOVA shows that there was no significant difference in decision time
due to the sex of the subject, however the relationship of average decision time
versus age and sex was significant at the 15 percent level. Also, there was no
significant interaction between age and sex. The means and standard deviations
of the relationship of average decision time versus age and sex are shown in
Figure 7-5 and the values are shown in Table 7-4.
In this study, younger males have a 0.4 second longer decision time than
younger females, but older males have a 1.6 second shorter decision time than
older females. The standard deviations increase with age, and young males
show the most consistent behavior (s = 2.95), while older males are the most
inconsistent (s = 3.97). The longer decision time taken by the older females of
14.1 seconds is supported in the literature which suggests that the current
generation of older female drivers lack the experience of their male
counterparts, but the younger generation of female and male drivers are more
equally matched in terms of driving experience (Grubb, 1986; Planck and Fowler,
1971). There is no significant interaction between age and sex.

66
AVERAGE DECISION TIME VERSUS AGE AND SEX
30-50, MALE --a-30-50, FEMALE
60-80, MALE
60-80, FEMALE --aI 1I I I I
0 5 10 15 20 25
AVERAGE DECISION TIME
MEAN STD DEV
Figure 7-5 Average Decision Time Versus Age and Sexfor all Intersections
TABLE 7-4 AVERAGE DECISION TIME (sec) VERSUS AGE AND SEXC.V.=30.04)
(p=0.15,
AGE AND SEX MEAN STD.DEV.
30-50, MALE 11.6 2.95
30-50, FEMALE 11.2 3.67
60-80, MALE 12.5 3.97
60-80, FEMALE 14.1 3.73

67
AVERAGE DECISION TIME VERSUS MEDICATION
MEDICATION
NO MEDICATION -N-.0 5 10 15 20
AVERAGE DECISION TIME
STD DEV
25
MEAN
Figure 7-6 Average Decision Time Versus Medicationfor all Intersections
TABLE 7-5 AVERAGE DECISION TIME (sec) VERSUS MEDICATION (p=0.16,C.V.=30.40)
MEDICATION MEAN STD.DEV.
MEDICATION 11.5 3.71
NO MEDICATION 12.8 3.74
68
7.1.1.4. Average Decision Time versus Medication
The ANOVA shows that the relationship of average decision time versus
medication is significant at the 16 percent level. The means and standard
deviations of average decision time versus medication are shown in Figure 7-
6,and the values are shown in Table 7-5. Table 7-5 shows that subjects on
medication took 1.3 seconds less time to make a decision than those not on any
medications. The most common reason for medication was arthritis or high blood
pressure. Table 7-6 indicates that very few of the prescribed medications have
any effect on reaction time. These results do not suggest that the influence of
medication should not be studied, but rather it merely indicates that in the
subject sample used in this study medication did not have any detrimental effect
on performance. The relationship of average decision time versus age, sex and
medication is significant at the 35 percent level, and there were no significant
interactions between age, sex, or medication.
7.1.1.5. Average Decision Time versus Glasses
The ANOVA shows that the relationship of average decision time versus age
and glasses is significant at the 16 percent level. The means and standard
deviations of average decision time versus age and glasses are shown in Figure
7-7, and the values are shown in Table 7-7.
The summary of means and standard deviation show that the younger
drivers with glasses have a 0.8 second shorter decision time than younger drivers

69
TABLE 7-6
LIST OF MEDICATIONS TAKEN BY SUBJECTS
MEDICATION REASON SIDE EFFECTS THATAFFECT REACTION TIME
Clinoril(2)* Arthritis noneDisalcid(2) Arthritis noneFeldene(2) Arthritis noneMethotrexate(2) Arthritis noneNapersin(4) Arthritis nonePlacquenil Arthritis nonePrednozone(4) Arthritis none
Aldazide Hypertension noneBlockadrin Beta blocker may affect reactionsCoumadin(2) Phlebitis noneDiazide Diuretic noneIsordil Hypertension noneLasix Diuretic noneLoupressor Beta blocker may affect reactionsMaxide Diuretic noneReserpin(2) Hypertension noneTenormin(2) Beta blocker may affect reactionsVasotec Hypertension noneAsidrex(2) Diuretic none
Synthroid(6) Hypothyroid speed up reactionsEntext Allergy may affect reactionsSeldane Allergy noneOrnaid Allergy noneIsoprel Asthma noneDimalor Diabetes noneInsulin(2) Diabetes noneParnate Depression may affect reactionsDilantin Seizures may affect reactionsDarvocet Pain may affect reactionsMotrin Pain may affect reactionsPercaset Pain may affect reactions
*( ) Indicates the number of subjects on the same medication

70
AVERAGE DECISION TIME VERSUS AGE AND GLASSES
30-50, GLASSES
30-50, NO GLASSES
60-80, GLASSES
60-80, NO GLASSES
I
0 5 10 15 20
AVERAGE DECISION TIME
MEAN a STD DEV
25
Figure 7-7 Average Decision Time Versus Age and Glassesfor all Intersections
TABLE 7-7 AVERAGE DECISION TIME (sec) VERSUS AGE AND GLASSES(p=0.16, C.V.=30.09)
AGE AND GLASSES MEAN STD.DEV.
30-50, GLASSES 10.9 3.63
30-50, NO GLASSES 11.7 3.35
60-80, GLASSES 13.7 3.72
60-80, NO GLASSES 12.4 4.24

71
without glasses. This relationship is reversed for the older drivers, where older
drivers without glasses have a 1.3 second shorter decision time than older drivers
with glasses. Of the older drivers, 66 percent wore glasses for driving compared
to approximately 50 percent of the younger drivers. It was anticipated that
there would be a significant relationship for drivers who wore glasses since they
need to turn their head farther to gather information. It can therefore be
concluded that age effects are stronger than the effect of glasses. There were
no significant interactions between age and glasses.
7.1.2. Intersection Summary
Four intersections were analyzed in depth, since these intersections were
representative of difficulty, sight distance and traffic volume. Many of the
other intersections had incomplete data sets and therefore were not selected for
the in-depth analysis. The first intersection of study has poor sight distance on
the left and low traffic volume. The second intersection of study has poor sight
distance and no traffic on the left, and has good sight distance and low volume
on the right. The third intersection of study has good sight distance in both
directions and high traffic volume. The fourth intersection of study has good
sight distance in both directions and low traffic volume.
The first, second and fourth intersections were examined to determine the
relationships of decision time versus age; sex; impairment code; glasses;
medication; functional level; age and sex; age and glasses; age and impairment;
age, sex and medication; and age, sex, and impairment. The third intersection
had high traffic volume and most subjects across all ages did not make a turn.

72
This is reflected in the low standard deviations. The relationships of decision
time versus age and sex; age and glasses; age and impairment; age, sex and
medication; and age, sex, and impairment were not studied for this intersection.
7.1.2.1 Intersection with Poor Sight Distance and Low Volume
The only relationship that is not significant for this intersection is
average decision time versus medication. All other relationships ranged in
significance from 0 to 13 percent. Figure 7-8 is a histogram depicting the
significance levels of the relationships.
Figure 7-9 shows the means and standard deviations for average decision
time versus functional level, and the values are shown in Table 7-8. Average
decision time increases with functional level for this intersection. Increasing
functional level is increasing age and impairment. However, the standard
deviation for functional level 2 (30-50 years and impaired) is 0.30 seconds smaller
than functional level 1 (30-50 years and unimpaired). All other standard
deviations increase with functional level. This is consistent with the totals
results across all intersections and all subjects.
Figure 7-10 shows the means and standard deviations for average decision
time versus age, and the values are shown in Table 7-9. Age effects are
clearly evident as shown in the 1.6 second increase in the means and the 1.19
increase in standard deviation. Younger drivers may be able to decide and
react more quickly at this intersection where the sight distance is poor, but
approach volumes are low, or they may be less cautious.

73
HISTOGRAM OF SIGNIFICANCE LEVELS FOR INTERSECTION
WITH POOR SIGHT DISTANCE AND LOW VOLUME
AGE
FUNCTIONAL LEVEL
MEDICATION
GLASSES
SEX
IMPAIRMENTAGE AND SEX
AGE AND GLASSES
AGE AND IMPAIRMENT
AGE, SEX, AND MEDICATION
AGE, SEX, AND IMPAIRMENT
/z_zi/A
]
Y/1//1
1111111110.0 0.2 0.4 0.6 0.8 1 0
SIGNIFICANCE LEVELS
Figure 7-8 Histogram of Significance Levels for Intersectionwith Poor Sight Distance and Low Volume

74
AVERAGE DECISION TIME VERSUS FUNCTIONAL LEVEL
FUNCTIONAL LEVEL 1
FUNCTIONAL LEVEL 2
FUNCTIONAL LEVEL 3
FUNCTIONAL LEVEL 4
-41-
--a-
--ii--a--
0 5 10 15 20
AVERAGE DECISION TIME
MEAN STD DEV
I
25
Figure 7-9 Average Decision Time Versus Functional Level for anIntersection with Poor Sight Distance and Low Volume
TABLE 7-8 AVERAGE DECISION TIME (sec) VERSUS FUNCTIONALLEVEL(1-4):at an intersection with poor sight distance and low volume(p=0.00, C.V.=30.43)
FUNCTIONAL LEVEL MEAN STD.DEV.
1 30-50, UNIMPAIRED 6.8 2.00
2 30-50, IMPAIRED 7.4 1.70
3 60-80, UNIMPAIRED 7.5 2.27
4 60-80, IMPAIRED 9.9 3.30

75
AVERAGE DECISION TIME VERSUS AGE
30 -50 YEARS
60-80 YEARS
-IN--
,-.41-
0 5 10 15 20
AVERAGE DECISION TIME
STD
25
MEAN DEV
Figure 7-10 Average Decision Time Versus Age for anIntersection with Poor Sight Distance and Low Volume
TABLE 7-9 AVERAGE DECISION TIME (sec) VERSUS AGE:at an intersectionwith poor sight distance and low volume (p=0.02, C.V.=31.96)
AGE MEAN STD.DEV.
30-50 7.1 1.85
60-80 8.7 3.04
76
Figure 7-11, shows the means and standard deviations for average decision
time versus age and glasses, and the values are shown in Table 7-10. There is
interaction between age and glasses, but it is the age effects which dominate
the increase in means and standard deviations of the older age group.
Figure 7-12 shows the means and standard deviations for average decision
time versus age, and impairment, and the values are shown in Table 7-11.
There are increases in the means of average decision time with age and
impairment level and also a significant increase in the standard deviation with
age. The 0.5 second difference in means of the (30-50) age group versus the
1.70 second difference in the (60-80) age group shows that the younger impaired
drivers are better able to compensate for their impairments.
Figure 7-13 shows the means and standard deviations for average decision
time versus age, sex, and impairment, and the values are shown in Table 7-12.
The standard deviations show an increase with age, and there is the largest
inconsistency among 60-80 year old males with impairments. The 30-50 year old
females have shorter mean average decision times than their male counterparts.
Except for the 30-50 year old male drivers, there is an increase in mean
average decision time with impairment level.
Figure 7-14 shows the means and standard deviations for average decision
time versus age and sex, and the values are shown in Table 7-13. In contrast
to the totals results for the relationship of average decision time versus age
and sex, the females show a 0.3-0.4 second shorter decision time and also more
consistent behavior as reflected in the smaller standard deviations.

77
AVERAGE DECISION TIME VERSUS AGE AND GLASSES
30-50, GLASSES --a-
30-50, NO GLASSES -s
60-80, GLASSES --e-60-80, NO GLASSES -a--
I1 I I I I
0 5 10 15 20 25
AVERAGE DECISION TIME
MEAN STD DEV
Figure 7-11 Average Decision Time Versus Age and Glasses for anIntersection with Poor Sight Distance and Low Volume
TABLE 7-10 AVERAGE DECISION TIME (sec) VERSUS AGE AND GLASSES:atan intersection with poor sight distance and low volume (p=0.03,C.V.=31.64)
AGE AND GLASSES MEAN STD.DEV.
30-50, GLASSES 7.1 1.89
30-50, NO GLASSES 7.0 1.87
60-80, GLASSES 9.2 3.33
60-80, NO GLASSES 7.5 2.06

78
AVERAGE DECISION TIME VERSUS AGE AND IMPAIRMENT
30-50, UNIMPAIRED --a--
30-50, IMPAIRED e-60-80, UNIMPAIRED f-60-80, IMPAIRED --II-
0 5 10 15 20 25
AVERAGE DECISION TIME
MEAN STD DEV
Figure 7-12 Average Decision Time Versus Age and Impairment for anIntersection with Poor Sight Distance and Low Volume
TABLE 7-11 AVERAGE DECISION TIME (sec) VERSUS AGE ANDIMPAIRMENT:at an intersection with poor sight distance and lowvolume (p=0.03, C.V.=31.63)
AGE AND IMPAIRMENT MEAN STD.DEV.
30-50, UNIMPAIRED 6.8 2.05
30-50, IMPAIRED 7.3 1.68
60-80, UNIMPAIRED 7.6 2.64
60-80, IMPAIRED 9.3 3.16
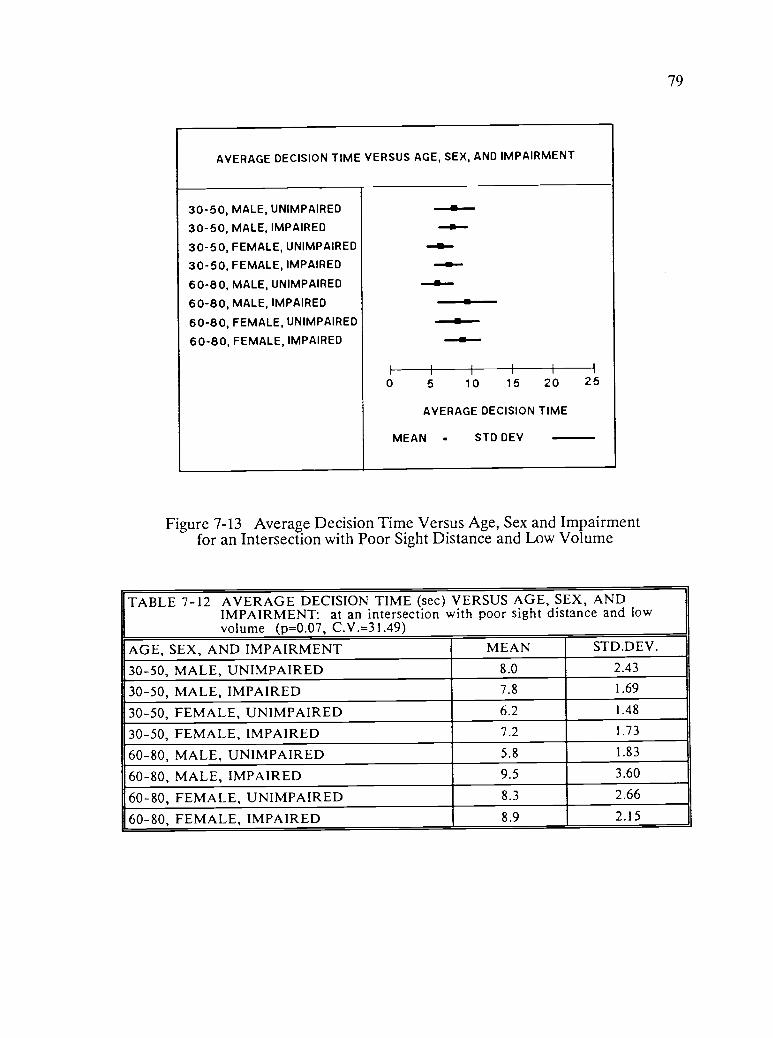
79
AVERAGE DECISION TIME VERSUS AGE, SEX, AND IMPAIRMENT
30-50, MALE, UNIMPAIRED
30-50, MALE, IMPAIRED
30-50, FEMALE, UNIMPAIRED
30-50, FEMALE, IMPAIRED
60-80, MALE, UNIMPAIRED
60-80, MALE, IMPAIRED
60-80, FEMALE, UNIMPAIRED
60-80, FEMALE, IMPAIRED
..a--a-a-a-x----e--.....0--a--
I
0 5 10 15 20
AVERAGE DECISION TIME
MEAN . STD DEV
25
Figure 7-13 Average Decision Time Versus Age, Sex and Impairmentfor an Intersection with Poor Sight Distance and Low Volume
TABLE 7-12 AVERAGE DECISION TIME (sec) VERSUS AGE, SEX, ANDIMPAIRMENT: at an intersection with poor sight distance and lowvolume (p=0.07, C.V.=31.49)
AGE, SEX, AND IMPAIRMENT MEAN STD.DE V.
30-50, MALE, UNIMPAIRED 8.0 2.43
30-50, MALE, IMPAIRED 7.8 1.69
30-50, FEMALE, UNIMPAIRED 6.2 1.48
30-50, FEMALE, IMPAIRED 7.2 1.73
60-80, MALE, UNIMPAIRED 5.8 1.83
60-80, MALE, IMPAIRED 9.5 3.60
60-80, FEMALE, UNIMPAIRED 8.3 2.66
60-80, FEMALE, IMPAIRED 8.9 2.15

AVERAGE DECISION TIME VERSUS AGE AND SEX
30-50, MALE --al-
30-50, FEMALE ....1
60-80, MALE
60-80, FEMALE -11.-
i
0 5 10 15 20 25
AVERAGE DECISION TIME
MEAN STD DEV
Figure 7-14 Average Decision Time Versus Age and Sex for anIntersection with Poor Sight Distance and Low Volume
80
TABLE 7-13 AVERAGE DECISION TIME (sec) VERSUS AGE AND SEX:at anintersection with poor sight distance and low volume (p=0.07,C.V.=32.16)
AGE AND SEX MEAN STD.DEV.
30-50, MALE 7.9 2.15
30-50, FEMALE 6.7 1.68
60-80, MALE 8.8 3.60
60-80, FEMALE 8.5 2.38
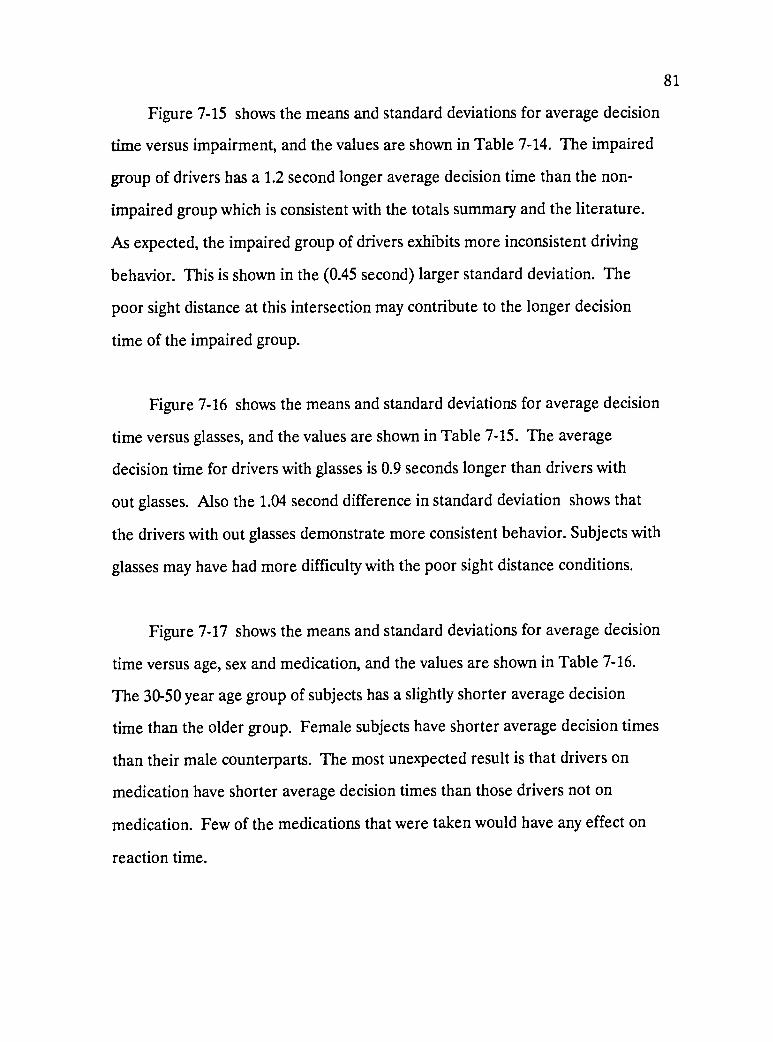
81
Figure 7-15 shows the means and standard deviations for average decision
time versus impairment, and the values are shown in Table 7-14. The impaired
group of drivers has a 1.2 second longer average decision time than the non-
impaired group which is consistent with the totals summary and the literature.
As expected, the impaired group of drivers exhibits more inconsistent driving
behavior. This is shown in the (0.45 second) larger standard deviation. The
poor sight distance at this intersection may contribute to the longer decision
time of the impaired group.
Figure 7-16 shows the means and standard deviations for average decision
time versus glasses, and the values are shown in Table 7-15. The average
decision time for drivers with glasses is 0.9 seconds longer than drivers with
out glasses. Also the 1.04 second difference in standard deviation shows that
the drivers with out glasses demonstrate more consistent behavior. Subjects with
glasses may have had more difficulty with the poor sight distance conditions.
Figure 7-17 shows the means and standard deviations for average decision
time versus age, sex and medication, and the values are shown in Table 7-16.
The 30-50 year age group of subjects has a slightly shorter average decision
time than the older group. Female subjects have shorter average decision times
than their male counterparts. The most unexpected result is that drivers on
medication have shorter average decision times than those drivers not on
medication. Few of the medications that were taken would have any effect on
reaction time.

82
AVERAGE DECISION TIME VERSUS IMPAIRMENT
NO IMPAIRMENT
IMPAIRMENT
II----e
I
0 5 10 15 20
AVERAGE DECISION TIME
MEAN STD DEV
25
Figure 7-15 Average Decision Time Versus Impairment for anIntersection with Poor Sight Distance and Low Volume
TABLE 7-14 AVERAGE DECISION TIME (sec) VERSUS IMPAIRMENT: at anintersection with poor sight distance and low volume (p=0.08,C.V.=32.75)
IMPAIRMENT MEAN STD.DEV.
NO IMPAIRMENT 7.2 2.30
IMPAIRMENT 8.4 2.75
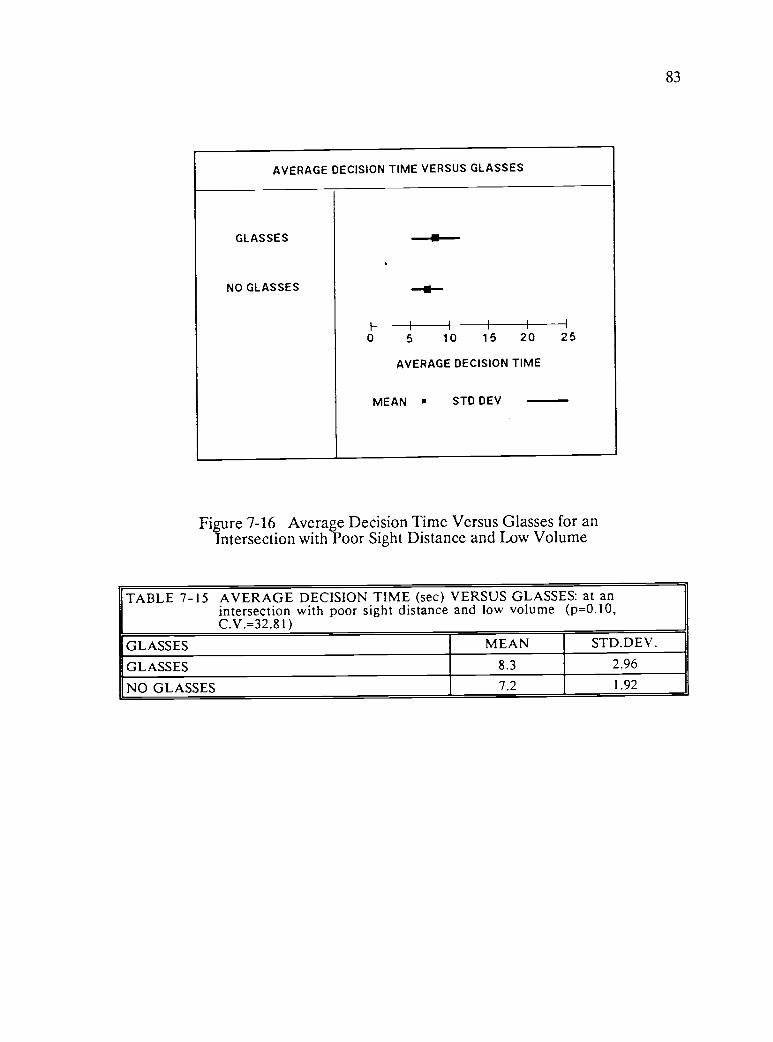
83
AVERAGE DECISION TIME VERSUS GLASSES
GLASSES
NO GLASSES
-41-
--ii-
0 5 10 15 20
AVERAGE DECISION TIME
MEAN STD DEV
25
Figure 7-16 Average Decision Time Versus Glasses for anIntersection with Poor Sight Distance and Low Volume
TABLE 7-15 AVERAGE DECISION TIME (sec) VERSUS GLASSES: at anintersection with poor sight distance and low volume (p=0.10,C.V.=32.81)
GLASSES MEAN STD.DEV.
GLASSES 8.3 2.96
NO GLASSES 7.2 1.92
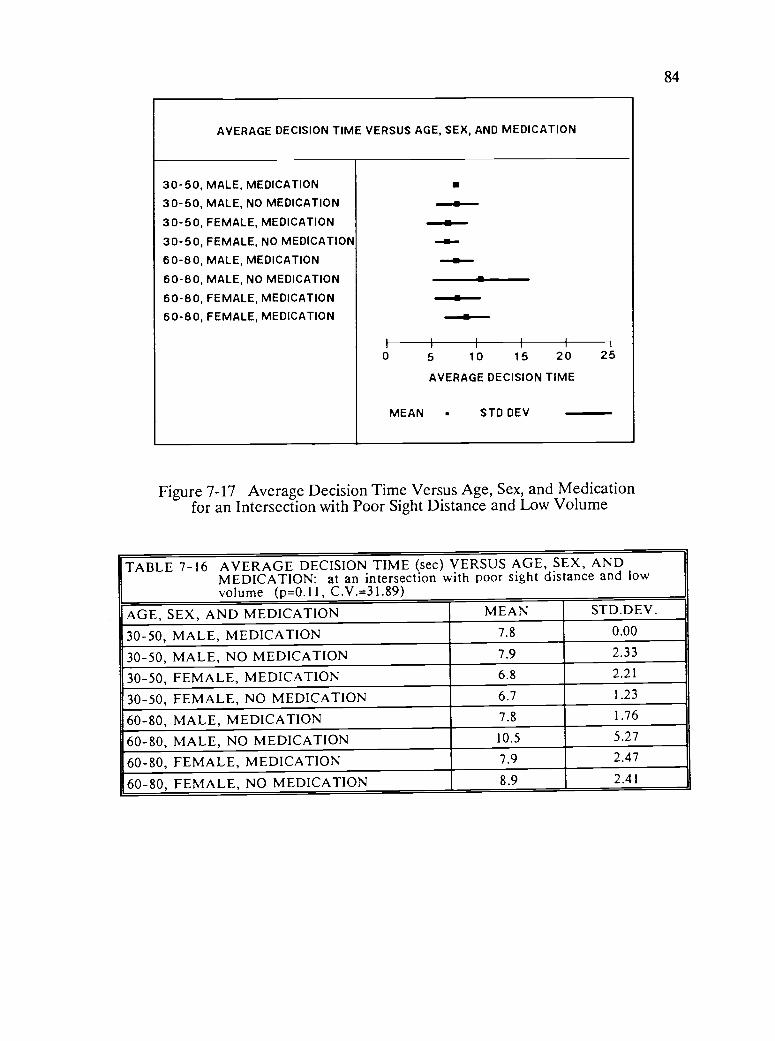
84
AVERAGE DECISION TIME VERSUS AGE, SEX, AND MEDICATION
30-50, MALE, MEDICATION
30-50, MALE, NO MEDICATION
30-50, FEMALE, MEDICATION
30-50, FEMALE, NO MEDICATION
60-80, MALE, MEDICATION
60-80, MALE, NO MEDICATION
60-80, FEMALE, MEDICATION
60-80, FEMALE, MEDICATION
a---aa.11--
in-a-0
MEAN
5 10 15 20
AVERAGE DECISION TIME
STD DEV
25
Figure 7-17 Average Decision Time Versus Age, Sex, and Medicationfor an Intersection with Poor Sight Distance and Low Volume
TABLE 7-16 AVERAGE DECISION TIME (sec) VERSUS AGE, SEX, ANDMEDICATION: at an intersection with poor sight distance and lowvolume (p=0.11, C.V.= 31.89)
AGE, SEX, AND MEDICATION MEAN STD.DEV.
30-50, MALE, MEDICATION 7.8 0.00
30-50, MALE, NO MEDICATION 7.9 2.33
30-50, FEMALE, MEDICATION 6.8 2.21
30-50, FEMALE, NO MEDICATION 6.7 1.23
60-80, MALE, MEDICATION 7.8 1.76
60-80, MALE, NO MEDICATION 10.5 5.27
60-80, FEMALE, MEDICATION 7.9 2.47
60-80, FEMALE, NO MEDICATION 8.9 2.41
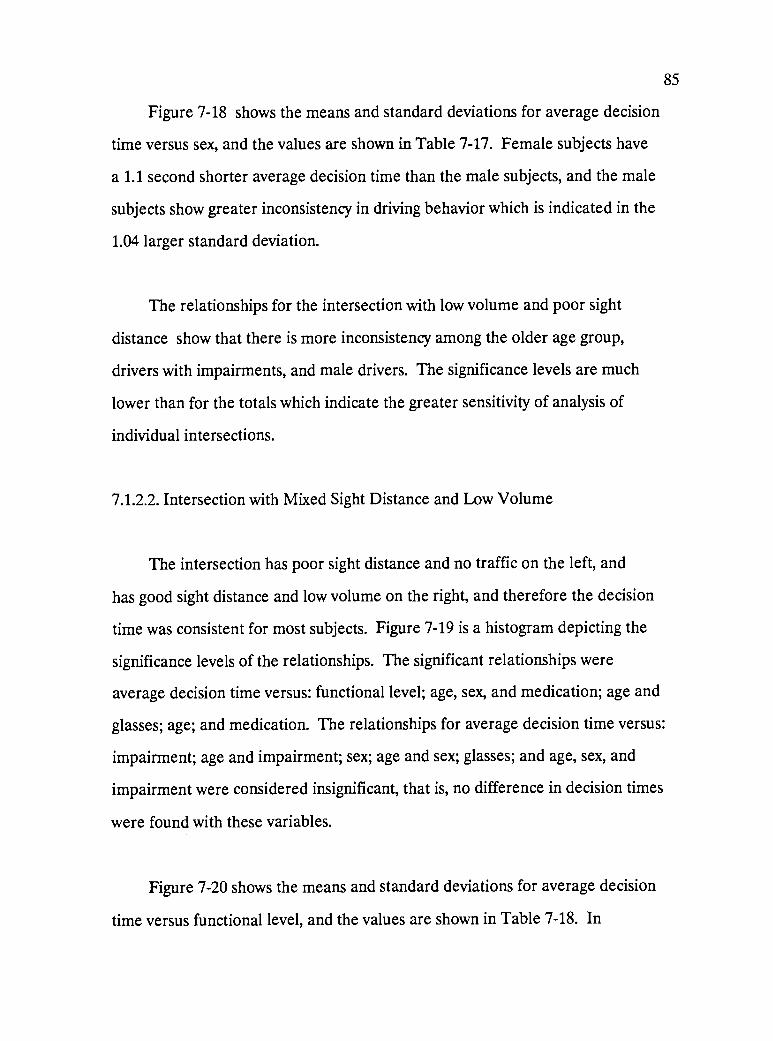
85
Figure 7-18 shows the means and standard deviations for average decision
time versus sex, and the values are shown in Table 7-17. Female subjects have
a 1.1 second shorter average decision time than the male subjects, and the male
subjects show greater inconsistency in driving behavior which is indicated in the
1.04 larger standard deviation.
The relationships for the intersection with low volume and poor sight
distance show that there is more inconsistency among the older age group,
drivers with impairments, and male drivers. The significance levels are much
lower than for the totals which indicate the greater sensitivity of analysis of
individual intersections.
7.1.2.2. Intersection with Mixed Sight Distance and Low Volume
The intersection has poor sight distance and no traffic on the left, and
has good sight distance and low volume on the right, and therefore the decision
time was consistent for most subjects. Figure 7-19 is a histogram depicting the
significance levels of the relationships. The significant relationships were
average decision time versus: functional level; age, sex, and medication; age and
glasses; age; and medication. The relationships for average decision time versus:
impairment; age and impairment; sex; age and sex; glasses; and age, sex, and
impairment were considered insignificant, that is, no difference in decision times
were found with these variables.
Figure 7-20 shows the means and standard deviations for average decision
time versus functional level, and the values are shown in Table 7-18. In

86
AVERAGE DECISION TIME VERSUS SEX
MALE
FEMALE
I
---8 --
--aII I I I
0 5 10 15 20
AVERAGE DECISION TIME
25
MEAN STD DEV
Figure 7-18 Average Decision Time Versus Sex for anIntersection with Poor Sight Distance and Low Volume
TABLE 7-17 AVERAGE DECISION TIME (sec) VERSUS SEX: at an intersectionwith poor sight distance and low volume (p=0.13, C.V.=32,91)
SEX MEAN STD.DEV.
MALE 8.5 3.17
FEMALE 7.4 2.13

87
HISTOGRAM OF SIGNIFICANCE LEVELS FOR INTERSECTIONWITH MIXED SIGHT DISTANCE AND LOW VOLUME
AGE
FUNCTIONAL LEVELMEDICATIONGLASSES
SEX
IMPAIRMENTAGE AND SEX
AGE AND GLASSESAGE AND IMPAIRMENTAGE, SEX, AND MEDICATIONAGE, SEX, AND IMPAIRMENT
A
ad
AlrAr A'F A
/I
0 0 0.2 0.4 0.6 0.8 1 0
SIGNIFICANCE LEVELS
Figure 7-19 Histogram of Significance Levels for an Intersectionwith Mixed Sight Distance and Low Volume

88
AVERAGE DECISION TIME VERSUS FUNCTIONAL LEVEL
FUNCTIONAL LEVEL 1
FUNCTIONAL LEVEL 2
FUNCTIONAL LEVEL 3 -a-FUNCTIONAL LEVEL 4
I I I I I -I
0 5 10 15 20 25
AVERAGE DECISION TIME
MEAN STD DEV
Figure 7-20 Average Decision Time Versus Functional Level for anIntersection with Mixed Sight Distance and Low Volume
TABLE 7-18 AVERAGE DECISION TIME (sec) VERSUS FUNCTIONALLEVEL(I-4): at an intersection with mixed sight distance and lowvolume (p=0.04, C.V.=112.07)
FUNCTIONAL LEVEL MEAN STD.DEV.
1 30-50, UNIMPAIRED 4.4 4.57
2 30-50, IMPAIRED 4.9 4.17
3 60-80, UNIMPAIRED 3.9 2.79
4 60-80, IMPAIRED 10.1 11.13

89
general, average decision time increases with functional level for this
intersection, however functional level 3, age 60-80 and unimpaired, indicates
both a lower average decision time and lower standard deviation. Subjects of
60-80 who are impaired, functional level 4, had a significantly higher average
decision time and standard deviation.
Figure 7-21 shows the means and standard deviations for average decision
time versus age, sex and medication, and the values are shown in Table 7-19.
The inconsistency in volume and sight distance at this intersection generate
some inconsistency in the response of the subjects. The 30-50 year age group
of subjects has a slightly shorter average decision time than the older group.
There was one male subject in the 30-50 age group on medication who took a
long time to make a decision to turn at this intersection. In general, the
subjects not on medication had longer average decision times. The large
inconsistency in behavior at this intersection is reflected in the large standard
deviations, particularly for the 60-80 age males not on medication. The ANOVA
for the relationship of average decision time versus age, sex and medication
shows significant interaction between age and medication (2 percent), and age,
sex and medication (16 percent). There is an increase in inconsistency with age,
and those drivers not on medication.
Figure 7-22 shows the means and standard deviations for average decision
time versus age and glasses, and the values are shown in Table 7-20. The 60-
80 age subjects with glasses have both the longest average decision time and
the largest standard deviation, and this is consistent with the predicted results.
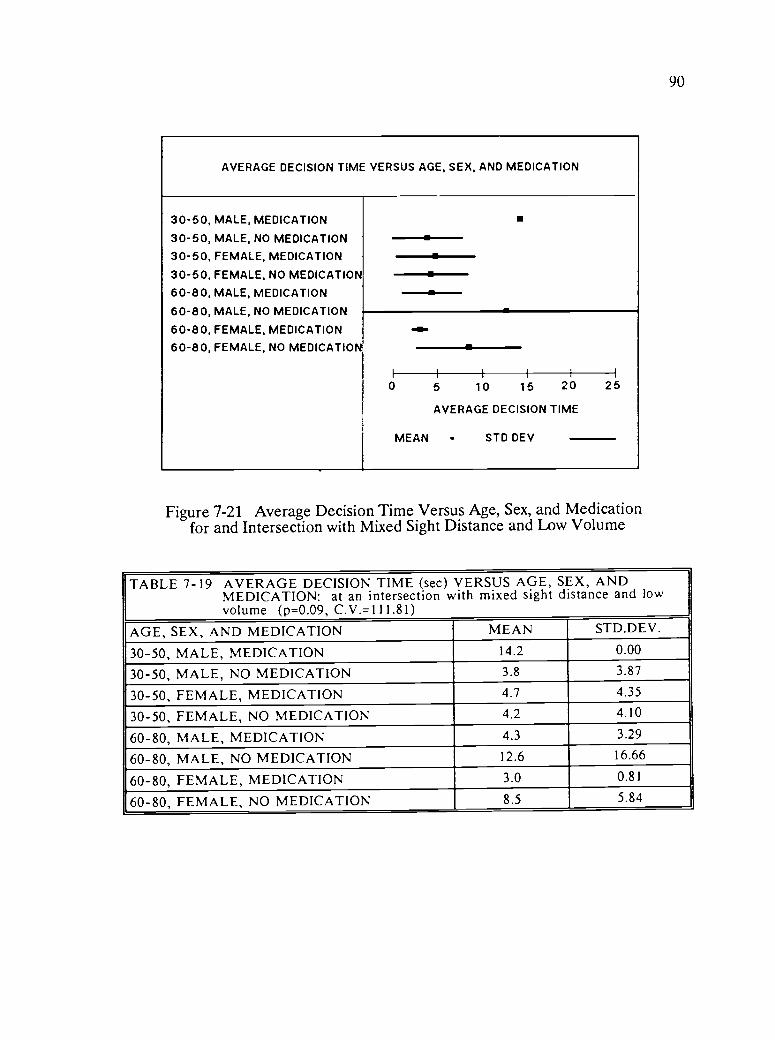
90
AVERAGE DECISION TIME VERSUS AGE, SEX, AND MEDICATION
30-50, MALE, MEDICATION
30-50, MALE, NO MEDICATION
30-50, FEMALE, MEDICATION
30-50, FEMALE, NO MEDICATION
60-80, MALE, MEDICATION
60-80, MALE, NO MEDICATION
60-80, FEMALE, MEDICATION
60-80, FEMALE, NO MEDICATION
--e-,
-a-
II I I I I
0 5 10 15 20
AVERAGE DECISION TIME
MEAN STD DEV
25
Figure 7-21 Average Decision Time Versus Age, Sex, and Medicationfor and Intersection with Mixed Sight Distance and Low Volume
TABLE 7-19 AVERAGE DECISION TIME (sec) VERSUS AGE, SEX, ANDMEDICATION: at an intersection with mixed sight distance and lowvolume (p=0.09, C.V.=111.81)
AGE, SEX, AND MEDICATION MEAN STD.DEV.
30-50, MALE, MEDICATION 14.2 0.00
30-50, MALE, NO MEDICATION 3.8 3.87
30-50, FEMALE, MEDICATION 4.7 4.35
30-50, FEMALE, NO MEDICATION 4.2 4.10
60-80, MALE, MEDICATION 4.3 3.29
60-80, MALE, NO MEDICATION 12.6 16.66
60-80, FEMALE, MEDICATION 3.0 0.81
60-80, FEMALE, NO MEDICATION 8.5 5.84
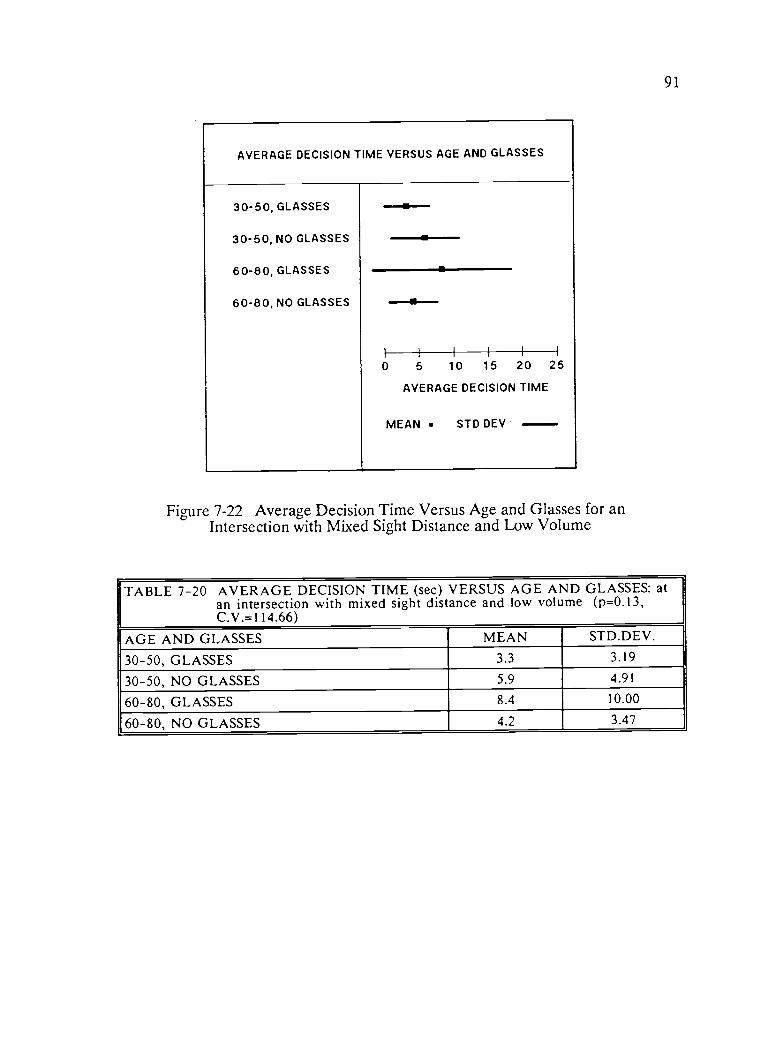
91
AVERAGE DECISION TIME VERSUS AGE AND GLASSES
30-50, GLASSES
30-50, NO GLASSES
60-80, GLASSES
60-80, NO GLASSES
--..--
-s
I I Illi0 5 10 15 20
AVERAGE DECISION TIME
MEAN STD DEV
25
Figure 7-22 Average Decision Time Versus Age and Glasses for anIntersection with Mixed Sight Distance and Low Volume
TABLE 7-20 AVERAGE DECISION TIME (sec) VERSUS AGE AND GLASSES: atan intersection with mixed sight distance and low volume (p=0.13,C.V. =1 14.66)
AGE AND GLASSES MEAN STD.DEV.
30-50, GLASSES 3.3 3.19
30-50, NO GLASSES 5.9 4.91
60-80, GLASSES 8.4 10.00
60-80, NO GLASSES 4.2 3.47
92
The most inconsistent result is the 30-50 age subjects without glasses who have
both a longer average decision time and a larger standard deviation than the 60-
80 age subjects without glasses. The interaction between age and glasses is
significant at the 5 percent level.
Figure 7-23 shows the means and standard deviations for average decision
time versus age, and the values are shown in Table 7-21. Age effects are
clearly evident as shown in the 2.4 second increase in the means and the 4.24
increase in standard deviation. These results are consistent with both the
predicted results and those seen in the literature. This intersection would be
expected to have larger decision times and variations in decision time for the
older driver due to the confusion caused by inconsistent volume and sight
distance conditions.
Figure 7-24 shows the means and standard deviations for average decision
time versus medication, and the values are shown in Table 7-22. These results
are inconsistent with the predicted results. The subjects on medication have
shorter average decision time and smaller standard deviations.
7.1.2.3. Intersection with Good Sight Distance and High Volume
The intersection had high traffic volume on the right and many subjects
decided not make a turn. Unlike most other intersections the only significant
relationship was decision time versus sex at the 5 percent level. Figure 7-25 is a
histogram depicting the significance levels of the relationships.

93
AVERAGE DECISION TIME VERSUS AGE
30-50 YEARS
60-80 YEARS
I
0 5 10 15 20
AVERAGE DECISION TIME
MEAN STD DEV
25
Figure 7-23 Average Decision Time Versus Age for an Intersectionwith Mixed Sight Distance and Low Volume
TABLE 7-21 AVERAGE DECISION TIME (sec) VERSUS AGE: at an intersectionwith mixed sight distance and low volume (p=0.18, C.V.=116.46)
AGE MEAN STD.DEV.
30-50 4.6 4.32
60-80 7.0 8.56

94
AVERAGE DECISION TIME VERSUS MEDICATION
MEDICATION
NO MEDICATION
II I II I
0 5 10 15 20
AVERAGE DECISION TIME
25
MEAN STD DEV
Figure 7-24 Average Decision Time Versus Medication for an Intersectionwith Mixed Sight Distance and Low Volume
TABLE 7-22 AVERAGE DECISION TIME (sec) VERSUS MEDICATION: at anintersection with mixed sight distance and low volume (p=0.24,C.V.=116.90)
MEDICATION MEAN STD.DEV.
MEDICATION 4.6 3.88
NO MEDICATION 6.7 8.28

95
HISTOGRAM OF SIGNIFICANCE LEVELS FOR INTERSECTIONWITH GOOD SIGHT DISTANCE AND HIGH VOLUME
AGEFUNCTIONAL LEVELMEDICATIONGLASSESSEXIMPAIRMENT
0.0 0.2 0.4 0.6 0.8 1 0
SIGNIFICANCE LEVELS
Figure 7-25 Histogram of Significance Levels for Intersectionwith Good Sight Distance and High Volume

96
Figure 7-26 shows the means and standard deviations for average decision
time versus sex of the subject, and the values are shown in Table 7-23. The
average decision time for female subjects was 3.6 seconds less than for male
subjects, and male subjects were more inconsistent as is reflected in the 0.93
larger standard deviation. The high volume conditions at this intersection had a
greater impact on decision time than either the sight distance conditions or the
characteristics of the drivers.
7.1.2.4. Intersection with Good Sight Distance and Low Volume
The intersection that had low volume and good sight distance was also
done consistently by most subjects. Figure 7-27 is a histogram depicting the
significance levels of the relationships. The relationships of significance are
decision time versus age; age and glasses; and glasses at the 11, 15, and 25
percent levels of significance. The relationships which are insignificant are
average decision time versus: functional level; age and sex; age and impairment;
medication; age, sex, and medication; sex; age, sex, and impairment; and
impairment.
Figure 7-28 shows the means and standard deviations for average decision
time versus age, and the values are shown in Table 7-24. The 60-80 year age
group has an average decision time of 1.5 seconds longer than the 30-50 year
age group. The older age group also has a 0.23 second larger standard
deviation. These results are consistent with the hypothesis and supported in
the literature. The low volume with good sight distance at this intersection
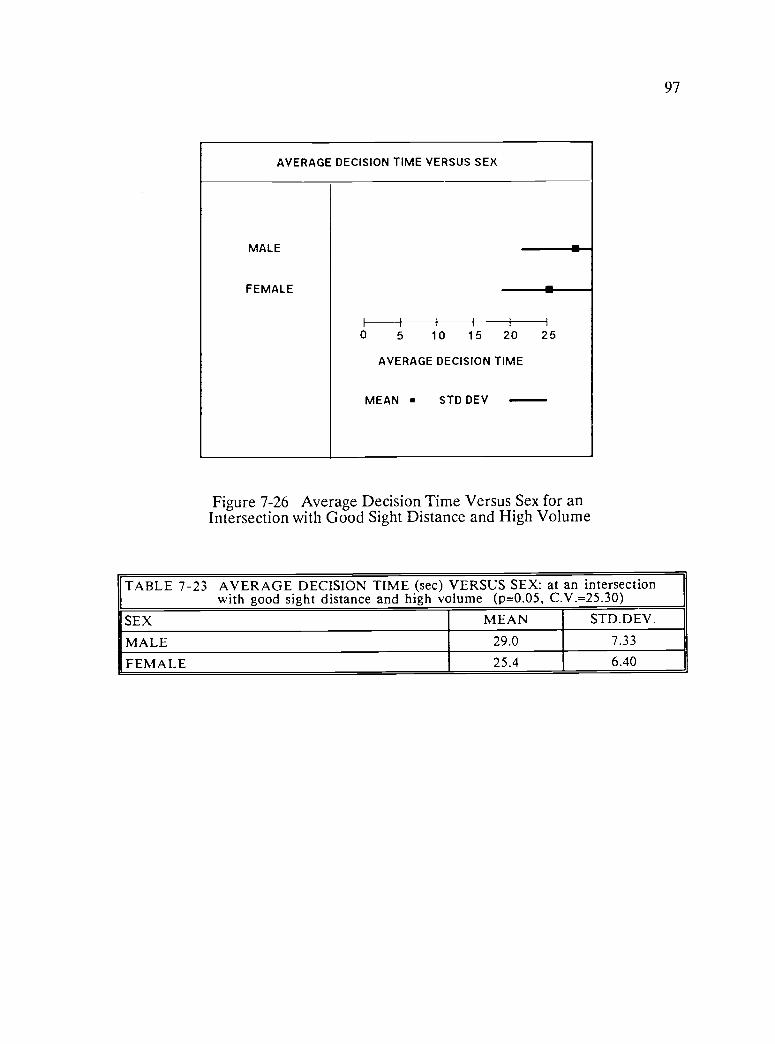
97
AVERAGE DECISION TIME VERSUS SEX
MALE
FEMALE
0 5 10 15 20 25
AVERAGE DECISION TIME
MEAN STD DEV
Figure 7-26 Average Decision Time Versus Sex for anIntersection with Good Sight Distance and High Volume
TABLE 7-23 AVERAGE DECISION TIME (sec) VERSUS SEX: at an intersectionwith good sight distance and high volume (p=0.05, C.V.=25.30)
SEX MEAN STD.DEV.
MALE 29.0 7.33
FEMALE 25.4 6.40

98
HISTOGRAM OF SIGNIFICANCE LEVELS FOR INTERSECTIONWITH GOOD SIGHT DISTANCE AND LOW VOLUME
AGEFUNCTIONAL LEVELMEDICATIONGLASSESSEXIMPAIRMENTAGE AND SEXAGE AND GLASSESAGE AND IMPAIRMENTAGE, SEX, AND MEDICATIONAGE, SEX, AND IMPAIRMENT
F
AreIAire
r A r e /OMI t
0 0 0.2 0.4 0.6 0.8 1.0
SIGNIFICANCE LEVELS
Figure 7-27 Histogram of Significance Levels for Intersectionwith Good Sight Distance and Low Volume
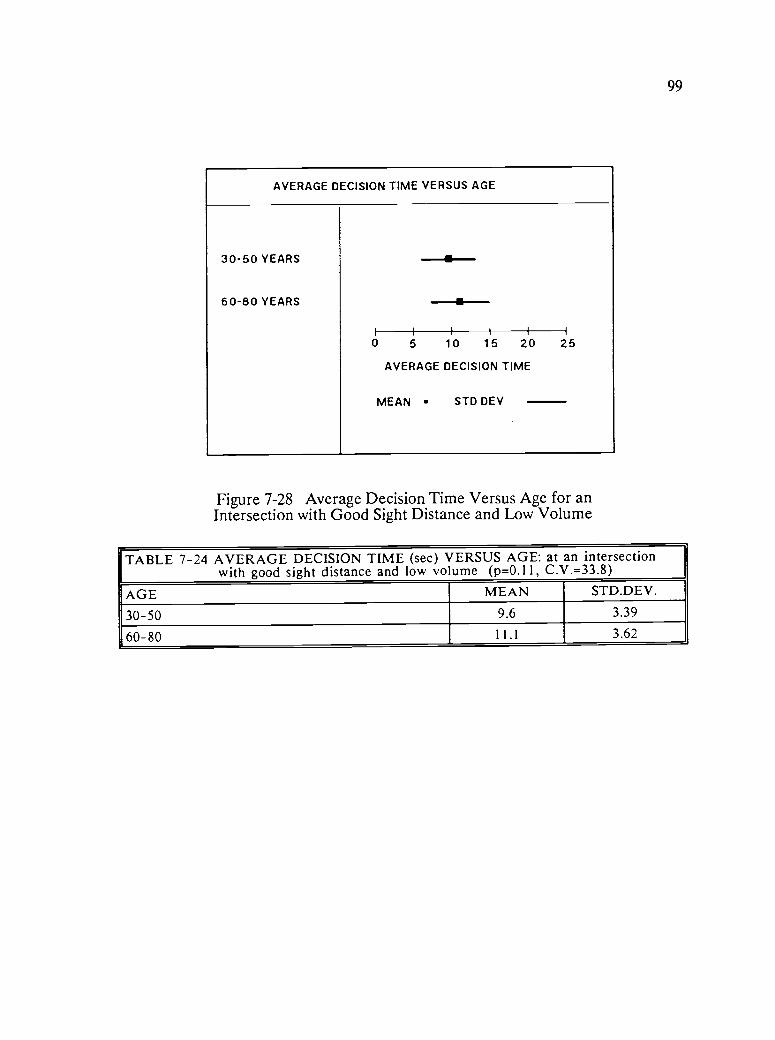
99
AVERAGE DECISION TIME VERSUS AGE
30-50 YEARS
60-80 YEARS
M-----ii
I
0 5 10 15 20
AVERAGE DECISION TIME
MEAN STD DEV
25
Figure 7-28 Average Decision Time Versus Age for anIntersection with Good Sight Distance and Low Volume
TABLE 7-24 AVERAGE DECISION TIME (sec) VERSUS AGE: at an intersectionwith good sight distance and low volume (p=0.11, C.V.=33.8)
AGE MEAN STD.DEV.
30-50 9.6 3.39
60-80 11.1 3.62

100
results in older drivers taking longer to determine that it is safe to enter the
intersection.
Figure 7-29 shows the means and standard deviations for average decision
time versus age and glasses, and the values are shown in Table 7-25. The
strongest result is both the large and small standard deviations of the 60-80
year age group. The 60-80 age group without glasses exhibits both the longest
average decision time and the largest standard deviation. The interaction of age
and glasses is significant at the 16 percent level. The good sight distance makes
it possible for younger drivers without glasses to determine faster that it is safe
to enter the intersection.
Figure 7-30 shows the means and standard deviations for average decision
time versus glasses, and the values are shown in Table 7-26. If the effect of
age is not considered, the effect of glasses is seen to increase decision time.
Subjects with glasses have a 1.1 second longer average decision time but a 1.90
second shorter standard deviation which indicates more consistent driving
behavior.
The individual intersection results are consistent with the Totals results.
They support the hypothesis that older drivers and those with physical
limitations take longer to make a decision at intersections. The results are also
consistent with the reviewed literature.
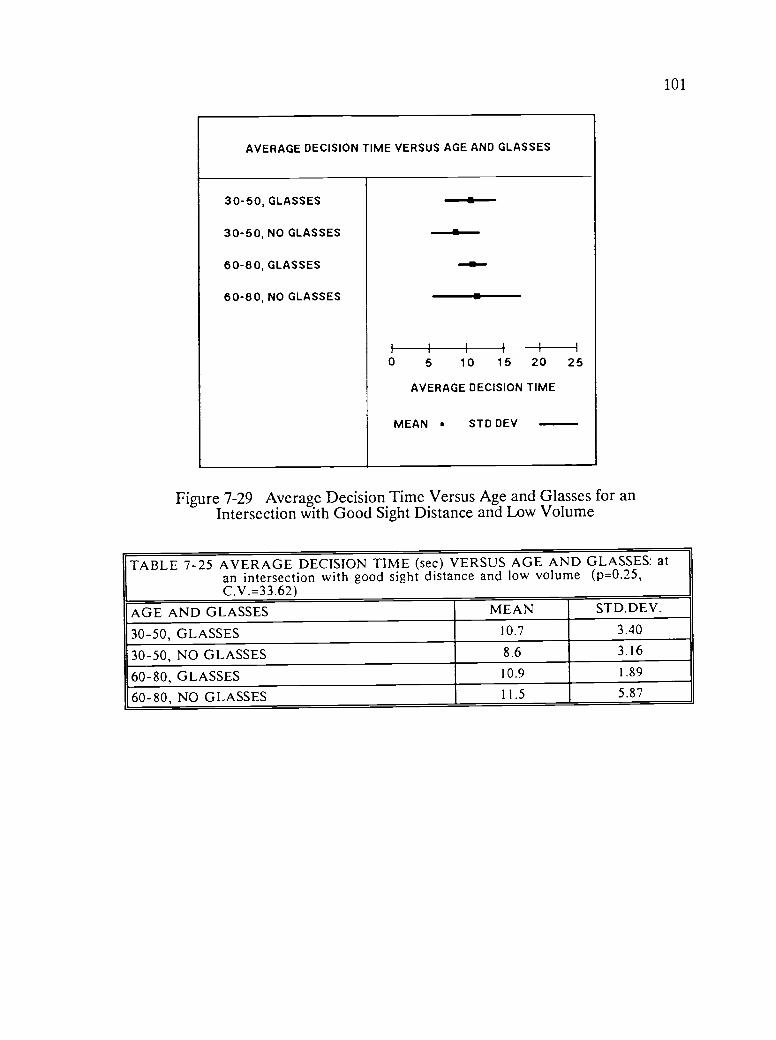
101
AVERAGE DECISION TIME VERSUS AGE AND GLASSES
30-50, GLASSES --.*-.30-50, NO GLASSES --al.60-80, GLASSES as-
60-80, NO GLASSES
I i I I I i
0 5 10 15 20 25
AVERAGE DECISION TIME
MEAN STD DEV
Figure 7-29 Average Decision Time Versus Age and Glasses for anIntersection with Good Sight Distance and Low Volume
TABLE 7-25 AVERAGE DECISION TIME (sec) VERSUS AGE AND GLASSES: atan intersection with good sight distance and low volume (p=0.25,C. V.= 33.62)
AGE AND GLASSES MEAN STD.DEV.
30-50, GLASSES 10.7 3.40
30-50, NO GLASSES 8.6 3.16
60-80, GLASSES 10.9 1.89
60-80, NO GLASSES 11.5 5.87

102
AVERAGE DECISION TIME VERSUS GLASSES
GLASSES
NO GLASSES
Is
0 5 10 15 20
AVERAGE DECISION TIME
STD
I
25
MEAN DEV
Figure 7-30 Average Decision Time Versus Glasses for an Intersectionwith Good Sight Distance and Low Volume
TABLE 7-26 AVERAGE DECISION TIME (sec) VERSUS GLASSES: at anintersection with good sight distance and low volume (p=0.15,C.V.=34.20)
GLASSES MEAN STD.DEV.
GLASSES 10.8 2.61
NO GLASSES 9.7 4.51

103
7.1.3. Intersection Geometrics
All the intersections were rated according to sight distance and volume.
The relationships of decision time versus volume, sight distance, and volume and
sight distance were examined. The relationship of decision time versus volume
was most significant at the 7 percent level.
Figure 7-31 shows the means and standard deviations for average decision
time versus volume, and the values are shown in Table 7-27. Intersections with
high traffic volumes have average decision times that are 6.6 seconds longer
than intersections with low volume. The large standard deviation is due to the
greater inconsistency in decision times associated with high volume
intersections.
Figure 7-32 shows the means and standard deviations for average decision
time versus sight distance, and the values are shown in Table 7-28. This
relationship is significant at the 11 percent level. Studying the means for
decision time versus sight distance, there is very little difference between poor
(9.54) and AASHTO sight distance criteria (9.50) but good sight distance has a
mean of (17.61).
Figure 7-33 shows the means and standard deviations for average decision
time versus volume and sight distance and the values are shown in Table 7-29.
This relationship is significant at the 8 percent level. In general, the
intersections with a good sight distance also had very high volumes and
therefore had long time intervals. However, the intersections with poor or

104
AVERAGE DECISION TIME VERSUS VOLUME
LOW VOLUME
HIGH VOLUME
I-
0 5 10 15 20
AVERAGE DECISION TIME
MEAN STD DEV
25
Figure 7-31 Average Decision Time Versus Volume
TABLE 7-27 AVERAGE DECISION TIME (sec) VERSUS VOLUME (p=0.07,C.V.=58.40)
VOLUME MEAN STD.DEV.
LOW VOLUME 8.9 4.89
HIGH VOLUME 15.5 8.82

105
AVERAGE DECISION TIME VERSUS SIGHT DISTANCE
POOR SIGHT DIST.
CRITERIA SIGHT DIST.
GOOD SIGHT DIST. IIIIi I
0 5 10 15 20 25
AVERAGE DECISION TIME
MEAN STD DEV
Figure 7-32 Average Decision Time Versus Sight Distance
TABLE 7-28 AVERAGE DECISION TIME (sec) VERSUS SIGHT DISTANCE(p=0.11, C.V.=57.87)
SIGHT DISTANCE MEAN STD.DEV.
POOR SIGHT DISTANCE 9.5 7.8
AASHTO CRITERIA SIGHT DISTANCE 9.5 5.59
GOOD SIGHT DISTANCE 17.6 7.60
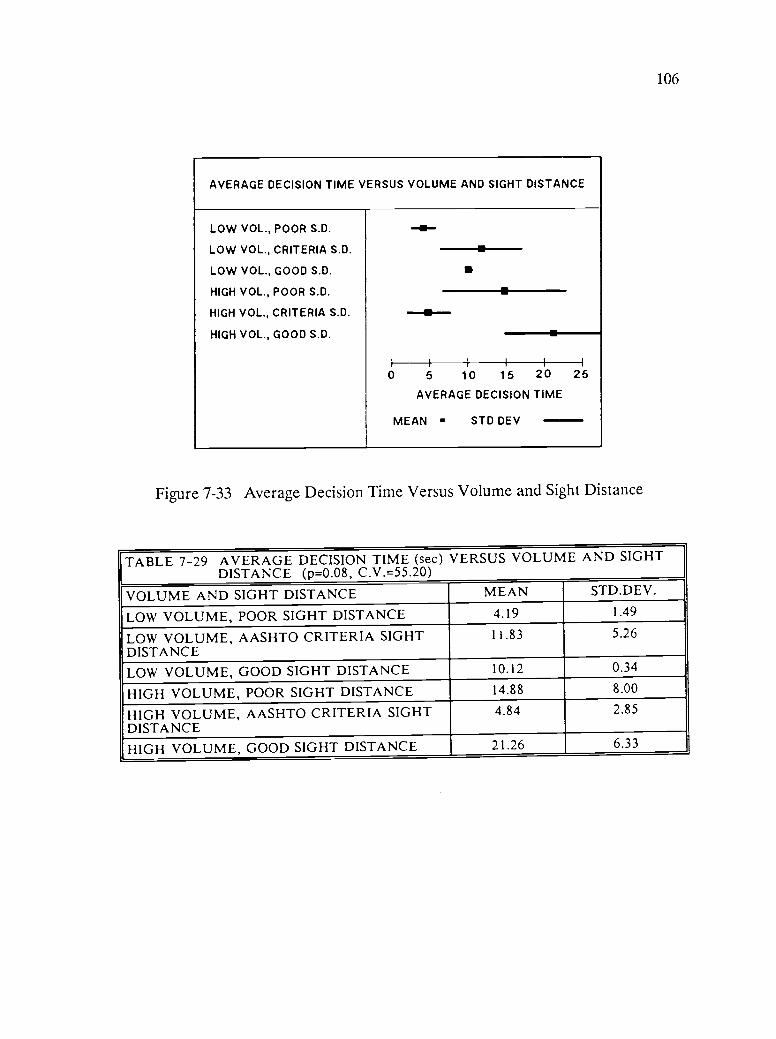
106
AVERAGE DECISION TIME VERSUS VOLUME AND SIGHT DISTANCE
LOW VOL., POOR S.D.
LOW VOL., CRITERIA S.D.
LOW VOL., GOOD S.D.
HIGH VOL., POOR S.D.
HIGH VOL., CRITERIA S.D.
HIGH VOL., GOOD S.D.
a
--aI II I I
0 5 10 15 20
AVERAGE DECISION TIME
I
25
MEAN STD DEV
Figure 7-33 Average Decision Time Versus Volume and Sight Distance
TABLE 7-29 AVERAGE DECISION TIME (sec) VERSUS VOLUME AND SIGHTDISTANCE (p=0.08, C.V.=55.20)
VOLUME AND SIGHT DISTANCE MEAN STD.DEV.
LOW VOLUME, POOR SIGHT DISTANCE 4.19 1.49
LOW VOLUME, AASHTO CRITERIA SIGHTDISTANCE
11.83 5.26
LOW VOLUME, GOOD SIGHT DISTANCE 10.12 0.34
HIGH VOLUME, POOR SIGHT DISTANCE 14.88 8.00
HIGH VOLUME, AASHTO CRITERIA SIGHTDISTANCE
4.84 2.85
HIGH VOLUME, GOOD SIGHT DISTANCE 21.26 6.33

107
AASHTO criteria sight distance had low traffic volumes in the segments of
video film. The relationship for decision time versus volume and sight distance
was most strongly influenced by volume considerations.
The quality and width of field of the video tapes masked many of the
sight distance effects. Many subjects were questioned about the sight distance
at intersections with a sight distance of 150 feet or less. These subjects were
unable to identify the sight distance as being significantly worse than other
intersections where the sight distance met the AASHTO criteria distance, for
example 550 feet. In actual driving situations, sight distance has a tremendous
impact on intersection safety. This aspect of intersection design should not be
overlooked. In the experimental situation the narrow focal width and
foreshortening of the video cameras severely limited the impact of sight
distance problems. These results clearly show the effect of traffic volume on
gap acceptance, and intersection decision time (Blumenfeld et al, 1979).
7.1.4. Regression Analysis
Examination of the regression results in Appendix B shows the very high
dispersion of data, with r2 values ranging from (0.002 to 0.533). The r value is
the correlation coefficient or coefficient of determination which is a measure of
the degree of fit of the regression equation. This the percent of the total
variation in the data that is explained by the regression. A good regression
should have r2 values of (0.8-0.99). Table 7-30 show the regression relationships
for the intersection totals.

108
TABLE 7-30 REGRESSION ANALYSIS FOR TOTAL SUBJECTS ANDINTERSECTIONS
SLOPE INTERCEPT R2
AVERAGE DECISIONTIME
0.564 AVERAGE HEADTURNS
9.150 0.138
AVERAGE DECISIONTIME
0.041 AGE 9.701 0.025

109
On the totals, the relationship between average decision time and the
average number of head turns has a positive slope of 0.564 and r2 of 0.138. The
relationship of average decision time versus age is relatively flat with a slope of
only 0.041, and a correspondingly low r2 of 0.025. These particular
relationships hold for the individual intersection results as well.
Relationships of range of motion versus maximum angle for right and left
respectively for the impaired group of subjects on the four intersections were
also studied. Tables 7-31 to 7-34 contains the regression equations for the four
intersection. The results are consistent across all intersections. Of the four
intersections, the relationship between average decision time and the average
number of head turns has a positive slope ranging from 0.328 to 2.230 and r2
values ranging from 0.054 to 0.263. Of the four intersections, the relationship of
average decision time versus age is relatively flat with a slope ranging from
0.048 to 0.062, and correspondingly low r2 values ranging from 0.012 to 0.125.
The right range of motion versus maximum right angle have positive slopes
ranging from 0.119 to 0.203 and r2 values of 0.032 to 0.107. The left range of
motion versus maximum left angle have almost flat negative slopes ranging from
-0.030 to -0.176, and correspondingly low r2 values of 0.002 to 0.027. The low
r2 values and slopes indicate the weak relationships for average decision time
versus age and range of motion versus maximum right and left angles. A
stronger relationship exists between decision time and head turns.

110
TABLE 7-31 REGRESSION ANALYSIS FOR INTERSECTION: with Poor SightDistance and Low Volume
SLOPE INTERCEPT R2
AVERAGE DECISIONTIME
0.628 AVERAGE HEADTURNS
5.569 0.263
AVERAGE DECISIONTIME
0.062 AGE 4.555 0.125
RIGHT R.O.M.* 0.147 MAX. RIGHTANGLE
38.865 0.039
LEFT R.O.M.* -0.091 MAX. LEFTANGLE
43.400 0.008
R.O.M.= Range Of Movement impaired subjects only
TABLE 7-32 REGRESSION ANALYSIS FOR INTERSECTION: with Mixed SightDistance and Low Volume
SLOPE INTERCEPT R2
AVERAGE DECISIONTIME
2.230 AVERAGE HEADTURNS
-0.495 0.533
AVERAGE DECISIONTIME
0.059 AGE 2.606 0.017
RIGHT R.O.M.* 0.203 MAX. RIGHTANGLE
37.869 0.107
LEFT R.O.M.* -0.176 MAX. LEFTANGLE
45.096 0.027
* R.O.M.= Range Of Movement impaired subjects only

111
TABLE 7-33 REGRESSION ANALYSIS FOR INTERSECTION: with Good SightDistance and High Volume
SLOPE INTERCEPT R2
AVERAGE DECISIONTIME
0.328 AVERAGE HEADTURNS
23.866 0.054
AVERAGE DECISIONTIME
0.052 AGE 24.028 0.012
RIGHT R.O.M.*I
0.119 MAX. RIGHTANGLE
39.238 0.032
LEFT R.O.M.* -0.030 MAX. LEFTANGLE
41.392 0.002
* R.O.M.= Range Of Movement impaired subjects only
TABLE 7-34 REGRESSION ANALYSIS FOR INTERSECTION: with Good SightDistance and Low Volume
SLOPE INTERCEPT R2
AVERAGE DECISIONTIME
0.459 AVERAGE HEADTURNS
8.294 0.085
AVERAGE DECISIONTIME
0.048 AGE 7.782 0.041
RIGHT R.O.M.* 0.164 MAX. RIGHTANGLE
38.651 0.041
LEFT R.O.M.* -0.078 MAX. LEFTANGLE
42.287 0.006
* R.O.M.= Range Of Movement impaired subjects only

112
CHAPTER 8
DISCUSSION OF RESULTS
8.0 INTRODUCTION
The discussion of results identifies the most significant results and relates
them to the literature and results from other sources. The experimental
observations, which are included as part of the discussion of results, contain
qualitative information that was gathered during conversations with the subjects
as well as observations that were made during the data collection phase. The
observations give further insight into the problems of drivers with diminished
capacities at T-intersections.
8.1 TOTALS SUMMARY
The totals summary is the totals for all intersections and all subjects. A
smaller decision time to turn left indicates that the subjects' driving
performance is better because the driver has more of the "gap" time to
accelerate to speed and thus maintain more uniform speed of the traffic stream.
The most significant relationship is average decision time versus age, which is
significant at the 4 percent level. The results show that the older drivers take
longer to make a decision and are more inconsistent in their decision making
than younger drivers. The larger standard deviation is a measure of the
inconsistency in driver behavior. Both the longer decision time and
113
inconsistency of the older driver support the hypothesis of this research that
reaction times are influenced by age and are also suggested in the literature and
a review of highway accident data (Brainin, Naughton, Breedlove, 1977; Yanik,
1986; and U.S. DOT Highway Statistics, 1980).
The relationship of average decision time versus functional level is
significant at the 8 percent level. The definition of functional level is a
combination of age and impairment level:
(a) functional level 1 = 30-50 years and no impairment,
(b) functional level 2 = 30-50 years and impairment,
(c) functional level 3 = 60-80 years and no impairment,
(d) functional level 4 = 60-80 years and impairment.
Impairment is defined by a combined static range of movement of the head
and visual field of less that 285 degrees, whereas no impairment ranges from
285 to 360 degrees. There is no definitive definition of impairment level in the
literature, therefore for this study, the choice of 284 degrees was arbitrarily
based on the functional requirements for driving.
There is an increase in the mean decision time with functional level. The
increase in standard deviation with impairment can be explained by the large
diversity of severity of impairment and the less consistent driving behavior in
this subject group. It is interesting to note that average decision time versus
impairment is not significant (p = 0.85). The implication of these results is that
the younger impaired drivers are able to compensate in their driving behavior for

114
their impairment, but the older drivers either impaired or unimpaired, are unable
to make the necessary compensations.
There was no significant difference in decision time due to subject's sex,
however, the relationship of average decision time versus age and sex was
significant at the 15 percent level. In this study, younger males have a longer
decision time than younger females, but older males have a shorter decision time
than older females. The standard deviations increase with age, and young males
show the most consistent behavior, while older males are the most inconsistent.
The longer decision time taken by the older females is supported in the
literature which suggests that the current generation of older female drivers lack
the experience of their male counterparts, but the younger generation of female
and male drivers are more equally matched in terms of driving experience
(Grubb, 1986; Planck and Fowler, 1971).
8.2 INTERSECTION SUMMARY
Four intersections are examined separately since these intersections
represent a cross section of difficulty, sight distance and traffic volume:
(i) Poor Sight Distance and Low Volume,
(ii) Mixed Sight Distance and Low Volume,
(iii) Good Sight Distance and High Volume,
(iv) Good Sight Distance and Low Volume.
Many of the other intersections have incomplete data sets and therefore
have not been selected for the in-depth analysis. Intersection (i) has poor sight
115
distance on the left and low traffic volume. Intersection (ii) has poor sight
distance and no traffic on the left, and has good sight distance and low volume
on the right. Intersection (iii) has good sight distance in both directions and
high traffic volume. Intersection (iv) has good sight distance in both directions
and low traffic volume.
8.2.1 Intersection with Poor Sight Distance and Low Volume
The average decision time versus functional level is significant at a zero
percent level. Average decision time increases with increased functional level,
that is increased age and impairment. The average decision time versus age is
significant at the two percent level. It is clearly seen that age effects dominate
and through the relationships of average decision time versus age and glasses,
age and impairment, age, sex and impairment, and age and sex, which are all
significant. These results are consistent with the totals summary and indicate
the strong influence of age effects. The relationships for this intersection
indicate that traffic volume has more of an impact than sight distance. This is
due to the simulation and the deficiencies of the video cameras. In summary,
the relationships for this intersection with poor sight distance and low volume
show that there is more inconsistency among the older age group, the drivers
with impairments, and male drivers. The significance levels are much lower than
for the totals which indicates the greater sensitivity of analysis of individual
intersections.

116
8.2.2. Intersection with Mixed Sight Distance and Low Volume
The results for this intersection also show a strong relation between
average decision time and functional level which is significant at the 4 percent
level. The influence of age effects are reflected in the relationship of average
decision time versus age, sex, and medication. In general, the subjects not on
medication had longer average decision times. The large inconsistency in
behavior at this intersection is reflected in the large standard deviations,
particularly for the 60-80 age males not on medication. The relationship of
average decision time versus age, sex and medication shows significant
interaction between age and medication (2 percent), and age, sex and medication
(16 percent). There is an increase in inconsistency with age, and those drivers
not on medication. Similarly, age effects are seen in the relationship of average
decision time versus age and glasses, and age. Traffic volume had more of an
influence on decision time than sight distance. This intersection is near the
crest of a hill on the right and roadside obstacles such as utility poles obstruct
the view on the left.
8.2.3. Intersection with Good Sight Distance and High Volume
This particular intersection had high traffic volume and as a result most
of the subjects did not make a left turn which was an appropriate decision. The
only relationship which was significant was average decision time versus
subject's sex. The average decision time for females was less than males who
were more inconsistent. Many of the older female drivers made inappropriate
turning decisions at this intersection. The results at this intersection indicate
117
that with good sight distance, i.e. good design, most people behave in the same
manner at high volume intersections. This more consistent behavior supports the
need for good design.
8.2.4. Intersection with Good Sight Distance and Low Volume
The relationships for this intersection show the influence of age effects.
At intersections with good sight distance and low volume, younger drivers are
able to determine when it is safe to proceed faster than older drivers. The
younger drivers in general had faster and more agile head movements but often
they were less cautious.
8.3 INTERSECTION GEOMETRICS
The intersection results are more sensitive than the totals results and
show the strong influence of age effects and impairment. The relationships of
average decision time and intersection volume and sight distance show that
volume effects dominate. In general, the intersections with good sight distance
also had very high volumes and therefore had long time intervals. However, the
intersections with poor or standard sight distance had low traffic volumes in the
segments of video film. The relationship for decision time versus volume and
sight distance was most strongly influenced by volume considerations.
The quality and width of field of the video tapes masked many of the
sight distance effects. Many subjects were questioned about the sight distance
at intersections with sight distance of 150 feet or less. These subjects were

118
unable to identify the sight distance as being significantly worse than other
intersections where the sight distance was at standard, for example 550 feet. In
actual driving situations, sight distance has a tremendous impact on intersection
safety, and this aspect of intersection design should not be overlooked. In the
experimental situation the narrow focal width and foreshortening of the video
cameras severely limited the impact of sight distance problems. These results
clearly show the effect of traffic volume on gap acceptance, and intersection
decision time (Blumenfeld et al, 1979)
8.4. REGRESSION ANALYSIS
The regression analysis of average decision time versus head turns, and
age indicates very weak relationships and low correlations. The sample size may
have been a contributing factor, although the sample size was considered large
for a human factors study. These results show that the number of head turns
and the length of time a subject takes to decide are not strongly related. The
relationships of average decision time versus age is poorly related. This is due
to the dispersion of the data, however the analysis of variance on the grouped
data shows that the age effects are significant. The relationships relating range
of motion and maximum angle are also poorly correlated.
8.5 EXPERIMENTAL OBSERVATIONS
There were plenty of opportunities during the data collection phase for
interaction and discussion with the test subjects. Many of the older subjects
(60-80 age group) were married couples who came to be tested together. In

119
general the husband did the majority of the driving when the couple travelled
together and particularly on long trips. The wives usually did the driving on
short trips and when they were not accompanied by their husbands. This
observation is supported by the significant relationships of average decision
time versus age and sex.
There were several couples where the husband's range of movement of the
neck was severely restricted, and his driving capabilities were severely impaired.
These couples were questioned about vehicle modifications, and driving behavior
to compensate for their restricted head motion. The responses ranged from," my
wife always looks to see if there are any cars coming", to " I only drive alone
when I know I only have to use my mirrors and I do not need to turn my head",
i.e. they are driving over familiar routes where they do not expect to have to
turn their heads.
Several of the male subjects in the (60-80) age group had restricted range
of movement of the neck that were due to whip lash injuries resulting from rear
end collisions. There were several other common factors among this group of
male subjects;
(a) they had been involved in one or more rear end collisions, "that had
not been their fault!",
(b) their driving on the simulator was erratic and impetuous,
(c) they tended to make hasty and incorrect judgments, especially on gap
lengths,
(d) in general they were divorcees and participated in the "singles" scene.

120
These subject's driving behavior on the simulator is clearly related to their
accident involvement.
Many of the older subjects had difficulty judging the gap lengths, or when
it was safe to proceed. The older drivers, in particular, made many more
judgment errors on the simulator than the younger drivers.
Most of the older drivers would avoid driving in adverse weather
conditions such as snow and ice. This was reflected in the large number of
subjects whose test time had to be rescheduled due to the weather. These
drivers also preferred late morning or early afternoon appointments in order to
avoid the high traffic volumes at rush hour, or nighttime driving. Nearly all the
older subjects mentioned that they would avoid nighttime driving as much as
possible. This is consistent with the literature (Sivak, and Olson, 1982; Yanik
1986).
There are several very bad intersections near to the Turner Fairbank
Highway Research Center, which prompted many of the subjects to comment on
intersection design in general. Several of the older subjects mentioned that they
had problems with skewed intersections, which are intersections that are not at
90 degrees, because they were forced to turn their heads and look over their
shoulders which was painful or not possible. Some of these subjects mentioned
that they would drive out of their way to avoid skewed intersections because
they could not turn their head enough to judge gap length and approaching
vehicle speed. These subjects were asked if they had any problems with merging
on freeways and highways. The most frequent response was that they could

121
always look ahead, and use their rear view mirrors or side mirrors when they
were in the merge lane. It has been observed that the skewed intersection
problem is accentuated due to the vehicle being stopped and the need for greater
gap length in order to accelerate to speed. Often skewed intersections are
complicated by poor sight distance conditions associated with the terrain or
foliage.
Subjects from both age groups mentioned that they often felt that they
had problems with gap length judgement and sight distance due to obstructions
such as utility poles, street signs or foliage. These comments are consistent
with the literature (Blumenfeld and Weiss, 1979).

122
CHAPTER 9
CONCLUSIONS and RECOMMENDATIONS
9.0 CONCLUSIONS
In general, older impaired drivers require longer to perceive and react to
traffic conditions at T-intersections. The major specific conclusions of the study
are:
1. Older drivers take longer to decide to make left turns at T-intersections
and their driving behavior is much more inconsistent than younger drivers.
2. The relationship of decision time and functional level, which is a
combination of age and impairment, shows that younger drivers with
impairments are able to compensate in their driving behavior for their
impairments. Older drivers, either with or without impairments, are not
able to compensate in their driving behavior.
3. Younger male and female drivers are more evenly matched in their driving
behavior, however there are differences in older male and female drivers
which is most likely due to driving exposure and experience.
4. The effects of age overshadow the effects of glasses on decision time, but
older drivers with glasses take longer to decide to make left turns at T-
intersections.
123
5. Skewed intersections which require drivers to look over their shoulders to
make a judgment of gap length cause the most difficulty for drivers with
neck limitations.
6. Traffic volume has more of an effect on decision time than does sight
distance, although subjects mentioned that a lack of sufficient sight
distance is a major problem in judging gap length.
9.0.1 Implications of the Conclusions
The major conclusion of the study is that older drivers require longer time
to perceive and react to traffic conditions at T-intersections. There are two
main implications of this conclusion on traffic safety.
1. Older drivers need to change their driving behavior to account for the
changes in their reaction time. Special driving education courses exist to
help mature drivers learn more about their own driving needs as well as to
account for changes in traffic and roadway design. Better incentives for
mature driver education such as lower insurance rates and easier license
renewal procedures would encourage more older drivers to participate in
driver improvement programs.
2. Traffic engineers need to account for drivers with diminished capacities in
the design of intersections and roadways. The perception reaction time
factor in the sight distance calculation should be increased, particularly at
complex intersections. Other factors such as increased legibility of signs
and visibility of pavement markings should also be considered.

124
9.1 RECOMMENDATIONS
The results of the study have shown that there is an increase in average
decision time with age, and also with age and impairment level. These findings
are based on a laboratory study, however further studies both in the laboratory
and in the field are required to validate the results. The experimental
observations indicated that there is a significant problem that requires further
study associated with skewed intersections and drivers with limited neck
movement. Further study is required to determine if there is any significant
relationship between medication and average decision time, particularly for
medications which are known to affect reaction time such as allergy, beta
blockers and seizure medication.
9.1.1 Validation Studies
9.1.1.1 Laboratory studies
There were limitations associated with the laboratory study which could
have had an effect on the outcome of the results. Chapter 6 Experimental
Procedure, discussed many of the problems associated with the equipment and
the experimental technique. Modifications of the equipment and techniques are
required in future laboratory studies. These studies should incorporate the
following changes in equipment and experimental techniques:
1. A wider field of view of the intersection is required. This can be
accomplished by either using cameras with wider lens angles or more

125
cameras. In any event, all cameras should function exactly the same and
have the same speeds for their internal mechanisms.
2. Intersection filming should permit more flexibility in the degrees of
freedom to accommodate variations in terrain and intersection geometry,
such as those which are skewed. For example, the cameras should not be
constrained to a horizontal platform and a straight ahead orientation.
Protection should also be provided for the vehicle when it is filming the
intersection.
3. There should be a procedure for editing and synchronizing the video tapes,
and the video tape players should be of good quality so that they can all
be synchronized. The video players should not be too heat sensitive to
avoid distortion of the tapes which destroys synchronization.
4. Three point seat belt restraint systems should be incorporated into the
driving simulator and their effect on driving performance of drivers with
neck limitations should also be studied. The restraints will help with
experimental control.
5. The data acquisition equipment should be adaptable enough to allow for
repeated playback of intersection presentations when there are errors,
automatic data tagging, minor real time data reduction, rapid scan rate for
head turn measurements, both analog and digital data collection and
consistency in data recording.
126
9.1.1.2 Field Studies
Field studies are required for validation of the experimental results and
for the transfer of findings to the real world situation. The field studies should
be conducted using an instrumented vehicle. The field studies would examine the
effect of three point seat restraint systems, use and influence of rear and side
mirrors on driving performance as well as the other variables which can not be
studied in the laboratory.
9.1.1.3. Applications
Both the laboratory and field studies should establish base line data for
drivers who are unimpaired and in three age segments; young (20-35), middle
age (40-55) and older (60-75). Once the baseline information has been
established then impaired drivers in the same age groups should be studied.
An application of both laboratory and field studies would be to compare
the driving performance of subjects that are either impaired or unimpaired at
intersections with 90 degree and skewed geometrics.
9.1.2. Medication Studies
The study of the effects of various medications on driving performance
should be conducted in the laboratory due to the obvious risks of field study.
The strategy and film scenarios which are developed for the validation studies
can be applied for the medication study. Pharmacologists should be consulted

127
and participate in the study. The medication study should be stratified with
respect to age and should be structured to validate the current literature on
the effects on driving performance of medication and age, with particular
emphasis on drug interactions.
9.1.3 Closure
Further studies are required to validate the findings of this study, and to
transfer these findings to "real world" applications. The skewed intersection
problem is suggested as an application which requires further study. The
literature suggests the need to examine the relationship of certain medications
and age effects on driving performance.
128
BIBLIOGRAPHY
Aging America: Trends and Projections,(1985-86 ed.), U.S. Senate SpecialCommission on Aging, Washington, D.C.
Allen, R.W., Jex, H.R.,(1980) "Driving Simulation-Requirements, Mechanizationand Application", SAE,Technical Paper Series, No.800448.
Alexander, G., Lunenfeld,H.A., (1977), Positive Guidance in Traffic Control,Federal Highway Administration, Washington, D.C., US Department ofTransportation.
Blaauw, G.J.,(1982) "Driving Experience and Task Demands in Simulator andInstrumented Car: A Validation Study", Human Factors, Vol.24, No.4, p.473-486
Blumenfeld, D.E. and Weiss, G.H.,(1979) "The Effects of Gap AcceptanceCriteria on Merging Delay and Capacity at an Uncontrolled Intersection",Traffic Engineering and Control, Vol. 20, No. 1. p.16-20.
Botwinick, J., Brinley, J.F. Birren, J.E,(1957) "Set in Relation to Age", Journalof Gerontology, Vol.12, No.3, p.300-305.
Brainin, P.A., Naughton, T.J., Breedlove, R.M.,(1977), Impact Study on Drivingby Special Populations. Final Report. Volume 1 and Volume 2, National HighwayTraffic Safety Administration, Washington D.C., Report No. DOT-HS-802 329.
Brainin, P.A.(1980), Safety and Mobility Issues in Licensing and Education ofOlder Drivers, National Highway Traffic Safety Administration, Washington,D.C.,Report No. DOT-HS-805-492
Burg, A.(1968),"Lateral Visual Field as related to Age and Sex", Journal ofApplied Psychology, Vol.52, p10-15
Cooper, D.F., Storr, P.A., Wennell, J., (1977), "Traffic Studies at T-Junctions"Traffic Engineering and Control, Vol. 18, No. 3. p.110-112.
Cooper , D.F., Wennell, J., (1978),"Models of Gap Acceptance by Queues atintersections ", Traffic Engineering and Control, Vol. 19, No. 4.
David, N.A., Norman, J.R.,(1976), Motor Vehicle Accidents in Relation toGeometric and Traffic Features of Highway Intersections. Volume 1-3, FederalHighway Administration, Washington D.C., Report No. FHWA/76/128.
Freedman, M. Davit, P.S., Staplin, L.K., Breton, M.E.,(1985), Traffic SignalBrightness: An Examination of Nighttime Dimming, Federal HighwayAdministration, Washington D.C., Report No. FHWA/RD-85/005.
129
Gordon, D.A., McGee, H.W., Hooper, K.G.,(1984),"Driver CharacteristicsImpacting Highway Design and Operations", Public Roads, Vol.48, No.1, p.12-16.
Greenshields, B.D.(1965), 'The Driver", The Traffic Engineering Handbook,Institute of Transportation Engineers, Washington, D.C., 3rd.ed.
Grubb, Monty,(1986) Driver Behavior at Intersections: An Analysis of AccidentRelated Variables,unpublished.
Hagen, R.E.(1975),"Sex Differences in Driving Performance", Human Factors,Vol.17, No.2, p.165-171.
Henderson, R.L.,ed,(1986) Driver Performance Data Book, National HighwayTraffic Safety Administration, U.S. Department of Transportation, WashingtonD.C.
Hicks, T.G., Wierwille, W.W.,(1979),"Comparison of Five Mental WorkloadAssessment Procedures in a Moving Base Simulator", Human Factors, Vol. 21,No. 2, p.129-143.
Highway Capacity Manual, (1985), Transportation Research Board, WashingtonD.C.
Hooper, K. G.,McGee H.W.,(1983), "Driver Perception-Reaction Time: AreRevisions to Current Specification Values in Order?" Transportation ResearchBoard, Washington D.C., Transportation Research Record, No. 904, p.21.
Hooper, K. G., McGee H.W.,(1983), "Corrections to Driver CharacteristicSpecifications and Standard Formulations for Intersection SightDistance(Abridgement)", Transportation Research Board, Washington D.C.,Transportation Research Record No. 904, p.30.
Hostetter, R.S., McGee, H.W., Crowley, K.W., Seguin, E.L., Dauber, G.W.,(1986),Improved Perception-Reaction Time Information for Intersection Sight DistanceVolume 1 Report of Research, Federal Highway Administration Report No.FHWA/RD-86.
Hulbert, S.,(1961),"The Driving Simulator", Proceedings of the 13th CaliforniaStreet and Highway Conference, IflE, University of California, Berkeley,January 26-28, 1961.
Hulbert, S.F., Burg, A.,(1970) "Human Factors in Transportation Systems",Systems Psychology, Kenyon B.DeGreene ed., New York, McGraw Hill.
Johansson, G., Rumar, K.(1971), "Driver's Brake Reaction Time", Human Factors,Vol.13, No.1, p.23-27.
Leonard, J.J., Wierwille, W.W.,(1975), "Human Performance Validation ofSimulators: Theory and Experimental Verification", Proceedings Human FactorsSociety 19th Annual Meeting, Dallas, Texas, October 14-16, p. 446-456.

130
Malfetti, J.L. Ed.,(1985),"Drivers 55 + : Needs and Problems of OlderDrivers:Survey Results and Recommendations", Proceedings of the Older DriversColloquim,Orlando, Florida.
Mathewson, J. H.,(1958), "Some Potentials of a Driving Simulator", Proceedingsof the 10th California Street and Highway Conference, ITTE, University ofCalifornia, Los Angeles, January 29-31.
McGee, H.W., Moore, W., Knapp, B.G., Sanders, J.H.,(1978), Decision SightDistance for Highway Design and Traffic Control Requirements,Federal HighwayAdministration, Washington D.C., Report No. FHWA/RD-78/78.
McGee, H.W., Hooper, KG., Hughes, W.E., Benson, W.,(1983) Highway Designand Operations Standards Affected By Driver Characteristics. Volume 1: FinalTechnical Report, Federal Highway Administration, Washington D.C.,ReportNo.FHWA/RD-83/015.
Moore, R.L., Sedgley, I.P., Sabey, B.E.,(1982), "Ages of Car Drivers Involved inAccidents, with Special Reference to Junctions", Transport and Road ResearchLaboratory Supplementary Report No. 718, TRRL, Crowthorne, Berkshire, U.K.
Moraal, J., Kraiss, K.F., (1981) "Evaluating Simulator Validity", Manned SystemsDesign; Methods. Equipment. and Applications,Plenum Press, New York, p.411-426.
Panek, P.E., Barrett, G.V., Stearns, H.L., and Alexander, R.A.,(1977), "A reviewof ay changes in perceptual information process ability with regard todriving", Experimental Aging Research, Vol.3., No.6, p.387-449.
Planck, T.W., Fowler, R.C., (1971), " Traffic Accident Problems and ExposureCharacteristics of the Aging Driver", Journal of Gerontology, Vol.26, No.2.,p.133-136.
A Policy on Geometric Design of Highways and Streets 1965, AmericanAssociation of State Highway and Transportation Officials,Washington D.C.
A Policy on Geometric Design of Highways and Streets 1984, AmericanAssociation of State Highway and Transportation Officials,Washington D.C.
Polus, A., (1983),"Gap Acceptance Characteristics at Unsignalized UrbanIntersections", Traffic Engineering and Control, Vol. 24, No. 5, p.255-258.
Polus, A.,(1985)"Driver Behavior and Accident Records at Unsignalized urbanintersections", Accident Analysis and Prevention, Vol.17, p.25-32.
Ratanaubol, U., Harvey, R.,(1985),"Accident and Violation Rate of HandicappedDrivers", Alabama Medicine, August 1985.
Rees, J.N., Botwinick, J.,(1971)," Detection and Decision Factors in AuditoryBehavior of the Elderly", Journal of Gerontology, Vol. 26, No.2, p.133-136.
131
Sivak, M., Olson, P.L.,(1982),"Nighttime Legibility of Traffic Signs: conditionseliminating the effects of driver age and disability glare", Accident Analysisand Prevention, Vol.14, p.87-93.
Sivak, M., Olson, P.L., Pasta lan, L.A.,(1981), "Effect of Drivers'Age onNighttime Legibility of Highway Signs", Human Factors, Vol.23, No.1., p59-64.
Staplin, L.K., Breton, M.E., Haimo, S.F., Farber, E.I., and Byrnes, A.,(1986),"AgeRelated Diminished Capabilities and Driver Performance", A Working PaperSubmitted to FHWA Contract No.DTFH61-86-C-00044.
U.S. Bureau of the Census, Decennial Census, 1980 and Projections of thePopulation of the United States by Sex and Race: 1983 to 2050, Series P-25,No. 952.
U.S. Department of Transportation,(1980), Highway Statistics.
Welford, A.T.,(1981), "Signal noise, performance and age", Human Factors, Vol23, p.97-109.
Wennel, J., Cooper, D.F.,(1981), "Vehicle and Driver Effects on Junction GapAcceptance", Traffic Engineering and Control, Vol. 22, No. 12., p.628-632.
Yanik, A.J.,(1985) "What Accident Data Reveal about Elderly Drivers", SAETechnical Paper Series N851688, September.
Yanik, A.J.,(1986) "Aging Factors that Affect the Driving Task", FourthInternational Conference on Mobility and Transport for Elderly and DisabledPersons, Vancouver, 1986.
OTHER REFERENCES
Davis, B.T., Watts, J. M.(1970)"Further Investigations of Movement Timebetween Brake and Acceleration Pedal in Automobiles", Human Factors, Vol.12,No.6, p.559-561.
Glencross, D.J. Anderson, G.A.,(1976),"Operator Response Factors in theLocation and Control of Foot Pedals", Ergonomics, Vol.19, p.399-408.
Knowles , W.B.,(1963), "Operator Loading Tasks",Human Factors, April,p.155-161.
Koppa, R.D., McDermott, M., Raab, C., Sexton, D.J., (1980), Human FactorsAnalysis of Automobile Adaptive Equipment for Disabled Drivers, NationalHighway Traffic Safety Administration, Washington, D.C.,Report No.DOT-HS-805-726.

132
Less, M., Colverd, E.G., Dillon, J.J.,Young,J.,(1977), Hand Controls and AssistiveDevices for the Physically Disabled Driver, Human Resources Center, Albertson,New York.
Less, M., Colverd, E.G., De Mauro, G.E.,Young,J.,(1978), Evaluating DrivingPotential of Persons with Physical Disabilites, Human Resources Center,Albertson, New York.
Mounce, J. M.,(1981)"Driver Compliance with Stop-Sign Control at Low-VolumeIntersections", Transportation Research Board, Washington D.C., ResearchRecord No.808, p.30.
Negri, D.B.,(1978), Accidents Involving Handicapped Drivers, U.S. Department ofTransportation, Washington D.C.,Report No.DOT-HS-803 610.
Negri, B.D., Ibison, R.(1979),"Accidents Involving Handicapped Drivers", Journalof Traffic Medicine, Vol. 7, No.2, p.23-26.
Norton, C. P.,(1982), A Comparison of the Driving Skills of Paraplegic andAble-Bodied Individuals, Ph.D. Dissertation, University of Tennessee, Knoxville.
Rhoads, M.D.(1974),"Filling the Needs of the Handicapped Driver", TrafficSafety, Vol.74, No.2, p.26-'7, 35-7.
Risk, H.F.,(1983) Force Capabilities of the Physically Handicapped at SelectedAutomobile Driving Controls, Ph. D. Dissertation, Southern Illinois Universityat Carbondale.
Rut ley, KS., Mace, D.G.W.,(1972)"Heart Rate as a Measure in Road LayoutDesign", Ergonomics, Vol.15, No.2, p.165-173.
Snyder, H.L., (1976),"Braking Movement Time and Accelerator and BrakeSeparation", Human Factors, Vol.18, p.201-204.
Summala, Heikki,(1981),"Driver/Vehicle Steering Response Latencies", HumanFactors, Vol.23, No.6, p.683-692.

APPENDICES

133
APPENDIX A
INSTRUCTION SHEET
Hello, you are about to be shown a series of driving situations in which
you will view the scene from the perspective of a driver in a vehicle stopped
at a T-intersection. Please sit and hold the steering wheel as if you were
driving and depress the brake pedal. The three screens in front of you will
provide a wide field of view of intersections. As soon as the scene begins you
will be faced with a decision about when to proceed to turn left. Release the
brake pedal when you think you are ready to turn. Please respond only when
there is sufficient time between vehicles to successfully complete your turning
maneuver. There may be some intersections where there is never a sufficiently
long gap to proceed. In that instance, just keep your foot on the brake.
After the intersection has been presented, the screens will go blank,
during that time you will be asked to rate the intersection according to a
rating scale concerning overall difficulty, sight distance and traffic volume. I
will note your response. There will be time to relax while I am setting up the
tapes for each intersection.
Before we begin with the actual study scenes we would like to provide
you with two intersections. Do not worry about remembering all these
instructions. By the time you have finished the two practice intersections you
will be familiar with the tasks.
Thank you for volunteering and have fun!
134
RECORD OF INFORMED CONSENT
Part 46, Subtitle A to Title 45 of the Code of Federal Regulationsrelating to the Protection of Human Subjects in research requires yourinformed consent for participation in Federal Highway Administration drivingstudies. Section 46.103(c) gives the following definition: "Informed consentmeans the knowing consent of an individual or his legal authorizedrepresentative, so situated as to be able to exercise free legal power of choice,without undue inducement to any element of force, fraud, deceit, duress, orother form of constraint. " Your participation as a subject in a study toevaluate driving behavior at intersections is requested. Please consider thefollowing elements of information in reaching your decision whether or not toconsent.
1. You will be asked for biographical information necessary to the study.Your visual field, and static head movement will be measured. All informationprovided is confidential and the source of information will not be disclosed tothe public.
2. You will drive a driving simulator, and will watch three video screens.You will be asked to wear a piece of equipment that will measure headmovement. You will be given time to adjust to the equipment and practiceintersections.
3. The test session will take about an hour. You will not be subjected to anyrisks.
4. You are free to decline consent, to withdraw consent and discontinueparticipation in the session at any time.
5. Upon completion of the session, you will be paid $25.00 for yourparticipation. You must complete the entire session to receive fullremuneration.
The basic elements of information have been presented and understood by me,and I consent to participate as a subject.
NAME:(Please Print)
SIGNATURE:
DATE:
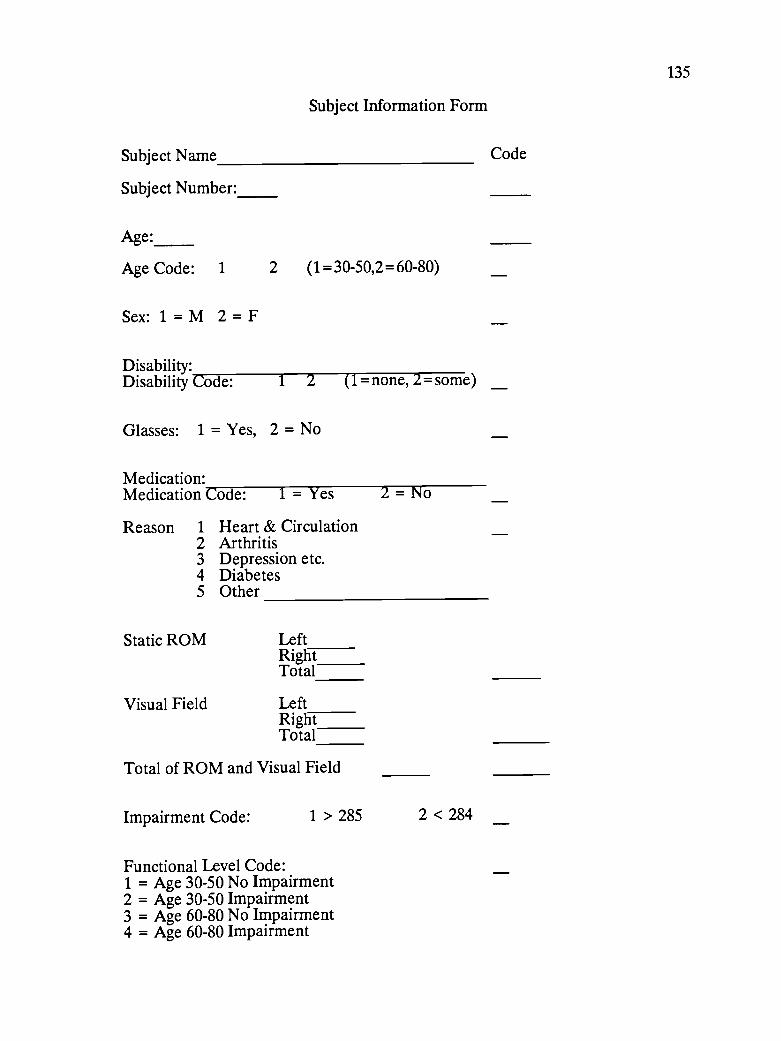
Subject Name
Subject Number:
Subject Information Form
Age:
Age Code: 1 2 (1=30-50,2=60-80)
Sex: 1 = M 2 = F
Code
Disability:Disability Code: 1 2 (1 =none, 2= some)
Glasses: 1 = Yes, 2 = No
Medication:Medication Code:
Reason
1 = Yes 2 = No
1 Heart & Circulation2 Arthritis3 Depression etc.4 Diabetes5 Other
Static ROM
Visual Field
LeftRightTotal
LeftRightTotal
Total of ROM and Visual Field
Impairment Code: 1 > 285
Functional Level Code:1 = Age 30-50 No Impairment2 = Age 30-50 Impairment3 = Age 60-80 No Impairment4 = Age 60-80 Impairment
2 < 284
135
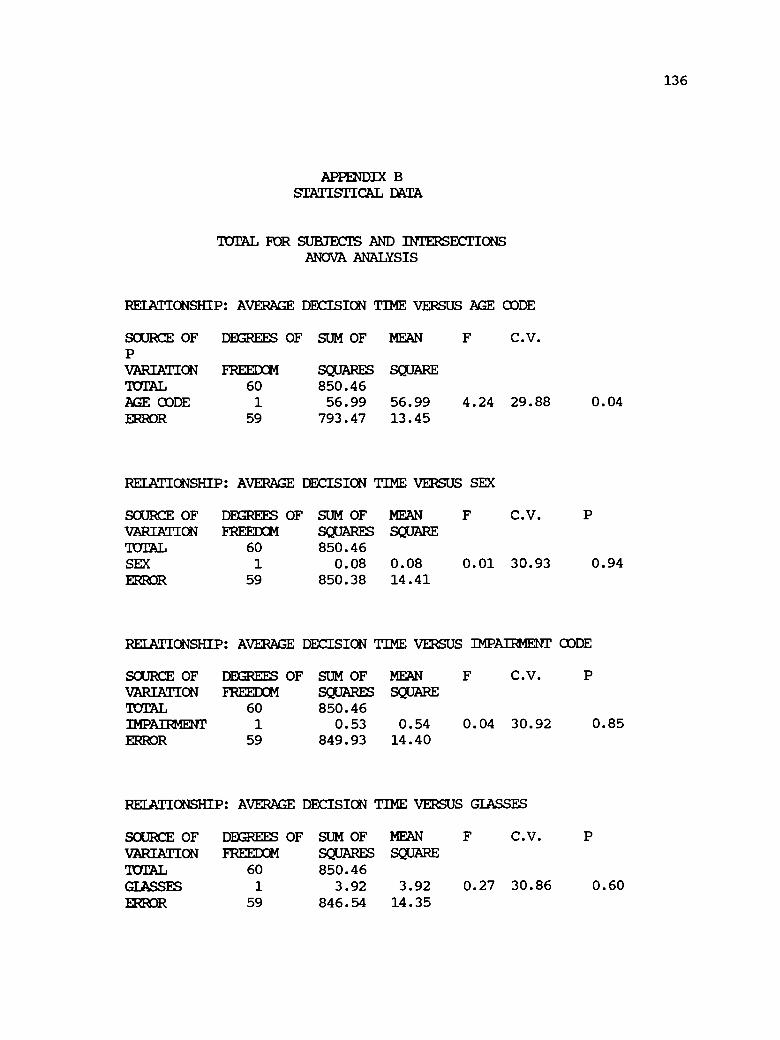
136
APPENDIX BSTATISTICAL DATA
Tam FOR SUBJECTS AND INTERSECTIONSANOVA ANALYSIS
RELATIONSHIP: AVERAGE DECISION TIME VERSUS AGE CODE
SOURCE OF DEGREES OF SUM OF MEANPVARIATION FREEDOM SQUARES SQUARETOTAL 60 850.46AGE CODE 1 56.99 56.99 4.24 29.88 0.04ERROR 59 793.47 13.45
RELATIONSHIP: AVERAGE DECISION TIME VERSUS SEX
SOURCE OF DEGREES OF SUM OF MEAN F C.V. PVARIATION FREEDOM SQUARES SQUARETOTAL 60 850.46SEX 1 0.08 0.08 0.01 30.93 0.94
ERROR 59 850.38 14.41
RELATIONSHIP: AVERAGE DECISION TIME VERSUS IMPAIRMENT CODE
SOURCE OF DEGREES OF SUM OF MEAN F C.V. PVARIATION FREEDOM SQUARES SQUARETOTAL 60 850.46IMPAIRMENT 1 0.53 0.54 0.04 30.92 0.85ERROR 59 849.93 14.40
RELATIONSHIP: AVERAGE DECISION TIME VERSUS GLASSES
SOURCE OF DEGREES OF SUM OF MEAN F C.V. PVARIATION FREEDOM SQUARES SQUARETOTAL 60 850.46GLASSES 1 3.92 3.92 0.27 30.86 0.60
ERROR 59 846.54 14.35
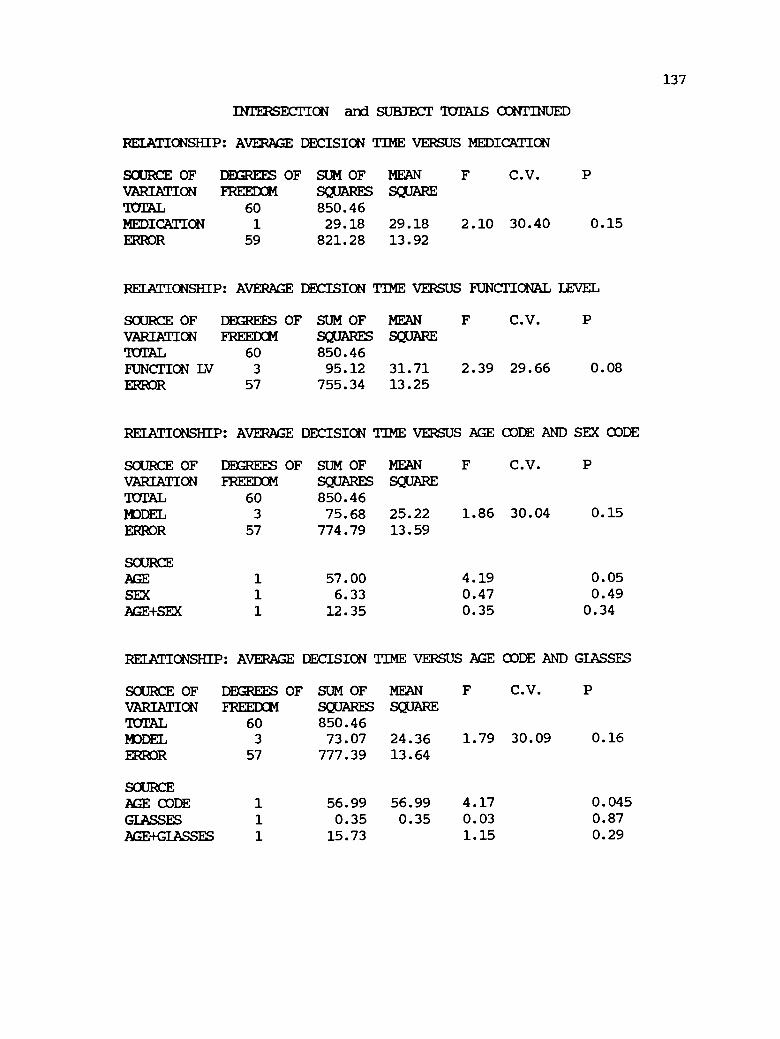
137
INTERSECTION and SUBJECT TOTALS CONTINUED
RELATIONSHIP: AVERAGE DECISION TIME VERSUS MEDICATION
SOURCE OF DEGREES OF SUM OF MEAN F C.V. PVARIATION FREEDOM SQUARES SQUARETOTAL 60 850.46MEDICATION 1 29.18 29.18 2.10 30.40 0.15ERROR 59 821.28 13.92
RELATIONSHIP: AVERAGE DECISION TIME VERSUS FUNCTIONAL LEVEL
SOURCE OF DEGREES OF SUM OF MEAN F C.V. PVARIATION FREEDOM SQUARES SQUARETOTAL 60 850.46FUNCTION LW 3 95.12 31.71 2.39 29.66 0.08
ERROR 57 755.34 13.25
RELATIONSHIP: AVERAGE DECISION TIME VERSUS AGE CODE AND SEX CODE
SOURCE OF DEGREES OF SUM OF MEAN F C.V. PVARIATION FREEDOM SQUARES SQUARETOTAL 60 850.46MODEL 3 75.68 25.22 1.86 30.04 0.15
ERROR 57 774.79 13.59
SOURCEAGE 1 57.00 4.19 0.05
SEX 1 6.33 0.47 0.49
AGE+SEX 1 12.35 0.35 0.34
RELATIONSHIP: AVERAGE DECISION TIME VERSUS AGE CODE AND GLASSES
SOURCE OF DEGREES OF SUM OF MEAN F C.V. PVARIATION FREEDOM SQUARES SQUARETOTAL 60 850.46MODEL 3 73.07 24.36 1.79 30.09 0.16
ERROR 57 777.39 13.64
SOURCEAGE CODE 1 56.99 56.99 4.17 0.045
GLASSES 1 0.35 0.35 0.03 0.87
AGE+GLASSES 1 15.73 1.15 0.29

138
INTERSECTION aryl SUBJECT TOMS CONTINUED
RELATIONSHIP: AVERAGE DECISION TIME VERSUS AGE ODDE AND IMPAIFMENTCODE
SOURCE OF DEGREES OF SUM OF MEAN F C.V. PVARIATION FREED34 SQUARES SQUARETOTAL 60 850.46MODEL 3 63.45 21.15 1.53 30.27 0.22ERROR 57 787.02 13.81
SOURCEAGE 1 57.00 4.19 0.05IMPAIRMENT 1 2.68 0.19 0.66AGE+IMPAIRMENT 1 3.77 0.27 0.60
RELATIONSHIP: AVERAGE DECISION TIME VERSUS AGE CODE, SEX ODDE ANDMEDICATION CODE
SOURCE OF DEGREES OF SUM OF MEAN F C.V. PVARIATION SQUARES SQUAREFREEDOMTOTAL 60 850.46MODEL 7 111.18 15.88 1.14 30.43 0.35ERROR 53 739.27 13.95
SOURCEAGE CODE 1 56.99 4.09 0.05SEX CODE 1 6.33 0.45 0.50AGE+SEX 1 12.35 0.89 0.35MED CODE 1 33.76 2.42 0.13AGE+MED 1 0.27 0.02 0.89SEX+MED 1 1.45 0.10 0.75AGE +SEX +MED 1 0.03 0.00 0.96
RELATIONSHIP: AVERAGE DECISION TIME VERSUS AGE ODDE, SEX CODE ANDIMPAIRMENT CODE
SOURCE OF DEGREES OF SUM OF MEAN F C.V. PVARIATION SQUARES SQUAREFREEDOMTOTAL 60 850.46MODEL 7 79.46 11.35 0.78 31.07 0.61ERROR 53 771.00 14.55
SOURCEAGE CODE 1 56.99 3.92 0.05
SEX CODE 1 6.33 0.44 0.51
AGE +SEX 1 12.35 0.85 0.36
IMPAIRMENT 1 0.08 0.01 0.94
AGE+IMP 1 1.02 0.07 0.79
SEX+1MP 1 2.11 0.14 0.71AGE+SEX+IMP 1 0.58 0.04 0.84

139
SUMMARY OF MEANS AND STANDARD DEVIATIONTOTAL FOR SUBJECTS AND INTERSECTIONS
RELATIONSHIP: AVERAGE DECISION TIME VERSUS AGE
AVERAGE DECISIONTIME
N MEAN STANDARDDEVIATION
30-50 31 11.324 3.4560-80 30 13.257 3.88
RELATIONSHIP: AVERAGE DECISION TIME VERSUS SEX
AVERAGE DECISION N MEAN STANDARDDEVIATIONTIME
MALE 24 12.229 3.63FEMALE 37 12.304 3.47
RELATIONSHIP: AVERAGE DECISION TIME VERSUS IMPAIRMENT
AVERAGE DECISION N MEAN STANDARDDEVIATIONTIME
NO IMPAIRMENT 26 12.283 3.36SOME IMPAIRMENT 35 12.194 4.09
RELATIONSHIP: AVERAGE DECISION TIME VERSUS FUNCTIONAL LEVEL(Functional level = age code, impairment code)
AVERAGE DECISION N MEAN STANDARDDEVIATIONTIME
1 30-50 NO IMPAIRMENT 16 11.296 2.872 30-50 IMPAIRMENT 15 11.353 4.093 60-80 NO IMPAIRMENT 15 12.130 3.084 60-80 IMPAIRMENT 15 14.384 4.35
RELATIONSHIP: AVERAGE DECISION TIME VERSUS GLASSES
AVERAGE DECISION N MEAN STANDARDDEVIATIONTIME
GLASSES 35 12.493 3.89NO GLASSES 26 11.980 3.65
RELATIONSHIP: AVERAGE DECISION TIME VERSUS MEDICATION
AVERAGE DECISION N MEAN STANDARDDEVIATIONTIME
MEDICATION 26 11.472 3.71NO MEDICATION 35 12.871 3.74

140
INTERSECTION and SUBJECT TOTALS CONTINUED
RELATIONSHIP: AVERAGE DECISION TIME VERSUS AGE AND SEX
AVERAGE DECISION N MEAN STANDARDDEVIATIONTIME
30-50, MALE 8 11.612 2.9530-50, FEMALE 23 11.223 3.6760-80, MALE 16 12.537 3.9760-80, FEMALE 14 14.080 3.73
RELATIONSHIP: AVERAGE DECISION TIME VERSUS AGE AND GLASSES
AVERAGE DECISION N MEAN STANDARDDEVIATIONTIME
30-50, GLASSES 15 10.904 3.6330-50, NO GLASSES 16 11.717 3.3560-80, GLASSES 20 13.684 3.7260-80, NO GLASSES 10 12.402 4.24
RELATIONSHIP: AVERAGE DECISION TIME VERSUS AGE AND IMPAIRMENT
AVERAGE DECISION N MEAN STANDARDDEVIATIONTIME
30-50, NO IMPAIRMENT 15 11.296 2.9730-50, IMPAIRMENT 16 11.349 3.9560-80, NO IMPAIRMENT 11 13.865 3.4160-80, IMPAIRMENT 19 12.905 4.17
RELATIONSHIP: AVERAGE DECISION TIME VERSUS AGE, SEX, & MEDICATION
AVERAGE DECISION N MEAN STANDARDDEVIATIONTIME
30-50, MALE, MEDICATION 1 11.060 0.0030-50, MALE, NO MEDICATION 7 11.691 3.1730-50, FEMALE, MEDICATION 10 10.341 3.8830-50, FEMALE, NO MEDICATION 13 11.902 3.5060-80, MALE, MEDICATION 10 12.012 3.9160-80, MALE, NO MEDICATION 6 13.412 4.2860-80, FEMALE, MEDICATION 5 12.736 3.4660-80, FEMALE, NO MEDICATION 9 14.827 3.86
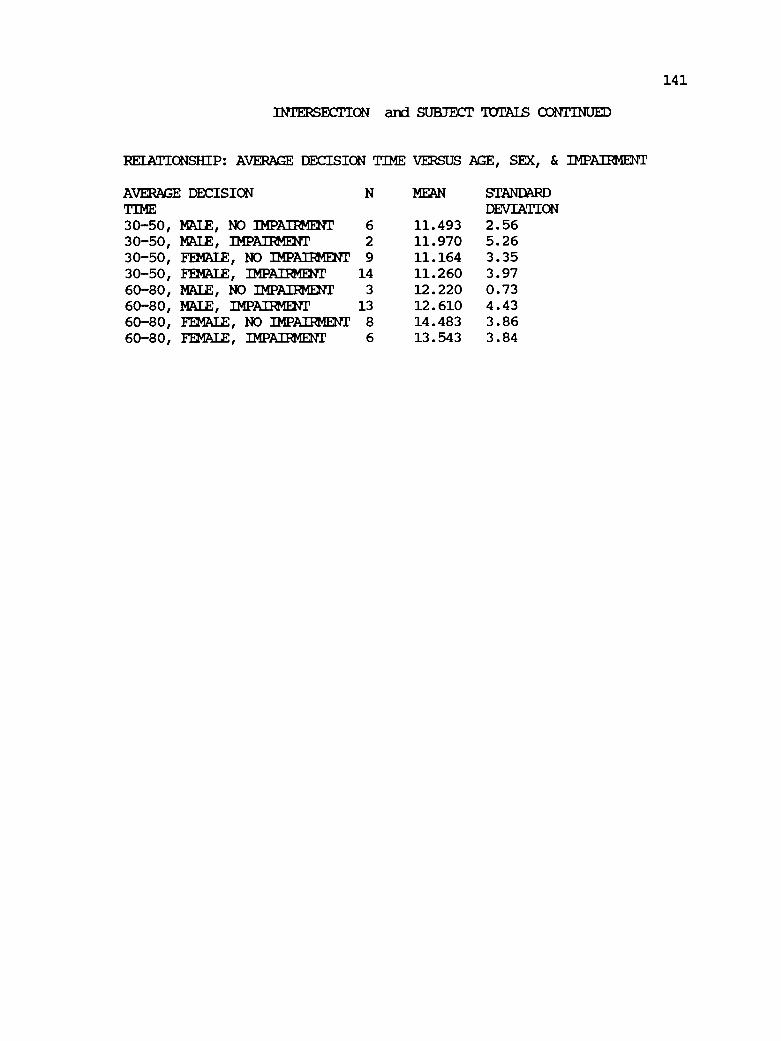
141
INTERSECTION and SUBJECT TOTALS CONTINUED
RELATIONSHIP: AVERAGE DECISION TIME VERSUS AGE, SEX, & IMPAIRMENT
AVERAGE DECISION MEAN STANDARDDEVIATIONTIME
30-50, MALE, NO IMPAIRMENT 6 11.493 2.5630-50, MALE, IMPAIRMENT 2 11.970 5.2630-50, FEMALE, NO IMPAIRMENT 9 11.164 3.3530-50, FEMALE, IMPAIRMENT 14 11.260 3.9760-80, MALE, NO IMPAIRMENT 3 12.220 0.7360-80, MALE, IMPAIRMENT 13 12.610 4.4360-80, FEMALE, NO IMPAIRMENT 8 14.483 3.8660-80, FEMALE, IMPAIRMENT 6 13.543 3.84

142
ANOVA ANALYSIS FOR INTERSECTION WITH POOR SIGHT DISTANCE AND LOWVOILIME
RELATIONSHIP: AVERAGE DECISION TIME VERSUS AGE CODE
SOURCE OF DEGREES OF SUM OF MEAN F C.V. PVARIATION FREEDOM SQUARES SQUARETOTAL 60 410.17AGE CODE 1 38.34 38.34 6.08 31.96 0.02ERROR 59 371.83 6.30
RELATIONSHIP: AVERAGE DECISION TIME VERSUS SEX
SOURCE OF DEGREES OF SUM OF MEAN F C.V. PVARIATION FREEDOM SQUARES SQUARETOTAL 60 410.17SEX 1 15.87 15.87 2.38 32.91 0.13ERROR 59 394.30 6.68
RELATIONSHIP: AVERAGE DECISION TIME VERSUS IMPAIRMENT CODE
SOURCE OF DEGREES OF SUM OF MEANVARIATION FREEDOM SQUARES SQUARETOTAL 60 410.17IMPAIRMENT 1 19.85 19.85 3.00 32.75 0.08ERROR 59 390.33 6.62
RELATIONSHIP: AVERAGE DECISION TIME VERSUS GLASSES
SOURCE OF DEGREES OF SUM OF MEANVARIATION FREEDOM SQUARES SQUARETOTAL 60 410.17GLASSES 1 18.26 18.26 2.75 32.81 0.10ERROR 59 391.91 6.64
RELATIONSHIP: AVERAGE DECISION TIME VERSUS MEDICATION
SOURCE OF DEGREES OF SUM OF MEAN F C.V.
VARIATION FREEDOM SQUARES SQUARETOTAL 60 410.17MEDICATION 1 7.97 7.97 1.17 33.24 0.28ERROR 59 402.20 6.82

143
INTERSECTION WITH POOR SIGHT DISTANCE AND LOW VOIUME CONTINUED
RELATIONSHIP: AVERAGE DECISION TIME VERSUS FUNCTIONAL LEVEL
SOURCE OF DEGREES OF SUM OF MEANVARIATION FREEDOM SQUARES SQUARETOTAL 60 410.17FUNCTION LW 3 84.66 28.22 4.94 30.43 0.00ERROR 57 755.34 13.25
RELATIONSHIP: AVERAGE DECISION TIME VERSUS AGE CODE AND SEX CODE
SOURCE OF DEGREES OF SUM OF MEAN F C.V. PVARIATION FREEDOM SQUARES SQUARETOTAL 60 410.17MODEL 3 46.55 15.52 2.43 32.16 0.07ERROR 57 363.62 6.38
SOURCEAGE 1 38.34 6.01 0.02SEX 1 5.45 0.85 0.36AGE+SEX 1 2.76 0.43 0.51
RELATIONSHIP: AVERAGE DECISION TIME VERSUS AGE CODE AND GLASSES
SOURCE OF DEGREES OF SUM OF MEAN F C.V. PVARIATION FREEDOM SQUARES SQUARETOTAL 60 410.17MODEL 3 58.22 19.41 3.14 31.64 0.03ERROR 57 351.95 6.17
SOURCEAGE CODE 1 38.34 6.21 0.015GLASSES 1 10.14 1.64 0.21AGE+GLASSES 1 9.74 1.58 0.21
RELATIONSHIP: AVERAGE DECISION TIME VERSUS AGE CODE AND IMPAIRMENT CODE
SOURCE OF DEGREES OF SUM OF MEAN F C.V. PVARIATION FREEDOM SQUARES SQUARETOTAL 60 410.17MODEL 3 58.29 19.43 3.15 31.63 0.03
ERROR 57 351.88 6.17
SOURCEAGE 1 38.34 6.21 0.02IMPAIRMENT 1 14.04 2.28 0.14AGE+IMPAIRMENT 1 5.90 0.96 0.33

144
INTERSECTION WITH POOR SIGHT DISTANCE AND LW VOLUME CCNTTUNED
RELATIONSHIP: AVERAGE DECISIONCODE
AGE CODE, SEX CODE ANDTIME VERSUSMEDICATION
SOURCE OF DEGREES OF SUM OF MEAN F C.V. PVARIATION FREEDOM SQUARES SQUARETOTAL 60 410.17MODEL 7 77.48 11.07 1.76 31.89 0.11ERROR 53 332.69 6.27
SOURCEAGE CODE 1 38.34 6.11 0.02SEX CODE 1 5.45 0.87 0.36AGE+SEX 1 2.76 0.44 0.51MED CODE 1 12.09 1.93 0.17AGE+MED 1 13.61 2.17 0.15SEX+MED 1 4.10 0.65 0.42AGE+SEX+MED 1 1.12 0.18 0.67
RELATIONSHIP: AVERAGE DECISIONCODE
AGE CODE, SEX CODE ANDTIME VERSUSIMPAIRMENT
SOURCE OF DEGREES OF SUM OF MEAN F C.V. PVARIATION SQUARES SQUAREFREEDOMTOTAL 60 410.17MODEL 7 85.91 12.27 2.01 31.49 0.07ERROR 53 324.26 6.11
SOURCEAGE CODE 1 38.34 6.27 0.02SEX CODE 1 5.45 0.89 0.35AGE+SEX 1 2.76 0.45 0.50IMPAIRMENT 1 20.29 3.32 0.07AGE+IMP 1 3.66 0.60 0.44SEX+IMP 1 3.51 0.57 0.45AGE+SEX+IMP 1 11.88 1.94 0.17
SUMMARY OF MEANS AND STANDARD DEVIATION FOR INTERSECTION WITH POOR SIGHTDISTANCE AND LOW VOLUME
RELATIONSHIP: TOTAL DECISION TIME VERSUS AGE
TOTAL DECISION N MEAN STANDARDTIME DEVIATION30-50 31 7.074 1.8560-80 30 8.660 3.04

145
IRTERSECTION WITH POOR SIGHT DISTANCE AND LW VOLUME OONTINUED
RELATIONSHIP: TOTAL DECISION TIME VERSUS SEX
TOTAL DECISION N MEAN STANDARDTIME DEVIATIONMALE 24 8.487 3.17FEMALE 37 7.444 2.13
RELATIONSHIP: TOTAL DECISION TIME VERSUS IMPAIRKENT
N MEANTOTAL DECISION STANDARDTIME DEVIATIONNO IMPAIRMENT 26 7.192 2.30SOME IMPAIRMENT 35 8.346 2.75
RELATIONSHIP: TOTAL DECISION TIME VERSUS FUNCTIONAL LEVEL(Functional level = age code, impairment code)
TOTAL DECISION N MEAN STANDARDDEVIATIONTIME
1 30-50 NO IMPAIRMENT 16 6.818 2.002 30-50 IMPAIRMENT 15 7.346 1.703 60-80 NO IMPAIRMENT 15 7.446 2.274 60-80 IMPAIRMENT 15 9.873 3.30
RELATIONSHIP: TOTAL DECISION TIME VERSUS GLASSES
TOTAL DECISION N MEAN STANDARDTIME DEVIATIONGLASSES 35 8.325 2.96NO GLASSES 26 7.219 1.92
RELATIONSHIP: TOTAL DECISION TIME VERSUS MEDICATION
TOTAL DECISION N MEAN STANDARDTIME DEVIATIONMEDICATION 26 7.435 2.02NO MEDICATION 35 8.165 2.97
RELATIONSHIP: AVERAGE DECISION TIME VERSUS AGE AND SEX
AVERAGE DECISION N MEAN STANDARDDEVIATIONTIME
30-50, MALE 8 7.925 2.1530-50, FEMALE 23 6.778 1.68
60-80, MALE 16 8.768 3.6060-80, FEMALE 14 8.535 2.38

146
INTERSECTION WITH POOR SIGHT DISTANCE AND LOW VOLUME CONTINUED
RELATIONSHIP: AVERAGE DECISION TIME VERSUS AGE AND GLASSES
AVERAGE DECISION N MEAN STANDARDDEVIATIONTIME
30-50, GLASSES 15 7.113 1.8930-50, NO GLASSES 16 7.037 1.8760-80, GLASSES 20 9.235 3.3360-80, NO GLASSES 10 7.510 2.06
RELATIONSHIP: AVERAGE DECISION TIME VERSUS AGE AND IMPAIRMENT
AVERAGE DECISION N MEAN STANDARDDEVIATIONTIME
30-50, NO IMPAIRMENT 15 6.880 2.0530-50, IMPAIRMENT 16 7.256 1.6860-80, NO IMPAIRMENT 11 7.618 2.6460-80, IMPAIRMENT 19 9.263 3.16
RELATIONSHIP: AVERAGE DECISION TIME VERSUS AGE, SEX, & MEDICATION
AVERAGE DECISION N MEAN STANDARDDEVIATIONTIME
30-50, MALE, MEDICATION 1 7.800 0.0030-50, MALE, NO MEDICATION 7 7.943 2.3330-50, FEMALE, MEDICATION 10 6.850 2.2130-50, FEMALE, NO MEDICATION 13 6.723 1.2360-80, MALE, MEDICATION 10 7.750 1.7660-80, MALE, NO MEDICATION 6 10.466 5.2760-80, FEMALE, MEDICATION 5 7.900 2.4760-80, FEMALE, NO MEDICATION 9 8.888 2.41
RELATIONSHIP: AVERAGE DECISION TIME VERSUS AGE, SEX, & IMPAIRMENT
AVERAGE DECISION N MEAN STANDARDDEVIATIONTIME
30-50, MAZE, NO IMPAIRMENT 6 7.966 2.4330-50, MALE, IMPAIRMENT 2 7.800 1.6930-50, FEMALE, NO IMPAIRMENT 9 6.155 1.48
30-50, FEMALE, IMPAIRMENT 14 7.178 1.73
60-80, MALE, NO IMPAIRMENT 3 5.800 1.83
60-80, MALE, IMPAIRMENT 13 9.453 3.6060-80, FEMALE, NO IMPAIRMENT 8 8.300 2.6660-80, FEMALE, IMPAIRMENT 6 8.850 2.15
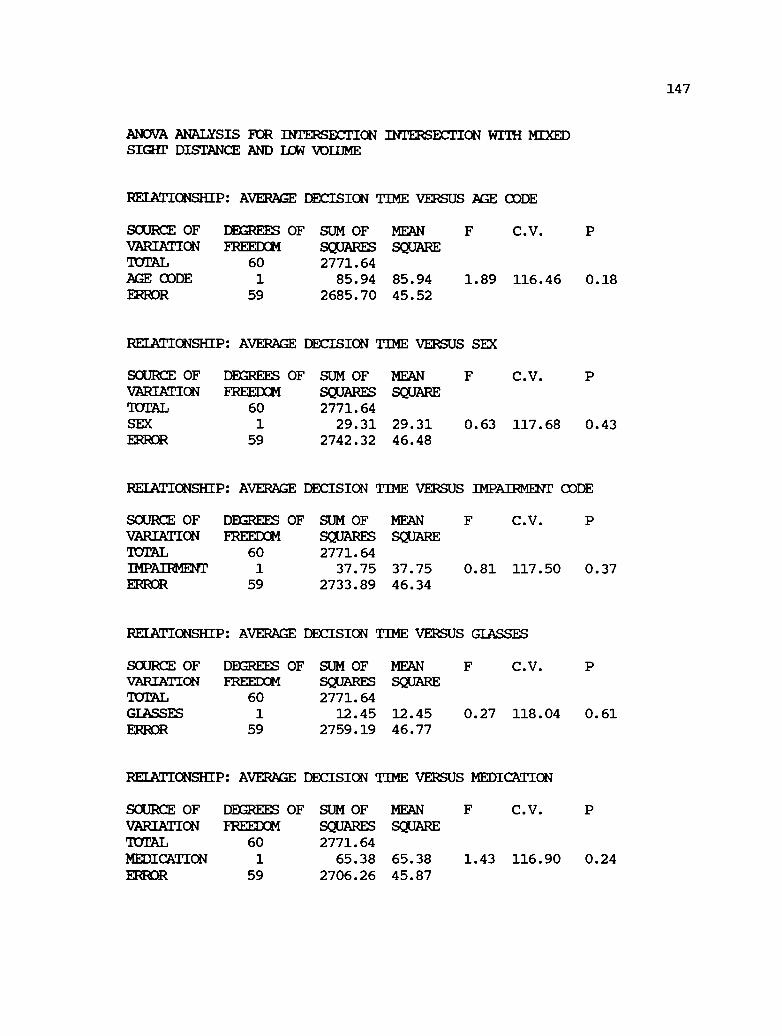
147
ANOVA ANALYSIS FOR INTERSECTION INTERSECTION WITH MIXEDSIGHT DISTANCE AND LOW VOLUME
RELATIONSHIP: AVERAGE DECISION TIME VERSUS AGE CODE
SCURCE OF DEGREES OF SUM OF MEANVARIATION FREEDOM SQUARES SQUARETOTAL 60 2771.64AGE CODE 1 85.94 85.94 1.89 116.46 0.18ERROR 59 2685.70 45.52
RELATIONSHIP: AVERAGE DECISION TIME VERSUS SEX
SOURCE OF DEGREES OF SUM OF MEAN F C.V. PVARIATION FREEDOM SQUARES SQUARETCTAL 60 2771.64SEX 1 29.31 29.31 0.63 117.68 0.43ERROR 59 2742.32 46.48
RELATIONSHIP: AVERAGE DECISION TIME VERSUS IMPAIRMENT CODE
SOURCE OF DEGREES OF SUM OF MEANVARIATION FREEDOM SQUARES SQUARETOTAL 60 2771.64IMPAIRMENT 1 37.75 37.75 0.81 117.50 0.37ERROR 59 2733.89 46.34
RELATIONSHIP: AVERAGE DECISION TIME VERSUS GLASSES
SOURCE OF DMREES OF SUM OF MEANVARIATION FREEDOM SQUARES SQUARETOTAL 60 2771.64GLASSES 1 12.45 12.45 0.27 118.04 0.61ERROR 59 2759.19 46.77
RELATIONSHIP: AVERAGE DECISION TIME VERSUS MEDICATION
SOURCE OF DEGREES OF SUM OF MEAN F C.V. PVARIATION FREEDOM SQUARES SQUARETOTAL 60 2771.64MEDICATION 1 65.38 65.38 1.43 116.90 0.24ERROR 59 2706.26 45.87

148
INTERSECTION WITH MIXED SIGHT DISTANCE AND LW VOLUME CONTINUED
RELATIONSHIP: AVERAGE DECISION TIME VERSUS FUNCTIONAL LEVEL
SOURCE OF DEGREES OF SUM OF MEAN F C.V.VARIATION FREEDOM SQUARES SQUARETOTAL 60 2771.64FUNCTION LV 3 368.72 122.91 2.92 112.07 0.04ERROR 57 2402.91 42.16
RELATIONSHIP: AVERAGE DECISION TIME VERSUS AGE CODE AND SEX CODE
SOURCE OF DEGREES OF SUM OF MEAN F C.V. PVARIATION FREEDOM SQUARES SQUARETOTAL 60 2771.64MODEL 3 94.64 31.55 0.67 118.29 0.57ERROR 57 2677.00 46.97
SOURCEAGE 1 85.93 1.83 0.18SEX 1 8.53 0.18 0.67AGE+SEX 1 0.16 0.00 0.95
RELATIONSHIP: AVERAGE DECISION TIME VERSUS AGE CODE AND GLASSES
SOURCE OF DEGREES OF SUM OF MEAN F C.V. PVARIATION FREEDOM SQUARES SQUARETOTAL 60 2771.64MODEL 3 256.31 85.44 1.94 114.66 0.13ERROR 57 2515.33 44.13
SOURCEAGE CODE 1 85.94 1.95 0.17GLASSES 1 3.41 0.08 0.78AGE+GLASSES 1 166.96 3.78 0.05
RELATIONSHIP: AVERAGE DECISION TIME VERSUS AGE CODE AND IMPAIRMENT CODE
SOURCE OF DEGREES OF SUM OF MEAN F C.V. PVARIATION FREEDOM SQUARES SQUARETOTAL 60 2771.64MOM 3 131.78 43.93 0.95 117.47 0.42ERROR 57 2639.85 46.31
SOURCEAGE 1 85.94 1.86 0.18IMPAIRMENT 1 25.82 0.56 0.46AGE+IMPURIDIT 1 20.03 0.43 0.51

149
INTERSECTION WITH MIXED SIGHT DISTANCE AND LOW VOLUME CONTINUED
RELATIONSHIP: AVERAGE DECISIONCODE
SUM OFSQUARES2771.64547.61
2224.02
85.948.530.16
101.69263.10
2.5685.61
AGE CODE, SEX CODE AND
C.V.
111.81 0.09
0.160.650.950.130.020.800.16
TIME VERSUS
MEANSQUARE
78.2341.96
SOURCE OFVARIATIONTOTALMODELERROR
SOURCEAGE CODE
MEDICATION
DEGREES OF
1.86
2.050.200.002.426.270.062.04
FREEDOM607
53
1
1
11
1
1
1
SEX CODEAGE+SEXMED CODEAGE-WEDSEX-WEDAGE+SEX+MED
RELATIONSHIP: AVERAGEIMPAIMENT
DEGREES OF
DECISIONCODE
SUM OFSQUARES
2771.64193.11
2578.53
85.948.530.16
26.2114.720.85
56.69
AGE CODE, SEX CODE AND
120.40 0.78
0.190.670.950.470.580.900.29
TIME VERSUS
MEANSQUARE
27.5948.65
SOURCE OFVARIATIONTOTALMODELERROR
SOURCEAGE CODE
0.57
1.770.180.000.540.300.021.17
FREEDOM607
53
11
1
1
1
1
SEX CODEAGE+SEXIMPAIRMENTAGE +IM
SEX+IMPAGE+SEX+IMP
SUMMARY OF MEANS AND STANDARD DEVIATIONFOR INTERSECTION WITH MIXED SIGHT DISTANCE AND LOW VOLUME
RELATIONSHIP: TOTAL DECISION TIME VERSUS AGE
TOTAL DECISIONTIME
N MEAN STANDARDDEVIATION
30-50 31 4.625 4.3260-80 30 7.000 8.56

150
INTERSECTION WITH MEXED SIGHT DISTANCE AND DOW VOLUME CONTINUED
RELATIONSHIP: TOTAL DECISION TIME VERSUS SEX
TOTAL DECISION N MEAN STANDARDTIME DEVIATIONMALE 24 6.654 9.23FEMALE 37 5.235 4.66
RELATIONSHIP: TOTAL DECISION TIME VERSUS IMPAIRMENT
TOTAL DECISION N MEAN STANDARDTIME DEVIATIONNO IMPAIRMENT 26 4.880 4.66SOME IMPAIRMENT 35 6.471 8.03
RELATIONSHIP: TOTAL DECISION TIME VERSUS FUNCTIONAL LEVEL(Functional level = age code, impairment code)
TOTAL DECISION N MEAN STANDARDDEVIATIONTIME
1 30-50 NO IMPAIRMENT 16 4.387 4.572 30-50 IMPAIRMENT 15 4.880 4.173 60-80 NO IMPAIRMENT 15 3.940 2.794 60-80 IMPAIRMENT 15 10.060 11.13
RELATIONSHIP: TOTAL DECISION TIME VERSUS GLASSES
TOTAL DECISION N MEAN STANDARDTIME DEVIATIONGLASSES 35 6.182 8.17NO GLASSES 26 5.269 4.42
RELATIONSHIP: TOTAL DECISION TIME VERSUS MEDICATION
TOTAL DECISION N MEAN STANDARDTIME DEVIATIONMEDICATION 26 4.592 3.88NO MEDICATION 35 6.685 8.28
RELATIONSHIP: AVERAGE DECISION TIME VERSUS AGE AND SEX
AVERAGE DECISION N MEAN STANDARDTIME DEVIATION30-50, MALE 8 5.125 5.1330-50, FEMALE 23 4.452 4.1260-80, MALE 16 7.418 10.7960-80, FEMALE 14 6.521 5.35
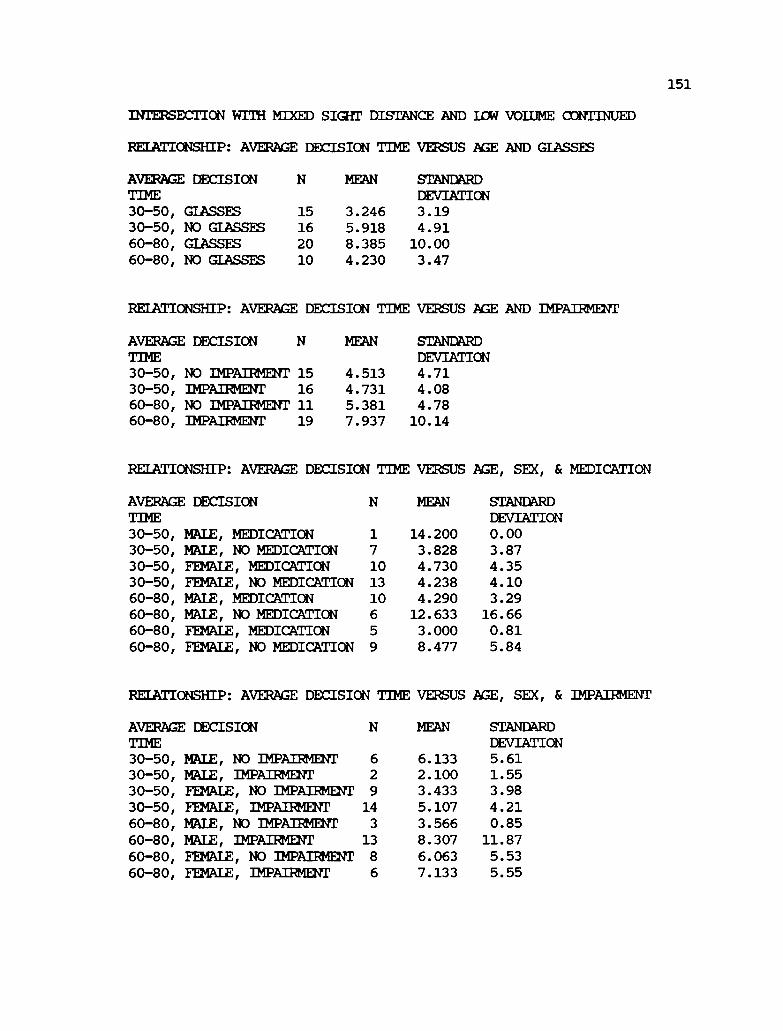
151
INTERSECTION WITH MIXED SIGHT DISTANCE AND Lag VOLUME CONTINUED
RELA'T'IONSHIP: AVERAGE DECISION TIME VERSUS AGE AND GLASSES
AVERAGE DECISION N MEAN STANDARDDEVIATIONTIME
30-50, GLASSES 15 3.246 3.1930-50, NO GLASSES 16 5.918 4.9160-80, GLASSES 20 8.385 10.0060-80, NO GLASSES 10 4.230 3.47
RELATIONSHIP: AVERAGE DECISION TIME VERSUS AGE AND IMPAIRMENT
AVERAGE DECISION N MEAN STANDARDDEVIATIONTIME
30-50, NO IMPAIRMENT 15 4.513 4.7130-50, IMPAIRMENT 16 4.731 4.0860-80, NO IMPAIRMENT 11 5.381 4.7860-80, IMPAIRMENT 19 7.937 10.14
RELATIONSHIP: AVERAGE DECISION VERSUS
MEAN
AGE, SEX, & MEDICATIONTIME
AVERAGE DECISION STANDARDTIME DEVIATION30-50, MALE, MEDICATION 1 14.200 0.0030-50, MALE, NO MEDICATION 7 3.828 3.8730-50, FEMALE, MEDICATION 10 4.730 4.3530-50, FEMALE, NO MEDICATION 13 4.238 4.1060-80, MALE, MEDICATION 10 4.290 3.2960-80, MALE, NO MEDICATION 6 12.633 16.6660-80, FEMALE, MEDICATION 5 3.000 0.8160-80, 9 8.477 5.84FEMALE, NO MEDICATION
RELATIONSHIP: AVERAGE DECISION TIME VERSUS AGE, SEX, & IMPAIRMENT
AVERAGE DECISION MEAN STANDARDDEVIATIONTIME
30-50, MALE, NO IMPAIRMENT 6 6.133 5.6130-50, MALE, IMPAIRMENT 2 2.100 1.5530-50, FEMALE, NO IMPAIRMENT 9 3.433 3.9830-50, FEMALE, IMPAIRMENT 14 5.107 4.2160-80, MALE, NO IMPAIRMENT 3 3.566 0.8560-80, MAZE, IMPAIRMENT 13 8.307 11.8760-80, FEMALE, NO IMPAIRMENT 8 6.063 5.53
60-80, 6 7.133 5.55FEMALE, IMPAIRMENT

152
ANOVA ANALYSIS FOR INTERSECTION WITH GOOD SIGHT DISTANCE ANDHIGH VOLUME
RELATIONSHIP: AVERAGE DECISION TIME VERSUS AGE CODE
SOURCE OF DEGREES OF SUM OF MEAN F C.V. PVARIATION FREEDOM SQUARES SQUARETOTAL 60 2895.63AGE CODE 1 53.09 53.09 1.10 25.90 0.30ERROR 59 2842.54 48.18
RELATIONSHIP: AVERAGE DECISION TIME VERSUS SEX
SOURCE OF DEGREES OF SUM OF MEAN F C.V.VARIATION FREEDOM SQUARES SQUARETOTAL 60 2895.63SEX 1 183.89 183.89 4.00 25.30 0.05ERROR 59 2711.74 45.96
RELATIONSHIP: AVERAGE DECISION TIME VERSUS IMPAIRMENT CODE
SOURCE OF DEGREES OF SUM OF MEAN F C.V. PVARIATION FREEDOM SQUARES SQUARETOTAL 60 2895.63IMPAIRMENT 1 0.18 0.18 0.00 26.14 0.95ERROR 59 2895.45 49.07
RELATIONSHIP: AVERAGE DECISION TIME VERSUS GLASSES
SOURCE OF DEGREES OF SUM OF MEANVARIATION FREEDOM SQUARES SQUARETOTAL 60 2895.63GLASSES 1 1.91 1.91 0.04 26.13 0.84ERROR 59 2893.71 49.05
RELATIONSHIP: AVERAGE DECISION TIME VERSUS MEDICATION
SOURCE OF DEGREES OF SUM OF MEANVARIATION FREEDOM SQUARES SQUARE9UTAL 60 2895.63MEDICATION 1 58.56 58.56 1.22 25.87 0.27ERROR 59 2837.07 48.08

INTERSECTION WITH GOOD SIGHT DISTANCE AND HIGH VOLUME CONTINUED
RELATIONSHIP: AVERAGE DECISION TIME VERSUS FUNCTIONAL LEVEL
SOURCE OF DEGREES OF SUM OF MEANVARIATION FREEDOM SQUARES SQUARETOTAL 60 2895.63FUNCTION LW 3 128.68 42.89 0.88 25.99ERROR 57 2766.95 48.54
P
0.45
153
SUMMARY OF MEANS AND STANDARD DEVIATIONFOR INTERSECTION WITH GOOD SIGHT DISTANCE AND HIGH VOLUME
RELATIONSHIP: TOTAL
TOTAL DECISIONTIME30-5060-80
RELATIONSHIP: TOTAL
TOTAL DECISIONTIMEMALEFEMALE
DECISION TIME VERSUS AGE
N MEAN STANDARDDEVIATION
31 25.880 8.8930 27.746 4.02
DECISION TIME VERSUS SEX
N MEAN STANDARDDEVIATION
24 28.954 7.3337 25.400 6.40
RELATIONSHIP: TOTAL DECISION TIME VERSUS IMPAIR .=
TOTAL DECISIONTIMENO IMPAIRMENTSOME IMPAIRMENT
N MEAN STANDARDDEVIATION
26 26.734 4.0735 26.845 8.54
RELATIONSHIP: TOTAL DECISION TIME VERSUS FUNCTIONAL LEVEL(FUnctional level = age code, impairment code)
TOTAL DECISION N MEAN STANDARDDEVIATIONTIME
1 30-50 NO IMPAIRMENT 16 26.581 4.282 30-50 IMPAIRMENT 15 25.133 12.203 60-80 NO IMPAIRMENT 15 26.340 3.374 60-80 IMPAIRMENT 15 29.153 3.89

154
INTERSECTION WITH GOOD SIGHT DISTANCE AND HIGH VOLUME CONTINUED
RELATIONSHIP: TOTAL DECISION TIME VERSUS GLASSES
TOTAL DECISION N MEAN STANDARDTIME DEVIATIONGLASSES 35 26.645 6.29NO GLASSES 26 27.003 7.86
RELATIONSHIP: TOTAL DECISION TIME VERSUS MEDICATION
TOTAL DECISION N MEAN STANDARDTIME DEVIATIONMEDICATION 26 25.661 7.69NO MEDICATION 35 27.642 6.32
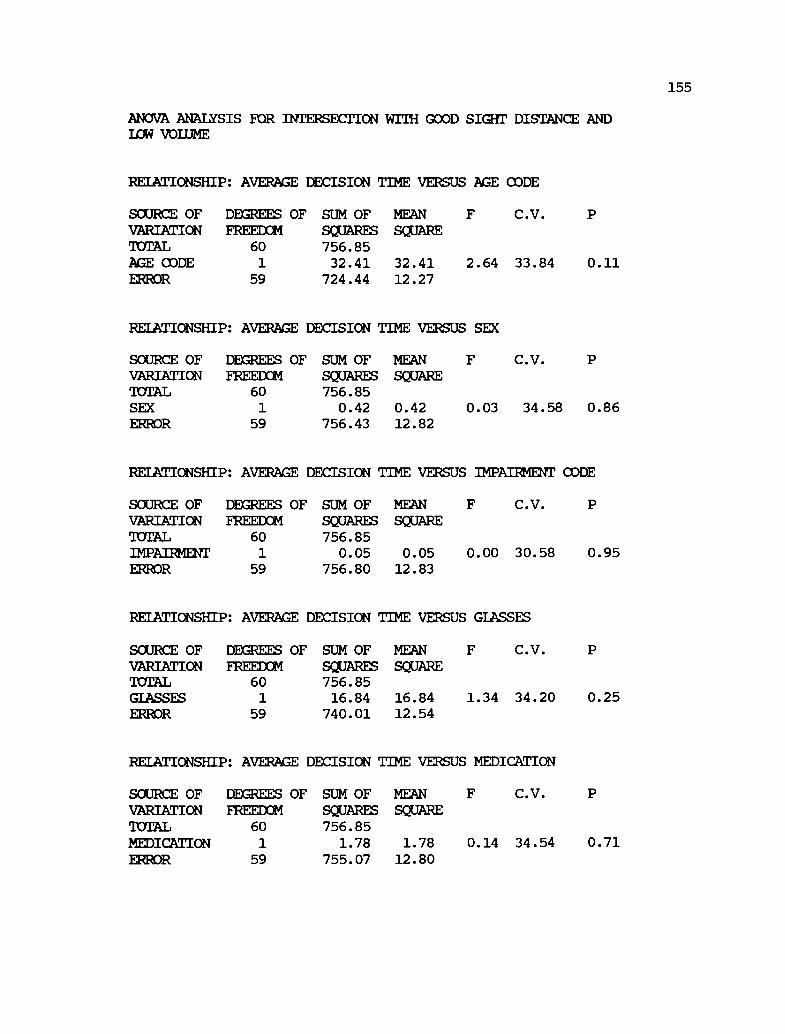
155
ANOVA ANALYSIS FOR INTERSECTION WITH GOOD SIGHT DISTANCE ANDLOW VOLUME
RELATIONSHIP: AVERAGE DECISION TIME VERSUS AGE CODE
SOURCE OF DEGREES OF SUM OF MEAN F C.V. PVARIATION FREEDOM SQUARES SQUARETOTAL 60 756.85AGE CODE 1 32.41 32.41 2.64 33.84 0.11ERROR 59 724.44 12.27
RELATIONSHIP: AVERAGE DECISION TIME VERSUS SEX
SOURCE OF DEGREES OF SUM OF MEAN F C.V. PVARIATION FREEDOM SQUARES SQUARETOTAL 60 756.85SEX 1 0.42 0.42 0.03 34.58 0.86ERROR 59 756.43 12.82
RELATIONSHIP: AVERAGE DECISION TIME VERSUS IMPAIRMENT CODE
SOURCE OF DEGREES OF SUM OF MEAN F C.V.
VARIATION FREEDOM SQUARES SQUAREMEAL 60 756.85IMPAIRMENT 1 0.05 0.05 0.00 30.58 0.95ERROR 59 756.80 12.83
RELATIONSHIP: AVERAGE DECISION TIME VERSUS GLASSES
SOURCE OF DEGREES OF SUM OF MEAN F C.V. PVARIATION FREEDOM SQUARES SQUARETOTAL 60 756.85GLASSES 1 16.84 16.84 1.34 34.20 0.25ERROR 59 740.01 12.54
RELATIONSHIP: AVERAGE DECISION TIME VERSUS MEDICATION
SOURCE OF DEGREES OF SUM OF MEANVARIATION FREEDOM SQUARES SQUARETOTAL 60 756.85MEDICATION 1 1.78 1.78 0.14 34.54 0.71ERROR 59 755.07 12.80

156
INTERSECTION WITH GOOD SIGHT DISTANCE AND LUe7 VOLUME CONTINUED
RELATIONSHIP: AVERAGE DECISION TIME VERSUS FUNCTIONAL LEVEL
SOURCE OF DEGREES OF SUM OF MEAN F C.V.VARIATION FREEDOM SQUARES SQUARETOTAL 60 756.85FUNCTION LV 3 42.56 14.19 1.13 34.18 0.34ERROR 57 714.29 12.53
RELATIONSHIP: AVERAGE DECISION TIME VERSUS AGE CODE AND SEX CODE
SOURCE OFVARIATIONTOTALMODELERROR
SOURCEAGESEXAGE+SEX
DEGREES OF SUM OFSQUARES756.8536.14
720.71
32.410.992.74
MEANSQUARE
12.0512.64
F
0.95
2.560.080.22
C.V.
34.34 0.42
0.110.780.64
FREEDOM603
57
1
1
1
RELATIONSHIP: AVERAGE DECISION TIME VERSUS AGE CODE AND GLASSES
SOURCE OF DEGREES OF SUM OF MEAN F C.V. PVARIATION FREEDOM SQUARES SQUAREMEAL 60 756.85MODEL 3 66.12 22.04 1.82 33.62 0.15ERROR 57 690.73 12.12
SOURCEAGE CODE 1 32.41 2.67 0.11GLASSES 1 9.64 0.08 0.38AGE+GIASSES 1 24.07 1.99 0.16
RELATIONSHIP: AVERAGE DECISION TIME VERSUS AGE CODE AND IMPAIR/0/r CODE
SOURCE OF DEGREES OF SUM OF MEANVARIATION FREEDOM SQUARES SQUARETOTAL 60 756.85MODEL 3 35.25 11.75 0.93 34.36 0.43ERROR 57 721.60 12.66
SOURCEAGE 1 32.41 2.56 0.11IMPAIRMENT 1 0.21 0.02 0.89AGE+IMPAIRMENT 1 2.63 0.21 0.65

157
INTERSECTION WITH GOOD SIGHT DISTANCE AND HIGH VOLUME CONTINUED
RELATIONSHIP: AVERAGE DECISIONCODE
SUM OFSQUARES756.8543.69
713.15
32.410.992.743.222.321.830.18
AGE CODE, SEX CODE AND
35.42 0.85
0.130.790.650.630.680.710.91
TIME VERSUS
MEANSQUARE
6.2413.45
SCURCE OFVARIATIONPUTALMODELERROR
SOURCEAGE CODE
MEDICATION
DEGREES OF F
0.46
2.410.070.200.240.170.140.01
FREEDOM607
53
11
1
11
1
1
SEX CODEAGE+SEXMED CODEAGE+MEDSEX +MED
AGE+SEX+MED
RELATIONSHIP: AVERAGE DECISION1MPAMONIT CODE
AGE CODE, SEX CODE ANDTIME VERSUS
SOURCE OF DEGREES OF SUM OF MEAN F C.V. PVARIATION FREEDOM SQUARES SQUARETOTAL 60 756.85MODEL 7 39.79 5.68 0.42 35.52 0.88ERROR 53 717.06 14.55
SOURCEAGE CODE 1 32.41 2.40 0.13SEX CODE 1 0.99 0.07 0.79AGE+SEX 1 2.74 0.20 0.65IMPAIRMENT 1 0.04 0.00 0.96AGE+IMP 1 1.67 0.12 0.73SEX+IMP 1 1.74 0.13 0.72AGE+SEX+IMP 1 0.20 0.01 0.90

158
SUMMARY OF MEANS AND STANDARD DEVIATIONFOR INTERSECTION WITH GOOD SIGHT DISTANCE AND HIGH VOLUME
RELATIONSHIP: TOTAL DECISION TIME VERSUS AGE
TOTAL DECISIONTIME
N MEAN STANDARDDEVIATION
30-50 31 9.638 3.3960-80 30 11.096 3.62
RELATIONSHIP: TOTAL DECISION TIME VERSUS SEX
TOTAL DECISION N MEAN STANDARDTIME DEVIATIONMALE 24 10.458 4.65FEMALE 37 10.289 2.68
RELATIONSHIP: TaTAL DECISION TIME VERSUS IMPAIRMENT
TOTAL DECISION N MEAN STANDARDTIME DEVIATIONNO IMPAIRMENT 26 10.323 3.20SaME IMPAIRMENT 35 10.380 3.83
RELATIONSHIP: TOTAL DECISION TIME VERSUS FUNCTIONAL LEVEL(Functional level = age code, impairment code)
TOTAL DECISION N MEAN STANDARDDEVIATIONTIME
1 30-50 NO IMPAIRMENT 16 9.500 3.552 30-50 IMPAIRMENT 15 9.786 3.313 60-80 NO IMPAIRMENT 15 10.533 3.124 60-80 IMPAIRMENT 15 11.660 4.09
RELATIONSHIP: 'DOTAL DECISION TIME VERSUS GLASSES
TOTAL DECISION N MEAN STANDARDTIME DEVIATIONGLASSES 35 10.808 2.61NO GLASSES 26 9.746 4.51
RELATIONSHIP: TOTAL DECISION TIME VERSUS MEDICATION
TOTAL DECISION N MEAN STANDARDTIME DEVIATIONMEDICATION 26 10.157 4.35NO MEDICATION 35 10.302 2.87

159
INTERSECTION WITH GOOD SIGHT DISTANCE AND HIGH VOLUME CONTINUED
RELATIONSHIP: AVERAGE DECISION TIME VERSUS AGE AND SEX
AVERAGE DECISION N MEAN STANDARDDEVIATIONTIME
30-50, MALE 8 9.812 4.8030-50, FEMALE 23 9.578 2.8760-80, MALE 16 10.781 4.7060-80, FEMALE 14 11.457 1.86
RELATIONSHIP: AVERAGE DECISION TIME VERSUS AGE AND GLASSES
AVERAGE DECISION N MEAN STANDARDDEVIATIONTIME
30-50, GLASSES 15 10.680 3.4030-50, NO GLASSES 16 8.662 3.1660-80, GLASSES 20 10.905 1.8960-80, NO GLASSES 10 11.480 5.87
RELATIONSHIP: AVERAGE DECISION TIME VERSUS AGE AND IMPAIRMENT
AVERAGE DECISION N MEAN STANDARDDEVIATIONTIME
30-50, NO IMPAIRMENT 15 9.493 3.6830-50, IMPAIRMENT 16 9.775 3.2060-80, NO IMPAIRMENT 11 11.454 2.0560-80, IMPAIRMENT 19 10.889 4.32
RELATIONSHIP: AVERAGE DECISION TIME VERSUS AGE, SEX, & MEDICATION
AVERAGE DECISION N MEAN STANDARDDEVIATIONTIME
30-50, MALE, MEDICATION 1 8.800 0.0030-50, MALE, NO MEDICATION 7 9.957 5.1730-50, FEMALE, MEDICATION 10 9.640 4.0430-50, FEMALE, NO MEDICATION 13 9.531 1.7160-80, MALE, MEDICATION 10 10.330 5.8360-80, MALE, NO MEDICATION 6 11.533 1.9960-80, FEMALE, MEDICATION 5 11.120 1.7460-80, 9 11.644 2.00FEMALE, NO MEDICATION

160
INTERSECTION WITH GOOD SIGHT DISTANCE AND HIGH VOLUME CONTINUED
RELATIONSHIP: AVERAGE DECISION TIME VERSUS AGE, SEX, & IMPAIRMENT
AVERAGE DECISION MEAN STANDARDDEVIATIONTIME
30-50, MALE, NO IMPAIRMENT 6 9.816 5.6530-50, MALE, IMPAIRMENT 2 9.800 1.4130-50, FEMALE, NO IMPAIRMENT 9 9.277 1.9130-50, FEMALE, IMPAIRMENT 14 9.771 3.4260-80, MALE, NO IMPAIRMENT 3 11.566 2.0460-80, MALE, IMPAIRMENT 13 10.600 5.17
8 11.413 2.1960-80, FEMALE, NO IMPAIRMENT60-80, FEMALE, IMPAIRMENT 6 11.516 1.50

161
INTERSECTION N MEAN
ANALYSIS
SIGHTDISTANCE
INTERSECTION DATA
SUMMARY OF DECISION TIMES
VOLUMESTANDARDDEVIATION
1 57 23.82 7.74 HIGH GOOD2 55 23.59 27.56 HIGH POOR3 51 2.85 2.35 LOW POOR4 61 14.53 4.70 LW CODE5 61 7.85 2.61 HIGH POOR6 53 2.82 1.52 HIGH CODE7 57 5.92 2.62 IOW CODE8 59 13.19 16.19 HIGH POOR9 61 5.79 6.80 LOW POOR
10 57 9.20 4.19 LOW CODE11 61 9.87 8.21 LOW GOOD12 61 26.80 6.95 HIGH GOOD13 61 6.85 5.13 HIGH CODE14 61 12.24 4.13 HIGH GOOD15 61 17.66 11.30 LOW CODE16 61 10.36 3.55 LOW GOOD17 57 3.93 4.09 LOW POOR18 59 22.60 16.62 HIGH GOOD
ANOVA ANALYSISINTERSECTION DATA
RELATIONSHIP: AVERAGE DECISION TIME VERSUS VOLUME
SOURCE OF DEGREES OF SUM OF MEAN F C.V. PVARIATION FREEDOM SQUARES SQUARETOTAL 17 1011.94VOLUME 1 197.65 197.65 3.88 58.40 .066ERROR 16 814.29 50.89
RELATIONSHIP: AVERAGE DECISION TIME VERSUS SIGHT DISTANCE
SOURCE OF DEGREES OF SUM OF MEAN F C.V. PVARIATION FREEDOM SQUARES SQUARETOTAL 17 1011.94SIGHT DIST 2 262.32 131.16 2.62 57.87 0.11ERROR 15 749.62 49.97
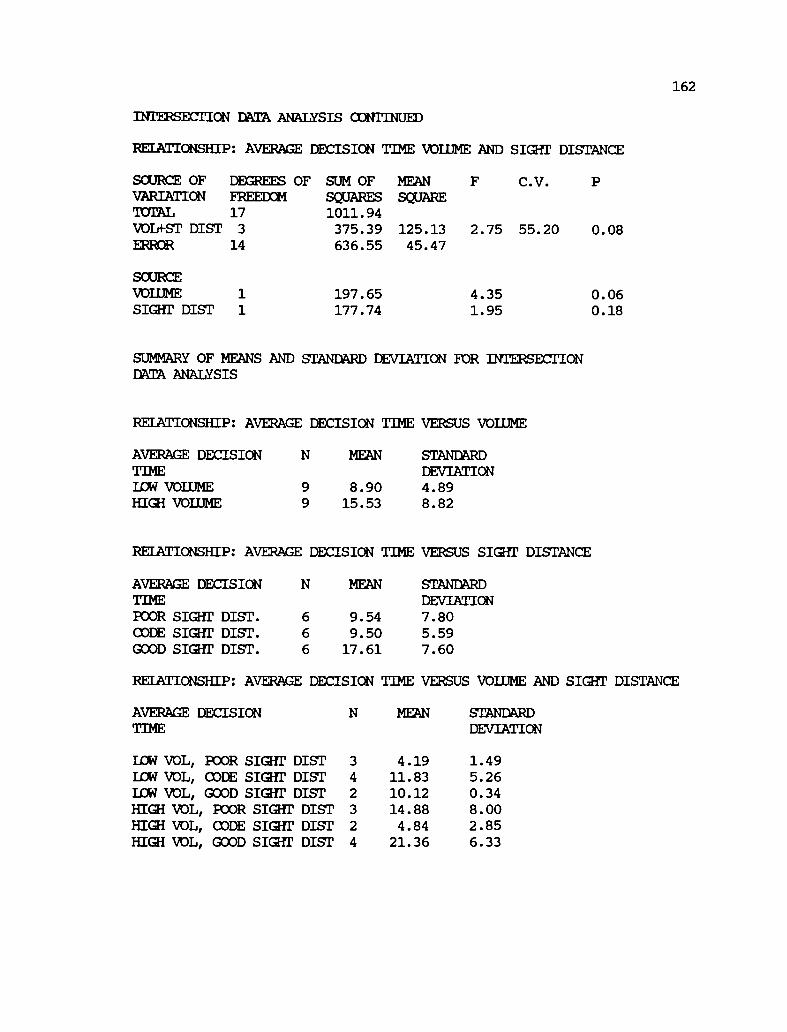
162
INTERSECTION DATA ANALYSIS CONTINUED
RELATIONSHIP: AVERAGE DECISION TIME VOLUME AND min' DISTANCE
SOURCE OFVARIATIONTOTALVOLO-ST DISTERROR
SOURCEVOLUMESIGHT DIST
SUM OFSQUARES1011.94375.39636.55
197.65177.74
MEANSQUARE
125.1345.47
2.75
4.351.95
55.20 0.08
0.060.18
DEGREES OFFREEDOM17
3
14
11
SUMMARY OF MEANS AND STANDARD DEVIATION FOR INTERSECTIONDATA ANALYSIS
RELATIONSHIP: AVERAGE DECISION TIME VERSUS VOLUME
AVERAGE DECISION N MEAN STANDARDTIME DEVIATIONLOW VOLUME 9 8.90 4.89HIGH VOLUME 9 15.53 8.82
RELATIONSHIP: AVERAGE DECISION TIME VERSUS SIGHT DISTANCE
AVERAGE DECISION N MEAN STANDARDDEVIATIONTIME
POOR SIGHT DIST. 6 9.54 7.80CODE SIGHT DIST. 6 9.50 5.59GOOD SIGHT DIST. 6 17.61 7.60
RELATIONSHIP: AVERAGE DECISION TIME VERSUS VOLUME AND SIGHT DISTANCE
AVERAGE DECISION N MEAN STANDARDDEVIATIONTIME
LOW VOL, POOR SIGHT DIST 3 4.19 1.49LOW VOL, CODE SIGHT DIST 4 11.83 5.26LOW VOL, GOOD SIGHT DIST 2 10.12 0.34HIGH VOL, POOR SIGHT DIST 3 14.88 8.00HIGH VOL, CODE SIGHT DIST 2 4.84 2.85HIGH VOL, GOOD SIGHT DIST 4 21.36 6.33
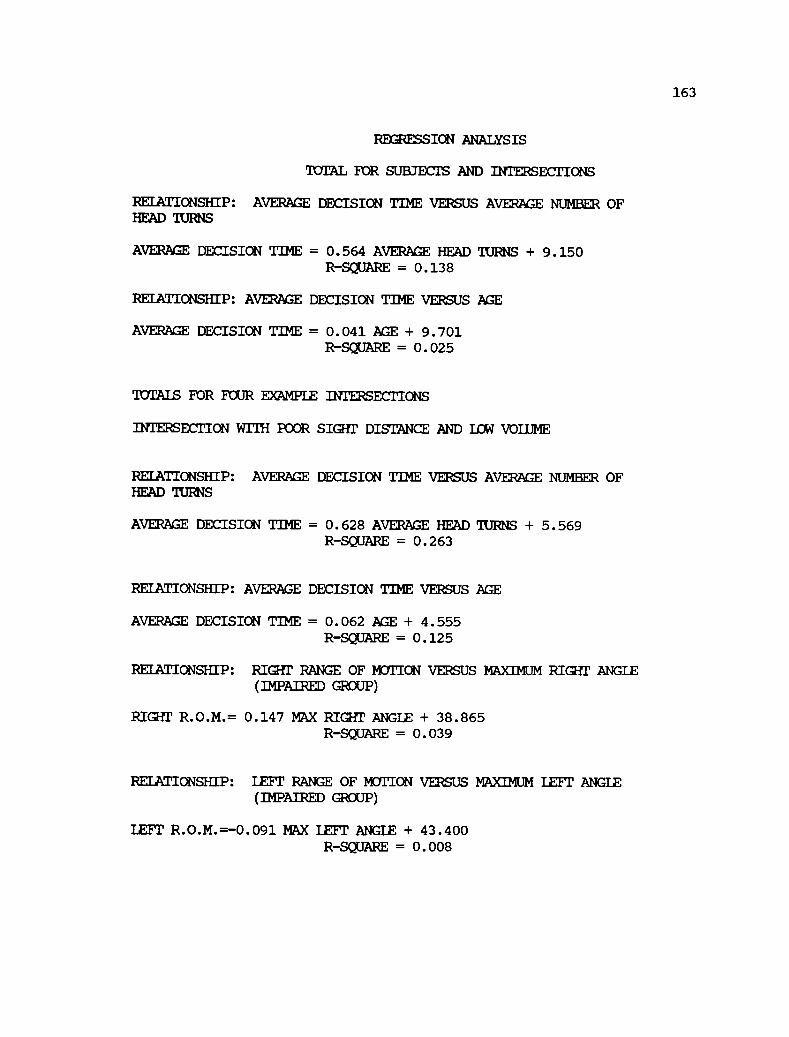
163
REGRESSION ANALYSIS
TOTAL FOR SUBJECTS AND INTERSECTIONS
RELATIONSHIP: AVERAGE DECISION TIME VERSUS AVERAGE NUMBER OFHEAD TURNS
AVERAGE DECISION TIME = 0.564 AVERAGE HEAD TURNS + 9.150R-SQUARE = 0.138
RELATIONSHIP: AVERAGE DECISION TIME VERSUS AGE
AVERAGE DECISION TIME = 0.041 AGE + 9.701R-SQUARE = 0.025
TOTALS FOR FOUR EXAMPLE INTERSECTIONS
INTERSECTION WITH POOR SIGHT DISTANCE AND LOW VOLUME
RELATIONSHIP: AVERAGE DECISION TIME VERSUS AVERAGE NUMBER OFHEAD TURNS
AVERAGE DECISION TIME = 0.628 AVERAGE HEAD TURNS + 5.569R-SQUARE = 0.263
RELATIONSHIP: AVERAGE DECISION TIME VERSUS AGE
AVERAGE DECISION TIME = 0.062 AGE + 4.555R-SQUARE = 0.125
RELATIONSHIP: RIGHT RANGE OF MOTION VERSUS MAXIMUM RIGHT ANGLE(IMPAIRED GROUP)
RIGHT R.O.M.= 0.147 MAX RIGHT ANGLE + 38.865R-SQUARE = 0.039
RELATIONSHIP: LEFT RANGE OF MOTION VERSUS MAXIMUM LEFT ANGLE(IMPAIRED GROUP)
LEFT R.O.M.=-0.091 MAX LEFT ANGLE + 43.400R-SQUARE = 0.008

164
INTERSECTION WITH MIXED SIGHT DISTANCE AND IOW VOLUME
RELATIONSHIP: AVERAGE DECISION TIME VERSUS AVERAGE NUMBER OFHEAD TURNS
AVERAGE DECISION TIME = 2.230 AVERAGE HEAD TURNS 0.495R-SQUARE = 0.533
RELATIONSHIP: AVERAGE DECISION TIME VERSUS AGE
AVERAGE DECISION TIME = 0.059 AGE + 2.606R-SQUARE = 0.017
RELATIONSHIP: RIGHT RANGE OF MOTION VERSUS MAXIMUM RIGHT ANGLE(IMPAIRED GROUP)
RIGHT R.O.M.= 0.203 MAX RIGHT ANGLE + 37.869R-SQUARE = 0.107
RELATIONSHIP: LEFT RANGE OF MOTION VERSUS MAXIMUM LEFT ANGLE(IMPAIRED GROUP)
LEFT R.O.M.=-0.176 MAX LEFT ANGLE + 45.096R-SQUARE = 0.027
INTERSECTION WITH GOOD Karr DISTANCE AND HIGH VOLUME
RELATIONSHIP: AVERAGE DECISION TIME VERSUS AVERAGE NUMBER OF HEAD TURNS
AVERAGE DECISION TIME = 0.328 AVERAGE HEAD TURNS + 23.866R-SQUARE = 0.054
RELATIONSHIP: AVERAGE DECISION TIME VERSUS AGE
AVERAGE DECISION TIME = 0.052 AGE + 24.028R-SQUARE = 0.012

165
INTERSECTION WITH GOOD SIGHT DISTANCE AND HIGH VOLUME CONTINUED
RELATIONSHIP: RIGHT RANGE OF MOTION VERSUS MAXIMUM RIGHT ANGLE (IMPAIREDGROUP)
RIGHT R.O.M.= 0.119 MAX RIGHT ANGLE + 39.238R-SQUARE = 0.032
INTERSECTION WITH GOOD SIGHT DISTANCE AND HIGH VOLUME CONTINUED
RELATIONSHIP: LEFT RANGE OF METICN VERSUS MAXIMUM LEFT ANGLE (IMPAIRED GROUP)
LEFT R.O.M.=-0.030 MAX LEFT ANGLE + 41.392R-SQUARE = 0.002

166
INTERSECTION WITH GOOD SIGHT DISTANCE AND ICU VOLUME
RELATIONSHIP: AVERAGE DECISION TIME VERSUS AVERAGE NUMBER OFHEAD TURNS
AVERAGE DECISION TIME = 0.459 AVERAGE HEAD TURNS + 8.294R-SQUARE = 0.085
RELATIONSHIP: AVERAGE DECISION TIME VERSUS AGE
AVERAGE DECISION TIME = 0.048 AGE + 7.782R-SQUARE = 0.041
RELATIONSHIP: RIGHT RANGE OF MEQUON VERSUS MAXIMUM RIGHT ANGLE(IMPAIRED GROUP)
RIGHT R.O.M.= 0.164 MAX RIGHT ANGLE + 38.651R-SQUARE = 0.041
RELATIONSHIP: LEFT RANGE OF MOTION VERSUS MAXIMUM LEFT ANGLE(IMPAIRED GROUP)
LEFT R.O.M.=-0.078 MAX LEFT ANGLE + 42.287R-SQUARE = 0.006
Copyright © 2022 FDOKUMEN