The pattern of demografic changes in Craiova and its peripheries – causal or catalytic agent in...
9
Forum geografic. Studii și cercetări de geografie și protecția mediului Volume XIII, Issue 1 (June 2014), pp. 101-109 (9) http://dx.doi.org/10.5775/fg.2067-4635.2014.210.i 101 forumgeografic.ro The pattern of demografic changes in Craiova and its peripheries - causal or catalytic agent in the urban growth? Cristina ŞOŞEA 1,* , Liliana POPESCU 1 1 University of Craiova, Geography Department, 13, Craiova, Romania * Corresponding author, [email protected] Received on <01-03-20144>, reviewed on <30-04-2014>, accepted on <28-05-2014> Abstract The paper analyses the demographic structure of Craiova and its neighbouring area, taking into consideration the suburbanization process and the strong demographic decline that followed after 1990. The demographic potential is the inner driving force of the urban and represents a decisive factor for the territorial changes that the contemporary post-communist town is facing in the context of an ever-increasing mobility and transformations of the core-periphery relationships. Keywords: Craiova, geodemographic resources, urban growth, demographic decline, suburbanization. Rezumat. Tiparul schimbărilor demografice în Craiova şi periferiile sale – agent cauzal sau catalizator în creşterea urbană? Articolul pune în evidenţă analiza demografică structurală a municipiului Craiova şi a zonei sale adiacente, în contextul suburbanizării şi al declinului demografic pronunţat de după 1990. Potenţialul demografic exprimă forţa motrice internă a urbanului şi reprezintă un factor decisiv în cadrul transformărilor teritoriale pe care le traversează oraşul post-comunist contemporan în contextul mobilităţii crescânde şi a schimbării raporturilor centru-periferie. Cuvinte-cheie: Craiova, resurse geodemografice, creştere urbană, declin demografic, suburbanizare. Introduction Well-known and influencial studies on urban structure to explain urban growth were posited by the Chicago School scholars; the process of urban expansion was explained based on differentiation of land uses and competition among those uses in models of internal organization, in terms of the invasion and succession of one zone (predominant land use) into the next outer zone adjacent to it, with physical expansion of the city as a result (Johnson et al., 2009, Warf, 2006). A clear picture of a settlement’s demographic potential is very important since the analysis of its diachronic evolution, together with the changes of the economic dynamics are the main factors that trigger urban growth and transformations of the relationships that will exist between the town and its hinterland (Suditu et. al., 2010, p. 81). Meanwhile, demographic changes are one of the major inner forces needed for restructuring and transformation of the urban system components and of the relationships between them, with a multiple impact upon the inner urban organization and the spatial development of the town towards the rural area. Thus, 'the population, which through its characteristics, creates a tipical social environment, influences not only the economic activities by the quantity and quality of the work force, the human settlements following the population increase and the demands for a particular way of life, leading to their spreading and upgrading, but also the behaviour of human communities as a result of the training and education level' (Ianoş, 2000, p. 23). Geographical setting Craiova holds a good position in the national urban system and has a leading role at a regional level, as its demographic potential, together with the status of town of first rank, increase pole and headquarters of the South-Western Development Region prove it, polarizing the entire region. Craiova is situated almost in the center of the region (Fig. 1), halfway between the Carpathians and the Danube, at the crossroads of the main communication lines; hence, good accessibility and connectivity. Along time, Craiova has maintained its rank within the national urban hierarchy as well as its role of the most influent centre within Oltenia. From this point of view, along the 20th century and the beginning of the 21st century, at national level Craiova has always been among the top ten towns of the country (Table 1), not only because of its administrative functions (county seat, oblast or region), but also because, just like other medieval towns, Craiova remained the main urban centre of a Romanian province, which ensured it a privileged regional position (Popescu, 2009). At regional level, Craiova had a very stable position, testifying for a significant hierarchic innercy as a result of the few small and medium-sized towns, less competitive centres in the monocentric urban system of Oltenia (Table 2). The rank of Craiova town has a linear trend, compared with the other county seats in Oltenia. Still, the primacy index
Transcript of The pattern of demografic changes in Craiova and its peripheries – causal or catalytic agent in...
Forum geografic. Studii și cercetări de geografie și protecția mediului Volume XIII, Issue 1 (June 2014), pp. 101-109 (9) http://dx.doi.org/10.5775/fg.2067-4635.2014.210.i
101 forumgeografic.ro
The pattern of demografic changes in Craiova and its peripheries - causal or catalytic agent in the urban growth?
Cristina ŞOŞEA1,*, Liliana POPESCU1
1 University of Craiova, Geography Department, 13, Craiova, Romania * Corresponding author, [email protected]
Received on <01-03-20144>, reviewed on <30-04-2014>, accepted on <28-05-2014>
Abstract
The paper analyses the demographic structure of Craiova and its neighbouring area, taking into consideration the suburbanization process and the strong demographic decline that followed after 1990. The demographic potential is the inner driving force of the urban and represents a decisive factor for the territorial changes that the contemporary post-communist town is facing in the context of an ever-increasing mobility and transformations of the core-periphery relationships.
Keywords: Craiova, geodemographic resources, urban growth,
demographic decline, suburbanization.
Rezumat. Tiparul schimbărilor demografice în Craiova şi periferiile sale – agent cauzal sau catalizator în creşterea urbană? Articolul pune în evidenţă analiza demografică structurală a municipiului Craiova şi a zonei sale adiacente, în contextul suburbanizării şi al declinului demografic pronunţat de după 1990. Potenţialul demografic exprimă forţa motrice internă a urbanului şi reprezintă un factor decisiv în cadrul transformărilor teritoriale pe care le traversează oraşul post-comunist contemporan în contextul mobilităţii crescânde şi a schimbării raporturilor centru-periferie.
Cuvinte-cheie: Craiova, resurse geodemografice, creştere
urbană, declin demografic, suburbanizare.
Introduction
Well-known and influencial studies on urban
structure to explain urban growth were posited by the Chicago School scholars; the process of urban
expansion was explained based on differentiation of land uses and competition among those uses in
models of internal organization, in terms of the
invasion and succession of one zone (predominant land use) into the next outer zone adjacent to it,
with physical expansion of the city as a result (Johnson et al., 2009, Warf, 2006).
A clear picture of a settlement’s demographic
potential is very important since the analysis of its diachronic evolution, together with the changes of
the economic dynamics are the main factors that trigger urban growth and transformations of the
relationships that will exist between the town and its hinterland (Suditu et. al., 2010, p. 81).
Meanwhile, demographic changes are one of the
major inner forces needed for restructuring and transformation of the urban system components and
of the relationships between them, with a multiple impact upon the inner urban organization and the
spatial development of the town towards the rural
area. Thus, 'the population, which through its characteristics, creates a tipical social environment,
influences not only the economic activities by the quantity and quality of the work force, the human
settlements following the population increase and the demands for a particular way of life, leading to
their spreading and upgrading, but also the
behaviour of human communities as a result of the
training and education level' (Ianoş, 2000, p. 23).
Geographical setting
Craiova holds a good position in the national urban system and has a leading role at a regional level, as
its demographic potential, together with the status of town of first rank, increase pole and headquarters of
the South-Western Development Region prove it,
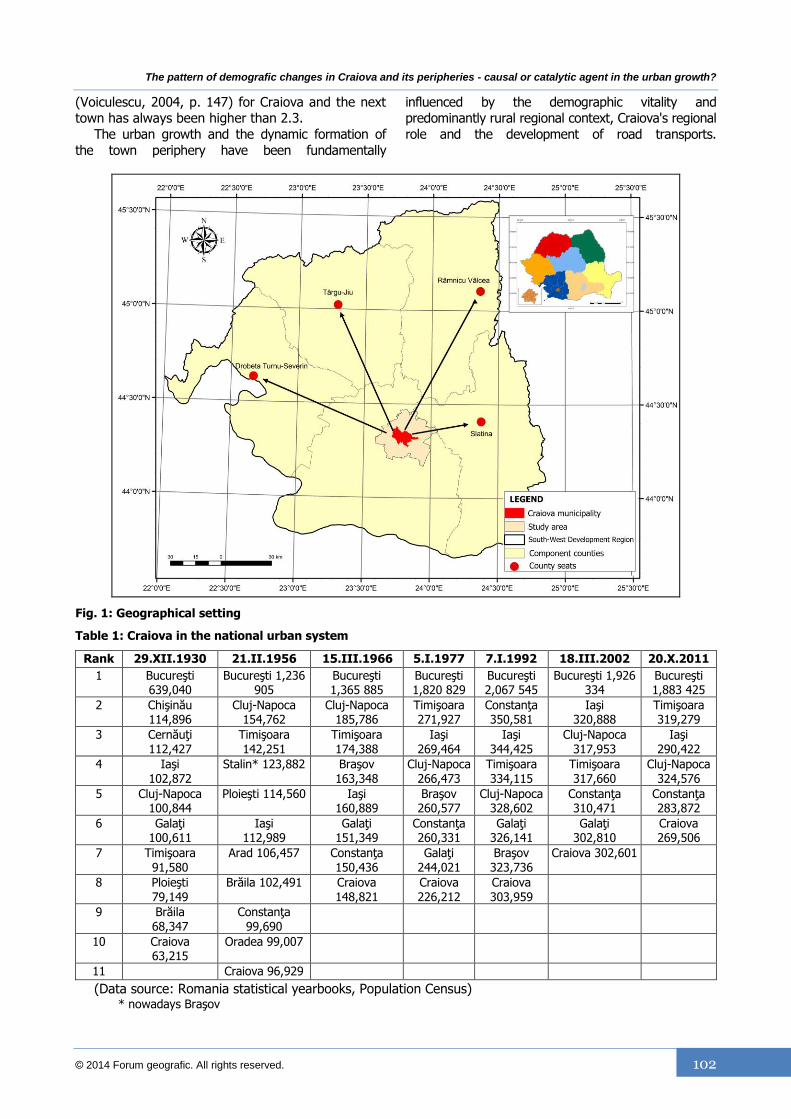
polarizing the entire region. Craiova is situated almost in the center of the region (Fig. 1), halfway between
the Carpathians and the Danube, at the crossroads of the main communication lines; hence, good
accessibility and connectivity.
Along time, Craiova has maintained its rank within the national urban hierarchy as well as its role of the
most influent centre within Oltenia. From this point of view, along the 20th century and the beginning of the
21st century, at national level Craiova has always been among the top ten towns of the country (Table 1), not
only because of its administrative functions (county
seat, oblast or region), but also because, just like other medieval towns, Craiova remained the main urban
centre of a Romanian province, which ensured it a privileged regional position (Popescu, 2009).
At regional level, Craiova had a very stable
position, testifying for a significant hierarchic innercy as a result of the few small and medium-sized
towns, less competitive centres in the monocentric urban system of Oltenia (Table 2). The rank of
Craiova town has a linear trend, compared with the other county seats in Oltenia. Still, the primacy index
The pattern of demografic changes in Craiova and its peripheries - causal or catalytic agent in the urban growth?
© 2014 Forum geografic. All rights reserved. 102
(Voiculescu, 2004, p. 147) for Craiova and the next town has always been higher than 2.3.
The urban growth and the dynamic formation of
the town periphery have been fundamentally
influenced by the demographic vitality and predominantly rural regional context, Craiova's regional
role and the development of road transports.
Fig. 1: Geographical setting
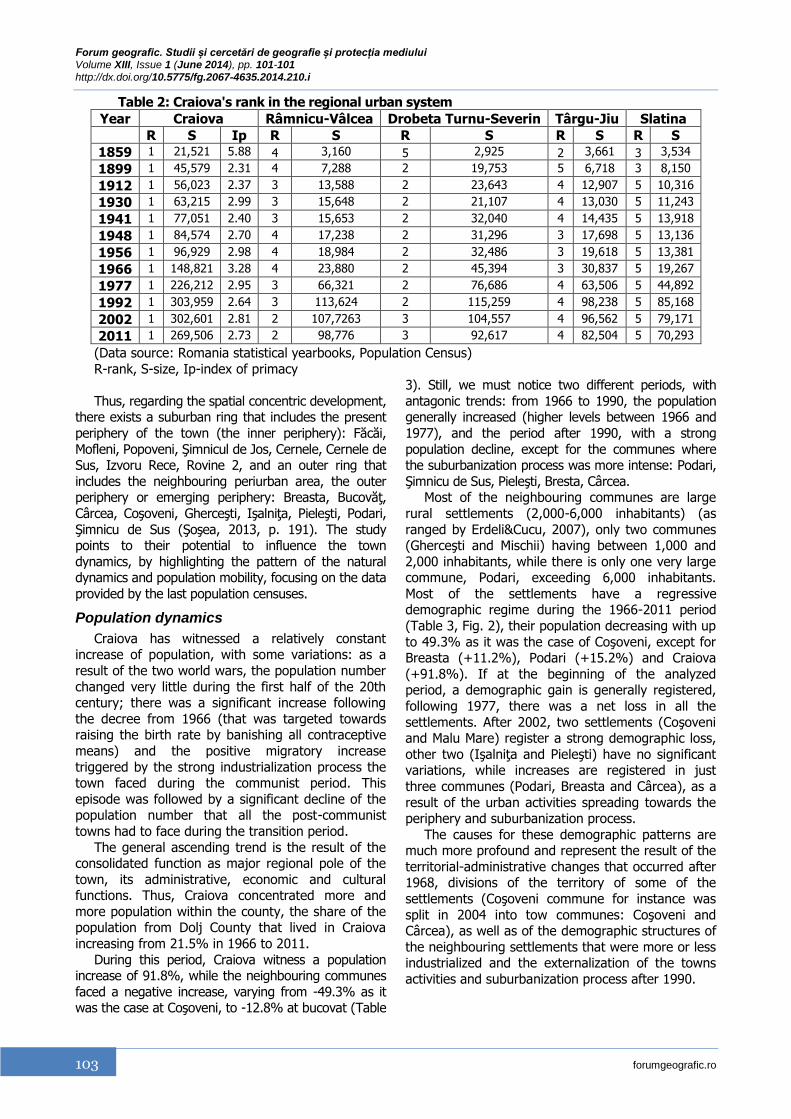
Table 1: Craiova in the national urban system
Rank 29.XII.1930 21.II.1956 15.III.1966 5.I.1977 7.I.1992 18.III.2002 20.X.2011
1 Bucureşti 639,040
Bucureşti 1,236 905
Bucureşti 1,365 885
Bucureşti 1,820 829
Bucureşti 2,067 545
Bucureşti 1,926 334
Bucureşti 1,883 425
2 Chişinău 114,896
Cluj-Napoca 154,762
Cluj-Napoca 185,786
Timişoara 271,927
Constanţa 350,581
Iaşi 320,888
Timişoara 319,279
3 Cernăuţi 112,427
Timişoara 142,251
Timişoara 174,388
Iaşi 269,464
Iaşi 344,425
Cluj-Napoca 317,953
Iaşi 290,422
4 Iaşi 102,872
Stalin* 123,882 Braşov 163,348
Cluj-Napoca 266,473
Timişoara 334,115
Timişoara 317,660
Cluj-Napoca 324,576
5 Cluj-Napoca 100,844
Ploieşti 114,560 Iaşi 160,889
Braşov 260,577
Cluj-Napoca 328,602
Constanţa 310,471
Constanţa 283,872
6 Galaţi 100,611
Iaşi 112,989
Galaţi 151,349
Constanţa 260,331
Galaţi 326,141
Galaţi 302,810
Craiova 269,506
7 Timişoara 91,580
Arad 106,457 Constanţa 150,436
Galaţi 244,021
Braşov 323,736
Craiova 302,601
8 Ploieşti 79,149
Brăila 102,491 Craiova 148,821
Craiova 226,212
Craiova 303,959
9 Brăila 68,347
Constanţa 99,690
10 Craiova 63,215
Oradea 99,007
11 Craiova 96,929
(Data source: Romania statistical yearbooks, Population Census) * nowadays Braşov
Forum geografic. Studii și cercetări de geografie și protecția mediului Volume XIII, Issue 1 (June 2014), pp. 101-101 http://dx.doi.org/10.5775/fg.2067-4635.2014.210.i
103 forumgeografic.ro
Table 2: Craiova's rank in the regional urban system
Year Craiova Râmnicu-Vâlcea Drobeta Turnu-Severin Târgu-Jiu Slatina
R S Ip R S R S R S R S
1859 1 21,521 5.88 4 3,160 5 2,925 2 3,661 3 3,534
1899 1 45,579 2.31 4 7,288 2 19,753 5 6,718 3 8,150
1912 1 56,023 2.37 3 13,588 2 23,643 4 12,907 5 10,316
1930 1 63,215 2.99 3 15,648 2 21,107 4 13,030 5 11,243
1941 1 77,051 2.40 3 15,653 2 32,040 4 14,435 5 13,918
1948 1 84,574 2.70 4 17,238 2 31,296 3 17,698 5 13,136
1956 1 96,929 2.98 4 18,984 2 32,486 3 19,618 5 13,381
1966 1 148,821 3.28 4 23,880 2 45,394 3 30,837 5 19,267
1977 1 226,212 2.95 3 66,321 2 76,686 4 63,506 5 44,892
1992 1 303,959 2.64 3 113,624 2 115,259 4 98,238 5 85,168
2002 1 302,601 2.81 2 107,7263 3 104,557 4 96,562 5 79,171
2011 1 269,506 2.73 2 98,776 3 92,617 4 82,504 5 70,293
(Data source: Romania statistical yearbooks, Population Census)
R-rank, S-size, Ip-index of primacy
Thus, regarding the spatial concentric development, there exists a suburban ring that includes the present
periphery of the town (the inner periphery): Făcăi,
Mofleni, Popoveni, Şimnicul de Jos, Cernele, Cernele de Sus, Izvoru Rece, Rovine 2, and an outer ring that
includes the neighbouring periurban area, the outer periphery or emerging periphery: Breasta, Bucovăţ,
Cârcea, Coşoveni, Gherceşti, Işalniţa, Pieleşti, Podari,
Şimnicu de Sus (Şoşea, 2013, p. 191). The study points to their potential to influence the town
dynamics, by highlighting the pattern of the natural dynamics and population mobility, focusing on the data
provided by the last population censuses.
Population dynamics
Craiova has witnessed a relatively constant increase of population, with some variations: as a
result of the two world wars, the population number
changed very little during the first half of the 20th century; there was a significant increase following
the decree from 1966 (that was targeted towards raising the birth rate by banishing all contraceptive
means) and the positive migratory increase
triggered by the strong industrialization process the town faced during the communist period. This
episode was followed by a significant decline of the population number that all the post-communist
towns had to face during the transition period.
The general ascending trend is the result of the consolidated function as major regional pole of the
town, its administrative, economic and cultural functions. Thus, Craiova concentrated more and
more population within the county, the share of the population from Dolj County that lived in Craiova
increasing from 21.5% in 1966 to 2011.
During this period, Craiova witness a population increase of 91.8%, while the neighbouring communes
faced a negative increase, varying from -49.3% as it was the case at Coşoveni, to -12.8% at bucovat (Table
3). Still, we must notice two different periods, with
antagonic trends: from 1966 to 1990, the population generally increased (higher levels between 1966 and
1977), and the period after 1990, with a strong
population decline, except for the communes where the suburbanization process was more intense: Podari,
Şimnicu de Sus, Pieleşti, Bresta, Cârcea. Most of the neighbouring communes are large
rural settlements (2,000-6,000 inhabitants) (as
ranged by Erdeli&Cucu, 2007), only two communes (Gherceşti and Mischii) having between 1,000 and
2,000 inhabitants, while there is only one very large commune, Podari, exceeding 6,000 inhabitants.
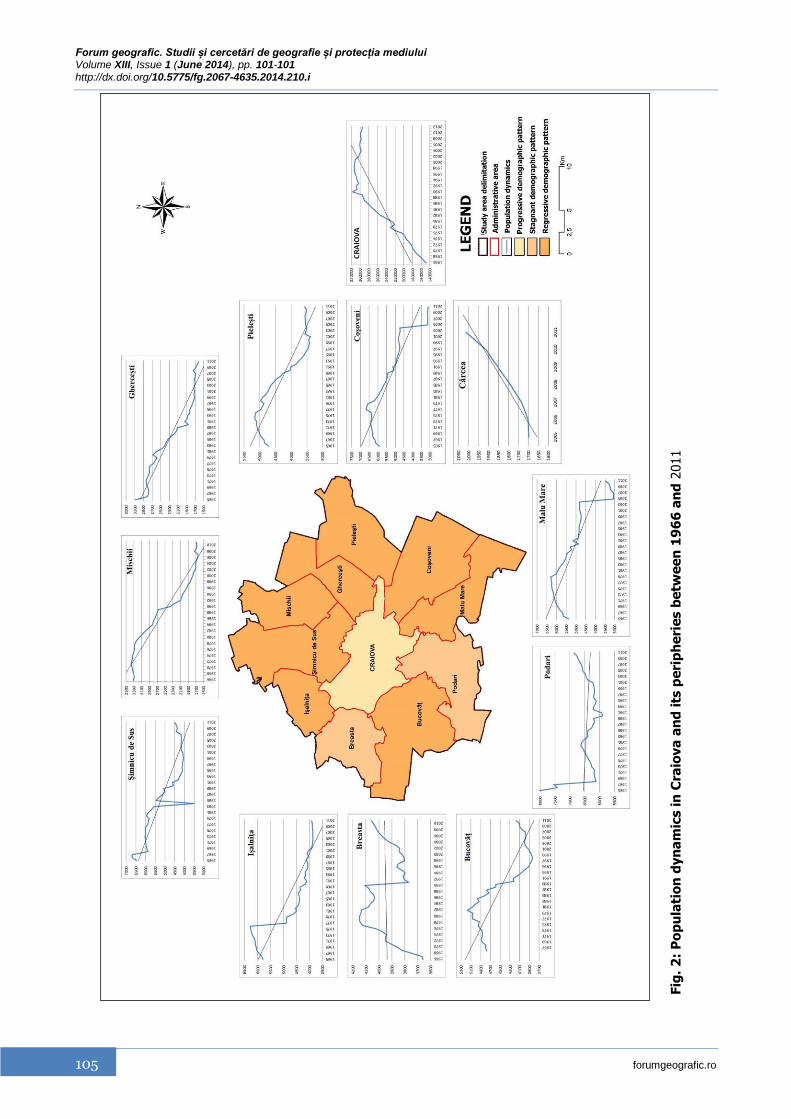
Most of the settlements have a regressive demographic regime during the 1966-2011 period
(Table 3, Fig. 2), their population decreasing with up
to 49.3% as it was the case of Coşoveni, except for Breasta (+11.2%), Podari (+15.2%) and Craiova
(+91.8%). If at the beginning of the analyzed period, a demographic gain is generally registered,
following 1977, there was a net loss in all the
settlements. After 2002, two settlements (Coşoveni and Malu Mare) register a strong demographic loss,
other two (Işalniţa and Pieleşti) have no significant variations, while increases are registered in just
three communes (Podari, Breasta and Cârcea), as a
result of the urban activities spreading towards the periphery and suburbanization process.
The causes for these demographic patterns are much more profound and represent the result of the
territorial-administrative changes that occurred after 1968, divisions of the territory of some of the
settlements (Coşoveni commune for instance was
split in 2004 into tow communes: Coşoveni and Cârcea), as well as of the demographic structures of
the neighbouring settlements that were more or less industrialized and the externalization of the towns
activities and suburbanization process after 1990.
The pattern of demografic changes in Craiova and its peripheries - causal or catalytic agent in the urban growth?
© 2014 Forum geografic. All rights reserved. 104
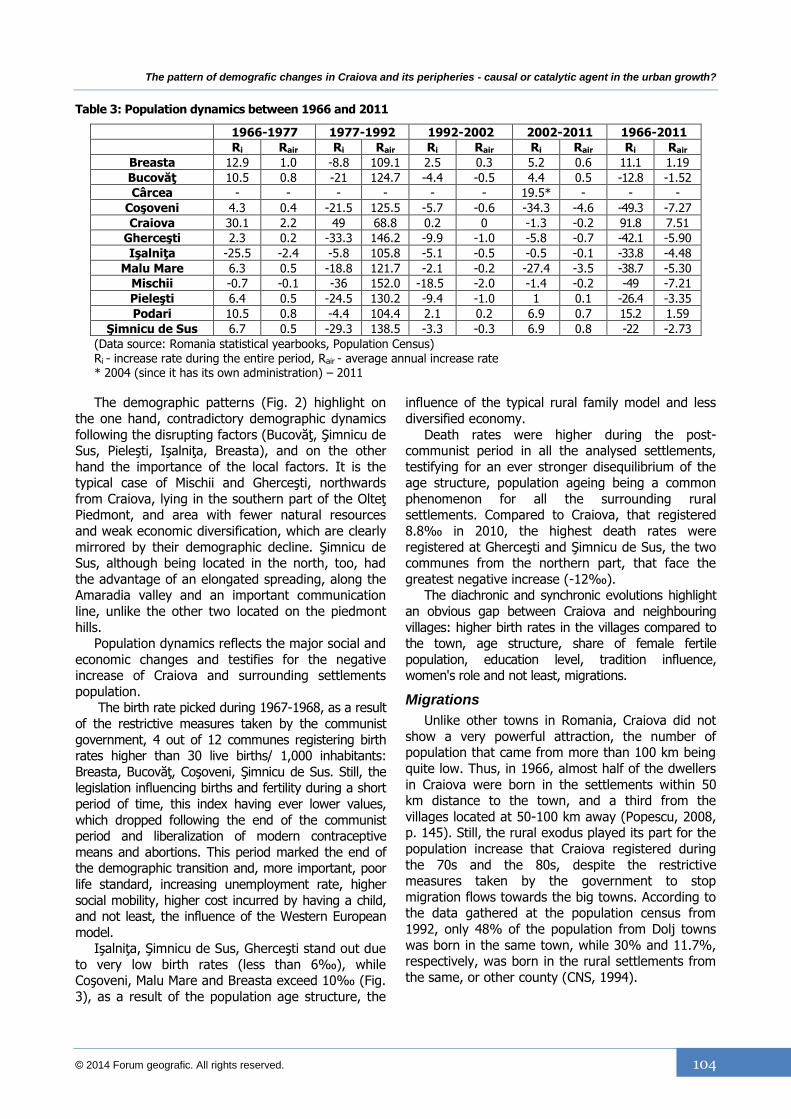
Table 3: Population dynamics between 1966 and 2011
1966-1977 1977-1992 1992-2002 2002-2011 1966-2011
Ri Rair Ri Rair Ri Rair Ri Rair Ri Rair
Breasta 12.9 1.0 -8.8 109.1 2.5 0.3 5.2 0.6 11.1 1.19
Bucovăţ 10.5 0.8 -21 124.7 -4.4 -0.5 4.4 0.5 -12.8 -1.52
Cârcea - - - - - - 19.5* - - -
Coşoveni 4.3 0.4 -21.5 125.5 -5.7 -0.6 -34.3 -4.6 -49.3 -7.27
Craiova 30.1 2.2 49 68.8 0.2 0 -1.3 -0.2 91.8 7.51
Gherceşti 2.3 0.2 -33.3 146.2 -9.9 -1.0 -5.8 -0.7 -42.1 -5.90
Işalniţa -25.5 -2.4 -5.8 105.8 -5.1 -0.5 -0.5 -0.1 -33.8 -4.48
Malu Mare 6.3 0.5 -18.8 121.7 -2.1 -0.2 -27.4 -3.5 -38.7 -5.30
Mischii -0.7 -0.1 -36 152.0 -18.5 -2.0 -1.4 -0.2 -49 -7.21
Pieleşti 6.4 0.5 -24.5 130.2 -9.4 -1.0 1 0.1 -26.4 -3.35
Podari 10.5 0.8 -4.4 104.4 2.1 0.2 6.9 0.7 15.2 1.59
Şimnicu de Sus 6.7 0.5 -29.3 138.5 -3.3 -0.3 6.9 0.8 -22 -2.73
(Data source: Romania statistical yearbooks, Population Census) Ri - increase rate during the entire period, Rair - average annual increase rate * 2004 (since it has its own administration) – 2011
The demographic patterns (Fig. 2) highlight on
the one hand, contradictory demographic dynamics
following the disrupting factors (Bucovăţ, Şimnicu de Sus, Pieleşti, Işalniţa, Breasta), and on the other
hand the importance of the local factors. It is the typical case of Mischii and Gherceşti, northwards
from Craiova, lying in the southern part of the Olteţ Piedmont, and area with fewer natural resources
and weak economic diversification, which are clearly
mirrored by their demographic decline. Şimnicu de Sus, although being located in the north, too, had
the advantage of an elongated spreading, along the Amaradia valley and an important communication
line, unlike the other two located on the piedmont
hills. Population dynamics reflects the major social and
economic changes and testifies for the negative increase of Craiova and surrounding settlements
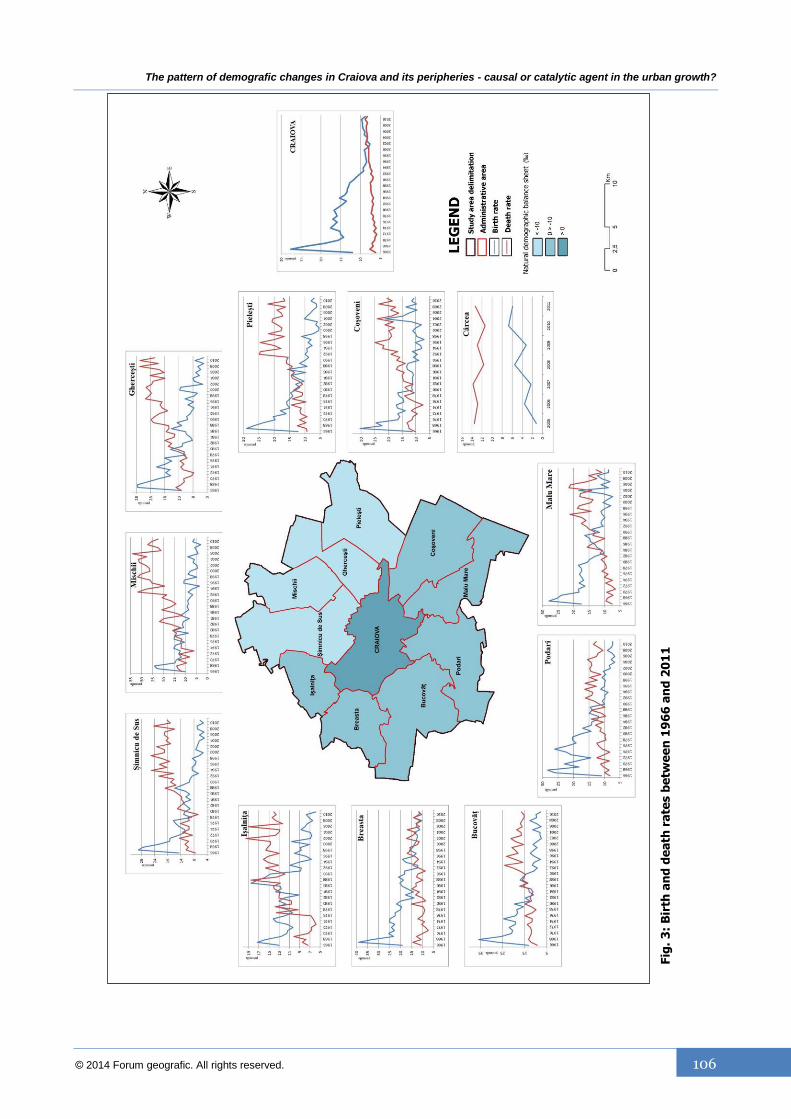
population. The birth rate picked during 1967-1968, as a result
of the restrictive measures taken by the communist
government, 4 out of 12 communes registering birth rates higher than 30 live births/ 1,000 inhabitants:
Breasta, Bucovăţ, Coşoveni, Şimnicu de Sus. Still, the legislation influencing births and fertility during a short
period of time, this index having ever lower values,
which dropped following the end of the communist period and liberalization of modern contraceptive
means and abortions. This period marked the end of the demographic transition and, more important, poor
life standard, increasing unemployment rate, higher
social mobility, higher cost incurred by having a child, and not least, the influence of the Western European
model. Işalniţa, Şimnicu de Sus, Gherceşti stand out due
to very low birth rates (less than 6‰), while Coşoveni, Malu Mare and Breasta exceed 10‰ (Fig.
3), as a result of the population age structure, the
influence of the typical rural family model and less
diversified economy.
Death rates were higher during the post-communist period in all the analysed settlements,
testifying for an ever stronger disequilibrium of the age structure, population ageing being a common
phenomenon for all the surrounding rural settlements. Compared to Craiova, that registered
8.8‰ in 2010, the highest death rates were
registered at Gherceşti and Şimnicu de Sus, the two communes from the northern part, that face the
greatest negative increase (-12‰). The diachronic and synchronic evolutions highlight
an obvious gap between Craiova and neighbouring
villages: higher birth rates in the villages compared to the town, age structure, share of female fertile
population, education level, tradition influence, women's role and not least, migrations.
Migrations
Unlike other towns in Romania, Craiova did not
show a very powerful attraction, the number of population that came from more than 100 km being
quite low. Thus, in 1966, almost half of the dwellers
in Craiova were born in the settlements within 50 km distance to the town, and a third from the
villages located at 50-100 km away (Popescu, 2008, p. 145). Still, the rural exodus played its part for the
population increase that Craiova registered during
the 70s and the 80s, despite the restrictive measures taken by the government to stop
migration flows towards the big towns. According to the data gathered at the population census from
1992, only 48% of the population from Dolj towns
was born in the same town, while 30% and 11.7%, respectively, was born in the rural settlements from
the same, or other county (CNS, 1994).
Forum geografic. Studii și cercetări de geografie și protecția mediului Volume XIII, Issue 1 (June 2014), pp. 101-101 http://dx.doi.org/10.5775/fg.2067-4635.2014.210.i
105 forumgeografic.ro
Fig
. 2
: P
op
ula
tio
n d
yn
am
ics i
n C
raio
va
an
d i
ts p
eri
ph
eri
es b
etw
ee
n 1
96
6 a
nd
2011
The pattern of demografic changes in Craiova and its peripheries - causal or catalytic agent in the urban growth?
© 2014 Forum geografic. All rights reserved. 106
Fig
. 3
: B
irth
an
d d
ea
th r
ate
s b
etw
ee
n 1
96
6 a
nd
20
11
Forum geografic. Studii și cercetări de geografie și protecția mediului Volume XIII, Issue 1 (June 2014), pp. 101-101 http://dx.doi.org/10.5775/fg.2067-4635.2014.210.i
107 forumgeografic.ro
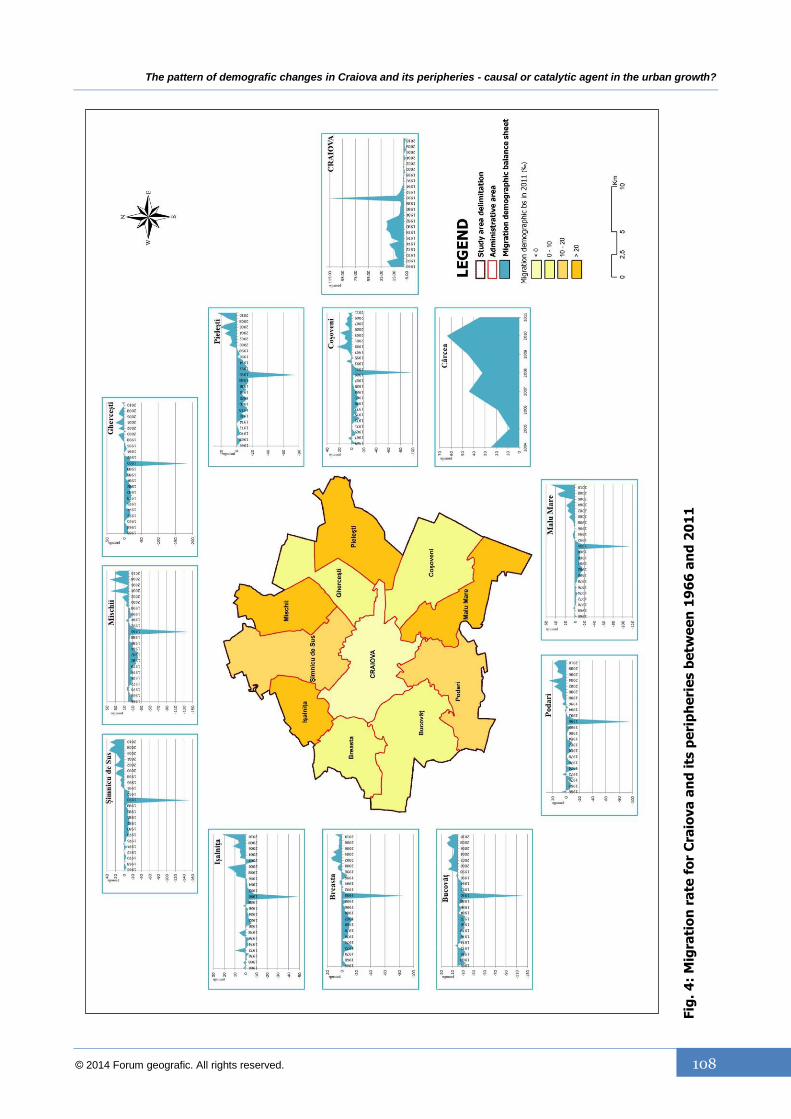
The highest migration rates peaked at 5,000 –
7,000 persons, i.e. 25-30‰ and were registered
during the 1977-1983; still, Craiova had the lowest immigration rate compared to the other county seats
in the region (Popescu, 2009), but just like all the big towns from the communist period, had a
considerable number of weekly or seasonal commuters (up to 10,000 persons, including
students) (Ianoş, 1993).
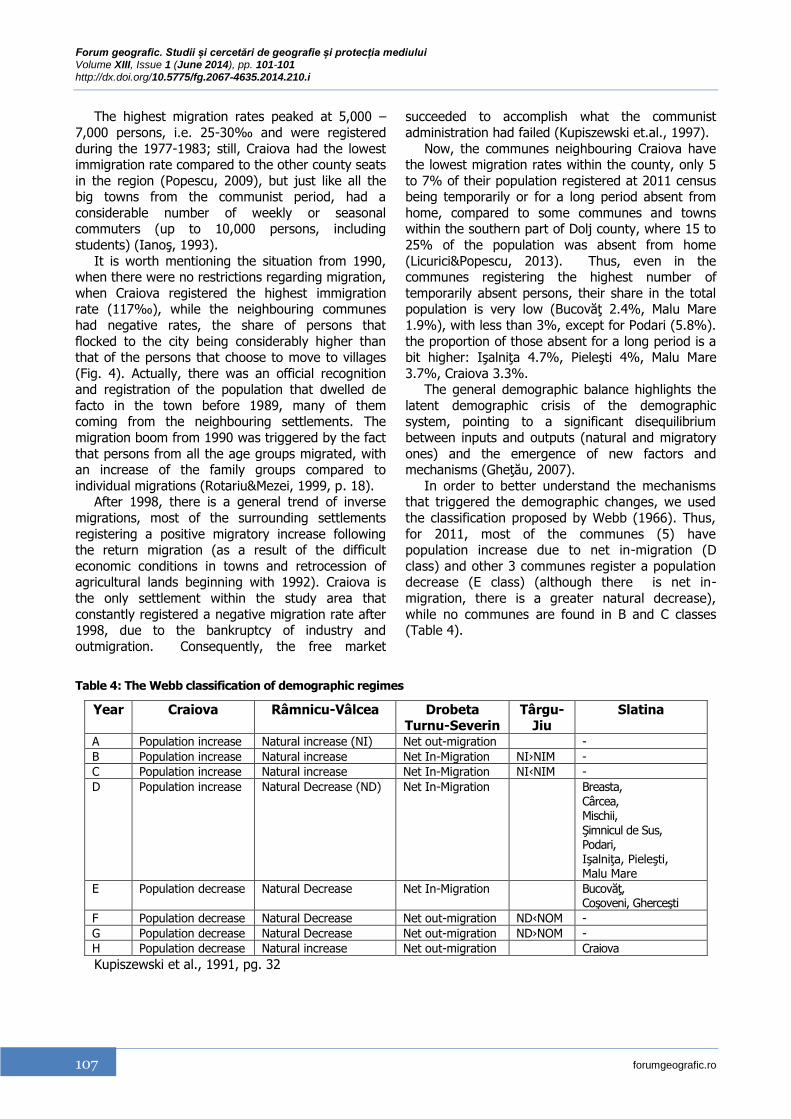
It is worth mentioning the situation from 1990, when there were no restrictions regarding migration,
when Craiova registered the highest immigration rate (117‰), while the neighbouring communes
had negative rates, the share of persons that
flocked to the city being considerably higher than that of the persons that choose to move to villages
(Fig. 4). Actually, there was an official recognition and registration of the population that dwelled de
facto in the town before 1989, many of them coming from the neighbouring settlements. The
migration boom from 1990 was triggered by the fact
that persons from all the age groups migrated, with an increase of the family groups compared to
individual migrations (Rotariu&Mezei, 1999, p. 18). After 1998, there is a general trend of inverse
migrations, most of the surrounding settlements
registering a positive migratory increase following the return migration (as a result of the difficult
economic conditions in towns and retrocession of agricultural lands beginning with 1992). Craiova is
the only settlement within the study area that
constantly registered a negative migration rate after 1998, due to the bankruptcy of industry and
outmigration. Consequently, the free market
succeeded to accomplish what the communist
administration had failed (Kupiszewski et.al., 1997).
Now, the communes neighbouring Craiova have the lowest migration rates within the county, only 5
to 7% of their population registered at 2011 census being temporarily or for a long period absent from
home, compared to some communes and towns within the southern part of Dolj county, where 15 to
25% of the population was absent from home
(Licurici&Popescu, 2013). Thus, even in the communes registering the highest number of
temporarily absent persons, their share in the total population is very low (Bucovăţ 2.4%, Malu Mare
1.9%), with less than 3%, except for Podari (5.8%).
the proportion of those absent for a long period is a bit higher: Işalniţa 4.7%, Pieleşti 4%, Malu Mare
3.7%, Craiova 3.3%. The general demographic balance highlights the
latent demographic crisis of the demographic system, pointing to a significant disequilibrium
between inputs and outputs (natural and migratory
ones) and the emergence of new factors and mechanisms (Gheţău, 2007).
In order to better understand the mechanisms that triggered the demographic changes, we used
the classification proposed by Webb (1966). Thus,
for 2011, most of the communes (5) have population increase due to net in-migration (D
class) and other 3 communes register a population decrease (E class) (although there is net in-
migration, there is a greater natural decrease),
while no communes are found in B and C classes (Table 4).
Table 4: The Webb classification of demographic regimes
Year Craiova Râmnicu-Vâlcea Drobeta Turnu-Severin
Târgu-Jiu
Slatina
A Population increase Natural increase (NI) Net out-migration -
B Population increase Natural increase Net In-Migration NI›NIM -
C Population increase Natural increase Net In-Migration NI‹NIM -
D Population increase Natural Decrease (ND) Net In-Migration Breasta, Cârcea, Mischii, Şimnicul de Sus, Podari, Işalniţa, Pieleşti, Malu Mare
E Population decrease Natural Decrease Net In-Migration Bucovăţ, Coşoveni, Gherceşti
F Population decrease Natural Decrease Net out-migration ND‹NOM -
G Population decrease Natural Decrease Net out-migration ND›NOM -
H Population decrease Natural increase Net out-migration Craiova
Kupiszewski et al., 1991, pg. 32
The pattern of demografic changes in Craiova and its peripheries - causal or catalytic agent in the urban growth?
© 2014 Forum geografic. All rights reserved. 108
Fig
. 4
: M
igra
tio
n r
ate
fo
r C
raio
va
an
d i
ts p
eri
ph
eri
es b
etw
ee
n 1
96
6 a
nd
20
11
Forum geografic. Studii și cercetări de geografie și protecția mediului Volume XIII, Issue 1 (June 2014), pp. 101-101 http://dx.doi.org/10.5775/fg.2067-4635.2014.210.i
109 forumgeografic.ro
Conclusion
A complex analysis of human resources is highly
necessary in order to fully understand the
characteristics of human settlements. The demographic dynamics (together with the
population age structure), points to the town vitality and offers a genuine perspective on the evolution of
the human factor and its potential to influence the
urban development one way or another. Craiova and its peripheries are witnessing
significant demographic changes, following several unfavourable demographic mechanisms:
considerable decrease of birth rates, below the death rate, demographic ageing process with severe
economic and social effects. Unfortunately, the
negative trend of population dynamics and the demographic characteristics will continue, at least in
the near future. As a result of the lower number of inhabitants
and strong dependency to the center, the suburban
communes as well as those neighbouring the town witness significant oscillations, being more
vulnerable from the demographic point of view than the town itself. This is a proof of spatial inequalities
related to the rural area, local resources that were not properly capitalized and, not least, the
relationships between the polarizing town and its
peripheries. The study concludes that for Craiova
municipality, the urban growth and suburbanization phenomenon testify for changes of the territorial
relations with the neighbouring rural communes, as
well as changes in the lifestyle and consumption models rather than a population increase.
References
Erdeli, G., Cucu, V. (2007). România. Populaţie. Aşezări umane. Economie, Edit. Transversal, Bucureşti.
Gheţău, V. (2007). Declinul demografic şi viitorul populaţiei României. O perspectivă din anul 2007 asupra populaţiei României din secolul 21, Academia Română, Institutul Naţional de Cercetări Economice,
Centrul de Cercetări Demografice „Vladimir Trebici”, Edit. Alpha MDN, Buzău.
Gregory, D., Johnston, R., Pratt, G., Watts, M., Whatmore, S. (2009). The dictionary of human geography, 5th Edition, Wiley-Blackwell.
Ianoş, I. (2004). Dinamica urbană. Aplicaţii la oraşul şi sistemul urban românesc, Edit. Ehnică, Bucureşti.
Ianoş, I. (1993). Comparative analysis on urban and industrial hierarchies of Romanian towns in 1990, Geojournal, 29 (1), 49-56.
Kupiszewski, M., Berinde, D., Teodorescu, V., Durham, H., & Rees, P. (1997). Internal migration and regional population dynamics in Europe: Romanian case study.
Licurici, Mihaela, Popescu, Liliana (2013). Vulnerability indicators for natural and technological hazards, in Bălteanu, D., Sima, M. (eds), Hazard assessment and mitigation in the Danube floodplain (Calafat-Vidin-Turnu-Măgurele-Nikopole Sector), Universitaria, Craiova.
Popescu (Truşcă), Liliana Sonia (2009). Oraşele din Oltenia. Dinamica fenomenelor geodemografice (rezumatul tezei de doctorat), Universitatea din Bucureşti, Facultatea de Geografie.
Popescu, Liliana (2008). Urbanizarea şi migraţia internă
din Oltenia în perioada 1977-2002, Forum Geografic, 7, Universitaria, Craiova.
Popescu, Liliana (2007). Changes in age-group structure of the urban population within Vâlcea county during 1977-2002 period/ Schimbări în structura pe grupe de vârstă a populaţiei urbane din judeţul Vâlcea între 1977-2002, Geographical Phorum. Geographical Studies and environment protection research, nr. 6, 146-151.
Puwac, H. (1994). Status report from Romania, Ageing International, 21 (3), 48-53.
Rotariu, T., Mezei, E. (1999). Asupra unor aspecte ale migraţiei interne recente din România, Sociologie Românească, III, serie nouă (3), 5-37.
Şoşea, Cristina (2013). A conceptual viewpoint on the urban periphery. Craiova, Romania as a case study, Geographical Phorum. Geographical Studies and
environment protection research, vol. XII, 2/December, 187-193.
Suditu, B., Ginavar, Anca, Muică, Ana, Iordăchescu, Crenguţa, Vârdol, Amalia, Ghinea, B. (2010). Urban sprawl characteristics and typologies in Romania, Human Geographies-Journal of Studies and Research in Human Geography, 4, 2, pg. 79-87.
Surd, V. (2003). Geografia aşezărilor, Presa Universitară Clujeană, Cluj-Napoca.
Voiculescu, Sorina (2004). Oraşele din Câmpia de Vest. Structuri şi funcţionalităţi urbane, Edit. Universităţii de Vest din Timişoara, Timişoara.
Trebici, V. (1979). Demografia, Edit. Ştiinţifică şi Enciclopedică, Bucureşti.
Warf, B. (2006). Encyclopedia of human geography, Sage Publications.
*** (1984). Geografia României, vol. II, Geografia umană şi economică, Edit. Academiei, Bucureşti.
*** (2006). Cartea Verde a Populaţiei în România, Comisia Naţională pentru Populaţie şi Dezvoltare.
(2011). Cities of tomorrow. Challenges, visions, ways forward, European Union, Regional Policy.