Low latitude floral assemblage from the Late Oligocene sediments
Organic Geochemistry 71 (2014) 43–59
Contents lists available at ScienceDirect
Organic Geochemistry
journal homepage: www.elsevier .com/locate /orggeochem
The Oligocene Maikop series of Lahich (eastern Azerbaijan):Paleoenvironment and oil–source rock correlation
http://dx.doi.org/10.1016/j.orggeochem.2014.04.0050146-6380/� 2014 Elsevier Ltd. All rights reserved.
⇑ Corresponding author. Tel.: +43 3842 402 6356; fax: +43 3842 402 6302.E-mail address: [email protected] (A. Bechtel).
Achim Bechtel a,⇑, Ulviyya Movsumova a,b, Jörg Pross c, Reinhard Gratzer a, Stjepan Coric d,Reinhard F. Sachsenhofer a
a Department of Applied Geosciences and Geophysics, Montanuniversität Leoben, Peter-Tunner-Str. 5, A-8700 Leoben, Austriab Azerbaijan National Academy of Sciences, Geology Institute, 29 A.H. Javid Pr., Baku 370143, Azerbaijanc Institute of Earth Sciences, Heidelberg University, Im Neuenheimer Feld 234, D-69120 Heidelberg, Germanyd Department of Sedimentgeology, Geological Survey of Austria, Neulinggasse 38, A-1030 Vienna, Austria
a r t i c l e i n f o a b s t r a c t
Article history:Received 12 December 2013Received in revised form 31 March 2014Accepted 3 April 2014Available online 13 April 2014
Keywords:BiomarkerDepositional environmentEastern ParatethysOil–source rock correlationEoceneOligocene
The Maikop Formation, deposited in eastern Azerbaijan during Oligocene and Early Miocene, represents aprolific source unit for the oils found within the southern Gobustan area and the Kura Depression. Basedon biomarker characteristics, the oils are believed to have originated from a clastic source rock depositedin an anoxic to suboxic, transitional marine environment with low to moderate input of terrigenousorganic matter. However, due to the thermal immaturity of accessible Maikop rocks, oil–source rock cor-relation based on biomarker fingerprints is hampered.
The results from a sedimentary succession sampled in the Shemakha–Gobustan area near the village ofLahich revealed the presence of marginally mature (Rr = 0.6–0.7%) Maikop rocks. Based on lithology, geo-chemical data and paleontological analyses, the sampled section contains Upper Eocene and Lower Oli-gocene sediments. Palynological analyses of dinoflagellate cysts indicate an early Rupelian to earlyChattian (Oligocene) age for the upper part of the investigated Maikop succession. However, the strati-graphic position of the middle and lower part of the succession remains unclear.
Maceral composition, as well as biomarker and stable isotope (C, N) data indicate a major contributionof aquatic organisms and variable inputs from macrophytes and land plants to organic matter depositionduring the Oligocene. Microbial communities most probably included heterotrophic bacteria and cyano-bacteria, as well as green sulfur bacteria. Higher inputs of terrigenous organic matter occurred duringdeposition of the lower part of the succession. Increased remineralisation of organic matter in the watercolumn is suggested to result in low TOC and hydrocarbon contents, as well as 15N enriched total nitrogenof the Eocene to earliest Oligocene sediments. Organic carbon accumulation during the Oligoceneoccurred in a stratified, episodically euxinic environment. This is indicated by low TOC/S ratios and highercontents of aryl isoprenoids in several samples from the upper units. A moderate to good oil–source rockcorrelation with oils from the Kura Depression is indicated by sterane and triterpane fingerprints as wellas carbon isotopic composition of hydrocarbon fractions.
� 2014 Elsevier Ltd. All rights reserved.
1. Introduction
Rocks of the Oligocene–Early Miocene Maikop Formation serveas the sources for the majority of the petroleum produced in theCaspian region (Guliyev et al., 2001). Within eastern Azerbaijan,they have been studied in surface outcrops reaching a thicknessof up to 1200 m. The formation consists of fine grained clastic rockscontaining elevated levels of organic carbon (Feyzullayev et al.,2001). The accumulation of organic rich sediments has been inter-
preted to occur during an episode of isolation of the Paratethys Seaduring Alpine–Himalayan collision (Golonka, 2007).
Assigning an age to the Maikop Formation is problematicbecause of the homogenous lithological appearance and the scar-city of fossils (Goubkin, 1912; Mirchink, 1933). Only recently, ele-mental geochemistry in combination with stable isotope andRock–Eval pyrolysis data provided information on internal varia-tions within the Maikop Formation and has been used for chemos-tratigraphy (Hudson et al., 2008).
Several publications addressed organic matter (OM) maturityand source rock potential, as well as organic geochemical compo-sition of the Maikop series (Lerche et al., 1997; lnan et al., 1998;

44 A. Bechtel et al. / Organic Geochemistry 71 (2014) 43–59
Feyzullayev et al., 2001). Biomarker correlation studies of theserocks with the oils within the Kura Depression have been ham-pered by the insufficient number of rock samples and by their ther-mal immaturity (lnan et al., 1998). Recent organic geochemicalanalytical results for immature Maikop rocks from a section nearAngeharan (Fig. 1) revealed insights into paleoenvironmental con-ditions during the Oligocene in this part of the Paratethys (Bechtelet al., 2013).
The aim of this study was to extend our knowledge about theevolution of the depositional environment during the Oligocenein the Shemakha–Gobustan area (Fig. 1) based on outcrop samplescollected from a sedimentary succession of the Upper Eocene andthe Oligocene Maikop Formation near Lahich (eastern Azerbaijan).Bulk parameters are discussed, together with the molecular andstable carbon isotopic composition of organic matter from selectedsamples. The maturity assessment of the sedimentary succession isbased on vitrinite reflectance measurements and biomarkerparameters. The distribution patterns of steranes and triterpanesare compared with those obtained during previous studies(Abrams and Narimanov, 1997; lnan et al., 1998).
2. Geological setting
Mudstones to siltstones of the Oligocene–Lower Miocene Mai-kop Formation are exposed in the Shemakha–Gobustan area(Fig. 1). This oil and gas province has been described by Guliyevet al. (2001) as a depression, filled by Cenozoic sediments andaffected by intensive folding and tectonic overthrusts. Tectonicsubsidence within the Shemakha–Gobustan synclinorium lastedfrom Mesozoic to Palaeogene times, resulting in thick Palaeogeneand Neogene sedimentary successions. Oligocene–Lower Miocenesediments (Maikop series) cover a large part of the study area.
The Maikop series is underlain by the Eocene Koun Formationconsisting of claystone, interbedded siltstone, marl, limestoneand volcanic tuff (Johnson et al., 2009). The Eocene strata are lowin total organic carbon (TOC) and contain inertinite and woody
N 41°00'
N40°00'
AngeharanAngeharan
ShemakhaShemakha
KhKh
LahichLahich
E 48°00' E
Mesozoic (mainly Cretaceous) Paleogene
CASPIAN
SEA
IRAN
RUSSIAGEORGIA
ARMENIA
AZERBAIJANAZERBAIJAN
Fig. 1. Simplified geological map of the Shemakha—Gobustan area (eastern Azerbaijan)Sampling locations in the Lahich trough and a previously studied profile near Angeharan ((2008).
organic matter (OM). The Maikop Formation is composed of lightgray to brownish, occasionally silty claystones with common cmto dm scale, organic rich, dark gray intervals. The Maikop mud-stones are overlain by claystones and siltstones of the middle Mio-cene Spirialis Beds (Tarkhan and Chokrak formations) and themiddle–late Miocene Diatom Suite, known for the generation ofliquid and gas hydrocarbons (Feyzullayev et al., 2001). Previousstudies revealed TOC contents ranging from 0.2–15.1%, with aver-age values of 1.6% and 1.9%, respectively (Feyzullayev et al., 2001;Hudson et al., 2008). Hydrogen Index (HI) values are reported tovary between 11 and 612 mg HC/g TOC, with an average of146 mg HC/g TOC (Feyzullayev et al., 2001). OM in the Maikoprocks has been characterized as amorphous algal-derived organicmaterial. Consistent results were obtained during a recent studyof the Maikop series of Angeharan (Bechtel et al., 2013).
3. Samples and analytical methods
The sampled section, including the Maikop, is located in theLahich trough (N 40�520 E 48�230) in the north of the Shemakha–Gobustan province. The samples were collected from two outcrops(sample sets LV and LN) along the slope of the southward-over-turned syncline by colleagues of the Azerbaijan National Academyof Sciences. Eocene and Oligocene lithological units were distin-guished based on grain size, degree of lamination and color(Fig. 2). Age assignment is verified by paleontological data in thisstudy. The section contains mudstones, mottled claystones, calcar-eous clayey siltstones, siltstones and limestones. Differences inmineralogy, OM content and grain size distribution cause a layer-ing of mudstones and claystones, with higher clay mineral andlower quartz contents occurring in the organic rich (i.e., darkbrown) layers. Banding of calcareous clayey siltstones is causedby intercalation of siltstone layers. Generally, samples were takenat a sampling interval of 10 m. In the case of very thick monoto-nous successions, the sampling interval was increased up to200 m (Fig. 2). However, because of the complicated tectonic
25 km
Sumgait
N
Baku
Sampling site
ilmiliilmili
49°00' E 50°00'
Neogene + Quaternary
claystone, siltstoneclaystone, siltstoneclaystoneclaystone
Profiles studied by Hudson et al. (2008)
Profile studied by Bechtel et al. (2013)
including distribution and lithofacies of the Lower Maikop Subgroup (Oligocene).Bechtel et al., 2013) are shown, as well as investigated sites included in Hudson et al.

LV-1
Sample
Clayey Siltstone
Siltstone
Claystone,Mudstone
Light
Dark
Samples selected forpaleontological analyes
LV-2LV-3LV-4LV-5LV-6LV-7LN-1LN-3LN-4LN-5LN-6
LN-9
LN-7
LN-10
LN-12
LN-13
LN-14
LN-15LN-16LN-17LN-18LN-19
Limestone Upp
er
Eoce
neLo
wer
Olig
ocen
e (M
aiko
p)
_ _ _ _ _ _ _ __ _ _ _ _ _ _ __ _ _ _ _ _ _ _
_ _ _ _ _ _ _ _. . . . . . . . . . . ._ _ _ _ _ _ _ _
_ _ _ _ _ _ _ __ _ _ _ _ _ _ __ _ _ _ _ _ _ __ _ _ _ _ _ _ __ _ _ _ _ _ _ __ _ _ _ _ _ _ __ _ _ _ _ _ _ _. . . . . . . . . . . ._ _ _ _ _ _ _ __ _ _ _ _ _ _ _. . . . . . . . . . . ._ _ _ _ _ _ _ _
. . . . . .. . . . . .
. . . . . . . . . . . .
. . . . . . . . . . . .
. . . . . .. . . . . .
. . . . . . . . . . . .
. . . . . . . . . . . .
_ _ _ _ _ _ _ __ _ _ _ _ _ _ __ _ _ _ _ _ _ _
_ _ _ _ _ _ _ _. . . . . . . . . . . ._ _ _ _ _ _ _ _
_ _ _ _ _ _ _ _. . . . . . . . . . . ._ _ _ _ _ _ _ _
. . . . . .. . . . . .
. . . . . . . . . . . .
. . . . . . . . . . . .
. . . . . .. . . . . .
. . . . . . . . . . . .
. . . . . . . . . . . .
. . . . . .. . . . . .
. . . . . . . . . . . .
. . . . . . . . . . . .
. . . . . .. . . . . .
. . . . . . . . . . . .
. . . . . . . . . . . .
_ _ _ _ _ _ _ _. . . . . . . . . . . ._ _ _ _ _ _ _ _
_ _ _ _ _ _ _ _. . . . . . . . . . . .
. . . . . .. . . . . .
. . . . . . . . . . . .
. . . . . . . . . . . .
. . . . . .. . . . . .
. . . . . . . . . . . .
. . . . . . . . . . . .
_ _ _ _ _ _ _ _. . . . . .. . . . . .
_ _ _ _ _ _ _ _. . . . . . . . . . . .
_ _ _ _ _ _ _ __ _ _ _ _ _ _ __ _ _ _ _ _ _ _
_ _ _ _ _ _ _ _. . . . . . . . . . . .
. . . . . .. . . . . ._ _ _ _ _ _ _ _0
50
100
150
200
250
300
350
400
450
500
550
600
650
700
750
800
Dis
tanc
e fr
om to
p (m
)
Fig. 2. Lithology of the Eocene units and the Oligocene Maikop series as well assampling positions in the cross-section from Lahich.
A. Bechtel et al. / Organic Geochemistry 71 (2014) 43–59 45
situation, the thickness represented by the profile is poorly con-strained. A total of 23 samples (50–100 g, each) were collected.Table 1 presents an overview about sampling position, lithostratig-raphy and performed analyses.
Polished blocks were prepared from selected samples fororganic petrographic investigation (Table 1). Maceral analysiswas performed with a Leica MPV microscope using reflected whiteand fluorescent light. Due to abundant mineral matter, the relativeproportions (vol%) of land plant-derived macerals (vitrinite, spori-nite), of alginite and of inertinite were estimated based on carefulmicroscopic inspection.
In order to obtain biostratigraphic age control for the succes-sion, 12 samples (Table 1) were studied for their content oforganic-walled dinoflagellate cysts (dinocysts). Sample processingfollowed standard palynological techniques, including treatmentwith HCl (10%) and HF (38%), careful oxidation with HNO3, ultra-sonification (1 min) and sieving through a 15 lm nylon mesh(e.g., Pross and Schmiedl, 2002). For each sample, at least twoslides were prepared using glycerin jelly as the mounting mediumand examined qualitatively for dinocyst content. The microscopeslides are stored in the collection of the Institute of Earth Sciences,Heidelberg University. Smear slides for investigation on calcareousnannoplankton were prepared for seven samples (Table 1) usingstandard procedures (Perch-Nielsen, 1985) and examined under a
Leica DMLP light microscope (cross and parallel nicols) with1000� magnification.
The total carbon and sulfur contents were determined with aLeco elemental analyser on all samples. Total organic carbon(TOC) was measured with the same instrument on samples pre-treated for 2 h at 60 �C with 6 N HCl. Total inorganic carbon wascalculated by difference. Pyrolysis was carried out using a DelsiRock–Eval Version RE II instrument. With this method, the amountof pyrolyzate (S2, mg HC/g rock) released from kerogen duringgradual heating in a helium stream is normalized to TOC to givethe Hydrogen Index (HI = (S2 � 100)/TOC). The temperature atmaximum generation per unit time (Tmax) serves as a maturationindicator.
For carbon and nitrogen isotope analyses of total organic mat-ter, as well as carbon isotope analyses on saturated and aromatichydrocarbon fractions of rock extracts (Table 1), the samples wereplaced into tin foil boats and combusted using an elemental ana-lyzer (Flash EA 1112) at 1020 �C in an excess of oxygen. The result-ing N2 and CO2, separated by column chromatography, wereanalyzed online by the DELTA V ir-MS, mentioned above. The13C/12C and 15N/14N isotope ratios of the CO2 and N2 from a samplewere compared with the corresponding ratio in reference gases,calibrated against the PDB and the air standards, respectively.The reproducibility of the total analytical procedure is in the rangeof 0.1–0.2‰.
For organic geochemical analyses, 10 g of selected homogenizedsample (Table 1) was extracted for ca. 1 h using dichloromethanein a Dionex ASE 200 accelerated solvent extractor at 75 �C and50 bar. After evaporation of the solvent to 0.5 ml total solution ina Zymark TurboVap 500 closed cell concentrator, asphaltenes wereprecipitated from a hexane:dichloromethane solution (80:1) andseparated using centrifugation. The hexane soluble fractions wereseparated into NSO compounds, saturated hydrocarbons and aro-matic hydrocarbons using medium pressure liquid chromatogra-phy (MPLC) with a Köhnen-Willsch instrument (Radke et al., 1980).
The saturated and aromatic hydrocarbon fractions were ana-lyzed with a gas chromatograph equipped with a 30 m DB-5MSfused silica capillary column (i.d. 0.25 mm; 0.25 lm film thickness)and coupled to a Finnigan MAT GCQ ion trap mass spectrometer(GC–MS system). The oven temperature was programmed from70–300 �C at 4 �C/min, followed by an isothermal period of15 min. Helium was used as carrier gas. The sample was injectedsplitless, with the injector temperature at 275 �C. The spectrometerwas operated in the EI (electron ionization) mode over a scan rangefrom m/z 50–650 (0.7 s total scan time). Data were processed witha Finnigan data system. Individual compounds were identified onthe basis of retention time in the total ion current (TIC) chromato-gram and comparison of the mass spectra with published data. Rel-ative percentages and absolute concentrations of differentcompound groups in the saturated and aromatic hydrocarbon frac-tions were calculated using peak areas in the TIC chromatogramsin relation to those of internal standards (deuterated n-tetracosaneand 1,10-binaphthyl, respectively), or by integration of peak areasin appropriate mass chromatograms using response factors to cor-rect for the intensities of the fragment ion used for quantificationof the total ion abundance. The concentrations were normalizedto TOC.
4. Results and interpretation
4.1. Paleontological analyses
4.1.1. PalynologyOf the 12 samples processed (Table 1), five (LV-2, LV-7, LN-4,
LN-5, LN-9) yielded low diversity dinocyst assemblages; preserva-
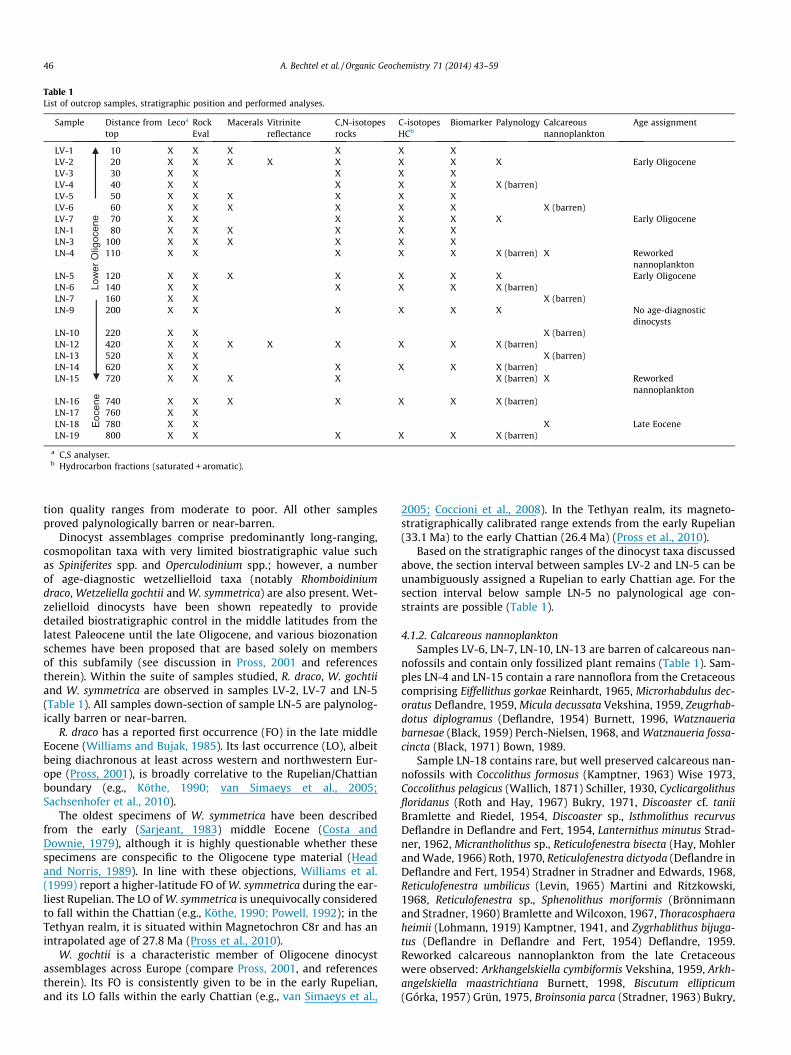
Table 1List of outcrop samples, stratigraphic position and performed analyses.
Sample Distance fromtop
Lecoa RockEval
Macerals Vitrinitereflectance
C,N-isotopesrocks
C-isotopesHCb
Biomarker Palynology Calcareousnannoplankton
Age assignment
LV-1
Low
er O
ligoc
ene
Eoce
ne
10 X X X X X XLV-2 20 X X X X X X X X Early OligoceneLV-3 30 X X X X XLV-4 40 X X X X X X (barren)LV-5 50 X X X X X XLV-6 60 X X X X X X X (barren)LV-7 70 X X X X X X Early OligoceneLN-1 80 X X X X X XLN-3 100 X X X X X XLN-4 110 X X X X X X (barren) X Reworked
nannoplanktonLN-5 120 X X X X X X X Early OligoceneLN-6 140 X X X X X X (barren)LN-7 160 X X X (barren)LN-9 200 X X X X X X No age-diagnostic
dinocystsLN-10 220 X X X (barren)LN-12 420 X X X X X X X X (barren)LN-13 520 X X X (barren)LN-14 620 X X X X X X (barren)LN-15 720 X X X X X (barren) X Reworked
nannoplanktonLN-16 740 X X X X X X X (barren)LN-17 760 X XLN-18 780 X X X Late EoceneLN-19 800 X X X X X X (barren)
a C,S analyser.b Hydrocarbon fractions (saturated + aromatic).
46 A. Bechtel et al. / Organic Geochemistry 71 (2014) 43–59
tion quality ranges from moderate to poor. All other samplesproved palynologically barren or near-barren.
Dinocyst assemblages comprise predominantly long-ranging,cosmopolitan taxa with very limited biostratigraphic value suchas Spiniferites spp. and Operculodinium spp.; however, a numberof age-diagnostic wetzellielloid taxa (notably Rhomboidiniumdraco, Wetzeliella gochtii and W. symmetrica) are also present. Wet-zelielloid dinocysts have been shown repeatedly to providedetailed biostratigraphic control in the middle latitudes from thelatest Paleocene until the late Oligocene, and various biozonationschemes have been proposed that are based solely on membersof this subfamily (see discussion in Pross, 2001 and referencestherein). Within the suite of samples studied, R. draco, W. gochtiiand W. symmetrica are observed in samples LV-2, LV-7 and LN-5(Table 1). All samples down-section of sample LN-5 are palynolog-ically barren or near-barren.
R. draco has a reported first occurrence (FO) in the late middleEocene (Williams and Bujak, 1985). Its last occurrence (LO), albeitbeing diachronous at least across western and northwestern Eur-ope (Pross, 2001), is broadly correlative to the Rupelian/Chattianboundary (e.g., Köthe, 1990; van Simaeys et al., 2005;Sachsenhofer et al., 2010).
The oldest specimens of W. symmetrica have been describedfrom the early (Sarjeant, 1983) middle Eocene (Costa andDownie, 1979), although it is highly questionable whether thesespecimens are conspecific to the Oligocene type material (Headand Norris, 1989). In line with these objections, Williams et al.(1999) report a higher-latitude FO of W. symmetrica during the ear-liest Rupelian. The LO of W. symmetrica is unequivocally consideredto fall within the Chattian (e.g., Köthe, 1990; Powell, 1992); in theTethyan realm, it is situated within Magnetochron C8r and has anintrapolated age of 27.8 Ma (Pross et al., 2010).
W. gochtii is a characteristic member of Oligocene dinocystassemblages across Europe (compare Pross, 2001, and referencestherein). Its FO is consistently given to be in the early Rupelian,and its LO falls within the early Chattian (e.g., van Simaeys et al.,
2005; Coccioni et al., 2008). In the Tethyan realm, its magneto-stratigraphically calibrated range extends from the early Rupelian(33.1 Ma) to the early Chattian (26.4 Ma) (Pross et al., 2010).
Based on the stratigraphic ranges of the dinocyst taxa discussedabove, the section interval between samples LV-2 and LN-5 can beunambiguously assigned a Rupelian to early Chattian age. For thesection interval below sample LN-5 no palynological age con-straints are possible (Table 1).
4.1.2. Calcareous nannoplanktonSamples LV-6, LN-7, LN-10, LN-13 are barren of calcareous nan-
nofossils and contain only fossilized plant remains (Table 1). Sam-ples LN-4 and LN-15 contain a rare nannoflora from the Cretaceouscomprising Eiffellithus gorkae Reinhardt, 1965, Microrhabdulus dec-oratus Deflandre, 1959, Micula decussata Vekshina, 1959, Zeugrhab-dotus diplogramus (Deflandre, 1954) Burnett, 1996, Watznaueriabarnesae (Black, 1959) Perch-Nielsen, 1968, and Watznaueria fossa-cincta (Black, 1971) Bown, 1989.
Sample LN-18 contains rare, but well preserved calcareous nan-nofossils with Coccolithus formosus (Kamptner, 1963) Wise 1973,Coccolithus pelagicus (Wallich, 1871) Schiller, 1930, Cyclicargolithusfloridanus (Roth and Hay, 1967) Bukry, 1971, Discoaster cf. taniiBramlette and Riedel, 1954, Discoaster sp., Isthmolithus recurvusDeflandre in Deflandre and Fert, 1954, Lanternithus minutus Strad-ner, 1962, Micrantholithus sp., Reticulofenestra bisecta (Hay, Mohlerand Wade, 1966) Roth, 1970, Reticulofenestra dictyoda (Deflandre inDeflandre and Fert, 1954) Stradner in Stradner and Edwards, 1968,Reticulofenestra umbilicus (Levin, 1965) Martini and Ritzkowski,1968, Reticulofenestra sp., Sphenolithus moriformis (Brönnimannand Stradner, 1960) Bramlette and Wilcoxon, 1967, Thoracosphaeraheimii (Lohmann, 1919) Kamptner, 1941, and Zygrhablithus bijuga-tus (Deflandre in Deflandre and Fert, 1954) Deflandre, 1959.Reworked calcareous nannoplankton from the late Cretaceouswere observed: Arkhangelskiella cymbiformis Vekshina, 1959, Arkh-angelskiella maastrichtiana Burnett, 1998, Biscutum ellipticum(Górka, 1957) Grün, 1975, Broinsonia parca (Stradner, 1963) Bukry,

A. Bechtel et al. / Organic Geochemistry 71 (2014) 43–59 47
1969, Eiffellithus turriseiffelii (Deflandre, 1954) Reinhardt, 1965, M.decussata Vekshina, 1959, Micrantholithus attenuatus Bramlette andSullivan, 1961, M. decoratus Deflandre, 1959, Placozygus fibuliformis(Reinhardt, 1964) Hoffmann, 1970, Prediscosphaera cretacea (Arkh-angelsky, 1912) Gartner, 1968, and W. barnesae (Black, 1959)Perch-Nielsen, 1968.
Sample LN-18 (Table 1) contains common I. recurvus with astratigraphic range from the Priabonian (NP18/NP19; Martini,1971) to early Rupelian (NP22). Disc-shaped discoasters (D. barba-diensis and D. saipanensis), the extinction of which marks theEocene/Oligocene boundary in terms of calcareous nannofossils,could not be observed in this sample. Based on the absence of dis-coasters and the presence of I. recurvus, this sample could be attrib-uted to the early Oligocene (NP21/22). However, based onlithology, bulk geochemical and stable isotope composition oforganic matter (see Sections 4.3 and 4.4), a late Eocene age seemsmore likely.
4.1.3. Age assignmentsBased on the paleontological interpretations, an Early Oligocene
age can be assigned to the interval between 20 and 120 m (samplesLV-2 to LN-5). For sample LN-18 (780 m), a Late Eocene age hasbeen confirmed. Differences in grain size, degree of laminationand color, as well as bulk geochemical and stable isotope dataargue for a Late Eocene age of the interval between 740 and800 m (LN-16 to LN-19) and an Early Oligocene age up-section(Fig. 2).
4.2. Organic petrography
Alginite is the predominant maceral (> 60 vol%) in the samplesfrom the upper part of the section (samples LV-2 to LN-3; Table 2).The OM of these samples shows abundant lamalginite, dominatingover telalginite. The relative abundance of telalginite increasestowards sample LN-3 (at 100 m down-section; Fig. 2). In certainsamples within the middle and lower part of the section (LN-5,LN-12, LN-16; Fig. 2), alginite is less common (between 55 vol%and 43 vol%) and lowest relative percentages were found in sam-ples LN-12 and LN-15 (Table 2).
Terrigenous organic matter is present in the samples as macer-als of the vitrinite and sporinite group. Sporinite is present in lowrelative abundances (< 10 vol%; Table 2). The proportion of vitriniteparticles slightly increases up to 30 vol% (Table 2) towards sampleLN-5 (Fig. 2). The siltstone sample LN-12 (at 420 m down-section)shows the highest abundance of elongated vitrinite particles(Table 2). Inertinite occurs in all samples in low amounts (up to10 vol%) and its relative abundance is highest in samples LN-1,LN-5 and LN-16 (Table 2).
Vitrinite reflectance measurements on two samples with a suf-ficient number of particles (> 50) revealed a thermal maturity of
Table 2Maceral composition (estimated) and vitrinite reflectance of selected samples.
Sample Distance from top Vitrinite (vol%) Sporinite (vol%)
LV-1 10 15 3LV-2 20 15 4LV-5 50 10 5LV-6 60 15 4LN-1 80 20 3LN-3 100 25 5LN-5 120 30 5LN-12 420 45 5LN-15 720 35 10LN-16 740 30 8
a Vitrinite reflectance.
0.60 ± 0.18%Rr (LV-2) and 0.68 ± 0.13%Rr (LN-12), respectively(Table 2).
Fish remains are found together with dinocysts in the samplesfrom the upper part of the section (LV-1 to LV-6, LN-1). Pyrite inthe samples is characterized by framboidal structures and rarecrystals, mainly in association with quartz. Microscopic inspectiondid not reveal significant oxidation of pyrite (Littke et al., 1991).The samples from the lower part of the section (LN-12, LN-16)are less enriched in pyrite.
4.3. Bulk geochemical parameters
The TOC content of the sediments vary between 0.21 wt% (lime-stone layer, sample LN-7 at 160 m) and 2.45 wt% (Table 3). Gener-ally, higher TOC contents are measured in the Oligocene Maikoprocks (mean TOC = 1.24 wt%) as compared to the Eocene samples(LN-16–LN-19; average TOC = 0.38 wt%). The data are consistentwith the average TOC values of Upper Eocene (0.33 wt%) and LowerOligocene (1.01 wt%) rocks from the Shemakha–Gobustan oil prov-ince obtained during previous studies (Johnson et al., 2009). Thehighest TOC contents are measured in samples LV-2 and LV-4(Table 1, Fig. 3a). Two limestone layers in the middle part of theMaikop series (samples LN-7 and LN-10 in the 160–220 m interval)and abundant carbonate cemented siltstone layers in the lowerpart of the section (520–720 m) are present in the samples inves-tigated (Fig. 2).
Sulfur is mainly bound in pyrite within the samples. The distri-bution of data points in the S versus TOC cross plot (Fig. 4) indi-cates two overall tendencies towards higher sulfur withincreasing organic carbon, characterized by distinct TOC/S ratios(Table 3; Figs. 3b and 4). The Oligocene samples from the intervalbetween 80 m and 520 m (samples LN-1 to LN-13, except of thelimestone samples LN-7 and LN-10) fall within the field character-istic for a euxinic depositional environment (Berner, 1984). TheTOC/S ratios of these samples are < 1.0 (Figs. 3b and 4). Generallyhigher TOC/S ratios (2.3–5.9, Table 3) are obtained from the sam-ples of the upper and lowermost part of the section (Fig. 3b). Someof these samples plot close to the relationship obtained from sed-iments deposited in the ‘‘normal’’ marine environment (TOC/S = 2.8, Fig. 4; Berner, 1984). However, samples LV-1, LV-2 andLV-6 from the upper part, as well as sample LN-14 from the lowerpart of the section (at 620 m) show TOC/S ratios > 4.0 (Table 4,Fig. 3b) normally found in freshwater deposits.
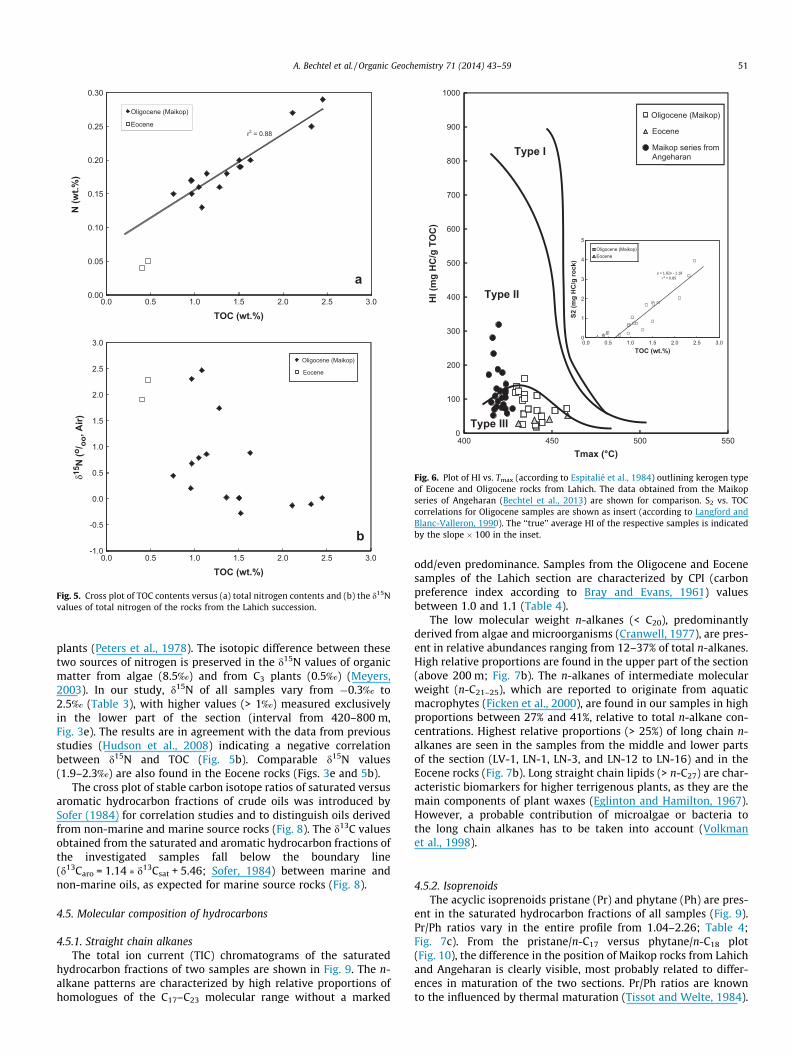
A strong positive relationship exists between TOC and N con-tents of the Maikop rocks (r2 = 0.88), suggesting that organic nitro-gen is the predominant nitrogen source (Fig. 5a). Relatively lowmolar TOC/N ratios between 5.9 and 10.8 (average TOC/N = 8.4)are obtained from the Oligocene samples (Table 3). A higher aver-age TOC/N ratio of 11.3 is obtained from the Eocene section(Table 3, Fig. 3b).
Inertinite (vol%) Alginite (vol%) Rra (%) Remarks
4 78 Fish scales5 76 0.60 ± 0.18 Dinocysts5 80 Dinocysts6 75 Fish scales
10 67 Dinocysts8 62
10 557 43 0.68 ± 0.138 47
10 52

Table 3Bulk geochemical parameters of the samples from the Eocene rocks and the Oligocene Maikop series of Lahich.
Sample Distance fromtop (m)
TOCa (wt%) TICb Sc TOC/S TOC/Nd S2(mg HC/g rock)
HIe
(mg HC/g TOC)Tmax
f
(�C)EOMg
(mg/g TOC)Sath HCi
(wt%, EOM)Aroj
HCNSOk Asphaltl d13CTOC
(‰. PDB)d15NTN
(‰. Air)
LV-1
Low
er O
ligoc
ene
Eoce
ne
10 1.50 0.08 0.33 4.51 8.8 0.85 57 434 66.2 38 3 58 1 �25.1 0.0LV-2 20 2.45 0.05 0.42 5.85 9.8 3.95 161 434 92.7 27 14 56 3 �25.9 0.0LV-3 30 2.11 0.06 1.04 2.03 9.1 2.05 97 433 103.9 48 10 39 3 �26.1 �0.1LV-4 40 2.32 0.10 3.17 0.73 10.8 3.18 137 430 112.0 45 16 38 1 �25.5 �0.1LV-5 50 1.51 0.00 1.77 0.85 9.2 1.80 120 429 117.5 45 10 42 2 �26.4 0.0LV-6 60 1.36 0.13 0.32 4.26 8.8 1.68 123 431 69.4 41 6 52 1 �25.7 0.0LV-7 70 1.52 0.05 0.47 3.24 9.3 1.74 114 435 98.7 52 9 37 1 �26.0 �0.3LN-1 80 1.13 0.29 2.12 0.53 7.4 0.75 66 442 85.9 48 14 30 8 �25.5 0.9LN-3 100 0.97 0.33 1.93 0.50 6.6 0.69 71 437 84.9 44 14 41 1 �26.2 0.7LN-4 110 1.63 0.42 2.48 0.66 9.5 1.82 111 442 105.1 27 8 63 2 �26.1 0.9LN-5 120 1.05 0.24 1.53 0.69 7.6 1.06 101 435 144.3 52 14 32 2 �26.0 0.8LN-6 140 0.76 0.24 1.30 0.58 5.9 0.14 18 441 62.6 59 12 24 5 �25.9 0.4LN-7 160 0.21 11.21 0.27 0.77 n.a.m 0.04 20 n.a. n.a. n.a. n.a. n.a. n.a. n.a.LN-9 200 0.96 0.23 2.18 0.44 6.6 0.23 24 441 61.3 62 8 24 6 �26.1 0.2LN-10 220 0.23 11.96 0.16 1.40 n.a. 0.06 26 434 n.a. n.a. n.a. n.a. n.a. n.a. n.a.LN-12 420 1.28 0.38 1.72 0.74 9.3 0.42 32 445 76.9 60 9 29 2 �26.4 1.7LN-13 520 0.49 3.53 0.66 0.74 n.a. 0.26 53 445 n.a. n.a. n.a. n.a. n.a. n.a. n.a.LN-14 620 0.97 1.71 0.23 4.18 7.5 0.63 66 453 75.9 59 6 32 3 �25.8 2.3LN-15 720 1.08 1.42 0.34 3.15 9.7 0.75 69 450 n.a. n.a. n.a. n.a. n.a. �26.2 2.5
LN-16 740 0.40 0.95 0.43 0.93 11.7 0.15 38 440 65.7 49 13 32 7 �24.2 1.9LN-17 760 0.39 0.93 0.26 1.51 n.a. 0.16 41 449 n.a. n.a. n.a. n.a. n.a. n.a. n.a.LN-18 780 0.26 1.19 0.11 2.27 n.a. 0.08 29 431 n.a. n.a. n.a. n.a. n.a. n.a. n.a.LN-19 800 0.47 1.74 0.17 2.74 11.0 0.25 52 459 71.2 60 9 29 3 �24.6 2.3
a Total organic carbon.b Total inorganic carbon.c Total sulphur.d Total organic carbon/total nitrogen (atom%/atom%).e Hydrogen Index.f Temperature of maximum pyrolysis yield.g Extractable organic matter.h Saturated.i Hydrocarbons.j Aromatic.k Polar compounds.l Asphaltenes.
m Not analysed.
48A
.Bechtelet
al./Organic
Geochem
istry71
(2014)43–
59

0 50 100 150 200
HI (mg HC/g TOC)
c
-27 -26 -25 -24 -23
δ13C TOC (o/oo, PDB) δ15N (o/oo, Air)
d
-1 0 1 2 3 4
e
0 4 8 12 16
TOC/S, TOC/N
TOC/S TOC/N
b
0
50
100
150
200
250
300
350
400
450
500
550
600
650
700
750
800
850
0 1 2 3 4
TOC, S (wt%)
TOC S
Dis
tanc
e fr
om to
p (m
)
a
Upp
erEo
cene
Low
er O
ligoc
ene
(Mai
kop)
“Nor
mal
“ mar
ine
TOC
/S =
2.8
Fig. 3. Variation with depth of (a) total organic carbon (TOC) and sulfur contents, (b) TOC/S (wt%/wt%) and TOC/N (atom%/atom%) ratios, (c) Hydrogen Index (HI), (d) carbonisotopic composition of organic matter, and (e) nitrogen isotope ratio of total nitrogen.
0.0
0.5
1.0
1.5
2.0
2.5
3.0
3.5
0.0 0.5 1.0 1.5 2.0 2.5 3.0
TOC (wt.%)
Oligocene (Maikop)
Eocene
S (w
t.%)
“Normal“ marine (TOC/S = 2.8)
Lacustrine
Euxinic
TOC/S = 1.0
Lim
esto
nes
Fig. 4. Cross plot of total sulfur (S) versus TOC contents of the rocks from the Lahichsuccession. The relationship obtained from ‘‘normal’’ marine sediments and thefields characteristic for freshwater and euxinic depositional environments areshown (according to Berner, 1984).
A. Bechtel et al. / Organic Geochemistry 71 (2014) 43–59 49
The Tmax values (429–459 �C) indicate the marginally mature tomature character of the OM in all samples. In the samples from theMaikop series, HI values vary from 20–161 mg HC/g TOC (Table 3;Figs. 3c and 6; Espitalié et al., 1984). Low HI values (29–69 mg HC/gTOC; Figs. 3c and 6) in the lower parts of the Maikop successionand in the Eocene rocks from Lahich suggest a relatively high con-tribution of humic material from land plants (Type III kerogen). Asmineral matrix effects may cause deviation toward lower HI val-ues, plots of S2 versus TOC can be applied for correction(Langford and Blanc-Valleron, 1990). The average ‘‘true’’ HI of Oli-gocene samples, obtained according to the slope of the S2 versus
TOC regression line (r2 = 0.85), is 182. The HI values of samplesfrom the Oligocene vary considerably (Figs. 3c and 6; Table 3). Acomparable average HI of 146 was found during previous studies(Feyzullayev et al., 2001).
The amounts of extractable organic matter (EOM) vary from61.3–144.3 mg/g TOC in the sedimentary succession (Table 3,Fig. 7a). Generally lower amounts of EOM are obtained from sam-ples below 120 m (sample LN-5; Table 3). The relative proportionsof hydrocarbons vary from 35–71% of EOM (Table 3). Saturatedhydrocarbons predominate by far over the aromatic hydrocarbonfractions. Beside hydrocarbons, the EOM is composed of polar com-pounds (NSO between 24% and 63% of EOM) and asphaltenes (1–8%of EOM, Table 3).
4.4. Stable isotope composition of organic matter
The carbon isotopic composition of TOC within the Maikop ser-ies falls within the range (d13C between �26.4‰ and �25.1‰,Table 3) reported from Oligocene sediments in the Paratethys(Hertelendi and Vetö, 1991; Schulz et al., 2002; Sachsenhoferet al., 2009; Bechtel et al., 2012, 2013). In contrast, the Eocene sam-ples yield heavier d13C values of�24.6‰ to�24.2‰ (Fig. 3d). Theseresults are in agreement with carbon isotope data obtained fromMaikop sediments of the Shemakha–Gobustan area (averaged13C = �26.0‰; Hudson et al., 2008). The Eocene strata have beenreported to be enriched in 13C in comparison to the LowerOligocene Maikop sediments (Hudson et al., 2008).
Nitrogen isotopic compositions can help to identify sources oforganic matter and to reconstruct past productivity rates (Talbot,2001). The nitrogen isotopic composition of total nitrogen inorganic-rich sediments is dominated by the d15N of organic-boundnitrogen. The d15N value of dissolved NO3
�, is typically 7–10%greater than that of the atmosphere-derived N2 available to land
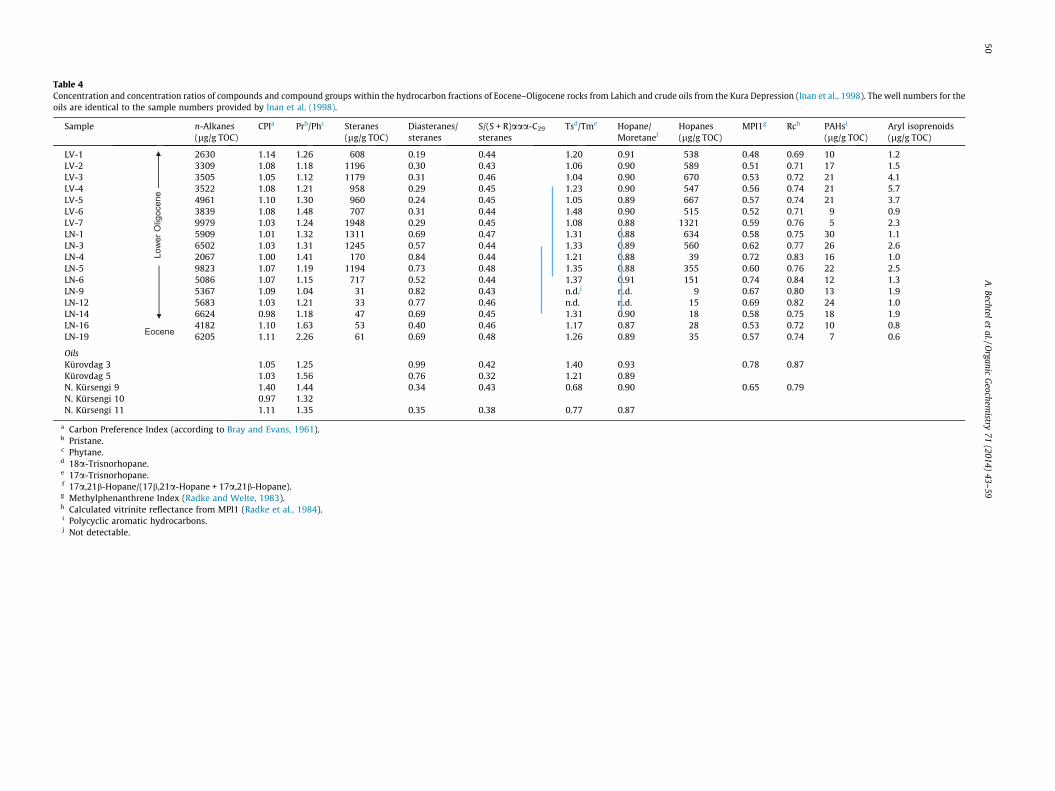
Table 4Concentration and concentration ratios of compounds and compound groups within the hydrocarbon fractions of Eocene–Oligocene rocks from Lahich and crude oils from the Kura Depression (lnan et al., 1998). The well numbers for theoils are identical to the sample numbers provided by lnan et al. (1998).
Sample n-Alkanes(lg/g TOC)
CPIa Prb/Phc Steranes(lg/g TOC)
Diasteranes/steranes
S/(S + R)aaa-C29
steranesTsd/Tme Hopane/
MoretanefHopanes(lg/g TOC)
MPI1g Rch PAHsi
(lg/g TOC)Aryl isoprenoids(lg/g TOC)
LV-1Lo
wer
Olig
ocen
e
Eocene
2630 1.14 1.26 608 0.19 0.44 1.20 0.91 538 0.48 0.69 10 1.2LV-2 3309 1.08 1.18 1196 0.30 0.43 1.06 0.90 589 0.51 0.71 17 1.5LV-3 3505 1.05 1.12 1179 0.31 0.46 1.04 0.90 670 0.53 0.72 21 4.1LV-4 3522 1.08 1.21 958 0.29 0.45 1.23 0.90 547 0.56 0.74 21 5.7LV-5 4961 1.10 1.30 960 0.24 0.45 1.05 0.89 667 0.57 0.74 21 3.7LV-6 3839 1.08 1.48 707 0.31 0.44 1.48 0.90 515 0.52 0.71 9 0.9LV-7 9979 1.03 1.24 1948 0.29 0.45 1.08 0.88 1321 0.59 0.76 5 2.3LN-1 5909 1.01 1.32 1311 0.69 0.47 1.31 0.88 634 0.58 0.75 30 1.1LN-3 6502 1.03 1.31 1245 0.57 0.44 1.33 0.89 560 0.62 0.77 26 2.6LN-4 2067 1.00 1.41 170 0.84 0.44 1.21 0.88 39 0.72 0.83 16 1.0LN-5 9823 1.07 1.19 1194 0.73 0.48 1.35 0.88 355 0.60 0.76 22 2.5LN-6 5086 1.07 1.15 717 0.52 0.44 1.37 0.91 151 0.74 0.84 12 1.3LN-9 5367 1.09 1.04 31 0.82 0.43 n.d.j n.d. 9 0.67 0.80 13 1.9LN-12 5683 1.03 1.21 33 0.77 0.46 n.d. n.d. 15 0.69 0.82 24 1.0LN-14 6624 0.98 1.18 47 0.69 0.45 1.31 0.90 18 0.58 0.75 18 1.9LN-16 4182 1.10 1.63 53 0.40 0.46 1.17 0.87 28 0.53 0.72 10 0.8LN-19 6205 1.11 2.26 61 0.69 0.48 1.26 0.89 35 0.57 0.74 7 0.6
OilsKürovdag 3 1.05 1.25 0.99 0.42 1.40 0.93 0.78 0.87Kürovdag 5 1.03 1.56 0.76 0.32 1.21 0.89N. Kürsengi 9 1.40 1.44 0.34 0.43 0.68 0.90 0.65 0.79N. Kürsengi 10 0.97 1.32N. Kürsengi 11 1.11 1.35 0.35 0.38 0.77 0.87
a Carbon Preference Index (according to Bray and Evans, 1961).b Pristane.c Phytane.d 18a-Trisnorhopane.e 17a-Trisnorhopane.f 17a,21b-Hopane/(17b,21a-Hopane + 17a,21b-Hopane).g Methylphenanthrene Index (Radke and Welte, 1983).h Calculated vitrinite reflectance from MPI1 (Radke et al., 1984).i Polycyclic aromatic hydrocarbons.j Not detectable.
50A
.Bechtelet
al./Organic
Geochem
istry71
(2014)43–
59
0.00
0.05
0.10
0.15
0.20
0.25
0.30
0.0 0.5 1.0 1.5 2.0 2.5 3.0
TOC (wt.%)
-1.0
-0.5
0.0
0.5
1.0
1.5
2.0
2.5
3.0
0.0 0.5 1.0 1.5 2.0 2.5 3.0
TOC (wt.%)
a
b
Oligocene (Maikop)
Eocene
Oligocene (Maikop)
Eocene
N (w
t.%)
r2 = 0.88
δ15 N
(o/ o
o, A
ir)
Fig. 5. Cross plot of TOC contents versus (a) total nitrogen contents and (b) the d15Nvalues of total nitrogen of the rocks from the Lahich succession.
Tmax (°C)
HI (
mg
HC
/g T
OC
)0
100
200
300
400
500
600
700
800
900
1000
400 450 500 550
Oligocene (Maikop)
Eocene
Maikop series fromAngeharanType I
Type II
Type III
S2 (m
g H
C/g
rock
)
TOC (wt.%)
0
1
2
3
4
5
0.0 0.5 1.0 1.5 2.0 2.5 3.0
Oligocene (Maikop)Eocene
Fig. 6. Plot of HI vs. Tmax (according to Espitalié et al., 1984) outlining kerogen typeof Eocene and Oligocene rocks from Lahich. The data obtained from the Maikopseries of Angeharan (Bechtel et al., 2013) are shown for comparison. S2 vs. TOCcorrelations for Oligocene samples are shown as insert (according to Langford andBlanc-Valleron, 1990). The ‘‘true’’ average HI of the respective samples is indicatedby the slope � 100 in the inset.
A. Bechtel et al. / Organic Geochemistry 71 (2014) 43–59 51
plants (Peters et al., 1978). The isotopic difference between thesetwo sources of nitrogen is preserved in the d15N values of organicmatter from algae (8.5‰) and from C3 plants (0.5‰) (Meyers,2003). In our study, d15N of all samples vary from �0.3‰ to2.5‰ (Table 3), with higher values (> 1‰) measured exclusivelyin the lower part of the section (interval from 420–800 m,Fig. 3e). The results are in agreement with the data from previousstudies (Hudson et al., 2008) indicating a negative correlationbetween d15N and TOC (Fig. 5b). Comparable d15N values(1.9–2.3‰) are also found in the Eocene rocks (Figs. 3e and 5b).
The cross plot of stable carbon isotope ratios of saturated versusaromatic hydrocarbon fractions of crude oils was introduced bySofer (1984) for correlation studies and to distinguish oils derivedfrom non-marine and marine source rocks (Fig. 8). The d13C valuesobtained from the saturated and aromatic hydrocarbon fractions ofthe investigated samples fall below the boundary line(d13Caro = 1.14 � d13Csat + 5.46; Sofer, 1984) between marine andnon-marine oils, as expected for marine source rocks (Fig. 8).
4.5. Molecular composition of hydrocarbons
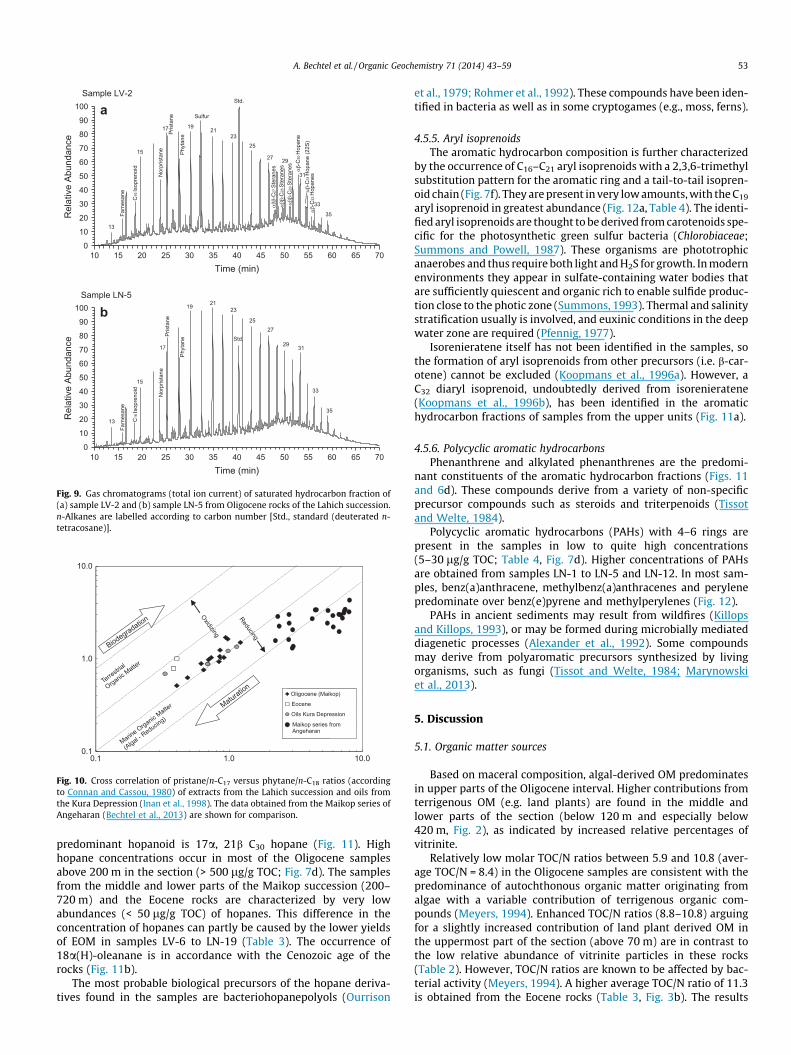
4.5.1. Straight chain alkanesThe total ion current (TIC) chromatograms of the saturated
hydrocarbon fractions of two samples are shown in Fig. 9. The n-alkane patterns are characterized by high relative proportions ofhomologues of the C17–C23 molecular range without a marked
odd/even predominance. Samples from the Oligocene and Eocenesamples of the Lahich section are characterized by CPI (carbonpreference index according to Bray and Evans, 1961) valuesbetween 1.0 and 1.1 (Table 4).
The low molecular weight n-alkanes (< C20), predominantlyderived from algae and microorganisms (Cranwell, 1977), are pres-ent in relative abundances ranging from 12–37% of total n-alkanes.High relative proportions are found in the upper part of the section(above 200 m; Fig. 7b). The n-alkanes of intermediate molecularweight (n-C21–25), which are reported to originate from aquaticmacrophytes (Ficken et al., 2000), are found in our samples in highproportions between 27% and 41%, relative to total n-alkane con-centrations. Highest relative proportions (> 25%) of long chain n-alkanes are seen in the samples from the middle and lower partsof the section (LV-1, LN-1, LN-3, and LN-12 to LN-16) and in theEocene rocks (Fig. 7b). Long straight chain lipids (> n-C27) are char-acteristic biomarkers for higher terrigenous plants, as they are themain components of plant waxes (Eglinton and Hamilton, 1967).However, a probable contribution of microalgae or bacteria tothe long chain alkanes has to be taken into account (Volkmanet al., 1998).
4.5.2. IsoprenoidsThe acyclic isoprenoids pristane (Pr) and phytane (Ph) are pres-
ent in the saturated hydrocarbon fractions of all samples (Fig. 9).Pr/Ph ratios vary in the entire profile from 1.04–2.26; Table 4;Fig. 7c). From the pristane/n-C17 versus phytane/n-C18 plot(Fig. 10), the difference in the position of Maikop rocks from Lahichand Angeharan is clearly visible, most probably related to differ-ences in maturation of the two sections. Pr/Ph ratios are knownto the influenced by thermal maturation (Tissot and Welte, 1984).

0
50
100
150
200
250
300
350
400
450
500
550
600
650
700
750
800
850
0 40 80 120 160
EOM(mg/g TOC)
0.0 0.1 0.2 0.3 0.4 0.5
n-Alkanes(rel. prop.)
n-C /n -Alkanes15-19
n-C /n -Alkanes27-31
0.0 0.5 1.0 1.5 2.0 2.5
Pr/Ph, Diasteranes/Steranes
Pr/Ph
Diasteranes/Steranes
0 500 1000 1500 2000
Steranes
Hopanes
0 50 100 150 200
Phen. + MPhen.
PAHs
0 1 2 3 4 5 6
Aryl Isopren. (µg/g TOC)Steranes/Hopanes
Aryl Isoprenoids
Steranes/Hopanes
Dis
tanc
e fr
om to
p (m
)
Phen. + MPhen., PAHs (µg/g TOC)
Steranes, Hopanes(µg/g TOC)
a b c d e f
Upp
erEo
cene
Low
er O
ligoc
ene
(Mai
kop)
Fig. 7. Variation with depth of (a) extractable organic matter (EOM) yield, (b) proportions of n-alkanes of low and high molecular weight relative to the concentration of totaln-alkanes, (c) concentration ratios of pristane to phytane and of the C27 diasteranes to the C27 steranes, (d) absolute concentrations of steranes and hopanes, (e)concentrations of phenanthrene (Phen) plus methylphenanthrenes (MPhen) and of polycyclic aromatic hydrocarbons (PAHs), and of (f) absolute concentrations of arylisoprenoids and steranes/hopanes ratio in the Lahich succession.
-30
-29
-28
-27
-26
-25
-24
-23
-31 -30 -29 -28 -27 -26 -25 -24 -23
Oligocene (Maikop)
Eocene
open marine
non-marine(lacustrine, terrestrial)
δ13CSat (o/oo, PDB)
δ13C
Aro
(o /oo
, PD
B)
Fig. 8. Cross plot of d13C values of aromatic versus saturated hydrocarbons fromextracts of the Maikop sediments together with the boundary line (d13Caro = 1.14� d13Csat + 5.46) separating marine and non-marine oils (Sofer, 1984). The ranges ofSouth Caspian oils (the ovals contain unspecified data points) obtained fromdifferent reservoirs are also shown (adapted from Abrams and Narimanov, 1997).
52 A. Bechtel et al. / Organic Geochemistry 71 (2014) 43–59
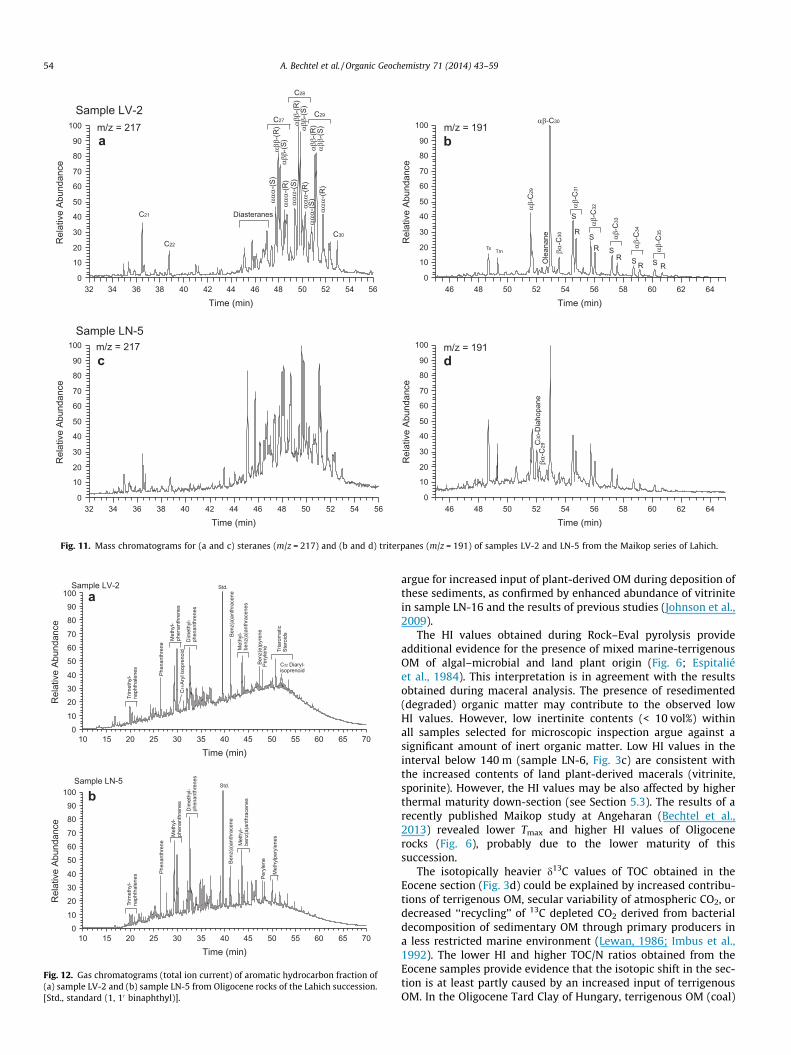
4.5.3. SteroidsSteranes are present in variable quantities in the saturated
hydrocarbon fractions (Table 4). The 5a,14b,17b(H) steranes, dom-inating over the 5a,14a,17a(H) isomers, are present in the C27–C29
range (Fig. 11), consistent with the elevated maturity of the sam-ples. The C28 homologues predominate in all samples followed by
the C27 and the C29 steranes that are present in comparableamounts. The 24-n-propyl-5a-cholestane has been identified tooccur in low amounts. Diasteranes are present in high concentra-tions (Fig. 11). High concentrations (> 1000 lg/g TOC) of steranesare obtained in several of the samples from the upper part of thesection (Table 4, Fig. 7d), whereas low amounts (< 100 lg/g TOC)are found in the lower part and the Eocene samples (Fig. 7d). TheC28 to C30 4-methylsteranes are not present in sufficient concentra-tion for peak integration. In the aromatic hydrocarbon fractions(Fig. 12a), triaromatic steroids are found in low concentrations(up to 56 lg/g TOC). These compounds arise from the diagenetictransformation of sterols and subsequent aromatization fromring-C to rings-ABC with increasing maturation (Mackenzie et al.,1981).
Algae are the predominant primary producers of C27 sterols,while C29 sterols are more typically associated with land plants(Volkman, 1986). However, numerous results from recent bio-marker studies add to the growing list of microalgae that containhigh proportions of 24-ethylcholesterol (Volkman et al., 1999).The 24-n-propylcholestanes have, until now, only been identifiedin marine Chrysophyte algae (Moldowan et al., 1990). Varyingratios of C27 diasteranes relative to the C27 regular steranes(0.19–0.84; Table 4) reflect the extent of the clay catalytic effect(i.e. clay content and composition) during diagenesis. Lower ratiosare found in the uppermost samples of the succession (Fig. 7c).
4.5.4. TriterpenoidsHopanoids are important non-aromatic cyclic triterpenoid con-
stituents of the Maikop rocks at Lahich (Table 4; Fig. 7d). The hopa-noid patterns (Fig. 11) are characterized by 17a, 21b(H)- and 17b,21a(H)-hopanes from C27 to C35, with C28 hopanes absent. The
10 15 20 25 30 35 40 45 50 55 60 65 70
Time (min)
0
10
20
30
40
50
60
70
80
90
100Sample LV-2
15
13
17 1921
2325
27 29
31
33
35
Pris
tane
Phyt
ane
Nor
pris
tane
C16
Isop
reno
id
Farn
esan
eSulfur
Std.
α β-C
30 H
opan
eαβ
-C31
Hop
ane
(22S
)
αββ-
C29
Ste
rane
sαββ-
C28
Ste
rane
sαββ-
C27
Ste
rane
s
αβ-C
32 H
opan
es
10 15 20 25 30 35 40 45 50 55 60 65 70
Time (min)
0
10
20
30
40
50
60
70
80
90
100
Rel
ativ
e Ab
unda
nce
Rel
ativ
e Ab
unda
nce
Sample LN-5
15
13
17
19 2123
2527
29 31
33
35
Pris
tane
Phyt
ane
Nor
pris
tane
C16
Isop
reno
id
Farn
esan
e
Std.
a
b
Fig. 9. Gas chromatograms (total ion current) of saturated hydrocarbon fraction of(a) sample LV-2 and (b) sample LN-5 from Oligocene rocks of the Lahich succession.n-Alkanes are labelled according to carbon number [Std., standard (deuterated n-tetracosane)].
0.1
1.0
10.0
10.0
Oligocene (Maikop)
Eocene
Oils Kura Depression
Terrestri
al
Organic Matter
Marine Organic Matter
(Algal - Reducin
g)
Reducing
Oxidizing
Maturation
Biodegradation
0.1 1.0
Maikop series fromAngeharan
Fig. 10. Cross correlation of pristane/n-C17 versus phytane/n-C18 ratios (accordingto Connan and Cassou, 1980) of extracts from the Lahich succession and oils fromthe Kura Depression (lnan et al., 1998). The data obtained from the Maikop series ofAngeharan (Bechtel et al., 2013) are shown for comparison.
A. Bechtel et al. / Organic Geochemistry 71 (2014) 43–59 53
predominant hopanoid is 17a, 21b C30 hopane (Fig. 11). Highhopane concentrations occur in most of the Oligocene samplesabove 200 m in the section (> 500 lg/g TOC; Fig. 7d). The samplesfrom the middle and lower parts of the Maikop succession (200–720 m) and the Eocene rocks are characterized by very lowabundances (< 50 lg/g TOC) of hopanes. This difference in theconcentration of hopanes can partly be caused by the lower yieldsof EOM in samples LV-6 to LN-19 (Table 3). The occurrence of18a(H)-oleanane is in accordance with the Cenozoic age of therocks (Fig. 11b).
The most probable biological precursors of the hopane deriva-tives found in the samples are bacteriohopanepolyols (Ourrison
et al., 1979; Rohmer et al., 1992). These compounds have been iden-tified in bacteria as well as in some cryptogames (e.g., moss, ferns).
4.5.5. Aryl isoprenoidsThe aromatic hydrocarbon composition is further characterized
by the occurrence of C16–C21 aryl isoprenoids with a 2,3,6-trimethylsubstitution pattern for the aromatic ring and a tail-to-tail isopren-oid chain (Fig. 7f). They are present in very low amounts, with the C19
aryl isoprenoid in greatest abundance (Fig. 12a, Table 4). The identi-fied aryl isoprenoids are thought to be derived from carotenoids spe-cific for the photosynthetic green sulfur bacteria (Chlorobiaceae;Summons and Powell, 1987). These organisms are phototrophicanaerobes and thus require both light and H2S for growth. In modernenvironments they appear in sulfate-containing water bodies thatare sufficiently quiescent and organic rich to enable sulfide produc-tion close to the photic zone (Summons, 1993). Thermal and salinitystratification usually is involved, and euxinic conditions in the deepwater zone are required (Pfennig, 1977).
Isorenieratene itself has not been identified in the samples, sothe formation of aryl isoprenoids from other precursors (i.e. b-car-otene) cannot be excluded (Koopmans et al., 1996a). However, aC32 diaryl isoprenoid, undoubtedly derived from isorenieratene(Koopmans et al., 1996b), has been identified in the aromatichydrocarbon fractions of samples from the upper units (Fig. 11a).
4.5.6. Polycyclic aromatic hydrocarbonsPhenanthrene and alkylated phenanthrenes are the predomi-
nant constituents of the aromatic hydrocarbon fractions (Figs. 11and 6d). These compounds derive from a variety of non-specificprecursor compounds such as steroids and triterpenoids (Tissotand Welte, 1984).
Polycyclic aromatic hydrocarbons (PAHs) with 4–6 rings arepresent in the samples in low to quite high concentrations(5–30 lg/g TOC; Table 4, Fig. 7d). Higher concentrations of PAHsare obtained from samples LN-1 to LN-5 and LN-12. In most sam-ples, benz(a)anthracene, methylbenz(a)anthracenes and perylenepredominate over benz(e)pyrene and methylperylenes (Fig. 12).
PAHs in ancient sediments may result from wildfires (Killopsand Killops, 1993), or may be formed during microbially mediateddiagenetic processes (Alexander et al., 1992). Some compoundsmay derive from polyaromatic precursors synthesized by livingorganisms, such as fungi (Tissot and Welte, 1984; Marynowskiet al., 2013).
5. Discussion
5.1. Organic matter sources
Based on maceral composition, algal-derived OM predominatesin upper parts of the Oligocene interval. Higher contributions fromterrigenous OM (e.g. land plants) are found in the middle andlower parts of the section (below 120 m and especially below420 m, Fig. 2), as indicated by increased relative percentages ofvitrinite.
Relatively low molar TOC/N ratios between 5.9 and 10.8 (aver-age TOC/N = 8.4) in the Oligocene samples are consistent with thepredominance of autochthonous organic matter originating fromalgae with a variable contribution of terrigenous organic com-pounds (Meyers, 1994). Enhanced TOC/N ratios (8.8–10.8) arguingfor a slightly increased contribution of land plant derived OM inthe uppermost part of the section (above 70 m) are in contrast tothe low relative abundance of vitrinite particles in these rocks(Table 2). However, TOC/N ratios are known to be affected by bac-terial activity (Meyers, 1994). A higher average TOC/N ratio of 11.3is obtained from the Eocene rocks (Table 3, Fig. 3b). The results
32 34 36 38 40 42 44 46 48 50 52 54 56
Time (min)
0
10
20
30
40
50
60
70
80
90
100
Rel
ativ
e Ab
unda
nce
Sample LV-2m/z = 217
C21
C22
Diasteranes
ααα
-(S)
ααα
-(R)
αββ
-(S)
αββ
-(R)
C27
ααα
-(S)
ααα
-(R)
αββ
-(S)
αββ
-(R)
ααα
-(S)
ααα
-(R)
αββ
-(S)
αββ
-(R)
C28
C29
C30
32 34 36 38 40 42 44 46 48 50 52 54 56
Time (min)
0
10
20
30
40
50
60
70
80
90
100
Rel
ativ
e Ab
unda
nce
Sample LN-5m/z = 217
46 48 50 52 54 56 58 60 62 64
Time (min)
0
10
20
30
40
50
60
70
80
90
100
Rel
ativ
e Ab
unda
nce
m/z = 191
C30
-Dia
hopa
neβα
-C29
46 48 50 52 54 56 58 60 62 64
Time (min)
0
10
20
30
40
50
60
70
80
90
100
Rel
ativ
e Ab
unda
nce
m/z = 191
Ts Tm
αβ-
C29
αβ-C30
βα-C
30
αβ-
C31
S
RS
R SR S R S R
αβ-
C32
αβ-
C33
αβ-
C34
αβ-
C35
Ole
anan
e
a
c d
b
Fig. 11. Mass chromatograms for (a and c) steranes (m/z = 217) and (b and d) triterpanes (m/z = 191) of samples LV-2 and LN-5 from the Maikop series of Lahich.
10 15 20 25 30 35 40 45 50 55 60 65 70
Time (min)
010
203040
506070
8090
100Sample LV-2
Phen
anth
rene
Met
hyl-
phen
anth
rene
s
Dim
ethy
l-ph
enan
thre
nes
Std.
Trim
ethy
l-na
phth
alen
es
Benz
(a)a
nthr
acen
eM
ethy
l-be
nz(a
)ant
hrac
enes
Benz
(e)p
yren
ePe
ryle
ne Tria
rom
atic
Ster
oids
C19
Aryl
isop
reno
id
C32 Diaryl-isoprenoid
10 15 20 25 30 35 40 45 50 55 60 65 70
Time (min)
Sample LN-5
010
203040
506070
8090
100
Rel
ativ
e Ab
unda
nce
Rel
ativ
e Ab
unda
nce
Trim
ethy
l-na
phth
alen
es
Phen
anth
rene
Met
hyl-
phen
anth
rene
s
Dim
ethy
l-ph
enan
thre
nes
Std.
Benz
(a)a
nthr
acen
e
Met
hyl-
benz
(a)a
nthr
acen
es
Pery
lene
Met
hylp
eryl
enes
a
b
Fig. 12. Gas chromatograms (total ion current) of aromatic hydrocarbon fraction of(a) sample LV-2 and (b) sample LN-5 from Oligocene rocks of the Lahich succession.[Std., standard (1, 10 binaphthyl)].
54 A. Bechtel et al. / Organic Geochemistry 71 (2014) 43–59
argue for increased input of plant-derived OM during deposition ofthese sediments, as confirmed by enhanced abundance of vitrinitein sample LN-16 and the results of previous studies (Johnson et al.,2009).
The HI values obtained during Rock–Eval pyrolysis provideadditional evidence for the presence of mixed marine-terrigenousOM of algal–microbial and land plant origin (Fig. 6; Espitaliéet al., 1984). This interpretation is in agreement with the resultsobtained during maceral analysis. The presence of resedimented(degraded) organic matter may contribute to the observed lowHI values. However, low inertinite contents (< 10 vol%) withinall samples selected for microscopic inspection argue against asignificant amount of inert organic matter. Low HI values in theinterval below 140 m (sample LN-6, Fig. 3c) are consistent withthe increased contents of land plant-derived macerals (vitrinite,sporinite). However, the HI values may be also affected by higherthermal maturity down-section (see Section 5.3). The results of arecently published Maikop study at Angeharan (Bechtel et al.,2013) revealed lower Tmax and higher HI values of Oligocenerocks (Fig. 6), probably due to the lower maturity of thissuccession.
The isotopically heavier d13C values of TOC obtained in theEocene section (Fig. 3d) could be explained by increased contribu-tions of terrigenous OM, secular variability of atmospheric CO2, ordecreased ‘‘recycling’’ of 13C depleted CO2 derived from bacterialdecomposition of sedimentary OM through primary producers ina less restricted marine environment (Lewan, 1986; Imbus et al.,1992). The lower HI and higher TOC/N ratios obtained from theEocene samples provide evidence that the isotopic shift in the sec-tion is at least partly caused by an increased input of terrigenousOM. In the Oligocene Tard Clay of Hungary, terrigenous OM (coal)

A. Bechtel et al. / Organic Geochemistry 71 (2014) 43–59 55
has been found to be enriched in 13C in comparison to the aquaticOM in shale (Hertelendi and Vetö, 1991).
As significant contributions of land plants to OM of the upper-most Oligocene samples (above 100 m in the section, Fig. 3e) canbe ruled out, the low d15N values (< 1.0‰) probably indicate theabundance of nitrogen-fixing cyanobacteria (Meyers, 2003). Lowd15N values in sediments of Lake Victoria have been suggested toindicate nitrogen fixation as an important process stimulated byincreased eutrophication (Talbot and Laerdal, 2000). However,methylhopanes as markers for cyanobacteria could not be identi-fied in the EOM of the rocks (Farrimond et al., 2004).
The n-alkane distribution patterns of the Maikop rocks and therelative abundances of the non-aromatic steroids (Fig. 13) are inagreement with the above mentioned indications for OM from mar-ine/brackish phytoplankton, living in the photic zone of the watercolumn, and the input of terrigenous OM (land plants, macro-phytes; Tissot and Welte, 1984; Ficken et al., 2000). The resultsargue for a higher contribution of plants to the OM of samples fromthe middle and lower part of the succession. However, the interpre-tation of land plant input from molecular distributions is based ononly a small portion of the OM in the samples. The predominance ofC28 steranes in the Maikop sediments (Fig. 13) most probably reflecthigh contributions from diatoms, as their evolution resulted in asignificant increase of C28 steranes in crude oils derived from Ceno-zoic sediments (Grantham and Wakefield, 1988).
Higher concentrations of hopanes in the uppermost samples(above 100 m in the section) indicate enhanced contributions frommicrobial sources to OM deposition. Enhanced bacterial activitycould explain the higher TOC/N ratios found in the rocks fromthe upper part of the section. The PAHs present in all samplesand the high relative abundances of their methylated analoguesargue for an input of PAHs resulting from microbial oxidation pro-cesses or fungal infection of wood-derived particles.
5.2. Depositional environment
The TOC–S relationships obtained from the Lower Oligocenerocks suggest oxygen-deficient conditions in the bottom water(Berner, 1984). Obviously, the depositional environment evolvedfrom normal marine during Late Eocene and earliest Oligocene totemporal euxinic conditions. TOC/S ratios > 4.0, obtained fromsamples in the upper part of the section (above 70 m, Fig. 3b),
Oligocene (Maikop)
Eocene
Oils Kura Depression
50
5050
Higher-plants
Phyto-plankton
Zoo-plankton
C27 C29
C28
Fig. 13. Ternary diagram of the relative amounts of aaa-C27, C28, and C29 steranesin the extracts of the Lahich rocks and in oils from the Kura Depression (lnan et al.,1998).
may indicate a sulfate deficient water column due to a fresheningin the photic layer. The results are in agreement with previous dataobtained on Maikop rocks indicating variable TOC–S distributions(Johnson et al., 2009).
Consistent with the results of previous studies (Hudson et al.,2008), a general tendency towards 15N enriched OM in sedimentsof low TOC concentrations is obtained (Fig. 5b). Enriched d15N con-centrations associated with low TOC contents (as found in samplesfrom intervals 80–120 m and below 200 m) may reflect increasedwater column denitrification, suggesting more oxygenated bottomwaters (Meyers, 1997; Hudson et al., 2008), or may reflect zoneswith intensified OM remineralisation (Müller, 1977). As low TOC/S ratios of samples from the 80–120 m interval of the section arguefor euxinic conditions in the bottom water, the latter interpretationis favored for the obtained relationship between d15N of OM andTOC contents.
Pristane/phytane (Pr/Ph) ratios between 1.0 and 3.0, as foundwithin the Lahich succession, have been proposed to indicate dys-oxic conditions during early diagenesis (Didyk et al., 1978). How-ever, Pr/Ph ratios are known to be affected also by maturation(Tissot and Welte, 1984) and by differences in the precursors foracyclic isoprenoids (bacterial origin; Goossens et al., 1984;Volkman and Maxwell, 1986; ten Haven et al., 1987). An influenceof thermal stress on Pr/Ph ratios may have occurred, as immaturesediments from Angeharan are characterized by low Pr/Ph (Bechtelet al., 2013), reflecting anoxic bottom water during deposition ofthe Oligocene Maikop series. However, a potential contribution ofPr from tocopherols or chromans also has to be taken into account(Goossens et al., 1984).
The occurrence of aryl and diaryl isoprenoids in the Oligocenerocks indicates photic zone anoxia and free H2S in the water col-umn. Higher concentrations of aryl isoprenoids are obtained withinthe upper part of the section (Fig. 7f). A general tendency towardshigher concentrations of aryl isoprenoids with decreasing Pr/Phexists, only if samples with aryl isoprenoid concentra-tion < 2.0 lg/g TOC are considered (Fig. 14). This relationship mostprobably reflects variations in the extent and persistence of thephotic zone anoxia. The offset between the Pr/Ph ratio and the arylisoprenoid concentration, seen in samples with elevated aryl iso-prenoid contents (Fig. 14), may be related to the relative thick-nesses of the euxinic versus oxygenated parts of the water body.According to Schwark and Frimmel (2004), aryl isoprenoid concen-tration can be higher, despite identical Pr/Ph ratio values, duringsea-level highstand compared to during times of lower sea level.This interpretation is in agreement with relatively high sea levelsreported during Lower Oligocene (Vail and Mitchum, 1979;Hudson et al., 2008).
The C35 hopanes are present in lower amounts than the C34
hopanes in all samples investigated (Fig. 11). Higher abundancesof C35 hopanes have been reported in marine carbonates depositedunder anoxic conditions in the water column due to salinity strat-ification (Peters et al., 2005). In the present case, salinity stratifica-tion has probably not been established, as further indicated by thelack of gammacerane.
5.3. Maturity
Vitrinite reflectance measurements revealed an early oilwindow maturity of 0.60 ± 0.18%Rr (LV-2) and 0.68 ± 0.13%Rr(LN-12), respectively. The results are in general agreement withthe marginally mature character of the OM in the Oligocene sam-ples below 80 m (sample LV-1), as indicated by Tmax values of429–435 �C. Higher Tmax values (up to 459 �C) are obtained fromsamples of the middle and lower parts of the section suggestinga peak oil window maturity of OM. Higher Tmax values may partlybe caused by low S2 values (< 0.3 mg HC/g rock) resulting in

Pristane/Phytane
Ary
l iso
pren
oids
(µg/
g TO
C)
0
1
2
3
4
5
6
0.0 0.5 1.0 1.5 2.0 2.5
Oligocene (Maikop)
Eocene
persistent
episodic
PZA
Sea level
rise
drop
Fig. 14. Cross correlation of concentrations of aryl isoprenoids versus the pristane/phytane ratio of Eocene–Oligocene rocks from Lahich. PZA = Photic zone anoxia.
56 A. Bechtel et al. / Organic Geochemistry 71 (2014) 43–59
unreliable Tmax readings. However, due to the great thickness of thesection (800 m), enhanced Tmax and higher vitrinite reflectancedata obtained from sample LN-12 suggest differences in thermalmaturity within the succession.
The amounts of extractable organic matter (EOM) are in agree-ment with extraction yields obtained from marginally mature tomature source rocks (Hunt, 1979). The relative proportions ofhydrocarbons between 35% and 71% of EOM (Table 3) are also con-sistent with values obtained from mature source rocks. Further-more, carbon preference index (CPI) values close to 1.0, derivedfrom long chain n-alkane distribution patterns, argue for a matu-rity of OM within the oil window (Tissot and Welte, 1984).
A higher maturity of samples from the lower part of the section(LN-12, LN-14, LN-16, LN-19) is indicated based on the pristane/n-C17 versus phytane/n-C18 correlation plot, which is consistent withhigher Tmax values (440–459 �C, Table 3) obtained for thesesamples.
An average ratio of the 20S/(20S + 20R) isomers of the5a,14a,17a(H)-C29 steranes of 0.45 was found within the Oligo-cene and Eocene rocks (Table 4). These values are in agreementwith equivalent vitrinite reflectance values of 0.6–0.7%Rr(Mackenzie and Maxwell, 1981; Mackenzie et al., 1982), as mea-sured in two samples of the profile. Published results of oils fromthe Kura Depression (lnan et al., 1998) show comparable steraneisomerisation values (Table 4). The ratios of the 22S/(22S + 22R)isomers of the 17a, 21b(H)-C31 hopanes of 0.58–0.62 indicate thatequilibrium of hopane isomerisation (0.60) has been obtained(Fig. 11b and d). The data indicate a level of thermal maturityequivalent to the beginning of the oil window (Mackenzie andMaxwell, 1981).
The Ts/(Ts + Tm) ratios are considered to be strongly influencedby differences in source facies, a conclusion already evidenced bythe data of previous studies (lnan et al., 1998). The methylphe-nanthrene index (MPI 1), based on phenanthrene and four isomers(3-, 2-, 9-, 1-) of methylphenanthrene, has been introduced as amaturation parameter for kerogen type III (Radke and Welte,1983). The MPI 1 of the oil samples ranges from 0.48–0.74 (Table 4).According to the empirical relationship between MPI 1 and vitri-nite reflectance (Radke et al., 1984), these values correspond toan equivalent vitrinite reflectance (Rc) of 0.69–0.84% (Table 4).The calculation is based on the relationship Rc = 0.6 �MPI 1 + 0.4,and is valid for maturity assessment of type III organic matterbelow vitrinite reflectance values (Rr) of 1.35% (Radke and Welte,1983). Comparable vitrinite reflectance values of 0.79–0.87%
derived from MPI 1 have been obtained from oils of the KuraDepression (lnan et al., 1998). The results are higher than estimatesbased on the isomerisation values of steranes and measured vitri-nite reflectance data in the range of 0.6–0.7%. However, the calcu-lated vitrinite reflectance data may be biased, due to the presenceof mixed marine/terrigenous OM and the fact that the calibrationof the MPI 1 is based on type III kerogen (i.e. coal).
5.4. Source rock quality and oil–source rock correlation
Based on TOC and S2 from Rock–Eval pyrolysis, the Maikopsamples from the upper part of the section (LV-1 to LN-5) can beregarded as fair to good oil prone source rocks, whereas the datafrom the rest of the sample set prove a poor source potentialaccording to the classification of Peters (1986). The lower EOMyields in these samples (LN-6 to LN-19) also point to a lower sourcerock quality of the rocks (higher contribution of type III OM).
The low TOC of most samples may be regarded as insufficient toallow expulsion. However, previous studies revealed TOC contentsranging from 0.2–15.1%, with average values of 1.6 (Feyzullayevet al., 2001; Hudson et al., 2008). Short and long term differencesin the environment of deposition are believed to be responsiblefor vertical and lateral variations in source rock quality withinthe Maikop. Best source rocks have been found in the Upper Mai-kop in eastern Azerbaijan towards the Caspian Sea (Feyzullayevet al., 2001).
Based on differences in d13C between oils reservoired in Plio-cene rocks and those reservoired in Miocene to Upper Cretaceouswithin the South Caspian depression of Azerbaijan, varying contri-butions from different age source rocks have been postulated(Fig. 8). Miocene to Upper Cretaceous reservoired oils are believedto have been derived from the early Maikopian organic rich sec-tions, whereas oils in the younger Pliocene reservoirs were mostlikely sourced from the Upper Maikopian and possibly youngerDiatom series (Abrams and Narimanov, 1997). The d13C values ofsaturated and aromatic hydrocarbons of the rock samples show atendency towards isotopically lighter d13C values from the lower(LN-19 to LN-4: d13CSat > -28‰) to the upper part (LN-3 to LV-1:d13CSat < �28‰) of the succession. However, all data points fallwithin the range characteristic for oils derived from Lower Maikoprocks.
In the pristane/n-C17 versus phytane/n-C18 plot (Fig. 10), a dia-gram often used in oil–oil and oil–source rock correlation studies(Connan and Cassou, 1980), good matches are obtained betweenoils from the Kura Depression (lnan et al., 1998) and rocks of theMaikop series from Lahich (Fig. 10).
Furthermore, the oils from the Kura Depression plot close to therock extracts in the triangular plot outlining the relative propor-tions of steranes (Fig. 13). Some oils are characterized by on aver-age lower relative amounts of C28 steranes and higher percentagesof C29 steranes. The cross correlation of C27 diasteranes to C27 reg-ular steranes versus the C28/C29 steranes ratios can be used todetect differences in oil sources (Peters et al., 2005). The data fromthe oils of the Kura Depression in general agree with a proposedsource from Maikop sediments (Fig. 15), however lower C28/C29
steranes ratios have been found in several of the oils (lnan et al.,1998). Slight differences in the relative abundances of C27, C28
and C29 steranes and in relative intensities of abb to aaa steranesare also seen in the m/z = 217 (steranes) mass chromatograms ofrock extracts from the Lahich section and published traces fromoils of the Kura Depression (Fig. 16).
A good match exists between the m/z = 191 mass chromato-grams of rock extracts from the Lahich section and the respectiveGC traces from oils of the Kura Depression (Fig. 16). Only, the rel-ative intensities of the C29 versus the C30 hopane do not corre-spond. Comparable ratios of 18a(H)-trisnorhopane (Ts) versus

C28/C29 Steranes
C27
Dia
ster
anes
/C27
Ste
rane
s
0.0
0.2
0.4
0.6
0.8
1.0
1.2
0.0 0.2 0.4 0.6 0.8 1.0 1.2 1.4 1.6
Oligocene (Maikop)
Eocene
Oils Kura Depression
Fig. 15. Cross correlation of aba-C27 diasteranes to aaa-C27 regular steranes versusthe aaa-C28/aaa- C29 steranes ratios in the extracts of Eocene and Oligocenesamples from Lahich, as well as in the oils from the Kura Depression.
A. Bechtel et al. / Organic Geochemistry 71 (2014) 43–59 57
17a(H)-trisnorhopane (Tm) of most oils (lnan et al., 1998), andsimilar concentration ratios of the ab(ba + ab)-C30 hopanes(hopane/moretane; Table 4), argue for the Maikop series as proba-ble source rocks. However, several oils show lower Ts/Tm ratios,suggested to reflect differences in source facies (lnan et al., 1998).
6. Summary and conclusions
The Maikop series of Lahich (eastern Azerbaijan) represents theOligocene succession deposited within an isolated Paratethyianmarginal sea. Based on lithological, geochemical and paleontologi-cal data, the sampled succession comprises Eocene and early Oligo-cene sediments. High primary bioproductivity resulted in anoxicbottom water with free H2S and the accumulation of organic mat-ter rich sediments during Oligocene. Claystones and mudstones of
32 34 36 38 40 42 44 46 48 50 52 54 56
Time (min)
0
10
20
30
40
50
60
70
80
90
100
Sample LV-2
C21
C22
Diasteranes
ααα-
(S)
ααα-
(R)
αββ
-(S)
αββ
-(R)
C27
ααα-
(S)
ααα-
(R)
αββ
-(S)
αββ
-(R)
ααα-
(S)
ααα-
(R)
αββ
-(S)
αββ
-(R)
C28
C29
C30
Oil 9 - Kürsengi Field(3604 - 3622 m)
Rel
ativ
e Ab
unda
nce
m/z = 217 (Steranes)
Fig. 16. Steranes and triterpanes (hopanes) fingerprints of an oil from the Kürsengi field (of sample LV-2 of the Oligocene rocks.
the Lower Oligocene Maikop series are considered as fairly oilprone source rocks.
TOC/S ratios and a matrix corrected ‘‘true’’ average HI value of182 HC/g TOC suggest the presence of Type II (marine/brackish)organic matter (OM) of algal and/or microbial origin and the inputof land plant derived OM (Type III kerogen) during deposition of theOligocene sediments. Eocene rocks are characterized by the highercontribution of terrigenous OM. Depth trends in d13C of total OMare interpreted to reflect changes in the regional carbon cycle(e.g. incorporation of recycled CO2 through primary producers intoOM of the upper units), and differences in OM sources (higher con-tribution of terrestrial OM in the lower part of the succession). Therole of cyanobacteria to OM production is suggested from d15N dataof total nitrogen. Increased remineralisation of OM is suggested toresult in low TOC and hydrocarbon contents, as well as 15N enrichedtotal nitrogen in the lower parts of the section.
The n-alkane distribution patterns, as well as relative propor-tions of C27, C28 and C29 steranes are characteristic of organic mat-ter of algal and/or microbial origin with a contribution fromterrigenous OM (i.e. vascular plants). The results are in agreementwith the results of organic petrographic inspection of selectedsamples. Diatoms are important primary producers, as evidencedby high C28 steranes. Hopanes most probably originated from cya-nobacteria and heterotrophic bacteria. The occurrence of aryl iso-prenoids and a C32 diaryl isoprenoid reflect the activity ofphototrophic anaerobes during periods of enhanced water columnstratification and high sea level. The obtained differences in Pr/Phratios and concentrations of aryl isoprenoids argue for changingenvironmental conditions. The depositional environment changedfrom normal marine conditions to a permanently stratified, envi-ronment with free H2S in the water column.
The origin of the oils within the Kura Depression from LowerMaikop successions are evidenced by sterane and triterpane finger-prints, as well as biomarker and carbon isotopic composition of theoils and marginal mature to mature Maikop rocks. Slight differ-ences in the molecular composition between the oils and the rock
m/z = 191 (Triterpanes)
46 48 50 52 54 56 58 60 62 64
Time (min)
0
10
20
30
40
50
60
70
80
90
100
Rel
ativ
e Ab
unda
nce
Ts Tm
αβ-
C29
αβ-C30
βα-C
30
αβ-
C31
S
RS
R SR S R S R
αβ-
C32
αβ-
C33
αβ-
C34
αβ-
C35
Ole
anan
e
adapted from lnan et al., 1998) in comparison to the respective mass chromatograms
58 A. Bechtel et al. / Organic Geochemistry 71 (2014) 43–59
extracts from the Lahich series are probably caused by vertical andlateral variations in source facies, known to occur within theMaikop rocks of eastern Azerbaijan.
Acknowledgments
The authors thank Sh. A. Babayev, T.N. Kengerli, and Sh. Sh. Bay-ramova from the Azerbaijan National Academy of Sciences for fieldwork and providing sample material. The article benefitted fromcritical remarks of J. Curiale and an anonymous reviewer. Financialsupport by the European Research Foundation (Marie-Curie Re-integration Fellowship to AB; Project No. 237917) is gratefullyacknowledged. Additional support was provided by the AzerbaijanNational Academy of Sciences to UM, and by British Petroleum.
Associate Editor—Ken Peters
References
Abrams, M.A., Narimanov, A.A., 1997. Geochemical evaluation of hydrocarbons andtheir potential sources in the western South Caspian depression, Republic ofAzerbaijan. Marine and Petroleum Geology 14, 451–468.
Alexander, R., Larcher, A.V., Kagi, R.I., Price, P.L., 1992. An oil–source correlationstudy using age specific plant-derived aromatic biomarkers. In: Moldowan, M.J.,Albrecht, P., Philip, P.R. (Eds.), Biological Markers in Sediments and Petroleum.Prentice-Hall, Englewood Cliffs, NJ, pp. 201–221.
Bechtel, A., Hámor-Vidó, M., Gratzer, R., Sachsenhofer, R.F., Püttmann, W., 2012.Facies evolution and stratigraphic correlation in the early Oligocene Tard Clay ofHungary as revealed by maceral, biomarker and stable isotope composition.Marine and Petroleum Geology 35, 55–74.
Bechtel, A., Movsumova, U., Strobl, S.A.I., Sachsenhofer, R.F., Soliman, A., Gratzer, R.,Püttmann, W., 2013. Organofacies and paleoenvironment of the OligoceneMaikop series of Angeharan (eastern Azerbaijan). Organic Geochemistry 56, 51–67.
Berner, R.A., 1984. Sedimentary pyrite formation: an update. Geochimica etCosmochimica Acta 48, 605–615.
Bray, E.E., Evans, E.D., 1961. Distribution of n-paraffins as a clue to recognition ofsource beds. Geochimica et Cosmochimica Acta 22, 2–15.
Coccioni, R., Marsili, A., Montanari, A., Bellanca, A., Neri, R., Bice, D.M., Brinkhuis, H.,Church, N., Macalady, A., McDaniel, A., Deino, A., Lirer, F., Sprovieri, M.,Maiorano, P., Monechi, S., Nini, C., Nocchi, M., Pross, J., Rochette, P., Sagnotti, L.,Tateo, F., Touchard, Y., van Simaeys, S., Williams, G.L., 2008. Integratedstratigraphy of the Oligocene pelagic sequence in the Umbria-Marche Basin(northeastern Apennines, Italy): a potential global stratotype section and point(GSSP) for the Rupelian/Chattian boundary. Geological Society of AmericaBulletin 120, 487–511.
Connan, J., Cassou, A.M., 1980. Properties of gases and petroleum lipids derivedfrom terrestrial kerogen at various maturation levels. Geochimica etCosmochimica Acta 44, 1–23.
Costa, L.I., Downie, C., 1979. The Wetzeliellaceae: Palaeogene dinoflagellates. In:Proceedings IV International Palynological Congress, Lucknow, India, vol. 2, pp.34–43.
Cranwell, P.A., 1977. Organic geochemistry of CamLoch (Sutherland) sediments.Chemical Geology 20, 205–221.
Didyk, B.M., Simoneit, B.R.T., Brassell, S.C., Eglinton, G., 1978. Organic geochemicalindicators of palaeoenvironmental conditions of sedimentation. Nature 272,216–222.
Eglinton, G., Hamilton, R.J., 1967. Leaf epicuticular waxes. Science 156, 1322–1335.Espitalié, J., Marquis, F., Barsony, I., 1984. Geochemical logging. In: Voorhess, K.J.
(Ed.), Analytical Pyrolysis. Butterworths, Boston, pp. 53–79.Farrimond, P., Talbot, H.M., Watson, D.F., Schulz, L.K., Wilhelms, A., 2004.
Methylhopanoids: molecular indicators of ancient bacteria and petroleumcorrelation tool. Geochimica et Cosmochimica Acta 68, 3873–3882.
Feyzullayev, A.A., Guliyev, I.S., Tagiyev, M.F., 2001. Source potential of theMesozoic–Cenozoic rocks in the South Caspian Basin and their role in formingthe oil accumulations in the Lower Pliocene reservoirs. Petroleum Geoscience 7,409–417.
Ficken, K.J., Li, B., Swain, D.L., Eglinton, G., 2000. An n-alkane proxy for thesedimentary input of submerged/floating freshwater aquatic macrophytes.Organic Geochemistry 31, 745–749.
Golonka, J., 2007. Geodynamic evolution of the South Caspian Basin. In: Yilmaz, P.O.,Isaksen, G.H. (Eds.), Oil and Gas of the Greater Caspian Area. AmericanAssociation of Petroleum Geologists Studies in Geology, vol. 55, pp. 17–41.
Goossens, H., de Leeuw, J.W., Schenck, P.A., Brassell, S.C., 1984. Tocopherols as likelyprecursors of pristane in ancient sediments and crude oils. Nature 312, 440–442.
Goubkin, I.M., 1912. Maikopian oil province. In: Proceedings of the GeologicalCommittee, vol. 1, pp. 19–28 (in Russian).
Grantham, P.J., Wakefield, L.L., 1988. Variations in the sterane carbon numberdistribution of marine source rocks derived crude oils through geological time.Organic Geochemistry 12, 61–74.
Guliyev, I.S., Tagiyev, M.F., Feyzullayev, A.A., 2001. Geochemical characteristics oforganic matter from Maikop rocks of eastern Azerbaijan. Lithology and MineralResources 36, 280–285.
Head, M.J., Norris, G., 1989. Palynology and dinocyst stratigraphy of the Eocene andOligocene in ODP Leg 105, Hole 647A, Labrador Sea. In: Srivastava, S.P., Arthur,M., Clement, B., et al. (Eds.), Proceedings of the Ocean Drilling Program,Scientific Results, vol. 105, pp. 515–550.
Hertelendi, A., Vetö, I., 1991. The marine photosynthetic carbon isotopefractionation remained constant during the Early Oligocene. Palaeogeography,Palaeoclimatology, Palaeoecology 83, 333–339.
Hudson, S.M., Johnson, C.L., Efendiyeva, M.A., Rowe, H.D., Feyzullayev, A.A., Aliyev,C.S., 2008. Stratigraphy and geochemical characterization of the Oligocene–Miocene Maikop series: implications for the paleogeography of EasternAzerbaijan. Tectonophysics 451, 40–55.
Hunt, J.M., 1979. Petroleum Geochemistry and Geology. Freeman, San Francisco,California.
Imbus, S.W., Macko, S.A., Elmore, R.D., Engel, M.H., 1992. Stable isotopes (C, S, N)and molecular studies on the Precambrian Nonesuch Shale (Wisconsin,Michigan, USA): evidence for differential preservation rates, depositionalenvironment and hydrothermal influence. Chemical Geology 101, 255–281.
Johnson, C.L., Hudson, S.M., Rowe, H.D., Efendiyeva, M.A., 2009. Geochemicalconstraints on the Paleocene–Miocene evolution of eastern Azerbaijan, withimplications for the South Caspian basin and eastern Paratethys. Basin Research22, 735–755.
Killops, S.D., Killops, V.J., 1993. An Introduction to Organic Geochemistry. LongmanGroup, England, p. 266.
Koopmans, M.P., Schouten, S., Kohnen, M.E.L., Sinninghe Damsté, J.S., 1996a.Restricted utility of aryl isoprenoids as indicators for photic zone anoxia.Geochimica et Cosmochimica Acta 60, 4873–4876.
Koopmans, M.P., Köster, J., van Kaam-Peters, H.M.E., Kenig, F., Schouten, S., Hartgers,W.A., de Leeuw, J.W., Sinninghe Damsté, J.S., 1996b. Diagenetic and catageneticproducts of isorenieratene: molecular indicators for photic zone anoxia.Geochimica et Cosmochimica Acta 60, 4467–4496.
Köthe, A., 1990. Paleogene dinoflagellates from Northwest Germany –biostratigraphy and paleoenvironment. Geologisches Jahrbuch A 118, 3–111.
Langford, F.F., Blanc-Valleron, M.-M., 1990. Interpreting Rock–Eval pyrolysis datausing graphs of pyrolyzable hydrocarbons vs. total organic carbon. AmericanAssociation of Petroleum Geologists Bulletin 74, 799–804.
Lerche, I., Ali-Zadeh, A., Guliyev, I., Bagirov, E., Nadirov, R., Tagiyev, M.F., Feizullayev,A. (Eds.), 1997. South Caspian Basin: Stratigraphy, Geochemistry and RiskAnalysis. Azerbaijan Academy of Sciences, Nafta Press, Baku.
Lewan, M.D., 1986. Stable carbon isotopes of amorphous kerogens from Phanerozoicsedimentary rocks. Geochimica et Cosmochimica Acta 50, 1583–1591.
Littke, R., Klussmann, U., Krooss, B., Leythaeuser, D., 1991. Quantification of loss ofcalcite, pyrite, and organic matter due to weathering of Toarcian black shalesand effects on kerogen and bitumen characteristics. Geochimica etCosmochimica Acta 55, 3369–3378.
lnan, S., Yalcin, M.N., Guliev, I.S., Kuliev, K., Feizullayev, A.A., 1998. Deep petroleumoccurrences in the Lower Kura Depression, South Caspian Basin, Azerbaijan: anorganic geochemical and basin modeling study. Marine and Petroleum Geology14, 731–762.
Mackenzie, A.S., Maxwell, J.R., 1981. Assessment of thermal maturation insedimentary rocks by molecular measurements. In: Brooks, J. (Ed.), OrganicMaturation Studies and Fossil Fuel Exploration. Academic Press, London, pp.239–254.
Mackenzie, A.S., Hoffmann, C.F., Maxwell, J.R., 1981. Molecular parameters ofmaturation in the Toarcian shales, Paris Basin, France: III. Changes in aromaticsteroid hydrocarbons. Geochimica et Cosmochimica Acta 45, 1345–1355.
Mackenzie, A.S., Brassell, S.C., Eglinton, G., Maxwell, J.R., 1982. Chemical fossils: thegeological fate of steroids. Science 217, 491–504.
Martini, E., 1971. Standard Tertiary and Quaternary calcareous nannoplanktonzonation. In: Tecnoscienza (Ed.), Proceedings of the II Planktonic Conference.Roma, pp. 739–785.
Marynowski, L., Smolarek, J., Bechtel, A., Philippe, M., Kurkiewicz, S., Simoneit,B.R.T., 2013. Perylene as an indicator of conifer fossil wood degradation bywood-degrading fungi. Organic Geochemistry 59, 143–151.
Meyers, P.A., 1994. Preservation of source identification of sedimentary organicmatter during and after deposition. Chemical Geology 144, 289–302.
Meyers, P.A., 1997. Organic geochemical proxies of paleoceanographic,paleolimnologic, and paleoclimatic processes. Organic Geochemistry 27, 213–250.
Meyers, P.A., 2003. Applications of organic geochemistry to paleolimnologicalreconstructions: a summary of examples from the Laurentian Great Lakes.Organic Geochemistry 34, 261–289.
Mirchink, M.F., 1933. Stratigraphical and tectonic problems of the SE end of theCaucasus. In: Proceedings of the 2nd Conference of Petroleum Geologists of theTranscaucasia, pp. 34–51 (in Russian).
Moldowan, J.M., Fago, F.J., Lee, C.J., Jacobson, S.R., Watt, D.S., Slougui, N.E.,Jeganathan, A., Young, D.C., 1990. Sedimentary 24-n-cholestanes, molecularfossils diagnostic of marine algae. Science 247, 309–312.
Müller, P.J., 1977. C/N ratios of marine sediments: effect of inorganic ammoniumand sorbed organic nitrogen of clays. Geochimica et Cosmochimica Acta 41,765–776.
Ourrison, G., Albrecht, P., Rohmer, M., 1979. The hopanoids: Palaeo-chemistry andbiochemistry of a group of natural products. Pure and Applied Chemistry 51,709–729.
A. Bechtel et al. / Organic Geochemistry 71 (2014) 43–59 59
Perch-Nielsen, K., 1985. Cenozoic calcareous nannofossils. In: Bolli, H.M., Saunders,J.B., Perch-Nielsen, K. (Eds.), Plankton Stratigraphy. Cambridge University Press,pp. 427–554.
Peters, K.E., 1986. Guidelines for evaluating petroleum source rock usingprogrammed pyrolysis. American Association of Petroleum Geologists Bulletin70, 318–329.
Peters, K.E., Sweeney, R.E., Kaplan, I.R., 1978. Correlation of carbon and nitrogenstable isotope ratios in sedimentary organic matter. Limnology andOceanography 23, 598–604.
Peters, K.E., Walters, C.C., Moldowan, J.M., 2005. The Biomarker Guide, Biomarkersand Isotopes in Petroleum Exploration and Earth History, vols. 1 & 2. CambridgeUniversity Press, New York, NY.
Pfennig, N., 1977. Phototrophic green and purple bacteria: a comparative,systematic survey. Annual Review of Microbiology 31, 275–290.
Powell, A.J., 1992. Dinoflagellate cysts of the Tertiary system. In: Powell, A.J. (Ed.), AStratigraphic Index of Dinoflagellate Cysts. Chapman and Hall, London, pp. 155–252.
Pross, J., 2001. Dinoflagellate cyst biogeography and biostratigraphy as a tool forpalaeoceanographic reconstructions: an example from the Oligocene of westernEurope. Neues Jahrbuch für Geologie und Paläontologie, Abhandlungen 219,207–219.
Pross, J., Schmiedl, G., 2002. Early Oligocene dinoflagellate cysts from the northernRhine Graben (SW Germany): Paleoenvironmental and paleoclimaticimplications. Marine Micropaleontology 45, 1–24.
Pross, J., Houben, A.P.J., van Simaeys, S., Williams, G.L., Kotthoff, U., Coccioni, R.,Wilpshaar, M., Brinkhuis, H., 2010. Umbria-Marche revisited: a refinedmagnetostratigraphic calibration of dinoflagellate cyst events for the Oligoceneof the Western Tethys. Review of Palaeobotany and Palynology 158, 213–235.
Radke, M., Welte, D.H., 1983. The methylphenanthrene index (MPI): amaturity parameter based on aromatic hydrocarbons. In: Bjorøy, M. et al. (Eds.),Advances in Organic Geochemistry, 1981. Wiley, Chichester, pp. 504–512.
Radke, M., Willsch, H., Welte, D.H., 1980. Preparative hydrocarbon group typedetermination by automated medium pressure liquid chromatography.Analytical Chemistry 52, 406–411.
Radke, M., Leythaeuser, D., Teichmüller, M., 1984. Relationship between rank andcomposition of aromatic hydrocarbons from coals if different origins. OrganicGeochemistry 6, 423–430.
Rohmer, M., Bisseret, P., Neunlist, S., 1992. The hopanoids, prokaryotic triterpenoidsand precursors of ubiquitous molecular fossils. In: Moldowan, J.M., Albrecht, P.,Philp, R.P. (Eds.), Biological Markers in Sediments and Petroleum. Prentice Hall,Englewood Cliffs, NJ, pp. 1–17.
Sachsenhofer, R.F., Stummer, B., Georgiev, G., Dellmour, R., Bechtel, A., Gratzer, R.,Coric, S., 2009. Depositional environment and hydrocarbon source potential ofthe Oligocene Ruslar Formation (Kamchia Depression; western Black Sea).Marine and Petroleum Geology 26, 57–84.
Sachsenhofer, R., Leitner, B., Linzer, H.-G., Bechtel, A., Coric, S., Gratzer, R.,Reischenbacher, D., Soliman, A., 2010. Deposition, erosion and hydrocarbonsource potential of the Oligocene Eggerding Formation (Molasse Basin, Austria).Austrian Journal of Earth Sciences 103, 76–99.
Sarjeant, W.A.S., 1983. A restudy of some dinoflagellate cyst holotypes in theUniversity of Kiel collections IV. The Oligocene and Miocene holotypes ofDOROTHEA MAIER (1959). Meyniana 35, 85–137.
Schulz, H.-M., Sachsenhofer, R.F., Bechtel, A., Polesny, H., Wagner, L., 2002.The origin of hydrocarbon source rocks in the Austrian Molasse Basin(Eocene–Oligocene transition). Marine and Petroleum Geology 19, 683–709.
Schwark, L., Frimmel, A., 2004. Chemostratigraphy of the Posidonia Black Shale, SW-Germany II. Assessment of extent and persistence of photic-zone anoxia usingaryl isoprenoid distribution. Chemical Geology 206, 231–248.
Sofer, Z., 1984. Stable carbon isotope composition of crude oils: application tosource depositional environments and petroleum alteration. AmericanAssociation of Petroleum Geologists Bulletin 68, 31–49.
Summons, R.E., 1993. Biogeochemical cycles: a review of fundamental aspects oforganic matter formation, preservation, and composition. In: Engel, M.H.,Macko, S.A. (Eds.), Organic Geochemistry – Principles and Applications. PlenumPress, New York, pp. 3–21.
Summons, R.E., Powell, T.G., 1987. Identification of aryl isoprenoids in source rocksand crude oils: biological markers for the green sulphur bacteria. Geochimica etCosmochimica Acta 51, 557–566.
Talbot, M.R., 2001. Nitrogen isotopes in palaeolimnology. In: Last, W.M., Smol, J.P.(Eds.), Tracking Environmental Changes Using Lake Sediments: Physical andChemical Techniques. Kluwer, Dordrecht, pp. 401–439.
Talbot, M.R., Laerdal, T., 2000. The Late Pleistocene–Holocene palaeolimnology ofLake Victoria, East Africa, based upon elemental and isotopic analyses ofsedimentary organic matter. Journal of Paleolimnology 23, 141–164.
ten Haven, H.L., de Leeuw, J.W., Rullkötter, J., Sinninghe Damsté, J.S., 1987.Restricted utility of the pristane/phytane ratio as a palaeoenvironmentalindicator. Nature 330, 641–643.
Tissot, B.T., Welte, D.H., 1984. Petroleum Formation and Occurrence, second Ed.Springer-Verlag, Berlin, p. 699.
Vail, P.R., Mitchum, R.M., 1979. Global cycles of relative changes of sea level fromseismic stratigraphy. American Association of Petroleum Geologists Memoir 29,469–472.
van Simaeys, S., Munsterman, D., Brinkhuis, H., 2005. Oligocene dinoflagellate cystbiostratigraphy of the southern North Sea Basin. Review of Palaeobotany andPalynology 134, 105–128.
Volkman, J.K., 1986. A review of sterol markers for marine and terrigenous organicmatter. Organic Geochemistry 9, 83–99.
Volkman, J.K., Maxwell, J.R., 1986. Acyclic isoprenoids as biological markers. In:Johns, R.B. (Ed.), Biological Markers in the Sedimentary Record. Elsevier,Amsterdam, pp. 1–42.
Volkman, J.K., Barrett, S.M., Blackburn, S.I., Mansour, M.P., Sikes, E.L., Gelin, F., 1998.Microalgae biomarkers: a review of recent research developments. OrganicGeochemistry 29, 1163–1179.
Volkman, J.K., Barrett, S.M., Blackburn, S.I., 1999. Eustigmatophyte microalgae arepotential sources of C29 sterols, C22–C28 n-alcohols and C28–C32 n-alkyl diols infreshwater environments. Organic Geochemistry 30, 307–318.
Williams, G.L., Bujak, J.P., 1985. Mesozoic and Cenozoic dinoflagellates. In: Bolli,H.M., Saunders, J.B., Perch-Nielsen, K. (Eds.), Plankton Stratigraphy. CambridgeUniversity Press, Cambridge, United Kingdom, pp. 847–964.
Williams, G.L., Bujak, J.P., Brinkhuis, H., 1999. Mesozoic–Cenozoic DinoflagellateCyst Course, Urbino, Italy, May 17–22, 1999, 407p.
Copyright © 2022 FDOKUMEN