The mysterious morphology of MRC0943-242 as revealed by ...
15
A&A 586, A124 (2016) DOI: 10.1051/0004-6361/201526858 c ESO 2016 Astronomy & Astrophysics The mysterious morphology of MRC0943-242 as revealed by ALMA and MUSE Bitten Gullberg 1 , Carlos De Breuck 1 , Matthew D. Lehnert 2 , Joël Vernet 1 , Roland Bacon 3 , Guillaume Drouart 4 , Bjorn Emonts 5 , Audrey Galametz 6 , Rob Ivison 1,7 , Nicole P. H. Nesvadba 8 , Johan Richard 3 , Nick Seymour 9 , Daniel Stern 10 , and Dominika Wylezalek 11 1 European Southern Observatory, Karl-Schwarzschild-Str. 2, 85748 Garching, Germany e-mail: [email protected] 2 Institut d’Astrophysique de Paris, UMR 7095, CNRS, Université Pierre et Marie Curie, 98bis boulevard Arago, 75014 Paris, France 3 CRAL, Observatoire de Lyon, CNRS, Université Lyon 1, 9 avenue Ch. André, 69561 Saint Genis-Laval Cedex, France 4 Department of Earth and Space Science, Chalmers University of Technology, Onsala Space Observatory, 43992 Onsala, Sweden 5 Centro de Astrobiología (INTA-CSIC), Ctra de Torrejón a Ajalvir, km 4, 28850 Torrej´ n de Ardoz, Madrid, Spain 6 Max-Planck-Institut für Extraterrestrische Physik, Giessenbachstraße 1, 85748 Garching, Germany 7 Institute for Astronomy, The University of Edinburgh, Royal Observatory, Blackford Hill, Edinburgh EH9 3HJ, UK 8 Institut d’Astrophysique Spatiale, CNRS, Université Paris-Sud, Bat. 120-121, 91405 Orsay, France 9 International Centre for Radio Astronomy Research, Curtin University, Perth WA 6845, Australia 10 Jet Propulsion Laboratory, California Institute of Technology, Pasadena, CA 91109, USA 11 Department of Physics and Astronomy, Johns Hopkins University, 3400 N. Charles St, Baltimore, MD 21218, USA Received 30 June 2015 / Accepted 9 October 2015 ABSTRACT We present a pilot study of the z = 2.923 radio galaxy MRC0943-242, where we combine information from ALMA and MUSE data cubes for the first time. Even with modest integration times, we disentangle the AGN and starburst dominated components. These data reveal a highly complex morphology as the AGN, starburst, and molecular gas components show up as widely separated sources in dust continuum, optical continuum, and CO line emission observations. CO(1-0) and CO(8-7) line emission suggest that there is a molecular gas reservoir offset from both the dust and the optical continuum that is located ∼90 kpc from the AGN. The UV line emission has a complex structure in emission and absorption. The line emission is mostly due to a large scale ionisation cone energised by the AGN, and a Lyα emitting bridge of gas between the radio galaxy and a heavily star-forming set of components. Strangely, the ionisation cone has no Lyα emission. We find this is due to an optically thick layer of neutral gas with unity covering fraction spread out over a region of at least ∼100kpc from the AGN. Other less thick absorption components are associated with Lyα emitting gas within a few tens of kpc from the radio galaxy and are connected by a bridge of emission. We speculate that this linear structure of dust, Lyα and CO emission, and the redshifted absorption seen in the circum nuclear region may represent an accretion flow feeding gas into this massive AGN host galaxy. Key words. galaxies: evolution – galaxies: high-redshift – galaxies: active – galaxies: ISM – galaxies: halos 1. Introduction Powerful high-z radio galaxies (HzRGs), defined as having L 3 GHz > 10 26 W Hz -1 and z > 1, are unique markers of the most active galaxies in the early Universe, showing signatures of both luminous AGN activity and vigorous starbursts. HzRGs are extremely luminous in both the mid-IR (Ogle et al. 2006; Seymour et al. 2007; De Breuck et al. 2010) and the submillime- tre (submm) waveband (Archibald et al. 2001; Reuland et al. 2004; Drouart et al. 2014). This has been interpreted as evidence of high black hole accretion rates, combined with high star for- mation rates (SFRs). HzRGs are some of the most massive galax- ies known at any redshift, with M > 10 11 M of stars (Seymour et al. 2007; De Breuck et al. 2010), confirming prior indications of their large masses from the tight correlation of the observed near-IR Hubble K - z diagram for these sources (Lilly & Longair 1984; Eales et al. 1997; De Breuck et al. 2002). In order to be so luminous, the black holes in these galaxies must be massive. Given that stellar bulge mass correlates with black hole mass (e.g. Tremaine et al. 2002), it is therefore no surprise that the most powerful radio galaxies reside in the most massive stellar hosts. Disentangling the AGN and starburst components requires excellent sampling of the spectral energy distribution (SED). Seymour et al. (2012) illustrate the decomposition of the star- burst and AGN components using 3.5-850 μm photometry in the z = 2.16 radio galaxy, PKS 1138-262, showing that both have roughly equal contributions to the IR luminosity. Disentangling the SED of HzRG is the main goal of our HErschel Radio Galaxy Evolution (HERGÉ) project (Drouart et al. 2014). The 71 HzRG targeted in the HERGÉ project are uniformly distributed across 1.0 < z < 5.2 with a range of radio powers. Spitzer, Herschel, SCUBA, and LABOCA data suggest that the sources targeted in the HERGÉ project have very high far-IR (FIR) luminosities (∼10 13 L , Drouart et al. 2014), but the data do not have high enough spatial resolution to pinpoint the AGN host galaxies as the source of the FIR emission. Resolution is important, as spec- tral decomposition alone is probably insufficient to understand the evolutionary state of HzRGs. Article published by EDP Sciences A124, page 1 of 15
-
Upload
khangminh22 -
Category
Documents
-
view
0 -
download
0
Transcript of The mysterious morphology of MRC0943-242 as revealed by ...
A&A 586, A124 (2016)DOI: 10.1051/0004-6361/201526858c© ESO 2016
Astronomy&
Astrophysics
The mysterious morphology of MRC0943-242as revealed by ALMA and MUSE
Bitten Gullberg1, Carlos De Breuck1, Matthew D. Lehnert2, Joël Vernet1, Roland Bacon3, Guillaume Drouart4,Bjorn Emonts5, Audrey Galametz6, Rob Ivison1,7, Nicole P. H. Nesvadba8, Johan Richard3, Nick Seymour9,
Daniel Stern10, and Dominika Wylezalek11
1 European Southern Observatory, Karl-Schwarzschild-Str. 2, 85748 Garching, Germanye-mail: [email protected]
2 Institut d’Astrophysique de Paris, UMR 7095, CNRS, Université Pierre et Marie Curie, 98bis boulevard Arago, 75014 Paris, France3 CRAL, Observatoire de Lyon, CNRS, Université Lyon 1, 9 avenue Ch. André, 69561 Saint Genis-Laval Cedex, France4 Department of Earth and Space Science, Chalmers University of Technology, Onsala Space Observatory, 43992 Onsala, Sweden5 Centro de Astrobiología (INTA-CSIC), Ctra de Torrejón a Ajalvir, km 4, 28850 Torrejn de Ardoz, Madrid, Spain6 Max-Planck-Institut für Extraterrestrische Physik, Giessenbachstraße 1, 85748 Garching, Germany7 Institute for Astronomy, The University of Edinburgh, Royal Observatory, Blackford Hill, Edinburgh EH9 3HJ, UK8 Institut d’Astrophysique Spatiale, CNRS, Université Paris-Sud, Bat. 120-121, 91405 Orsay, France9 International Centre for Radio Astronomy Research, Curtin University, Perth WA 6845, Australia
10 Jet Propulsion Laboratory, California Institute of Technology, Pasadena, CA 91109, USA11 Department of Physics and Astronomy, Johns Hopkins University, 3400 N. Charles St, Baltimore, MD 21218, USA
Received 30 June 2015 / Accepted 9 October 2015
ABSTRACT
We present a pilot study of the z = 2.923 radio galaxy MRC0943-242, where we combine information from ALMA and MUSE datacubes for the first time. Even with modest integration times, we disentangle the AGN and starburst dominated components. Thesedata reveal a highly complex morphology as the AGN, starburst, and molecular gas components show up as widely separated sourcesin dust continuum, optical continuum, and CO line emission observations. CO(1−0) and CO(8−7) line emission suggest that thereis a molecular gas reservoir offset from both the dust and the optical continuum that is located ∼90 kpc from the AGN. The UV lineemission has a complex structure in emission and absorption. The line emission is mostly due to a large scale ionisation cone energisedby the AGN, and a Lyα emitting bridge of gas between the radio galaxy and a heavily star-forming set of components. Strangely, theionisation cone has no Lyα emission. We find this is due to an optically thick layer of neutral gas with unity covering fraction spreadout over a region of at least ∼100 kpc from the AGN. Other less thick absorption components are associated with Lyα emitting gaswithin a few tens of kpc from the radio galaxy and are connected by a bridge of emission. We speculate that this linear structure ofdust, Lyα and CO emission, and the redshifted absorption seen in the circum nuclear region may represent an accretion flow feedinggas into this massive AGN host galaxy.
Key words. galaxies: evolution – galaxies: high-redshift – galaxies: active – galaxies: ISM – galaxies: halos
1. Introduction
Powerful high-z radio galaxies (HzRGs), defined as havingL3 GHz > 1026 W Hz−1 and z > 1, are unique markers of themost active galaxies in the early Universe, showing signaturesof both luminous AGN activity and vigorous starbursts. HzRGsare extremely luminous in both the mid-IR (Ogle et al. 2006;Seymour et al. 2007; De Breuck et al. 2010) and the submillime-tre (submm) waveband (Archibald et al. 2001; Reuland et al.2004; Drouart et al. 2014). This has been interpreted as evidenceof high black hole accretion rates, combined with high star for-mation rates (SFRs). HzRGs are some of the most massive galax-ies known at any redshift, with M > 1011 M� of stars (Seymouret al. 2007; De Breuck et al. 2010), confirming prior indicationsof their large masses from the tight correlation of the observednear-IR Hubble K−z diagram for these sources (Lilly & Longair1984; Eales et al. 1997; De Breuck et al. 2002). In order to beso luminous, the black holes in these galaxies must be massive.Given that stellar bulge mass correlates with black hole mass(e.g. Tremaine et al. 2002), it is therefore no surprise that the
most powerful radio galaxies reside in the most massive stellarhosts.
Disentangling the AGN and starburst components requiresexcellent sampling of the spectral energy distribution (SED).Seymour et al. (2012) illustrate the decomposition of the star-burst and AGN components using 3.5−850 µm photometry in thez = 2.16 radio galaxy, PKS 1138-262, showing that both haveroughly equal contributions to the IR luminosity. Disentanglingthe SED of HzRG is the main goal of our HErschel Radio GalaxyEvolution (HERGÉ) project (Drouart et al. 2014). The 71 HzRGtargeted in the HERGÉ project are uniformly distributed across1.0 < z < 5.2 with a range of radio powers. Spitzer, Herschel,SCUBA, and LABOCA data suggest that the sources targetedin the HERGÉ project have very high far-IR (FIR) luminosities(∼1013 L�, Drouart et al. 2014), but the data do not have highenough spatial resolution to pinpoint the AGN host galaxies asthe source of the FIR emission. Resolution is important, as spec-tral decomposition alone is probably insufficient to understandthe evolutionary state of HzRGs.
Article published by EDP Sciences A124, page 1 of 15
A&A 586, A124 (2016)
Previous single sources studies of HzRGs have revealed thatthese systems have highly complicated morphologies, for exam-ple with line emission separated from the continuum emission.In several systems (e.g. 4C41.17, 4C60.07, TXS0828+193, andB3 J2330+3927), most of the gas and dust emission originatesfrom the companion rather than the AGN host galaxy, while oth-ers (e.g. MRC0114-211, MRC0156-252, and MRC2048-272)show no evidence for a companion (De Breuck et al. 2003,2005; Ivison et al. 2008, 2012; Nesvadba et al. 2009; Emontset al. 2014). These observations confirm that spectral decompo-sition alone is insufficient to understand the evolutionary state ofHzRGs; sufficiently high spatial resolution to separate out indi-vidual emission components is also crucial.
The sub-arcsecond spatial resolution of ALMA will un-doubtedly reveal a much more complex composition of AGNand starburst dominated sources than previously thought. To il-lustrate this point, we conducted a pilot study of MRC0943-242at z = 2.9, where we combine − for the first time − sensi-tive ALMA 235 GHz and VLT/MUSE observations. This com-bination allows us to trace the spatially resolved distributions ofthe ionisation state of the warm ionised medium (T ∼ 104 K)through the UV emission and absorption lines (e.g. CIV), thewarm neutral gas (T ∼ few ×103 K) through Lyα absorption,and the dense and diffuse molecular gas as probed by the dustand high-J CO transitions. Through this combination it is pos-sible to get a comprehensive picture of several important phasesof gas in the interstellar medium and haloes of HzRGs.
MRC0943-242 is an ultra-steep spectrum radio source witha spectral index of α = −1.5 between 1.4−30 GHz and showsno evidence of a spectral curvature within this range (Carilliet al. 1997; Emonts et al. 2011). MRC0943-242 is located ina proto-cluster (with an over density of almost 5σ; Wylezaleket al. 2013) surrounded by many nearby companions detected inLyα with known redshifts (Venemans et al. 2007) and a giantquiescent Lyα halo with a diameter of ≥100 kpc − extending farbeyond the radio structure (Villar-Martín et al. 2003). A deep ab-sorption trough in the Lyα emission line suggests the presenceof a large amount of neutral gas (Röttgering et al. 1995). Basedon a 1.5 Å-resolution spectrum Röttgering et al. (1995) concludethat the saturated absorption trough is due to a reservoir of neu-tral hydrogen (HI) situated within the HzRG it self. They deter-mine a HI column density of NHI = 1019 cm−2 in the absorber.Using the same observational set-up, Binette et al. (2000) deter-mine a HI column density similar to that of Röttgering et al.(1995) and a CIV column density of NCIV = 1014.5±0.1 cm−2.However based on Voigt-profile fittings to the absorption troughsin both the Lyα and CIV emission lines Binette et al. (2000) con-clude that the reservoir of gas causing the absorption features isnot situated within the HzRG, but rather due to a low metallic-ity (Z = 0.01 Z�), low density gas in the outer halo at a red-shift of z = 2.29202 ± 0.0002. They propose that this gas is aremnant of gas expelled from the HzRG during the initial star-burst. Though such a starburst is expected to enrich the expelledgas more than what is observed for MRC0943-242, Jarvis et al.(2003) still favoured this scenario. Based on numerical simula-tions by Bekki (1998), which predict that the outer regions ofgalactic halos should be less metal-rich, Jarvis et al. (2003), asBinette et al. (2000), favored a picture where the shell lies in thehalo to explain its the low metallicity. Furthermore, by compar-ing MRC0943-242 with another HzRG (MRC0200+015), theyargue that the age of the system can have an influence on themetallicity of the shells. They conclude that the metallicities ofabsorption shells surrounding HzRG vary from galaxy to galaxyand from shell to shell. This implies that the shells must be
enriched by a variety of processes. With UVES data with a spec-tral resolution of 25 000−40 000 Jarvis et al. (2003) identifiedthree additional weaker absorbing components of different HIcolumn densities.
In this paper, we present a study of MRC0943-242, wherewe for the first time combine relatively short ALMA submmobservations with MUSE optical observations. This ALMA-MUSE-pilot study reveals an even more complex morphology ofMRC0943-242 than previously seen with star-formation takingplace far outside the AGN host galaxy. In Sect. 2 we present ourALMA submm and MUSE optical observations. The results ofthese observations are given in Sect. 3 and are analysed and dis-cussed in Sect. 4. In Sect. 5 we speculate as to the origin and roleof the substructures and in Sect. 6 we summarise our conclusion.
2. Observations
2.1. ALMA observations
The Atacama Large Milimeter/submilimeter Array (ALMA) cy-cle 1 observations in Band 6 were carried out on 2014 April 29for 3 min on-source time with 36 working antennas. The four1.875 GHz spectral windows were tuned to cover the frequencyranges 233.6−237.1 GHz and 248.6−252.3 GHz. We used theCommon Astronomy Software Applications (CASA) and thesupplied calibration script to calibrate the data, produce the datacube and moment 0 maps. The average Tsys was ∼80 K and theaverage precipitable water vapour 1.3 mm. The quasar J1037-2934 was used as bandpass calibrator and results in an astro-metric accuracy of 4 mas. The UV coverage was sparse, but uni-form over ∼400 kλ. In order to search for CO(8−7) line emissionat νrest = 921.80 GHz, which is within the frequency rangeat z = 2.923, we subtracted the continuum in the UV-planeby fitting a first-order polynomial to all four spectral windows,as no strong line emission is contaminating the continuum. Asour data are limited by the signal-to-noise ratio (S/N), we usea natural weighting (robust parameter of 2). This results in a0.′′7 × 0.′′6 beam with pa = 75◦ and an rms of 0.1 mJy for thecontinuum. We binned the line data to 10 km s−1 which has anrms of 1.7 mJy. As objects are detected up to 12′′ from the phasecentre, we applied a primary beam correction on all our mapsand spectra.
2.2. MUSE observations
Multi Unit Spectroscopic Explorer (MUSE; Bacon et al. 2010)observations were obtained on 2014 February 21, during thefirst commissioning run of the instrument (see Bacon et al.2014) on VLT/UT4. This one hour observation taken under∼1′′ seeing was split into three 20 min exposures taken at 45,135 and 225 deg position angle with a small dithering offsetto minimise the effect of systematics. In order to observe theLyα line of MRC0943-242 at 476.5 nm, we used the extendedwavelength range mode (i.e. without second order blocking fil-ter), resulting in a observed wavelength range of 460−935 nm).These data were taken specifically to compare MUSE observa-tions with previous observations with other instruments of thiswell-studied source. Thus it serves as a pilot study for usingMUSE to study HzRGs. All data were processed with the ver-sion 1.0 of the MUSE pipeline (Weilbacher et al. 2012) to pro-duce a fully calibrated and sky subtracted data cube. Finally, thecube was cleaned for sky subtraction residuals with the principalcomponent analysis (PCA) based algorithm ZAP developed bySoto et al. (in prep.). To analyse the line emission and to remove
A124, page 2 of 15
B. Gullberg et al.: The mysterious morphology of MRC0943-242 as revealed by ALMA and MUSE
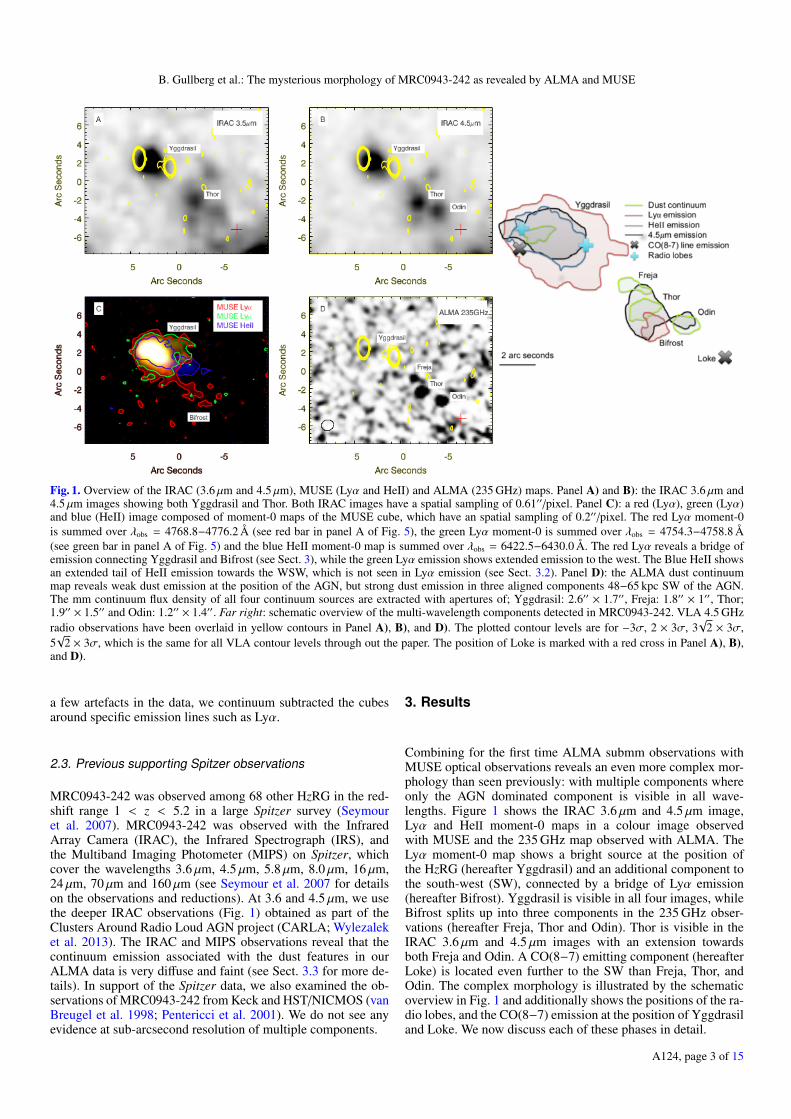
Fig. 1. Overview of the IRAC (3.6 µm and 4.5 µm), MUSE (Lyα and HeII) and ALMA (235 GHz) maps. Panel A) and B): the IRAC 3.6 µm and4.5 µm images showing both Yggdrasil and Thor. Both IRAC images have a spatial sampling of 0.61′′/pixel. Panel C): a red (Lyα), green (Lyα)and blue (HeII) image composed of moment-0 maps of the MUSE cube, which have an spatial sampling of 0.2′′/pixel. The red Lyα moment-0is summed over λobs = 4768.8−4776.2 Å (see red bar in panel A of Fig. 5), the green Lyα moment-0 is summed over λobs = 4754.3−4758.8 Å(see green bar in panel A of Fig. 5) and the blue HeII moment-0 map is summed over λobs = 6422.5−6430.0 Å. The red Lyα reveals a bridge ofemission connecting Yggdrasil and Bifrost (see Sect. 3), while the green Lyα emission shows extended emission to the west. The Blue HeII showsan extended tail of HeII emission towards the WSW, which is not seen in Lyα emission (see Sect. 3.2). Panel D): the ALMA dust continuummap reveals weak dust emission at the position of the AGN, but strong dust emission in three aligned components 48−65 kpc SW of the AGN.The mm continuum flux density of all four continuum sources are extracted with apertures of; Yggdrasil: 2.6′′ × 1.7′′, Freja: 1.8′′ × 1′′, Thor;1.9′′ × 1.5′′ and Odin: 1.2′′ × 1.4′′. Far right: schematic overview of the multi-wavelength components detected in MRC0943-242. VLA 4.5 GHzradio observations have been overlaid in yellow contours in Panel A), B), and D). The plotted contour levels are for −3σ, 2 × 3σ, 3
√2 × 3σ,
5√
2 × 3σ, which is the same for all VLA contour levels through out the paper. The position of Loke is marked with a red cross in Panel A), B),and D).
a few artefacts in the data, we continuum subtracted the cubesaround specific emission lines such as Lyα.
2.3. Previous supporting Spitzer observations
MRC0943-242 was observed among 68 other HzRG in the red-shift range 1 < z < 5.2 in a large Spitzer survey (Seymouret al. 2007). MRC0943-242 was observed with the InfraredArray Camera (IRAC), the Infrared Spectrograph (IRS), andthe Multiband Imaging Photometer (MIPS) on Spitzer, whichcover the wavelengths 3.6 µm, 4.5 µm, 5.8 µm, 8.0 µm, 16 µm,24 µm, 70 µm and 160 µm (see Seymour et al. 2007 for detailson the observations and reductions). At 3.6 and 4.5 µm, we usethe deeper IRAC observations (Fig. 1) obtained as part of theClusters Around Radio Loud AGN project (CARLA; Wylezaleket al. 2013). The IRAC and MIPS observations reveal that thecontinuum emission associated with the dust features in ourALMA data is very diffuse and faint (see Sect. 3.3 for more de-tails). In support of the Spitzer data, we also examined the ob-servations of MRC0943-242 from Keck and HST/NICMOS (vanBreugel et al. 1998; Pentericci et al. 2001). We do not see anyevidence at sub-arcsecond resolution of multiple components.
3. Results
Combining for the first time ALMA submm observations withMUSE optical observations reveals an even more complex mor-phology than seen previously: with multiple components whereonly the AGN dominated component is visible in all wave-lengths. Figure 1 shows the IRAC 3.6 µm and 4.5 µm image,Lyα and HeII moment-0 maps in a colour image observedwith MUSE and the 235 GHz map observed with ALMA. TheLyα moment-0 map shows a bright source at the position ofthe HzRG (hereafter Yggdrasil) and an additional component tothe south-west (SW), connected by a bridge of Lyα emission(hereafter Bifrost). Yggdrasil is visible in all four images, whileBifrost splits up into three components in the 235 GHz obser-vations (hereafter Freja, Thor and Odin). Thor is visible in theIRAC 3.6 µm and 4.5 µm images with an extension towardsboth Freja and Odin. A CO(8−7) emitting component (hereafterLoke) is located even further to the SW than Freja, Thor, andOdin. The complex morphology is illustrated by the schematicoverview in Fig. 1 and additionally shows the positions of the ra-dio lobes, and the CO(8−7) emission at the position of Yggdrasiland Loke. We now discuss each of these phases in detail.
A124, page 3 of 15
A&A 586, A124 (2016)
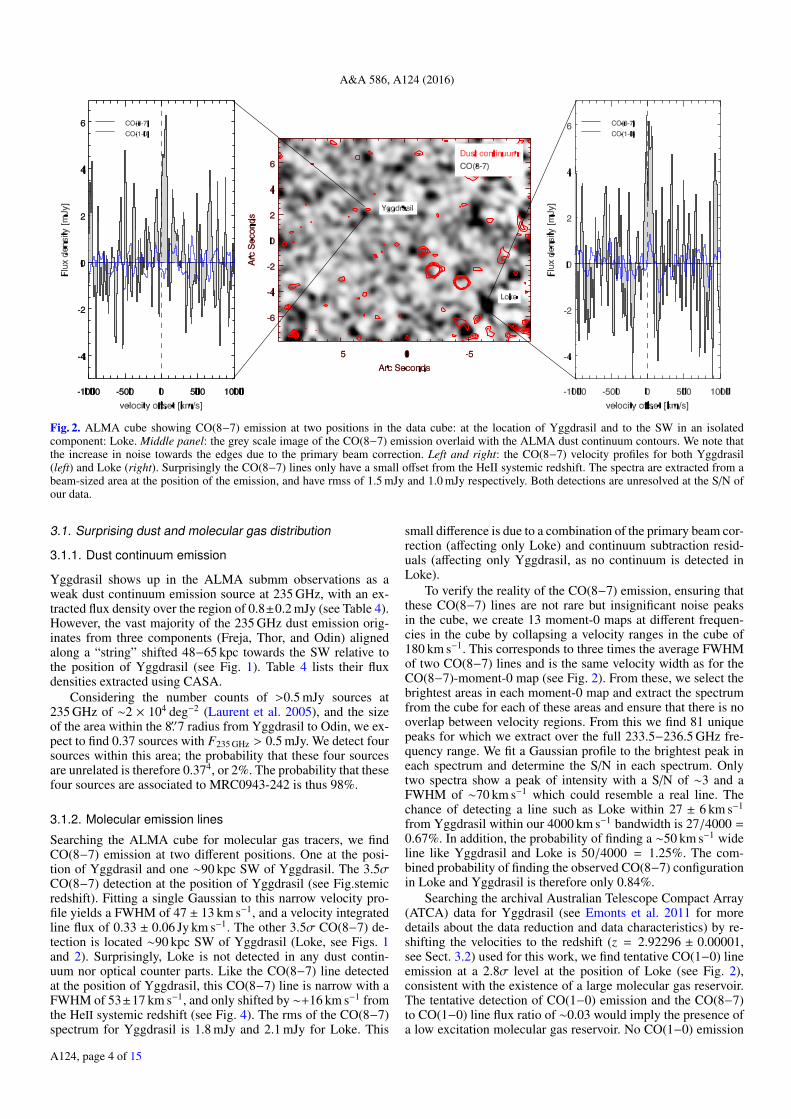
Fig. 2. ALMA cube showing CO(8−7) emission at two positions in the data cube: at the location of Yggdrasil and to the SW in an isolatedcomponent: Loke. Middle panel: the grey scale image of the CO(8−7) emission overlaid with the ALMA dust continuum contours. We note thatthe increase in noise towards the edges due to the primary beam correction. Left and right: the CO(8−7) velocity profiles for both Yggdrasil(left) and Loke (right). Surprisingly the CO(8−7) lines only have a small offset from the HeII systemic redshift. The spectra are extracted from abeam-sized area at the position of the emission, and have rmss of 1.5 mJy and 1.0 mJy respectively. Both detections are unresolved at the S/N ofour data.
3.1. Surprising dust and molecular gas distribution
3.1.1. Dust continuum emission
Yggdrasil shows up in the ALMA submm observations as aweak dust continuum emission source at 235 GHz, with an ex-tracted flux density over the region of 0.8±0.2 mJy (see Table 4).However, the vast majority of the 235 GHz dust emission orig-inates from three components (Freja, Thor, and Odin) alignedalong a “string” shifted 48−65 kpc towards the SW relative tothe position of Yggdrasil (see Fig. 1). Table 4 lists their fluxdensities extracted using CASA.
Considering the number counts of >0.5 mJy sources at235 GHz of ∼2 × 10⁴ deg−2 (Laurent et al. 2005), and the sizeof the area within the 8.′′7 radius from Yggdrasil to Odin, we ex-pect to find 0.37 sources with F235 GHz > 0.5 mJy. We detect foursources within this area; the probability that these four sourcesare unrelated is therefore 0.374, or 2%. The probability that thesefour sources are associated to MRC0943-242 is thus 98%.
3.1.2. Molecular emission lines
Searching the ALMA cube for molecular gas tracers, we findCO(8−7) emission at two different positions. One at the posi-tion of Yggdrasil and one ∼90 kpc SW of Yggdrasil. The 3.5σCO(8−7) detection at the position of Yggdrasil (see Fig.stemicredshift). Fitting a single Gaussian to this narrow velocity pro-file yields a FWHM of 47 ± 13 km s−1, and a velocity integratedline flux of 0.33 ± 0.06 Jy km s−1. The other 3.5σ CO(8−7) de-tection is located ∼90 kpc SW of Yggdrasil (Loke, see Figs. 1and 2). Surprisingly, Loke is not detected in any dust contin-uum nor optical counter parts. Like the CO(8−7) line detectedat the position of Yggdrasil, this CO(8−7) line is narrow with aFWHM of 53±17 km s−1, and only shifted by ∼+16 km s−1 fromthe HeII systemic redshift (see Fig. 4). The rms of the CO(8−7)spectrum for Yggdrasil is 1.8 mJy and 2.1 mJy for Loke. This
small difference is due to a combination of the primary beam cor-rection (affecting only Loke) and continuum subtraction resid-uals (affecting only Yggdrasil, as no continuum is detected inLoke).
To verify the reality of the CO(8−7) emission, ensuring thatthese CO(8−7) lines are not rare but insignificant noise peaksin the cube, we create 13 moment-0 maps at different frequen-cies in the cube by collapsing a velocity ranges in the cube of180 km s−1. This corresponds to three times the average FWHMof two CO(8−7) lines and is the same velocity width as for theCO(8−7)-moment-0 map (see Fig. 2). From these, we select thebrightest areas in each moment-0 map and extract the spectrumfrom the cube for each of these areas and ensure that there is nooverlap between velocity regions. From this we find 81 uniquepeaks for which we extract over the full 233.5−236.5 GHz fre-quency range. We fit a Gaussian profile to the brightest peak ineach spectrum and determine the S/N in each spectrum. Onlytwo spectra show a peak of intensity with a S/N of ∼3 and aFWHM of ∼70 km s−1 which could resemble a real line. Thechance of detecting a line such as Loke within 27 ± 6 km s−1
from Yggdrasil within our 4000 km s−1 bandwidth is 27/4000 =0.67%. In addition, the probability of finding a ∼50 km s−1 wideline like Yggdrasil and Loke is 50/4000 = 1.25%. The com-bined probability of finding the observed CO(8−7) configurationin Loke and Yggdrasil is therefore only 0.84%.
Searching the archival Australian Telescope Compact Array(ATCA) data for Yggdrasil (see Emonts et al. 2011 for moredetails about the data reduction and data characteristics) by re-shifting the velocities to the redshift (z = 2.92296 ± 0.00001,see Sect. 3.2) used for this work, we find tentative CO(1−0) lineemission at a 2.8σ level at the position of Loke (see Fig. 2),consistent with the existence of a large molecular gas reservoir.The tentative detection of CO(1−0) emission and the CO(8−7)to CO(1−0) line flux ratio of ∼0.03 would imply the presence ofa low excitation molecular gas reservoir. No CO(1−0) emission
A124, page 4 of 15
B. Gullberg et al.: The mysterious morphology of MRC0943-242 as revealed by ALMA and MUSE
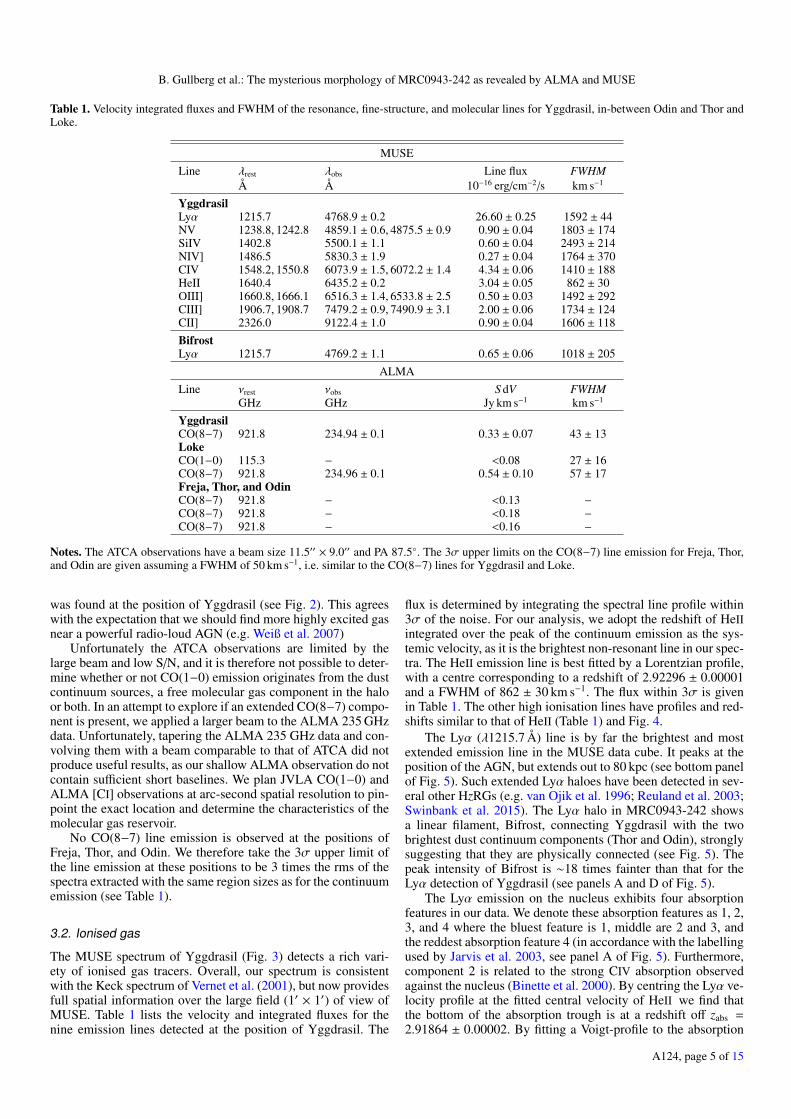
Table 1. Velocity integrated fluxes and FWHM of the resonance, fine-structure, and molecular lines for Yggdrasil, in-between Odin and Thor andLoke.
MUSELine λrest λobs Line flux FWHM
Å Å 10−16 erg/cm−2/s km s−1
YggdrasilLyα 1215.7 4768.9 ± 0.2 26.60 ± 0.25 1592 ± 44NV 1238.8, 1242.8 4859.1 ± 0.6, 4875.5 ± 0.9 0.90 ± 0.04 1803 ± 174SiIV 1402.8 5500.1 ± 1.1 0.60 ± 0.04 2493 ± 214NIV] 1486.5 5830.3 ± 1.9 0.27 ± 0.04 1764 ± 370CIV 1548.2, 1550.8 6073.9 ± 1.5, 6072.2 ± 1.4 4.34 ± 0.06 1410 ± 188HeII 1640.4 6435.2 ± 0.2 3.04 ± 0.05 862 ± 30OIII] 1660.8, 1666.1 6516.3 ± 1.4, 6533.8 ± 2.5 0.50 ± 0.03 1492 ± 292CIII] 1906.7, 1908.7 7479.2 ± 0.9, 7490.9 ± 3.1 2.00 ± 0.06 1734 ± 124CII] 2326.0 9122.4 ± 1.0 0.90 ± 0.04 1606 ± 118BifrostLyα 1215.7 4769.2 ± 1.1 0.65 ± 0.06 1018 ± 205
ALMALine νrest νobs S dV FWHM
GHz GHz Jy km s−1 km s−1
YggdrasilCO(8−7) 921.8 234.94 ± 0.1 0.33 ± 0.07 43 ± 13LokeCO(1−0) 115.3 − <0.08 27 ± 16CO(8−7) 921.8 234.96 ± 0.1 0.54 ± 0.10 57 ± 17Freja, Thor, and OdinCO(8−7) 921.8 − <0.13 −
CO(8−7) 921.8 − <0.18 −
CO(8−7) 921.8 − <0.16 −
Notes. The ATCA observations have a beam size 11.5′′ × 9.0′′ and PA 87.5◦. The 3σ upper limits on the CO(8−7) line emission for Freja, Thor,and Odin are given assuming a FWHM of 50 km s−1, i.e. similar to the CO(8−7) lines for Yggdrasil and Loke.
was found at the position of Yggdrasil (see Fig. 2). This agreeswith the expectation that we should find more highly excited gasnear a powerful radio-loud AGN (e.g. Weiß et al. 2007)
Unfortunately the ATCA observations are limited by thelarge beam and low S/N, and it is therefore not possible to deter-mine whether or not CO(1−0) emission originates from the dustcontinuum sources, a free molecular gas component in the haloor both. In an attempt to explore if an extended CO(8−7) compo-nent is present, we applied a larger beam to the ALMA 235 GHzdata. Unfortunately, tapering the ALMA 235 GHz data and con-volving them with a beam comparable to that of ATCA did notproduce useful results, as our shallow ALMA observation do notcontain sufficient short baselines. We plan JVLA CO(1−0) andALMA [CI] observations at arc-second spatial resolution to pin-point the exact location and determine the characteristics of themolecular gas reservoir.
No CO(8−7) line emission is observed at the positions ofFreja, Thor, and Odin. We therefore take the 3σ upper limit ofthe line emission at these positions to be 3 times the rms of thespectra extracted with the same region sizes as for the continuumemission (see Table 1).
3.2. Ionised gas
The MUSE spectrum of Yggdrasil (Fig. 3) detects a rich vari-ety of ionised gas tracers. Overall, our spectrum is consistentwith the Keck spectrum of Vernet et al. (2001), but now providesfull spatial information over the large field (1′ × 1′) of view ofMUSE. Table 1 lists the velocity and integrated fluxes for thenine emission lines detected at the position of Yggdrasil. The
flux is determined by integrating the spectral line profile within3σ of the noise. For our analysis, we adopt the redshift of HeIIintegrated over the peak of the continuum emission as the sys-temic velocity, as it is the brightest non-resonant line in our spec-tra. The HeII emission line is best fitted by a Lorentzian profile,with a centre corresponding to a redshift of 2.92296 ± 0.00001and a FWHM of 862 ± 30 km s−1. The flux within 3σ is givenin Table 1. The other high ionisation lines have profiles and red-shifts similar to that of HeII (Table 1) and Fig. 4.
The Lyα (λ1215.7 Å) line is by far the brightest and mostextended emission line in the MUSE data cube. It peaks at theposition of the AGN, but extends out to 80 kpc (see bottom panelof Fig. 5). Such extended Lyα haloes have been detected in sev-eral other HzRGs (e.g. van Ojik et al. 1996; Reuland et al. 2003;Swinbank et al. 2015). The Lyα halo in MRC0943-242 showsa linear filament, Bifrost, connecting Yggdrasil with the twobrightest dust continuum components (Thor and Odin), stronglysuggesting that they are physically connected (see Fig. 5). Thepeak intensity of Bifrost is ∼18 times fainter than that for theLyα detection of Yggdrasil (see panels A and D of Fig. 5).
The Lyα emission on the nucleus exhibits four absorptionfeatures in our data. We denote these absorption features as 1, 2,3, and 4 where the bluest feature is 1, middle are 2 and 3, andthe reddest absorption feature 4 (in accordance with the labellingused by Jarvis et al. 2003, see panel A of Fig. 5). Furthermore,component 2 is related to the strong CIV absorption observedagainst the nucleus (Binette et al. 2000). By centring the Lyα ve-locity profile at the fitted central velocity of HeII we find thatthe bottom of the absorption trough is at a redshift off zabs =2.91864 ± 0.00002. By fitting a Voigt-profile to the absorption
A124, page 5 of 15
A&A 586, A124 (2016)
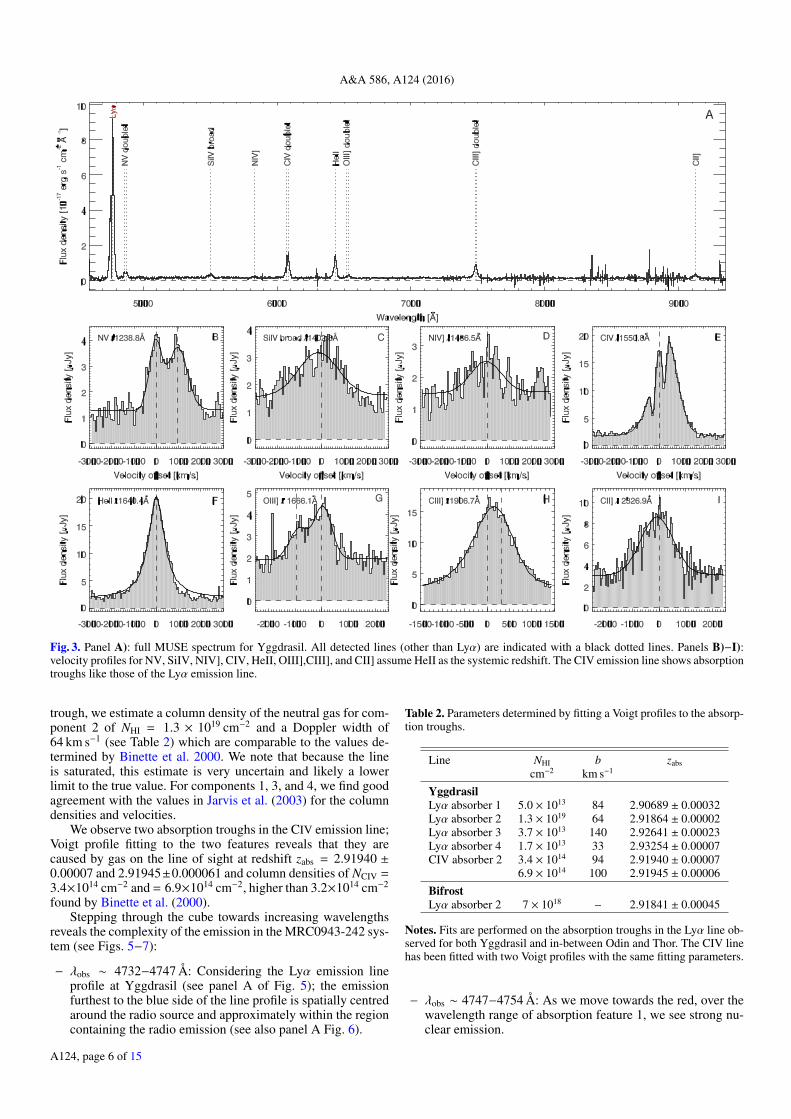
Fig. 3. Panel A): full MUSE spectrum for Yggdrasil. All detected lines (other than Lyα) are indicated with a black dotted lines. Panels B)−I):velocity profiles for NV, SiIV, NIV], CIV, HeII, OIII],CIII], and CII] assume HeII as the systemic redshift. The CIV emission line shows absorptiontroughs like those of the Lyα emission line.
trough, we estimate a column density of the neutral gas for com-ponent 2 of NHI = 1.3 × 1019 cm−2 and a Doppler width of64 km s−1 (see Table 2) which are comparable to the values de-termined by Binette et al. 2000. We note that because the lineis saturated, this estimate is very uncertain and likely a lowerlimit to the true value. For components 1, 3, and 4, we find goodagreement with the values in Jarvis et al. (2003) for the columndensities and velocities.
We observe two absorption troughs in the CIV emission line;Voigt profile fitting to the two features reveals that they arecaused by gas on the line of sight at redshift zabs = 2.91940 ±0.00007 and 2.91945±0.000061 and column densities of NCIV =3.4×1014 cm−2 and = 6.9×1014 cm−2, higher than 3.2×1014 cm−2
found by Binette et al. (2000).Stepping through the cube towards increasing wavelengths
reveals the complexity of the emission in the MRC0943-242 sys-tem (see Figs. 5−7):
− λobs ∼ 4732−4747 Å: Considering the Lyα emission lineprofile at Yggdrasil (see panel A of Fig. 5); the emissionfurthest to the blue side of the line profile is spatially centredaround the radio source and approximately within the regioncontaining the radio emission (see also panel A Fig. 6).
Table 2. Parameters determined by fitting a Voigt profiles to the absorp-tion troughs.
Line NHI b zabscm−2 km s−1
YggdrasilLyα absorber 1 5.0 × 10¹³ 84 2.90689 ± 0.00032Lyα absorber 2 1.3 × 10¹⁹ 64 2.91864 ± 0.00002Lyα absorber 3 3.7 × 10¹³ 140 2.92641 ± 0.00023Lyα absorber 4 1.7 × 10¹³ 33 2.93254 ± 0.00007CIV absorber 2 3.4 × 10¹⁴ 94 2.91940 ± 0.00007
6.9 × 10¹⁴ 100 2.91945 ± 0.00006BifrostLyα absorber 2 7 × 10¹⁸ − 2.91841 ± 0.00045
Notes. Fits are performed on the absorption troughs in the Lyα line ob-served for both Yggdrasil and in-between Odin and Thor. The CIV linehas been fitted with two Voigt profiles with the same fitting parameters.
− λobs ∼ 4747−4754 Å: As we move towards the red, over thewavelength range of absorption feature 1, we see strong nu-clear emission.
A124, page 6 of 15
B. Gullberg et al.: The mysterious morphology of MRC0943-242 as revealed by ALMA and MUSE
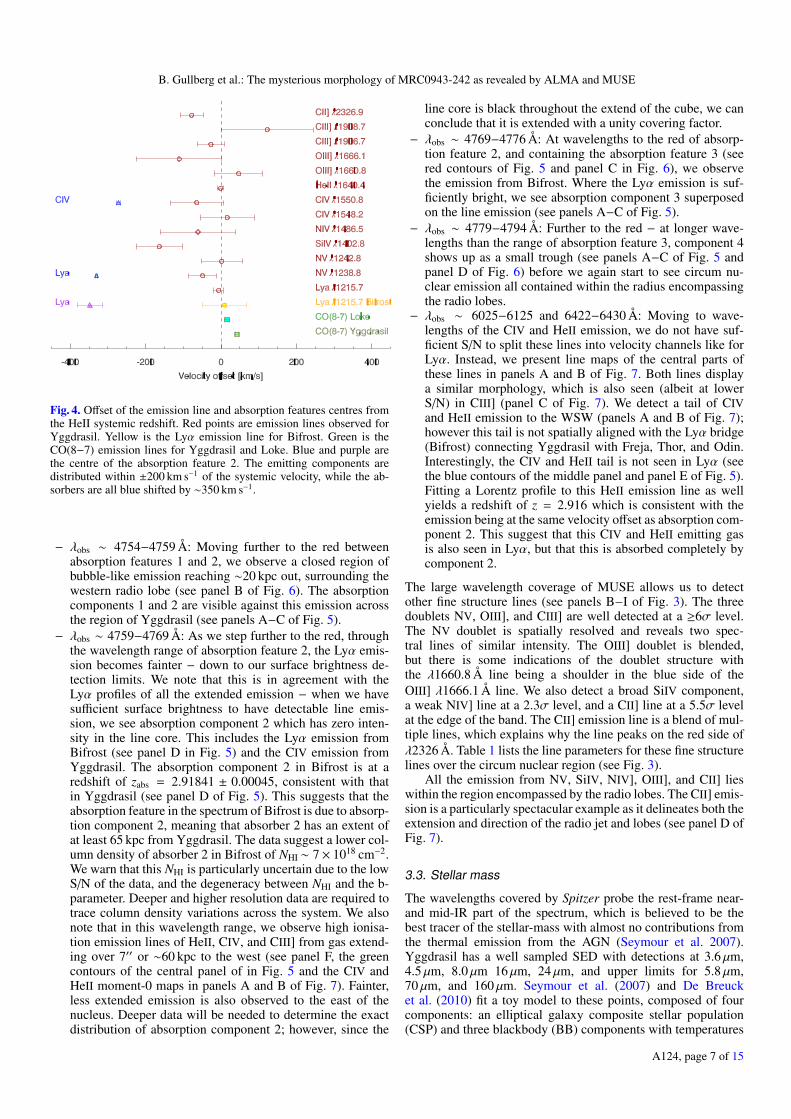
Fig. 4. Offset of the emission line and absorption features centres fromthe HeII systemic redshift. Red points are emission lines observed forYggdrasil. Yellow is the Lyα emission line for Bifrost. Green is theCO(8−7) emission lines for Yggdrasil and Loke. Blue and purple arethe centre of the absorption feature 2. The emitting components aredistributed within ±200 km s−1 of the systemic velocity, while the ab-sorbers are all blue shifted by ∼350 km s−1.
− λobs ∼ 4754−4759 Å: Moving further to the red betweenabsorption features 1 and 2, we observe a closed region ofbubble-like emission reaching ∼20 kpc out, surrounding thewestern radio lobe (see panel B of Fig. 6). The absorptioncomponents 1 and 2 are visible against this emission acrossthe region of Yggdrasil (see panels A−C of Fig. 5).
− λobs ∼ 4759−4769 Å: As we step further to the red, throughthe wavelength range of absorption feature 2, the Lyα emis-sion becomes fainter − down to our surface brightness de-tection limits. We note that this is in agreement with theLyα profiles of all the extended emission − when we havesufficient surface brightness to have detectable line emis-sion, we see absorption component 2 which has zero inten-sity in the line core. This includes the Lyα emission fromBifrost (see panel D in Fig. 5) and the CIV emission fromYggdrasil. The absorption component 2 in Bifrost is at aredshift of zabs = 2.91841 ± 0.00045, consistent with thatin Yggdrasil (see panel D of Fig. 5). This suggests that theabsorption feature in the spectrum of Bifrost is due to absorp-tion component 2, meaning that absorber 2 has an extent ofat least 65 kpc from Yggdrasil. The data suggest a lower col-umn density of absorber 2 in Bifrost of NHI ∼ 7× 1018 cm−2.We warn that this NHI is particularly uncertain due to the lowS/N of the data, and the degeneracy between NHI and the b-parameter. Deeper and higher resolution data are required totrace column density variations across the system. We alsonote that in this wavelength range, we observe high ionisa-tion emission lines of HeII, CIV, and CIII] from gas extend-ing over 7′′ or ∼60 kpc to the west (see panel F, the greencontours of the central panel of in Fig. 5 and the CIV andHeII moment-0 maps in panels A and B of Fig. 7). Fainter,less extended emission is also observed to the east of thenucleus. Deeper data will be needed to determine the exactdistribution of absorption component 2; however, since the
line core is black throughout the extend of the cube, we canconclude that it is extended with a unity covering factor.
− λobs ∼ 4769−4776 Å: At wavelengths to the red of absorp-tion feature 2, and containing the absorption feature 3 (seered contours of Fig. 5 and panel C in Fig. 6), we observethe emission from Bifrost. Where the Lyα emission is suf-ficiently bright, we see absorption component 3 superposedon the line emission (see panels A−C of Fig. 5).
− λobs ∼ 4779−4794 Å: Further to the red − at longer wave-lengths than the range of absorption feature 3, component 4shows up as a small trough (see panels A−C of Fig. 5 andpanel D of Fig. 6) before we again start to see circum nu-clear emission all contained within the radius encompassingthe radio lobes.
− λobs ∼ 6025−6125 and 6422−6430 Å: Moving to wave-lengths of the CIV and HeII emission, we do not have suf-ficient S/N to split these lines into velocity channels like forLyα. Instead, we present line maps of the central parts ofthese lines in panels A and B of Fig. 7. Both lines displaya similar morphology, which is also seen (albeit at lowerS/N) in CIII] (panel C of Fig. 7). We detect a tail of CIVand HeII emission to the WSW (panels A and B of Fig. 7);however this tail is not spatially aligned with the Lyα bridge(Bifrost) connecting Yggdrasil with Freja, Thor, and Odin.Interestingly, the CIV and HeII tail is not seen in Lyα (seethe blue contours of the middle panel and panel E of Fig. 5).Fitting a Lorentz profile to this HeII emission line as wellyields a redshift of z = 2.916 which is consistent with theemission being at the same velocity offset as absorption com-ponent 2. This suggest that this CIV and HeII emitting gasis also seen in Lyα, but that this is absorbed completely bycomponent 2.
The large wavelength coverage of MUSE allows us to detectother fine structure lines (see panels B−I of Fig. 3). The threedoublets NV, OIII], and CIII] are well detected at a ≥6σ level.The NV doublet is spatially resolved and reveals two spec-tral lines of similar intensity. The OIII] doublet is blended,but there is some indications of the doublet structure withthe λ1660.8 Å line being a shoulder in the blue side of theOIII] λ1666.1 Å line. We also detect a broad SiIV component,a weak NIV] line at a 2.3σ level, and a CII] line at a 5.5σ levelat the edge of the band. The CII] emission line is a blend of mul-tiple lines, which explains why the line peaks on the red side ofλ2326 Å. Table 1 lists the line parameters for these fine structurelines over the circum nuclear region (see Fig. 3).
All the emission from NV, SiIV, NIV], OIII], and CII] lieswithin the region encompassed by the radio lobes. The CII] emis-sion is a particularly spectacular example as it delineates both theextension and direction of the radio jet and lobes (see panel D ofFig. 7).
3.3. Stellar mass
The wavelengths covered by Spitzer probe the rest-frame near-and mid-IR part of the spectrum, which is believed to be thebest tracer of the stellar-mass with almost no contributions fromthe thermal emission from the AGN (Seymour et al. 2007).Yggdrasil has a well sampled SED with detections at 3.6 µm,4.5 µm, 8.0 µm 16 µm, 24 µm, and upper limits for 5.8 µm,70 µm, and 160 µm. Seymour et al. (2007) and De Breucket al. (2010) fit a toy model to these points, composed of fourcomponents: an elliptical galaxy composite stellar population(CSP) and three blackbody (BB) components with temperatures
A124, page 7 of 15
A&A 586, A124 (2016)
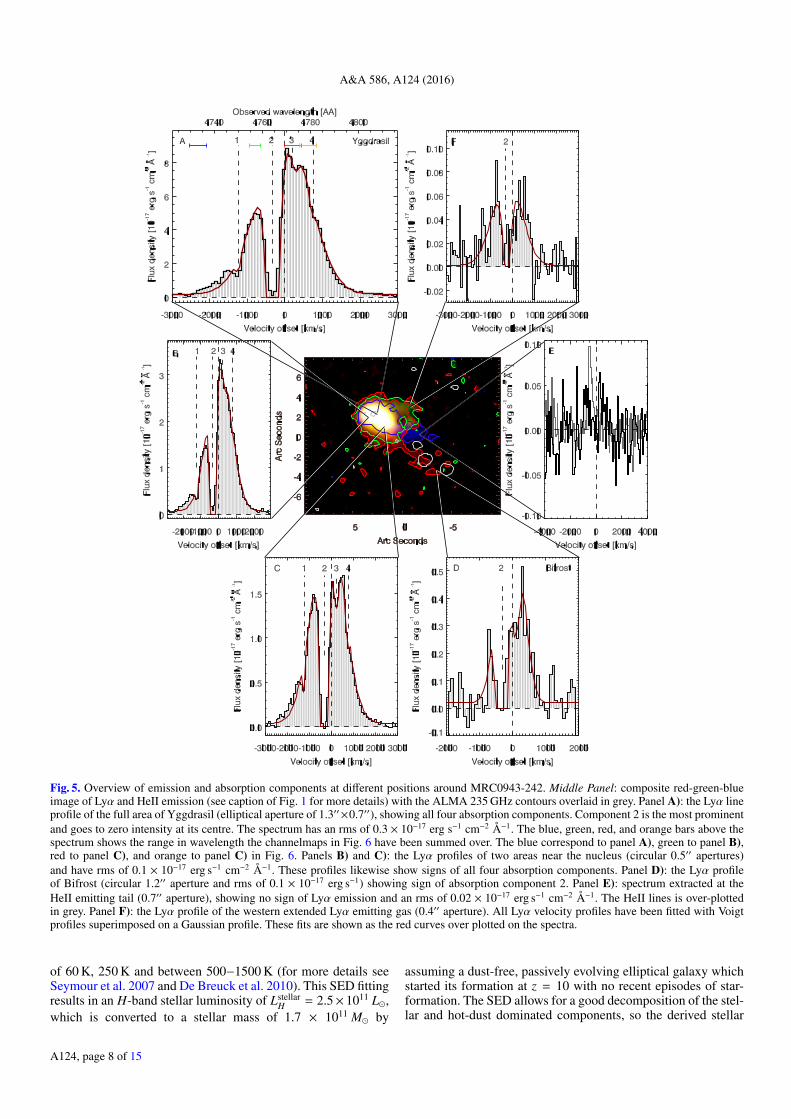
Fig. 5. Overview of emission and absorption components at different positions around MRC0943-242. Middle Panel: composite red-green-blueimage of Lyα and HeII emission (see caption of Fig. 1 for more details) with the ALMA 235 GHz contours overlaid in grey. Panel A): the Lyα lineprofile of the full area of Yggdrasil (elliptical aperture of 1.3′′×0.7′′), showing all four absorption components. Component 2 is the most prominentand goes to zero intensity at its centre. The spectrum has an rms of 0.3 × 10⁻¹⁷ erg s−1 cm−2 Å−1. The blue, green, red, and orange bars above thespectrum shows the range in wavelength the channelmaps in Fig. 6 have been summed over. The blue correspond to panel A), green to panel B),red to panel C), and orange to panel C) in Fig. 6. Panels B) and C): the Lyα profiles of two areas near the nucleus (circular 0.5′′ apertures)and have rms of 0.1 × 10⁻¹⁷ erg s−1 cm−2 Å−1. These profiles likewise show signs of all four absorption components. Panel D): the Lyα profileof Bifrost (circular 1.2′′ aperture and rms of 0.1 × 10⁻¹⁷ erg s−1) showing sign of absorption component 2. Panel E): spectrum extracted at theHeII emitting tail (0.7′′ aperture), showing no sign of Lyα emission and an rms of 0.02 × 10⁻¹⁷ erg s−1 cm−2 Å−1. The HeII lines is over-plottedin grey. Panel F): the Lyα profile of the western extended Lyα emitting gas (0.4′′ aperture). All Lyα velocity profiles have been fitted with Voigtprofiles superimposed on a Gaussian profile. These fits are shown as the red curves over plotted on the spectra.
of 60 K, 250 K and between 500−1500 K (for more details seeSeymour et al. 2007 and De Breuck et al. 2010). This SED fittingresults in an H-band stellar luminosity of Lstellar
H = 2.5× 10¹¹ L�,which is converted to a stellar mass of 1.7 × 10¹¹ M� by
assuming a dust-free, passively evolving elliptical galaxy whichstarted its formation at z = 10 with no recent episodes of star-formation. The SED allows for a good decomposition of the stel-lar and hot-dust dominated components, so the derived stellar
A124, page 8 of 15
B. Gullberg et al.: The mysterious morphology of MRC0943-242 as revealed by ALMA and MUSE
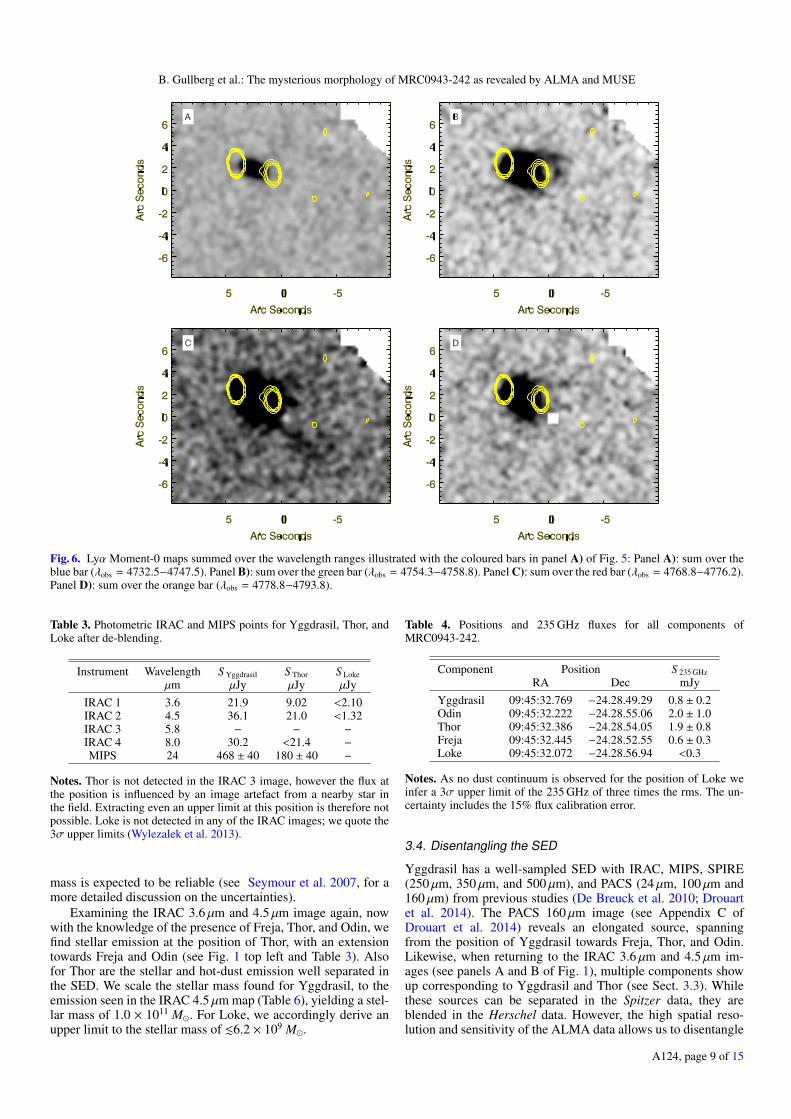
Fig. 6. Lyα Moment-0 maps summed over the wavelength ranges illustrated with the coloured bars in panel A) of Fig. 5: Panel A): sum over theblue bar (λobs = 4732.5−4747.5). Panel B): sum over the green bar (λobs = 4754.3−4758.8). Panel C): sum over the red bar (λobs = 4768.8−4776.2).Panel D): sum over the orange bar (λobs = 4778.8−4793.8).
Table 3. Photometric IRAC and MIPS points for Yggdrasil, Thor, andLoke after de-blending.
Instrument Wavelength S Yggdrasil S Thor S Lokeµm µJy µJy µJy
IRAC 1 3.6 21.9 9.02 <2.10IRAC 2 4.5 36.1 21.0 <1.32IRAC 3 5.8 − − −
IRAC 4 8.0 30.2 <21.4 −
MIPS 24 468 ± 40 180 ± 40 −
Notes. Thor is not detected in the IRAC 3 image, however the flux atthe position is influenced by an image artefact from a nearby star inthe field. Extracting even an upper limit at this position is therefore notpossible. Loke is not detected in any of the IRAC images; we quote the3σ upper limits (Wylezalek et al. 2013).
mass is expected to be reliable (see Seymour et al. 2007, for amore detailed discussion on the uncertainties).
Examining the IRAC 3.6 µm and 4.5 µm image again, nowwith the knowledge of the presence of Freja, Thor, and Odin, wefind stellar emission at the position of Thor, with an extensiontowards Freja and Odin (see Fig. 1 top left and Table 3). Alsofor Thor are the stellar and hot-dust emission well separated inthe SED. We scale the stellar mass found for Yggdrasil, to theemission seen in the IRAC 4.5 µm map (Table 6), yielding a stel-lar mass of 1.0 × 10¹¹ M�. For Loke, we accordingly derive anupper limit to the stellar mass of .6.2 × 109 M�.
Table 4. Positions and 235 GHz fluxes for all components ofMRC0943-242.
Component Position S 235 GHzRA Dec mJy
Yggdrasil 09:45:32.769 −24.28.49.29 0.8 ± 0.2Odin 09:45:32.222 −24.28.55.06 2.0 ± 1.0Thor 09:45:32.386 −24.28.54.05 1.9 ± 0.8Freja 09:45:32.445 −24.28.52.55 0.6 ± 0.3Loke 09:45:32.072 −24.28.56.94 <0.3
Notes. As no dust continuum is observed for the position of Loke weinfer a 3σ upper limit of the 235 GHz of three times the rms. The un-certainty includes the 15% flux calibration error.
3.4. Disentangling the SED
Yggdrasil has a well-sampled SED with IRAC, MIPS, SPIRE(250 µm, 350 µm, and 500 µm), and PACS (24 µm, 100 µm and160 µm) from previous studies (De Breuck et al. 2010; Drouartet al. 2014). The PACS 160 µm image (see Appendix C ofDrouart et al. 2014) reveals an elongated source, spanningfrom the position of Yggdrasil towards Freja, Thor, and Odin.Likewise, when returning to the IRAC 3.6 µm and 4.5 µm im-ages (see panels A and B of Fig. 1), multiple components showup corresponding to Yggdrasil and Thor (see Sect. 3.3). Whilethese sources can be separated in the Spitzer data, they areblended in the Herschel data. However, the high spatial reso-lution and sensitivity of the ALMA data allows us to disentangle
A124, page 9 of 15
A&A 586, A124 (2016)
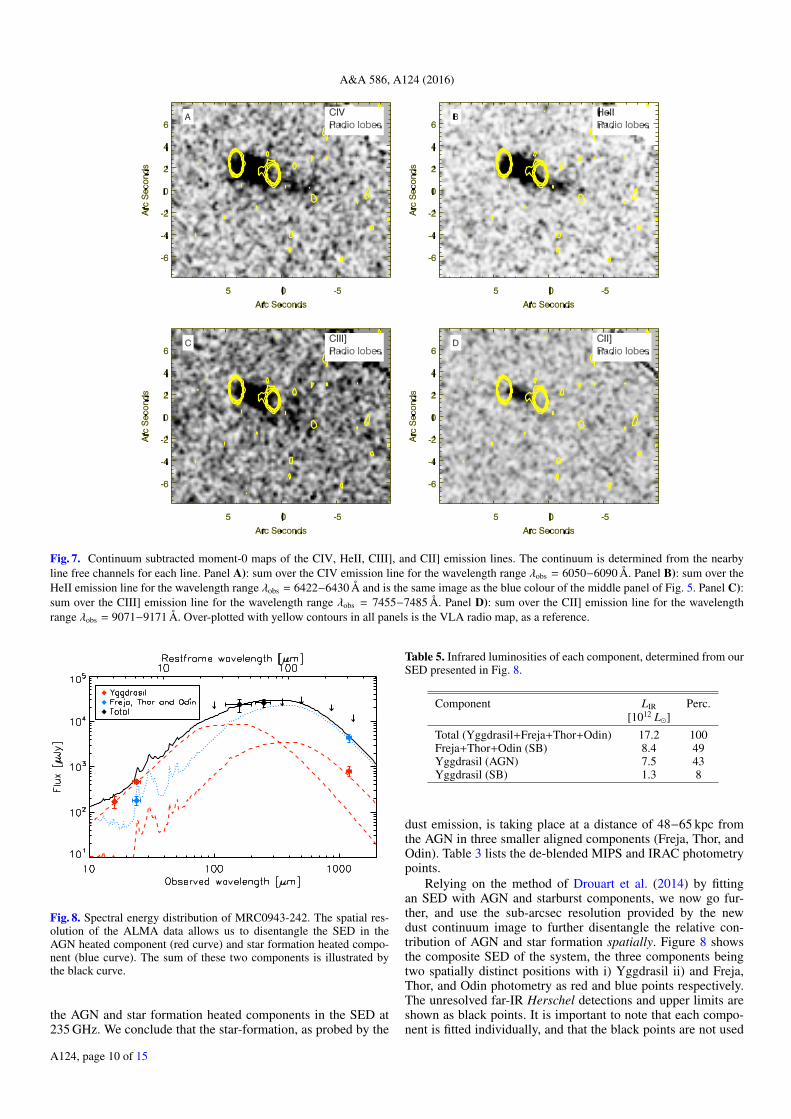
Fig. 7. Continuum subtracted moment-0 maps of the CIV, HeII, CIII], and CII] emission lines. The continuum is determined from the nearbyline free channels for each line. Panel A): sum over the CIV emission line for the wavelength range λobs = 6050−6090 Å. Panel B): sum over theHeII emission line for the wavelength range λobs = 6422−6430 Å and is the same image as the blue colour of the middle panel of Fig. 5. Panel C):sum over the CIII] emission line for the wavelength range λobs = 7455−7485 Å. Panel D): sum over the CII] emission line for the wavelengthrange λobs = 9071−9171 Å. Over-plotted with yellow contours in all panels is the VLA radio map, as a reference.
Fig. 8. Spectral energy distribution of MRC0943-242. The spatial res-olution of the ALMA data allows us to disentangle the SED in theAGN heated component (red curve) and star formation heated compo-nent (blue curve). The sum of these two components is illustrated bythe black curve.
the AGN and star formation heated components in the SED at235 GHz. We conclude that the star-formation, as probed by the
Table 5. Infrared luminosities of each component, determined from ourSED presented in Fig. 8.
Component LIR Perc.[1012 L�]
Total (Yggdrasil+Freja+Thor+Odin) 17.2 100Freja+Thor+Odin (SB) 8.4 49Yggdrasil (AGN) 7.5 43Yggdrasil (SB) 1.3 8
dust emission, is taking place at a distance of 48−65 kpc fromthe AGN in three smaller aligned components (Freja, Thor, andOdin). Table 3 lists the de-blended MIPS and IRAC photometrypoints.
Relying on the method of Drouart et al. (2014) by fittingan SED with AGN and starburst components, we now go fur-ther, and use the sub-arcsec resolution provided by the newdust continuum image to further disentangle the relative con-tribution of AGN and star formation spatially. Figure 8 showsthe composite SED of the system, the three components beingtwo spatially distinct positions with i) Yggdrasil ii) and Freja,Thor, and Odin photometry as red and blue points respectively.The unresolved far-IR Herschel detections and upper limits areshown as black points. It is important to note that each compo-nent is fitted individually, and that the black points are not used
A124, page 10 of 15
B. Gullberg et al.: The mysterious morphology of MRC0943-242 as revealed by ALMA and MUSE
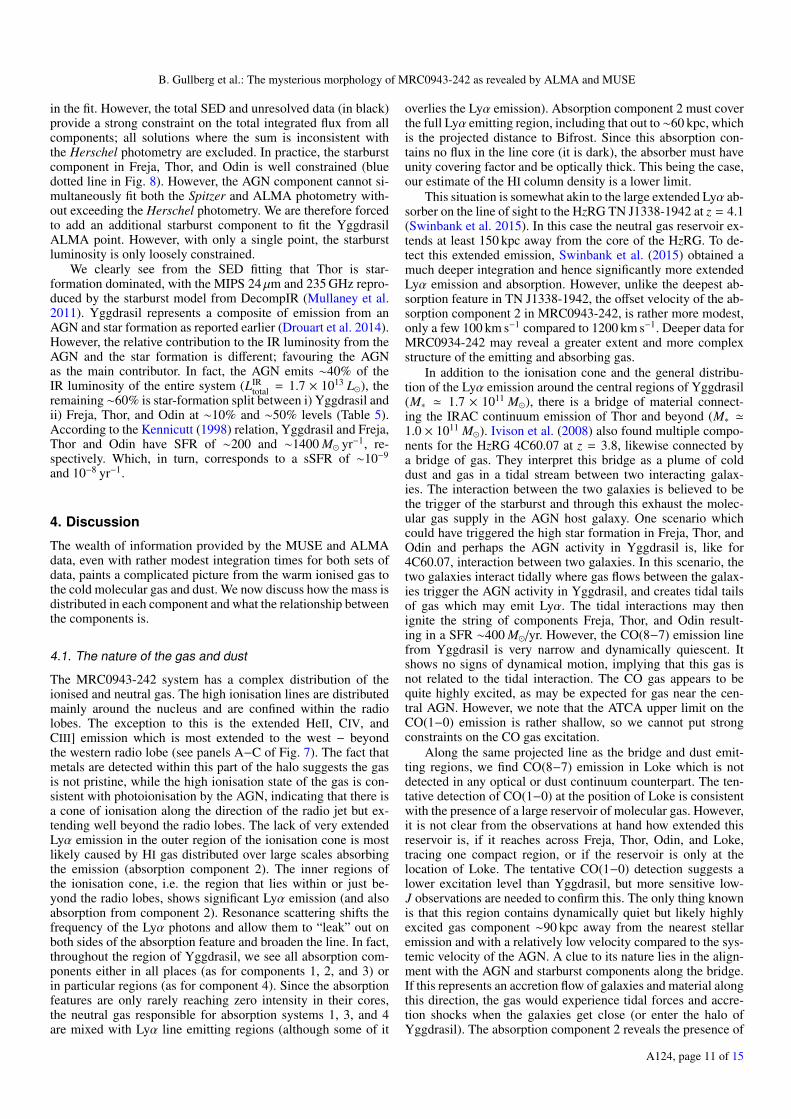
in the fit. However, the total SED and unresolved data (in black)provide a strong constraint on the total integrated flux from allcomponents; all solutions where the sum is inconsistent withthe Herschel photometry are excluded. In practice, the starburstcomponent in Freja, Thor, and Odin is well constrained (bluedotted line in Fig. 8). However, the AGN component cannot si-multaneously fit both the Spitzer and ALMA photometry with-out exceeding the Herschel photometry. We are therefore forcedto add an additional starburst component to fit the YggdrasilALMA point. However, with only a single point, the starburstluminosity is only loosely constrained.
We clearly see from the SED fitting that Thor is star-formation dominated, with the MIPS 24 µm and 235 GHz repro-duced by the starburst model from DecompIR (Mullaney et al.2011). Yggdrasil represents a composite of emission from anAGN and star formation as reported earlier (Drouart et al. 2014).However, the relative contribution to the IR luminosity from theAGN and the star formation is different; favouring the AGNas the main contributor. In fact, the AGN emits ∼40% of theIR luminosity of the entire system (LIR
total = 1.7 × 10¹³ L�), theremaining ∼60% is star-formation split between i) Yggdrasil andii) Freja, Thor, and Odin at ∼10% and ∼50% levels (Table 5).According to the Kennicutt (1998) relation, Yggdrasil and Freja,Thor and Odin have SFR of ∼200 and ∼1400 M� yr−1, re-spectively. Which, in turn, corresponds to a sSFR of ∼10−9
and 10−8 yr−1.
4. Discussion
The wealth of information provided by the MUSE and ALMAdata, even with rather modest integration times for both sets ofdata, paints a complicated picture from the warm ionised gas tothe cold molecular gas and dust. We now discuss how the mass isdistributed in each component and what the relationship betweenthe components is.
4.1. The nature of the gas and dust
The MRC0943-242 system has a complex distribution of theionised and neutral gas. The high ionisation lines are distributedmainly around the nucleus and are confined within the radiolobes. The exception to this is the extended HeII, CIV, andCIII] emission which is most extended to the west − beyondthe western radio lobe (see panels A−C of Fig. 7). The fact thatmetals are detected within this part of the halo suggests the gasis not pristine, while the high ionisation state of the gas is con-sistent with photoionisation by the AGN, indicating that there isa cone of ionisation along the direction of the radio jet but ex-tending well beyond the radio lobes. The lack of very extendedLyα emission in the outer region of the ionisation cone is mostlikely caused by HI gas distributed over large scales absorbingthe emission (absorption component 2). The inner regions ofthe ionisation cone, i.e. the region that lies within or just be-yond the radio lobes, shows significant Lyα emission (and alsoabsorption from component 2). Resonance scattering shifts thefrequency of the Lyα photons and allow them to “leak” out onboth sides of the absorption feature and broaden the line. In fact,throughout the region of Yggdrasil, we see all absorption com-ponents either in all places (as for components 1, 2, and 3) orin particular regions (as for component 4). Since the absorptionfeatures are only rarely reaching zero intensity in their cores,the neutral gas responsible for absorption systems 1, 3, and 4are mixed with Lyα line emitting regions (although some of it
overlies the Lyα emission). Absorption component 2 must coverthe full Lyα emitting region, including that out to ∼60 kpc, whichis the projected distance to Bifrost. Since this absorption con-tains no flux in the line core (it is dark), the absorber must haveunity covering factor and be optically thick. This being the case,our estimate of the HI column density is a lower limit.
This situation is somewhat akin to the large extended Lyα ab-sorber on the line of sight to the HzRG TN J1338-1942 at z = 4.1(Swinbank et al. 2015). In this case the neutral gas reservoir ex-tends at least 150 kpc away from the core of the HzRG. To de-tect this extended emission, Swinbank et al. (2015) obtained amuch deeper integration and hence significantly more extendedLyα emission and absorption. However, unlike the deepest ab-sorption feature in TN J1338-1942, the offset velocity of the ab-sorption component 2 in MRC0943-242, is rather more modest,only a few 100 km s−1 compared to 1200 km s−1. Deeper data forMRC0934-242 may reveal a greater extent and more complexstructure of the emitting and absorbing gas.
In addition to the ionisation cone and the general distribu-tion of the Lyα emission around the central regions of Yggdrasil(M∗ ' 1.7 × 10¹¹ M�), there is a bridge of material connect-ing the IRAC continuum emission of Thor and beyond (M∗ '1.0 × 10¹¹ M�). Ivison et al. (2008) also found multiple compo-nents for the HzRG 4C60.07 at z = 3.8, likewise connected bya bridge of gas. They interpret this bridge as a plume of colddust and gas in a tidal stream between two interacting galax-ies. The interaction between the two galaxies is believed to bethe trigger of the starburst and through this exhaust the molec-ular gas supply in the AGN host galaxy. One scenario whichcould have triggered the high star formation in Freja, Thor, andOdin and perhaps the AGN activity in Yggdrasil is, like for4C60.07, interaction between two galaxies. In this scenario, thetwo galaxies interact tidally where gas flows between the galax-ies trigger the AGN activity in Yggdrasil, and creates tidal tailsof gas which may emit Lyα. The tidal interactions may thenignite the string of components Freja, Thor, and Odin result-ing in a SFR ∼400 M�/yr. However, the CO(8−7) emission linefrom Yggdrasil is very narrow and dynamically quiescent. Itshows no signs of dynamical motion, implying that this gas isnot related to the tidal interaction. The CO gas appears to bequite highly excited, as may be expected for gas near the cen-tral AGN. However, we note that the ATCA upper limit on theCO(1−0) emission is rather shallow, so we cannot put strongconstraints on the CO gas excitation.
Along the same projected line as the bridge and dust emit-ting regions, we find CO(8−7) emission in Loke which is notdetected in any optical or dust continuum counterpart. The ten-tative detection of CO(1−0) at the position of Loke is consistentwith the presence of a large reservoir of molecular gas. However,it is not clear from the observations at hand how extended thisreservoir is, if it reaches across Freja, Thor, Odin, and Loke,tracing one compact region, or if the reservoir is only at thelocation of Loke. The tentative CO(1−0) detection suggests alower excitation level than Yggdrasil, but more sensitive low-J observations are needed to confirm this. The only thing knownis that this region contains dynamically quiet but likely highlyexcited gas component ∼90 kpc away from the nearest stellaremission and with a relatively low velocity compared to the sys-temic velocity of the AGN. A clue to its nature lies in the align-ment with the AGN and starburst components along the bridge.If this represents an accretion flow of galaxies and material alongthis direction, the gas would experience tidal forces and accre-tion shocks when the galaxies get close (or enter the halo ofYggdrasil). The absorption component 2 reveals the presence of
A124, page 11 of 15
A&A 586, A124 (2016)
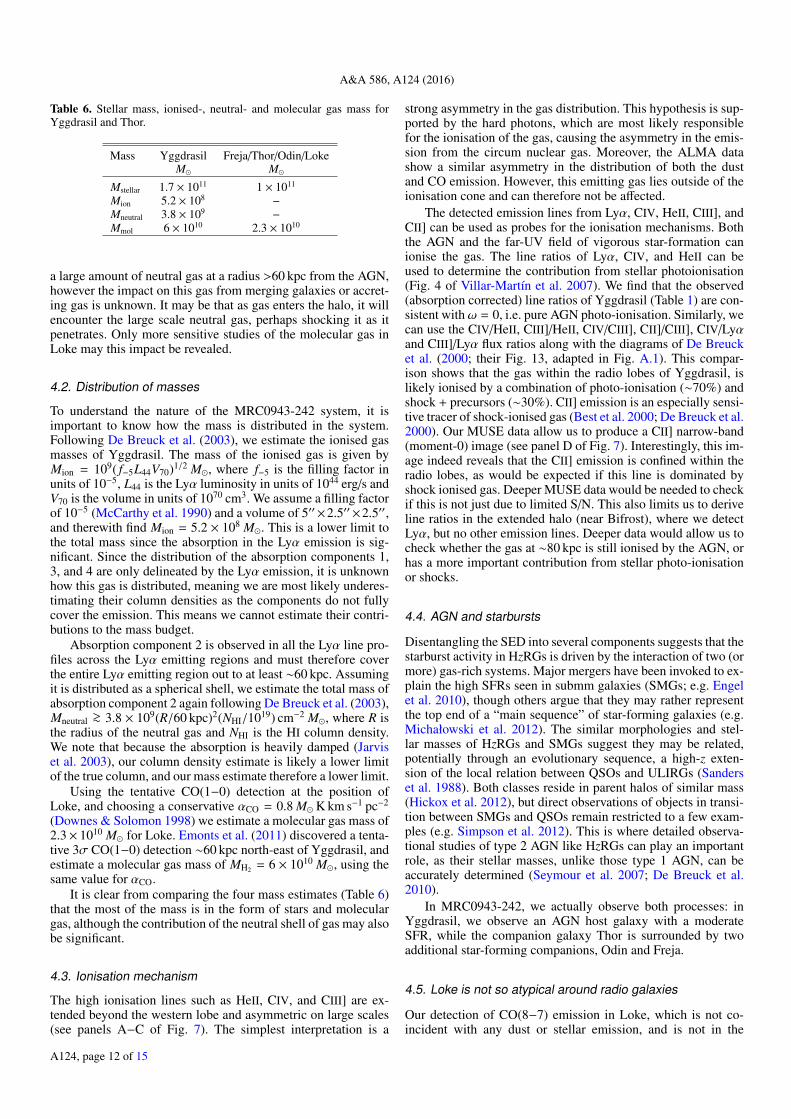
Table 6. Stellar mass, ionised-, neutral- and molecular gas mass forYggdrasil and Thor.
Mass Yggdrasil Freja/Thor/Odin/LokeM� M�
Mstellar 1.7 × 10¹¹ 1 × 10¹¹
Mion 5.2 × 10⁸ −
Mneutral 3.8 × 10⁹ −
Mmol 6 × 10¹⁰ 2.3 × 10¹⁰
a large amount of neutral gas at a radius >60 kpc from the AGN,however the impact on this gas from merging galaxies or accret-ing gas is unknown. It may be that as gas enters the halo, it willencounter the large scale neutral gas, perhaps shocking it as itpenetrates. Only more sensitive studies of the molecular gas inLoke may this impact be revealed.
4.2. Distribution of masses
To understand the nature of the MRC0943-242 system, it isimportant to know how the mass is distributed in the system.Following De Breuck et al. (2003), we estimate the ionised gasmasses of Yggdrasil. The mass of the ionised gas is given byMion = 109( f−5L44V70)1/2 M�, where f−5 is the filling factor inunits of 10−5, L44 is the Lyα luminosity in units of 1044 erg/s andV70 is the volume in units of 1070 cm3. We assume a filling factorof 10−5 (McCarthy et al. 1990) and a volume of 5′′×2.5′′×2.5′′,and therewith find Mion = 5.2 × 10⁸ M�. This is a lower limit tothe total mass since the absorption in the Lyα emission is sig-nificant. Since the distribution of the absorption components 1,3, and 4 are only delineated by the Lyα emission, it is unknownhow this gas is distributed, meaning we are most likely underes-timating their column densities as the components do not fullycover the emission. This means we cannot estimate their contri-butions to the mass budget.
Absorption component 2 is observed in all the Lyα line pro-files across the Lyα emitting regions and must therefore coverthe entire Lyα emitting region out to at least ∼60 kpc. Assumingit is distributed as a spherical shell, we estimate the total mass ofabsorption component 2 again following De Breuck et al. (2003),Mneutral >∼ 3.8 × 10⁹(R/60 kpc)2(NHI/1019) cm−2 M�, where R isthe radius of the neutral gas and NHI is the HI column density.We note that because the absorption is heavily damped (Jarviset al. 2003), our column density estimate is likely a lower limitof the true column, and our mass estimate therefore a lower limit.
Using the tentative CO(1−0) detection at the position ofLoke, and choosing a conservative αCO = 0.8 M� K km s−1 pc−2
(Downes & Solomon 1998) we estimate a molecular gas mass of2.3× 1010 M� for Loke. Emonts et al. (2011) discovered a tenta-tive 3σ CO(1−0) detection ∼60 kpc north-east of Yggdrasil, andestimate a molecular gas mass of MH2 = 6 × 10¹⁰ M�, using thesame value for αCO.
It is clear from comparing the four mass estimates (Table 6)that the most of the mass is in the form of stars and moleculargas, although the contribution of the neutral shell of gas may alsobe significant.
4.3. Ionisation mechanism
The high ionisation lines such as HeII, CIV, and CIII] are ex-tended beyond the western lobe and asymmetric on large scales(see panels A−C of Fig. 7). The simplest interpretation is a
strong asymmetry in the gas distribution. This hypothesis is sup-ported by the hard photons, which are most likely responsiblefor the ionisation of the gas, causing the asymmetry in the emis-sion from the circum nuclear gas. Moreover, the ALMA datashow a similar asymmetry in the distribution of both the dustand CO emission. However, this emitting gas lies outside of theionisation cone and can therefore not be affected.
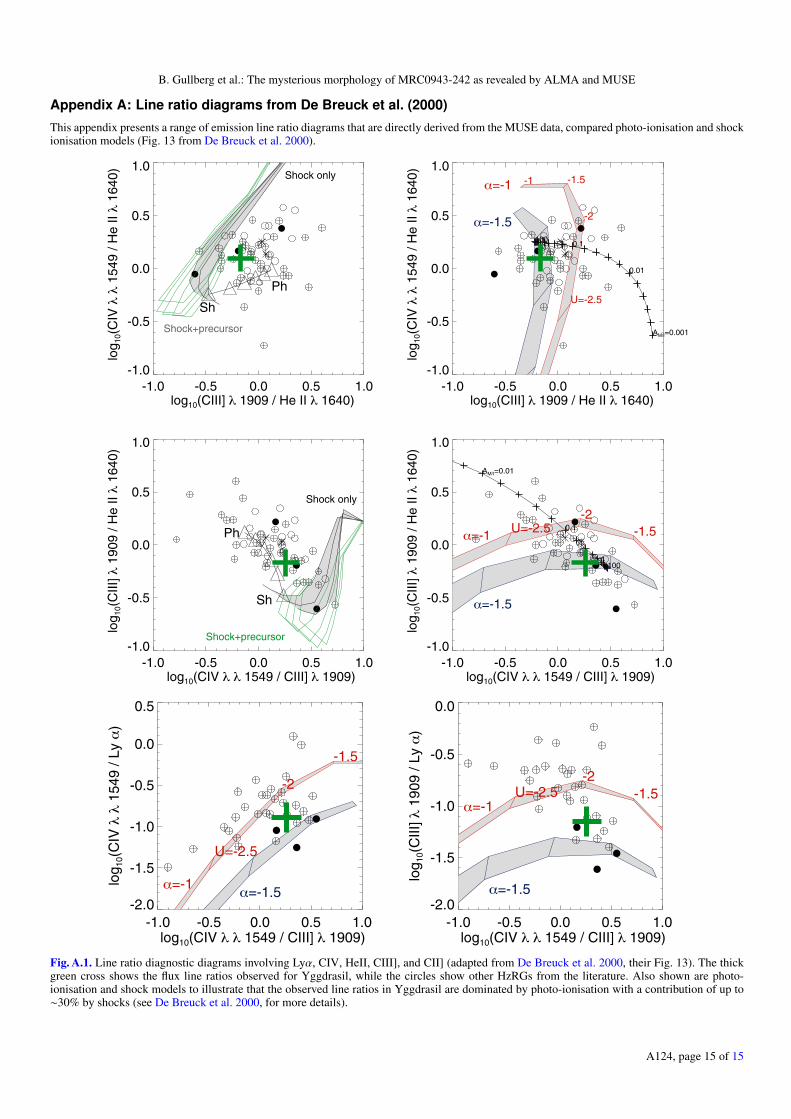
The detected emission lines from Lyα, CIV, HeII, CIII], andCII] can be used as probes for the ionisation mechanisms. Boththe AGN and the far-UV field of vigorous star-formation canionise the gas. The line ratios of Lyα, CIV, and HeII can beused to determine the contribution from stellar photoionisation(Fig. 4 of Villar-Martín et al. 2007). We find that the observed(absorption corrected) line ratios of Yggdrasil (Table 1) are con-sistent withω = 0, i.e. pure AGN photo-ionisation. Similarly, wecan use the CIV/HeII, CIII]/HeII, CIV/CIII], CII]/CIII], CIV/Lyαand CIII]/Lyα flux ratios along with the diagrams of De Breucket al. (2000; their Fig. 13, adapted in Fig. A.1). This compar-ison shows that the gas within the radio lobes of Yggdrasil, islikely ionised by a combination of photo-ionisation (∼70%) andshock + precursors (∼30%). CII] emission is an especially sensi-tive tracer of shock-ionised gas (Best et al. 2000; De Breuck et al.2000). Our MUSE data allow us to produce a CII] narrow-band(moment-0) image (see panel D of Fig. 7). Interestingly, this im-age indeed reveals that the CII] emission is confined within theradio lobes, as would be expected if this line is dominated byshock ionised gas. Deeper MUSE data would be needed to checkif this is not just due to limited S/N. This also limits us to deriveline ratios in the extended halo (near Bifrost), where we detectLyα, but no other emission lines. Deeper data would allow us tocheck whether the gas at ∼80 kpc is still ionised by the AGN, orhas a more important contribution from stellar photo-ionisationor shocks.
4.4. AGN and starbursts
Disentangling the SED into several components suggests that thestarburst activity in HzRGs is driven by the interaction of two (ormore) gas-rich systems. Major mergers have been invoked to ex-plain the high SFRs seen in submm galaxies (SMGs; e.g. Engelet al. 2010), though others argue that they may rather representthe top end of a “main sequence” of star-forming galaxies (e.g.Michałowski et al. 2012). The similar morphologies and stel-lar masses of HzRGs and SMGs suggest they may be related,potentially through an evolutionary sequence, a high-z exten-sion of the local relation between QSOs and ULIRGs (Sanderset al. 1988). Both classes reside in parent halos of similar mass(Hickox et al. 2012), but direct observations of objects in transi-tion between SMGs and QSOs remain restricted to a few exam-ples (e.g. Simpson et al. 2012). This is where detailed observa-tional studies of type 2 AGN like HzRGs can play an importantrole, as their stellar masses, unlike those type 1 AGN, can beaccurately determined (Seymour et al. 2007; De Breuck et al.2010).
In MRC0943-242, we actually observe both processes: inYggdrasil, we observe an AGN host galaxy with a moderateSFR, while the companion galaxy Thor is surrounded by twoadditional star-forming companions, Odin and Freja.
4.5. Loke is not so atypical around radio galaxies
Our detection of CO(8−7) emission in Loke, which is not co-incident with any dust or stellar emission, and is not in the
A124, page 12 of 15
B. Gullberg et al.: The mysterious morphology of MRC0943-242 as revealed by ALMA and MUSE
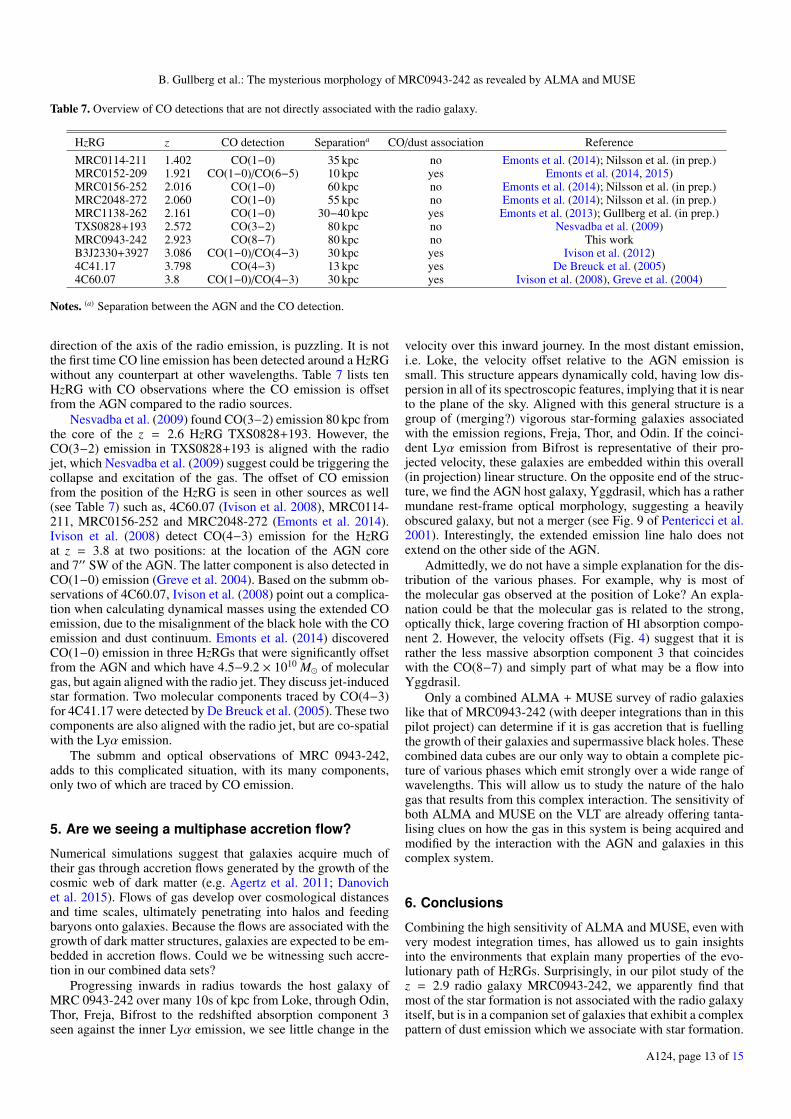
Table 7. Overview of CO detections that are not directly associated with the radio galaxy.
HzRG z CO detection Separationa CO/dust association ReferenceMRC0114-211 1.402 CO(1−0) 35 kpc no Emonts et al. (2014); Nilsson et al. (in prep.)MRC0152-209 1.921 CO(1−0)/CO(6−5) 10 kpc yes Emonts et al. (2014, 2015)MRC0156-252 2.016 CO(1−0) 60 kpc no Emonts et al. (2014); Nilsson et al. (in prep.)MRC2048-272 2.060 CO(1−0) 55 kpc no Emonts et al. (2014); Nilsson et al. (in prep.)MRC1138-262 2.161 CO(1−0) 30−40 kpc yes Emonts et al. (2013); Gullberg et al. (in prep.)TXS0828+193 2.572 CO(3−2) 80 kpc no Nesvadba et al. (2009)MRC0943-242 2.923 CO(8−7) 80 kpc no This workB3J2330+3927 3.086 CO(1−0)/CO(4−3) 30 kpc yes Ivison et al. (2012)4C41.17 3.798 CO(4−3) 13 kpc yes De Breuck et al. (2005)4C60.07 3.8 CO(1−0)/CO(4−3) 30 kpc yes Ivison et al. (2008), Greve et al. (2004)
Notes. (a) Separation between the AGN and the CO detection.
direction of the axis of the radio emission, is puzzling. It is notthe first time CO line emission has been detected around a HzRGwithout any counterpart at other wavelengths. Table 7 lists tenHzRG with CO observations where the CO emission is offsetfrom the AGN compared to the radio sources.
Nesvadba et al. (2009) found CO(3−2) emission 80 kpc fromthe core of the z = 2.6 HzRG TXS0828+193. However, theCO(3−2) emission in TXS0828+193 is aligned with the radiojet, which Nesvadba et al. (2009) suggest could be triggering thecollapse and excitation of the gas. The offset of CO emissionfrom the position of the HzRG is seen in other sources as well(see Table 7) such as, 4C60.07 (Ivison et al. 2008), MRC0114-211, MRC0156-252 and MRC2048-272 (Emonts et al. 2014).Ivison et al. (2008) detect CO(4−3) emission for the HzRGat z = 3.8 at two positions: at the location of the AGN coreand 7′′ SW of the AGN. The latter component is also detected inCO(1−0) emission (Greve et al. 2004). Based on the submm ob-servations of 4C60.07, Ivison et al. (2008) point out a complica-tion when calculating dynamical masses using the extended COemission, due to the misalignment of the black hole with the COemission and dust continuum. Emonts et al. (2014) discoveredCO(1−0) emission in three HzRGs that were significantly offsetfrom the AGN and which have 4.5−9.2 × 10¹⁰ M� of moleculargas, but again aligned with the radio jet. They discuss jet-inducedstar formation. Two molecular components traced by CO(4−3)for 4C41.17 were detected by De Breuck et al. (2005). These twocomponents are also aligned with the radio jet, but are co-spatialwith the Lyα emission.
The submm and optical observations of MRC 0943-242,adds to this complicated situation, with its many components,only two of which are traced by CO emission.
5. Are we seeing a multiphase accretion flow?
Numerical simulations suggest that galaxies acquire much oftheir gas through accretion flows generated by the growth of thecosmic web of dark matter (e.g. Agertz et al. 2011; Danovichet al. 2015). Flows of gas develop over cosmological distancesand time scales, ultimately penetrating into halos and feedingbaryons onto galaxies. Because the flows are associated with thegrowth of dark matter structures, galaxies are expected to be em-bedded in accretion flows. Could we be witnessing such accre-tion in our combined data sets?
Progressing inwards in radius towards the host galaxy ofMRC 0943-242 over many 10s of kpc from Loke, through Odin,Thor, Freja, Bifrost to the redshifted absorption component 3seen against the inner Lyα emission, we see little change in the
velocity over this inward journey. In the most distant emission,i.e. Loke, the velocity offset relative to the AGN emission issmall. This structure appears dynamically cold, having low dis-persion in all of its spectroscopic features, implying that it is nearto the plane of the sky. Aligned with this general structure is agroup of (merging?) vigorous star-forming galaxies associatedwith the emission regions, Freja, Thor, and Odin. If the coinci-dent Lyα emission from Bifrost is representative of their pro-jected velocity, these galaxies are embedded within this overall(in projection) linear structure. On the opposite end of the struc-ture, we find the AGN host galaxy, Yggdrasil, which has a rathermundane rest-frame optical morphology, suggesting a heavilyobscured galaxy, but not a merger (see Fig. 9 of Pentericci et al.2001). Interestingly, the extended emission line halo does notextend on the other side of the AGN.
Admittedly, we do not have a simple explanation for the dis-tribution of the various phases. For example, why is most ofthe molecular gas observed at the position of Loke? An expla-nation could be that the molecular gas is related to the strong,optically thick, large covering fraction of HI absorption compo-nent 2. However, the velocity offsets (Fig. 4) suggest that it israther the less massive absorption component 3 that coincideswith the CO(8−7) and simply part of what may be a flow intoYggdrasil.
Only a combined ALMA + MUSE survey of radio galaxieslike that of MRC0943-242 (with deeper integrations than in thispilot project) can determine if it is gas accretion that is fuellingthe growth of their galaxies and supermassive black holes. Thesecombined data cubes are our only way to obtain a complete pic-ture of various phases which emit strongly over a wide range ofwavelengths. This will allow us to study the nature of the halogas that results from this complex interaction. The sensitivity ofboth ALMA and MUSE on the VLT are already offering tanta-lising clues on how the gas in this system is being acquired andmodified by the interaction with the AGN and galaxies in thiscomplex system.
6. Conclusions
Combining the high sensitivity of ALMA and MUSE, even withvery modest integration times, has allowed us to gain insightsinto the environments that explain many properties of the evo-lutionary path of HzRGs. Surprisingly, in our pilot study of thez = 2.9 radio galaxy MRC0943-242, we apparently find thatmost of the star formation is not associated with the radio galaxyitself, but is in a companion set of galaxies that exhibit a complexpattern of dust emission which we associate with star formation.
A124, page 13 of 15
A&A 586, A124 (2016)
We say apparently because the morphology of the dust emis-sion is peculiarly distributed in three distinct sources but roughlywithin the diffuse stellar continuum emission of the source.
The MUSE data show that the continuum emitting sourceis embedded in a Lyα emitting linear filament stretching frombeyond the AGN to the circum nuclear emission of the AGN.This structure of dust and Lyα emission aligns well in projectionwith a region of CO(8−7) and CO(1−0) emitting gas (at lowersignificance) about 90 kpc in projection from the AGN.
The AGN apparently ionises a large region which is asym-metric, lying mostly on the western side of the source. This islikely due to the gas distribution as it tantalisingly lies in the di-rection where the dust, CO line emission, and the filamentaryLyα emission are found.
The relationship between the Lyα emission and absorptionand the associate CIV absorption paints a fascinating pictureof the distribution of the warm ionised medium. There is acomponent of Lyα absorbing gas which reaches zero intensitythroughout the Lyα emission detected across MRC0943-242 inthe MUSE data. It clearly has a unity covering fraction and ishighly optically thick. Since the gas is seen as an absorption fea-ture throughout the Lyα emitting filament (Bifrost) this thick,unity covering fraction absorber is extended and is visible in ab-sorption out to >60 kpc. Because of its velocity and optical thick-ness, it absorbs all of the extended Lyα emission in the cube.
Acknowledgements. We thank the anonymous referee for her/his very thor-ough reading of our manuscript, and suggestions that substantially improvedour paper. This publication uses data taken from the MUSE commissioning run060.A-9100. All of the MUSE data used in this paper are available throughthe ESO science archive. This paper makes use of the following ALMA data:ADS/JAO.ALMA#2012.1.00039.S. ALMA is a partnership of ESO (represent-ing its member states), NSF (USA) and NINS (Japan), together with NRC(Canada) and NSC and ASIAA (Taiwan), in cooperation with the Republicof Chile. The Joint ALMA Observatory is operated by ESO, AUI/NRAO andNAOJ. The work of D.S. was carried out at Jet Propulsion Laboratory, CaliforniaInstitute of Technology, under a contract with NASA. B.E. acknowledges fund-ing through the European Union FP7 IEF grant nr. 624351. M.D.L. acknowl-edges the support from the ESO visitors program and especially would like tothank Mario van den Ancker for his help and Eric Emsellem for interesting sci-entific discussions. Nick Seymour is the recipient of an ARC Future Fellowship.We thank Kurt Soto for giving us access to the ZAP software which suppressesresiduals of sky subtraction using a principal component analysis.
ReferencesAgertz, O., Teyssier, R., & Moore, B. 2011, MNRAS, 410, 1391Archibald, E. N., Dunlop, J. S., Hughes, D. H., et al. 2001, MNRAS, 323, 417Bacon, R., Accardo, M., Adjali, L., et al. 2010, in SPIE Conf. Ser., 7735, 8Bacon, R., Vernet, J., Borisova, E., et al. 2014, The Messenger, 157, 13Bekki, K. 1998, ApJ, 504, 50Best, P. N., Röttgering, H. J. A., & Longair, M. S. 2000, MNRAS, 311, 23
Binette, L., Kurk, J. D., Villar-Martín, M., & Röttgering, H. J. A. 2000, A&A,356, 23
Carilli, C. L., Röttgering, H. J. A., van Ojik, R., et al. 1997, ApJS, 109, 1Danovich, M., Dekel, A., Hahn, O., Ceverino, D., & Primack, J. 2015, MNRAS,
449, 2087De Breuck, C., Röttgering, H., Miley, G., van Breugel, W., & Best, P. 2000,
A&A, 362, 519De Breuck, C., van Breugel, W., Stanford, S. A., et al. 2002, AJ, 123, 637De Breuck, C., Neri, R., Morganti, R., et al. 2003, A&A, 401, 911De Breuck, C., Downes, D., Neri, R., et al. 2005, A&A, 430, L1De Breuck, C., Seymour, N., Stern, D., et al. 2010, ApJ, 725, 36Downes, D., & Solomon, P. M. 1998, ApJ, 507, 615Drouart, G., De Breuck, C., Vernet, J., et al. 2014, A&A, 566, A53Eales, S., Rawlings, S., Law-Green, D., Cotter, G., & Lacy, M. 1997, MNRAS,
291, 593Emonts, B. H. C., Norris, R. P., Feain, I., et al. 2011, MNRAS, 415, 655Emonts, B. H. C., Feain, I., Röttgering, H. J. A., et al. 2013, MNRAS, 430, 3465Emonts, B. H. C., Norris, R. P., Feain, I., et al. 2014, MNRAS, 438, 2898Emonts, B. H. C., De Breuck, C., Lehnert, M. D., et al. 2015, A&A, 584, A99Engel, H., Tacconi, L. J., Davies, R. I., et al. 2010, ApJ, 724, 233Greve, T. R., Ivison, R. J., & Papadopoulos, P. P. 2004, A&A, 419, 99Hickox, R. C., Wardlow, J. L., Smail, I., et al. 2012, MNRAS, 421, 284Ivison, R. J., Morrison, G. E., Biggs, A. D., et al. 2008, MNRAS, 390, 1117Ivison, R. J., Smail, I., Amblard, A., et al. 2012, MNRAS, 425, 1320Jarvis, M. J., Wilman, R. J., Röttgering, H. J. A., & Binette, L. 2003, MNRAS,
338, 263Kennicutt, Jr., R. C. 1998, ApJ, 498, 541Laurent, G. T., Aguirre, J. E., Glenn, J., et al. 2005, ApJ, 623, 742Lilly, S. J., & Longair, M. S. 1984, MNRAS, 211, 833McCarthy, P. J., Spinrad, H., Dickinson, M., et al. 1990, ApJ, 365, 487Michałowski, M. J., Dunlop, J. S., Cirasuolo, M., et al. 2012, A&A, 541, A85Mullaney, J. R., Alexander, D. M., Goulding, A. D., & Hickox, R. C. 2011,
MNRAS, 414, 1082Nesvadba, N. P. H., Neri, R., De Breuck, C., et al. 2009, MNRAS, 395, L16Ogle, P., Whysong, D., & Antonucci, R. 2006, ApJ, 647, 161Pentericci, L., McCarthy, P. J., Röttgering, H. J. A., et al. 2001, ApJS, 135, 63Reuland, M., van Breugel, W., Röttgering, H., et al. 2003, ApJ, 592, 755Reuland, M., Röttgering, H., van Breugel, W., & De Breuck, C. 2004, MNRAS,
353, 377Röttgering, H. J. A., Hunstead, R. W., Miley, G. K., van Ojik, R., & Wieringa,
M. H. 1995, MNRAS, 277, 389Sanders, D. B., Soifer, B. T., Elias, J. H., et al. 1988, ApJ, 325, 74Seymour, N., Stern, D., De Breuck, C., et al. 2007, ApJS, 171, 353Seymour, N., Altieri, B., De Breuck, C., et al. 2012, ApJ, 755, 146Simpson, C., Rawlings, S., Ivison, R., et al. 2012, MNRAS, 421, 3060Swinbank, A. M., Vernet, J. D. R., Smail, I., et al. 2015, MNRAS, 449, 1298Tremaine, S., Gebhardt, K., Bender, R., et al. 2002, ApJ, 574, 740van Breugel, W. J. M., Stanford, S. A., Spinrad, H., Stern, D., & Graham, J. R.
1998, ApJ, 502, 614van Ojik, R., Roettgering, H. J. A., Carilli, C. L., et al. 1996, A&A, 313, 25Venemans, B. P., Röttgering, H. J. A., Miley, G. K., et al. 2007, A&A, 461, 823Vernet, J., Fosbury, R. A. E., Villar-Martín, M., et al. 2001, A&A, 366, 7Villar-Martín, M., Vernet, J., di Serego Alighieri, S., et al. 2003, New Astron.
Rev., 47, 291Villar-Martín, M., Humphrey, A., De Breuck, C., et al. 2007, MNRAS, 375, 1299Weilbacher, P. M., Streicher, O., Urrutia, T., et al. 2012, in SPIE Conf. Ser., 8451,
84510BWeiß, A., Downes, D., Neri, R., et al. 2007, A&A, 467, 955Wylezalek, D., Galametz, A., Stern, D., et al. 2013, ApJ, 769, 79
A124, page 14 of 15
B. Gullberg et al.: The mysterious morphology of MRC0943-242 as revealed by ALMA and MUSE
Appendix A: Line ratio diagrams from De Breuck et al. (2000)
This appendix presents a range of emission line ratio diagrams that are directly derived from the MUSE data, compared photo-ionisation and shockionisation models (Fig. 13 from De Breuck et al. 2000).
-1.0 -0.5 0.0 0.5 1.0log10(CIII] 1909 / He II 1640)
-1.0
-0.5
0.0
0.5
1.0
log 1
0(C
IV
1
549
/ He
II 1
640) Shock only
Shock+precursor
Ph
Sh
-1.0 -0.5 0.0 0.5 1.0log10(CIII] 1909 / He II 1640)
-1.0
-0.5
0.0
0.5
1.0
log 1
0(C
IV
1
549
/ He
II 1
640)
AM/I=0.001
0.01
0.11100
=-1.5
=-1
U=-2.5
-2
-1.5-1
-1.0 -0.5 0.0 0.5 1.0log10(CIV 1549 / CIII] 1909)
-1.0
-0.5
0.0
0.5
1.0
log 1
0(C
III]
190
9 / H
e II
164
0)
Shock only
Shock+precursor
Ph
Sh
-1.0 -0.5 0.0 0.5 1.0log10(CIV 1549 / CIII] 1909)
-1.0
-0.5
0.0
0.5
1.0
log 1
0(C
III]
190
9 / H
e II
164
0)
AM/I=0.01
0.1
1100
=-1.5
=-1 U=-2.5-2
-1.5
-1.0 -0.5 0.0 0.5 1.0log10(CIV 1549 / CIII] 1909)
-2.0
-1.5
-1.0
-0.5
0.0
0.5
log 1
0(C
IV
1
549
/ Ly
)
=-1.5=-1
U=-2.5
-2
-1.5
-1.0 -0.5 0.0 0.5 1.0log10(CIV 1549 / CIII] 1909)
-2.0
-1.5
-1.0
-0.5
0.0
log 1
0(C
III]
190
9 / L
y )
=-1.5
=-1U=-2.5
-2-1.5
Fig. A.1. Line ratio diagnostic diagrams involving Lyα, CIV, HeII, CIII], and CII] (adapted from De Breuck et al. 2000, their Fig. 13). The thickgreen cross shows the flux line ratios observed for Yggdrasil, while the circles show other HzRGs from the literature. Also shown are photo-ionisation and shock models to illustrate that the observed line ratios in Yggdrasil are dominated by photo-ionisation with a contribution of up to∼30% by shocks (see De Breuck et al. 2000, for more details).
A124, page 15 of 15


![Volume 5, No. 2 Nopember 2019 [242] Jurnal Al-Lubab ISSN](https://static.fdokumen.com/doc/165x107/63273c31cedd78c2b50d7953/volume-5-no-2-nopember-2019-242-jurnal-al-lubab-issn.jpg)