The Moderating Role of Shopping Frequency on the ...
16
INTERNATIONAL JOURNAL OF BUSINESS, 26(2), 2021 ISSN: 1083-4346 The Moderating Role of Shopping Frequency on the Relationship Between Store Image and Satisfaction: Evidence from Cyprus Ahmet Maslakçı a,* , Figen Yeşilada b , Tahir Yeşilada c a Cyprus Science University, Mersin,Turkey [email protected] b European University of Lefke,Mersin,Turkey [email protected] c European University of Lefke, Mersin,Turkey [email protected] ABSTRACT In the fast-moving retail industry, consumer needs guide purchasing decisions. While several studies have explored the basic characteristics of consumers’ store choice strategies, the industry would benefit from further analysis. This study examines Cyprus consumers’ supermarket shopping behaviour, identifies store image expectations, evaluates expectation differences across consumer profiles, and explores the effect of shopping frequency on the relationship between store image and satisfaction. We surveyed 692 consumers from eight cities in Cyprus, which has a unique social, cultural, and political environment. Four store image criteria were identified: services, atmosphere, prices, and location and convenience. The findings suggest that store image expectations differ significantly by gender, ethnicity, and shopping frequency and that shopping frequency moderates the relationship between services and satisfaction as well as between atmosphere and satisfaction. By elucidating the store choice factors important to consumers, these findings provide valuable information to managers of operating supermarkets and potential competitors. JEL Classifications: M0, M1, M2, M3 Keywords: Cyprus, retailing, shopping frequency, store choice, store image, supermarket * Corresponding Author
-
Upload
khangminh22 -
Category
Documents
-
view
1 -
download
0
Transcript of The Moderating Role of Shopping Frequency on the ...

INTERNATIONAL JOURNAL OF BUSINESS, 26(2), 2021 ISSN: 1083-4346
The Moderating Role of Shopping Frequency on
the Relationship Between Store Image and
Satisfaction: Evidence from Cyprus
Ahmet Maslakçıa,*, Figen Yeşiladab, Tahir Yeşiladac a Cyprus Science University, Mersin,Turkey
[email protected] bEuropean University of Lefke,Mersin,Turkey
[email protected] cEuropean University of Lefke, Mersin,Turkey
ABSTRACT
In the fast-moving retail industry, consumer needs guide purchasing decisions. While
several studies have explored the basic characteristics of consumers’ store choice
strategies, the industry would benefit from further analysis. This study examines
Cyprus consumers’ supermarket shopping behaviour, identifies store image
expectations, evaluates expectation differences across consumer profiles, and
explores the effect of shopping frequency on the relationship between store image
and satisfaction. We surveyed 692 consumers from eight cities in Cyprus, which has
a unique social, cultural, and political environment. Four store image criteria were
identified: services, atmosphere, prices, and location and convenience. The findings
suggest that store image expectations differ significantly by gender, ethnicity, and
shopping frequency and that shopping frequency moderates the relationship between
services and satisfaction as well as between atmosphere and satisfaction. By
elucidating the store choice factors important to consumers, these findings provide
valuable information to managers of operating supermarkets and potential
competitors.
JEL Classifications: M0, M1, M2, M3
Keywords: Cyprus, retailing, shopping frequency, store choice, store image,
supermarket
* Corresponding Author

2 Maslakçı, Yeşilada, Yeşilada
I. INTRODUCTION
Consumers’ perceptions of store image affect their retail store patronage behaviour
(Hutcheson and Moutinho, 1998; Thang and Tan, 2003). Previous research has
shown that store image attributes differ across retail sectors (Birtwistle et al., 1999;
Gosh, 1994), with each retail store additionally having a distinct perception of
consumers based on salient elements of the retail mix (Bloemer and de Ruyter, 1998).
Zeithaml (1988) has identified product, service quality, and store image attributes
that influence store choice behaviours. Studies on retailing have revealed that service
quality and internal and external store appearance have become prominent in
influencing consumer choices and in differentiating one retailer from another (Chang
and Wildt,1994). In this fiercely competitive environment, retailers must understand
the roles of store attributes to better satisfy customers, thereby improving sales
performance and increasing customer retention and loyalty (Theodoridis and
Chatzipanagiotou, 2009).
Despite vast research on store image, few studies have been conducted in
Mediterranean countries, where the markets may not reflect findings in other regions.
Cyprus is a small island in the heart of the Mediterranean Sea where Turkish Cypriot
and Greek Cypriot communities constitute the majority of the population, living side
by side and sharing many aspects of the unique Cypriot cultural, demographic, and
political environment. There are 339,275 people living in the north and 848,300
people living in the south of the island. Retailing and wholesaling constitute 14.1%
of the GDP in the south of the island. In terms of supermarket retailing in the south,
the grocery sector has been growing rapidly for the past 15 years, following
international trends. As of 2014, there were 132 hypermarkets/supermarkets, and
local retail chains and global retailers made up 55% of the total sales in the retail
grocery sector (Olympios, 2015). Due to the lack of data about the grocery retail
sector in the north, interviews were conducted with managers of the leading
supermarket retailers and their key suppliers. These interviews revealed that retailing
and wholesaling constitute 14% of the GDP in the northern part of the island, and the
retailing sector has been growing by approximately 23% annually for the past two
years. Out of 1,300 grocery retailers, only 50 may be classified as supermarkets
according to the American Marketing Association’s (2017) definition; furthermore,
these are only local supermarkets and a few local chains. While talks for the
unification of the island have yet to come to a conclusion, Turkish and Greek
Cypriots have been able to travel freely and purchase products and services in both
regions since 2003, expanding cross-regional spending over the years. Credit card
usage statistics show that in the first half of 2019, Turkish Cypriots spent €18.8
million, with the highest share of transactions being in supermarkets in the south.
Greek Cypriots, however, spent €5.7 million in the north, primarily on credit card
transactions, hotels, casinos, fuel, and fruit and vegetables (Yeni Düzen ,2020; LGC
News, 2018). Hence, as competition intensifies, both current and potential
supermarket retailers must have a thorough knowledge of consumers’ store choice
behaviour and be aware of how consumer expectations may differ across
demographic profiles in Cyprus.
II. LITERATURE REVIEW
Consumers’ perceptions of store image affect their retail store patronage behaviour
(Hutcheson and Moutinho, 1998; Thang and Tan, 2003). Previous research has
shown that store image attributes differ across retail sectors (Birtwistle et al., 1999),
INTERNATIONAL JOURNAL OF BUSINESS, 26(2), 2021 3
with each retail store additionally having a distinct image in the minds of consumers
based on salient elements of the retail mix (Bloemer and de Ruyter, 1998). Zeithaml
(1988) has identified that product, service quality, and store image attributes
influence store choice behaviours. Studies on retailing have revealed that service
quality and internal and external store appearance have become prominent in
influencing consumer choices and in differentiating one retailer from another (Chang
& Wildt, 1994). In this fiercely competitive environment, retailers must understand
the roles of store attributes to better satisfy customers, thereby improving sales
performance and increasing customer retention and loyalty (Theodoridis &
Chatzipanagiotou, 2009).
When making store preference decisions, consumers go through a cognitive
process wherein they evaluate store alternatives against a set of personally important
criteria, similar to the process they undertake while making purchasing decisions.
Indeed, these criteria are the expectations stores must meet to satisfy consumers’
needs. When evaluating alternative stores, consumers try to identify the stores that
will fulfil their expectations. Thus, their evaluation is subjective (Home, 2002).
Studies on store preference criteria have identified store image as an important
determinant of consumer preference (Erdem et al., 1999). Martineau (1958) defined
store image as ‘the store personality or image, the way in which the store is defined
in the shopper’s mind, partly by its functional qualities and partly by an aura of
psychological attributes’ (p. 47).
Research regarding the identification and measurement of the components
of store image has focused on different retail store categories. An extensive amount
of research, conducted in various countries, has focused specifically on supermarket
preference. Skinner (1969) identified pleasant shopping experience, prices, social
influences, nearness to other services, availability of meat products, advertising,
convenience, and location as the basic consumer motives concerning supermarket
selection in the United States. Thirty-seven years later, Carpenter and Moore (2006)
found that cleanliness, product selection, price competitiveness, crowding, courtesy
of personnel, and ease of access are the most important store attributes for U.S.
supermarket customers. Merchandise quality and prices (Severin et al., 2001) and
product quality, the convenience of the location, and value for money (Collins-Dodd
and Lindley, 2003) were identified as the key drivers of supermarket preference for
Canadian consumers. Hutcheson and Moutinho (1998) determined the quality of
product and staff, additional services, availability of parking and petrol, ease/speed
of use, and value for money to be the underlying constructs of Welsh consumers’
supermarket preferences. Four studies conducted in similar years in northern
European countries were identified. Home (2002), found fresh fruit and vegetables,
a versatile range of goods, fair pricing of goods, friendly salespeople, reliable
shopkeepers, the ability to find goods easily, clearly marked prices, and cleanliness
and neatness of the store as the most important preference criteria of Finnish
consumers, while Landsverk et al. (2003), in their research in Norway, identified
price as the most important supermarket preference criterion. Semeijn et al. (2004)
concluded that layout, merchandise, and service are the main components of store
image for Dutch consumers. In Denmark, Hansen and Solgaard (2004) identified
product variety as the most important common factor influencing store preference
across discount stores, hypermarkets, and traditional supermarkets.
Research in neighbouring Mediterranean countries reveals similar results.
Baltas and Papastathopoulou (2003) identified merchandise quality, merchandise
variety, and store locations as the most important store preference criteria for Greek
consumers. Six years later Theodoridis and Chatzipanagiotou (2009) found products,

4 Maslakçı, Yeşilada, Yeşilada
pricing, atmosphere, personnel, merchandising, and in-store convenience constitute
the main supermarket store image attributes for Greek consumers. In two studies
conducted in Turkey, Tabak et al. (2005) identified product variety, accessibility,
product quality, and general price level as the most influential image criteria, while
Külter and Polat (2007) suggested that store atmosphere, product quality and variety,
service amenities, and price elements are the most important criteria for Turkish
consumers. In two studies carried out in the northern part of Cyprus, Guneren (2012)
found services, product variety, convenience, and price/value were the most
important store preference criteria, and Dagli (2014) identified added benefits, non-
price essentials, pricing, and personnel as the most important.
Previous studies have also focused on the role of demographic variables in
consumers’ store image expectations. The common finding is that store image
expectations differ significantly by gender (e.g., Carpenter and Moore, 2006;
Theodoridis and Chatzipanagiotou, 2009) and age (e.g., Külter and Polat, 2007;
Hawes and Lumpkin, 1984) but not by other consumer characteristics like education,
occupation, income, and household size. Satisfaction has also attracted considerable
attention from researchers. Previous studies have shown that consumers’ perceptions
of retail store attributes influence satisfaction (Bloemer and de Ruyter, 1998; Chang
et al., 2015; Kim and Jin, 2001), and satisfied customers are more inclined to
repurchase and become loyal (Thang & Tan, 2003). Bloomer and de Ruyter (1997)
suggested that store loyalty is built through store satisfaction, which is built on store
image.
III. RESEARCH METHODOLOGY
A. Aim and originality
Previous research conducted on Cyprus consumers has concentrated on either the
north or the south of the island, ignoring the free movement of people from one side
to the other and the possibility of unification, which is a scenario businesses and
investors must consider. Thus, the focus herein is first to identify the store image
factors important to consumers in Cyprus, and then to provide insight into how
shopping frequency moderates the relationship between store image factors and
satisfaction. Our first hypothesis is:
H1: Store image expectations differ significantly by consumer profile.
Previous studies have focused on store image perception, shopper
satisfaction, and shopper loyalty, but none have analysed the moderating role of
shopping frequency. Thus, our second hypothesis is:
H2: Shopping frequency moderates the relationship between each of the store image
attributes and shopper satisfaction.
The authors know of no other study in the field of marketing that has been
conducted across both the northern and southern areas of Cyprus concurrently.
Furthermore, the present study uniquely analyses the moderating role of shopping

INTERNATIONAL JOURNAL OF BUSINESS, 26(2), 2021 5
frequency on the relationship between perceived store image attributes and
satisfaction.
B. Methods
Data were collected from a total of 692 conveniently selected consumers who
reported having an active role in supermarket shopping for the household.
Comprising this sample, 390 consumers live in four main cities in northern Cyprus
(Nicosia, Famagusta, Kyrenia, and Morphou) and 302 live in four main cities in
southern Cyprus (Nicosia, Larnaca, Limassol, and Paphos). The field study was
conducted by leading professional research companies in both regions.
C. Data-collection tools
The consumers were surveyed using a five-part questionnaire. The first part consisted
of 29 store image attributes, derived from the relevant literature, to identify
respondents’ expectations from an ideal supermarket. The respondents were asked to
assess each attribute using a five-point Likert-type scale from 1 (not important at all)
to 5 (very important). In the second part, respondents were asked to evaluate the
supermarket they visited regularly according to the same 29 store image attributes
using a five-point Likert-type scale from 1 (very dissatisfied) to 5 (very satisfied), to
identify their perceptions. The third part consisted of four questions about the
respondents’ supermarket shopping behaviours, including shopping frequency, and
one question about their overall satisfaction with the supermarket that they usually
visit. In the fourth part, respondents were asked whether they would switch to another
supermarket if they faced an unfavourable change and to identify five such change
criteria. Satisfaction was defined and measured as overall satisfaction rather than as
a transaction-specific post-purchase evaluation. In the last part of the questionnaire,
respondents identified themselves according to 11 demographic variables, including
ethnicity.
The questionnaire was developed in English. Translations to Turkish and
Greek and back to English were undertaken by Turkish Cypriot and Greek Cypriot
professional translators. Before finalising the questionnaire, to ensure face validity,
feedback was received from experts, including managers and suppliers of
supermarkets and academics. The experts reviewed the draft questionnaire and made
comments on the language, general structure, content, flow, duration, explicitness,
and sufficiency of the measurement tools. In line with the feedback received, some
statements were rephrased and some attributes were removed to eliminate
redundancy.
IV. RESULTS
The final sample had the following structure: gender (female: 61.8%, male: 38.2%),
age group (≤25 years: 18%, 26–35 years: 18%, 36–45 years: 19%, 46–55 years: 20%,
56–65 years: 23%, over 65 years: 2%), education (primary: 14%, high school: 36%,
undergraduate: 42%, graduate: 8.1%), residence (North Nicosia: 22%, Famagusta:
17%, Kyrenia: 11%, Morphou: 7%, South Nicosia: 17%, Larnaca: 7%, Limassol:
12%, Paphos: 4%), and ethnicity (Turkish Cypriot: 32%, Greek Cypriot: 40%,
Turkish: 19%, Greek: 2%, British: 3%, Other: 4%).

6 Maslakçı, Yeşilada, Yeşilada
Of the respondents, 22.4% visited supermarkets every day, 28% visited four
to five times per week, 27% visited two to three times per week, and 16% visited
once or twice per month. Regarding preferred supermarkets, 91% of the respondents
visited one supermarket regularly. 58.3% shopped regularly from a local chain,
29.6% shopped regularly from a local market, and 12.1% shopped regularly from a
global chain. More than 78% of the respondents shopped alone, 76% preferred to
shop on weekdays, and 91.3% were satisfied with the supermarket they visited
regularly. Cleanliness of the store; competitive prices; and the availability of fresh
food such as fruit, vegetables, and dairy products were identified as the top three
store attributes critical for respondents, any unfavourable change which would result
in switching to a competitor. Less than 1% of the respondents rated criteria about
store atmosphere as critical to their satisfaction. Table 1 summarises the consumers’
shopping behaviour.
Table 1
Shopping behaviour of the respondents
Supermarket Type Regularly Visited Shopping Time
Local Chain
Local Market
Global Chain
58.3%
29.6%
12.1%
Weekdays
Weekends
76.0%
24.0%
Satisfaction with the Supermarket
Regularly Visited Shopping Partner
Satisfied
Not satisfied
91.3%
8.7%
Alone
With spouse
With spouse and kids
With parents
With friends
78.9%
14.7%
2.5%
3.3%
0.6%
Shopping Frequency Switching Reason
Everyday
4-5 times/week
2-3 times/week
Once/week
1-2 times/month
22.4%
28.1%
27.2%
15.5%
6.8%
Cleanliness
Competitive prices
Availability of fresh food
Product variety
Product quality
Discounts and sales promotions
Price/quality balance
13.0%
12.1%
11.8%
8.4%
8.4%
7.8%
7.6%
To identify store image factors affecting consumers’ supermarket
preference, exploratory factor analysis was conducted with maximum likelihood
extraction using the direct oblimin rotation method. Direct oblimin rotation is
appropriate when it is reasonable to correlate among constructs, as is common in
social sciences (Hair et al., 2016). Items with eigenvalues of one or greater were
extracted, and factor loadings lower than 0.40 and those with cross-loading were
excluded from further analysis. Four factors explaining 57.22% of the total variance
were extracted, and the Cronbach’s alpha coefficients ranged from 0.60 to 0.84, as
shown in Table 2.
Table 2
Factors and reliability of store attributes
Factor labels and statements Factor loading
Services
Cleanliness and tidiness of shelves 0.800
Cleanliness of staff 0.788

INTERNATIONAL JOURNAL OF BUSINESS, 26(2), 2021 7
Kindness of staff 0.751
Obligingness and enthusiasm of staff 0.714
Existence of price tags on products/shelves 0.604
Freshness of food products (vegetables, fruits, and
dairy) 0.597
Scent in the market 0.592
Store atmosphere
Colours used inside the market 0.770
Music in the market 0.659
Spacious corridors 0.590
Illumination of the market 0.584
Spacious interior design 0.505
Price
Discounts and special offers 0.846
Low prices compared to major competitors 0.833
Location and convenience
Car parking 0.761
Located close to home/work 0.694
Layout of the market 0.585
Cronbach’s alpha (α) 0.84 0.72 0.68 0.60
Variance explained (%) 31.1 10.9 7.7 7.5
Total variance explained (%) 57.22
The first factor accounting for the largest variance in store image attributes
(31.1%) was ‘services’, consisting of factors concerning the cleanliness and tidiness
of shelves, cleanliness and kindness of staff, and availability of fresh food. The scent
in the market was perceived to be a signal of cleanliness and freshness. The second
factor was ‘store atmosphere’, characterised by colours, music, illumination,
spaciousness, and interior design. The third factor was ‘price’, made up of factors
concerning discounts, low/competitive prices, and promotions. The fourth factor,
‘location and convenience’, comprised the availability of car parking, the location,
and the layout.
The compliance indices obtained from the results of the confirmatory factor
analysis reveal that a four-factor solution is an acceptable model of supermarket
selection factors when compared with the expected critical values of the related
indices, meaning that each factor correctly represents the items of which it is
comprised. Table 3 shows these goodness-of-fit indices.
Table 3
Goodness-of-fit indices
Compliance measures Model
χ2/sd 2.890
Goodness-of-fit index 0.948
Adjusted goodness-of-fit index 0.928
Normed fit index 0.910
Relative fit index 0.889
Incremental fit index 0.939
Tucker–Lewis index 0.925
Comparative fit index 0.938
Root mean of square error average 0.052
8 Maslakçı, Yeşilada, Yeşilada
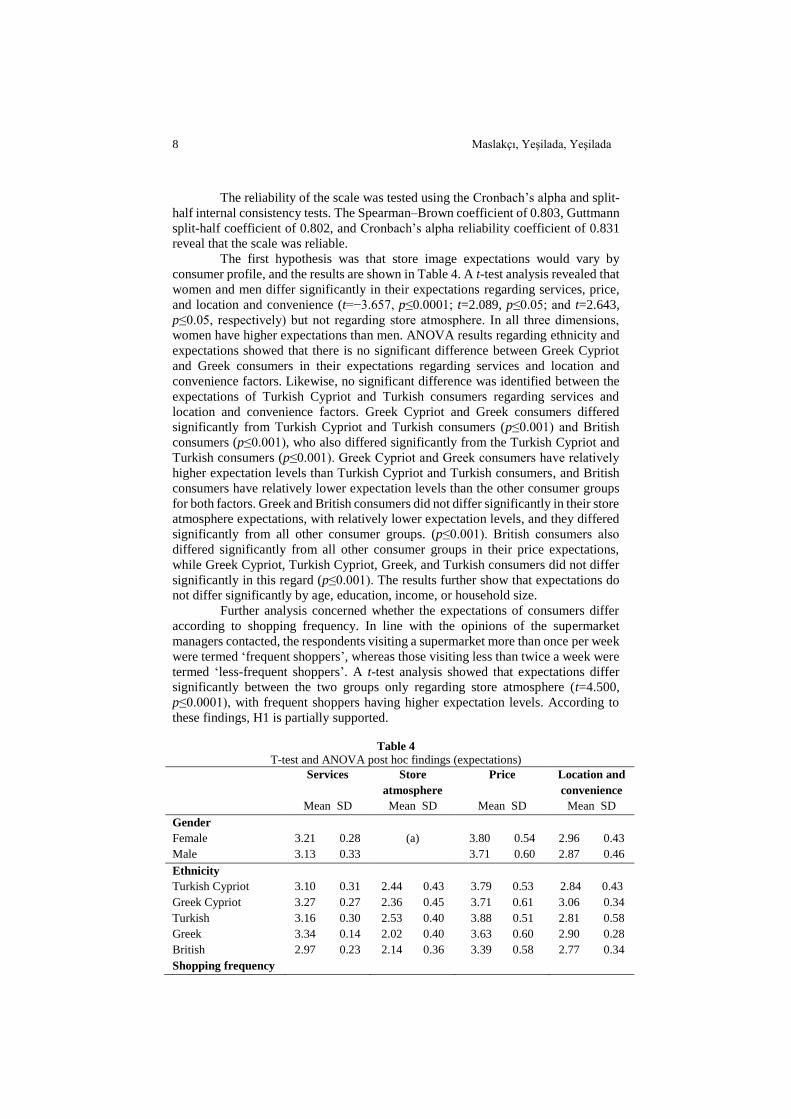
The reliability of the scale was tested using the Cronbach’s alpha and split-
half internal consistency tests. The Spearman–Brown coefficient of 0.803, Guttmann
split-half coefficient of 0.802, and Cronbach’s alpha reliability coefficient of 0.831
reveal that the scale was reliable.
The first hypothesis was that store image expectations would vary by
consumer profile, and the results are shown in Table 4. A t-test analysis revealed that
women and men differ significantly in their expectations regarding services, price,
and location and convenience (t=−3.657, p≤0.0001; t=2.089, p≤0.05; and t=2.643,
p≤0.05, respectively) but not regarding store atmosphere. In all three dimensions,
women have higher expectations than men. ANOVA results regarding ethnicity and
expectations showed that there is no significant difference between Greek Cypriot
and Greek consumers in their expectations regarding services and location and
convenience factors. Likewise, no significant difference was identified between the
expectations of Turkish Cypriot and Turkish consumers regarding services and
location and convenience factors. Greek Cypriot and Greek consumers differed
significantly from Turkish Cypriot and Turkish consumers (p≤0.001) and British
consumers (p≤0.001), who also differed significantly from the Turkish Cypriot and
Turkish consumers (p≤0.001). Greek Cypriot and Greek consumers have relatively
higher expectation levels than Turkish Cypriot and Turkish consumers, and British
consumers have relatively lower expectation levels than the other consumer groups
for both factors. Greek and British consumers did not differ significantly in their store
atmosphere expectations, with relatively lower expectation levels, and they differed
significantly from all other consumer groups. (p≤0.001). British consumers also
differed significantly from all other consumer groups in their price expectations,
while Greek Cypriot, Turkish Cypriot, Greek, and Turkish consumers did not differ
significantly in this regard (p≤0.001). The results further show that expectations do
not differ significantly by age, education, income, or household size.
Further analysis concerned whether the expectations of consumers differ
according to shopping frequency. In line with the opinions of the supermarket
managers contacted, the respondents visiting a supermarket more than once per week
were termed ‘frequent shoppers’, whereas those visiting less than twice a week were
termed ‘less-frequent shoppers’. A t-test analysis showed that expectations differ
significantly between the two groups only regarding store atmosphere (t=4.500,
p≤0.0001), with frequent shoppers having higher expectation levels. According to
these findings, H1 is partially supported.
Table 4
T-test and ANOVA post hoc findings (expectations)
Services
Mean SD
Store
atmosphere
Mean SD
Price
Mean SD
Location and
convenience
Mean SD
Gender
Female
Male
3.21 0.28
3.13 0.33
(a)
3.80 0.54
3.71 0.60
2.96 0.43
2.87 0.46
Ethnicity
Turkish Cypriot
Greek Cypriot
Turkish
Greek
British
3.10 0.31
3.27 0.27
3.16 0.30
3.34 0.14
2.97 0.23
2.44 0.43
2.36 0.45
2.53 0.40
2.02 0.40
2.14 0.36
3.79 0.53
3.71 0.61
3.88 0.51
3.63 0.60
3.39 0.58
2.84 0.43
3.06 0.34
2.81 0.58
2.90 0.28
2.77 0.34
Shopping frequency

INTERNATIONAL JOURNAL OF BUSINESS, 26(2), 2021 9
Frequent shoppers
Less-frequent
shoppers
(a) 2.45 0.42
2.27 0.49
(a) (a)
Note: (a) denotes no significant difference (p≥0.05). SD is the standard deviation.
To test the second hypothesis, hierarchical regression analysis was used to
examine the moderating role of shopping frequency in the relationship between store
image perceptions and satisfaction. Non-categorical variables were standardised
before entering the regression model. Demographic variables which were found to
have significant importance on perceptions entered the analysis in the first step. The
interaction terms obtained by multiplying services by shopping frequency and store
atmosphere by shopping frequency contribute significantly to the related model and
suggest that shopping frequency significantly moderates the relationship between
services perception and satisfaction, shown in Table 5, and store atmosphere
perception and satisfaction, shown in Table 6.
Table 5
Hierarchical regression analysis: The moderating role
of shopping frequency on the relationship between services perception and satisfaction
Step Variable
Model 1
β
Model 2
β
Model 3
β
1 Gender
Age
Education
Ethnicity
0.027
0.097*
0.089*
-0.046
0.003
0.049
0.087*
0.044
-0.002
0.054
0.090*
0.029
2 Shopping frequency
Services
-0.003
0.343*
0.014
0.368*
3 Services × Shopping frequency -0.103*
Model F 3.917* 15.567* 14.458*
Total R2 0.024 0.128 0.137
∆ R2 0.024 0.104 0.009
Note: * p≤0.01
Table 6
Hierarchical regression analysis: The moderating role of shopping
frequency on the relationship between store atmosphere perception and satisfaction
Step Variable
Model 1
β
Model 2
β
Model 3
β
1 Gender
Age
Education
Ethnicity
0.027
0.097*
0.089*
-0.046
0.003
0.070
0.091*
0.014
-0.004
0.071
0.090*
0.002
2 Shopping frequency
Store atmosphere
-0.046
0.242*
-0.053
0.249*
3 Store atmosphere × Shopping frequency -0.095*
Model F 3.917* 9.287* 8.894*
Total R2 0.024 0.080 0.089
∆ R2 0.024 0.057 0.009
Note: * p≤0.01

10 Maslakçı, Yeşilada, Yeşilada
Figure 1 illustrates the moderating effect of shopping frequency on the
relationship between services perception and satisfaction. At lower levels of services
perception, frequent shoppers have higher satisfaction levels than less-frequent
shoppers. However, at higher levels of service perception, the satisfaction of less-
frequent shoppers is higher than frequent shoppers, showing that improvement in the
perception of services leads to a higher effect on the satisfaction of less-frequent
shoppers.
Figure 1
The relationship between services perception and satisfaction for low and high levels of
shopping frequency
The moderating effect of shopping frequency on the relationship between
store atmosphere perception and satisfaction is illustrated in Figure 2. At lower levels
of store atmosphere perception, satisfaction of frequent shoppers is slightly higher
than less-frequent shoppers. At higher levels of store atmosphere perception, less-
frequent shoppers have higher satisfaction than frequent shoppers. Thus, improving
store atmosphere boosts the satisfaction of less-frequent shoppers, while it has a
lower positive effect on the satisfaction of frequent shoppers.
Figure 2
The relationship between store atmosphere perception and satisfaction for low and
high levels of shopping frequency
1
1.5
2
2.5
3
3.5
4
4.5
5
Low Services Perception High Services Perception
Sati
sfact
ion
Low Shopping Frequency
High Shopping
Frequency
1
1.5
2
2.5
3
3.5
4
4.5
5
Low Services Perception High Services Perception
Sati
sfact
ion
Low Shopping Frequency
High Shopping
Frequency

INTERNATIONAL JOURNAL OF BUSINESS, 26(2), 2021 11
The hierarchical regression analysis results show that shopping frequency
does not moderate the relationship between the other two image factors and
satisfaction (p≥0.05), lending partial support to H2.
V. DISCUSSION AND CONCLUSIONS
Despite significant academic and commercial research, many uncertainties remain
about how consumer behaviour affects store preference (Knee, 2002) and consumer
expectations tend to differ from one market to another. This study makes a necessary
contribution to the limited research carried out in Cyprus regarding supermarket
selection. The results of this study can guide businesses in both northern and southern
Cyprus in developing retail strategies.
The study has investigated factors affecting supermarket choice criteria of
Cyprus consumers and has presented an analysis of whether these expectations differ
according to the consumer profile. Four attributes have been identified, namely,
services, store atmosphere, price, and convenience and location.
Services concern the presence of clean, kind, and enthusiastic staff and the
availability of products on clean, tidy shelves with price tags. According to Grönroos
(1991), intangible service attributes concern the functional quality of the store; that
is, how consumers obtain a service, rather than the technical quality of the store,
which regards the quality of the products themselves. Supermarket shopping is a self-
service concept, where interaction with staff is quite low compared to other retail
store formats, yet previous studies (e.g., Carpenter and Moore, 2006; Home, 2002;
Koo, 2003; Theodoridis and Chatzipanagiotou, 2009) have also identified the human
factor as a common store image attribute. The development of positive staff–
customer relationships can play a significant role in satisfaction and can provide a
key differential advantage. This finding is unsurprising within the context of Cyprus
where interaction among people is high; it is common to see customers chat with one
another or with store personnel. The development of customer–staff relationships
also provides managers with a unique opportunity to obtain first-hand information
about customer satisfaction, allowing managers to make any necessary corrections.
Furthermore, fresh fruit and vegetable revenues in the supermarkets varied between
12% and 20%; therefore, in contrast to frozen or processed foods, fresh food products
are a prerequisite for Cyprus consumers. Cleanliness of the store and fresh food
products were ranked as the first and third issues in which any discontent might lead
customers to switch to a competitor. Thus, service attributes are critical for consumer
satisfaction.
Store atmosphere, as identified by previous researchers (e.g., Koo, 2003;
Stanley and Sewall, 1976; Thang and Tan, 2003; Theodoridis and Chatzipanagiotou,
2009), was found to be the second most important store image attribute in this study.
Thang and Tan (2003) stated that a pleasing store atmosphere enhances the quality
of the visit and thus increases consumer preference for the store. A stimulating store
atmosphere can induce specific emotional outcomes (Kaltcheva and Weitz, 2006)
and lead consumers to spend more time and money in the store (Donovan et.al.,1994).
However, although the store atmosphere aspects of colour, music, lighting,
spaciousness, and interior design were identified as important factors for consumers
in their choice of store, these factors were not considered to be issues that would
cause consumers to switch to another supermarket in response to a negative change.
Frequent shoppers have significantly higher store atmosphere expectations than less-
frequent shoppers. The majority of the consumers on the island visit supermarkets
frequently, generally on the way home from work; therefore, they visit the same

12 Maslakçı, Yeşilada, Yeşilada
supermarkets repeatedly and are familiar with the layout of the store. Consequently,
they have small shopping baskets and spend a short amount of time in the market.
Moreover, they have strong relationships with the store personnel and the confidence
that any grievances they may have will be addressed.
The third important attribute identified was prices, consisting of discounts
and competitive pricing. While price has emerged as an important variable in studies
related to grocery shopping behaviour (e.g., Landsverk et al., 2003; Severin et al.,
2001; Tabak et al., 2005; Theodoridis and Chatzipanagiotou, 2009), some studies
have shown that price is not the only factor that determines supermarket preference
and that consumers spend a short time making decisions regarding price (Dickson
and Sawyer, 1990). However, competitive prices were ranked as the second issue in
which any discontent might lead consumers to switch to a competitor. Consumer
expectations with regard to prices do not differ according to shopping frequency and
residence; however, price was found to be more important to women than to men.
Previous research has found that women make the highest number of purchases in a
family (Blaylock and Smallwood, 1987) and that elderly women undertake this task
in most cases (Dholakia, 1999). Women in Cyprus have more control over grocery
shopping decisions, and they want to purchase the highest-quality food products at
the lowest possible prices. British consumers were found to differ significantly from
all other groups concerning price, to which they assign relatively less importance.
British consumers living on the island are mostly retired people who have relatively
higher disposable incomes than the other consumer groups studied.
The last factor, location and convenience, has also been frequently
identified in previous research conducted in different countries (e.g., Baltas and
Papastathopoulou, 2003; Belwal and Belwal, 2017; Carpenter and Moore, 2006;
Collins-Dodd and Lindley, 2003; Skinner, 1969). Store selection is highly influenced
by the geographic locations of retailers (Brooks et al., 2004), and the proximity of
the store influences consumers' patronage decisions (Baltas and Papastathopoulou,
2003; Theodoridis and Chatzipanagiotou, 2009). Due to insufficient public
transportation, car ownership is high throughout the island; therefore, consumers
prefer stores with parking facilities.
The relationship between perceptions of services and store atmosphere and
satisfaction were found to be affected by shopping frequency. It was found that at
lower levels of services perception, frequent shoppers have slightly higher
satisfaction levels than less-frequent shoppers, whereas at higher levels of services
perception, less-frequent shoppers have higher satisfaction. This may be because
frequent shoppers spend less time in the store and do not consider supermarket
shopping as a leisure activity. The moderating role of shopping frequency on the
relationship between store atmosphere perception and satisfaction is found to be
similar to the case of services and satisfaction. This may be because frequent
shoppers visit the supermarket more than once per week, mostly during weekdays
after work, and tend to spend less time in the market, purchasing daily items as
quickly as possible. These consumers shop frequently and are familiar with the layout
of the store, enabling them to finish their shopping quickly with little regard to the
store’s atmosphere. However, less-frequent shoppers spend more time in the market
and have larger baskets; hence, even an incremental improvement in the atmosphere
of the store leads to a higher positive effect on their satisfaction.
Grocery shopping is a task-oriented activity (Babin et al., 1994) to acquire
useful products (Kim and Jin, 2001), and consumers’ shopping motives are
influenced by culture and by the socioeconomic conditions of the market (Roth,
1995). Therefore, the findings of previous studies conducted in different cultural and
INTERNATIONAL JOURNAL OF BUSINESS, 26(2), 2021 13
socioeconomic settings are not directly relevant to the markets considered in the
current study. As competition intensifies, supermarket managers should consider the
competitive benefits of a more-favourable store atmosphere. Thang and Tan (2003)
have determined that store atmosphere influences store loyalty and repurchase
behaviour, and Berman and Evans (1998) have argued that consumers who like a
store’s atmosphere stay longer and prefer to shop more frequently.
Cyprus is a small island with a low population. Distances are short, and
word-of-mouth communication is effective; customers hearing of higher quality
fresh produce or price discounts at another supermarket may simply change their
route to try a different store. This places great pressure on supermarket managers to
monitor the prices, discounts, and sales promotion activities of their competitors as
well as the type and quality of their products. Store managers should never sacrifice
hygiene and should employ staff with good communication skills to build
relationships with customers. Staff can also observe customers’ behaviours and
report discontentedness. The availability of fresh food products is critical; managers
must ensure that fresh food products, especially bread, dairy, fresh vegetables, and
fruit, are available every day. A favourable store atmosphere, high level of services,
superior fresh food products, competitive prices, and excellent location and car
parking facilities would allow stores to increase the time customers spend in the store
and stimulate conspicuous buying, creating a high-quality image and emotional
outcomes in customers such as happiness and trust.
The focus of this study is supermarket image criteria of Cyprus consumers;
therefore, the results may not be directly applicable to consumers in other countries
and other retail store categories. However, researchers may wish to replicate the
study in other Mediterranean islands, such as Sicily, Sardinia, Corsica, Crete, and
Malta to examine whether Mediterranean island consumers have similar behaviours.
Replicating the study in other retail store categories across Cyprus would help
businesses to remain competitive in case of a possible unification of the island.
Examining the moderating role of shopping frequency on the relationship between
store image attributes and satisfaction in different retail store categories would
provide useful information to managers while designing marketing strategies
targeted toward consumers with different shopping frequencies.
Data Availability Statement
The data supporting the findings of this study are available from the corresponding
author upon reasonable request.
REFERENCES
American Marketing Association, 2017, Dictionary, available at:
https://www.ama.org/resources/Pages/Dictionary (accessed 22 December 2017).
Babin, B.J., W.R. Darden, and M. Griffin, 1994, “Work and/or Fun: Measuring
Hedonic and Utilitarian Shopping Value,” Journal of Consumer Research, 20,
644-656.
Baltas, G., and P. Papastathopoulou, 2003, “Shopper Characteristics, Product and
Store Choice Criteria: A Survey in the Greek Grocery Sector,” International
Journal of Retail & Distribution Management, 31, 498-507.
Belwal, R., and S. Belwal, 2017, “Factors Affecting Store Image and the Choice of
Hypermarkets in Oman,” International Journal of Retail & Distribution
Management, 45, 587-607.

14 Maslakçı, Yeşilada, Yeşilada
Berman, B., and J.R. Evans, 1998, Retail Management: A Strategic Approach, 7th
Ed. Prentice Hall.
Birtwistle, G., I. Clarke, and P. Freathy, 1999, “Store Image in the UK Fashion Sector:
Consumer Versus Retailer Perceptions,” The International Review of Retail,
Distribution and Consumer Research, 9(1), 1-16.
Blaylock, J.R., and D.M. Smallwood, 1987, “Intrahousehold Time Allocation: The
Case of Grocery Shopping,” Journal of Consumer Affairs, 21, 183-201.
Bloemer, J., and K. de Ruyter, 1998, “On the Relationship Between Store Image,
Store Satisfaction and Store Loyalty,” European Journal of Marketing, 32, 499-
513.
Brooks, C.M., P.J. Kaufmann, and D.R. Lichtenstein, 2004, “Travel Configuration
on Consumer Trip-Chained Store Choice,” Journal of Consumer Research, 31,
241-248.
Carpenter, J.M., and M. Moore, 2006, “Consumer Demographics, Store Attributes,
and Retail Format Choice in the US Grocery Market,” International Journal of
Retail & Distribution Management, 34, 434-452.
Chang, T.Z., and A.R. Wildt, 1994, “Price, Product Information, and Purchase
Intention: An Empirical Study,” Journal of the Academy of Marketing Science,
22, 16-27.
Collins-Dodd, C., and T. Lindley, 2003, “Store Brands and Retail Differentiation:
The Influence of Store Image and Store Brand Attitude on Store Own Brand
Perceptions,” Journal of Retailing and Consumer Services, 10, 345-352.
Dagli, O., 2014, “Consumer Attributes and Store Perceptions: An Integrated Study
of Grocery Shopping Behavior in North Cyprus,” International Journal of
Economic Perspectives, 8, 50-61.
Dholakia, R.R., 1999, “Going Shopping: Key Determinants of Shopping Behaviors
and Motivations,” International Journal of Retail & Distribution Management,
27, 154-165.
Dickson, P.R., and A.G. Sawyer, 1990, “The Price Knowledge and Search of
Supermarket Shoppers,” Journal of Marketing, 54, 42-53.
Donovan, R.J., J.R. Rossiter, G. Marcoolyn, and A. Nesdale, 1994, “Store
Atmosphere and Purchasing Behavior,” Journal of Retailing, 70(3), 283-294.
Erdem, O., A.B. Oumlil, and S. Tuncalp, 1999, “Consumer Values and the
Importance of Store Attributes,” International Journal of Retail & Distribution
Management, 27, 137-144.
Grönroos, C., 1991, “The Marketing Strategy Continuum: Towards a Marketing
Concept for the 1990s,” Management Decision, 29(1).
Guneren, E., 2012, “Kuzey Kibris Türk Cumhuriyeti’nde faaliyet gösteren
süpermarketlerin imaj bileşenleri” [The Composition of Image Components of
Supermarkets Function in Turkish Republic of Northern Cyprus], Hacettepe
Ü niversitesi İktisadi ve İdari Bilimler Fakültesi Dergisi [Hacettepe University
Journal of Economics and Administrative Sciences], 30, 55-79.
Hair, J.F., G.T.M. Hult, C. Ringle, and M. Sarstedt, 2016, A Primer on Partial Least
Squares Structural Equation Modeling (PLS-SEM), Sage Publications.
Hansen, T., and H.S. Solgaard, 2004, New Perspectives on Retailing and Store
Patronage Behavior, Kluwer Academic Publishers.
Hawes, J.M., and J.R. Lumpkin, 1984, “Understanding the Outshopper,” Journal of
the Academy of Marketing Science, 12, 200-217.
Home, N., 2002, “Rural Consumers' Patronage Behaviour in Finland,” International
Review of Retail, Distribution and Consumer Research, 12, 149-164.

INTERNATIONAL JOURNAL OF BUSINESS, 26(2), 2021 15
Hutcheson, G.D., and L. Moutinho, 1998, “Measuring Preferred Store Satisfaction
Using Consumer Choice Criteria as a Mediating Factor,” Journal of Marketing
Management, 14, 705-720.
Kaltcheva, V.D., and B.A. Weitz, 2006, “When Should a Retailer Create an Exciting
Store Environment?” Journal of Marketing, 70(1), 107-118.
Kim, J.O., and B. Jin, 2001, “Korean Consumers’ Patronage of Discount Stores:
Domestic vs Multinational Discount Store Shoppers’ Profiles,” Journal of
Consumer Marketing, 18, 236-255.
Knee C., 2002, “Learning from Experience: Five Challenges for Retailers,”
International Journal of Retail & Distribution Management, 30, 518-529.
Koo, D.M., 2003, “Inter‐Relationships Among Store Images, Store Satisfaction, and
Store Loyalty Among Korea Discount Retail Patrons,” Asia Pacific Journal of
Marketing and Logistics, 15, 42-71.
Külter, B., and C. Polat, 2007, “Tüketicilerin perakende mağaza seçimin etkileyen
faktörler: Niğde ili örneği” [Consumers’ Retail Store Choice Factors: Case of
Nigde], Gazi Üniversitesi İktisadi ve İdari Bilimler Fakültesi Dergisi [Hacettepe
University Journal of Economics and Administrative Sciences], 9, 109-126.
Landsverk, O.B., D. Hughes, and A. Fearne, 2003, “Shopper Loyalty and Store
Choice: Insights from a Study of Norwegian Supermarkets,” European Retail
Digest, 38, 1-8.
LGC News, 2018, available at: http://lgcnews.com/greek-cypriots-spending-more-
in-trnc (accessed 10 August 2018).
Martineau, P., 1958, “The Personality of the Retail Store,” Harvard Business Review,
36, 47-55.
Olympios, T., 2015, Factors Affecting Customer Satisfaction in Services: A Case of
the Supermarket Sector in Cyprus, University of Leicester.
Roth, M.S., 1995, “The Effects of Culture and Socioeconomics on the Performance
of Global Brand Image Strategies,” Journal of Marketing Research, 32, 163-175.
Semeijn, J., A.C. Van Riel, and A.B. Ambrosini, 2004, “Consumer Evaluations of
Store Brands: Effects of Store Image and Product Attributes,” Journal of
Retailing and Consumer Services, 11(4), 247-258.
Severin, V., J.J. Louviere, and A. Finn, 2001, “The Stability of Retail Shopping
Choices Over Time and Across Countries,” Journal of Retailing, 77, 185-202.
Skinner, R.W., 1969, “Hidden Consumer Motives in Supermarket Selection,”
American Journal of Agricultural Economics, 51, 1154-1158.
Stanley, T.J., and M.A. Sewall, 1976, “Image Inputs to a Probabilistic Model:
Predicting Retail Potential,” Journal of Marketing, 40, 48-53.
Tabak, B.İ., A.G.Ö . Ö zgen, and A.G.B. Aykol, 2005, “Süpermarket imaj kriterlerinin
değerlendirmesi: İzmir ili uygulamasi” [Evaluation of Supermarket Image
Criteria: Evidence From Izmir], Süleyman Demirel Üniversitesi İktisadi ve İdari
Bilimler Fakültesi Dergisi [Journal of Süleyman Demirel University Faculty of
Economics and Administrative Sciences], 10, 131-148.
Thang, D.C.L., and B.L.B. Tan, 2003, “Linking Consumer Perception to Preference
of Retail Stores: An Empirical Assessment of the Multi-Attributes of Store
Image,” Journal of Retailing and Consumer Services, 10, 193-200.
Theodoridis, P.K., and K.C. Chatzipanagiotou, 2009, “Store Image Attributes and
Customer Satisfaction Across Different Customer Profiles Within the
Supermarket Sector in Greece,” European Journal of Marketing, 43, 708-734.
Yenidüzen, 2020, available at: http://www.yeniduzen.com/kredi-kartiyla-kuzeyde-
alisveriste-122-artis-123069h (accessed 01 March 2020).

16 Maslakçı, Yeşilada, Yeşilada
Zeithaml, V.A., 1988, “Consumer Perceptions of Price, Quality, and Value: A
Means-End Model and Synthesis of Evidence,” Journal of Marketing, 52, 2-22.