
MODERATING EFFECTS OF SERVICE FAILURE AND ...
149
MODERATING EFFECTS OF SERVICE FAILURE AND CUSTOMER COMMUNICATION ON THE RELATIONSHIP BETWEEN SERVICE QUALITY AND CUSTOMER SATISFACTION AMONG MOBILE PHONE FIRMS IN KENYA BY SAMSON NTONGAI JEREMIAH A THESIS SUBMITTED IN FULFILMENT OF THE REQUIREMENTS FOR THE DEGREE OF DOCTOR OF PHILOSOPHY IN BUSINESS ADMINISTRATION DEPARTMENT OF BUSINESS ADMINISTRATION MASENO UNIVERSITY © 2016
-
Upload
khangminh22 -
Category
Documents
-
view
3 -
download
0
Transcript of MODERATING EFFECTS OF SERVICE FAILURE AND ...

MODERATING EFFECTS OF SERVICE FAILURE AND CUSTOMER
COMMUNICATION ON THE RELATIONSHIP BETWEEN SERVICE
QUALITY AND CUSTOMER SATISFACTION AMONG MOBILE
PHONE FIRMS IN KENYA
BY
SAMSON NTONGAI JEREMIAH
A THESIS SUBMITTED IN FULFILMENT OF THE REQUIREMENTS
FOR THE DEGREE OF DOCTOR OF PHILOSOPHY IN BUSINESS
ADMINISTRATION
DEPARTMENT OF BUSINESS ADMINISTRATION
MASENO UNIVERSITY
© 2016

ii
DECLARATION
DECLARATION BY THE CANDIDATE
I certify that this thesis has not been previously presented for a degree in Maseno
University, or in any other University. The work reported herein has been carried out by
me and all sources of information have been acknowledged by means of references.
Signature ___________ Date___________________
Samson Ntongai Jeremiah
PG/PhD/030/2013
DECLARATION BY THE SUPERVISORS
This thesis has been submitted for examination with our approval as the University
supervisor.
1. Dr. Patrick Boniface Ojera, PhD
Department of Accounting and Finance
Maseno University
Signature _____________ Date______________
2. Dr. Isaac O. Ochieng’, PhD
Department of Commerce
Laikipia University
Signature _______________ Date__________________

iii
ACKNOWLEDGEMENT
I wish to acknowledge the immense contribution of various authorities whose input led to
the successful development and completion of this thesis. To begin with, I wish to thank
in the most sincere way the Almighty God for availing me not only a rare opportunity to
pursue postgraduate studies, but also seeing me through the successful completion of the
same. I further extend my heartfelt gratitude to Maseno University for the opportunity it
offered me to pursue studies through the Staff Development Programme that significantly
reduced the college fees burden on me and provided a conducive learning environment. I
also want to express my lasting appreciation to my supervisors Dr. Patrick Boniface Ojera
of Maseno University, Department of Accounting and Finance and Dr. Isaac O. Ochieng’
of Laikipia University, Department of Commerce. They both tirelessly participated in the
conception, design and successful development of this thesis as well as their constructive
criticisms that greatly helped to improve this work.
I am also greatly indebted to staff of the School of Business and Economics of Maseno
University. Specifically, I would like to thank Dr. Jairo Mise for academic mentorship,
Dr. Fredrick Aila for academic support, Dr. Kiprotich Isaac, my friend and a colleague for
inspiring me through his own timely academic progression and through other valuable
advice, Dr. Beatrice Abong’o, Dr. Charles Ondoro the Chairperson of the Department of
Business Administration for the administrative support he gave me during the entire
period I was writing this thesis. I also received significant support from Prof. Mohamed
Mukras, Dr. Alphonce Juma Odondo, whose critical advice especially on the areas of
research methodology significantly improved this study. Finally, I want to appreciate the
moral support and constant encouragement I received from my good friends Mohamed
Dawe Chute, Kamau Ndichu and Benson Yano. They have been my source of inspiration
and strength from the commencement of this academic journey to its logical conclusion.

iv
DEDICATION
I dedicate this thesis to my father Jeremiah M'timitu and my mother Martha Askala who
kept on instilling in me words of hope, encouragement and hard work in academic
pursuits. May I also dedicate this work to my aunty Najma Ali Hassan and her family for
their constant financial and emotional support throughout my academic progress

v
ABSTRACT
Worldwide, Telecommunication Industry revenue has reached 2.1 trillion dollars in 2013
and is expected to grow by 3.4% by 2014. In Kenya, the mobile phone sector is growing
at 80.5% adoption rate and contributed 12% GDP growth in 2014. The 2013/2014
Communication Authority of Kenya (CAK) sectorial report, however, revealed frequent
service interruptions, numerous customer complaints, fraud, limited network coverage as
key concerns of stakeholders. Past studies have focused on establishing quality-
satisfaction relationship in high-contact service settings like banking, hospitality and
learning institutions only. Consequently, aspects of this relationship in low-contact
services that are highly integrated with technology, such as Kenya’s mobile phone
services are not known. Furthermore, the inconsistent findings regarding effect of service
quality on customer satisfaction suggests that moderating processes may be involved.
Hitherto, limited efforts to resolve the conflict through moderator investigation exist.
Service failure and customer communication, though plausible moderators, have,
however, not been considered. Consequently, their likely effect on service quality-
customer satisfaction relationship remains unknown. The purpose of the study was to
examine the moderating effect of service failure and customer communication on the
relationship between service quality and customer satisfaction. The specific objectives
were to: establish the effect of service quality on customer satisfaction; examine the
moderating effect of service failure on service quality and customer satisfaction
relationship; and analyze the moderating effect of customer communication on service
quality and customer satisfaction relationship. Expectancy disconfirmation theory guided
the study in a correlational survey research design. The population was 32.2 million
subscribers of four mobile phones firms in Kenya out of which 384 respondents were
selected using proportionate stratified sampling technique. Pilot results (N=10) revealed
42-item instrument overall mean reliability α=0.943.Discrimant validity was tested using
factor intercorrelations where all values are less than 0.7 indicating that the retained
factors are measures conceptually different constructs. Results revealed Reliability
(β=0.143, p=0.009); Assurance (β=0.419, p=0.000) and Empathy (β=0.559, p=0.000)
meaning they significantly predicted customer satisfaction in Kenya’s mobile phone
firms. Service failure (∆R2=0.064; p=0.000) moderated the relationship significantly
implying the interactive effect of service failure improved customer satisfaction by 6.4%
while customer communication (∆R2=0.059; p=0.000) moderated the relationship
meaning the interactive effect of customer communication improved customer
satisfaction by 5.9%. The study concluded that service quality practices (reliability,
assurance and empathy) were significant predictors of customer satisfaction; service
failure has a negative moderating effect (β= -0.662, p=0.000) on the relationship between
service quality and customer satisfaction; while customer communication moderates the
relationship positively (β=0.640, p=0.000). Recommendations were that firms should
continue enhancing service quality dimensions, mitigate service failures and institute
effective customer communication strategies as these efforts enhance customer
satisfaction. The study’s significance is informing service marketing literature and
marketing policy by isolating service failure and customer communication as key
variables.

vi
TABLE OF CONTENT
Title Page……………………………………………………………………………..........i
Declaration ..................................................................................................................... II
Acknowledgement .........................................................................................................III
Abstract .......................................................................................................................... V
Table of Content ........................................................................................................... VI
Abbreviations ................................................................................................................. X
Operational Definition of Terms .................................................................................. XII
List of Tables ..............................................................................................................XIV
List of Figures.............................................................................................................XVI
List of Appendices ....................................................................................................... xiii
CHAPTER ONE: INTRODUCTION .......................................................................... 1
1.1 Background to the Study ........................................................................................... 1
1.1.1 Customer Satisfaction ............................................................................................ 2
1.1.2 Service Quality ...................................................................................................... 3
1.1.3 Service Failure ....................................................................................................... 6
1.1.4 Customer Communication ...................................................................................... 7
1.1.5 The Mobile Phone Industry in Kenya ..................................................................... 9
1.2 Statement of the Problem .........................................................................................10
1.3 Objectives of the Study ............................................................................................11
1.4 Hypotheses for the Study .......................................................................................12
1.5 Scope of the Study .................................................................................................12
1.6 Significance of the Study .........................................................................................12
1.7 Conceptual Framework .......................................................................................13
CHAPTER TWO: LITERATURE REVIEW ............................................................16
2.1 Theoretical Perspectives ...........................................................................................16
2.1.1 Cognitive Dissonance Theory ............................................................................... 16
2.1.2 The Contrast Theory ............................................................................................ 17

vii
2.1.3 The Expectancy Disconfirmation Theory ............................................................. 17
2.1.4 The Concepts of Service Quality, Customer Satisfaction, Service Failure and
Customer Communication ............................................................................................ 18
2.2 Empirical Studies on Service Quality, Customer Satisfaction, Service Failure And
Customer Communication .............................................................................................22
2.2.1 Empirical Studies on Service Quality and Customer Satisfaction .......................... 22
2.2.2 Empirical Studies on Service Failure, Service Quality and Customer
Satisfaction……………………………………………………………………………...31
2.2.3 Empirical Studies on Service Quality, Customer Communication and Customer
Satisfaction ................................................................................................................... 34
2.2.4 Summary of Gaps................................................................................................36
CHAPTER THREE: RESEARCH METHODOLOGY............................................38
3.1 Research Design ......................................................................................................38
3.2 Study Area ...............................................................................................................39
3.3 Target Population .....................................................................................................39
3.4 Sample Size and Sampling Procedure .......................................................................40
3.5 Data Collection Methods ..........................................................................................42
3.5.1 Data Sources ........................................................................................................ 42
3.5.2 Data Collection Procedures .................................................................................. 42
3.5.3 Data Collection Instrument ................................................................................... 43
3.5.4 Reliability Tests .................................................................................................. 45
3.5.5 Validity Tests ....................................................................................................... 46
3.6. Testing for the Assumptions for the Linear Regression........................................... 48
3.7 Data Analysis ...........................................................................................................53
3.7.1 Correlation Analysis............................................................................................. 54
3.7.2 Factor Analysis .................................................................................................... 54
3.7.3 Regression Model................................................................................................. 54
3.8 Data Presentation .....................................................................................................58
CHAPTER FOUR: RESULTS AND DISCUSSIONS ................................................59
4.1 Characteristics of The Mobile Phone Users ..............................................................59
4.2 Extent of Service Quality Practised by Mobile Phones Firms in Kenya ....................61

viii
4.2.1 Tangible Dimension of Service Quality ................................................................ 61
4.2.2 Reliability Dimension of Service Quality ............................................................. 62
4.2.3 Responsiveness Dimension of Service Quality ..................................................... 64
4.2.4 Assurance Dimension of Service Quality .............................................................. 65
4.2.5 Empathy Dimension of Service Quality ................................................................ 66
4.2.6 Summary of the Extent of Service Quality Practised by Mobile Phones Firms in
Kenya ……………………………………………………………………………… ….68
4.3 Extent of Customer Satisfaction among Mobile Phone Firms in Kenya ....................69
4.4 Extent of Service Failure in Mobile Phone Sector in Kenya......................................70
4.5 Extent of Customer Communication in Mobile Phone Sector in Kenya ....................71
4.6 Examining the Effect of Service Quality on Customer Satisfaction ..........................72
4.6.1 Bivariate Association between Service Quality Measures and Customer
Satisfaction……………………………………………………………………………...73
4.7 Establishing the Moderating Effect of Service Failure on the Relationship between
Service Quality and Customer Satisfaction in Mobile Phone Firms in Kenya ................ 79
4.9 Summary of the Hypothesized Empirical Framework and Results ............................87
CHAPTER FIVE: SUMMARY, CONCLUSIONS AND RECOMMENDATIONS
……………………………………………………………………………………………………………………………………………90
5.1 Summary of Findings ...............................................................................................90
5.2 Conclusions ............................................................................................................ .91
5.3 Recommendations ....................................................................................................92
5.4 Contribution of The Study ........................................................................................93
5.4.1 Contribution of The Study to Theory .................................................................... 93
5.4.2 Contribution of The Study to Marketing Practice.................................................. 94
5.5 Limitations of the Study ..........................................................................................95
5.6 Suggestions for Further Studies ................................................................................96
REFERENCES ............................................................................................................97
APPENDICES………………………………………………………………………… 113
Appendix i: Letter Of Introduction ............................................................................... 109
Appendix ii: Research Questionnaire ........................................................................... 110

ix
Appendix iii: An S‐P‐P Framework Perspective ........................................................... 116
Appendix iv: Map Of Kenya ........................................................................................ 117
Appendix v: Raw Data ................................................................................................. 118

x
ABBREVIATIONS AND ACRONYMS
ABC African Banking Corporation
ATM Automated Teller Machines
CAK Communication Authority of Kenya
CPATI Certified Public Accounting Training Institution
CBD Central Business District
EU European Union
GTF Global Technology Forum
GDP Gross Domestic Product
GSMA Group Special Mobile Association
ICT Information and Communication Technology
IT Information Technology
KMO Kaiser-Meyer-Olkin
KCB Kenya Commercial Bank
KASNEB Kenya Accountant and Secretaries National Examination Board
MRA Moderated Regression Analysis
MTN Mobile Telecommunication Networks
OLS Ordinary Least Square
PCA Principle Component Analysis
SEM Structural Equation Modeling
SERVPERF Service Performance
SERVQUAL Service Quality
SMS Short Message Service
SD Standard Deviation
SPP Structure Process Performance
3G Third Generation of Mobile Telephony
VIF Variance Inflation Factor

xi
ZRESID Standardized residual
ZPRED Standardized predicted value

xii
OPERATIONAL DEFINITION OF TERMS
Assurance Refers to the knowledge and courtesy of employees and their
ability to inspire trust and confidence.
Customer Satisfaction A post consumption evaluative judgment concerning a
specific product or service
Customer Communication The ability of a customer to communicate freely and easily
interacts with service firm
Consumers The final or end users of a given product-market offering
Delivery failure These are failures in the service delivery system which may
either make services unavailable or unreasonably slow
thereby causing costly customer inconvenience
Empathy This involves individualized and caring attention the firm
provides to its customers
High Contact Service Is that service where customer’s direct interaction with the
service provider is seen as relatively more intense.
Low Contact Service Is that service where customer’s direct contact with the service
provider is seen as relatively less intense.
Service Failure The occurrence of unsatisfactory service encounters
experienced by service clients.
Service Quality The extent to which a firm successfully serves the purpose
of the customer. The sum total of customers’ expectations,
service delivery process and service outcome will have an
influence on service quality
Tangible Refers to the appearance of physical artefact and staff
members connected with the service (accommodation,
equipment, staff uniforms and so on.
Reliability Refers to the ability to deliver the promised services.
xiii
Responsiveness The readiness of the staff members to help in a pleasant and
effective way
Response failure These are failure by service employees to respond to
customers’ implicit and explicit needs.
Service Setting Totality of ambience and physical environment in which
service occurs. It is also called services cape.
Unprompted employee failure: These are failures arising from employees behaviour that
are totally unexpected by customers. These behaviour may
include poor attitudes, employee who ignores customers
and unusual behaviour such as rudeness, abusiveness and
inappropriate touching.

xiv
LIST OF TABLES
Table 3.1: Study Population and Study Sample……………………………………...40
Table 3.2 Response Rate…………………………………………………………......41
Table 3.3: Analysis of Internal Consistency…...…………………………………….46
Table 3.4 Summary of Validation Tests………………………………………….......48
Table 3.5: Testing for Normality Requirement………………………………………51
Table 3.6: Collinearity Statistics……………………………………………………..52
Table 3.7: Test for Independence of Error (Durbin-Watson Test)…………………...52
Table 4.1: Distribution of Mobile Phone User by Gender……………………...…....59
Table 4.2: Distribution based on Type of Network Connection……….………….....59
Table 4.3: Distribution of Respondents based on Year of Network Experience…….60
Table 4.4: Distribution of Respondents their Current Age…………...……………...60
Table 4.5 Measure of Tangible Dimension of Service Quality………………...…….62
Table 4.6 Measure of Reliability Dimension of Service Quality………………...…..63
Table 4.7 Measure of Responsiveness Dimension of Service Quality….………...….64
Table 4.8 Measure of Assurance Dimension of Service Quality…..………..……….66
Table 4.9 Empathy Dimension of Service Quality……………......……………….....67
Table 4.10 Summary of the Extent of Service Quality Practised by Mobile Phones Firms
in Kenya………………………………………………………………………………68
Table 4.11: Extent of Customer Satisfaction among Mobile Phone Firms in Kenya..69
Table 4.12: Measure of Service Failure in Mobile Phone Firms in Kenya……...…...71
Table 4.13: Measure of the Extent of Communication Level………………..………72
Table 4.14: Correlations of Variables with Customer Satisfaction…………...……...73
Table 4.15: ANOVA Results on the Relationship between Service Quality and Customer
Satisfaction………..………………………………………………………………….74
Table 4.16: Summary of Service Quality-Customer Satisfaction Model……….........75
Table 4.17: Estimated Regression Coefficients for Variables in Service Quality-Customer
Satisfaction Model…………………….………………………….…..……………….75

xv
Table 4.18: Estimated Regression Coefficients for Variables in the Effect of Service
Failure on the Relationship between Service Quality-Customer Satisfaction
Mode………………………………………………………………………………......80
Table 4.19: Model Summary of Effect of Service Failure on the Relationship between
Service Quality and Customer Satisfaction……………………………………………81
Table 4.20: Estimated Regression Coefficients for Variables in the effect of Customer
Communication on the Relationship between Service Quality-Customer Satisfaction
Models…………………………………..……………………………………………..84
Table 4.21: Model Summary of Effect of Customer Communication on the Relationship
between Service Quality and Customer Satisfaction……………….............................85
Table 4.22: Summary of the Hypothesized Empirical Framework and Results……….89

xvi
LIST OF FIGURES
Figure1.1: Conceptual Framework ………………………………………………......16
Figure 3.1: Histogram of Regression Standardized Residuals for Customer
Satisfaction………………...…………………………………………………………49
Figure 3.2: Normal P-P plot of Regression Standardized Residuals for Customer
Satisfaction……………..………………………………………………………...…..50
Figure 3.3: Scatter Plot of ZRESID against ZPRED for Customer Satisfaction....….50

xvii
LIST OF APPENDICES
APPENDIX I: Letter of Introduction……………………………………………..109
APPENDIX 11: Research Questionnaire…………………………………………110
APPENDIX 111: An S-P-P Framework Perspective……………..………………116
APPENDIX IV: Map of Kenya……………...…………………………………....117
APPENDIX V: Raw data….…………………………………...…………………118

xviii

1
CHAPTER ONE
INTRODUCTION
This chapter presents the background to the study and builds a case for the research
problem. It reviews the concepts of customer satisfaction, service quality, service failure
and customer communication, then introduces the development and challenges in the
mobile phone sector in Kenya. This section also entails the statement of the problem,
hypotheses, objectives, justification and the conceptual framework.
Background to the Study
Globally many marketing scholars (Parasuraman, Zeithaml and Berry, 1988; Azman,
Norashyikin and Muhammad, 2009) have acknowledged service quality is an important
antecedent to customer satisfaction. In fact, literature on quality management suggests that
service quality is a vital driver of customer satisfaction (Kotler and Armstrong, 2012;
Azman et al., 2009). Spreng and Mackoy (1996) have acknowledged the fact that the dual
concepts of service quality and customer satisfaction are indeed core aspects of marketing
theory and practice. In a highly competitive mobile phone sector such as that of Kenya,
service quality becomes a critical success factor for gaining a sustainable competitive
advantage in the marketplace which eventually translates into customer satisfaction
(Parasuraman, Zeithaml and Berry, 1985). There is therefore need for a paradigm shift of
focus by service managers and academicians aimed at seeking to understand how clients
perceive the quality of their services. This is true because delivering high quality service
will cause satisfaction and make a firm attain sustainable competitive advantage in the
market place (Shemwell, Yavas and Bilgin, 1998; Odhiambo, 2015). The concepts of
service quality and customer satisfaction are drawn from the expectancy disconfirmation
theory that proposes that service quality is a vital driver of customer satisfaction. In tandem
with the proposition of the theory, the interaction between the concept of service quality and
customer satisfaction will be anchored by expectancy disconfirmation theory as a guiding
theoretical grounding for this study. However, the study further hypothesizes that the
interaction between the service quality and customer satisfaction is expected to be
moderated by service failure and customer communication. These concepts are discussed in
the following sub-sections.

2
1.1.1 Customer Satisfaction
Customer satisfaction relates to the extent to which a product’s perceived performance
matches a buyer’s expectations (Kotler and Armstrong, 2012). Kotler (2006) observes that
modern organizations are endeavoring to become customer oriented by adopting customer-
driven initiatives that seek to build long-term profitable relationships with their customers.
Consequently, there is a paradigm shift of focus from merely satisfying customers to
achieving ultimate customer delight thereby making customer satisfaction gain more
attention from both practitioners and scholars in recent times (Nimako, Dokor and
Veronica; 2012). Since customers play a vital role in the success of an organization (Agbor,
2011; Lee and Ritzman, 2005) they should be placed first in management priorities.
According to reports by Communication Authority of Kenya of 2013/2014, the problem of
the core service delivery in terms of signal quality and network coverage are affecting
customer satisfaction in the context of mobile phone services. Additionally, issues to do
with perceived price fairness, service failure problems, efficiency of services provided,
availability of product variety, clarity of network and fast connectivity were cited as issues
affecting customer satisfaction levels. The theory of expectancy disconfirmation suggest
that improving service quality will not only help a firm gain a sustainable competitive
advantage in the marketplace but also results in increased satisfaction levels for their
customer (Oliver, 1980).
The status of customer satisfaction with regard to mobile service quality worldwide is
varied. At global level for instance, a survey conducted in Europe indicates that customer
satisfaction levels with regard to service quality provided by mobile phones firms are
inconsistent across Europe (Oracle white paper, 2011). Furthermore, consumers want
operators to improve the quality of services offered. Moreover, the global trend in the
mobile phone market indicates that consumers are today very willing to switch between
mobile operators. There is therefore need to increase brand loyalty through increased
personalization of customer services. Therefore, the critical need for and importance of
quality improvement in the telecommunication industry continues to be a loudly voiced
customer demand (Oracle White Paper, 2011). In Africa, customer satisfaction level with
regard to service quality delivered in Ghana’s mobile Network is reported to be moderately
low at 43.5% (Nimako et al., 2012). This indicates that customer satisfaction was neither

3
equal to, nor better than the desires and expectations of customers. In Kenya, however, the
status of customer satisfaction with respect to Kenya’s mobile services remains unknown.
1.1.2 Service Quality
Service quality can be perceived as the result of customers’ comparison of their
expectations about a service and their perception of the way the service has been performed
(Gronross, 1984; Caruana, Money and Berthon; 2000). Further, when all service quality
features such as tangibility, responsiveness, empathy, assurance and reliability are
effectively implemented; it may result in enhanced satisfaction of service clients (Gronross,
1984, Parasuraman et.al., 1988; Azman, 2009). With regard to mobile phone services,
service quality relates to issues to do with net quality which include indoor and outdoor
coverage, smoothness of connectivity along the effective delivery of other value added
service (Gerpott, Rams and Schindler, 2001). Since the mobile phone market is in a highly
competitive service sector, service quality becomes a very critical success factor for gaining
sustainable competitive advantage that will translate into customer satisfaction and profit
for the firm.
However, according to Buttle (2006), the conceptualization, dimensionality,
operationalization and measurement of the service quality practices has been problematic as
there exist no universally acceptable scale to measure service quality along its diverse
manifestations. Even though many marketing scholars (Zeithaml, Parasuraman and Berry,
1990; Bitner and Hubert, 1994; Sureshchandar, Rajendran and Anantharaman, 2002)
suggested that the 22 items scale of the SERVQUAL model are reasonably good predictors
of service quality in its wholeness, Zeithaml et al. (1990) observed that to date, researchers
are not in agreement over whether to use SERVQUAL scale or functional/technical measure
of service quality. Moreover, getting a precise measure of service quality is quite a
challenging undertaking. This, in part, can also be attributed to variability inherent in the
service that tends to defy standardization of service quality (Gibson, 2009). Consequently,
this has caused many researches involving the study of service quality practice to generate
mixed and inconsistent results due to the conflicting views about the dimensionality of
service quality constructs. Therefore, with this apparent lack of acceptable measurement
scale, more so in the context of Kenya’s mobile phone services, the status of service quality
practices with regard to mobile phone services remain unclear.
4
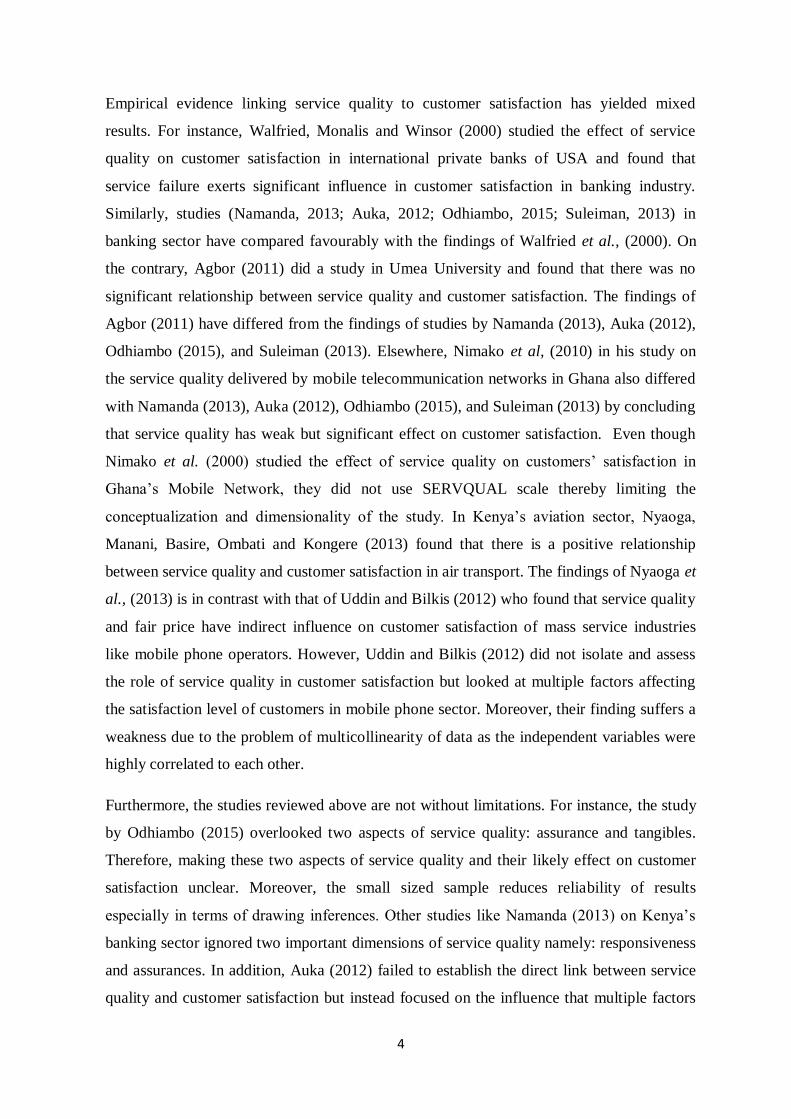
Empirical evidence linking service quality to customer satisfaction has yielded mixed
results. For instance, Walfried, Monalis and Winsor (2000) studied the effect of service
quality on customer satisfaction in international private banks of USA and found that
service failure exerts significant influence in customer satisfaction in banking industry.
Similarly, studies (Namanda, 2013; Auka, 2012; Odhiambo, 2015; Suleiman, 2013) in
banking sector have compared favourably with the findings of Walfried et al., (2000). On
the contrary, Agbor (2011) did a study in Umea University and found that there was no
significant relationship between service quality and customer satisfaction. The findings of
Agbor (2011) have differed from the findings of studies by Namanda (2013), Auka (2012),
Odhiambo (2015), and Suleiman (2013). Elsewhere, Nimako et al, (2010) in his study on
the service quality delivered by mobile telecommunication networks in Ghana also differed
with Namanda (2013), Auka (2012), Odhiambo (2015), and Suleiman (2013) by concluding
that service quality has weak but significant effect on customer satisfaction. Even though
Nimako et al. (2000) studied the effect of service quality on customers’ satisfact ion in
Ghana’s Mobile Network, they did not use SERVQUAL scale thereby limiting the
conceptualization and dimensionality of the study. In Kenya’s aviation sector, Nyaoga,
Manani, Basire, Ombati and Kongere (2013) found that there is a positive relationship
between service quality and customer satisfaction in air transport. The findings of Nyaoga et
al., (2013) is in contrast with that of Uddin and Bilkis (2012) who found that service quality
and fair price have indirect influence on customer satisfaction of mass service industries
like mobile phone operators. However, Uddin and Bilkis (2012) did not isolate and assess
the role of service quality in customer satisfaction but looked at multiple factors affecting
the satisfaction level of customers in mobile phone sector. Moreover, their finding suffers a
weakness due to the problem of multicollinearity of data as the independent variables were
highly correlated to each other.
Furthermore, the studies reviewed above are not without limitations. For instance, the study
by Odhiambo (2015) overlooked two aspects of service quality: assurance and tangibles.
Therefore, making these two aspects of service quality and their likely effect on customer
satisfaction unclear. Moreover, the small sized sample reduces reliability of results
especially in terms of drawing inferences. Other studies like Namanda (2013) on Kenya’s
banking sector ignored two important dimensions of service quality namely: responsiveness
and assurances. In addition, Auka (2012) failed to establish the direct link between service
quality and customer satisfaction but instead focused on the influence that multiple factors

5
had customer loyalty in banking sector. On the other hand, Suleiman (2013) focused only
on the individual dimensions of service quality separately, and their resulting effects on
customer satisfaction in banking industry. This service sector depict a different service
setting from that of mobile phone sector. Finally, Nyaoga et al., (2013) used descriptive
statistics in its analysis which are regarded as a less preferred approach to establish cause
and effect relationship. Moreover, air transport sector is regarded as high contact service
whose setting does not relate to a low contact services as in the case of mobile phone sector.
According to Gerpott et al. (2001) mobile phone sector in Kenya has become an important
key in the development of the economy of developed countries since 1990s. Kenya’s mobile
phone sector has grown exponentially but has continued to experience numerous challenges
relating to the quality of services offered to customers. These challenges include: numerous
customer complaints about unsolicited marketing text, frequent service interruption due to
server/network breakdown and cable cuts causing frequent delays and costly inconvenience
to customers, fraud targeted at customers has also become endemic in the mobile market
place (CAK, 2012). Moreover, the sectoral report of 2013/2014 period released by the
Communication Authority of Kenya rated all the four mobile phone operators in Kenya as
non-compliant in terms of service quality standards. Specifically, the report indicated that
Safaricom, Airtel and Telkom Kenya achieved an overall rating of 62.5% which is below
the set target for quality of services. Past efforts to address these challenges majorly
concentrated with little success on policy issues. However, some policy issues were seen as
unfair and discriminatory by some operators. For instance, the Fair Competition and
Equality of Treatment Regulation which requires dominant players to report to the regulator
before revising pricing has been facing resistance for some operators (CAK, 2014).
Therefore, no effort has been put forward to address the foregoing challenges from firms’
internal management practices such as service quality management. In Kenya, most studies
(Auka, 2012; Nyaoga et al., 2013; Odhiambo, 2015; Kimani, 2014) relating service quality
to customer satisfaction have only focused on sectors like banking, aviation and higher
learning institutions which are regarded as high contact service setting with intense client-
service provider interaction. Therefore, none of the reviewed studies analyzed effect of
service quality practices on satisfaction of mobile phone service users, as a low contact
services which is highly integrated with a technology. Consequently, the status of service
quality practices and its consequences on satisfaction levels of the mobile phone subscribers
in Kenya is not known.

6
1.1.3 Service Failure
A service failure is a service performance that fails to meet customer expectations (Walfried
et al., 2000). Typically, when a service failure occurs, a customer will expect to be
compensated for the inconvenience in the form of any combination of refunds, credits,
discounts or apologies. The strength of a customer relationship with the organization prior
to a service failure has a buffering effect in the event of service failure (Walfried et al.,
2000). This study explores the following three dimensions of service failure: delivery
failure, response failure and unprompted employee actions. Research suggests that
customers who expect the relationship to continue have lower service recovery
expectations, and in turn, are more satisfied with service performance after recovery
(Polaris Marketing Research, 2011). The severity of the service failure is expected to
moderate the relationship between quality and satisfaction. Even with strong recovery,
research indicates that customers may still be upset, engage in negative word-of-mouth, and
be less likely to develop trust with and commitment to the organization, if the original
service failure was really bad (Polaris Marketing Research, 2011). Service failure and
recovery is therefore a critical issue for both service managers and researchers (Mc
Collough et al, 2000). However, until recently, the research on the nature and the effect of
service failure on the customer satisfaction has been limited. Therefore, service failure has
been identified as a neglected area that requires additional research (Andreassen, 1999; Tax,
Brown and Chandrashekaran, 1998). Following the limited attention given to service
failure, it is unclear how customers evaluate service failure and its potential effect on
customer satisfaction.
Previous attempts in terms of empirical investigation to test for moderation effect on the
service quality-customer satisfaction relationship have failed due to poor conceptualization
of dimensionality of variables (Walfried et al., 2000). Moreover, many moderation studies
have modeled other moderators in service quality-customer satisfaction relationship. For
instance, moderation study by Wang et al. (2004) sought to establish the moderating role of
customer value in the relationship between service quality and customer satisfaction in
China’s mobile telecommunication market and found it significant. Similarly, Caruana et al.
(2000) explored the moderating role of value on the relationship between service quality
and customer satisfaction in an audit firm which revealed small negative moderation effect
on quality-satisfaction relationship. However, the studies by Wang et al. (2004) and
Caruana et al. (2000) differed in terms of direction of effects. Whereas Wang et al. (2004)

7
found positively significant moderating effect, Caruana et al. (2000) on the other hand
found that customer value had a small negative moderating effect in the relationship.
Elsewhere, in a study on USA banking services, Walfried et al. (2000) attempted to
introduce service failure as a moderator into service quality-customer satisfaction
relationship with little success as there was no moderation. However, Walfried et al. (2000)
omitted the empathy dimension of service quality hence limiting the conceptualization of
dimensions of his study. In Europe, Reimann, Lunemann and Chase, (2008) differed from
Walfried et al. (2000) as they modelled and tested the moderation effect of uncertainty
avoidance on the relationship between perceived service quality and customer satisfaction
instead of service failure.
However, the above reviewed studies are not without weaknesses. For instance, moderation
studies (Wang et al., 2004; Caruana et al., 2000; Reinman et al., 2008) have all tested for
other variables like customer value, uncertainty avoidance as possible moderators instead of
service failure. Moreover, studies by (Mc Collough et al., 2000) only tested for direct effect
of service failure on customer satisfaction instead of its moderating role on quality-
satisfaction relationship. Study by Caruana et al. (2000) had a major limitation due to the
problem of multicollinearity since variables were strongly correlated coupled with the use
of small sample size of 80 respondents thus making generalization of their results difficult.
Moreover, Most studies (Walfried et al., 2000; Wang et al., 2004; Caruana et al., 2000;
Reinman et al., 2008) that have tested moderation effect have focused on other sectors such
as banking services, audit services which are high end and high contact services with high
service standards and high customer expectations. Their analysis has excluded the mobile
phone sector in a developing country like Kenya. Therefore, the moderating role of service
failure in quality/satisfaction relation with regard to low contact services such as mobile
phone services has not been formally explored. Consequently, the status of service failure
and its influence on quality/satisfaction model in low contact services, particularly in
Kenya’s mobile services industry is not known.
1.1.4 Customer Communication
Customer communication refers to the ability to freely converse with the service firm.
Zeithaml et al. (1990) perceived that customer communication will play a critical role in the
service delivery process; by eliminating ignorance regarding customer’s expectation by
service firms. This was further supported by Mohr’s and Nevin’s (1990) theoretical model

8
which suggested that communication, among other things serves to moderate the effects of
circumstance and conditions in the service exchange process. This study explored the
following dimensions of customer communication: complaints, suggestions, compliments
and abandonment of usage. Excellent customer service and communication programmes
can make companies stand apart from their competition, stand out as accomplished in the
business world and stand out with their customers and employees. Even though customer
communication was theoretically perceived as a plausible moderator in the service quality-
customer satisfaction relationship, its moderating role has not been tested empirically yet.
Empirical evidence by Junaid, Theeb, Motairi, Egab, Muhammad and Jamal (2012) tested
for direct effect of communication on customer satisfaction in the context
telecommunication services in Malaysia and found that communication influences
satisfaction negatively though insignificantly. Similarly, Rezaie and Forghani (2011) also
tested direct effect of communication on customer satisfaction in the context of users of
Information Technology services in Isfahan University in Iran but differed from Junaid
et.al. (2012) in the direction of effects. Whereas Junaid et al. (2012) found that
communication has exerted negative insignificant direct effect on customer satisfaction,
Rezaie and Forghani (2011) found that among other factors, communication plays a vital
role in explaining variation in customer satisfaction among IT service users. Despite Junaid
et al., (2012) focusing on telecommunication services and establishing a direct link between
communication and customer satisfaction, their study had failed to establish the moderating
role of communication on the quality-satisfaction relationship. On the other hand, a study
by Gantasala and Padmakumar (2013) modelled and tested the mediating effects of
customer communication on relationship between service quality and customer satisfaction
of Telecom Company in Oman. The studies by Gantasala and Padmakumar (2013) and
Junaid et al., (2012) were similar in terms of the context as both were done in
telecommunication sector in Asian market but different in terms of their focus. Whereas
Junaid et al., (2012) tested for the direct effect of communication on customer satisfaction,
Gantasala and Padmakumar (2013) on the other hand, tested for the its mediating role and
found it significantly so. Most studies reviewed (Junaid et al., 2012; Rezaie and Forghani,
2011; Gantasala and Padmakumar, 2013) did not shade light on the likely effect of
communication as a plausible moderator variable on quality-satisfaction relationship as
some only tested direct effect while others tested mediating effect. Furthermore, most
studies reviewed were conducted in the context of developed countries thereby missing the

9
analysis of Kenya’s mobile phone context. This is despite the fact that the Kenya’s mobile
sector is currently experiencing many challenges like low access to telecommunication
infrastructure, high operation and regulation costs and stiff competition that has forced
small operators like Essar Yu to quit the sector and put off many potential developers of
mobile services. Therefore, there is no known attempt to empirically establish the
moderating role of customer communication on the relationship between service quality and
customer satisfaction despite advances in theoretical literature (Zeithaml et al., 1990; Mohr
and Nevin, 1990) that it can moderate. Consequently, the status and the likely effect of
customer communication on quality-satisfaction relationship is not known.
1.1.5 The Mobile Phone industry in Kenya
Globally, the U.S.A mobile phone market is outperforming the E.U market in many
important respects relating to customer service. In 2012 alone, the U.S mobile market grew
by 42% overall from 2009 with the device segment growing at 152% (Chetan Sharma
Consulting, 2013). Further, a report by Telecommunication Industry Review (2012)
indicates that the worldwide telecommunications industry revenue has reached $ 2.1 trillion
in 2012 and is expected to grow by 3.4% by 2013. This growth in revenue is expected to
continue everywhere expect Europe. This is so because Europe’s share of the global
telecommunications markets has been declining regularly from 31% in 2005 to just 25% in
2012. In contrast, Asia Pacific region led the growth but Africa is also growing faster than
is obvious (Telecommunication Industry Review, 2012).
During the last decades, developments in the mobile phone sector have presented a great
success story in Kenya’s economy. The ICT sector in Kenya grew at an average of nearly
20% per year from 1999-2013. The internet usage rates for 2013 were around five to ten
adults. There are over 32 million mobile phone users in the country and virtually every
adults has access to one. Besides, over 45% of the population enjoys internet access. It is
noteworthy that Kenya has led the world in mpesa electronic cash transfer through mobile
telephony platform (CAK, 2014). Another success story with mobile phones services is the
emergence of digital transaction culture which have enabled high proportion of Kenya’s
urban population to support family members in rural part of the country. Finally, today
Kenyan businesses can access world-class fibre-optic links to the rest of the world and
fierce telecom competition has significantly lowered connectivity prices (CAK, 2014).

10
Kenya has experienced a tremendous growth in investment in the mobile phone sub-sector
which has facilitated improvement in technology infrastructure. From the year 1992 when
mobile phone was first introduced, subscribers numbered 1,100 compared to 32.8 million
mobile phone subscriptions in Kenya by 2014. Revenue from this sector has contributed up
to an estimated 12.1% to the Kenyan economy (Communication Authority of Kenya, 2013).
The growth in mobile telecommunication sector has therefore had a positive impact on the
Kenyan economy. As at July 2013, there were four major mobile phone firm operators in
Kenya namely: Safaricom Kenya, Airtel Networks, Telkom Kenya (Orange) and Essar
Telkom (CAK, 2013). The latter two are relatively smaller. Besides, the sector comprises
32.8 million subscribers who form both post-paid and pre-paid customers. The government
also plays a critical role in sector regulation by licensing and enforcing legal aspects
governing the sector through Communication Authority of Kenya. CAK being a state-
owned corporation, is responsible for ensuring fair play in the airwaves among competitors,
licensing and developing and coordinating the policies and strategies with respect to
development and operation of telecommunications services in Kenya (CAK, 2012).
Despite the promising growth trends in performance by the mobile phone sector in Kenya,
there are many challenges that affect both the operators and their customers
(subscribers).These challenges include: lower access to telecommunications infrastructure
with network coverage in northern parts of Kenya still being a challenge, high operations
and regulatory costs/challenges have further put off many potential developers of mobile
services. Kenya’s tax regime has also been blamed to be the biggest obstacle holding back
the growth of the sector by treating this service as a luxury (GSMA, 2008; CAK, 2012).
Finally, cut-throat competition has reduced the stock turnover and profit earned by
individual small business operators.
1.2 Statement of the Problem
Despite growing at 80.5 per cent adoption rate and contributing 12 per cent GDP growth in
2014, Kenya’s mobile phone sector has experienced myriad challenges that have held back
its growth. The 2013/2014 sectorial report by Communication Authority of Kenya (CAK),
revealed that frequent service interruptions, numerous customer complaints, fraud targeted
on customers, limited network coverage on some part of Northern Kenya as key
stakeholders’ concerns. Moreover, CAK have rated all four Kenyan mobile phone operators
as non-compliant (62.5%) in terms of set quality of service targets of 80 per cent. Service

11
quality management literature shows plausible but mixed relationship between service
quality and customer satisfaction. Moreover, many of such studies focused on establishing
the relationship between service quality and customers satisfaction in high end market and
in high contact services with high service standards and high customer expectation such as
the banking and hospitality sector. Consequently, aspects of quality-satisfaction relationship
particularly in the case of low contact services offered by mobile phone firms is not known.
Furthermore, the inconsistent findings regarding the effect of service quality on customer
satisfaction and the weak explanatory power of the service quality on satisfaction suggests
that moderating processes may be involved. However, the studies in other context on the
relationship have yielded inconsistent results with limited effort to resolve the conflict
through moderator investigation. While service failure and customer communication are
theoretically plausible moderators of the service quality-customer satisfaction relationship,
there is no empirical evidence on Kenya’s mobile market sector, particularly on the
inclusion of these plausible moderators in the elusive customer service quality - customer
satisfaction relationship. Therefore, this study investigated the moderating effects of service
failure and customer communication on the relationship between service quality and
customer satisfaction among mobile phone firms in Kenya.
1.3 Objectives of the Study
The overall objective of the study was to examine the moderating effects of service failure
and customer communication on the relationship between service quality and customer
satisfaction among mobile phone firms in Kenya.
Specific Objectives:
Specifically, the study sought to:
i. Establish the effect of service quality on customer satisfaction in mobile phone firms
in Kenya.
ii. Examine the moderating effect of service failure on the relationship between service
quality and customer satisfaction in mobile phone firms in Kenya.
iii. Analyze the moderating effect of customer communication on the relationship
between service quality and customer satisfaction in mobile phone firms in Kenya.

12
1.4 Hypotheses for the Study
The following hypotheses were tested in this study;
i. Ho: βi =0 Service quality has no significant effect on customer satisfaction among
Kenya’s mobile phone firms.
ii. Ho: βi =0 The relationship between service quality and customer satisfaction is not
moderated by service failure among mobile phone firms in Kenya.
iii. Ho: βi = 0 The relationship between service quality and customer satisfaction is not
moderated by customer communication among mobile phone firms in Kenya.
1.5 Scope of the Study
This research focused on the study of four concepts namely service failure, customer
communication, service quality and customer satisfaction as constructed in the conceptual
framework in Figure1.1. The research took the form of a consumer study where mobile
subscribers of the four mobile phone service operators in Kenya were targeted as
participants to validate constructs and estimate econometric models. Besides, viewing the
subject from a customer perspective was seen as appropriate since customers are the ones
who ultimately consume the service and are therefore the best judges of quality. The study
area is Kenya because it is regarded as the world leader in mobile money transfer services
with a penetration rate of 80.5% rising exponentially hence widely accepted as a vibrant
mobile economy (CAK, 2014). Finally, to achieve the stated objectives, mobile subscribers
who have been using the network services in at least the last 6 months of the year 2014 were
targeted as possible participants in the study to get objective and accurate views on their
service quality assessment and their level of satisfaction. Therefore, the study was
conducted between May, 2014 and September, 2015 at a time when there were four active
mobile firms in Kenya.
1.6 Significance of the Study
The state of Kenya’s mobile phone environment with respect to customer satisfaction and
service quality delivered still remains unclear due to scanty documentation. In tandem to the
above fact, a major service sector that would benefit from clarity of the interrelationship
among service quality, service failure, customer communication and customer satisfaction is

13
the mobile phone sector in Kenya. Statistics obtained from articles that relate customer
service quality to satisfaction show that little research has been conducted on this subject
particularly with service quality dimensions hence the need for more research in this area
(Agbor, 2011). Furthermore, the relationship between service quality and customer
satisfaction shows a paradoxical connection worth studying. Besides, knowledge gained
from this study may be used to develop strategies for efficient management of service
quality standards to influence consumers profitably.
Moreover, prior studies (Nimako et al., 2010; Uddin and Bilkis; 2012; Agbor, 2011; Lai,
griffin and Babin, 2009; Wu and Lang, 2009; Kuo, Wu and Deng, 2009; Baker, 2000), have
used different scales to measure service quality. Consequently, this has led to model
misspecification, poor conceptualization of the study constructs and generation of
paradoxical findings. However, the current study made contribution by developing and
validating a scale which service managers in mobile phone sector, that marketing specialists
and policy makers can use to empirically determine the extent of service quality practices as
determinant of customer satisfaction in mobile phone sector.
Finally, by ignoring the role of moderating variables in the elusive quality-satisfaction
relationship, majority of past studies have yielded inconsistent results with limited effort to
resolve the inconsistency through a moderator investigation. Therefore, by isolating and
analyzing the moderating role of service failure and customer communication, this study
contributes to better clarity of the relationship as well as in theory development and
validation. The study is insightful for academics and practitioners in the field of service
marketing and quality management in the mass service industry.
1.7 Conceptual Framework
Figure 1.1 provides a conceptual framework from which to develop hypotheses. The
framework is modified from Walfried et al., (2000) as shown in Appendix III. Walfried et
al, (2000) framework was used to measure banking services in USA international bank
which was regarded as a high contact service setting and therefore included both
SERVQUAL and SERVPERF measures of service quality. However, the current study
modified and used Walfried et al, (2000) framework by omitting SERVPERF measures of
service quality. The use of SERVQUAL scale only to measure service quality in the context
of low contact services such as Mobile phone services was deemed appropriate and

14
sufficient given that service expectation and standards are relatively low as compared with
those of high contact setting. The framework will comprise of four variables namely:
service quality as independent, service failure and customer communication both as
moderator variables, customer satisfaction as dependent variable. First, as depicted in
Figure 1.1, customer satisfaction is expected to be influenced by service quality
operationalized using SERVQUAL scale with dimensions which comprise: tangibles,
reliability, responsiveness, assurance and empathy. This is attributed to the fact that service
quality is a vital determinant of customer satisfaction since superior service quality offered
by a service firm would lead to customer satisfaction (Yi, 1990; Gantasala and
Padmakumar, 2013).
Further, the inconsistent findings regarding the effect of service quality on customer
satisfaction and the weak explanatory power of the service quality on satisfaction suggests
that moderating processes may be involved. Baron and Kenney (1986) noted that the use of
moderator variable influences the strength of the relationship between two variables and can
be used to cure weak relationships in social science studies. Similarly, Cohen, Cohen, Aiken
and West (2003) noted that the testing of interactions is at the very heart of theory testing in
the social science. However, to date there is limited effort to empirically resolve those
inconsistent research findings through moderator investigation. Despite service failure and
customer communication being seen as plausible moderators in theoretical literature, they
are however not formally considered empirically especially in a low contact service setting.
Subsequently, this study hypothesizes that the relationship between service quality and
customer satisfaction is moderated by service failure and customer communication. For
instance, communication plays a critical role in the service delivery process. Mohr and
Nevin's model (1990) suggests, among other things, that communication serves to moderate
the effects of various circumstances and conditions associated with exchange, on the
outcomes of exchange, as well as the impact that organizational climate exerts on buyer-
seller satisfaction. Therefore, customer communication is expected to moderate relationship
between service quality and customer satisfaction and is operationalized by complaints,
suggestions, compliments and abandonment of usage. Service Failure on the other hand is
expected to moderate relationship between service quality and customer satisfaction and is
operationalized as delivery failure, response failure and unprompted employee actions. For
instance, according to Polaris Marketing Research (2011), the severity of the service failure
is expected to influence the customer satisfaction and commitment. All the three

15
independent variables: namely service quality, service failure and customer communication
are abstract constructs and are measured using a seven point agreement Likert scale. The
interplay of variables is summarized in Figure 1.1.
Independent Variable Dependent variable
H01
H03 H02
Moderator Variable2 Moderator Variable 1
Fig.1.1: The Effects of Service failure, Customer Communication and Service Quality
on Customer Satisfaction
Source: Adapted from Walfried et.al, (2000, Pg. 11)
-Tangibles
-Reliability
-Responsiveness
-Assurance
-Empathy
Ser
vic
e Q
ua
lity
Cu
sto
mer
Sa
tisf
act
ion
-Affective &
Cognitive
-Intention to
repurchase
-Loyalty
-Overall satisfaction
(emotional)
Customer
Communication
Complaints
Suggestions
Compliments
Abandonment of
usage
Service Failure
Delivery failure
Response failure
Unprompted
employee
actions

16
CHAPTER TWO
LITERATURE REVIEW
This chapter reviews both theoretical and empirical literature related to service quality,
service failure, customer communication and customer satisfaction to establish the level of
knowledge related to the research topic. Thereafter, identified knowledge gaps from the
review are summarized.
2.1 Theoretical Perspectives
This review explores theoretical foundation of the study by advancing the theory that
guided the study as well as defining the concepts and dimensions of the variables.
According to Kerlinger (1979), a theory is a set of interrelated constructs, definitions and
propositions that presents a systematic view of phenomena by specifying relations among
variables with the purpose of explaining natural phenomena. There are a number of theories
associated with the satisfaction and service paradigms. These theories have been used to
understand the process through which customers form satisfaction judgment (Oliver, 1980).
In other to evaluate their suitability for the study, the cognitive dissonance theory, contrast
theory, expectancy disconfirmation theory and their corresponding critiques have been
reviewed in the following subsections.
2.1.1 Cognitive Dissonance Theory
Cognitive dissonance is basically an uncomfortable feeling caused by holding two
contradictory ideas simultaneously. Proposed by Festinger (1957), the theory suggests that
people have motivation to reduce discomfort/dissonance by changing their attitude and
behaviour or by justifying or rationalizing them. Festinger (1957) further stated that
cognitive dissonance revealed high explanatory power in explaining the state of
dissatisfaction/discomfort buyers often find themselves when making a purchase. However,
this theory was criticized as having relatively scarce application area. Specifically, critics
have termed dissonance as often being merely a transitory phenomenon. Moreover,
addressing cognitive dissonance empirically has presented some difficulties because of the
problem of measurement and data collection. As a theory of satisfaction, it has also failed to
provide a theoretical link between two variables of the study namely service quality and
customer satisfaction because it ignored service quality practices as a critical antecedent of

17
customer satisfaction. Therefore, cognitive dissonance theory fails as a complete
explanation of consumer satisfaction.
2.1.2 The Contrast Theory
Dawes et al. (1972) defined contrast theory as the tendency to magnify the discrepancy
between one’s own attitudes and the attitudes represented by an opinion statement.
According to the contrast theory, any discrepancy of experience from expectations will be
exaggerated in the direction of the discrepancy. For instance, if the firm raises expectation
in its advertising and then a customers’ experience turns out to be only slightly less than that
promised, the product or service would be rejected as totally unsatisfactory (Terry, 1997).
However, critics have noted that contrast theory of customer satisfaction only predicts
customer reaction instead of reducing dissonance/dissatisfaction since the consumers will
magnify the difference between the expectation and performance of the products or service.
Additionally, it overlooked the aspects of service quality as the critical variable of the
present study.
2.1.3 The Expectancy Disconfirmation Theory
Proposed by Oliver (1980), this theory states that satisfaction level is a result of the
difference between the expected and the perceived performance of service. Precisely,
satisfaction, which is a positive disconfirmation, occurs when a product or service performs
between that customer’s expectations. At the other extreme, a performance that is worse
than expectation of customer will cause dissatisfaction. This is termed as negative
disconfirmation (McQuitty, Finn and Wiley, 2000). Furthermore, Mattila and O’Neill
(2003) have argued that amongst the most popular satisfaction theories is the expectancy
disconfirmation theory, which states that satisfaction is related to the size and direction of
the disconfirmation experience that occurs as a result of comparing service quality
performance against customer expectation. The expectancy/disconfirmation paradigm
provides the theoretical basis for the link between quality and satisfaction (Yi, 1990). Many
empirical studies support this model for identifying the causal link between service quality
and satisfaction (Anderson and Sullivan, 1993; Cronin and Taylor, 1992; Anderson et al.,
1994). In this regard, the current study was anchored on the expectancy disconfirmation
theory which provides the theoretical grounding for the study. In the current study, the
theory is deemed appropriate as it provides a theoretical link between the study variables.
Specifically, the two main research variables namely: service quality and customer

18
satisfaction were drawn from the expectancy disconfirmation theory. According to the
theory, satisfaction is the direct consequence of service quality. Furthermore, researchers
have argued that customer satisfaction has a potential to impact either directly or indirectly
the business performance especially on profitability. Luo and Homburg (2007) suggest that
customer satisfaction can positively affect a firm’s profitability. Besides, other researchers
like Chi and Qu (2008) have concluded that customer satisfaction increases customer
loyalty repurchase intention and enhance brand popularity through the positive word-of–
mouth. Customer satisfaction model stipulates that satisfaction is influenced by service
quality. That is to say, higher satisfaction results from customers getting expected service
quality (Hutchinson et al., 2009). Perceived service quality is a reflection of the differences
between the customer’s expectations and a product’s real performance. The main elements
of this theory are discussed below.
2.1.4 The Concepts of Service Quality, Customer satisfaction, Service Failure and
Customer Communication
2.1.4.1 The Concept of Service Quality
Service quality is the extent to which a firm successfully serves the purpose of the customer
(Zeithaml, Parasuraman and Berry, 1990). The sum total of customers’ expectations, service
delivery process and service outcome will have an influence on service quality. Moreover,
Edvardsson (2005) note that service quality perception is formed in the process of
production, delivery and service consumption. Furthermore, prior experience with a
particular service will largely influence the extent of their customer perceptions of service
quality (O’Neill and Palmer, 2003). In a highly competitive market, service quality becomes
a very critical success factor for gaining a sustainable competitive advantage in the
marketplace which will then translate into customer satisfaction. There is need therefore for
a paradigm shift by service managers and academicians in order to understand how clients
perceive the quality of services. In the mobile phone service sector, service quality implies
network quality which includes voice reproduction, indoor and outdoor coverage,
smoothness of connectivity along with effective delivery of other value added services
(Gerpott et al, 2001). However, in order to appreciate effectively the concept of service
quality, the study adopted the SERVQUAL model to aid in conceptualizing and
operationalizing service quality as one of the main variables of the study.

19
The SERVQUAL model has five dimensions of service quality across a variety of services
include: tangibles, reliability, responsiveness, assurance and empathy (Parasuraman et al.,
1991, Carman 1990, Crompton and Mackay, 1989). Tangibles relate to the physical
evidences of service such as facilities, tools and appearance of the personnel; reliability is
concerned with the consistency of performance and dependability; responsiveness deals
with the willingness of employees/staff to deliver services; assurance covers issues relating
to the courtesy of staff and their ability to inspire trust and confidence. Finally, empathy
relates to the personalized contact that a firm gives to its customers.
Several studies show that SERVQUAL model is a tool popularly used for measuring service
quality dimensions in many service industries (Parasuraman, Berry and Zeithaml, 1985).
However, Buttle (1996) notes that the conceptualization, dimensionality, operationalization,
measurement and applications of the SERVQUAL model have been subject of much
criticism. On one hand, Sureshchandar et al. (2002) observe that there is a general
agreement that the 22 items scale of the SERVQUAL model are reasonably good predictors
of service quality in its wholeness. Further, similar sentiments were put forward by Bitner
and Hubert (1994) who suggested that the SERVQUAL items of Parasuraman et al., (1988),
when measured at the level of the firm’s services, appears to be good predictors of service
quality. It is recognized as a principal instrument in the services marketing literature for
assessing quality (Parasuraman et al., 1991; Gantasala and Padmakumar, 2013).
This fact notwithstanding, a good number of prior studies (Nimako et al, 2010; Uddin and
Bilkis; 2012; Agbor, 2011; Lai et al., 2009; Wu and Lang, 2009; Kuo et al., 2009; Baker,
2000), have used different scales to measure service quality leading to poor
conceptualization of the study constructs and generation of paradoxical research findings.
This suggests absence of accepted measurement scale for measuring service quality in the
context of mobile phone sector. Consequently, the status of service quality practices and its
consequences on satisfaction levels of mobile phone subscribers in Kenya is not known.
2.1.4.2 The Concept of Customer Satisfaction
Customer satisfaction refers to a post consumption evaluative judgment concerning a
specific product or service (Gundersen, Heide and Olsson, 1996). The customer contrasts
pre-purchase expectations with the perceptions of performance during and after the
consumption experience (Oliver, 1980). Despite customer satisfaction being a popular
subject of great interest among marketing practitioners and academic researchers, there still

20
does not appear to be a consensus regarding its role (Giese and Cole, 2000) and this has
remained a critical gap in knowledge even in terms of designing appropriate service quality
standards.
Customer’s satisfaction levels can be best understood by analyzing the expectancy
disconfirmation theory that seeks to explain how a customer compares the expected and
perceived performance of service quality to arrive to a state of satisfaction and
dissatisfaction. In the current study, the following dimensions of customer satisfaction were
explored: Intention to purchase, loyalty, overall satisfaction and affective and cognitive
elements. Customer satisfaction status with regard to mobile service quality worldwide is
varied. In Europe for instance, customer satisfaction levels with regard to service quality
provided by mobile phones firms are inconsistent (Oracle white paper, 2011). In Africa and
in particular in Ghana’s mobile Network, customer satisfaction level was reported to be
moderately low at 43.5% (Nimako et al., 2012). In Kenya, however, customer satisfaction
levels with respect to Kenya’s mobile services remains unknown due to scanty
documentation.
2.1.4.3 The Concept of Service Failure
According to Walfried et al. (2000), service failure refers to the occurrence of unsatisfactory
service encounters. Walfried et al. (2000) further suggested that service failure have a
potential to moderate the service quality/customer satisfaction relationship. Zeithaml et al.
(1990) on the other hand proposes that service failure potentially has immense impact on
consumers especially in their “switching behaviour”. Roos (1999) states that service failure
is one “pushing determinate” that drives customer switching behaviour and that successful
service recovery can mean the difference between customer retention and defection.
According to Stauss and Friege (1999), customer retention is critical to a company as it
boost the profitability. However, due to unique nature of services (specifically,
inseparability and variability), it is impossible to eliminate service failure or to ensure 100%
error-free services.
Christine and Klaus (2003) noted that not all consumers will be satisfied and few
organizations can guarantee to deliver “zero defects” service every time. Service failure and
customer dissatisfaction may be inevitable. Mobile phone services are technology-based
services with heavy dependence on machines for delivery and maintenance of services. It is
therefore likely to have high potential of service failure due to factors that are largely

21
outside the individual organization’s control such as poor weather (Christine and Klaus,
2003). Mc Collough et al. (2000) noted that service failure and recovery is a critical issues
for both service managers and researcher. In line with Bitner et al. (1990), service failure
classification model, service failure was operationalized by delivery failures, response
failure and unprompted/unsolicited employee actions. However, until recently, research on
the nature and the effect of service failure on the customer satisfaction has been limited.
Therefore, service failure has been identified as a neglected area requiring additional
research (Andreassen, 1999; Tax, Brown and Chandrashekaran, 1998). As a result,
following limited attention given to both service failure and recovery, the information about
how customers evaluate service failure, and the potential effects that it has on customer
satisfaction is not known. Despite service failure being seen as a significant variable in
theoretical literature (Mc Collough et al., 2000; Christine and Klaus, 2003), it is nonetheless
yet to be formally tested empirically to establish its moderating effects on the service
quality/ satisfaction relationship especially in the context of low contact service settings
such as the mobile phone sector.
2.1.4.4 The Concept of Customer communication
Walfried et al. (2000) postulated that the ability of a customer to communicate freely and
easily with the service firm will moderate the quality/satisfaction relationship. This is
further supported by Mohr’s and Nevin’s (1990) theoretical model which suggests that
communication, among other things, serves to moderate the effects of circumstance and
conditions in the service exchange process. Moreover, Zeithaml et al. (1990) perceive that
communication can play a critical role in the service delivery process by eliminating
ignorance regarding customers’ expectation by service firms. In the study, customer
communication is operationalized by complaints, suggestions, compliments and
abandonment of usage.
Despite advances in the theoretical literature (Zeithaml et al., 1990; Mohr and Nevin, 1990)
that customer communication can moderate the quality/satisfaction relationship, there is no
known attempt to empirically establish the moderating role of customer communication on
the relationship between service quality and customer satisfaction. This is particularly so
especially in the context of low contact service settings such as the case of mobile phone
services. This fact was further acknowledged by Gantasala and Padmakumar (2013) who
noted that the level of communication has not been tested in terms of its moderating effect

22
on the service quality-satisfaction relationship. Consequently, the status and likely effect of
customer communication on quality-satisfaction relationship is not known.
2.1.4.5 The Concept of Moderation in Relationship
Cohen et al. (2003) observed that in statistics and regression analysis, moderation occurs
when the relationship between two variables depends on a third variable. The third variable
is referred to as the moderator variable or simply the moderator. The effect of a moderating
variable is characterized statistically as an interaction (Cohen et al., 2003) that is, a
qualitative (e.g., sex, race, class) or quantitative (e.g., level of reward) variable that affects
the direction and/or strength of the relation between dependent and independent variables.
Specifically within a correlational analysis framework, a moderator is a third variable that
affects the zero-order correlation between two other variables, or the value of the slope of
the dependent variable on the independent variable (Baron & Kenny, 1986).
Cohen et al. (2003) underscored the importance of moderators or interaction research by
stating that the testing of the interaction is at the heart of theory testing in social science.
The aim of a moderator investigation is to uncover the hidden effect or nature of
relationships in behavioral sciences inquiry. Service failure and customer communication
are hypothesized to be potential moderators in the relationship between service quality and
customer communication. A service failure variable and a customer communication
variable are proposed because the literature on service marketing suggests that they are a
sets of plausible moderators of quality/satisfaction relationship for services (Walfried et al.,
2000). This fact notwithstanding, empirically limited effort was put forward to establish
their moderating roles especially in the context of low contact service setting. Therefore, the
status and moderating role of the two suggested moderator variables in the
quality/satisfaction relationship is not known.
2.2 Empirical Studies on Service Quality, Customer Satisfaction, Service Failure and
Customer Communication
2.2.1 Empirical Studies on Service Quality and Customer Satisfaction
There are empirical evidences suggesting that the five dimensions of service quality
namely: tangibility, reliability, assurance, empathy and responsiveness are associated with
high level of customer satisfaction. However, other studies indicate a negative and weak
relationship between service quality and customer satisfaction. The empirical work on the

23
interrelationship between service quality and customer satisfaction are summarized
subsequently.
Uddin and Bilkis (2012) conducted a study that sought to explore customer satisfaction and
its influencing factors in the mobile phone operation industry in Bangladesh. In their study,
data were collected through a questionnaire in a survey research design and analyzed using
factor analysis with Principle Component Analysis (PCA) and Structural Equation
Modeling (SEM). The empirical result of this study showed that service quality and fair
price have indirect influence on customer satisfaction of mass service industries such as the
mobile phone operators. Furthermore, fair price showed weak but positive impact on
customer satisfaction (r = 0.136, p<0.05) at 95% confidence level. However, the study
found a weak but significant direct impact of service quality on customer satisfaction (r =
0.016, p< 0.01). This study concluded that service quality is not a significant predictor of
customer satisfaction in the context of mobile phone operation industry in Bangladesh. The
study, however, did not isolate and assess the role of service quality in customer satisfaction
but considered multiple factors that affect satisfaction level of customers in the mobile
phone sector. Furthermore, the finding suffers from weakness due to the problem of data co-
linearity.
Nimako et al. (2010) sought to analyze overall customer satisfaction with the service quality
delivered by mobile telecommunication networks (MTNs) in Ghana. In order to achieve this
objective, the authors conducted a cross-sectional survey using structured questionnaires
personally administered to over 1000 subscribers selected from four mobile telecom
networks in 2008. However, the findings indicated that irrespective of the mobile telecom
network in Ghana, customer satisfaction was low; neither equal to nor better than the
desires and expectations of customers. Specifically, the result indicated a customer
satisfaction index of 48.3 % which could be described as considerably low because it fell
below the satisfactory index of 50%. Therefore, the study concluded that service quality has
a weak but significant effect on customer satisfaction in the context of mobile
telecommunication networks (MTNs) in Ghana. The study depicted weak explanatory
power of service quality as a predictor of customer satisfaction but failed to unearth the
underlying reasons for the same. Moreover, service quality was measured using a different
scale other than widely accepted SERVQUAL scale. Consequently, this result further
intensified the ongoing debate by scholars and researchers on the paradoxical nature of the

24
relationship between service quality and customer satisfaction leaving research in this field
still inconclusive.
Agbor (2011) reports a study aimed at examining the relationship between customer
satisfaction and service quality in three service sectors. To achieve this objective, Agbor
(2011) study used convenient sampling technique to collect quantitative data from a sample
of 220 customers of Umea University (100), ICA (60) and Forex Bank (60). Data were
analyzed using Chi-square to test the hypotheses separately and in a group. The study
yielded one of the most interesting but controversial results. Specifically, it showed a
distinct result for the relationship between service quality and customer satisfaction in three
of service settings. For instance, in the case of ICA and Forex, there was a significant
relationship between service quality and customer satisfaction. However in the case of
Umea University, there was no significant relationship between service quality and
customer satisfaction. The study found that service quality is not the only factor that could
lead to customer satisfaction in the different service sectors but failed to reveal other latent
variables that could amplify or strengthen this weak link between service quality and
customer satisfaction. Moreover, the three service settings namely: University, ICA and
Forex bank all depict high contact service setting where client expectations and service
standards are all expected to be high. Consequently, the study did not focus on low contact
service setting. In addition, the views of internal customers (employers) were not factored in
the analysis of data.
Abdullah and Rozario (2009) conducted a survey that sought to identify attributes that
influence customer satisfaction in hotels in Kuala Lumpur in Malaysia. In particular, the
study analyzed three variables i.e. ambience/place, service quality and food quality as
independent variables and customer satisfaction as the dependent variable. In their study, a
survey questionnaire was administered to 149 sample respondents from one of the well-
known hotels in Kuala Lumpur, Malaysia. The findings of this study showed that there was
a positive significant relationship between place/ambience(r=0.563, p =0.000) and service
quality (r=0.544, P=0.000) with customer satisfaction but the relationship between food
quality and customer satisfaction was significant but was in the negative direction (r= -
0.268, P=0.001). The study concluded that the impact of quality on satisfaction is varied
across different measures of service quality in hospitality industry. However, since the study
focused on the hospitality sector which is a high contact service setting, the results may not
relate well to other service setting particularly low contact service setting like in the case of

25
mobile phone sector. Moreover, the study failed to isolate and assess the role of service
quality in customer satisfaction but instead examined multiple factors that affect satisfaction
level of customers in hospitality sector.
In yet another related study, Suleiman (2013) report a study that sought to identify the
impact of the basic dimensions of the SERVQUAL model on the level of customer
satisfaction in dealing with the housing bank in Karak, Jordan. Using a simple random
sample of 375 questionnaires, data was collected and analyzed. A review of the statistical
analysis revealed that tangible dimension has interpreted (47.8%) of the variation in
customer satisfaction; reliability dimension has interpreted (55.7%); responsiveness
(43.7%); assurance dimension (51.3%); and empathy dimension affects the level of
customer satisfaction by 68.3%. The study concluded that all the five dimensions of service
quality influenced customer satisfaction positively. The study established that all the five
dimensions of service quality were significant predictors of customer satisfaction. Even
though, Suleiman (2013) study focused on the individual dimensions of service quality
separately and the resulting effects of the same on customer satisfaction. It did not,
however, analyze the impact that the various contingencies might have on the already
established quality-satisfaction relationship. In addition, the banking service sector depicts
different service settings from the mobile phone sector hence the result cannot be
adequately generalized to all service sector which includes mobile phones service sector.
Wang and Shieh (2006) conducted a study that sought to investigate the relationship
between service quality and customer satisfaction in Chang Jung Christian University
library in Taiwan. A questionnaire survey was conducted to reveal users’ perspective on
service quality. A valid sample of 55 respondents was studied. The result indicated that
there was a significant positive relationship between service quality and user satisfaction
(R2 =0.410, p=0.000) indicating further that it was statistically significant. Further, the
finding indicated that all dimensions other than “responsiveness” had significantly positive
impacts on user satisfaction. Specifically, tangibles (R2=0.446 P=0.000), Responsiveness
(R2= 0.033, p=0.186), Reliability (R2=0.409, p=0.000), Assurance (R2=0.183, p=0.001) and
empathy (R2=0.377, p=0.000). The study therefore concluded that service quality was
positively related to customer satisfaction in the context of university library services in
Taiwan. The study, however, used a small sample size making the result unfit for
generalization to other service setting. Furthermore, the views of internal customers were

26
ignored thereby making it difficult to accurately establish if there was a relationship
between the user’s expected service quality and managers’ perceived service quality.
Walfried et al. (2000) conducted an exploratory study that utilized a sample of international
private banking customers in United State of America. The aim of the study was to examine
the effect of service quality on customer satisfaction. In order to measure service quality,
they used SERVPERF model instead of the widely accepted and well-known measure of
service quality, SERVQUAL. This study used ordinary least square (OLS) regression to test
six models of customer service quality. The findings of the study indicate that service
quality yields a significant influence on customer satisfaction in the banking industry (r =
0.74, P < 0.05). However, the study ignored the use of empathy dimension of SERVQUAL
model but only dwelt on the functional dimension of quality thereby limiting the scope of
conceptualizing study variables. Omission of the empathy dimension from Walfried et al.
(2000) study has made the finding involving empathy factors of the SERVQUAL model
less clear. Further, their finding only sheds light on aspects of the quality and satisfaction
relationship as it operates in a high end and high contact service such as banking services
but not in low contact service settings such as mobile network services.
Mohammad and Alhamadani (2011) reported a study that examined the level of service
quality as perceived by customers of commercial bank working in Jordan and its resulting
effect on customer satisfaction. The study utilized SERVQUAL scale to measure service
quality. Data were collected by using 260 questionnaires which were distributed randomly
to customers of commercial banks in Jordan. Data were analyzed using multiple regression
techniques to test the impact of service quality and customer satisfaction. The result
indicated that service quality (R2 =0.261, p<0.05) is an antecedent of customer satisfaction.
Namanda (2013) conducted a study that sought to establish the relationship between service
quality and customer satisfaction in ABC Bank in Uganda. Data were collected using closed
ended self-administered questionnaires in a case study research design. The study was
conducted on 80 respondents from ABC bank main branch who are selected using
convenient sampling techniques. Data was analyzed using correlation analysis. The findings
revealed that there was a significant positive correlation between service quality and
customer satisfaction (r =0.830, p<0.05).The study concluded that service quality, a part
from dimension like responsiveness and courtesy, improves customer satisfaction; reduce
customer churn leading to organizational stability. However, since the study (Namanda,

27
2013) focused on banking sector, which is regarded as high contact service setting, it failed
to shed light on aspects of low contact services as in the case of mobile phone services.
Moreover, the use of a small sample size of 80 respondents and convenient sampling
techniques also makes the results not generalizable to other contexts of service settings.
Auka (2012) sought to examine the extent to which service quality, perceived value and
customer satisfaction influence customer loyalty in commercial banks in Nakuru
Municipality in Kenya. To actualize this objective, a simple randomized ex-post facto
design was adopted to investigate and analyze the research problem. A stratified random
sampling technique was used to obtain a sample of 384 from a population of 48,000
customers of commercial banks in Nakuru. Data were analyzed through Pearson correlation
and regression analysis. The findings revealed that there was positive and significant
relationship between service quality and customer loyalty (R2 =0.198, p<0.05); Customer
satisfaction and customer loyalty (R2 =0.236, p<0.05) and perceived value and customer
loyalty (R2 =0.156, p<0.05). Overall, the regression results revealed that the three variables
of service quality, customer value and customer satisfaction explain only 27.1% (R2 =0.271,
p<0.05) of the factors that influence customer loyalty in banking. The study concluded that
service quality, customer value and satisfaction are critical success factor that influence
firm’s competitiveness of the organization. However, the study did not establish the direct
link between service quality and customer satisfaction but instead focused on the influence
that multiple factors had customer loyalty in banking sector.
Another empirical analysis on the relationship between service quality and customer
satisfaction in Certified Public Accountant Training Institutions (CPATIs) in Kenya was
provided by (Kimani, 2014). Based on a descriptive survey design, samples of 500
respondents were drawn using stratified sampling techniques from a population of 5000
students registered with KASNEB. The study revealed that 76.3% (R2 =0.763, p<0.05) of
customer’s satisfaction in CPATIs is explained by the five dimensions of the SERVQUAL
model. The study concluded that service quality dimensions differ in importance to
customers thereby influencing customers’ satisfaction differently. However, since learning
services offered by CPATIs are in high contact service setting. The study by Kimani (2014)
did not shed light on the aspects of service quality perspectives in the context of low contact
service setting as in the case of mobile phone sector in Kenya.

28
In Kenya’s Aviation sector, Nyaoga et al. (2013) conducted a study that explored the key
determinants of customer satisfaction for passengers at Kenya Airways. The study adopted
a case study approach to obtain information on key determinants of customer satisfaction
for passengers at Kenya Airways. A sample of 100 passengers who used Kenya Airways
services for a period of six month between Jan-June, 2012 were used. Self-administered
questionnaires were administered to collect primary data. The data collected was analyzed
into of means, frequencies and percentages. The finding of the study indicate that among the
key determinants of customer satisfaction are: language security and safety, proper
communication with customer, provision of food variety, compassion by airline crew. This
study concluded that there is a relationship between service quality and customer
satisfaction in air transport and other related sector. However, the study used descriptive
statistics in its analysis which are not appropriate approaches of establishing cause and
effect relationships. Moreover, air transport sector is regarded as high contact service whose
setting does not relate to a low contact service as is the case with the mobile phone sector.
Odhiambo (2015) completed a study that sought to determine the effect of service quality
on customer satisfaction at Kenya Commercial Bank. Specifically, the study established the
effect of reliability, responsiveness and empathy dimension of service quality on customer
satisfaction. Using a descriptive survey design, the study collected a sample of 100 KCB
customers from a population of 400,000 customers based in Nairobi’s CBD area. The
sample size was arrived at using a systematic sampling technique and data collected using a
structured questionnaires administered to respondents. Data were analyzed using descriptive
statistics such as mean, frequency, standard deviation and inferential statistics like
correlations and regression analysis were also used. The multiple regression analysis results
showed that 80.1% (R2 =0.801, p<0.05) of variation in customer satisfaction is influenced
by responsiveness, reliability and empathy. The study concluded that in banking services,
only three out of five dimensions of service quality namely: responsiveness, reliability and
empathy are critical antecedents of customer satisfaction. However, Odhiambo (2015)
overlooked two other aspect of service quality: assurance and tangibles hence making these
two aspects of service quality and their likely effect on satisfaction levels of customers
unclear. In addition, the small sized sample reduced reliability of results especially in terms
of drawing inferences.
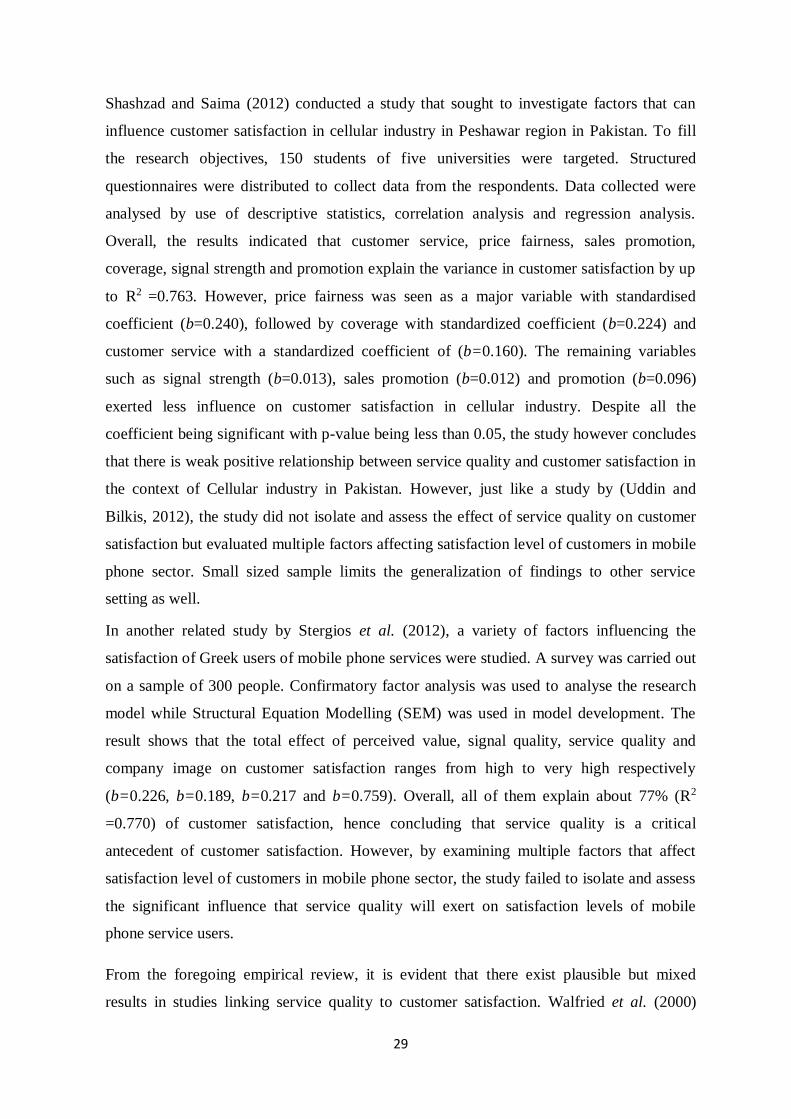
29
Shashzad and Saima (2012) conducted a study that sought to investigate factors that can
influence customer satisfaction in cellular industry in Peshawar region in Pakistan. To fill
the research objectives, 150 students of five universities were targeted. Structured
questionnaires were distributed to collect data from the respondents. Data collected were
analysed by use of descriptive statistics, correlation analysis and regression analysis.
Overall, the results indicated that customer service, price fairness, sales promotion,
coverage, signal strength and promotion explain the variance in customer satisfaction by up
to R2 =0.763. However, price fairness was seen as a major variable with standardised
coefficient (b=0.240), followed by coverage with standardized coefficient (b=0.224) and
customer service with a standardized coefficient of (b=0.160). The remaining variables
such as signal strength (b=0.013), sales promotion (b=0.012) and promotion (b=0.096)
exerted less influence on customer satisfaction in cellular industry. Despite all the
coefficient being significant with p-value being less than 0.05, the study however concludes
that there is weak positive relationship between service quality and customer satisfaction in
the context of Cellular industry in Pakistan. However, just like a study by (Uddin and
Bilkis, 2012), the study did not isolate and assess the effect of service quality on customer
satisfaction but evaluated multiple factors affecting satisfaction level of customers in mobile
phone sector. Small sized sample limits the generalization of findings to other service
setting as well.
In another related study by Stergios et al. (2012), a variety of factors influencing the
satisfaction of Greek users of mobile phone services were studied. A survey was carried out
on a sample of 300 people. Confirmatory factor analysis was used to analyse the research
model while Structural Equation Modelling (SEM) was used in model development. The
result shows that the total effect of perceived value, signal quality, service quality and
company image on customer satisfaction ranges from high to very high respectively
(b=0.226, b=0.189, b=0.217 and b=0.759). Overall, all of them explain about 77% (R2
=0.770) of customer satisfaction, hence concluding that service quality is a critical
antecedent of customer satisfaction. However, by examining multiple factors that affect
satisfaction level of customers in mobile phone sector, the study failed to isolate and assess
the significant influence that service quality will exert on satisfaction levels of mobile
phone service users.
From the foregoing empirical review, it is evident that there exist plausible but mixed
results in studies linking service quality to customer satisfaction. Walfried et al. (2000)

30
studied the effect of service quality on customer satisfaction and found that service quality
exerts significant influence in customer satisfaction. Similarly, studies (Namanda, 2013) in
the banking sector have compared favourable with the findings of Walfried et.al. (2000). On
the contrary, Agbor (2011) study in Umea University found that there was no significant
relationship between service quality and customer satisfaction and thus conflicting with the
findings of Namanda (2013). In Kenya’s banking sector, both Odhiambo (2015) and Auka
(2012) conducted studies and found that service quality is a critical determinant of customer
satisfaction. However, they differed in their focus of their respective studies in that, whereas
Odhiambo (2015) analyzed service quality along its five dimensions, Auka (2012) on the
other hand, focused on how multiple factors, one of which was service quality, influence a
firm’s competiveness. Elsewhere, Nimako et al. (2010) concluded that service quality has a
weak but significant effect on customer satisfaction in mobile telecommunication networks
in Ghana. In contrast, Wang and Shieh (2006) differed with Nimako et al. (2010) in the
direction of results since Wang and Shieh (2006) established that service quality had
significantly positive effect on customer satisfaction in University Library service in
Taiwan. Nyaoga et al. (2013) found that there is a direct relationship between service
quality and customer satisfaction in air transport in Kenya. In contrast, Uddin and Bilkis
(2012) differed with Nyaoga et al. (2013) in that service quality and fair price have an
indirect influence on customer satisfaction of mass service industries like mobile phone
operators.
Furthermore, the above reviewed studies are not without limitations. For instance, the
studies (Wang and Shieh, 2006; Shashzad and Saima, 2012; Abdullah and Rozario, 2009)
used small sample sizes while Agbor (2011) utilized convenience sampling technique
thereby rendering their results unfit for generalization. Odhiambo (2015) overlooked two
aspects of service quality: assurance and tangibles hence making these two aspects of
service quality and their likely effect on satisfaction levels of customers unclear. In
addition, the small sized sample reduces reliability of results especially in terms of drawing
inferences. Other studies like Namanda (2013) ignored two importance dimensions of
service quality namely: responsiveness and assurances in its analysis hence posing a
limitation. Even though Nimako et al. (2000) studied the effect of service quality on
customers’ satisfaction in Ghana’s Mobile Network, they omitted the use of SERVQUAL
scale thereby limiting the conceptualization and dimensionality of the study. In addition,
Auka (2012) did not establish the direct link between service quality and customer

31
satisfaction but instead focused on the influence that multiple factors had customer loyalty
in banking sector. On the other hand, Suleiman (2013) focused only on the individual
dimensions of service quality separately and their resulting effects on customer satisfaction
in banking service sector which depicts different service setting from that of mobile phone
sector. Therefore the findings cannot be generalized. Finally, Nyaoga et al. (2013) used
descriptive statistics in their analysis which are regarded as a less preferred approach to
establish cause and effect relationship. Uddin and Bilkis (2012) did not isolate and assess
the role of service quality in customer satisfaction and instead focused on multiple factors
affecting satisfaction level of customers in mobile phone sector thus becoming a limitation.
Furthermore, their findings are weak due to the problem of multicollinearity as the variables
were highly correlated with each other.
In Kenya, most studies (Auka, 2012; Nyaoga et al., 2013; Odhiambo, 2015; Kimani, 2014)
relating service quality to customer satisfaction have only focused on sectors like banking,
aviation and tertiary learning institutions which are regarded as high contact service setting
with intense client-service provider interaction. Their limitations notwithstanding, none of
the above reviewed studies analyzed the effect of service quality practices on satisfaction of
mobile phone service users, as a low contact services which is highly integrated with a
technology. Consequently, the status of service quality practices and its consequences on
satisfaction levels of mobile phone subscribers in Kenya is not known.
2.2.2 Empirical Studies on Service Failure, Service quality and customer satisfaction
Mc Collough et al., (2000) conducted two studies using scenario-based experiments to
reveal the impact of failure expectations, recovering expectation, recovery performance and
justice on customers’ post recovering satisfaction. By using a control condition of non-
service failure, the research evaluated the service recovery paradox. The study found that
the mean satisfaction ratings of participants who experienced service failure as greater than
those who did not experience service failure. This is so because, no recovery effort can
completely mitigate the harm caused by the service. In addition, the customer satisfaction
level was found to be lower after service failure and recovery (even given high recovery
performance) than in the case of error-free service. Mc Collough et al., (2000)
recommended that companies should strive to avoid service failure than to respond to it
through service recovery effort. However, this study did not highlight the moderating role

32
of service failure in quality-satisfaction relationship and, in particular, in the context of the
mobile phone sector.
Another study that sought to introduce the possible role of a moderator in the relationship
between service quality and customer satisfaction was that of Caruana et al., (2000). In
order to explore the moderating role of value on the relationship between service quality
and satisfaction, a survey of 80 customers of an audit firm through personal interview were
conducted over a period of four weeks. A moderated regression analysis that seeks to
determine the change in R2 was used. The result indicated that when the dependent variable
(satisfaction) is regressed on service quality (independent variable), the result provided a
significant R2 of 0.51. When a moderator variable was introduced, the R2 increased from
0.53 to 0.60 (P<0.05) and was deemed statistically significant. However, the beta
coefficient for the moderating effect was negative thereby showing a small negative effect
on the overall level of satisfaction. However, the library services are high customer contact
services therefore the results may not be relevant for lower contact cases like mobile phone
service. Besides, the problems of multicollinearity and the use of a small sample size of
only 80 respondents makes generalization of their results difficult.
Reimann, Lunemann and Chase (2008) tested the moderation effects of uncertainty
avoidance on the relationship between perceived service quality and customer satisfaction.
The study addressed the issue of cultural differences among 303 Spanish, German and
Swedish business-to-business customers. The study revealed that clients from a culture of a
high degree of uncertainty avoidance were less satisfied than low-uncertainty avoidance
clients when, as a result of a service defect, their service expectations were not met. The
central finding for Reimann et al. (2008) is that the degree of uncertainty avoidance as a
cultural variable has a significant moderating influence on the perceived service quality-
customer satisfaction relationship. This study is, however, not focused on the final
consumer but rather on institutional buyers.
Based on the data from China’s mobile telecommunication market, Wang, Lo and Yang,
(2004) investigated moderating effect of customer value on the relationship between
perceived quality and customer satisfaction. Face-to- face customer survey was conducted
to collect data from consumers of China Mobile and China Unicom, the duopoly companies
in China that compete with each other in the mobile communication market. The results,
based on the development of structural equation models using partial least square
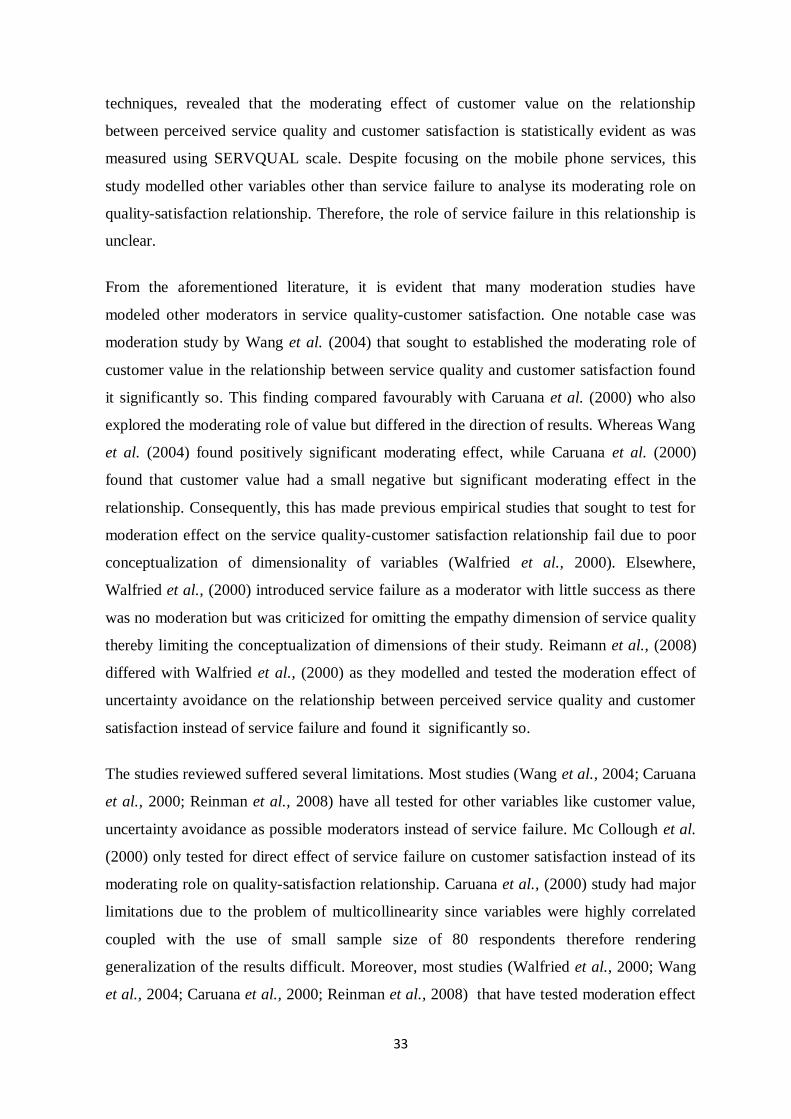
33
techniques, revealed that the moderating effect of customer value on the relationship
between perceived service quality and customer satisfaction is statistically evident as was
measured using SERVQUAL scale. Despite focusing on the mobile phone services, this
study modelled other variables other than service failure to analyse its moderating role on
quality-satisfaction relationship. Therefore, the role of service failure in this relationship is
unclear.
From the aforementioned literature, it is evident that many moderation studies have
modeled other moderators in service quality-customer satisfaction. One notable case was
moderation study by Wang et al. (2004) that sought to established the moderating role of
customer value in the relationship between service quality and customer satisfaction found
it significantly so. This finding compared favourably with Caruana et al. (2000) who also
explored the moderating role of value but differed in the direction of results. Whereas Wang
et al. (2004) found positively significant moderating effect, while Caruana et al. (2000)
found that customer value had a small negative but significant moderating effect in the
relationship. Consequently, this has made previous empirical studies that sought to test for
moderation effect on the service quality-customer satisfaction relationship fail due to poor
conceptualization of dimensionality of variables (Walfried et al., 2000). Elsewhere,
Walfried et al., (2000) introduced service failure as a moderator with little success as there
was no moderation but was criticized for omitting the empathy dimension of service quality
thereby limiting the conceptualization of dimensions of their study. Reimann et al., (2008)
differed with Walfried et al., (2000) as they modelled and tested the moderation effect of
uncertainty avoidance on the relationship between perceived service quality and customer
satisfaction instead of service failure and found it significantly so.
The studies reviewed suffered several limitations. Most studies (Wang et al., 2004; Caruana
et al., 2000; Reinman et al., 2008) have all tested for other variables like customer value,
uncertainty avoidance as possible moderators instead of service failure. Mc Collough et al.
(2000) only tested for direct effect of service failure on customer satisfaction instead of its
moderating role on quality-satisfaction relationship. Caruana et al., (2000) study had major
limitations due to the problem of multicollinearity since variables were highly correlated
coupled with the use of small sample size of 80 respondents therefore rendering
generalization of the results difficult. Moreover, most studies (Walfried et al., 2000; Wang
et al., 2004; Caruana et al., 2000; Reinman et al., 2008) that have tested moderation effect

34
have focused in other sectors like banking services, audit services which is high end and
high contact services with high service standards and high customer expectations. Their
analyses have excluded the mobile phone sector in developing country like Kenya.
Therefore, the moderating role of service failure in a quality/satisfaction model with regard
to low contact services such as mobile phone services has not been formally explored.
Consequently, the status of service failure and its influence on quality/satisfaction model in
low contact services, particularly in Kenya’s mobile service industry is not known.
2.2.3 Empirical Studies on Service Quality, Customer Communication and Customer
Satisfaction
Gantasala and Padmakumar (2013) examined the effect of service quality on customer
satisfaction after the privatization of a Telecom company in Oman using two
methodological perspectives. Service quality was measured using SERVQUAL model.
Gantasala and Padmakumar (2013) proposed communication as a suitable mediator of the
relationship between quality and satisfaction. A random sampling method was used and out
of 572 customers who were given questionnaires, 369 responded (64.5% response rate). The
result shows that service quality has a direct effect on customer satisfaction but indirect
effect on communication. The R2 =0.93 for customer satisfaction. The standardized
coefficient from service quality to customer satisfaction is 0.69 while that from
communication to customer satisfaction is 0.88. This clearly indicates the proposed path
between service quality, communication and customer satisfaction. However, the study was
criticized for ignoring the important facet of SERVQUAL which includes employee
perspectives. Besides, the study modelled communication as a mediator and not a
moderating variable.
Juaid et al. (2012) did a study to examine the direct effects of staff conduct, communication,
access to service and credibility on satisfaction towards telecommunication services in
Malaysia. The study focused on 100 university lecturers to see whether they were happy
with the services provided by the telecommunication firms. Data analysis was performed
using structural equation modelling (SEM). Significantly, the results revealed that the
relationship between communication and customer satisfaction (β= - 0.289, p-value= 0.415)
are found to be insignificant. The study concludes that communication influences
satisfaction negatively though insignificant. Despite focusing on telecommunication
services and establishing a direct link between communication and customer satisfaction,

35
the study did not establish the moderating role of communication on the quality-satisfaction
relationship.
In an attempt to determine factors affecting customer satisfaction in outsourcing IT services
in University of Isfahan in Iran, Rezaie and Forghani (2011) carried out quantitative
research to comprehensively evaluate these factors. The survey targeted 252 users of IT
services in Isfahan University. A seven factor framework of customer satisfaction analysed
include: responsiveness, reliability, communication, service attitudes, empathy, quality of
information and ethics. Analysis showed that among other factors, communication (β =
0.259, p < 0.001) plays a vital role in explaining variation in customer satisfaction among IT
service users. A recommendation was further made to improve quality of communication so
as to enhance satisfaction levels. Even though this study revealed a direct effect of
communication on customer satisfaction, there are no known attempts to empirically
establish its moderating role in on the relationship between service quality and customer
satisfaction.
From the aforementioned studies, researches on the role of communication as a moderator
in the relationship between service quality and customer satisfaction are indeed limited.
Empirical evidence by Juaid et al. (2012) only tested for direct effect of communication on
customer. Similarly, Rezaie and Forghani (2011) also tested direct effect of communication
on customer but differed with Juaid et al. (2012) in the direction of effects. Whereas Juaid
et al. (2012) found that communication has exerted negative insignificant direct effect on
customer satisfaction, Rezaie and Forghani (2011) found out that among other factors,
communication plays a vital role in explaining variation in customer satisfaction among IT
service users. Despite Juaid et al. (2012) focusing on telecommunication services, their
study did not establish the moderating role of communication on the quality-satisfaction
relationship. Elsewhere, Gantasala and Padmakumar (2013) modelled and tested the
mediating effects of customer communication on the relationship between service quality
and customer satisfaction. The studies by Gantasala and Padmakumar (2013) and Junaid et
al. (2012) were similar in terms of the context as both were done in telecommunication
sector in Asian market but differed in terms of focus of their studies. Whereas Junaid et al.
(2012) tested for the direct effect of communication on customer satisfaction and confirmed
its significance, Gantasala and Padmakumar (2013) on the other hand tested for the its
mediating role and found it significantly so.

36
In addition, most studies reviewed (Juaid et al., 2012; Rezaie and Forghani, 2011; Gantasala
and Padmakumar, 2013) did not shade light on the likely effect of communication as a
moderator variable on quality-satisfaction relationship as some only tested direct effect
while others tested mediating effects. Furthermore, these studies, as reviewed, were
conducted in the context of developed countries hence missing the analysis of Kenya’s
mobile phone context. This is despite the fact that Kenya’s mobile sector is currently
experiencing many challenges like low access to telecommunication infrastructure, high
operation and regulation costs and stiff competition that has forced small operators like
Essar Yu to quit the sector and put off many potential developers of mobile services.
Theoretically, customer communication is seen as a sound moderator but empirically, there
was no known attempt to establish the moderating role of customer communication on the
relationship between service quality and customer satisfaction. As such, the status and the
likely effect of customer communication on quality-satisfaction relationship in Kenya’s
mobile phone sector is not known.
2.2.4 Summary of Gaps
Existing literature shows that plausible but mixed relationship exists between service
quality and customer satisfaction. Apparently, the cause of this mixed result has remained
unclear. Moreover, past studies have attempted to establish this relationship in other
contexts such as in banking, hospitality and University library services which are regarded
as a high end and high contact service settings. These studies have, however, did not shed
light on aspect of quality-satisfaction relationship as in the case of low contact service
setting in which mobile phone firms operate under. Furthermore, there is no evidence that a
psychometric scale exists to measure services quality practices in such service setting.
Consequently, the status and effect of service quality practices on customer satisfaction in
mobile phone firms in Kenya is not known. Moreover, studies involving service failure and
customer communication as moderators in quality-satisfaction relationship are rare. Most
studies attempted to establish the direct effect of these aforementioned variables on
satisfaction with limited effort to empirically establish their moderating role on the
relationship between service quality and customer satisfaction. Other studies focused on
modelling other variables such as value, uncertainty avoidance as possible moderators of
this relationship with little success. Therefore, the status of service failure and customer
communication and their moderating role in quality-satisfaction relationship is not known.
Therefore, this study analyses the influence of service failure and customer communication

37
in the relationship between service quality and customer satisfaction among mobile phone
firms in Kenya.

38
CHAPTER THREE: RESEARCH METHODOLOGY
This chapter presents the research methodology which encompasses research design, the
study area, the target population, sampling frame, sampling techniques, instrumentation,
reliability and validity test, analysis and presentation of data. Special attention is paid to
model specification because of the multiplicative nature of variables involved in moderation
studies such as this.
3.1 Research Design
A research design is a systematic plan to study a scientific problem. It basically
encompasses the method and procedures employed to conduct scientific research by
defining the study type, data types and collection techniques and the methods of analysis of
data (Kothari, 2004). This study followed the quantitative paradigm as it is in tandem with
the researcher’s characteristics and the main purpose of the study (Creswell, 1994).The
quantitative paradigm is the traditional, positivist, experimental or empiricist paradigm
(Schiffman and Kanuk, 2009). The positivists tend to assume that a single, objective reality
exist independent of what individuals perceive. Besides, they place a high priority on
identifying causal linkages between and amongst variables. Utilizing a positivist
quantitative paradigm, this study explored the relationship between service quality and
customer satisfaction as well as the moderating effects of service failure and customer
satisfaction on the same relationship.
In tandem with the positivist quantitative research paradigm and philosophical orientation
which has been adopted for this study, the researcher used a correlational survey research
design to obtain the empirical data to address the objectives of the study. According to
Mugenda and Mugenda (2003), the correlational approach helps in determining whether and
to what degree a relationship exists between the quantifiable variables. Therefore, the
method of knowledge enquiry and research design adopted were appropriate for the focus
and objectives. A survey gathers data at a particular point in time with the intention of
describing the nature of the existing condition, or determines the relationship that exists
between specific events (Chava and Nachmias, 1996). According to Mugenda and Mugenda
(1999) and Mutai (2005), survey study involves finding out what people are doing and
thinking and gathering information from them at a particular point in time.

39
This design was deemed appropriate for the study because it gave the principal researcher a
profile of relevant aspects of the phenomena of interest from an individual, organization and
industry perspective. With respect to this study, the design was specifically intended to
present the relationship between the service quality and customer satisfaction as was
moderated by customer communication and service failure. This research design was
therefore relevant for the study as it also enabled the researcher to take control over the
research process (Saunders et al., 2007).
3.2 Study Area
The study was conducted in Kenya because it was regarded as the world leader in mobile
phone transfer money transfer services with a penetration rate of 80.5% rising exponentially
hence regarded as a vibrant mobile economy (CAK, 2014). Despite this growth, the sector
was bedeviled by numerous quality related challenges like endemic customer fraud,
frequent service interruptions, poor signal quality; that is holding back the growth of the
mobile phone sector in Kenya, a situation that warrants a study. Geographically, Kenya is
located at longitude 100N and latitude 3800 E. In terms of land mass, it covers an area of
582, 650 Km2 out of which 569,250 Km2 is dry land while 13,400 Km2 is covered by water.
Kenya has a population of approximately 40 million people. A detailed map of the study
area is attached as an appendix IV in page 120.
3.3 Target Population
Kombo and Delmo (2006) defined population as a group of individuals, objects or items
from which samples are taken for measurement. The research took the form of a consumer
study where mobile subscribers of the four mobile service operators in Kenya were targeted
as participants both to validate constructs and estimate econometric models. The four
targeted mobile phone firms offer services ranging from call, money transfer and data
services and include: Safaricom Kenya, Airtel Kenya, Orange Kenya and Essar Telkom. In
this regard, a total of 32.7 million mobile phone subscribers obtained from the data
published by CAK in 2014 which include staff of those four mobile firms, formed the
universe of the study. However, caution was taken to ensure that respondents who are 18
years and above and who have used a network services for a period of 6 months at the time
when the study was conducted were selected for final analysis. Viewing the subject from a
customer perspective was also seen as appropriate since customers are the ones who

40
ultimately consume the service hence become the best judge of its quality (Parasuraman et
al., 1991).
3.4 Sample Size and Sampling Procedure
Sekaran (2003) defines a sampling frame as a listing of all elements in the population from
which a sample was drawn. The study adopted a proportionate stratified sampling technique
in which mobile phone subscribers were drawn from the four mobile phone firms that
existed at the time when the study was conducted. Daniel (2012) notes that in proportionate
stratified sampling, the number of elements allocated to the various strata is proportional to
the representation of the strata in the target population. This technique of sampling is
suitable for the study as it accounts for geographically diverse subscriber population
(Fienberg, 2003). Therefore, the mobile phones firms, as a stratification basis are a
convenient way of organizing sampling and data collection. The sampling units are the
individual subscribers of those four mobile phone firms who, at the time of study, were
resident in Kenya. A sampling frame for the study was therefore constructed according to
the proportionate market share of each of the four mobile firms as shown in Table 3.1.
Table 3.1: Study population and sample size
Mobile Phone Firms
in Kenya
No. of Subscribers
in Millions
Proportion in
(%)
Study Sample
Safaricom Kenya 21.8 66.7 256
Airtel Networks 5.4 16.5 64
Telkom Kenya
(Orange)
3.0 9.2 35
Essar Telkom 2.5 7.6 29
32.7 100 384
Source: Communication Authority of Kenya, (2014).
Kothari (2004) defines a sample size as the number of items to be selected from the
universe to constitute a sample. Since the study considered drawing a sample from a large
population of over 10,000 members, the sample size was determined according to the
formula suggested by Mason, Lind and Marchal (2002) and Nargundkar (2003) as below:
Let sample size .......................equation 3.1

41
Where
n = Sample size;
p = Proportion belonging to the specified category;
q = Proportion not belonging to the specified category;
z = z value corresponding to the level of confidence; and
e = the margin of error required.
Let the p value = 0.5 and q =1-p= 1-0.5=0.5 and 95% confidence level.
Thus: = 384
In order to cater for non-response, a total of 402 questionnaires were filled by respondents
representing subscribers of the existing four mobile phone companies namely: Safaricom,
Airtel, Essar Telkom and Telkom Kenya Orange. However, 21 questionnaires were found to
be unfit for the analysis as they were uncompleted with some having missing values ranging
between 16 to 3 values. Ultimately, a total of 381 questionnaires were obtained, yielding a
satisfactory response rate of 99.2% as shown in Table 3.2. It is important to note that as a
rule of thumb, a minimum response rate of 75% is considered adequate (Fowler, 1993; Ary
et al., 1996). Others like Babbie (1990) state that 50% is adequate, 60% is good and 75% is
very good. Since the response rate for the current study was at 99.2%, it is deemed to be
adequate and nonresponse bias is greatly minimized. Furthermore, the questionnaires
received were completed to a good standard and were found useable since they were
complete and consistent.
Table 3.2 Response Rate
Total
No.(Millions) Sample Response % Response
Safaricom 21.8 256 254 99.2
Bharti Airtel 5.4 64 64 100
Essar Yu 2.5 29 29 100
Telkom Orange 3.0 35 34 97.1
Total 32.7 384 381 99.2
Source: Survey data (2014)

42
Moreover, care was taken to establish the acceptable sample size for specific data analysis
techniques. For instance, with regard to regression analysis, the 99.2% from 381
observation was deemed appropriate. As a rule of thumb, Sekaran and Bougie (2010) say
the acceptable sample size for regression analysis should be between 10 and 20
observations for each and every variable. Huang et al. (2014) further state that the effective
sample which falls between 140 and 280 cases is deemed adequate.
3.5 Data Collection Methods
The process of data collection involves a number of activities namely: sourcing for data,
data collection procedures and validation of data collection instruments. These are discussed
consecutively.
3.5.1 Data Sources
Both primary and secondary data were collected on different aspects of service quality,
service failure, customer communication and their likely impact on customer satisfaction.
Primary data were generated from the survey conducted through the questionnaire method
to fulfil the main purpose of the study. Primary data were mainly in the form of perception
data on respondents’ views about service quality, service failure, customer communication
and customer satisfaction. Survey research is appropriate for collecting primary data in
marketing research because it allows collection of robust information on behaviour,
feelings, attitude and personal characteristics (Tull and Hawkins, 2004). Secondary data, on
the other hand, are data collected for some other purpose but appears useful and relevant for
the current study (Tull and Hawkins, 2004). With respect to this research, several secondary
data sources were used and include: published sectorial report of 2013/2014 period by
CAK, reports by Business Monitor International for 2012 and Telecommunication Industry
Review reports of 2012 among others. These data sources served to augment data from the
primary sources.
To facilitate analyses using inferential statistics, the data were ratio scaled for ease of
manipulation in order to identify their correlational properties. Therefore, Likert scales are
employed in primary data collection for data to be analysed inferentially (Norman, 2010).
3.5.2 Data Collection Procedures
The process of data collection was preceded by recruitment and training of five research
assistants who were dispersed to different towns in Kenya on a rotational basis. The towns

43
included: Kisumu, Nakuru, Eldoret, Nairobi, Mombasa, Isiolo, Garissa, Marsabit, Migori
and Narok. This distribution ensured that regional and cross-cultural diversity of the study
respondents are catered for. At the initial stage, the researcher supervised the research
assistants by accompanying and observing their activities in the field as per their training
guide. Subsequently, the research assistants were then released in the field to personally
deliver the questionnaires to the respondents. This procedure was preferred as it enhanced
the response rate, response quality and due to the geographical dispersion of the units of
study, being scattered throughout the whole country (Saunders et al., 2003).
Prior to data collection, the participants were assured of confidentiality and anonymity of
responses and were, in addition, promised access to a copy of research report as an
incentive. Before individual respondents were allowed to participate in the study, care was
taken to ensure that only those respondents/subscribers who had used their respective
network service up to six months and above were selected. Additionally, since
questionnaires were worded in English, the research assistants were instructed to establish
their language mastery of the subscribers through verbal conversation before issuing
questionnaires to them. The technique ensured that final participants in the study were
knowledgeable about the subject and were eligible to participate in the study having met the
time duration for using and assessing the service quality.
The selected respondents were presented with the research instrument and encouraged to
respond to it. The respondents self-administered their feedback and the completed
questionnaires are collected soon for analysis. Further, in order to reduce non-responses,
follow up visits and call reminders were done by research assistants to encourage
respondents to return the questionnaires in time (Welch, 2011). Finally, a total of 402 copies
of the questionnaires were delivered. Out of this, 381 were successfully received
representing a response rate of 99.2 percent. The data collection process lasted a period of
3-4 weeks.
3.5.3 Data Collection Instrument
A questionnaire was the main instrument of data collection. In order to improve both
content validity and response rate, questionnaire was formulated with guidelines adopted
from Dilman (2000). First, scales were drawn from in-depth literature from which the

44
indicators for each construct with modification to suit the study context were drawn. These
modifications are in term of the wording of the statements to suit the industry.
Subsequently, a pool of items for each dimensions and which were suitable for use in self-
administered questionnaires were extracted. For Service quality, the dimensions were:
tangibles, reliability, responsiveness, assurance and empathy. For customer satisfaction, the
key dimensions were: Overall satisfaction, intention to repurchase and loyalty among
others. Customer communication dimensions included: views on channels effectiveness to
receive complaints, suggestions, compliments and abandonment of usage. Finally, the
dimensions on service failure were delivery failure, response failure and unprompted
employee actions. This approach of surveying literature to identify underlying constructs
strengthened the research with a framework built on dimensions of constructs that are
prominent within the literature (Bailey et al., 2000; Ojera et al., 2011).
Secondly, the pool of items was submitted for evaluation by an expert panel of academics.
In this regard, a team of five content expert scholars drawn from the School of Business and
Economics, Maseno University went through draft questionnaires items to judge its clarity,
relevance and suggest areas for review. The questionnaires were then piloted on 10 mobile
phone network subscribers who were thereafter excluded from the main study. This small
sample was guided by the suggestion by Saunders et al., (2007) that a minimum of (10) ten
members for pre-testing are adequate. This process produced 42 items with modification to
the context of the study. Most items in the questionnaire are on Likert-type scale with a few
dichotomous questions. Likert-type scale is intended to facilitate easy coding and analysis.
The respondents were asked to express their level of agreement on a seven point Likert
scale, with scores anchored at the extremes 1 and 7 (Vagias, 2006; Aila, 2014). The
instrument was deemed suitable for the study because it was time saving, maintained
confidentiality of information and had no room for interviewer bias. Questionnaires were
further deemed appropriate for the study because they are easy to analyze statistically
(Kavulya, 2007).
The final questionnaire for data collection had the following five sections, capturing all the
dimensions of the study variables: Section A captured general information on respondent’s
gender, age, and experience on network and detail on choice of network provider. The
remaining four sections each had several structured items. Section B sought to obtain views
about service quality practices of the selected mobile phone firms. These items were set
under five subheadings: tangibles, 4 items; reliability, 5 items; responsiveness, 4 items;

45
Assurance, 4 items; empathy, 5 items. Section C presents customers’ view on service failure
and comprised of 6 items. Section D presents views on customer communication and
comprised of 4 items. Finally, section E presented the 9 item pool that sought to measure
customers’ view on their satisfaction level. The research instrument is included as Appendix
II.
3.5.4 Reliability Tests
According to Sekaran (2000), reliability test measures the extent to which any measuring
procedure yields the same results on repeated trial. The reliability analysis was conducted
on all the multi-items scales to check the internal consistency of the scales and constructs.
In this view, the study adopted a cut off at an alpha α= 0.70 Cronbach’s coefficient which
was recommended by Nunnally (1978) as a good indicator of reliability. Variables with low
reliabilities were deleted to improve the overall reliability of the research instrument to be
used in the main research. Reliability test for all the five dimensions of service quality
namely: Tangibility, Reliability, Responsiveness, Assurance and Empathy were (alpha
values of 0.739, 0.887, 0.882, 0.732, 0.942) respectively. For service failure, an alpha value
of α= 0.944 was obtained. While for the case of customer communication and customer
satisfaction, an alpha coefficient of α=0.765 and α=0.913 were obtained respectively. The
mean reliability for the entire 42 items was at α= 0.943. Although some Alpha values were
moderate, they were, nonetheless, acceptable since alpha values are above the threshold of
0.60 (Bagozzi and Yi, 1988) and above a minimum 0.70 level recommended by Nunnally
(1978) for measurement instruments thereby indicating good stability. The reliability results
have been presented in Table 3.3.

46
Table: 3.3: Analysis of Internal Consistency
Constructs No. of items Cronbach’s alpha
Service quality
i).Tangibles 4 0.739
ii). Reliability 5 0.887
iii). Responsiveness 4 0.882
iv). Assurance 4 0.732
v). Empathy 5 0.942
Service Failure 6 0.944
Customer Communication 4 0.765
Customer Satisfaction 9 0.913
Mean Reliability 42 0.943
Source: Pilot Survey, 2014
3.5.5 Validity Tests
Validity is the extent to which a construct or a set of measures correctly represents the
concept of the study, and the degree to which it is free from any systematic or non-random
error (Nunnally, 1978). In this regard, the following basic types of validity were
determined. Bolliger and Inam (2012) noted that face validity, which is defined as the
degree to which a test seems to measure what it purports to measure, can be established
through expert judgement and supervisors’ assessment. Subsequently, the number of items
retrained for each subscale has good face validity.
Content validity refers to the general agreement among the subjects and the researcher that
the instrument has measurement items that cover all aspects of the variables being
measured. This was achieved through ratings by expert judges. The pool of items generated
from this exercise that were deemed to represent the underlying dimensions of service
quality were given to an expert panel of five scholars drawn from the fields of the marketing
profession. These experts expressed their degree of agreement/disagreement with the use of
different items on a Likert scale of seven points. This process produced 22 items that were

47
customized to measure service quality in the mobile phone sector services consistent with
SERVQUAL scale envisage by (Parasuraman et al., 1991, Carman 1990, Crompton and
Mackay, 1989). In summary, the process produced an instrument with: 22 items for
measuring service quality; 6 items for measuring service failure; 4 items for measuring
customer communication and 9 items for measuring customer satisfaction. Furthermore, the
expert panel, in an interactive manner, revised questions and response-options until all
evaluators concurred that each question accurately reflected the underlying dimensions of
each construct. Therefore, the entire instrument has sound measure theoretically.
According to Nunnally (1978), construct validity refers to the degree to which measurement
scale assesses the theoretical construct its purports to assess. It is achieved by assessing face
validity, content validity, convergent and discriminant validity. The researcher sought to
operationalize the study constructs as a multi-item measurement scales. Therefore, there is a
critical need to provide evidence of dimensionality of multi-item measurement scale using
factor analysis (Carmines and Zeller, 1979; Nunnally, 1978). Through factor analysis,
information contained in a number of original variables were summarized into a smaller set
compact dimensions or constructs with minimum loss of information on original variables
(Hair et al., 2006).
Convergent validity which means variables within a single factor are highly correlated was
examined through factor loading (Bearden et al., 2011). In this regard, all constructs
indicated a significant alpha level (p<0.0001) for Bartlett’s test of Sphericity stating that
there was sufficient correlation between the variables (Meyer et al., 2006). Furthermore, the
Bartlett’s Test of Sphericity for each subscale is significant at p=0.000 meaning each scale
is unidimensional (Field, 2005).
Discriminant validity refers to the extent to which the factors are unrelated or uncorrelated
to each other. Trochim (2006) stated that discriminant validity can be best assessed by
examining the factor intercorrelation matrix where the correlation coefficient between
factors should not exceed 0.7 levels. In addition, the factor model should have a non-
significant chi-square goodness-of-fit test (Conway and Huffcutt, 2003). In this regard,
Table 3.4 indicates the validation results where all subscales are seen as valid.

48
Table 3.4: Summary of Validation Tests
Subscale Factors
retained
Items
retained
Scale
reliability
KMO Bartlett’s
Test(p-
values)
Goodness-
of-fit
test(p-
value)
Variance
explained
(%)
Factor
intercorrelation
(r)
SQ 4 22 0.915 0.913 0.000 0.151 47.393 F1-F2,r = -0.454
F2-F3, r =-0.431 F3-F4, r =0.268
SF 1 6 0.944 0.832 0.000 0.145 57.858 _ CC 1 4 0.762 0.697 0.000 0.237 55.014 _ CS 2 9 0.913 0.510 0.000 0.573 84.683 F1-F2, r =0.303
SQ= Service Quality; SF=Service Failure; CC= Customer Communication; CS= Customer satisfaction
Source: Pilot survey, 2014
From Table 3.4, the subscale Kaiser-Meyer-Olkin measure of sampling adequacy ranges
between 0.510 ≤ KMO ≥ 0.944 indicating good sampling adequacy (Field, 2005). Further,
subscales are unidimensional as was shown by Bartlett’s Test of Sphericity significant at
p=0.000 (Field, 2005). The goodness-of-fit test based on maximum likelihood exploratory
factor analysis show insignificant p-values for the chi-square tests ranging between 0.141≤
p ≤0.573 indicating good fit for each constructs. In addition, each subscale explained
adequate variance 47.393 ≤VE ≤84.683. The factor intercorrelations where all are less than
0.7 and indicate that the retained factors measure conceptually different constructs thus
proving discriminant validity (Vagias, 2006).
3.6. Testing for the Assumptions for the Linear Regression
Since the study employed linear regression analysis in the analysis of quantitative data,
there was need to determine if the assumptions of linear regressions were not violated
before subjecting the data to further analysis as was emphasised (Hair et. al., 1998). In this
regard, the assumptions which are considered necessary if the conclusions can be drawn
about the population on the basis of a regression analysis on a sampled data include: types
of variables, homoscedasticity, and linearity, normality of residuals, multicollinearity and
independent errors.
3.6.1 Type of variables
As a pre-requisite for linear regression analysis, all predictor variables must be quantitative
in nature and the outcome must be quantitative, continuous or unbound (Field, 2005). In this
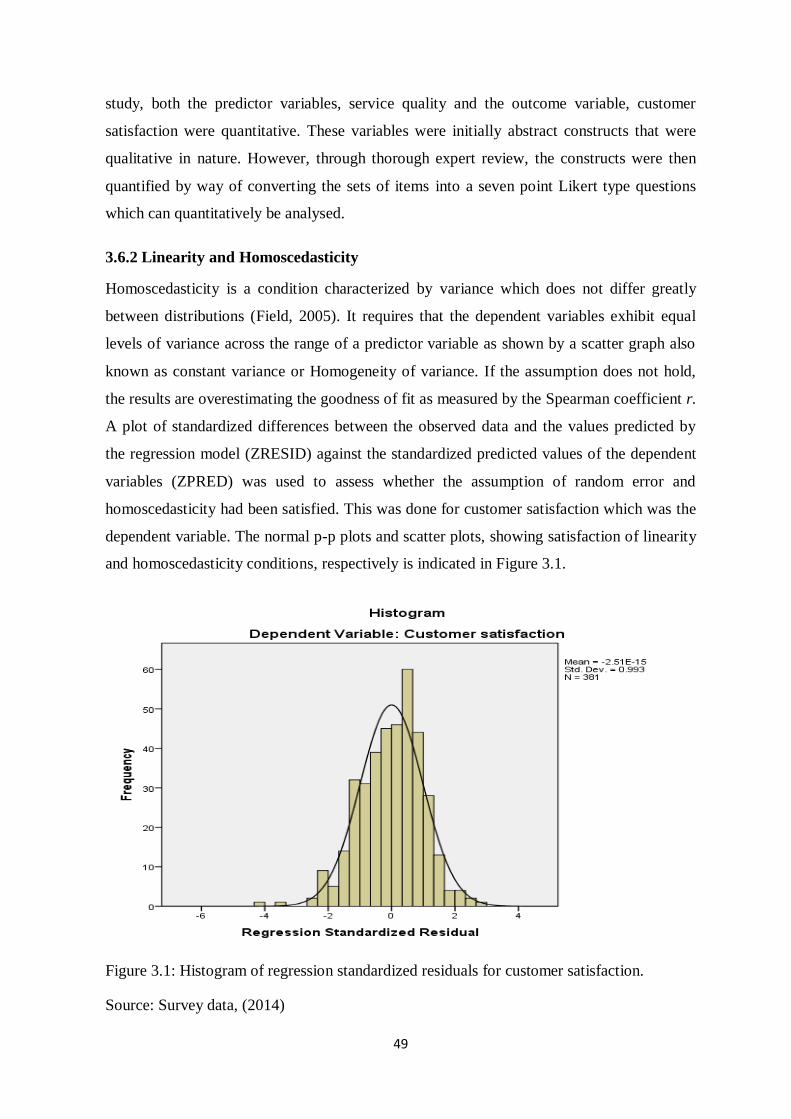
49
study, both the predictor variables, service quality and the outcome variable, customer
satisfaction were quantitative. These variables were initially abstract constructs that were
qualitative in nature. However, through thorough expert review, the constructs were then
quantified by way of converting the sets of items into a seven point Likert type questions
which can quantitatively be analysed.
3.6.2 Linearity and Homoscedasticity
Homoscedasticity is a condition characterized by variance which does not differ greatly
between distributions (Field, 2005). It requires that the dependent variables exhibit equal
levels of variance across the range of a predictor variable as shown by a scatter graph also
known as constant variance or Homogeneity of variance. If the assumption does not hold,
the results are overestimating the goodness of fit as measured by the Spearman coefficient r.
A plot of standardized differences between the observed data and the values predicted by
the regression model (ZRESID) against the standardized predicted values of the dependent
variables (ZPRED) was used to assess whether the assumption of random error and
homoscedasticity had been satisfied. This was done for customer satisfaction which was the
dependent variable. The normal p-p plots and scatter plots, showing satisfaction of linearity
and homoscedasticity conditions, respectively is indicated in Figure 3.1.
Figure 3.1: Histogram of regression standardized residuals for customer satisfaction.
Source: Survey data, (2014)

50
Figure 3.2: Normal P-P plot of Regression Standardized Residuals for customer satisfaction.
Source: Survey data, (2014)
Figure 3.3: Scatter plot of ZRESID against ZPRED for customer satisfaction.
Source: Survey data (2014)

51
In Figure 3.3, the points are more or less randomly and evenly spread in scatter plot. In
addition, the shape of the normal scatter p-p plot of regression-standardized residuals
satisfied the requirement of rectangularity necessary for linearity and homoscedasticity.
Further, there is no curvilinear pattern, and the assumption of linearity is re-emphasised
(Field, 2000).
3.6.3 Testing for the Normality of Residual
This assumption signifies the generalizability of the findings by looking at the residuals and
normal probability plot (Tabachnick and Fidell, 2007). In this study, normality was assessed
using histogram of regression of standardized residuals and a normal probability plot (P-P
plot) of regression standardized residuals done for a composite customer satisfaction. Both
indicated that the assumption of normality is met by the data. Further test for normality was
assessed using measures of Skewness and Kurtosis (Tabachnick and Fidell, 2001). The
results are shown in Table 3. 5.
Table 3.5: Testing for Normality Requirement of Residual
Skewness Kurtosis
Statistic Std. Error Statistic Std. Error
Tangibles -1.132 .125 1.205 .249
Reliability -.693 .125 .021 .249
Responsiveness -.520 .125 .024 .249
Assurance -.894 .125 .790 .249
Empathy -.503 .125 .066 .249
Customer satisfaction -.662 .125 .061 .249
Source: Survey Data (2014)
Tabachnick and Fidell (2001) noted that for the distribution to be considered normal, the
values of Skewness and Kurtosis should fall within the interval -2.0 to 2.0. From the Table
3.5, the value of Skewness and Kurtosis ranged within the acceptable interval further
confirming that normality assumptions were met.
3.6.4 Testing for Multicollinearity
The researcher felt that there was a critical need to test for multicollinearity because highly
collinear items can distort the results substantially or make them unstable and not
generalizable (Hair et al., 1998). This study assessed the multicollinearity of the
independent variables by means of tolerance and variance inflation factors (VIF). A

52
tolerance of below 0.01 or a VIF greater than 10 is regarded as indicative of serious
multicollinearity problems (Field, 2005; Pallant, 2007).
Table 3.6: Collinearity Statistics of Independent Variables
Sou
rce:
Sur
vey
Dat
a
(20
14)
From Table 3.6, the tolerance statistics were all well above 0.10 and the variance Inflation
factor (VIF) values were all below 10. This was a solid proof that there was no evidence of
multicollinearity within the data.
3.6.5 Independent errors
The assumption of independent of errors was tested using the values of Durbin-Watson
statistics. The test was aimed at finding out whether prediction of dependence errors were
correlated. Table 3.7 shows the results.
Sources: Survey Data (2014)
Independent Variables Collinearity Statistics
Tolerance Variance Inflation Factor
Tangibles 0.672 1.488
Reliability 0.431 2.321
Responsiveness 0.526 1.900
Assurance 0.600 1.667
Empathy 0.601 1.664
Dependent Variable: Customer satisfaction
Table 3.7 Test for independence of Errors( Durbin Watson Test)
Model Unstandardized Coefficients Standardized
Coefficients
B Std. Error Beta
(Constant) -.678 .301
Tangibles -.060 .054 -.043
Reliability .143 .055 .129
Responsiveness .039 .048 .036
Assurance .419 .055 .318
Empathy .559 .049 .473
Durbin-Watson 1.842
Dependent Variable: Customer satisfaction

53
In this study, the values of Durbin-Watson statistic was found to be 1.842 which implies
that the errors were uncorrelated as the statistics is within the intervals 1.50-2.50
(Tabachnick and Fidell, 2001) or 1.0 to 3.0 (Field, 2005). Therefore, the assumption of
independent errors is tenable (Field, 2000).
3.7 Data Analysis
This section discusses the data analysis methods. With the method used to collect the
primary data, there was a risk of receiving incomplete questionnaires, either because of
language and that the respondent ignored or did not see the question. Since the problem of
incomplete questionnaires is very common in questionnaire answering, it is always good to
see how to sort this out to avoid problem in analysis of incomplete questionnaires. To avoid
this undesirable state, the researcher took a caution by going through the questionnaires and
selected only those that were filled out in full and discarded away the incomplete ones.
Therefore, in this regard, out of a total of 402 questionnaires filled during field survey, only
381 were completed and had no missing values. A total of 21 questionnaires had missing
values of between 16 and 3 cases. These were regarded unfit for analysis and avoided. The
remaining 381, which were complete, were then subjected to further analysis to address the
stated objectives of the study.
Preliminary data analysis included the use of descriptive statistics such as mean, frequency
and standard deviation to analyse qualitative data such as gender, age experience on
network services among others. This approach was deemed appropriate since descriptive
methods tend to be stronger in validity but weak in reliability (Kibwage, 2002 & Odondo,
2007).
To achieve specific objective one of the study, measures of degree of association and
relationships were used to give the study multivariate analysis, where numerous variables
was directly associated with the dependent variable. This approach was deemed appropriate
since inferential statistics tend to be stronger in reliability but weak in validity (Kibwage,
2002 & Odondo, 2007). Therefore, the use of both descriptive and inferential statistics aided
the researcher in gaining a higher degree of reliability and validity (Babbie, 1986). An
outline of the correlation model is described in subsection 3.7.1 as follows.

54
3.7.1 Correlation Analysis
Correlation analysis was used to determine the relationship between variables namely:
service quality (Tangibles, Reliability, Responsiveness, Assurance and Empathy) and
customer satisfaction. Since the data set in this study was ordinal, Spearman's rank
coefficient is appropriate for both continuous and discrete variables, including ordinal
variables (Lehman, 2005). Further, Spearman rank correlation is used to test the association
between two ranked variables, or one ranked variable and one measurement variable. The
measure is appropriate because the Likert scale used in service quality scales, customer
satisfaction is ordinal and therefore ranked (Norman, 2012). Therefore, Spearman’s rank
correlation is an appropriate measure of strength of association.
3.7.2 Factor Analysis
Factor analysis was performed to validate the scale for measuring the study constructs. In
this regard, exploratory factor analysis was used to validate the research instrument and
ultimately perform hypothesis testing (Costello and Osborne, 2005). Specifically, maximum
likelihood exploratory factor analysis in which the rotation method is oblique’s direct
oblimin method was used (Conway and Huffcutt, 2003). The number of factors retained is
based on Kaiser’s criterion of Eigen values greater than 1 (Raven, 2009) and with a variable
with loadings of .30 or higher should be considered.
3.7.3 Regression Model
Due to the inherent weakness in correlation results especially the third variable problem
(tertium quid) and the difficulty in determination of causality (Field, 2005), there is
therefore need to exercise caution when interpreting correlation results. The correlation
results could not reveal other measured or unmeasured variables affecting the results. In an
attempt to overcome this serious shortcoming with correlation results and in order to test a
null hypothesis for the first objective, a multiple regression analysis between the five
indicators of service quality as independent variables and customer satisfaction as
dependent variable was run. Therefore, the coefficient of determination, R2 was relied on to
overcome the problem of determining causality as it indicates the amount of variability in
one variable that is explained by the others. The construct scores were estimated by
obtaining the average response score of all items per case under each construct. The first
model (Model 1) contains an array of variables that constitute service quality as generally
agreed in many SERVQUAL modelling studies. This model utilized cross-sectional data
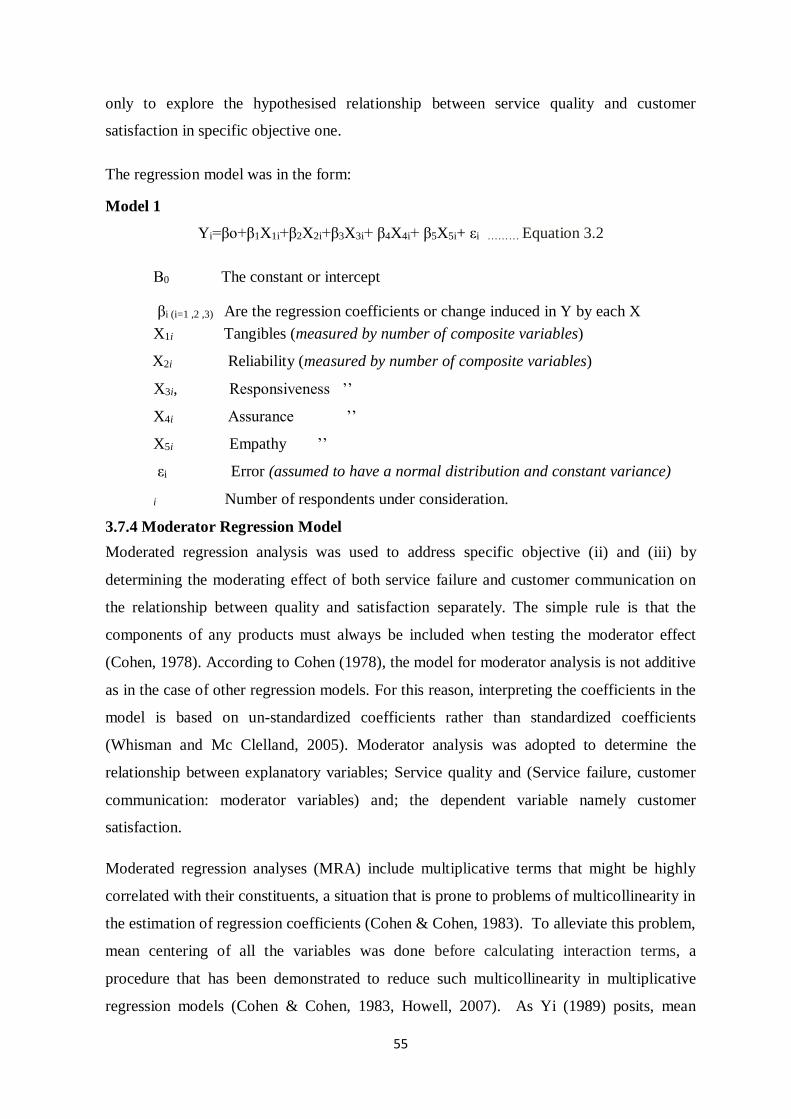
55
only to explore the hypothesised relationship between service quality and customer
satisfaction in specific objective one.
The regression model was in the form:
Model 1
Yi=βo+β1X1i+β2X2i+β3X3i+ β4X4i+ β5X5i+ εi ……… Equation 3.2
Β0 The constant or intercept
βi (i=1 ,2 ,3) Are the regression coefficients or change induced in Y by each X
X1i Tangibles (measured by number of composite variables)
X2i Reliability (measured by number of composite variables)
X3i, Responsiveness ’’
X4i Assurance ’’
X5i Empathy ’’
εi Error (assumed to have a normal distribution and constant variance)
i Number of respondents under consideration.
3.7.4 Moderator Regression Model
Moderated regression analysis was used to address specific objective (ii) and (iii) by
determining the moderating effect of both service failure and customer communication on
the relationship between quality and satisfaction separately. The simple rule is that the
components of any products must always be included when testing the moderator effect
(Cohen, 1978). According to Cohen (1978), the model for moderator analysis is not additive
as in the case of other regression models. For this reason, interpreting the coefficients in the
model is based on un-standardized coefficients rather than standardized coefficients
(Whisman and Mc Clelland, 2005). Moderator analysis was adopted to determine the
relationship between explanatory variables; Service quality and (Service failure, customer
communication: moderator variables) and; the dependent variable namely customer
satisfaction.
Moderated regression analyses (MRA) include multiplicative terms that might be highly
correlated with their constituents, a situation that is prone to problems of multicollinearity in
the estimation of regression coefficients (Cohen & Cohen, 1983). To alleviate this problem,
mean centering of all the variables was done before calculating interaction terms, a
procedure that has been demonstrated to reduce such multicollinearity in multiplicative
regression models (Cohen & Cohen, 1983, Howell, 2007). As Yi (1989) posits, mean

56
centering “yields the same R2 as the current practice, while producing such desirable
properties as scale independence, low multicollinearity, and a clear interpretation of main
effects”. Furthermore, care was taken to test for multicollinearity in the final regression
output using Variance Inflation Factor (VIF) where values less than 10 were treated as
acceptable. In addition, other regression diagnostic test such as test for normality of
independent variables, linearity and homoscedasticity was performed to establish the
reliability and validity of the regression model.
Researchers have posited that moderated regression analysis is the most general and
conservative method for testing contingency hypothesis in which interaction exists
(Aguinis, 2004, Cohen & Cohen, 1983, Dowling & Mc Gee 1994). In this regard, a
moderated regression analysis was conducted for contingent hypotheses testing the
moderating effects of service failure on the relationship between service quality and
customer practices were tested. This procedure involves the regression of the dependent
variable on the independent variable (service quality), the potential moderating variable,
and the cross- product interaction term of the independent variable and the potential
moderating variable. If the cross-product interaction term produces a significant change in
the R-square value (that is, significantly increases the amount of variance accounted for in
the criterion variable), then the moderating variable is identified as having a significant
effect on the nature of the relationship between service quality and the criterion variable.
However, in order to avoid multicollinearity in a multiplicative regression model, a
procedure called mean centering was performed to ensure that all construct measures were
mean centered before calculating interaction terms (Bagozzi et al., 1992; Cohen and
Cohen, 1983).
The moderated regression analysis used to test data is mathematically presented below:
The models for the regression analysis are given below.
Model 2
E
Where Zi is a moderator variable which can either be service failure or customer
communication.
Model 2, introduces the service failure or customer communication respectively as
moderators in order to establish its contribution in the service quality/customer satisfaction
model 1.
Additive model: Yi= β0+β1Xi + β2Zi +εi Eq. 3.3

57
Model 3
Where XiZi is the cross product of interaction term between service quality and
either service failure and customer communication (potential moderators)
Model 3 encompasses the dependent and independent variables, the potential moderating
variable and the cross-product interaction term of the dependent and potential moderating
variable (Service quality or customer communication) respectively.
Source: Adapted from Aikin and West (1991), Fairchild and Mackinnon (2009),
Ahimbisibwe et al. (2012) and Whisman and McClelland (2005)
Y= Dependent Variable (Customer satisfaction)
X= Independent Variable (Service quality)
Z= Moderator Variables (Service failure/customer communication respectively)
XZ = Interaction Terms (Interaction of Service Quality and service failure/customer
communication respectively)
β0 =Standardized Y intercept in the additive model (model without the interaction term)
β1 = Standardized coefficient of X in the additive model
β2 = Standardized coefficient of X in the additive model
b1 = Un-standardized coefficient of X in the moderator model (Main effect of X on Y if Z
is zero or Simple effect of X on Y if Z is above zero).
b2 = Un-standardized coefficient of Z in the moderator model (Simple effect of Z on Y)
b3 =Un-standardized coefficient of XZ in the moderator model (The interaction
measure for moderation)
ε = Residual in the equations
i = Number of respondents under consideration
(b0+ b2Zi)= The Y intercept of the moderator model.
(b1 +b3 Zi)=The slope of Y to X for different values of Z
Equation 3.5 represents the linear functional form with (b0+ b2Zi) representing the intercept
and (b1 +b3 Zi) representing the slope of Yi to Xi, therefore at different values of Z, Yi to Xi
slope is expected to have different values. The moderator model coefficients are expressed
as b because their interpretation is supposed to be based on un-standardized values. As
Moderator Model: Yi= b0+b1Xi + b2Zi+ b3Xi Zi +εi 3.4

58
depicted in the regression equations, the interaction term, XZ, is entered last to ensure that
the coefficient is not confounded with variance arising from the main effects of the
variables. In addition, Z can be considered a moderator variable only if the change in R2 for
equation (3.3) compared to equation (3.4) is statistically significant.
3.8 Data Presentation
Data are presented by use of tables, figures and equations (Field, 2015; Zikmund et al.,
2010). This technique of presenting data was suitable as it aided in describing and
summarizing large data sets into meaningful outputs that are easily interpretable.

59
CHAPTER FOUR
RESULTS AND DISCUSSIONS
This chapter presents the results of the study followed by the discussion of the findings in
light of the research objectives. This part is divided into two main sections. The first section
addresses the descriptive aspects of the data such as the demographic characteristics of the
respondents and the description of the extent of the service quality and customer
satisfaction. In the second section, the results of the test hypotheses are discussed beginning
with the main effects and ending with the moderating effects of the associated variables.
4.1 Characteristics of the Mobile Phone Users
Table 4.1 summarizes the distribution of respondents by gender. The majority (57.2%) of
the respondents were male compared to 42.8% who were female. This preliminary
indication suggests that the number of male subscribers is more than their female
counterpart in the study area.
Table 4.1: Distribution of Mobile Phone Users by Gender
Frequency Percent
Male 218 57.2
Female 163 42.8
Total 381 100
Source: Survey data (2014)
The distribution of respondents based on the type of network they subscribe to are indicated
in Table 4.2. The analysis revealed that most (86.6%) of the respondents subscribe to a
prepaid call services while only 13.4 % subscribe to postpaid services. This result indicates
that the growing trend in customer preference for a prepaid call service as opposed to
postpaid services which was largely seen as a preserve of a few business class individuals.
Table 4.2: Distribution based on Type of Network Connection
Frequency Percent
Prepaid 330 86.6
postpaid 51 13.4
Total 381 100
Source: Survey data (2014)

60
The distribution of respondents based on their year of network usage is shown in Table 4.3.
Majority of the respondents representing 52.2% have had an experience with a given mobile
network for a period of more than 5 years. This suggests that the level of adoption of
innovation in the mobile phone sector is relatively high among the users of this service. This
was followed by those who stated that they had been on a particular network for a period of
between 1-5 years representing 32.5%. Others, 4.7%, confirmed that they had been on a
network for at least 6 months.
Table 4.3: Distribution of Respondents based on Years of Network Experience
Frequency Percent
About 6months 18 4.7
About 1year 40 10.5
Between 1-5 years 124 32.5
More than 5 years 199 52.2
Total 381 100
Source: Survey data (2014)
The age profile of the respondents revealed that most (43.8%) of them were aged between
24-29 years with 31.8% falling over 30 years. On the other hand, 21% of the respondents
fell between 19-23 years of age. While only 3.4% of respondents were aged 18 years.
Table 4.4: Distribution of respondents by their current age
Frequency Percent
About 18year 13 3.4
19_23 years 80 21
24-29 years 167 43.8
>30years 121 31.8
Total 381 100
Source: Survey data (2014)
Table 4.4 summarizes the distribution of the respondents by age. Since the vast majority of
respondents were well over 24 years of age, approximately 75.6%, we can conclude that the
use of mobile phone services is more prevalent among young adults than teenage youth.
This can be attributed to their level of income, social status, occupational demand and
robust activities of life.
61
4.2 Extent of Service Quality Practised by Mobile Phones Firms in Kenya
Addressing the objectives of the study requires description of several explanatory variables
to ascertain their explanatory capacity. This was achieved and presented frequency
distributions, means and standard deviation for each variables consecutively. First, effort
was put to establish the extent of service quality practised by mobile phones firms in Kenya.
To determine this, respondents were asked to indicate the extent to which mobile phone
firms carry out service quality practices on a scale of 1 to 7. In this study, SERVQUAL
scale consisting of five dimensions namely; Tangibles, Reliability, Responsiveness,
Assurance and Empathy were used as a measure of service quality practices in the mobile
phone sector in Kenya.
4.2.1 Tangible dimension of Service Quality
The descriptive measures of tangible dimensions of service quality are found in Table 4.5.
Respondents were also asked to indicate their level of agreement with the extent to which
firms have modern looking equipment, visually appealing physical facilities, neat
employees and visually appealing materials such as brochures.

62
Table 4.5 Measure of tangible dimension of service quality
Response scale
1 2 3 4 5 6 7 Mean
Std.
Dev
My mobile network
provider has
modern-looking
equipment N 5 5 12 24 62 111 162
% 1.3% 1.3% 3.1% 6.3% 16.3% 29.1% 42.5% 5.92 1.288
The physical
facilities at my
mobile network
provider is visually
appealing N 7 4 15 23 64 147 120
% 1.8%
1.0
% 3.9% 6.0% 16.8% 38.6% 31.5% 5.77 1.29
Employees at my
mobile network
provider are neat in appearance N 8 9 11 36 71 128 114
% 2.1%
2.4
% 2.9% 9.4% 18.4% 33.6% 29.9% 5.63 1.385
Material e.g.
brochures or
statements
associated with the
service was visually
appealing in an
excellent mobile
network provider N 11 9 8 31 70 105 145
% 2.9% 2.4% 2.1% 8.1% 18.4% 27.6% 38.1% 5.73 1.457
Overall Mean 5.76 1.355
1=Strongly disagree, 2=Disagree, 3= somewhat disagree, 4=Neither agree nor disagree, 5=Somewhat
agree, 6=Agree and 7=Strongly agree.
Source: Survey data (2014)
From Table 4.5, it is evident that the tangible aspects of service quality were practiced to a
high extent by mobile phone companies in Kenya. On a scale of 1 to 7, the average overall
mean score revealed that tangibles was at a high level of 5.76 representing 82.3% of
respondents. This suggests that it is a prevalent practice of service quality among mobile
phone firms in Kenya.
4.2.2 Reliability dimension of Service Quality
The descriptive measures of reliability dimensions of service quality are found in Table 4.6.
Respondents were are asked to indicate their level of agreement with the extent to which
firms promises to do something by certain time, will show sincere interest in solving

63
customer interest, will perform service right the first time, will provide services at the time
they promise to do so and will insist on error-free record.
Table 4.6 Measure of Reliability Dimension of Service Quality
Response scale
N 1 2 3 4 5 6 7 Mean
SD
When my mobile
network provider
promises to do
something by a
certain time, it will
do so. N 26 16 9 35 80 116 97 5.28
1.7
1
% 6.8%
4.2%
2.4% 9.2%
21.0%
30.4%
25.5%
When customers
have a problem my
mobile network
provider will show
a sincere interest in
solving it N 8 13 20 52 87 101 97 5.35 1.475
%
2.1
%
3.4
%
5.2
%
13.6
%
22.8
%
26.5
%
25.5
%
My mobile
network provider will perform the
service right the
first time N 16 20 24 41 104 94 78 5.1 1.611
%
4.2
%
5.2
%
6.3
%
10.8
%
27.3
%
24.7
%
20.5
%
My mobile
network provider
will perform their
service at the time
they promise to do
so N 17 23 24 48 91 86 89 5.08 1.679
% 4.5%
6.0%
6.3%
12.6%
23.9%
22.6%
23.4%
My mobile
network provider
will insist on error-
free record N 23 20 33 65 64 85 84 4.92 1.766
%
6.0
%
5.2
%
8.7
%
17.1
%
16.8
%
22.3
%
22.0
%
Overall mean 5.15 1.648
1=Strongly disagree, 2=Disagree, 3= somewhat disagree, 4=Neither agree nor disagree,
5=Somewhat agree, 6=Agree and 7=Strongly agree.
Source: Survey data (2014)
From Table 4.6, it is evident that reliability aspects of service quality were practiced to a
high extent by mobile phone companies in Kenya. On a scale of 1 to 7, the average overall
mean score revealed that reliability was moderately level at 5.15 (SD. = 1.648) representing
73.6% of respondents. This suggests that it is a moderately prevalent practice of service
quality among mobile phone firms in Kenya.

64
4.2.3 Responsiveness Dimension of Service Quality
The descriptive measures of responsiveness dimensions of service quality are found in
Table 4.7. Respondents were also asked to indicate their level of agreement with the extent
to which firm’s employees will tell customers exactly when the service will be performed, if
they will give prompt service to customers, if employees will always be willing to help
customers and that they will not be too busy to respond to customers’ requests.
Table 4.7 Measure of Responsiveness Dimension of Service Quality
Response scale
1 2 3 4 5 6 7 Mean SD
Employees of my
mobile network
provider will tell
customers exactly when
services will be
performed
N 24 14 21 34 107 90 90 5.15 1.68
% 6.3% 3.7% 5.5% 8.9% 28.1% 23.6% 23.6%
Employees of my
mobile network
provider will give
prompt service to
customers.
N 17 24 14 47 93 109 73 5.11 1.621
% 4.5% 6.3% 3.7% 12.3% 24.4% 28.6% 19.2%
Employees of my
mobile network
provider will always be
willing to help
customers
N 14 12 20 43 85 99 104 5.35 1.567
% 3.7% 3.1% 5.2% 11.3% 22.3% 26.0% 27.3%
Employees of my
mobile network
provider will never be
too busy to respond to
customer request
N 101 47 38 52 55 46 42 3.57 2.105
% 26.5% 12.3% 10.0% 13.6% 14.4% 12.1% 11.0%
Overall Mean 4.80 1.74
1=Strongly disagree, 2=Disagree, 3= somewhat disagree, 4=Neither agree nor disagree, 5=Somewhat
agree, 6=Agree and 7=Strongly agree.
Source: Survey data (2014)

65
Table 4.7 revealed that Responsiveness aspects of service quality were practiced to a
moderate extent by mobile phone companies in Kenya. On a scale of 1 to 7, the average
overall mean score revealed that responsiveness was at a moderate level of 4.80 (SD =
1.743) representing 68.6% of respondents who are in agreement. This suggests that it is a
moderately prevalent practice of service quality among mobile phone firms in Kenya.
4.2.4 Assurance Dimension of Service Quality
Table 4.8 illustrates the responses to measures of assurance dimensions of service quality.
Respondents were further asked to indicate their level of agreement with the extent to which
firms’ employees’ behaviour will instil confidence in customers, employees will be
consistently courteous with their customers, customers will be safe in their transactions and
employees will have the knowledge to answer customer questions.

66
Table 4.8 Measure of Assurance Dimension of Service Quality
Response scale
1 2 3 4 5 6 7 Mean SD
The behaviour of
Employees will
instill confidence
in customer
N 8 10 12 48 80 101 122 5.55 1.438
% 2.1% 2.6% 3.1% 12.6% 21.0% 26.5% 32.0%
Customers will be
safe in their money
transfer
transactions
N 19 23 23 38 82 98 96 5.16 1.716
% 5.0% 6.0% 6.0% 10.0% 21.5% 25.7% 25.2%
Employees of
mobile phone firms
will be consistently
courteous with
customers
N 5 10 9 29 86 111 128 5.71 1.328
% 1.3% 2.6% 2.4% 7.6% 22.6% 29.1% 33.6%
Employees of
mobile phone firms
will have the
knowledge to
answer customer
questions
N 7 6 11 34 73 95 153 5.79 1.375
% 1.8% 1.6% 2.9% 8.9% 19.2% 24.9% 40.2%
Overall Mean 5.55 1.46
1=Strongly disagree, 2=Disagree, 3= somewhat disagree, 4=Neither agree nor disagree, 5=Somewhat
agree, 6=agree and 7=Strongly agree.
Source: Survey data (2014)
As indicated in Table 4.8, it is evident that assurance aspects of service quality were
practiced to a greater extent by mobile phone companies in Kenya. On a scale of 1 to 7, the
average overall mean score revealed that assurance was at a moderate level of 5.55
(SD=1.464) representing 79.3% of respondents. This suggests that it is a highly prevalent
practices of the services quality among mobile phone firms in Kenya.
4.2.5 Empathy Dimension of Service Quality
The survey responses for empathy dimensions of service quality are depicted in Table 4.9.
Respondents were asked to indicate their level of agreement with the extent to which firms

67
will give customers individual attention, will provide an operating hours convenient to their
customers, will understand the specific needs of customers and will have customers’ best
interest in heart. The responses were on a 7-point scale and revealed that empathy was at a
moderately high level of 5.36 (SD = 1.575) representing 76.6% of respondents who were in
agreement with that view suggesting that it is a moderately prevalent practice of service
quality among mobile phone firms in Kenya.
Table 4.9 Empathy Dimension of Service Quality
Response scale
1 2 3 4 5 6 7 Mean Std.
Dev
My mobile network
provider will give
customer individual
attention
N 15 9 10 19 61 125 141 5.74 1.507
% 3.9% 2.4% 2.6% 5.0% 16.0% 32.8% 37.0%
Employees give
customers personal attention
N 14 12 12 32 76 133 100 5.49 1.504
% 3.7% 3.1% 3.1% 8.4% 19.9% 34.9% 26.2%
My mobile network
provider will have operating hours and
location convenient
to all its customers
N 25 12 18 55 70 92 105 5.2 1.735
% 6.6% 3.1% 4.7% 14.4% 18.4% 24.1% 27.6%
The employees
understand the
specific needs of
customers
N 12 9 23 43 85 96 112 5.41 1.531
% 3.1% 2.4% 6.0% 11.3% 22.3% 25.2% 29.4%
My mobile network
provider will have
customer’s best
interest at heart
N 20 14 28 64 93 100 62 4.95 1.597
% 5.2% 3.7% 7.3% 16.8% 24.4% 26.2% 16.3%
Overall Mean 5.36 1.575
1=Strongly disagree, 2=Disagree, 3= somewhat disagree, 4=Neither agree nor disagree, 5=Somewhat
agree, 6=Agree and 7=Strongly agree.
Source: Survey data (2014)

68
4.2.6 Summary of the Extent of Service Quality Practised by Mobile Phones Firms in
Kenya
Table 4.10 shows that tangibility as one of the construct used to measure the extent of
service quality is a moderately prevalent practice at 82.3% (mean score= 5.76, SD=1.355)
among mobile phone firms in Kenya. This implies that the surveyed firms have equipment
that seem to be modern which is visually appealing to the sampled respondents in the study
area. This was closely followed by assurance dimension of service quality at 79.3% (mean
score=5.55, SD =1.464). Respondents strongly agreed that employees’ instil confidence in
their customers and consistently remain courteous. However, responsiveness recorded the
lowest mean score of 4.80 (68.6%) indicating that it was only moderately practised by the
mobile phone firms in the study area.
Table 4.10 Summary of the Extent of Service Quality Practised by Mobile
Phone Firms in Kenya
Overall Mean score SD Percent
Score
1.Tangibility 5.76 1.355 82.3%
2.Reliability 5.15 1.648 73.6%
3.Responsiveness 4.80 1.743 68.6%
4. Assurance 5.55 1.464 79.3%
5. Empathy 5.36 1.575 76.6%
Mean Composite
Service quality
5.324 1.557 76.08%
Source: Survey data, 2014
On the whole, it is evident that the prevalent view among the respondents regarding service
quality as was practiced among the surveyed mobile phone firms was at a moderate level as
revealed by an overall mean score of 5.324 (SD.=1.557) representing 76.08% of responses
in support of that view. All variables have mean values around or slightly below the mean
composite service quality of 5.324. This further suggests that service quality is applied to a
moderate extent across all its five dimensions namely: Tangibles, Reliability,
Responsiveness, Assurance and Empathy meaning that mobile phone firms in Kenya have
adopted service quality practices to moderately significant level.

69
4.3 Extent of Customer Satisfaction among Mobile Phone Firms in Kenya
In addition, the researcher sought to establish the extent of customer satisfaction among
mobile phone firms in Kenya descriptively as shown in Table 4.11
Table 4.11: Extent of Customer Satisfaction among Mobile Phone Firms in Kenya
Response scale
1 2 3 4 5 6 7 Mean SD
Overall, I am satisfied
with my current mobile
network provider
N 24 24 12 30 108 76 106 5.17 1.754
% 6.3 6.3 3.1 7.9 28.3 19.9 27.8
I am likely to continue to
choose/repurchase from
my mobile network
provider
N 22 17 17 46 92 89 97 5.17 1.692
% 5.8 4.5 4.5 12.1 24.1 23.4 25.5
I am likely to recommend my mobile network
provider to a friend and
family
N 17 16 11 41 81 97 117 5.4 1.629
% 4.5 4.2 2.9 10.8 21.3 25.5 30.7
The services offered to
me were important to me
N 1 9 13 41 70 127 117 5.68 1.295
% 0.3 2.4 3.4 10.8 18.4 33.3 30.7
The services offered to
me fit well with my
situation/problems
N 10 20 20 37 93 108 86 5.28 1.537
% 2.6 5.2 5.2 9.7 24.4 28.3 22.6
The services offered to
me exceeded the
requirement my
situation/problems
N 48 43 45 75 80 57 32 4.04 1.537
% 12.6 11.3 11.8 19.7 21.0 15.0 8.4
I feel absolutely delighted
with delivered services
N 16 13 30 61 95 93 71 5.03 1.569
% 4.2 3.4 7.9 16.0 24.9 24.4 18.6
I feel very pleased with
services delivered
N 13 17 31 56 94 81 81 5.06 1.594
% 3.4 4.5 8.1 14.7 24.7 21.3 21.3
I am completely satisfied
with the services
delivered by the service
provider
N 26 26 23 52 94 74 85 4.91 1.783
% 6.8 6.8 6.0 13.6 24.7 19.4 22.3
Overall Mean 5.08 1.599
1=Strongly disagree, 2=Disagree, 3= somewhat disagree, 4=Neither agree nor disagree,
5=Somewhat agree, 6=Agree and 7=Strongly agree.
Source: Survey data (2014)

70
On a seven point Likert scale, respondents were asked to show their level of agreement with
9 items used as indicators or measures of customer satisfaction. The findings revealed that
customer satisfaction levels among mobile phones users in the study area is at a moderate
level of 72.6% (mean score 5.08, SD = 1.599). Specifically, a vast majority of respondents
81.1% (mean score of 5.68, SD = 1.295) were strongly in agreement that the services
provided to them by the mobile phone firms were important to them. Whereas, only 57.7%
(mean score= 4.04, SD. =1.537) of the respondents agreed that the services offered to them
by their respective mobile phone companies exceeded the requirement of their situation or
problems. There are, however, varied responses for the remaining items that ranged from
4.04 to 5.68 in mean score.
4.4 Extent of Service Failure in Mobile Phone Sector in Kenya
In this study, service failure was measured by service failure classification model proposed
by Bitner et al. (1990) that was operationalized as: delivery failures, response failure and
unprompted/unsolicited employee actions. On a 7 point Likert scale, the respondents were
asked to consider their score on the extent to which the network service provider gave
unreasonable service, provided unreasonably slow service, failed to respond to individual
customer needs and special request or even ignored customers and exhibited unusual
behaviour like ruddiness. Table 4.12 illustrates the response to the measure of service
failure.

71
Table 4.12: Measure of Service Failure in Mobile Phone Firms in Kenya
Response scale
1 2 3 4 5 6 7 Mean S D
My mobile network provider
will give unreasonable service.
N
%
119
31.2
94
24.7
51
13.4
29
7.6
30
7.9
22
5.8
34
8.9
2.89 1.963
My mobile network provider
will provide unreasonably slow
service
N
%
79
20.7
98
25.7
64
16.8
36
9.4
41
10.8
33
8.7
26
6.8
3.17 1.871
Employees of my mobile
network provider fail to
respond to individual customer
needs and special request
N
%
117
30.7
84
22.0
52
13.6
41
10.8
42
11.0
16
4.2
27
7.1
2.9 1.878
Employees of my mobile
network provider have poor
attitudes towards customers
N
%
141
37
121
31.8
34
8.9
23
6.0
15
3.9
17
4.5
30
7.9
2.53 1.862
Employees of my mobile
network provider will ignore
customers
N
%
146
38.3
111
29.1
40
10.5
19
5.0
18
4.7
28
7.3
19
5.0
2.51 1.813
Employees of my mobile
network provider exhibits
unusual behaviour such as
rudeness and abusiveness
Overall
mean
N
%
157
41.2
115
30.2
43
11.3
18
4.7
11
2.9
15
3.9
22
5.8
2.33
2.723
1.717
1.850
1=Strongly disagree, 2=Disagree, 3= somewhat disagree, 4=Neither agree nor disagree, 5=Somewhat agree,
6=Agree and 7=Strongly agree.
Source: Survey Data (2014)
From Table 4.12, the responses revealed that most of the variables measuring service failure
have mean values close to the mean point of three. Based on the overall mean of 2.723
(SD.=1.850), it appears that the level of occurrence of service failure associated with mobile
phone services in Kenya has been reported to be low among mobile phone users.
4.5 Extent of Customer Communication in Mobile Phone Sector in Kenya
As a necessary part of descriptive analysis of the explanatory variables, the study sought to
establish from customers’ perspective the extent to which the mobile phone firms have put
in place channels or mechanisms to facilitate free flow of communication between their
customers and themselves. Table 4.13 illustrates the responses to measures of customer
communication. Respondents were also asked to indicate their level of agreement with the
extent to which the mobile network provider has put in place channels for receiving
complaints from customers, mobile network provider has put in place channels for receiving
suggestions from customers, my mobile network provider has put in place channels for

72
receiving compliments from customers and customers communicate their dissatisfaction by
abandoning usage of the network services. Table 4.13 illustrates the responses to the
measure of customer communication.
Table 4.13 The Measure of the Extent of Communication Levels
Response scale
1 2 3 4 5 6 7 Mean Std.
Dev
My mobile network
provider has put in place
channels for receiving
complaints from
customers/subscribers
N
%
18
4.7
10
2.6
12
3.1
36
9.4
75
19.7
99
26.0
131
34.4
5.52 1.607
My mobile network provider has put in place
channels for receiving
suggestions from
customers/subscribers
N %
19 5.0
20 5.2
17 4.5
44 11.5
82 21.5
123 32.3
75 19.7
5.16 1.632
My mobile network
provider has put in place
channels for receiving
complements from
customers/subscribers.
N
%
17
4.5
17
4.5
27
7.1
46
12.1
78
20.5
111
29.1
82
21.5
5.15 1.637
Subscribers/customers communicate their
dissatisfaction by
abandonment of usage of
the network services.
N %
34 8.9
22 5.8
29 7.6
63 16.5
69 18.1
86 22.6
76 19.9
4.78 1.849
Mean
5.153 1.681
1=Strongly disagree, 2=Disagree, 3= somewhat disagree, 4=Neither agree nor disagree, 5=Somewhat agree,
6=Agree and 7=Strongly agree.
Source: Survey Data (2014)
From Table 4.13, the responses revealed that most of the variables measuring customer
communication had mean values close to the mean point of five. Based on the overall mean
of 5.153 (SD =1.681), it appears that the level of customer communication practices
associated with mobile phone services in Kenya has been reported to be moderately high
among mobile phone users.
4.6 Examining the Effect of Service Quality on Customer Satisfaction
The first objective was to establish whether service quality practice across its five
dimensions had an effect on satisfaction levels of mobile phone customers in Kenya. This

73
was actualized through the testing of the first null hypothesis stated as; Ho: βi =0 Service
quality has no significant influence on customer satisfaction among Kenya’s mobile phone
firms. The first step to conducting multiple regression analysis in order to test this stated
hypothesis was by conducting correlation analysis. Service quality was measured by five
parameters namely: Tangibles, Reliability, Responsiveness, Assurance and empathy; which
are consistent with those used by leading researchers like (Parasuraman, Berry and
Zeithaml, 1985) in measuring service quality standards. The results of bivariate association
between service quality measures and customer satisfaction are discussed in subsection
4.6.1.
4.6.1 Bivariate Association between Service quality measures and Customer
Satisfaction
In order to assess bivariate association between independent and dependent variable,
Spearman rank Correlation analysis was performed. Since both service quality dimensions
and customer satisfaction is measured in Likert scale and hence ordinal, Spearman rank
correlation becomes appropriate non-parametric measure of strength of association between
these variables. (Norman, 2010; Churchill and Iacobucci, 2004). The correlation matrix of
all variables was depicted in Table 4.14.
Table 4.14: Correlations of Variables with Customer Satisfaction among Mobile
Phone Users in Kenya.
Variables N Correlation with Customer
satisfaction (Spearman’s rho, ρ)
p-value
Tangibles 381 .381** .000
Reliability 381 .570** .000
Responsiveness 381 .553** .000
Assurance 381 .587** .000
Empathy 381 .564** .000
**. Correlation is significant at the 0.01 level (1-tailed)
Source: Main survey data, 2014
The results from the correlation matrix in Table 4.14 revealed that customer satisfaction has
a significant positive correlation with all the five dimensions of service quality. The
association between tangibles and customer satisfaction ρ = 0.381, (p= 0.000) is positively
weak but significant at 95% confidence level. The association between reliability and
customer satisfaction ρ = 0.570, (p = 0.000) is positive and equally significant, suggesting
that there is a statistically significant positive association between reliability and customer

74
satisfaction. Similarly, the association between responsiveness and customer satisfaction ρ =
0.553, (p = 0.000) was found to be positive and sufficiently significant at 95% confidence
level. The association between assurance and customer satisfaction ρ = 0.587, (p = 0.000)
was found to be positive and equally significant. Lastly, the association between empathy
dimension of service quality and customer satisfaction ρ = 0.561, (p = 0.000) was found to
be positive and significant. These results concur with those of Wang and Shieh (2006)
whose findings indicated that overall service quality has a significantly positive effect on
customer satisfaction. Among the five dimensions of service quality except for
responsiveness (r=0.195, p> 0.1), all have a significant positive effect on customer
satisfaction (Wang and Shieh, 2006). This result implies that as service quality is enhanced
across its five dimensions namely: Tangibles, Reliability, Responsiveness, assurance and
empathy, the customer satisfaction level increases.
However, in an attempt to overcome the shortcoming with correlation results and in order to
test a null hypothesis for the first objective, a multiple regression analysis between the five
indicators of service quality as independent variables and customer satisfaction as
dependent variable was run. The detailed results of the multiple regression analysis
involving all indicators of the service quality and customer satisfaction are presented in
Table 4.15, Table 4.16 and Table 4.17 and discussed in the following subsections.
Table 4.15: ANOVA Results of the Relationship between Service Quality Measures
and Customer Satisfaction
Model Sum of
Squares
Df Mean Square F Sig.
1
Regression 482.715 5 96.543 116.932 .000
Residual 309.612 375 .826
Total 792.327 380
a. Dependent Variable: Customer satisfaction
b. Predictors: (Constant), Empathy, Tangibles, Responsiveness, Assurance, Reliability
Source: Survey Data, 2014
Table 4.15 presents ANOVA results of the Service quality-customer satisfaction model.
The data test revealed that F (5, 375) = 116.932 at p = 0.000, an indication that the model
fits the given data well.

75
Table 4.16: Summary of Service Quality-Customer Satisfaction Model
Model R R Square Adjusted R
Square
Std. Error of
the Estimate
Change Statistics Durbin-
Watson R Square
Change
F
Change
df1 df2 Sig. F
Change
1 .781 .609 .604 .90864 .609 116.932 5 375 .000 1.842
a. Predictors: (Constant), Empathy, Tangibles, Responsiveness, Assurance, Reliability
b. Dependent Variable: Customer satisfaction
Source: Survey data, 2014
The Service quality-Customer satisfaction model summary in Table 4.16 shows that the
proportion of variance in the customer satisfaction explained by the independent variables
(all five dimensions of service quality) is 60.9% or R2=0.609. According to Cohen (1988),
60.9 % of variation explained by the model is regarded as a large increase. The other
variation in customer satisfaction of 39.1% was explained by other external factors outside
this model. The difference between R2=0.609 and adjusted R2=0.604 is 0.005 and shows
that the suggested model generalizes quite well as the adjusted R2 is too close to R2.
According to interpretation by Field (2005), shrinkage of less than 0.5 depict that the
validity of the model is very good. The value of Durbin-Watson is 1.842, which is close to
2. This indicates lack of serial correlation.
Table 4.17: Estimated Regression Coefficients for Variables in Service Quality-
Customer Satisfaction Model
Table Coefficients
Model Unstandardized
Coefficients
Standardized
Coefficients
T Sig. Collinearity Statistics
B Std. Error Beta Tolerance VIF
(Constant) -.678 .301 -2.252 .025
Tangibles -.060 .054 -.043 -1.093 .275 .672 1.488
Reliability .143 .055 .129 2.620 .009 .431 2.321
Responsiveness .039 .048 .036 .806 .421 .526 1.900
Assurance .419 .055 .318 7.623 .000 .600 1.667
Empathy .559 .049 .473 11.370 .000 .601 1.664
Dependent Variable: Customer satisfaction
Source: Main survey, 2014.
Table 4.17 shows that out of the five independent variables, three independent variables
which include: Reliability (β = 0.143, p = 0.009); Assurance (β = 0.419, p = 0.000) and
Empathy (β = 0.559, p = 0.000) had positive significant effect on customer satisfaction. The
β statistics is interpreted by ranking measures of these independent variables, whereby the

76
higher the magnitude of the β values, the more influence the variables has on the customer
satisfaction. The unstandardized β coefficient of reliability shows that units change in the
level of reliability causes 0.143 standard deviation in customer satisfaction level and the
change is significant as shown by the p-value while a unit change in assurance and empathy
causes 0.419 and 0.559 standard deviation in customer satisfaction levels among mobile
phone firms respectively. Other variables, Tangibles (β = -0.060, p = 0.275) and
Responsiveness (β = 0.039, p = 0.421), had insignificant negative effect and positive effects
on the customer satisfaction levels among mobile phone firms respectively. The coefficient
of a constant term was at (β = -0.678, p = 0.025) and is significant. The negative signs of the
coefficient for indicate that the dimension of Tangibles influences customer satisfaction
negatively though insignificant. The VIF values ranged from 1.488 to 2.321 and these are
within the range recommended by Pan and Jackson (2008), and Rogerson (2001).
Therefore, the regression results indicated that there was a statistically significant positive
relationship between the service quality and customer satisfaction in a mobile phone sector
in Kenya thereby rejecting Ho: βi =0, Service quality has no significant influence on
customer satisfaction among Kenya’s mobile phone firms.
By adding regression coefficient as was shown in Table 4.6.3c, the study developed
analytical model equations for predicting customer satisfaction level among mobile phones
firms:
Ŷ = - 0.678 - 0.060Tangible + 0.143Relaibility + 0.039Responsiveness +
0.419Assurance + 0.559Empathy …..Eq. 4.1
t= (-2.252) (-1.093) (2.620) (0.806) (7.623) (11.370)
S.E= (.301) (.054) (.055) (.048) (.055) (.049)
R2=0.609 or 60.9%
From the foregoing results, the following discussion can be adduced. Firstly, the finding of
the current study has received enormous support from theoretical literature. For instance,
Oliver (1980) acknowledges that customer satisfaction is the direct consequence of service
quality. This affirms the proposition of the expectancy disconfirmation theory which states
that satisfaction level is a result of the difference between the expected and the perceived
performance of service. Moreover, Lai et al., (2009); Wu and Lang, (2009); Kuo et al.,

77
(2009) have all advanced the argument that with the improvement in service quality,
customer satisfaction will be enhanced. Others like (O’Neill and Palmer, 2003) have
concluded that in a highly competitive market place, service quality becomes a very critical
success factor for gaining a sustainable competitive advantage in the marketplace which
will then translate into customer satisfaction.
Empirically, the findings are similar with the study by Walfried et al., (2000) who found
that service quality (R2= 0.74, p < 0.05) yields a significant influence on customer
satisfaction in the banking industry. However, Walfried et al., (2000) finding differed with
the present study as it ignored the use of empathy dimension of SERVQUAL model and
instead dwelt on the functional dimension of quality. Consequently, this has made findings
involving SERVQUAL model less clear. Similarly, Namanda (2013) concurred with
Walfried et al., (2000) by confirming a positive relationship between service quality and
customer satisfaction in the banking sector in Uganda. However, the present study and
Namanda (2013) differed from Walfried et al., (2000). Whereas the former tested and
confirmed that service quality had a positive effect on customer satisfaction when measured
along SERVQUAL scale, the latter tested and confirmed the relationship using functional
quality scale called SERVPERF. Contrary to the above authors, Agbor (2011) failed to
confirm positive significant effect of service quality on customer satisfaction in a university
library services and instead found that there was no significant relationship between service
quality and customer satisfaction. Further support for the result of the present study was
offered by (Lin and Wang, 2006) who, in a case-based study, found service quality to have
a significant positive effect on customer satisfaction (R2=0.410, P=0.000). This finding is
plausible because of the complementary nature of the five dimensions of service quality.
That is to say that service quality exerts more influence if all the five dimensions are
aggregated into a composite variable than if each element is disaggregated.
In Kenya’s banking sector, both Odhiambo (2015) and Auka (2012) conducted studies and
found that service quality is a critical determinant of customer satisfaction but differed in
variables studied. Whereas Odhiambo (2015) analyzed service quality along its five
dimensions namely: tangibles, reliability, responsiveness, assurance and empathy; Auka
(2012) on the other hand, focused on how multiple factors one of which was service quality
influence firm’s competiveness. Nyaoga et al. (2013) found that there is a direct
relationship between service quality and customer satisfaction in air transport in Kenya. By
contrast, Uddin and Bilkis (2012) differed from the present study and Nyaoga et al. (2013)
78
by concluding that service quality and fair price have indirect influence on customer
satisfaction of mass service industries like mobile phone operators. Despite focusing on
mobile telecommunication services in Ghana, Nimako et al. (2010) differed from results of
the present study and that of Wang and Shieh (2016). Whereas, Nimako et al. (2010)
concluded that service quality has weak but significant effect on customer satisfaction,
Wang and Shieh (2006) found that service quality had significantly positive effect on
customer satisfaction in University Library service in Taiwan.
However, the studies (Wang and Shieh, 2006; Shashzad and Saima, 2012; Abdullah and
Rozario, 2009 Namanda, 2013; Nyaoga et al., 2013) have all used small sample sizes thus
limiting the generalizability of their result. Studies by Agbor (2011; Namanda, 2013)
utilized convenience sampling technique thereby rendering their results unfit for
generalization. In other cases, (Stergios et al., 2012; Shashzad and Saima, 2012) had many
parameters which presented a problem for the collection of required data thus reducing the
reliability of their findings. Odhiambo (2015) overlooked two aspects of service quality:
assurance and tangibles hence making these two aspects of service quality and its likely
effect on satisfaction levels of customers unclear. Namanda (2013) ignored two important
dimensions of service quality namely: responsiveness and assurances in its analysis hence
posing a limitation. Nimako et al. (2000) omitted the use of SERVQUAL scale thereby
limiting the conceptualization and dimensionality of the study. Auka (2012) and Uddin and
Bilkis (2012) failed to establish the direct link between service quality and customer
satisfaction but instead focused on the influence that multiple factors had on customer
satisfaction. Furthermore, their finding suffers a weakness due to the problem of data co-
linearity. Nyaoga et al. (2013) used descriptive statistics in their analysis which are
regarded as not better way to establish cause and effect relationship. All the above studies
relating service quality to customer satisfaction have only focused on sectors such as
banking, aviation and tertiary learning institutions which are regarded as high contact
service settings with intense client-service provider interaction. The few studies like
(Nimako et al., 2000) that focused in telecommunication sector overlooked SERVQUAL
perspective of measuring service quality. Therefore, none of the these studies analyzed the
effect of service quality practices on satisfaction of mobile phone service users, as a low
contact service which is highly integrated with technology using an acceptable and
validated SERVQUAL scale. Therefore, information on mobile phone services in Kenya is
lacking. However, the current study has a made a major milestone towards new knowledge

79
by developing and validating service quality measurement scale with enhanced sample size
to be used in measuring low contact services. Unlike past studies which largely focused on
high contact service settings such as banking and hospitality sector, the current study added
to new knowledge by revealing the significantly positive effect of service quality (R2=
0.609, p<0.05) on satisfaction of mobile phone service users, as a low contact service which
is highly integrated with technology with an acceptable measurement scale. Consequently,
the effect of service quality on customer satisfaction in mobile phone services in Kenya was
established.
4.7 Establishing the Moderating Effect of Service Failure on the Relationship between
Service Quality and Customer Satisfaction in Mobile Phone Firms in Kenya
The second objective of the study sought to establish whether the relationship between
service quality practices and customer satisfaction is moderated by service failure. This
involved testing the null hypotheses two stated as: Ho: βi =0, the relationship between
service quality and customer satisfaction is not moderated by service failure among mobile
phone firms in Kenya. This hypothesis was tested and actualized by use of Moderated
Regression Analysis (MRA). This was informed by the realization that weak relationship
among variables can be remedied by incorporating appropriate moderating variable (Luft
and Shields, 2003). Furthermore, inconsistent research findings particularly with regard to
service quality-customer satisfaction can be resolved with the inclusion of the contextual
factors in the form moderator variables. The study tested the interaction between service
quality and service failure. This procedure involved hierarchical regression which entails
entering service quality and service failure in step 1, and then entering the interaction
variable (which is the cross product between service quality and service failure) in step 2. In
order to reduce threats of multi-collinearity by reducing the size of any high correlation of
service quality and service failure with the new interaction, standardized values were used
for the interaction variable (Ondoro, 2014). The summary regression coefficients are shown
in Table 4.18.

80
Table 4.18: Estimated Regression Coefficients for Variables in the Effect of Service Failure
on the Relationship between Service Quality-Customer Satisfaction Model
Model Unstandardized
Coefficients
Standardized
Coefficients
T Sig. Collinearity Statistics
B Std. Error Beta Tolerance VIF
1
(Constant) -.764 .192 -3.975 .000
Service quality .224 .047 .144 4.717 .000 .566 1.768
Service failure .865 .033 .792 25.872 .000 .566 1.768
2
(Constant) -.391 .161 -2.423 .016
Service quality .267 .039 .173 6.789 .000 .562 1.781
Service failure 1.437 .051 1.315 28.044 .000 .415 2.410
Interaction term -.662 .050 -.598 -13.248 .000 .421 2.375
a. Dependent Variable: Customer satisfaction
Source: survey data (2013)
The Table 4.18 shows the standardized (β) and un-standardized (B) coefficients for Service
quality and service failure with and without the interaction term. The un-standardized
coefficient should be used while reporting coefficient for moderation as they represents
simple effects rather than the main effects that are exposed in the additive regression model
(Whisman and McClelland, 2005). Without the interaction term, B for Service quality and
service failure are 0.224 and 0.865 respectively with both being significant at (p=0.000).
The B coefficient when the interaction term was introduced for service quality, service
failure (moderator) and interaction term are 0.267, 1.437, and -0.662 respectively. As a
result, the hypothesized moderation model was confirmed to be;
Ŷ = -0.391+ 0.267X + 1.437Z -0.662XZ………………………Equation 4.2
The model can be re expressed as;
Ŷ = (-0.391 + 1.437Z) + (0.267 -0.662Z) X……………….........Equation 4.3
In the model, the intercept and the XY slope is influenced by Z (the moderate variable)
intercepts and slopes of line Ŷ X. The un-standardized co-efficient of the moderator model
b3 is -0.662. This means that for each unit increase in Z, the slope relating X to Y decreases
by -0.662. This further mean that, as service failure encounters increases by one unit, the
satisfaction level of customers decreases by (-0.662). The summary statistics for moderator
regression model are shown in Table 4.19.

81
Table 4.19 Model Summary of Effect of Service Failure on the Relationship
Between Service Quality and Customer Satisfaction
Model R R
Square
Adjusted
R Square
Std. Error of
the Estimate
Change Statistics Durbin-
Watson R Square
Change
F
Change
df
1
df2 Sig. F
Change
2 .894 .800 .798 .64824 .800 753.773 2 378 .000
3 .929 .863 .862 .53617 .064 175.521 1 377 .000 1.972
a. Predictors: (Constant), Service failure, Service quality
b. Predictors: (Constant), Service failure, Service quality, Interaction term
c. Dependent Variable: Customer satisfaction
Source: Survey data (2014)
As shown in Table 4.19, the full Model 3 includes service quality as the independent
variable, service failure as the moderator and the interaction effects. This model is
significant at (R2=0.863, Adjusted R2=0.862, F (1,377) 175.521, p=.000) thus rejecting
hypothesis Ho: βi = 0; (the relationship between service quality and customer satisfaction is
not moderated by service failure among mobile phone firms in Kenya). When compared
with the reduced Model 2, which only includes predictor variable and moderators (steps 2),
the addition of the interaction terms in the full model significantly increases the R2 by
(∆R2=0.064; p=0.000) or 6.4%). Although it was small, this change was statistically
significant. Moreover, the variables in the two models: (Model 2=service quality and
service failures, Model 3= service quality, service failure and interaction term) are also
found to predict variance in the customer satisfaction significantly differently (Model 2-F
change=755.77; Model 3- F change=175.521, p=.000). Therefore, the moderating effect of
service failure which improves the model’s goodness of fit is statistically evident. The
hypothesised contingency model therefore explains 86.3% of the variance in customer
satisfaction among mobile phone firms in Kenya.
The adjusted R2 of Model 2 is 0.798 and R2 is 0.800 for the main model with service failure.
When the interaction of service failure with main the predictor variable is also introduced in
the model, R2 is 0.863 with adjusted R2 dropping to 0.862. The differences in the two cases
of R2 for each model are less than a ceiling of 0.5 (Field, 2005). The low shrinkage between
the R2 and adjusted R2 in each model depict both models as valid and stable for the
prediction of the dependent variable, customer satisfaction, at 80% and 86.3% variance
respectively. The power to detect interaction effects is often low because of the small effect
sizes observed in social science (Aikin and West, 1991). A similar view was held by

82
Fairchild and Mackinnon (2009) who noted that interaction effect; in this case 6.4% is very
low but confirm moderation. The significant interaction indicates that the presumed
moderator (service failure) does actually moderate the effect of the predictor (service
quality) on the outcome variable (customer satisfaction among mobile phone firms in
Kenya).
This finding concurs with Zeithaml et al. (1990) who observed that service failure has
immense impact on consumers especially in their “switching behaviour”. The study found
out that service failure moderate the relationship between service quality and customer
satisfaction negatively (∆R2=0.064; p=0.000). However, the results imply that service
quality does not operate independently as a determinant of customer satisfaction but rather
its predictive power can be enhanced by managing service failure encounters as this will
impact negatively on service quality-customer satisfaction model. Furthermore, the results
imply that when the firms put effort to reduce on service failures encounters, the effect of
service quality on customer satisfaction will be intensified thus resulting to the higher the
satisfaction levels of the customers among mobile phone companies in Kenya.
Empirical studies that investigate the moderating role of service failure on the relationship
between service quality and customer satisfaction are limited. One notable case was a
moderation study by Wang et al. (2004) that sought to establish the moderating role of
customer value in the relationship between service quality and customer satisfaction found
it significantly so. Similarly, Caruana et al. (2000) also explored the moderating role of
value but differed in the direction of results with Wang et al. (2004). Whereas Wang et al.
(2004) found positively significant moderating effect, while Caruana et al. (2000) found
that customer value had a small negative moderating effect on the relationship.
Consequently, this has made previous attempts that sought to test for moderation effect on
the service quality-customer satisfaction relationship fail to clarify the causes of the
inconsistent results due to poor conceptualization of dimensionality of variables. Attempt
by Walfried et al., (2000) to introduced service failure as a moderator bore little success as
there was no moderation. Elsewhere, Reimann et al., (2008) differed with Walfried et al.,
(2000) as they modelled and tested the moderation effect of uncertainty avoidance on the
relationship between perceived service quality and customer satisfaction instead of service
failure and found it significantly so.

83
Studies by (Wang et al., 2004; Caruana et al., 2000); have all tested for other variables like
customer value while (Reinman et al., 2008) tested for uncertainty avoidance as possible
moderators in service quality-customer satisfaction relationship. All these studies have
therefore failed to hypothesise and model service failure as a possible moderator. Other
studies like Mc Collough et al., (2000) only tested for direct effect of service failure on
customer satisfaction instead of its moderating role on quality-satisfaction relationship their
by failing to give reasons for the inconsistent results. Further, Caruana et al., (2000) study
had the problem of multicollinearity since variables were highly correlated coupled.
Moreover, most studies that have tested moderation effect have focused on other sectors
such as banking services, audit services which is high end and high contact services with
high service standards and high customer expectations. Their analysis has excluded the
mobile phone sector in a developing country like Kenya. However, the finding of the
present study has made a major milestone towards bringing clarity on the interrelationship
between service quality and customer satisfaction relationship that has often remained
inconsistent. This study hypothesized and confirmed moderation of service failure
(∆R2=0.064; p=0.000) on the elusive service quality-customer satisfaction relationship. The
study further added new knowledge that has created clarity on the reasons for mixed and
inconsistent results of the research in this realm. Indeed, the findings, imply that, through
proper alignment and management of service failure encounters, the influence that service
quality has on customer satisfaction can be intensified. This study therefore made a
significant contribution to knowledge by highlighting on how service failure as a moderator
can be aligned in a quality-satisfaction model to better explain the mixed results by
providing moderation findings as further empirical evidence and for theory development
4.8 Analysis of Moderating Effect of Customer Communication on the Relationship
between Service Quality and Customer Satisfaction
The third objective of the study sought to establish whether the relationship between service
quality and customer satisfaction was moderated by customer communication. This
procedure involved testing the third null hypothesis sated as: (Ho: βi = 0); the relationship
between service quality and customer satisfaction is not moderated by customer
communication among mobile phone firms in Kenya. In order to test the third hypothesis,
moderated regression analysis was done and results were displayed in Table 4.20 and Table
4.21.

84
Table 4.20: Estimated Regression Coefficients for Variables in the Effect of Customer
Communication on the Relationship between Service Quality-Customer Satisfaction
Model
Model Unstandardized
Coefficients
Standardized
Coefficients
T Sig. Collinearity
Statistics
B Std. Error Beta Tolerance VIF
1
(Constant) -.122 .202 -.604 .546
Service quality .269 .049 .173 5.444 .000 .578 1.729
Customer
communication
.793 .033 .760 23.841 .000 .578 1.729
2
(Constant) -.156 .174 -.896 .371
Service quality .168 .043 .109 3.885 .000 .555 1.801
Customer
communication
.453 .041 .434 11.092 .000 .283 3.538
Interaction term .640 .055 .443 11.621 .000 .299 3.349
a. Dependent Variable: Customer satisfaction
Source: Survey Data, 2014
Table 4.20 Shows the standardized (β) and un-standardized (B) coefficients for Service
quality and service failure with and without the interaction term. Without the interaction
term, B for Service quality and customer communication are 0.269 and 0.793 respectively
with both being significant at (p=0.000). The B coefficient when the interaction term was
introduced for service quality, service failure (moderator) and interaction term are 0.168,
0.453, and 0.640 respectively.
As a result, the hypothesized moderation model was confirmed as;
Ŷ = -0.156+ 0.168X + 0.453Z +0.640XZ……………………Equation 4.3
The model can be re expressed as;
Ŷ = (-0.156 + 0.453Z) + (0.168 +0.640Z) X……………….....Equation 4.4
In the model, the intercept and the XY slope is influenced by Z (the moderate variable)
intercepts and slopes of line Ŷ X. The un-standardized co-efficient of the moderator model
b3 is 0.640. This means that for each unit increase in Z, the slope relating X to Y increases
by 0.640. This means that as customer communication levels increases by one unit, the
satisfaction level of customers’ increases by 0.640. The summary statistics for moderator
regression model are shown in Table 4.21.

85
Table 4.21: Model Summary of Effect of Customer Communication on the
Relationship between Service Quality and Customer Satisfaction
Mode
l
R R
Square
Adjusted
R Square
Std. Error of
the Estimate
Change Statistics Durbin-
Watson R Square
Change
F Change df1 df2 Sig. F
Change
1 .882 .778 .777 .68195 .778 662.870 2 378 .000
2 .915 .837 .835 .58593 .059 135.039 1 377 .000 1.670
a. Predictors: (Constant), Customer communication, Service quality
b. Predictors: (Constant), Customer communication, Service quality, Interaction term
b. Dependent Variable: Customer satisfaction
Source: Survey Data, 2014.
As shown in Table 4.21, the full model 3 includes service quality as the independent
variable, customer communication as the moderator and the interaction effects. This model
is significant at (R2=0.837, Adjusted R2=0.835, F (1,377) 135.039, p=.000) thus rejecting
null hypothesis three which states: (Ho: βi = 0); the relationship between service quality and
customer satisfaction is not moderated by customer communication among mobile phone
firms in Kenya. When compared to the reduced Model 2, which only includes predictor
variable and moderators in step 2, the addition of the interaction terms in the full model
significantly increases the R2 (∆R2=0.059; p=0.000 or 5.9 %). Fairchild and Mackinnon
(2009) noted that interaction effect, though small, was significant and depict moderation.
Therefore, the moderating effect of customer communication which improves the model’s
goodness of fit is statistically evident. The hypothesised contingency model thus explains
83.7 % of the variance in customer satisfaction among mobile phone firms in Kenya. The
low shrinkage between the R2 and adjusted R2 in each model depict that the both models are
valid and stable for the prediction of the dependent variable, customer satisfaction, at 77.8
% and 83.7 % variance respectively. Therefore, the presumed moderator (customer
communication) does actually moderate the effect of the predictor (service quality) on the
outcome variable (customer satisfaction) among mobile phone firms in Kenya as was shown
by the significant interaction. Furthermore, the results imply that service quality does not
operate independently as a determinant of customer satisfaction but rather its predictive
power can be enhanced by customer communication. The greater the effort by firms to put
in place customer communication mechanisms, the greater the intensity of influence of
service quality on customer satisfaction levels.

86
This result suggests that aligning service quality with customer communication will lead to
higher satisfaction levels for customers. The notion that customer communication may play
a moderating role is derived from Mohr’s and Nevin’s (1990) theoretical model which
suggests that communication, among other things, serves to moderate the effects of
circumstance and conditions in the service exchange process. Therefore, among other
contextual variables, a proper alignment between customer communication and service
quality can be used to better address the customer satisfaction level. This was further
supported by Walfried et al., (2000) who postulated that the ability of a customer to
communicate freely and easily with the service firm will enhance the quality/satisfaction
relationship. Overall, the study findings find general support that high level of customer
satisfaction and subsequently higher long term profitability can be achieved by aligning or
focusing firm’s communication activities and strategies with service quality practices
(Oliver, 1980; Zeithaml et al., 1990; Gantasala and Padmakumar, 2013; Mohr and Nevin,
1990). Moreover, the resulting clarity facilitates better customer satisfaction by setting
service quality performance standards, goals, criteria and actions (Oliver, 1980). Zeithaml et
al. (1990) concluded that communication will play a critical role in the service delivery
process by eliminating ignorance regarding customers’ expectation by service firms.
Empirical studies on the role of communication as a moderator in the relationship between
service quality and customer satisfaction are indeed limited. For instance, contrary to the
findings of the present study, Walfried et al. (2000) found that moderating role of customer
communication in quality/satisfaction relationship was implausible. In addition, Walfried et
al. (2000) differed from the current study in that, whereas the former conducted a study in
banking services regarded as a high contact services, the latter was conducted study in
mobile phone sector regarded as low contact services. Other studies such as Juaid et al.
(2012) only tested for direct effect of communication on customer satisfaction. Similarly,
Rezaie and Forghani (2011) tested direct effect of communication on customer satisfaction
but differed with Juaid et al. (2012) in the direction of effects. Whereas the later found that
communication has exerted negative insignificant direct effect on customer satisfaction, the
former found that communication plays a vital role in explaining variation in customer
satisfaction. In yet another study by Gantasala and Padmakumar (2013), customer
communication was modelled and tested in terms of its mediating effects of customer
communication on relationship between service quality and customer satisfaction. The
studies by Gantasala and Padmakumar (2013) and Juaid et al., (2012) were similar in terms
87
of the context as both were done in telecommunication sector in Asian market but differed
in terms of focus of their studies. Whereas Juaid et al., (2012) tested for the direct effect of
communication on customer satisfaction and confirmed its significance, Gantasala and
Padmakumar (2013) on the other hand tested for the its mediating role and found it
significant. However, Both Juaid et al., (2012) and Gantasala and Padmakumar (2013)
differed from the finding of the present study that tested and established customer
communication as a moderator in quality-satisfaction relationship.
Despite Juaid et al., (2012) focusing on telecommunication services, their study had failed
to establish the moderating role of communication on the quality-satisfaction relationship.
Rezaie and Forghani, (2011) only tested for direct effects of customer communication
instead of its moderating role. On the other hand, Gantasala and Padmakumar, (2013)
modeled customer communication as a mediator variable instead of a moderator.
Furthermore, these studies as reviewed were conducted in the context of developed
countries hence missing the analysis of Kenya’s mobile phone context. Therefore, despite
customer communication being seen as a theoretically sound moderator, there was no
known attempt to empirically establish the moderating role of customer communication on
the relationship between service quality and customer satisfaction in a low contact services
like telecommunication services. As such, the status and likely effect of customer
communication on quality-satisfaction relationship in Kenya’s mobile phone sector is not
known. It is for this reason that the present study provided an insight into this elusive
explanation by hypothesizing and confirming moderation effect of customer communication
(∆R2=0.059; p=0.000) in the relationship between service quality and customer satisfaction.
Furthermore, the findings of the present study on the moderating role of customer
communication underscore the notion that a match between a company’s communication
strategy and overall service quality strategy is critical in order to satisfy customers. Through
a moderator investigation, the study has made immense contribution to the body of new
knowledge by isolating and studying customer communication as a more refined construct
that facilitates avoidance of ignorance by customers regarding the perceived level of service
quality.
4.9 Summary of the Hypothesized Empirical Framework and Results
Hypothesis one entailed the testing of the main effect to determine the effect of service
quality practices (Tangibles, reliability, responsiveness, assurance and empathy) on

88
customer satisfaction. Hypothesis two tested whether the relationship between service
quality practices and customer satisfaction was moderated by service failure. This involved
the testing of the moderating effect of service failure on the relationship between service
quality and customer satisfaction. Finally, hypothesis three sought to find out if customer
communication had any moderating role on the relationship between each service quality
and customer satisfaction.
The results indicated that service quality practices along its five dimensions positively
influenced customer communication. In the case of the moderating effect of service failure,
the result indicated that service failure played statistically significant role as a moderating
variable in the service quality-customer satisfaction relationship. On the other hand, the
relationship between service quality and customer satisfaction does vary with the level of
customer communication put in place by the mobile phone firms surveyed. In conclusion,
the study findings are that, service failure and customer communication significantly
moderates the relationship between service quality and customer satisfaction among mobile
phone firms in Kenya. Table 4.22 gives a summary of hypotheses testing, both for main
effect and interactive effects.

89
Table 4.22: Summary of the Hypothesized Empirical Framework and Results
Hypotheses Expected
sign
Regression
Coefficient
Statement
1.Main effect of service quality
on customer
satisfaction
Ho: βi =0 Service quality has no significant
influence on customer satisfaction
among Kenya’s mobile phone firms.
i).Tangibles
ii) Reliability
iii) Responsiveness
iv) Assurance
v) Empathy
-
+
+
+
+
-.060
.143
.039
.419
.559
Not significant
Significant
Not significant
Significant
Significant
2.Moderating
Effect of service
failure
Ho: βi =0 The relationship between service quality and customer satisfaction is not
moderated by service failure among
mobile phone firms in Kenya.
- -.662 Significant
3.Moderating
effect of
customer
communication
Ho: βi = 0 The relationship between service
quality and customer satisfaction is not
moderated by customer communication
among mobile phone firms in Kenya.
+ .640 Significant
Source: Survey Data (2014)

90
CHAPTER FIVE
SUMMARY, CONCLUSIONS AND RECOMMENDATIONS
This chapter presents summary of study findings based on each research question,
conclusions and recommendations of the study. It also presents the limitations of the study.
Finally, it suggests areas for further study.
5.1 Summary of Findings
The first objective of the study was to determine the relationship between service quality
and customer satisfaction in mobile phone firms in Kenya. Its corresponding null hypothesis
was that service quality has no significant influence on customer satisfaction among
Kenya’s mobile phone firms. The study revealed that there was a statistically significant
positive relationship between service quality and customer satisfaction in the mobile phone
sector in Kenya. Specifically, three dimensions of service quality: reliability, assurance and
empathy had positive significant effects in the service quality- customer satisfaction model.
The other two dimensions: tangibles and responsiveness had insignificant negative effects
and positive effects on the customer satisfaction levels among mobile phone firms
respectively. This is in contrast to prior studies that found dimensions like tangibles and
responsiveness as significantly important aspects of service quality in other sectors like
banking and hospitality sector. These findings contributed to new knowledge by developing
and validating service quality measurement scale with enhanced sample size to be used in
the subsequent studies involving low contact services. It also provided a new empirical
evidence linking service quality practices to satisfaction levels of customers in low contact
service settings. It further provided information on mobile phone services quality practices
in Kenya which were previously lacking.
The second objective of the study was to determine the moderating effect of service failure
on the relationship between service quality and customer satisfaction in mobile phone firms
in Kenya. Its corresponding null hypothesis was that the relationship between service
quality and customer satisfaction is not moderated by service failure among mobile phone
firms in Kenya. The study found that the moderating effect of service failure on the
relationship between service quality and customer satisfaction is statistically significant.
However, this findings runs contrary to other studies in other sectors like banking services

91
which found that service failure was not a significant moderator in the relationship between
service quality and customer satisfaction. The study made a major milestone towards by
clarifying the interrelationship between service quality and customer satisfaction through a
moderator investigation.
The third objective involved the analysis of the moderating effects of customer
communication on the relationship between service quality and customer satisfaction. Its
corresponding null hypothesis was that the relationship between service quality and
customer satisfaction is not moderated by customer communication among mobile phone
firms in Kenya. The study revealed that positive relationship between service quality and
customer satisfaction was moderated by customer communication. In contrast, other studies
conducted in a high contact service setting like banking services did not reveal any
moderating role of customer communication in the relationship between service quality and
customer satisfaction. This finding is therefore a breakthrough in explaining the paradoxical
relationship between service quality and customer satisfaction that can be enhanced by
inclusion of customer communication as a moderator variable.
5.2 Conclusions
Three conclusions can be drawn based on the preceding evidence. The first conclusion
based on the first results is that overall, service quality practice is a critical antecedent of
customer satisfaction in a mobile phone services in Kenya. This finding makes an important
contribution in terms of modelling quality-satisfaction relationship as it identifies the
variables which can be manipulated to better predict the level of customer satisfaction
arising from the quality of services offered by mobile phone firms in the study area.
Based on the second results, it is concluded that, controlling for service failure encounters
significantly intensifies the effect that service quality can have on satisfaction levels of
customers in mobile phone sector. This implies that, as service failure encounters decreases,
the satisfaction level of customers’ decreases. In other words, service failure encounters
influence customer satisfaction level negatively. The explanatory power of service quality
on customer satisfaction can be enhanced by aligning and controlling for service failure as
contingency factors that has a significant influence on this relationship.
The third conclusion based on the third results is that customer communication strategies as
was practised by mobile phone firms improves the satisfaction levels through its interactive

92
effect. Further, this conclusion is important as it provides an explanation to the hitherto low
predictive power of service quality in the quality-satisfaction model. When applied in a low
contact services as in the case of mobile phone services, customer communication can
moderate the relationship between service quality and customer satisfaction.
5.3 Recommendations
In view of the findings and conclusions of the study, the following recommendations were
made. Based on the first conclusion, it is recommended that, in order to intensify the
influence of service quality practices on customer satisfaction and to satisfy customers who
encounter a service problem, mobile phone companies in Kenya are encouraged to conduct
continuous service quality assessment to enable them to align and adjust their service
standards to the changing customer needs. Secondly, since the competitive environment in
Kenya has become intense, mobile phone firms should improve quality of their service
through: vigorous investment in network coverage, upgrading, competitive pricing,
improving signal clarity and quality, innovating and diversifying service offering to attract
and retain subscribers to their network. Finally, since employees also play a key role in
telecommunication services, the frontline staff need to know the importance of their role in
service delivery which can be achieved through staff training.
Based on the second conclusion that controlling for service failure encounters significantly
intensifies the effect that service quality can have on satisfaction levels of customers in the
mobile phone sector, the following recommendations are made: First, mobile phone
companies in Kenya are encouraged to institute appropriate service failure recovery
mechanisms to minimize on the impact that service failure encounters can have on users of
mobile phone services. This can be achieved through significant investments in technology
to enhance their service production capacity and to subsequently minimize on service down
time occasioned by service interruptions due to network congestions and frequent system
maintenance. Secondly, employees can also be enlightened through training on ethical
service delivery to eliminate employee-related fraudulent activities that can cause serious
service failure leading to customer dissatisfaction.
The third conclusion is that customer communication strategies as was practiced by mobile
phone firms improve the satisfaction levels through its interactive effect. In line with this
conclusion, the following recommendations can be drawn: First, mobile phone firms should
consider integrating service marketing communications to achieve common purpose of

93
enhancing customer satisfaction. Secondly, these firms should institute customer
expectation management programme through all forms of communication. Thirdly, they
should emphasize on interactive marketing in their communication plan. People in research,
design, sales, and production must work as a team to foresee problems of production and
use that might be encountered with the product or service. In order to fill the gap between
customer expectations and management perceptions of the same, service firm managers
must collect data on customer expectation and relate customer data to overall service
strategy. Further, recommendations are that service managers should increase internal
communication and track service performance on satisfaction through customer feedback
systems that will allow customers communicate directly with their service providers.
5.4 Contribution of the Study
This study makes several important contributions to both theory and practice of service
quality in Kenya and other developing and developed nations.
5.4.1 Contribution of the Study to Theory
The theory of the expectancy disconfirmation theory that links service quality and customer
satisfaction has not been yet fully explored and is still not without research controversies. A
good number of prior studies have used different scales to measure service quality as an
independent variable in quality-satisfaction model, resulting into model misspecification
and generation of paradoxical research findings. First, the researcher endeavored to make an
extensive and critical review of prior studies. Given the past inconclusive and often
fragmented literature, this study makes a significant contribution in synthesis of service
quality frameworks. Secondly, the study has offered the most logical and plausible
explanation of the paradoxical relationship between quality and satisfaction. This was
achieved through the finding in which both service failure and customer communication
appears to moderate the link between service quality and customer satisfaction. The major
contribution of this study in this regard is that of establishing a relationship between service
quality and customer satisfaction and explaining how this relationship is moderated by both
service failure and customer communication thereby contributing towards validation and
upgrading of the existing theory. Researchers can now enhance the predictive power of
service quality practices by incorporating the moderator variable such as service failure and
customer communication. Thirdly, the study developed and validated an instrument for
measuring service quality practices in the telecommunication sector. This is an important

94
contribution of the study as it validates the SERVQUAL scale of the Parasuraman et.al,
(1988) with several modifications to a multi-item scales to suit the objectives of the study
and enhance its reliability. The fourth contribution relates to the finding of the empirical
survey. The current study entailed a comprehensive research into service quality, customer
communication and customer satisfaction in the mobile phone sector of Kenya. Given the
academic lacuna in service quality practices, research on mobile phone sector particularly in
emerging economies where firm-level studies are very limited, this has resulted in the
documentation of service quality practices and customer communication in Kenya.
5.4.2 Contribution of the Study to Marketing Practice
The finding of this study brings out several important contributions to the marketing
profession. First, the finding of moderate prevalence level of some service quality
dimensions particularly reliability and responsiveness has direct implications for service
managers in the mobile phone sector in Kenya. It indicates that, although all components of
service quality are practised in a complementary fashion, service managers have paid little
attention and effort on responsiveness and reliability aspects of service quality in the studied
mobile phone firms. If managers want to exert more influence on the service quality
practices in their firms, more attention should be focused on the design of responsiveness
and reliability systems. Further, the study has established the most significant determinant
of customer satisfaction. Since customer satisfaction is the ultimate interest of firms in a
competitive mobile phone sector, this study has empirically determined the variables which
can significantly impact on customer satisfaction and which the service managers in the
mobile phone sector can actually take advantage of to both satisfy their clients and meet the
firm’s objective of profitability. Furthermore, using the SERVQUAL dimension to
examine the relationship between customer satisfaction and service quality will help the
management to better understand what these dimensions mean to the customers and to the
organization.
Finally, through one of its findings, the study revealed that relationship between service
quality and customer satisfaction is moderated by contextual variables like customer
communication. In this study, consistent with the previous studies, the benefits of
contextual variables on the quality-satisfaction model has been largely ignored and
therefore the contribution of this study lies on how service managers can utilize customer

95
communication strategies to positively influence how service quality practices can impact
on customer satisfaction profitably.
5.5 Limitations of the Study
Notwithstanding the immense contributions to the body of the knowledge on service quality
practices and customer satisfaction modelling, it is paramount to evaluate the results in the
context of the study limitations. First, the choice of survey design as the preferred
methodological choice for the study has a profound effect especially on the measurement
problems. Surveys and their cross-sectional nature of data will imply that conclusions are
generally limited by virtue of being collected at one point in time and do not give the
sequence of events. However, studies based on crossectional data tend to provide
information for subsequent studies in the same areas of interest.
The second limitation relates to the self-report nature of the research instruments that was
used to measure and collect data on the study variables. The outcome of this study therefore
reflects the perception of respondents who are both internal and external customers of
mobile phone firms. This has, however, raised concerns over their objectives as was alluded
to by (Chenhall, 2003). However, the limitation relating to the subjective measure was
suppressed by the various validity tests. Moreover, multiple respondents helped to reduce
error relating to common method bias. Finally, the psychometric properties of self-
administered questionnaire were tested to ensure reliability and validity.
The third limitation relates to the fact that the current study focused only on the mobile
industry in Kenya. Concerns have been raised by previous scholars as to whether focus on a
single industry was enough to make results of the study more generalizable to other
industries. However, the focus of such a study conferred the obvious advantage of control
for industry effects. Moreover, the Kenyan mobile phone sector is such a large and rapidly
growing sector that contributes to 12% growth in economy. Due to this, an appreciation of
the concept of service quality practices with a view to enhancing customer satisfaction and
subsequently improving profitability of firms in the context of the mobile phone sector will
have immense implications for other firms in Kenya and other emerging economies around
Africa.

96
5.6 Suggestions for Further Studies
Based on the foregoing conclusions on the findings of this study, and in tandem with the
missed opportunities arising out of using the selected rather than alternative research
methodologies and techniques, the researcher suggested the following future research
directions in the field relating to the service quality-customer satisfaction relationship.
Firstly, this study used cross-sectional data to test the hypothesis on the relationship
between service quality and customer satisfaction and the subsequent moderating roles of
the contextual variables in the relationship. It only provided a snapshot picture at a single
point in time. Therefore, there is need to conduct a longitudinal study to provide even more
conclusive evidence of the above relationship.
Given that the current study is limited to a few organizations in one service industry, the
assertion that the relationship between service quality and customer satisfaction is
moderated by customer communication and service failure would need to be validated by
further research. Perhaps an effective way to validate this assertion is by focusing future
studies on various other unrelated industry players through comparative studies between the
players.
Furthermore, the moderator variables should be expanded and validated beyond just buyer-
service communication and incidence of service failure. For instance, questions like: What
other moderators of the quality/satisfaction relationship exist other than the two researched
about? What are the particular situations and/or service settings wherein these moderators
operate? These may be asked and answered through further research intervention.
Furthermore, the possibility of incorporating a mediating role of service failure and
customer communication into the quality-satisfaction model can be explored.
Moreover, effective measurement of service quality remains a challenge, and as such,
necessitates measuring validation processes that include, among others, independent
replications of the same study. Furthermore, the hypotheses were tested using data obtained
from Kenya’s mobile phone sector. There is therefore need to test these results in different
national cultures and economic contexts to be able to establish global generalizability.
Finally, future studies should explore the possibilities of joint moderation of service failure
and customer communication in quality-satisfaction relationship.

97
REFERENCES
Abdullah, D. N. & Rozario, F. (2009), Influence of service and product quality
towards customer satisfaction: A case study at the staff Cafeteria in Hotel.
International Journal of Social, Behavioral, Educational, Economics, Business and
Industrial Engineering, 3 (5), 346-351.
Agbor, J.M. (2011). The relationship between customer satisfaction and service
quality. A Study of three service sectors in Umea, published thesis; Umea School of
Business, Umea University; www. Usbe.umu.se.
Ahimbisibwe, A., Nangoli, S., & Tusime, W. (2012). Moderating effect of buyer-
supplier Trust on the relationship between outsourced formal contracts and
supplier delivery performance: An empirical study of public sector procurement.
International Journal of Business and Social Sciences, 3(17), 50-71.
Aguinis, H. (2004). Regression analysis for categorical moderators, New York:
Guilford.
Aila, F.O. (2014), Effect of consumer attitudes, consumer characteristics and
biosecurity principles on consumer preferences for indigenous chickens in Kisumu
City, Kenya. Unpublished thesis. Department of Business Administration, Maseno
University.
Andreassen, T. W. (1999). What drives customer loyalty with complaint
Resolution? Journal of Service Research, 1, 324-32.
Auka, D.O. (2012). Service quality, satisfaction, perceived value and loyalty among
customers in commercial banking in Nakuru Municipality, Kenya. African Journal
of Marketing Management, 4(5), 185-20.
Ary, D., Jacobs, L., & Razavieh, A. (1996). Introduction to research in education.
Fort Worth, TX: Holt, Rinehart, and Winston.
Azman, I, Norashyikin, A, & Muhammad, M. A (2009). Perceive value as a
moderator on the relationship between service quality features and customer
Satisfaction: International Journals of Business Management, 4(2), 71-79.
Babakus, E. & Boller, G.W. (1992), An empirical assessment of the SERVQUAL
Scale, Journal of Business Research, 24, 253‐68.
Babbie, E. (1986),The practice of social science (3rd .ed.).Belmont, C.A, Wadsworth.
Babbie, E. R. (1990). Survey research methods. Belmont, CA: Wadsworth.

98
Bagozzi, R., & Yi, Y., (1988). On the evaluation of structural equation models. Journal of
Academy of Marketing Science, 16, 74-94.
Bagozzi, R.P., Baumgartner, H. &Yi, Y. (1992). State versus action orientation and the
theory of reasoned Action: An Application to Coupon Usage. Journal of
Consumer Research, Inc. 18, 505-518.
Bailey, A. Johnson, & Daniels, G. (2000). Validation of a multi-dimensional measure of
strategy development processes. British Journal of Management, 11, 151-162.
Baker, D.A. and Crompton, J.L. (2000), Quality, satisfaction and behavioral
Intentions. Annal of Tourism Research, 27 (3), 785-804.
Baron, R.M., & Kenny, D.A. (1986). The moderator-mediator variable distinction in
social psychology research: conceptual, strategic, and statistical considerations.
Journal of Personality and Social Psychology. 51, 1173-1182.
Bitner, M.J., & Hubbert, A.R. (1994) Encounter Satisfaction versus Overall
Satisfaction versus Quality, In R.T. Rust & R.L. Oliver (eds.), Service Quality: New
Directions in Theory and Practice, Thousand Oaks, California: Sage. 72-94
Bitner, M. J., Booms, B. H. & Tetreault, M. S., (1990), "The Service Encounter:
Diagnosing Favorable and Unfavorable Incidents,” Journal of Marketing, 54(1),
71-84.
Business Monitor International (2012) Kenya telecommunication report, pp.88
Bolliger, D.U., & Inam, F.A. (2012). Development and validation of the online
student connectedness survey (OSCS). The International Review of Research in
Open and Distance Learning, 13(2), 41-65.
Buttle, F. (1996), SERVQUAL: Review, critique, research agenda, European
Journal of Marketing, 31(1), 8-32.
Buttle, F. (2006). Customer retention management processes: A quantitative study.
European Journal of Marketing, 40(1), 83-99.
Carman, J. M. 1990. Consumer perceptions of service quality: An assessment of the
SERVQUAL dimensions. Journal of Retailing, 66 (1),33–55.
Carmines, E.G & Zellner, R.A (1979). Reliability and validity assessment.
Beverley Hills, CA. Sage Publishers.

99
Caruana, A., Money, A.H. & Berthon, P.R. (2000). Service quality and satisfaction –
the moderating role of value .European Journal of Marketing, 34(11/12), 1338-
1352.
Chava, F. & Nachmias, D.N. (1996). Research methods in the social sciences. 5thed.
London: Arnold.
Chenhall, R.H. & Langfield-Smith, K. (1998). The relationship between strategic priorities,
management techniques and management accounting: an empirical investigation
using a systems approach. Accounting, Organizations and Society, (23) 3, 243-
64.
Chetan Sharma Consulting, (2013). Mobile industry prediction survey (Accessed on
2ndFebruary,2014)http://www.chetansharma.com/MobilePredictions2013.htm
Christine, E & Klaus, S (2003). Service Failure and Service Recovery in Tourism: A
Review. 6, 1-16.
Cohen, J. & Cohen, P. (1983). Applied multiple regression/correlation analysis for the
behavioral sciences (2nd ed.), Hillsdale, NJ: Erlbaum.
Cohen, J.(1988). Statistical power analysis for the behavioural science. New York: 2nd ed.
Academic Press.
Cohen, Jacob. Cohen, Patricia. Leona S. Aiken & West, Stephen H. (2003). Applied
multiple regression/correlation analysis for the behavioral sciences. Hillsdale, N.J:
L. Erlbaum Associates. ISBN 0-8058-2223-2.
Communication Authority of Kenya (2012). The insider’s guide to mobile Web and
Marketing in Kenya, 2012.
Communication Authority of Kenya (2013). The insider’s guide to mobile Web and
Marketing in Kenya, 2013.
Conway, J. M., & Huffcutt, A.I. (2003). A review and evaluation of exploratory factor
analysis practices in organizational research. Organizational Research Methods,
6(2), 147-168.
Costello, A.B., & Osborne, J.W. (2005). Best practices in exploratory factor analysis
practices: four recommendations for getting the most from your analysis. A Peer-
Reviewed electronic Journal, 10(7), 1-9.
Chi, C. G. -Q., & Qu, H. (2008). Examining the structural relationships of destination
image, tourist satisfaction and destination loyalty: An integrated approach. Tourism
Management, 29, 624-636.

100
Churchill, G.A. Jr., & Iacobucci, D. (2004). Marketing research: Methodological
foundations. Mason, OH: Thomson/South-Western.
Chenhall, R.H. (2003). Management control system design within its organizational
context: Findings from contingency-based research and directions for future.
Accounting, organizations and Society, 28 (2-3), 127-168
Creswell, J.W (1994). Research design: qualitative and quantitative approaches. Sage
Publication, Inc.
Crompton, J.L. & MacKay, K.J. (1989). Users' perceptions of the relative
importance of service quality dimensions in selected public recreation programs.
Leisure Sciences, 11, 367-75.
Cronin, J.J. & Taylor, S.A. (1992). Measuring service quality: A re-examination and
extension, Journal of marketing, 56, 55-68.
Daniel, J. (2012). Sampling essentials: Practical guidelines for making sampling
choices. London: Sage Publications Inc.
Dawes, R., Singer, D. & Lemons, P. (1972). An experimental analysis of the contrast
effect and its implications for intergroup communication and indirect assessment of
attitude. Journal of personality and social psychology, 21(3), 281-295.
Dowling, M.J, & McGee, J.E. (1994). Business and technology strategies and new venture
performance: A study of the telecommunications equipment industry. Management
Science, 40(12), 1663-1677.
Dillman, D.A. (2000). Mail and Internet surveys: The tailored design method (2nd ed.).
Washington: John Wiley and Sons.
Edvardsson, B (2005). Service quality: Beyond cognitive assessment. Managing Service
Quality, 15 (2), 127–131.
Festinger, L. (1957). A Theory of Ccgnitive dissonance. Stanford, CA: Stanford
University Press.
Field, A.P. (2000). Discovering statistics using SPSS for windows: Advanced
techniques for the beginner. London: Sage.
Field, A.P. (2005). Discovering statistics using SPSS. 2nd ed. London: Sage
Publication.
Fienberg, S.E. (2003). Notes on stratified sampling for statistics 36-303: Sampling,
surveys and society. Department of Statistics, Carnegie Mellon University.

101
Fowler, F.J. (1993). Survey research methods. (2nd ed.). Thousand Oaks, CA: Sage.
Huang, L.C., Goh, Y. N., & Mohaidin, Z. (2014). Factors influencing consumer
intentions to avoid broiler chicken meat and products in Malaysia.
International Food Research Journal, 21(1), 181-188.
Gantasala V. P., & Padmakumar, R. (2013). SERVQUAL and customer satisfaction:
The mediating influence of communication in the privatized Telecom Sector:
International Journal of Academic Research in Business and Social Sciences. 3 (3),
135-151.
Gibson. C. (2009). Using SERVQUAL to assess the customer satisfaction level of the
Oregon HIDTA ISC Analytical unit: Published thesis. Hartfield School of
Government; Portland State University.
Gerpott, T.J., Rams, W., & Schindler, A. (2001). Customer retention, loyalty, and
satisfaction in the German mobile cellular telecommunications market,
Telecommunications Policy, 25, 249-269.
Giese, J.L. & Cote, J. A, (2000). Defining customer satisfaction, Academy of
Marketing Science Review. Available: http://www.amsreview.org/articles/giese01-
2000.pdf.
Gonroos, C. (1984). A service quality model and its market implications. European
Journal of Marketing, 18(4), 36-44.
GSMA (2008). Taxation and the growth of the Mobile Services in Sub-Saharan
African. Global Technology Forum.
Gundersen, M. G., Heide, M, & Olsson, U. H (1996). Hotel guest satisfaction among
business travelers: What are the important factors? The Cornell Hotel and
Restaurant Administration Quarterly, 37 (2), 72–81
Hair, J.F. Black, W.C. Babin, B.J.X, Anderson, B.J & Tatham, R.L. (1998).
Multivariate data analysis. New York: MacMillan.
Hair, J.F., Black, W.C., Babin, B.J.X, Anderson, B.J & Tatham, R.L. (2006).
Multivariate data analysis. Upper Saddle River: Pearson Education Inc.
Howell, D. (2007). Statistical methods for psychology. Belmont, CA: Thompson.
Hutchinson, J., Lai, F., and Wang, Y. (2009). Understanding the relationships of
quality, value, Equity, satisfaction, and behavioral intentions among golf travelers,
Tourism Management, 30, 298-308.

102
Junaid, Z., Nik, K, Theeb, M.A; Al Motairi, M. H, Egab A, Muhammad, S.A, &
Jamal M, A (2012). Staff conduct, communication, access to service & customer
satisfaction: The mediating effect of credibility. American Journal of Economics,
Special Issue, 37-40.
Ittner, C.D. & Larcker, D.F. (2001). Assessing empirical research in managerial
accounting: A value-based management perspective. Journal of accounting and
Economics, 32, 349-410.
Kibwage, J.K (2002): Integrating the informal recycling sector into solid waste management
planning in Nairobi city, unpublished PhD Thesis.
Kim, Y.S., Moreo, P.J., & Yeh, R.J.M. (2004). Customers’ satisfaction factors
regarding university food court service. Journal of Foodservice Business
Research, 7, 97-110.
Kimani, G.H. (2014). Service quality and customer satisfaction in certified
public accountant training Institutions in Nairobi: unpublished Research project:
School of Business. University of Nairobi.
Kerlinger, F.N. (1977). The influence of research on educational practices.
Educational Researcher, 6(8), 5-12.
Kombo, K.D., & Delmo, L.A. (2006). Proposal and Thesis writing. Pauline Publications
Africa, Nairobi.
Kothari, C.R. (2004). Research Methodology-Methods and techniques. New Age
International Publishing Ltd.
Kotler, P & Armstrong, G (2012) Principles of Marketing, 13th ed, Prentice Hall, Pearson
International Edition.
Kotler, P. & Keller. K. (2006). Marketing Management, 12th ed. New Jersey: Pearson
Education Inc.
Kuo, Y-F., Wu, C-M., & Deng, W-J. (2009). The relationships among service
quality, Perceived value, customer satisfaction, and post-purchase intention in
mobile value-added services, Computers in Human Behavior, 25, 887-896.
Lai, F., Griffin, M., & Babin, B.J. (2009). How quality, value, image, and
satisfaction create loyalty at a Chinese telecom, Journal of Business Research, 62,
980-986.
Lehman, A. (2005). Jmp For Basic Univariate and multivariate statistics: A Step-by-
step Guide. Cary, NC: SAS Press. 123. ISBN 1-59047-576-3.

103
Lee, J. K. & Ritzman, L. P. (2005). Operations Management; Process and value
Chains. 7th ed. New Jersey: Person Education.
Lin, H-H., & Wang, Y-S (2006). An examination of the determinants of customer
loyalty in mobile commerce contexts. Information & Management, 43, 271-
282.
Luft, J., & Shields, M.D. (2003). Mapping management accounting: graphics and
Guidelines for theory consistent empirical research. Accounting, Organizations and
Society. 28, 169-249.
Luo, X. & Homburg, C. (2017). Neglected outcomes of customer satisfaction, Journal
of Marketing, 71(2), 133-149.
Mason L.M, Lind D.A & Marcha W.G (2002): Statistical techniques in Business and
Economics. 11th ed, Mc Graw Hill. Irwin, United states, New York City.
Mattila, A., & O’Neill, J.W. (2003). Relationships between hotel room pricing,
occupancy, and guest Satisfaction: A longitudinal case of a Midscale Hotel in the
United States. Journal of Hospitality & Tourism Research, 27 (3), 328-341.
McQuitty, S., Finn, A. & Wiley, J. B. (2000). Systematically varying customer
satisfaction and Its implications for product choice. Academy of Marketing
ScienceReview,2000(10),Available:http://www.amsreview.org/articles/mcquitty10-
2000.pdf.
McCollough, M. A., & Sundar, G. B (1992). The Recovery paradox: An examination
of consumer satisfaction in relation to disconfirmation, service quality, and
attribution based theories. American Marketing Association. Chicago: 119-119.
McCollough, M. A., Berry L. L., & Yadav, M. S. (2000). An empirical investigation
of customer satisfaction after service failure and recovery, Journal of Service
Research, 3, 626-637.
Mohr, J., & Nevin, J.R. (1990). Communication strategies in marketing channels: a
Theoretical perspective. Journal of Marketing, 56, 36-51.
Mohammad, A.A., & Alhamadani, Y.M. (2011). Service Quality Perspective and
customer Satisfaction in Commercial banks working in Jordan. Middle Eastern
Finance and Economics, 14(1), 60-72.
Mugenda, O., & Mugenda, A., (1999). Research methods quantitative approaches, Nairobi
African Centre of Technology Studies.

104
Mutai, K.B. (2006). How to write quality research proposal. A complete and simplified
Recipe. Thelley Publications, New York.
Namanda, S. (2013). Service Quality and customer Satisfaction: A case of ABC bank main
branch, Uganda. Published Dissertation: College of Education and External
Studies, Makerere University.
Nunnally, J.C. (1978). Psychometric theory. New York: McGraw-Hill.
Narver, J., & Slater, S (1990) The effects of market orientation on business philosophy,
Journal of Marketing. 54(4), 20-35.
Nargundkar, R (2003). Marketing Research –Text and Cases: 2nd ed. New Delhi, Mc Graw-
Hill education.
Naik. C.N., Gantasal. S.B, & Prabhakar. G.V. (2010). Service quality (SERVQUAL) and its
effect on customer satisfaction in Retailing, European Journal of social sciences,
16(2), 223-243.
Nimako, S. G., Dokor, A.F., & Veronica, A.B. (2010). Overall customer satisfaction in
Ghana’s mobile telecommunication networks: Implications for Management and
Policy ADTF journal. 7(3), 35-49.
Norman, G. (2010). Likert scales, levels of measurement and the “laws” of statistics. Adv.
In Health Sci. Educ. 1-8.
Nyaoga, R.B., Manani, T.O., Basire, R.M., Ombati, T.O. & Kongere, T.O. (2013). service
quality and customer satisfaction at Kenya Airways Ltd; European Journal of
Business and Management. 5(22), 170-180.
Odhiambo, M.R. (2015). Effect of service quality on customer satisfaction in banking
industry. A case study of Kenya Commercial bank. Unpublished Research project.
United State University Africa.
Odondo, A.J. (2007). Structure and performance of formal retail market for Bamboo
products in Kenya, Unpublished thesis. Department of Economics and Business
Studies, Maseno University.
Ondoro, C.O. (2014). Analysis of strategic purchasing and supply chain Management,
purchasing ethics and performance of public bus transport firms in nairobi, Kenya.
Unpublished thesis. Department of Business Administration, Maseno University.
Ojera, P., Ogutu, M., Siringi, E.M., & Othuon, L.A. (2001). Belief control practices and
organizational performances: A survey of sugar industry in Kenya. African
Research Review, 5(4), 211-2017.
Oliver, R.L. (1980) A cognitive model of the antecedents and consequences of
satisfaction decisions. Journal of Marketing Research, 17, 460-469.

105
Olson, J. & Dover, P. (1979). Disconfirmation of consumer expectations through
product trial”. Journal of Applied Psychology, 64, 179-189.
O’Neill, M., & Palmer. A. (2003). An exploratory study of the effects of experience in
consumer perceptions of the service quality construct. Managing Service
Quality, 13 (2), 187–196.
Pan, Y., & Jackson, R. T. (2008). Ethnic difference in the relationship between acute
inflammation and serum ferritin in US adult males. Journal of Epidemiology and
Infection, 136 (3), 421-43.
Pallant J, (2007). SPSS survival manual: Step by step guide to data analysis using SPSS for
Windows: 3rd ed. Open University Press, Maidenhead.
Parasuraman, A., Zeithaml, V. A., & Berry, L. L. (1985). A conceptual model of service
quality and its implications for future research, Journal of Marketing,
49 (4), 41-50.
Parasuraman, A., Zeithaml, V. A., & Berry, L. L. (1988). SERVQUAL: A multiple
item scale for measuring consumer perceptions of service quality. Journal of
Retailing, 64(1), 12-40.
Parasuraman, A., Berry, L.L. & Zeithaml, V.A. (1991), ``Refinement and
reassessment of the SERVQUAL scale'', Journal of Retailing, 67, 420-50.
Polaris Marketing Research (2011). Service Recovery impact customer satisfaction:
Polaris Marketing Research.
Raven, M.R. (2009). The application of exploratory factor analysis in agricultural
education. Journal of Agricultural Education, 35(4), 9-14.
Rogerson, P.A.(2000).Statisticalmethodsforgeography.London:SagePublications.
fromhttp://www.amazon.com/exec/obidos/ASIN/0761962875/#reader
_0761962875.
Roos, I. (1999). Switching processes in customer relationships. Journal of Service
Research. 1, 68-85.
Reimann, M., Lunemann, U.F., & Chase, R.B. (2008). Uncertainty avoidance as a
moderator of the relationship between perceived service quality and customer
satisfaction. Journal of Service Research. 2 (1), 63-73.
106
Rezaie D, H and Forghani, P (2011) Determining factors affecting on customer
satisfaction in outsourcing IT services in University of Isfahan
Interdisciplinary Journal of Contemporary Research in Business. 3(5), 775-782.
Saunders, M Lewis & Thornhil, A. (2007). Research methods in business, New York,
McGraw Hill Publishers.
Schiffman, LG. & LL. Kanuk (2009) Consumer Behaviour, 10th ed. Boston: Prentice Hall.
Sekaran, U. & Bougie, R. (2010). Research methods for business: A skill building
approach. (5th ed.). New York, John Wiley and Sons.
Sekaran, U. (2003). Research methods for business: Skill Building Approach, 4th ed. India,
Replika Press PVT Ltd.
Shemwell, D.J., Yavas, U., & Bilgin, Z. (1998). Customer-service provider relationships:
An empirical test of a model of service quality, satisfaction and relationship
oriented outcome. International Journal of Service Industry Management, 9, 155-
168.
Shahzad, K., & Saima. A, (2012). Determinants of customer satisfaction in telecom
Industry: A study of telecom industry Peshawar KPK Pakistan, Journal of Basic and
Applied Scientific Research. 2 (12), 12833-12840.
Sojka, J., & Spangenberg, E.R, (1994). Ethical concerns in marketing research, in
Advances in Consumer Research. Association for Consumer Research, 21, 392-396.
Spreng, R.A., & Mackoy, R.D. (1996). An empirical examination of a model of
perceived Service quality and satisfaction. Journal of Retailing. 72 (2), 201-214.
Suleiman, A. (2013). Basic dimension of the SERVQUAL MODEL and its impact on
the level of customer satisfaction: An empirical study of the Housing Bank in Karak,
Jordan. European scientific Journal. 9(1), 21-34
Sureshchandar G.S., Rajendran, C., & Anantharaman R.N. (2002). The relationship
between Service quality and customer satisfaction – a factor specific approach,
Journal of Services Marketing. 16(4), 363 – 379.
Stauss, B. & Christian, F. (1999). Regaining Service customers, Journal of
Service Research. 1, 347-61.
Stergios, V., Prodromos, C., & Apostolos, M. (2012). Customer satisfaction of Greek
mobile phone services, International Journal of Managing Value and Supply
Chains (IJMVSC,). 3(4), 43-54.

107
Tabachnick, B.G., & Fidell, L.S. (2007). Using multivariate statistics. 5th ed. Boston: Allyn
and Bacon.
Tax, S.S., Brown, S.W., & Chandrashekaran, M. (1998). Customer evaluations of
Service Complaint experiences: implications for relationship marketing. Journal of
Marketing. 62, 60-76.
Telecommunication Industry Review (2012): The Anthology of Market Facts and
Forecast. (Accessed on 2 February 2014) http://www.insight
corp.com/reports/review12.asp.
Terry, G. V. (1997). Improving your measurement of customer satisfaction: A
guide to creating, conducting, analyzing, and reporting customer satisfaction
measurement programs. American Society for Quality. 47, 1-47.
Tull, D.S., & Hawkins, D. I. (2004). Marketing research: Measurement and methods.
Macmillan Publishing Company, London.
Trochim, W.M. (2006). The Research methods knowledge base. (2nd ed.). Internet
www page, at URL:<http://www.socailresearchmethod s.net/kb/> (version current as
of October 20, 2006). Accessed on 15 May 2014.
Uddin, B.M. & Akhter, B. (2012). Customer satisfaction in mobile phone service in
Bangladesh: A survey research. Management and Marketing Journal. 10 (1), 21-36.
Vagias, W.M. (2006). Likert-type scale response anchors. Clemson International
Institute for Tourism & Research Development, Department of Parks, Recreation
and Tourism Management. Clemson University.
Walfried, M. L., Manolis, C. & Winsor, R.D. (2000). Service quality perspectives
& satisfaction in private banking. Journal of Service Marketing. 14(3), 244-271.
Wang, I.M. & Shieh, C. (2006). The relationship between service quality and
customer satisfaction: The example of CJCU Library. Journal of Information and
Optimization Sciences. 27(1), 193-209.
Wang, Y., Lo H.P., & Yang, Y. (2004). An Integrated Framework for service quality,
customer value, satisfaction: Evidence from China’s telecommunication industry.
Information Systems Frontiers. 6(4), 325-340.
Welch, W.W. (2011). The sustainability of the advanced technological education
Program. Retrieved on 20th September 2014 from Evaluate:
http://www.colorado.edu/ibs/decaproject/pubs/index.html.
108
Whisman, M.A., & Mc Clelland, G.H. (2005). Designing, testing and interpreting
interactions and moderator effects in family research. Journal of Family Psychology,
19(1), 111-120.
Wu, C.H-J., & Liang, R.D. (2009). Effect of experiential value on customer
satisfaction with service encounters in luxury-hotel restaurant. International Journal
of Hospitality Management. 28, 586-593.
Yi, Youje (1989). On the evaluation of main effects in multiplicative regression models.
Journal of the Market Research Society. 31 (1), 133-138.
Zeithaml, V., A. Parasuraman., & Berry, L.L. (1990). Delivering service quality. New
York: The Free Press.
Zeithaml, V.A., Parasuraman, A., & Berry, L.L. (1990). Delivering quality service:
balancing customer perceptions and expectations. Macmillan. New York.
Zeithaml, V.A., Berry, L.L. & Parasuraman, A. (1996). The behavioral consequences of
service quality. Journal of Marketing Management, 60, 31-46.

109
APPENDIX I: LETTER OF INTRODUCTION
MASENO UNIVERSITY
OFFICE OF THE DEAN
SCHOOL OF BUSINESS AND ECONOMICS
============================================================= Tel: +254-057-351622, 351008,351011 Private Bag Fax: +254-057-351221, 351153 MASENO KISUMU
Kenya.
24th March, 2014
To: --------------------------------------
Dear Sir,
RE: LETTER OF INTRODUCTION- Samson Ntongai Jeremiah (PG/PhD/030/2013
(Tel: 0702288108 Email: [email protected])
The above mentioned is a student pursing Doctor of Philosophy degree in Business
Administration at the Department of Business Administration, School of Business and
Economics. The title of his study is “Influence of Service Failure and Customer
Communication on the Relationship between Service Quality and Customer
Satisfaction among Mobile Phone Firms in Kenya”. He has selected you to be included
in this study.
The questionnaire attached asks questions about your perception of service quality of your
mobile phone network, your satisfaction levels resulting from the same, and your
experiences on service failure and customer communication. Based on your experience and
knowledge of your mobile phone service provider; you are required to indicate the
statement which best reflect your views. I also assure you that the information you provide
will only be used for academic purposes and will be treated with utmost confidentiality. If
you would like, we could send you the executive summary of the findings on request.
Thank you.
DR. PATRICK B. OJERA. (Tel: 0722330847)
DEAN, SCHOOL OF BUSINESS AND ECONOMICS
MASENO UNIVERSITY ISO 9001:2008 CERTIFIE

110
APPENDIX 11: RESEARCH QUESTIONNAIRE
CODE
Preamble:
This study is being carried out in order to examine the Influence of Service Failure and
Customer Communication on the Relationship between Service Quality and Customer
Satisfaction among Mobile Phone Firms in Kenya and is strictly for academic purposes
only. Neither you nor your business organization shall be identified with the information
you provide. All information provided shall be treated with utmost confidentiality.
SECTION A: GENERAL INFORMATION
Instruction: tick (√) the appropriate box.
1. Gender
2. What is the type of your connection? (Tick appropriately)
Prepaid
Postpaid
3. How many years have you had the network experience? (Tick as appropriate)
about 6
months
About 1
year
Between 1-5
years
More than 5
years
4. On a scale of 1-4 indicate your current age
1= About 18year [ ] 2= 19-23 years [ ] 3= 24-29 years [ ] 4 = more 30 years [ ]
5. What is the name(s) of your phone network provider (Tick appropriately)
Safaricom Barti Airtel Essar Yu Telkom Orange
Section B: Measurement of Service Quality using SERVQUAL Scale
The questions in this section are aimed at obtaining views about service quality of your
mobile network providers using SERVQUAL SCALE. Please tick the appropriate box that
best represents your opinion on the question. The score are measured on a seven-point
Male
Female

111
Likert scale where 1=Strongly disagree, 2=Disagree, 3= somewhat disagree, 4=Neither
agree or disagree, 5=Somewhat agree, 6=Agree and 7=Strongly agree.
1) Tangibles
Strongly
agree
7
6
5
4
3
2
Strongly
disagree
1
a. My mobile network provider(s)
have modern-looking equipment.
b. The physical facilities at my
mobile network provider(s) are
visually appealing
c. Employees at my mobile network
provider(s) are neat in appearance.
d. Material e.g. brochures or
statements associated with the
service are visually appealing in my
mobile network provider(s).
2) Reliability
Strongly
agree
7
6
5
4
3
2
Strongly
disagree
1
a. When my mobile network
provider(s) promise to do something
by a certain time, it will do so.
b. When customers have a problem,
my mobile network provider(s) show
a sincere interest in solving it.
c. My mobile network provider(s)
perform the service right the first
time.
d. My mobile network provider(s)
provide their services at the time
they promise to do so.
e. My mobile network provider(s)
insist on error-free record.
c) Responsiveness
Strongly
agree
7
6
5
4
3
2
Strongly
disagree
1
a. Employees of my mobile network

112
provider(s) tell customers exactly
when services will be performed.
b. Employees of my mobile network
provider(s) give prompt service to
customers.
c. Employees of my mobile network
provider(s) are always be willing to
help customers.
d. Employees of my mobile network
provider(s) have never been too busy
to respond to customer request.
d) Assurance
Strongly
agree
7
6
5
4
3
2
Strongly
disagree
1
a. The behaviour of Employees of
my mobile network provider(s)
instill confidence in customer.
b. Customers of my mobile network
provider(s) are safe in their
transactions.
c. Employees of my mobile network
provider(s) are consistently
courteous with customer.
d. Employees of my mobile network
provider(s) have the knowledge to
answer customer questions.
e) Empathy
Strongly
agree
7
6
5
4
3
2
Strongly
disagree
1
a. My mobile network provider(s)
give customer individual attention.
b. My mobile network provider(s)
have employees who give customers
personal attention.
c. My mobile network provider(s)
have operating hours and location
convenient to all its customers.
d. The employees of my mobile

113
network provider(s) understand the
specific needs of customers.
e. My mobile network provider(s)
have customer’s best interest at
heart.
SECTION C: Customers’ view on service failure
The questions in this section are aimed at obtaining views about service failures of your
mobile network providers. Please tick the appropriate box that best represents your opinion
on the question. The score are measured on a seven-point Likert scale where 1=Strongly
disagree, 2=Disagree, 3= somewhat disagree, 4=Neither agree or disagree, 5=Somewhat
agree, 6=Agree and 7=Strongly agree.
1. Service failure
Strongly
agree
7
6
5
4
3
2
Strongly
disagree
1
a. My mobile network provider(s)
give unreasonable service.
b. My mobile network provider(s)
provide unreasonably slow service.
c. Employees of my mobile network
provider(s) fail to respond to
individual customer needs and
special request.
d. Employees of my mobile network
provider(s) have poor attitudes
towards customers.
Cont. Strongly
agree
7
6
5
4
3
2
Strongly
disagree
1
e. Employees of my mobile network
provider(s) ignore customers.
f. Employees of my mobile network
provider(s) exhibit unusual
behaviour such as rudeness and
abusiveness
SECTION D: Customers’ view on customer communication
The questions in this section are aimed at obtaining views about communication of your
mobile network providers with its customers. Please tick the appropriate box that best
represents your opinion on the question. The score are measured on a seven-point Likert
scale where 1=Strongly disagree, 2=Disagree, 3= somewhat disagree, 4=Neither agree or
disagree, 5=Somewhat agree, 6=Agree and 7=Strongly agree.

114
Strongly
agree
7
6
5
4
3
2
Strongly
disagree
1
a. My mobile network provider(s)
have put in place channels for
receiving complaints from
customers/subscribers.
b. My mobile network provider(s)
have put in place channels for
receiving suggestions from
customers/subscribers.
c. My mobile network provider(s)
have put in place channels for
receiving complements from
customers/subscribers.
d. Subscribers/customers
communicate their dissatisfaction by
abandonment of usage of the
network services.
SECTION E: Customers’ view on customer satisfaction
The questions in this section are aimed at obtaining views about customer satisfaction with
your mobile network providers. Please tick the appropriate box that best represents your
opinion on the question. The score are measured on a seven-point Likert scale where
1=Strongly disagree, 2=Disagree, 3= somewhat disagree, 4=Neither agree or disagree,
5=Somewhat agree, 6=Agree and 7=Strongly agree.
Strongly
agree
7
6
5
4
3
2
Strongly
disagree
1
a. Overall, I am satisfied with my
current mobile network provider.
b. I am likely to continue to
choose/repurchase from my mobile
network provider.
c. I am likely to recommend my
mobile network provider to a friend
and family.
d. The services offered to me by my
mobile network provider were
important to me.
e. The services offered to me by my
mobile network provider fit well with
my situation/problems.
f. The services offered to me by my

115
mobile network provider exceeded
the requirement my
situation/problems.
g. I feel absolutely delighted.
h. I feel very pleased with delivered
services.
i. I am completely satisfied with the
services delivered by the service
provider

116
APPENDIX III: AN S‐P‐P FRAMEWORK PERSPECTIVE
Source: Walfried et al., (2000)

117
APPENDIX IV: MAP OF KENYA
Source: Google map (2013)

118
APPENDIX V: RAW DATA
Mean score of various Service quality dimensions
Tangibility Reliability Responsiveness Assurance Empathy Customer
Satisfaction service Quality
Service Failure
Customer communication
6.5 6.2 4.75 3.25 6 4 5.34 3 4.25
6.75 6.4 6 5.5 6.6 6.89 6.25 1.83 6.5
5.5 5.6 5.75 5.25 6.2 3.33 5.66 5.17 5.25
2.5 5.6 5.5 6.25 6.4 4.44 5.25 5 6.25
4.75 6.2 4.5 4.75 4.6 4.78 4.96 6 4.75
6.5 5 6.5 1 4.6 3.78 4.72 5.67 5.75
6.75 4.2 1 5.5 5.2 5.33 4.53 6.33 6.25
6.75 5.2 5.25 2.75 6.6 4.56 5.31 6.17 6.5
6.25 6.4 5 6.25 6.8 5.11 6.14 2 5.75
5.25 5.6 5.25 5.25 5.8 5.89 5.43 6.67 7
7 6.8 5.25 5.75 5.6 6.78 6.08 2.33 6.5
6.75 5.4 6.5 6.5 5.6 5.67 6.15 6.33 5.25
6.75 6.2 5.25 4.75 5.6 4 5.71 6.67 5.25
7 6.8 5.5 6.75 6.6 7 6.53 1.67 6.5
7 6.2 5.5 6 6.6 4.67 6.26 5.17 6.25
6.75 6.4 6.25 5.75 5.4 6.56 6.11 6 6.5
6.5 6.4 6.5 6.25 6.2 6.11 6.37 5.67 4
6.25 6 6.25 6 6.4 6.22 6.18 1.17 5.75
5 5.4 5 5.5 6.2 5.78 5.42 6.67 5.5
7 6.8 7 7 6.4 5.33 6.84 6 6
6.25 6.2 4.5 5.5 5.4 5.56 5.57 4.33 4.75
5.75 5 4.75 5.75 4.6 5.67 5.17 2.33 5.25
5 5.2 4.25 4.5 6 3 4.99 3.67 6
7 5.8 5.5 5.5 5.8 5.22 5.92 4 7

119
5.25 4.6 3.5 5.5 6.6 6.22 5.09 1 5.75
7 5.8 5.75 6.5 3.8 6.78 5.77 3.33 6.5
6.25 6.8 6.25 6.25 6.8 5.56 6.47 1.33 3.25
7 4.6 6 7 3 5.78 5.52 3.83 5.25
4.5 4.6 4.75 4.75 5.6 5.11 4.84 1.67 5.25
7 7 7 7 7 7 7 1 7
5.5 4 3.5 7 5.8 5.56 5.16 3 6
6 3.8 4 2.5 3.4 3.22 3.94 4.83 2.5
6.5 4.8 4.75 5.5 5.2 5.44 5.35 1.33 2.5
4.75 3 4.25 6 6 4.44 4.8 3 6
5 5.6 4.75 6.25 6.2 5.11 5.56 2.33 5.25
3.75 3.2 3 5.25 3.2 4.11 3.68 2.67 2.5
2 4.4 4.25 4.5 4.4 4.11 3.91 5 3.75
5 4.4 4.25 4.25 4.8 4 4.54 2.83 5.5
4.75 5.2 5.5 5.25 5.6 4.67 5.26 1.5 5.25
5.5 5.4 5.75 5.75 5.4 6 5.56 6.17 6.75
3.75 5.4 5 4.75 4.6 4.89 4.7 5.5 6
6.5 6 6.25 6 6.2 6.56 6.19 2 5
6.25 5.6 5 6 4.8 5 5.53 3.33 6
2 2.6 2.5 4 4 2.56 3.02 6.33 2.5
4.25 5 4 6.75 5.4 5.44 5.08 3.33 6
3.75 3.4 5 5.75 4.8 5.22 4.54 6 5.5
6 3.8 2.5 2.25 1 1.44 3.11 7 1
5.25 5.4 6 5.75 5 5.56 5.48 2.17 4.25
6.75 4.4 6 6.25 6.2 4.44 5.92 1 4.75
4.25 4 5 4.5 4.4 5 4.43 2.67 3.5
5.5 4.8 6 6.75 4.2 4 5.45 1.17 6.75
6.5 4.6 5.25 6 4.8 4.89 5.43 2.67 6.75
6.75 3.4 3.75 4.75 4.8 4.44 4.69 1.83 4

120
5.75 4.4 6.25 6 6 4.78 5.68 1.5 4.5
6.25 4.8 5.5 6.75 5.6 6.67 5.78 6.17 6.25
4.75 4.6 5 5 4.6 4.67 4.79 1.5 4
5.25 5.8 5 5.75 4.8 5.67 5.32 1.17 5.75
6.25 6.8 6.5 6.25 6.6 6.67 6.48 4 6.5
5.25 5.4 5 6.5 6 6.56 5.63 1 6.5
2.75 2 2.5 2 2.6 1 2.37 5.5 2
6.25 6.8 6.25 6.75 7 4.22 6.61 2.83 2.5
4.75 4.8 3.75 4.75 5 2.56 4.61 1.5 2.75
4.25 5 5.5 6.75 6 6.33 5.5 3 6.5
3.75 5.6 4.5 4.75 3.4 5.78 4.4 2.67 3.25
4 2.6 2.75 4.75 5.2 3 3.86 2.33 5.5
2 1.4 2.25 4.5 3.4 1.44 2.71 3.33 4
4.25 2.8 4.5 5.25 5.2 4.33 4.4 5 4.25
5.5 5 5 4 5 4.11 4.9 5.17 4.75
4.75 3.2 3.75 5.25 5.6 3.56 4.51 3.67 7
7 6.2 3 6 2.6 6.78 4.96 1.5 5.25
5.75 4.6 4.75 5 3.8 4.56 4.78 3 3.5
6.25 5 5.75 6.75 5.8 5.11 5.91 2.83 5.75
5 4.8 5 5 5.6 4.89 5.08 2.17 6
5.5 5.6 5.25 6.75 6.2 6.44 5.86 1.5 6.5
5.5 5.4 5 5.25 4.8 4.89 5.19 2.33 4
4.75 5.6 5.75 6.25 5.6 6.44 5.59 3.67 5.25
4.25 4.8 4.75 5.25 4.8 5 4.77 3.33 4
6.75 6.4 6 5.75 5.8 6.22 6.14 1.33 3
2.75 3.4 5.75 6.5 3.6 5.22 4.4 2.5 5.25
5.5 7 7 7 7 7 6.7 1 7
6.25 4.8 5.5 5.5 3.6 4.22 5.13 2.33 2.5
5.25 4 4 3.5 3.8 3.44 4.11 4.17 3.75

121
6.25 6.6 6.25 6 6.2 6 6.26 1.67 5.5
5.25 5.4 6 4.25 4.6 3.33 5.1 2.33 4.5
5.25 4.6 6.5 6 5.4 5.89 5.55 2.5 6.5
6.25 7 6.5 6.5 7 6.67 6.65 1 7
5.25 3 2 4.75 5 5.11 4 2.5 6
7 6 6.25 6 7 6 6.45 1.5 7
5.5 4.4 5 4.25 4.4 4.56 4.71 4.5 3
4.75 3.2 4 4 4.4 4.44 4.07 4 4.75
6.5 6 6.5 6.75 6.4 6.56 6.43 1 6.75
6.5 6 6.5 6.75 6.4 6.56 6.43 1 6.75
4.5 2 7 7 7 6.89 5.5 1 4.5
4 5.6 4.25 6 6.8 6 5.33 1 6.75
4 1.6 2.25 3 3 3.89 2.77 1.33 6.25
5 3.2 4.25 5 4 4.89 4.29 3.17 4
6.25 6.4 4.75 7 6.4 6.33 6.16 1.17 5
6.25 3.6 5.25 6.75 5 7 5.37 1 1
6 4 4.75 5.75 6.2 5.67 5.34 1.33 6.25
7 7 7 7 7 7 7 1 5.25
4.5 3.6 4 4 4 4.56 4.02 4 4.5
6.5 6 6.75 7 6.6 6.11 6.57 1.5 5.75
4.75 4.6 4 5 4.2 2.78 4.51 2.5 4.25
3.75 3.4 3.75 4.25 4.4 3 3.91 2.67 3.75
4.25 3 3 5 3.4 4.56 3.73 2.33 5.5
4.5 4.2 4 6 5 3.67 4.74 2.33 1
7 5.8 2.5 7 3.4 5.11 5.14 4 1
7 2 4 5.5 4.6 5 4.62 2 7
6.75 6.8 6.75 7 6.4 6.89 6.74 1 5.25
5 3.2 4.25 5.5 3.6 3.78 4.31 1.67 3.25
5.25 6 4.5 6.75 5.8 4.67 5.66 2 5.5

122
5.75 6.4 4.75 6.75 5.6 5.33 5.85 2.67 5.25
5.5 4.4 5.25 6.25 6.4 6.56 5.56 2.67 5.25
6 6 5.5 5.75 5.4 4.33 5.73 2 3.25
6 6 5.5 6 6 4.89 5.9 3.67 3.25
6 6 5.5 5.25 5.4 4.89 5.63 2 3.25
6 6 5.5 5.25 5.4 4.89 5.63 2 3.25
5.5 4.8 2.25 2.75 4 2.11 3.86 2.83 4.5
5.5 5 5.5 6 5.6 5.89 5.52 1 5.75
5.25 6 4.5 6.75 5.8 4.89 5.66 1.5 5.5
5.75 6.4 4.75 6.75 5.6 5.33 5.85 2.67 5.25
6 6.4 5.5 6.5 6.2 6.44 6.12 1 5.5
7 5.4 6.25 6.25 6.8 5.67 6.34 1 5.25
5.75 6.6 4 5.5 6.6 4.78 5.69 1.83 5.75
6 6.6 4.25 6 5 5.22 5.57 2.33 5.25
6.75 5 4.5 5.5 6 4.89 5.55 2 5.75
6.75 5.6 4.75 5.25 7 5.44 5.87 1.33 5.25
7 6.8 5.5 6.75 6 5.44 6.41 2.17 5.5
6.5 6.2 4 5.25 5.8 5.67 5.55 2 5.5
6.75 4.8 4 4.5 5 4.78 5.01 2.5 4
6.5 6.6 5 5.25 6.4 4.89 5.95 3 6.5
6.75 6.2 5.5 5.25 5.2 4.67 5.78 1.83 5
6 6.6 6 6.25 6.2 5.89 6.21 2.5 4.75
7 7 7 7 7 6.33 7 1 6
7 7 7 7 7 6.33 7 1 5.5
7 7 5.5 7 7 6.33 6.7 2 6.25
6.25 6.2 6.25 6 6.4 5.89 6.22 1.5 3.5
6 5.2 4.5 5.75 5.6 4.89 5.41 1.67 4.75
7 7 7 6.75 6.8 6 6.91 1.33 7
7 7 7 7 7 7 7 1 7

123
6.75 6 6 7 6 7 6.35 1 7
6 7 7 6 7 7 6.6 2 7
6.25 5.8 6 6 5.4 6.22 5.89 1.17 5.75
6.5 6.4 6 6.75 6.6 6.67 6.45 2 6
5.75 2.2 3.75 2.5 3 1.56 3.44 5 2
6.5 6.4 6 6.75 6.6 6.44 6.45 2 6
6.25 4.6 2.75 3.75 4.6 4 4.39 2 4.25
6.25 5.8 4.25 6.75 5.6 4.89 5.73 2.5 5.5
6.5 6.8 4.75 6.5 5.6 5.56 6.03 2.33 5.5
6.75 6 4.25 5.75 6.8 5 5.91 2.17 5.75
6.75 5.6 4.25 6.5 6.2 5.89 5.86 2.33 4.75
6.5 6.4 4.5 6.5 5.8 5.56 5.94 2.5 5.25
7 6.4 4.25 6.25 6.4 5.22 6.06 1.67 6.5
6 5.4 4.25 6.25 5 4.11 5.38 2.5 5.5
6.5 6.4 6.5 6.75 6.6 5.67 6.55 2.5 6
6.5 6.4 6.5 6.75 6.6 6.67 6.55 2.5 6
6.5 6.4 6.5 6.75 6.6 6.67 6.55 2.5 6
6.5 6.4 6.5 6.75 6.6 6.67 6.55 2.5 6
6.5 6.6 6.5 6.75 6.6 6.67 6.59 2.5 6
6.5 6.4 6 6.75 6.6 6.67 6.45 2.5 6
6.25 5.2 6 6 6 5.44 5.89 2 6.25
6.25 4.6 4.25 5.5 4.4 4.89 5 2.17 2
5.5 4 2.5 5.5 4.6 5.11 4.42 3.83 5.25
6.5 4.4 5.25 6.25 5.4 5.22 5.56 1.83 5.25
5.5 5 4 5 4 3.78 4.7 2.83 3.5
5 4.6 5.5 4.5 5 4.11 4.92 3 6
5.5 5 4.5 5 5 3.11 5 4 4.5
5.5 5.4 5 5.25 4.4 2.89 5.11 3.17 4
6.5 5 5 6 5.8 4.11 5.66 3.33 5.75

124
4.5 3.8 4.5 2.5 3.4 2.67 3.74 4 5.75
5 3 5 5.25 5.2 3.33 4.69 3.5 5.75
4.25 4 3.5 3.75 4.4 4.22 3.98 4.17 4.5
2.5 1.8 2 2 2 2.22 2.06 5.67 3
6 5 5 5.5 4.4 4.44 5.18 2.67 4.75
4.25 4.6 4.25 4.5 4.4 2.22 4.4 2 4
3.75 5.4 4.5 6.75 7 5 5.48 1 5.5
6.5 5.2 4.75 6 4.8 4.22 5.45 2.83 6.75
6 5 4.75 5.75 5.4 5.11 5.38 2.67 5.5
7 5.8 5.5 5.75 6.6 5.22 6.13 2 5.5
6.5 5.2 4.75 6 6 4.33 5.69 2 5.5
5.25 5.8 4.5 5 6.2 5.44 5.35 2.33 6
6 6.6 5.75 4.75 5.2 5.56 5.66 3.5 5.5
7 5.2 5 6 5.8 4.89 5.8 1.5 6.5
5.5 5.4 4.75 5.75 5.4 5 5.36 3.67 5.75
6.5 5.2 4.75 5.75 5.8 5 5.6 1 6.75
6.75 4.8 4.25 4.5 5.8 4.89 5.22 2.17 5.5
7 5.6 5.25 4.75 5.4 6.67 5.6 1.17 5.5
6.25 5.2 4.5 5.25 5.8 4.78 5.4 1.67 5.25
6.25 6.4 4.5 5 5.6 5 5.55 2.67 6
6.25 5 4.75 5.5 5.4 4.67 5.38 3.17 5.5
6.5 4.4 4.25 6 5 4.67 5.23 4 5.5
5.5 5.4 4 5.25 4.8 4.56 4.99 2.17 5.5
6.75 4.4 4.5 4.25 4.6 4.22 4.9 2 4.5
6 5.6 4.5 5.75 6 5.89 5.57 2 5.5
5.5 4.8 4 4.75 5.6 5.22 4.93 2.83 4.75
4.5 4.2 4.5 4.5 4.2 3.44 4.38 4.33 4.25
6.5 5.2 4.5 5.25 5.6 5.44 5.41 2.17 5.5
5.5 6 5 6 5 5.56 5.5 2 4.5

125
6.5 4.6 4 5 5 3.67 5.02 2.17 5.5
5.75 5.4 4.75 5 5.8 4.11 5.34 2.33 5.5
5.25 5.6 4.75 5.75 5.2 3.78 5.31 2 5.5
6 4.4 4.25 5.25 5.2 3.56 5.02 3 5
4.75 3.8 4.25 5 5 3.44 4.56 2 5.25
4.75 3.4 4.25 4.75 4.8 2.33 4.39 3.33 3.25
5.25 4.2 4.25 5 5 5.56 4.74 3 4
6.25 3.4 6.5 6.5 6.2 6.11 5.77 5.83 6.25
7 6 6 6 5.4 4.56 6.08 6.17 6
4.75 3.6 2.5 4.25 4 4.11 3.82 3.5 3.25
5.25 4.2 5.75 5.75 5.6 4.44 5.31 2.83 5
4.25 4.2 4 4.25 4.6 3.11 4.26 1.5 5.5
6.25 5 7 6 4.6 3.56 5.77 4.17 6.5
4.5 4.8 4.75 4.5 4.4 3.78 4.59 2.5 4.75
2.25 1.8 2.25 5.5 2.2 3.89 2.8 3.5 2
5.25 5.2 4.75 5 5.6 5.78 5.16 2.33 5.25
6 4.8 6.5 5.5 5.2 6.33 5.6 4 4.5
5.5 5 5.25 4.25 6 4.89 5.2 1 4.75
6.5 5.4 5.75 4.75 5.4 5.22 5.56 2 5
5.5 4.8 4 5.75 5.2 6 5.05 2.67 5.25
6 4.6 5.25 5.75 4.2 4.67 5.16 2.5 6.5
5.75 2.8 3 6.25 4.2 4.67 4.4 4 6
5.5 4.8 4.25 4.5 5 5.56 4.81 3 5.25
6 1.6 2.5 4.75 3.4 1.67 3.65 2.5 6
5.75 6 5 7 2.8 3.22 5.31 4.67 1
6.75 4.8 4 4.5 5 4.78 5.01 2.83 4
6.75 4.8 4 5 4.8 4.78 5.07 2.83 4
6.25 4.4 2.75 3.75 4.6 4 4.35 2 4.25
7 6 5.25 6 4 5.67 5.65 2.5 3.25

126
6.5 4.6 4.25 5.5 5.4 4.56 5.25 2.33 6
6.25 5.6 3.5 4.25 5.2 5.44 4.96 1.83 5.5
3.25 2.2 2 2.75 3.8 2.33 2.8 6 4
6.25 2.6 3.5 5.75 3 5.56 4.22 1.67 5.25
3 2.6 2 3.25 4.2 2.67 3.01 2.83 4
5 5.8 5.5 5.5 6.4 6.11 5.64 2.67 5.5
6.75 6.4 5 5.75 3.4 5.89 5.46 1.33 5.75
6.25 5.2 4.5 5.75 5.6 4.78 5.46 1 5.25
6.25 5.4 3.5 5.5 5.4 6.11 5.21 2.33 4
5.75 5.8 5.75 4.75 6.4 5.44 5.69 1 6.75
7 7 7 7 7 7 7 1 5.5
4.75 4.6 4.25 4.75 4.6 5.67 4.59 1 3.5
5.75 4.8 4.25 6 4.6 4.78 5.08 2.67 4.5
4.75 3.4 4.5 5.25 5.8 4.33 4.74 2.17 4.5
7 7 6.75 6.5 5 6 6.45 2 2
7 7 5.5 6.75 7 5.33 6.65 4.17 6
5.5 4.4 4.75 5 5.4 5 5.01 2.83 5.75
5.75 5.4 2 6.25 5.4 4.89 4.96 2.5 5.5
5.75 6 1.5 5.5 6.2 5.22 4.99 1.5 4.75
5.75 3.6 1 6.25 5.4 4.89 4.4 2.5 5.5
5.5 4.4 5.25 6.25 6.4 6.56 5.56 2.67 5.25
6.25 3.6 1 6.25 5.4 5.67 4.5 2.33 5.5
5.5 6 5.25 6 5.8 6.22 5.71 2 6.75
6.25 6.8 6.75 6.5 6.6 6.33 6.58 5 6.5
5.75 4.2 4.75 6.5 3.4 5.11 4.92 3.83 5.5
5.75 1.8 2.5 3.75 4.2 2.67 3.6 4.33 4.75
6.75 6.2 3.5 6.25 5.2 4.89 5.58 3.5 4.25
3 3 3 3.75 3.6 3.78 3.27 2 3
7 6.4 5.5 6.25 5.8 6.33 6.19 1.33 6.75

127
3.75 5 4 4.75 4.6 3.33 4.42 1.67 3.5
5.75 5.2 5.5 4.25 5.4 5.44 5.22 5.83 5.75
6.5 6.4 6 6.75 6.6 5.89 6.45 2 6
5.25 6 4.5 6.75 5.8 4.67 5.66 2 5.5
5.25 6 4.5 6.75 5.8 4.67 5.66 2 5.5
5.25 6 4.5 6.75 5.8 4.67 5.66 2 5.5
5.25 6 4.5 6.75 5.8 4.89 5.66 1.5 5.5
5.25 6 4.5 6.75 5.8 4.67 5.66 2 5.25
6.5 6.8 7 6.75 6.6 6.67 6.73 1 2
5.25 6 4.5 6.75 5.8 4.67 5.66 2 5.5
6.5 5.4 3.25 4 5 4.56 4.83 2.67 5
6.5 6.8 6.75 6.75 7 7 6.76 1 7
6.5 6.4 5.25 6 6.2 2.11 6.07 1.5 5.75
3.25 2.8 2 3 3.6 1.67 2.93 2.83 3.75
5.75 4.6 6 5.25 5.6 4.78 5.44 2 6.75
5 4.4 3.5 4.5 4.2 4 4.32 3.67 5
3.25 1.6 2 3.75 2.4 1.33 2.6 4 3.25
6.75 4.6 1.25 3.75 3.6 4.56 3.99 2 4.25
6.75 4.6 4.75 5.5 5.8 5 5.48 2.5 5.5
6 5 4 4.5 4.6 3.78 4.82 2.33 4.75
5.75 3.4 2 6.25 5.8 4.67 4.64 2.67 5.5
6.75 3.6 3 5 5.4 5.11 4.75 2.5 5.5
7 6.8 6.75 6.25 7 4.67 6.76 1.17 6
6.25 2.6 2.5 6.25 3.4 3.22 4.2 3.67 5
6.5 6.4 6 6.75 6.6 6.67 6.45 2 6
6.5 6.8 3.75 6.5 6.2 5.44 5.95 2.5 5
6.75 7 4 4 3.6 6.89 5.07 2.67 3.5
7 6.6 6.25 6.25 6.2 5.11 6.46 1.17 6
5.5 4 3 3.75 4.4 3.22 4.13 2.67 4.25

128
5.5 4.2 4.5 5 5.4 5 4.92 1 5.75
6 6 6 5.75 6 6 5.95 4.17 5.5
5 6.2 6 6 5.2 6.33 5.68 2.17 6.5
5.5 4.6 5.5 6.25 4.4 5 5.25 6.17 6
4 5.2 3.75 5.5 5 4.44 4.69 2.17 5.25
6.5 6.6 4.5 5.25 5.8 4.78 5.73 3.67 5
7 6.2 6 6 6 6.11 6.24 1.5 5.75
6 6.2 7 7 6 6.56 6.44 1.33 6.25
7 5.8 5.5 6 6.2 6.56 6.1 1 5.5
6 6.2 5.75 5 6 6.56 5.79 1.67 5.5
4.5 3.6 3.75 4.25 4.8 3.89 4.18 4.17 4.75
4.5 3.4 3.5 4.25 4.2 4.33 3.97 5.17 4.75
3.75 1.6 2.5 4.75 1.6 2.44 2.84 4.17 4
6.25 4.2 4.75 4.5 4.4 4.67 4.82 3.83 5.25
4.5 4 3.5 4.75 5.8 5.22 4.51 2.67 6
5.5 4.6 4 6 5.8 6 5.18 2.5 5
5.5 1.4 1.25 3 2.4 2.89 2.71 4.83 2.5
5.25 5 4.25 4.75 4 5.33 4.65 4.83 4.25
5.25 2.2 3 4.75 4.8 4.44 4 2.67 1
6.75 6.6 6.75 6.25 6.8 6.89 6.63 1 5.5
4.75 2.6 5.25 4.5 4.2 2.22 4.26 4.33 5
6.25 6.4 5.25 6.25 5.8 6 5.99 1.5 5
6.25 2 2.5 7 5.8 4 4.71 1 2.5
3.25 4.8 5.5 5.75 5 4.89 4.86 4.33 5.5
6.5 5 6 6.25 6.8 6.22 6.11 1.17 5.25
4 5 4.5 5 4 6 4.5 7 6
6 3.2 2.25 4 4 4.67 3.89 2.67 4.75
6.5 6 5 6.75 3.8 6.56 5.61 1.5 3.25
7 4.6 6.25 6.5 6.6 6.56 6.19 1.67 7

129
7 7 7 7 6.8 7 6.96 2 7
6.5 5.6 4.75 6.25 6.4 6.22 5.9 1.17 6.25
5.5 7 6.25 7 7 7 6.55 1 7
5 4 2.75 5 4 3.11 4.15 4 4.5
5.75 3.2 4.5 5.25 5.6 4.67 4.86 3.83 5.25
6.25 6.8 6.25 7 7 6.89 6.66 3.17 5.75
5 2.6 3.5 3.25 3.6 3.67 3.59 5 3
6.5 5 5 5.75 6.8 5.11 5.81 3.33 3.25
5.25 6.8 7 7 6.8 7 6.57 1 7
6.5 4 5.5 6.5 6.2 6.11 5.74 2.17 6
6.5 4.8 5 4.75 4.8 4.22 5.17 1.33 4.75
6.5 5.6 6 5.75 5.6 5.89 5.89 1.83 5.25
4.75 3 4 3.5 4.8 5 4.01 3 5.5
7 6.4 6 6.75 5.6 6.78 6.35 1 5.25
6.75 4.4 6 5.75 6.2 5.78 5.82 6.67 6.25
6 6 6.25 6 6 5 6.05 2 5.75
6.5 3.4 2.5 3.5 3.8 5.33 3.94 5.5 4.5
6 5.2 4.25 6 6 5 5.49 2.33 4
5.75 5.6 5.25 5.5 5.6 4.22 5.54 3 5
6.5 6.6 6.25 6.25 6 6.44 6.32 3.33 5.25
6.5 4.6 3.5 6 6.6 4.44 5.44 2 7
4.75 5 2.5 4.5 5.8 6.22 4.51 4.33 5.75
4.5 5.2 6.25 6 5.6 6.11 5.51 3.5 4.25
5.75 5.2 4.25 6 5.2 5.33 5.28 1.83 5.75
4.75 5.8 5 4.5 4.4 5.89 4.89 2.5 7
6.5 5.6 5.25 5.75 6.6 5.56 5.94 1 6
6.75 6.8 6.5 7 6 5.67 6.61 1 4.5
5 4.4 5.25 5 5.8 5 5.09 3.33 5
3.5 3.8 3.25 3.25 3 2.11 3.36 1.33 4.25

130
4.25 4.6 2.5 3.75 2.4 5.56 3.5 2.33 7
4.75 3.2 3.5 4.25 4 3.22 3.94 2 3.75
3.75 5.4 5.5 5.5 4 4.56 4.83 2 4.75
6.5 7 6 6.25 4.6 6 6.07 1.5 6
5.5 4.6 5.5 4 3.4 6.33 4.6 2 5.5
6.75 7 6 5.25 4.6 4.56 5.92 5 6
6 5.8 3.75 6.25 5.4 5.67 5.44 2 5.75
6.75 6.2 7 7 7 7 6.79 1 4.75
6 6.8 6.75 7 4 4.56 6.11 2 3
6 5 5 4.75 4 4.89 4.95 2.17 4.5
6.25 6 6 6.25 6 5.33 6.1 2.5 4
6.75 4.8 4 5.5 5.8 4.44 5.37 1.83 5.25
6.75 3.6 2.75 5 5.4 5.22 4.7 2.5 5.5
6.75 4.8 4 5.5 5.8 4.44 5.37 1.83 5.25
6.75 4.6 3.25 4.5 4.6 4.56 4.74 2.33 5
6.75 4.6 3.25 3.25 4.6 4.56 4.49 2.67 5
6.75 4.6 4 4.5 5.6 4.78 5.09 2.5 4
3.5 4 4.5 5 5 5.56 4.4 5.5 5
5.25 5.4 5.25 6.25 5.6 6.33 5.55 1.67 5.5
5.5 5.2 5 6.5 6.2 5.67 5.68 2 4
5.5 6 5 5.75 7 5.78 5.85 2.5 5.25
5.75 5.4 5.25 5.25 6.4 5.22 5.61 3 6.25
6 5.2 5 6.75 6.2 3.78 5.83 2.83 5.75
6.25 6 4 5.5 5.8 4.78 5.51 2.83 4.75
6.5 6 4.75 6.75 5.4 4.67 5.88 1.83 5
6.5 6.4 3.75 6.75 5.8 6.67 5.84 2.5 6.75
5.5 5.6 5 6.25 6.2 5.44 5.71 2.5 5.75
6.25 6.2 4.5 7 6.8 5.78 6.15 2.33 6.5
6.75 6.8 6.5 6.5 6 6.89 6.51 3.67 6.5

131
4 6 5.5 5.5 6.6 5.89 5.52 4.83 7
4.75 4 3.75 4.75 5.6 5.67 4.57 2.17 5.5
5.75 3.6 1 6.25 5.4 5.78 4.4 1.83 4.25
6.5 6.6 7 6.25 7 5.33 6.67 4.5 5.75
5.75 5.2 5.5 3.75 5.4 4.89 5.12 3.83 5.5
5.75 3.6 1 6.25 5.4 5.56 4.4 2.5 5.5
5.5 6 5.5 6.25 6.2 6.78 5.89 1.83 5.75
6.25 5.6 6 6 6.2 2.56 6.01 2.5 4.75
5.5 4.6 3.25 4.25 4 5.11 4.32 2 5.25
Source: Survey data (2014)