The mitochondrial genomes of Campodea fragilis and Campodea lubbocki (Hexapoda: Diplura): High...
34
eScholarship provides open access, scholarly publishing services to the University of California and delivers a dynamic research platform to scholars worldwide. Lawrence Berkeley National Laboratory Lawrence Berkeley National Laboratory Peer Reviewed Title: The mitochondrial genomes of Campodea fragilis and C. lubbocki (Hexapoda: Diplura): high genetic divergence in a morphologically uniform taxon Author: Podsiadlowski, L. Carapelli, A. Nardi, F. Dallai, R. Koch, M. Boore, J.L. Frati, F. Publication Date: 12-01-2005 Publication Info: Lawrence Berkeley National Laboratory Permalink: http://escholarship.org/uc/item/4bp3x1sx Keywords: mtDNA mitochondrial genome apterygote hexapods
-
Upload
independent -
Category
Documents
-
view
3 -
download
0
Transcript of The mitochondrial genomes of Campodea fragilis and Campodea lubbocki (Hexapoda: Diplura): High...

eScholarship provides open access, scholarly publishingservices to the University of California and delivers a dynamicresearch platform to scholars worldwide.
Lawrence Berkeley National LaboratoryLawrence Berkeley National Laboratory
Peer Reviewed
Title:The mitochondrial genomes of Campodea fragilis and C. lubbocki (Hexapoda: Diplura): highgenetic divergence in a morphologically uniform taxon
Author:Podsiadlowski, L.Carapelli, A.Nardi, F.Dallai, R.Koch, M.Boore, J.L.Frati, F.
Publication Date:12-01-2005
Publication Info:Lawrence Berkeley National Laboratory
Permalink:http://escholarship.org/uc/item/4bp3x1sx
Keywords:mtDNA mitochondrial genome apterygote hexapods

LBNL-59182
The mitochondrial genomes of Campodea fragilis and C. lubbocki (Hexapoda: Diplura): high genetic divergence in a
morphologically uniform taxon
L. Podsiadlowski, A. Carapelli, F. Nardi, R. Dallai, M. Koch, J.L.Boore, F. Frati

The mitochondrial genomes of Campodea fragilis and C. lubbocki (Hexapoda:
Diplura): high genetic divergence in a morphologically uniform taxon
L. Podsiadlowski*, A. Carapelli†, F. Nardi†, R. Dallai†, M. Koch*, J.L. Boore‡, F.
Frati†
* Dept. of Animal Systematics and Evolution, Freie Universität Berlin, Germany
† Dept. of Evolutionary Biology, University of Siena, Italy
‡ U.S. Department of Energy Joint Genome Institute, and Lawrence Berkeley
National Laboratory, University of California, Berkeley, U.S.A.
Keywords: mtDNA, mitochondrial genome, apterygote hexapods
Running title: The mitochondrial genome of C.fragilis and C. lubbocki
* Correspondence: Dr. Lars Podsiadlowski, Department of Animal Systematics and
Evolution, Freie Universität Berlin, Königin-Luise-Strasse 1-3, D-14195 Berlin,
Germany. Fax: +49 3083854869; email: [email protected]

Abstract
Mitochondrial genomes from two dipluran hexapods of the genus Campodea have
been sequenced. Gene order is the same as in most other hexapods and
crustaceans. Secondary structures of tRNAs reveal specific structural changes in
tRNA-C, tRNA-R, tRNA-S1 and tRNA-S2. Comparative analyses of nucleotide and
amino acid composition, as well as structural features of both ribosomal RNA
subunits, reveal substantial differences among the analysed taxa. Although the two
Campodea species are morphologically highly uniform, genetic divergence is larger
than expected, suggesting a long evolutionary history under stable ecological
conditions.

Introduction
Mitochondrial sequence data are commonly used in phylogenetic studies from large
scale phylogenetics down to the population level. With few exceptions, mitochondrial
genomes from multicellular animals are circular DNA molecules, about 16 Kb in size,
containing 37 genes encoding for two ribosomal RNA molecules (rrnS and lrrS), 13
protein subunits (cox1-3, cob, nad1-6 and nd4L, atp6 and atp8) and 22 transfer RNA
molecules (trnX) (Wolstenholme, 1992; Boore, 1999). In addition, mitochondrial
genomes of insects bear one large A+T rich noncoding region, which is involved in
the initiation of mitochondrial replication and transcription (Wolstenholme, 1992), and
is therefore commonly referred to as the mitochondrial control region.
Because of the ease of amplification and sequencing, the mitochondrial genome has
been extensively studied for phylogenetic purposes, as well as for its peculiar
patterns of molecular evolution (Boore, 1999). Concerning the latter, the
mitochondrial genome has been found to exhibit extensive nucleotide compositional
bias. One of the best examples of mitochondrial compositional bias is that observed
in insects (Simon et al., 1994), and some other arthropods (e.g.: Black et al., 1998;
Negrisolo et al., 2004), where a significant higher amount of Adenine and Thymine
nucleotides (A+T bias) has been found. Another type of compositional bias is that
affecting base content at Protein Coding Genes (PCGs) in the different strands of the
mitochondrial genome (Perna & Kocher, 1995). In a thorough investigation of this
strand-specific bias across Metazoa, Hassanin et al. (2005) found clear evidence of
an asymmetric mutational bias, as well as traces of the reversal of such a bias in
some taxa due to an inversion of the control region.
Gene rearrangements of the mitochondrial genome are also well known, and several
mechanisms have been proposed to explain gene order changes, involving
duplication events followed by the random (Boore, 2000) or non-random (Lavrov et

al., 2004) loss of some duplicated copies. These events sometimes leave unusually
large fragments of non-coding DNA, in addition to the canonical control region
(Lavrov et al., 2002).
While partial sequences from the control region or from single genes, like cox1, cob,
rrnS, have been utilised in phylogenetic studies at the species or population level,
complete mitochondrial genome data have been used predominantly in phylogenetic
analyses above the family level (e.g: Nardi et al., 2003; Negrisolo et al., 2004;
Cameron et al., 2005; Cook et al., 2005). In most of the latter cases only PCGs were
studied. However, complete mitochondrial genomes provide more data than just
sequence information:
(1) Gene order is not conserved among metazoa and gene translocations may serve
as characters in phylogenetic analyses. For example the “Pancrustacea” hypothesis -
a close relationship between Crustacea and Hexapoda (excluding the Myriapoda,
which were traditionally viewed as sistergroup to hexapods) - has been suggested on
the basis of a gene translocation involving a mitochondrial tRNA gene (Boore et al.,
1998).
(2) Secondary structure features of tRNAs and rRNAs are seldomly used as
characters in phylogenetic analyses but with a growing amount of data these may be
of greater value soon (e.g. Macey et al., 2000).
(3) The mitochondrial genetic code differs in some codons from the standard code
and also varies among metazoan taxa. These deviations are of phylogenetic value as
well (e.g. Castresana et al., 1998; Telford et al., 2000).
During the last ten years the traditional view of arthropod phylogeny has been
strongly challenged by molecular analyses. As a result the Pancrustacea hypothesis
is now well supported by mitochondrial gene rearrangement data (Boore et al., 1998)
and sequence based analyses of both, mitochondrial (Wilson et al. 2000; Hwang et
al. 2001; Lavrov et al., 2004) and nuclear genes (Mallatt et al., 2004, Regier et al.,

2005). On the other hand, crustacean and even hexapod monophyly, as well as their
internal relationships, are still under debate (Regier et al., 2005; Babbitt & Patel,
2005; Podsiadlowski & Bartolomaeus, 2005). In particular, some analyses using
complete mitochondrial datasets do not support the monophyly of Hexapoda, with
different crustacean subtaxa forming sistergroups to Collembola and Insecta (Nardi
et al., 2003; Cook et al., 2005). In this context, apterygote taxa play a crucial role,
and their reciprocal relationships have not yet been resolved with certainty
(Kristensen, 1997; Kukalova-Peck, 1987; Stys & Bilinski, 1990; Carapelli et al.,
2000). Recently, the first mitochondrial genome of a member of Diplura, the japygid
Japyx solifugus, has been published (Carapelli et al., 2005) and the corresponding
phylogenetic analysis suggests a paraphyletic origin of Hexapoda. On the other hand
detailed analyses of hexapod relationships based on the nuclear 18S rRNA results in
hexapod monophyly (Kjer, 2004; Babitt & Patel, 2005). The increased use of rRNA
sequences in phylogenetic studies has stimulated the debate over the correct
alignment procedures. One approach calls for using the information contained in
rRNA secondary structures (Kjer, 1995, 2004), which, in turn, are inferred from
general models based on the comparison of a large number of sequences (Hickson
et al., 1996).
In this study we present two additional mitochondrial genomes from apterygote
hexapods: Campodea fragilis and C. lubbocki (Diplura: Campodeidae). We provide
detailed analyses of nucleotide and amino acid frequencies, and compositional bias,
as well as the reconstruction of the putative secondary structures of tRNA and rRNA
genes. Although a lot of mitochondrial genomes from arthropods are published now,
only a few congeneric species are compared. The genus Campodea has a worldwide
distribution and comprises about 150 soil-dwelling, herbivorous species, sized up to 5
mm and highly uniform in appearance. The two species studied exhibit only a few
morphological differences: spatulate (C.l.) or acuminate (C.f.) praetarsal

appendages; presence (C.l.) or absence (C.f.) of mediane macrochaetae on
abdominal tergites; annulated (C.l.) or smooth (C.f.) cerci (Palissa, 1964). Both seem
to occupy similar ecological niches but their genetic divergence turned out to be
rather high, suggesting a long evolutionary history under stable environmental
conditions.
Results and Discussion
Genome organisation
Both Campodea mitochondrial genomes presented here share the same 37 genes
with most bilaterian animals and have the same gene arrangement (Fig. 1) as other
apterygote hexapods (Tricholepidion gertschi, NC005437; Nesomachilis australica,
NC006895; Japyx solifugus AY771989), insects (Drosophila melanogaster
NC001709), and crustaceans (Daphnia pulex NC000844; Penaeus monodon
NC002184). This gene order appears to be the ancestral state for Pancrustacea
(Crustacea+Hexapoda) and differs from that of chelicerates and myriapods by the
translocation of trnL1 (Boore et al., 1998).
In both Campodea species gene overlaps exist between the PCGs atp8/atp6 (7
nucleotides) and nad4/nad4L (7 nucleotides). Other overlaps occur between tRNA
genes or between a tRNA- and a protein-coding gene. Only a few overlaps are larger
than 3 nucleotides, notably at the trnY/cox1 boundary in both species (8nt in C.
lubbocki and 5nt in C. fragilis). A large non-coding region is present between rrnS
and trnI (558nt in C. fragilis and 561nt in C. lubbocki). This is, by all evidence
available, homologous to the mitochondrial control region (CR), which, in insects, is
usually called AT-rich region for exhibiting a remarkable A+T-bias (up to >90% in
hymenopterans; Crozier & Crozier, 1993). In Campodea, the putative AT-rich region

shows A+T content between 84.2% (C. fragilis) and 89.1% (C. lubbocki). More
unusual, other non-coding (ncod) sequences are found between other mitochondrial
genes of the two Campodea species. One of them, shared by both species, is
located between trnS2 and nad1 (56nt in C. fragilis, 80nt in C. lubbocki), while only
C. fragilis has an additional ncod region of 111nt between nad2 and trnW (Fig. 1).
Interestingly, the two ncod regions can be folded in apparently stable secondary
structures (Fig. 2). Most other arthropods lack non-coding sequences larger than a
few nucleotides (with the control region as an exception). Although very unusual, the
occurrence of large non-coding regions abutting gene junctions has been observed in
insects and myriapods (Lavrov et al., 2002; Bae et al., 2004). Sometimes these
fragments are mentioned as remnants of gene duplication events due to possible
errors during the replication of the mitochondrial genome (Boore, 2000). Extra copies
of mitochondrial genes are subsequently eliminated from the compactly arranged
mitochondrial genome (Boore, 1999). The occurrence of these structures would
suggest that the remnant of an exceeding copy of a tRNA gene is still present in the
genomes of the taxa under study. In addition, the ncod fragments found in both
Campodea species between trnS2 and nad1 clearly exhibit homologous patterns in
either primary sequence and secondary structure. Accordingly, this feature would
suggest that the presumed duplication event has occurred before the speciation of
the two taxa.
A+T content of complete mitochondrial genomes varies among insects (Table 1).
While Japyx solifugus (Japygidae), the only other dipluran species with published
mitogenomic data, has the lowest value among hexapods (64.8%), C. lubbocki has
the highest value among apterygote insects (74.9%), followed by two collembolans
(Gomphiocephalus hodgsoni and Tetrodontophora bielanensis) and C. fragilis
(72.6%). Comparatively, high values are also found in Pterygota, while
archaeognathan and zygentoman species range between 67-69%. In all species,

third-codon position sites of PCGs have significantly higher A+T content than either
first and second codon positions. Functional reasons for the strong differences of
A+T content among hexapods are still under debate.
Protein coding genes
There is no significant difference in the size of the PCGs of C. fragilis and C. lubbocki
compared to each other and to other apterygote hexapods (Table 2). The three
starting codons ATA, ATG and ATT are used in both species, while only in C.
lubbocki the starting codon ATC is used for atp8, nad1 and nad5. In some cases stop
codons are truncated (cox1-3 in C. fragilis; cox3, nad3, nad4 and nad6 in C.
lubbocki) and possibly post-transcriptionally completed to TAA after cleavage
(Okimoto et al., 1990, Lavrov et al., 2002).
Nucleotide sequence similarity of PCGs between the two Campodea species ranges
from 49.5% (nad6) to 77.9% (cox2) (Table 2). As an example, the pairwise similarity
of cox1-cox3 between C. fragilis and C. lubbocki (77.1%) is rather low: in the same
region, four Ixodes species show levels of nucleotide divergence ranging from 75%
to 82%, five Drosophila-species are in the range 92-99%, while two species of the
crustacean Triops (T. cancriformis and T. longicaudatus) differ by 81.2%, and two
species of Bombyx (B. mori and B. mandarina) by 96%. In contrast, the divergence
between the two Campodea sequences is more similar to that observed between
species from different orders, such as in the comparison between Pteronarcys
princeps (Pterygota: Plecoptera) and five Drosophila species (78-79%), or the
comparison of P. princeps with the zygentoman Tricholepidion gertschi (73.5%). Frati
et al. (1997) provided a comparison between different collembolan species and other
hexapods based on cox2 sequences. Levels of nucleotide similarity for cox2 between
congeneric species (genera Orchesella and Isotomurus) were only slightly higher
(80.4-81%) than that observed between C. fragilis and C. lubbocki (77.9% or

78.5%?). On the other hand, nucleotide similarity of cox2 between Campodea
species and J. solifugus varies between 67.4% and 67.8%, well in the range of that
estimated, in Collembola, between species from different lineages (61.9%-69.7%), or
between collembolan species and other pterygote insects (60.4%-68.9%). Looking at
the inferred amino acid sequence similarity, the values estimated in diplurans
(68.1%-69.5% between Campodea and J. solifugus) are comparable to those found
between species from different orders among pterygote insects (Simon et al., 1994).
We conclude that, although morphologically very uniform, the taxon Campodea is
genetically highly diverse and that, under the molecular clock hypothesis, the split
between the two species occurred comparably long ago, perhaps as long as some of
the basal splits among pterygote insects. Indeed, taxonomic categories above the
species do not necessarily imply similar genetic and morphological differentiation, nor
similar age in different lineages. Our results in Campodea parellel those obtained in
collembolans (Frati et al., 1997, 2000) in indicating high levels of genetic divergence
(in itochondrial sequences) even between congeneric species which do not exhibit
comparable morphological differentiation. These results point towards either
accelerated rates of evolution or remarkably older age of genera of apterygote
hexapods.
As shown by Hassanin et al. (2005), PCGs differ for their A vs. T and C vs. G content
according to the strand (J- or N-strands; sensu Simon et al., 1994) where they are
encoded. Genes encoded on the J-strand show a slight bias towards Ts over As and
a strong bias towards Cs over Gs, while genes encoded on the N-strand show a
much stronger bias towards Ts over As and towards Gs over Cs (Table 2, Fig. 3).
One reason for this outcome might be the asymmetrical replication process, during
which one strand is single-stranded for a longer time than the other, and therefore
more susceptible for specific mutations (for more details see: Hassanin et al., 2005).

Relative synonymous codon usage in PCGs (Table 3) reveals that the genome-wide
base compositional bias for A+T is also reflected in codon usage. The two
Campodea species differ in preferred codons for Glycine, Proline and Threonine,
whereas both species differ from J. solifugus in codon preferences for Alanine,
Histidine and Valine. In the case of Histidine, this reflects the strong differences in
A+T content, as in J.solifugus codon the codon CAC is preferred, whereas
Campodea species prefer CAT. A similar observation is evident in the case of
Leucine, for which TTA is the preferred codon in all three diplurans, but to a much
stronger degree in Campodea than in J. solifugus.
Transfer-RNA coding genes
In both species all 22 tRNA-encoding genes usually found in mitochondrial genomes
of metazoans are present. In both species the most likely secondary structure
models for tRNA-R, tRNA-S1 and tRNA-S2 lack the D-arm (Fig. 4). In C. lubbocki
also the tRNA-C has a shortened (or missing) D-arm. In contrast, all tRNAs
mentioned above show the usual cloverleaf secondary structure in J. solifugus (Fig.
4), as well as all remaining tRNAs in C. fragilis and C. lubbocki (data not shown).
Accordingly, a reduction of the D-arm of tRNA-R, and the two types of tRNA-S, must
have evolved after the split between Campodeidae and Japygidae. Reduction of the
D-arm of tRNA-C probably occured even later, after the split between C. lubbocki and
C. fragilis. These data may be of value for phylogenetic inferences, when
mitogenomic data will be available from more dipluran species.
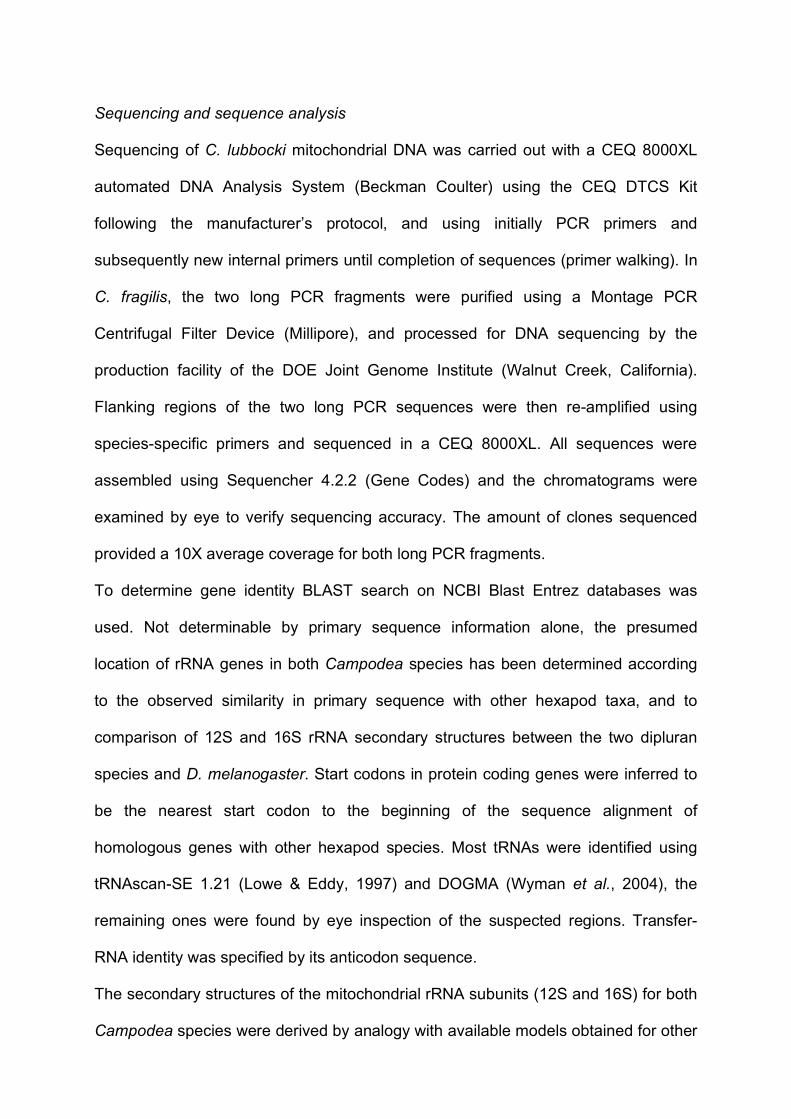
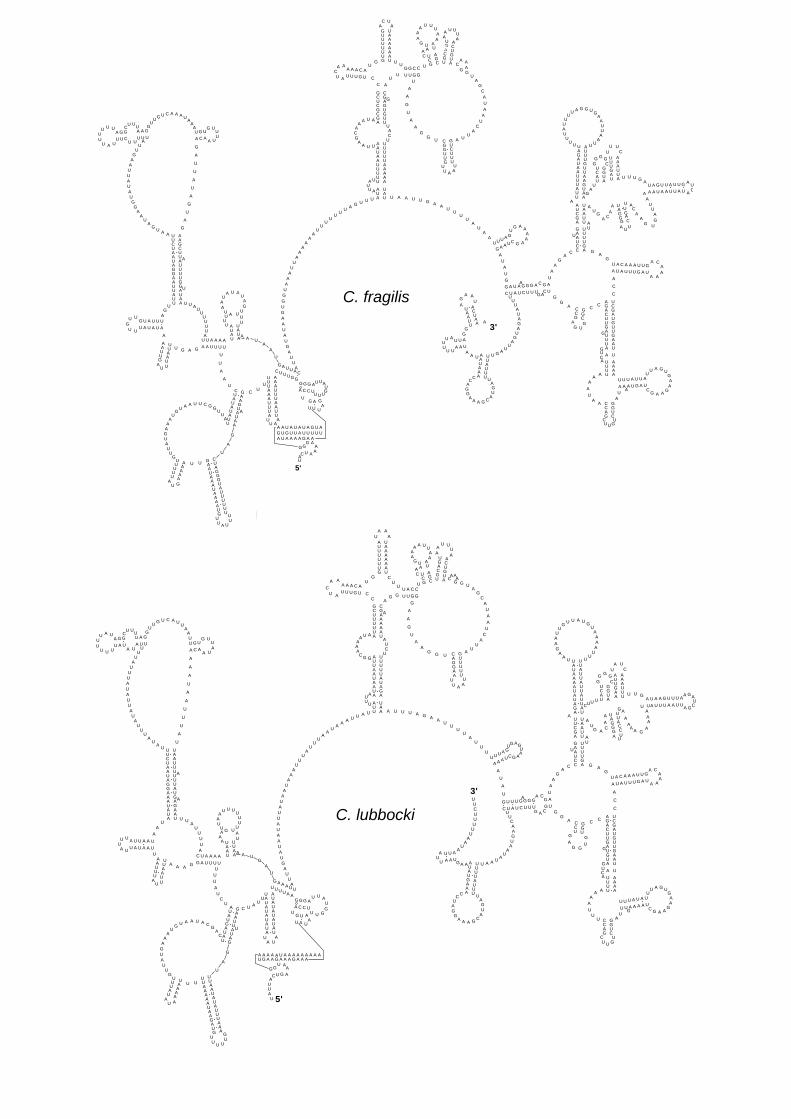
Ribosomal-RNA coding genes
The two genes for ribosomal RNA subunits (rrnL for 16S rRNA and rrnS for 12S
rRNA) can be folded in an inferred secondary structure composed of paired and
single strand fragments (Figs. 5, 6). Comparative analysis shows that both rRNA

subunits are composed of a mosaic of variable and conserved sequence fragments,
which are distributed in paired and unpaired regions of all domains (Fig. 7). This is
probably due to variable functional constraints, acting at different degrees in specific
parts of the rRNA subunits, which are necessary to maintain the ribosome
functionality. This evidence suggests that different rates of nucleotide substitution
affect each domain of rrnL and rrnS. Sequence similarity in aligned (based on
secondary structure) rRNAs of C. lubbocki and C. fragilis is within the range of
sequence similarity of the PCGs (rrnL: 74.3%; rrnS: 73.8%).
In general, core structural elements of C. fragilis and C. lubbocki rRNA subunits
closely resemble those proposed for Drosophila melanogaster. The inferred
secondary structure of the 12S rRNA of each species (Fig. 5) displays a considerable
degree of differentiation in terms of length and shape of most of domains I and II (Fig.
7a), with conserved stretches of sequences present only on helices h and m.
Conversely, domain III is probably the most conserved fragment of the entire 12S
rRNA subunit, showing many invariant structural elements between C. fragilis and C.
lubbocki (Figs. 5, 7a: all helices from o to a1 with the exception of u) and some
identical stretches of primary sequence. With few exceptions aside (Page, et al.
2002), this evidence is in agreement with the data obtained from broader
comparisons that include extended datasets of animal mitochondrial 12S rRNA
sequences (Hickson et al., 1996; Simon et al., 1996).
Domain I is probably the most variable part of the 16S rRNA subunit (Fig. 6), differing
in terms of length and primary sequence between C. fragilis and C. lubbocki. On
domain II the highest levels of sequence variability can be observed in the most
peripheral helices (g, j, k and o), in the descendant part of helix I and in the single
strand segments connecting helices l, m and n (Fig. 7b). An extensive primary
sequence homology can be observed in the fragment enclosed between the
ascendant and the descendant parts of helix t.

Experimental procedures
C. lubbocki; DNA isolation and PCR
Campodea lubbocki was collected in the garden of the Institute for Zoology, Freie
Universität Berlin. One individual was cut into pieces and directly used for rolling
circle amplification with the Templify kit (Amersham) following the manufacturer’s
protocol. Templify treated material was diluted with water (1:5) and used as DNA
template in PCR. Two additional specimens were ethanol fixed for SEM, in order to
determine the species according to Palissa (1964).
Initially five partial mitochondrial sequences (cox1, nad5, cob, rrnL, rrnS) were
determined with PCR primer pairs designed for this purpose by looking for conserved
regions of mitochondrial genes from other hexapod and crustacean sequences
(Podsiadlowski & Bartolomaeus, 2005). PCR primers were purchased from metabion
(Germany). PCR was performed on Mastercycler and Mastercycler Gradient
(Eppendorf, Hamburg, Germany) using the Eppendorf HotMasterTaq kit. 50 µl
reaction volumes were set up as follows: 42 µl sterilized distilled water, 5 µl 10x
reaction buffer 1µl dNTP mix (Eppendorf) 1 µl primer mix (10 µM each), 1 µl DNA
template, 0,2 µl (1u) HotMasterTaq polymerase. The cycling protocol included an
initial denaturation step (94°C, 2 min), 40 cycles of denaturation (94°C, 30 sec),
annealing (1 min, primer specific annealing temperature) and extension (68°C, 90
sec) and a final extension step (68°C, 1 min). After agarose (0,9%) gel separation
and visualization of ethidium-bromide stained PCR products, purification for
sequencing (see below) was performed using the PCR purification kit (Qiagen) or
when necessary using the Gel extraction kit (Qiagen).

In a second step the determined sequences were used to design five additional PCR
primer pairs bridging the gaps between them. PCR was performed as described
above, except for using an extension time of seven minutes. PCR products were
inspected and purified as described above.
C. fragilis; DNA isolation and PCR
Total DNA was extracted from a specimen of C. fragilis collected nearby the Belcaro
Castle (Siena; Italia) using the Wizard SV Genomic DNA purification system
(Promega). Preliminary amplification of short fragments of nad4 and rrnL, obtained
using mitochondrial universal primers (Simon et al., 1994), were used to design
species-specific primers to generate two long PCR products corresponding to the
entire mitochondrial genome. The first long PCR product (about 6.5 Kb) amplified the
fragment between nd4 and rrnL, with the primer pair Camp-rRNAN (5’-
GGTTGTATCGGAAGCTGCAGCTAG-3’) and Camp-nd4J (5’-
CTGGGTCGATAGTTTTGGCTGC-3’), using the following two-steps PCR conditions:
35 cycles at 96°C for 1 min and 68°C for 8 min, followed by incubation at 68°C for 15
min. The second fragment (8.5 Kb) corresponding to the sequence encompassed
between rrnL and nad4, was amplified with the primer pair Camp-rRNAJ and Camp-
nd4R (corresponding to the reverse complementary of the previous pair), using the
following PCR condition: 35 cycles at 96°C for 1 min and 68°C for 12 min, followed
by incubation at 68°C for 15 min.
PCR reactions were performed on a GeneAmp PCR System 2700 (Applied
Biosystem) in 25 µl reaction volume set up as follows: 10,75 µl of sterilized distilled
water, 2.5 µl 10x reaction buffer, 2.5 µl of 25 mM MgCl2, 4µl dNTP mix, 1.25 µl of
each primer (10 µM), 2.5 µl DNA template and 0,25 µl (1.25u) of TaKaRa LA Taq
polymerase (Takara). Each PCR reaction yielded a single band when visualized with
ethidium bromide staining after electrophoresis in a 1% agarose gel.
Sequencing and sequence analysis
Sequencing of C. lubbocki mitochondrial DNA was carried out with a CEQ 8000XL
automated DNA Analysis System (Beckman Coulter) using the CEQ DTCS Kit
following the manufacturer’s protocol, and using initially PCR primers and
subsequently new internal primers until completion of sequences (primer walking). In
C. fragilis, the two long PCR fragments were purified using a Montage PCR
Centrifugal Filter Device (Millipore), and processed for DNA sequencing by the
production facility of the DOE Joint Genome Institute (Walnut Creek, California).
Flanking regions of the two long PCR sequences were then re-amplified using
species-specific primers and sequenced in a CEQ 8000XL. All sequences were
assembled using Sequencher 4.2.2 (Gene Codes) and the chromatograms were
examined by eye to verify sequencing accuracy. The amount of clones sequenced
provided a 10X average coverage for both long PCR fragments.
To determine gene identity BLAST search on NCBI Blast Entrez databases was
used. Not determinable by primary sequence information alone, the presumed
location of rRNA genes in both Campodea species has been determined according
to the observed similarity in primary sequence with other hexapod taxa, and to
comparison of 12S and 16S rRNA secondary structures between the two dipluran
species and D. melanogaster. Start codons in protein coding genes were inferred to
be the nearest start codon to the beginning of the sequence alignment of
homologous genes with other hexapod species. Most tRNAs were identified using
tRNAscan-SE 1.21 (Lowe & Eddy, 1997) and DOGMA (Wyman et al., 2004), the
remaining ones were found by eye inspection of the suspected regions. Transfer-
RNA identity was specified by its anticodon sequence.
The secondary structures of the mitochondrial rRNA subunits (12S and 16S) for both
Campodea species were derived by analogy with available models obtained for other

arthropods (Gutell et al., 1994; Misof & Fleck, 2003; Cannone et al., 2002).
Secondary structures of 12S and 16S rRNA genes and of intergenic non-coding
regions were then visualized using the program RnaViz 2.0 (De Rijk & DeWachter,
1997).
Nucleotide frequencies and codon usage was determined using DAMBE (version
4.2.13; Xia & Xie, 2001). PCGs were aligned and compared using Bioedit (version
7.0.1; Hall, 1999).
Acknowledgements
Part of this work was performed by the University of California, Lawrence Berkeley
National Laboratory under Contract No. DE-AC02-05CH11231
References
Babbitt, C.C. and Patel, N.H. (2005) Relationships within the Pancrustacea:
Examining the influence of additional Malacostracan 18S and 28S rDNA.
Crustacean Issues 16: 275-294
Bae, J.S., Kim, I., Sohn, H.D. and Jin, B.R. (2004) The mitochondrial genome of the
firefly, Pyrocoelia rufa: complete DNA sequence, genome organization, and
phylogenetic analysis with other insects. Mol Phylogenet Evol 32: 978-985.
Black IV, W.C., and Roehrdanz, R.L. (1998) Mitochondrial gene order is not
conserved in arthropods: prostriate and metastriate tick mitochondrial genomes.
Mol Biol. Evol 15: 1772-1785.
Boore, J.L. (1999) Animal mitochondrial genomes. Nucleic Acids Res 27: 1767-1780.
Boore, J.L. (2000) The duplication/random loss model for gene rearrangement
exemplified by mitochondrial genomes of deuterostome animals. In Comparative
genomics (D. Sankoff and J. H. Nadeau, eds.), pp. 133–147. Kluwer Academic
Publishers, Dordrecht, The Netherlands.

Boore, J.L., Lavrov, D. and Brown, W.M. (1998) Gene translocation links insects and
crustaceans. Nature 393: 667-668.
Buckley, T.R., Simon, C., Flook, P.K. and Misof, B. (2000) Secondary structure and
conserved motifs of the frequently sequenced domains IV and V of the insect
mitochondrial large subunit rRNA gene. Insect Mol Biol 9: 565-580.
Cameron, S.L., Miller, K.B., D'Haese, C.A., Whiting, M.F. and Barker, S.C. (2004)
Mitochondrial genome data alone are not enough to unambiguously resolve the
relationships of Entognatha, Insecta and Crustacea sensu lato (Arthropoda).
Cladistics 20: 534-557.
Cannone, J.J., Subramanian, S., Schnare, M.N., Collett, J.R., D'Souza, L.M., Du, Y.,
Feng, B., Lin, N., Madabusi, L.V., Muller, K.M., Pande, N., Shang, Z., Yu, N. and
Gutell, R.R. (2002) The Comparative RNA Web (CRW) Site: An Online Database
of Comparative Sequence and Structure Information for Ribosomal, Intron, and
other RNAs. BioMed Central Bioinformatics 3: 2.
Carapelli, A., Frati, F., Nardi, F., Dallai R. & Simon, C. 2000. Molecular phylogeny of
the apterygotan insects based on nuclear and mitochondrial genes. Pedobiologia
44: 361-373.
Carapelli, A., Nardi, F., Dallai, R., Boore, J.L., Lio, P. and Frati, F. (2005)
Relationships between hexapods and crustaceans based on four mitochondrial
genes. Crustacean Issues 16: 295-306.
Castresana, J., Feldmaier-Fuchs, G. and Pääbo, S. (1998) Codon reassignment and
amino acid composition in hemichordate mitochondria. Proc Nat Acad Sci USA 95:
3703-3707.
Cook, C.E., Yue, Q. and Akam, M. (2005) Mitochondrial genomes suggest that
hexapods and crustaceans are mutually paraphyletic. Proc R Soc B 272: 1295-
1304.

Crozier, R.H. and Crozier, Y.C. (1993) The mitochondrial genome of the honeybee
Apis mellifera: complete sequence and genome organization. Genetics 133: 97-
117.
De Rijk, P. and De Wachter, R. (1997) RnaViz, a program for the visualisation of
RNA secondary structure. Nucleic Acids Res 25: 4679-4684.
Frati, F., Simon, C., Sullivan, J. and Swofford, D.L. (1997) Evolution of the
mitochondrial cytochrome oxidase II gene in Collembola. J Mol Evol 44: 143-158.
Frati, F., Dell’Ampio, E., Casasanta, S., Carapelli, A. and Fanciulli, P.P. (2000) Large
amounts of genetic divergence among Italian populations and species of the
genus Orchesella (Insecta, Collembola) and the relationships of two new species.
Mol Phylog Evol 17: 456-461.
Gutell, R.R., Larsen, N. and Woese, C.R. (1994) Lessons from an evolving rRNA mit
LSU and 23S structures from a comparative perspective. Microbiol Rev 58: 10-26.
Hall, T.A. (1999) BioEdit: a user-friendly biological sequence alignment editor and
analysis program for Windows 95/98/NT. Nucl Acids Symp Ser 41: 95-98.
Hassanin, A., Leger, N. and Deutsch, J. (2005) Evidence for multiple reversals of
asymmetric mutational constraints during the evolution of the mitochondrial
genome of Metazoa, and consequences for phylogenetic inferences. Syst Biol 54:
277-298.
Hickson, R.E., Simon, C., Cooper, A., Spicer, G.S., Sullivan, J. and Penny, D. (1996)
Conserved sequence motifs, alignment, and secondary structure for the third
domain of animal 12S rRNA. Mol Biol Evol 13: 150-169.
Hwang, U.W., Friedrich, M., Tautz, D., Park, C.J. and Kim, W. (2001) Mitochondrial
protein phylogeny joins myriapods with chelicerates. Nature 413: 154-157.
Kjer, K.M. (1995) Use of rRNA secondary structure in phylogenetic studies to identify
homologous positions: an example of alignment and data presentation from the
frogs. Mol Phylog Evol 4: 314-330.

Kjer, K.M. (2004) Aligned 18S and insect phylogeny. Syst Biol 53: 506-514.
Kristensen, N.P. 1997. The groundplan and basal diversification of the hexapods. In:
Fortey, R.A. & Thomas, R.H. (eds.), Arthropod Relationships: pp. 281-293.
London: Chapman & Hall.
Kukalová-Peck, J. 1987. New Carboniferous Diplura, Monura and Thysanura, the
hexapod groundplan, and the role of thoracic side lobes in the origin of wings
(Insecta). Can J Zool 65: 2327-2345.
Lavrov, D.V., Boore, J.L. and Brown, W.M. (2002) Complete mt DNA sequences of
two millipedes suggest a new model for mitochondrial gene rearrangement:
duplication and non-random loss. Mol Biol Evol 19: 163-169.
Lavrov, D.V., Brown, W.M. and Boore, J.L. (2004) Phylogenetic position of the
Pentastomida and (pan)crustacean relationships. Proc R Soc Lond B 271: 537-
544.
Lowe, T.M. and Eddy, S.R. (1997). tRNAscan-SE: a program for improved detection
of tRNA genes in genomic sequence. Nucl Acids Res 25: 955-964.
Macey, J.R., Schulte II, J.A., and Larsen, A. (2000) Evolution and phylogenetic
information content of mitochondrial genomic structural features illustrated with
acrodont lizards. Syst Biol 49: 257-277.
Mallatt, J.M., Garey, J.R. and Shultz, J.W. (2004) Ecdysozoan phylogeny and
bayesian inference: first use of nearly complete 18S and 28S rRNA gene
sequences to classify the arthropods and their kin. Mol Phyl Evol 31: 178-191.
Misof, B. and Fleck, G. (2003) Comparative analysis of mt LSU rRNA secondary
structures of Odonates: structural variability and phylogenetic signal. Insect Mol
Biol 12: 535-547.
Nardi, F., Spinsanti, G., Boore, J.L., Carapelli, A., Dallai, R. and Frati, F. (2003)
Hexapod origins: Monophyletic or paraphyletic? Science 299: 1887-1889.

Negrisolo, E., Minelli, A. and Valle, G. (2004) The Mitochondrial Genome of the
House Centipede Scutigera and the Monophyly Versus Paraphyly of Myriapods
Mol Biol Evol 21: 770-780.
Okimoto, R., Macfarlane, J.L. and Wolstenholme, D.R. (1990) Evidence for the
frequent use of TTG as the translation initiation codon of mitochondrial protein
genes in the nematodes, Ascaris suum and Caenorhabditis elegans. Nucleic Acids
Res 18: 6113-6118.
Page, R.D.M., Cruickshank, R. and Johnson, K. P. (2002) Louse (Insecta:
Phthiraptera) mitochondrial 12S rRNA secondary structure is highly variable.
Insect Mol Biol 11: 361-369.
Pallissa, A. (1964): Insekten I: Apterygota. Quelle & Meyer, Leipzig, Germany.
Perna, N.T. and Kocher, T.D. (1995) Patterns of nucleotide composition at fourfold
degenerate sites of animal mitochondrial genomes. J Mol Evol 41, 353-358.
Podsiadlowski, L. and Bartolomaeus T. (2005) Organization of the mitochondrial
genome from the mantis shrimp Pseudosquilla ciliata (Crustacea: Stomatopoda).
Mar Biotechnol, in press.
Rawlings, T.A., Collins, T.M. and Rüdiger B. (2001) A Major Mitochondrial Gene
Rearrangement Among Closely Related Species. Mol Biol Evol 18: 1604-1609.
Regier, J.C., Shultz, J.W. and Kambic, R.E. (2005) Pancrustacean phylogeny:
hexapods are terrestrial crustaceans and maxillopods are not monophyletic. Proc
Roy Soc B 272: 395-401.
Simon, C., Frati, F., Beckenbach, A., Crespi, B., Liu, H. and Flook, P. (1994)
Evolution, weighting, and phylogenetic utility of mitochondrial gene sequences and
a compilation of conserved polymerase chain reaction primers. Ann Entomol Soc
Am 87: 651-704.
Simon, C., Nigro, L., Sullivan, J. Holsinger, K., Martin, A., Grapputo, A., Franke, A.
and McIntosh, C. (1996) Large differences in substitutional pattern and

evolutionary rate of 12S ribosomal RNA genes. Mol Biol Evol 13: 923-932.
Stys, P. and Bilinski, S. (1990) Ovariole types and the phylogeny of hexapods. Biol
Rev 65: 401-429.
Telford, M.J., Herniou, E.A., Russell, R.B. and Littlewood, T.J. (2000) Changes in
mitochondrial genetic codes as phylogenetic characters; two examples from the
flatworms. Proc Nat Acad Sci USA 97: 11359-11364.
Wilson, K., Cahill, V., Ballment, E. and Benzie, J. (2000) The complete sequence of
the mitochondrial genome of the crustacean Penaeus monodon: are
malacostracan crustaceans more closely related to insects than to branchiopods?
Mol Biol Evol 17: 863-874.
Wolstenholme, D. (1992) Animal mitochondrial DNA: structure and evolution. Int Rev
Cytol 141: 173-216.
Wyman, S.K., Jansen, R.K. and Boore, J.L. (2004). Automatic annotation of
organellar genomes with DOGMA. Bioinformatics 20: 3252-3255.
Xia, X. and Xie, Z. (2001) DAMBE: software package for data analysis in molecular
biology and evolution. J Hered 92: 371-373.

Legends to Figures
Figure 1. Genome organization of the mitochondrial genomes of two Campodea
fragilis and C. lubbocki. Arrows indicate direction of coding regions, numbers inside
the circle represent the size of the fragments separating two adjacent genes (positive
values) or the amount of shared nucleotides between two overlapping genes
(negative values). Large non-coding regions are dashed, with the one located
between rrnS and trnI being the putative control region.
Figure 2. Hypothetical secondary structure features found in intergenic non-coding
regions: ncod between trnS2 and nad1 in C. fragilis (a) and C. lubbocki (b); ncod
between nad2 and trnW in C. fragilis (c).
Figure 3. A+T content, calculated in a sliding window of 100 bp, along the J-strand of
the mitochondrial genomes of C. fragilis and C. lubbocki. The position and coding
directions of protein- and rRNA-coding genes are shown below.
Figure 4. Putative secondary structures of mitochondrial tRNAs of C. fragilis, C.
lubbocki, and Japyx solifugus. Only tRNAs exhibiting secondary structure changes in
one or both Campodea species are shown. All other tRNAs of C. fragilis and C.
lubbocki can be folded into cloverleaf-like secondary structures.
Figure 5. Secondary structure model of the mitochondrial 12S rRNA in the two
dipluran species.
Figure 6. Secondary structure model of the mitochondrial 16S rRNA in the two
dipluran species.

Figure 7. Generalized secondary structure model of Campodea mitochondrial 12S
(a, domains I-III) and 16S (b, domains I, II, IV and V) rRNAs. Grey beads show the
most variable regions, in base composition, sequence length or secondary structure,
of the different domains in both species. Black beads represent highly conserved
fragments.

nd2 cox1 cox2 atp6 cox3 nd3 nd5 n
d4
n
d6
cob
nd
1
lr
RNA
srRNA
+7 +20+3
-5
-4+1
-6-3-7
+3
+2-3-1-1
-7+5
+2
-2+80 Campodea lubbocki
I Q M nd2 W C Y cox1 L1 cox2 K D atp8 atp6 cox3 G nd3 A R N S1E F nd5 H
nd4
nd4
l T
P n
d6
co
b
S2
nd1
L2 lr
RNA V srRNA CR W
I Q M
CY
L1
KD
atp8
G
FE S1N
RA
H
nd4L
TP
S2
V
L2
nd2 cox1 cox2 atp6 cox3 nd3 nd5 n
d4
n
d6
cob
nd
1
lr
RNA
srRNA W
I Q M
CY
L1
KD
atp8
G
FE S1N
RA
H
nd4L
TP
S2
V
L2
-3 +2+111
-8
-2-7
+4
-2-3-1-2
-7+8
+2
-2
+56 Campodea fragilis
+2-1
-3
-2-1-15
-1

oTTT
A A T T ACATA
ATT
CTTTTCTCCTTTTT G
TGC
TCAAA
AA
A AAAAAGGAGAAAAGAo
1n c o d S 2 N D1 f r a g i l i s
5'3'
a
oAA A A T
TCA
TTTAAAATTCTTTCTTTCCTTTT A
TTA
AAAA
AAAA
A AAAAGGAAAAAAAAAAATCTA
CCTTATTAA A A C CCo
1
2
ncodlub
5'3'
b
o TGTTT C
AAT
CA
AAAC
TAAAAAC
TA
AG
CTAATTTAAAATTGTTTCT C
TAT
AAACC
TTA
A AGAAATCATTTAAAATACTTTAT
GA
TA
CCTTAAG
ACT T A
AATA
TT A A
CTATTT o
1
2
3
CF111
5'3'
c


AA-UA-UU-AC-GU-AA-UU-G
C C U
G A A
- - - AA
A
AG
AA
U-AU-AU UG-CA-U
GA
ACG
UU
A
U U U U A
A A A A U
- - - - -GU
A
A
Cysteine(C)
AA-UG-CA-UA-UU-AA-UU-A
A U U G U
U A A C A
- - - - -
AU
AAG
U-AA-UA-UA-UG-C
AA
UCG
CC
UA
AA
Serine (S1)(AGN)
A
AU
UA-UA-UU-AC-GA-UC-GU-A
U C U U U
A G A A A
- - - - -
A
UU
AA
AU
A-UG-CU-AA-UU-A
AA
AGU
CU
UU
A
Serine (S2)(UCN)
A
A
AU
A
G
U
UA-UA-UA-UC-GA-UG-CG-C
C U G
G A C
- - -
U
AC
CUUC
AAU-AU-AC-GA-UG-C
CG
GCU
UU
A
A G C G
U C G C- - - -
AA
C
CA
A
Serine(S2)(UCN)
AG-CG AA-UA-UA-UG GG-C
C U C
G C G
- -
U
A
GU
A
AG-CA-UA AA-UU-C
AA
UCG
CU
C
U G
A U
- -
AUA
ACUU
G
Serine(S1)(AGN)
UG-CA-UU-AU-AG-UC-GU-A
U C U U
A G A A
- - -
AU
C
A
AG
UA
C UA-UU-AG-CC-G
AA
AGU
CU
A
U U C G
A A G C
- - - -
UA
A
UU
Arginine(R)
U
CJapyx solifugus
C. fragilis
G
AU
A
AA G U
AA
AA-UA-UA-UU-AA-UG-UG-C
C C G
G G C
- - -
UU
A
A
AU
AAAGA-U
U-AU-AA-UG-C
CA
GCU
UU
UA
AA
G
Arginine(R)
UG-UC-GC-GU-AG-UU-AA A
U U A A
G A U U
- - - - UG
A
AA
CA
U-AU-AA-UG-CA-U
AA
ACG
UU
G
U
A
-
UA
AA
Cysteine(C)
GA-UG-CA-UA-UU-AA-UU-A
A U U G
U A A C
- - - -CA
C UU
UA
AU
A-UA-UG-CA-UG-C
AA
UCG
CC
UAA
C
Serine (S1)(AGN)
U
U
UA-UA-UU-AC-GA-UC-GU-A
U U U G C
A A A C G
- - - - -
U CA
UU
CC
UU
A-UG-CU-AA-UU-A
AA
AGU
CU
U
U
Serine (S2)(UCN)
UA
A
U
U
C. lubbocki
UG-UA-UC-GU-AA-UA-UA-U
C G
G U
- -
A
U
A
UA
UG
A-UA-UU-AG-CA-U
GA
ACG
UU
C
U U U G
A A A C
- - - -
UA
A
A
Cysteine(C)
A
UU
AA-UA-UA-UU-AA-UA-UG-C
C U A U
G A U A
- - - -
UU
A
ACAAAAA-U
U-AC-GA-UG-C
CA
GCU
UU
A
A
A
Arginine(R)
GGA

oUUAU C A U A U
UA U UUUUUUU
GUAUGACACUUAAAUUUGAUUUUA GUUA
GUGUA
AAA
AGAUAAUAU
AAUAUUAUAUAA
AA GU
UUU
UAAA
UGAGGUUUUAGUAAUU
U U A A U U A A A A A U U U AGAUUAU
UA U
AUGA
AAAG
AU
UUGGUU
AAAUUU
G
U
GCCAGC
CA C
CGCGGU U A
GAC
AUGA
AAUU
C
A
A
UUUU AUAAUA AUAAUA AUU
UU
A AU
AAGAG
CUUA
GA
AA
AA
UA
UAU
UUUGAAUA
UUGAA
GUGA
A AU U U A U U
AC A A A A C U
UUAUU
C
UU
UU
UU
U U U A U U AUUAUUG
AAG UA
AUAA
A AGAC
CAGGA
UU
A G AUA
CCCUGUUA
U
A AA
AAUAAAU
U
UAU U A G G
G UA G U A
AUAUU
UGAA
ACCU
AA A AAA U U
U G G C GGU A U U U A A
GG
CA
UU C
UAG
AG
GAACUUGUAACAUAA
GU
GA
UAAUCCU C
GU
UA
AAA
U U U A CUUUUUUUAU
U A AUUUG
UA
UAUCG
U C GUU
GUC
AGGAUUUUUU
A
U AA
AAUUUUUCC U A G A
AA
AA G A
UACU
AAGAAUGUCA
GAUC
AAGAUGCAGU
UU
AUGGAGAAGUGUU
U A UGA GU UA
CA A U
AAU
UU A
AA
UUA U
AC
UAAUU U U A U U U U
UAAAAAUAAA
UGAAGGUGG
AU
UU
AG
GA
AU
A A U A A U U U U UU
AGAAAGUUUU
UG
UG
AAGAAUUAAAU
GC
UC
UAAAAUGUGCA
CAUA
U U GC C
C G U C A U U U U C A U UUUUGAAA
CAAGUCGUAACAA
AGUGGUUGUAUCG
GAAGCUGCAGCUA
o15
3
4 1416
28
29
12
5
6
7
8
9
10 11
12
13
17
1819
20
21
22
23
24
25
26
27
CFRRNA12S
5'
oAU
AU
UA U A A U U UUUGUAAUUAAGUUAAAUUU
GA
UU
UUAGUUUAAGUAA A
GAU
GA
AAU
AUA
AU
AUUAUAUAAAUUAG
UUUAUU
AA
CAUAUAUAGUAAUAUAAUUU
A AU A U A U U A G A UUA U A A G
CG
AG
A U U U G GUUAA
AU
U CGU
GCCAGC
CA U
CGCGGU U
AGA
CG
UAA
AAAUUUCUUU
AU
AAG
AA
UA
GA
A
A
AUAAAU
UAAUGUUUAAA
AG
A A AG A A G A U U A
U GU A U
G A AU U A A G G U A A A A U
U UA U U G U A U G
AAUUAUGAUGUUUUAUGUUAA
AA
UU
UU
AU
U
G
U UACAUAUGAUAC
AUA AA
GA
CCAGG
AUU A G A
UA
CCCU
G
U
U
AUUACAUAUAU
UA
UUAAAC
UAU U A G G
G UA G U
A UU
UAUUG
AAACCU
AAAA
AA
UU U G G C G
GU A U U U U
AG
UC
AU U U
UAG
AG
GAGUCUGUAAUAUAA
GU
GA
UAAUCC U C
GU
UA
AGA
U U A G CUUUUAUU
UAA U A AU
U AGU
A UAUCG
U C GUUGUC
AGAAUUUUUC
AU U
AGAUUUUUUC A A
AG
U A A G C
3'
A
GAUUUA
AA
AUGUCAGAU
CAAGAUG
CAGUUU
AUAUAAAAG
UA UU
U A UGG A C UA
CA A U
AAAU
U UA
UUUA A
AU
GAAUU U U A A U
U U UAC
AUAAUUAAC
AUAAAGGUGG
AU
UU
AA G
AC
AU
A A A A A A U U U UUA
UGACAUGUUUU
UU
UG
AAGUAUACAUG
CU
CU
AACAUGUGCA
CAU
A
U U GC C
C GUC A U
U C U C U UU
UAGAGAU
AAGUCGUAACAUA
GUAGGAUAUAUU
GGA
AAAUGUAUCUAG
o
1
15
2
3
4
5
6
7
8
9
10 11
12
13
1416
17
1819
20
21
22
23
24
25
26
27
2829
CLURNA12S
5'3'
C. lubbocki
C. fragilis
oUAC U
G AAAA
GG
A A U A U A U A G U AG U G U U A U U U U UA U A A A A G A A
U U UA
GAGU
A C C UU UU
GU
AUUAGGGGGUUUC
AAAUUUAAUUA
AUUAUUUAAAUUU
UUCG
AA
GUAA
UAA
G
A
UCUAGGGUAUUUUUU
UU
UAUUGUAAAAUAAAUAAGUUA
AA
AAGU
AUUUUU
GU
UAUGAAA
UG
U A A U U C G G UU
AUUAUAUAUC
UA
A
U
U
UUUUAAGAGUUUAAUUU
AGUUAA
A
AUAUAUUU
GU U
G U A U U UAG
U UUAUUAAGGAUAAUCUUAAUG
AU
AA
GG
UAUAUUAAG
UU
AUUU
UUCUU
UAUUU
U U UA G G
CU UU
A A GG
UUG U C A A A U A
AAU G U
G UUU
UAACA
G
A
U
U
A
U
A
G
U
A
G
AAGCUUAAUUUUGGUAUAA U U A U
UUUUUA
U U A A A A UAUAU
UU AU
AAU
A U AUAG
UU
UU
UAUAA A U
AA
U
GA U U A CA
UU
AG
UAUAAGUGGUAAAUU
AA
AA
AA
UU
UU
UU U A G U U U A
UAAU
UA U U
UUUUAAUAAUUA
AGCA
AA U A A
GCGCUCG
CCUGUUUAU
CA A
A A A C AU
G GUUUUUUG
AC U
AUAAAAAAU U U
G G C C U GCUC
A AUG
AA
A U UUAA
AUAGC U
GCAGU
AA U U
UA
ACUGUA C
A AAG G
UA
GCAUA
AU
CA
UUAGUCUUU
UAAU
UGUUGGCUG
GA
A
U
G
A
AU
GGUUUU
A
CGGAGUGUU
UAC
UUUUUUAAAAA
UAU U A A U U G A A U
UU
UA
UA
AUUU AG
UG A A
AA
AGCUAAGAUAUGG A U A
AG G G A C G A
UA
AG
AC C
CUAUAGAGCUA
AUUAUUUAAUAGAUUU
UUAUU
UU A G G U G
AAUUA
AUUA
UUUGUUAAGUAA
GA
UUACU
GG G G
CGGUA U
AGUUU
UU U
CAAAUUA U U U G A
U A G U U A U U G A UCAUAUUAAUAAA
AUUAG
UGA
AAGUU A
C
CUUA
GGGAUA
ACA
GU
AUAAUU A
UUUUUGA G A
GU A C A A A U U G
A CAA
AAUAGUUUAUA
A
C
C
UCGAUGUUGAAUUAAAA
U U U A U U AU
U A G UGAA
GAAGC
UAGUAA
AAU
AGGUCU
GUUCGACCA
AUAA
A A UUUUA
C AUG A
UUUGAGUUCAGA
CCGGCG
UGA
GCCA
GG
UCAGUUUCUAUC
UUUAUAGA
UG
AU
UAGUUUAUUU U
AGU
ACGAAA
GGACC A
AAUAAUA
AUAA
UUUU
U A U U AGG
UUAA
UAG
A AU
ACUAA A o
1
2
3
4
5
6
7
8
z
9
10
11
12 13
y
14
15
16
17
18 19
w
20
V
21
22
23
24
25
26
27
28
29
30
31
32
33
34
35
CFRRNA16S
5'
3'
°
C. fragilis
oUAUUA
CU G AA
AUGG
A A A A A U A A A A A A A A AU G A A G A A A G A A A
U A UA
AUGU
A C C UU U G
GU
AUUAGGG
AAUUUUAUAUAUAUAU
AUA
UAUAUAUAUAU
UUAUCG
AAUUUA
UAG
G
A
UUUAAUAUAUUUAAA
GU
UUUUGUAGAAUAAAAAUU
UUUA
AA
AAU
AUAUUU
GU
UAUGAA
AU
G U A A U A C GA
CUAUAGUAUA
UC
UAUUU
UUUUAGGAAAUUAAUUU
AUUUAA
UUAAUAUUA
UU U A U U A A U
AA
UAUAUAAAGGAUAAUCUUUA
UA
UU
UA
UA
UUAUAUUUAU
UU
UUAUA
UAUUUU
UU
U A UA G G
CU UU
U A GG
UU G U C A U U
AAUU G U
G UUA
UAACA
A
A
A
U
A
A
U
U
U
A
U
UAAUUUAUUUAUGAAGAAU U U
AU
UUUA
C U A A A A UAAUA
AA GU
UAA
U U UUUU
UUAU
UUAAA A U
GA
U
G A A A U UA
UU
AG
UAUAAUAUUAUAAUAA
AU
UU
AU
UU
AA
U A A A U U A U UUAUU
UA AUAAUAAUUAGGC
AAA
A U A AUUUUUCG
CCUGUUU
AUC
A AA A A C A
UG
GUUUUUUA
UA A
AUAAAAAAU
CU
U U A C CU G
CUC
A AUG
AAA A U U
AA
AUAGC U
GCAGU
AA
U UUA
ACUGUA C
A AA
G G UA
GC
AUAA
UC
AU
UAG
UUUUU
UAAU
UAAGGACUGG
AA
U
G
A
A
GGGUUGG
ACGAAAAAAU
AUC
UUUUUUAUAGA
UAA A U U U A G A A U
UU
UA
UU
UUUU AG
UG AGUA
AGCUAAAA
U
A
U
G U U U GAG G G
A CG A
UA
AG
AC C
CUAUAGAGCUU
AAGAUAUAAAAUAUUA
AGAAU
UG U U A U G
UAAAA
UUUU
UAUUAUUAUUAU
CUU U UACU
GG G G
CGGUA A
AGUUA
UA U
CAAAUUU U U G
A U A A G U U U AA GA
UCGAUUAAUUUAU
AA
U
AA
GAAA
AAG
UUACCU
UAGGGAUA
AC
AGU
AUAAUU A
UUUUUGA G A
GU A C A A A U U G
A CAA
AAUAGUUUAUA
A
C
C
UCGAUGUUGAAUUAAAA
U U U A U A UU
U A G UGAA
GAAGC
UAAAAG
UUU
AGGUC
UGUU
CGACCU
UUAA
A A UUUUA
C AUG A
UGUGAGUUCAGACCG
GU
GU
GGAG
UCCA
GG
UGCAG
UUUCUAUCU
UCAAGUA
AU
AUAAUUUUUAUUU U
AGU
ACGAAA
GGAU
C C AAAGUAUAAAG
UAAUU
A U U A AU
AAUUUUUCUU
o
1
2
3
4
5
6
7
8
z
9
10
11
1213
y
14
15
16
17
18 19w
20
V
21
22
23
24
25
26
27
28
29
30
31
32
33
34
CLURNA16S
°
5'
3'
C. lubbocki


Table 1
* incomplete genome data; missing sequence of control region or control region and rRNAs respectively
Higher ranking taxon Species Accession number
PCG 1st codon Position
2nd codon position
3rd codon position
rRNAs tRNAs total
Diplura Campodea fragilis XX 70.6 67.0
65.8 79.0 76.5 76.4 72.6
“ Campodea lubbocki XX 73.0 68.3 66.9 84.2 80.3 76.1 74.9*
“ Japyx solifugus AY771989 64.1 63.5 60.4 68.5 65.0 64.9 64.8
Collembola Gomphiocephalus hodgsoni NC005438 72.4 66.6 65.5 86.2 77.0 76.0 74.1
“ Tetrodontophora bielanensis NC002735 71.3 66.4 66.2 81.4 77.0 75.5 72.7
“ Podura aquatica NC006075 64.7 60.0 64.1 70.0 - 70.5 -
“ Onychiurus orientalis NC006074 68.5 71.5 65.8 66.2 - 73.2 -
Archaeognatha Petrobius brevistylis AY956355 66.2 61.1 63.2 74.2 71.7 70.6 67.3
“ Nesomachilis australica NC006895 67.2 60.8 64.4 76.8 72.6 70.3 68.8
Zygentoma Tricholepidion gertschi NC005437 67.7 63.0 63.0 77.1 71.2 69.0 68.6
“ Thermobia domestica NC006080 66.3 59.4 62.9 76.6 67.9 67.2 67.0
Pterygota Locusta migratoria NC001712 74.1 68.9 66.1 87.3 77.7 74.0 75.3
“ Drosophila yakuba X03240 76.7 69.8 66.4 93.7 81.9 76.6 78.6
“ Apis mellifera L06178 83.3 79.3 75.4 95.2 83.4 87.1 84.9

Table 2
Gene identity C. fragilis C. lubbocki
(Strand)
(%) length start/stop %A %C %G %T length start/stop %A %C %G %T
atp6 (+) 73.3 675 ATG/TAA 31.3 20.6 10.7 37.5 675 ATG/TAA 30.7 18.4 9.6 41.3
atp8 (+) 57.0 156 ATT/TAA 38.5 14.7 4.5 42.3 156 ATC/TAA 35.3 18.0 5.8 41.0
cox1 (+) 77.4 1540 ATT/T - - 29.0 19.7 15.7 35.7 1542 ATA/TAA 29.0 18.6 14.6 37.8
cox2 (+) 77.9 679 ATA/T - - 33.1 19.3 11.6 35.9 684 ATA/TAA 33.2 17.0 10.5 39.3
cox3 (+) 76.6 787 ATG/T - - 30.9 21.1 14.1 33.9 787 ATG/T - - 28.7 18.7 13.1 39.5
cob (+) 76.5 1143 ATG/TAA 32.8 19.5 11.2 36.5 1140 ATG/TAA 32.5 17.5 10.8 39.2
nad1 (-) 70.7 924 ATT/TAA 26.4 10.5 16.3 46.8 921 ATA/TAA 29.0 8.3 17.3 45.5
nad2 (+) 61.3 1005 ATA/TAA 32.1 20.2 9.2 38.5 1005 ATT/TAA 32.4 16.9 8.0 42.7
nad3 (+) 62.9 357 ATA/TAA 35.0 18.2 7.8 38.9 347 ATC/TA - 34.9 16.7 7.8 40.6
nad4 (-) 68.7 1338 ATG/TAA 25.7 8.2 17.6 48.5 1326 ATG/T - - 27.9 6.9 17.2 48.0
nad4l (-) 74.0 285 ATG/TAA 28.4 4.9 20.4 46.3 285 ATG/TAG 27.4 1.8 21.4 49.5
nad5 (-) 73.7 1707 ATA/TAA 26.5 8.0 19.5 46.0 1710 ATC/TAG 30.0 7.3 17.5 45.2
nad6 (+) 49.5 510 ATT/TAA 38.4 17.1 4.7 39.8 524 ATT/TA - 37.6 16.8 4.8 40.8

Table 3
C.l. C.f. J.s. G.h. T.b. P.a. O.o. P.b. N.a. T.g. T.d. L.m.
GCA A 1.15 1.03 1.68 1.22 1.13 0.82 0.75 1.29 1.66 1.70 1.33 2.11 GCU A 2.18 1.87 1.39 2.17 2.00 1.83 2.55 1.42 1.52 1.28 1.46 1.68 GCG A 0.06 0.14 0.31 0.12 0.09 0.44 0.15 0.33 0.16 0.20 0.23 0.05 GCC A 0.62 0.96 0.62 0.49 0.78 0.91 0.55 0.96 0.67 0.83 0.99 0.16 UGC C 0.33 0.43 0.28 0.41 0.31 0.82 0.58 0.63 0.35 0.50 0.49 0.36 UGU C 1.67 1.57 1.72 1.59 1.69 1.18 1.42 1.38 1.65 1.50 1.51 1.64 GAU D 1.46 1.40 1.09 1.53 1.44 1.22 1.20 1.44 1.18 1.32 1.49 1.68 GAC D 0.54 0.60 0.91 0.47 0.56 0.78 0.80 0.56 0.82 0.69 0.51 0.33 GAG E 0.51 0.58 0.63 0.41 0.49 0.55 0.56 0.71 0.49 0.47 0.54 0.29 GAA E 1.49 1.42 1.37 1.59 1.51 1.45 1.44 1.29 1.51 1.53 1.46 1.71 UUU F 1.75 1.66 1.30 1.80 1.65 1.50 1.66 1.59 1.67 1.49 1.32 1.49 UUC F 0.25 0.34 0.70 0.20 0.35 0.50 0.34 0.41 0.33 0.51 0.68 0.52 GGU G 1.21 1.48 1.39 0.87 1.02 0.71 0.96 1.27 1.23 1.22 1.24 1.77 GGG G 1.00 0.66 0.71 1.01 0.90 1.87 1.27 0.82 0.80 0.98 0.51 0.19 GGC G 0.11 0.41 0.42 0.21 0.17 0.38 0.34 0.45 0.55 0.20 0.83 0.02 GGA G 1.68 1.45 1.48 1.92 1.91 1.03 1.43 1.46 1.43 1.60 1.42 2.02 CAC H 0.35 0.84 1.19 0.32 0.73 1.11 0.49 0.86 0.87 0.78 0.80 0.70 CAU H 1.65 1.17 0.81 1.68 1.27 0.89 1.51 1.14 1.13 1.23 1.21 1.30 AUU I 1.75 1.61 1.46 1.77 1.65 1.49 1.48 1.49 1.63 1.59 1.63 1.78 AUC I 0.25 0.39 0.54 0.23 0.35 0.52 0.52 0.51 0.37 0.41 0.37 0.23 AAA K 1.64 1.60 1.22 1.64 1.44 1.44 1.58 1.41 1.45 1.51 1.21 1.41 AAG K 0.36 0.40 0.78 0.36 0.56 0.56 0.42 0.59 0.55 0.49 0.80 0.59 UUG L 0.53 0.70 1.67 0.31 0.64 0.53 0.81 0.86 1.07 1.00 0.56 0.54 UUA L 3.77 3.50 1.93 4.04 3.39 2.54 2.85 2.62 2.46 2.65 2.61 3.91 CUA L 0.56 0.66 1.49 0.64 1.07 1.23 0.81 1.17 1.08 1.28 1.18 0.83 CUC L 0.24 0.28 0.11 0.08 0.12 0.38 0.25 0.18 0.33 0.16 0.44 0.06 CUG L 0.08 0.07 0.25 0.04 0.07 0.31 0.21 0.26 0.13 0.23 0.13 0.05 CUU L 0.81 0.79 0.55 0.89 0.71 1.02 1.08 0.90 0.93 0.69 1.09 0.61 AUG M 0.27 0.51 0.46 0.23 0.23 0.51 0.38 0.44 0.32 0.45 0.43 0.31 AUA M 1.73 1.49 1.54 1.78 1.77 1.49 1.62 1.56 1.68 1.55 1.57 1.69 AAC N 0.31 0.56 1.00 0.41 0.51 0.80 0.66 0.66 0.64 0.46 0.59 0.48 AAU N 1.69 1.44 1.00 1.59 1.49 1.20 1.34 1.34 1.36 1.54 1.41 1.52 CCU P 2.06 1.38 1.58 2.05 1.80 1.70 2.05 1.67 1.70 0.94 1.83 1.50 CCG P 0.17 0.32 0.15 0.09 0.15 0.19 0.18 0.36 0.19 0.14 0.18 0.09 CCC P 0.78 0.43 0.59 0.39 0.46 0.99 0.43 0.93 0.69 0.61 0.85 0.12 CCA P 0.99 1.87 1.68 1.47 1.59 1.12 1.34 1.04 1.43 2.31 1.14 2.29 CAG Q 0.20 0.30 0.49 0.18 0.14 0.40 0.26 0.37 0.54 0.27 0.23 0.10 CAA Q 1.80 1.71 1.51 1.82 1.86 1.60 1.74 1.63 1.46 1.73 1.77 1.91 CGA R 2.25 2.59 1.31 1.78 1.71 1.39 1.47 2.26 1.42 1.93 2.03 2.47 CGC R 0.17 0.31 0.30 0.44 0.33 0.77 0.33 0.26 0.14 0.21 0.49 0.07 CGG R 0.00 0.31 0.48 0.07 0.65 0.77 0.41 0.45 0.68 0.83 0.62 0.15 CGU R 1.58 0.78 1.91 1.70 1.31 1.08 1.80 1.03 1.76 1.03 0.86 1.31 AGC S 0.13 0.40 0.33 0.30 0.16 0.47 0.29 0.40 0.43 0.17 0.30 0.07 AGU S 0.61 0.87 1.18 0.91 1.03 0.99 0.73 1.10 0.86 0.95 1.28 0.53 AGG S 0.23 0.23 0.18 0.04 0.16 0.09 0.00 0.07 0.02 0.30 0.03 0.04 UCU S 2.09 2.30 1.72 2.82 2.43 2.66 2.67 1.93 2.56 1.86 2.40 2.69 UCG S 0.13 0.11 0.23 0.11 0.16 0.18 0.31 0.47 0.26 0.11 0.20 0.09 AGA S 1.73 1.23 0.90 1.46 1.10 1.42 1.40 1.87 1.90 1.46 1.38 1.79 UCC S 0.71 0.40 0.72 0.47 1.06 0.90 0.94 0.81 0.64 0.68 0.69 0.15 UCA S 2.38 2.45 2.74 1.89 1.91 1.29 1.65 1.35 1.33 2.48 1.73 2.65 ACA T 1.63 1.64 1.92 1.40 1.27 1.21 1.07 1.52 1.69 1.93 1.68 2.56 ACU T 1.65 1.61 1.13 2.28 1.93 1.79 2.01 1.52 1.43 1.18 1.54 1.15 ACC T 0.67 0.73 0.74 0.30 0.73 0.74 0.78 0.75 0.76 0.80 0.68 0.23 ACG T 0.05 0.02 0.22 0.02 0.07 0.27 0.15 0.21 0.12 0.09 0.09 0.06 GUU V 1.76 1.51 1.30 1.83 1.54 1.50 1.44 1.45 1.69 1.56 1.46 2.08 GUG V 0.29 0.48 0.82 0.42 0.28 0.92 0.74 0.57 0.47 0.48 0.35 0.07 GUA V 1.70 1.49 1.78 1.60 1.96 1.16 1.33 1.55 1.54 1.56 1.91 1.75 GUC V 0.25 0.53 0.11 0.15 0.22 0.43 0.49 0.43 0.30 0.41 0.28 0.11 UGA W 1.55 1.77 1.39 1.62 1.72 1.65 1.30 1.65 1.54 1.71 1.70 1.92 UGG W 0.45 0.23 0.61 0.38 0.28 0.35 0.70 0.36 0.46 0.29 0.31 0.08 UAU Y 1.67 1.54 1.30 1.54 1.47 1.12 1.44 1.35 1.40 1.48 1.46 1.62 UAC Y 0.33 0.46 0.70 0.46 0.53 0.88 0.56 0.65 0.60 0.52 0.54 0.38 Bolded numbers represent the codon most commonly used to code the amino acid. C.f.= Campodea fragilis, C.l.= C. lubbocki, J.s.= Japyx solifugus, G.h.=Gomphiocephalus hodgsoni, T.b.= Tetrodonto-phora bielanensis, P.a.= Podura aquatica, O.o.= Onychurus orientalis, P.b.= Petrobius brevistylis, N.a.= Nesomachilis australica, T.g.= Tricholepidion gertschi, T.d.= Thermobia domestica, L.m.= Locusta migratoria