Project BRAHSS: Behavioural response of Australian humpback whales to seismic surveys

1
SC/A06/HW16
THE MIGRATIONS OF HUMPBACK WHALES PAST CAPE VIDAL, SOUTH AFRICA, AND A PRELIMINARY ESTIMATE OF THE POPULATION INCREASE RATE.
KEN FINDLAY1 AND PETER BEST2
1. Oceanography Department, University of Cape Town, Private Bag, Rondebosch 7700, South
Africa
2. Mammal Research Institute Whale Unit, c/o Iziko / South African Museum, P O Box 61 , Cape
Town 8001, South Africa.
ABSTRACT
Shore-based surveys of northward migrating humpback whales have been undertaken at Cape Vidal, northern KwaZulu
Natal, each year between 1988 and 1991, and in 2002. Daily counts of whale groups crossing the midline of the survey
area were adjusted for proportions missed with distance offshore and by sighting condition. Adjusted daily counts were
further adjusted by daily effort to produce daily densities which were summed over the survey period to estimate the
number of whales passing Cape Vidal each year. The numbers passing Cape Vidal during co-incident periods of 17 days
over the 1988 to 2002 surveys (6 July to 22 July) and 25 days over the 1990, 1991 and 2002 surveys (6 July to 30 July)
provide preliminary increase rates of 12.3% and 0.90% per annum respectively. The preliminary nature of these trend
estimates is discussed.
INTRODUCTION
The fact that southern humpback whales (Megaptera novaeangliae) undertake annual migrations from
summer polar feeding grounds to winter breeding grounds in tropical and sub-tropical waters has long been
known from seasonal variations in abundance in whaling grounds at various latitudes and mark and natural
mark returns (Risting, 1912; Olsen, 1914; Harmer, 1928; 1931; Matthews, 1938; Mackintosh, 1942). Seven
feeding grounds have been identified within the Southern Ocean (IWC 1998), each of which has been
linked to a breeding ground in the coastal waters of South America, Africa (including Madagascar),
Australia, New Zealand or the islands of the south - western Pacific Ocean (Kellogg, 1929; Rayner, 1940;
Mackintosh, 1942). En route between breeding and feeding grounds some humpback whales utilise the
coastal waters of southern hemisphere continents as migratory corridors. Historical catch records have
indicated that the east coast corridor off Africa conveys whales to breeding grounds off Mozambique

2
(Olsen 1914) and Madagascar (Angot, 1951), while the west coast corridor takes whales as far north as
breeding grounds off Gabon (Budker and Collignon, 1952).
Modern humpback whaling from shore-based stations in southern Africa began in 1908, and catches of
humpback whales amounted to approximately 23 000 animals between 1908 and 1915 (Committee for
Whaling Statistics 1942 -1964). By 1914 the populations on both coasts had declined to the extent that
stations relying entirely on humpback catches were forced to close. Despite such high catches, little actual
biological data (apart from catch data) has been collected or published on African humpback whales prior
to 1988, apart from information published by Risting (1912), Olsen (1914) and Matthews (1938).
The coastal migratory habits of humpback whales result in the species being ideally suited for shore-based
monitoring. Such monitoring of large cetacean populations has been carried out for Californian gray whales
(Reilly, Rice and Wolman 1980; 1983; Rugh and Braham, 1979; Rugh, 1984; Reilly, 1984), bowhead
whales (Zeh, Ko, Krogman and Sonntag, 1986a; 1986b; Gentleman and Zeh, 1987; Krogman, Rugh,
Sonntag, Zeh and Ko, 1989), and humpback whales in Australia (Bryden, 1985; Bryden Kirkwood and
Slade, 1990; Paterson and Paterson, 1984, 1989; and Paterson, 1991). The population migrating off the east
coast of Australia have been shown through shore - based surveys to be increasing at approximately 10 %
per annum (Bryden et al., 1990; Paterson, 1991; Paterson and Paterson, 1984; 1989; Paterson et al., 1994)
The shore - based observations from Cape Vidal between 1988 and 1991 (Findlay’ 1994; Findlay and Best
‘1996a and 1996 b) suggested northern KwaZulu - Natal population to be in the region of 1700 animals in
1990. Winn and Reichley (1985) suggested a post - exploitation stock size of 340 whales for the
southwestern Indian Ocean (including Madagascar and the Mozambique Channel Islands) although the
origins of this estimate were not given. The fact that approximately 36 humpback whales were taken from
the Durban whaling grounds in each of the final ten years of humpback whaling suggested to Findlay
(1994) that the population has increased considerably since 1963. However, the time period of the 1988 -
1991 observations at Cape Vidal was too short to establish an increase rate for this population. A further
year of shore – based survey was carried out from Cape Vidal in 2002 and this paper presents a preliminary
increase rate for humpback whales migrating northwards past Cape Vidal between 1988 and 2002.
METHODS
Field methods
Shore-based surveys of northward migrating humpback whales have been undertaken at Cape Vidal,
northern Natal, each year between 1988 and 1991, and in 2002. Surveys were undertaken from an
approximately 60m high vantage point from 4 July to 22 July 1988, from 27 June to 22 July 1989, from 2
June to 28 October 1990, 17 June to 6 August 1991 and 5 July to 30 July, 2002 (Although 5 July was

3
discarded as a training day). During the July 1990, the 1991 and part of the 2002 surveys, concurrent
independent observations were made from a second tower (at a similar altitude and 22 m to the north of the
primary tower) to determine observer efficiency under different weather conditions, and with distances
from the coast (see Findlay and Best, 1996a). For the purposes of the present paper, only sightings made
from the primary (southern) tower will be analysed.
Observations were undertaken for ten hours per day (07h00 to 17h00), weather permitting, except during
the five-month survey in 1990, when five hours observation were undertaken each day outside of the
expected peak migration periods (1 July to 23 July and 15 September to 15 October). Searching was
carried out by two observers per tower at all times, generally with one observer searching offshore with 7 x
35 wide-angle binoculars and the other searching the entire area by naked eye, with roles being reversed
approximately every 15 minutes. The lack of experienced observers during the 2002 survey necessitated
that a third experienced and passive observer (KF) oversee the recording of observations on both towers at
certain times. Such passive observation included assistance with tracking, recording and identification of
groups once sighted. No initial sightings made by the passive observer were reported.
Positions of groups were measured using a Wild T1 or T1A theodolite (orientated daily on a standard
reference object on the shoreline) with fixes being taken on successive surface activity behaviour (as
carried out by Wursig, Cipriano and Wursig, 1991). The time of each fix was measured to the nearest
second. Position fixes were measured as vertical and horizontal angles of the group from the centre of the
earth and True North respectively, and were immediately plotted onto a chart. Angles were measured to at
least the nearest 20 seconds in 1988 and the nearest 3 seconds in subsequent years. Immediate plotting not
only provided an error check for recorded positions, but also eliminated confusion when two groups were
migrating in close proximity, and assisted trackers in providing a rough indication of where the group
would next surface. Estimates of group size and heading (north or south) were noted at each position fix,
and animals had to be within five body lengths of each other to be classified as a group. During the 2002
survey, the higher densities of whales and the tendency of observers to search to the south (where they
knew whale groups were coming from) necessitated that the observation effort be concentrated near the
midline of the survey area. In such cases a “survey box” was demarcated by two marker poles directly
ahead of the towers, and observers concentrated their efforts to within this box. A record of search activity
was kept wherein the times at which searching began, ended or was interrupted (eg for the tracking of a
group of whales) and subsequently resumed were noted. Environmental observations (wind direction and
speed, sea surface state (Beaufort), swell, cloud cover, visibility, and a general index of sightability) and the
number of ski-boats and ships visible were recorded every hour, starting one hour after the commencement
of observations. Watch was discontinued during rain, when visibility dropped to less than five kilometres,
or when wind speeds exceeded 25 knots.

4
When possible during the 1988 to 1991 surveys, a ski-boat was launched to intercept passing groups of
whales for confirmation of estimates of group size made from the tower and for collection of identification
material. During the 2002 survey, an independent shipboard survey was carried out from the FRS Algoa in
the vicinity of Cape Vidal during which whale groups were approached by rigid inflatable boats.
Exemption for all whale approaches was granted in terms of the Sea Fisheries Act (no 58 of 1973), the
Fishery Act (no 12 of 1988) and the Marine Living Resources Act (Act 18 of 1998).
Analyses
All observation effort has been regarded as being of equal intensity, and periods during which whales were
tracked have been included as observation effort. Although this may result in a density-dependent
underestimate of whales passing the platform, such a bias is thought to be balanced by increased observer
awareness during tracking periods. From 1990 onwards, the tracking of each group was limited to three
consecutive fixes or twenty minutes, whichever came first.
From 1990, group size estimates were refined at each fix, and the sizes used in analyses were the final
estimates of group size. Where the final estimate of group size was recorded as a range, the group size used
in analysis was the mean of the range rounded to the nearest integer. Group size estimates from the tower
were compared to group sizes confirmed during interception of the same groups by ski-boat during the
1988 to 1991 surveys, while the frequencies of group sizes observed during the 2002 shore and a
concurrent ship based survey off Cape Vidal were compared. Groups of indeterminate size (where no
estimate was made) were excluded from these analyses, but included in daily density analyses as single
individuals.
The vertical and horizontal angles recorded by theodolite for each position were converted to distances
from the platform (radial distance) and bearings from true north, taking into consideration both the
curvature of the earth and a refraction correction factor. Thereafter, having established Cartesian co-
ordinate positions for each fix, the migration speed and heading of each group and their distance from the
shore (coastal distance) were calculated. Migration speeds were calculated using the distance travelled
between the first and last definite fixes of each migration track and the elapsed time between these fixes,
while the mean heading of each track was calculated as the heading between the first and last definite fix.
The coastal distance was calculated as the distance of the midpoint of the track to the shore directly to the
east of it. Migration speeds and headings were calculated for all migrating groups for which more then two
definite fixes were obtained, while coastal distances were calculated for all groups for which at least one
definite position fix was obtained.
Due to observations only being possible during daylight hours, daily densities have to be calculated by
extrapolating from the number of groups sighted during periods of watch each day. Consequently to be

5
included in the calculations of daily density, groups must have crossed the midline of the observation area
within the period of observation. Groups that were not seen to have crossed the midline of the observation
area were projected forwards or backwards at their measured speed and bearing, and the time of the
projected crossing was calculated. Such groups were included in the daily density if the time of their
projected cross fell within an observation period. Groups of indeterminate direction were apportioned to the
total on a pro rata basis of groups scored to cross (or projected to cross) northwards or southwards of all
groups seen on that day
Totals of the number of groups (nd,i) crossing the midline of the survey area each day (d) in each of three
perpendicular distance intervals (i) were tallied for i = 1 (0-2.99 km from the coast); 2 (3.0-5.99 km from
the coast), and 3 (> 6.0 km from the coast. The proportions of groups missed by observers (pw,i) in each of
the three perpendicular distance intervals (i) in three weather condition strata (w) were calculated by
Findlay and Best (1996a) for w = 1 (poor weather conditions) 2 (fair weather conditions) and 3 (good
weather conditions) and i = 1, 2, 3 (as defined above).
Daily tallies of the number of groups seen in each distance interval were adjusted for proportions missed in
each distance interval under the weather condition of the day to produce adjusted tallies in each distance
interval (ad,i)
ad,i = nd,i(1+ pw(d),i) (1)
Adjusted counts in each of the three distance intervals were summed and divided by the observation effort
of that day (ed) to give estimated densities (Jd) of groups crossing the midline per hour
Jd = (Σ3i=1 (ai,d)) / ed (2)
Estimated densities of groups crossing the midline per hour of observation were multiplied by 24 to
produce daily densities (Dd). Extrapolation of hourly densities to daily densities assumes that the migration
rate is constant throughout the day.
Dd = Jd.24 (3)
Densities of individuals per day (Id) were calculated as the product of daily group densities and the mean
group size observed in that year (s).
Id = Dd.s (4)

6
The number of whales observed migrating northwards past Cape Vidal (N) each year have been calculated
through summation of the daily densities recorded for each day of each survey,
N = Σhd=1 (Id) (5)
where h is the length of the survey in days.
No calculation of variance has been carried out for these estimates of whales passing Cape Vidal on their
northward migration. Findlay and Best (1996b) estimated a cv for the 1991 estimate by bootstrapping each
individual day’s data (tallies of groups seen by each tower in each distance bin, numbers of whales in
groups of which more than two fixes were taken) to provide a series of pseudo estimates from which a cv
could be calculated. However it should be noted that this could not be carried out for other years due to
incomplete twin platform data throughout the survey.
RESULTS
Observation Effort and whales sighted
The observation effort and number of sightings recorded each year are shown in Table 3.1. The high
proportion of humpback whales in the identified whales suggests that essentially all the unidentified whales
were humpback whales, and they have been analysed as such. Other identified whales, including southern
right whales (Eubalaena australis) and minke whales (Balaenoptera acutorostrata), have been excluded
from analyses.
Table 1. Results of shore-based surveys undertaken at Cape Vidal between 1988 and 2002. SRW =
Southern Right Whales, MW = Minke Whales. All unidentified whales in 2002 are included under
humpback whales.
WHALES OBSERVED Groups (individuals) YEAR OBSERVATION
EFFORT (Hours) Humpback SRW MW Unidentified
1988 166 46 (115) 0 (0) 0(0) 17 ( 31)
1989 199.5 44 ( 91) 1 (2) 0 (0) 14 ( 20)
1990 618.25 291 (525) 3 (6) 2 (4) 89 (119)

7
1991 363 126 (254) 1 (1) 2 (3) 105 (154)
2002 179.93 323 (573) 0 (0) 0 (0)
The extent of observation effort recorded each day is shown in Figure.1, while Figure 2 shows the mean
daily sighting conditions recorded each year. It should be noted that the conditions during the 2002 survey
were generally poor with a total of 49 % of the available observation period lost to poor weather.
Furthermore inland rainfall during the 2002 survey resulted in large plumes of turbid water in the inshore
coastal region of the research area during the survey. Humpback whales were seen to avoid these.
Factors reducing sighting conditions over all years included strong haze (presumably arising from inland
sugar cane burning), and high wind and sea conditions resulting from frontal systems passing the coast
during the survey. No differences in mean daily sighting condition were found between years ((one way
ANOVA, F = 1.14, d.f. = 4;213, p = 0.33)

0
2
4
6
8
10
12
2 10 18 26 4 12 20 28 5 13 21 29 6 14 22 30 8 16 24
DAY
HOURS
1988
0
2
4
6
8
10
12
2 10 18 26 4 12 20 28 5 13 21 29 6 14 22 30 8 16 24
DAY
HOURS
1989
0
2
4
6
8
10
12
2 10 18 26 4 12 20 28 5 13 21 29 6 14 22 30 8 16 24
DAY
HOURS
1990
1991
0
2
4
6
8
10
12
2 10 18 26 4 12 20 28 5 13 21 29 6 14 22 30 8 16 24
DAY
HOURS
1991
0
2
4
6
8
10
12
2 10 18 26 4 12 20 28 5 13 21 29 6 14 22 30 8 16 24
DAY
HOURS
2002
Figure 1. Observation effort (hours) carried out from Cape Vidal between 2 June and 28 October, 1988 to
2002.
8

9

1988
0
0.5
1
1.5
2
2.5
3
3.5
4
4.5
5
2 9 16 23 30 7 14 21 28 4 11 18 25 1 8 15 22 29 6 13 20 27
DAY
SIGHT
1989
0
0.5
1
1.5
2
2.5
3
3.5
4
4.5
5
2 9 16 23 30 7 14 21 28 4 11 18 25 1 8 15 22 29 6 13 20 27
DAY
SIGHT
1990
0
0.5
1
1.5
2
2.5
3
3.5
4
4.5
5
2 9 16 23 30 7 14 21 28 4 11 18 25 1 8 15 22 29 6 13 20 27
DAY
SIGHT
1991
0
0.5
1
1.5
2
2.5
3
3.5
4
4.5
5
2 9 16 23 30 7 14 21 28 4 11 18 25 1 8 15 22 29 6 13 20 27
DAY
SIGHT
2002
0
0.5
1
1.5
2
2.5
3
3.5
4
4.5
5
2 9 16 23 30 7 14 21 28 4 11 18 25 1 8 15 22 29 6 13 20 27
DAY
SIGHT
10
11
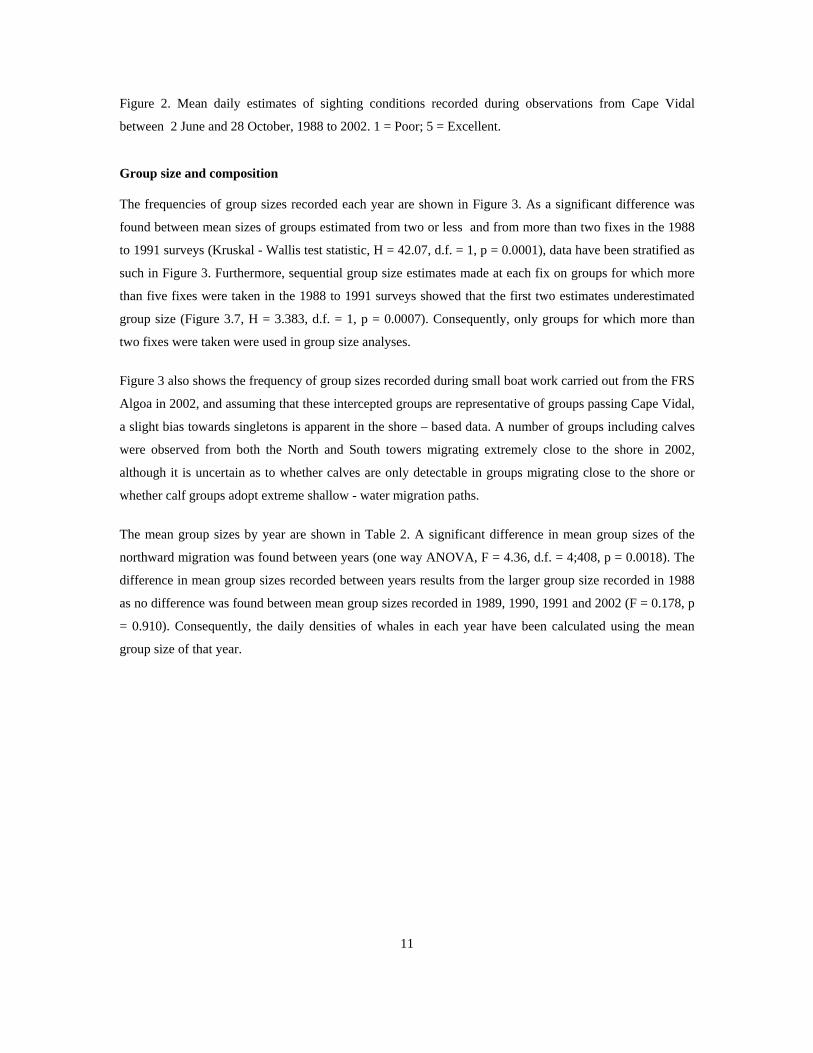
Figure 2. Mean daily estimates of sighting conditions recorded during observations from Cape Vidal
between 2 June and 28 October, 1988 to 2002. 1 = Poor; 5 = Excellent.
Group size and composition
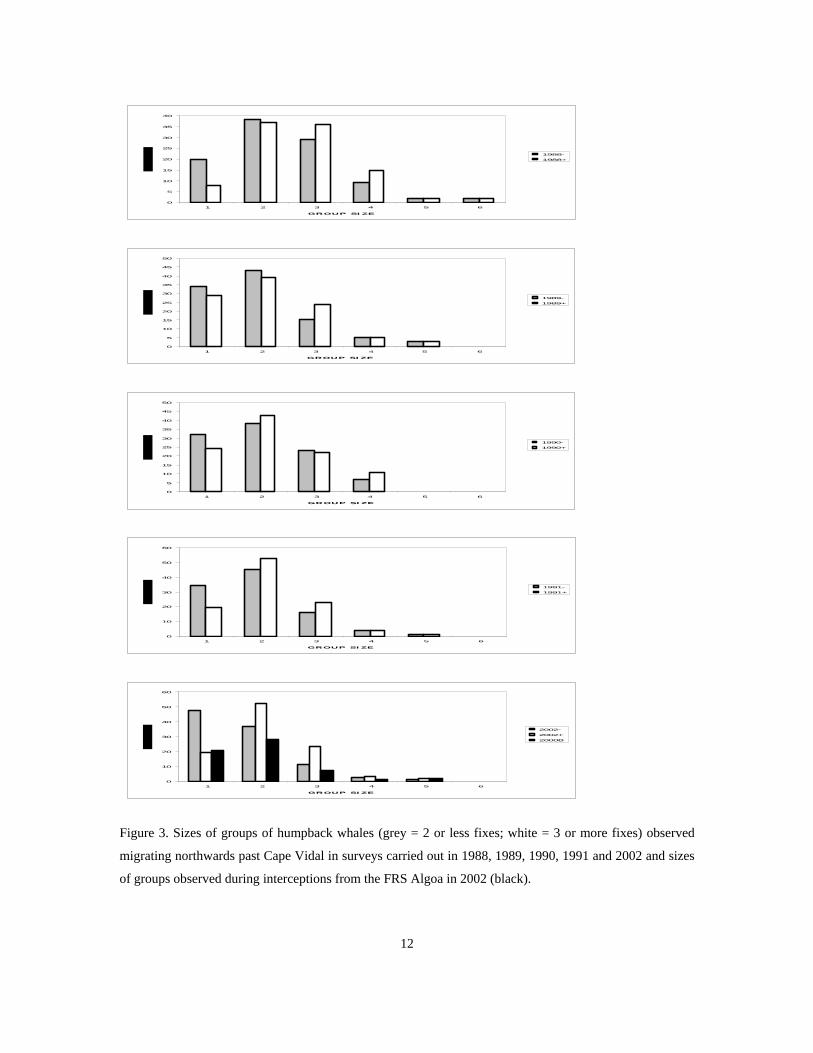
The frequencies of group sizes recorded each year are shown in Figure 3. As a significant difference was
found between mean sizes of groups estimated from two or less and from more than two fixes in the 1988
to 1991 surveys (Kruskal - Wallis test statistic, H = 42.07, d.f. = 1, p = 0.0001), data have been stratified as
such in Figure 3. Furthermore, sequential group size estimates made at each fix on groups for which more
than five fixes were taken in the 1988 to 1991 surveys showed that the first two estimates underestimated
group size (Figure 3.7, H = 3.383, d.f. = 1, p = 0.0007). Consequently, only groups for which more than
two fixes were taken were used in group size analyses.
Figure 3 also shows the frequency of group sizes recorded during small boat work carried out from the FRS
Algoa in 2002, and assuming that these intercepted groups are representative of groups passing Cape Vidal,
a slight bias towards singletons is apparent in the shore – based data. A number of groups including calves
were observed from both the North and South towers migrating extremely close to the shore in 2002,
although it is uncertain as to whether calves are only detectable in groups migrating close to the shore or
whether calf groups adopt extreme shallow - water migration paths.
The mean group sizes by year are shown in Table 2. A significant difference in mean group sizes of the
northward migration was found between years (one way ANOVA, F = 4.36, d.f. = 4;408, p = 0.0018). The
difference in mean group sizes recorded between years results from the larger group size recorded in 1988
as no difference was found between mean group sizes recorded in 1989, 1990, 1991 and 2002 (F = 0.178, p
= 0.910). Consequently, the daily densities of whales in each year have been calculated using the mean
group size of that year.
0
5
10
15
20
25
30
35
40
1 2 3 4 5 6
GROUP SI ZE
1988-
1988+
0
5
10
15
20
25
30
35
40
45
50
1 2 3 4 5 6
GROUP SI ZE
1989-
1989+
0
5
10
15
20
25
30
35
40
45
50
1 2 3 4 5 6
GROUP SI ZE
1990-
1990+
0
10
20
30
40
50
60
1 2 3 4 5 6
GROUP SI ZE
1991-
1991+
0
10
20
30
40
50
60
1 2 3 4 5 6
GROUP SI ZE
2002-
2002+
2000B
Figure 3. Sizes of groups of humpback whales (grey = 2 or less fixes; white = 3 or more fixes) observed
migrating northwards past Cape Vidal in surveys carried out in 1988, 1989, 1990, 1991 and 2002 and sizes
of groups observed during interceptions from the FRS Algoa in 2002 (black).
12

13
Table 2. Mean group size, migration speed, distance offshore and migration heading (and associated
standard errors) recorded during the northward and southward migrations past Cape Vidal each year
between 1988 and 2002.
YEAR GRP SIZE SPEED
(km/h)
DISTANCE
OFFSHORE
(km)
BEARING
degrees
Northward Migration
1988 2.73 4.49 5.20 16.59
(0.18) (0.48) (0.53) (3.80)
1989 2.10 5.41 4.01 9.56
(0.16) (0.59) (0.62) (5.43)
1990 2.11 4.62 4.70 15.44
(0.11) (0.30) (0.33) (3.60)
1991 2.22 3.63 3.50 15.09
(0.09) (0.21) (0.16) (3.13)
2002 2.10 3.89 4.20 10.65
(0.07) (0.20) (0.19) (2.35)
Southward Migration
1990 2.18 5.26 6.21 195
(0.17) (0.37) (0.48) (3.01)

Migration Speeds
The frequencies of migration speeds recorded each year (Figure 4) show speeds to range to over 12 km/hr.
0
10
20
30
40
50
60
70
0-2 2-4 4-6 6-8 8-10 10-12 12+
SPEED (km/h)
FRE
QUE
NCY
19881989199019912002
Figure 4. Distribution of migration speeds of groups passing Cape Vidal each year between 1988 and 2002.
No significant difference in the mean northward migration speed (Table 2) between years (F = 1.79, d.f. =
4;441, p = 0.13).
The extrapolation of daylight counts to night to estimate daily migrating densities requires the assumption
of a constant diel migration rate. Findlay (1994) found no difference in migration speed by time of day and
assumed a constant migration speed. Bryden (1985) projected whales from positions where they were seen
during aerial surveys, past shore-based observation points at a speed of 6.5 km per hour, and found no
difference between the number of projected passes and the number of observed passes, and so concluded
that diel migration speeds were constant. Paterson and Paterson (1989) cite Bryden (1985) as evidence of
constant diel migration rate.
In order to estimate migration speeds in the vicinity of Cape Vidal, photo-identification sampling was
planned to the south and north of Cape Vidal from the FRS Algoa in 2002. Apart from increasing the
sample of naturally marked individuals from this coast, the aim of this exercise was to attempt to sample
known individuals both to the south and north of Cape Vidal and consequently gather information on
14

movement of whales during the migration. Unfortunately this sampling, as with the onshore – offshore
distribution sampling, was thwarted by mechanical failure of the sampling vessel.
Distance Offshore
The distribution of whales sighted with distance from the coast each year (Figure 5) shows whales to be
visible at over 12 km from the coast, with the mode of the northward migration at 2-4 km. A significant
difference in distance offshore was recorded between years (F = 5.59, d.f. = 4;889, p = 0.00018). No
difference in mean sighting conditions were recorded between years.
0
10
20
30
40
50
60
70
80
1-2 2-4 4-6 6-8 8-10 10-12 12+
DISTANCE OFFSHORE (km)
FRE
QUE
NCY
19881989199019912002
Figure 5. Frequencies of distances of whale groups from the shore recorded during surveys from Cape
Vidal between 1988 and 2002.
The maximum distances at which whales were recorded from the coast were just over 20 km, although it
should be noted that distance estimation by theodolite of such distant groups are likely to be very
inaccurate. Paterson and Paterson (1984, 1989), Bryden (1985) and Bryden et al. (1990) stated that it is
unlikely that humpback whales will be seen at distances greater than 10 km from the coast, despite the
horizon being further than this in their surveys. Paterson and Paterson (1984) suggest that the number of
whales passing beyond 10 km from the shore is small, while Bryden (1985) undertook independent aerial
surveys to assess the distribution of whales with respect to the coast, with 96% of sighting being made
within visibility limits of observers on headlands. However, Chittleborough (1965) notes that the main
15

stream of humpback whales migrating along the Australian coast passes within 18.5 km of the shore, and
that few whales were seen or captured more than 37 km from the coast. Only two offshore - onshore
transects could be carried out off Cape Vidal from the FRS Algoa during 2002, and resulted in 20 sightings
of humpback whale groups (Figure 6) showing 95 % of sightings being made within visibility limits of the
Cape Vidal observation platform.
Figure 6. Distributions of humpback whale sightings and survey effort on the one offshore – onshore
transect surveyed off Cape Vidal in 2002.
Migration Bearing
The frequencies of the headings of northward and southward (as reciprocal headings) migrating groups
each year is shown in Figure 7. The coastline to the south of Cape Vidal lies at a bearing of approximately
20 degrees True, while to the north of Cape Vidal the coast lies at a bearing of about 10 degrees True. In
both the northern and southern migrations, the mean headings (Table 2) lie between the bearings of the
coastline, which suggests no convergence onto, or divergence from, the coastline during the northward or
southward migration respectively.
For the northward migration, no significant difference was found in migration headings by year in the 1988
to 1991 surveys (Table 2, F =1.31, d.f. = 4,441, p =0.34)
16

-30
-20
-10
0
10
20
30
280 290 300 310 320 330 340 350 360 10 20 30 40 50 60 70 80 90
BEARING
FREQ
UEN
CY
1988
1989
1990
1991
1990 S
2002
Figure 7. Distribution of headings of groups migrating northwards (1988-2002) and southwards (1990 –
negative axis) past Cape Vidal.
Daily Densities
The calculated daily densities of whales migrating northwards past Cape Vidal each year are shown in
Figures 7a – 7c. The migrations observed in surveys carried out between 1988 and 1991 comprised a series
of waves centred over the periods 3 - 9 July, 15 - 20 July and 24 - 30 July (Findlay 1994). Spearman rank
correlation of daily densities recorded each year showed significant correlation between the 1989 and 1991
daily densities (rs= 0.5098, p = 0.011, n = 26), but no correlation between daily densities recorded in other
years, possibly due to an oil spill across the migration path to the south of Cape Vidal in 1990 and the
limited duration of the survey in 1988. Spectral analysis (BMDP Statistical software) with missing values
replaced by means showed a periodicity at 10.2 days in 1988, 1989 and 1991 and at 8.5 days in 1990,
(although these were not significant at the 5% level) and a significant periodicity at 10.2 days for the mean
daily densities of the 1988 to 1991 surveys (Findlay, 1994). Daily densities recorded during the 2002
survey showed a similar wave nature although not as co-incident to the 1988 to 1991 surveys (Figure 8).
The first group seen migrating southward in 1990 was on 7 July, while the last group migrating northwards
was recorded on 13 October. Despite the majority of whales migrating southwards after the end of August
in 1990, 31 % of northward-migrating individuals were sighted after 9 August. Figure 9 shows the switch
in the north to south migration occurring between 5 and 25 August, although the exact timing is impossible
to establish, and suggests milling seems to occur in the area during August. Matthews (1938) found the
17

18
mid-season catch in the Durban whaling grounds to comprise a high proportion of juvenile animals, and
suggested that juvenile humpback whales did not migrate as far north as mature individuals.

1988
0
10
20
30
40
50
60
70
2 8 14 20 26 2 8 14 20 26 1 7 13 19 25 31 6 12 18 24 30 6 12 18 24
DAY
DEN
SITY
(WH
ALE
S PE
R D
AY
1989
0
10
20
30
40
50
60
2 8 14 20 26 2 8 14 20 26 1 7 13 19 25 31 6 12 18 24 30 6 12 18 24
DAY
DEN
SITY
(WH
ALE
S PE
R D
AY
Figure 8a. Daily densities of northward migrating whales recorded from Cape Vidal between 2 June and 28
October 1988 and 1989.
19

1990
0
20
40
60
80
1002 8 14 20 26 2 8 14 20 26 1 7 13 19 25 31 6 12 18 24 30 6 12 18 24
DAY
DEN
SITY
(WH
ALE
S PE
R D
AY
1990S
0102030405060708090
2 8 14 20 26 2 8 14 20 26 1 7 13 19 25 31 6 12 18 24 30 6 12 18 24
DAY
DEN
SITY
(WH
ALE
S PE
R D
AY
Figure 8b. Daily densities of northward and southward migrating whales recorded from Cape Vidal
between 2 June and 28 October, 1990.
20
1991
0
20
40
6080
100
120
1402 8 14 20 26 2 8 14 20 26 1 7 13 19 25 31 6 12 18 24 30 6 12 18 24
DAY
DEN
SITY
(WH
ALE
S PE
R D
AY
2002
0
50
100
150
200
250
2 8 14 20 26 2 8 14 20 26 1 7 13 19 25 31 6 12 18 24 30 6 12 18 24
DAY
DEN
SITY
(WH
ALE
S PE
R D
AY
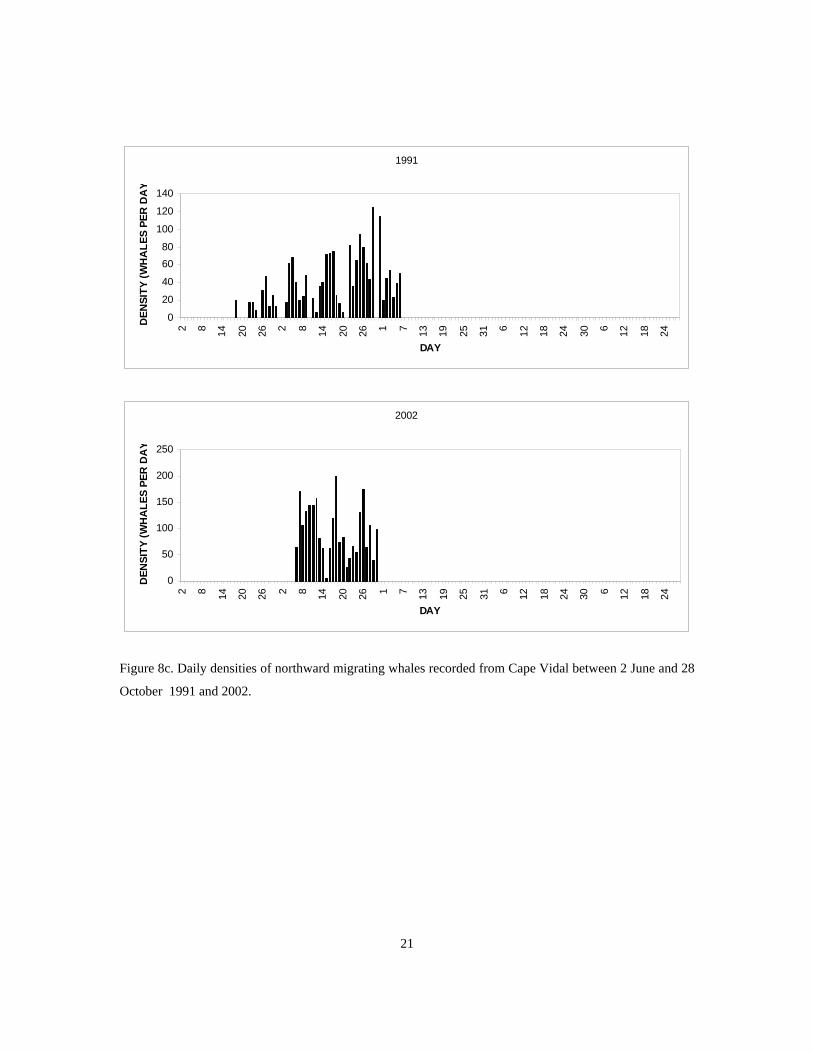
Figure 8c. Daily densities of northward migrating whales recorded from Cape Vidal between 2 June and 28
October 1991 and 2002.
21

0
0.2
0.4
0.6
0.8
1
1.2
23-May
12-Jun 02-Jul 22-Jul 11-Aug 31-Aug 20-Sep 10-Oct 30-Oct 19-Nov
DECADE
PRO
PORT
ION
OF
GRO
UPS
NORTHSOUTH
Figure 9.The proportions of northward and southward migrating groups recorded from Cape Vidal in 1990
by 10 day decade.
Table 3 shows the estimated numbers of whales passing Cape Vidal on both the northward and southward
migrations during six survey periods between 1988 and 2002. The survey periods have been chosen to
cover both the broadest range of co-incident surveys between years and the longest duration of surveys.
Only one relatively brief survey period of 17 days was covered in all years (6 July to 22 July), while the 6
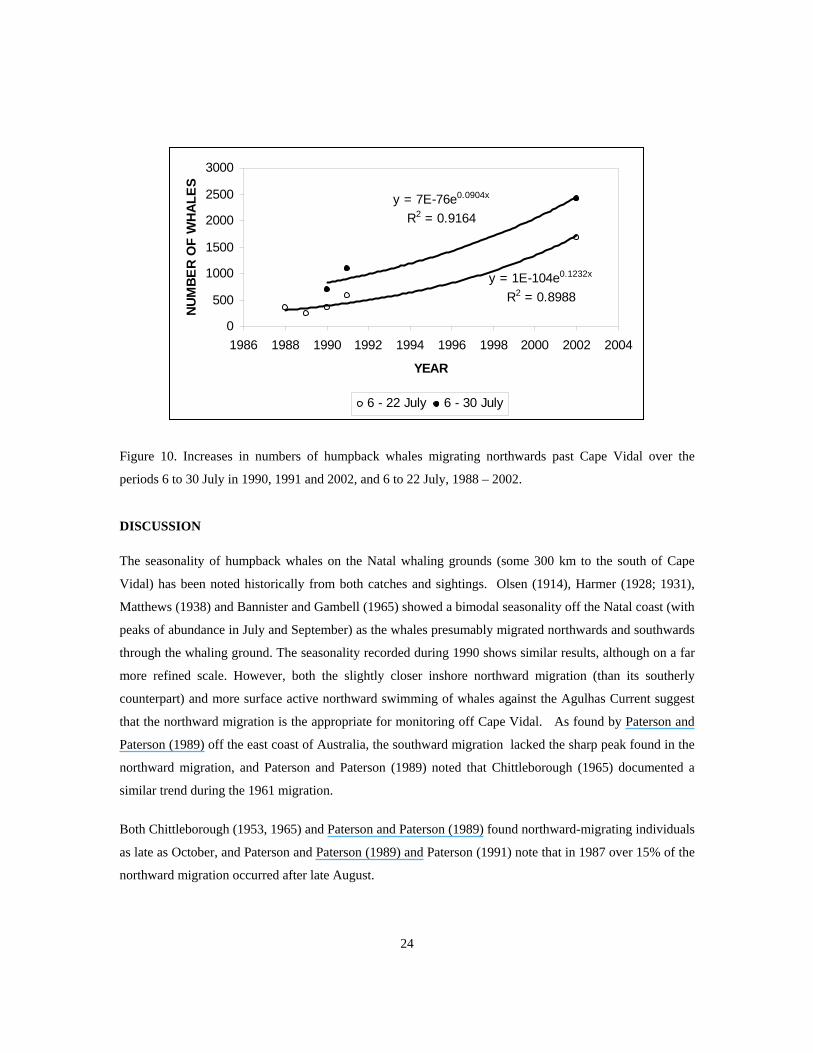
July to 30 July period covered three years (1990; 1991 and 2002). Figure 10 shows preliminary estimates of
increase rates of humpback whales of 0.123 and 0.090 per annum for these respective survey periods. It
should be stressed that these estimated rates of increase must be regarded with caution given the limited
number of surveys, the limited duration of concurrent surveys, and the fact that the 6 July to 22 July survey
period excludes the peak migration period. However both trend estimates lie within plausible rates of
population growth in humpback whales (Clapham et al., 2001).
22

23
Table 3 Estimated numbers of humpback whales passing Cape Vidal on the northward and southward
migration during five survey periods each year.
SURVEY PERIOD
6/7-22/7 1/7-22/7 27/6-22/7 6/7-30/7 17/6-6/8 2/6-28/10
Northward
1988 358 - - - -
1989 249 296 302 - -
1990 359 420 420 695 1000 1711
1991 587 734 831 1093 1777
2002 1673 2406
Southward
1990 - - - - 1647
y = 7E-76e0.0904x
R2 = 0.9164
y = 1E-104e0.1232x
R2 = 0.8988
0
500
1000
1500
2000
2500
3000
1986 1988 1990 1992 1994 1996 1998 2000 2002 2004
YEAR
NUM
BER
OF
WH
ALE
S
6 - 22 July 6 - 30 July
Figure 10. Increases in numbers of humpback whales migrating northwards past Cape Vidal over the
periods 6 to 30 July in 1990, 1991 and 2002, and 6 to 22 July, 1988 – 2002.
DISCUSSION
The seasonality of humpback whales on the Natal whaling grounds (some 300 km to the south of Cape
Vidal) has been noted historically from both catches and sightings. Olsen (1914), Harmer (1928; 1931),
Matthews (1938) and Bannister and Gambell (1965) showed a bimodal seasonality off the Natal coast (with
peaks of abundance in July and September) as the whales presumably migrated northwards and southwards
through the whaling ground. The seasonality recorded during 1990 shows similar results, although on a far
more refined scale. However, both the slightly closer inshore northward migration (than its southerly
counterpart) and more surface active northward swimming of whales against the Agulhas Current suggest
that the northward migration is the appropriate for monitoring off Cape Vidal. As found by Paterson and
Paterson (1989) off the east coast of Australia, the southward migration lacked the sharp peak found in the
northward migration, and Paterson and Paterson (1989) noted that Chittleborough (1965) documented a
similar trend during the 1961 migration.
Both Chittleborough (1953, 1965) and Paterson and Paterson (1989) found northward-migrating individuals
as late as October, and Paterson and Paterson (1989) and Paterson (1991) note that in 1987 over 15% of the
northward migration occurred after late August.
24

25
Group size
The group sizes recorded were similar to those recorded off the east Australian coast by Bryden (1985) and
(Bryden et al. 1990). Bryden (1985) and Bryden et al. (1990) suggest that the potential error in the
population estimate arising from the error in group size estimates would be small due to the small group
sizes recorded. However Antarctic minke whales are also found most often in small groups (Best and
Butterworth 1980) and in surveys carried out in passing mode (equivalent to a shore-based survey), group
size can be underestimated by an average of 35 % (Butterworth 1987). No group sizes were presented by
Paterson and Paterson (1984, 1989) or by Paterson (1991) and they do not discuss the accuracy of group
size estimation.
Offshore distance and migration path width
Paterson and Paterson (1984, 1989), Bryden (1985) and Bryden et al. (1990) state that it is unlikely that
humpback whales will be seen at distances greater than 10 km from the coast, despite the horizon being
further than this. Paterson and Paterson (1984) suggest that the number of whales passing beyond 10 km
from the shore is small, while Bryden (1985) undertook independent aerial surveys to assess the
distribution of whales with respect to the coast, and found 96% of whales to be within 10 km of observers
on headlands. However, Chittleborough (1965) notes that the main stream of humpback whales migrating
along the Australian coast passes within 18.5 km of the shore, and that few whales were seen or captured
more than 37 km from the coast.
Dawbin (1956; 1966) found that the course followed by migrating humpback whales showed no
relationship to water depth or proximity to the coastline The northward migration in 1990 was closer to the
shore than southward migration (Table 2 and see Findlay, 1994), and may reflect avoidance of the strong
southerly Agulhas Current (and simultaneous utilisation of the northward inshore counter-current) by
northward moving whales, and the more offshore utilisation of the Agulhas Current by southward
migrating whales, the main core of the Agulhas Current lies well offshore of the visibility limit of
observers. Pearce (1977) noted little meandering of the Agulhas Current in the region of Cape Vidal, and
Schumann (1987) found longshore wind to be the dominant influence on local currents at Richards Bay
some 100 km to the south of Cape Vidal. Unfortunately the steep slope in bathymetry precludes in situ
measurements of current speed or direction off Cape Vidal.
Migration speed
The migration speeds recorded are comparable to instantaneous speeds recorded by Chittleborough (1953)
off the west coast of Australia from aerial observations. He found individuals moved at speeds of between
4.8 and 14.2 km per hour, with a mean of 8.7 km/h. Chittleborough (1965) found integrated (over time)

26
migration speeds of between 5.18 and 6.66 km per hour for animals marked and recovered in Australian
waters, while Robins (in Dawbin 1956) reported a mark return where the individual must have migrated at
a mean speed of 4 km per hour over six days. Dawbin (1956) calculated the migration rate of humpback
whales off New Zealand from timing of migration peaks as 2.4 km per hour and suggests that frequent
periods of rest or other activity must occur during the migration. However, these peaks were measured in
different seasons, and Dawbin notes that timing of components of the migration varies between seasons.
Despite the considerable variation in migration speeds reported both in the literature and recorded at Cape
Vidal, no correlation was found between speeds and the environmental parameters, including time of day,
measured (Findlay, 1994). Although humpback whales migrate rapidly at certain times, the report of an
individual marked and caught in the same area some days later (Chittleborough 1965) suggest some degree
of rest during the migration. Such relatively instantaneous migration speeds, as these measured at Cape
Vidal, must therefore be regarded with caution in the integration of migration rates. In the determination of
population size through shore-based surveys, daily densities recorded during daylight hours are
extrapolated up to a 24 hour period (Reilly et al. 1983, Bryden et al. 1990), which assumes that the diel
migration rate is constant. Although no direct evidence of diel differences in migration rates is available for
humpback whales, Watkins, Moore, Wartzok, and Johnson (1981) showed that three radio-tracked
humpback whales in Prince William Sound, Alaska (a feeding ground) had shorter dive times at night than
during the day.
Migration heading
Dawbin (1956, 1966) noted that the course followed by migrating humpback whales off New Zealand
showed no relationship to water depth or proximity of the coastline, and that the orientation of the coastline
appeared to be the most important factor in determining migration direction; while northward-migrating
whales were concentrated by the north-easterly orientation of the east coast, southward-migrating whales
diverged from it. Although some convergence onto the coast would be expected in the region of Cape Vidal
during the northward migration, this could not be detected from the analysis of headings observed from
Cape Vidal. However, it should be noted that the length of coast-line within the visibility limits is possibly
too short to quantify any such convergence. Furthermore, the number of southbound whales recorded off
Cape Vidal in 1990 suggests that the migration has not diverted from the coastline at this latitude, a fact
substantiated by the southward migration headings being parallel to the coastline. Incidental sightings of
southward-migrating humpback whales close inshore have been made well to the south of Cape Vidal, and
it is possible that migration follows the coast at least as far south as Knysna, where Best and Ross (1996)
report sightings of humpback whales made from the pilot station prior to the initiation of whaling in 1908.

27
No measurements of migration heading were presented by Paterson and Paterson (1984, 1989) or Paterson
(1991). Bryden (1985) noted that the majority of whales observed travelled a direct course from south to
north as they passed headlands, and he estimated the offshore distribution of whales passing headlands by
projecting the positions of groups seen on aerial surveys northwards. The lack of difference in northward
headings recorded to the north and south of Cape Vidal suggest that whales migrate from headland to
headland during the northward migration, rather following the coast at a set distance offshore.
Whale densities
The relative co-incident timing of the migrations between years is somewhat surprising, given the
approximately 2000 n. mile distance between the Antarctic feeding grounds and northern KwaZulu Natal.
No waves in the migrations were reported by authors analysing catches or sightings in the KwaZulu Natal
whaling grounds by month, day - decade or week (Olsen 1914, Harmer 1931, Matthews 1938, Bannister
and Gambell 1965, and Findlay unpub.), although a time division of a week would not be sufficiently
refined for such waves to be detected. Although Dawbin (1956) found some annual differences in the
timing of the northward migration through the Cook Strait, New Zealand, Chittleborough (1965) speculated
that this resulted from differences in Antarctic oceanographic conditions and food availability between
years causing differences in the timing of the initiation of the migration, and not differences in migration
rates. Both Chittleborough (1965) and Dawbin (1966) showed age or reproductive classes segregation in
the migration in that that lactating females were in the vanguard of the northward migration, followed by
immature whales, mature males and resting females, and lastly pregnant females. On the return migration
newly pregnant females were the first to leave the breeding grounds, followed by males and immature
whales and lastly newly-lactating females. It is unknown if the waves recorded off the northern KwaZulu
Natal coast represent such reproductive or age class segregation.
There are a number of assumptions which require verification (see reviews by Reilly et al., 1983; Reilly,
1984 and Hiby and Hammond, 1989, Buckland et al., 1993) for estimation of absolute abundance through
shore – based surveys. These are discussed below in relation to trend estimation.
1. The proportions of the population passing beyond the spatial and temporal limits of observers must be
estimated through independent survey. The important aspect for trend estimation is not so much estimation
of these proportions as ensuring that equal proportions of the population are observable between years.
Shifts in the migration timing or in distance offshore off Cape Vidal would bias trend estimates. Densities
recorded in 2002 suggest an earlier migration than in the 1988 to 1991 surveys which would bias the trend
estimate upwards given that it was calculated from early portions of the of migrations. The local whale
watch operator in St Lucia (32 km south of Cape Vidal) noted that large numbers of humpback whales were
present off St Lucia throughout June (D. Bennet, pers. comm.). In contrast to this few whales were recorded

28
passing Cape Vidal before 20 June in the 1990 survey. It is recommended that future surveys off Cape
Vidal be carried out to over the period June, July and August so as to include the entire northward
migration. Although a difference in migration distances offshore were recorded between years, such
differences are well within the sighting limits of Cape Vidal.
2. Detection probabilities vary with inter alia, distance and sighting conditions, and the consequent
heterogeneity in sighting probabilities within the survey area must be taken into consideration. Although
not noted by Reilly et al. (1983), Reilly (1984), Hiby and Hammond (1989) or Buckland et al. (1993)
whale behaviour and group size may further compound detection probabilities. However, these latter
detection probabilities would be extremely difficult to quantify. Heterogeneity in sighting probabilities with
both distance and sighting condition have been taken into consideration by adjusting for proportions
missed.
3. Observer accuracy and precision must be constant throughout surveys. Of importance in the current
series of surveys is the increase in density of sightings and consequently sighting processing times in 2002.
The number of whales in view of observers at any one time has increased considerably to the point that
both the probability of sighting groups and the linking of surfacing activity bouts to particular groups may
be compromised. Failure to sight groups in the 2002 survey would result in a downward bias in trend
estimation, while failure to link surfacing activity bouts to previously sighted groups may result in an
upward bias in trend estimation.
4. Observations (outside of summer observations in polar regions) can only be conducted throughout
daylight hours in suitable sighting conditions. As daily totals must be extrapolated from periods of
observation effort, the assumptions that both the diel migration rate and the migration rate under different
sighting conditions constant must hold. Sighting conditions experienced in the 2002 survey were believed
to be poorer than those from the 1988 – 1991 survey series, with both haze and sea and wind conditions
compromising sighting probabilities. Biases due to sighting probabilities have to some degree been
corrected by adjusting for proportions missed under poor weather conditions, and Findlay (1994) found no
variation in migration speeds by weather condition.
CONCLUSION
Although the population increase rates estimated here are biologically feasible, they must be considered
preliminary, being strongly influenced by the single data point for 2002. Although there is no reason to
consider the 2002 point estimate biased, further surveys are required to improve precision.

29
ACKNOWLEDGEMENTS
We are indebted to the following people, groups or organisations for their assistance with these surveys.
The numerous observers who gave up their time to attend and participate in these surveys, including Tim
Collins, Stephanie Lemm, Traci Viljoen, Franco Merkel, Margaret Hamilton, Hayley Tennent, Olive
Tennent, Olivier Breyesse, Gavin Mankabane, Hamada Mari, Ronny Alcindor, Celestino Albino, Corey
Corbett, Yvette Razafindrakto, Sam Weru, Lorne August, Ashley Naidoo, Simon Elwen, Omar Amir,
Sakhile Tsotsobe, Gcobane Popose, Keiko Sekiguchi, Peter Bartlett, Michael Meyer, Martin Haupt, Gus
van Dyk, Dave Rungren, Jacki Portuesi, Peter Chadwick, Anton Rossouw, Rob Faure, Sean Patrick, Dave
baker, Vic Peddemors, Paddy Cook, Peter Leitner, Stefan Swanson, Keith Benkenstein, Robyn Lovemore,
Nicole Godenir, Pierre de Groot, Brian Morris, Michelle Yates, Sabena Wintner, Sean Blyth, Debbie Grant,
Warren Backler, Marliese Teuschner, Ed (Chris) Parsons, Jenny Christal, Cameron Dallas, Leon
Liebenberg, Ingrid Rencken, Leszek Karczmarski and Price Kerfoot. In particular the assistance of Tim
Collins, Keiko Sekiguchi, Michael Meyer and Peter Bartlett is gratefully acknowledged.
We gratefully acknowledge the Department of Environmental Affairs and Tourism donation of research
time aboard FRS Algoa in 2002. The Captain and crew of the FRS Algoa are gratefully acknowledged for
their assistance to this project under difficult conditions. We are indebted to Smit Pentow and the agents
King and Sons for logistic arrangements and support.
The Director and staff of Ezemvelo KZN Wildlife at Durban, Cape Vidal and St Lucia are gratefully
acknowledged. In particular the assistance of Dr Jean Harris, Mr. Richard Penn – Sawyers, Mr. Ian Porter
and the Camp Manager of Cape Vidal, Mr. Ron Joubert, must be acknowledged. In earlier years, the
assistance of Robin Allen, Lionel van Schoor and Callum Beatie is acknowledged.
The Director of the International Fund for Animal Welfare (IFAW) is acknowledged for providing travel
assistance to ISAHWN participants from the Sultanate of Oman, Kenya, Tanzania, Mozambique,
Madagascar and the Comoros.
A grant from The Center for Environmental Research and Conservation of Columbia University awarded to
Rosenbaum, Ersts, and Findlay provided financial assistance in the regionally coordinated systematic data
collection efforts necessary for the population and development of a regionally distributed humpback whale
database.
We are grateful to the Natal Sharks Board, the Wildlife Conservation Society, The Department of
Environmental Affairs and Tourism and the Whale Unit of Pretoria University’s Mammal Research

30
Institute for loan of equipment and Mr Bennet of St Lucia for collecting photo identification samples at his
own time and expense.
31
LITERATURE CITED
Angot, M. 1951. Rapport Scientifique Sur Le Expeditions Baleineres Autour de Madagascar. (Saisons
1949 et 1959) Mem. Inst. scient. Madagascar VI (2) : 439 - 486.
Baker, C. S. and Herman, L.M. 1987. Alternative population estimates of humpback whales (Megaptera
novaeangliae) in Hawaiian waters. Can. J. Zool. 65: 2818 - 21.
Baker, C. S., Herman, L. M., Perry, A., Lawton, W. S., Straley, J. M., Wolman, A. A., Kaufman, G. D.,
Winn, H. E., Hall, J. D., Reinke, J. M. and Ostman, J. 1986. Migratory movement and population structure
of humpback whales (Megaptera novaeangliae) in the central and eastern North Pacific. Mar. Ecol. Prog.
Ser. 31: 105 - 119.
Bannister, J. L., Kirkwood, G. P. and Wayte, S. E. 1991. Increase in humpback whales off Western
Australia. Rep. int. Whal. Commn, 41:461 - 5.
Bermond, M. 1950. Campagne balieniere dans les eaux de Madagascar (saison 1949). Cybium 5:31 - 47.
Best, P .B. and Ross, G. J. B. 1996. Whale observations from the Knysna Heads, 1903 – 1906. S. Afr. J.
Mar. Sci. 17:305 - 308.
Best, P. B., Findlay, K. P., Sekiguchi, K., Peddemors, V. M., Rakotonirina, B., Rossouw, A. and Gove, D.
1998. Winter distribution and possible migration routes of humpback whales Megaptera novaeangliae in
the southwest Indian Ocean. Mar. Ecol. Prog. Ser. 162:287 - 299.
Breiwick, J., Rugh, D., Withrow, D., Dahlheim, M. and Buckland, S. 1988. Preliminary population estimate
of gray whales during the 1987-88 southward migration. Document SC/40/PS12 submitted to the Scientific
Committee of the IWC. 21pp.
Brown, M. R., Corkeron, P. J., Hale, P. T., Schultz, K. W. and Bryden, M. M. 1995. Evidence for sex -
segregated migration in the humpback whale (Megaptera novaeangliae). Proc. Royal Soc. Lond. 259: 229 -
234.
Bryden, M. M. 1985. Studies of humpback whales (Megaptera novaeangliae), Area V. pp. 115-123 In Ling
J.K. and Bryden M.M. (eds) Studies of sea mammals in south latitudes. South Australian Museum,
Adelaide.

32
Bryden, M. M., Kirkwood, G. P. and Slade, R. W. 1990. Humpback whales, Area V. An increase in
numbers off Australia’s east coast. pp 271 - 276 In Kerry, K.R. and Hempel, G. (eds) Antarctic
Ecosystems. Ecological change and Conservation. Springer Verlag, Belgium.
Buckland, S.T., Breiwick, J.M., Cattanach, K.L. and Laake, J.L. 1993a. Estimated population size of the
California gray whale. Mar. Mamm. Sci. 9(3): 235-249.
Budker, P. and Collignon, J. 1952. Trois campagnes balienieres au gabon: 1949 - 1950 - 1951. Bull Inst.
Etud. centrafr. 3:75 - 100.
Chittleborough, R. G. 1965. Dynamics of two populations of the humpback whale, Megaptera
novaeangliae (Borowwski). Aust. J. mar. Freshw. Res. 16:33 - 128.
Clapham, P. J. and Mayo, C. A. 1990. Reproduction of humpback whales (Megaptera novaeangliae)
observed in the Gulf of Maine. Rep. int. Whal. Commn (special issue 12): 171 - 176.
Clapham, P.J., Robbins, J., Brown, M., Wade, P., and Findlay, K. 2001. A note on plausible rates of
population growth in humpback whales. J. Cetacean Res. Manage. 2 (Suppl)
Dawbin, W. H. 1966. The seasonal migratory cycle of humpback whales. pp. 145 - 170. In Norris, K.S.
(ed.) Whales, dolphins, and porpoises. University of California Press, Berkley.
Findlay, K. P. 1989. The distribution of cetaceans off the coast of South Africa and South West Africa /
Namibia. MSc PhD thesis submitted to the University of Pretoria, Pretoria, South Africa.
Findlay, K. P. 1994. The migrations of east coast humpback whales (Megaptera novaeangliae). PhD thesis
submitted to the University of Pretoria, Pretoria, South Africa.
Findlay, K. P. 2002. A review of humpback whale catches by modern whaling operations in the Southern
Hemisphere. Mem. Qld Mus. 47(2): 411 - 420.
Findlay, K. P. and Best, P. B. 1996a. Assessment of heterogeneity in sighting probabilities of humpback
whales in shore - based surveys at Cape Vidal, South Africa. Mar. Mamm. Sci. 12(3): 335 - 353.
Findlay, K. P. and Best, P. B. 1996b. Preliminary population estimates of humpback whales migrating past
Cape Vidal, South Africa, 1988 - 1991. Mar. Mamm. Sci. 12(3): 354 - 370.
Findlay, K. P., Best, P. B., Peddemors, V. M. and Gove, D. 1994. The distribution and abundance of
humpback whales on their Mozambique winter grounds. Rep. Int. whal. Comm 44: 311 - 320.

33
Glockner, D. A. 1983. Determining the sex of humpback whales (Megaptera novaeangliae) in their natural
environment. pp. 447 - 464. In Payne, R. (ed.) Communication and behavior of whales. AAAS Sel. Symp.
No 76, Westview Press, Boulder. 643 pp.
Gordon, J. C. D. 1990. A simple photographic technique for measuring whales at sea. Rep. int. Whal.
Commn 40: 581 - 588.
Harmer, S. F. 1929. History of whaling. Proc Linn. Soc. Lond. 140 (1927 - 28) : 51 - 59.
Harmer, S. F. 1931. Southern whaling. Proc Linn. Soc. Lond. Session 142, 1929 - 30, Pres. Add. : 85 - 163.
International Whaling Commission, 1998. Report of the Scientific Committee of the International Whaling
Commission, 1998.
Katona, S., Baxter, B., Kraus, B., Perkins, J. and Whitehead, H. 1979. Identification of humpback whales
by fluke photographs. pp. 33 - 44. In Winn, H.E. and Olla, B.L. (eds), Behaviour of marine animals, vol 3,
Plenum Press. New York.
Katona, S. K. and Whitehead, H. P. 1981. Identifying humpback whales using their natural markings.
Polar Rec. 20 (128): 439 - 444.
Katona, S. K. and Beard, J. A. 1990. Population size, migrations and feeding aggregations of the
Humpback Whale (Megaptera novaeangliae) in the western North Atlantic Ocean. Rep. int. Whal. Commn
(Special issue 12): 295 - 306.
Kellogg, R. 1929. What is known of the migrations of some of the whalebone whales. Rep. Smithson Inttn
1928 : 467 - 494.
Krogman, B., Rugh, D., Sonntag, R., Zeh, J. and Ko, D. 1989. Ice-based census of bowhead whales
migrating past Point Barrow, Alaska, 1978-83. Mar. Mamm. Sci. 5 (2) : 116-138.
Mackintosch N.A. 1942. The southern stocks of whalebone whales. Discovery Reports 22: 197-300.
Matthews, L. H. 1938. The humpback whale, Megaptera nodosa. Disc. Rep. 17 : 7 - 92.
Noad, M. J., Cato, D. H., Bryden, M. M., Jenner, M - N. and Jenner, K. S. 2000. Cultural revolution in
whale songs Nature, Lond. 408: 537.
Olsen, O. 1914. Hvaler og hvalangst i Sydafrika. Bergerns Mus. Arb. 1914 - 1915, 5 : 1 - 56.

34
Omura, H. 1953. Biological study on the humpback whales in the Antarctic areas IV and V. Sci. Rep. Whal.
Res. Inst., Tokyo. 8 : 81 - 101.
Omura H. 1973. A review of pelagic whaling operations in the Antarctic based on the effort and catch data
in 10° squares of latitude and longitude. Sci. Rep. Whal. Res. Inst., Tokyo 25: 105-203.
Paterson, R. 1991, The migrations of humpback whales, Megaptera novaeangliae, in east Australian
waters. Mem. Qd Mus. 30 (2): 333-341.
Paterson, R. and Paterson, P. 1984. A study of the past and present status of humpback whales in east
Australian waters. Biol. Conserv. 29:321-343.
Paterson, R. and Paterson, P. 1989. The status of the recovering stock of humpback whales Megaptera
novaeangliae in east Australian waters. Biol. Conserv. 47 :33-48.
Paterson, R., Paterson, P. and Cato, D.H. 1994. The status of humpback whales Megaptera novaeangliae in
east Australia thirty years after whaling. Biol. Conserv. 70:135-142.
Payne, R. and Guinee, L. 1983. Humpback whale (Megaptera novaeangliae) songs as an indicator of
stocks. pp. 333 - 358. In Payne, R. (ed.) Communication and behavior of whales. AAAS Selected
Symposium No 76, Westview Press, Boulder. 643 pp.
Payne, R. and McVay, S. 1971. Songs of humpback whales. Science N.Y. 173: 585 - 597.
Rayner, G. W. 1940. Whale marking : progress and results to December 1939. Disc. Rep. 19 : 245 - 284.
Reilly, S.B. 1984. Assessing gray whale abundance: a review. pp. 203-224. In Jones, M.L., Swartz, S. and
Leatherwood, S. (eds) The Gray Whale (Eschrichtius robustus). Academic Press, Orlando, Florida.
Reilly, S. B., Rice, D.W. and Wolman, A.A. 1980. Preliminary population estimate for the California gray
whale based upon Monterey shore censuses 1967/68 to 1978/79. Rep. int. Whal. Commn 30:359-368.
Reilly, S. B., Rice, D.W. and Wolman, A.A. 1983. Population assessment of the gray whale, Eschrichtius
robustus, from California shore censuses, 1967-80. Fish. Bull. U.S. 81:267-281.
Risting, S. 1912. Knolhvalen. Norsk FiskTid. 31 : 437 - 49. (Translation in Hinton, M .A. C. 1925. Report
on the papers left by the late Major Barrett - Hamilton, relating to the whales of South Georgia. Crown
Agents for the Colonies, London : 57 - 209).
Rorvik, C. J. 1980. Whales and whaling off Mozambique. Rep. int. Whal. Commn 30: 223 - 225.

35
Rosenbaum H.C. Walsh P.D., Razafindrakoto Y., Vely M. & DeSalle R. 1997. First description of a
humpback whale breeding ground in Baie d’Antogil, Madagascar. Conservation Biology. 11: 312-314.
Rugh, D. 1984. Census of gray whales at Unimak Pass, Alaska: November-December, 1977-79. pp. 225-
248. In Jones, M.L., Swartz, S. and Leatherwood, S. (eds) The Gray Whale (Eschrichtius robustus).
Academic Press, Orlando, Florida.
Rugh, D. and Braham, H.W. 1979. California gray whale Eschrichtius robustus Fall migration through
Unimak Pass, Alaska, 1977: a preliminary report. Rep. Int. Whal. Commn 29 :315-320.
Rugh, D.J., Ferrero, R.C. and Dahlheim, M.E. 1990. Inter-observer discrepancies in a shore-based census of
gray whales (Eschrichtius robustus). Mar Mamm. Sci. 6 (2):109-120.
Seber, G .A. F. 1982. The estimation of animal abundance. (Second edition). Macmillan Publishing Co.,
New York. i - xvii +654 pp.
Steiger, G. H. and Calambokidis, J. 2000. Reproductive rates of humpback whales off California. Mar.
Mamm. Sci. 16(1): 220 - 239.
Stone, G. S., Florez - Gonzalez, L., and Katona, S. 1990. Whale migration record. Nature, Lond. 346: 705.
Tonnessen, J.N. & A.O. Johnsen, 1982. The history of modern whaling. University of California Press,
Berkeley and Los Angeles.
Townsend, C. H. 1935. The distribution of certain whales as shown by logbook records of American
whaleships. Zoologica N.Y. 19:1 - 50.
Whitehead, H., Chu, K., Perkins, J., Bryant, P. and Nicols, G. 1983. Population size, stock identity, and
distribution of the humpback whale off West Greenland - summer 1981. Rep. int. Whal. Commn 33: 497 -
501.
Winn, H. E. and Reichley, N. 1985. Humpback whale - Megaptera novaeangliae. In Ridgeway, S.H. and
Harrison, R. (eds) Handbook of Marine Mammals. Vol 3. The Sirenians and Baleen Whales. Academic
Press, London 1985.
Winn, H. E., Thompson, T. J., Cummings, W. C., Hain, J. Hudnall, J. Hays, H. and Steiner W. W. 1981.
Song of the humpback whale - population comparisons. Behav. Ecol. Sociobiol. 8: 41 - 46.
Wray, P. and Martin, K. R. 1983. Historical whaling records from the Western Indian Ocean. Rep. int.
Whal. Commn (special issue 5): 213 - 241.

36
Yablokov, A. V. 1994. Validity of whaling data Nature, London 367 (6459):108.
Zeh, J.E., George, J.C., Raftery, A.E. and Carroll, G.M. 1991. Rates of increase 1978-1988 of bowhead
whales, Balaena mysticetus, estimated from ice-edge census data. Mar. Mamm. Sci. 7(2):105-122.
Zeh, J.E., Ko, D., Krogman, B.D. and Sonntag, R. 1986a. A multinomial model for estimating the size of a
whale population from incomplete census data. Biometrics 42:1-14.
Zeh, J.E., Ko, D., Krogman, B.D. and Sonntag, R. 1986b. Statistical considerations in estimating the
number of bowhead whales, Balaena mysticetus, from ice-based visual census data. Rep. int. Whal. Commn
36:317-323.
Zemsky, V. A., Mikhalev, Y. A. and Tormosov, D. D. 1977. Humpback whale catches by area by the
Soviet Antarctic Whaling Fleets. Rep Int. Whal. Commn. 47:151.
Copyright © 2022 FDOKUMEN