The mental speed—IQ relationship: unitary or modular
26
INTELLIGENCE 22, 23-48 (1996) The Mental Speed-IQ Relationship: Unitary or Modular? ALJOSCHA C. NEUBAUER University of Graz, Austria VALENTIN BUCIK University of Ljubljana, Slovenia In his “specificity of mind” view, Ceci (1990a) asserted that mental speed-IQ relation- ships are only due to their sharing of a common knowledge base. According to the con- trasting “singularity of mind” view. the mental speed-IQ correlation should reflect general intelligence. We tested these two views by letting 120 participants perform a battery of paper-and-pencil elementary cognitive tests (ECTs): a modified version of Lind- ley’s Coding Test and two newly developed paper-and-pencil tests following the rationales of the Stemberg and the Posner paradigms. Three versions of each of these ECTs involv- ing different knowledge bases (verbal, numerical. and figural) were devised. Intelligence tests employed were Raven’s Advanced Progressive Matrices and the Berlin model of Intelligence Structure (BIS). In the bimodal BIS, three content-based components (verbal, numerical. figural), four operational components (processing speed, memory, creativity, processing capacity), and a general factor are operationalized. We obtained three main results: First. as expected, high speed of information processing in ECTs is related to high psychometric intelligence. Second, there is only weak evidence for ECT-intelligence correlations with the same content to be largest, which rather supports the singularity of mind view. Third, regarding the operational components in the BIS, mental speed in ECTs correlates most highly with the processing speed component. followed by the processing capacity component. Less prominent but still significant correlations resulted for the memory and creativity components. After about 1.5 years of research, there is an impressive body of evidence sug- gesting a moderate but significant relationship between psychometric intel- ligence and the speed of execution of elemental cognitive processes; that is, more intelligent participants display a higher speed of information processing (SIP) in a variety of so-called elementary cognitive tasks (ECTs; see Vernon, 1987, and This study was partially supported by the Slovenian Ministry of Science and Technology (Project No. 35-6261-058 l-95). by a fellowship granted to the second author by the Rector’s conference of the ARGE Alps-Adria, and by the help of the Austrian Institute for Eastern and Southern Europe. We wish to thank Petra Eppich, Gerda Klopf, and Elsbeth Sitzwohl for their help in preparing the paper- and-pencil ECTs and for administering the tests. Correspondence and requests for reprints should be sent to Aljoscha Neubauer, University of Graz, Department of Psychology, Universitatsplatz 2, A-8010 Graz, Austria. 23
Transcript of The mental speed—IQ relationship: unitary or modular
INTELLIGENCE 22, 23-48 (1996)
The Mental Speed-IQ Relationship: Unitary or Modular?
ALJOSCHA C. NEUBAUER
University of Graz, Austria
VALENTIN BUCIK
University of Ljubljana, Slovenia
In his “specificity of mind” view, Ceci (1990a) asserted that mental speed-IQ relation-
ships are only due to their sharing of a common knowledge base. According to the con-
trasting “singularity of mind” view. the mental speed-IQ correlation should reflect
general intelligence. We tested these two views by letting 120 participants perform a
battery of paper-and-pencil elementary cognitive tests (ECTs): a modified version of Lind-
ley’s Coding Test and two newly developed paper-and-pencil tests following the rationales
of the Stemberg and the Posner paradigms. Three versions of each of these ECTs involv-
ing different knowledge bases (verbal, numerical. and figural) were devised. Intelligence
tests employed were Raven’s Advanced Progressive Matrices and the Berlin model of
Intelligence Structure (BIS). In the bimodal BIS, three content-based components (verbal,
numerical. figural), four operational components (processing speed, memory, creativity,
processing capacity), and a general factor are operationalized. We obtained three main
results: First. as expected, high speed of information processing in ECTs is related to high
psychometric intelligence. Second, there is only weak evidence for ECT-intelligence
correlations with the same content to be largest, which rather supports the singularity of
mind view. Third, regarding the operational components in the BIS, mental speed in ECTs
correlates most highly with the processing speed component. followed by the processing
capacity component. Less prominent but still significant correlations resulted for the
memory and creativity components.
After about 1.5 years of research, there is an impressive body of evidence sug- gesting a moderate but significant relationship between psychometric intel- ligence and the speed of execution of elemental cognitive processes; that is, more intelligent participants display a higher speed of information processing (SIP) in a variety of so-called elementary cognitive tasks (ECTs; see Vernon, 1987, and
This study was partially supported by the Slovenian Ministry of Science and Technology (Project
No. 35-6261-058 l-95). by a fellowship granted to the second author by the Rector’s conference of the ARGE Alps-Adria, and by the help of the Austrian Institute for Eastern and Southern Europe. We
wish to thank Petra Eppich, Gerda Klopf, and Elsbeth Sitzwohl for their help in preparing the paper-
and-pencil ECTs and for administering the tests.
Correspondence and requests for reprints should be sent to Aljoscha Neubauer, University of
Graz, Department of Psychology, Universitatsplatz 2, A-8010 Graz, Austria.
23

24 NEUBAUERANDBUCIK
Neubauer, 1993, for reviews). The proponents of this “mental speed’ approach assume SIP to be the basis of individual differences in general intelligence or R (in Spearman’s sense, 1927); that is, mental speed as a latent trait should be located at the apex of the hierarchical system of intellectual abilities (Jensen, 1992; in the following, this view is termed the g hypothesis of the mental speed approach). In this hypothesis, mental speed or SIP is viewed as the expression of an inherited feature of the central nervous system, which should also be responsi- ble for the positive manifold; that is, the fact that even batteries of diverse intel- ligence tests always display positive intercorrelations (Jensen, 1986).
This view of the mental speed-IQ relationship was termed the “singularity of mind” view by Ceci ( 1990a, 1990b) when he proposed his contrasting “specific- ity of mind” view. Ceci stated that relationships between microlevel measures of processing efficiency (i.e., ECTs) and macrolevel measures of intelligence are only due to the-acquired and not inherited-sharing of a common knowledge base. On the basis of research evidence reviewed in Ceci (1990b), he concluded that “it is not unreasonable to suspect that the speed-of-information-processing- IQ correlation is due to individual differences in familiarity with written letters, numbers, and words and correlated differences in identifying them” (p. 169). Following this view, a verbal ECT should correlate only with verbal intelligence, and the same should be true for numerical or visuospatial contents.
What does the available research evidence tell us about these two contrasting views? First, several authors have reported empirical evidence in support of the singularity of mind view (i.e., the g hypothesis). Hemmelgarn and Kehle (1984) were the first to report a significant correlation of - .80 between the g loadings of the Wechsler Intelligence Scale for Children (WISC) subtests and their correla- tions with the RT slope in the Hick paradigm; that is, the higher the g loading of a WISC subtest, the higher its (the subtest’s) negative correlation with the SIP measure from the Hick paradigm. Similar results were reported by Larson, Mer- ritt, and Williams (1988) and by Smith and Stanley (1987). Vernon (1989) sup- plied additional evidence not only by calculating the g loadings of psychometric intelligence tests (IQg) but also from the battery of ECTs he employed (ECTg). The correlations between IQg and ECTg ranged from -.26 to - .67 in five different samples. Therefore, all these studies provided evidence in favor of the singularity of mind view (contradictory evidence comes from only one study by Ruchalla, Schalt, & Vogel, 1985).
However, none of these studies was specifically designed to test Ceci’s speci- ficity of mind view. A first attempt in this direction was reported by Lindley, Bathurst, Smith, and Wilson (1993). In a sample of 102 students, they adminis- tered two paper-and-pencil tests for mental speed, designed to measure the speed ’ of coding alphanumerics and visual forms (which should involve different knowledge bases), and correlated them with psychometric tests for verbal intel- ligence and for abstract reasoning. In contradiction to Ceci’s specificity of mind view, both coding tests were not uncorrelated, they displayed similar correlations

MENTAL SPEED AND IQ 25
with both IQ tests, and there was no evidence for content-specific ECT-intel- ligence correlations (i.e., the correlation of the verbal coding test with verbal intelligence was not higher than the other ECT-intelligence correlations).
However, as Lindley et al. did not employ a test for visuospatial intelligence (which would correspond to the visual forms coding test), their study was an incomplete test of Ceci’s hypothesis of content-specific ECT-intelligence rela- tionships. A more thorough test can be found already in a study by Levine, Preddy, and Thorndike (1987). When correlating scores for verbal, numerical, and visuospatial abilities from the Cognitive Abilities Test (CogAT) with verbal, numerical, and spatial ECTs, the content-specific correlations were higher (.28) than ECT-intelligence correlations involving different contents (.22, calculated from Levine et al.‘s table on p. 606) but the difference was rather small.
One objective of our study was to test the two contrasting views of the mental speed-IQ relationship, the singularity versus specificity of mind views. In order to test the specificity of mental speed-intelligence correlations, we based our study on a recent structural model of intelligence, the so-called Berlin model of Intelligence Structure (BIS; Jaeger, 1982, 1984), which includes three content- based components (verbal, numerical, and figural). In addition to these content- based components, the hierarchical and bimodal BIS assumes four operational components: processing speed, memory, creativity, and processing capacity. Fi- nally, a score for general intelligence can be calculated on the basis of all BIS subtests (a more detailed outline of the BIS is given in the Method section). The operational components are considered especially interesting with respect to the second major question of our study: Is mental speed in ECTs primarily (or maybe exclusively) associated with the operational component processing speed in the BIS? If so, mental speed could be viewed “only” as a broad ability factor beneath the other operational components in the BIS. Or does mental speed in ECTs also display significant (and maybe similar) correlations with the other operational components of memory, creativity, and processing capacity? This would support the R hypothesis of the mental speed approach; that is, SIP plays an important role for all broad abilities located below the apex of the intelligence structure (i.e., general intelligence). Empirical evidence on relations between BIS opera- tions and SIP comes from only two studies. Hussy (1990) observed that mental speed in ECTs is related to processing speed in the BIS, but he did not investigate the other three operational components. This information can be obtained from a study by Beauducel and Brocke (1993): In a sample of 73 participants, parame- ters from the Hick paradigm (median reaction time and intraindividual vari- ability) correlated significantly with the operational components processing speed, processing capacity, and memory of the BIS; solely the creativity compo- nent was not associated with SIP.
In our study we not only investigate the replicability of Beauducel and Brocke’s important first findings, but in addition we also try to assess its general- izability when using a more comprehensive battery of ECTs.
26 NEUBAUER AND BUCIK
METHOD
Participants Participants were recruited via an advertisement in a local newspaper, in which they were offered the opportunity to receive information about their IQ and their strengths and weaknesses concerning specific intellectual abilities. Out of a larg- er pool of 182 participants tested with the BIS, a subsample of 120 participants was also tested with the battery of ECTs. The results presented here are based on this sample of 64 men and 56 women who ranged in age from 18 to 53 years (M = 28.33, SD = 7.94).
Intelligence Tests
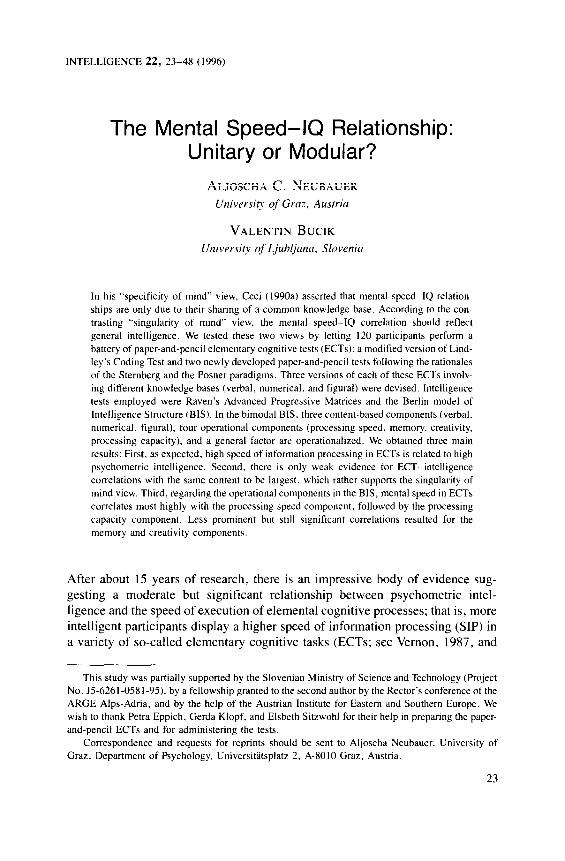
Berlin Model of Intelligence Structure (BZS). The BIS is a bimodal hier- archical model for describing broad intellectual abilities in the framework of four operational components (B = Bearbeitungsgeschwindigkeit or processing speed; M = Merkfiihigkeit or memory; E = Einfallsreichtum or creativity, K = Ver-
arbeitungskapazitiit or processing capacity) and three content-based components (F = figural, V = verbal, N = numerical; see Figure 1). In the 12 cells resulting from the combination of four operational and three content-based components are the bimodally determined performances (e.g., a participant’s memory ability for figural material is assumed to be determined by both memory ability and figural ability). For testing the participants’ abilities according to the BIS, the most recent BIS-4 test was used.’ This test includes a total of 45 subtests. Each combination of the operations processing speed (B) and memory (M) with the three content-based components is measured by means of three subtests (i.e., 2 X 3 X 3 = 18 subtests); for the measurement of creativity (E) there are four subtests for each content-based component, (i.e., 4 X 3 = 12 subtests); and processing capacity (K) is assessed by means of five subtests for each content- based component (i.e., 5 X 3 = 15 subtests). The operational and content-based components are described as follows:
Processing speed (Bearbeitungsgeschwindigkeit; B): Working speed, ease of perception, and concentration capacity, which are decisive in solving simple tasks of low difficulty levels. Memory (Merkfiihigkeit; M): Active storage into short- or middle-term mem- ory and recognition or reproduction of verbal, numerical, and figural mate- rial. Creativity (Einfallsreichtum; E): Fluid, flexible, and original production of ideas, requiring the availability of diverse information, wealth of imagina-
‘Thanks are due to A.O. Jaeger and A. Beauducel for the permission to use the BIS in our study
and to W. Hussy for providing us with the BIS-4 test materials.
MENTAL SPEED AND IQ 27
I, I,
g
general intelligence
Numerical N ;,,~” \,: K Processing capacity
/ Figure 1. The Berlin model of Intelligence Structure (BIS).
speed
tion, and ability to see many different sides, variations, reasons, and possi- bilities in problem-oriented (not purely imaginative) solutions. Processing capacity (Verubeitungskupuzitiit; K): The processing of complex information in tasks that are not immediately solvable, but rather require the subject to establish diverse relations and use exact formal-logical reasoning about relevant problem-solving information. Verbal ability (V): Language-based thinking; it plays a role in all groups of tasks in different operations that are linked to language. Numerical ability (N): Number-based thinking; it plays a role in all groups of tasks in different operations that are linked to numerical material. Figurul ability (F): Visually based thinking; the ability to understand clearly relations and plasticity in figural material, forms, shapes, patterns in tasks, pertaining to different operations.
Raven’s Advanced Progressive Matrices. As the BIS is rather unknown out- side German-language countries and as we wanted to ensure comparability of our results with the vast majority of studies in mental speed research, we decided to also include a well-known psychometric intelligence test, which has frequently

28 NEUBAUER AND BUCIK
been used in this field of research: Raven’s Advanced Progressive Matrices
(APM; Raven, 1958).2
Elementary Cognitive Tests In order to allow an economical administration of the ECTs in groups, we sought to develop paper-and-pencil versions of the ECTs. The development of our ECT battery was guided by Wittmann’s principles of symmetry and aggregation, ac- cording to which the tests on the predictor and on the criterion side should be as symmetrical and balanced as possible, to allow a “fair” assessment of multiple relationships (Wittmann, 1987). To be as symmetrical as possible with respect to the BIS, the ECT battery should, first, include tests for measuring the speed of the three different elementary cognitive processes, which according to Jensen’s (1982) mental speed model, should determine the quality of problem solving in complex tasks: speed of encoding, speed of access to short-term memory, and speed of retrieval from long-term memory. Second, the ECT battery should allow the measurement of these elementary cognitive processes in three content do- mains: verbal, numerical, and figural.
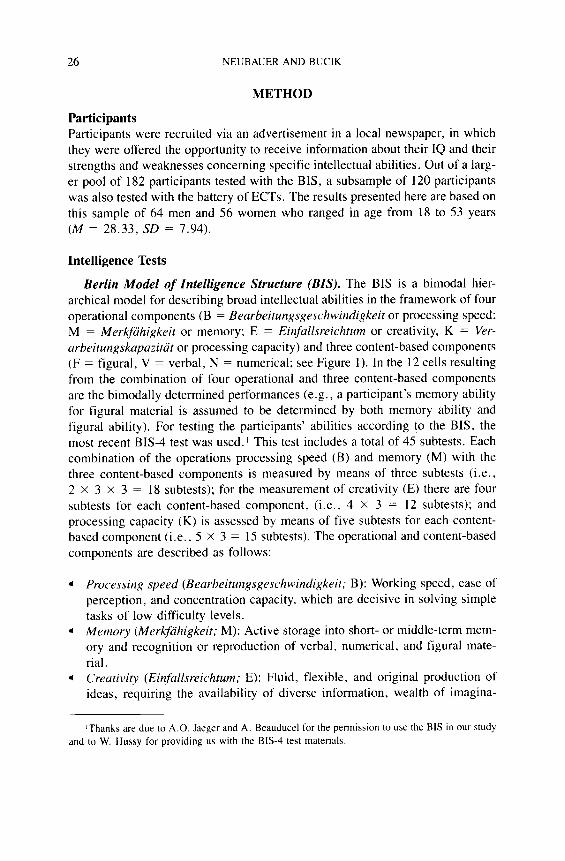
Coding Test. In order to include an established paper-and-pencil test for men- tal speed in the battery, we decided to adapt the Coding test by Lindley, Smith, and Thomas (1988) by developing three test forms involving verbal materials (letters), numerical materials (digits), and figural materials (circle segments). The verbal and numerical versions are similar to the original by Lindley et al. The participant is given rows of stimuli to work on in three conditions: (a) COPY, or write the items as given (D for D, 6 for 6); (b) CODE FORward, or write the next letter or number in the series instead of the printed item (G for F, 8 for 7); and (c) CODE BACKward, or write the preceding letter or number in the series instead of the printed item (B for C, 2 for 3). For the figural version of the Coding test, series of circle segments of different sizes were used as materials (see Figure 2). The participants’ task was either to copy the circle segment (COPY), to enlarge the circle segment in a clockwise direction (in steps of 45”; CODE FOR) or to reduce the circle segment in a counterclockwise direction (also in steps of 45”; CODE BACK). In order to avoid too many motor compo- nents in this task, the participants only had to draw one line to show the bounds of the circle segment.
In each of the three Coding tests (verbal, numerical, figural), participants were given one row of 10 items as practice and two pages with seven rows of IO
‘Raven’s APM were given with a IO-min time-limit for Set I and a 20.min time-limit for Set II
(instead of the original 40.min limitation). Frearson and Eysenck (1986) reported unpublished studies
by H.J. Eysenck and J.C. Raven, which showed that 20- and 40.min procedures are correlated quite
highly (around 0.95). demonstrating that time limitations have little influence on relative standing in
the APM.

MENTAL SPEED AND IQ 29
Figure 2. Sample items of the figural Coding test
items (instructions stressed speed and accuracy). The time limits per page were 20 s, 30 s, and 40 s for the numerical, verbal, and figural materials, respectively (the usefulness of these time limits was determined in a pilot study). The depen- dent variable was the number of correct items within the time limit for each condition (COPY, CODE FOR, CODE BACK) and each material, aggregated over both repeated presentations of each condition. The scores of the first and second presentation of each condition served for the computation of split-half reliabilities.
Sternberg Test. In order to assess the speed of access to short-term memory we devised a paper-and-pencil test following the rationale of the Sternberg para- digm (Sternberg, 1966). For this purpose we adapted the classical Sternberg experiment in the following way: By means of a slide projector the participants were presented with memory sets of letters, digits, or simple geometrical figures. Three set sizes of one, three, or five elements were used, which were presented successively (i.e., one element was shown on each slide for a period of 1 s). Immediately after presentation of the last element of the memory set, a warning tone (from the PC that controlled the slide changes of the projector) was given as a signal for the participants to start working on a row of 30 elements listed on a sheet of paper. For each element in the row, the participant had to indicate if it was a member of the previously shown memory set by marking either a “yes” or “no” (again, instructions stressed speed and accuracy). In each condition half of the required responses were positive and half were negative. The time limit for each row was 20 s. This procedure was given two times for each set size and each material (to allow computation of split-half reliabilities). The dependent variable was the number of items answered correctly within the time limit, aggregated over both presentations of each condition. In each version (verbal, numerical, figural) the participants performed on one row or 30 elements with a set size of four elements as a practice.
For each variant of the Sternberg test, 10 different stimuli were used: the uppercase letters A, D, F, H, N, R, T, X, U, Z in the verbal Sternberg test; the digits from 0 to 9 in the numerical test; and 10 simple geometrical figures for the figural version (square, rectangle, circle, ellipse, half-circle, equilateral tri- angle, right-angled triangle, trapezoid, diamond, pentagon).
Following the rationale of the Sternberg paradigm, the slope of the regression of reaction times (RTs) onto the number of elements in short-term memory

30 NEUBAUERANDBUCIK
(STM) should give the time for STM access (i.e., the duration of time needed for retrieving a single element from STM and comparing this element with the key stimulus). Our paper-and-pencil variant of the Stemberg test, however, does not provide RTs. Therefore it was necessary to compute mean RTs for each set size by dividing the time limit (20 s) by the number of correctly solved items. These mean RTs (for set sizes 1, 3, and 5) were used as dependent variables in calculat- ing a linear regression for each subject. This procedure was performed separately for each version (verbal, numerical, figural), providing three slope and three intercept parameters for each participant.
Posner Test. For assessing the speed of retrieval from long-term memory (LTM) we developed a paper-and-pencil variant of the Posner paradigm (Posner 6t Mitchell, 1967). For each version (verbal, numerical, figural) of this paper- and-pencil Posner test, participants were given two pages of four rows with 16 items (i.e., a total of 128 items) with a time limit of 25 s per page. Each item was composed of two stimuli that were either physically the same, semantically the same, or physically and semantically different. The following stimuli were used: uppercase and lowercase letters A/a and B/b in the verbal test; the arabic and roman numerals 5/V and 9/1X; and two different kinds of symbols for the sexes ( t and d for male and Q and t for female). Each test version (verbal, numer- ical, figural) with 128 items was given twice: In the first condition the partici- pants judged the Physical Identity (PI) of the two stimuli (i.e., had to respond “yes” to items of the type “a a” or “V V” or “ QQ ” and “no” to all other items). In the Name Identity (NI) test the subjects were instructed to indicate the semantic identity of the two stimuli; that is, stimulus pairs like “B b” or “IX 9” and “ at ” had to be responded to by “yes;” the opposite response (“no”) was required to semantically different stimulus pairs (like “a B,” “V IX,” or “Qa”). Scores from the two test halves (presented on two different pages) served to allow the computation of split-half reliabilities. The dependent variable was the number of correctly solved items aggregated over both test halves. According to Hunt (1980), the time needed in the PI condition should reflect only the process of visual discrimination, whereas the NI condition requires an additional retriev- al of codes (letters, numbers, figural stimuli) from LTM. Therefore, the differ- ence of scores from these two conditions should reflect the time needed for LTM retrieval. In the usual RT version of the Posner paradigm, the mean RT in the PI condition is subtracted from the mean RT in the NI condition. As we obtained numbers of correctly solved items we had to reverse this difference score; that is, PI - NI. Therefore, a large difference score means that participants solved con- siderably fewer items correctly in the NI condition as compared to the PI condi- tion, indicating a slow LTM access.
p1 ocedure The psychometric intelligence tests and paper-and-pencil ECTs were presented in small groups. Each participant attended two test sessions on different days with

MENTAL SPEED AND IQ 31
an average time lag of 1 week. In the first test session (which took about 90 min) the ECT battery and-after a break of 10 min-the APM were presented. The order of presentation of the three paper-and-pencil ECTs (Coding test, Sternberg test, Posner test) was varied according to a Latin square. Within each ECT the order of the verbal, numerical, and figural variants was also varied following a Latin square. In the second session, the BIS-4 test was administered, which took 3 hours. After participation in both test sessions, the participants were offered the possibility to get descriptive information on their performance in the tests admin- istered.
Statistical Analysis In a first step, we calculated descriptive statistics of all psychometric test vari- ables (intelligence tests and ECTs). As the ECTs were newly developed (or adapted in the case of the Coding test), the reliabilities of their scores were determined by means of the split-half method. For this purpose, each ECT was designed to give scores for two test halves, both involving a presentation of items with the same time limit (see the earlier description of ECTs). The scores from the two test halves were correlated and reliabilities were estimated by means of the Spearman-Brown formula. To determine how many factors underlie perfor- mance in ECTs, we analyzed the intercorrelations of ECT variables by means of a principal components analysis (PCA). Factor scores extracted from this PCA were then correlated with scores from the psychometric intelligence tests. Re- sponses to the two main questions of our study were sought by constructing linear structural models, which were analyzed with respect to their fit to the data by means of the LISREL 8 program (Joreskog & S&born, 1993).
RESULTS
Descriptive Statistics The scores from Raven’s APM (sum of Set I and 11) were normally distributed with a mean of 3 1.83 (SD = 4.66). Following the procedure suggested by Jaeger ( 1984), the scores for the BIS-4 test were computed by means of aggregating normalized z scores: First, for each of the 45 subtests, z scores were calculated. Subsequently a mean z score for each of the 12 cells in the BIS (cf. Figure 1) is computed by averaging the z scores of all subtests in the corresponding cell. Then, mean z scores for each operational component and each content-based component are calculated by averaging the aggregated z scores from the corre- sponding row or column in the BIS (e.g., the z score for BIS-verbal is computed by averaging the z scores from the cells BIS-B-verbal, BIS-M-verbal, BIS-E-ver- bal, and BIS-K-verbal). Finally, a score for general intelligence (BIS-AI) is ob- tained by averaging z scores from all 12 cells in the BIS. The distribution of this score as well as all component scores and all scores for the 12 cells of the BIS did not depart significantly from normality. Due to the procedure of obtaining aggre- gated scores via z transformation, all aggregated BIS variables have a mean of 0

32 NEUBAUERANDBUCIK
(SDS = .49-.80; as the size of these depends largely on the degree of aggrega- tion we do not consider it sensible to report these values here).
Descriptive statistics of all ECT variables are shown in Table 1. Generally, the means conform to the expectation that more complex conditions result in lower numbers of correctly solved items. This is true for all three tests: In the Coding test, COPY gives the highest values and CODE BACK the lowest (although the difference between CODE FOR and CODE BACK is rather small in the numeri- cal and figural versions). In the Stemberg test, the number of correct items de- creases with increasing set size; in the sequel the mean squared correlation between set size and mean RT (i.e., the fit) gives high values around 90% for all three versions. Finally, in the Posner test, the PI instruction leads to more cor- rectly solved items per time than the NI condition, giving positive values for the difference measure (PI -NH.
The error rates were generally low (below 2%), with only two exceptions, both for the figural version of the Stemberg test. Here, the set size of three elements gave a mean of 3.7% errors, and in the set size of five elements the participants committed on average 7.1% errors (which is probably due to the fact that the memory span is lower for figural material than for letters and digits).
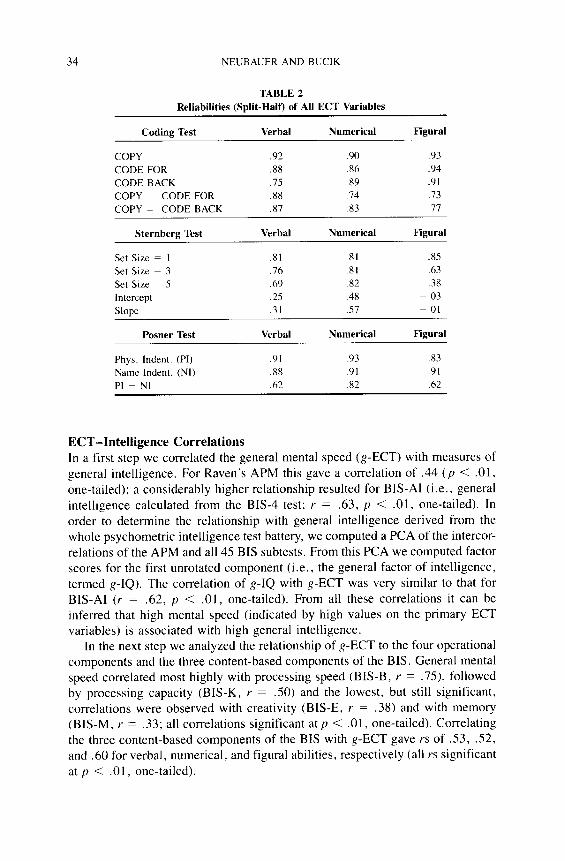
Reliabilities Two conclusions can be drawn from the split-half reliabilities of all ECT vari- ables (Table 2). First, the primary ECT variables (i.e., the number of correctly solved items) of all tests and test versions proved sufficiently reliable; rather low reliabilities were found only for some variables of the Sternberg test (in particular the figural version). Second, the derived measures (i.e., difference scores or intercepts and slopes in the Sternberg paradigm) are-with the exception of the difference measures in the Coding test-generally of poor psychometric quality. This is especially true for the intercept and slope variables from the Stemberg test, but the reliability of two of the three PI - NI measures must also be consid- ered unsatisfactory.
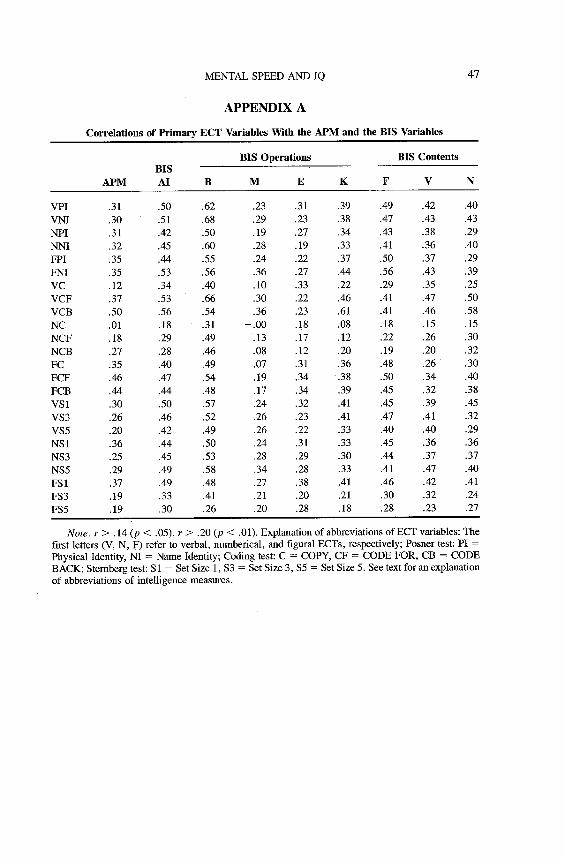
Presumably as a consequence of these low reliabilities, the derived ECT mea- sures displayed mostly low and nonsignificant zero-order correlations with the psychometric intelligence tests (APM and BIS) and the BIS components (this was also true for the difference measures in the Coding test, although these were somewhat more reliable). For the remaining statistical analyses we decided, there- fore, to concentrate on the primary ECT measures that, for the most part, displayed significant relationships with the intelligence variables (see Appendix A).
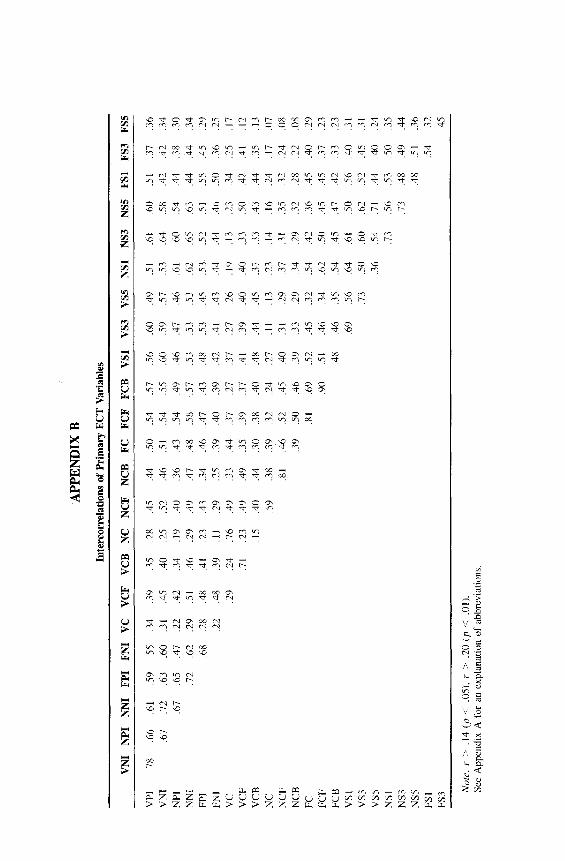
Intercorrelations of ECT Variables To determine how many factors underlie performance in ECTs, we analyzed the intercorrelations of ECT variables (see Appendix B) by means of a PCA. Due to the high level of intercorrelations, the PCA displayed a strong first factor (46.7% of variance, eigenvalue = 11.2). On the basis of the scree test we decided to extract only one factor (Factors 2, 3, and 4 had eigenvalues of 2.17, 1.39, and

MENTAL SPEED AND IQ 33
TABLE 1
Means and SDS (in Parentheses) of All ECT Variables
Coding Test Verbal Numerical Figural
COPY
CODE FOR
CODE BACK
COPY - CODE FOR
COPY - CODE BACK
109.6
(14.5)
40.2
(10.X)
24.8
(7.8)
69.4
(15.4)
84.8
(14.8)
83.2
(11.9)
63.5
(8.1)
60.4
(8.5)
19.7
(9.7)
22.8
(11.7)
102.1
(17.3)
80.2
(14.3)
78.9
(13.2)
21.9
(10.4)
23.2
(12.5)
Sternberg Test Verbal Numerical Fieural
Set Size = I
Set Size = 3
Set Size = 5
Intercept
Slope
Fit
45.8
(8.8)
33.6
(8.6)
24.3
(6.5)
338 ms
(122 ms)
107 mb
(52 ms)
91 4
(12 c/c)
46.3
(9.2)
35.2
(8.7)
25.6
(7. I)
340 ms
(126 ms)
99 ms
(53 ms)
92 ?‘c
(IO %,)
41.3
(10.3)
18.5
(5.7)
13.2
(4.4)
249 ms
(298 ms)
297 ms
(164 ms)
88 8
(15 %‘c)
Posner Test Verbal Numerical Figural
Phya. Indent. (PI) 88.3 84.5 75 .o (15.7) (17.6) (14.9)
Name Indent. (NI) 72.6 61.0 43.0 (12.3) (10.3) (10.1)
PI - NI 15.7 23.5 32.0
(9.7) (13.1) (10.9)
Note. Unless otherwise stated. the unit of measurement is the number of correctly solved items.
1.24, respectively, and accounted for only small amounts of the variance: 9.1%, 5.8%, 5.2%). After extracting the first unrotated component (we termed it the general factor of ECT performance = g-ECT), factor scores were computed and subsequently correlated with psychometric intelligence.
34 NEUBAUER AND BUCIK
TABLE 2 Reliabilities &%-Half) of All ECT Variables
Coding Test Verbal Numerical Figural
COPY
CODE FOR
CODE BACK
COPY ~ CODE FOR COPY - CODE BACK
.92 .90 .93
.88 .86 .94
.75 .89 .91
.X8 .I4 .73
.87 .83 .71
Sternberg Test Verbal Numerical Figural
Set Size = I Set Size = 3
Set Size = 5
Intercept
Slope
Power Test
Phys. Indent. (PI) Name Indent. (NI) PI - NI
.81 .81 .85
.76 .81 .63
.69 .82 .38
.25 .48 -.03
.31 .57 p.01
Verbal Numerical Figural
.91 .93 .83
.88 .91 .91
.62 .82 .62
ECT-Intelligence Correlations In a first step we correlated the general mental speed (g-ECT) with measures of general intelligence. For Raven’s APM this gave a correlation of .44 (p < .Ol, one-tailed); a considerably higher relationship resulted for BIS-AI (i.e., general intelligence calculated from the BIS-4 test; Y = .63, p < .Ol, one-tailed). In order to determine the relationship with general intelligence derived from the whole psychometric intelligence test battery, we computed a PCA of the intercor- relations of the APM and all 45 BIS subtests. From this PCA we computed factor scores for the first unrotated component (i.e., the general factor of intelligence, termed K-IQ). The correlation of g-IQ with J+ECT was very similar to that for BIS-AI (I. = .62, p < .Ol, one-tailed). From all these correlations it can be inferred that high mental speed (indicated by high values on the primary ECT variables) is associated with high general intelligence.
In the next step we analyzed the relationship of g-ECT to the four operational components and the three content-based components of the BIS. General mental speed correlated most highly with processing speed (BIS-B, r = .75), followed by processing capacity (BIS-K, r = .50) and the lowest, but still significant, correlations were observed with creativity (BIS-E, r = .38) and with memory (BIS-M, r = .33; all correlations significant at p < .Ol , one-tailed). Correlating the three content-based components of the BIS with g-ECT gave rs of .53, .52, and .60 for verbal, numerical, and figural abilities, respectively (all rs significant at p < .Ol , one-tailed).
MENTAL SPEED AND IQ 35
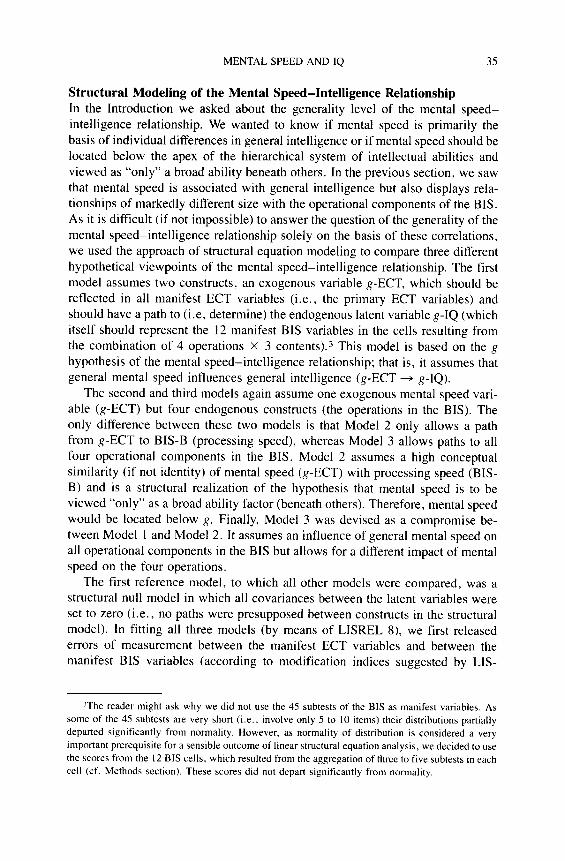
Structural Modeling of the Mental Speed-Intelligence Relationship In the Introduction we asked about the generality level of the mental speed- intelligence relationship. We wanted to know if mental speed is primarily the basis of individual differences in general intelligence or if mental speed should be located below the apex of the hierarchical system of intellectual abilities and viewed as “only” a broad ability beneath others. In the previous section, we saw that mental speed is associated with general intelligence but also displays rela- tionships of markedly different size with the operational components of the BIS. As it is difficult (if not impossible) to answer the question of the generality of the mental speed-intelligence relationship solely on the basis of these correlations, we used the approach of structural equation modeling to compare three different hypothetical viewpoints of the mental speed-intelligence relationship. The first model assumes two constructs, an exogenous variable g-ECT, which should be reflected in all manifest ECT variables (i.e., the primary ECT variables) and should have a path to (i.e, determine) the endogenous latent variable g-IQ (which itself should represent the 12 manifest BIS variables in the cells resulting from the combination of 4 operations X 3 contents).3 This model is based on the g hypothesis of the mental speed-intelligence relationship; that is, it assumes that general mental speed influences general intelligence (g-ECT -+ g-IQ).
The second and third models again assume one exogenous mental speed vari- able (g-ECT) but four endogenous constructs (the operations in the BIS). The only difference between these two models is that Model 2 only allows a path from g-ECT to BIS-B (processing speed), whereas Model 3 allows paths to all four operational components in the BIS. Model 2 assumes a high conceptual similarity (if not identity) of mental speed (g-ECT) with processing speed (BIS- B) and is a structural realization of the hypothesis that mental speed is to be viewed “only” as a broad ability factor (beneath others). Therefore, mental speed would be located below g. Finally, Model 3 was devised as a compromise be- tween Model 1 and Model 2. It assumes an influence of general mental speed on all operational components in the BIS but allows for a different impact of mental speed on the four operations.
The first reference model, to which all other models were compared, was a structural null model in which all covariances between the latent variables were set to zero (i.e., no paths were presupposed between constructs in the structural model). In fitting all three models (by means of LISREL 8), we first released errors of measurement between the manifest ECT variables and between the manifest BIS variables (according to modification indices suggested by LIS-
ZThe reader might ask why we did not use the 45 subtests of the BIS as manifest variables. As
some of the 45 subtests are very short (i.e., involve only 5 to 10 items) their distributions partially
departed significantly from normality. However, as normality of distribution is considered a very
important prerequisite for a sensible outcome of linear structural equation analysis, we decided to use
the scores from the 12 BIS cells, which resulted from the aggregation of three to five subtests in each cell (cf. Methods section). These scores did not depart significantly from normality.

36 NEUBAUER AND BUCIK
REL). Moreover, in Models 2 and 3 the residuals of the four endogenous latent variables (i.e., the operations) were allowed to correlate (as suggested by mod- ification indices).
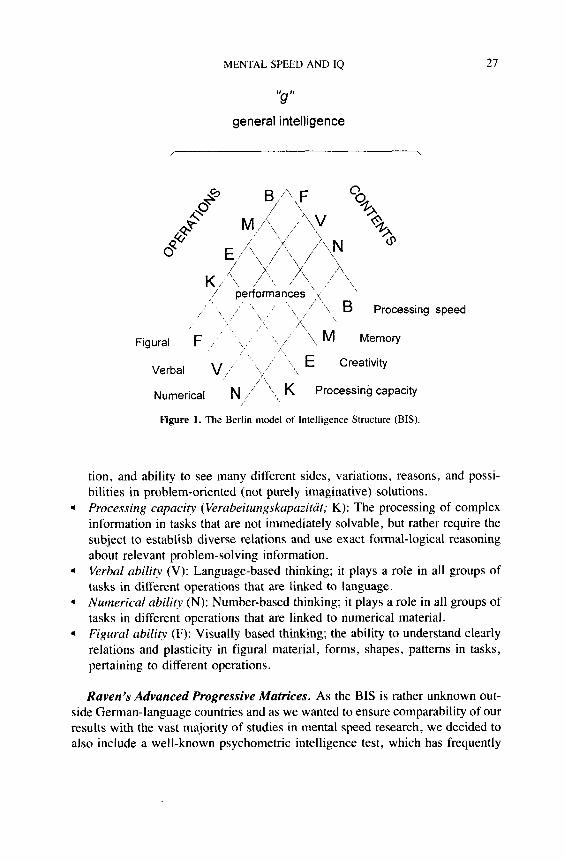
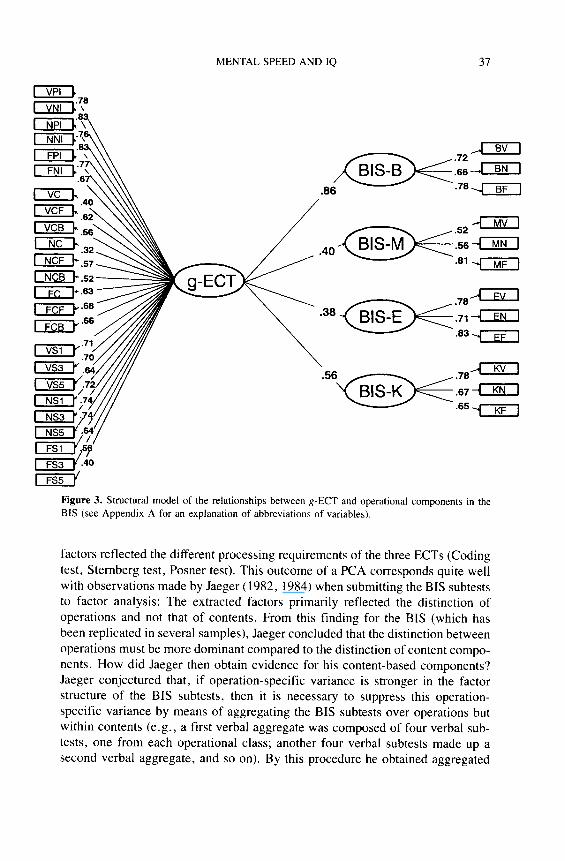
The models were evaluated using the chi-square test associated with maxi- mum likelihood estimation of parameters. These chi-square values are usually evaluated in relation to their corresponding degrees of freedom. The lower the chi-squareidfratio the better the model fit, with ratios below 2 indicating a satis- factory model fit and ratios below 1 indicating a very good model fit. Table 3 shows that Model 1 (g-ECT -+ g-IQ) gives a satisfactory but not very good fit to the data. A much better fit is obtained with Model 2 (g-ECT + BIS-B), but the best (and almost perfect) fit results from Model 3 (displayed in Figure 3). With respect to the question of the generality of the mental speed-intelligence rela- tionship, it can be concluded that general mental speed (g-ECT) influences all operations (assumed in the BIS) but the strength of influence varies: The path coefficients in Figure 3 show that mental speed exerts the strongest influence on BIS-B (processing speed), followed by BIS-K (processing capacity) and the weakest (albeit still significant) influence is exerted on BIS-M (memory) and BIS-E (creativity). It can also be seen that the path coefficients correspond quite well with the outcomes of correlational analyses.
Singularity or Specificity of Mind Finally, we tested the two contrasting views of the mental speed-intelligence relationship. To examine whether ECTs involving the processing of verbal, nu- merical, or figural materials are more strongly associated with measures of intel- lectual ability involving the same content than with measures of a different content, it is necessary to extract scores for verbal, numerical, and figural speed of processing from the ECT battery. For this purpose we again submitted the intercorrelations of all primary ECT measures to a PCA but now extracted three factors. However, our expectation that we would obtain three content-based fac- tors (verbal, numerical, figural) received no empirical support. Rather, the three
TABLE 3
Summary of Goodness-of-Fit Measures for Structural Models Representing ECT and Intelligence Measures
Model Chi-Square df P
I (g-ECT + g-IQ, 897.37 566 .oo 2 (g-ECT + BIS-B) 573.61 562 .36 3 (g-ECT ---f BIS-B,M.E,K) 483.77 559 .99
Differences Among Models Model 0 vs. Model I 58.41 I Model 1 vs. Model 2 323.76 4 Model 2 vs. Model 3 89.84 3
MENTAL SPEED AND IQ 37
/ - ,.52 -
Figure 3. Structural model of the relationships between g-ECT and operational components in the
BIS (see Appendix A for an explanation of abbreviations of variables).
factors reflected the different processing requirements of the three ECTs (Coding test, Sternberg test, Posner test). This outcome of a PCA corresponds quite well with observations made by Jaeger (1982, 1984) when submitting the BIS subtests to factor analysis: The extracted factors primarily reflected the distinction of operations and not that of contents. From this finding for the BIS (which has been replicated in several samples), Jaeger concluded that the distinction between operations must be more dominant compared to the distinction of content compo- nents. How did Jaeger then obtain evidence for his content-based components? Jaeger conjectured that, if operation-specific variance is stronger in the factor structure of the BIS subtests, then it is necessary to suppress this operation- specific variance by means of aggregating the BIS subtests over operations but within contents (e.g., a first verbal aggregate was composed of four verbal sub- tests, one from each operational class; another four verbal subtests made up a second verbal aggregate, and so on). By this procedure he obtained aggregated

38 NEUBAUER AND BUCIK
verbal numerical figural
COPY . . l
Coding Test Code For . . 9
Code Back . . l
Set S.= 1 41 0 ,
Sternberg T. Set S.: 3 0 0
Set S.= 5 , I,
PI Posner Test
NI I, 0
. * , * * v ” v
ECT aggregates: v1 vz v3 N1 Nz NJ F1 Fz FJ
Figure 4. Aggregation of ECT variables within contents.
variables that are homogeneous with respect to content, which then-in a factor analysis-gave three clearly distinguishable content factors or components.
We adopted Jaeger’s procedure for our ECT battery; we defined three verbal aggregates (V 1 to V3), three numerical aggregates (N 1 to N3), and three figural aggregates (Fl to F3). Figure 4 shows the variables used for aggregation (e.g., V 1 results from the aggregation of the variables CODE BACK[verbal] from the Coding test, Set Size I [verbal] from the Sternberg test, and Pl[verbal] from the Posner test). Submitted to a PCA (with oblique rotation), the nine aggregated variables gave three factors (see Table 4): a numerical ECT-factor 1 (72.2% variance), a figural ECT-factor 2 (7.9%), and a verbal ECT-factor 3 (5.2%). For these factors we computed factor scores and correlated them with the content- based components of the BIS (see Table 5). According to Ceci’s specificity of mind view, the correlations in the main diagonal should be substantially larger
TABLE 4
Pattern Matrix From the PCA (With Oblique Rotation) of the
Content-HomoQeneous ECT A!zQrwates
Factor 1 Factor 2 Factor 3
N3 N2 NI F3
F2
FI
v3 VI
v2
.9l
.87
.84
.I7 -.09 .I4 .I8 .26 .35
m.14 .I8 .II -.05 .I4 -.05 .x9 p.24 .86 .26 .7l .20 .06 .80 .34 .49 .31 .40
MENTAL SPEED AND IQ 39
TABLE 5
Correlations of ECT Content-Based Factors With Content-Based Components in the BIS
Content-Based Factors From ECTs
BIS-Numerical
BIS-Figural
BIS-Verbal
Factor 1 (Numerical)
,45””
.45**
.44**
Factor 2 (Figural)
.45**
.60**
.43**
Factor 3 (Verbal)
.45**
.45**
.52**
**:p < .Ol (one-tailed).
than all other coefficients (e.g., the verbal ECT factor should correlate most highly with BIS-verbal, etc.). Table 5 shows little empirical support for Ceci’s conjecture: All correlations are significant and of a very similar size (in fact, five out of nine correlations were different only in the third decimal place). The only exception to this is the (larger) correlation of the figural BIS component with the figural ECT factor. When testing the differences between correlations in the main diagonal and correlations in the same row and the same column for significance, only the BIS-figural X ECT-figural correlation of .60 is significantly larger than the correlations in the same row and in the same column.
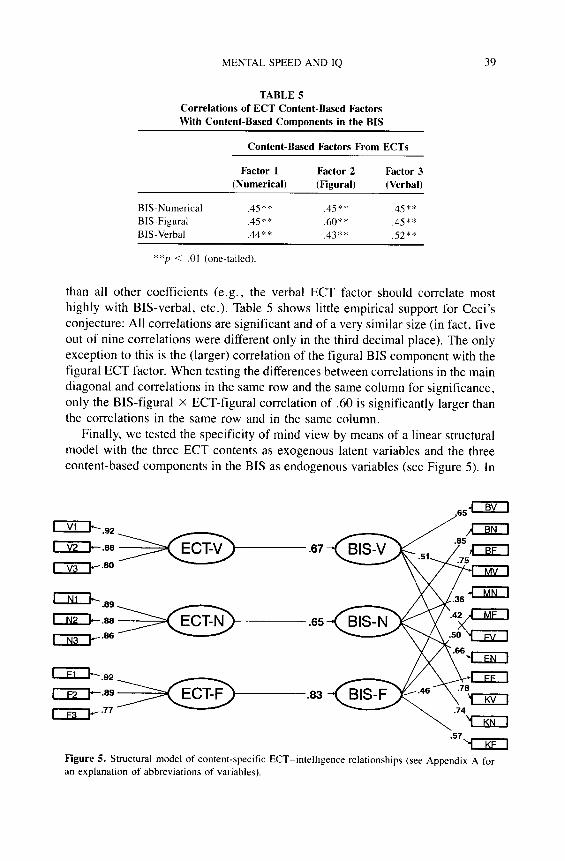
Finally, we tested the specificity of mind view by means of a linear structural model with the three ECT contents as exogenous latent variables and the three content-based components in the BIS as endogenous variables (see Figure 5). In
I.62 IfTq- .66 .67
Iv3J.*
-.I39 IN2lc .66 .65
INa.=
.83
Figure 5. Structural model of content-specific ECT-intelligence relationships (see Appendix A for an explanation of abbreviations of variables).

40 NEUBAUERANDBUCIK
this model we allowed only one path from each ECT content variable to its corresponding content variable in the BIS. The fit of this model to the data was again evaluated by means of the chi-square test and gave a very high chi-square of 473.55 in comparison with 165 degrees of freedom. Therefore, in a confirma- tory analysis of our data, the specificity of mind view did not receive empirical support. Moreover, it should be emphasized that the fit of this model is also much worse than that of Model 1 (g-ECT + g-IQ, see previous section), which can be regarded as a test of the singularity of mind view.
DISCUSSION
The findings of our study can be summarized in three points:
1. The hypothesis of a relationship between mental speed and psychometric intelligence has received strong empirical support in our study: A high speed of information processing in elementary cognitive tasks was associated with high psychometric intelligence.
2. This mental speed-intelligence relationship can neither be localized unequiv- ocally at the level of general intelligence or g, nor can speed of information processing be equated with the processing speed component in the Berlin model of Intelligence Structure (BIS). Rather, it can be concluded that speed of information processing (SIP) is substantially related to all operational components in the BIS but to a different degree. We found a very close relationship of SIP with processing speed in the BIS, a less strong-but surprisingly high-relationship with processing capacity and weaker-but still significant-associations with the memory and creativity components in the BIS.
3. Generally, our findings do not support Ceci’s specificity of mind view of the mental speed-intelligence relationship: Correlational analyses provided only weak evidence in favor of content-specific ECT-intelligence correlations (only for the figural content domain) and, perhaps more important, a “speci- ficity model” received no empirical support in a confirmatory analysis by means of linear structural relations analysis. In the following, we discuss these three main findings in more detail.
First, the significant association of SIP in ECTs with general intelligence was observed for both measures of general intelligence: For Raven’s APM the r was .44 and for general intelligence derived from the BIS (BIS-AI) an even more substantial relationship of .63 was observed. Already the correlation with the APM is higher than in many other mental speed studies, where correlations up to .3 have been found (inducing Hunt, 1980, to infer a “.3 barrier” for correlations between RTs and ECTs and psychometric intelligence). Two circumstances might be responsible for this: First, whereas in most previous mental speed stud-

MENTAL SPEED AND IQ 41
ies rather homogeneous samples (undergraduates or university students) were tested, we recruited our participants via a local newspaper. Therefore, in our more representative sample, an underestimation of correlations due to restriction of range (in intellectual abilities) seems less likely. Second, on the ECT side, we obtained our correlations by aggregating scores from 3 X 3 paper-and-pencil ECTs (through extracting a general factor score g-ECT). As the primary vari- ables used for the computation of a general factor score already displayed good reliabilities, one can assume a further improvement of reliability through the aggregation of a total of 24 ECT variables. Therefore, an attenuation of ECT- intelligence correlations due to ECT unreliability is extremely unlikely.
The mental speed-intelligence relationship was substantially higher for gener- al intelligence derived from the BIS (.63) as compared to the APM. This finding seems easily explainable: Although the APM are considered one of the best sin- gle measures of g (e.g., Snow, Kyllonen, & Marshalek, 1984), it is widely ac- cepted that the most reliable and valid assessment of g can be obtained by means of test batteries sampling the largest possible portions from the universe of cogni- tive operations (Detterman, 1986). It is reasonable to assume that the BIS-4 test with its 45 subtests constitutes one of the best g measures currently available. This might be one reason why the BIS correlates substantially higher with mental speed than the APM. There is however, also another explanation: The high cor- relation between mental speed and the BIS-4 test might be largely due to the subtests for the processing speed component of the BIS, which are partially very similar in their cognitive demands to our paper-and-pencil ECTs.
This leads us to the second main finding of our study. In fact, there was a very high correlation of .75 between the ECT-general factor (g-ECT) and the concep- tually similar processing speed component in the BIS. However, two results argue against equating mental speed with BlS-processing speed. First, g-ECT also displayed significant correlations with all other operational components in the BIS; the relationship with processing capacity (BIS-K) was especially sur- prisingly high (.50), as this component includes mainly subtests of considerable complexity (like syllogisms, analogies, number series). In the light of the fre- quently reported correlations of the (also very complex) Raven matrices with mental speed, this relationship might be considered not the real surprise. Perhaps the most intriguing finding is the relationship of mental speed with creativity, a finding that-to our knowledge-has never been published before.4 In the only study currently available that related mental speed (parameters of the Hick para- digm) to the BIS Beauducel and Brocke (1993) found significant correlations with all operational components except for creativity.
The second argument against equating mental speed with BIS-processing
“One of the reviewers, P.A. Vernon, informed us about a similar relationship of - .30 between
RT and creativity he had observed in a sample of 120 university students. This study, however, is not available in a published form (Vernon, 1988).
42 NEUBAUERANDBUCIK
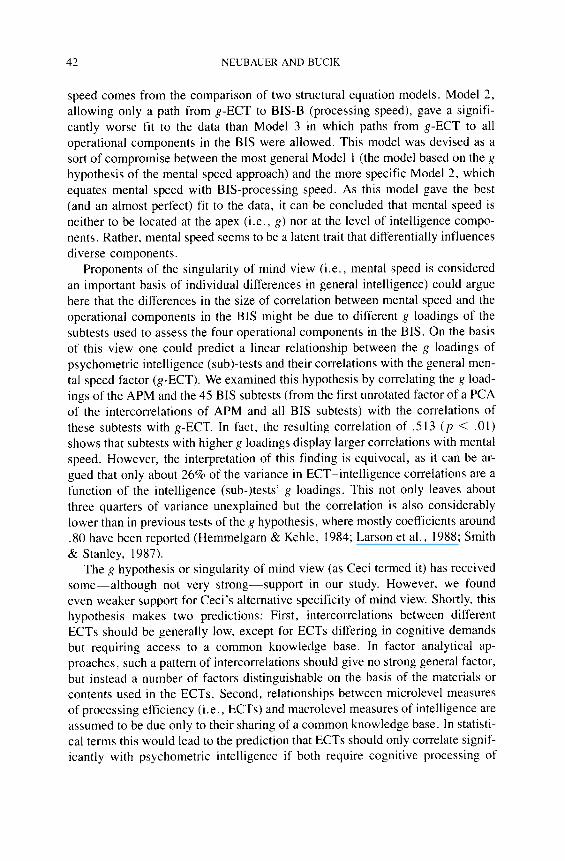
speed comes from the comparison of two structural equation models. Model 2, allowing only a path from g-ECT to BIS-B (processing speed), gave a signifi- cantly worse fit to the data than Model 3 in which paths from g-ECT to all operational components in the BIS were allowed. This model was devised as a sort of compromise between the most general Model 1 (the model based on the g hypothesis of the mental speed approach) and the more specific Mode1 2, which equates mental speed with BIS-processing speed. As this model gave the best (and an almost perfect) fit to the data, it can be concluded that mental speed is neither to be located at the apex (i.e., g) nor at the level of intelligence compo- nents. Rather, mental speed seems to be a latent trait that differentially influences diverse components.
Proponents of the singularity of mind view (i.e., mental speed is considered an important basis of individual differences in general intelligence) could argue here that the differences in the size of correlation between mental speed and the operational components in the BIS might be due to different g loadings of the subtests used to assess the four operational components in the BIS. On the basis of this view one could predict a linear relationship between the R loadings of psychometric intelligence (sub)-tests and their correlations with the general men- tal speed factor (g-ECT). We examined this hypothesis by correlating the g load- ings of the APM and the 45 BIS subtests (from the first unrotated factor of a PCA of the intercorrelations of APM and all BIS subtests) with the correlations of these subtests with g-ECT. In fact, the resulting correlation of .513 (p < .Ol) shows that subtests with higher g loadings display larger correlations with mental speed. However, the interpretation of this finding is equivocal, as it can be ar- gued that only about 26% of the variance in ECT-intelligence correlations are a function of the intelligence (sub-Nests g loadings. This not only leaves about three quarters of variance unexplained but the correlation is also considerably lower than in previous tests of the R hypothesis, where mostly coefficients around .80 have been reported (Hemmelgam & Kehle, 1984; Larson et al., 1988; Smith & Stanley, 1987).
The g hypothesis or singularity of mind view (as Ceci termed it) has received some-although not very strong-support in our study. However, we found even weaker support for Ceci’s alternative specificity of mind view. Shortly, this hypothesis makes two predictions: First, intercorrelations between different ECTs should be generally low, except for ECTs differing in cognitive demands but requiring access to a common knowledge base. In factor analytical ap- proaches, such a pattern of intercorrelations should give no strong general factor, but instead a number of factors distinguishable on the basis of the materials or contents used in the ECTs. Second, relationships between microlevel measures of processing efficiency (i.e., ECTs) and macrolevel measures of intelligence are assumed to be due only to their sharing of a common knowledge base. In statisti- cal terms this would lead to the prediction that ECTs should only correlate signif- icantly with psychometric intelligence if both require cognitive processing of
MENTAL SPEED AND IQ 43
stimulus materials involving the same content base (i.e., verbal, numerical, or
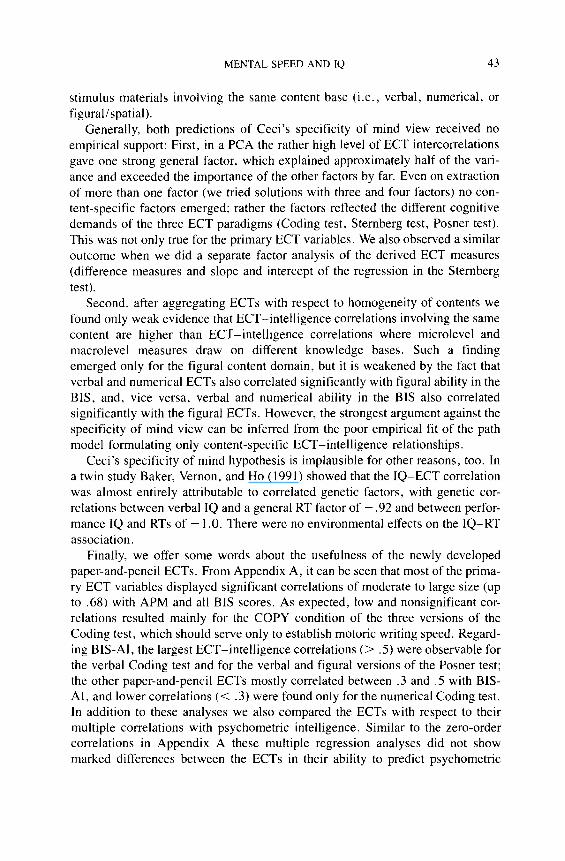
figuralispatial). Generally, both predictions of Ceci’s specificity of mind view received no
empirical support: First, in a PCA the rather high level of ECT intercorrelations gave one strong general factor, which explained approximately half of the vari- ance and exceeded the importance of the other factors by far. Even on extraction of more than one factor (we tried solutions with three and four factors) no con- tent-specific factors emerged; rather the factors reflected the different cognitive demands of the three ECT paradigms (Coding test, Stemberg test, Posner test). This was not only true for the primary ECT variables. We also observed a similar outcome when we did a separate factor analysis of the derived ECT measures (difference measures and slope and intercept of the regression in the Sternberg
test). Second, after aggregating ECTs with respect to homogeneity of contents we
found only weak evidence that ECT-intelligence correlations involving the same content are higher than ECT-intelligence correlations where microlevel and macrolevel measures draw on different knowledge bases. Such a finding emerged only for the figural content domain, but it is weakened by the fact that verbal and numerical ECTs also correlated significantly with figural ability in the BIS, and, vice versa, verbal and numerical ability in the BIS also correlated significantly with the figural ECTs. However, the strongest argument against the specificity of mind view can be inferred from the poor empirical fit of the path model formulating only content-specific ECT-intelligence relationships.
Ceci’s specificity of mind hypothesis is implausible for other reasons, too. In a twin study Baker, Vernon, and Ho (1991) showed that the IQ-ECT correlation was almost entirely attributable to correlated genetic factors, with genetic cor- relations between verbal IQ and a general RT factor of - .92 and between perfor- mance IQ and RTs of - 1 .O. There were no environmental effects on the IQ-RT association.
Finally, we offer some words about the usefulness of the newly developed paper-and-pencil ECTs. From Appendix A, it can be seen that most of the prima- ry ECT variables displayed significant correlations of moderate to large size (up to .68) with APM and all BIS scores. As expected, low and nonsignificant cor- relations resulted mainly for the COPY condition of the three versions of the Coding test, which should serve only to establish motoric writing speed. Regard- ing BIS-AI, the largest ECT-intelligence correlations (> .5) were observable for the verbal Coding test and for the verbal and figural versions of the Posner test; the other paper-and-pencil ECTs mostly correlated between .3 and .5 with BIS- AI, and lower correlations (< .3) were found only for the numerical Coding test. In addition to these analyses we also compared the ECTs with respect to their multiple correlations with psychometric intelligence. Similar to the zero-order correlations in Appendix A these multiple regression analyses did not show marked differences between the ECTs in their ability to predict psychometric

44 NEUBAUER AND BUCIK
intelligence. From this finding, as well as from the strong general factor derived from the ECT intercorrelations, we infer that our ECT battery assessed a rather unitary construct of mental speed, which correlates with psychometric intel- ligence.
This outcome, however, was contrary to our expectations. Initially, our test battery was designed to provide measures of different processing components like speed of encoding and speed of access to short-term and long-term memory. The derived measures that should reflect these processes (the PI - Nl difference measure in the Posner test and the slope in the Sternberg test), however, partially suffered from low reliability (and subsequently depressing correlations with in- telligence measures), but even those derived measures with a satisfactory re- liability (like the PI - NI measure in the numerical Posner test, or the difference measures in the Coding test) displayed largely low and nonsignificant correla- tions with the APM and the BIS scores (mostly up to .20).
The finding of low correlations with intelligence for derived or component scores from ECTs is not unusual. On the basis of a thorough review of the mental speed literature, the first author if this article (Neubauer, in press) has argued that there is weak evidence for a relationship between psychometric intelligence on one side and Sternberg slope and the Posner difference measure on the other. In a recent editorial in Intelligence, Lohman (1994) put forward augments in the same direction: As slope measures can be considered “simply a combination of several difference scores in a weighted average” (p. 3) they are not only more unreliable but also display much less variance than, for example, the intercept. According to Lohman, the intercept is “actually the locus of individual differences variance . . whereas component scores . . can only help explain residual individual difference variance” (Lohman, 1994, p. 7).
This issue seems especially important with respect to the recent debate be- tween Kranzler and Jensen (1991a, 1991b, 1993) and Carroll (1991a. 1991b, 1993) about the “nature of psychometric ,g: Unitary process or a number indepen- dent process?“. Whereas Kranzler and Jensen assumed four independent SIP factors (derived by means of factor analysis from an ECT battery) as sources of g variance, Carroll-on the basis of reanalyses of Kranzler and Jensen’s data- argued that there is “no demonstration that g is not unitary” (199 1 a). On the basis of Lohman’s conjectures, of evidence summarized in Neubauer (in press) and of the results presented in this article, we conclude that-at least for the present- there is no reason to reject the parsimonious assumption of a unitary g.
REFERENCES
Baker, L.A., Vernon, P.A.. & Ho. H.-Z. (1991). The genetic correlation between intelligence and
speed of information processing. Behavior Genefics. 21. 35 i-367.
Beauducel. A.. & Brocke. B. (1993). Intelligence and speed of information processing: Further

MENTAL SPEED AND IQ 45
results and questions on Hick’s paradigm and beyond. Persona/i@ and individual Dijferences.
15. 627-636.
Carroll, J.B. (199la). No demonstration that g is not unitary. but there’s more to the story-corn-
ment. Intelligence. 15, 423-436.
Carroll, J.B. (199lb). Still no demonstration that ,c is not unitary-Further comment. Intelligence,
15. 449-453.
Carroll, J.B. (1993). The unitary ,e problem once more: On Kranzler and Jensen. Intelligence. 17.
15-16.
Ceci. S.J. (1990a). On the relation between microlevel processing efficiency and macrolevel mea-
sures of intelligence-Some arguments against current reductionism. Infelligence, 14, l4ll
150.
Ceci. S.J. ( 1990b). On intelligence more or less--A bio-ecological treatise on intellectual devel-
opment. Englewood Cliffs, NJ: Prentice-Hall.
Detterman, D.K. (1986). Human intelligence is a complex system of separate processes. In R.J.
Sternberg & D.K. Detterman (Eds.). Whaf is inle//igenceP Norwood. NJ: Ablex.
Frearson, W., & Eysenck. H.J. (1986). Intelligence, reaction time CRT) and a new odd-man-out RT
paradigm. Personality and Individual D@rences. 7, 807-818.
Hemmelgarn. T.E., & Kehle. T.J. (1984). The relationship between reaction time and intelligence in
children. School Psvchology International. 5. 77-84.
Hunt, E. (1980). Intelligence as an information processing concept. British Journal of Psychology,
71, 449-474.
Hussy, W. (1990). Eine experimentelle Analyse des Intelligenzfaktors “Bearbeitungsgeschwin-
digkeit” [An experimental analysis of the intelligence factor “processing speed”]. Diag-
nosrica, 36, 283-298.
Jaeger, A.O. (1982). Mehrmodale Klassifikation van Intelligenzleistungen: Experimentell kon-
trollierte Weiterentwicklung eines deskriptiven Intelligenzstrukturmodells [Multimodal classi-
fication of cognitive abilities: An experimentally controlled development of a descriptive
model of intelligence structure]. Diagnostica, 28, 195-225.
Jaeger. A.O. (1984). Intelligenzstrukturfoforschung: Konkurrierende Modelle, neue Entwicklungen,
Perspektiven. [Research in the structure of intelligence: Competing models, new develop-
ments, perspectives]. Psychologische Rundschau. 35. 21-35.
Jensen, A.R. (1982). Reaction time and psychometric R. In H.J. Eysenck (Ed.), A mode/.for imel-
ligence. Berlin: Springer.
Jensen, A.R. (1986). Cc Artifact or reality‘? Journal of Vocational Behavior, 29, 301-331.
Jensen. A.R. (1992). Understanding ,e in terms of information processing. Educafional Psycholog)
Review, 4. 27 l-308.
Joreskog. K.G., & Sorbom, D. (1993). LISREL 8-User’s reference guide. Chicago: Scientific Soft-
ware International. Kranzler. J.H., & Jensen, A.R. (1991a). The nature of psychometric R-Unitary process or a number
of independent processes. Intelligence. 15. 397-422.
Krdnzler, J.H., & Jensen, A.R. (199lbl. Unitary 8: Unquestioned postulate or empirical fact? Intel-
ligence. 15. 437-448.
Kranzler, J.H., & Jensen. A.R. (1993). Psychometric R is still not unitary after eliminating supposed
“impurities”: Further comment on Carroll. Inrelligence. f7. 1 I- 14.
Larson, G.E.. Merritt, C.R., & Williams, S.E. (1988). Information processing and intelligence: Some implications of task complexity. Intelligence, 12. 13lll48.
Levine, G.. Preddy, D., & Thorndike, R.L. (1987). Speed of information processing and level of
cognitive ability. Personality and Individual Di$erences, 8, 599-608.
Lindley, R.H., Bathurst. K., Smith, W.R., & Wilson. S.M. (1993). Hick’s law, IQ, and singularity or specificity of mind-A psychometric analysis. Personaliry and Individual Differences. 15,
129-135.
46 NEUBAUER AND BUCIK
Lindley, R.H.. Smith, W.R., &Thomas, T.J. t 1988). The relationship between speed of information
processing as measured by timed paper-and-pencil tests and psychometric intelligence. fntrl-
li‘qence. 12. 17-26.
Lohman, D.F. (1994). Component scores as residual variation (or why the intercept correlates best).
Intelligence, 19. I - 1 I Ncubauer. A.C. (1993). Intelligenz und Geschwindigkeit der Informationsverarbeitung: Stand der
Forschung und Perspektiven [Intelligence and speed of information processing: Empirical
evidence and perspectives]. Psvchologische Rundschau. 44, 90- 105.
Neubauer, A.C. (in press). The mental speed approach to the assessment of intelligence. In J. King-
ma & W. Tomic (Eds.), Advances in cognition and education: Reflections on the concept of
intelligence. Greenwich, CT: JAI Press. Poaner, M.I., & Mitchell, R.F. (1967). Chronometric analysis of classification. Psyhological Re-
view, 74. 392-409.
Raven, J.C. (1958). Advunced progressive matrices. London: Lewis.
Ruchalla, E., Schalt. E., & Vogel. F. (1985). Relations between mental performance and reaction
time: New aspects of an old problem. Inrelligence. 9. 1899205.
Smith, G.A.. & Stanley. G. (1987). Comparing subtest profiles of 8 loadings and correlations with
RT measures. Intelligence. II, 291-298.
Snow. R.E., Kyllonen, P.C., & Marshalek, B. (1984). The topography of ability and learning cor-
relations. In R.J. Sternberg (Ed.). Advances in rhepswhology ofhumun intelligence (Vol. 2).
Hillsdale, NJ: Erlbaum.
Spearman, C. (1927). The abiliries qf man. New York: Macmillan.
Stemberg, S. (1966). High-speed scanning in human memory. Science, 153. 652-654.
Vernon. P.A. (1987). Speed qf infivmation processing und intelligence. Norwood. NJ: Ablex.
Vernon, P.A. (I 988). Intelligence, creativity and speed qfinformarion processing. Paper presented at
the XXIV International Congress of Psychology, Sydney. Australia.
Vernon, P.A. (1989). The generality of 8. Personal& and Individual D(fferences. 10. 803-804.
Wittmann. W.W. (1987). Grundlagen erfolgreicher Forschung in der Psychologie: Multimodale Di- agnostik. Multiplismus, multivariate Reliabilitlts- und Validitltstheorie [Bases of successful
research in psychology: Multimodal diagnostic, multiplism. multivariate reliability and valid-
ity theory]. Diagnostica. 33. 209-226.
MENTAL SPEED AND IQ 47
APPENDIX A
Correlations of Rimarv ECT Variables With the AF’M and the BIS Variables
BIS BIS Operations BIS Contents
APM AI B M E K F
VP1 .31 .50 .62 .23 .31 .39 .49
VNI .30 .51 .68 .29 .23 .38 .47
NPI .31 .42 .50 .19 .27 .34 .43
NNI .32 .45 .60 .28 .19 .33 .41
FPI .35 .44 .55 .24 .22 .31 .50 FNI .35 .53 .56 .36 .27 .44 .56
vc .12 .34 .40 .lO .33 .22 .29
VCF .37 .53 .66 .30 .22 .46 .41
VCB .50 .56 .54 .36 .23 .61 .41
NC .Ol .18 .31 -.oo .18 .08 .18
NCF .18 .29 .49 .13 .17 .12 .22
NCB .27 .28 .46 .08 .12 .20 .19
FC .35 .40 .49 .07 .31 .36 .48
FCF .46 .41 .54 .19 .34 .38 .50
FCB .44 .44 .48 .17 .34 .39 .45
VSl .30 .50 .51 .24 .32 .41 .45
vs3 .26 .46 .52 .26 .23 .41 .47
vs5 .20 .42 .49 .26 .22 .33 .40
NSl .36 .44 .50 .24 .31 .33 .45
NS3 .25 .45 .53 .28 .29 .30 .44
NS5 .29 .49 .58 .34 .28 .33 .41
FSl .37 .49 .48 .27 .38 .41 .46
FS3 .I9 .33 .41 .21 .20 .21 .30
FS5 .19 .30 .26 .20 .28 .18 .28
V N
.42 .40
.43 .43
.38 .29
.36 .40
.37 .29
.43 .39
.35 .25
.41 .50
.46 .58
.15 .15
.26 .30
.20 .32
.26 .30
.34 .40
.32 .38
.39 .45
.41 .32
.40 .29
.36 .36
.37 .37
.47 .40
.42 .41
.32 .24
.23 .21
Note. r > .14 (p < .05), I > .20 (p < .Ol). Explanation of abbreviations of ECT variables: The first letters (V, N, F) refer to verbal, numberical, and figural ECTs, respectively; Posner test: PI = Physical Identity, NI = Name Identity; Coding test: C = COPY, CF = CODE FOR, CB = CODE BACK; Stemberg test: Sl = Set Size 1, S3 = Set Size 3, S5 = Set Size 5. See text for an explanation of abbreviations of intelligence measures.
AP
PE
ND
IX
B
Inte
rcor
rela
tion
s of
Pri
mar
y E
CT
V
aria
bles
VN
I N
H
NN
I F
W
FN
I V
C
VC
F
VC
B
NC
N
CF
NC
B
FC
F
CF
FC
B
VS
l V
S3
VS
S
NS
l N
S3
NS
5 F
Sl
FS
3
FS
5
VP1
V
NI
NPI
N
NI
FPI
FN
I V
C
VW
V
CB
N
C
NC
F
NC
R
FC
F
CF
FC
B
VS
I vs
3
vs5
NS
I N
S3
NS
5 F
SI
FS
3
7u
.66
.61
.s9
.55
.34
.39
.35
.28
.45
.44
.50
.54
Sl
.56
.60
.49
.51
.61
.60
.51
.37
-36
.61
.72
.63
.60
.31
.4s
.40
.25
.52
.46
.51
.54
55
.60
.59
.57
.53
-64
.5x
.42
.42
.34
.67
.65
.47
.22
.42
.34
.I9
.40
.36
.43
.54
.49
.46
.47
.46
.hl
.60
.54
.44
.38
.30
.72
.62
.29
.51
.46
.29
.49
.47
.48
.58
.57
.53
.s3
.s3
.G2
.65
.63
.44
.44
.34
.68
.28
.48
.41
.23
.43
.34
.46
.41
.43
.48
.53
.45
.53
.52
.51
-55
.45
.29
.22
.48
.39
.I1
.29
.2s
39
.40
.39
.42
.41
.43
.44
-44
.46
.50
.36
.25
.29
.24
.76
.49
.33
.44
.37
.21
.37
.27
-26
IO
.I3
.23
.34
.25
.I7
.7l
.23
.49
.49
.35
.39
.37
.4l
.39
.40
.40
.33
30
.42
.41
.I2
.I5
.40
.44
.30
.38
.40
.4x
.44
.45
.37
.33
.43
.44
.35
.I3
.59
.38
.39
.32
.24
.27
.l I
.I
3 .2
3 I4
.I
6 .2
4 .I
7 .0
7 .x
1 .4
6 .5
2 .4
5 -4
0
.3l
.29
.37
.3l
.35
-32
.24
.0X
.3
9 .5
0 .4
6 .3
9 .3
3 .2
9 .3
4 .2
9 .3
2 .2
8 .2
2 .0
x .8
1 .6
9 .5
2 .4
5 -3
2
.54
,112
.3
6 .4
S
.40
.29
.90
.5l
.46
.34
-62
.50
.45
.45
.3-l
.2
3 .4
8 .4
6 .3
5 .5
4 .4
5 .4
7 .4
2 .3
3 .2
3 .6
9 .5
6 .6
4 .6
1 .5
0 .%
i .4
(1
.3l
.73
.50
.60
.62
.s2
.45
.3l
.3h
.5
4 .7
1 .4
4 .4
0 .2
4 .7
3 .5
6 .5
3 .5
0 .3
5 .7
3 .4
8 .4
9 .4
4 .4
x .5
l .3
6 .5
4 .3
2 .4
5
No&
~. ,-
>
.I4
(p c
: .O
S),
r -1
.20
(p <
.O
l).
SW
Appen
dix
A f
or a
n e
xpla
nat
ion
of a
bbre
viat
ion
s.