emergency overflow shelter request for proposal - Mayor's ...
Upload
khangminh22Category
view
0download
0
Office of the City Auditor
Report to the City Council City of San José
THE MAYOR’S GANG PREVENTION TASK FORCE: BETTER COORDINATION AND USE OF DATA CAN FURTHER THE TASK FORCE’S STRATEGIC GOALS
Report 19-04 May 2019

This page was intentionally left blank
200 E. Santa Clara Street, San José, CA 95113
Telephone: (408) 535-1250 Fax: (408) 292-6071 Website: www.sanjoseca.gov/auditor/
Office of the City Auditor Joe Rois, Acting City Auditor
May 8, 2019
Honorable Mayor and Members Of the City Council 200 East Santa Clara Street San José, CA 95113 The Mayor’s Gang Prevention Task Force: Better Coordination and Use of Data Can Further the Task Force’s Strategic Goals Created in 1991, the Mayor’s Gang Prevention Task Force is a city-wide coalition that calls for the collaboration of multiple City departments and non-City stakeholders to address gang activity in San José. Over time, the Task Force has evolved, bringing in new partners, adding new services based on emerging needs, and increasing service areas. Referred to as the “City’s youth violence reduction initiative,” Task Force programs target youth and young adults ages 6 to 24 in four risk categories: at-risk, high-risk, gang-impacted, and gang-intentional youth.
The Task Force is housed within the Department of Parks, Recreation and Neighborhood Services (PRNS). It includes the Bringing Everyone’s Strengths Together (BEST) program where the City contracts with Community Based Organizations (CBOs) to provide gang prevention and intervention services to youth across the City. CBOs provided services to more than 3,000 youth in FY 2017-18. Parallel to BEST grantee services, Youth Intervention Services were provided by City staff through the Safe School Campus Initiative (SSCI), the Clean Slate Tattoo Removal, Digital Arts, and other programs. In FY 2017-18, City spending on Task Force programs totaled nearly $9 million.
While Task Force programs have shifted and evolved over time, the focus of the Task Force to address the needs of youth and reduce violence associated with gangs has remained the same. The objective of our audit was to review the evolution of the Mayor’s Gang Prevention Task Force and BEST program over time, including contract monitoring and grantee performance.
Finding 1: Better Coordination Among Task Force Partners Can Improve Service Delivery. The Task Force aims to provide services through a continuum of care strategy, which includes: prevention, intervention, suppression, and re-entry. This continuum of care relies on multiple players, including staff in PRNS, the San José Police Department (SJPD), BEST grantees, school districts, and various Santa Clara County agencies. The success of the Task Force in providing services to San José youth relies on coordination among the various partners.
We found that while the City has an agreement with Santa Clara County Probation to receive client referrals for City-provided case management services, very few clients receiving services were referred from Probation. Also, other informal activities done in coordination with Probation could
4
benefit from a more formalized, defined process. In addition, despite re-entry services for recently incarcerated individuals being part of the Task Force’s continuum of care, the City does not currently have an agreement with the Santa Clara County Office of Re-entry Services and does not provide or receive referrals from it. Additional coordination between PRNS and these County agencies can help strengthen the Task Force’s continuum of care. Finally, additional strategic coordination with the SJPD would be beneficial for future initiatives to address overall youth violence.
Finding 2: Task Force Services Could Be Better Aligned to Meet the Needs of Target Populations. The Task Force provides prevention and intervention services to youth at different levels of risk for gang involvement. Though the Task Force identifies different target populations for services, there is no uniform criteria to identify participants as one target population or another. While BEST grantees use different tools or methods to assess youth participants as lower or higher risk for gang involvement, those methods are not consistent among the different grantees. PRNS’ Youth Intervention Services (YIS) staff do not use a formal assessment tool to place participants into Task Force programs. More consistent assessment of participants can ensure youth receive the most appropriate services for their needs. Also, although grant agreements for BEST services have generally been focused on higher risk populations (high-risk or gang-involved youth), we noted that nearly half of clients served were the lowest risk population. Finally, coordination among BEST and YIS can be improved to ensure youth are provided with services that best fit their needs.
Finding 3: PRNS Should Use a Data Driven Approach to Prioritize School-Based Programs. The Safe School Campus Initiative (SSCI) is a City resource for schools. SSCI staff provide a wide array of services beyond gang-related violence prevention and intervention, including regular school visits, responses to non-gang violence or other incidents (i.e., school activations), and case management services. We found that the SSCI program could benefit from increased oversight, accountability, and follow-up. For example, following school activations, Youth Interventionists are expected to complete incident reports that document the activities undertaken, and any follow-up actions required. However, incident reports often had limited information, with results of the activations or follow-up actions frequently absent from the reports. In addition, most of the agreements with school districts are many years old and should be updated to reflect all of the services currently provided by PRNS staff. This includes such activities as case management for students, regular YIS presence on schools, and responses to school activations. The update should also include roles and responsibilities for City staff and school administrators, as well as criteria for SSCI school activations. In addition, the weekly schedules of regular SSCI school visits can be better aligned with the number of school activations. Finally, YIS should clearly define expectations and track results for case management services provided to youth.
Finding 4: Monitoring of BEST Grantees Can Be Improved to Ensure Program Success. CBOs are contracted by the City to deliver services under the BEST program. In 2017-18, PRNS monitored grantee performance through 29 site visits for the City’s 18 BEST grantees, in addition to other monitoring activities. However, current monitoring practices have not always ensured compliance with grant agreements in terms of reaching targeted populations. They also have not prevented over reporting of participant enrollment because of duplicates in the participant lists. PRNS should update procedures to make monitoring visits more efficient and better assess grantee performance. PRNS can also develop clear guidelines on when underperforming grantees should be placed on corrective action plans, as this has not been consistent across grantees who had not met goals outlined in the grant agreements.
5
Finding 5: Tracking and Reporting of Overall Task Force Program Performance Can Aid Decision Making and Improve Oversight. PRNS reports multiple performance measures for Task Force activities through an annual report on the BEST program, or included in the City’s Operating Budget. These have included a mix of measures, including overall units of service provided, as well as some outcome measures from the annual BEST evaluation reports. For example, in the most recent evaluation, BEST services were found to have modestly impacted the occurrence of gang incidents and youth arrests in program areas. Despite this, the Task Force can benefit from more ongoing measurement of program performance. Other jurisdictions use more comprehensive performance measures to assess program outcomes, such as changes in youth crime in hot spot areas, pre- and post-assessments of youth, and other measurable outcomes. In addition, PRNS should develop participant surveys to use as a feedback mechanism to collect data on participant satisfaction with Task Force services. Finally, in its annual report to the City Council, PRNS should include key performance measures and expenditures for both the BEST and YIS programs. Currently, only BEST program services are included, despite program expenditures being nearly equal. This can ensure decision-makers and staff are equipped with complete information to make strategic decisions about service delivery.
This report contains 17 recommendations. We will present this report at the May 16, 2019 meeting of the Public Safety, Finance, & Strategic Support Committee. We would like to thank the Parks, Recreation and Neighborhood Services Department and the San José Police Department for their time and insight during the audit process.
Respectfully submitted,
Joe Rois Acting City Auditor finaltr JR:lg
Audit Staff: Gitanjali Mandrekar Shirley Duong Margaret Anderson
cc: Dave Sykes Avi Yotam Brian Shab Jon Cicirelli Jennifer Maguire Mario Maciel Neil Rufino CJ Ryan Margaret McCahan Angel Rios Edgardo Garcia Margaret Le Rick Doyle David Delong Elizabeth Klotz
This report is also available online at www.sanjoseca.gov/audits

6
This page was intentionally left blank

Table of Contents
Cover Letter ........................................................................................................... 3
Introduction .......................................................................................................... 11
Background .......................................................................................................................... 11
Audit Objective, Scope, and Methodology ................................................................... 24
Finding I Better Coordination Among Task Force Partners Can Improve Service Delivery .................................................................................... 27
The Task Force Achieves Its Goals Through a Continuum of Care Strategy ...... 27
Coordination With the Santa Clara County Probation Department Can Be Improved .............................................................................................................................. 30
The Task Force Does Not Currently Coordinate With Santa Clara County Re-entry Services ................................................................................................................ 33
Coordination With the San José Police Department Can Be Enhanced ............... 34
Finding 2 Task Force Services Could Be Better Aligned to Meet the Needs of Target Populations ............................................................................................... 37
The Task Force Provides Intervention and Prevention Services to Youth at Various Levels of Risk for Gang Involvement .............................................................. 37
The Task Force Serves Youth With Different Needs................................................ 38
Most BEST Grantees Are Contracted to Serve High-Risk or Gang-Involved Youth ..................................................................................................................................... 41
Coordination Can Be Strengthened to Maximize Service Coverage to Participants at Sites Where BEST and YIS Overlap .................................................... 45
Finding 3 PRNS Should Use a Data Driven Approach to Prioritize School-Based Programs ....................................................................................... 47
The Safe School Campus Initiative (SSCI) Has Evolved and Is a City-Wide Resource for Schools ......................................................................................................... 47
Increased Oversight, Accountability, and Follow-Up of YIS Services Can Ensure Program Success ................................................................................................... 49
Memoranda of Agreement With School Districts Do Not Clearly Define Expectations for City Staff and School Administrators.............................................. 51
Weekly SSCI School Visits Can Better Align With the Number of School Incidents ................................................................................................................................ 53
YIS Should Better Define and Track Results From Case Management .................. 55
Finding 4 Monitoring of BEST Grantees Can Be Improved to Ensure Successful Program Outcomes ............................................................................................. 57
Grants Analysts in PRNS Monitor BEST Grantees Performance for the Task Force ...................................................................................................................................... 57
Finding 5 Tracking and Reporting of Overall Task Force Program Performance Can Aid Decision Making and Improve Oversight ........................................... 63
Performance Management and Reporting of Overall Task Force Activities ......... 63
Annual Reports to Council Do Not Include Information on All PRNS’ Task Force Programs ................................................................................................................... 66
PRNS Should Develop Guidelines and Improve Oversight of Expenditures From the BEST Reserve .................................................................................................... 68
Conclusion ............................................................................................................. 71
Administration’s Response ................................................................. yellow pages

Table of Exhibits
Exhibit 1: Youth Crime Is Trending Downwards But the Proportion of Arrests Involving Females Is Increasing ...................................................................................................... 12
Exhibit 2: Santa Clara County Youth Arrests/Citations Showed a Declining Trend But Increased in 2017 ...................................................................................................................... 13
Exhibit 3: The Task Force’s Organization Includes Multiple Subcommittees and Teams .................................................................................................................................................. 15
Exhibit 4: Mayor’s Gang Prevention Task Force Services Provided by PRNS .................... 17
Exhibit 5: Task Force Service Areas Eligible for Funding ........................................................ 18
Exhibit 6: Youth Intervention Services (YIS) Programs Provide Direct Services .............. 19
Exhibit 7: Definitions of Task Force Target Populations ......................................................... 20
Exhibit 8: BEST Grantee Actual Service Populations for the Last Six Years ...................... 20
Exhibit 9: Hot Spot Service Areas By Council District (2017-18) ........................................ 21
Exhibit 10: Overall YIS and BEST Funding Expenditures Over the Past Five Years.......... 22
Exhibit 11: Many Internal and External Agencies Contribute to the Task Force’s Continuum of Care .......................................................................................................................... 28
Exhibit 12: Referrals for Case Management Were Mostly From Schools (FY 2017-18) ........................................................................................................................................................ 31
Exhibit 13: Distribution of Grantee Funds Over Eligible Services (FY 2017-18) ............... 38
Exhibit 14: BEST Grantees’ Contracted Target Populations (FY 2017-18) ........................ 42
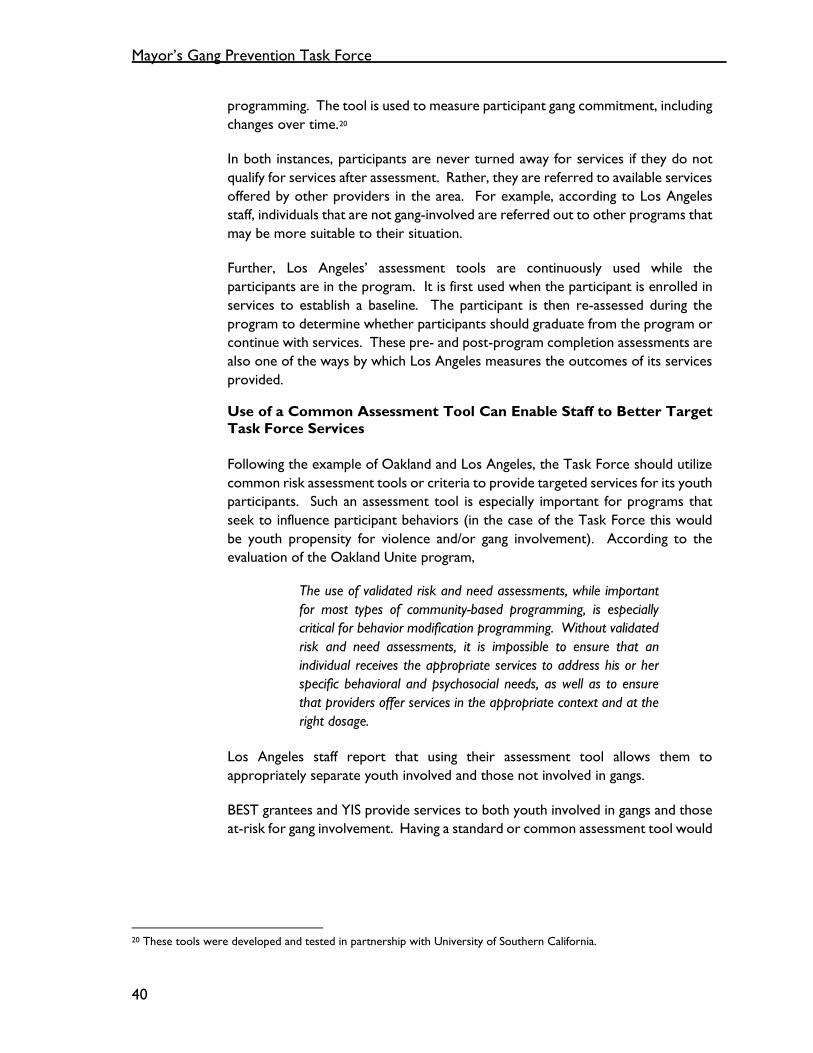
Exhibit 15: Target Populations Served by BEST Grantees (FY 2017-18) ............................ 43
Exhibit 16: Actual Populations Served by BEST Grantees (FY 2017-18) ............................. 43
Exhibit 17: Cost Comparison of Task Force Grants to PRNS Youth Programming by the Same Grantee ....................................................................................................................... 44
Exhibit 18: Coordination Between YIS and BEST Could Be Strengthened ......................... 46
Exhibit 19: Activation Incident Levels .......................................................................................... 48
Exhibit 20: SSCI Activations (FY 2017-18) ................................................................................. 50
Exhibit 21: Alignment of Schools With High Numbers of Activations and Weekly School Visits Could Be Improved ................................................................................................. 54
Exhibit 22: Most Case Management Participants Received Few Sessions ........................... 55
Exhibit 23: More Than Half of BEST Grantees Served Participants Outside of Their Contracted Populations (FY 2017-18) ........................................................................................ 58
Exhibit 24: Site Visit Checklist Does Not Include Key Grant Terms ................................... 61
Exhibit 25: Oakland Reported a Reduction in Recidivism as a Result of Its Programs .... 65
Exhibit 26: BEST and YIS Expenditures (FY 2017-18) .............................................................. 67
11
Introduction
The mission of the City Auditor’s Office is to independently assess and report on City operations and services. The audit function is an essential element of San José’s public accountability, and our audits provide the City Council, City management, and the general public with independent and objective information regarding the economy, efficiency, and effectiveness of City operations and services.
In accordance with the City Auditor’s Fiscal Year (FY) 2018-19 Audit Work Plan, we have completed an audit of the Mayor’s Gang Prevention Task Force (Task Force) and Bringing Everyone’s Strengths Together (BEST) programs. The audit was conducted in response to requests from Councilmembers.
We conducted this performance audit in accordance with generally accepted government auditing standards. Those standards require that we plan and perform the audit to obtain sufficient, appropriate evidence to provide a reasonable basis for our findings and conclusions based on our audit objectives. We believe that the evidence obtained provides a reasonable basis for our findings and conclusions based on our audit objectives. We limited our work to those areas specified in the “Audit Objective, Scope, and Methodology” section of this report.
The Office of the City Auditor thanks the management and staff from the Parks, Recreation and Neighborhood Services (PRNS) Department and the San José Police Department (SJPD) for their time, information, insight, and cooperation during the audit process.
Background
Established in 1991, the Mayor’s Gang Prevention Task Force (Task Force) is a City-wide program that calls for the collaboration of multiple City departments and other non-City stakeholders to address gang activity in San José.
Referred to as “City of San José’s youth violence reduction strategy”, Task Force programs generally target youth and young adults ages 6 to 24 defined as at-risk, high-risk, gang-impacted, and gang-intentional (described in more detail later in Exhibit 7). The Task Force is housed within the Department of Parks, Recreation and Neighborhood Services (PRNS) and its stated mission is:
[…] to ensure safe and healthy opportunities for San José’s youth, free of gangs and crime, to realize their hopes and dreams, and become successful and productive in their homes, schools, and neighborhoods.
Mayor’s Gang Prevention Task Force
12
Task Force programming has shifted and evolved over time, including the addition of services targeted to females and more intervention and prevention services. Yet, the focus of the Task Force to address the needs of youth and young adults in an effort to reduce violence associated with gangs has remained the same since the program’s inception.
Youth Crime Rates Appear to Be Trending Downwards Nationally
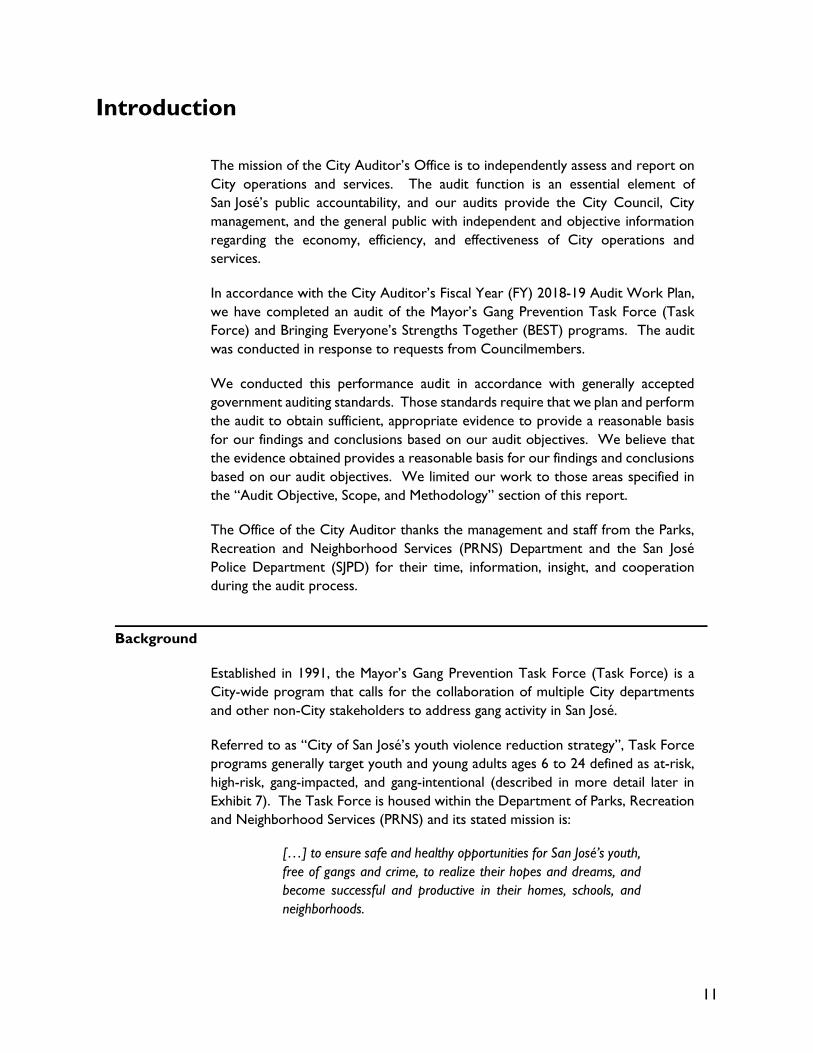
Based on data reported by the Department of Justice, Office of Juvenile Justice and Delinquency Prevention, youth crime rates overall have been trending downwards. Since 2008, arrest rates declined 60 percent for ages 15–17, 50 percent for ages 18–20, and 31 percent for ages 21–24. However, the proportion of female arrests has increased.
Exhibit 1: Youth Crime Is Trending Downwards But the Proportion of Arrests Involving Females Is Increasing
Overall youth arrests have declined Arrests involving females increased as a proportion of total youth arrests
Source: https://www.ojjdp.gov/ojstatbb/snapshots/
Santa Clara County Probation also reported a decline in juvenile arrests and citations for youth. The reduction may be attributed to factors such as law enforcement, staffing patterns, and a focus on school-based and prevention-oriented programs like that of the Task Force.
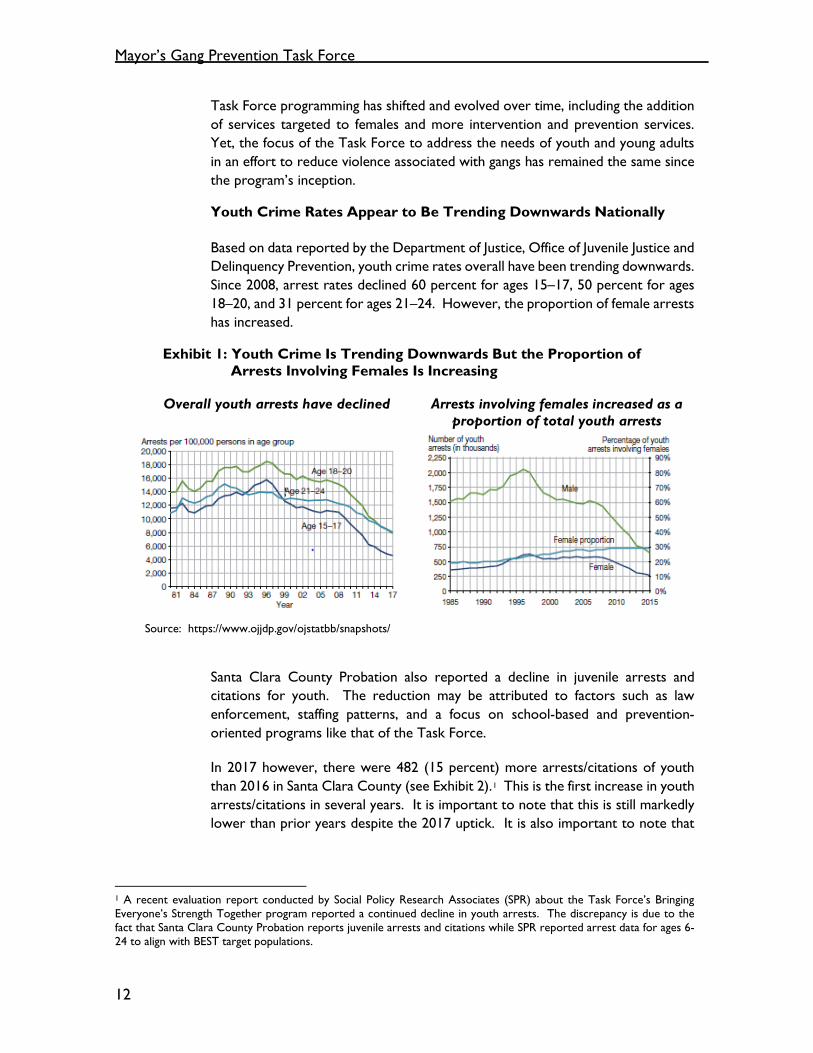
In 2017 however, there were 482 (15 percent) more arrests/citations of youth than 2016 in Santa Clara County (see Exhibit 2).1 This is the first increase in youth arrests/citations in several years. It is important to note that this is still markedly lower than prior years despite the 2017 uptick. It is also important to note that
1 A recent evaluation report conducted by Social Policy Research Associates (SPR) about the Task Force’s Bringing Everyone’s Strength Together program reported a continued decline in youth arrests. The discrepancy is due to the fact that Santa Clara County Probation reports juvenile arrests and citations while SPR reported arrest data for ages 6-24 to align with BEST target populations.
Introduction
13
one youth may be arrested or cited multiple times. While there were 3,792 arrests and citations in 2017, 2,433 youth accounted for those arrests/citations.
Exhibit 2: Santa Clara County Youth Arrests/Citations Showed a Declining Trend But Increased in 2017
Source: Santa Clara County Probation 2017 and 2013 Annual Reports.2
What Is a Youth Gang?
The definition of a gang3 as used by the U.S. Department of Justice and the Department of Homeland Security's Immigration and Customs Enforcement is:
A. An association of three or more individuals;
B. Whose members collectively identify themselves by adopting a group identity, which they use to create an atmosphere of fear or intimidation, frequently by employing one or more of the following: a common name, slogan, identifying sign, symbol, tattoo or other physical marking, style or color of clothing, hairstyle, hand sign or graffiti;
C. Whose purpose in part is to engage in criminal activity and which uses violence or intimidation to further its criminal objectives.
D. Whose members engage in criminal activity or acts of juvenile delinquency that if committed by an adult would be crimes with the intent to enhance or preserve the association's power, reputation or economic resources.
E. The association may also possess some of the following characteristics:
1. The members may employ rules for joining and operating within the association.
2. The members may meet on a recurring basis.
2 https://www.sccgov.org/sites/probation/reports/Pages/Annual-Reports.aspx.
3 https://www.nij.gov/topics/crime/gangs/pages/definitions.aspx.
9,7208,303
6,6125,636
3,990 3,310 3,792
0
2,000
4,000
6,000
8,000
10,000
12,000
2011 2012 2013 2014 2015 2016 2017
All Arrests/Citations

Mayor’s Gang Prevention Task Force
14
3. The association may provide physical protection of its members from others.
4. The association may seek to exercise control over a particular geographic location or region, or it may simply defend its perceived interests against rivals.
5. The association may have an identifiable structure.
Task Force Organization Structure
The Task Force has two leadership teams—the Policy Team and the Technical Team. The Policy Team develops the strategic direction for the Task Force, while the Technical Team provides prevention and intervention services through a collaboration of over 150 members from over 70 agencies.
• The Policy Team: Co-chaired by the City of San José’s Mayor and Police Chief, the Policy Team consists of local government officials, school district leaders, representatives from community-based organizations, and faith-based and neighborhood leaders. This team meets quarterly.
The Policy Team is further divided into four subcommittees: Interagency, Community Engagement, Technical Team,4 and the School City Collaborative. Sub-committees meet in the months between quarterly Policy Team meetings.
• The Technical Team: The Technical Team is responsible for delivering prevention and intervention services to the community by “putting best practices and resources into action”. Among its 150 members are staff from PRNS, City-funded agencies, faith leaders, the San José Police Department (SJPD), school officials, and other direct-service organizations. The Technical Team also includes many organizations that do not receive funding from the City.
The Technical Team meets monthly to share announcements, review reported gang-related incidents and trends for the current month from SJPD5, and address critical gang-related activity through the development of action plans in four regional divisions: Western, Central, Foothill and Southern.6 Organizations are expected to provide updates regarding action items from previous meetings,
4 The Technical Team Subcommittee of the Policy Team is different from the Technical Team mentioned above. The Technical Team Subcommittee (co-chaired by the Task Force manager and a SJPD Captain) is a part of the Policy team and their goal is to “discuss strategies to better leverage resources to address issues, and to ensure cross-divisional engagement by members.”
5 Gang-incidents are broadly categorized as violent (homicide, robbery, rape, aggravated assault) and property (burglary, larceny, vehicle theft) crimes.
6 This part of the meeting is split into four separate meeting groups by divisions which are aligned with those of the SJPD. Each division has a lead, or “precinct captain” and two co-leads, one representative from PRNS and one from a Community Based Organization (CBO).
Introduction
15
discuss current events, and create new action items. For example, if there was gang-activity at a high school, organizations who provide services in that area will discuss possible ways to intervene.
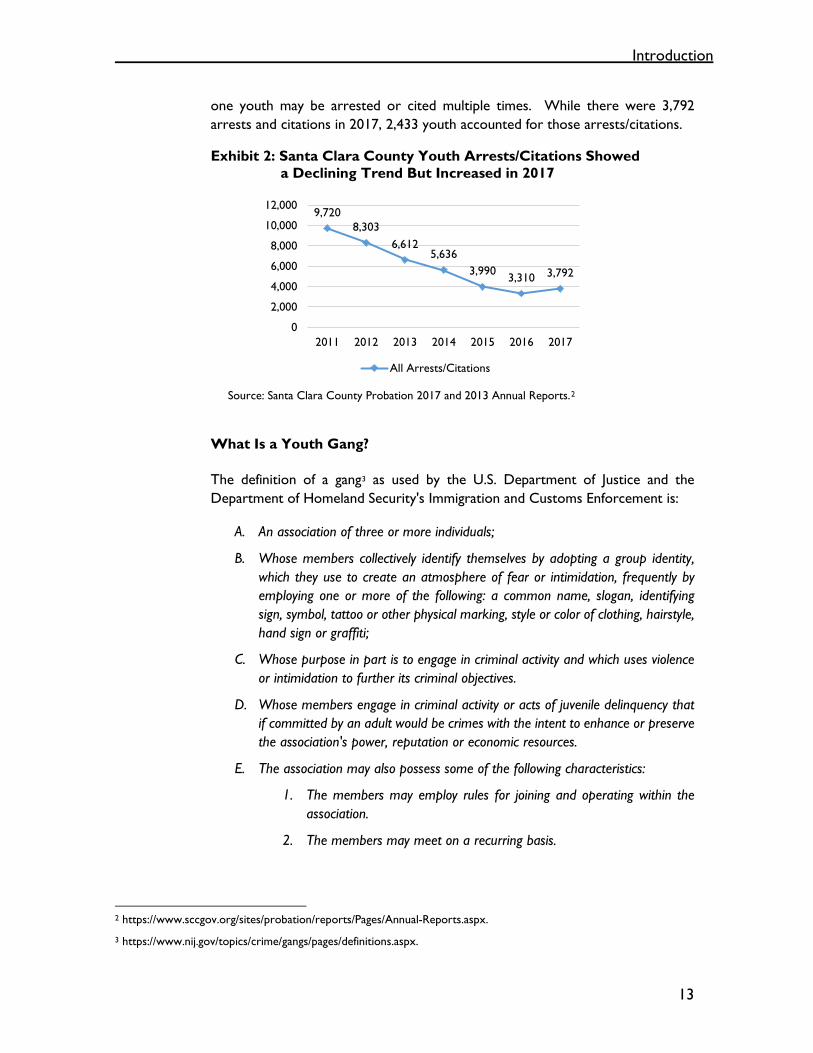
Exhibit 3: The Task Force’s Organization Includes Multiple Subcommittees and Teams
Source: Mayor’s Gang Prevention Task Force Strategic Workplan 2018-2020 The 2018-20 Task Force Strategic Plan Provides Near Term Goals and Strategies
Every three years, the Task Force develops a three-year Strategic Workplan plan to “mobilize and focus the collective efforts of all cross-sector stakeholder members.” The Strategic Work Plan reflects the collective communication and agreement of stakeholders, and is a vehicle to provide stakeholders measurable feedback about their collective efforts and successes.
In 2017, Task Force partners, service providers, parents, and youth were engaged to provide feedback on future Task Force direction. This engagement process also raised several ideas and strategies for tackling the complex and multifaceted issue of youth and gang violence. Stakeholders identified the following strategies for the 2018-2020 cycle:
• Reaffirming and strengthening ties between the Task Force and other service and resource providers to supply a critical continuum of services to youth at risk,
• Working directly with neighborhoods to build the capacity for advocacy,
Mayor's Gang Preventon Task Force Organization Structure
MayorChief of Police
District Attorney Probation
School Superintendents County Supervisors
Policy Team
Inter Agency Community Engagement Technical Team (Policy)
School City Collaborative
Subcommittees
CBOsSJPD
Schools Faith-based Community
Technical Team
Mayor’s Gang Prevention Task Force
16
• Combining data from multiple Task Force partners to inform action and investment, and
• Continuing to invest in programming that makes a difference in gang-impacted neighborhoods.
Guided by this feedback, the Strategic Plan for 2018-2020 set five strategic goals for the Task Force:
Goal #1: Strengthen the Continuum of Care
Goal #2: Implement outcome evaluation studies of Task Force funded programs and services with a focus on impact of services
Goal # 3: Develop strategies to place Task Force youth and young adults in vocational training programs and jobs
Goal #4: Increase community safety through empowered neighborhoods
Goal #5: Enhance linkage and leverage of all youth violence prevention initiatives
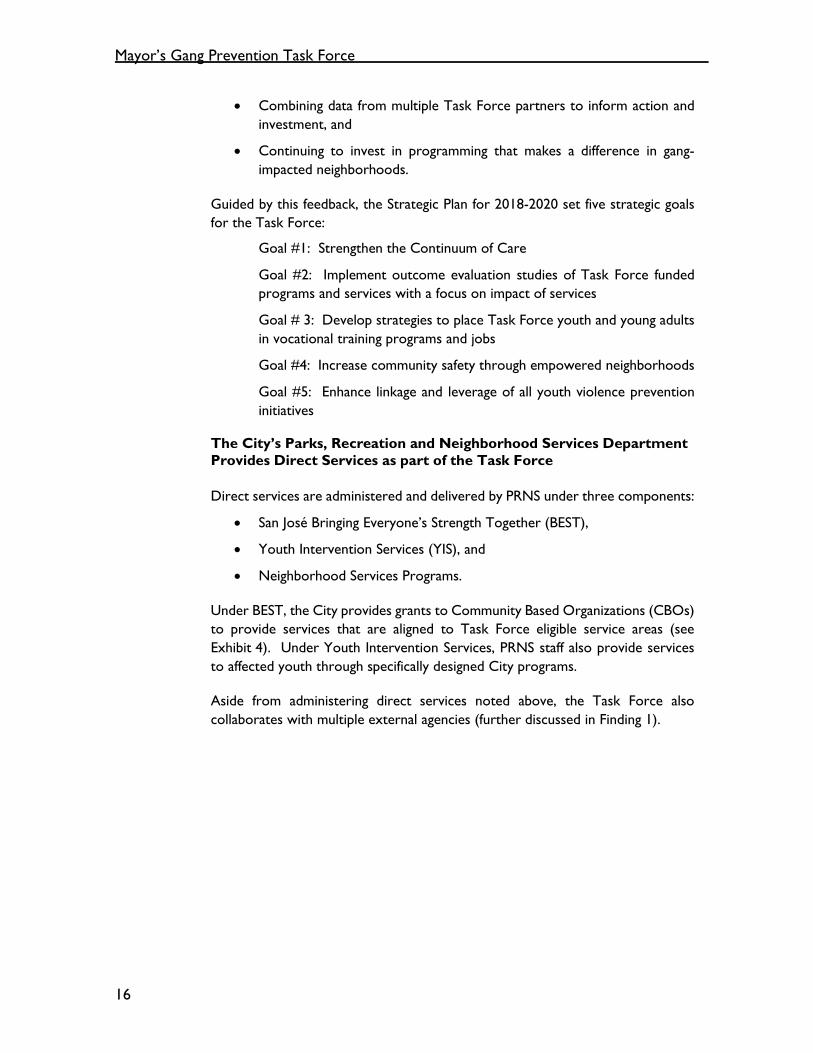
The City’s Parks, Recreation and Neighborhood Services Department Provides Direct Services as part of the Task Force
Direct services are administered and delivered by PRNS under three components:
• San José Bringing Everyone’s Strength Together (BEST),
• Youth Intervention Services (YIS), and
• Neighborhood Services Programs.
Under BEST, the City provides grants to Community Based Organizations (CBOs) to provide services that are aligned to Task Force eligible service areas (see Exhibit 4). Under Youth Intervention Services, PRNS staff also provide services to affected youth through specifically designed City programs.
Aside from administering direct services noted above, the Task Force also collaborates with multiple external agencies (further discussed in Finding 1).
Introduction
17
Exhibit 4: Mayor’s Gang Prevention Task Force Services Provided by PRNS
Source: Strategic Work Plan 2018-2020. *In January 2019, the Policy Team approved to combine two eligible services “Substance Abuse Services” and “Personal Transformation - Cognitive Group”. The next RFQ cycle will be based on the updated eligible services.
BEST Grantees Provide Services to Youth as Defined by Task Force Strategy
BEST is referred to as the “funding arm” of the Task Force. Under BEST, PRNS provides grant funding and oversight for direct services delivered by CBOs. PRNS identifies BEST grantees through a Request for Qualification (RFQ) process. Every three years, PRNS selects CBOs that align with the Task Force Strategic Work Plan.
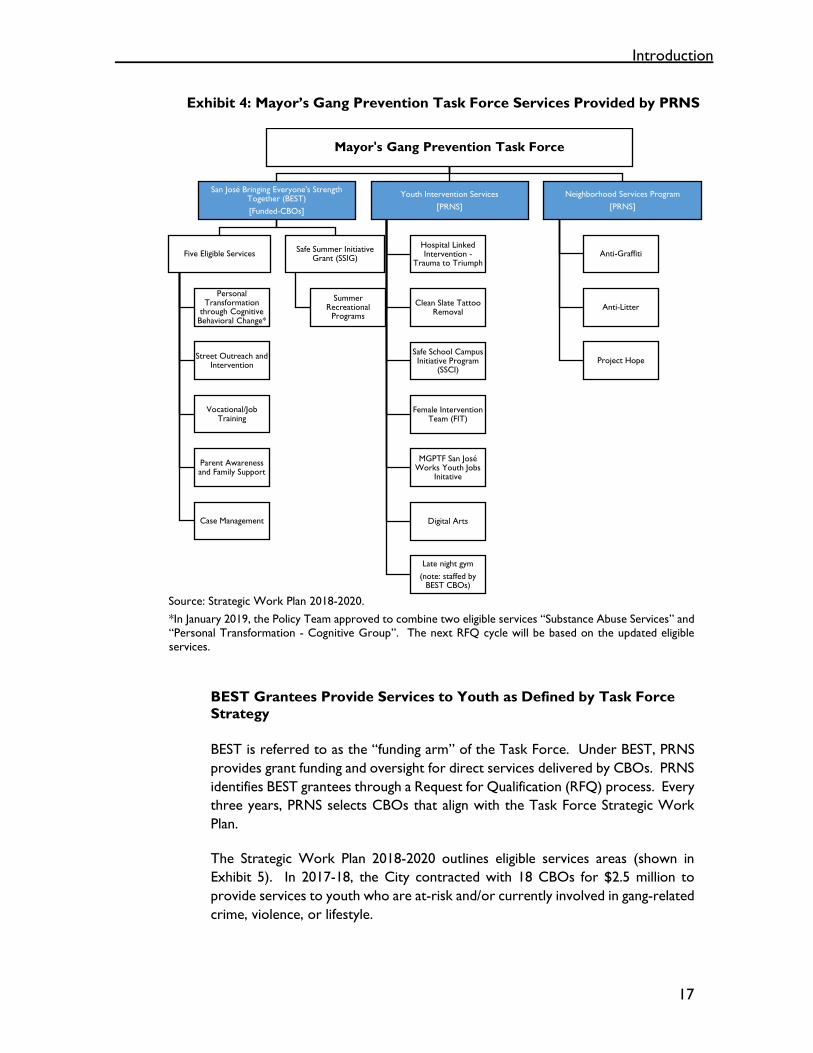
The Strategic Work Plan 2018-2020 outlines eligible services areas (shown in Exhibit 5). In 2017-18, the City contracted with 18 CBOs for $2.5 million to provide services to youth who are at-risk and/or currently involved in gang-related crime, violence, or lifestyle.
Mayor's Gang Prevention Task Force
San José Bringing Everyone's Strength Together (BEST)[Funded-CBOs]
Five Eligible Services
Personal Transformation
through Cognitive Behavioral Change*
Street Outreach and Intervention
Vocational/Job Training
Parent Awareness and Family Support
Case Management
Safe Summer Initiative Grant (SSIG)
Summer Recreational
Programs
Youth Intervention Services[PRNS]
Hospital Linked Intervention -
Trauma to Triumph
Clean Slate Tattoo Removal
Safe School Campus Initiative Program
(SSCI)
Female Intervention Team (FIT)
MGPTF San José Works Youth Jobs
Initative
Digital Arts
Late night gym(note: staffed by
BEST CBOs)
Neighborhood Services Program[PRNS]
Anti-Graffiti
Anti-Litter
Project Hope
Mayor’s Gang Prevention Task Force
18
Exhibit 5: Task Force Service Areas Eligible for Funding
Source: MGPTF Strategic Work Plan 2018-2020 Note: “Substance Abuse Services” will be combined with “Personal Transformation – Cognitive Groups” in the next RFQ cycle. The BEST grantees for the triennial period 2016-19 provided services that were based on the above eligible services.
In FY 2017-187, BEST grantees targeted services to youth ages 6-24 with activities ranging from individual case management sessions, yoga, tutoring, and support services to youth and young adults identified through a hospital-based intervention program, to other group activities.
City Staff Provide Youth Intervention Programs
Parallel to BEST grantee services, PRNS’ YIS staff provide programs to youth and young adults that are either on the path to gang membership or gang members. These programs are described in Exhibit 6.
7 BEST grantee program year for service delivery is the Fiscal Year ending August 31.
BEST Eligible Services
Personal Transformation -Cognitive Groups
Street Outreach and Intervention
Substance Abuse Services
Vocational / Job Training
Parent Awareness and Family Support
Case Management

Introduction
19
Exhibit 6: Youth Intervention Services (YIS) Programs Provide Direct Services
Program Description
Safe School Campus Initiative (SSCI)
The largest program within YIS is a partnership with 18 School Districts and provides school site visits, on-call violent incident mediation at schools (activations), and case management for higher risk participants. The goal of the program is to keep schools safe by preventing and de-escalating incidents of violence on and around school campuses. In FY 2017-18, YIS served 64 SSCI case management participants and responded to over 500 activations.
Female Intervention Team (FIT)
The FIT program leads weekly cognitive classes at 11 high schools and offers case management services for high-risk females. In FY 2017-18, YIS served 11 FIT case management participants and reported serving 1,085 duplicated participants through cognitive classes.
Hospital Linked Intervention “Trauma to Triumph”
In partnership with the Valley Medical Center Trauma Unit, this program provides bedside support and follow-up case management sessions for victims of individual/group assault and gang-related violence (ages 13-30). The goal of the program is to prevent re-victimization and/or help break the cycle of violence. In FY 2017-18, YIS served 68 case management participants.
Clean Slate Tattoo Removal Program
The Clean Slate Program provides free removal of gang-related tattoos for San José residents (ages 14-25). Participants are required to complete 30 hours of community service and attend weekly life skills group workshops for seven weeks. Seven doctors from Valley Medical Center volunteer their time to provide tattoo removal services. In FY 2017-18, YIS reported serving 75 participants.
San José Works Jobs Initiative
In partnership with the Office of Economic Development’s (OED) Work2Future program, the Task Force refers youth (ages 15-18) to receive work experience at a non-profit or in a municipal job setting. The program subsidizes participant wages. In FY 2017-18, PRNS reported serving 375 participants.
Digital Arts Digital Arts provides youth the opportunity to utilize digital arts media platforms. Participants are enrolled in a curriculum (8 sessions) that focuses on music creation, photography, and videography. The program is located at the Roosevelt and Seven Trees community centers.
Late Night Gym Late Night Gym provides evening gym activities at four community centers including Alum Rock Youth Center, Edenvale Community Center, Seven Trees, and Bascom Community Center. YIS collaborates with BEST grantees (New Hope for Youth, Firehouse Development, and Catholic Charities) in the operation of this program. In FY 2017-18, YIS reported serving over 5,000 duplicated Late Night Gym participants.
Crisis response YIS works with multiple stakeholders (e.g., SJPD, the Mayor and Council offices, and BEST grantees) to provide a crisis response to assist the community and family members when there is a violent incident in the community. The crisis response protocol “activates police and other city departments, community service organizations, social service agencies, and schools to respond promptly to acts of violence.” The response includes notification and activation of youth interventionists and communication with impacted schools. If needed, the crisis response team will facilitate community meetings. Since 2015, the crisis response team has been activated 29 times.
Source: Auditor summary of YIS programs based on review of Task Force documents and staff interviews. Task Force Target Populations
BEST grantees and YIS staff provide direct services to the City’s youth. BEST programs use defined target populations (see Exhibit 7) with the goal of aligning services with those populations over time. In FY 2012-13, target populations were re-defined as at-risk, high-risk, gang-impacted, and gang-intentional. Prior to the change, target populations were delineated as high-risk and early intervention.

Mayor’s Gang Prevention Task Force
20
Exhibit 7: Definitions of Task Force Target Populations
Target Population
Definition
At-Risk Youth residing in a high-risk community (e.g., hotspot areas, low socioeconomic areas) and have high potential to exhibit gang behaviors (e.g., behavioral issues, poor school attendance, etc.)
High-Risk Youth distinguished by the level of intensity at which the youth adopts gang lifestyle. Characteristics include several contacts with law enforcement or the juvenile justice system.
Gang-Impacted
Youth exhibiting high-risk behaviors related to gang lifestyle including arrests or contact with the juvenile justice system.
Gang-Intentional
Youth explicitly identified and/or arrested for gang-related incidents or acts of gang violence.
Source: Evaluation of San José’s Mayor’s Gang Prevention Task Force by Resource Development Associates and Cycle 26 FY 2016-17 Final Evaluation Report.8
Over time, BEST grantees have begun reaching increasingly more at-risk youth with services. Exhibit 8 shows BEST grantee populations for the last six years.9 Target populations are discussed in more detail in Finding 2.
Exhibit 8: BEST Grantee Actual Service Populations for the Last Six Years
Source: Community Crime Prevention Associates BEST Evaluation Report and BEST Grantee Workbooks (FY 2017-18).
8 https://www.ncjrs.gov/pdffiles1/ojjdp/grants/250620.pdf.
9 Target populations are not tracked and reported for programs under Youth Intervention Services (except for case management participants which are not tracked the same way as BEST grantees); therefore, the data only includes BEST grantee target populations.
7%
31%20%
45% 48% 48%
59%32%
40%
27% 19% 26%
24% 24% 28%20% 23% 18%
10% 13% 9% 7% 10% 8%
0%
20%
40%
60%
80%
100%
2012-13 2013-14 2014-15 2015-16 2016-17 2017-18
At-risk High-risk Gang-impacted Gang-intentional
Introduction
21
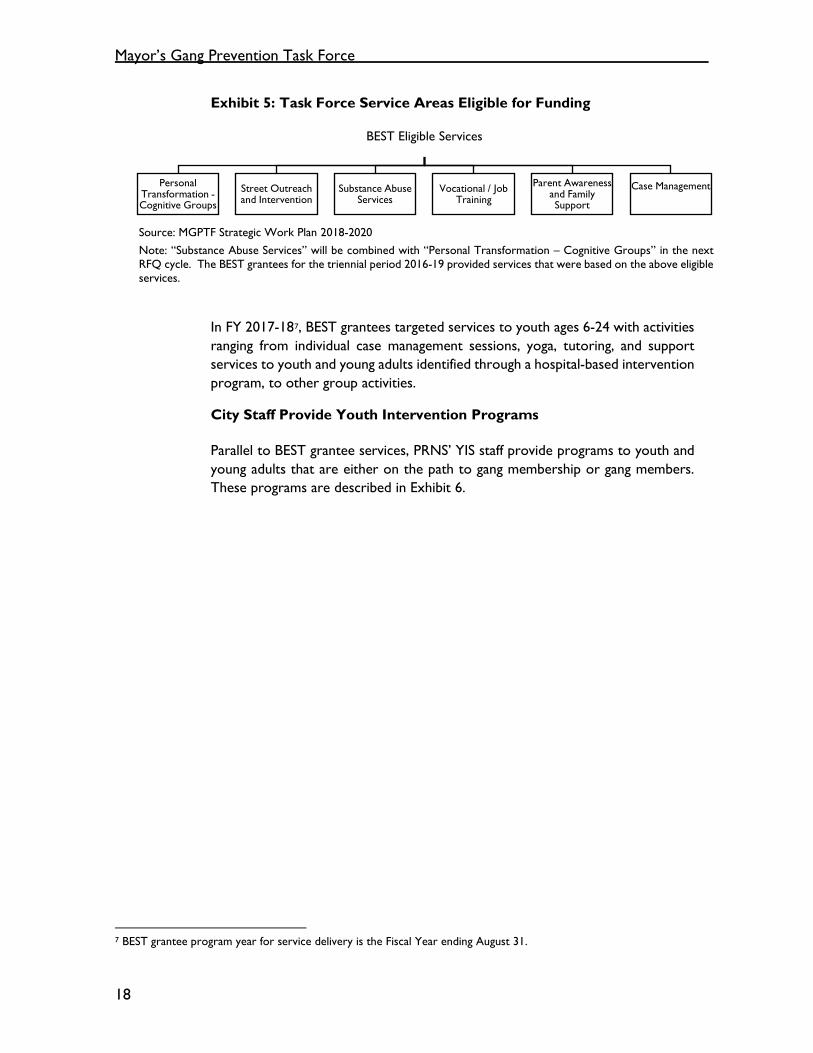
Task Force Priority Service Areas Are Determined By Hot Spots
While BEST and YIS services are provided throughout the City, every three years the Task Force identifies priority service areas known as hot spots (see Exhibit 9).
The Task Force conducts a hot spot exercise, in which representatives from the Task Force and BEST grantees provide insights based on experiences working in certain areas that may have gang-related activity. This ground-level information is then combined with information on reported violence and gang-related violence from the SJPD, as well as data regarding poverty, unemployment, and under-resourced schools. In FY 2017-18, there were 18 hot spots and two emerging hot spots. Generally, YIS and BEST grantees provide services throughout the City, with services more concentrated in hot spot areas.
Exhibit 9: Hot Spot Service Areas By Council District (2017-18)
Source: Auditor map of Task Force Hot Spot designations (2017-18).
Mayor’s Gang Prevention Task Force
22
Budget and Staffing
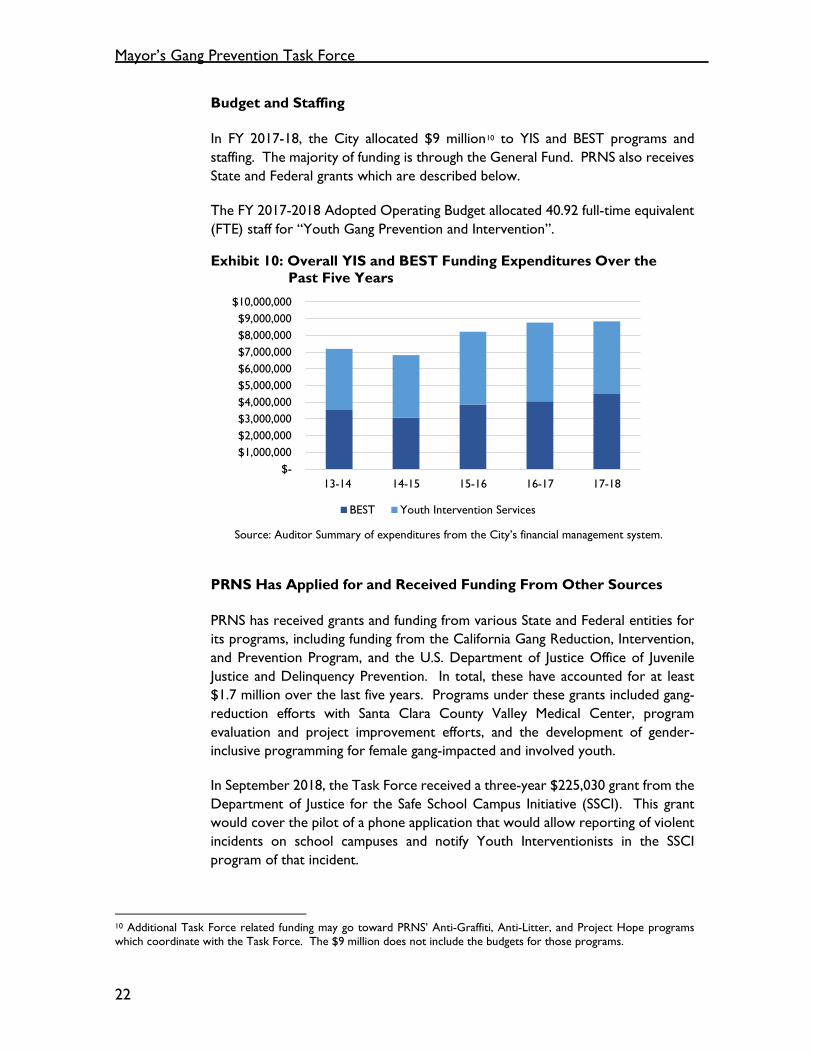
In FY 2017-18, the City allocated $9 million10 to YIS and BEST programs and staffing. The majority of funding is through the General Fund. PRNS also receives State and Federal grants which are described below.
The FY 2017-2018 Adopted Operating Budget allocated 40.92 full-time equivalent (FTE) staff for “Youth Gang Prevention and Intervention”.
Exhibit 10: Overall YIS and BEST Funding Expenditures Over the Past Five Years
Source: Auditor Summary of expenditures from the City’s financial management system.
PRNS Has Applied for and Received Funding From Other Sources
PRNS has received grants and funding from various State and Federal entities for its programs, including funding from the California Gang Reduction, Intervention, and Prevention Program, and the U.S. Department of Justice Office of Juvenile Justice and Delinquency Prevention. In total, these have accounted for at least $1.7 million over the last five years. Programs under these grants included gang-reduction efforts with Santa Clara County Valley Medical Center, program evaluation and project improvement efforts, and the development of gender-inclusive programming for female gang-impacted and involved youth.
In September 2018, the Task Force received a three-year $225,030 grant from the Department of Justice for the Safe School Campus Initiative (SSCI). This grant would cover the pilot of a phone application that would allow reporting of violent incidents on school campuses and notify Youth Interventionists in the SSCI program of that incident.
10 Additional Task Force related funding may go toward PRNS’ Anti-Graffiti, Anti-Litter, and Project Hope programs which coordinate with the Task Force. The $9 million does not include the budgets for those programs.
$- $1,000,000 $2,000,000 $3,000,000 $4,000,000 $5,000,000 $6,000,000 $7,000,000 $8,000,000 $9,000,000
$10,000,000
13-14 14-15 15-16 16-17 17-18
BEST Youth Intervention Services

Introduction
23
The City Has Contracted for Various Program Evaluations
Historically, Community Crime Prevention Associates (CCPA) served as the independent evaluation consultant for the Task Force. CCPA used self-reported data from BEST grantees to report outcome measures including: participant-reported increases in school attendance, reductions in recidivism, reductions in substance abuse, and participants’ ability to express themselves in non-violent ways and connect with adults.
In 2012, San José received a Department of Justice grant to conduct a multi-year evaluation of the Task Force. PRNS worked with Resource Development Associates (RDA) to assess the implementation and impact of the Task Force over the course of its existence and identify potential lessons for other cities considering similar efforts. The first part of the evaluation effort, completed in 2013, was a 20-year retrospective evaluation that examined the development, implementation, and impact of the Task Force from its inception, assessing how the Task Force has evolved over time. The second part of the evaluation, completed in 2015, provided an in-depth analysis of the impact of the Task Force on youth crime in San José. The study found that BEST services were associated with neighborhood-level reductions in youth arrests and that clients with existing arrest histories experienced reduced juvenile justice system involvement.
Current Evaluation
In 2016, the City Council directed staff to evaluate and incorporate additional methods for collecting and sharing objective data, to better understand the direct impact that the BEST and Task Force services provide.
In 2018, PRNS selected a new evaluation consultant, Social Policy Research Associates (SPR) to evaluate the BEST program. SPR examined the effect of BEST services on crime within SJPD beats over an eight-year period11 and found a modest association between the delivery of BEST services and a reduction of both gang incidents and youth arrests (i.e., arrests of people ages 24 and under). The evaluation also made recommendations about future evaluations of BEST and the Task Force, specifically of the overall scope, the influence of Task Force activities, and the individual-level outcomes.12
Future Program Evaluations
PRNS plans to develop an evaluation that can assess outcomes for BEST’s individual participants. To that end, staff has begun working with various agencies to formalize data-sharing agreements and develop in-house tools to improve data-driven decision-making. Specifically, PRNS is working with the Library Department and the Santa Clara County Office of Education to develop data-sharing
11 Fiscal Years 2010-11 to 2017-18.
12 For SPR’s report see: https://www.sanjoseca.gov/DocumentCenter/View/83565.
Mayor’s Gang Prevention Task Force
24
agreements for DataZone, which aggregates school-based data for many of the Santa Clara County school districts.
Audit Objective, Scope, and Methodology
The objective of our audit was to review the evolution of the Mayor’s Gang Prevention Task Force and BEST programs over time, including contract monitoring and grantee performance. We assessed the performance of service providers under the BEST program, the variety of services offered through YIS, the populations served, and overall program expenditures. Our review focused on YIS and BEST; we did not review Neighborhood Services provided by the Anti-Litter, Anti-Graffiti, and Project Hope programs. To achieve our audit objectives, we performed the following:
• Reviewed the history and evolution of the Task Force by reviewing:
o Task Force Strategic Workplans 2005 – 2011, 2015 - 2020
o PRNS’ MGPTF Annual Reports (2014-2018)
• Reviewed various City-wide policies and procedures including:
o City Administrative Policy on Procurement and Contract Process Integrity and Conflict of Interest (Administrative Policy 5.1.1)
o Council Policy 9-13 on Grants to Outside Entities
o City-wide Grants Manual Policies and Procedures
o The Finance Department’s Request for Proposals Manual
• Reviewed PRNS’ internal procedures including:
o Strategic Partnership Unit’s Grant Monitoring Guidelines
o Strategic Partnership Unit’s Contracts Management Handbook
o Strategic Partnership Unit’s Contract Development Handbook
o Youth Intervention Services Safe School Campus Initiative Technical Assistance Training Manual (draft)
• Analyzed Task Force and BEST program expenditures and budgets including:
o PRNS Adopted Operating Budget (FY 2015-2018)
o City Manager’s Budget Addenda (FY 2013-2018)
o Expenditure data from the City’s financial management system (FY 2013 -2019)
Introduction
25
o Mayor’s Budget Message and Council Budget Documents (FY 2015-2017)
• Interviewed staff from PRNS Strategic Partnership Unit and Youth Intervention Services, as well as the SJPD
• Reviewed crime data for San José and Santa Clara County from SJPD and Santa Clara County Probation, and federal crime data from the Department of Justice Office of Juvenile Justice and Delinquency Prevention
• Reviewed annual BEST evaluation reports including:
o Community Crime Prevention Associates (CCPA) evaluation reports (2010-2017)
o Resource Development Associates (RDA) evaluation reports (2013 and 2015)
o Social Policy Research Associates (SPR) evaluation report (2019). In addition, audit staff interviewed SPR during the course of their evaluation
• Observed various Task Force policy or other meetings and events, including:
o Technical Team meeting (September 2018)
o Policy Team meeting (January 2019)
o Interagency Subcommittee meeting (February 2019)
o Annual Crime and Gang Prevention Summit
• Interviewed staff from Santa Clara County Re-entry Resource Center
• Benchmarked with other jurisdictions’ gang- or youth-violence initiatives, including interviews and reviewing evaluation or other reports, for the following programs:
o Oakland Unite
o Los Angeles Gang Reduction and Youth Development program
• Reviewed City agreements with school districts, BEST grantees, Santa Clara County Probation, and Santa Clara County Valley Medical Hospital.
• Reviewed PRNS’ monitoring activities and grant compliance of 18 BEST grantees (2017-18 BEST cycle):
o Reviewed grantee quarterly performance reports and site monitoring documentation
o Interviewed BEST grantees during site visits

Mayor’s Gang Prevention Task Force
26
• Reviewed Youth Intervention Services program activities, including:
o Reviewed referrals for YIS case management services
o Analyzed PRNS’ data management system QuesGen for information on the Safe School Campus Initiative and the Female Intervention Team
o Analyzed incident report data (2016-2018) for activations in the Safe School Campus Initiative program
o Reviewed reported participant data for the Female Intervention Team (FIT), the Hospital Linked Intervention “Trauma to Triumph” program, the Clean Slate Tattoo Removal Program, the San José Works Jobs Initiative, and Late Night Gym
o Observed and interviewed Youth Intervention Specialists and Youth Interventionists at schools
o Interviewed school administrators from Independence, Pegasus, James Lick, Santa Teresa, and Overfelt High Schools, as well as Sylvandale Middle School
27
Finding I Better Coordination Among Task Force Partners Can Improve Service Delivery
Summary
The Task Force achieves its mission by providing services through a continuum of care strategy, which includes: prevention, intervention, suppression, and re-entry. This continuum of care relies on multiple players, including staff in PRNS, the San José Police Department, BEST grantees, school districts, and various Santa Clara County agencies. The success of the Task Force in providing services to San José youth relies on coordination among the various parties.
We found that while the City has an agreement with Santa Clara County Probation to receive client referrals for City-provided case management services, very few clients receiving services had been referred from Probation. Other informal activities done in coordination with Probation could also benefit from a more formalized, defined process. In addition, despite re-entry being part of the Task Force’s continuum of care, the City does not currently have an agreement with the Santa Clara County Office of Re-entry Services and does not provide or receive any referrals to it. Additional coordination between PRNS and these County agencies can help strengthen the Task Force continuum of care. Finally, additional strategic coordination with SJPD would be beneficial for future initiatives to address overall youth violence.
The Task Force Achieves Its Goals Through a Continuum of Care Strategy
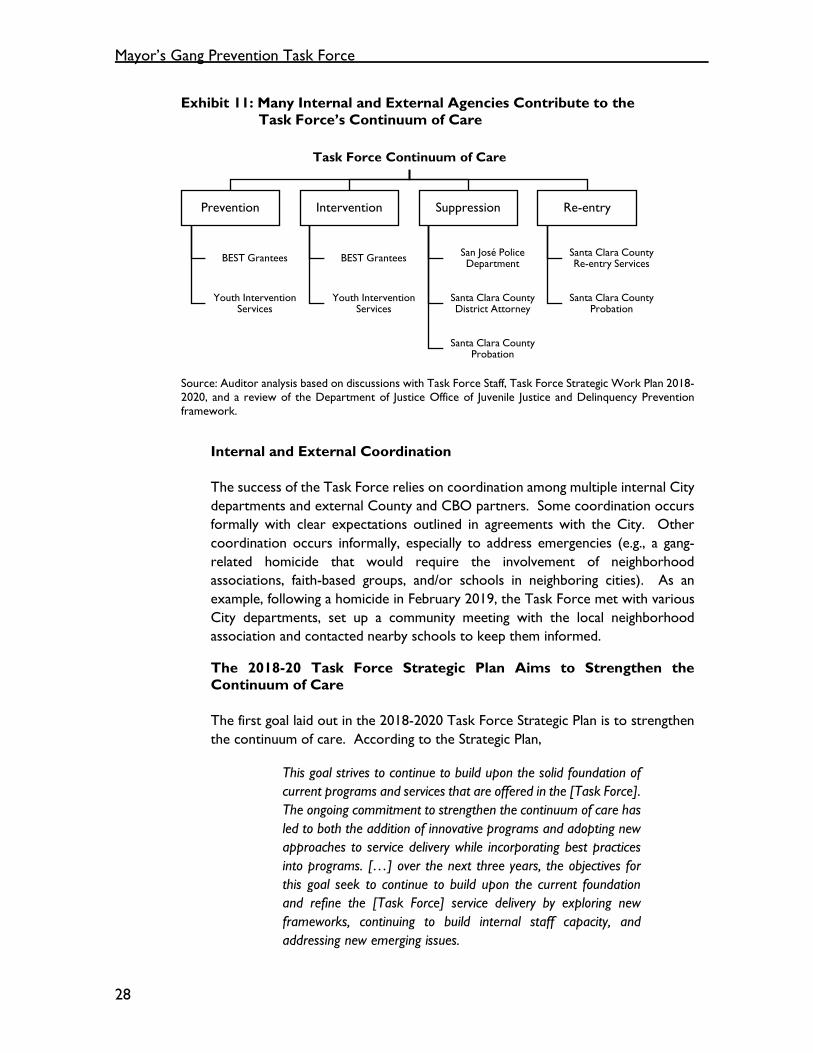
The Task Force collaborates with many departments and agencies through a combination of prevention, intervention, suppression, and re-entry services (see Exhibit 11). The Task Force is referred to as a:
broad continuum of services [which] includes programs coordinated under the direction of the Task Force as well as a number of projects led by individual Task Force members.
Combined, these services make up the Task Force’s “Continuum of Care” strategy.
Mayor’s Gang Prevention Task Force
28
Exhibit 11: Many Internal and External Agencies Contribute to the Task Force’s Continuum of Care
Source: Auditor analysis based on discussions with Task Force Staff, Task Force Strategic Work Plan 2018-2020, and a review of the Department of Justice Office of Juvenile Justice and Delinquency Prevention framework.
Internal and External Coordination
The success of the Task Force relies on coordination among multiple internal City departments and external County and CBO partners. Some coordination occurs formally with clear expectations outlined in agreements with the City. Other coordination occurs informally, especially to address emergencies (e.g., a gang-related homicide that would require the involvement of neighborhood associations, faith-based groups, and/or schools in neighboring cities). As an example, following a homicide in February 2019, the Task Force met with various City departments, set up a community meeting with the local neighborhood association and contacted nearby schools to keep them informed.
The 2018-20 Task Force Strategic Plan Aims to Strengthen the Continuum of Care
The first goal laid out in the 2018-2020 Task Force Strategic Plan is to strengthen the continuum of care. According to the Strategic Plan,
This goal strives to continue to build upon the solid foundation of current programs and services that are offered in the [Task Force]. The ongoing commitment to strengthen the continuum of care has led to both the addition of innovative programs and adopting new approaches to service delivery while incorporating best practices into programs. […] over the next three years, the objectives for this goal seek to continue to build upon the current foundation and refine the [Task Force] service delivery by exploring new frameworks, continuing to build internal staff capacity, and addressing new emerging issues.
Task Force Continuum of Care
Prevention
BEST Grantees
Youth Intervention Services
Intervention
BEST Grantees
Youth Intervention Services
Suppression
San José Police Department
Santa Clara County District Attorney
Santa Clara County Probation
Re-entry
Santa Clara County Re-entry Services
Santa Clara County Probation
Finding 1
29
Activities under the Continuum of Care Range From Prevention to Re-entry
The Task Force utilizes the following approaches under its continuum of care strategy.
1. Primary prevention: Activities that target the entire population of high-crime, high-risk communities to reduce community risk factors or provide protective factors for community members. In addition to the Task Force programs noted in Exhibit 11, primary prevention activities may also include: PRNS’ Anti-litter, Anti-graffiti, and Project Hope13 programs. These programs include membership from neighborhood association representatives and SJPD staff that participate in Project Hope’s neighborhood association meeting. Primary prevention resources and efforts are coordinated by City staff.
2. Secondary prevention: Direct activities for youth assessed as at-risk or high-risk for gang membership. In FY 2017-18, BEST grantees reached over 2,100 participants with prevention services. Sixty-six percent of BEST participants received secondary prevention. In addition, the Safe Summer Grant Initiative (SSIG) and Late Night Gym provide secondary prevention. City staff also provided secondary prevention services under the YIS Safe School Campus Initiative (SSCI), Female Intervention Team (FIT), Hospital Linked Intervention, San José Works, and Digital Arts programs.
3. Intervention: Direct activities for youth that show strong characteristics of gang involvement and/or have been arrested for gang-related incidents. In FY 2017-18, BEST grantees reached over 700 participants with intervention services. Case management services for youth (and sometimes families) are the primary intervention. These services seek to identify youth needs and develop individual services plans for participants. Activities also include: San José Works, Clean Slate Tattoo Removal, Hospital Linked Intervention, and SSCI.
4. Suppression: SJPD leads targeted suppression activities when necessary. SJPD Captains are integrated into monthly Technical Team meetings and the San José Police Chief is co-chair of the Policy Team. Santa Clara County Probation and the District Attorney’s Office also contribute to suppression efforts. Both agencies participate in quarterly coordination meetings with the Task Force. Probation and SJPD may provide
13 During the 2016-17 budget process, City Council approved one-time funding to implement an 18-month (July 2016-December 2017) "Project Hope" pilot program in the Cadillac/Winchester neighborhood. This program uses principles of community partnership, community development, neighborhood empowerment, and coordination of a broad range of City services to address challenging neighborhood issues such as crime and blight. In FY 2018-19, the program transitioned to an ongoing program and has funding to provide services to two neighborhoods—Cadillac/Winchester and Roundtable and one-time funding for services at Welch Park.
Mayor’s Gang Prevention Task Force
30
participant referrals to Task Force services. The Probation partnership with the Task Force is embodied in an operational agreement.
5. Re-entry: Santa Clara County Re-entry Services provides re-entry services for former offenders over the age of 18 and Santa Clara County Probation provides re-entry services to youth leaving juvenile hall under the age of 18. As discussed later, the Task Force does not have a formal partnership with the SCC Re-entry Resource Center.
In 2017-18, Task Force services were largely prevention focused, and most participants reached received prevention-related services. The Task Force also includes a community engagement component. Activities include the hosting of an annual Gang Prevention and Awareness Summit.
Coordination With the Santa Clara County Probation Department Can Be Improved
The Santa Clara County Board of Supervisors and multiple County departments, including the Probation Department, Department of Drug and Alcohol Services, the District Attorney’s Office, the Office of Education, the Public Defender’s Office, the Public Health Department, Superior Court (Juvenile Division), and the Department of Corrections and Rehabilitation participate in the Task Force Policy Team meetings. Additionally, the Interagency Subcommittee includes an assigned SCC Board Supervisor, and representatives from Probation, the District Attorney’s Office, County Office of Education, and the Public Defender’s Office, as well as school superintendents.
PRNS has formal agreements with Santa Clara County Probation and the Santa Clara Valley Medical Center to support Task Force programming.14
PRNS Has an Agreement with Santa Clara County Probation to Coordinate Activities and Share Data
In 2017, the City entered into a coordination and data sharing agreement with the County’s Probation Department for YIS case management services. The agreement formalized the scope and types of services provided to clients referred by Probation, as well as the referral process for client access to City services, and the process to exchange data. The agreement also defines performance metrics for YIS case management.
As part of the agreement, the County is to provide referrals from Probation Officers in the Probation Adult Services Division to YIS case management services, and provide access to Probation participant data to track progress. The target population under the agreement includes:
14 Staff reports that it has also begun data-sharing discussions with the Santa Clara County Public Health Department.
Finding 1
31
• Clients or youth who are at risk to high risk for gang-involvement.
• Clients between 18-24 years of age that are on deferred entry of judgement, formal probation, mandatory supervision, or post-release community supervision.
• Female youth on probation and in custody (Juvenile Hall and James Ranch) between 13-21 years of age.
• Youth on active juvenile probation supervision.
Coordination of the Task Force with Probation is important in a context where overall youth crime in Santa Clara County increased in 2017.
Few Referrals for Case Management Services for Higher Risk Youth Are From Probation
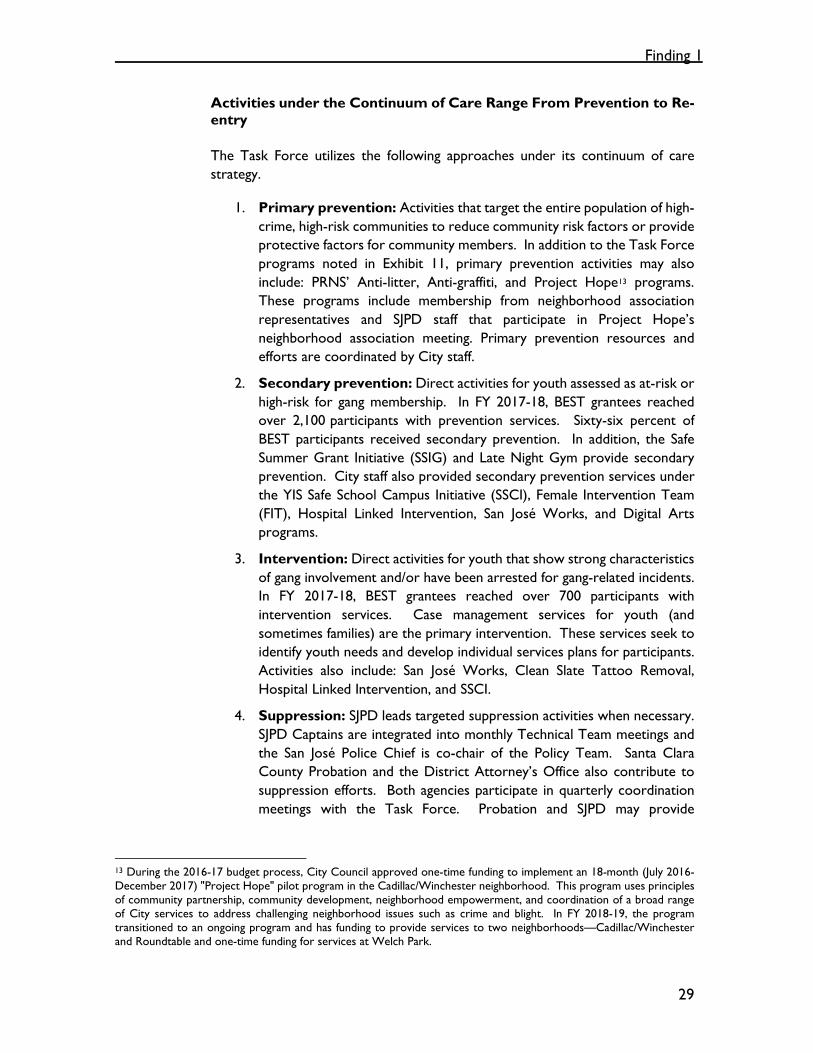
YIS received only a small number of referrals from Probation in FY 2017-18.15 Most participants are referred for case management by school administrators, which reflects the strong relationship Youth Interventionists have with schools.
Exhibit 12: Referrals for Case Management Were Mostly From Schools (FY 2017-18)
Source: Auditor analysis of case management referrals from QuesGen (YIS database system for case management participants). Note: Does not include Hospital Intervention Program case management participants. All referrals are from Valley Medical Center staff generally after a traumatic event. Five referrals were not included because data did not clearly define referral source.
15 It should be noted that participants referred from schools or other agencies could be on probation but were not formally referred by County Probation.
0
10
20
30
40
50
60
70
School YouthIntervention
Staff
Other Probation Self Client
FIT SSCI
Mayor’s Gang Prevention Task Force
32
The City of Oakland’s Gang Prevention program Oakland Unite aims to serve youth currently involved in the justice system, ensuring those with a criminal record receive the intensive services needed. Oakland Unite has established a more targeted approach to receiving referrals from Probation. Specifically, this youth program primarily serves participants referred from Alameda County Probation through an established referral process which enables Oakland Unite to have a more active role in receiving referrals and information from Alameda County Probation.
Performance Measurement and Reporting Has Not Been Occurring
We also found that not all components of the City’s agreement with Probation had been fulfilled by either Probation or YIS. For example:
• The agreement details several reports that YIS and Probation are to share with one another to track progress. This has not occurred to date.
• Recommended performance targets and metrics to measure the success of YIS case management such as time to initial client contact (no more than 3 business days), time to first visit/appointment (within 14 calendar days from referral), engagement in services and dosage (clients engaged within 30 days of first contact, number and length of sessions/activities attended per client) do not appear to have been analyzed or reported to date.
Measuring performance and reporting is important because it helps both YIS and Probation assess progress towards goals or whether program modifications are needed.
The City Coordinates with the County Probation Department for Some Activities Informally Outside the Scope of the Agreement
In addition to the City’s formal coordination outlined in the agreement with Probation on referrals and data sharing, the City informally coordinates with County Probation in other ways on a regular basis. The roles and expectations for these activities are not documented or reflected in the agreement. For example, YIS staff assist in transportation of youth to a Probation-led weekly sports league, but the agreement with Probation does not account for this activity, nor is it clear whether they are gang-impacted/intentional youth.
Finding 1
33
Recommendation #1: To ensure services reach highest-risk youth and further strengthen the partnership, the Department of Parks, Recreation and Neighborhood Services should work with Santa Clara County Probation to:
a) Set goals and criteria for expected referrals,
b) Report on the results and outcomes achieved and units of service provided, and
c) Amend its agreement to include all current activities performed by Youth Intervention Services.
The Task Force Does Not Currently Coordinate With Santa Clara County Re-entry Services
Re-entry for former offenders leaving incarceration is an important component of the Task Force’s continuum of care. The Santa Clara County Re-Entry Resource Center provides a broad range of support services to adults over 18 years of age released from the criminal justice system within the last 12 months.16 Services provided include assistance to certain benefits (e.g., CalFresh and Medicaid), mental health services, housing resources, health services, housing assistance, transitional case management, and faith-based connections. Some Task Force participants may be eligible for these re-entry services.
While the Task Force’s website links to the Re-entry Resource Center, the Re-entry Center has not been receiving referrals from PRNS-provided programs. Further, the Task Force does not have a formal partnership in place with Re-entry Services, nor is it an eligible service focus for BEST grantees.
There may be opportunities to collaborate formally and maximize resources from the Task Force and the Re-entry Center. Currently, the Re-entry Center receives referrals directly from the Santa Clara County Office of Probation, CBOs, and the Superior Court through a shared database system. PRNS could build on its existing data sharing agreement with Probation to include the Re-entry Center. This would allow PRNS to gain access to the Re-entry Center’s database and refer eligible participants of the Task Force that could benefit from receiving re-entry services.
16 The State of California enacted criminal justice system changes through California Assembly bills AB 109 and AB 117. As a result, individuals on parole who would have previously been the responsibility of the State are now being supervised by local county probation and sheriff departments. In response to AB 109, Santa Clara County established the County's Re-entry Resource Center to assist formerly incarcerated individuals as they transition from incarceration. The Resource Center opened in February 2012 and focuses on recidivism reduction strategies; streamlining processes to link inmates to effective in-custody and post-release community-based programming; identify cost-saving methods; and support the realignment of parolees and low-level prisoners.
Mayor’s Gang Prevention Task Force
34
Recommendation #2: The Department of Parks, Recreation and Neighborhood Services should work with the Santa Clara County Re-entry Services to establish and implement roles and responsibilities for coordination, and establish a formal process for referring clients eligible for re-entry services. This could potentially involve an amendment to the current agreement with Santa Clara County Probation.
Coordination With the San José Police Department Can Be Enhanced
PRNS coordinates with SJPD in various ways. For example, SJPD presents crime data related to gang activity to the Task Force during monthly Technical Team meetings and presents an overview of current gang-related crime trends at Policy Team meetings. SJPD staff are also part of each school’s Multi-Disciplinary Team which consists of representatives from SJPD, PRNS, and school districts. These teams meet on an as-needed basis to address juvenile crime issues (in or around campus) and establish crisis response protocols.17
School Liaison Officers in the SJPD’s Crime Prevention Unit (CPU) often contact YIS staff for issues relating to gangs at schools. CPU attends monthly Technical Team meetings and, also, refer youth to a BEST grantee from SJPD’s Truancy Abatement/Burglary Suppression Program (TABS) center.18
CPU expressed interest in referring more youth to the various Task Force services, but did not have information on the different organizations that provide services, and who to contact in addition to the current grantee they partner with at the TABS center. As mentioned previously, the Task Force coordinates with multiple agencies and it would be beneficial to create and provide an updated list of all Task Force services and contact information to CPU. We should note that since bringing this need to PRNS’ attention, staff reached out to CPU staff and provided this updated information.
Additional Strategic Coordination With the Police Department Would Be Beneficial for Future Initiatives to Address Overall Youth Violence
In February 2019, SJPD reported an increase in overall juvenile crimes. SJPD reported that it was responding to this increase by coordinating with County agencies such as Probation and other justice system partners. These are agencies
17 The crisis response protocol is aimed at restoring “peace” in the community and assisting family members, relatives, and witnesses of violent incidents. This protocol activates SJPD and other City departments, community service organizations, social service agencies, and schools to respond promptly to acts of violence. 18 The TABS program was created to reduce the number of daytime burglaries in the City and reduce truancy. The Police Department operates a TABS processing center in East San José at the PAL Stadium. Police officers locate truant juveniles and either return them to their school, or transport them to the TABS center where they will be processed and released to a parent or guardian.
Finding 1
35
whom the Task Force already works and in some cases has close relationships with.
As SJPD develops a response to the increase in youth crimes, it should coordinate with the Task Force to build on existing Task Force relationships as well to ensure the Task Force be leveraged to respond to ongoing and evolving trends in violence.
Finally, the Task Force’s BEST grantees and YIS staff provide prevention and intervention services to youth at-risk or in gangs, and those services could be expanded to include other youth as well. The Administration reports that it will continue to work with the Police Department and other stakeholders to address juvenile crime issues in a coordinated manner.
Recommendation #3: In addition to its goal of reducing youth gang violence, the Administration should determine the role of the Task Force (BEST and Youth Intervention Services) in the context of overall juvenile crimes and youth violence prevention.

Mayor’s Gang Prevention Task Force
36
This page was intentionally left blank

37
Finding 2 Task Force Services Could Be Better Aligned to Meet the Needs of Target Populations
Summary
The Task Force provides prevention and intervention services to youth at different levels of risk for gang involvement. Though the Task Force identifies different target populations for services, there is no uniform criteria to identify participants as one target population or another. While BEST grantees use different tools or methods to assess youth participants as at-risk, high-risk, gang-impacted, and gang-intentional, those methods are not consistent among the different grantees. YIS staff do not use a formal assessment tool to place participants into Task Force programs. More consistent assessment of participants can ensure youth receive the most appropriate services for their needs. Further, although grant agreements for BEST services have generally been focused on high-risk or gang-involved youth, we noted that nearly half of clients served were deemed at-risk (the lowest risk population among those targeted by the Task Force). Finally, coordination among BEST and YIS can be strengthened to ensure youth are provided with services that best fit their needs.
The Task Force Provides Intervention and Prevention Services to Youth at Various Levels of Risk for Gang Involvement
The City contracts with CBOs under the BEST program to provide gang prevention and intervention services. These services target youth who are at-risk of violence or gang involvement and/or currently involved in gang-related crime, violence, or lifestyle.
For FYs 2016-19, funds are distributed under six eligible service areas: 1) Personal transformation through cognitive behavior and life skills education, 2) Street outreach intervention services: gang outreach and mediation, 3) Substance abuse prevention and intervention, 4) Vocational/job training services, 5) Parent awareness/training and family support, and 6) Case management services. Most funding is provided in the categories of personal transformation and case management services. Some eligible services such as street outreach, vocational/job training services, and case management services are targeted to higher risk youth.

Mayor’s Gang Prevention Task Force
38
Exhibit 13: Distribution of Grantee Funds Over Eligible Services (FY 2017-18)
Source: BEST grantee agreements (FY 2017-18).
YIS serves similar populations of youth, with a reported focus on providing programs to gang-impacted and gang-intentional youth.
The Task Force Serves Youth With Different Needs
BEST grantees are contracted to provide services to all categories of youth participants (at-risk, high-risk, gang impacted, and gang-intentional), with each agreement matching needs identified by the Task Force. Though YIS reports targeting programs to a higher risk population, our review of the YIS case management system showed YIS may also serve a similar mix of at-risk and gang-involved youth as BEST programs.
Matching Youth to Services Is Important to Ensure Their Specific Needs Are Met
Initiatives generally target populations defined by an age group, gender, geography, or as in the case of the Task Force by risk level of gang involvement. Identifying target populations is important because youth defined as gang-impacted or gang-intentional would more than likely need higher intensity services, and thus more investment to ensure these services are available to them. According to an evaluation of the Oakland Unite program:
Those programs that require longer and more intense participation should be only available to individuals with a high-risk level, and those with low-risk should participate in programs that are shorter and less intense.
$- $250,000 $500,000 $750,000 $1,000,000
Vocational/job training services
Parent awareness/training and family support
Substance abuse prevention and intervention
Street outreach intervention services: gangoutreach and mediation
Case management services
Personal transformation through cognitivebehavior and life skills edcuation

Finding 2
39
There Is Variation in How the Task Force Assesses Youth Needs Across Programs
Though the Task Force identified different target populations, there is no uniform criteria to identify participants as one target population or another. The means by which youth are assessed vary among the different BEST grantees, as well as with YIS programs.
BEST grantees use multiple different tools or methods to identify youth participants as at-risk, high-risk, gang-impacted, and gang-intentional. For example, one grantee utilizes an assessment tool that classifies youth into the various target populations based on risk factors.19 In another case, we found that a grantee broadly classified all participants as high-risk and did not use an assessment tool. The grantee reported an assessment tool is not necessary since all its participants come from juvenile hall or are received as referrals from school counselors.
YIS staff uses an informal assessment tool for participants at intake; however, it is not standardized, which could lead to variation in results across staff. Further, YIS does not assign program participants to the same categories of risk that BEST grantees use. Rather, YIS denotes youth as gang-affiliated or not and relies on staff experience to identify risk factors to determine youth eligibility for services.
Lacking a common means of assessing participants makes it difficult to compare outcomes across programs. Additionally, a greater risk may be the possibility that participants may not be enrolled in services that best fit their needs.
Other Jurisdictions’ Youth or Gang Violence Initiatives Utilize Standard Assessment Tools
Other cities rely on the use of a standardized assessment tool to determine participant eligibility, as well as inform the development of appropriate individual service plans. The Oakland Unite program uses a narrowly defined list of referral sources (police department and probation), and an assessment of youth risk factors to determine their eligibility for services. This, and other modifications to their service delivery model contribute to the program’s ability to reach a higher risk population.
The Los Angeles Gang Reduction and Youth Development program developed standardized tools to assess participant eligibility for its prevention and intervention programs. For prevention services, Los Angeles uses the Youth Services Eligibility Tool (YSET), a nine-part questionnaire that determines if youth are eligible for prevention services based on attitudinal and behavioral factors. Los Angeles uses another tool, Services Eligibility Tool (SET), for its intervention
19 PRNS provides broad definitions of risk factors for each of the four categories. Grantees then utilize these risk factors to develop their risk assessments.
Mayor’s Gang Prevention Task Force
40
programming. The tool is used to measure participant gang commitment, including changes over time.20
In both instances, participants are never turned away for services if they do not qualify for services after assessment. Rather, they are referred to available services offered by other providers in the area. For example, according to Los Angeles staff, individuals that are not gang-involved are referred out to other programs that may be more suitable to their situation.
Further, Los Angeles’ assessment tools are continuously used while the participants are in the program. It is first used when the participant is enrolled in services to establish a baseline. The participant is then re-assessed during the program to determine whether participants should graduate from the program or continue with services. These pre- and post-program completion assessments are also one of the ways by which Los Angeles measures the outcomes of its services provided.
Use of a Common Assessment Tool Can Enable Staff to Better Target Task Force Services
Following the example of Oakland and Los Angeles, the Task Force should utilize common risk assessment tools or criteria to provide targeted services for its youth participants. Such an assessment tool is especially important for programs that seek to influence participant behaviors (in the case of the Task Force this would be youth propensity for violence and/or gang involvement). According to the evaluation of the Oakland Unite program,
The use of validated risk and need assessments, while important for most types of community-based programming, is especially critical for behavior modification programming. Without validated risk and need assessments, it is impossible to ensure that an individual receives the appropriate services to address his or her specific behavioral and psychosocial needs, as well as to ensure that providers offer services in the appropriate context and at the right dosage.
Los Angeles staff report that using their assessment tool allows them to appropriately separate youth involved and those not involved in gangs.
BEST grantees and YIS provide services to both youth involved in gangs and those at-risk for gang involvement. Having a standard or common assessment tool would
20 These tools were developed and tested in partnership with University of Southern California.
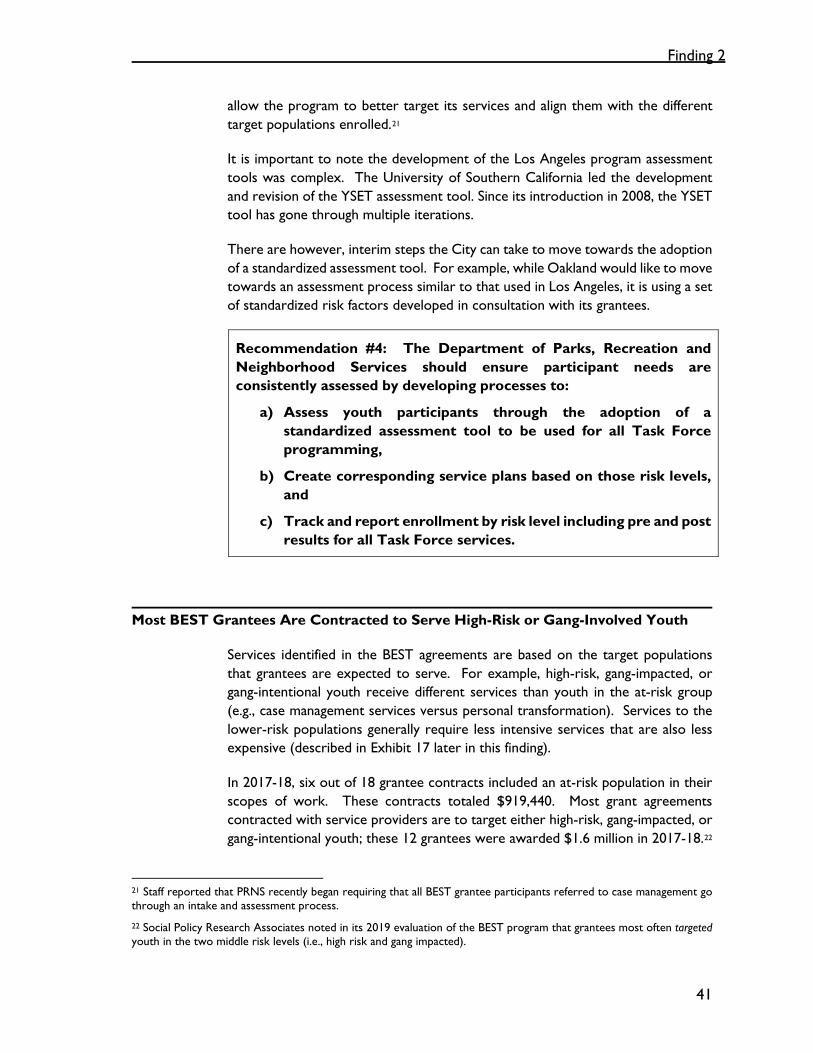
Finding 2
41
allow the program to better target its services and align them with the different target populations enrolled.21
It is important to note the development of the Los Angeles program assessment tools was complex. The University of Southern California led the development and revision of the YSET assessment tool. Since its introduction in 2008, the YSET tool has gone through multiple iterations.
There are however, interim steps the City can take to move towards the adoption of a standardized assessment tool. For example, while Oakland would like to move towards an assessment process similar to that used in Los Angeles, it is using a set of standardized risk factors developed in consultation with its grantees.
Recommendation #4: The Department of Parks, Recreation and Neighborhood Services should ensure participant needs are consistently assessed by developing processes to:
a) Assess youth participants through the adoption of a standardized assessment tool to be used for all Task Force programming,
b) Create corresponding service plans based on those risk levels, and
c) Track and report enrollment by risk level including pre and post results for all Task Force services.
Most BEST Grantees Are Contracted to Serve High-Risk or Gang-Involved Youth
Services identified in the BEST agreements are based on the target populations that grantees are expected to serve. For example, high-risk, gang-impacted, or gang-intentional youth receive different services than youth in the at-risk group (e.g., case management services versus personal transformation). Services to the lower-risk populations generally require less intensive services that are also less expensive (described in Exhibit 17 later in this finding).
In 2017-18, six out of 18 grantee contracts included an at-risk population in their scopes of work. These contracts totaled $919,440. Most grant agreements contracted with service providers are to target either high-risk, gang-impacted, or gang-intentional youth; these 12 grantees were awarded $1.6 million in 2017-18.22
21 Staff reported that PRNS recently began requiring that all BEST grantee participants referred to case management go through an intake and assessment process.
22 Social Policy Research Associates noted in its 2019 evaluation of the BEST program that grantees most often targeted youth in the two middle risk levels (i.e., high risk and gang impacted).

Mayor’s Gang Prevention Task Force
42
Exhibit 14: BEST Grantees’ Contracted Target Populations (FY 2017-18)
BEST Agency Contracted Target Population Budget
Caminar At-Risk, High-Risk, Impacted $86,040
San Jose Jazz At-Risk, High-Risk, Impacted $70,470
Bay Area Tutoring Association At-Risk, High-Risk, Impacted, Intentional $70,470
Catholic Charities of Santa Clara At-Risk, High-Risk, Impacted, Intentional $351,186
Uplift Family Services At-Risk, High-Risk, Impacted, Intentional $167,004
CTC dba ConXion At-Risk, High-Risk, Impacted, Intentional $174,270
Art of Yoga Project High-Risk, Impacted
$50,229
Bill Wilson Center High-Risk, Impacted
$140,016
Empowering Our Communities for Success High-Risk, Impacted
$44,520
Ujima Adult and Family Services High-Risk, Impacted
$161,369
Fresh Lifelines for Youth High-Risk, Impacted, Intentional $122,162
Alum Rock Counseling Center High-Risk, Impacted, Intentional $209,502
Firehouse High-Risk, Impacted, Intentional $282,120
Girl Scouts High-Risk, Impacted, Intentional $72,017
Happy House* High-Risk, Impacted, Intentional $23,760
Tenacious Group High-Risk, Impacted, Intentional $80,850
Teen Success Impacted $62,430
New Hope for Youth Impacted, Intentional
$364,415
Total $2,532,830 Source: Auditor summary of BEST grantee targeted populations as stated in grant agreements (FY 2017-18). * Happy House contracted target population was families though they actually reached both parents andyouth with services in FY 2017-18.
Nearly Half of BEST Participants Served Were At-Risk Populations
In some instances, grantees who are contracted to focus on higher risk youth may be providing services to at-risk youth. Although these participants may benefit from services, they likely do not require the intensive services provided by the grantee.
Though just six of the 18 grant agreements targeted at-risk youth, almost half (48 percent) of participants enrolled in BEST programs during the 2017-18 program year were classified as such. Exhibit 15 summarizes actual grantee target populations receiving BEST services in FY 2017-18.
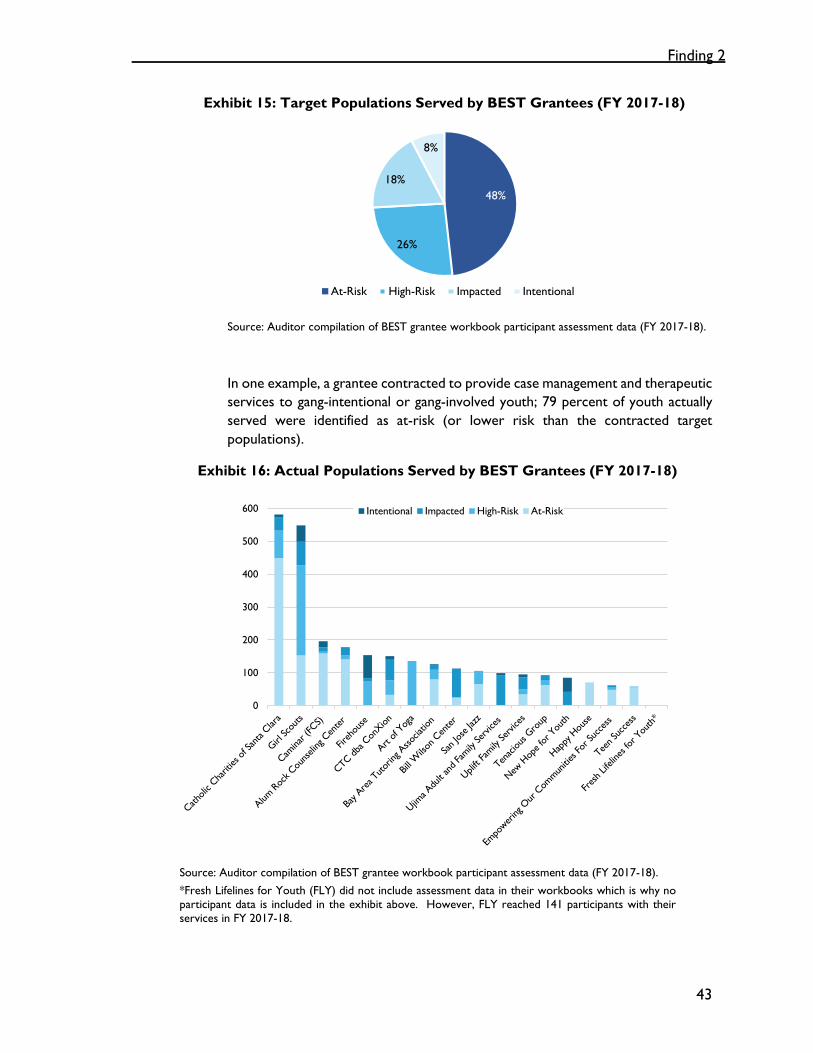
Finding 2
43
Exhibit 15: Target Populations Served by BEST Grantees (FY 2017-18)
Source: Auditor compilation of BEST grantee workbook participant assessment data (FY 2017-18).
In one example, a grantee contracted to provide case management and therapeutic services to gang-intentional or gang-involved youth; 79 percent of youth actually served were identified as at-risk (or lower risk than the contracted target populations).
Exhibit 16: Actual Populations Served by BEST Grantees (FY 2017-18)
Source: Auditor compilation of BEST grantee workbook participant assessment data (FY 2017-18). *Fresh Lifelines for Youth (FLY) did not include assessment data in their workbooks which is why noparticipant data is included in the exhibit above. However, FLY reached 141 participants with theirservices in FY 2017-18.
48%
26%
18%
8%
At-Risk High-Risk Impacted Intentional
0
100
200
300
400
500
600 Intentional Impacted High-Risk At-Risk
Mayor’s Gang Prevention Task Force
44
Grant Agreements Did Not Clearly Define Expected Services for Target Populations
While BEST grant agreements define the range of target populations to serve, more detail on service expectations for different target populations may be warranted. Currently, agreements require grantees to report overall youth served. This does not allow PRNS to account for services target populations receive.
Each target group requires different services, and as previously discussed, services should be tailored to that group. Because intensive services are more costly than other services, it is important to align budgets and expected expenditures with actual target populations served. To ensure higher risk populations are receiving more intensive services it may also be important for grantees to disaggregate the reporting of services by target population, and develop metrics and expected services for each targeted population.
PRNS Programs Provide a Diversity of Services for Youth
PRNS also offers various other activities geared towards youth. Below we compared these services by reviewing one grantee that received two grants from PRNS, one under the Task Force mission and another under PRNS’ general youth programming. We observed variations both in cost and intensity of grantee activities. Yet, both grants targeted youth in hotspot areas and both appeared to mainly target at-risk youth. Under their BEST grant, this grantee classified only 49 out of 582 total participants as gang-impacted or intentional.
Exhibit 17: Cost Comparison of Task Force Grants to PRNS Youth Programming by the Same Grantee
Program Amount Annual Units of Service
Types of Services
BEST - Task Force
$ 351,200 11,000 Street Outreach, Case Management, Personal Transformation and Life Skills, Substance Abuse and Intervention, Field Trips
PRNS Youth Services
$ 117,600 28,900 Afterschool Homework Assistance, Field Trips, and Summer Programming (literacy, service learning, arts, etc.)
Source: Auditor comparison of PRNS grant agreements.
In some cases, these additional PRNS services could augment BEST-provided services. In other cases, these services could serve as a referral source for BEST programs, or be the primary source of services for individual youth that would otherwise utilize more intensive BEST services.
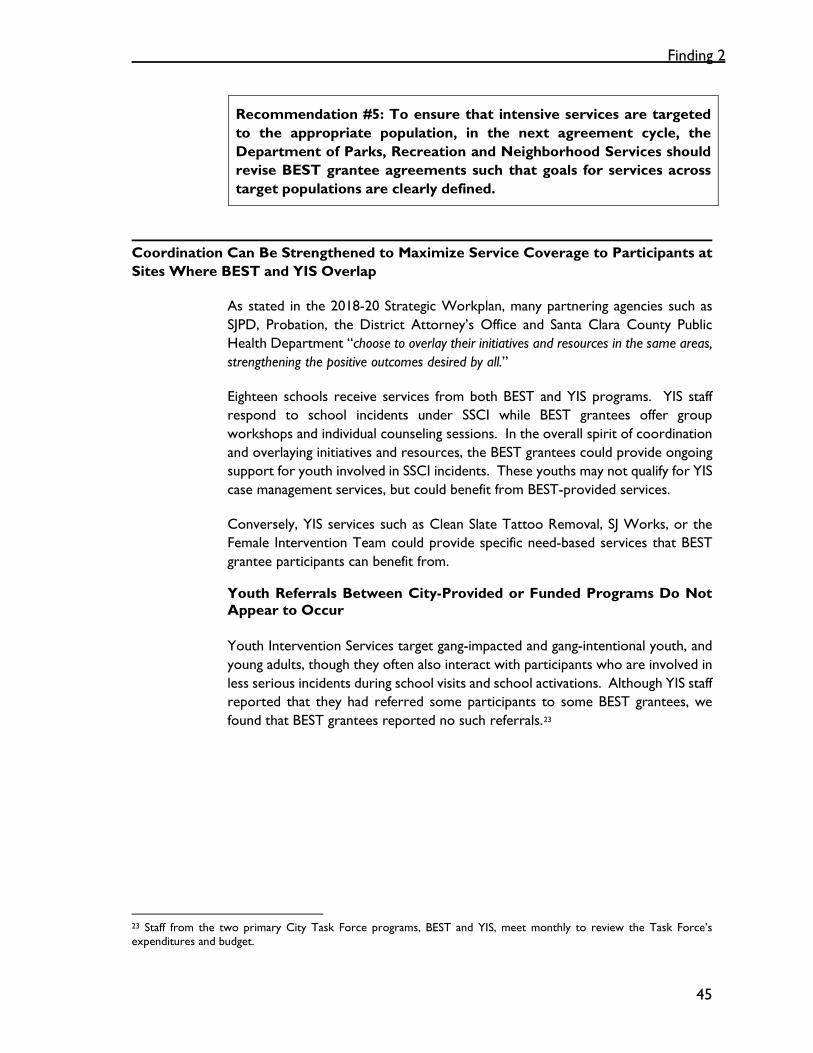
Finding 2
45
Recommendation #5: To ensure that intensive services are targeted to the appropriate population, in the next agreement cycle, the Department of Parks, Recreation and Neighborhood Services should revise BEST grantee agreements such that goals for services across target populations are clearly defined.
Coordination Can Be Strengthened to Maximize Service Coverage to Participants at Sites Where BEST and YIS Overlap
As stated in the 2018-20 Strategic Workplan, many partnering agencies such as SJPD, Probation, the District Attorney’s Office and Santa Clara County Public Health Department “choose to overlay their initiatives and resources in the same areas, strengthening the positive outcomes desired by all.”
Eighteen schools receive services from both BEST and YIS programs. YIS staff respond to school incidents under SSCI while BEST grantees offer group workshops and individual counseling sessions. In the overall spirit of coordination and overlaying initiatives and resources, the BEST grantees could provide ongoing support for youth involved in SSCI incidents. These youths may not qualify for YIS case management services, but could benefit from BEST-provided services.
Conversely, YIS services such as Clean Slate Tattoo Removal, SJ Works, or the Female Intervention Team could provide specific need-based services that BEST grantee participants can benefit from.
Youth Referrals Between City-Provided or Funded Programs Do Not Appear to Occur
Youth Intervention Services target gang-impacted and gang-intentional youth, and young adults, though they often also interact with participants who are involved in less serious incidents during school visits and school activations. Although YIS staff reported that they had referred some participants to some BEST grantees, we found that BEST grantees reported no such referrals.23
23 Staff from the two primary City Task Force programs, BEST and YIS, meet monthly to review the Task Force’s expenditures and budget.
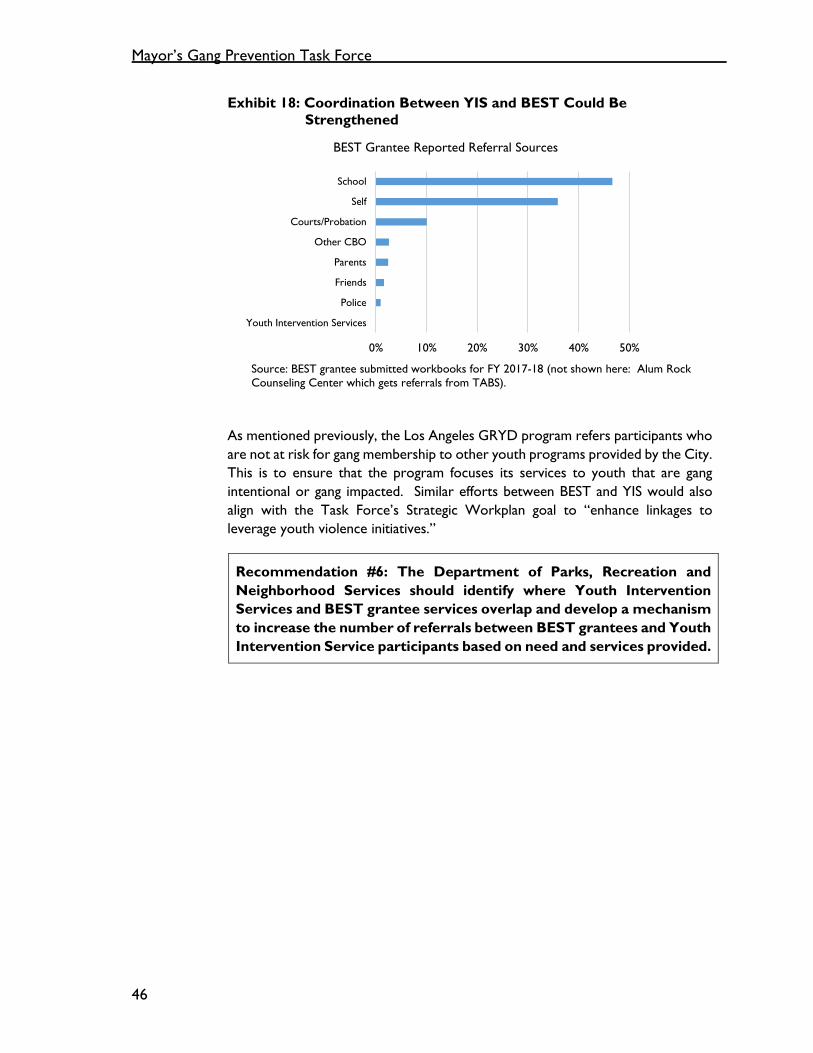
Mayor’s Gang Prevention Task Force
46
Exhibit 18: Coordination Between YIS and BEST Could Be Strengthened
Source: BEST grantee submitted workbooks for FY 2017-18 (not shown here: Alum Rock Counseling Center which gets referrals from TABS).
As mentioned previously, the Los Angeles GRYD program refers participants who are not at risk for gang membership to other youth programs provided by the City. This is to ensure that the program focuses its services to youth that are gang intentional or gang impacted. Similar efforts between BEST and YIS would also align with the Task Force’s Strategic Workplan goal to “enhance linkages to leverage youth violence initiatives.”
Recommendation #6: The Department of Parks, Recreation and Neighborhood Services should identify where Youth Intervention Services and BEST grantee services overlap and develop a mechanism to increase the number of referrals between BEST grantees and Youth Intervention Service participants based on need and services provided.
0% 10% 20% 30% 40% 50%
Youth Intervention Services
Police
Friends
Parents
Other CBO
Courts/Probation
Self
School
BEST Grantee Reported Referral Sources
47
Finding 3 PRNS Should Use a Data Driven Approach to Prioritize School-Based Programs
Summary
SSCI is a citywide resource for schools. SCCI staff provide a wide array of services beyond gang-related violence, including regular school visits, responses to violence or other incidents (i.e., school activations), and case management services. We found that the SSCI program could benefit from increased oversight, accountability, and follow-up. For example, following school activations, Youth Interventionists are expected to complete incident reports that document the actions taken, and any follow-up required. However, incident reports often had limited information, with results of the activations or follow up actions frequently absent.
In addition, most of the agreements with school districts are many years old and should be updated to reflect all of the services currently provided by PRNS’ Youth Intervention Services (YIS) staff, such as case management for students, regular YIS presence on schools, and YIS responses to school activations. The update should also include roles and responsibilities for City staff and school administrators, as well as criteria for SSCI school activations. The weekly schedules of regular SSCI school visits can also be better aligned with the number of school activations or incidents. Finally, YIS should clearly define expectations and track results for case management services provided to youth.
The Safe School Campus Initiative (SSCI) Has Evolved and Is a City-Wide Resource for Schools
The SSCI program began in 1996 when SSCI first partnered with the East Side Union High School District. According to a school administrator familiar with the program, youth interventionists only responded to gang-related incidents when the program began; however, this is no longer the case. Over the years SSCI has grown to become the largest program in the Task Force.
Today, the program is a citywide resource, with formal partnerships with 18 school districts and activities in over 80 schools. SSCI staffing in PRNS includes three Youth Intervention Specialists and 12 Youth Interventionists. School administrators we spoke to generally expressed positive reviews and were appreciative of Youth Interventionists and the program.

Mayor’s Gang Prevention Task Force
48
SSCI Staff Provide a Wide Array of Services Beyond Gang-Related Violence Prevention and Intervention Programs
Youth Intervention Specialists are responsible for intake and assessment of case management participants, act as the main liaison between school administrators, assign activation incidents to Youth Interventionists, and supervise Youth Interventionists. Youth Interventionists are responsible for many activities including:
• Weekly School Visits: Youth Interventionists are assigned to regularly visit schools either three-, two-, or one-time per week. The frequency is based on Specialists’ informal assessment on how much coverage is needed, which can be informed by news of violence from school administrators and the number of past incidents.
• Activations: These are unscheduled visits to a school, potentially to mediate a conflict, as requested by school administrators and sometimes SJPD School Liaison Officers. There are three activation levels with Level 1 being the most serious. In FY 2017-18, Youth Interventionists responded to over 500 activations. See Exhibit 19 for a description of the three different activation levels.
Exhibit 19: Activation Incident Levels
Level Level Description
Definition
1 Incident in progress
9-1-1 event which is clearly a safety concern and is interfering with school operations. Examples: Fights, weapons have been observed, confirmed bomb threat
2 Incident likely to occur
Increasing potential for an incident to both happen and cause interference with school operations. Example: Reliable source says, “fight will happen Friday”, significant threats have been made towards students or staff
3 Potential that
incident may occur
Not an immediate safety concern or interference with school operations, information may indicate potential for an incident that may warrant proactive intervention or mediation. Example: A rumor
Source: SSCI Technical Assistance Training Manual (draft).
Activation requests are directed to Specialists who redirect the request to a nearby Youth Interventionist who may be on a school visit. The Youth Interventionist will arrive at the school where the request was made and, after checking-in with school administrators, attempt to de-escalate the situation occurring on campus.
• Case management: Youth Interventionists provide case management or mentoring services to youth from various schools for up to one year. Specialists have recently begun conducting an informal intake and
Finding 3
49
assessment on each participant. Specialists are also responsible for assigning a Youth Interventionist to a participant.
In addition to weekly school visits, responding to activations and case management, YIS staff also organize various pro-social activities with targeted youth,24 provide transportation for case management participants, and are involved in other programs such as case management for the Hospital Linked Intervention program.
Increased Oversight, Accountability, and Follow-Up of YIS Services Can Ensure Program Success
School administrators request an activation for a wide array of incidents. These range from gang-related or other violent incidents to less serious issues at school campuses.
Youth Intervention Specialists’ Goal Is to Respond to all Activation Requests
Youth Interventionists are on call for school activations requested by school administrators. Youth Intervention Specialists report that their goal is to respond to 100 percent of activations no matter the level of risk. However, it is unclear if Youth Interventionists are able to do this. For example, one school administrator reported that Youth Interventionists are not always available to respond to school activations and the Youth Interventionist assigned to the school was performing fewer weekly school visits than they were scheduled (three times a week).
Activations were most commonly categorized as level 3 incidents. These include verbal misconduct, student harassment, or rumors of a school fight (unrelated to gangs). Many of these could potentially have been resolved by school administrators, indicating a need for clarity on when City staff activations should occur to better ensure the more serious activations are responded to, and regular school visits remain on schedule.
Youth Interventionists Responded to Over 500 Campus Activations
In FY 2017-18, Youth Interventionists responded to over 500 activations. While most activations require Youth Interventionists to be physically present on campus for mediation, some incidents resulted in a phone conversation or solely checking in with school administrators.
24 Pro-social activities “may include recreational activities, sports, art, field trips and college campus visits.”
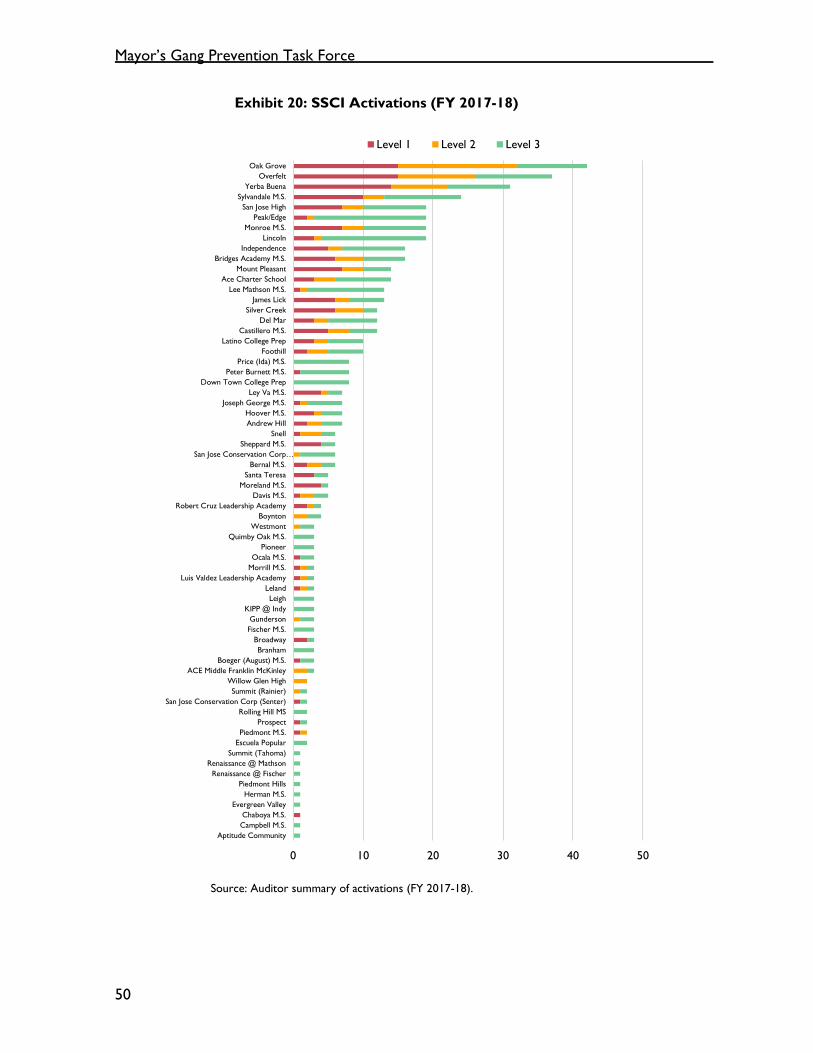
Mayor’s Gang Prevention Task Force
50
Exhibit 20: SSCI Activations (FY 2017-18)
Source: Auditor summary of activations (FY 2017-18).
0 10 20 30 40 50
Aptitude CommunityCampbell M.S.Chaboya M.S.
Evergreen ValleyHerman M.S.
Piedmont HillsRenaissance @ Fischer
Renaissance @ MathsonSummit (Tahoma)
Escuela PopularPiedmont M.S.
ProspectRolling Hill MS
San Jose Conservation Corp (Senter)Summit (Rainier)
Willow Glen HighACE Middle Franklin McKinley
Boeger (August) M.S.Branham
BroadwayFischer M.S.Gunderson
KIPP @ IndyLeigh
LelandLuis Valdez Leadership Academy
Morrill M.S.Ocala M.S.
PioneerQuimby Oak M.S.
WestmontBoynton
Robert Cruz Leadership AcademyDavis M.S.
Moreland M.S.Santa Teresa
Bernal M.S.San Jose Conservation Corp…
Sheppard M.S.Snell
Andrew HillHoover M.S.
Joseph George M.S.Ley Va M.S.
Down Town College PrepPeter Burnett M.S.
Price (Ida) M.S.Foothill
Latino College PrepCastillero M.S.
Del MarSilver Creek
James LickLee Mathson M.S.
Ace Charter SchoolMount Pleasant
Bridges Academy M.S.Independence
LincolnMonroe M.S.
Peak/EdgeSan Jose High
Sylvandale M.S.Yerba Buena
OverfeltOak Grove
Level 1 Level 2 Level 3
Finding 3
51
Minimal Details About Activations, Including Follow-Up Activities, Are Included in Incident Reports
Youth Interventionists complete incident report forms after activations to document the reasons and results of activations. Youth Interventionist Specialists are responsible for checking incident reports; however, unclear reporting expectations may have led to inconsistency of incident report content.
In our review of incident reports for FY 2017-18, the Youth Interventionist response to incidents at schools included contacting the student or administrator. In a few cases, some follow-up activities were documented, such as a youth enrollment in YIS programs. However, activations often resulted in one-time responses to incidents, with varying documentation of follow up or after-care services. For example, we found that although some reports appeared complete, others showed minimal details on results of the activations. In some cases, the incident reports were incomplete (some sections were left blank). Further, there were many instances where follow-up was not documented. In the cases we reviewed, only a few incidents had follow up with program referrals for either case management or to another BEST grantee service.
Recommendation #7: To improve oversight and accountability of the Safe School Campus Initiative program, the Department of Parks, Recreation and Neighborhood Services should:
a) Set expectations for follow-up, referrals, and after-care activities, and review if goals were met,
b) Conduct a supervisory review of post-activation responses, and
c) Develop a review process to assess sufficiency of staff incident reporting.
Memoranda of Agreement With School Districts Do Not Clearly Define Expectations for City Staff and School Administrators
Since 1996, because of the City’s concern about the incidence of juvenile crime in and around schools, the City has “established a variety of programs aimed at the prevention, intervention, and suppression of juvenile crime, including gang activity.”
Since that time, the City has established Memoranda of Agreements (MOAs) with school districts, allowing the City and school districts to establish a ‘Multi-Disciplinary Team (MDT)’ for the purpose of promoting safety and reducing juvenile crime in and around school campuses. The agreements were developed to bring Task Force activities to school campuses and allow for:
• The establishment of MDTs,
Mayor’s Gang Prevention Task Force
52
• Meeting on an as-needed basis to address juvenile crime, and
• Information sharing.
MOAs With School Districts Have Not Been Updated to Reflect Full Scope of Task Force Activities
The SSCI program has since evolved from when the MOAs were put in place. Youth Intervention staff perform many more additional tasks than envisioned by the previous agreements. For example, Youth Interventionists conduct school and home visits, respond to activations, attend school safety meetings, and provide case management services.
We found that 17 out of 18 MOAs should be updated to reflect how the program’s roles and expectations have evolved over the last 20 years. The MOA with the East Side Union High School District was updated in 2015. Staff reported that the update was made because East Side High School Union District introduced a limit on the length of MOAs to five years, whereas, the other MOAs do not hold an expiration date. The updated agreement with East Side Union School District includes many of the current YIS activities.
In contrast, the agreements with the remaining districts do not have a reference to SSCI youth interventionists working with youth off campus for case management or what the scope of those activities and length of services should be. Further, many key YIS activities such as regular YIS staff presence in schools, responding to SSCI activations, and home visits are not defined in the agreements.
Further, it is not clear what the expectations are with respect to goals and outcomes for both the schools and the City. This includes what types of school events would qualify for City response, who would respond, and pre- and post-activation expectations.
The current agreements also do not clarify other key expectations, such as those related to parental consent,25 data sharing, student privacy, and communication on student performance with school administrators and SJPD. Finally, there is no reference to requirements for backgrounding or LiveScan of City employees.
25 Youth interventionists had requested and received signed parental consent forms in all cases we reviewed in PRNS’ QuesGen database.
Finding 3
53
Recommendation #8: The Department of Parks, Recreation and Neighborhood Services should work with the City Attorney’s Office to update the current Memoranda of Agreement with school districts to include:
a) All services provided by City staff on school campuses,
b) Roles and responsibilities for City staff and school administrators, including criteria for Safe School Campus Initiative activations, and
c) Key documents that would be required to enroll participants, including parental consent forms.
Weekly SSCI School Visits Can Better Align With the Number of School Incidents
In FY 2017-18, Youth Interventionists were scheduled to visit 76 high schools and middle schools with each school designated three, two, or one visit per week. These scheduled weekly visits are in addition to the responses to activations. According to YIS staff, an informal assessment of school need is used to identify the frequency of school visits and is based on past incidents or information received from school administrators.
Our review of the activations and scheduled visits showed that the number of school visits could be more intentionally aligned with the number and type of activations. More intentional alignment of site visits with activations would allow Youth Interventionists to prioritize schools where the additional presence of Interventionists would be beneficial, and reduce time spent at schools that have fewer activations and potentially less risk. This is important because one school administrator noted that Interventionists were not always available to respond to calls and were at the school campus less than the established site visit schedule.
Currently, the criteria to determine the number of proactive site visits appears to be inconsistent. A comparison of proactive visits for FY 2017-18 and FY 2016-17 activations shows that alignment could be improved. For example, while Moreland Middle School activations increased in intensity (more level one in the second year) and number of activations from FY 2016-17 to FY 2017-18, proactive visits remained unchanged at one visit per week.
In FY 2017-18, Monroe and Castillero Middle School had high levels (more than 10) of incident activations, and more Level 1 activations but Youth Interventionists visited these sites only once a week. In contrast, Evergreen Valley and Gunderson High School have low number of activations and mostly Level 3 activations, but are visited twice a week (see Exhibit 21 for activations and weekly school visits).
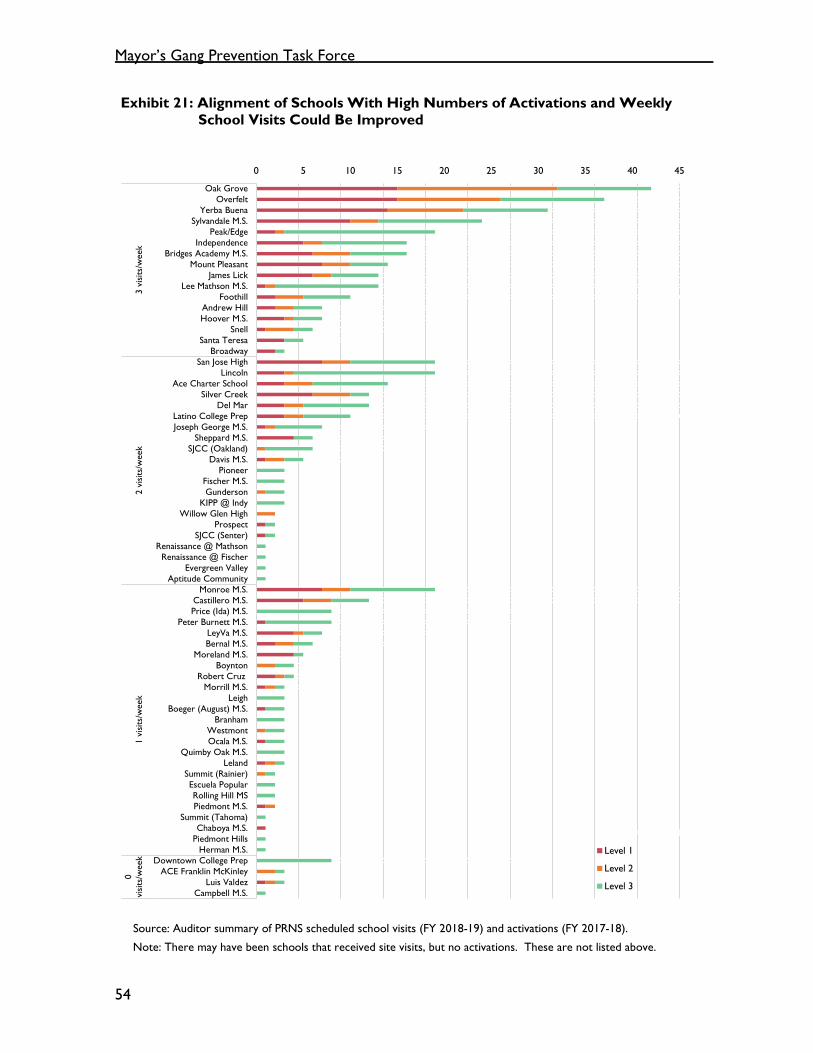
Mayor’s Gang Prevention Task Force
54
Exhibit 21: Alignment of Schools With High Numbers of Activations and Weekly School Visits Could Be Improved
Source: Auditor summary of PRNS scheduled school visits (FY 2018-19) and activations (FY 2017-18).
Note: There may have been schools that received site visits, but no activations. These are not listed above.
0 5 10 15 20 25 30 35 40 45
Campbell M.S.Luis Valdez
ACE Franklin McKinleyDowntown College Prep
Herman M.S.Piedmont HillsChaboya M.S.
Summit (Tahoma)Piedmont M.S.Rolling Hill MS
Escuela PopularSummit (Rainier)
LelandQuimby Oak M.S.
Ocala M.S.Westmont
BranhamBoeger (August) M.S.
LeighMorrill M.S.
Robert CruzBoynton
Moreland M.S.Bernal M.S.LeyVa M.S.
Peter Burnett M.S.Price (Ida) M.S.Castillero M.S.
Monroe M.S.Aptitude Community
Evergreen ValleyRenaissance @ Fischer
Renaissance @ MathsonSJCC (Senter)
ProspectWillow Glen High
KIPP @ IndyGunderson
Fischer M.S.Pioneer
Davis M.S.SJCC (Oakland)
Sheppard M.S.Joseph George M.S.Latino College Prep
Del MarSilver Creek
Ace Charter SchoolLincoln
San Jose HighBroadway
Santa TeresaSnell
Hoover M.S.Andrew Hill
FoothillLee Mathson M.S.
James LickMount Pleasant
Bridges Academy M.S.Independence
Peak/EdgeSylvandale M.S.
Yerba BuenaOverfelt
Oak Grove
0vi
sits
/wee
k1
visi
ts/w
eek
2 vi
sits
/wee
k3
visi
ts/w
eek
Sum of AUD Total
Level 1
Level 2
Level 3
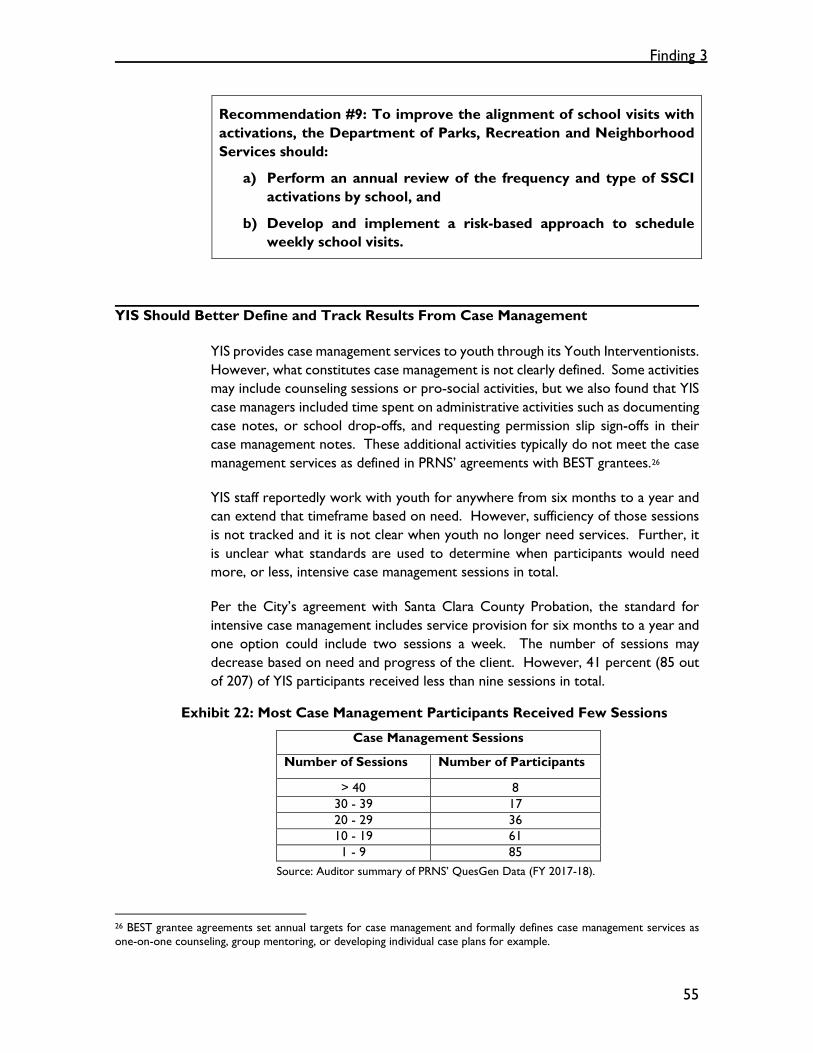
Finding 3
55
Recommendation #9: To improve the alignment of school visits with activations, the Department of Parks, Recreation and Neighborhood Services should:
a) Perform an annual review of the frequency and type of SSCI activations by school, and
b) Develop and implement a risk-based approach to schedule weekly school visits.
YIS Should Better Define and Track Results From Case Management
YIS provides case management services to youth through its Youth Interventionists. However, what constitutes case management is not clearly defined. Some activities may include counseling sessions or pro-social activities, but we also found that YIS case managers included time spent on administrative activities such as documenting case notes, or school drop-offs, and requesting permission slip sign-offs in their case management notes. These additional activities typically do not meet the case management services as defined in PRNS’ agreements with BEST grantees.26
YIS staff reportedly work with youth for anywhere from six months to a year and can extend that timeframe based on need. However, sufficiency of those sessions is not tracked and it is not clear when youth no longer need services. Further, it is unclear what standards are used to determine when participants would need more, or less, intensive case management sessions in total.
Per the City’s agreement with Santa Clara County Probation, the standard for intensive case management includes service provision for six months to a year and one option could include two sessions a week. The number of sessions may decrease based on need and progress of the client. However, 41 percent (85 out of 207) of YIS participants received less than nine sessions in total.
Exhibit 22: Most Case Management Participants Received Few Sessions
Case Management Sessions
Number of Sessions Number of Participants
> 40 8 30 - 39 17 20 - 29 36 10 - 19 61 1 - 9 85
Source: Auditor summary of PRNS’ QuesGen Data (FY 2017-18).
26 BEST grantee agreements set annual targets for case management and formally defines case management services as one-on-one counseling, group mentoring, or developing individual case plans for example.
Mayor’s Gang Prevention Task Force
56
YIS Can Better Measure Results From Case Management Services
The City requires that BEST grantees set targets for performance of case management services, and track activities with participants for intake and assessment, individual service plans, one-on-one sessions, support groups, phone calls, referrals to outside agencies, and pro-social activities.
YIS does not similarly track these services or require staff tasked with case management to report activities in this way. Results of case management sessions are inconsistently documented and results of individual service plans are not consistently monitored.
Youth Interventionists could effectively utilize results of individual service plans to set targets for performance as these plans include measurable results with prescribed activities such as: behavioral improvements (e.g., improved communication with parents, improved school attendance, reduced fighting at school), improved grade point average, graduation from high school, or obtaining a GED or vocational licensing. However, some case managers included case notes on improvement in service plans by participants while others did not. Without clearly defined guidelines and reportable outcomes, it is difficult to demonstrate success or failure of the sessions.
Recommendation #10: To more clearly define expectations for Youth Interventionist case management services, the Department of Parks, Recreation and Neighborhood Services should:
a) Define what constitutes a case management session such as one-on-one sessions, support groups, or similar activities,
b) Develop targets for expected number of case management sessions, and
c) Develop procedures to track the required number of sessions received by participants and monitor the results of individual service plans.
57
Finding 4 Monitoring of BEST Grantees Can Be Improved to Ensure Successful Program Outcomes
Summary
Community Based Organizations (CBOs) are contracted by the City to deliver services under the BEST program. PRNS monitors grantee performance through grants management and oversight. In 2017-18, this included 29 site visits for the City’s 18 BEST grantees, in addition to other monitoring activities. Though staff routinely perform monitoring visits, they have not always ensured compliance with grant agreements in terms of reaching targeted populations. Nor have they prevented over reporting of participant enrollment because of duplicates in the participant lists. PRNS should update procedures to make monitoring visits more efficient and better assess grantee performance. PRNS can also develop clear guidelines on when underperforming grantees should be placed on corrective action plans.
Grants Analysts in PRNS Monitor BEST Grantees Performance for the Task Force
As described earlier, the BEST program contracts direct service delivery from CBOs, with grants management and oversight provided by PRNS staff. Monitoring activities of grantee performance are performed by PRNS’ grant analysts and include two annual on-site monitoring visits, a quarterly review of grantee workbook data,27 and other ongoing discussions with grantees as needed. In cases of underperformance, grantees may be placed on corrective action plans (CAP).
Our review of FY 2017-1828 monitoring visits shows that PRNS staff were performing regular monitoring. According to PRNS, staff perform quarterly reviews of workbook data and we found 18 grantees received a total of 29 site visits in that year. PRNS uses City-wide and department-specific grant guidelines to perform its grantee monitoring.
Monitoring Does Not Always Ensure Grantee Compliance
Despite monitoring activities by PRNS staff, basic errors were observed in the workbook data. While BEST reportedly reached 3,456 participants in 2017-18, over 200 of those were duplicates. Staff reported that, historically, duplicate participants were checked prior to publication of the annual evaluation report by their former consultant; however, this year, duplicates remained in the data
27 PRNS establishes units of service targets with grantees at the start of a contract year. Progress towards targets are recorded in an excel spreadsheet and are reported to PRNS analysts for review on a quarterly basis.
28 BEST grantee program year for service delivery is the Fiscal Year ending August 31.
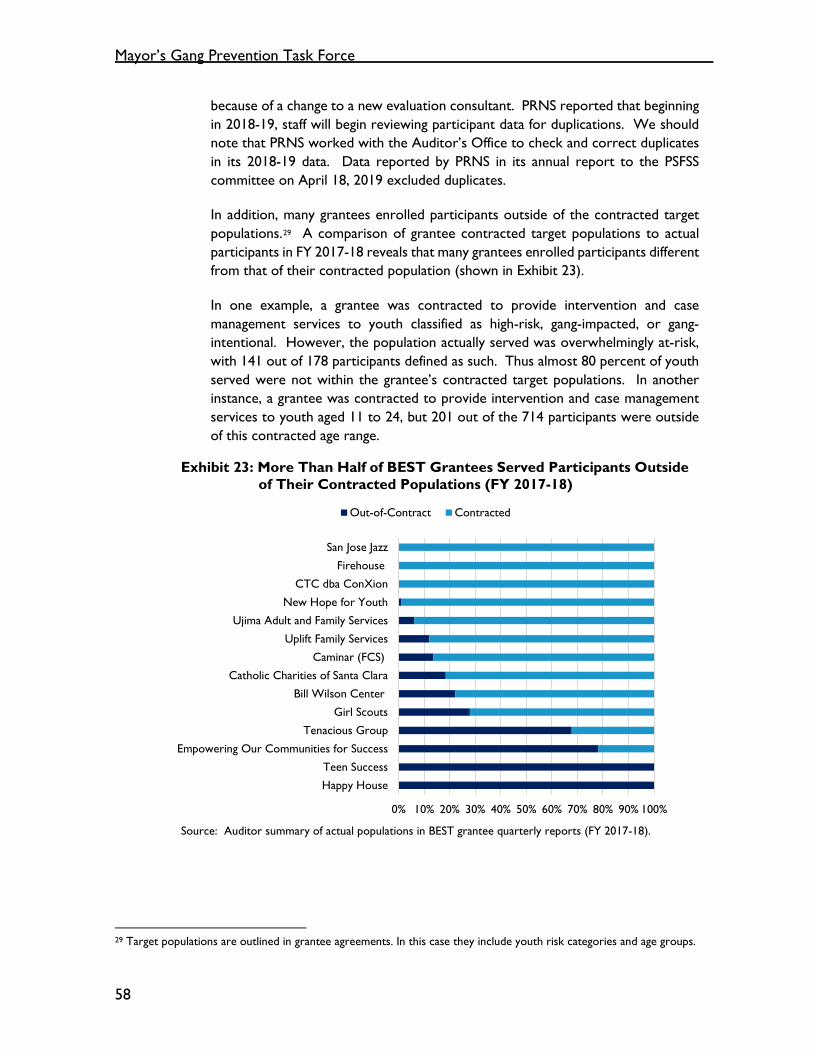
Mayor’s Gang Prevention Task Force
58
because of a change to a new evaluation consultant. PRNS reported that beginning in 2018-19, staff will begin reviewing participant data for duplications. We should note that PRNS worked with the Auditor’s Office to check and correct duplicates in its 2018-19 data. Data reported by PRNS in its annual report to the PSFSS committee on April 18, 2019 excluded duplicates.
In addition, many grantees enrolled participants outside of the contracted target populations.29 A comparison of grantee contracted target populations to actual participants in FY 2017-18 reveals that many grantees enrolled participants different from that of their contracted population (shown in Exhibit 23).
In one example, a grantee was contracted to provide intervention and case management services to youth classified as high-risk, gang-impacted, or gang-intentional. However, the population actually served was overwhelmingly at-risk, with 141 out of 178 participants defined as such. Thus almost 80 percent of youth served were not within the grantee’s contracted target populations. In another instance, a grantee was contracted to provide intervention and case management services to youth aged 11 to 24, but 201 out of the 714 participants were outside of this contracted age range.
Exhibit 23: More Than Half of BEST Grantees Served Participants Outside of Their Contracted Populations (FY 2017-18)
Source: Auditor summary of actual populations in BEST grantee quarterly reports (FY 2017-18).
29 Target populations are outlined in grantee agreements. In this case they include youth risk categories and age groups.
0% 10% 20% 30% 40% 50% 60% 70% 80% 90% 100%
Happy House
Teen Success
Empowering Our Communities for Success
Tenacious Group
Girl Scouts
Bill Wilson Center
Catholic Charities of Santa Clara
Caminar (FCS)
Uplift Family Services
Ujima Adult and Family Services
New Hope for Youth
CTC dba ConXion
Firehouse
San Jose Jazz
Out-of-Contract Contracted
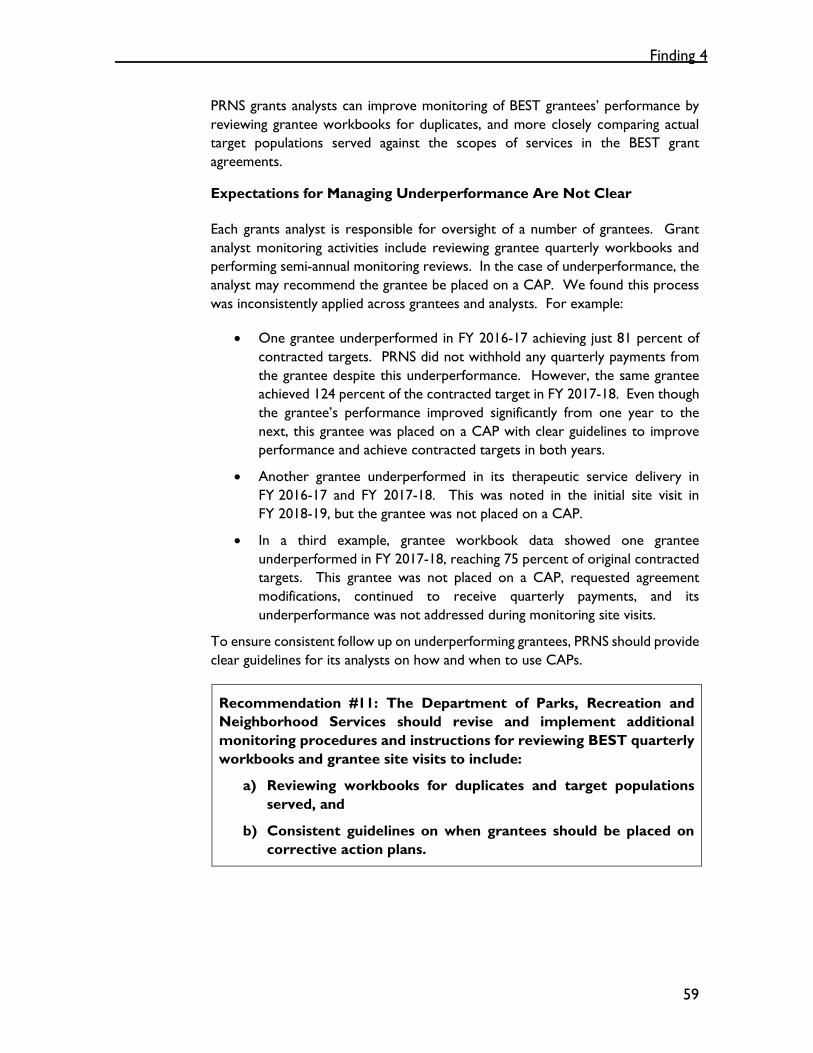
Finding 4
59
PRNS grants analysts can improve monitoring of BEST grantees’ performance by reviewing grantee workbooks for duplicates, and more closely comparing actual target populations served against the scopes of services in the BEST grant agreements.
Expectations for Managing Underperformance Are Not Clear
Each grants analyst is responsible for oversight of a number of grantees. Grant analyst monitoring activities include reviewing grantee quarterly workbooks and performing semi-annual monitoring reviews. In the case of underperformance, the analyst may recommend the grantee be placed on a CAP. We found this process was inconsistently applied across grantees and analysts. For example:
• One grantee underperformed in FY 2016-17 achieving just 81 percent of contracted targets. PRNS did not withhold any quarterly payments from the grantee despite this underperformance. However, the same grantee achieved 124 percent of the contracted target in FY 2017-18. Even though the grantee’s performance improved significantly from one year to the next, this grantee was placed on a CAP with clear guidelines to improve performance and achieve contracted targets in both years.
• Another grantee underperformed in its therapeutic service delivery in FY 2016-17 and FY 2017-18. This was noted in the initial site visit in FY 2018-19, but the grantee was not placed on a CAP.
• In a third example, grantee workbook data showed one grantee underperformed in FY 2017-18, reaching 75 percent of original contracted targets. This grantee was not placed on a CAP, requested agreement modifications, continued to receive quarterly payments, and its underperformance was not addressed during monitoring site visits.
To ensure consistent follow up on underperforming grantees, PRNS should provide clear guidelines for its analysts on how and when to use CAPs.
Recommendation #11: The Department of Parks, Recreation and Neighborhood Services should revise and implement additional monitoring procedures and instructions for reviewing BEST quarterly workbooks and grantee site visits to include:
a) Reviewing workbooks for duplicates and target populations served, and
b) Consistent guidelines on when grantees should be placed on corrective action plans.
Mayor’s Gang Prevention Task Force
60
Staff Performed Initial Site Visits for Multi-Year Grantees
Grant analysts conduct initial site visits annually during each contract year for BEST grantees. These initial site visits are meant to set expectations around how clients are recruited, set eligibility requirements for the program, establish work plans, and ensure tracking systems are in place. These occur even for grantees who have multi-year agreements and should be fully aware of expectations.30
Staff reported these repeat initial site visits were a repetitive check on information that was established during earlier visits. Having an introductory visit of this nature for only the first year of a multi-year grant, or for a new grantee, would allow analysts to spend more time determining how systems are being used, rather than re-verifying they are in place during site visits. Specifically, this would allow the site visits to incorporate more of a focus on verifying results of activities.
Further, prior year results are not included in the site visit forms. Including prior year grant performance for a multi-year grantee on the monitoring checklist would be helpful information for an analyst prior to their visit. For example, one grantee had not been receiving enough parent participation in sessions since year one of the grant cycle, but modifications to service delivery to account for this shortcoming were not made until after an initial monitoring visit in year three of the grant cycle. Another grantee was unable to meet contracted units of service targets for two cycles for its therapeutic services, yet benchmarks were not redefined to be more realistic.
Recommendation #12: To improve monitoring of its BEST grantees, the Parks, Recreation and Neighborhood Services Department should:
a) Require staff to perform initial site visits only for new grantees or programs and conduct monitoring site visits twice a year afterwards, and
b) Include a comparison of prior year results (on the site monitoring forms) for multi-year grantees.
Monitoring Tools Can Be Improved to Include Additional Information to Assess Grantee Performance
To perform its monitoring visits, staff are provided monitoring tools, including two site visit forms to verify grantee compliance. The “initial/mid-year site visit form” is used during the first monitoring visit conducted shortly after contract start. The second, “site visit II checklist”, covers the second site visit performed during the year.
30 Grantees qualify for a three-year grant period through PRNS’ RFQ process and grantee agreements are developed annually.
Finding 4
61
During the second site visit, analysts use a basic “yes” or “no” checklist to review budget or contract modifications, financial information (e.g., audited financial statements, invoices, expenditures), and program information (e.g., sign-in sheets, curriculum, activity schedules, units of service, number of unduplicated participants, and output goals).
Exhibit 24: Site Visit Checklist Does Not Include Key Grant Terms
Documents Yes No Comments Amendments Modifications Initial/Mid-Year Follow up Items Community of Learning Program Verification Sign in sheets Curriculum Weekly/Monthly Activity Schedule Unduplicated Participants Activity UOS Verification Outcome Measures31 Output Goals Financial Audited Financial Statement Financial Dashboard Invoices match request Payroll matches salaries Properly allocated to grant Cycle Report Findings Modifications to Requests Contract Budget Notes
Source: PRNS monitoring checklist.
While the checklist included some standard grant terms, it does not reflect individual grantees’ contracted scopes of work. For example, it is missing key grant terms outlined in agreements such as target populations (youth ages and risk category), prior year results, and verification of backgrounding requirements.32
Without including key grant terms, a full review of grant success and performance is difficult to accomplish. To ensure a more comprehensive review of grantee performance, the checklist should be revised to better reflect grantee agreements and thus improve analyst monitoring of grantee compliance.
31 These refer to surveys developed and led by a former consultant. In 2017-18, due to a change in the evaluation consultant, grantees were no longer required to complete these surveys.
32 Agreements with grantees require a criminal background check through the database of the California Department of Justice and an FBI criminal database or equivalent national database.
Mayor’s Gang Prevention Task Force
62
Recommendation #13: The Department of Parks, Recreation and Neighborhood Services should revise its site visit checklist to include contracted grantee scope of work and verification of key requirements including backgrounding.

63
Finding 5 Tracking and Reporting of Overall Task Force Program Performance Can Aid Decision Making and Improve Oversight
Summary
PRNS reports multiple performance measures for Task Force activities through an annual report on the BEST program, or included in the City’s Operating Budget. These have included a mix of measures, including overall units of service provided, as well as some outcome measures from the annual BEST evaluation reports. For example, in the most recent BEST evaluation conducted by Social Policy Research Associates, BEST services were found to have modestly impacted the occurrence of gang incidents and youth arrests in program areas.
Despite this, the Task Force can benefit from more ongoing measurement of program performance. Other jurisdictions use more comprehensive performance measures to assess program outcomes, such as changes in youth crime in hot spot areas, pre- and post-assessments of youth, and other measurable outcomes. In addition, PRNS should develop participant surveys to use as a feedback mechanism to collect data on participant satisfaction with Task Force services. Finally, in its annual report to the City Council, PRNS should include key performance measures and expenditures for both the BEST and YIS programs. Currently, only BEST program services are included, despite equivalent program expenditures. This can ensure decision-makers and staff are equipped with complete information to make strategic decisions and improve service delivery.
Performance Management and Reporting of Overall Task Force Activities
PRNS reports multiple performance measures for Task Force activities through its annual report to the City Council on the BEST program or included in the City’s Operating Budget.
The primary performance measures reported for BEST are units of service delivered or number of youth served. However, BEST has had annual evaluation reports prepared by outside consultants that have also included some outcome measures for the BEST program. For example, previous reports conducted by the former evaluation consultant included reductions in youth recidivism and drug use during the evaluation year. In the most recent evaluation conducted by Social Policy Research Associates, an analysis of crime statistics showed that BEST services were

Mayor’s Gang Prevention Task Force
64
found to have modest impacts on gang incidents and youth arrests.33 Similar analyses have not been done for the full scope of Task Force activities, including YIS services.
The City’s Adopted Operating Budget includes additional YIS-related performance measures, including the percent of SSCI customers (i.e., school administrators) surveyed rating services “good or better”, percent of Clean Slate Tattoo removal program participants who complete the Life Skills class, and percent of incidents at SSCI sites responded to within 30 minutes.34 Other YIS programs such as the Female Intervention Team and Hospital Linked Intervention do not report outcomes though they also provide significant services, including case management.
Ongoing Measurement of Overall Program Performance Can Be Improved
The Task Force’s 2018-20 Strategic Plan states that one of its primary goals is to implement outcome evaluation studies of Task Force funded programs and services with a focus on the impact of services. This goal seeks to:
“[…] implement a new annual evaluation process which will better evaluate [Task Force] programs and services. Transitioning this to a strategic evaluation methodology will allow the [Task Force] to better assess whether funds that are provided deliver the intended impact. Additionally, the [Task Force] will develop strategies so that partner agencies can share information to assess the collective impact of services provided with City funds.”
Other jurisdictions have used more comprehensive measures to assess program outcomes than currently utilized by the City. For example, Los Angeles tracks the change in youth crime in “hot spots” and other measurable outcomes. Los Angeles also does pre- and post-assessments that measure individual youth and program success.
In 2014, Oakland looked at outcomes across 10 years, showing that Oakland Unite programs had reduced recidivism.
Overall 78% of participants had an arrest in the five years before program involvement compared to only 37% in the two years after participating in the Oakland Unite program. Typical re-arrest rates in CA range from 60-75% of people being re-arrested within one year of release.
33 A 2017 evaluation report by Resource Development Associates similarly showed that BEST services were associated with neighborhood-level reductions in youth arrests.
34 PRNS reports the response rate annually and a 100 percent response rate has been reported for many years. The audit did not review the accuracy of this metric; however, variations in definitions of what a response entails were unclear. Some responses were a phone call while others were a physical visit to the school campus. In addition, one school administrator reported interventionists were not always available to respond to incidents.
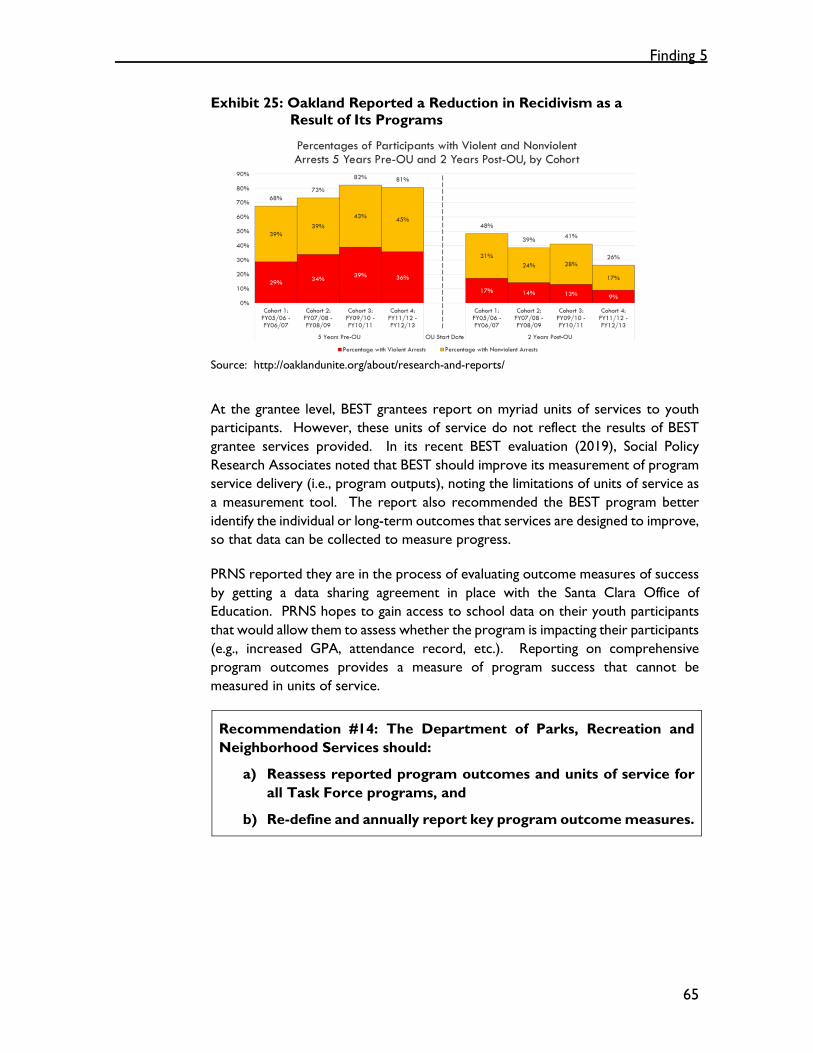
Finding 5
65
Exhibit 25: Oakland Reported a Reduction in Recidivism as a Result of Its Programs
Source: http://oaklandunite.org/about/research-and-reports/
At the grantee level, BEST grantees report on myriad units of services to youth participants. However, these units of service do not reflect the results of BEST grantee services provided. In its recent BEST evaluation (2019), Social Policy Research Associates noted that BEST should improve its measurement of program service delivery (i.e., program outputs), noting the limitations of units of service as a measurement tool. The report also recommended the BEST program better identify the individual or long-term outcomes that services are designed to improve, so that data can be collected to measure progress.
PRNS reported they are in the process of evaluating outcome measures of success by getting a data sharing agreement in place with the Santa Clara Office of Education. PRNS hopes to gain access to school data on their youth participants that would allow them to assess whether the program is impacting their participants (e.g., increased GPA, attendance record, etc.). Reporting on comprehensive program outcomes provides a measure of program success that cannot be measured in units of service.
Recommendation #14: The Department of Parks, Recreation and Neighborhood Services should:
a) Reassess reported program outcomes and units of service for all Task Force programs, and
b) Re-define and annually report key program outcome measures.
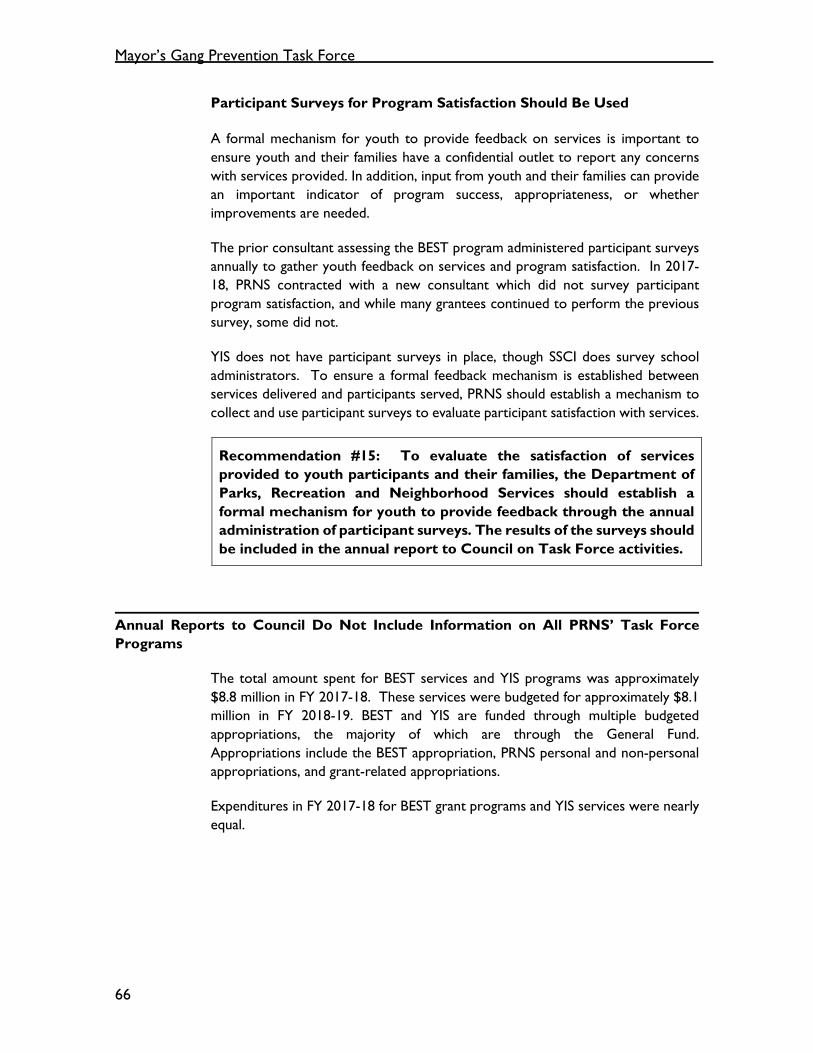
Mayor’s Gang Prevention Task Force
66
Participant Surveys for Program Satisfaction Should Be Used
A formal mechanism for youth to provide feedback on services is important to ensure youth and their families have a confidential outlet to report any concerns with services provided. In addition, input from youth and their families can provide an important indicator of program success, appropriateness, or whether improvements are needed.
The prior consultant assessing the BEST program administered participant surveys annually to gather youth feedback on services and program satisfaction. In 2017-18, PRNS contracted with a new consultant which did not survey participant program satisfaction, and while many grantees continued to perform the previous survey, some did not.
YIS does not have participant surveys in place, though SSCI does survey school administrators. To ensure a formal feedback mechanism is established between services delivered and participants served, PRNS should establish a mechanism to collect and use participant surveys to evaluate participant satisfaction with services.
Recommendation #15: To evaluate the satisfaction of services provided to youth participants and their families, the Department of Parks, Recreation and Neighborhood Services should establish a formal mechanism for youth to provide feedback through the annual administration of participant surveys. The results of the surveys should be included in the annual report to Council on Task Force activities.
Annual Reports to Council Do Not Include Information on All PRNS’ Task Force Programs
The total amount spent for BEST services and YIS programs was approximately $8.8 million in FY 2017-18. These services were budgeted for approximately $8.1 million in FY 2018-19. BEST and YIS are funded through multiple budgeted appropriations, the majority of which are through the General Fund. Appropriations include the BEST appropriation, PRNS personal and non-personal appropriations, and grant-related appropriations.
Expenditures in FY 2017-18 for BEST grant programs and YIS services were nearly equal.
Finding 5
67
Exhibit 26: BEST and YIS Expenditures (FY 2017-18)
Source: PRNS Expenditures from the City’s Financial Management System (FY 2017-18).
As noted previously, PRNS reports on BEST activities through an annual report to the City Council. However, these reports are limited to BEST activities with no reporting on YIS activities included. In addition, the annual BEST reports include only those funds spent on BEST programming and do not include the full scope of PRNS’ Task Force expenditures.
Reporting on Overall Activities Can Improve Oversight and Decision Making
In our 2009 white paper Performance Management and Reporting In San José: A Proposal For Improvement,35 we emphasized that:
Citizens and policy makers want to know how their tax dollars are spent and whether those dollars are spent well. Strong performance management systems are critical components of high performing organizations in both the public and private sectors. Performance management systems can provide management and policy makers with information necessary to maximize resource allocations, improve service delivery, and increase accountability through better public reporting.
Given that Task Force activities include both BEST and YIS, PRNS should include key performance measures and expenditures for both programs in its annual report to the City Council. Reporting on the overall Task Force impact would reflect the full range of services of the Task Force and equip City Council and staff with complete information to make strategic decisions and improve service delivery. In its recent evaluation report, Social Policy Research Associates noted that an evaluation of BEST isolated from an evaluation of other Task Force activities tells only part of the story of what the City is doing to reduce youth violence and gang
35 http://www.sanjoseca.gov/DocumentCenter/View/3232.
BEST Services$4,485,157
(51%)
YIS Services,$4,353,498
(49%)
Mayor’s Gang Prevention Task Force
68
activity. They considered what a broader evaluation of Task Force activities could look like alongside, or in coordination with ongoing BEST evaluations.
Reporting performance for all its programs would also reinforce coordination of services and allow the Task Force to better identify service gaps by enabling an ‘apples to apples’ comparison of services provided to key target populations by both YIS and BEST programming. Social Policy Research Associates noted that future evaluations could include a social network analysis, noting the analysis could “include the nature and type of organizations involved [in the Task Force], the number and strength of the relationships they have to other partners, and the ways in which the partners are connected to each other. This illustration will identify stronger and weaker partnerships and areas where the [Task Force] may wish to focus efforts to strengthen relationships.” For example, if the Task Force identified that services delivered were more heavily weighted towards lower risk populations, this could allow the Task Force to shift services as deemed appropriate.
Recommendation #16: The Department of Parks, Recreation and Neighborhood Services should monitor and report key performance measures in its annual report to the City Council and Task Force committees, including total expenditures and activities for the entirety of Task Force programs.
PRNS Should Develop Guidelines and Improve Oversight of Expenditures From the BEST Reserve
The BEST Reserve is a part of the BEST appropriation that is approved annually through the City’s annual budget process. This ‘reserve’ was approved for $267,000 in FY 2018-19.
Reserve fund usage has been guided through an approved resolution (Reserve Fund Guidelines). Guidelines for the triennial grantee period 2013-16 stated that the Reserve Fund was to be used for additional services that are not available through existing service providers in the event of an emergency or “sudden spikes in violent gang crimes [that] bring unique challenges.” There is no updated resolution that includes Reserve Fund guidelines for the triennial grantee period 2016-19.
We found that the reserve has been used for one-time purchases and to address emerging trends when needed. While these uses may be appropriate, PRNS should develop guidelines clarifying appropriate uses of the BEST Reserve and approvals for expenditures. This would ensure these funds are appropriately used and for the intended purposes.
Finding 5
69
Recommendation #17: The Department of Parks, Recreation and Neighborhood Services should develop formal guidelines on Task Force reserve fund expenditures including, potential uses, approval process and tracking of expenditures.

Mayor’s Gang Prevention Task Force
70
This page was intentionally left blank

71
Conclusion
Created in 1991, the Mayor’s Gang Prevention Task Force is a City-wide program that calls for the collaboration of multiple City departments and other non-City stakeholders to address gang activity in San José. Task Force programs have evolved over time and provide valuable services to vulnerable youth and the community, but can benefit from some improvements. PRNS should formalize and improve coordination among some Task Force partners, better align programs and services to meet the needs of its targeted populations, use a more data driven approach to prioritize services in its school-based programs, improve its grant monitoring processes, and track and report overall program performance.
RECOMMENDATIONS Finding 1: Better Coordination Among Task Force Partners Can Improve Service Delivery
Recommendation #1: To ensure services reach highest-risk youth and further strengthen the partnership, the Department of Parks, Recreation and Neighborhood Services should work with Santa Clara County Probation to:
a) Set goals and criteria for expected referrals,
b) Report on the results and outcomes achieved and units of service provided, and
c) Amend its agreement to include all current activities performed by Youth Intervention Services.
Recommendation #2: The Department of Parks, Recreation and Neighborhood Services should work with the Santa Clara County Office of Re-entry Services to establish and implement roles and responsibilities for coordination, and establish a formal process for referring clients eligible for re-entry services. This could potentially involve an amendment to the current agreement with Santa Clara County Probation. Recommendation #3: In addition to its goal of reducing youth gang violence, the Administration should determine the role of the Task Force (BEST and Youth Intervention Services) in the context of overall juvenile crimes and youth violence prevention. Finding 2: Task Force Services Could Be Better Aligned to Meet the Needs of Target Populations
Recommendation #4: The Department of Parks, Recreation and Neighborhood Services should ensure participant needs are consistently assessed by developing processes to:
a) Assess youth participants through the adoption of a standardized assessment tool to be used for all Task Force programming,
b) Create corresponding service plans based on those risk levels, and
c) Track and report enrollment by risk level including pre and post results for all Task Force services.
Mayor’s Gang Prevention Task Force
72
Recommendation #5: To ensure that intensive services are targeted to the appropriate population, in the next agreement cycle, the Department of Parks, Recreation and Neighborhood Services should revise BEST grantee agreements such that goals for services across target populations are clearly defined. Recommendation #6: The Department of Parks, Recreation, and Neighborhood Services should identify where Youth Intervention Services and BEST grantee services overlap and develop a mechanism to increase the number of referrals between BEST grantees and Youth Intervention Service participants based on need and services provided. Finding 3: PRNS Should Use a Data Driven Approach to Prioritize School-Based Programs Recommendation #7: To improve oversight and accountability of the Safe School Campus Initiative program, the Department of Parks, Recreation and Neighborhood Services should:
a) Set expectations for follow-up, referrals, and after-care activities, and review if goals were met,
b) Conduct a supervisory review of post-activation responses, and
c) Develop a review process to assess sufficiency of staff incident reporting. Recommendation #8: The Department of Parks, Recreation and Neighborhood Services should work with the City Attorney’s Office to update the current Memoranda of Agreement with school districts to include:
a) All services provided by City staff on school campuses,
b) Roles and responsibilities for City staff and school administrators, including criteria for Safe School Campus Initiative activations, and
c) Key documents that would be required to enroll participants, including parental consent forms.
Recommendation #9: To improve the alignment of school visits with activations, the Department of Parks, Recreation, and Neighborhood Services should:
a) Perform an annual review of the frequency and type of SSCI activations by school, and
b) Develop and implement a risk-based approach to schedule weekly school visits. Recommendation #10: To more clearly define expectations for Youth Interventionist case management services, the Department of Parks, Recreation and Neighborhood Services should:
a) Define what constitutes a case management session such as one-on-one sessions, support groups, or similar activities,
b) Develop targets for expected number of case management sessions, and
c) Develop procedures to track the required number of sessions received by participants and monitor the results of individual service plans.
Conclusion
73
Finding 4: Monitoring of BEST Grantees Can Be Improved to Ensure Successful Program Outcomes
Recommendation #11: The Department of Parks, Recreation and Neighborhood Services should revise and implement additional monitoring procedures and instructions for reviewing BEST quarterly workbooks and grantee site visits to include:
a) Reviewing workbooks for duplicates and target populations served, and
b) Consistent guidelines on when grantees should be placed on corrective action plans. Recommendation #12: To improve monitoring of its BEST grantees, the Parks, Recreation and Neighborhood Services Department should:
a) Require staff to perform initial site visits only for new grantees or programs and conduct monitoring site visits twice a year afterwards, and
b) Include a comparison of prior year results (on the site monitoring forms) for multi-year grantees.
Recommendation #13: The Department of Parks, Recreation, and Neighborhood Services should revise site its visit checklist to include contracted grantee scope of work and verification of key requirements including backgrounding. Finding 5: Tracking and Reporting of Overall Task Force Program Performance Can Aid Decision Making and Improve Oversight
Recommendation #14: The Department of Parks, Recreation and Neighborhood Services should:
a) Reassess reported program outcomes and units of service for all Task Force programs, and
b) Re-define and annually report key program outcome measures. Recommendation #15: To evaluate the satisfaction of services provided to youth participants and their families, the Department of Parks, Recreation and Neighborhood Services should establish a formal mechanism for youth to provide feedback through the annual administration of participant surveys. The results of the surveys should be included in the annual report to Council on Task Force activities. Recommendation #16: The Department of Parks, Recreation and Neighborhood Services should monitor and report key performance measures in its annual report to the City Council and Task Force committees, including total expenditures and activities for the entirety of Task Force programs. Recommendation #17: The Department of Parks, Recreation and Neighborhood Services should develop formal guidelines on Task Force reserve fund expenditures including, potential uses, approval process and tracking of expenditures.

Mayor’s Gang Prevention Task Force
74
This page was intentionally left blank

CTIYOF ~.
SANJOSE CAPITAL OF SILICON VALLEY
TO: JOSEPH ROIS ACTING CITY AUDITOR
SUBJECT: RESPONSE TO THE AUDIT OF THE MAYOR'S GANG PREVENTION TASK FORCE
Approved
BACKGROUND
Memorandum FROM: Jon Cicirelli
DATE: May 7, 2019
Date .5-8-2ot9
This memorandum responds to the recently completed audit of the Parks, Recreation and Neighborhood Services' (Department) Mayor's Gang Prevention Task Force (Task Force). We thank the City Auditor's Office for its insights and recommendations for ongoing program improvements. From ride-a-longs with Street Outreach Workers, to detailed meetings with administrative staff, the Auditor's staff spent a significant amount of tin1e visiting, observing, and learning about Task Force programs, with a view towards helping staff improve outcomes for the community. We welcome the City Auditor's perspectives and look forward to implementing the recommendations; in order to continue to serve the San Jose community as effectively as possible.
The Department is proud of the Task Force' s accomplishments and its status as a national model for engaging multiple stakeholders _in addressing the complex issue of keeping our community safe from gang crime and violence. Since 1991, the Task Force has created a culture of collaboration at both the policymaking and administrative levels through intentional relationship building.
The Policy Team is responsible for settmg the strategic direction and oversight of tl1e Task Force's activities. It is comprised of multiple City of San Jose departments, Santa Clara County Departments, School Districts, and community representatives. These partners work together through four subcommittees, including the Inter-Agency, Community Engagement, Technical Team, and School-City Collaboratives. Separately, the Task Force's Technical Team includes over 150 members, comprised of Parks, Recreation & Neighborhood Services staff, Community Based Organizations (CBOs), faith leaders, police officers, school officials, and other directservice organizations that provide prevention and intervention services to youth and their families. This team meets on a monthly basis to confer and coordinate efforts to implement best
· practices and allocate resources for mitigating youth violence.
HONORABLE MAYOR AND CITY COUNCIL May 7, 2019 Subject: Response to the Audit ofMGPTF and BEST Page2
The audit focused on the Department's Youth Intervention Services (YIS) and the San Jose's Bringing Everyone's Strengths Together (BEST) Program, which focus on delivering gang prevention and intervention services to at-risk, high-risk, gang-impacted and gang-intentional youth and their families. The Task Force takes seriously its role in creating and growing the City's capacity to serve San Jose's most vulnerable populations as effectively as possible.
The Department is committed to continuous quality improvement, and since 1997, has contracted an external evaluator for the BEST program to document and inform the work that has been done by contracted CB Os. It is in the context of this commitment to evaluation and improvement that the Department responds to the Auditor's recommendations.
RECOMMENDATIONS AND RESPONSE
Recommendation #1: To ensure services reach highest-risk youth and further strengthen the partnership, the Department of Parks, Recreation and Neighborhood Services should work with Santa Clara County Probation to:
(a) Set goals and criteria for expected referrals, (b) Report on the results and outcomes achieved and units of service provided, and (c) Amend its agreement to include all current activities performed by Youth
Intervention Services.
Administration Response: The Administration agrees with this recommendation.
Green: The Department will meet with Santa Clara County Probation Department to discuss the partnership. In collaboration with the Probation Department, staff will work to establish goals, criteria, and appropriate reporting mechanisms for monitoring results of the program. The Department will amend the existing agreement to update the description of activities performed by Youth Intervention Services.
Target Date of Completion: July 2020
Recommendation #2: The Department of Parks, Recreation and Neighborhood Services should work with the Santa Clara County Office of Re-entry Services to establish and implement roles and responsibilities for coordination, and establish a formal process for referring clients eligible for re-entry services. This could potentially involve an amendment to the current agreementwith Santa Clara County Probation.
Administration Response: The Administration agrees with this recommendation.
Green: The Department wili work with Santa Clara County Office of Re-entry Services to identify ways that the two organizations may be able to coordinate overlapping services delivered to common target populations.

HONORABLE MAYOR AND CITY COUNCIL May 7, 2019 Subject: Response to the Audit ofMGPTF and BEST Page3
Target Date of Completion: July 2020
C l . · ·, · ..
Recommendation #3: In addition to its goal of reducing youth gang violence, the Administration should determine the role of the Task Force (BEST and Youth Intervention Services) in the context of overall juvenile crimes and youth violence prevention.
Administration Response: The Administration agrees with this recommendation.
Green: The Department will work through the Task Force Policy Team and its participating partners to better define its role in overall juvenile crimes and youth violence prevention.
Target Date of Completion: July 2021
Recommendation #4: The Department of Parks, Recreation and Neighborhood Services should ensure participant needs are consistently assessed by developing processes to:
(a) Assess youth participants through the adoption of a standardized assessment tool to be used for all Task Force programming,
(b) Create corresponding· service plans based on those risk levels, and (c) Track and report enroll~ent by risk level including pre and post results for all
Task Force services.
Administration Response: The Administration agrees with this recommendation.
Green: The Department will explore best practices in this field and detemrine the right methodologies and tools to use for a standardized risk assessment. The Department agrees that by developing a standardized assessment tool for similar Task Force programs, creating service plans based on those risk levels, and by tracking emollment by risk level, the programs will better be able to document that the participants are receiving the appropriate level of service based on their risk profile.
Target Date of Completion: July 2021
Recommendation #5: To ensure that intensive services are targeted to the appropriate population, in the next agreement cycle, the Department of Parks, Recreation and Neighborhood Services should revise BEST grantee agreements such that goals for services across target populations are clearly defined.
Administration Response: The Administration agrees with this recommendation.
HONORABLE MAYOR AND CITY COUNCIL May 7, 2019 Subject: Response to the Audit ofMGPTF and BEST :eage 4
Green: The Department agrees that there is opportunity to clarify the scope of work in BEST Grant Agreements to more clearly define goals for services across target populations. The Department's Strategic Partnerships Unit will develop a grant agreement that more clearly defines the target populations for each service category and/or activity of the BEST grantees.
Target Date of Completion: December 2019
Recommendation #6: The Department of Parks, Recreation and Neighborhood Services should identify where Youth Intervention Services and BEST grantee services overlap and develop a mechanism to increase the number of referrals between BEST grantees and Youth Intervention Service participants based on need and services provided.
Administration Response: The Administration agrees with this recommendation.
Green: The Department will create a tracking system for referrals from YIS to BEST agencies, and evaluate opportunities for increasing referrals.
Target Date of Completion: July 2020
Recommendation #7: To improve oversight and accountability of the Safe School Campus Initiative program, the Department of Parks, Recreation and Neighborhood Services should:
(a) Set expectations for follow-up, referrals, and after-care activities, and review if goals were met,
(b) Conduct a supervisory review of post-activation responses, and ( c) Develop a review process to assess sufficiency of staff incident reporting.
Administration Response: The Administration agrees with this recommendation.
Green: The Department will develop procedures to conduct reviews of incident reports on a weekly basis. The reviews will ensure that staff is on track to resolve issues related to the incidents.
Target Date of Completion: July 2021
Recommendation #8: The Department of Parks, Recreation and Neighborhood Services should work with the City Attorney's Office to update the current Memoranda of Agreement with school districts to include:
HONORABLE MAYOR AND CITY COUNCIL . May 7, 2019 Subject: Response to the Audit ofMGPTF and BEST Page 5
(a) All services provided by City staff on school campuses, (b) Roles and responsibilities for City staff and school administrators, including
criteria for Safe School Campus Initiative activations, and (c) Key documents that would be required to enroll participants, including parental
consent forms.
Administration Response: The Administration agrees with this recommendation.
Green: The Department will update all school district MOU' s to reflect current service levels, roles, responsibilities, and any key documents.
Target Date of Completion: July 2020
Recommendation #9: To improve the alignment of school visits with activations, the Department of Parks, Recreation and Neighborhood Services should:
(a) Perform an annual review of the frequency and type of SSCI activations by school, and
(b) Develop and implement a risk-based approach to schedule weekly school visits.
Administration Response: The Administration agrees with this recommendation.
Green: The Department will continue to perfonn the annual review and assessment of school visit frequency. Staff will implement the weekly school visit schedule based on the risk factors of the schools.
Target Date of Completion: July 2020
Recommendation #10: To more clearly define expectations for Youth Intervention case management services, the Department of Parks, Recreation and Neighborhood Services should:
(a) Define what constitutes a case management session such as one-on-one sessions, support groups, or similar activities,
(b) Develop targets for expected number of case management sessions, and (c) Develop procedures to track the required number of sessions received by
participants and monitor the results of individual service plan results.
Administration Response: The Administration agrees with this recommendation. ·
Green: The Department will develop definitions of case management activities, as well as a tracking mechanism to monitor the results of individual service plan results.
- ·: r :· ·
HONORABLE MAYOR AND CITY COUNCIL May 7, 2019 Subject: Response to the Audit ofMGPTF and BEST Page 6
Target Date of Completion: July 2021
Recommendation #11: The Department of Parks, Recreation and Neighborhood Services should revise and implement additional monitoring procedures and instructions for reviewing BEST quarterly workbooks and grantee site visits to include:
(a) Reviewing workbooks for duplicates and target populations served, and (b) Consistent guidelines on when grantees should be placed on corrective action
plans.
Administration Response: The Administration agrees with this recommendation.
Green: The Department will assign a unique identifier to individual participants that ensures more accurate tracking of duplicates and target populations served. This tracking will be included as part of the BEST workbook review. The Strategic Partnerships Unit will develop additional grantee monitoring guidelines to evaluate grantee performance and thresholds for triggering corrective actions.
Target Date of Completion: July 2020
Recommendation #12: To improve monitoring of its BEST grantees, the Parks, Re';!reation and Neighborhood Services Department should:
(a) Require staff to perform initial site visits only for new grantees or programs and conduct monitoring site visits twice a year afterwards, and
(b) Include a comparison of prior year results ( on the site monitoring forms) for multi-year grantees.
Administration Response: The Administration agrees with this recommendation.
Green: The Department will include these improvements in the monitoring guidelines for BEST grant agreements.
Target Date of Completion: July 2020
Recommendation #13: The Department of Parks, Recreation and Neighborhood Services should revise its site visit checklist to include contracted grantee scope of work and verification of key requirements including backgrounding.
Administrc:l-tion Response: The Administration agrees with this recommendation.

HONORABLE MAYOR AND CITY COUNCIL May 7, 2019 Subject: Response to the Audit ofMGPTF and BEST Page 7
Green: The Department will revise its site visit procedures to account for differences in site visit content based on the length of time a grantee has been funded. Staff will revise the site visit checklist to include the contracted grantee scope of work, as well as the verification of backgrounding to ensure more thorough monitoring. The Department will ensure these changes are in alignment with the Citywide Grant Management Handbook.
Target Date of Completion: July 2020
Recommendation #14: The Department of Parks, Recreation and Neighborhood Services should:
(a) Reassess reported program outcomes and units of service for all Task Force programs, and
(b) ReNdefine and annually report key program outcome measures.
Administration Response: The Administration agrees with this recommendation.
Green: The Department will convene key staff to evaluate and assess current outcomes and units of services. Once outcomes and units of service measures are agreed upon, staff will develop procedures to train staff on collecting and reporting the data appropriately.
Target Date of Completion: July 2021
Recommendation #15: To evaluate the satisfaction of services provided to youth participants and their families, the Department of Parks, Recreation and Neighborhood Services should establish a formal mechanism for youth to provide feedback through the annual administration of participant surveys. The results of the surveys should be included in the annual report to Council on Task Force activities.
Administration Response: The Administration agrees with this recommendation.
Green: The Department will develop a survey or other formal mechanism to receive feedback from participants. Staff will research best practices in youth surveys to determine the appropriate implementation plan.
Target Date of Completion: July 2020
Recommendation #16: The Department of Parks, Recreation and Neighborhood Services should monitor and report key performance measures in its annual report to the City Council and Task Force committees, including total expenditures and activities for the entirety of Task Force programs.
HONORABLE :MAYOR AND CITY COUNCIL May 7, 2019 Subject: Response to the Audit ofMGPTF and BEST Page 8
• • • ~ I •
Administration Response: The Administration agrees with this recommendation.
Green: The Department will report on key performance measures and financial expenditures for all Task Force programs in its annual report to the City Council and Task Force committees.
Target Date of Completion: July 2020
Recommendation #17: The Department of Parks, Recreation and Neighborhood Services should develop formal guidelines on Task Force reserve fund expenditures including, potential uses, approval process and tracking of expenditures.
Administration Response: The Administration agrees with this recommendation.
Green: The Department will develop a formal process and guidelines on reserve fund spending, uses, and tracking.
Target Date of Completion: December 2019
/s/
JON CICIRELLI Acting Director Parks, Recreation and Neighborhood Services
For questions, please contact Neil Rufino, Deputy Director of Parks, Recreation and Neighborhood Services, at 408-535-3576.
Copyright © 2022 FDOKUMEN