The market effects of CEO turnover in Australian firms
47
The Market Effects of CEO Turnover in Australian Firms Jo-Ann Suchard a Manohar Singh b and Robert Barr c a University of New South Wales b Long Island University c Commonwealth Bank of Australia We examine the relationship between the monitoring of CEO’s by inside and outside directors and CEO turnover in the Australian market. Australian board structures and mechanisms are more similar to those in the U.S./U.K but market activity characteristics are more similar to Japanese/German systems. The results suggest that there is a relationship between CEO turnover and lagged performance rather than current performance as found in the U.S. In addition, non executive directors and independent directors are more likely to monitor management. However, there is a size effect as the results are driven by large firms. The difference in the results may be due to differences in the behaviour of United States and Australian institutional stockholders in solving corporate governance issues. Furthermore, a negative lagged market reaction is found on the announcement of the CEO change. However, the reaction is driven by a sub sample of firms with non independent boards and prior positive performance that may proxy for retirements. JEL Classification : G32 Key Words : Corporate Governance, Australia, CEO change * Contact Author : J.Suchard, School of Banking and Finance, University of New South Wales, NSW 2052, tel 61 2 98355876, fax 61 2 93856347, Email : [email protected]
-
Upload
independent -
Category
Documents
-
view
0 -
download
0
Transcript of The market effects of CEO turnover in Australian firms

The Market Effects of CEO Turnover in Australian Firms
Jo-Ann Suchard a Manohar Singh b and Robert Barr c
a University of New South Wales b Long Island University
c Commonwealth Bank of Australia
We examine the relationship between the monitoring of CEO’s by inside and outside directors and CEO
turnover in the Australian market. Australian board structures and mechanisms are more similar to those
in the U.S./U.K but market activity characteristics are more similar to Japanese/German systems. The
results suggest that there is a relationship between CEO turnover and lagged performance rather than
current performance as found in the U.S. In addition, non executive directors and independent directors
are more likely to monitor management. However, there is a size effect as the results are driven by large
firms. The difference in the results may be due to differences in the behaviour of United States and
Australian institutional stockholders in solving corporate governance issues. Furthermore, a negative
lagged market reaction is found on the announcement of the CEO change. However, the reaction is driven
by a sub sample of firms with non independent boards and prior positive performance that may proxy for
retirements.
JEL Classification : G32Key Words : Corporate Governance, Australia, CEO change
* Contact Author : J.Suchard, School of Banking and Finance, University of New South Wales, NSW 2052, tel 61
2 98355876, fax 61 2 93856347, Email : [email protected]

1
1. Introduction
An efficient corporate governance system characterises a multiplicity of mechanisms to ensure that the
interests of stockholders are protected against the agency behaviour of managers. One key mechanism of
various corporate governance systems around the world, is the board of directors. It is argued that the major
role of a typical board is the monitoring of managerial actions and thus the optimisation of corporate
performance and maximisation of stockholder wealth. An important mechanism whereby boards discipline
management, is the threat of removal or actual dismissal of poor performing management. Thus, by acting
as monitors and as a disciplining mechanism, boards can significantly influence corporate policies and in
case of failure, take corrective action by the removal of inefficient management.
Prior studies have examined the relationship between the monitoring role of boards and poor performance
related CEO turnover in the United States (U.S.), Japan, Germany and the United Kingdom (U.K.).
Although, it is commonly reported that poor corporate performance is associated with CEO turnover, there
are significant differences among these countries in terms of the sensitivity of CEO turnover to
performance, as well as, the time lag between poor performance and removal of the CEO. In addition, there
are significant differences as to the influence that various board characteristics may have on the
performance-turnover relationship. In the U.S. and the U.K, poor performance seems significantly related
to CEO removal. The U.S. and the U.K. tend to have similar board structures and governance practices,
as well as similar market transparency and depth. In contrast, the poor performance-CEO (president)
turnover relationship is not very strong for German (Japanese) systems of governance. However, the
explanation of the reported asymmetry is not clear. The logical question that arises is whether it is
differential board structures and governance mechanisms or the differences in the market’s objectivity in
evaluating corporate performance, that explains the turnover-performance relationship differences in
Anglo-Saxon and German/Japanese systems.
2
The purpose of this paper is to investigate the turnover-performance relationship asymmetry by examining
the relationship between CEO turnover and poor corporate performance for a sample of Australian firms.
The Australian corporate system offers a unique environment to address this question. Australian firms
have board structures and mechanisms that are similar in design to the Anglo-Saxon boards and are in
contrast to German/Japanese boards. However, in contrast to the U.S. and the U.K., the Australian market
for corporate control is not as active and its effectiveness in inducing boards to be strict monitors and take
corrective action in case of failure, may not be comparable to the U.S and the U.K. In addition, Australia
is characterised by a small and less active market than the large, deep and active U.S. and U.K. markets.
The investigation of the Australian corporate governance system may help us differentiate between the role
of market specific factors versus governance characteristics in determining the corporate performance-CEO
turnover relationship.
The results of our analysis indicate that there is a relationship between CEO turnover and poor
performance. However, in Australia poor performance has a lagged effect on CEO turnover in comparison
to the U.S. and U.K. where current performance effects CEO turnover. In addition, we find that while
board independence does positively influence the sensitivity of CEO turnover-performance relationship,
the result only holds for large firms. In terms of the CEO turnover-performance relationship, our results
seem to be more in line with those reported for Japanese/German firms.
The paper proceeds as follows. In the next section we provide a brief overview of comparative corporate
governance practices in the U.S, U.K., Japan, Germany and Australia. In section 3, we review previous
research on the issue of corporate performance-CEO turnover relationship. Section 4 contains our data and
methodological approach. In section 5 we describe and discuss our results and section 6 concludes the
paper.
3
2. Corporate Governance and Board Structure in the U.S., Japan, Germany, the U.K. and Australia
Corporate governance systems vary across international markets. Kaplan (1994) argues that the U.S.
corporate governance system is generally characterised as market oriented or “short term” stockholder
oriented whereas the Japanese and German systems are characterised as relationship oriented systems. In
the U.S., several internal and external mechanisms provide incentives for managers to maximise
stockholder wealth. Managers are monitored by institutional and large stockholders, there is an external
market for corporate control, boards of directors are usually dominated by outsiders and top executives
have equity ownership. In comparison, in Japan and Germany, managers are monitored by a combination
of banks, large corporate stockholders and other inter corporate relationships which are maintained over
long periods of time. In addition, the external market for corporate control is small.
An important feature of the German system is the requirement by law for a two tier board. The
management board is appointed by and reports to the supervisory board. The management board typically
receives a five year contract from the supervisory board and runs the firm unless dismissed for cause by
the supervisory board. Kaplan (1994a) argues that the chairman of the management board is considered
to be the first among equals rather than the first among lessors usually associated with US chief executive
officers. In principle, the supervisory board performs a function similar to that of outside directors but
board members are not appointed by or dominated by CEOs. The board consist of both capital owners
(banks) and employees. In addition, banks possess the privilege of proxy votes and exercise considerable
influence on governance and management. The stock markets are thinly traded and there is a prevalence
of ownership stock firms by other firms1. In addition, stock ownership of large German firms is more
concentrated than ownership of large U.S. firms.
1 John and Senbet(1998).
4
In Japan, equity ownership by management is considerably less than in the U.S., large stockholders are
sometimes viewed as passive and the proportion of outside directors on the board is lower.2 The majority
of directors of Japanese firms are long term employees and have been on the board for a substantial length
of time.3 Directors are elected at a stockholders meeting for not more than two years and the highest
ranking member is the president. A majority of firms also have a chairman who is usually a former
president. The president of a Japanese firm is not necessarily comparable to the U.S. CEO as Japanese
chairmen commonly have CEO powers. A comparable group may be that of the top several executives in
both countries. In Japan, this group is comprised of representative directors who have the legal right to
represent the firm. While the president is always a representative director, the chairman may not be.
Japanese corporate governance tends to be more consensus oriented and less CEO dominated than in the
U.S.
In the U.S., board members are elected by stockholders for terms of 1 to 3 years. The board is responsible
for choosing, compensating, monitoring, and if necessary, firing the top management team. Mace (1986)
and Lorsch and MacIver (1989) argue that the board is dominated by the CEO who takes a lead role in
setting the board’s agenda and choosing new directors. U.S. boards have various combinations of current
and retired executives and non executives rather than a corporate hierarchy around and below the CEO.
Directors are classified as inside directors (executive and other non-independent directors) and outside
(independent) directors. Directors are classified as outside directors if they neither work for the firm nor
have extensive dealings with the firm. Employees are classified as inside directors.
2 Kaplan (1994) finds outside directors in 41.2% of the firms in his sample.
3 Kang and Shivdasani(1995).
Australian board members can be classified into two broad categories, executives and non executives.
5
While the executives are employees of the firm, the non executives can be further classified into two
categories, independent and non independent. For monitoring purposes, the most effective directors are
the ones that are independent non executives. The Bosch (1993) report defines independence as the
director not being a substantial stockholder, not being an ex-employee, not being retained as a professional
adviser (either individually or through his/her firm) to the firm, not being a significant supplier or customer
to the firm and overall having no significant contractual relationships with the firm.
Australian initiatives in the area of corporate governance have been limited until 1990. Uniformly accepted
standards were not evident in the Australian business community, although a number of professional and
business associations had adopted their own code of corporate governance. The Bosh (1993) report
suggested principles of corporate governance to be applied in Australia. Although it called for firms to
adhere to the principles and disclose this in their annual reports, compliance was voluntary. These
principles included boards comprising of a majority of non executive directors with an appropriate mix of
skills and experience and the appointment of an audit committee with a majority of non executive directors.
From July 1996, the Australian Stock Exchange formalised a disclosure requirement for firms to include
in their annual report, “a statement of the main corporate governance practices that the entity had in place
during the reporting period”. In contrast, in the U.S. certain corporate governance procedures are regulated.
In the U.K., it is mandatory for all public firms listed on the London stock exchange to disclose compliance
with the Cadbury(1992) 4 report recommendations and explain non compliance.
4 Refers to the commission chaired by Sir Adrian Cadbury entitled “The Financial Aspects of CorporateGovernance”.
6
3. Prior Evidence
One of the problems in empirically measuring the effectiveness of corporate governance, is that some
aspects are not quantifiable. Often the only signal to the general market as to the existence of a governance
problem at a firm, is the removal of the CEO. Therefore, one of the key reasons for examining CEO
turnover in a corporate governance context, is that it is visible and usually the end product of corrective
action.
In general, the U.S. evidence finds a negative relationship between top executive turnover likelihood
and firm performance. These studies include the earlier studies that focus on the relationship between stock
and earnings performance and CEO turnover (Warner, Watts and Wruck (1988) and Weisbach (1988)),
the examination of performance pay and top management incentives (Jensen and Murphy (1990)), the
examination of the relative performance evaluation for CEOs (Gibbons and Murphy (1990)), the
examination of management turnover and financial distress (Gilson (1990)), the examination of accounting
performance around management turnover (Murphy and Zimmerman (1993)), the examination of
accounting performance and internal performance evaluation in Texas banks (Blackwell, Brickley and
Weisbach (1994)), the examination of CEO turnover and outsider succession (Borokhovich, Parrino and
Trapani (1996) and Parrino (1997)), the examination of the relationship between takeover activity and
management turnover (Mikkelson and Partch (1997)) and the documentation of changes in the turnover
performance relationship over time (Denis, Denis and Sarin (1997)).
Warner, Watts and Wruck (1988) show that poor performance is associated with CEO turnover and find
an inverse relationship between the probability of a top management change5 and the firm’s stock
performance. In addition, they find that the average announcement effect of the management change is
5 Top management is defined as individuals holding the title CEO, president or chairman of the board.

7
zero. They argue that the zero abnormal return could have reflected the positive effect of the change (as
the change was in the stockholders’ best interests) being nullified by the bad news about management’s
poor performance (and perhaps the future effect on the firm). They suggest that the announcement of a
change in CEO may be good news for some firms and bad news for the others, thus for the overall sample,
the average effect may be zero.
Weisbach (1988) extends Warner, Watts and Wruck (1988) by linking the performance-management
turnover relationship to board composition. He examines the relationship between the monitoring of CEOs
by inside (executive and other non independent) directors and outside (independent) directors. Weisbach
suggests that the task of evaluating senior management and replacing them for failure to perform, is likely
to fall mainly on outside directors. He argues that inside directors’ careers are tied to that of the CEO and
hence insiders generally are unwilling to remove incumbent CEOs. Weisbach suggests that outside
directors will have the incentive to ensure the effective running of a firm in order to protect their
reputations in the market. However, he argues that insiders can add value to a board as they can improve
the decision as to CEO successors. Inside board members are often potential CEOs. Their inclusion on the
board provides them with valuable experience and allows outside board members an opportunity to
evaluate potential CEO candidates. Weisbach suggests that boards combining inside and outside directors
should be more effective in management replacement following poor performance.
Similar to Warner, Watts and Wruck (1988), Weisbach finds that a poor stock return increases the
probability of a CEO losing his/her job. Weisbach finds that the relationship between firm performance
and the likelihood of CEO turnover is stronger at firms with outsider dominated boards than firms with
insider dominated boards. The results support the monitoring hypothesis that independent directors are
more effective monitors. Weisbach concludes that boards react quickly to poor performance to replace a
CEO and that the results are not affected by different ownership structures, firm size or industry.

8
In contrast to Warner, Watts and Wruck, Weisbach finds that the excess returns at the announcement of
a CEO change are generally positive. The significance of this result varies depending on the event window
used and the board classification. Overall, the announcement effect is positive for outside and mixed
boards, while close to zero for inside dominated boards. Weisbach concludes that the results for outside
boards is consistent with the hypothesis that outside directors act in the best interest of stockholders and
improve the firm’s value by removing poor CEOs. Weisbach argues that the positive mixed board result
is consistent with the argument that mixed boards are often used to train and evaluate future CEOs.
Borokhovich, Parrino and Trapani (1996) extend Weisbach (1988) by investigating how director incentives
affect the likelihood that a new CEO is hired from outside the firm. They argue that for reputational
reasons, directors will choose the best candidate for CEO regardless of whether the potential CEO is an
insider or an outsider. In contrast, inside directors are likely to prefer inside candidates as they themselves
are generally the leading candidates. Additionally, an insider is less likely to substantially alter firm policies
and inside appointments tend to be followed by less turnover among senior management.
However, Borokhovich, Parrino and Trapani (1996) use a simple director classification method, executives
are insiders and all other directors are outsiders6. This definition is not ideal and makes it difficult to
compare the results with previous studies which have used a more robust director classification.
Borokhovich, Parrino and Trapani (1996) find that the likelihood of an outside executive being hired
increases monotonically with the percentage of outside directors. Consistent with Weisbach (1988), they
find a positive announcement effect for the news of a CEO change. Moreover, they find a significant
positive abnormal return when an outsider is appointed CEO following forced or voluntary turnover
compared to a large negative return when an insider replaces the fired CEO. Thus the results indicate that
6 They ignore all potential business relationships which could affect director motives due to the difficulty ofobtaining enough accurate information about directors in the early years of their sample.

9
when choosing a new CEO, outside directors act in the best interest of stockholders.
Mikkelson and Partch(1997) extend the earlier turnover studies by examining whether the effectiveness
of corporate governance suffers when the market for corporate control becomes less active. They compare
top management turnover in acquired U.S. industrial firms during an active takeover market and a less
active takeover market. They find that, after controlling for various determinants of management turnover7,
turnover and performance are only related in the active takeover period and argue that takeover activity
affects the intensity of managerial discipline.
Denis, Denis and Sarin(1997) document changes in the turnover performance relationship over time. They
examine the relationship between turnover and various aspects of corporate governance. They find that
ownership structure significantly affects the likelihood of change in top executives. The probability of top
executive turnover is negatively related to the ownership stake of officers and directors and is positively
related to the presence of an outside blockholder. The likelihood of a change in top executive is
significantly less sensitive to stock price performance in firms with higher managerial ownership. In
addition, top executive turnover is preceded by unusually high incidences of corporate control activity
regardless of the level of managerial ownership.
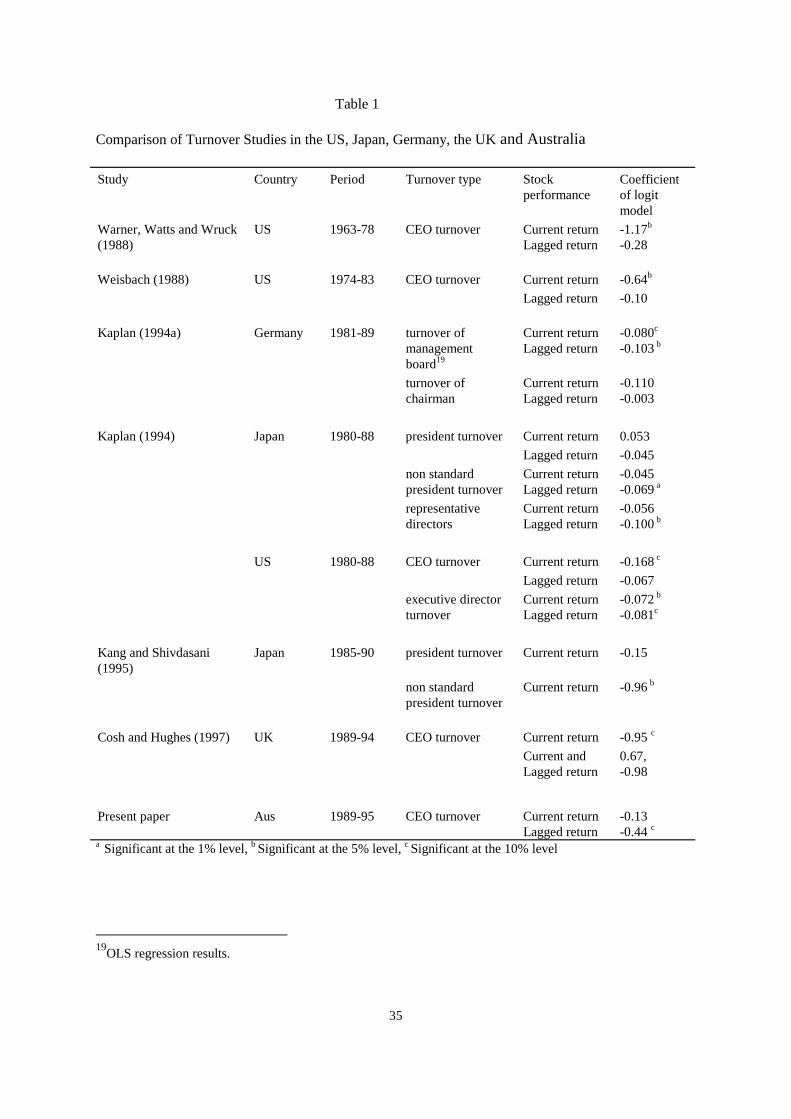
There have been similar studies for Japan, Germany and the U.K. Table 1 provides a comparison of the
international results.
[Insert Table 1 here]
7 These include directors stockholding, age of CEO, board size and proportion of outside directors.
10
Kaplan (1994) and Kang and Shivdasani (1995) examine management turnover in Japanese firms.
Kaplan’s results do not show a significant relationship between stock performance and president turnover.
Kaplan argues that the results suggest that it is standard for Japanese presidents to resign their presidencies
at regular intervals without regard to firm performance. This is consistent with the president becoming
chairman after resignation. However, non standard turnover is significantly negatively related to lagged
stock price performance but not current performance. For a comparative sample of U.S. firms, Kaplan finds
that the coefficients of stock returns in the current period are significantly different between U.S. and
Japanese firms. Kaplan argues that this suggests that CEO turnover in the U.S. is more sensitive to stock
performance than Japanese presidential turnover. In Japan, representative director turnover is also
negatively significantly related to lagged stock performance. Kaplan concludes that the fortune of Japanese
top executives overall appears to be less closely tied to stock performance than those of U.S. executives.
Kang and Shivdasani (1995) extend and support Kaplan (1994) in finding a negative relationship between
non routine top executive turnover likelihood and firm performance for Japanese firms. The effect of firm
performance on routine turnover likelihood is small. In comparison, varying stock performance from the
bottom to the top decile, significantly increases the likelihood of non routine turnover. Further, they find
that firms with ties to a main bank are more likely to remove top executives for poor earnings performance
than firms without ties to a main bank. There is also evidence of a marginally stronger relationship between
stock price performance and non routine turnover for firms with high levels of block ownership. However,
keiretsu membership or the presence of outside directors on the board does not have an effect on the
sensitivity of turnover to stock price performance.
Kaplan (1994a) examines German firms and finds that turnover of the management board is significantly
negatively related to current and lagged stock price performance. However, the turnover of the chairman
is not significantly related to poor stock performance. The results are similar to Kaplan (1994) who finds
that turnover of the top three to five executives (representative directors) in Japanese and (executive
11
directors) in US firms is significantly related to stock returns.
Cosh and Hughes(1997) examine CEO turnover of firms in the electrical engineering sector in the UK.
They find a significant negative relationship between relative8 stock performance and CEO turnover but
do not find a relationship for lagged returns. The probability of dismissal increases, the lower the relative
stock returns in the last financial year in which a dismissed CEO is in office.
Overall, it appears that the U.S. and the U.K. are similar in terms of corporate governance effectiveness
in ensuring the corporate performance-CEO turnover link. There appears to be a strong negative
relationship between the probability of CEO removal and corporate performance and the time lag for the
turnover to take effect is relatively small. In comparison, in Japanese and German corporate markets, it is
lagged performance that is significantly negatively related to the removal of president and management
boards respectively. The question is whether it is the difference in market effectiveness or the difference
in board structure, that explains the asymmetry of the relationship between turnover and performance
between Anglo-Saxon and Japanese/German systems. A logical way to isolate the two factors is to
investigate a system that has market activity characteristics similar to Japanese/German systems and a
board structure mechanism similar to Anglo-Saxon systems. Australia offers an ideal experimental setup
where board structure is more similar to the U.S./U.K. while the functioning of stock and corporate control
markets is more similar to Japan/Germany.
8Return is measured as the total stockholder return for the firm less the median total stockholder return for thesample.
4. Data Description and Methodology
12
The sample includes 93 of the top 150 listed public firms in Australia as of April 1996. The composition
of the board of directors of the firms over the 1989-1995 period is ascertained from their annual reports.
Firms are excluded if they are
a) not traded on the ASX (Australian Stock Exchange) for the full period between June 1989 and
July 1995; or
b) listed property trusts.
The announcement date of the CEO change is the date of the firm’s market release to the ASX. Firms are
required to make an announcement to the ASX before any information is provided to the media. Stock
price and market index ( All Ordinaries Accumulation Index) data are obtained from the Australian Stock
Exchange (ASX) database
Four firms are removed from the sample, two due to takeovers, one due to a merger and one due to its
withdrawal from trading on the ASX. Thus the sample consists of 89 firms over the period July 1989 to
June 1995 during which there were 77 CEO changes. Out of the 77 announcements for 89 firms in the
sample, only 59 announcements are analysed. Two events are removed as there is no clear announcement
date (or the actual announcement/release is missing), one is due to a period of no trading/removal of listing
on the exchange before the change and 15 are removed because of contaminated announcements, that is,
simultaneous information released with the CEO change announcement.
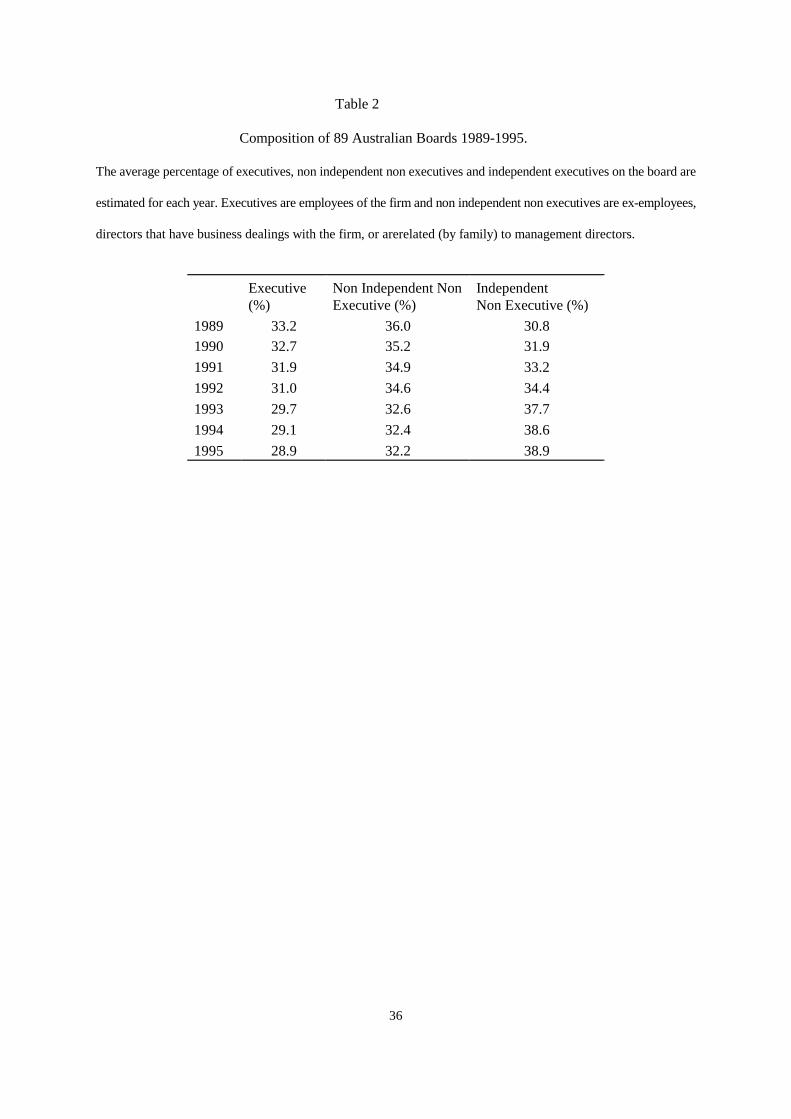
We classify directors as non independent if they were current or ex-employees, had business dealings with
the firm, or were related (by family) to management directors. Directors are classified as executive if they
are employees of the firm. Table 2 describes the make-up of Australian boards over 1989 to 1995.
[Insert Table 2 here]
13
The evidence suggests that the make-up of Australian firm boards is improving as compared to best-
practice theory and empirical evidence (such as the findings of Byrd and Hickman (1992)). The average
proportion of executives and non independent directors has dropped, and the proportion of independent
directors has risen over 1989-1995. To provide an international comparison, the size of the board and the
percentage of executives, insiders and outsiders of the board is compared to Japanese, U.S. and German
boards9. Australian boards had an average size of 8.5 directors compared to 23, 14.9 and 25 (management
and supervisory) directors for Japanese, U.S. and German boards respectively10. Australian boards were
composed of 33.2% executives compared to 18.8%, 30.8% and 29.9% for Japanese, U.S. and German
boards respectively11. In addition, outsiders comprised 30.8% of Australian boards compared to 3.2% and
64.3% for Japanese and U.S. boards.12 Figure 1 provides a graphical comparison.
[Insert Figure 1 here]
Table 3 presents the characteristics of the CEO changes.
9 The Australian data is measured at 1989. Kaplan (1994) reports percentages for Japanese and U.S. boards at1980 and Kaplan (1994a) reports percentages for German boards at 1983.
10 The difference in size between Australian and Japanese, U.S. and German boards is significant at the 1%level.
11 The difference in the percentage of executives on the board between Australian and Japanese boards issignificant at the 1% level. There is an insignificant difference between Australian and U.S. and Australian andGerman boards.
12 The difference in the percentage of outsiders on the board between Australian and Japanese firms andAustralian and U.S. firms is significant at the 1% level.
14
[Insert Table 3 here]
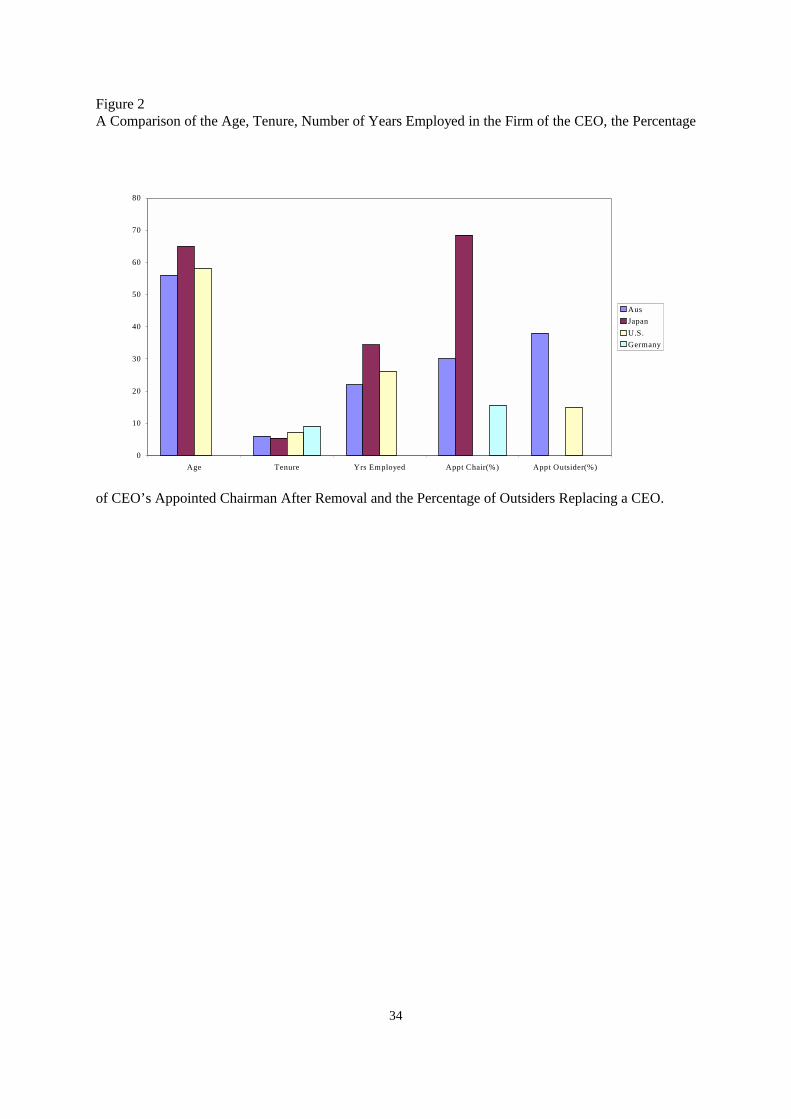
Panel A describes the characteristics of the outgoing CEO and his/her replacement. The average Australian
outgoing CEO is of similar age to US CEOs13 (56 and 58 years old respectively) but are younger than
Japanese CEOs (65 years old).14 Australian CEOs had a similar average tenure to Japanese CEOs (6 and
5.4 years respectively) compared to a higher tenure of U.S. and German CEOs15 (7.2 and 9 years
respectively). An Australian CEO was employed on average for 22 years in the firm compared to 26 years
for U.S. CEOs and 34 years for Japanese CEOs. In addition, the outgoing Australian CEO was a director
on the board for an average of 10 years. In comparison, the incoming Australian CEO had an average age
of 50, an average tenure as a director on the board of 3.3 years and was employed on average for 17.9 years
in the firm.
13 Kaplan (1994).
14 Kaplan (1994). Kang and Shivdasani (1995) report an average age of 62 and average tenure of 7.4 years.
15 Kaplan (1994a).
15
Panel B provides details of the number of CEO changes per year, the number of CEOs appointed chairman
and the number of outsiders that replaced the outgoing CEO. For the Australian sample, the outgoing CEO
was appointed chairman in 30% of the firms where data was available (65% of the sample). In comparison
64% of Japanese presidents16 and 16% of U.S. CEOs stayed on as chairman17.The incoming CEO was an
outsider in 38% of the firms for which data was available (65% of the sample) compared to 10% for
Japanese firms and 15% for U.S. firms18. An Australian inside replacement had been a director for 2 years
on average and an employee for 11 years on average. Figure 2 provides a graphical comparison.
[Insert Figure 2 here]
We relate turnover to performance measures to test if poor performance increases the likelihood of CEO
replacement. Further, we test whether non executive and independent (outside) boards monitor the
management more effectively than executive and non independent (inside) boards and compare the size
of the effects across boards. We utilise a multivariate logit regression framework to estimate the probability
of a CEO change as determined by performance.
The dependent variable is an indicator variable that captures the change in the CEO. The variable equals
one if there is a change in CEO and equals zero otherwise. The set of independent variables consists of a
market adjusted return measure and dummy variables that describe the composition of the board. Two
return measures are used. Current return is the return of the firm’s stock less the return on the market index
for the four quarters prior to the quarter in which the CEO change is announced. Lagged return is the
return of the firm’s stock less the return on the market index for the fifth to eight quarter prior to the
16 Kang and Shivdasani (1995). Kaplan (1994) reports an average percentage of 68.5%.
17 Kaplan (1994).
18 Parrino(1997).

16
quarter in which the CEO change is announced. The market performance adjustment is aimed at isolating
any overall market induced shocks to the firm’s performance21.
21 An adjustment of the market return by each firm’s beta was considered. However, it can be argued that theevaluation of managers for corporate governance purposes is done on present, or recent past, performance. Thatis, the monitors of managers do not take into account how the firm has moved historically (in previous years) tothe market (which is in essence what the firm’s beta measures), but rather how it is currently performing. Thusthe beta adjustment is not undertaken. Weisbach (1988) and Warner et al (1988) do not adjust for beta.Weisbach argues that the firm’s performance from previous years (that is, 5 or 6 years back) are not necessarilycorrelated with today’s performance and may therefore bias the results.
The dummy variables used to describe the composition of a firm’s board of directors are DNon Executives, a
dummy variable equal to one if the board consists of greater than 50% of non-executive directors and
DIndependant , a dummy variable equal to one if the board consists of greater than 50% of independent
directors.
Similar to Weisbach (1988), dummy variables are multiplied by the return variable to examine the
interactive effects. The product variables represent the probability that a particular board type will remove
a CEO due to the level of the firm’s performance. In addition, we examine the effect of the announcement
of the change in CEO on the firms stock price using the standard event study methodology developed by
Brown and Warner (1980,1985).
A number of hypotheses are tested. Firstly, that there is an inverse relationship between prior performance
and the probability of CEO turnover, as poor stock price performance should lead to a CEO change.
Secondly, that non executive boards are more likely to monitor and remove managers for poor
performance. Thirdly, that independent directors are more likely than non independent directors to remove
a CEO for poor performance.

17
5. Results
5.1. Logit Model Predicting CEO Replacement
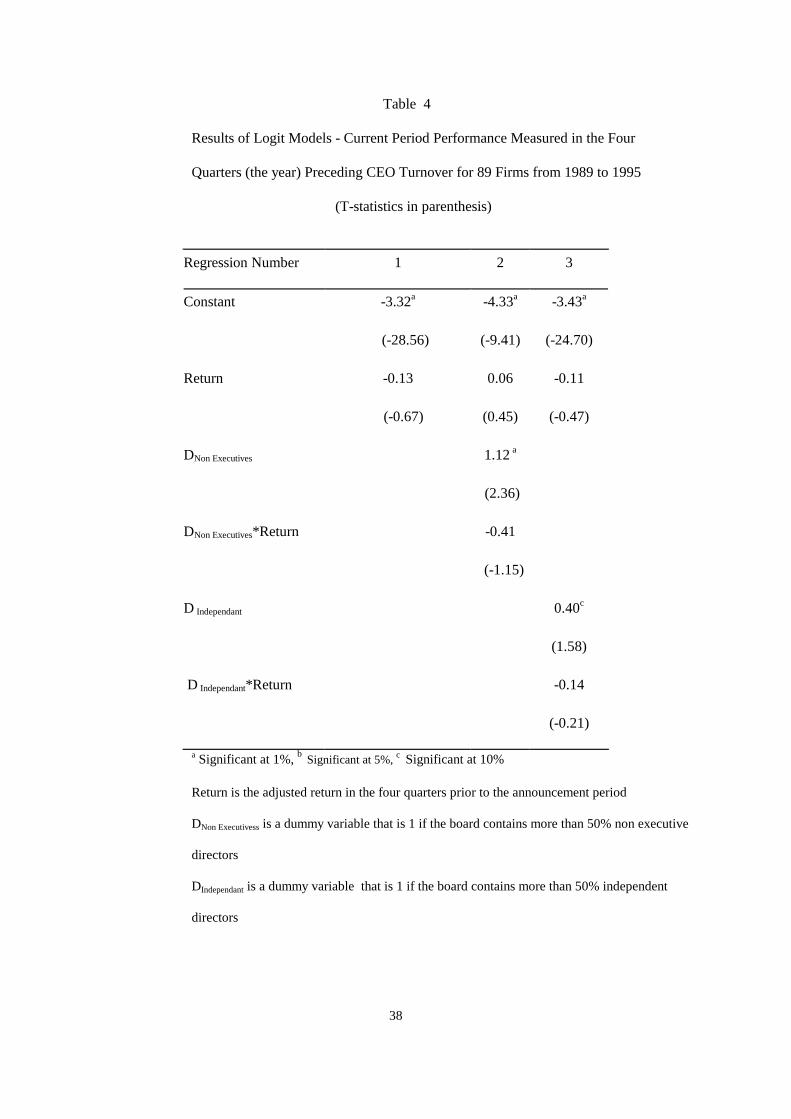
Table 4 presents the results of the logit model to test each of the three hypotheses, using the current
performance measure.
[Insert Table 4 here]
Regression 1 tests whether there exists an inverse relationship between the likelihood of CEO turnover and
the firm’s performance. The coefficient of the return variable is negative as theorised, but insignificant.
Therefore, there is no empirical support for the hypothesis that the board of directors will remove a CEO
for current poor performance. Even though this result suggests that overall, the board of directors may not
be monitoring and removing a CEO for poor short term performance, there could be two different
explanations. Firstly, the insignificance of the return-CEO replacement relationship may be due to
differences in board composition which is examined in Regression 2 and 3.
However, the results in regression 2 do not support the hypothesis that non executive directors are more
likely than executive directors to remove a CEO for poor performance. For the executive dominated
boards, the return coefficient (0.06) is not significantly related to CEO change. For the non executive
18
boards, the return coefficient (-0.35 = 0.06-0.41), is negative as hypothesised but insignificant.22 Similarly
in Regression 3, the return coefficient for non independent (-0.11) and independent boards (-0.25 = -0.11-
0.14) is negative but insignificant. Thus overall, it appears that current stock performance does not
significantly determine the likelihood of CEO change and the results are similar across different board
types.
The results are in contrast to those reported for the U.S.(Weisbach (1988) and Warner, Watts and Wruck
(1988)), but are consistent with those reported for Japan (Kang and Shivdasani (1995), and Kaplan (1994))
and Germany (Kaplan (1994a)).
Secondly, the insignificance of the current return-CEO replacement relationship may be due to the
possibility that the Australian market setup, due to the lack of market pressure for short term performance,
does not initiate board action against the CEO. In this scenario, it is plausible that before removing the
CEO, the firm tries to resolve the matter internally within the existing board - management configuration.
Thus, if performance does not improve despite mild corrective action, we may find that CEO replacement
takes place with a lagged response.
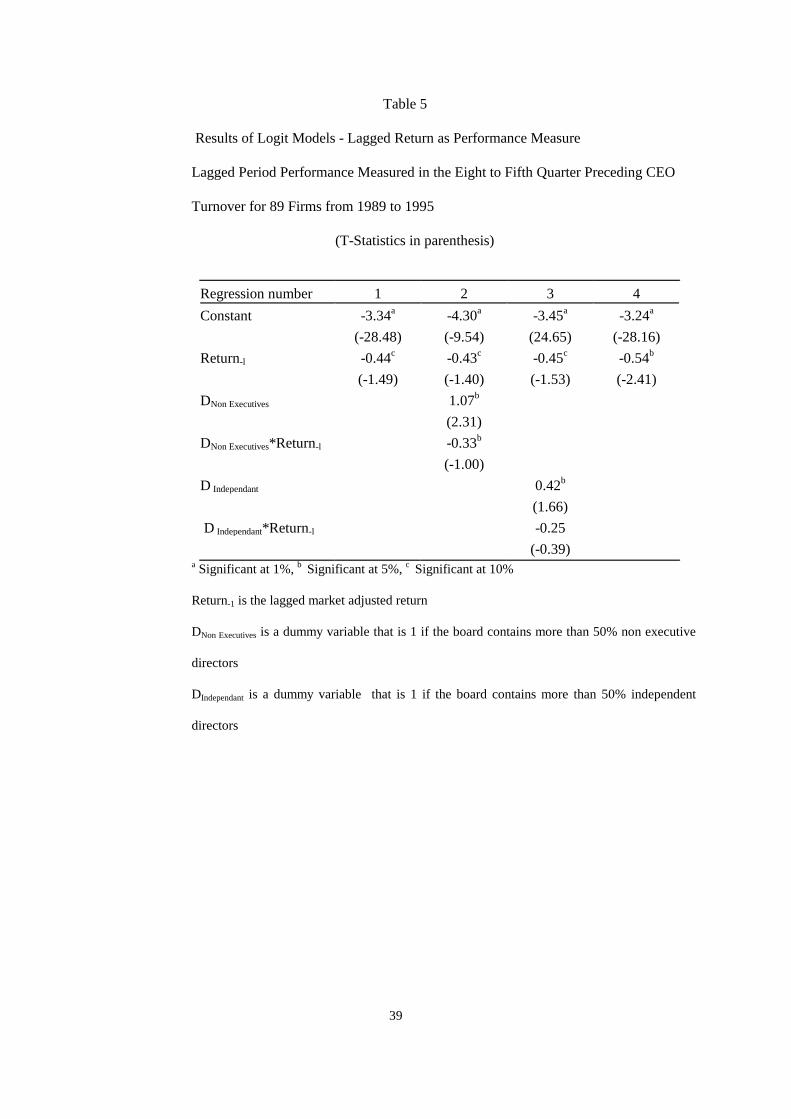
Table 5 presents the results of lagged performance as a predictor of CEO turnover. In regression 1, the
coefficient of market adjusted performance is negative and significant23, indicating that irrespective of
board types, poor performance increases the likelihood of CEO turnover. In addition, the results are
consistent with the monitoring hypothesis. In regression 2, the return coefficient (-0.76 =-0.33-0.43) for
non executive boards is significant at the 5% level. The result implies that boards dominated by non
22 The standard deviation used to calculate the t statistics of the combined coefficient is the square root of thesum of the varaince of A and B multiplied by the covaraince of A and B. A is the return estimate and B is theinteractive return estimate from the logit regression.
23 Following Weisbach (1988), we use a one tailed t test.

19
executives are more likely than executive dominated boards to remove the CEO for poor performance.
In regression 3, the results show that independent boards are more likely than non independent boards to
remove CEOs for poor performance, although the coefficient ( -0.70 = -0.25-0.45) is not significant at
conventional levels.
[Insert Table 5 here]
Thus overall, the results in Tables 4 and 5 suggest that despite the similarity in the board structure between
Australian and Anglo-Saxon systems, there are differences in the sensitivity of CEO turnover to poor
performance. More specifically, for Australian firms, it is lagged performance rather than current
performance that seems to influence the board’s decision to remove the CEO. However, similar to the
U.S./U.K. markets, non executive dominated boards are more likely to remove poor performing CEOs.
To further test the timing of the response to poor performance, a two year return measure (the firm’s stock
return less the return on the market index for the eight quarters prior to the quarter in which the CEO
change is announced), is regressed against CEO change. Regression 4 in Table 5 shows that the coefficient
of market adjusted long term performance is negative and significant, indicating that irrespective of board
types, long term poor performance increases the likelihood of CEO turnover. This result suggests that it
takes a number of years of poor performance before the board decides to terminate the CEO.
One reason for the partial support of the boards hypothesised role, may be the visibility and consequent
scrutiny of firms by markets. It is possible that large firms are more closely followed by market analysts
and ownership structure of large firms reflects higher absolute stakes and hence closer monitoring by active
investors. Thus, large firm boards may be more responsive to performance fluctuations and hence more
likely to remove poor performing CEOs. In addition, it is possible that in smaller firms, the board structure
has not evolved and/or the firm is still family/founder dominated. Thus, there may be a less pronounced

20
effect of board types in determining the performance-turnover relationship in small firms, compared to
large firms.
The above analysis is repeated for large and small firms. The results for large firms are presented in Table
624. The results in regression 2 support the hypothesis that non executive directors are more likely than
executive directors to remove a CEO as the coefficient of the variable for the non executive dominated
board of directors (-1.33 = -1.03-0.30), is significant at the 5% level. Similarly, the results in regression
3 support the monitoring hypothesis. Independent directors are more likely than non independent directors
to remove a CEO for poor performance as the coefficient of the variable for independent boards (-2.81 =
-1.73-1.08) is negatively significant at the 5% level. In addition, the results in regression 4 indicate that
long term poor performance increases the likelihood of CEO turnover. Similar regressions were run for
small firms but there were no signifcant relationships between CEO turnover, performance and board
types.
[Insert Table 6 here]
The results imply that for Australian firms, corporate boards are effective mechanisms in taking corrective
action against poor performing CEOs. However, the board is more effective in larger firms than smaller
firms and there appears to be a lagged response compared to the U.S./U.K. markets where current poor
performance results in CEO removal.
24Large firms are those with a market capitalisation greater than A$1.1billion. Small firms have a marketcapitalisation between A$330 million and A$1.1billion.
21
To make the results directly comparable to U.S. studies, we investigate the turnover performance
relationship using Weisbach’s (1988) board classifications25. The results are presented in Table 7. In Panel
A, regression 1 suggests that there is not an outside dominated board effect on the relationship between
current performance and CEO turnover. The results do not change when we control for board size in
regression 2. The results are in contrast to Weisbach (1988) who finds a significant relationship. The panel
B results use lagged return as a predictor of CEO turnover. The relationship between lagged return
conditional upon board type is not significant at conventional levels, consistent with Weisbach (1988).
However, when the sample is restricted to large firms in panel C, we find that poor performance increases
the likelihood of CEO removal in outsider dominated boards. In regression 1 and 2, the coefficients for
outside dominated boards (-2.31= -1.16-1.15 and -2.27 = -1.11-1.16, respectively) are significant at the
5% level. Overall the results confirm our previous finding that Australian boards are more effective in
removing CEOs in large firms than small firms and the corrective action takes place with a response lag.
The size effect result is in contrast to Weisbach (1988) who finds that his results are not sensitive to firm
size. This result may be a factor of the small number of truly large Australian firms as well as the large
discrepancy in the size between large and small Australian firms.
[Insert Table 7 here]
The difference between the timing of the CEO removal in Australia and US may be attributed to
differences in the corporate governance methodologies used by key institutional investors. U.S.
institutional investors (such as CalPERS) tend to have an aggressive and preemptive methodology and thus
there is a quicker reaction to poor performance, due to aggressive action from external parties. In Australia,
institutional investors (such as AMP) adopt a less aggressive, informal approach. Often after a problem
is discovered, the institutional investor will informally meet with the firm and discuss possible solutions.
If the issue is not settled or further issues arise, then there is a public corporate governance reaction to the
25 As suggested by the reviewer.

22
problem..26 Thus, there is a lag between discovery and action.
26 Ascertained from interviews with Leigh Hall, Deputy Managing Director, AMP.

23
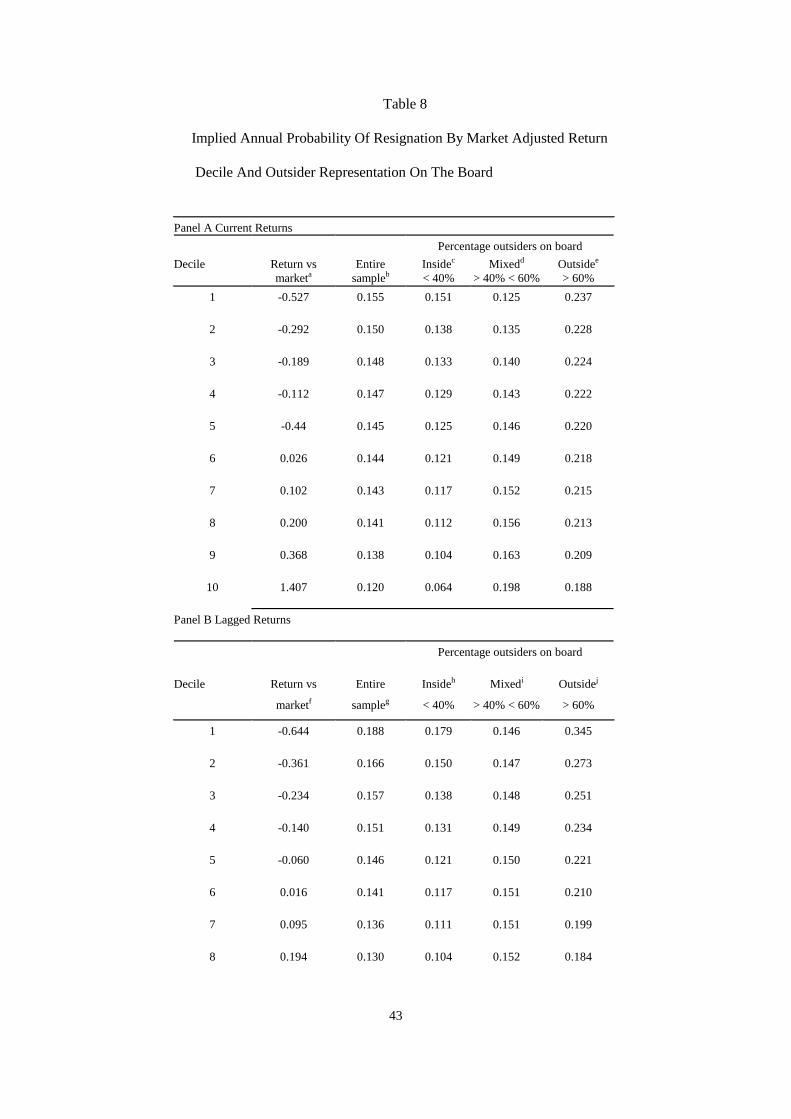
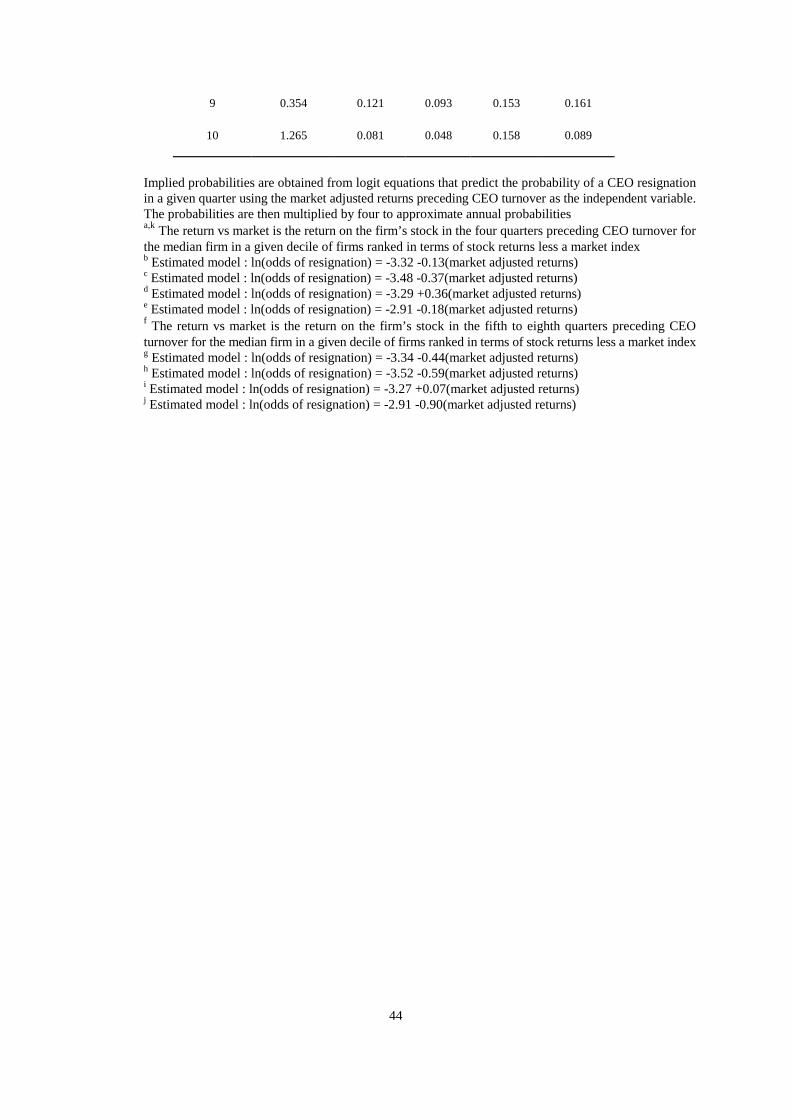
In Table 8, we present the calculation of implied probability of CEO turnover in response to current and
lagged performance which allows the examination of the economic significance of the results.27 The
difference in the likelihood of CEO turnover between the top and bottom performance deciles is 3.5% for
current performance and 10.7% for lagged performance. The results are similar to Weisbach (1988) who
finds a difference of 3% for U.S. firms and Kang and Shivdasani (1995) who find a difference of 3.9% for
Japanese firms. We find that for outside boards, the probability of removal of the CEO is higher than for
inside dominated boards, in all performance deciles. Further, the difference between the probabilities of
CEO removal between the bottom and top performance lagged performance deciles for inside boards is
lower than that for outside boards, similar to Weisbach (1988). Finally, consistent with the monitoring
hypothesis there is a monotonic increase in probabilities of CEO removal as we move from the lowest
percentage of outsiders to the highest percentage except for the two worst and the best performing deciles.
[Insert Table 8]
5.2 Event Study Results
Table 9 reports the results of the announcement effect of CEO change.
[Insert Table 9 here]
The results show a positive, but insignificant abnormal return in the stock price on the day of the
announcement. In contrast, the day following the announcement has a significant negative abnormal return
which suggests a lagged response to the announcement or the information only flowing to the market the
day after the announcement to the stock exchange (due to the lateness of the time of day at which the
27 This point was highlighted by the reviewer to make the results directly comparable to those of Weisbach(1988).

24
information is supplied).
The results are in contrast to Weisbach (1988) who finds a significant positive effect. He concludes that
this is consistent with the hypothesis that directors act in the interest of stockholders. Therefore, the market
interprets the change in CEO as being motivated to enhance stockholder wealth, which would result in the
market upgrading the future forecast for the firm, and hence an increase in the stock price. Additionally,
a zero announcement effect may be interpreted as being good news for some firms and bad for others
(Warner, Watts and Wruck (1988)).
A possible explanation of the negative announcement effect, is that the short term effect of the change
dominates the long term effect. The effect of a change in the CEO will have an adverse short term effect
on the firm, as there will be a settling in period for the new CEO, a potential restructure of the management
in the firm and a general period of distraction from the core business of the firm. In addition, in the short
term, the problems that caused the change in CEO may still exist (which will adversely affect the
performance of the firm). In contrast, in the long term, the change in CEO should improve the performance
of the firm (this is based on the assumption that the firm would hire a qualified and capable CEO). If there
is a negative announcement effect, this implies that the market judges that the short term negative effect
is greater than the long term positive effect.
A further potential explanation of the negative effect is derived from the corporate governance process in
Australia. Much of the corporate governance methodology is conducted in private. Often, the only signal
to the market of a corporate governance issue at a firm is the final process of the removal of a CEO. Thus,
the announcement of a change in CEO may be the first time the market is informed about a corporate
governance issue and thus lead investors to revise their forecasts of the firm.
In addition, the sample of CEO changes is divided on the basis of board composition into an independent
25
director dominated or non independent dominated board to investigate whether the present corporate
governance structure at the firm influences the market’s reaction. The announcement effect of a CEO
change for a firm with a non independent board, is negative and significant (at a 10% level). This result
conforms to the explanation of the overall negative market reaction to a CEO change. An additional
consideration is the concept that an independent director will monitor managers more strictly than non
independent directors. For non independent directors to remove a CEO, the action that motivated the
change in CEO must have been significantly detrimental to the interests of stockholders. The market
interprets the change in CEO of a firm with a non independent board as bad news about the current
situation of the firm. There is an insignificant announcement effect for the change in the CEO of a firm
with an independent board. The insignificant result is consistent with Warner et al (1988). Their
conclusion, that the news of a CEO change is good for some firms but bad news for other firms, appears
to be relevant for Australian firms with independent boards.28
Furthermore, the effect of previous stock performance (which is a measure of the performance of the
managers and is a possible proxy for monitoring by directors) on the announcement is investigated. The
sample is divided on the criteria of the stock price return (relative to the market) over the previous year.
Table 10 presents the announcement effects.
[Insert Table 10 here]
28 The abnormal stock price movement in the period around the announcement of a change in CEO is analysed.However apart from day 1, the results are insignificant. This is consistent for all board types.
26
Similarly, only day one has significant abnormal returns. Firms which have negative performance, followed
by a CEO change, have an insignificant announcement effect. This result is consistent with the overall
finding of Warner et al (1988). A priori, the announcement effect is expected to be positive as it signals
the removal of an ineffective manager, and thus improved performance. However, this potential
improvement in the firm may be countered/nullified by the release of other previously unknown
information about the internal factors of the firm. Additionally, the suggestion that the short term
disruptions dominate (or in this case, cancel) the long term improvement, may also contribute to the
insignificant result.
Firms that have positive performance followed by a CEO change, have a significant negative
announcement effect. This suggests that the announcement of a change in CEO contains adverse
information about other aspects of the operation of the firm. Thus, when a CEO of a firm that has
performed well is removed, the market will search for the underlying reason. If a corporate governance
type issue is discovered, the stock is devalued (by a large margin as previously they may have overvalued
the firm, hence the positive pre-announcement performance).
In addition, the sample is divided by prior performance and board composition to estimate the relationship
between the announcement effect and corporate governance issues. Only one of the four classifications,
a firm with prior positive performance and a non-independent board, yields significant negative results.
The other three classifications yield insignificant results.29
The strong negative announcement effect of the prior positive performance and a non independent board
sample may be the best proxy for a true retirement30. A non independent board is the least likely to remove
29 One problem with dividing the overall sample into these segments, is the small size of each segment. This maylead to small sample size bias in the results. Thus strong overall conclusions cannot be made.
30 We were unable to directly determine if a CEO change was due to retirement.

27
a CEO. Furthermore, prior positive performance at face value (and with no other information) would not
constitute a rationale to remove a CEO. Thus this combination may well reflect a true retirement (or at least
be the best proxy). Therefore, the negative announcement effect suggests that the short term disruption,
due to a new CEO being appointed (and having to learn about the operation of the firm), dominates the
long term improvement a new CEO may bring to the firm.31
31 On the other hand, the theory of new ‘bad’ information about the firm, coupled with the seriousness of this if anon-independent board is to act, may also be applicable.
28
The insignificant results of the event study approach highlight the assertion by Warner et al(1988) for the
need to use predictive models (such as the logit model).The negative announcement effect of a change in
CEO may be explained by two (possible contradictory) theories. Firstly, that the short term ‘damage’ to
the firm dominates the long term improvement from a change in a (poorly performing) CEO. Secondly,
the announcement of a change in CEO, releases previously unknown32 information about certain internal
aspects of the firm.
6. Conclusion
We provide evidence of the relationship between CEO turnover and firm performance for Australian firms.
Australian board structures and mechanisms are more similar to those in the U.S./U.K but market activity
characteristics are more similar to Japanese/German systems. We find a negative relationship between
lagged firm performance and CEO turnover in comparison to U.S. results where the relevant performance
measure is the current stock price return. In addition the monitoring hypothesis is supported as non
executive and independent boards are more likely to monitor and remove a CEO for poor performance.
However, in contrast to the U.S., a size effect is found for Australian firms whereby the monitoring
hypothesis appears to only be relevant for large Australian firms.
The difference between the timing of the CEO removal in Australia and US may be attributed to
differences in the corporate governance methodologies used by key institutional investors. US institutional
investors tend to have an aggressive and preemptive methodology compared to a less aggressive, informal
approach used by Australian institutional investors.
32Because much of corporate governance activity, monitoring and investigative of a CEO behaviour is conductedin private.

29
In addition, the announcement of a CEO change has a lagged significant negative effect. In contrast, the
announcement effect in the US is either positive (Weisbach (1988)) or zero (Warner, Watts and Wruck
(1988)). Two potential explanations of the effect are suggested. Firstly, the short term damage from the
change (due to upheaval caused by the change, distraction of the appointment and settling in period of the
new CEO as well as the existing problems which caused the change) dominates the potential long term
benefit from a change in CEO (assuming that the new CEO is suitably qualified and capable) as well as
the correction of the current problems. Secondly, the news of the change in CEO might release previously
unknown information about potential problems or managerial behavior at the firm. The release of unknown
information is consistent with the private or hidden aspects of the corporate governance system in
Australia.
30
References
Blackwell, D.W., Brickley, J.A. and M.S.Weisbach, 1994, Accounting Information and Internal
Performance Evaluation: Evidence from Texas Banks, Journal of Accounting and Economics 17,
331-58.
Borokhovich, K.A., Parrino, R. and T.Trapani, 1996, Outside Directors and CEO Selection,
Journal of Quantitative Analysis 31, 337-55.
Bosch, H., 1991, Corporate Practices and Conduct, (Information Australia, Melbourne).
Brown, S. and J.Warner, 1980, Measuring Security Price Performance, Journal of Financial
Economics 8, 205-258.
Brown, S. and J.Warner, 1985, Using Daily Stock Return: The Case of Event Studies, Journal
of Financial Economics 24, 3-31.
Byrd, J.W. and K.J.Hickman, 1992, Do outside directors monitor managers?, Journal of Financial
Economics 32, 195-221.
Cadbury, A., 1992, The Financial Aspects of Corporate Governance - The Code of Best Practice,
(Burgess Science Press, London).
Cosh, A. and A. Hughes, 1997, Executive Remuneration, Executive Dismissal and Institutional
31
Shareholdings, International Journal of Industrial Organisation 15, 469-92.
Denis, D.J, Denis, D.K and A.Sarin, 1997, Ownership Structure and Top Executive Turnover,
Journal of Financial Economics 45, 193-221.
Gibbons and Murphy, 1990, Relative Performance Evaluation for Chief Executive Officers,
Industrial-and-Labor-Relations-Review 43, 30-51.
Gilson, S.A, 1990, Bankruptcy, Boards, Banks, and Blockholders: Evidence on Changes in
Corporate Ownership and Control When Firms Default, Journal-of-Financial-Economics 27,
355-87.
Jensen, M.C. and K.J.Murphy, 1990, Performance Pay and Top-Management Incentives, Journal
of Political Economy 98, 225-64.
John, K and L.M Senbet, 1998, Corporate Governance and Board Effectiveness, Journal of
Banking and Finance 22, 371-403.
Kang, J.K. and A. Shivdasani, 1995, Firm Performance, Corporate Governance, and Top
Executive Turnover in Japan, Journal of Financial Economics 38, 29-58.
Kaplan, S.N, 1994, Top Executive Rewards and Firm Performance: A Comparison of Japan and
the United States, Journal of Political Economy 102, 510-46.

32
Kaplan, S.N, 1994a, Top Executives, Turnover, and Firm Performance in Germany, Journal of
Law, Economics and Organization 10, 142-59.
Lorsch, J.W. and E.MacIver, 1989, Pawns or Potentates : The Reality of America’s Corporate
Boards, (Harvard Business School Press, Boston).
Mace, M.L, 1986, Directors : Myth and Reality, (Harvard Business School Press, Boston).
Mikkelson, W.H. and M.M. Partch, 1997, The Decline of Takeovers and Disciplinary Managerial
Turnover, Journal of Financial Economics 44, 205-28.
Murphy, K.J. and J.L. Zimmerman, 1993, Financial Performance Surrounding CEO Turnover,
Journal of Accounting and Economics 16, 273-315.
Parrino, 1997, CEO Turnover and Outside Succession a Cross-Sectional Analysis, Journal of
Financial Economics 46, 165-97.
Stapleton, G., Lawrence, J. & D.Pollard, 1996, Corporate Governance and Corporate Boards,
Conference of Major Superannuation Funds, Sydney, Australia
Warner, J.B., Watts, R.L. and K.H.Wruck, 1988, Stock Prices and Top Management Changes,
Journal of Financial Economics 20, 461-492.
Weisbach, M., 1988, Outside Directors and CEO Turnover, Journal of Financial Economics 20,
431-460.

33
Figure 1
A Comparison of the Board Size and the Percentage of Executives, Outsiders
and Insiders of Australian, Japanese, U.S. and German Boards.
0
20
40
60
80
100
120
Board Size Executives(%) Outsiders(%) Insiders(%)
AusJapanU.S.Germany
34
Figure 2A Comparison of the Age, Tenure, Number of Years Employed in the Firm of the CEO, the Percentage
of CEO’s Appointed Chairman After Removal and the Percentage of Outsiders Replacing a CEO.
0
10
20
30
40
50
60
70
80
Age Tenure Yrs Employed Appt Chair(%) Appt Outsider(%)
AusJapanU.S.Germany
35
Table 1
Comparison of Turnover Studies in the US, Japan, Germany, the UK and Australia
Study Country Period Turnover type Stockperformance
Coefficientof logitmodel
Warner, Watts and Wruck(1988)
US 1963-78 CEO turnover Current returnLagged return
-1.17b
-0.28
Weisbach (1988) US 1974-83 CEO turnover Current return -0.64b
Lagged return -0.10
Kaplan (1994a) Germany 1981-89 turnover ofmanagementboard19
Current returnLagged return
-0.080c
-0.103 b
turnover ofchairman
Current returnLagged return
-0.110-0.003
Kaplan (1994) Japan 1980-88 president turnover Current return 0.053Lagged return -0.045
non standardpresident turnover
Current returnLagged return
-0.045-0.069 a
representativedirectors
Current returnLagged return
-0.056-0.100 b
US 1980-88 CEO turnover Current return -0.168 c
Lagged return -0.067executive directorturnover
Current returnLagged return
-0.072 b
-0.081c
Kang and Shivdasani(1995)
Japan 1985-90 president turnover Current return -0.15
non standardpresident turnover
Current return -0.96 b
Cosh and Hughes (1997) UK 1989-94 CEO turnover Current return -0.95 c
Current andLagged return
0.67,-0.98
Present paper Aus 1989-95 CEO turnover Current returnLagged return
-0.13-0.44 c
a Significant at the 1% level, b Significant at the 5% level, c Significant at the 10% level
19OLS regression results.
36
Table 2
Composition of 89 Australian Boards 1989-1995.
The average percentage of executives, non independent non executives and independent executives on the board are
estimated for each year. Executives are employees of the firm and non independent non executives are ex-employees,
directors that have business dealings with the firm, or arerelated (by family) to management directors.
Executive(%)
Non Independent NonExecutive (%)
IndependentNon Executive (%)
1989 33.2 36.0 30.81990 32.7 35.2 31.91991 31.9 34.9 33.21992 31.0 34.6 34.41993 29.7 32.6 37.71994 29.1 32.4 38.61995 28.9 32.2 38.9

37
Table 3
Characteristics of CEO Change
The age, the tenure of the incumbent CEO in his/her current position, the tenure of the CEO as a director on the
board and the years employed by the firm are reported in the first set of columns. Similar characteristics of the
replacement are reported in the second set of columns. The original sample is of 59 firms between 1989 and 1995.
In panel B, the number of CEO changes (n) is not equal to 59 as data was not available for all CEO changes.
Panel A Descriptive characteristics of incumbent CEO and replacement
Current CEO Replacement
Age Tenure(CEO)
Tenure(director)
Yearsemployed
Age Tenure(director)
Yearsemployed
Average 55.70 5.98 10.15 21.96 49.65 3.29 17.93
Median 56 4 8 20 50 3 18
Std deviation 7.04 5.77 7.36 13.71 5.62 3.33 11.22
N 48 51 44 39 47 33 33
Panel B Appointments and Outsider Replacement for CEO Changes by Year of Change
89 90 91 92 93 94 95
Appointedchairman
1 1 3 5 1 4 4
Not appointedchairman
2 3 4 7 6 4 6
Outsiderreplacement(data available)
1 (2) 0 (4) 0 (5) 6 (16) 3 (6) 6 (10) 3 (7)
Number ofCEO changes
7 10 11 19 11 11 8
38
Table 4
Results of Logit Models - Current Period Performance Measured in the Four
Quarters (the year) Preceding CEO Turnover for 89 Firms from 1989 to 1995
(T-statistics in parenthesis)
Regression Number 1 2 3
Constant -3.32a -4.33a -3.43a
(-28.56) (-9.41) (-24.70)
Return -0.13 0.06 -0.11
(-0.67) (0.45) (-0.47)
DNon Executives 1.12 a
(2.36)
DNon Executives*Return -0.41
(-1.15)
D Independant 0.40c
(1.58)
D Independant*Return -0.14
(-0.21)
a Significant at 1%, b Significant at 5%, c Significant at 10%
Return is the adjusted return in the four quarters prior to the announcement period
DNon Executivess is a dummy variable that is 1 if the board contains more than 50% non executive
directors
DIndependant is a dummy variable that is 1 if the board contains more than 50% independent
directors
39
Table 5
Results of Logit Models - Lagged Return as Performance Measure
Lagged Period Performance Measured in the Eight to Fifth Quarter Preceding CEO
Turnover for 89 Firms from 1989 to 1995
(T-Statistics in parenthesis)
Regression number 1 2 3 4Constant -3.34a -4.30a -3.45a -3.24a
(-28.48) (-9.54) (24.65) (-28.16)Return-l -0.44c -0.43c -0.45c -0.54b
(-1.49) (-1.40) (-1.53) (-2.41)DNon Executives 1.07b
(2.31)DNon Executives*Return-l -0.33b
(-1.00)D Independant 0.42b
(1.66) D Independant*Return-l -0.25
(-0.39)a Significant at 1%, b Significant at 5%, c Significant at 10%
Return-1 is the lagged market adjusted return
DNon Executives is a dummy variable that is 1 if the board contains more than 50% non executive
directors
DIndependant is a dummy variable that is 1 if the board contains more than 50% independent
directors

40
Table 6
Results of Logit Models - Large Firms
Lagged Return Measured in the Eight to Fifth Quarter Preceding CEO Turnover as
Performance Measure for 44 firms from 1989 to 1995
(T-statistics in parenthesis)
Regression number 1 2 3 4
Constant -3.27a -4.01a -3.32a -3.36a
(-19.81) (-5.57) (-16.41) (18.49)Return-1 -0.98b -1.03b -1.08b -1.39a
(-2.03) (-2.05) (-2.19) (-3.38)DNon Executives 0.79
(1.08)DNon Executives*Return-1 -0.30b
(-0.56)D Independant 0.34
(0.10)D Independant*Return-1 -1.73b
(-1.62)a Significant at 1%, b Significant at 5%, c Significant at 10%
Return-1 is the lagged market adjusted return
DNon Executives is a dummy variable that is 1 if the board contains more than 50% non executive
directors
DIndependant is a dummy variable that is 1 if the board contains more than 50% independent
directors

41
Table 7
Results of Logit Models - Weisbach Classification
Current Return Measured in the Four Quarters (the year) Preceding CEO Turnover and Lagged Return
Measured in the Eight to Fifth Quarter Preceding CEO Turnover as the Performance Measure for 89 firms
from 1989 to 1995. Australian results are compared to U.S. results in Weisbach(1988).
(T-statistics in parenthesis)
Panel A
Current Return Weisbachresults
Regression number 1 2 1Constant -3.48a -4.26a -4.39a
(-20.57) (-10.65) (31.40)Return -0.37 -0.33 -0.46
(-0.97) (-0.84) (0.92)DMixed 0.19 0.12 0.13
(0.71) (0.46) (0.68)DMixed*Return 0.66 0.70 0.26
(1.29) (1.33) (0.39)DOutside 0.57b 0.54b -0.18
(1.85) (1.74) (0.86)DOutside*Return 0.19 0.25 -1.17a
(0.24) (0.31) (1.60)Board Size 0.09b
(2.09)Panel B
Lagged Return Weisbachresults
Regression number 1 2 1Constant -3.52a
(-20.36)-4.26a
(-10.65)-4.60a
(28.80)Return-1 -0.59c -0.66c -0.10
(-1.48) (-1.57) (0.20)DMixed 0.25
(0.92)0.18
(0.66)0.23
(1.15)DMixed*Return-1 0.66
(0.96)0.78
(1.11)-0.08(0.11)
Doutside 0.61b
(1.95)0.57b
(1.83)-0.03(0.14)
DOutside*Return-1 -0.31(-0.34)
-0.25(-0.26)
-0.44(0.71)

42
Board Size 0.09b
(2.16)
Panel CLagged Return Large FirmsRegression number 1 2Constant -3.36a
(-13.09)-4.26a
(-10.65)Return-1 -1.16b
(-1.72)-1.16b
(-1.73)DMixed 0.04
(0.10)0.03
(0.09)DMixed*Return-1 1.55
(1.40)1.57
(1.41)DOutside 0.26
(0.62)0.27
(0.64)DOutside*Return-1 -1.15b
(-0.93)-1.11b
(-0.92)Board Size 0.01
(0.22)a Significant at 1%, b Significant at 5%, c Significant at 10%
Return is the current market adjusted return
Return-1 is the lagged market adjusted return
DMixs is a dummy variable that is 1 if the board contains between 40% and 60% outsiders
DOutside is a dummy variable that is 1 if the board contains at least 60% outsiders
43
Table 8
Implied Annual Probability Of Resignation By Market Adjusted Return
Decile And Outsider Representation On The Board
Panel A Current ReturnsPercentage outsiders on board
Decile Return vsmarketa
Entiresampleb
Insidec
< 40%Mixedd
> 40% < 60%Outsidee
> 60%1 -0.527 0.155 0.151 0.125 0.237
2 -0.292 0.150 0.138 0.135 0.228
3 -0.189 0.148 0.133 0.140 0.224
4 -0.112 0.147 0.129 0.143 0.222
5 -0.44 0.145 0.125 0.146 0.220
6 0.026 0.144 0.121 0.149 0.218
7 0.102 0.143 0.117 0.152 0.215
8 0.200 0.141 0.112 0.156 0.213
9 0.368 0.138 0.104 0.163 0.209
10 1.407 0.120 0.064 0.198 0.188
Panel B Lagged Returns
Percentage outsiders on board
Decile Return vs
marketf
Entire
sampleg
Insideh
< 40%
Mixedi
> 40% < 60%
Outsidej
> 60%
1 -0.644 0.188 0.179 0.146 0.345
2 -0.361 0.166 0.150 0.147 0.273
3 -0.234 0.157 0.138 0.148 0.251
4 -0.140 0.151 0.131 0.149 0.234
5 -0.060 0.146 0.121 0.150 0.221
6 0.016 0.141 0.117 0.151 0.210
7 0.095 0.136 0.111 0.151 0.199
8 0.194 0.130 0.104 0.152 0.184
44
9 0.354 0.121 0.093 0.153 0.161
10 1.265 0.081 0.048 0.158 0.089
Implied probabilities are obtained from logit equations that predict the probability of a CEO resignationin a given quarter using the market adjusted returns preceding CEO turnover as the independent variable.The probabilities are then multiplied by four to approximate annual probabilitiesa,k The return vs market is the return on the firm’s stock in the four quarters preceding CEO turnover forthe median firm in a given decile of firms ranked in terms of stock returns less a market indexb Estimated model : ln(odds of resignation) = -3.32 -0.13(market adjusted returns)c Estimated model : ln(odds of resignation) = -3.48 -0.37(market adjusted returns)d Estimated model : ln(odds of resignation) = -3.29 +0.36(market adjusted returns)e Estimated model : ln(odds of resignation) = -2.91 -0.18(market adjusted returns)f The return vs market is the return on the firm’s stock in the fifth to eighth quarters preceding CEOturnover for the median firm in a given decile of firms ranked in terms of stock returns less a market indexg Estimated model : ln(odds of resignation) = -3.34 -0.44(market adjusted returns)h Estimated model : ln(odds of resignation) = -3.52 -0.59(market adjusted returns)i Estimated model : ln(odds of resignation) = -3.27 +0.07(market adjusted returns)j Estimated model : ln(odds of resignation) = -2.91 -0.90(market adjusted returns)

45
Table 9
Abnormal Return and Measures of Variance Change Around the Announcement of CEO Change
The sample comprises 59 firms between 1989 and 1995. Day 0 is the announcement to the Stock Exchange of the
CEO change.
Board Number of
CEO Changes
Abnormal
Return
Variance
change
Abnormal
Return
Variance
change
Abnormal
Return
Variance
change
Type Day 0 Day 1 0 to 1
All Types 59 0.16% 2.10 -0.49%b 1.92 b -0.33% 2.67
(Full Sample) (0.68) (0.14) (-2.03) (2.15) (-0.96) (1.42)
Non-Independent 40 0.26% 1.96 -0.56% c 1.98 -0.30% 2.61
Board (0.82) (0.01) (-1.75) (1.45) (-0.66) (1.02)
Independent 19 -0.04% 2.41 -0.36% 1.79 -0.39% 2.79
Board (-0.09) (0.23) (-0.88) (1.69)c (-0.69) (1.03)
b Significant at 5%, c Significant at 10% # T-statistic in parenthesis^Z-statistic in parenthesis

46
Table 10
Abnormal Return from Announcement of CEO Change by Board Type and Prior Performance for 59 Firms
over 1989 to 1995.
Prior Performance No of CEO
Changes
Abnormal
Return
Abnormal
Return
Abnormal
Return
Abnormal
Return
Type Day 0 Day 1 0 to 1 -3 to 3
Positive 27 0.44 -0.97a -0.53 -0.48
(1.28) (-2.82) (-1.09) (-0.53)
Negative 32 -0.07 -0.08 -0.15 -0.17
(-0.19) (-0.23) (-0.30) (-0.18)
Independent Board 12 -0.40 -0.29 -0.68 -1.37
with Negative (-0.77) (-0.55) (-0.93) (-1.00)
Independent Board 7 0.58 -0.48 0.10 -0.59
with Positive (1.01) (-0.83) (0.13) (-0.39)
Non Independent Board 20 0.13 0.04 0.16 0.55
with Negative (0.25) (0.07) (0.23) (0.40)
Non Independent Board 20 0.39 -1.15a -0.75 -0.44
with Positive (0.93) (-2.71) (-1.26) (-0.40)
a Significant at 1%