The Loss of Species: Mangrove Extinction Risk and Geographic Areas of Global Concern
10
The Loss of Species: Mangrove Extinction Risk and Geographic Areas of Global Concern Beth A. Polidoro 1 *, Kent E. Carpenter 1 , Lorna Collins 2,3 , Norman C. Duke 4 , Aaron M. Ellison 5 , Joanna C. Ellison 6 , Elizabeth J. Farnsworth 7 , Edwino S. Fernando 8 , Kandasamy Kathiresan 9 , Nico E. Koedam 10 , Suzanne R. Livingstone 1 , Toyohiko Miyagi 11 , Gregg E. Moore 12 , Vien Ngoc Nam 13 , Jin Eong Ong 14 , Jurgenne H. Primavera 15 , Severino G. Salmo, III 4,16 , Jonnell C. Sanciangco 1 , Sukristijono Sukardjo 17 , Yamin Wang 18 , Jean Wan Hong Yong 19 1 IUCN Species Programme/SSC/Conservation International Global Marine Species Assessment, Biological Sciences, Old Dominion University, Norfolk, Virginia, United States of America, 2 Center for Global Trends, The Nature Conservancy, Arlington, Virginia, United States of America, 3 School of Biological Sciences, University of Plymouth, Plymouth, United Kingdom, 4 Centre for Marine Studies, University of Queensland, St. Lucia, Queensland, Australia, 5 Harvard Forest, Harvard University, Petersham, Massachusetts, United States of America, 6 School of Geography and Environmental Studies, University of Tasmania, Launceston, Tasmania, Australia, 7 New England Wild Flower Society, Framingham, Massachusetts, United States of America, 8 Department of Forest Biological Sciences, University of the Philippines Los Ban ˜ os College, Laguna, Philippines, 9 Centre of Advanced Study in Marine Biology, Annamalai University, Parangipettai, India, 10 Faculty of Sciences and Bioengineering Sciences, Vrije Universiteit Brussel, Brussels, Belgium, 11 Faculty of Liberal Art, Department of Regional Management, Tohoku-Gakuin University, Sendai, Japan, 12 Department of Biological Sciences and Jackson Estuarine Laboratory, University of New Hampshire, Durham, New Hampshire, United States of America, 13 Faculty of Forestry, Nong Lam University, Ho Chi Minh City, Vietnam, 14 Centre for Marine and Coastal Studies, Universiti Sains Malaysia, Penang, Malaysia, 15 Aquaculture Department, Southeast Asian Fisheries Development Center, Tigbauan, Iloilo, Philippines, 16 College of Agriculture, Central Luzon State University, Science City of Munoz, Nueva Ecija, Philippines, 17 Center for Oceanological Research and Development, Indonesian Institute of Sciences, Jakarta, Indonesia, 18 College of Ocean, Shandong University, Weihai, China, 19 Natural Sciences and Science Education Academic Group, National Institute of Education, Nanyang Technological University, Singapore, Singapore Abstract Mangrove species are uniquely adapted to tropical and subtropical coasts, and although relatively low in number of species, mangrove forests provide at least US $1.6 billion each year in ecosystem services and support coastal livelihoods worldwide. Globally, mangrove areas are declining rapidly as they are cleared for coastal development and aquaculture and logged for timber and fuel production. Little is known about the effects of mangrove area loss on individual mangrove species and local or regional populations. To address this gap, species-specific information on global distribution, population status, life history traits, and major threats were compiled for each of the 70 known species of mangroves. Each species’ probability of extinction was assessed under the Categories and Criteria of the IUCN Red List of Threatened Species. Eleven of the 70 mangrove species (16%) are at elevated threat of extinction. Particular areas of geographical concern include the Atlantic and Pacific coasts of Central America, where as many as 40% of mangroves species present are threatened with extinction. Across the globe, mangrove species found primarily in the high intertidal and upstream estuarine zones, which often have specific freshwater requirements and patchy distributions, are the most threatened because they are often the first cleared for development of aquaculture and agriculture. The loss of mangrove species will have devastating economic and environmental consequences for coastal communities, especially in those areas with low mangrove diversity and high mangrove area or species loss. Several species at high risk of extinction may disappear well before the next decade if existing protective measures are not enforced. Citation: Polidoro BA, Carpenter KE, Collins L, Duke NC, Ellison AM, et al. (2010) The Loss of Species: Mangrove Extinction Risk and Geographic Areas of Global Concern. PLoS ONE 5(4): e10095. doi:10.1371/journal.pone.0010095 Editor: Dennis Marinus Hansen, Stanford University, United States of America Received October 7, 2009; Accepted March 16, 2010; Published April 8, 2010 Copyright: ß 2010 Polidoro et al. This is an open-access article distributed under the terms of the Creative Commons Attribution License, which permits unrestricted use, distribution, and reproduction in any medium, provided the original author and source are credited. Funding: This research was generously supported by core funding from Tom Haas and the New Hampshire Charitable Foundation. The funders had no role in study design, data collection and analysis, decision to publish, or preparation of the manuscript. Competing Interests: The authors have declared that no competing interests exist. * E-mail: [email protected] Introduction The importance of mangroves for humans and a variety of coastal organisms has been well documented [1–7]. Mangrove forests are comprised of unique plant species that form the critical interface between terrestrial, estuarine, and near-shore marine ecosystems in tropical and subtropical regions. They protect inland human communities from damage caused by coastal erosion and storms [8–11], provide critical habitat for a variety of terrestrial, estuarine and marine species [5,12–14], and serve as both a source and sink for nutrients and sediments for other inshore marine habitats including seagrass beds and coral reefs [2,15]. Mangrove species that form dense and often monospecific stands are considered ‘‘foundation species’’ that control population and ecosystem dynamics, including fluxes of energy and nutrients, hydrology, food webs, and biodiversity [16]. Mangroves have been widely reviewed [17] as supporting numerous ecosystem services including flood protection, nutrient and organic matter processing, PLoS ONE | www.plosone.org 1 April 2010 | Volume 5 | Issue 4 | e10095
Transcript of The Loss of Species: Mangrove Extinction Risk and Geographic Areas of Global Concern
The Loss of Species: Mangrove Extinction Risk andGeographic Areas of Global ConcernBeth A. Polidoro1*, Kent E. Carpenter1, Lorna Collins2,3, Norman C. Duke4, Aaron M. Ellison5, Joanna C.
Ellison6, Elizabeth J. Farnsworth7, Edwino S. Fernando8, Kandasamy Kathiresan9, Nico E. Koedam10,
Suzanne R. Livingstone1, Toyohiko Miyagi11, Gregg E. Moore12, Vien Ngoc Nam13, Jin Eong Ong14,
Jurgenne H. Primavera15, Severino G. Salmo, III4,16, Jonnell C. Sanciangco1, Sukristijono Sukardjo17,
Yamin Wang18, Jean Wan Hong Yong19
1 IUCN Species Programme/SSC/Conservation International Global Marine Species Assessment, Biological Sciences, Old Dominion University, Norfolk, Virginia, United
States of America, 2 Center for Global Trends, The Nature Conservancy, Arlington, Virginia, United States of America, 3 School of Biological Sciences, University of
Plymouth, Plymouth, United Kingdom, 4 Centre for Marine Studies, University of Queensland, St. Lucia, Queensland, Australia, 5 Harvard Forest, Harvard University,
Petersham, Massachusetts, United States of America, 6 School of Geography and Environmental Studies, University of Tasmania, Launceston, Tasmania, Australia, 7 New
England Wild Flower Society, Framingham, Massachusetts, United States of America, 8 Department of Forest Biological Sciences, University of the Philippines Los Banos
College, Laguna, Philippines, 9 Centre of Advanced Study in Marine Biology, Annamalai University, Parangipettai, India, 10 Faculty of Sciences and Bioengineering
Sciences, Vrije Universiteit Brussel, Brussels, Belgium, 11 Faculty of Liberal Art, Department of Regional Management, Tohoku-Gakuin University, Sendai, Japan,
12 Department of Biological Sciences and Jackson Estuarine Laboratory, University of New Hampshire, Durham, New Hampshire, United States of America, 13 Faculty of
Forestry, Nong Lam University, Ho Chi Minh City, Vietnam, 14 Centre for Marine and Coastal Studies, Universiti Sains Malaysia, Penang, Malaysia, 15 Aquaculture
Department, Southeast Asian Fisheries Development Center, Tigbauan, Iloilo, Philippines, 16 College of Agriculture, Central Luzon State University, Science City of Munoz,
Nueva Ecija, Philippines, 17 Center for Oceanological Research and Development, Indonesian Institute of Sciences, Jakarta, Indonesia, 18 College of Ocean, Shandong
University, Weihai, China, 19 Natural Sciences and Science Education Academic Group, National Institute of Education, Nanyang Technological University, Singapore,
Singapore
Abstract
Mangrove species are uniquely adapted to tropical and subtropical coasts, and although relatively low in number of species,mangrove forests provide at least US $1.6 billion each year in ecosystem services and support coastal livelihoods worldwide.Globally, mangrove areas are declining rapidly as they are cleared for coastal development and aquaculture and logged fortimber and fuel production. Little is known about the effects of mangrove area loss on individual mangrove species andlocal or regional populations. To address this gap, species-specific information on global distribution, population status, lifehistory traits, and major threats were compiled for each of the 70 known species of mangroves. Each species’ probability ofextinction was assessed under the Categories and Criteria of the IUCN Red List of Threatened Species. Eleven of the 70mangrove species (16%) are at elevated threat of extinction. Particular areas of geographical concern include the Atlanticand Pacific coasts of Central America, where as many as 40% of mangroves species present are threatened with extinction.Across the globe, mangrove species found primarily in the high intertidal and upstream estuarine zones, which often havespecific freshwater requirements and patchy distributions, are the most threatened because they are often the first clearedfor development of aquaculture and agriculture. The loss of mangrove species will have devastating economic andenvironmental consequences for coastal communities, especially in those areas with low mangrove diversity and highmangrove area or species loss. Several species at high risk of extinction may disappear well before the next decade ifexisting protective measures are not enforced.
Citation: Polidoro BA, Carpenter KE, Collins L, Duke NC, Ellison AM, et al. (2010) The Loss of Species: Mangrove Extinction Risk and Geographic Areas of GlobalConcern. PLoS ONE 5(4): e10095. doi:10.1371/journal.pone.0010095
Editor: Dennis Marinus Hansen, Stanford University, United States of America
Received October 7, 2009; Accepted March 16, 2010; Published April 8, 2010
Copyright: � 2010 Polidoro et al. This is an open-access article distributed under the terms of the Creative Commons Attribution License, which permitsunrestricted use, distribution, and reproduction in any medium, provided the original author and source are credited.
Funding: This research was generously supported by core funding from Tom Haas and the New Hampshire Charitable Foundation. The funders had no role instudy design, data collection and analysis, decision to publish, or preparation of the manuscript.
Competing Interests: The authors have declared that no competing interests exist.
* E-mail: [email protected]
Introduction
The importance of mangroves for humans and a variety of
coastal organisms has been well documented [1–7]. Mangrove
forests are comprised of unique plant species that form the critical
interface between terrestrial, estuarine, and near-shore marine
ecosystems in tropical and subtropical regions. They protect inland
human communities from damage caused by coastal erosion and
storms [8–11], provide critical habitat for a variety of terrestrial,
estuarine and marine species [5,12–14], and serve as both a source
and sink for nutrients and sediments for other inshore marine
habitats including seagrass beds and coral reefs [2,15]. Mangrove
species that form dense and often monospecific stands are
considered ‘‘foundation species’’ that control population and
ecosystem dynamics, including fluxes of energy and nutrients,
hydrology, food webs, and biodiversity [16]. Mangroves have been
widely reviewed [17] as supporting numerous ecosystem services
including flood protection, nutrient and organic matter processing,
PLoS ONE | www.plosone.org 1 April 2010 | Volume 5 | Issue 4 | e10095
sediment control, and fisheries. Mangrove forests are the economic
foundations of many tropical coastal regions [18] providing at least
US$1.6 billion per year in ‘‘ecosystem services’’ worldwide [7]. It is
estimated that almost 80% of global fish catches are directly or
indirectly dependant on mangroves [1,19]. Mangroves sequester
up to 25.5 million tonnes of carbon per year [20], and provide
more than 10% of essential organic carbon to the global oceans
[21]. Although the economic value of mangroves can be difficult to
quantify, the relatively small number of mangrove species
worldwide collectively provide a wealth of services and goods
while occupying only 0.12% of the world’s total land area [22].
With almost half (44%) of the world’s population living within
150 km of a coastline [23], heavily populated coastal zones have
spurred the widespread clearing of mangroves for coastal
development, aquaculture, or resource use. At least 40% of the
animal species that are restricted to mangrove habitat and have
previously been assessed under IUCN Categories and Criteria are
at elevated risk of extinction due to extensive habitat loss [12]. It is
estimated that 26% of mangrove forests worldwide are degraded
due to over-exploitation for fuelwood and timber production [24].
Similarly, clearing of mangroves for shrimp culture contributes
,38% of global mangrove loss, with other aquaculture accounting
for another 14% [1]. In India alone, over 40% of mangrove area
on the western coast has been converted to agriculture and urban
development [25]. Globally, between 20% and 35% of mangrove
area has been lost since approximately 1980 [24,26,27], and
mangrove areas are disappearing at the rate of approximately 1%
per year [26,27], with other estimates as high as 2–8% per year
[28]. These rates may be as high as or higher than rates of losses of
upland tropical wet forests [24], and current exploitation rates are
expected to continue unless mangrove forests are protected as a
valuable resource [29].
Given their accelerating rate of loss, mangrove forests may at
least functionally disappear in as little as 100 years [2]. The loss of
individual mangrove species is also of great concern, especially as
even pristine mangrove areas are species-poor compared with
other tropical plant ecosystems [29]. However, there is very little
known about the effects of either widespread or localized
mangrove area loss on individual mangrove species or populations.
Additionally, the identification and implementation of conserva-
tion priorities for mangroves has largely been conducted in the
absence of comprehensive species-specific information, as species-
specific data have not been collated or synthesized. Species
information including the presence of threatened species is
important for refining conservation priorities, such as the
designation of critical habitat, no-take zones, or marine protected
areas, or to inform policies that regulate resource extraction or
coastal development. For the first time, systematic species-specific
data have been collated and used to determine the probability of
extinction for all 70 known species of mangroves under the
Categories and Criteria of the International Union for the
Conservation of Nature (IUCN) Red List of Threatened Species.
Methods
The IUCN Red List Categories and Criteria were applied to 70
species of mangroves, representing 17 families. Hybrids were not
assessed as the IUCN Red List Guidelines generally exclude all
plant hybrids for assessment unless they are apomicts. Species
nomenclature primarily followed Tomlinson [30], and family
nomenclature primarily followed Stevens [31], with the exception
of Pteridaceae.
The definition of a mangrove species is based on a number of
anatomical and physiological adaptations to saline, hypoxic soils.
These include viviparous or cryptoviviparous seeds adapted to
hydrochory; pneumatophores or aerial roots that allow oxygen-
ation of roots in hypoxic soils; and salt exclusion or salt excretion
to cope with high salt concentrations in the peat and pore water in
which mangroves grow. Those species that are exclusively
restricted to tropical intertidal habitats have been defined as ‘‘true
mangrove’’ species, while those not exclusive to this habitat have
been termed ‘‘mangrove associates’’ [32]. Tomlinson [30] further
subdivided these categories into major mangrove components
(true, strict, or specialized mangrove species), minor components
(non-specialized mangrove species), and mangrove associates (non-
exclusive species that are generally never immersed by high tides).
Duke [33] more specifically defined a true mangrove as a tree,
shrub, palm, or ground fern generally exceeding 0.5 m in height
and which normally grows above mean sea level in the intertidal
zone of tropical coastal or estuarine environments. For the IUCN
Red List assessments, we defined a mangrove species based on
Tomlinson’s list of major and minor mangroves, supplemented by
a few additional species supported by the expanded definition
provided by Duke [33]. It is recognized that the definition used in
this study may not strictly apply to all geographic areas. For
example, the fern genus Acrostichum, which is included in this study,
is considered a mangrove associate in some parts of the world [34].
Data collection and assessments for mangrove species proba-
bility of extinction were conducted during two IUCN Red List
Assessment workshops: one in 2007 in Dominica and the second in
2008 in the Philippines. These two mangrove species assessment
workshops brought together 25 of the world’s leading mangrove
experts to share and synthesize species-specific data, and to
collectively apply the IUCN Red List Categories and Criteria [35].
The IUCN Red List Categories and Criteria are the most widely
accepted system for classifying extinction risk at the species level
[36–39]. During the Red List assessment workshops, species were
evaluated one at a time by the group of experts present, with
outside consultation and follow-up conducted when additional
information was needed but not available at the workshop.
Information on taxonomy, distribution, population trends, ecolo-
gy, life history, past and existing threats, and conservation actions
for each species was recorded, quantified and reviewed for
accuracy. Quantitative species information was then used to
determine if a species met the threshold for a threatened category
under at least one IUCN Red List Criterion. This IUCN Red List
process consolidates the most current and highest quality data
available, and ensures peer-reviewed scientific consensus on the
probability of extinction for each species [40–42]. All species data
and results of Red List assessments are freely and publicly
available on the IUCN Red List of Threatened Species [43].
The IUCN Red List Categories are comprised of eight different
levels of extinction risk: Extinct (EX), Extinct in the Wild (EW),
Critically Endangered (CR), Endangered (EN), Vulnerable (VU),
Near Threatened (NT), Least Concern (LC) and Data Deficient
(DD). A species qualifies for one of the three threatened categories
(CR, EN, or VU) by meeting the threshold for that category in one
of the five different available criteria (A–E). These different criteria
form the real strength of the IUCN Red List as they are based on
extinction risk theory [44] and provide a standardized method-
ology that is applied consistently to any species from any
taxonomic group [40–42,45].
Criterion A measures extinction risk based on exceeding a
threshold of population decline (30% for Vulnerable, 50% for
Endangered, and 80% for Critically Endangered) over a time-
frame of three generation lengths, a measure of reproductive
turnover rate, in the recent past. To determine if a species could be
assessed under Criterion A, percent decline was calculated for
Mangrove Extinction Risk
PLoS ONE | www.plosone.org 2 April 2010 | Volume 5 | Issue 4 | e10095
each species based on country-level estimates of mangrove area
loss between 1980 and 2005 [27] within the species range.
Mangrove species generation length, defined as the median age of
a reproducing individual based on the estimated age at earliest
reproduction and the estimated age at oldest reproduction [35],
was conservatively estimated to range between 10 and 40 years
based on recent aging techniques developed for Rhizophora,
Avicennia and Sonneratia spp. [46–48]. As few or no data are
available to estimate generation length for all of the mangrove
species in this study, the lowest value (10 years) was used
uniformly, based on an assumption that mangrove species
reproduce throughout their lifetime and can live to an age of at
least 15 to 20 years. The two Acrostichum species may be the
exception, as stands can live to at least 15 to 20 years, but not likely
individual plants. However, this has no bearing on the results for
these two species, as declines over the minimum time period
required under Criterion A (10 years) do not meet the threshold
for a threatened category.
Data based on mangrove area declines from 1980 to 2005 [27]
fall within the maximum time frame of three generation lengths
estimated for mangroves (30 years) allowed under Criterion A.
However, the relationship between mangrove area loss and species
range and population reduction is rarely linear, as mangrove area
loss can occur in areas of lower or higher population density, and
therefore can represent a slower or faster decline of the actual
population size [49]. In some cases, area loss can be preceded by
impoverishment, due to general decrease in the quality of the
forest, or due to specific harvesting of highly prized species like
Rhizophora spp, which can lead to an underestimation of the rate of
disappearance of certain species. Similarly, as the margin-to-area
ratio in mangroves is high, not only can deterioration occur
rapidly, but changes can occur before areal decreases are
detectable [50], including species declines or changes in
community composition. By contrast, some species are pioneering
or are able to re-colonize rapidly after disturbance. For this reason,
expert knowledge and data on the life history traits of each
mangrove species, including growth rate and propagation rate,
generalized abundance, and where possible, data on pre-1980
declines or continued severity of threats within a restricted
geographic distribution were used in combination with mangrove
area decline within a species range to estimate and quantify a
species’ global population decline under Criterion A.
Criterion B measures extinction risk based on a small
geographic range size (extent of occurrence ,20,000 km2 or area
of occupancy ,2,000 km2 to meet the lowest threshold for
Vulnerable) combined with continued decline and habitat
fragmentation. The majority of species assessed under Criterion
B for example, had an area of occupancy estimated to be less than
2,000 km2 due to very specific habitat requirements, such as
freshwater-dominated river margins or patchy distributions.
However, as many mangrove areas are often patchily distributed
over considerable distances, estimations of area of occupancy or
extent of occurrence for mangrove species were conservative.
Criterion C is applied to species with small population sizes
estimated to be less than 10,000 mature individuals, with
continued decline. Although not used to assess mangrove species
in this study, Criterion D is applied to species with less than 1,000
mature individuals or those with an area of occupancy of less than
20 km2, and Criterion E is applied to species with extensive
population information that allows for population declines to be
appropriately modeled over time. A category of Near Threatened
is assigned to species that come close to but do not fully meet the
all the thresholds or conditions required for a threatened category
under Criterion A, B, C, D or E.
Results and Discussion
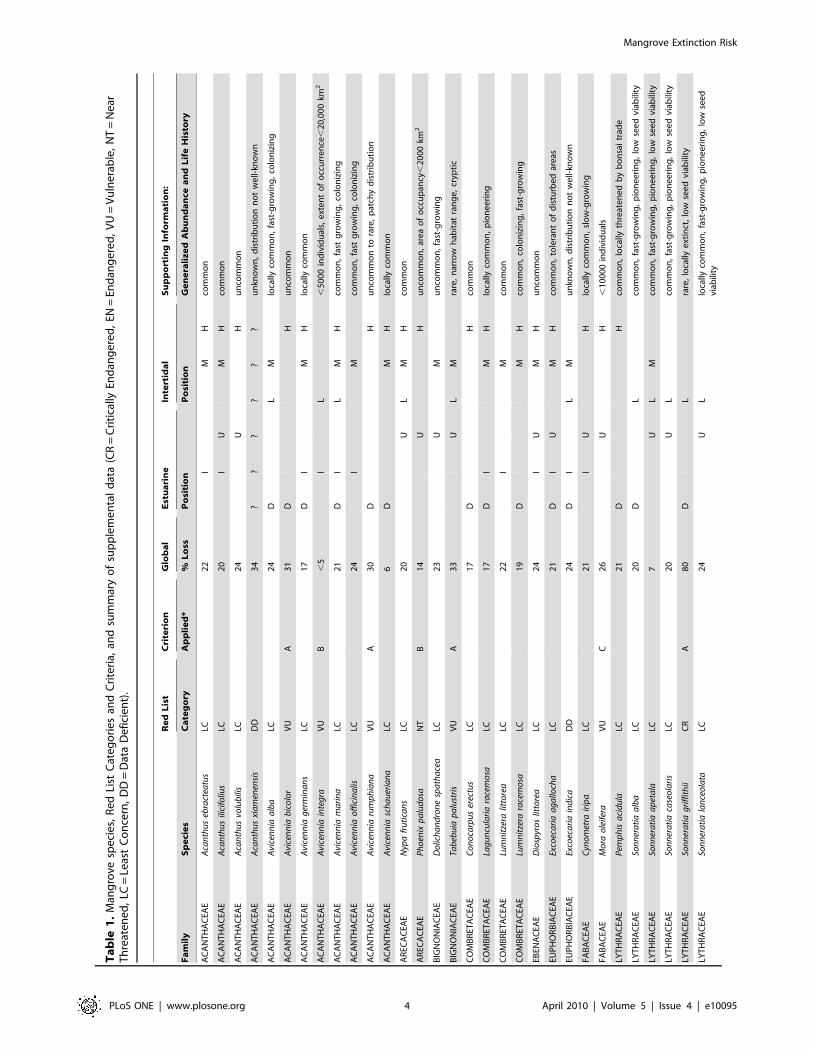
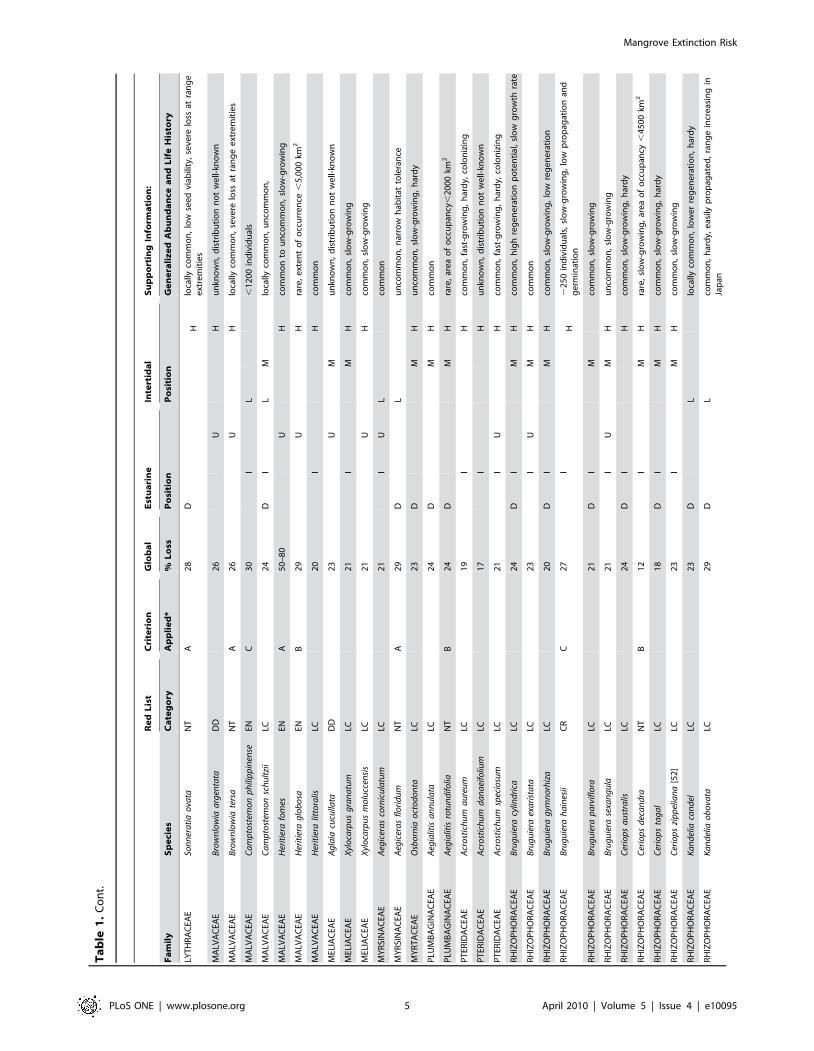
Of the 70 species of true mangrove species, 11 (16%) qualified
for one of the three Red List categories of threat: Critically
Endangered, Endangered, or Vulnerable (Table 1). Heritiera is the
genus with the most threatened mangrove species with 2 of the 3
species (66%) in threatened categories. Seven species (10%) only
partially met the thresholds for a threatened category and were
therefore listed as Near Threatened. Four species (6%) were listed
as Data Deficient primarily due to critical gaps in knowledge of the
extent of the species distribution e.g., Acanthus xiamenensis from the
extensively developed and heavily polluted estuaries of the Jiulong
River in Fujian Province, China [53]. A listing of Data Deficient
does not preclude future listing of the species when more data are
gathered. Forty-eight species (68%) were assessed as Least
Concern. Even though mangrove area continues to be lost where
the majority of these ‘‘Least Concern’’ species are found [27], the
global population decline over the past 30 years for each of these
species was estimated to be below the threshold required for
assignment to a threatened category. Some of the ‘‘Least
Concern’’ species also are considered to be common, fast-growing,
early-successional species.
Of special concern are the two species that are listed as
Critically Endangered, the highest probability of extinction
measured by the IUCN Red List. The rare Sonneratia griffithii is
distributed in parts of India and southeast Asia, where a combined
80% loss of all mangrove area has occurred within its patchy range
over the past 60 years, with significant losses in Malaysia [54],
primarily due to the clearing of mangrove areas for rice farming,
shrimp aquaculture, and coastal development [55]. This species is
already reported to be locally extinct in a number of areas within
its range, and less than 500 mature individuals are known from
India. Bruguiera hainesii is an even rarer species and is only known
from a few fragmented locations in Indonesia, Malaysia, Thailand,
Myanmar [56], Singapore and Papua New Guinea. It has very low
rates of propagation and low rates of germination. It is estimated
that there are less than 250 mature individuals remaining. For
these species, urgent protection is needed for remaining individuals
as well as research to determine minimum viable population size.
All but two species that were listed in threatened categories
(Critically Endangered, Endangered or Vulnerable) or as Near
Threatened are rare or uncommon, and/or have small population
sizes. The two Near Threatened species, Sonneratia ovata and
Brownlowia tersa, are common throughout their relatively wide
range, but have experienced severe loss at their range margins. It is
well established that rare species (species with very small
population or range size, low abundance, and/or associated
specialist pattern of resource use [57]), have a higher intrinsic risk
of extinction [58,59]. As the IUCN Red List Criteria are based on
extinction risk, the quantitative thresholds for each threatened
category are designed to capture these rare or uncommon species
with small ranges and/or low population sizes.
Being uncommon, however, is not always a precursor to being
threatened. At least five of the species listed as Least Concern are
considered uncommon. General abundance was only one factor
that was used to interpret global population status for a species in
combination with overall area loss in a species range and other life
history traits. For example, a species with a low risk of extinction
can be uncommon, but can grow over a very large range with little
or low mangrove area loss. Alternately, it can be uncommon and
exist in a smaller range or degraded area, but be fast-growing,
hardy and easily propagated, (e.g., more of a habitat generalist).
However, mangrove species abundance generally is not the same
across the entire range of a given species, as mangrove species tend
Mangrove Extinction Risk
PLoS ONE | www.plosone.org 3 April 2010 | Volume 5 | Issue 4 | e10095
Ta
ble
1.
Man
gro
vesp
eci
es,
Re
dLi
stC
ate
go
rie
san
dC
rite
ria,
and
sum
mar
yo
fsu
pp
lem
en
tal
dat
a(C
R=
Cri
tica
llyEn
dan
ge
red
,EN
=En
dan
ge
red
,V
U=
Vu
lne
rab
le,
NT
=N
ear
Th
reat
en
ed
,LC
=Le
ast
Co
nce
rn,
DD
=D
ata
De
fici
en
t).
Re
dL
ist
Cri
teri
on
Glo
ba
lE
stu
ari
ne
Inte
rtid
al
Su
pp
ort
ing
Info
rma
tio
n:
Fa
mil
yS
pe
cie
sC
ate
go
ryA
pp
lie
d*
%L
oss
Po
siti
on
Po
siti
on
Ge
ne
rali
ze
dA
bu
nd
an
cea
nd
Lif
eH
isto
ry
AC
AN
TH
AC
EAE
Aca
nth
us
ebra
ctea
tus
LC2
2I
MH
com
mo
n
AC
AN
TH
AC
EAE
Aca
nth
us
ilici
foliu
sLC
20
IU
MH
com
mo
n
AC
AN
TH
AC
EAE
Aca
nth
us
volu
bili
sLC
24
UH
un
com
mo
n
AC
AN
TH
AC
EAE
Aca
nth
us
xia
men
ensi
sD
D3
4?
??
??
?u
nkn
ow
n,
dis
trib
uti
on
no
tw
ell-
kno
wn
AC
AN
TH
AC
EAE
Avi
cen
nia
alb
aLC
24
DL
Mlo
cally
com
mo
n,
fast
-gro
win
g,
colo
niz
ing
AC
AN
TH
AC
EAE
Avi
cen
nia
bic
olo
rV
UA
31
DH
un
com
mo
n
AC
AN
TH
AC
EAE
Avi
cen
nia
ger
min
an
sLC
17
DI
MH
loca
llyco
mm
on
AC
AN
TH
AC
EAE
Avi
cen
nia
inte
gra
VU
B,
5I
L,
50
00
ind
ivid
ual
s,e
xte
nt
of
occ
urr
en
ce,
20
,00
0km
2
AC
AN
TH
AC
EAE
Avi
cen
nia
ma
rin
aLC
21
DI
LM
Hco
mm
on
,fa
stg
row
ing
,co
lon
izin
g
AC
AN
TH
AC
EAE
Avi
cen
nia
off
icin
alis
LC2
4I
Mco
mm
on
,fa
stg
row
ing
,co
lon
izin
g
AC
AN
TH
AC
EAE
Avi
cen
nia
rum
ph
ian
aV
UA
30
DH
un
com
mo
nto
rare
,p
atch
yd
istr
ibu
tio
n
AC
AN
TH
AC
EAE
Avi
cen
nia
sch
au
eria
na
LC6
DM
Hlo
cally
com
mo
n
AR
ECA
CEA
EN
ypa
fru
tica
ns
LC2
0U
LM
Hco
mm
on
AR
ECA
CEA
EP
ho
enix
pa
lud
osa
NT
B1
4U
Hu
nco
mm
on
,ar
ea
of
occ
up
ancy
,2
00
0km
2
BIG
NO
NIA
CEA
ED
olic
ha
nd
ron
esp
ath
ace
aLC
23
UM
un
com
mo
n,
fast
-gro
win
g
BIG
NO
NIA
CEA
ETa
beb
uia
pa
lust
ris
VU
A3
3U
LM
rare
,n
arro
wh
abit
atra
ng
e,
cryp
tic
CO
MB
RET
AC
EAE
Co
no
carp
us
erec
tus
LC1
7D
Hco
mm
on
CO
MB
RET
AC
EAE
Lag
un
cula
ria
race
mo
saLC
17
DI
MH
loca
llyco
mm
on
,p
ion
ee
rin
g
CO
MB
RET
AC
EAE
Lum
nit
zera
litto
rea
LC2
2I
Mco
mm
on
CO
MB
RET
AC
EAE
Lum
nit
zera
race
mo
saLC
19
DM
Hco
mm
on
,co
lon
izin
g,
fast
-gro
win
g
EBEN
AC
EAE
Dio
spyr
os
litto
rea
LC2
4I
UM
Hu
nco
mm
on
EUP
HO
RB
IAC
EAE
Exco
eca
ria
ag
allo
cha
LC2
1D
IU
MH
com
mo
n,
tole
ran
to
fd
istu
rbe
dar
eas
EUP
HO
RB
IAC
EAE
Exco
eca
ria
ind
ica
DD
24
DI
LM
un
kno
wn
,d
istr
ibu
tio
nn
ot
we
ll-kn
ow
n
FAB
AC
EAE
Cyn
om
etra
irip
aLC
21
IU
Hlo
cally
com
mo
n,
slo
w-g
row
ing
FAB
AC
EAE
Mo
rao
leif
era
VU
C2
6U
H,
10
00
0in
div
idu
als
LYT
HR
AC
EAE
Pem
ph
isa
cid
ula
LC2
1D
Hco
mm
on
,lo
cally
thre
ate
ne
db
yb
on
sai
trad
e
LYT
HR
AC
EAE
Son
ner
ati
aa
lba
LC2
0D
Lco
mm
on
,fa
st-g
row
ing
,p
ion
ee
rin
g,
low
see
dvi
abili
ty
LYT
HR
AC
EAE
Son
ner
ati
aa
pet
ala
LC7
UL
Mco
mm
on
,fa
st-g
row
ing
,p
ion
ee
rin
g,
low
see
dvi
abili
ty
LYT
HR
AC
EAE
Son
ner
ati
aca
seo
lari
sLC
20
UL
com
mo
n,
fast
-gro
win
g,
pio
ne
eri
ng
,lo
wse
ed
viab
ility
LYT
HR
AC
EAE
Son
ner
ati
ag
riff
ith
iiC
RA
80
DL
rare
,lo
cally
ext
inct
,lo
wse
ed
viab
ility
LYT
HR
AC
EAE
Son
ner
ati
ala
nce
ola
taLC
24
UL
loca
llyco
mm
on
,fa
st-g
row
ing
,p
ion
ee
rin
g,
low
see
dvi
abili
ty
Mangrove Extinction Risk
PLoS ONE | www.plosone.org 4 April 2010 | Volume 5 | Issue 4 | e10095
Re
dL
ist
Cri
teri
on
Glo
ba
lE
stu
ari
ne
Inte
rtid
al
Su
pp
ort
ing
Info
rma
tio
n:
Fa
mil
yS
pe
cie
sC
ate
go
ryA
pp
lie
d*
%L
oss
Po
siti
on
Po
siti
on
Ge
ne
rali
ze
dA
bu
nd
an
cea
nd
Lif
eH
isto
ry
LYT
HR
AC
EAE
Son
ner
ati
ao
vata
NT
A2
8D
Hlo
cally
com
mo
n,
low
see
dvi
abili
ty,
seve
relo
ssat
ran
ge
ext
rem
itie
s
MA
LVA
CEA
EB
row
nlo
wia
arg
enta
taD
D2
6U
Hu
nkn
ow
n,
dis
trib
uti
on
no
tw
ell-
kno
wn
MA
LVA
CEA
EB
row
nlo
wia
ters
aN
TA
26
UH
loca
llyco
mm
on
,se
vere
loss
atra
ng
ee
xtre
mit
ies
MA
LVA
CEA
EC
am
pto
stem
on
ph
ilip
pin
ense
ENC
30
IL
,1
20
0in
div
idu
als
MA
LVA
CEA
EC
am
pto
stem
on
sch
ult
zii
LC2
4D
IL
Mlo
cally
com
mo
n,
un
com
mo
n,
MA
LVA
CEA
EH
erit
iera
fom
esEN
A5
0–
80
UH
com
mo
nto
un
com
mo
n,
slo
w-g
row
ing
MA
LVA
CEA
EH
erit
iera
glo
bo
saEN
B2
9U
Hra
re,
ext
en
to
fo
ccu
rre
nce
,5
,00
0km
2
MA
LVA
CEA
EH
erit
iera
litto
ralis
LC2
0I
Hco
mm
on
MEL
IAC
EAE
Ag
laia
cucu
llata
DD
23
UM
un
kno
wn
,d
istr
ibu
tio
nn
ot
we
ll-kn
ow
n
MEL
IAC
EAE
Xyl
oca
rpu
sg
ran
atu
mLC
21
IM
Hco
mm
on
,sl
ow
-gro
win
g
MEL
IAC
EAE
Xyl
oca
rpu
sm
olu
ccen
sis
LC2
1U
Hco
mm
on
,sl
ow
-gro
win
g
MY
RSI
NA
CEA
EA
egic
era
sco
rnic
ula
tum
LC2
1I
UL
com
mo
n
MY
RSI
NA
CEA
EA
egic
era
sfl
ori
du
mN
TA
29
DL
un
com
mo
n,
nar
row
hab
itat
tole
ran
ce
MY
RT
AC
EAE
Osb
orn
iao
cto
do
nta
LC2
3D
MH
un
com
mo
n,
slo
w-g
row
ing
,h
ard
y
PLU
MB
AG
INA
CEA
EA
egia
litis
an
nu
lata
LC2
4D
MH
com
mo
n
PLU
MB
AG
INA
CEA
EA
egia
litis
rotu
nd
ifo
liaN
TB
24
DM
Hra
re,
are
ao
fo
ccu
pan
cy,
20
00
km2
PT
ERID
AC
EAE
Acr
ost
ich
um
au
reu
mLC
19
IH
com
mo
n,
fast
-gro
win
g,
har
dy,
colo
niz
ing
PT
ERID
AC
EAE
Acr
ost
ich
um
da
na
eifo
lium
LC1
7I
Hu
nkn
ow
n,
dis
trib
uti
on
no
tw
ell-
kno
wn
PT
ERID
AC
EAE
Acr
ost
ich
um
spec
iosu
mLC
21
IU
Hco
mm
on
,fa
st-g
row
ing
,h
ard
y,co
lon
izin
g
RH
IZO
PH
OR
AC
EAE
Bru
gu
iera
cylin
dri
caLC
24
DI
MH
com
mo
n,
hig
hre
ge
ne
rati
on
po
ten
tial
,sl
ow
gro
wth
rate
RH
IZO
PH
OR
AC
EAE
Bru
gu
iera
exa
rist
ata
LC2
3I
UM
Hco
mm
on
RH
IZO
PH
OR
AC
EAE
Bru
gu
iera
gym
no
rhiz
aLC
20
DI
MH
com
mo
n,
slo
w-g
row
ing
,lo
wre
ge
ne
rati
on
RH
IZO
PH
OR
AC
EAE
Bru
gu
iera
ha
ines
iiC
RC
27
IH
,2
50
ind
ivid
ual
s,sl
ow
-gro
win
g,
low
pro
pag
atio
nan
dg
erm
inat
ion
RH
IZO
PH
OR
AC
EAE
Bru
gu
iera
pa
rvif
lora
LC2
1D
IM
com
mo
n,
slo
w-g
row
ing
RH
IZO
PH
OR
AC
EAE
Bru
gu
iera
sexa
ng
ula
LC2
1I
UM
Hu
nco
mm
on
,sl
ow
-gro
win
g
RH
IZO
PH
OR
AC
EAE
Cer
iop
sa
ust
ralis
LC2
4D
IH
com
mo
n,
slo
w-g
row
ing
,h
ard
y
RH
IZO
PH
OR
AC
EAE
Cer
iop
sd
eca
nd
raN
TB
12
IM
Hra
re,
slo
w-g
row
ing
,ar
ea
of
occ
up
ancy
,4
50
0km
2
RH
IZO
PH
OR
AC
EAE
Cer
iop
sta
ga
lLC
18
DI
MH
com
mo
n,
slo
w-g
row
ing
,h
ard
y
RH
IZO
PH
OR
AC
EAE
Cer
iop
szi
pp
elia
na
[52
]LC
23
IM
Hco
mm
on
,sl
ow
-gro
win
g
RH
IZO
PH
OR
AC
EAE
Ka
nd
elia
can
del
LC2
3D
Llo
cally
com
mo
n,
low
er
reg
en
era
tio
n,
har
dy
RH
IZO
PH
OR
AC
EAE
Ka
nd
elia
ob
ova
taLC
29
DL
com
mo
n,
har
dy,
eas
ilyp
rop
agat
ed
,ra
ng
ein
cre
asin
gin
Jap
an
Ta
ble
1.
Co
nt.
Mangrove Extinction Risk
PLoS ONE | www.plosone.org 5 April 2010 | Volume 5 | Issue 4 | e10095

to be less common at their range margins and can be locally
abundant where salinity or other environmental factors are closer
to each species’ optimum [51].
Many mangrove forests exhibit distinct zones of species that are
controlled by the elevation of the substrate relative to mean sea
level and the associated variation in frequency of elevation, salinity
and wave action [51]. Such zonation is not always apparent [60]
and may be disrupted by anthropogenic disturbance. Seven of 16
(44%) mangrove species found primarily in the upstream estuarine
or high intertidal region are in threatened or Near Threatened
categories. These species have very specific freshwater-dominated
habitat requirements, are often patchily distributed, and are often
occupy areas that are cleared first for the construction of shrimp or
fish ponds, or for agriculture. For example, populations of the
Endangered Heritiera fomes and Heritiera globosa in Southeast Asia
have been severely reduced due to coastal development, the
creation of ponds, reduction of freshwater from the creation of
dams, and expansion of palm and timber plantations. Three of 10
(30%) of mangrove species found primarily in the downstream
estuarine and low intertidal region are in threatened or Near
Threatened categories. Many of these fringe species, such as the
Near Threatened Aegiceras floridum, have high salinity requirements,
and are only found along beaches and in rocky or sandy substrate
[61]. In these mangrove areas, populations are experiencing severe
declines due to coastal development and the conversion of tidal
wetlands to fish ponds or other land uses.
The primary threats to all mangrove species are habitat
destruction and removal of mangrove areas for conversion to
aquaculture, agriculture, urban and coastal development, and
overexploitation. Of these, clear-felling, aquaculture and over-
exploitation of fisheries in mangroves are expected to be the
greatest threats to mangrove species over the next 10–15 years
[29]. Climate change is also considered a threat to all mangrove
species, particularly at the edges of a species range where sea
temperature and other environmental changes may be greatest.
With a rise in sea level, the habitat requirements of each species
will be disrupted, and species zones will suffer mortality in their
present tidal zones and attempt to re-establish at higher elevations
in areas that were previously landward zones [62]. Mangrove
species with a habitat on the landward margin are particularly
vulnerable to sea-level rise if, owing to coastal development, their
movement inland is blocked. Species that occur at the landward
edge, or upstream in tidal estuaries include Brownlowia tersa,
Bruguiera sexangula, Nypa fruticans, Phoenix paludosa, Lumnitzera
racemosa, Lumnitzera littorea, Sonneratia caseolaris, Sonneratia lanceolata,
and Xylocarpus granatum. Species that are easily dispersed, and grow
or reproduce rapidly, such as Rhizophora spp may cope better than
those which are slower growing and slower to reproduce such as
Bruguiera spp, Ceriops spp, or Xylocarpus spp.
Geographic Areas of ConcernRange declines for all mangrove species from habitat loss and
localized threats are occurring in all tropical coastal regions of the
world [27]; however, some regions show greater losses than others.
Unlike many other forests, mangrove forests consist of relatively
few species, with thirty to forty species in the most diverse sites and
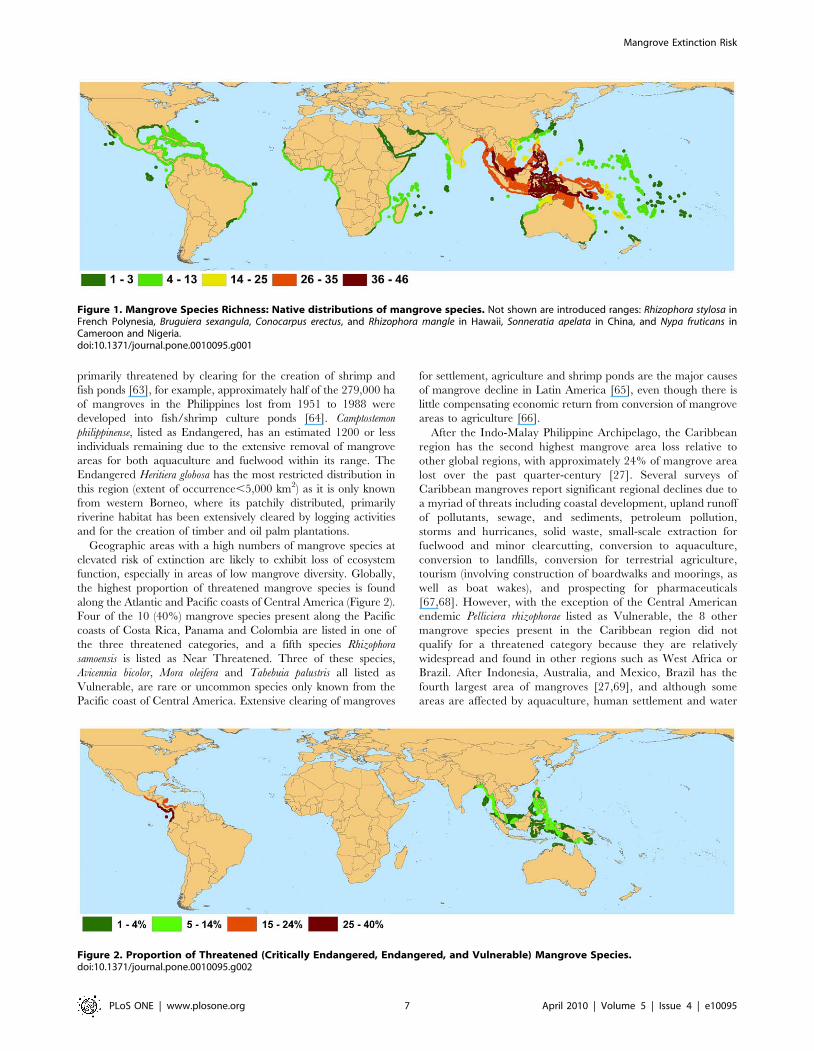
only one or a few in many places [51]. Globally, mangrove
biodiversity is highest in the Indo-Malay Philippine Archipelago
(Figure 1), with between 36 and 46 of the 70 known mangrove
species occurring in this region. Although less than 15% of species
present in this region are in threatened categories (Figure 2), the
Indo-Malay Philippine Archipelago has one of the highest rates of
mangrove area loss globally, with an estimated 30% reduction in
mangrove area since 1980 [27]. Mangroves in this region are
Re
dL
ist
Cri
teri
on
Glo
ba
lE
stu
ari
ne
Inte
rtid
al
Su
pp
ort
ing
Info
rma
tio
n:
Fa
mil
yS
pe
cie
sC
ate
go
ryA
pp
lie
d*
%L
oss
Po
siti
on
Po
siti
on
Ge
ne
rali
ze
dA
bu
nd
an
cea
nd
Lif
eH
isto
ry
RH
IZO
PH
OR
AC
EAE
Rh
izo
ph
ora
ap
icu
lata
LC2
0I
Mve
ryco
mm
on
,h
ard
y,fa
st-g
row
ing
RH
IZO
PH
OR
AC
EAE
Rh
izo
ph
ora
ma
ng
leLC
17
DI
LM
com
mo
n,
har
dy,
fast
-gro
win
g
RH
IZO
PH
OR
AC
EAE
Rh
izo
ph
ora
mu
cro
na
taLC
20
IU
LM
com
mo
n,
har
dy,
fast
-gro
win
g
RH
IZO
PH
OR
AC
EAE
Rh
izo
ph
ora
race
mo
saLC
15
DI
Mlo
cally
com
mo
n,
can
form
larg
est
and
sw
ith
pat
chd
istr
ibu
tio
n
RH
IZO
PH
OR
AC
EAE
Rh
izo
ph
ora
sam
oen
sis
NT
A2
9D
IL
Mco
mm
on
tora
re,
loca
llyth
reat
en
ed
by
inte
nsi
veh
arve
stin
g
RH
IZO
PH
OR
AC
EAE
Rh
izo
ph
ora
styl
osa
LC2
0D
IL
Mco
mm
on
,h
ard
y,fa
st-g
row
ing
RU
BIA
CEA
ESc
yph
iph
ora
hyd
rop
hyl
ace
aLC
20
IH
un
com
mo
n
TET
RA
MER
IST
AC
EAE
Pel
licie
rarh
izo
ph
ora
eV
UB
27
IU
MH
relic
tan
dra
re,
are
ao
fo
ccu
pan
cy,
20
00
km2
Estu
arin
e(D
=d
ow
nst
ream
,I=
inte
rme
dia
te,
U=
up
stre
am)
and
inte
rtid
al(L
=lo
w,
M=
me
diu
m,
H=
hig
h)
po
siti
on
sar
em
od
ifie
dfr
om
[51
].*s
ee
mai
nte
xtfo
rcr
ite
rio
nd
efi
nit
ion
s.d
oi:1
0.1
37
1/j
ou
rnal
.po
ne
.00
10
09
5.t
00
1
Ta
ble
1.
Co
nt.
Mangrove Extinction Risk
PLoS ONE | www.plosone.org 6 April 2010 | Volume 5 | Issue 4 | e10095
primarily threatened by clearing for the creation of shrimp and
fish ponds [63], for example, approximately half of the 279,000 ha
of mangroves in the Philippines lost from 1951 to 1988 were
developed into fish/shrimp culture ponds [64]. Camptostemon
philippinense, listed as Endangered, has an estimated 1200 or less
individuals remaining due to the extensive removal of mangrove
areas for both aquaculture and fuelwood within its range. The
Endangered Heritiera globosa has the most restricted distribution in
this region (extent of occurrence,5,000 km2) as it is only known
from western Borneo, where its patchily distributed, primarily
riverine habitat has been extensively cleared by logging activities
and for the creation of timber and oil palm plantations.
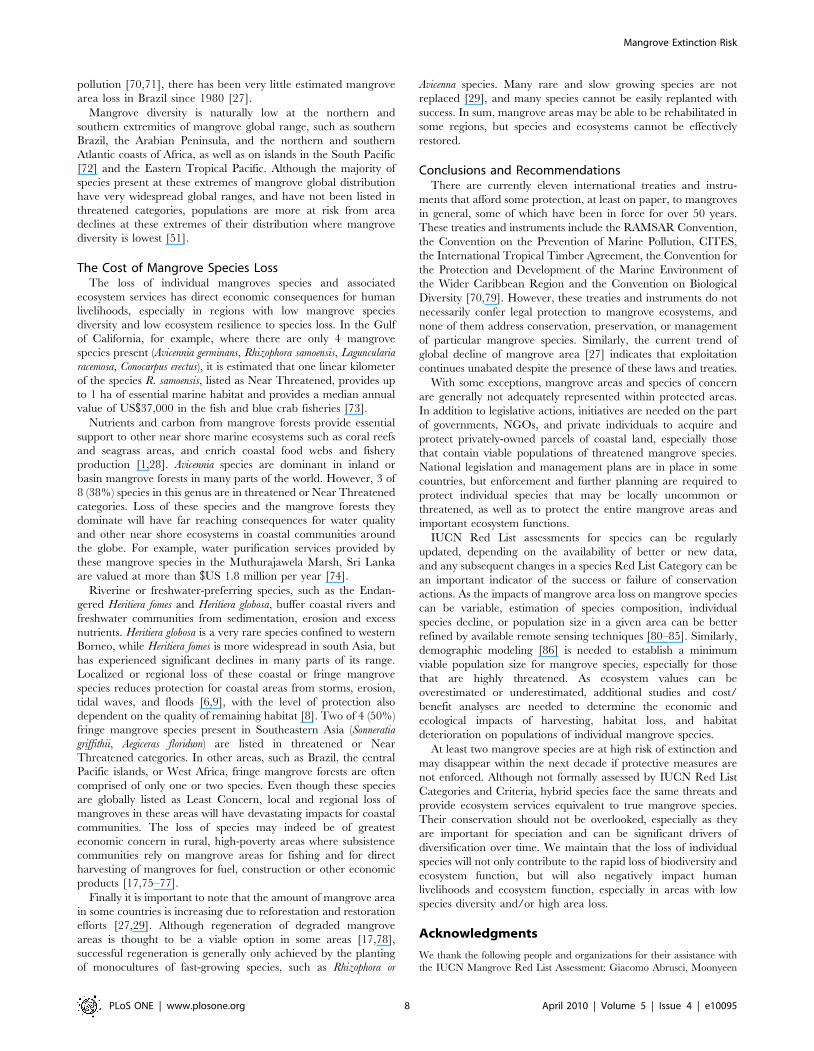
Geographic areas with a high numbers of mangrove species at
elevated risk of extinction are likely to exhibit loss of ecosystem
function, especially in areas of low mangrove diversity. Globally,
the highest proportion of threatened mangrove species is found
along the Atlantic and Pacific coasts of Central America (Figure 2).
Four of the 10 (40%) mangrove species present along the Pacific
coasts of Costa Rica, Panama and Colombia are listed in one of
the three threatened categories, and a fifth species Rhizophora
samoensis is listed as Near Threatened. Three of these species,
Avicennia bicolor, Mora oleifera and Tabebuia palustris all listed as
Vulnerable, are rare or uncommon species only known from the
Pacific coast of Central America. Extensive clearing of mangroves
for settlement, agriculture and shrimp ponds are the major causes
of mangrove decline in Latin America [65], even though there is
little compensating economic return from conversion of mangrove
areas to agriculture [66].
After the Indo-Malay Philippine Archipelago, the Caribbean
region has the second highest mangrove area loss relative to
other global regions, with approximately 24% of mangrove area
lost over the past quarter-century [27]. Several surveys of
Caribbean mangroves report significant regional declines due to
a myriad of threats including coastal development, upland runoff
of pollutants, sewage, and sediments, petroleum pollution,
storms and hurricanes, solid waste, small-scale extraction for
fuelwood and minor clearcutting, conversion to aquaculture,
conversion to landfills, conversion for terrestrial agriculture,
tourism (involving construction of boardwalks and moorings, as
well as boat wakes), and prospecting for pharmaceuticals
[67,68]. However, with the exception of the Central American
endemic Pelliciera rhizophorae listed as Vulnerable, the 8 other
mangrove species present in the Caribbean region did not
qualify for a threatened category because they are relatively
widespread and found in other regions such as West Africa or
Brazil. After Indonesia, Australia, and Mexico, Brazil has the
fourth largest area of mangroves [27,69], and although some
areas are affected by aquaculture, human settlement and water
Figure 2. Proportion of Threatened (Critically Endangered, Endangered, and Vulnerable) Mangrove Species.doi:10.1371/journal.pone.0010095.g002
Figure 1. Mangrove Species Richness: Native distributions of mangrove species. Not shown are introduced ranges: Rhizophora stylosa inFrench Polynesia, Bruguiera sexangula, Conocarpus erectus, and Rhizophora mangle in Hawaii, Sonneratia apelata in China, and Nypa fruticans inCameroon and Nigeria.doi:10.1371/journal.pone.0010095.g001
Mangrove Extinction Risk
PLoS ONE | www.plosone.org 7 April 2010 | Volume 5 | Issue 4 | e10095
pollution [70,71], there has been very little estimated mangrove
area loss in Brazil since 1980 [27].
Mangrove diversity is naturally low at the northern and
southern extremities of mangrove global range, such as southern
Brazil, the Arabian Peninsula, and the northern and southern
Atlantic coasts of Africa, as well as on islands in the South Pacific
[72] and the Eastern Tropical Pacific. Although the majority of
species present at these extremes of mangrove global distribution
have very widespread global ranges, and have not been listed in
threatened categories, populations are more at risk from area
declines at these extremes of their distribution where mangrove
diversity is lowest [51].
The Cost of Mangrove Species LossThe loss of individual mangroves species and associated
ecosystem services has direct economic consequences for human
livelihoods, especially in regions with low mangrove species
diversity and low ecosystem resilience to species loss. In the Gulf
of California, for example, where there are only 4 mangrove
species present (Avicennia germinans, Rhizophora samoensis, Laguncularia
racemosa, Conocarpus erectus), it is estimated that one linear kilometer
of the species R. samoensis, listed as Near Threatened, provides up
to 1 ha of essential marine habitat and provides a median annual
value of US$37,000 in the fish and blue crab fisheries [73].
Nutrients and carbon from mangrove forests provide essential
support to other near shore marine ecosystems such as coral reefs
and seagrass areas, and enrich coastal food webs and fishery
production [1,28]. Avicennia species are dominant in inland or
basin mangrove forests in many parts of the world. However, 3 of
8 (38%) species in this genus are in threatened or Near Threatened
categories. Loss of these species and the mangrove forests they
dominate will have far reaching consequences for water quality
and other near shore ecosystems in coastal communities around
the globe. For example, water purification services provided by
these mangrove species in the Muthurajawela Marsh, Sri Lanka
are valued at more than $US 1.8 million per year [74].
Riverine or freshwater-preferring species, such as the Endan-
gered Heritiera fomes and Heritiera globosa, buffer coastal rivers and
freshwater communities from sedimentation, erosion and excess
nutrients. Heritiera globosa is a very rare species confined to western
Borneo, while Heritiera fomes is more widespread in south Asia, but
has experienced significant declines in many parts of its range.
Localized or regional loss of these coastal or fringe mangrove
species reduces protection for coastal areas from storms, erosion,
tidal waves, and floods [6,9], with the level of protection also
dependent on the quality of remaining habitat [8]. Two of 4 (50%)
fringe mangrove species present in Southeastern Asia (Sonneratia
griffithii, Aegiceras floridum) are listed in threatened or Near
Threatened categories. In other areas, such as Brazil, the central
Pacific islands, or West Africa, fringe mangrove forests are often
comprised of only one or two species. Even though these species
are globally listed as Least Concern, local and regional loss of
mangroves in these areas will have devastating impacts for coastal
communities. The loss of species may indeed be of greatest
economic concern in rural, high-poverty areas where subsistence
communities rely on mangrove areas for fishing and for direct
harvesting of mangroves for fuel, construction or other economic
products [17,75–77].
Finally it is important to note that the amount of mangrove area
in some countries is increasing due to reforestation and restoration
efforts [27,29]. Although regeneration of degraded mangrove
areas is thought to be a viable option in some areas [17,78],
successful regeneration is generally only achieved by the planting
of monocultures of fast-growing species, such as Rhizophora or
Avicenna species. Many rare and slow growing species are not
replaced [29], and many species cannot be easily replanted with
success. In sum, mangrove areas may be able to be rehabilitated in
some regions, but species and ecosystems cannot be effectively
restored.
Conclusions and RecommendationsThere are currently eleven international treaties and instru-
ments that afford some protection, at least on paper, to mangroves
in general, some of which have been in force for over 50 years.
These treaties and instruments include the RAMSAR Convention,
the Convention on the Prevention of Marine Pollution, CITES,
the International Tropical Timber Agreement, the Convention for
the Protection and Development of the Marine Environment of
the Wider Caribbean Region and the Convention on Biological
Diversity [70,79]. However, these treaties and instruments do not
necessarily confer legal protection to mangrove ecosystems, and
none of them address conservation, preservation, or management
of particular mangrove species. Similarly, the current trend of
global decline of mangrove area [27] indicates that exploitation
continues unabated despite the presence of these laws and treaties.
With some exceptions, mangrove areas and species of concern
are generally not adequately represented within protected areas.
In addition to legislative actions, initiatives are needed on the part
of governments, NGOs, and private individuals to acquire and
protect privately-owned parcels of coastal land, especially those
that contain viable populations of threatened mangrove species.
National legislation and management plans are in place in some
countries, but enforcement and further planning are required to
protect individual species that may be locally uncommon or
threatened, as well as to protect the entire mangrove areas and
important ecosystem functions.
IUCN Red List assessments for species can be regularly
updated, depending on the availability of better or new data,
and any subsequent changes in a species Red List Category can be
an important indicator of the success or failure of conservation
actions. As the impacts of mangrove area loss on mangrove species
can be variable, estimation of species composition, individual
species decline, or population size in a given area can be better
refined by available remote sensing techniques [80–85]. Similarly,
demographic modeling [86] is needed to establish a minimum
viable population size for mangrove species, especially for those
that are highly threatened. As ecosystem values can be
overestimated or underestimated, additional studies and cost/
benefit analyses are needed to determine the economic and
ecological impacts of harvesting, habitat loss, and habitat
deterioration on populations of individual mangrove species.
At least two mangrove species are at high risk of extinction and
may disappear within the next decade if protective measures are
not enforced. Although not formally assessed by IUCN Red List
Categories and Criteria, hybrid species face the same threats and
provide ecosystem services equivalent to true mangrove species.
Their conservation should not be overlooked, especially as they
are important for speciation and can be significant drivers of
diversification over time. We maintain that the loss of individual
species will not only contribute to the rapid loss of biodiversity and
ecosystem function, but will also negatively impact human
livelihoods and ecosystem function, especially in areas with low
species diversity and/or high area loss.
Acknowledgments
We thank the following people and organizations for their assistance with
the IUCN Mangrove Red List Assessment: Giacomo Abrusci, Moonyeen
Mangrove Extinction Risk
PLoS ONE | www.plosone.org 8 April 2010 | Volume 5 | Issue 4 | e10095
Alava, Lem Casten, Farid Dahdouh-Guebas, Michael Hoffmann, Sheila
McKenna, Roger McManus, Mohamed Omar Said Mohamed, Katrien
Quisthoudt, Mike Palomar, Jeremy Raynal, Mia Raynal, Jennifer Smith,
Mark Spalding, Annamalai University India, Conservation International,
Conservation International Philippines, First Philippine Conservation
Incorporated, National Parks Board Singapore, Royal Caribbean Cruises
Ocean Fund, and the Gordon and Betty Moore Foundation.
Author Contributions
Conceived and designed the experiments: BP KEC SRL. Performed the
experiments: BP KEC NCD AME JCE EF ESF KK NK SRL TM GEM
VNN JEO JHP SGSI JS SS YW JWHY. Analyzed the data: BP LC JS.
Contributed reagents/materials/analysis tools: LC NCD AME JCE EF
ESF KK NK TM GEM VNN JEO JHP SGSI SS YW JWHY. Wrote the
paper: BP.
References
1. Ellison AM (2008) Managing mangroves with benthic biodiversity in mind:
moving beyond roving banditry. J Sea Res 59: 2–15.
2. Duke NC, Meynecke JO, Dittmann S, Ellison AM, Anger K, et al. (2007) A
world without mangroves. Science 317: 41.
3. Millenium Ecosystem Assessment (2005) Ecosystems and human well-being:Synthesis. Washington DC: Island Press. 137 p.
4. Mumby PJ, Edwards AJ, Arias-Gonzalez JE, Lindeman KC, Blackwell PG, et al.
(2004) Mangroves enhance the biomass of coral reef fish communities in the
Caribbean. Nature 427: 533–536.
5. Kathiresan K, Bingham BL (2001) Biology of mangroves and mangroveecosystems. Advances Mar Biol 40: 81–251.
6. Ewel KC, Twilley RR, Ong JE (1998) Different kinds of mangrove forests
provide different goods and services. Global Ecol Biogeog Let 7: 83–94.
7. Costanza R, d’Arge R, de Groot R, Farber S, Grasso M, et al. (1997) The value
of the world’s ecosystem services and natural capital. Nature 387: 253–260.
8. Dahdouh-Guebas F, Jayatissa LP, Di Nitto D, Bosire JO, Lo Seen D, et al.(2005) How effective were mangroves as a defence against the recent tsunami?
Curr Biol 15: 443–447.
9. Barbier EB, Koch EW, Silliman BR, Hacker SD, Wolanski E, et al. (2008)
Coastal ecosystem based management with non-linear ecological functions andvalues. Science 319: 321–323.
10. Fosberg FR (1971) Mangroves vs. tidal waves. Biol Conserv 4: 38–39.
11. Das S, Vincent JR (2009) Mangroves protected villages and reduce death tollduring Indian super cyclone. Proc Nat Acad Sci 106: 7357–7360.
12. Luther D, Greenburg R (2009) Mangroves: a global perspective on the evolution
and conservation of their terrestrial vertebrates. Bioscience 59: 602–612.
13. Robertson AI, Duke NC (1987) Mangroves as nursery sites: comparisons of the
abundance and species composition of fish and crustaceans in mangroves andother nearshore habitats in tropical Australia. Mar Biol 96: 193–205.
14. Primavera JH (1998) Mangroves as nurseries: shrimp populations in mangrove
and non-mangrove habitats. Estuar Coast Shelf Sci 46: 457–464.
15. Dorenbosch M, van Riel MC, Nagelkerken I, van der Velde G (2004) The
relationship of reef fish densities to the proximity of mangrove and seagrassnurseries. Estuar Coast Shelf Sci 60: 37–48.
16. Ellison AM, Bank MS, Clinton BD, Colburn EA, Elliott K, et al. (2005) Loss of
foundation species: consequences for the structure and dynamics of forestedecosystems. Front Ecol Environ 3: 479–486.
17. Walters BB, Ronnback P, Kovacs JM, Crona B, Hussain SA, et al. (2008)Ethnobiology, socio-economics and management of mangrove forests: a review.
Aquatic Bot 89: 220–236.
18. Field CB, Osborn JG, Hoffman LL, Polsenberg JF, Ackerly DD, et al. (1998)Mangrove biodiversity and ecosystem function. Global Ecol Biogeog Let 7:
3–14.
19. Sullivan C (2005) The importance of mangroves Available: www.vi_
shandwildlife.com/Education/FactSheet/PDF_Docs/28Mangroves.pdf. Ac-cessed 2009 June 1.
20. Ong JE (1993) Mangroves – a carbon source and sink. Chemosphere 27:
1097–1107.
21. Dittmar T, Hertkorn N, Kattner G, Lara RJ (2006) Mangroves, a major source
of dissolved organic carbon to the oceans. Global Biogeochem Cycles 20:GB1012. doi:10.1029/2005GB002570.
22. Dodd RS, Ong JE (2008) Future of mangrove ecosystems to 2025. In:
Polunin NVC, ed. Aquatic ecosystems: Trends and global prospects. Cam-
bridge: Foundation for Environmental Conservation, Cambridge UniversityPress. pp 172–187.
23. Cohen JE, Small C, Mellinger A, Gallup J, Sachs J (1997) Estimates of coastal
populations. Science 278: 1209–1213.
24. Valiela I, Bowen JL, York JK (2001) Mangrove forests: one of the world’s
threatened major tropical environments. BioScience 51: 807–815.
25. Upadhyay VP, Ranjan R, Singh JS (2002) Human-mangrove conflicts: The wayout. Curr Sci India 83: 1328–1336.
26. FAO (2003) Status and trends in mangrove area extent worldwide. In:
Wilkie ML, Fortuna S, eds;Forest Resources Assessment Working Paper
No. 63. Rome: Forest Resources Division, FAO. Available: http://www.fao.org/docrep/007/j1533e/j1533e00.HTM. Accessed 2009 August 1.
27. FAO (2007) The World’s Mangroves 1980-2005, FAO Forestry Paper 153.
Rome: Forest Resources Division, FAO. 77 p.
28. Miththapala S (2008) Mangroves. Coastal Ecosystems Series Volume 2.
Colombo Sri Lanka: Ecosystems and Livelihoods Group Asia IUCN. 28 p.
29. Alongi DM (2002) Present state and future of the world’s mangrove forests.Environ Conserv 29: 331–349.
30. Tomlinson PB (1986) The Botany of Mangroves. Cambridge, UK: CambridgeUniversity Press. 413 p.
31. Stevens PF (2001) Angiosperm Phylogeny Website Version 9, June 2008.
Available: http://www.mobot.org/MOBOT/research/APweb/. Accessed 2009July 25.
32. Lugo AE, Snedaker SC (1974) The ecology of mangroves. Annu Rev Ecol Syst
5: 39–63.
33. Duke NC (1992) Mangrove floristics and biogeography. In: Robertson AI,
Alongi DM, eds. Tropical mangrove ecosystems. Washington DC: AmericanGeophysical Union. pp 63–100.
34. Jayatissa LP, Dahdouh-Guebas F, Koedam N (2002) A review of the floral
composition and distribution of mangroves in Sri Lanka. Bot J Lin Soc 138:29–43.
35. IUCN (2001) IUCN Red List Categories and Criteria Version 3.1. ;Available:
http://www.redlist.org/info/categories_criteria2001.html. Accessed 2009 Au-gust 1.
36. Hoffmann M, Brooks TM, da Fonseca GAB, Gascon C, Hawkins AFA, et al.
(2008) Conservation planning and the IUCN Red List. Endanger Species Res 6:113–125.
37. Rodrigues ASL, Pilgrim JD, Lamoreux JF, Hoffmann M, Brooks TM (2006)
The value of the IUCN Red List for conservation. Trends Ecol Evol 21: 71–76.
38. De Grammont PC, Cuaron AD (2006) An evaluation of threatened species
categorization Systems use don the American continent. Conserv Biol 20: 14–27.
39. Butchart SHM, Stattersfield AJ, Baillie J, Bennun LA, Stuart SN (2005) UsingRed List Indices to measure progress towards the 2010 target and beyond. Phil
Trans Soc B 360: 255–268.
40. Schipper J, Chanson JS, Chiozza F, Cox NA, Hoffmann M, et al. (2008) TheStatus of the World’s Land and Marine Mammals: Diversity, Threat, and
Knowledge. Science 322: 225–230.
41. Carpenter KE, Abrar M, Aeby G, Aronson RB, Banks S, et al. (2008) One-thirdof reef-building corals face elevated extinction risk from climate change and local
impacts. Science 321: 560–563.
42. Stuart SN, Chanson JS, Cox NA, Young BE, Rodrigues ASL, et al. (2004) Statusand trends of amphibian declines and extinctions worldwide. Science 306:
1783–1786.
43. IUCN (2008) IUCN Red List of Threatened Species. ;Available: http://www.iucnredlist.org. Accessed 2009 August 1.
44. Mace GM, Collar NJ, Gaston KJ, Hilton-Taylor C, Akcakaya HR, et al. (2008)
Quantification of extinction risk: the background to IUCN’s system forclassifying threatened species. Conserv Biol 22: 1424–1442.
45. Butchart SHM, Stattersfield AJ, Bennun LA, Shutes SM, Akcakaya HR, et al.(2004) Measuring global trendes in the status of biodiversity: Red List indices for
birds. PLoS Biol 2: 2294–2304.
46. Verheyden A, Kairo JG, Beeckman H, Koedam N (2004) Growth rings, growthring formation and age determination in the mangrove Rhizophora mucronata.
Ann Bot 94: 59–66.
47. Duarte CM, Thampanya U, Terrados J, Geertz-Hansen O, Fortes MD (1999)The determination of the age and growth of SE Asian mangroves seedlings from
internodal counts. Mangroves Salt Marshes 3: 251–257.
48. Duke NC, Pinzon ZS (1992) Aging Rhizophora seedlings from leaf Scar nodes: atechnique for studying recruitment and growth in mangrove forests. Biotropica
24: 173–186.
49. Rodrıguez ASL, Gaston KJ (2002) Rarity and conservation planning acrossgeopolitical units. Conserv Biol 16: 674–682.
50. Koedam N, Dahdouh-Guebas F (2008) Ecological quality changes precede
changes in quantity in mangrove forests. Response to Barbier EB, Koch EW,Silliman BR, Hacker SD, Wolanski E, et al. (2008) Coastal ecosystem-based
management with non-linear ecological functions and values Science 319:321–232.
51. Duke NC, Ball MC, Ellison JC (1998) Factors influencing biodiversity and
distributional gradients in mangroves. Global Ecol Biogeog Let 7: 27–47.
52. Sheue CR, Liu HY, Tsai CC, Rashid SMA, Yong JWH, et al. (2009) On themorphology and molecular basis of segregation of two species Ceriops zippeliana
and C. decandra (Rhizophoraceae) from Southeastern Asia. Blumea 54, in press.
53. Xue X, Hon H, Charles T (2004) Cumulative environmental impacts and
integrated coastal management: the case of Xiamen, China. J Environ Man 71:
271–283.
54. Ong JE (2003) Plants of the Merbok mangrove, Kedah, Malaysia and the urgent
need for their conservation. Folia Malaysiana 4: 1–18.
55. Ong JE (1995) The ecology of mangrove conservation and management.Hydrobiologia 295: 343–351.
Mangrove Extinction Risk
PLoS ONE | www.plosone.org 9 April 2010 | Volume 5 | Issue 4 | e10095
56. Kress WJ, DeFilipps RA, Farr E, Kyi DYY (2003) A checklist of the trees,
shrubs, herbs, and climbers of Myanmar. Smithsonian Institution: Contribution
from the United States National Herbarium 45: 1–590.
57. Rabinowitz D (1981) Seven forms of rarity. In: Synge H, ed. The biological
aspects of rare plant conservation. New York: Wiley. pp 205–217.
58. Soule ME (1986) Conservation biology: the science of scarity and diversity.
Sunderland: Sinauer Associates. 584 p.
59. Simberloff D (1988) The contribution of population and community biology to
conservation science. Annu Rev Ecol Syst 19: 473–511.
60. Ellison AM, Mukherjee BB, Karim A (2000) Testing patterns of zonation in
mangroves: scale-dependence and environmental correlates in the Sundarbans
of Bangladesh. J Ecol 88: 813–824.
61. Primavera JH, Sadaba RB, Lebata MJHL, Altamirano JP (2004) Handbook of
Mangroves in the Philippines – Panay. Philippines: SEAFDEC Aquaculture
Department and UNESCO Man and the Biosphere ASPACO Project. 106 p.
62. Ellison J (2005) Holocene palynology and sea-level change in two estuaries in
Southern Irian Jaya. Palaeogeog Palaeoclim Palaeoecol 220: 291–309.
63. Armitage D (2002) Socio-institutional dynamics and the political ecology of
mangrove forest conservation in Central Sulawesi, Indonesia. Global Environ
Change 12: 203–217.
64. Primavera JH (2000) Development and conservation of Philippine mangroves:
institutional issues. Ecol Econ 35: 91–106.
65. Lugo AE (2002) Conserving Latin American and Caribbean mangroves: issues
and challenges. Madera y Bosques 8: 5–25.
66. Tovilla-Hernandez C, Espino de la Lanza G, Orihuela-Belmonte DE (2001)
Impact of logging on a mangrove swamp in South Mexico: cost/benefit analysis.
Rev Biol Trop 49: 571–580.
67. Ellison AM, Farnsworth EJ (1996) Anthropogenic disturbance of Caribbean
mangrove ecosystems: past impacts, present trends, and future predictions.
Biotropica 28: 549–565.
68. Duke NC, Pinzon ZS, Prada MCT (1997) Large-scale damage to mangrove
forests following two large oil spills in Panama. Biotropica 29: 2–14.
69. Spalding MD, Blasco F, Field CD (1997) World Atlas of Mangroves. Okinawa
Japan: International Society for Mangrove Ecosystems. 178 p.
70. Pagliosa PA (2004) The impact of urbanization on biosphere reserves: a
comparative study of protected and non-protected coastal areas. Available:
http://www.unesco.org.uy/mab/documentospdf/PPAGLIOSA-MABA-
WARD.pdf. Accessed 2009 August 1.
71. Lamparelli CC, Rodrigues, FO, Moura DO (1997) Long-term assessment of an
oil-spill in a mangrove forest in Sao Paulo, Brazil. In: Kjerfve B, Lacerda LD,
Diop EHS, eds. Mangrove ecosystem studies in Latin America and Africa. Paris:
UNESCO. pp 191–203.72. Ellison JC (2009) Wetlands of the Pacific Islands region. Wetlands Ecol Manage
17: 169–206.
73. Aburto-Oropez O, Ezcurra E, Danemann G, Valdez V, Murria J, et al. (2008)Mangroves in the Gulf of California increase fishery yields. PNAS 105:
10456–10459.74. Emerton L, Kekulandala LDCB (2002) Assessment of the economic value of
Muthurajawela wetland. Occasional paper 4. Colombo: IUCN Sri Lanka
Country Office. 28 p.75. Ronnback P (1999) The ecological basis for economic value of seafood
production supported by mangrove ecosystems. Ecol Econ 29: 235–252.76. Glaser M (2003) Interrelations between mangrove ecosystem, local economy and
social sustainability in Caete Estuary, North Brazil. Wetland Ecol Manage 11:265–272.
77. Lopez-Hoffman L, Monroe LE, Narvaez E, Martinez-Ramos M, Ackerly DD
(2006) Sustainability of mangrove harvesting: how do harvesters perceptionsdiffer from ecological analysis? Ecol Soc 11: 14.
78. Saenger, P (2002) Mangrove ecology, silviculture and conservation. Dordrecht:Kluwer Academic Publishers. 372 p.
79. Farnsworth E J, Ellison AM (1997) The global conservation status of mangroves.
Ambio 26: 328–334.80. Neukermans G, Dahdouh-Guebas F, Kairo J G, Koedam N (2008) Mangrove
species and stand mapping in Gazi Bay (Kenya) using Quickbird satelliteimagery. J Spatial Science 52: 75–86.
81. Dahdouh-Guebas F, Koedam N (2008) Long-term retrospection on mangrovedevelopment using transdisciplinary approaches: a review. Aquat Bot 89: 80–92.
82. Dahdouh-Guebas F, Van Hiel E, Chan JC-W, Jayatissa LP, Koedam N (2005)
Qualitative distinction of congeneric and introgressive mangrove species inmixed patchy forest assemblages using high spatial resolution remotely sensed
imagery (IKONOS). Syst Biodivers 2: 113–119.83. Kovacs JM, Wang J, Flores-Verdugo F (2005) Mapping mangrove leaf area
index at the species level using IKONOS and LAI-2000 sensors for the Agua
Brava Lagoon, Mexican Pacific. Estuar Coastal Shelf Science 62: 377–384.84. Wang L, Sousa WP, Gong P, Biging S (2004) Comparison of IKONOS and
QuickBird images for mapping mangrove species on the Caribbean coast ofPanama. Remote Sens Environ 91: 432–440.
85. Green EP, Clark CD, Mumby PJ, Edwards AJ, Ellis AC (1998) Remote sensingtechniques for mangrove mapping. Internat J Remote Sens 5: 935–956.
86. Clarke PJ (1995) The population dynamics of the mangrove Avicennia marina:
demographic synthesis and predictive modelling. Hydrobiol 295: 83–88.
Mangrove Extinction Risk
PLoS ONE | www.plosone.org 10 April 2010 | Volume 5 | Issue 4 | e10095