
The location of Ti containing phases after the completion of the NaAlH4+xTiCl3 milling process
9
Journal of Alloys and Compounds 513 (2012) 597–605 Contents lists available at SciVerse ScienceDirect Journal of Alloys and Compounds jou rn al h om epage: www.elsevier.com/locate/jallcom The location of Ti containing phases after the completion of the NaAlH 4 + xTiCl 3 milling process M.P. Pitt a,c,∗ , P.E. Vullum b , M.H. Sørby a , D. Blanchard a , M.P. Sulic d , H. Emerich e , M. Paskevicius c , C.E. Buckley c , J. Walmsley b , R. Holmestad b , B.C. Hauback a a Physics Department, Institute for Energy Technology, P.O. Box 40 Kjeller, N-2027, Norway b Department of Physics, Norwegian University of Science and Technology, N-7491 Trondheim, Norway c Department of Imaging and Applied Physics, Curtin University, GPO Box U1987, Perth 6845, Western Australia, Australia d Department of Chemistry, University of Hawaii, Honolulu, HI 96822, USA e Swiss-Norwegian Beam Line, European Synchrotron Radiation Facility, BP 220, Grenoble, CEDEX, France a r t i c l e i n f o Article history: Received 5 August 2011 Received in revised form 4 November 2011 Accepted 4 November 2011 Available online 11 November 2011 Keywords: Metal hydrides Amorphous materials Transition metal alloys and compounds Synchrotron radiation Transmission electron microscopy (TEM) a b s t r a c t The NaAlH 4 + xTiCl 3 (x < 0.1) system has been studied by X-ray synchrotron diffraction and transmission electron microscopy (TEM) after the completion of the milling process, for both planetary (PM) and cryo milled (CM) samples. Comparison of the NaAlH 4 mosaic size (coherence length) determined from the X-ray synchrotron diffraction lineshape, and measurement of the external powder grain dimensions of ca. 250–300 particles by TEM, reveals that after the completion of the milling process, 1 1 0 {1 1 1} edge dislocated 2–20 nm Al crystallites are dispersed in a Ti rich amorphous (a-)Al 1−x Ti x (0.3 < x < 0.5) matrix. This nano Al/Al 50 Ti 50 composite is embedded on the surface of single crystalline NaAlH 4 powder grains. The NaAlH 4 single crystal powder grains are moderately defected with uncorrelated defects, induced from the milling process. © 2011 Elsevier B.V. All rights reserved. 1. Introduction The solid state reversible storage of hydrogen (H) to gravimet- ric densities greater than 10 wt.% depends directly on the use of the family of compounds referred to as ‘complex’ hydrides. The crystal structure of a complex, M n+ [RH m ] n − (M,R = metal or met- alloid), typically assumes a regular array of polyhedra, formed by the coordination of H atoms about the R type atom. By the late nineties over 40 complex structure types representing some 70 ternary and quaternary metal hydrides were reported [1]. Gen- erally, hydrogen bonding is covalent, with partial ionic bonding occurring between the M type atom and the polyhedra [2]. Hydro- gen bonding in a complex is typically stronger than in heavier low H wt.% interstitial type metal-hydrides (e.g. LaNi 5 H 6.7 ), yielding higher dissociation temperatures, and slower hydrogen absorp- tion/desorption kinetics. The earliest experimental reversibility studies revealed that many complexes were thermally very sta- ble, too heavy in terms of H wt.%, and suffered from multi-step disproportionation of the starting metal stoichiometry, such as ∗ Corresponding author at: Department of Imaging and Applied Physics, Curtin University, Kent Street, Bentley, Perth, WA 6102, Australia. Tel.: +61 8 9266 3673; fax: +61 8 9266 2377. E-mail address: [email protected] (M.P. Pitt). Ca 4 Mg 4 Fe 3 H 22 [3]. Such decomposition leads to the generation of multiple phase interfaces, also revealed as multiple plateaus in the Pressure–Composition–Temperature (PCT) phase diagram, requir- ing the transport of dispersed heavy atoms over large distances (>100 nm) to re-generate the original metal stoichiometry from the decomposed products. Within the wide variation of thermodynamic stability in the complex hydride family, the previously irreversible aluminohy- dride NaAlH 4 (‘alanate’ family) has emerged as an auspicious benchmark system. The addition of minor amounts of transition metals [4] has enabled lowered H absorption/desorption tem- peratures (ca. 120–140 ◦ C), and orders of magnitude increase in kinetics of hydrogen re-absorption at an increased and stable 4–5 wt.% H, demonstrated up to 100 cycles [5–7]. Understand- ing the kinetic enhancing mechanics of transition metals such as Ti is a potential key to destabilising more stable and higher wt.% complex compounds such as LiBH 4 and Mg(BH 4 ) 2 from the borohydride family, which have a theoretical capacity of 18.5 and 14.9 wt.% H. A wide variety of experimental techniques have been employed to study the addition of Ti-salts to NaAlH 4 in the milled state, including Anelastic Spectroscopy [8–10], Auger Elec- tron [11], Energy Dispersive X-ray (EDS) [12–14] and Electron Energy Loss Spectroscopies (EELS) [12,14], Electron Paramagnetic Resonance [15], X-ray Absorption (XAS and EXAFS) [16–22], Inelas- tic Neutron Scattering (INS) [23,24], Infrared Spectroscopy (IR) 0925-8388/$ – see front matter © 2011 Elsevier B.V. All rights reserved. doi:10.1016/j.jallcom.2011.11.021
Transcript of The location of Ti containing phases after the completion of the NaAlH4+xTiCl3 milling process

Tm
MCa
b
c
d
e
a
ARRAA
KMATST
1
rtcatnteogHhtsbd
Uf
0d
Journal of Alloys and Compounds 513 (2012) 597– 605
Contents lists available at SciVerse ScienceDirect
Journal of Alloys and Compounds
jou rn al h om epage: www.elsev ier .com/ locate / ja l l com
he location of Ti containing phases after the completion of the NaAlH4 + xTiCl3illing process
.P. Pitta,c,∗, P.E. Vullumb, M.H. Sørbya, D. Blancharda, M.P. Sulicd, H. Emeriche, M. Paskeviciusc,.E. Buckleyc, J. Walmsleyb, R. Holmestadb, B.C. Haubacka
Physics Department, Institute for Energy Technology, P.O. Box 40 Kjeller, N-2027, NorwayDepartment of Physics, Norwegian University of Science and Technology, N-7491 Trondheim, NorwayDepartment of Imaging and Applied Physics, Curtin University, GPO Box U1987, Perth 6845, Western Australia, AustraliaDepartment of Chemistry, University of Hawaii, Honolulu, HI 96822, USASwiss-Norwegian Beam Line, European Synchrotron Radiation Facility, BP 220, Grenoble, CEDEX, France
r t i c l e i n f o
rticle history:eceived 5 August 2011eceived in revised form 4 November 2011ccepted 4 November 2011vailable online 11 November 2011
a b s t r a c t
The NaAlH4 + xTiCl3 (x < 0.1) system has been studied by X-ray synchrotron diffraction and transmissionelectron microscopy (TEM) after the completion of the milling process, for both planetary (PM) and cryomilled (CM) samples. Comparison of the NaAlH4 mosaic size (coherence length) determined from theX-ray synchrotron diffraction lineshape, and measurement of the external powder grain dimensions ofca. 250–300 particles by TEM, reveals that after the completion of the milling process, 〈1 1 0〉 {1 1 1} edge
eywords:etal hydrides
morphous materialsransition metal alloys and compounds
dislocated 2–20 nm Al crystallites are dispersed in a Ti rich amorphous (a-)Al1−xTix (0.3 < x < 0.5) matrix.This nano Al/Al50Ti50 composite is embedded on the surface of single crystalline NaAlH4 powder grains.The NaAlH4 single crystal powder grains are moderately defected with uncorrelated defects, inducedfrom the milling process.
© 2011 Elsevier B.V. All rights reserved.
ynchrotron radiationransmission electron microscopy (TEM). Introduction
The solid state reversible storage of hydrogen (H) to gravimet-ic densities greater than 10 wt.% depends directly on the use ofhe family of compounds referred to as ‘complex’ hydrides. Therystal structure of a complex, Mn+[RHm]n
− (M,R = metal or met-lloid), typically assumes a regular array of polyhedra, formed byhe coordination of H atoms about the R type atom. By the lateineties over 40 complex structure types representing some 70ernary and quaternary metal hydrides were reported [1]. Gen-rally, hydrogen bonding is covalent, with partial ionic bondingccurring between the M type atom and the polyhedra [2]. Hydro-en bonding in a complex is typically stronger than in heavier low
wt.% interstitial type metal-hydrides (e.g. LaNi5H6.7), yieldingigher dissociation temperatures, and slower hydrogen absorp-ion/desorption kinetics. The earliest experimental reversibility
tudies revealed that many complexes were thermally very sta-le, too heavy in terms of H wt.%, and suffered from multi-stepisproportionation of the starting metal stoichiometry, such as∗ Corresponding author at: Department of Imaging and Applied Physics, Curtinniversity, Kent Street, Bentley, Perth, WA 6102, Australia. Tel.: +61 8 9266 3673;
ax: +61 8 9266 2377.E-mail address: [email protected] (M.P. Pitt).
925-8388/$ – see front matter © 2011 Elsevier B.V. All rights reserved.oi:10.1016/j.jallcom.2011.11.021
Ca4Mg4Fe3H22 [3]. Such decomposition leads to the generation ofmultiple phase interfaces, also revealed as multiple plateaus in thePressure–Composition–Temperature (PCT) phase diagram, requir-ing the transport of dispersed heavy atoms over large distances(>100 nm) to re-generate the original metal stoichiometry from thedecomposed products.
Within the wide variation of thermodynamic stability in thecomplex hydride family, the previously irreversible aluminohy-dride NaAlH4 (‘alanate’ family) has emerged as an auspiciousbenchmark system. The addition of minor amounts of transitionmetals [4] has enabled lowered H absorption/desorption tem-peratures (ca. 120–140 ◦C), and orders of magnitude increase inkinetics of hydrogen re-absorption at an increased and stable4–5 wt.% H, demonstrated up to 100 cycles [5–7]. Understand-ing the kinetic enhancing mechanics of transition metals suchas Ti is a potential key to destabilising more stable and higherwt.% complex compounds such as LiBH4 and Mg(BH4)2 from theborohydride family, which have a theoretical capacity of 18.5and 14.9 wt.% H. A wide variety of experimental techniques havebeen employed to study the addition of Ti-salts to NaAlH4 in themilled state, including Anelastic Spectroscopy [8–10], Auger Elec-
tron [11], Energy Dispersive X-ray (EDS) [12–14] and ElectronEnergy Loss Spectroscopies (EELS) [12,14], Electron ParamagneticResonance [15], X-ray Absorption (XAS and EXAFS) [16–22], Inelas-tic Neutron Scattering (INS) [23,24], Infrared Spectroscopy (IR)
5 and C
[a[tMN[X
ot5t[saitctNpci
dh>mg(btssotg[mtNNpb[f
stFamifTph[abaibNi
98 M.P. Pitt et al. / Journal of Alloys
25], Laboratory X-ray Diffraction [16,25–33], Neutron [34–36]nd X-ray Synchrotron Diffraction [36,37], Muon Spin Rotation38], Nuclear Magnetic Resonance (NMR) [29,39–42], Raman Spec-roscopy [25,43,44], Scanning [13,45] and Transmission Electron
icroscopies [12–14,19,46], Secondary Ion Mass and Secondaryeutral Mass Spectroscopy [27], Ultrasmall-angle X-ray Scattering
45,47], X-ray Photoelectron Spectroscopy (XPS) [16,26,48,49], and-ray Photoemission Electron Microscopy (XPEEM) [16].
Auger spectroscopy suggests that ‘most of the catalyst remainsn the sample surface’ [11]. All X-ray absorption studies agreehe Ti valence is reduced to zero after a milling time scale of–30 min, however, a range of interpretation exists surroundinghe formation of Al–Ti species. Ti is coordinated by Al (n = 4.8) in17], with ca. 30% of Ti in Al, and 70% proposed as interstitiallyubstituted into the NaAlH4 crystal structure, while Al–Ti speciesre precluded in the milled state in [21]. Ti is coordinated by Aln [19] and the similarity of the milled NaAlH4 + 0.02TiCl3 spec-ra to crystalline (c-) Al3Ti suggest it is formed during milling andhanges little with hydrogen cycling. The observation of oscilla-ions in the fine structure of the Ti K edge spectra from milledaAlH4 + 0.02–0.04TiCl3 in [20] suggest the formation of amor-hous (a-) Al3Ti, which changes to c-Al3Ti with hydrogen cycling,ommensurate with more pronounced fine structure oscillationsndicating longer range ordering.
Diffraction data from milled NaAlH4 + xTiCl3 samples generallyo not show any crystalline reflections from Ti containing phases,owever, NaCl reflections are normally observed after typically30 min milling time, indicating that reduction has occurred, com-ensurate with the Ti valence reducing to zero. Exceptions to this
enerality include [28], where a broad reflection in-between Al1 1 1) and Al (2 0 0) for milled NaAlH4 + 0.1TiCl3 is proposed toe an hcp Ti(Al) solid solution, and [27], where Ti substitution inhe NaAlH4 lattice has been modelled by Rietveld analysis, whichhould be disregarded on the basis of inherent correlation with thecale factor. At longer planetary milling times (>10 h) c-Al80Ti20 isbserved to form [50], suggesting that at typically short millingimes (<1–10 h), Ti is bound in an amorphous state. XPEEMS sug-ests that TiAlx ‘complexes’ have formed after only 25 min of milling16]. Milling of a stoichiometric mixture of 3NaAlH4 + TiCl3 at short
illing times yields c-Al3Ti + 3NaCl [29]. It is emphasised in [36]hat there are no observed changes in the unit cell parameters ofaAlH4 after TiCl3 addition, indicating that Ti does not enter theaAlH4 unit cell. Direct sputtering of the milled NaAlH4 + 0.05TiCl3owder surface [27] yields a Ti rich signal at short milling times,ecoming weaker as a function of milling time, correlated by XPS49]. The Ti signal is estimated to occur across a 30–40 nm depthrom the surface.
Aside from the question of the location and formation of Ti–Alpecies, NMR and IR both display spectral features which indicatehat the addition of Ti to NaAlH4 has perturbed Al–H bonding.ast T1 relaxation in [41] suggests enhanced hydrogen dynamicst ambient temperature, and Al–H stretching and H–Al–H bendingodes are shifted in frequency in the IR spectra in [25]. However,
n both of these cases, it has been noted that the same spectraleatures are evident in milled pure NaAlH4 (without Ti additives).his suggests that microstructural features induced by the millingrocess are likely responsible for the distortion of bulk AlH4 tetra-edra. In support of this argument, quasi-elastic neutron scattering23] shows that the fraction of mobile H is insignificant at 315 K,nd that the addition of TiCl3 to NaAlH4 has a limited influence onulk H dynamics. It is also summarised in [51] that the Raman, IRnd INS spectra of pure and Ti enhanced NaAlH4 are very similar,
ndicating that bulk substitution of Ti is not responsible for Al–Hond weakening. At least some fraction of the Ti remaining at theaAlH4 powder grain surface is strongly supported by [27], and bysotopic gas phase H/D scrambling experiments [43,52], where a
ompounds 513 (2012) 597– 605
large fraction of HD is reported at 50 ◦C and 20 bar by soaking milledNaAlH4 + 0.04TiCl3 under D2 gas [52]. Without homogenous bulk Tidistribution, and at least a fraction of the Ti exposed at the NaAlH4surface, it can be inferred that only a small fraction of NaAlH4 is incontact with the added Ti, and consequently, only a small and localfraction of AlH4 tetrahedra may be affected in the vicinity of Ti.
For sub-stoichiometric mixtures (typically <5 mol% TiCl3 for thefastest kinetics) at short milling times, we aim to provide an exper-imental proof of the correct morphological location of Ti in theNaAlH4 powder grain and what phase the Ti is in. Knowledge of thecorrect Ti containing phase will then allow an understanding of thephysical role of Ti in enhancing H absorption/desorption kinetics.From an experimental [36] and modelling perspective [2,53] bulksubstitution of Ti into the NaAlH4 crystal structure is unfavourable,with no changes of unit cell parameters evident. With the nature ofthe Ti containing phase formed after milling unresolved, the pow-der grain microstructure (free dislocations, grain boundary (GB)network, micro-twins, stacking faults, etc.) and/or powder surfacecan be viewed as potential locations of Ti. We have adopted asimple but powerful geometrical technique, the measurement ofcrystalline mosaic (coherent domain length) size from the diffrac-tion lineshape, to determine what, if any influence, Ti additives haveon the microstructure. In combination with the measurement ofexternal powder grain dimensions by TEM, we can determine ifchanges in diffraction lineshape due to Ti addition are the resultof internal changes in the powder grain microstructure, or a sur-face related modification of the external powder grain dimensions.TiCl3 rich contents up to 10 mol% are used to better identify the for-mation of any Ti containing phases. A wide range of milling energyhas been employed by using a typical low energy planetary milland a cryogenic mill. Cryogenic milling has the potential to inducea much denser initial microstructure. We have measured the X-ray synchrotron lineshape of milled NaAlH4 + xTiCl3 as a functionof TiCl3 content (up to 10 mol%), to observe any influence increas-ing Ti content has on it. Milling has been performed directly at thesynchrotron beamline to avoid any artefactual reduction in mosaicsize of NaAlH4 that may occur over a period of hours to days due todisproportionation of the starting NaAlH4 composition.
2. Experimental procedure
NaAlH4 was purchased from Albemarle Corporation (LOT NO.#: 22470404-01).All halide precursors were purchased from Sigma–Aldrich Chemicals Inc. (>99.99%purity). At all times, all powders have been handled under inert Ar or N2 atmospherein a dry glove box, with <1 ppm O2 and H2O. Milled NaAlH4 powders (pure and withTiCl3 additive) were prepared in 1 g quantities in a Fritsch P7 planetary mill, with ballto powder ratio (bpr) of 20:1, at 750 rpm for a period of 1 h, and in 2 g quantities in aSpex 6750 Freezer mill, milled at intensity 15 for a period of 2 h, in a standard SPEXcryo vial, with a 32 g stainless steel 440c impactor. Wet TiCl3 enhanced powderswere prepared as described in [4]. Milled powders were taken directly to the beam-line after milling for diffraction measurements. Powder X-ray diffraction data wererecorded at the Swiss-Norwegian Beamline (SNBL) at the European SynchrotronRadiation Facility (ESRF) in Grenoble, France. Samples were contained in rotat-ing 0.8 mm boron–silica glass capillaries. High resolution data (�d/d ∼ 2 × 10⁻⁴)was typically collected at 295 K between 5 and 35◦ 2�, in steps of 0.003–0.030◦ ,depending on the sample broadening. A wavelength of 0.4998 A was obtained froma channel cut Si (1 1 1) monochromator. Transmission electron microscopy (TEM)was performed with a JEOL 2010F field emission gun operating at 200 kV, or witha Philips CM30 operating at 100–300 kV. All TEM samples were loaded inside theglove box and transferred into the column of the microscope by two different meth-ods: (a) An oxygen tight transfer cap was used, with the cap being removed insidea glove bag attached to the holder entrance of the microscope. The glove bag waspumped and flushed with pure N2 to prevent sample oxidation. (b) A Gatan envi-ronmental cell TEM holder was used. A vacuum gate valve on the environmentalchamber allowed the sample to be withdrawn and isolated in the chamber duringtransfer, which prevented contamination or contact with air. Method (a) was mostfrequently used. Electron diffraction patterns were integrated by the ProcessDiffrac-
tion V 4.2.4 B software [54]. The inelastic background in the integrated diffractionpatterns was subtracted by a combination of a four-parameter exponential decayfunction and a third order polynomial. Further details regarding TEM measurementscan be found in [55]. X-ray synchrotron diffraction patterns were modelled with theRietveld diffraction analysis software RIETICA [56]. Background was modelled with
and Compounds 513 (2012) 597– 605 599
aft1espnhfdIttsrqipN
3
3tp
pAmmmmfamhnppNcsad
mttlpSiadoawtp
oNfitw〈m
Fig. 1. (a) A conceptual schematic representation that describes the two possiblegeometrical outcomes of the combined X-ray synchrotron lineshape/TEM measure-ment technique. (i) A typical �-sized powder grain with sub-� mosaics defined by agrain boundary network or (ii) individual single crystal powder grains. (b) Mediumresolution image showing the TEM measurement technique for external powderdimensions. Powder grains are moderately elongated from spherical dimensions,
M.P. Pitt et al. / Journal of Alloys
type I Chebyshev polynomial. Diffraction lineshape profiles were fitted with aull Voigt function to separate size and strain contributions, with the instrumen-al shape determined by a NIST LaB6 660a lineshape standard, further annealed to800 ◦C. Average volume weighted mosaic size (coherent domain length), 〈D〉V, wasxtracted from the synchrotron lineshape using the Scherrer equation (we empha-ise that the use of the Scherrer equation is valid only when high resolution (lowestart of the 10−4 decade) data is used, where the diffractometer instrumental compo-ent is negligible and can be correctly subtracted). To distinguish which techniqueas been used to measure the relevant size, the coherent domain length extracted
rom the synchrotron lineshape is quoted in units of Å, while external powder grainimensions measured by TEM are quoted in nm, with the distribution average 〈x〉.
ntegrated electron diffraction patterns are displayed in units of wavevector, q. Theypical standard deviation of a size is less than ±50 A from the lineshape, and lesshan ±5 nm by TEM. Fig. 1 demonstrates schematically the concept of the combinedynchrotron lineshape/TEM measurement technique, and the two possible geomet-ical outcomes. Case (ii) is the same measurement technique used by NIST in theuantification of the new nano dimensioned lineshape standard SRM 1979 [57],
n which the powder grain size measured from the diffraction lineshape is com-ared to the direct measurement of up to 1000 powder particles by TEM. The sameaAlH4 + xTiCl3 samples measured with X-rays have also been measured by TEM.
. Results and discussion
.1. Combined X-ray synchrotron diffraction and TEM approacho determine the location of Ti after the NaAlH4 + 0.1TiCl3 millingrocess
Our initial aim in using a cryogenic-mill was to: (a) avoid dis-roportionation of the NaAlH4 metal stoichiometry to Na3AlH6 andl during milling, so as to enable single-phase diffraction lineshapeosaic size estimates that can be compared with TEM measure-ents of external powder dimensions, and (b) to induce a densericrostructure than that obtainable by lower energy planetaryilling. Fig. 2 compares the X-ray synchrotron diffraction patterns
rom typical PM and CM NaAlH4 + 0.02TiCl3 samples, immediatelyfter milling. It is clear that the cryo milling process has produced auch broader lineshape, indicating either fine microstructure that
as produced a smaller mosaic size, or a significantly smaller exter-al powder grain dimension. Both patterns appear close to singlehase, with no indication of TiCl3 or any crystalline Ti-containinghases. Quantitative phase analysis (QPA) of both the PM and CMaAlH4 + 0.02TiCl3 samples yields ca. 5 mol% Al and 5 mol% NaClrystalline phases due to the reduction of TiCl3, that together con-ume only ca. 4.5% of the total powder grain volume, thereforellowing an accurate single-phase comparison with external pow-er grain dimensions measured by TEM.
In Fig. 3, the initial powder mosaic size of pure NaAlH4 deter-ined from the X-ray synchrotron peak breadth is compared with
he mosaic size obtained after milling as a function of TiCl3 con-ent. PM TiCl3 enhanced NaAlH4 samples display little change inineshape as a function of Ti content compared to the 0% additive,ure NaAlH4 PM standard (referred to as the Standard Milling Line,ML). Following the PM NaAlH4 + 0.02TiCl3 sample over 196 days, its also clear that even moderately disproportionated samples shown artefactual development of microstructure over a period of days,ue to the formation of Na3AlH6 and Al, and subsequent contractionf the NaAlH4 mosaic size. The CM TiCl3 enhanced samples display
strong change in lineshape as a function of increasing Ti content,ell below the size of the 0% pure NaAlH4 CM standard, indicating
he development of either fine microstructure, or reduced externalowder dimensions.
Fig. 4(a) and (b) shows the external powder dimensionsf ca. 300 powder particles measured by TEM, for the sameaAlH4 + 0.02TiCl3 samples from Fig. 2, both PM and CM. Wend excellent agreement between the mosaic size extracted from
he synchrotron peak breadth, 〈D〉V PM = 2994 A, 〈D〉V CM = 380 Aith the external powder grain dimensions measured by TEM,x〉 PM = 297 nm, 〈x〉 CM = 37 nm, demonstrating that the NaAlH4osaic is in fact a single crystal powder grain (there exists also a
displaying short (dS) and long (dL) dimensions which are then averaged to give afinal size d.

600 M.P. Pitt et al. / Journal of Alloys and Compounds 513 (2012) 597– 605
Fig. 2. Low angle portion of the X-ray synchrotron diffraction patterns collected for PM and CM NaAlH4 + 0.02TiCl3 samples. Both samples were measured ca. 20 minimmediately after the completion of milling.
Fig. 3. Variation of the X-ray synchrotron lineshape determined mosaic size as a function of Ti content for TiCl3 enhanced NaAlH4. SML = standard milling line, indicatingthe mosaic size of the 0% pure NaAlH4 PM or CM standard. Deviation below the SML indicates fine microstructure development, or a reduction of external powder graindimensions. The TEM symbol indicates sample sizes which have been compared by both synchrotron X-ray lineshape and TEM measurements.

M.P. Pitt et al. / Journal of Alloys and Compounds 513 (2012) 597– 605 601
Fig. 4. (a) External powder dimensions measured by TEM for ca. 300 powder particles, for CM NaAlH4 + 0.02TiCl3. (b) External powder dimensions measured by TEM for ca.3 om thw CM = 3
nstbtpofdcptT
tdmbacet
00 powder particles, for PM NaAlH4 + 0.02TiCl3. Excellent agreement is obtained frith the external powder grain dimensions measured by TEM, 〈x〉 PM = 297 nm, 〈x〉
on-zero strain component in the lineshape, indicating the NaAlH4ingle crystalline bulk has sustained a non-correlated defect struc-ure, likely free edge or screw dislocations), free of any grainoundary network. It is thus clear that no Ti-dependent microstruc-ural generation occurs within the NaAlH4 bulk during the millingrocess, and it can be inferred that after reduction of TiCl3 hasccurred, crystalline Al and ‘dispersed’ Ti are embedded on the sur-ace of defected single crystal NaAlH4 powder grains. The strong Tiependency for mosaic size in CM NaAlH4 + xTiCl3 samples indi-ates the reduction products in CM samples serve as an effectiveowder grinding agent, reducing dimensions from ca. 100 nm forhe 0% additive pure NaAlH4 CM standard down to 30–40 nm foriCl3 enhanced powders (>2 mol% TiCl3).
Due to the apparent absence of any form of crystalline Ti con-aining phase in PM NaAlH4 + xTiCl3 X-ray diffraction patternsirectly after the milling process, it has been suggested that Tiay be present as an X-ray amorphous phase [32,36]. It should
e clarified here that elemental Ti cannot exist in a pure Ti only
morphous state without the application of severe environmentalonditions, and is highly metastable on a < 10 s timescale [58]. How-ver, information about the location of Ti after the completion ofhe NaAlH4 + xTiCl3 milling process does exist in X-ray synchrotrone size extracted from the synchrotron lineshape 〈D〉V PM = 2994 A, 〈D〉V CM = 380 A7 nm, demonstrating the powder consists of single crystals.
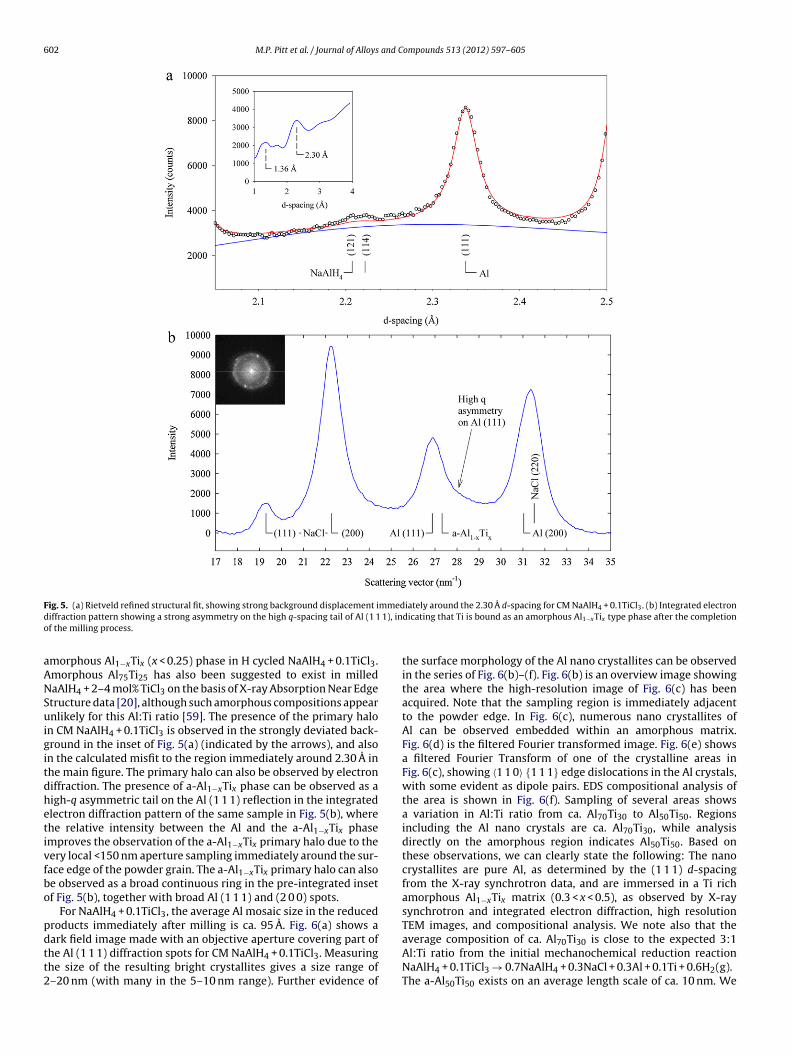
diffraction data. Subtle features in the diffraction pattern of CMNaAlH4 + 0.1TiCl3 in Fig. 5(a) provide the first clue about the loca-tion of Ti atoms after the milling process is completed. To enablea statistically satisfactory fit to the immediate region surroundingthe Al (1 1 1) reflection, it is necessary to considerably deviate thebackground function, demonstrated in the inset figure across theentire d-spacing range of the data. This is due to the presence ofamorphous halos in the diffraction data, producing broad humpsin the scattering background. The maxima of the deviation occursat a d-spacing of 2.30 A (the earlier deviation around 1.36 A is froma weaker secondary halo), at which position the primary amor-phous halo of binary Al50Ti50 phases is centred [59,60]. The primaryhalo from Ti poorer amorphous compositions such as a-Al90Ti10(x < 0.25) is typically observed at 2.21 A [61]. Amorphous Al1−xTixphases have been observed in melt spins, thin films and in ballmilled mixtures of elemental Al and Ti powders [59–62]. An amor-phous Al1−xTix phase has been suggested to exist in cooled milledand H cycled NaAlH4 + 0.1TiCl3, although d-spacings of the primary
halo and Al:Ti compositions are not specified [28]. The observa-tion that the ‘broad reflection’ in [28] is centred close to 2� = 41◦(for Cu K� radiation) in-between Al (1 1 1) and Al (2 0 0) suggeststhe ‘broad reflection’ is centred around 2.20 A, indicating a Ti poor
602 M.P. Pitt et al. / Journal of Alloys and Compounds 513 (2012) 597– 605
F mmedd 1), ino
aANSuigitdhetivfbo
pdtt2
ig. 5. (a) Rietveld refined structural fit, showing strong background displacement iiffraction pattern showing a strong asymmetry on the high q-spacing tail of Al (1 1f the milling process.
morphous Al1−xTix (x < 0.25) phase in H cycled NaAlH4 + 0.1TiCl3.morphous Al75Ti25 has also been suggested to exist in milledaAlH4 + 2–4 mol% TiCl3 on the basis of X-ray Absorption Near Edgetructure data [20], although such amorphous compositions appearnlikely for this Al:Ti ratio [59]. The presence of the primary halo
n CM NaAlH4 + 0.1TiCl3 is observed in the strongly deviated back-round in the inset of Fig. 5(a) (indicated by the arrows), and alson the calculated misfit to the region immediately around 2.30 A inhe main figure. The primary halo can also be observed by electroniffraction. The presence of a-Al1−xTix phase can be observed as aigh-q asymmetric tail on the Al (1 1 1) reflection in the integratedlectron diffraction pattern of the same sample in Fig. 5(b), wherehe relative intensity between the Al and the a-Al1−xTix phasemproves the observation of the a-Al1−xTix primary halo due to theery local <150 nm aperture sampling immediately around the sur-ace edge of the powder grain. The a-Al1−xTix primary halo can alsoe observed as a broad continuous ring in the pre-integrated insetf Fig. 5(b), together with broad Al (1 1 1) and (2 0 0) spots.
For NaAlH4 + 0.1TiCl3, the average Al mosaic size in the reducedroducts immediately after milling is ca. 95 A. Fig. 6(a) shows a
ark field image made with an objective aperture covering part ofhe Al (1 1 1) diffraction spots for CM NaAlH4 + 0.1TiCl3. Measuringhe size of the resulting bright crystallites gives a size range of–20 nm (with many in the 5–10 nm range). Further evidence ofiately around the 2.30 A d-spacing for CM NaAlH4 + 0.1TiCl3. (b) Integrated electrondicating that Ti is bound as an amorphous Al1−xTix type phase after the completion
the surface morphology of the Al nano crystallites can be observedin the series of Fig. 6(b)–(f). Fig. 6(b) is an overview image showingthe area where the high-resolution image of Fig. 6(c) has beenacquired. Note that the sampling region is immediately adjacentto the powder edge. In Fig. 6(c), numerous nano crystallites ofAl can be observed embedded within an amorphous matrix.Fig. 6(d) is the filtered Fourier transformed image. Fig. 6(e) showsa filtered Fourier Transform of one of the crystalline areas inFig. 6(c), showing 〈1 1 0〉 {1 1 1} edge dislocations in the Al crystals,with some evident as dipole pairs. EDS compositional analysis ofthe area is shown in Fig. 6(f). Sampling of several areas showsa variation in Al:Ti ratio from ca. Al70Ti30 to Al50Ti50. Regionsincluding the Al nano crystals are ca. Al70Ti30, while analysisdirectly on the amorphous region indicates Al50Ti50. Based onthese observations, we can clearly state the following: The nanocrystallites are pure Al, as determined by the (1 1 1) d-spacingfrom the X-ray synchrotron data, and are immersed in a Ti richamorphous Al1−xTix matrix (0.3 < x < 0.5), as observed by X-raysynchrotron and integrated electron diffraction, high resolutionTEM images, and compositional analysis. We note also that the
average composition of ca. Al70Ti30 is close to the expected 3:1Al:Ti ratio from the initial mechanochemical reduction reactionNaAlH4 + 0.1TiCl3 → 0.7NaAlH4 + 0.3NaCl + 0.3Al + 0.1Ti + 0.6H2(g).The a-Al50Ti50 exists on an average length scale of ca. 10 nm. We
M.P. Pitt et al. / Journal of Alloys and Compounds 513 (2012) 597– 605 603
Fig. 6. (a) Dark field image made with Bragg scattered Al (1 1 1) diffraction spots, showing a ca. 2–20 nm size range for the reduced Al present immediately after milling.(b) An overview image showing the area from where the high resolution image in (c) is acquired. (c) A high-resolution image showing several nanoscopic crystallites ofAl surrounded by an amorphous Al1−xTix matrix. (d) The inverse Fourier transform image of (c). With the inelastic scattering removed, the a-Al1−xTix matrix is more easilyobserved. (e) An inverse Fourier transform image of a nano crystallite of Al in (c). The inelastic scattering is removed in the FT, and numerous 〈1 1 0〉 {1 1 1} dislocations areevident (dashed circles). (f) Local compositional EDS analysis of the area in (c), indicating that the pure amorphous region is ca. a-Al50Ti50.
6 and C
nP
tAecrtoNslafwfiAowrnfeact
4
dacTAssiciaoi
A
cpa
R
[
[
[
[
[
[
[[
[
[
[
[
[
[
[
[
[
[
[
[
[[
[
[[
[[
[
[
[
[[
[
[
[
[
[[
[
[[
[[
[[[
[[
04 M.P. Pitt et al. / Journal of Alloys
ote also that a similar strong background deviation is observed inM NaAlH4 + 0.02TiCl3, with the maxima centred at d = 2.32 A.
In metallurgical terms, our observations present as a classicwo-phase crystalline-amorphous model, commonly observed inl based amorphous phases nucleating from nanoscopic Al crystalsmbedded in an amorphous matrix [63]. In this case, the primaryrystallite of nanoscopic Al is formed by virtue of the reductioneaction and the energy imparted by milling, rather than throughhe influence of temperature. This nanoscopic Al formation processccurs due to extremely small surface area collisions between theaAlH4 powder and the TiCl3 powder grains during milling, over
urface areas as small as 4 nm2 (based on the lower limit of 2 nmength observed from our dark field images). A similar process haslso been observed and utilised in the field of mechanochemistryor the production of nanoscopic metals by reacting metal-saltsith Na, such as the reaction NiCl2 + Na, yielding an extremelyne nanoscopic (ca. 5 nm) dispersion of Ni on NaCl particles [64].fter a 1 h milling period in a conventional P7 planetary mill,r any length of time in the CM, the NaAlH4 surface is litteredith extremely fine nanoscopic crystals of Al immersed in a Ti
ich Al1−xTix (0.3 < x < 0.5) amorphous matrix that is also highlyanoscopic in extent. Nanoscopic crystalline Al1−xTix phases can be
ormed from the nano Al/a-Al50Ti50 composite by extended plan-tary milling, producing crystalline c-Al80Ti20, isothermal vacuumnnealing, producing c-Al88Ti12, isochronal annealing, producing-Al86Ti14, or H cycling, yielding c-Al85Ti15. Further discussion ofhese processes can be found in [50].
. Concluding remarks
As observed by X-ray synchrotron and integrated electroniffraction, high resolution TEM images, and compositional EDSnalysis, after the completion of the NaAlH4 + 0.1TiCl3 milling pro-ess, 〈1 1 0〉 {1 1 1} edge dislocated 2–20 nm Al is embedded in ai-rich amorphous matrix of composition ca. Al50Ti50. This nanol/a-Al50Ti50 composite is embedded on the surface of defectedingle crystalline NaAlH4 powder grains. Dark field analysis demon-trates these nano Al/a-Al50Ti50 composites are well dispersed andsolated from each other on the NaAlH4 surface. The Al/a-Al50Ti50omposite is on average only ca. 10 nm in scale, indicating that thenterfacial area between Al50Ti50 and NaAlH4 is only very small, and
limited number of Al–H bonds may be perturbed by the presencef Ti atoms, and only locally in the vicinity of the Al50Ti50/NaAlH4nterface.
cknowledgements
This project has been funded by the Norwegian Research Coun-il. MPP thanks the staff of the Swiss-Norwegian Beam Line forroviding experimental assistance and logistics during long-termttachments.
eferences
[1] K. Yvon, Chimia 52 (1998) 613–619.[2] O.M. Løvvik, S.M. Opalka, Phys. Rev. B 71 (2005) 054103.[3] B. Huang, K. Yvon, P. Fischer, J. Alloys Compd. 190 (1992) 65–68.[4] B. Bogdanovic, M. Schwickardi, J. Alloys Compd. 253–254 (1997) 1–9.[5] G. Sandrock, K. Gross, G. Thomas, J. Alloys Compd. 339 (2002) 299–308.[6] S.S. Srinivasan, H.W. Brinks, B.C. Hauback, D. Sun, C.M. Jensen, J. Alloys Compd.
377 (2004) 283–289.[7] P. Wang, C.M. Jensen, J. Phys. Chem. B 108 (2004) 15827–15829.[8] R. Cantelli, O. Palumbo, A. Paolone, C.M. Jensen, M.T. Kuba, R. Ayabe, J. Alloys
Compd. 446–447 (2007) 260–263.
[9] O. Palumbo, A. Paolone, R. Cantelli, C.M. Jensen, M. Sulic, J. Phys. Chem. B 110(2006) 9105–9111.10] O. Palumbo, R. Cantelli, A. Paolone, C.M. Jensen, S.S. Srinivasan, J. Alloys Compd.
404–406 (2005) 748–751.11] K.J. Gross, S. Guthrie, S. Takara, G. Thomas, J. Alloys Compd. 297 (2000) 270–281.
[
ompounds 513 (2012) 597– 605
12] D.D. Graham, L.F. Culnane, M. Sulic, C.M. Jensen, I.M. Robertson, J. Alloys Compd.446–447 (2007) 255–259.
13] A. Leon, O. Kircher, H. Rosner, B. Decamps, E. Leroy, M. Fichtner, A. Percheron-Guegan, J. Alloys Compd. 414 (2006) 190–203.
14] C.M. Andrei, J.C. Walmseley, H.W. Brinks, R. Holmestad, S.S. Srinivasan, C.M.Jensen, B.C. Hauback, Appl. Phys. A 80 (2005) 709–715.
15] M.T. Kuba, S.S. Eaton, C. Morales, C.M. Jensen, J. Mater. Res. 20 (2005)3265–3269.
16] T. Dobbins, M. Abrecht, Y. Uprety, K. Moore, Nanotechnology 20 (2009) 204014.17] C.P. Balde, H.A. Stil, Ad.M.J. van der Eerden, K.P. de Jong, J.H. Bitter, J. Phys. Chem.
C 111 (2007) 2797–2802.18] S. Chaudhuri, J. Graetz, A. Ignatov, J.J. Reilly, J.T. Muckerman, J. Am. Chem. Soc.
128 (2006) 11404–11415.19] M. Felderhoff, K. Klementiev, W. Grunert, B. Spliethoff, B. Tesche, J.M. Bellosta
von Colbe, B. Bogdanovic, M. Hartel, A. Pommerin, F. Schuth, C. Weidenthaler,Phys. Chem. Chem. Phys. 6 (2004) 4369–4374.
20] J. Graetz, J.J. Reilly, J. Johnson, A. Yu Ignatov, T.A. Tyson, Appl. Phys. Lett. 85(2004) 500–502.
21] A. Leon, O. Kircher, J. Rothe, M. Fichtner, J. Phys. Chem. B 108 (2004)16372–16376.
22] J.-J. Zhou, Y.-G. Chen, C.-L. Wu, Y. Xiao, T. Gao, Acta Phys. Sin. 59 (2010)7452–7457.
23] Q. Shi, J. Voss, H.S. Jacobsen, K. Lefmann, M. Zamponi, T. Vegge, J. Alloys Compd.446–447 (2007) 469–473.
24] J. Iniguez, T. Yildirim, T.J. Udovic, M. Sulic, C.M. Jensen, Phys. Rev. B 70 (2004)060101R.
25] S. Gomes, G. Renaudin, H. Hagemann, K. Yvon, M.P. Sulic, C.M. Jensen, J. AlloysCompd. 390 (2005) 305–313.
26] C. Rongeat, I.L. Jansa, S. Oswald, L. Schultz, O. Gutfleisch, Acta Mater. 57 (2009)5563–5570.
27] M. Fichtner, P. Canton, O. Kircher, A. Leon, J. Alloys Compd. 404–406 (2005)732–737.
28] A.G. Haiduc, H.A. Stil, M.A. Schwarz, P. Paulus, J.J.C. Geerlings, J. Alloys Compd.393 (2005) 252–263.
29] E.H. Majzoub, J.L. Herberg, R. Stumpf, S. Spangler, R.S. Maxwell, J. Alloys Compd.394 (2005) 265–270.
30] E.H. Majzoub, K.J. Gross, J. Alloys Compd. 356–357 (2003) 363–367.31] E.H. Majzoub, R. Stumpf, S. Spangler, J. Herberg, R. Maxwell, Mater. Res. Soc.
Symp. Proc. 801 (2003) 153–158.32] C. Weidenthaler, A. Pommerin, M. Felderhoff, B. Bogdanovic, F. Schuth, Phys.
Chem. Chem. Phys. 5 (2003) 5149–5153.33] K.J. Gross, G. Sandrock, G.J. Thomas, J. Alloys Compd. 330–332 (2002) 691–695.34] S. Singh, S.W.H. Eijt, J. Huot, W.A. Kockelmann, M. Wagemaker, F.M. Mulder,
Acta Mater. 55 (2007) 5549–5557.35] V. Ozolins, E.H. Majzoub, T.J. Udovic, J. Alloys Compd. 375 (2004) 1–10.36] H.W. Brinks, C.M. Jensen, S.S. Srinivasan, B.C. Hauback, D. Blanchard, K. Murphy,
J. Alloys Compd. 376 (2004) 215–221.37] H.W. Brinks, B.C. Hauback, S.S. Srinivasan, C.M. Jensen, J. Phys. Chem. B 109
(2005) 15780–15785.38] R. Kadono, K. Shimomura, K.H. Satoh, S. Takeshita, A. Koda, K. Nishiyama, E.
Akiba, R.M. Ayabe, M. Kuba, C.M. Jensen, Phys. Rev. Lett. 100 (2008) 026401.39] M.H.W. Verkuijlen, P.J.M. van Bentum, E.R.H. van Eck, W. Lohstroh, M. Fichtner,
A.P.M. Kentgens, J. Phys. Chem. C 113 (2009) 15467–15472.40] J.L. Herberg, R.S. Maxwell, E.H. Majzoub, J. Alloys Compd. 417 (2006) 39–44.41] G. Majer, E. Stanik, L.E. Valiente Banuet, F. Grinberg, O. Kircher, M. Fichtner, J.
Alloys Compd. 404–406 (2005) 738–742.42] J.L. Herberg, R.S. Maxwell, E.H. Majzoub, Mater. Res. Soc. Symp. Proc. 801 (2003)
147–152.43] A. Borgschulte, A. Zuttel, P. Hug, G. Barkhordarian, N. Eigen, M. Dornheim, R.
Bormann, A.J. Ramirez-Cuesta, Phys. Chem. Chem. Phys. 10 (2008) 4045–4055.44] R. Domenech-Ferrer, F. Zeigs, S. Klod, I. Lindemann, R. Voigtlander, L. Dunsch,
O. Gutfleisch, Anal. Chem. 83 (2011) 3199–3204.45] T.A. Dobbins, E.L. Bruster, E.U. Oteri, J. Ilavsky, J. Alloys Compd. 446–447 (2007)
248–254.46] S.D. Beattie, G.S. McGrady, Int. J. Hydrogen Energy 34 (2009) 9151–9156.47] S. NareseGowda, S.A. Gold, J. Ilavsky, T.A. Dobbins, Ceram. Trans. 224 (2011)
51–59.48] A. Leon, O. Kircher, M. Fichtner, J. Rothe, D. Schild, J. Phys. Chem. B 110 (2006)
1192–1200.49] A. Leon, D. Schild, M. Fichtner, J. Alloys Compd. 404–406 (2005) 766–770.50] M.P. Pitt, P.E. Vullum, M.H. Sørby, M.P. Sulic, C.M. Jensen, J.C. Walmsley, R.
Holmestad, B.C. Hauback, Acta Mater. 56 (2008) 4691–4701.51] S.F. Parker, Coord. Chem. Rev. 254 (2010) 215–234.52] J.M. Bellosta von Colbe, W. Schmidt, M. Felderhoff, B. Bogdonavic, F. Schuth,
Angew. Chem. Int. Ed. 45 (2006) 3663–3665.53] C. Qiu, S.M. Opalka, O.M. Løvvik, G.B. Olson, CALPHAD 32 (2008) 624–636.54] J.L. Labar, Ultramicroscopy 103 (2005) 237–249.55] P.E. Vullum, M.P. Pitt, J.C. Walmsley, B.C. Hauback, R. Homestad, J. Alloys Compd.
509 (2011) 281–289.56] B.A. Hunter, Commission on Powder Diffraction Newsletter 20 (1998) 21.57] N. Armstrong, W. Kalceff, J.P. Cline, J. Bonevich, Diffraction analysis of the
microstructure of materials, in: E.J. Mittemeijer, P. Scardi (Eds.), Springer Seriesin Materials Science, Springer-Verlag, Berlin, 2004, pp. 187–227.
58] Y. Wang, Y.Z. Fang, T. Kikegawa, C. Lathe, K. Saksl, H. Franz, J.R. Schnei-der, L. Gerward, F.M. Wu, J.F. Liu, J.Z. Jiang, Phys. Rev. Lett. 95 (2005)155501.

and C
[
[
M.P. Pitt et al. / Journal of Alloys
59] T. Itsukaichi, K. Masuyama, M. Umemoto, I. Okane, J.G. Cabanas-Moreno, J.Mater. Res. 8 (1993) 1817–1828.
60] M. Oehring, Z.H. Yan, T. Klassen, R. Bormann, Phys. Stat. Sol. A 131 (1992)671–689.
[[[[
ompounds 513 (2012) 597– 605 605
61] H. Kimura, K. Sasamori, A. Inoue, Mater. Trans. JIM 39 (1998) 773–777.62] D.E. Mencer Jr., D.G. Naugle, D.L. Cocke, Appl. Phys. Commun. 11 (1992) 7–18.63] J.H. Perepezko, R.J. Hebert, J. Met. 54 (2002) 34–39.64] T. Tsuzuki, P.G. McCormick, J. Mater. Sci. 39 (2004) 5143–5146.