The Land Use Change Identification and Analysis (LUCIA) System: A Tool for Supporting Quantitative...
40
Paper 1. The Land Use Change Identification and Analysis (LUCIA) System: A Tool for Supporting Quantitative Plan Evaluation Abstract Over the past two decades Planning Support Systems (PSS) and related tools have steadily evolved from a narrow focus on land use forecasting and simulation to much broader endeavors. The majority of this work, however, remains focused on the process of plan creation and evalu- ation of potential alternatives. A similar trend is evident in the planning evaluation literature, in which ex ante evaluation (forecasting and scenario planning) dominates while efforts to mea- sure the ongoing performance and the ultimate efficacy of plans (ex post evaluation) languishes. This research seeks to address both these gaps by providing a general framework for developing a toolbox-type PSS aimed at identifying, measuring and analyzing past land use changes at the parcel level. Termed a Land Use Change Identification and Analysis (LUCIA) system, its applicability is shown via an example evaluation of housing unit growth targets in one of the City of Seattle’s Urban Villages. Introduction The gathering, storing, analysis and interpretation of information is fundamental to the planning process (Branch 1998). Information in its various forms is used by the planner for multiple activities including, but not limited to, plan creation, plan enforcement, plan evaluation, and, 1
Transcript of The Land Use Change Identification and Analysis (LUCIA) System: A Tool for Supporting Quantitative...
Paper 1. The Land Use Change Identification and Analysis
(LUCIA) System: A Tool for Supporting Quantitative Plan
Evaluation
Abstract
Over the past two decades Planning Support Systems (PSS) and related tools have steadily
evolved from a narrow focus on land use forecasting and simulation to much broader endeavors.
The majority of this work, however, remains focused on the process of plan creation and evalu-
ation of potential alternatives. A similar trend is evident in the planning evaluation literature,
in which ex ante evaluation (forecasting and scenario planning) dominates while efforts to mea-
sure the ongoing performance and the ultimate efficacy of plans (ex post evaluation) languishes.
This research seeks to address both these gaps by providing a general framework for developing
a toolbox-type PSS aimed at identifying, measuring and analyzing past land use changes at
the parcel level. Termed a Land Use Change Identification and Analysis (LUCIA) system, its
applicability is shown via an example evaluation of housing unit growth targets in one of the
City of Seattle’s Urban Villages.
Introduction
The gathering, storing, analysis and interpretation of information is fundamental to the planning
process (Branch 1998). Information in its various forms is used by the planner for multiple
activities including, but not limited to, plan creation, plan enforcement, plan evaluation, and,
1
increasingly, communication with stakeholders and the public at large. As the availability,
sheer volume and demand for increasingly complex information has steadily grown a number
of technological innovations have permeated the everyday activities of planning professionals.
Geographic Information Systems (GIS) present the most important and ubiquitous change to
the way that planners manage spatially referenced data and information. Other internet-based
advances such as open data sources, collaborative planning software and crowd-sourcing have
also increased the flow of information both to and from planning organizations. One particular
set of information frameworks that have arisen to address the specific needs of planners are
Planning Support Systems (PSS) (Klosterman 1997; Geertman & Stillwell 2003).
This recent influx of information and the technological capabilities to manage it offer an in-
credible opportunity to enhance all facets of the urban planning process. While the ability to
forecast and simulate future land use and transportation patterns have grown incredibly over
the last 20 years (Klosterman 1999; Waddell 2002; Gaunt & Jackson 2003; Sun et al. 2009),
similar improvements in the ability to accurately monitor and evaluate the outcomes of plan
implementation (ex post evaluation) have been much more modest. In fact, the literature on
plan monitoring and ex post evaluation suggests that the lack of necessary information remains
one of causes of the failure to evaluate plans (Seasons 2003; Laurian et al. 2010). In this paper, I
address this shortfall by presenting a highly flexible method (a toolbox-type PSS) for providing
planners with land use change data that can be used to evaluate a subset of common urban
planning objectives and, ideally, further the capacity of plan monitoring and ex post evaluation.
This paper begins by discussing the definition, evolution and current state of Planning Support
Systems (PSS). Next, I present a brief overview of plan evaluation and monitoring centered
around quantitative, ex post evaluation. The third section of the paper describes a generalizable
information framework for identifying, measuring, analyzing and visualizing land use change at
the parcel level, with a particular focus on use for plan evaluation. Here I present a system that
tracks changes to urban form across a number of dimensions including: 1) parcel geometry (lot
splits, lot combinations, etc); 2) land use (apartment, condominium, retail, etc.); 3) structural
2
size and density (building square foot, number of living units, etc.); and 4) change process (new
development, conversion, etc.). To demonstrate the applicability of this tool, termed a Land
Use Change Identification and Analysis (LUCIA) system, I conclude the paper with an example
analysis of housing unit changes in one of the City of Seattle’s Urban Villages.
Background
Planning Support Systems (PSS)
The term “Planning Support System” can trace its beginning back to an Urban and Regional
Information Systems Association (URISA) conference in the late 1980s (Batty 2003). Harris
(1989) was the first to add this term to the lexicon of urban planning literature. Since that
time, research and development of Planning Support Systems (PSS) has grown rapidly, including
dozens of scholarly articles and four edited volumes dedicated to the topic (Brail & Klosterman
2001; Geertman & Stillwell 2003; Brail 2008; and Geertman & Stillwell 2009).
Throughout the development and expansion of PSS, its exact definition has evolved. Early
efforts to define PSS focused on all-encompassing systems in which complex models, such as
spatial equilibrium, cellular automata and other simulation and forecasting systems, served as
the central feature (Harris 1989; Densham 1991; Kammeier 1999). Many of these holistic models
have been developed, thoroughly described in the academic literature and successfully employed
in planning practice. A decade ago, a review study conducted by the U.S. Environmental
Protection Agency (EPA) found more than 20 of these large land use/transportation forecasting
models in existence (Gaunt & Jackson 2003). Some of the most common are UrbanSim (Waddell
2002), WhatIf? (Klosterman 1999), LEAM (Sun et al 2009; Deal & Pallathucheril 2009) and
SLEUTH (Silva & Clarke 2002). These large, complex modeling systems remain the most
common form of PSS discussed in the academic literature.
Although land use and transportation forecasting models remain the dominant form of PSS,
3
the breadth of what constitutes a PSS has slowly expanded over time to include models and
systems aimed at other planning functions. Examples include research and development on
PSS for public participation in planning (Geertman 2002; Snyder 2003; Khaila & Kytta 2009),
ecological and environmental modeling (Bonfatti et al. 2003; Besio & Quadrelli 2009) as well as
more specialized pursuits aimed at tourism (Johnson & Sieber 2009) and motor vehicle safety
(Levine 2009). In short, the collection of PSS in the literature is expanding in scope from its
initial and narrowly defined parameters.
There are two unifying components of all Planning Support Systems. The first is the ability to
improve the information handling of a particular set or sets of data used in the planning process
(Geertman & Stillwell 2009). The second unifying component is that all PSS are developed and
used to address a particular planning task or collection of tasks. This focus on the planning
process – often described as a rational, forward-looking activity (Klosterman 2009) – is a key
component of what separates PSS from a more simplified and generalized GIS (Geertman &
Stillwell 2003). Under these very generic boundaries, a wide variety of models and related
systems fall into this domain. In fact, as Geertman and Stillwell (2003) note, PSS may vary
based on their goals, aims, functional capabilities, content, structure, technology and look and
feel.
Task and technique are two particularly useful dimensions over which to classify PSS. (Kloster-
man & Pettit 2005). Task refers to the specific planning question, problem or objective that
is being addressed by the PSS. Technique, on the other hand, describes the manner in which
the PSS gathers or process data to transforms it into usable information in the planning pro-
cess. Categorization along these lines can help bring order to the rapidly expanding universe of
Planning Support Systems.
PSS tasks can range from grandiose – forecasting future development patterns – to very utili-
tarian – aiding in aggregating public responses – to everything in between. It is the task and
the available data and computing environment that determine the ultimate design or technique
that the system will use. In terms of technique, most of the large, complex modeling systems
4
such as UrbanSIM, WhatIf? and others are developed around simulation methods that use
either agent-based modeling or cellular automata to produce forecasts. These forecasts often
consist of population, employment or land use change estimates and are aggregated at various
geographic levels from individual parcels to census block groups and up to larger areas such as
traffic analysis zones (TAZ) or forecast analysis zones (FAZ). Systems utilizing cellular automata
usually produce forecasts for equally-sized and spaced raster or grid areas, the spatial scale of
which vary by the model’s computational power and underying data resolution. Other simpler
PSS may analyze and/or visualize existing datasets for collaboration and visioning purposes,
compile inputs from various stakeholders into a database or create very specialized spatial and
non-spatial estimates and forecasts depending on the specific task of the PSS.
PSS and the Practitioner
Despite the great promise that PSS hold for the planning practice and the extensive resources
applied toward developing PSS in academic circles, the actual adoption of planning support
systems by practitioners remains sporadic. To examine the under-utilization of PSS, Geertman
and Stillwell (2009) have developed a three-fold approach. In this approach, the relationship of
PSS to potential users is examined based on the instruments in the PSS (instrument approach),
the user’s specific characteristics (user approach) and method of information diffusion regarding
the PSS itself (transfer approach). They find evidence in the literature suggesting that PSS
suffer from deficiencies across all three approaches.
Empircal research directed at assessing causes for the limited use of PSS have found a number
of key “bottlenecks” to the adoption of PSS (Vonk et al. 2005). These include poor awareness
of the existence of usable systems, insufficient experience with these systems and overall lack of
intention to use such systems (Vonk et al. 2005). From this work conducted in the Netherlands,
it appears that planners either are not aware of PSS or are hesitant due to limitations (real or
perceived) in their ability to properly use them. These findings support Geertman and Stillwell’s
consideration of both transfer and user approaches to examine hurdles in the adoption of PSS.
5
Additional survey research in this direction has identified the desire for more transparency in the
PSS inputs, outputs and models, more user-friendliness and more flexibility in the PSS design.
These user demands are critical hurdles to implementation created by the PSS instruments
themselves (Broemmelstroet 2010).
Overall, the majority of resources aimed at developing and maintaining PSS are focused on
large-scale, complex models used to forecast and simulate land use and transportation out-
comes. Incredible progress in the development of these models has been achieved, however,
their diffusion to practicing planners has proven difficult. Surveys of practitioners suggest that
planners actually desire less complex, more transparent and more easy to use systems. Simply
put, urban growth and change is a very complex phenomena for which researchers and devel-
opers have created equally complex models to explain this process. The complexity of these
large-scale is, therefore, unavoidable. Practicing planners, who operate under constant resource
and political constraints (Seasons 2003), may recognize and appreciate this complexity, how-
ever, the demands of their position often require more practical and pragmatic tools to improve
their daily work. What the reflective research on PSS adoption suggests is that more research
and development aimed at smaller, toolbox-type PSS (Batty 2003) could help bridge the gap
between the development and ultimate implementation and daily use of Planning Support Sys-
tems. In no way are these toolbox-type systems a replacement for the large-scale models, but
rather should be seen as a compliment to these existing, complex PSS.
Evaluation of Urban Planning Policies
The evaluation of existing policies forms a key component of the urban planning process (Branch
1998). In fact, as Alexander and Faludi (1989) suggest, the very credibility of the entire profes-
sion rests on the ability to properly measure the effectiveness of the planning process. Regret-
tably, however, research on plan evaluation finds that thorough ex post plan evaluation is the
exception and not the rule in general practice (Calkins 1979; Talen 1996; Seasons 2003; Laurian
et al. 2010). This section explores the issue of plan evaluation and its deficiencies.
6
As there is no one type of urban plan, there is also no one type of plan evaluation. Evaluation
can vary over a number of metrics or characteristics. First, plan evaluation can occur during
the planning process (ex ante), while the plan is being carried out (plan monitoring) or after
the completion of the plan (ex post)1 (Talen 1996; Baer 1997). Depending on the point in
the process at which the evaluation occurs, the method(s) of evaluation will differ. In an ideal
situation, evaluation criteria are developed contemporaneously with the plan itself (Kaiser et
al. 1995; Oliveira & Pinho 2010), though often in practice plans are evaluated based on criteria
developed at a later time and/or are evaluated by individuals or groups not involved in the
original plan creation process.
Ex ante evaluation is the most common form of plan evaluation. A major component of ex ante
evaluation involves the comparison of a number of forecasts or scenarios to determine which ones
support larger goals and objectives. This form of evaluation also occurs when local government
planners must gauge the direct compliance of their plans to broader state or federal requirements.
Conversely, the on-going monitoring and the ex post evaluation of plans receive much less
attention in general planning practice (Oliviera & Pinho 2010). There are number of reasons
cited to explain this shortcoming. The most common include the lack of resources – monetary
and time – to do so, insufficient skills and data (Talen 1996) as well as organizational cultures
that do not place an emphasis on evaluation (Seasons 2003). Calkins (1979) goes so far as
to suggest that because proper ex post planning evaluation can bring accountability, certain
agencies are disincentivized to undertake evaluation in order to avoid scrutiny.
As with any kind of evaluation, the choice of metrics or indicators is important. Indicators may
be large aggregate metrics, somewhat moderately aggegated or finely dissagregagted (Oliveira &
Pinho 2010). The type of indicator(s) used in planning evaluation should ideally be tailored to
the plan itself (Branch 1998). For instance, quantitative measures are only truly meaningful for
plans that have goals and objectives that are measurable in a numeric fashion. Less quantifiable
plans will require a qualitative, contextual approach to evaluation. In developing an evaluation
1This may also be referred to a “post-hoc” or “retrospective” evaluation (Waldner 2004)
7
method or metric, consideration should also be given to the credibility of the potential results,
the feasibility given available resources and the level to which the results will be understood by
parties not directly involved in the evaluation process (Kaiser et al. 1995).
Finally, plans can also be measured based on their performance or conformance. Plan perfor-
mance is measured by how well the plan operates as a guiding set of regulations and policies.
This type of evaluation examines the output of the planning process – the plan itself – to judge if
the plan is indeed functioning as envisioned (Laurian et al. 2010). Measuring plan performance
can also involve a larger, more normative assessment in which the plan is examined to determine
if it has bettered the community or not (Waldner 2004). Due to the inherent subjectivity of this
type of performance-based analysis results can be difficult to reach and/or compare across time
and space.
Conformance, on the other hand, examines the outcome(s) of the plan to see if it matches the
goals and objectives originally desired (Oliveira & Pinho 2010). For instance, if a plan has the
objective of adding X number of affordable housing units in area Y over time period Z, then a
measure of the actual growth in units over that time could be used to the judge the conformance
of the actual results to the intended outcomes. Like indicators, the choice of a performance-
or conformance-based measure (or some combination of the two) depends on the type of plan
being evaluated.
In sum, the planning evaluation literature agrees on two things. First, ex post planning eval-
uation, while incredibly important to the overall process, is notoriously lacking in everyday
practice. And, second, plan evaluation methods and metrics need to be designed specifically for
the plan being evaluated and should be carried out before, during and after plan implementation.
An Opportunity for PSS
Planning has ridden a wave of changes in governing theory and paradigms shifts since the
mid-1950s. From hyper-rational planning of the 1950s and 60s to the backlash and focus on
8
communication in the 70s and 80s, to a time of fragmentation and specialization more recently,
the direction of planning has never been clear (Geertman 2006). In a hopeful call to arms, Beau-
regard (1990) suggests that planners could regain relevance by focusing their efforts around a
better understanding of the physical city building process and the relationships and mechanisms
that drive it. Twenty years later, Oliveira and Pinho (2010) report that such a change is occur-
ring and that urban form is again becoming the focus of the planning profession. At the same
time, governments have, for better or worse, adopted the corporate model of fiscal management
in which all spending and resource use must be validated by concrete evidence of efficacy and
cost-effectiveness (Seasons 2003). In such an environment, thorough and comprehensive plan-
ning evaluation can go a long way in validating the planning profession and ensuring that the
necessary resources are continually available in order to properly shape our collective futures.
Overall on-going monitoring and ex post plan evaluation is lacking in every-day practice. Inter-
estingly, a survey of the Planning Support System literature finds that most of the energy and
resources are put towards simulation or forecasting studies and/or systems aimed at facilitating
public input; both activities which commonly fall under the ex ante evaluation typology. Given
these gaps in the current work, an opportunity for PSS exists in aiding planners with on-going
plan monitoring and the ex post evaluation of plans.
Many urban plans, goals and objectives call for specific quantitative changes in terms of land
use, however, most metrics used to measure the conformance of these plans are available at
spatial and temporal scales insufficient for quality evaluation. As a result, the purpose of the
methodology presented in this paper is to develop a toolbox-like Planning Support System that
can provide planners with a wide variety of information regarding past changes to land use in
their jurisdictions. This research provides a flexible PSS able to generate and visualize land use
changes for any given spatial extent over any given time frame across a number of dimensions,
such as use type, quantity of change and type of change process. The remainder of this paper
outlines a general framework, termed the Land Use Change Identification and Analysis (LUCIA)
system, for doing so and provides an example using data from the City of Seattle.
9
Methodology
There are essentially two unavoidable hurdles in any attempt to create a widely generalizable
methodology for measuring land use change. First, data availability, quality and specific col-
lection and recording methods vary widely across planning jurisdictions, meaning that specific
models developed in one area may not necessarily translate well to others. In other words, the
external validity of any given solution to this problem may be quite limited. Second, urban
planning policies often have numerous goals and objectives that can rarely be characterized by
a single set of indicators or data. I begin this section by outlining how this research addresses
these two concerns. Afterwords, a discussion of the general framework, the data requirements
and the specific analytical steps of the LUCIA system is presented.
Data Integrity and External Validity
Although geographic information systems (GIS) are decades old and data computation and
storage is incredibly cheap, data quality and availability issues still exist. Within the U.S.,
most major metropolitan areas have well-developed GIS data at the parcel level as well as
relevant property information (generally from county assessor’s offices) that can be linked to
individual parcels. This parcel level data usually includes, at a minimum, information on land
use designation, lot size and a variety of data on the structural characteristics of the property.
Moving to smaller and more rural jurisdictions, availability and resource constraints (lack of
expensive GIS software) may inhibit the data collection exercises necessary to maintain accurate
and up-to-date spatial datasets.
In developing a toolbox-type PSS that can be used across multiple jurisdictions, a bigger issue
is the conformity of data collection and storage processes. In most U.S. states (Maryland and
Florida as exceptions) there is no central depository of parcel-level data and data storage schema
may vary at the county or municipality level. Within the U.S. context, a national level parcel
database has been proposed and the feasibility of doing so examined (U.S. Dept of H.U.D. 2013)
10
but the closest thing to its realization has been the development of extensive and proprietary
databases by commercial vendors such as CoreLogic and DataQuick.2 Outside of the U.S. a
number of countries, including Australia, Belgium, Germany and South Korea have developed
functional national level parcel databases (Schutzberg 2008).
Differences in data collection and storage schematics can create considerable headaches for local
planners hoping to adapt an existing PSS to their particular jurisdiction or area of study. To
address this, the Land Use Change Identification and Analysis (LUCIA) system developed in
this paper is presented as a broad framework or process that can be adapted to the particular
local level. To enhance the external validity of the method, the LUCIA system uses a set of
basic data fields and structures that are widely available across counties in the United States and
in developed nations around the world. Using basic, ubiquitous data fields limits the necessity
for additional data collection, a process that can be expensive and time consuming. Further,
the example LUCIA system presented here is developed using R3 and GEOS4, two open source
software platforms capable of advanced statistical and geo-spatial analysis as well as two- and
three-dimensional mapping. Developing the LUCIA system with open source software commonly
used across a wide variety of academic disciplines illustrates the flexibility and accessibility of
the LUCIA framework.
Quantitative Focus
The myriad of potential evaluation indicators makes creating a unified quantitative evaluation
framework a difficult exercise, or perhaps even an impossible or undesirable one. As Laurian
et al. (2010) suggest, a comprehensive evaluation plan should contain theoretical, quantitative
and qualitative components. The research presented here focuses on providing a support tool
for generating the data that is likely to be necessary in the quantitative/analytical portion of
a hypothetical holistic evaluation framework. As there are many potential data to collect and
2For an example, see CoreLogic’s ParcelPoint product at www.corelogic.com/products/parcelpoint.aspx3The R Project for Statistical Computing. See www.r-project.org for more information4Geometry Engine: Open Source. See http://trac.osgeo.org/geos/ for more information
11
analyze, the question necessarily arises reqarding what data are needed and how a planning
support system can best provide these data.
As Beauregard (1990) suggests, the central, unifying thread of planning’s many sub-disciplines
is the city-building process. Recognizing this, the process I develop here focuses on identifying
and analyzing changes to the physical urban form of the city over time at the finest spatial
scale, the property lot or parcel. By doing so, this process allows users to answer a number of
questions regarding changes to the physical structure of the city. To be most useful, this process
is flexible both spatially and temporally, as well as able to provide more than counts of housing
units or construction permits, for example. A complete list of the goals of the LUCIA system
are to:
• Provide analysis at the elemental or parcel level
• Provide analysis over any user defined spatial extent
• Provide analysis over a variety of temporal extents
• Provide analysis over multiple dimensions of land use change
• Output raw data for further analysis
• Output a set of simple analytical tables based on user demands
• Allow for two- and three-dimensional visualization of the data
In short, the goal is to develop a toolbox-type PSS that can answer the question:
“What changes to the built environment occurred in area X over time period Y
broken down by category(s)/characteristic(s) Z?”,
where X is any spatial extent (within the jurisdiction in question), Y is any time period (within
the bounds of the available data) and Z is a set of dimensions such as land use type, change type
and actual physical characteristics. An example of such a question might be: How many existing
single family homes were converted to multi-family dwellings in the Oak Park neighborhood
12
from 2005 to 2009? A secondary objective of this system is to produce flexible data analysis
and visualization outputs.
Using the terminology of Klosterman and Pettit (2005), it is helpful to define the task and
the technique of the LUCIA system. The central task is to provide parcel level information on
land use changes in a flexible, yet highly detailed manner. The basic technique of the LUCIA
system is one of data aggregation, data analysis and geospatial visualization of existing land use
changes. This is primarily a descriptive exercise. The LUCIA instance developed in this paper
is designed specifically for ex post plan evaluation, but other related planning functions could
benefit from the products of the LUCIA system as well.
In the remainder of this paper I presents an overivew of the LUCIA system. In terms of the
existing literature on planning support systems, the LUCIA system expands on the parcel-based
GIS models (PBGIS) currently developed in order to provide more flexibility and user-controlled
analysis and visualization (Moudon & Hubner 2000). It is not intended to be an all-encompassing
forecasting model, but rather a small, transparent and intuitive tool aimed at converting existing
data into useful information on past land use changes. Within the planning evaluation framework
(Laurian et al. 2010), this system is an atheoretical tool focused on creating the information
necessary to answer existing questions as well as to provide the stimulus to generate more focused
future inquiries.
General Model Overview
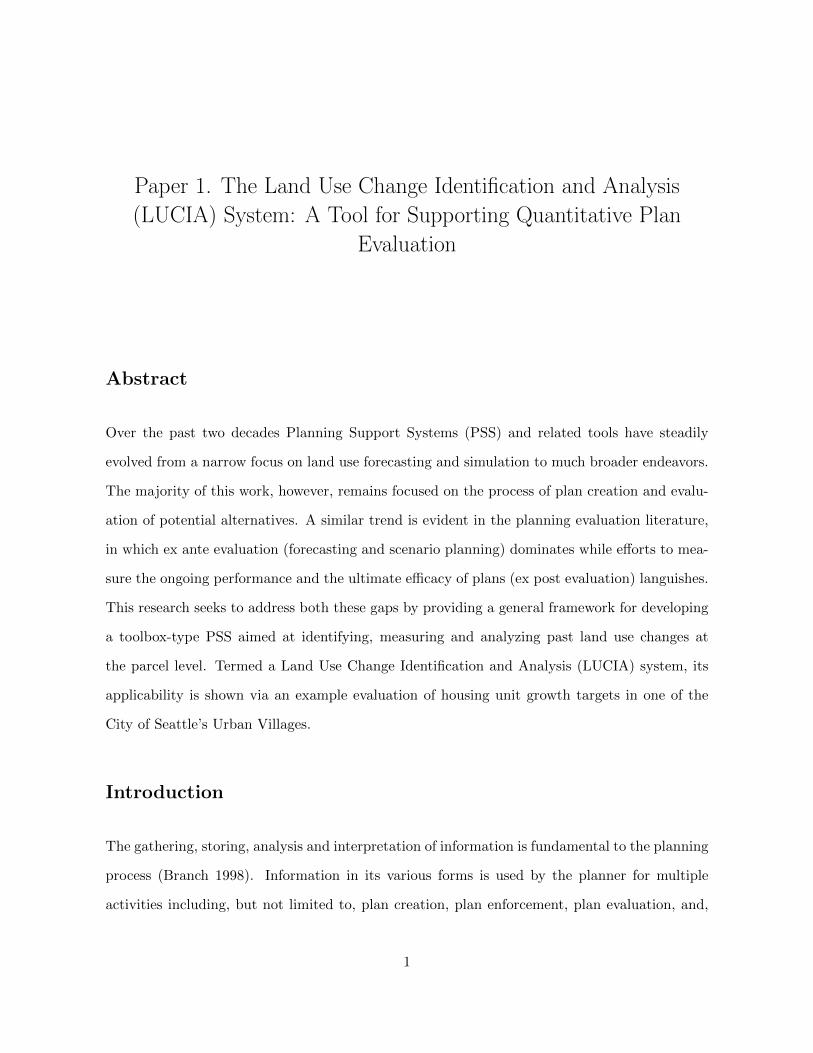
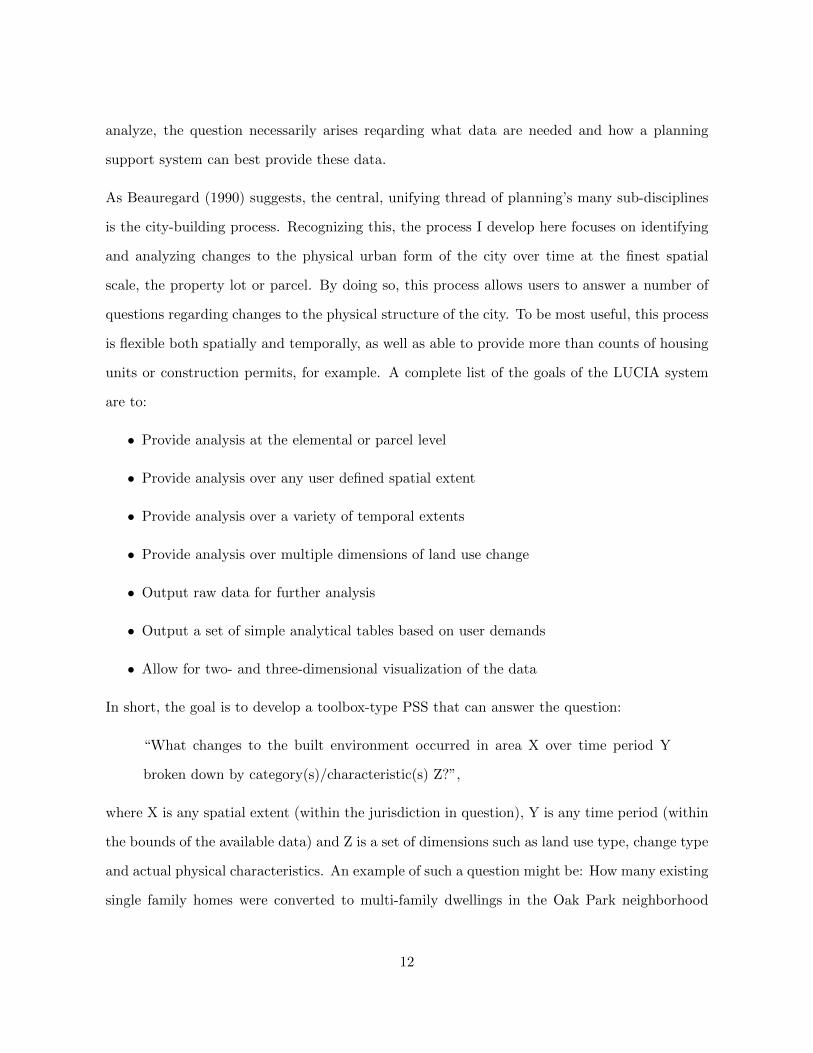
Figure 1 shows a general overview of the LUCIA system. The remainder of this section discusses
the functionality of each of the individual components. In discussing the LUCIA system, I refer
to a hypothetical user-defined spatial extent, X, and temporal extent, Y. An example would be
a given neighborhood or special planning zone (X) and a given time frame of interest (Y), say,
2005 to 2009. These two inputs to the model are shown in the upper right hand corner of Figure
1.
13
Figure 1: LUCIA Process Overview
Data
As noted above, data quality, availability and congruency all present problems when attempting
to utilize an existing PSS or other urban model in a new jurisdiction or study area. The
LUCIA system described in this paper seeks to limit these issues by relying on a standard set of
data types and fields commonly found in jurisdictions across the U.S. and abroad. This use of
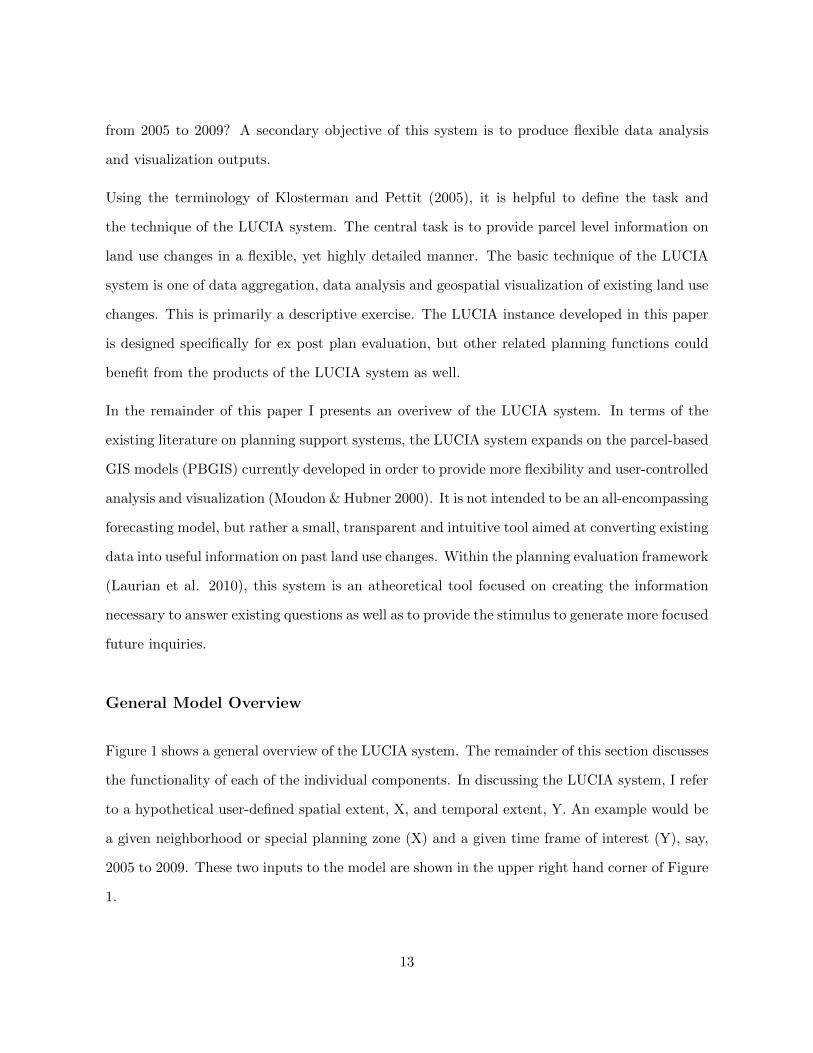
ubiquitous data greatly increases the transferability of the system. The specific data required
are listed in Table 1 and discussed more fully below. Some data objects are required for the
LUCIA system to function, others are optional and help create improved data resolution or
more options for analytical and visual output. These data enter the general LUCIA framework
as inputs in the upper left portion of Figure 1 under the “Beginning Period Data”, “End Period
Data” and “Intervening Period(s) Data” items.
14
Table 1: LUCIA Data Requirements
Data Description Importance Type
Parcel Level GIS Polygons with PIN5 Required Spatial
Land Use Classification Required Tabular
Lot Size Required Tabular6
Structural Size Required Tabular
Structural Year Built Required Tabular
Number of Living/Commercial Units Required Tabular
Structural Footprint Optional Spatial
Structural Number of Stories Optional Tabular
Zoning Optional Tabular/Spatial
• Parcel GIS Polygons: Polygons of individual parcels (property tax lots) form the base
spatial dataset of the LUCIA system. These parcel polygons are overlaid and spatially
joined via the process introduced in step 1 below. The tabular data attached to the spatial
polygons requires only a single parcel identification number field (PIN) that can be linked
to the subsequent tabular data that follows. The usual considerations of spatial GIS data,
such as projection and coordinate systems, apply here as well.
• Land Use Classifications: Each parcel in the study area (X) must have a land use designa-
tion for both the beginning and the end period. Ideally, these classifications will arise from
the same typological system. If not, conversions need to be made. Classification systems
can be as aggregate or as finely disaggregate as the user desires.
• Lot Sizes: Parcel lot size measurements are helpful in tracking parcel geometry changes.
This data can be provided in a tabular format or calculated directly using the parcel
polygon file(s).
• Structure Size: A measure of the structural size of any building on the property is a
5Parcel Identification Number6This may be calculated from the GIS file
15
necessary input for the LUCIA system.
• Structure Year Built: A variable indicating when a structure(s), if any, was built is also
required.
• Number of Living/Commercial Units: To analyze changes in the density of use for a given
parcel, the number of functional living or leaseable (in the case of commercial uses) units
is required.
• Structure Footprint: Spatial data indicating the structural footprint of the building on
the individual parcels is a desired, but optional, data source for the LUCIA system. In
the absence of this data, floor-to-area ratios (FARs) can be used to approximate building
bulk in the two- and three-dimensional visualizations.
• Structure Number of Stories: Structural height or an indicator of the number of stories of
the structure, if any, is a useful data point for the three-dimensional visualization process.
This field is not required as a value can be roughly approximated based on total square
foot and lot size.
• Zoning Classification: Zoning classifications are also an optional input to the LUCIA
system. Zoning classifications allow for additional analysis and visualization but is not
required.
At a minimum, each of the necessary data fields are required from the beginning and the end
time period. In our example using time period Y, this would require data from both 2005 and
2009. The intervening period data are an optional data source that can improve the accuracy
of the LUCIA system, especially in terms of assigning exact time stamps to various land use
changes. For example, if a structure was converted from a single family residence to a multi-
family rental unit, intervening period data can help pinpoint the exact time that change took
place. In the case of new buildings, the year built variable will usually be able to locate the
identified change in time. Again, the intervening year data are optional.
16
Step 1: Track Parcel Geometry
The first step in identifying changes to urban land use is to track changes in parcel geometry over
time. There are two central reasons for doing so. First, if parcel numbering systems and parcel
boundaries were completely static, this step would be unnecessary. They are not, and in the
case of changing urban land use parcels that undergo changes to their geometry are more likely
to also see changes to their land use. In other words, instances of parcel boundary changes are
indicators of growth and change. In order to properly measure changes over time, the LUCIA
system must make a direct comparison between what used to exist on a given spatial geometry
and what currently exists.
A second reason for tracking changes to parcel boundaries is the fact that parcelization structures
can determine the type of land use changes that are possible and/or more likely to occur in a
given area. For example, an existing neighborhood composed primarily of small 5,000 square
foot lots that are individually owned will present problems to developers looking to build large
apartment, condominium or retail/office structures since lot assemblage (plottage) can be a
time consuming and expensive process. On the other hand, converting an area of large lot
industrial parcels to densely developed townhomes may prove more difficult due to the lack of
existing right-of-ways and other costs associated with land subdivision. Parcelization may, in
part, guide future development and understanding and tracking its relationship to past changes
is one of the useful data products that can be generated by the LUCIA system.
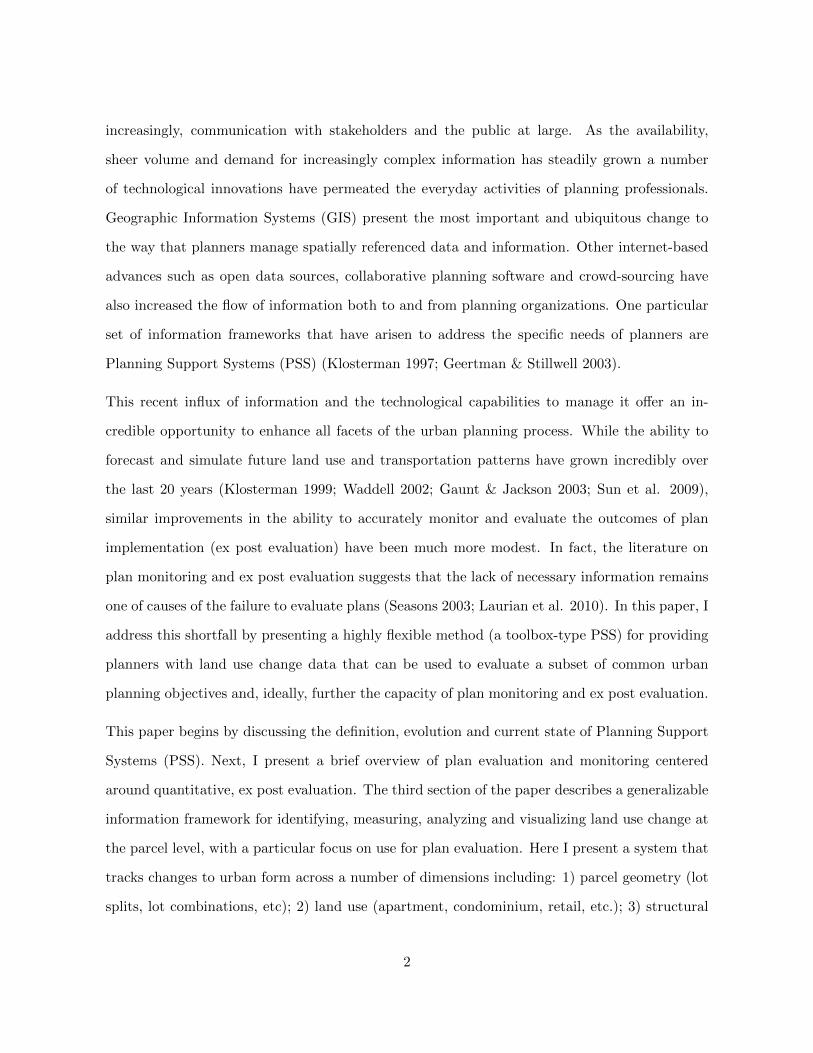
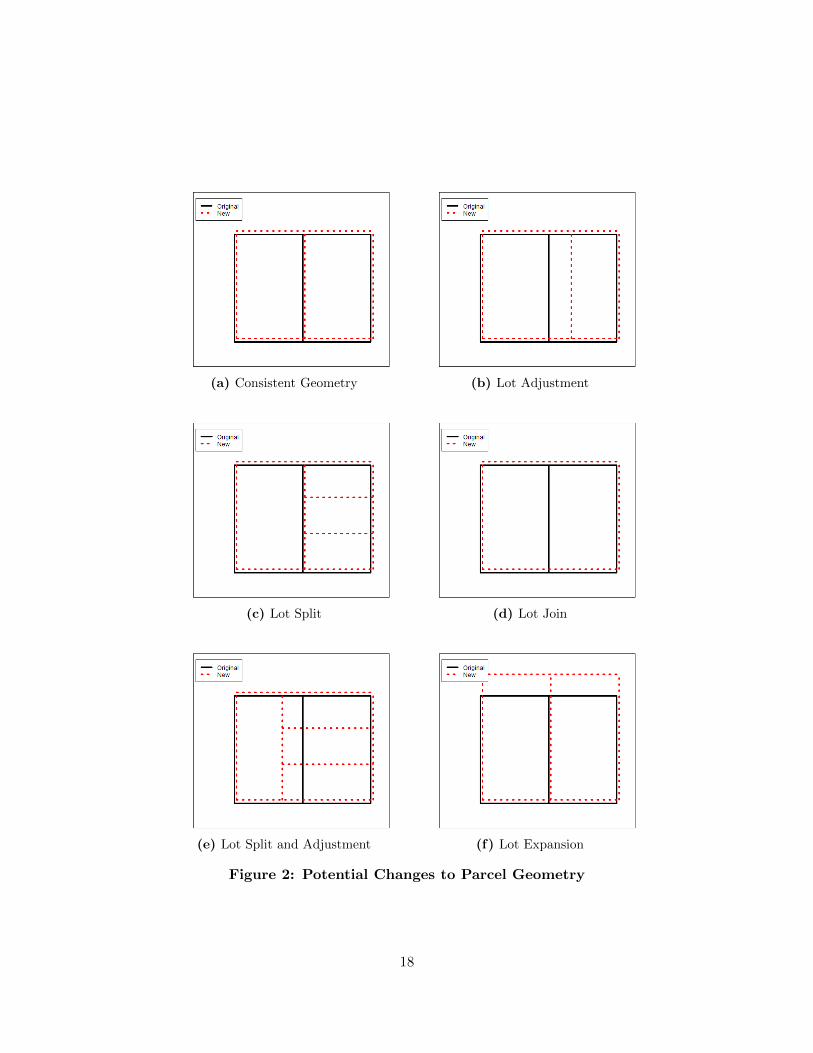
Changes to parcel geometry over time can take many forms. Six of the most common are shown
in Figure 2 and discussed below. In Figure 2, black, solid boundaries represent the original
parcel boundaries at the beginning of the time frame and red, dashed lines represent the new
boundaries at the end of the study period. The dashed lines are slightly elevated to allow for
visualization. Note that other, more exotic, changes may occur in areas undergoing complete
parcel realignments, however, these are rare occurrences.7 These change types are:
7In a test on the entire City of Seattle these six change types explain 99.85% of changes to all parcels in theCity from 2000 to 2012.
17
(a) Consistent Geometry (b) Lot Adjustment
(c) Lot Split (d) Lot Join
(e) Lot Split and Adjustment (f) Lot Expansion
Figure 2: Potential Changes to Parcel Geometry
18

• (a) Consistent Geometry: Parcel boundaries have not changed over time. In most areas
of the city not undergoing major development activities consistent parcel geometry is the
predominant form of change (or lack thereof).
• (b) Lot Adjustment: Contiguous parcels may mutually agree (if more than one owner) to
shift the location of a shared boundary(s). In the figure, the right hand parcel gains size
at the direct expense of the left hand lot.
• (c) Lot Split: The right hand lot is split into three, smaller and equally-sized lots. Lot
splits in suburban areas often involve traditional land subdivision followed by single family
home development. In developed urban areas, lot splits are often followed by townhome,
rowhouse or other small multi-family developments.
• (d) Lot Join: In many areas, existing parcels are too small to accommodate the desired
development. In these instances, lot joins are common. In the example, the two parcels
are combined to create a single, larger lot. Lot joins often precede large apartment,
condominium, office and mixed use development.
• (e) Lot Split and Adjustment: Lot splits may also be accompanied by changes to existing
and surrounding lot boundaries. Changes like this are most common when a developer is
able to purchase two or more contiguous lots and perform adjustments in order to create
the maximum number of small lots out of the given geometry of contiguous parcels that
they may own.
• (f) Lot Expansion/Contraction: In areas undergoing changes to land use patterns, existing
right-of-ways may not be necessary or sufficient to support the current transportation
infrastructure. In the example given, the right-of-way to the top of the two parcels has
been vacated and that land brought within the boundaries of the existing parcels. A similar
process may occur if land is needed for right-of-way expansion and is taken via eminent
domain proceedings. In an eminent domain situation, the lots would be contracting and
the top boundary (dashed) would shift below the original boundary (solid).
19
A critical component of the parcel geometry tracking step (1) is to assign links between parcels
over the two selected time frames. In the case of consistent parcels (a), boundary changes (b) and
lot expansions/contractions (f) parcel identification numbers have not changed over time. This
represents a direct one-to-one relationship between parcel geometry and identification numbers
from initial to ending period. More complex changes to parcel geometry such as lot splits (c), lot
joins (d) and a combination of the two (e) involve one-to-many, many-to-one or many-to-many
relationships over time. To manage these types of relationships, the LUCIA system employs a
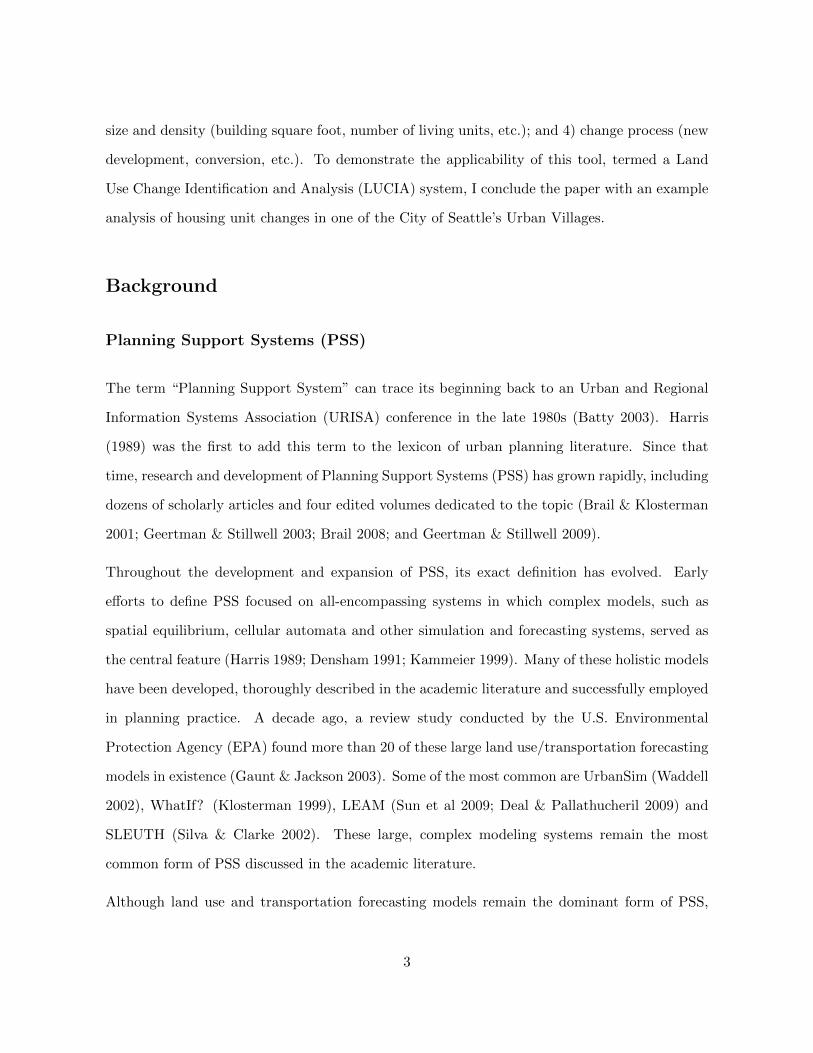
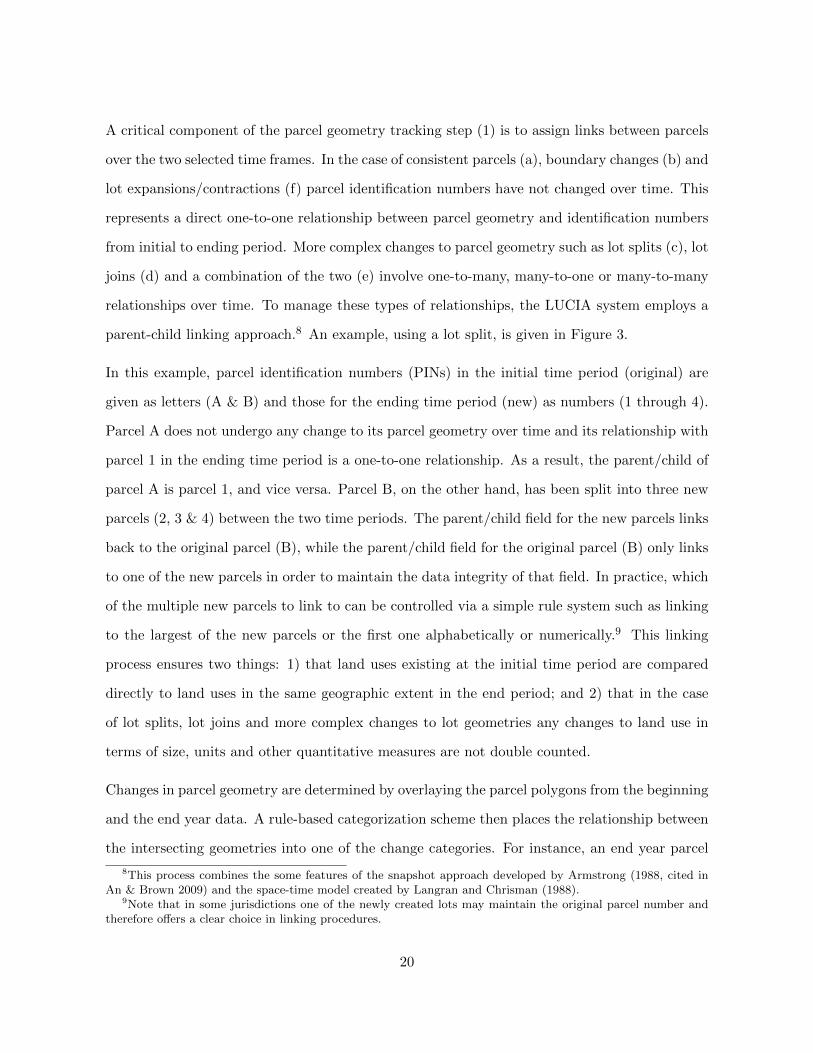
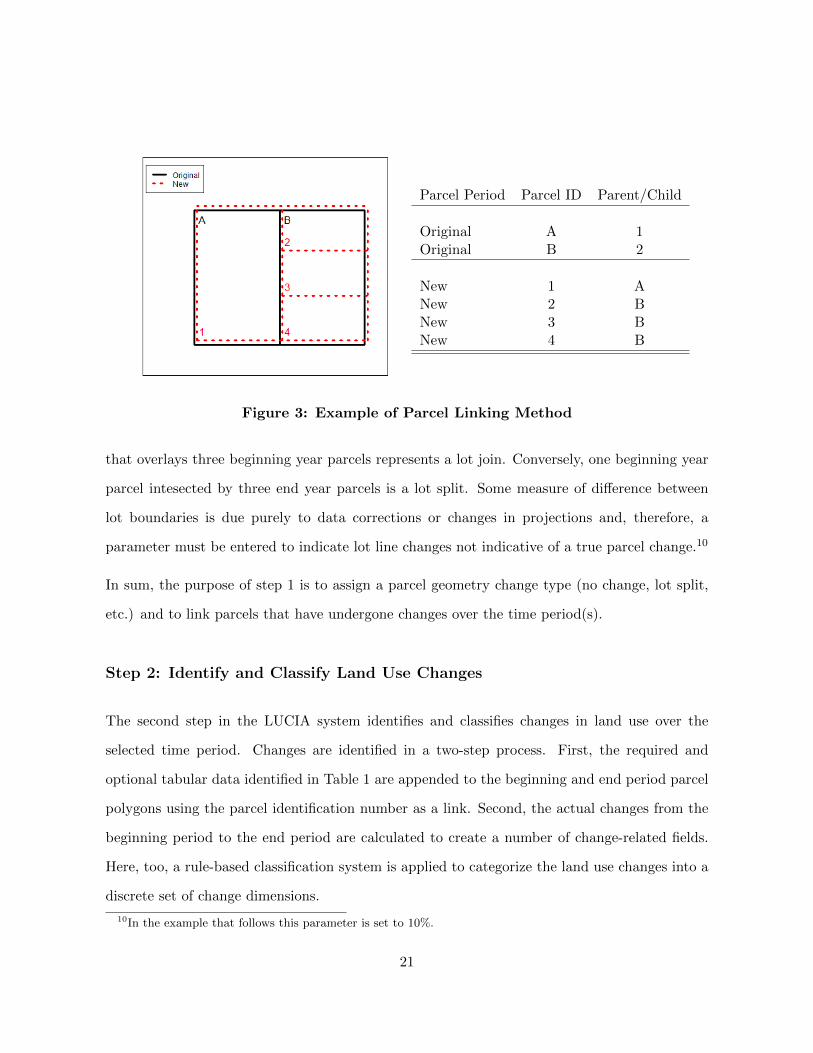
parent-child linking approach.8 An example, using a lot split, is given in Figure 3.
In this example, parcel identification numbers (PINs) in the initial time period (original) are
given as letters (A & B) and those for the ending time period (new) as numbers (1 through 4).
Parcel A does not undergo any change to its parcel geometry over time and its relationship with
parcel 1 in the ending time period is a one-to-one relationship. As a result, the parent/child of
parcel A is parcel 1, and vice versa. Parcel B, on the other hand, has been split into three new
parcels (2, 3 & 4) between the two time periods. The parent/child field for the new parcels links
back to the original parcel (B), while the parent/child field for the original parcel (B) only links
to one of the new parcels in order to maintain the data integrity of that field. In practice, which
of the multiple new parcels to link to can be controlled via a simple rule system such as linking
to the largest of the new parcels or the first one alphabetically or numerically.9 This linking
process ensures two things: 1) that land uses existing at the initial time period are compared
directly to land uses in the same geographic extent in the end period; and 2) that in the case
of lot splits, lot joins and more complex changes to lot geometries any changes to land use in
terms of size, units and other quantitative measures are not double counted.
Changes in parcel geometry are determined by overlaying the parcel polygons from the beginning
and the end year data. A rule-based categorization scheme then places the relationship between
the intersecting geometries into one of the change categories. For instance, an end year parcel
8This process combines the some features of the snapshot approach developed by Armstrong (1988, cited inAn & Brown 2009) and the space-time model created by Langran and Chrisman (1988).
9Note that in some jurisdictions one of the newly created lots may maintain the original parcel number andtherefore offers a clear choice in linking procedures.
20
Parcel Period Parcel ID Parent/Child
Original A 1Original B 2
New 1 ANew 2 BNew 3 BNew 4 B
Figure 3: Example of Parcel Linking Method
that overlays three beginning year parcels represents a lot join. Conversely, one beginning year
parcel intesected by three end year parcels is a lot split. Some measure of difference between
lot boundaries is due purely to data corrections or changes in projections and, therefore, a
parameter must be entered to indicate lot line changes not indicative of a true parcel change.10
In sum, the purpose of step 1 is to assign a parcel geometry change type (no change, lot split,
etc.) and to link parcels that have undergone changes over the time period(s).
Step 2: Identify and Classify Land Use Changes
The second step in the LUCIA system identifies and classifies changes in land use over the
selected time period. Changes are identified in a two-step process. First, the required and
optional tabular data identified in Table 1 are appended to the beginning and end period parcel
polygons using the parcel identification number as a link. Second, the actual changes from the
beginning period to the end period are calculated to create a number of change-related fields.
Here, too, a rule-based classification system is applied to categorize the land use changes into a
discrete set of change dimensions.
10In the example that follows this parameter is set to 10%.
21
In cases where lot boundaries have changed and new parcels have been created, the linking
procedure described above is employed to ensure that additions and subtractions of units or
building sizes are not double counted. Changes in land use can be classified over three separate
dimensions: 1) by land use designation; 2) by changes to physical characteristics of the property;
and 3) by the type of change itself. If intervening period data is available a fourth dimension,
time, can also be used to classify land use changes.
Changes to land use designations are the most obvious dimension of land use change. Exam-
ples of this type of change include new apartment construction (converting vacant land to an
apartment use), a conversion of a building from office use to retail use or the demolition of a
single family residence and construction of a new condominium building. A particular user of
the LUCIA system could utilize any number of land use designation breakdowns, depending on
the level of disaggregation in their particular data.
Changes to land use may also be examined in regards to the actual differences in the physical
structures. For example, many planning goals and objectives are focused on impacting the
number of housing units or the number of jobs (a correlate of structural size) in targeted areas.
The LUCIA system allows a user to identify and measure changes in living units and building
square footage. Other potential measures such as renovations, parking spaces and impervious
surfaces may be of interest in given studies and could also be analyzed within the LUCIA
framework.
The third dimension of land use change concerns the method used to facilitate the change in
use. In other words, did the land use change result from a demolition and a new development
(redeveloment) or simply the conversion of an existing structure from one use to another? The
land use succession literature (Andrews 1971; Bourne 1971) provides some guidance when clas-
sifying change types. Using this work, I have developed six different categories of change types
to track in my implementation of the LUCIA system:
• Demolition - change from an improved structure to vacant land
22
• New Development - change from vacant land to a new improved structure
• Redevelopment - change from one structure to a completely new structure11
• Conversion - change in the primary use of the structure12
• Expansion/Contraction - change in the size of the structure13
• Densification - No change in use or in size, but an increase of units/occupants due to a
change in density within the structure
If intervening year data is available, then land use changes across the three previous dimensions
may also be broken down by time. The resolution of this temporal analysis will depend on the
temporal resolution of the intervening period data.
To summarize, the second step of the LUCIA process compares property characteristics from
the beginning and ending time periods to determine the change, if any, in land use and in
the physical characteristics as well as the manner in which the change occurred (new building,
expansion, etc.). If the time period being studied is sufficiently long and intervening period data
are available, this process can also add temporal stamps to the land use changes.
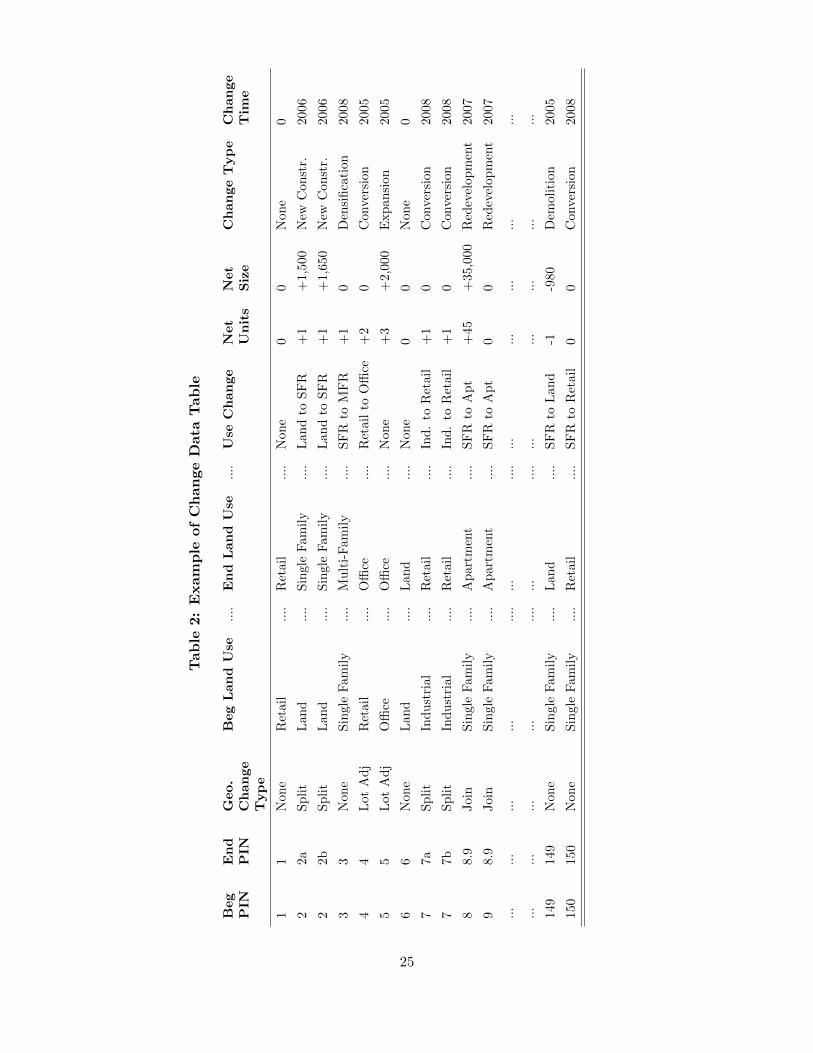
Step 3: Compute, Report and Visualize Changes
The third step of the LUCIA process takes the change information developed in step 2 and
produces three separate types of output. The first is the raw data created in step 2. An
example of what this raw data might look like is shown in Table 2. In this example, records and
fields have been suppressed for space considerations and are indicated by ‘...’s. This example
has been constructed to illustrate the maximum number of potential change scenarios and it is
11In highly urbanized areas, the distinction between Redevelopment and a two-step process of Demolition andthen New Development is differentiated solely by the time frame of the study. On a long enough time frame,most urban parcels in the private land market will follow Demolition with New Development.
12Note that Conversion may be paired with Expansion/Contraction and that the modeler should determinewhich one is of more concern for the particular study in question.
13Ibid.
23
unlikely that any given area of 150 parcels we would expect see this variety of change over the
short, four-year time frame being used in this example.
The second output from the LUCIA system is a set of analytical table(s) cross tabulating the
various changes to land use across a combination of user-selected dimensions (Z). Finally, the
third type of output of the LUCIA system are maps, GIS shapefiles and three-dimensional visual-
izations of land use changes over the area (X), the time period (Y) and across the specific dimen-
sions of interest (Z). Examples of these cross-tabular analyses and two- and three-dimensional
visualizations are given in the fully developed LUCIA example that follows.
LUCIA Example
To demonstrate the functionality of the LUCIA system, I have developed a prototype using data
from the City of Seattle, located in King County, WA. In the example that follows I examine
changes in housing units in Seattle’s 12th Avenue Urban Village, a highly urbanized area just
east of the downtown core. The location and the boundaries of this Urban Village are shown in
Figure 4.
The 12th Avenue Urban Village is one of 41 Urban Villages defined by the City of Seattle.
These spatially delineated villages are part of an Urban Villages planning strategy that the city
adopted in 1994 and has been using ever since. The villages exist in a three-level hierarchy:
1) Urban Center Villages (UCVs) the largest and densest; 2) Hub Urban Villages (HUV); and
3) Residential Urban Villages (RUV). A fourth category, Manufacturing-Industrial Centers are
reserved for the city’s two largest industrial areas and do not fit into the hierarchy. UCVs and
HUVs receive individual housing and employment forecasts, while only housing growth targets
are forecast for RUVs. The 12th Avenue Village is an Urban Center Village and is considered
part of the First/Capitol Hill Urban Center.
To show the functionality of the LUCIA system, I calculate the actual change in housing units
in the 12th Avenue Village over the 2000 to 2012 period. I also conduct a number of additional
24
Table
2:Example
ofChangeData
Table
Beg
PIN
End
PIN
Geo.
Change
Type
BegLand
Use
....
End
Land
Use
....
Use
Change
Net
Units
Net
Size
ChangeType
Change
Tim
e
11
Non
eR
etai
l..
..R
etail
....
Non
e0
0N
on
e0
22a
Sp
lit
Lan
d..
..S
ingle
Fam
ily
....
Lan
dto
SF
R+
1+
1,5
00
New
Con
str.
2006
22b
Sp
lit
Lan
d..
..S
ingle
Fam
ily
....
Lan
dto
SF
R+
1+
1,6
50
New
Con
str.
2006
33
Non
eSin
gle
Fam
ily
....
Mu
lti-
Fam
ily
....
SF
Rto
MF
R+
10
Den
sifi
cati
on
2008
44
Lot
Ad
jR
etai
l..
..O
ffice
....
Ret
ail
toO
ffice
+2
0C
onve
rsio
n2005
55
Lot
Ad
jO
ffice
....
Offi
ce..
..N
on
e+
3+
2,0
00
Exp
an
sion
2005
66
Non
eL
and
....
Lan
d..
..N
one
00
Non
e0
77a
Sp
lit
Ind
ust
rial
....
Ret
ail
....
Ind
.to
Ret
ail
+1
0C
onver
sion
2008
77b
Sp
lit
Ind
ust
rial
....
Ret
ail
....
Ind
.to
Ret
ail
+1
0C
onve
rsio
n2008
88.
9Joi
nS
ingl
eF
am
ily
....
Ap
art
men
t..
..S
FR
toA
pt
+45
+35,0
00
Red
evel
op
men
t2007
98.
9Joi
nS
ingl
eF
am
ily
....
Ap
art
men
t..
..S
FR
toA
pt
00
Red
evel
op
men
t2007
...
...
...
...
....
...
....
...
...
...
...
...
...
...
...
...
....
...
....
...
...
...
...
...
149
149
Non
eSin
gle
Fam
ily
....
Lan
d..
..S
FR
toL
an
d-1
-980
Dem
oli
tion
2005
150
150
Non
eSin
gle
Fam
ily
....
Ret
ail
....
SF
Rto
Ret
ail
00
Conve
rsio
n2008
25
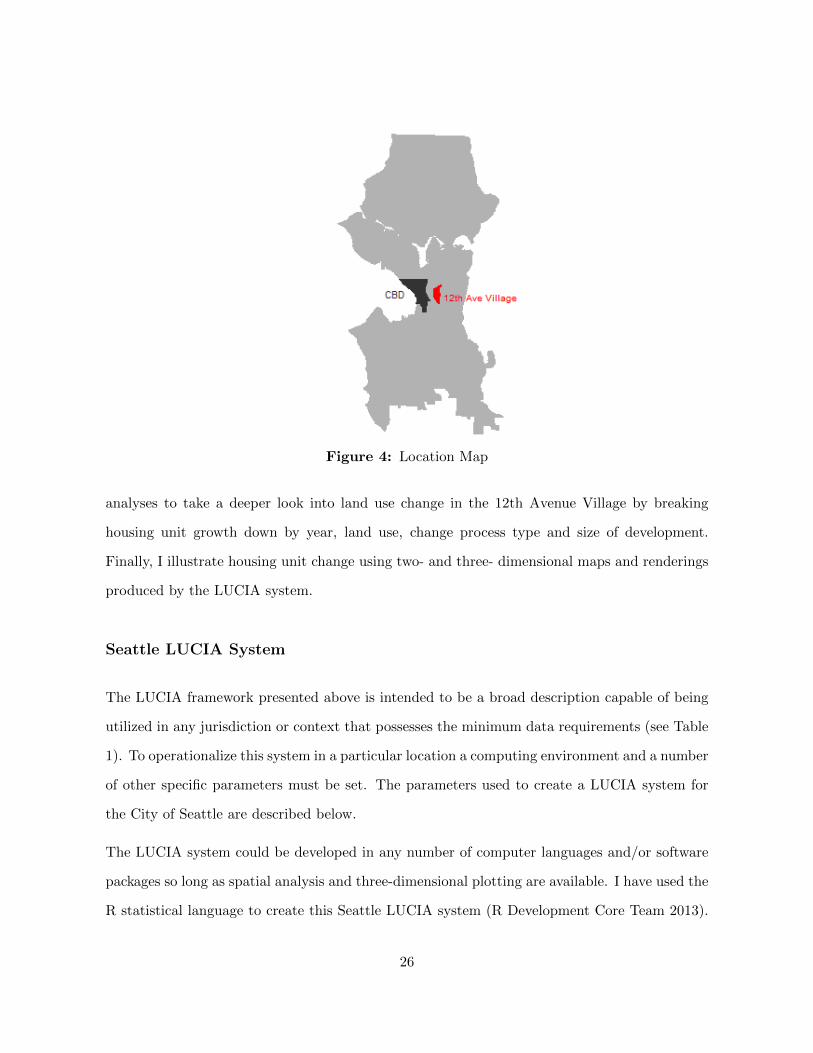
Figure 4: Location Map
analyses to take a deeper look into land use change in the 12th Avenue Village by breaking
housing unit growth down by year, land use, change process type and size of development.
Finally, I illustrate housing unit change using two- and three- dimensional maps and renderings
produced by the LUCIA system.
Seattle LUCIA System
The LUCIA framework presented above is intended to be a broad description capable of being
utilized in any jurisdiction or context that possesses the minimum data requirements (see Table
1). To operationalize this system in a particular location a computing environment and a number
of other specific parameters must be set. The parameters used to create a LUCIA system for
the City of Seattle are described below.
The LUCIA system could be developed in any number of computer languages and/or software
packages so long as spatial analysis and three-dimensional plotting are available. I have used the
R statistical language to create this Seattle LUCIA system (R Development Core Team 2013).
26
In its basic installation, R does not possesses the necessary geostatistical packages to perform
the required analyses. Through use of the maptools (Bivand & Lewin-Koh 2013), sp (Pebesma
& Bivand 2005), rgeos (Bivand & Rundel 2013) and rgl (Adler & Murdoch 2013) packages,
however, R can produce the mapping and three-dimensional visualization show in Figures 6 to
7 below.14 The use of the rgeos package, which allows for basic geometric and geospatial data
analysis such as area calculation, clipping and buffering, requires the use of the GEOS (Open
Source Geometry Engine) platform as well. ESRI’s ArcGIS software was used to produce the
base boundaries files for the 12th Avenue Urban Village and City of Seattle, but is not used in
the actual LUCIA system.
Data for the Seattle LUCIA system comes from King County. Current property characteristic
data (tabular) are available for download from the King County Assessor’s Website.15 The
King County GIS Center provides free downloads of current parcel polygons from its website.16
Historic data from 2009 to 2012 were collected by the author over that time period. Data prior to
2009 were gathered from the University of Washington Map Library collection or from Runstad
Center for Real Estate Studies data archives. Data are available from these sources back to the
year 2000. As a result, the study time period for the Seattle LUCIA system runs from 2000 to
the end of year 2012.17
The LUCIA framework provides the ability to categorize land use changes across a number of
dimensions including land use, size of structure and change type. The specific typology that each
of these dimensions (or variables) can take is dependent on the local data and/or the specific
desires or needs of the analyst or modeler. For instance, King County divides land uses into over
150 different categories. This fine of a classification system is likely too detailed for meaningful
analysis in most cases. As a result, a subjective decision must be made by the analyst/modeler as
to a whether or not to use this system or to create a more aggregated typology. For the purposes
14Note, that the functions for plotting .shp files into the RGL viewer are user-created and are available fromthe author upon request.
15http://www.kingcounty.gov/Assessor.aspx16http://www.kingcounty.gov/operations/GIS.aspx17Note that intervening year data for 2002 and 2003 is missing.
27
of this example, I have chosen to use the following land use categories (only those relating to
housing) in this version of the Seattle LUCIA system: 1) Apartment; 2) Condominium; 3) Small
Multi-Family (2-4 Units); 4) Single Family Detached; and 5) Townhome. Finally, the LUCIA
system is designed to return information on both changes to housing units and to building sizes.
The Seattle LUCIA system, as currently set up, returns information on both of these figures,
however, the example presented here focuses on housing units only.
In terms of the X, Y and Z framework presented in the methodology section and Figure 1, the
boundaries of the 12th Avenue Urban Village represent the spatial extent (X), the years 2000 to
2012 represent the user defined temporal extent (Y) and the various dimensions of change (land
use, change type, change size and timing of change) represent the characteristics of interests (Z).
LUCIA Tabular Results
I begin by presenting a variety of tabular results generated by the LUCIA system. In each case,
the results show the breakdown of changes in housing units over a number of categories in one
of the dimensions discussed above (by parcel change type, by time, by land use, by change type
and by size). Five different statistics are created for each category:
1. The number of parcels losing housing units
2. The total number of housing units lost
3. The number of parcels gaining housing units
4. The total number of housing units gained
5. The total net change in housing units
The purpose of the tabular analysis that follows is to highlight the capabilities of the LUCIA
system and not to perform an in-depth analysis of trends in the 12th Avenue Village or draw
any causal inferences as to the drivers of growth in this neighborhood.
28
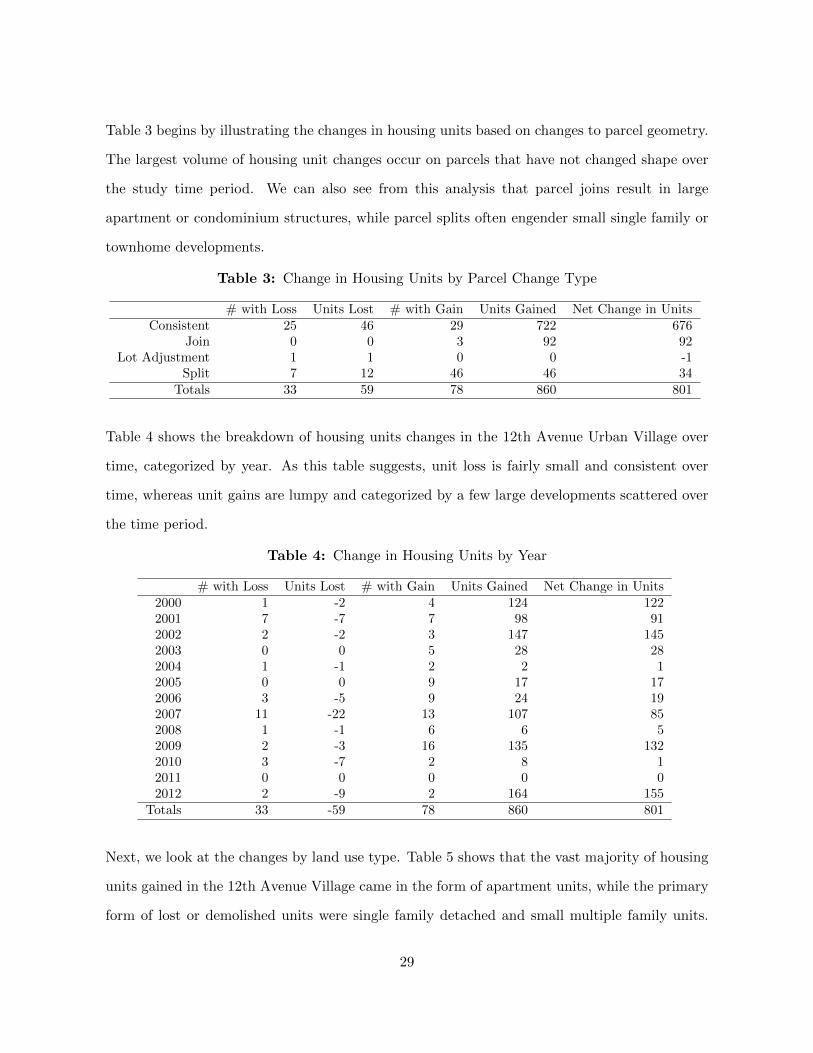
Table 3 begins by illustrating the changes in housing units based on changes to parcel geometry.
The largest volume of housing unit changes occur on parcels that have not changed shape over
the study time period. We can also see from this analysis that parcel joins result in large
apartment or condominium structures, while parcel splits often engender small single family or
townhome developments.
Table 3: Change in Housing Units by Parcel Change Type
# with Loss Units Lost # with Gain Units Gained Net Change in UnitsConsistent 25 46 29 722 676
Join 0 0 3 92 92Lot Adjustment 1 1 0 0 -1
Split 7 12 46 46 34Totals 33 59 78 860 801
Table 4 shows the breakdown of housing units changes in the 12th Avenue Urban Village over
time, categorized by year. As this table suggests, unit loss is fairly small and consistent over
time, whereas unit gains are lumpy and categorized by a few large developments scattered over
the time period.
Table 4: Change in Housing Units by Year
# with Loss Units Lost # with Gain Units Gained Net Change in Units2000 1 -2 4 124 1222001 7 -7 7 98 912002 2 -2 3 147 1452003 0 0 5 28 282004 1 -1 2 2 12005 0 0 9 17 172006 3 -5 9 24 192007 11 -22 13 107 852008 1 -1 6 6 52009 2 -3 16 135 1322010 3 -7 2 8 12011 0 0 0 0 02012 2 -9 2 164 155
Totals 33 -59 78 860 801
Next, we look at the changes by land use type. Table 5 shows that the vast majority of housing
units gained in the 12th Avenue Village came in the form of apartment units, while the primary
form of lost or demolished units were single family detached and small multiple family units.
29
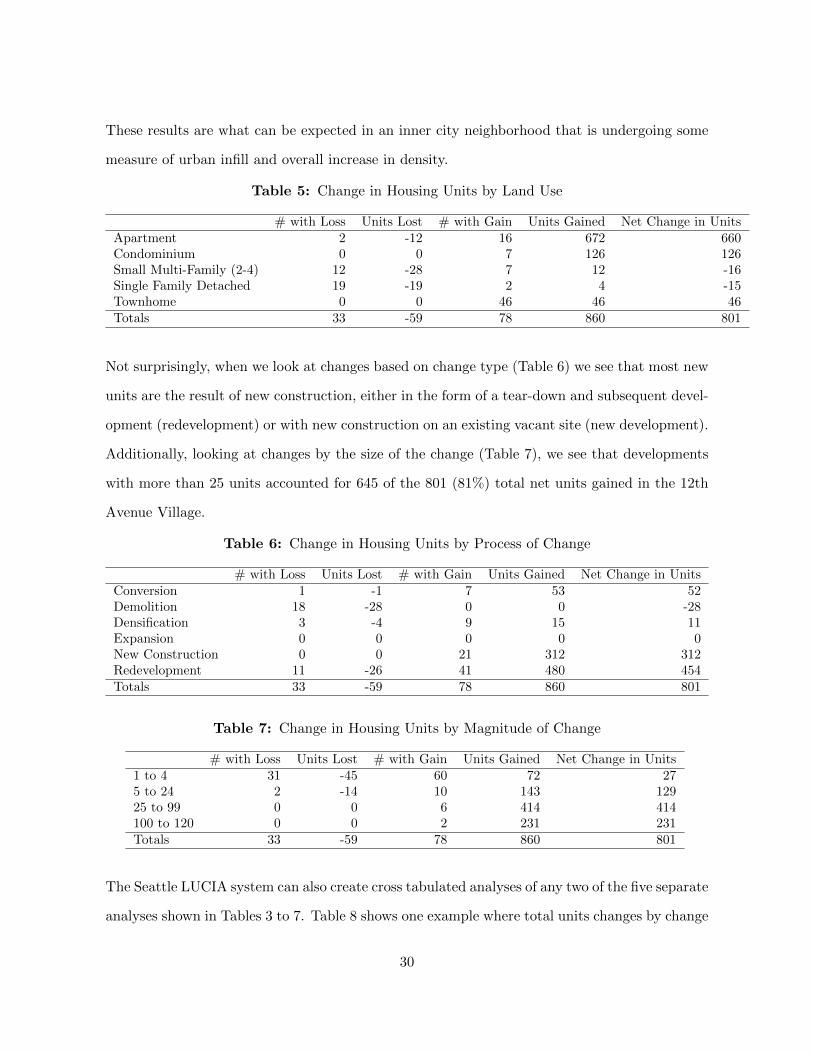
These results are what can be expected in an inner city neighborhood that is undergoing some
measure of urban infill and overall increase in density.
Table 5: Change in Housing Units by Land Use
# with Loss Units Lost # with Gain Units Gained Net Change in UnitsApartment 2 -12 16 672 660Condominium 0 0 7 126 126Small Multi-Family (2-4) 12 -28 7 12 -16Single Family Detached 19 -19 2 4 -15Townhome 0 0 46 46 46Totals 33 -59 78 860 801
Not surprisingly, when we look at changes based on change type (Table 6) we see that most new
units are the result of new construction, either in the form of a tear-down and subsequent devel-
opment (redevelopment) or with new construction on an existing vacant site (new development).
Additionally, looking at changes by the size of the change (Table 7), we see that developments
with more than 25 units accounted for 645 of the 801 (81%) total net units gained in the 12th
Avenue Village.
Table 6: Change in Housing Units by Process of Change
# with Loss Units Lost # with Gain Units Gained Net Change in UnitsConversion 1 -1 7 53 52Demolition 18 -28 0 0 -28Densification 3 -4 9 15 11Expansion 0 0 0 0 0New Construction 0 0 21 312 312Redevelopment 11 -26 41 480 454Totals 33 -59 78 860 801
Table 7: Change in Housing Units by Magnitude of Change
# with Loss Units Lost # with Gain Units Gained Net Change in Units1 to 4 31 -45 60 72 275 to 24 2 -14 10 143 12925 to 99 0 0 6 414 414100 to 120 0 0 2 231 231Totals 33 -59 78 860 801
The Seattle LUCIA system can also create cross tabulated analyses of any two of the five separate
analyses shown in Tables 3 to 7. Table 8 shows one example where total units changes by change
30
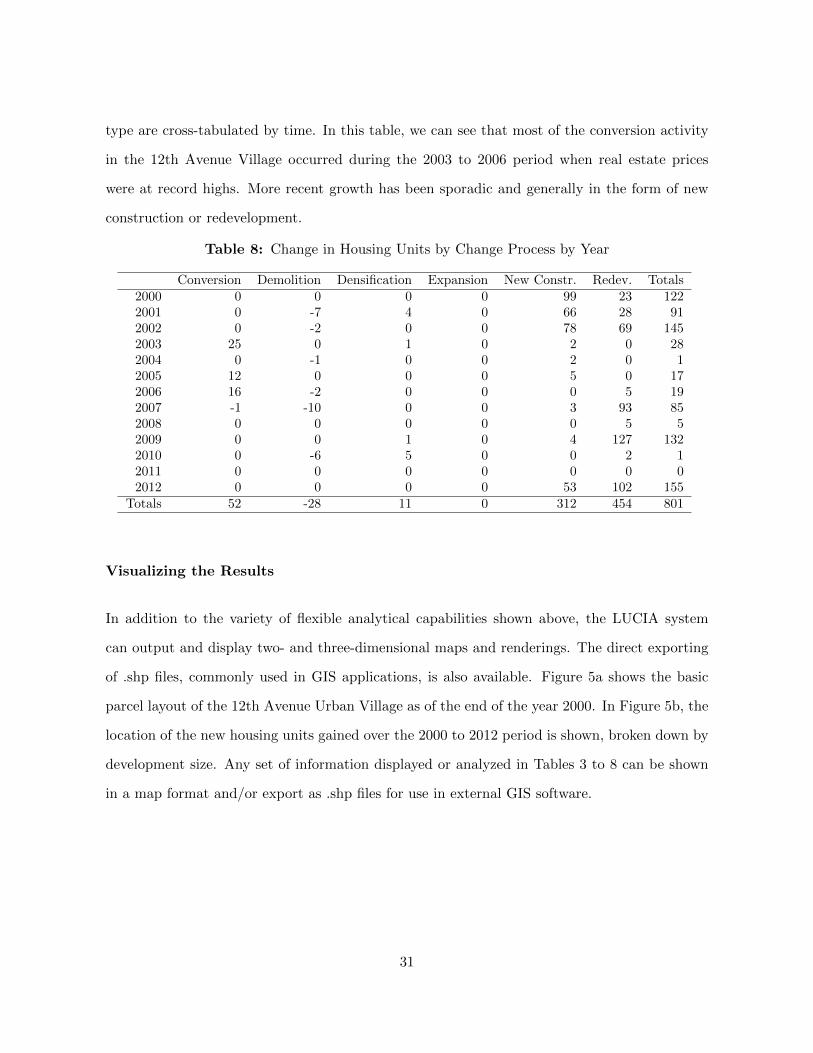
type are cross-tabulated by time. In this table, we can see that most of the conversion activity
in the 12th Avenue Village occurred during the 2003 to 2006 period when real estate prices
were at record highs. More recent growth has been sporadic and generally in the form of new
construction or redevelopment.
Table 8: Change in Housing Units by Change Process by Year
Conversion Demolition Densification Expansion New Constr. Redev. Totals2000 0 0 0 0 99 23 1222001 0 -7 4 0 66 28 912002 0 -2 0 0 78 69 1452003 25 0 1 0 2 0 282004 0 -1 0 0 2 0 12005 12 0 0 0 5 0 172006 16 -2 0 0 0 5 192007 -1 -10 0 0 3 93 852008 0 0 0 0 0 5 52009 0 0 1 0 4 127 1322010 0 -6 5 0 0 2 12011 0 0 0 0 0 0 02012 0 0 0 0 53 102 155
Totals 52 -28 11 0 312 454 801
Visualizing the Results
In addition to the variety of flexible analytical capabilities shown above, the LUCIA system
can output and display two- and three-dimensional maps and renderings. The direct exporting
of .shp files, commonly used in GIS applications, is also available. Figure 5a shows the basic
parcel layout of the 12th Avenue Urban Village as of the end of the year 2000. In Figure 5b, the
location of the new housing units gained over the 2000 to 2012 period is shown, broken down by
development size. Any set of information displayed or analyzed in Tables 3 to 8 can be shown
in a map format and/or export as .shp files for use in external GIS software.
31
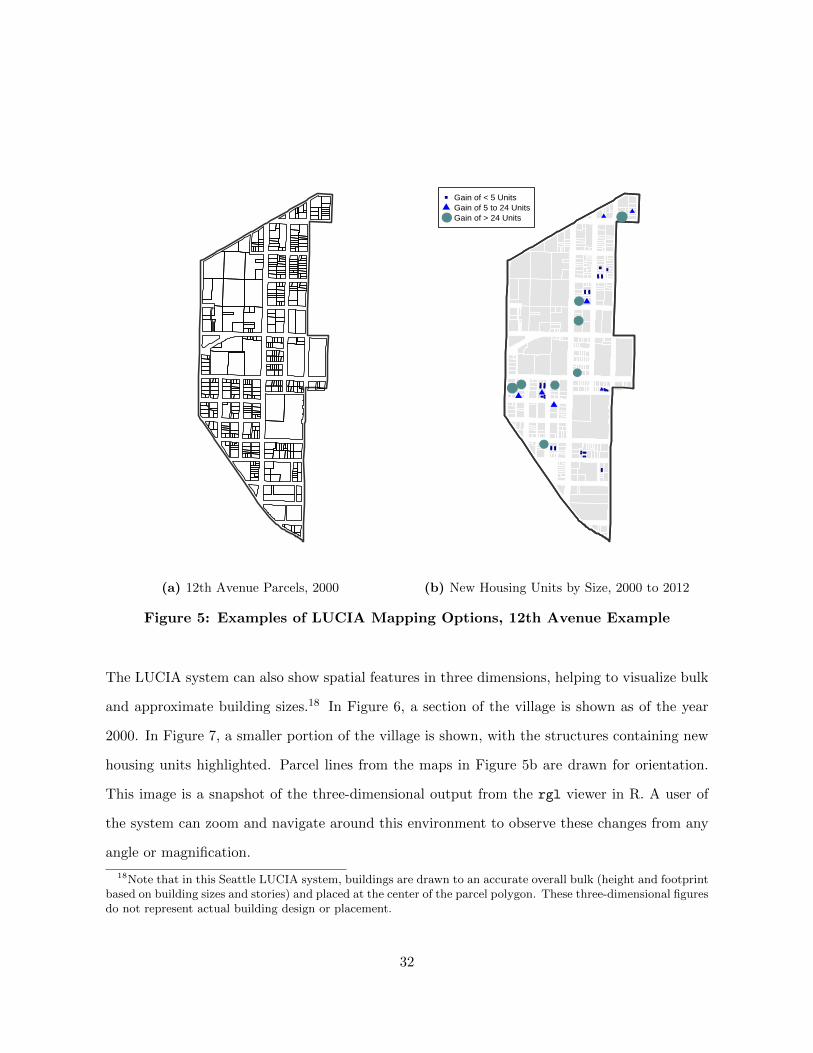
(a) 12th Avenue Parcels, 2000
●●
●
●
●
●
●
●●
Gain of < 5 UnitsGain of 5 to 24 UnitsGain of > 24 Units
(b) New Housing Units by Size, 2000 to 2012
Figure 5: Examples of LUCIA Mapping Options, 12th Avenue Example
The LUCIA system can also show spatial features in three dimensions, helping to visualize bulk
and approximate building sizes.18 In Figure 6, a section of the village is shown as of the year
2000. In Figure 7, a smaller portion of the village is shown, with the structures containing new
housing units highlighted. Parcel lines from the maps in Figure 5b are drawn for orientation.
This image is a snapshot of the three-dimensional output from the rgl viewer in R. A user of
the system can zoom and navigate around this environment to observe these changes from any
angle or magnification.
18Note that in this Seattle LUCIA system, buildings are drawn to an accurate overall bulk (height and footprintbased on building sizes and stories) and placed at the center of the parcel polygon. These three-dimensional figuresdo not represent actual building design or placement.
32
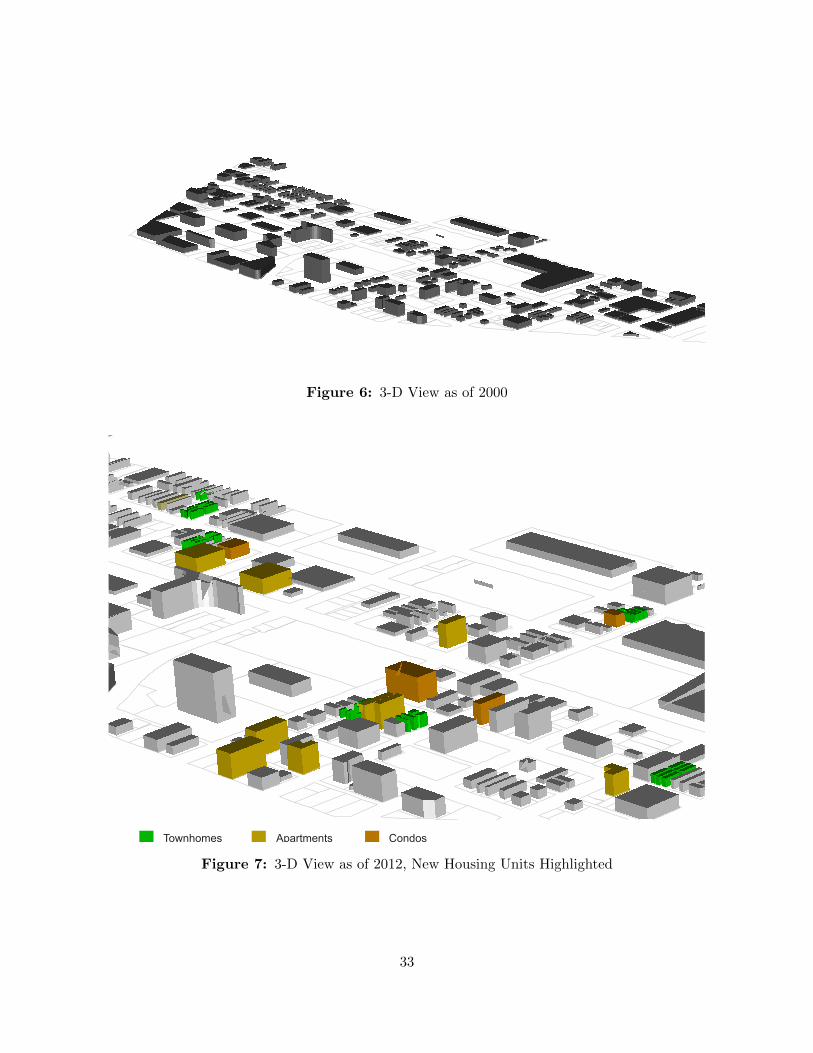
Figure 6: 3-D View as of 2000
Townhomes Apartments Condos
Figure 7: 3-D View as of 2012, New Housing Units Highlighted
33
Plan Evaluation with the LUCIA System
As the literature notes, the ex post evaluation of plans is a critical step in the planning process
and one that too often is ignored. One factor contributing to this deficiency is the lack of
adequate data with which to properly evaluate planning outcomes. The products of the LUCIA
system offer an opportunity to fill this void in the case of plans that proscribe some form of land
use change.
The Seattle Urban Village (UV) strategy is one such plan. A response to the State’s Growth
Management Act (GMA) of 1991, the UV strategy seeks to focus urban growth within existing
high density areas, the urban villages. Each village has separate housing unit growth forecasts,
updated every ten years. By using the LUCIA system, the existing analysis done by the city
(Seattle DPD Data Warehouse 2013) can be expanded to include net changes as opposed to
simple permit counts as well as the addition of context to the analysis by examining housing
unit growth over a variety of dimensions.
Interpolating the revolving 20-year housing unit growth forecasts from the 1994 and 2004 com-
prehensive plan updates shows that an additional 440 housing units were targeted for the 12th
Avenue Urban Village over the 2000 to 2012 time period. As Tables 3 to 8 above illustrate,
the village gained nearly twice that many housing units, 860, over this time period. From an
evaluation standpoint, actual growth could be considered conforming to the planned growth for
the area, if exceeding totals is a desired occurrence. The LUCIA system allows for consideration
of the number of housing units lost (59) and, therefore, can examine net growth in units. Sub-
tracting out the loss of the 59 demolished units, net housing unit growth in the urban village
reduces down to a gain of 801 units, still much higher than forecasted for this period.
This growth can be examined across a number of dimensions. In Figure 8a, we see that most
growth in the 12th Avenue Urban Village has come in the form of apartment buildings, with
condos making up the second most commonly added unit type. Over three-fourths of the growth
in units is located in developments of at least 25 units in size (Figure 8b). While the existing
34
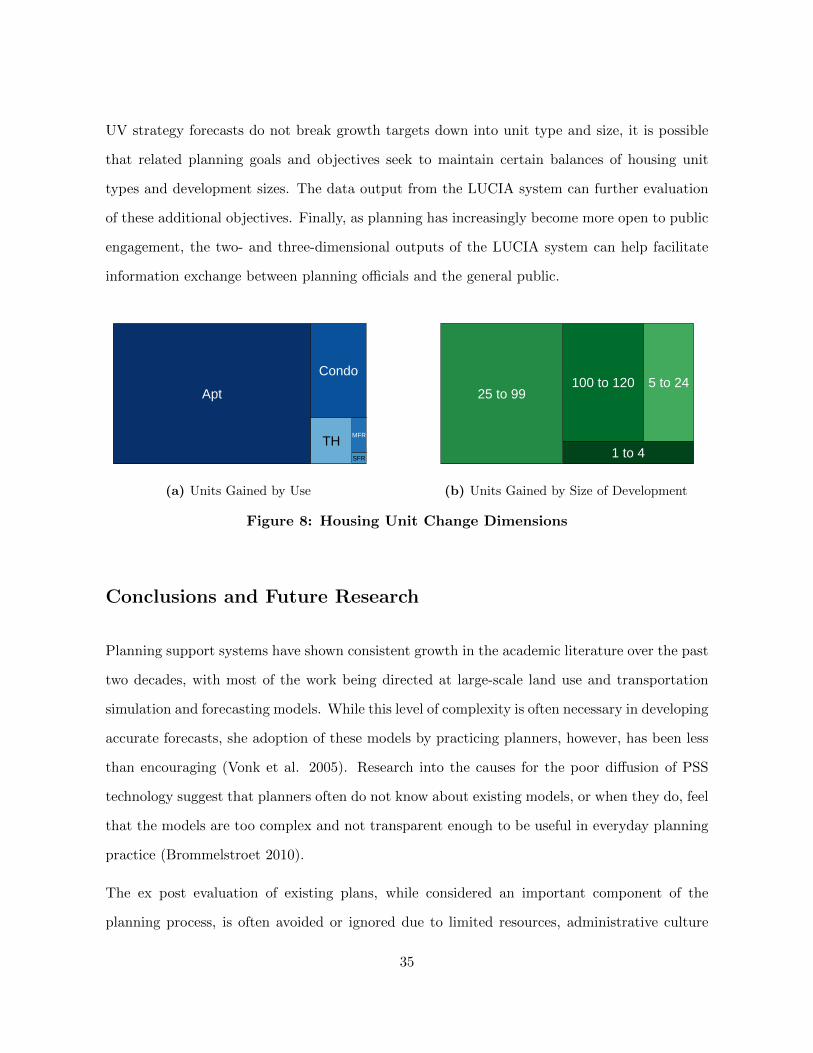
UV strategy forecasts do not break growth targets down into unit type and size, it is possible
that related planning goals and objectives seek to maintain certain balances of housing unit
types and development sizes. The data output from the LUCIA system can further evaluation
of these additional objectives. Finally, as planning has increasingly become more open to public
engagement, the two- and three-dimensional outputs of the LUCIA system can help facilitate
information exchange between planning officials and the general public.
Apt
Condo
MFR
SFR
TH
(a) Units Gained by Use
1 to 4
100 to 12025 to 99
5 to 24
(b) Units Gained by Size of Development
Figure 8: Housing Unit Change Dimensions
Conclusions and Future Research
Planning support systems have shown consistent growth in the academic literature over the past
two decades, with most of the work being directed at large-scale land use and transportation
simulation and forecasting models. While this level of complexity is often necessary in developing
accurate forecasts, she adoption of these models by practicing planners, however, has been less
than encouraging (Vonk et al. 2005). Research into the causes for the poor diffusion of PSS
technology suggest that planners often do not know about existing models, or when they do, feel
that the models are too complex and not transparent enough to be useful in everyday planning
practice (Brommelstroet 2010).
The ex post evaluation of existing plans, while considered an important component of the
planning process, is often avoided or ignored due to limited resources, administrative culture
35
or lack of data (Seasons 2003). This research presents one option to addressing issues of data
availability for ex post plan evaluation dealing with land use change. A tool-box type planning
support framework, the land use change identification and analysis (LUCIA) system, has been
constructed to offer a flexible, user-friendly system for analyzing land use change. In direct
contrast to much of the PSS literature, this model is merely descriptive, not predictive, and it
operates at the parcel scale allowing for the level of detail often necessary to evaluate plans in
highly urbanized areas. The LUCIA system was first described as a general framework that can
be applied to any geographic area or context where a standard set of data exists. To shows its
potential use, a specific LUCIA system for the City of Seattle was developed and presented.
Developing this system shows that reasonable data requirements exist in order to create a
system capable of producing base data for additional analysis, providing tabular analysis and
presenting two- and three-dimensional data visualization. The Seattle LUCIA is programmed
in open source software and uses data readily available to the public.
The existing large-scale PSS models have a place in urban planning and are likely to gain
acceptance over time as planners become more comfortable with using these complex models.
Certainly, they hold great promise for long range planning. Planners could also benefit from
smaller and simpler tools to help them properly analyze and visualize existing data, not to
mention aid in the ex post plan evaluation process. The LUCIA framework presented here
offers an example of how existing data combined with open source software can present a usable
and transparent spatial analysis tool.
The current version of the Seattle LUCIA system is a first generation prototype. Some future
improvements include using building footprint, remotely sensed and/or contour data to improve
the three-dimensional building renderings and adding in building permit data to show the likely
changes in the near future. Another supplement could be the addition of real estate transaction
and value information to provide planners and other users with indicators of market activity
and potential changes in highest and best use.
36
References
Adler, D & Murdoch, D (2013) rgl: 3D visualization device system (OpenGL). R package version0.93.935. http://CRAN.R-project.org/package=rgl.
Alexander, E & Faludi, A (1989) Planning and plan implementation: Notes on evaluationcriteria, Environment and Planning B, 16, 127-140.
Andrews, R (1971) Urban Land Economics and Public Policy Free Press Collier MacMillen Ltd.
Batty, M (2003) Preface: Planning Support Systems: Technologies that are driving planning, inPlanning Support Systems in Practice, eds. Geertman, S & Stillwell, J, Springer-Verlag,Berlin, pp v-viii.
Baer, W (1997) General plan evaluation criteria: An approach to making better plans. Journalof the American Planning Association, 63(3), 329-344.
Beauregard, R (1990) Bringing the city back in. Journal of the American Planning Association,56(2), 210-215.
Besio, M & Quadrelli, N (2009) Geo-Information technologies in support of environmental andlandscape planning, in Planning Support Systems: Best Practices and New Methods, eds.Geertman, S & Stillwell, J., Springer-Verlag, Berlin, pp. 265-294.
Bivand, R & Lewin-Koh, N (2013) maptools: Tools for reading and handling spatial objects. Rpackage version 0.8-23. http://CRAN.R-project.org/package=maptools.
Bivand, R & Rundel, C (2013) rgeos: Interface to Geometry Engine - Open Source (GEOS). Rpackage version 0.2-17. http://CRAN.R-project.org/package=rgeos.
Bourne, L (1971) Physical adjustment processes and land use succession: A conceptual reviewand central city example. Economic Geography 47(1), 1-15.
Brail, R (2008) Planning Support Systems for Cities and Regions, Lincoln Institute of LandPolicy, Cambridge, MA.
Brail, R & Klosterman, R (2001) Planning Support Systems: Integrating Geograhic InformationSystems, Models and Visualization Tools., ESRI Inc, Redlands, CA.
Branch, M (1998) Comprehensive Planning for the 21st Century, Praeger, Westport, CT.
Brommelstroet, M (2010) Equip the warrior instead of manning the equipment: Land use andtransport planning support in the Netherlands. The Journal of Transport and Land Use3(1), 25-41.
Calkins, H (1979) The planning monitor: An accountability theory of plan evaluation. Environ-ment and Planning A, 11, 745-758.
Chapin, T, Deyle, R, and Baker, E (2008) A parcel-based GIS method for evaluating confor-mance of local land-use planning with a state mandate to reduce exposure to hurricaneflooding. Environment and Planning B: Planning and Design, 35, 261-279.
37
Deal, B & Pallathucheril, V (2009) A use-driven approach to large-scale urban modeling andplanning support, in Planning Support Systems: Best Practices and New Methods, eds.Geertman, S & Stillwell, J, Springer-Verlag, Berlin, pp. 29-51.
Densham, P (1991) Spatial decision support systems. in Geographical Information Systems:Priciples and Applications, eds. Maguire, D, Goodchild, M & Rhind, D. Longman Group,London.
Gaunt, C, & Jackson, L (2003) Chp. 19: Models for assessing the effects of community change onland use patterns, in Planning Support Systems in Practice, eds. Geertman, S & Stillwell,J, Springer-Verlag, Berlin, pp 351-371.
Geertman, S (2002) Participatory planning and GIS: a PSS to bridge the gap. Environmentand Planning B, 29(1), 21-36.
Geertman, S, & Stillwell, J (2003) Planning Support Systems in Practice, Springer-Verlag, Berlin.
Geertman, S (2006) Potential for planning support: A planning conceptual approach. Environ-ment and Planning B: Planning and Design, 33, 863-880.
Geertman, S, & Stillwell, J (2003) Planning Support Systems: An Introduction, in PlanningSupport Systems in Practice, eds. Geertman, S & Stillwell, J, Springer-Verlag, Berlin, pp3-21.
Geertman, S & Stillwell, J (2009) Planning Support Systems: Best Practices and New Methods,Springer-Verlag, Berlin.
Harts, J, Maat, K and Ottens, H (2003) Chp. 17: An urbanization monitoring system forstrategic planning, in Planning Support Systems in Practice, eds. Geertman, S & Stillwell,J, Springer-Verlag, Berlin, pp 316-331.
Harris, B (1989) Beyond geographic information systems. Journal of the American PlanningAssociation, 55(1), 85-90.
Johnson, P & Sieber, R (2009) Agent-based modelling: A dynamic scenario planning approachto tourism PSS, in Planning Support Systems: Best Practices and New Methods, eds.Geertman, S & Stillwell, J, Springer-Verlag, Berlin, pp. 211-226.
Kahila, M & Kytta, M (2009) SoftGIS as a bridge-builder in collaborative urban planning, inPlanning Support Systems: Best Practices and New Methods, eds. Geertman, S & Stillwell,J., Springer-Verlag, Berlin, pp. 389-412.
Kaiser, E, Godschalk, D & Chapin, F (1995) Urban Land Use Planning, University of IllinoisPress, Urbana, IL, pp 425-453.
Klosterman, R (1997) Planning support systems: A new perspective on computer-aided plan-ning. Journal of Planning Education and Research, 17(1), 45-54.
Klosterman, R (1999) The What If? collaborative planning support systems. Environment andPlanning B, 26, 393-408.
38
Klosterman, R (2009) Preface: Planning Support Sytems - Retrospect and Prospect. In PlanningSupport Systems: Best Practice and New Methods eds. Geertman S & Stillwell, J. Berlin:Springer, pp v - vii.
Klosterman, R & Pettit, C (2005) An update on planning support systems. Environment andPlanning B, 32(4), 4-6.
Laurian, L, Crawford, J, Day, M, Kouwenhoven, P, Mason, G, Ericksen, N, & Beattie, L (2010)Evaluating the outcomes of plans: theory, practice and methodology. Environment andPlanning B: Planning and Design, 37, 740-757.
Levine, N (2009) A motor vehicle safety planning support system: The Houston experience,in Planning Support Systems: Best Practices and New Methods, eds. Geertman, S &Stillwell, J., Springer-Verlag, Berlin, pp. 93-112.
Moudon, A & Hubner, S (2000) Monitoring land supply with geographic information systems:Theory, practice and parcel-based approaches. John Wiley & Sons, Toronto.
Oliveira, V, and Pinho, P (2010) Evaluation in urban planning: Advances and prospects. Journalof Planning Literature 24, 343-361.
Pebesma, E & Bivand, R (2005) Classes and methods for spatial data in R. R News 5 (2),http://cran.r-project.org/doc/Rnews/.
R Development Core Team (2013). R: A language and environment for statistical computing. RFoundation for Statistical Computing, Vienna, Austria. URL http://www.R-project.org.
Seasons, M (2003) Monitoring and evaluation in municipal planning: Considering the realities.Journal of the American Planning Association, 69(4), 430-440.
Schutzberg, A (2008) Five questions with Susan Marlow about parcel datasets. DirectionsMagazine, accessed online: 7/9/2013.
Silva, E & Clarke, K. (2002) Calibration of the SLEUTH urban growth model for Lisbon andPorto, Portugal. Computers, Environment and Urban Systems, 26(6), 525-552.
Snyder, K (2003) Tools for community design and decision making, in Planning Support Systemsin Practice, eds. Geertman, S & Stillwell, J, Springer-Verlag, Berlin, pp 99-120.
Sun, Z, Deal, B, & Pallathucheril, V (2009) The land-use evolution and impact assessmentmodel: A comprehensive urban planning support system, The Journal of the Urban andRegional Information Systems Association, 21(2), 57-68.
Talen, E (1996) Do plans get implemented? A review of evaluation in planning. Journal ofPlanning Literature, 10(3), 248-259.
U.S. Department of Housing and Urban Development (HUD) (2013) The Feasibility of Devel-oping a National Parcel Database: County Data Records Project Final Report.
Vonk, G, Geertman, S & Schot, P (2005) Bottlenecks blocking widespread usage of planningsupport systems. Environment and Planning A, 37(5), 909-924.
39

Waddell, P (2002) UrbanSIM: Modeling urban development for land use, transportation andenvironmental planning.Journal of the American Planning Association, 68(3), 297-314.
Waldner, L (2004) Planning to perform: Evaluation models for city planners, Berkeley PlanningJournal, 17(1), 1-28.
40