THE KROGER CO.
67
THE KROGER CO. 2013 Fact Book
-
Upload
khangminh22 -
Category
Documents
-
view
0 -
download
0
Transcript of THE KROGER CO.

THE KROGER CO. 2013 Fact Book
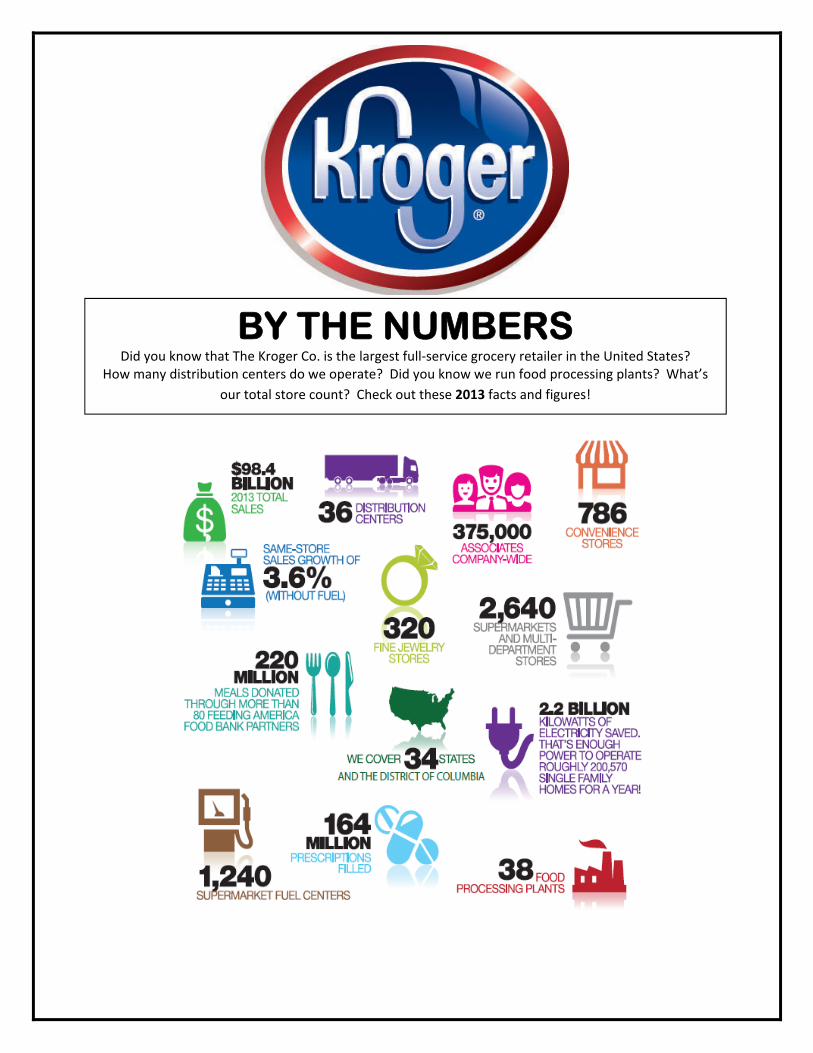
BY THE NUMBERS Did you know that The Kroger Co. is the largest full‐service grocery retailer in the United States?
How many distribution centers do we operate? Did you know we run food processing plants? What’s
our total store count? Check out these 2013 facts and figures!
The Kroger Co. Page 1
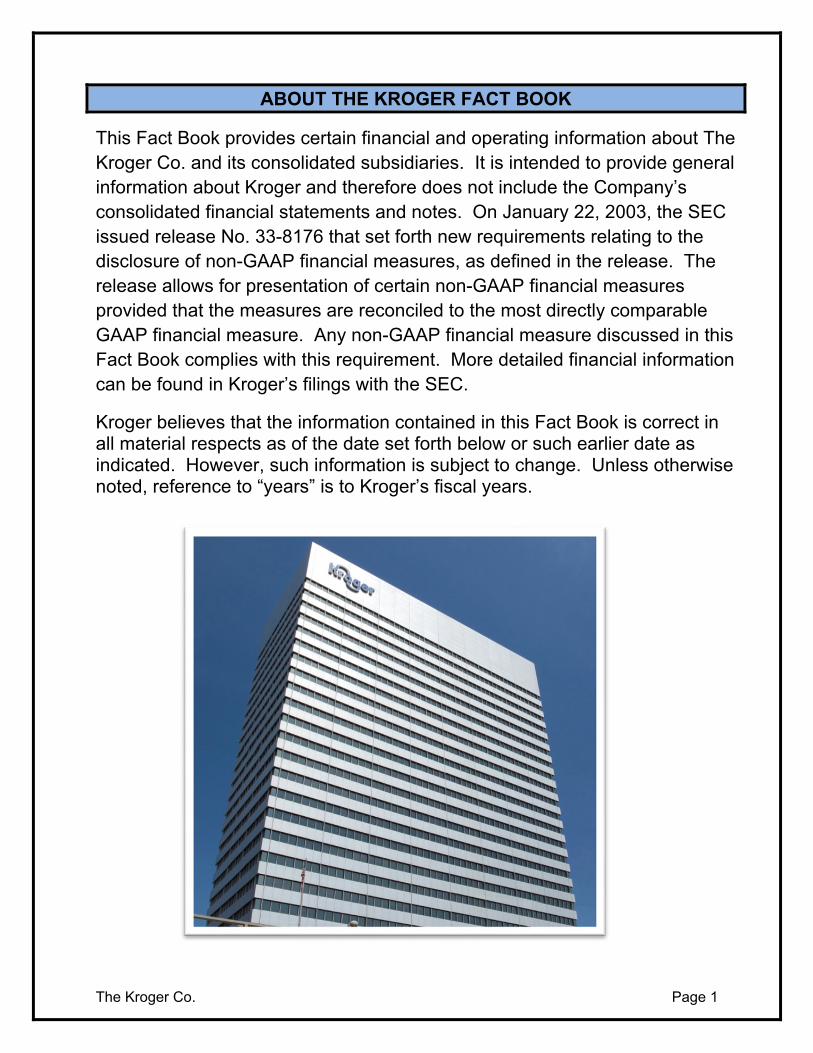
ABOUT THE KROGER FACT BOOK
This Fact Book provides certain financial and operating information about The Kroger Co. and its consolidated subsidiaries. It is intended to provide general information about Kroger and therefore does not include the Company’s consolidated financial statements and notes. On January 22, 2003, the SEC issued release No. 33-8176 that set forth new requirements relating to the disclosure of non-GAAP financial measures, as defined in the release. The release allows for presentation of certain non-GAAP financial measures provided that the measures are reconciled to the most directly comparable GAAP financial measure. Any non-GAAP financial measure discussed in this Fact Book complies with this requirement. More detailed financial information can be found in Kroger’s filings with the SEC.
Kroger believes that the information contained in this Fact Book is correct in all material respects as of the date set forth below or such earlier date as indicated. However, such information is subject to change. Unless otherwise noted, reference to “years” is to Kroger’s fiscal years.
The Kroger Co. Page 2
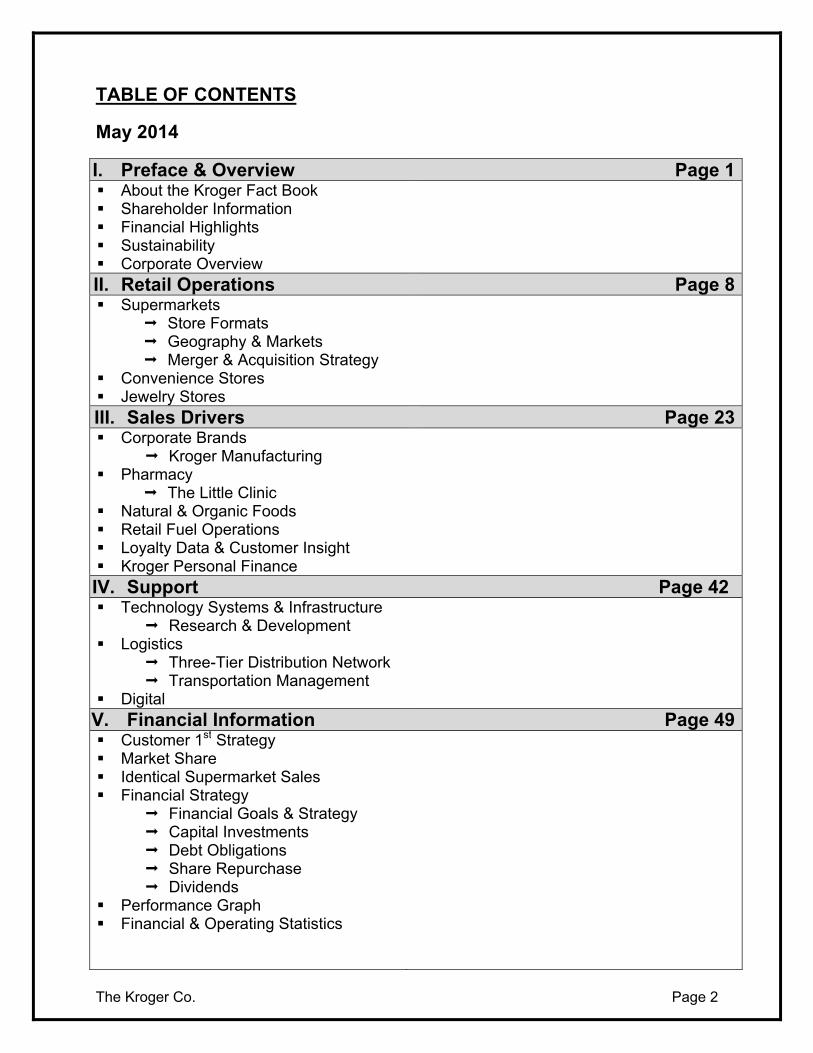
TABLE OF CONTENTS
May 2014
I. Preface & Overview Page 1 About the Kroger Fact Book Shareholder Information Financial Highlights Sustainability Corporate Overview
II. Retail Operations Page 8 Supermarkets
Store Formats Geography & Markets Merger & Acquisition Strategy
Convenience Stores Jewelry Stores
III. Sales Drivers Page 23 Corporate Brands
Kroger Manufacturing Pharmacy
The Little Clinic Natural & Organic Foods Retail Fuel Operations Loyalty Data & Customer Insight Kroger Personal Finance
IV. Support Page 42 Technology Systems & Infrastructure
Research & Development Logistics
Three-Tier Distribution Network Transportation Management
Digital V. Financial Information Page 49 Customer 1st Strategy Market Share Identical Supermarket Sales Financial Strategy
Financial Goals & Strategy Capital Investments Debt Obligations Share Repurchase Dividends
Performance Graph Financial & Operating Statistics

The Kroger Co. Page 3
SHAREHOLDER INFORMATION
CORPORATE OFFICE
1014 Vine Street Cincinnati, OH 45202
(513) 762-4000 www.thekrogerco.com or ir.kroger.com
Shareholder Services (513) 762-4808 Investor Relations & Financial Materials Requests
(513) 762-4366 e-mail: [email protected]
STOCK TRANSFER AGENT & REGISTRAR
Wells Fargo Shareowner Services P.O. Box 64874 St. Paul, MN 55164-0874
(800) 468-9716 [toll free] e-mail: [email protected] www.shareowneronline.com
2014 FISCAL CALENDAR
First Quarter February 2 – May 24 Second Quarter May 25 – August 16
Third Quarter August 17 – November 8 Fourth Quarter November 9 – January 31, 2015
Number of Employees 375,000 Shareholders of Record as of March 28, 2014 30,449 Common Diluted Shares Outstanding (FY 2013) 519,785,486* Common Diluted Shares Outstanding (FY 2012) 536,636,984* Exchanges NYSE Ticker KR
*Represents a weighted average outstanding amount during the fiscal year.
HIGH, LOW & CLOSING STOCK PRICE BY QUARTER Fiscal 2013 Fiscal 2012
Quarter High Low Close High Low Close 1st $35.44 $27.53 $34.23 $24.78 $21.76 $21.81 2nd $39.98 $32.77 $38.25 $23.22 $20.98 $22.50 3rd $43.85 $35.91 $41.96 $25.44 $21.57 $24.93 4th $42.73 $35.71 $36.10 $28.00 $24.19 $27.89
The Kroger Co. Page 4
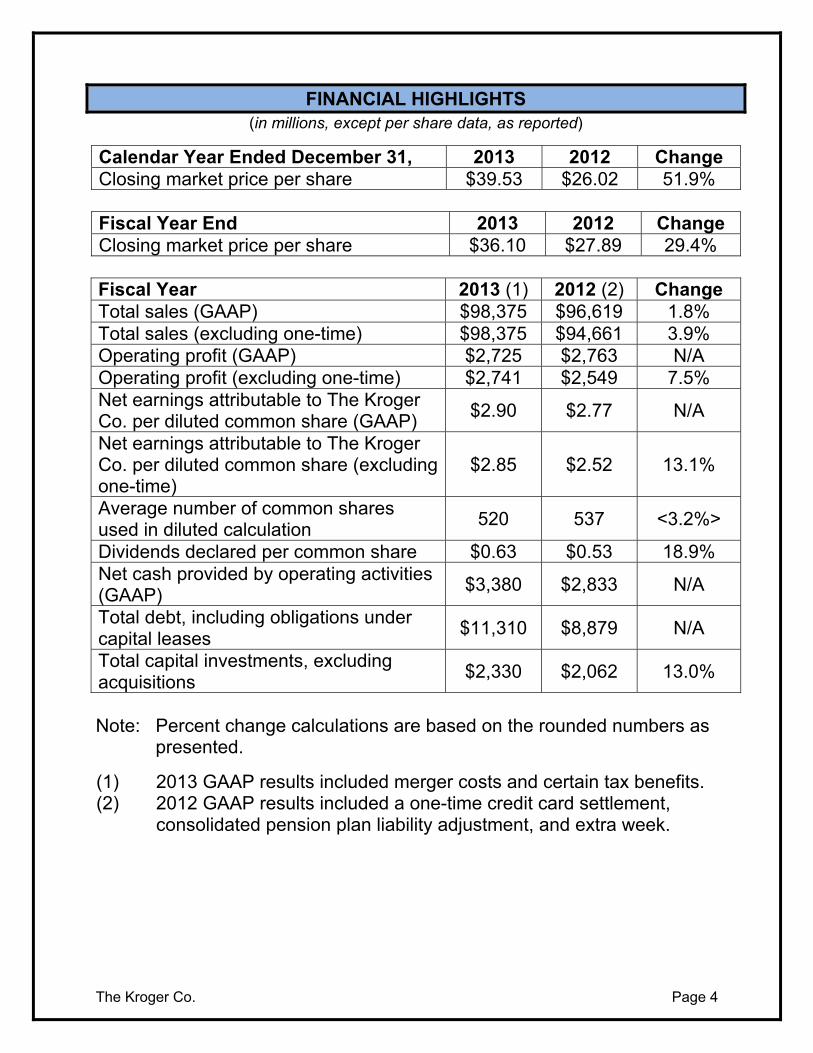
FINANCIAL HIGHLIGHTS (in millions, except per share data, as reported)
Calendar Year Ended December 31, 2013 2012 Change Closing market price per share $39.53 $26.02 51.9% Fiscal Year End 2013 2012 Change Closing market price per share $36.10 $27.89 29.4% Fiscal Year 2013 (1) 2012 (2) Change Total sales (GAAP) $98,375 $96,619 1.8% Total sales (excluding one-time) $98,375 $94,661 3.9% Operating profit (GAAP) $2,725 $2,763 N/A Operating profit (excluding one-time) $2,741 $2,549 7.5% Net earnings attributable to The Kroger Co. per diluted common share (GAAP)
$2.90 $2.77 N/A
Net earnings attributable to The Kroger Co. per diluted common share (excluding one-time)
$2.85 $2.52 13.1%
Average number of common shares used in diluted calculation
520 537 <3.2%>
Dividends declared per common share $0.63 $0.53 18.9% Net cash provided by operating activities (GAAP)
$3,380 $2,833 N/A
Total debt, including obligations under capital leases
$11,310 $8,879 N/A
Total capital investments, excluding acquisitions
$2,330 $2,062 13.0%
Note: Percent change calculations are based on the rounded numbers as
presented.
(1) 2013 GAAP results included merger costs and certain tax benefits. (2) 2012 GAAP results included a one-time credit card settlement,
consolidated pension plan liability adjustment, and extra week.
The Kroger Co. Page 5
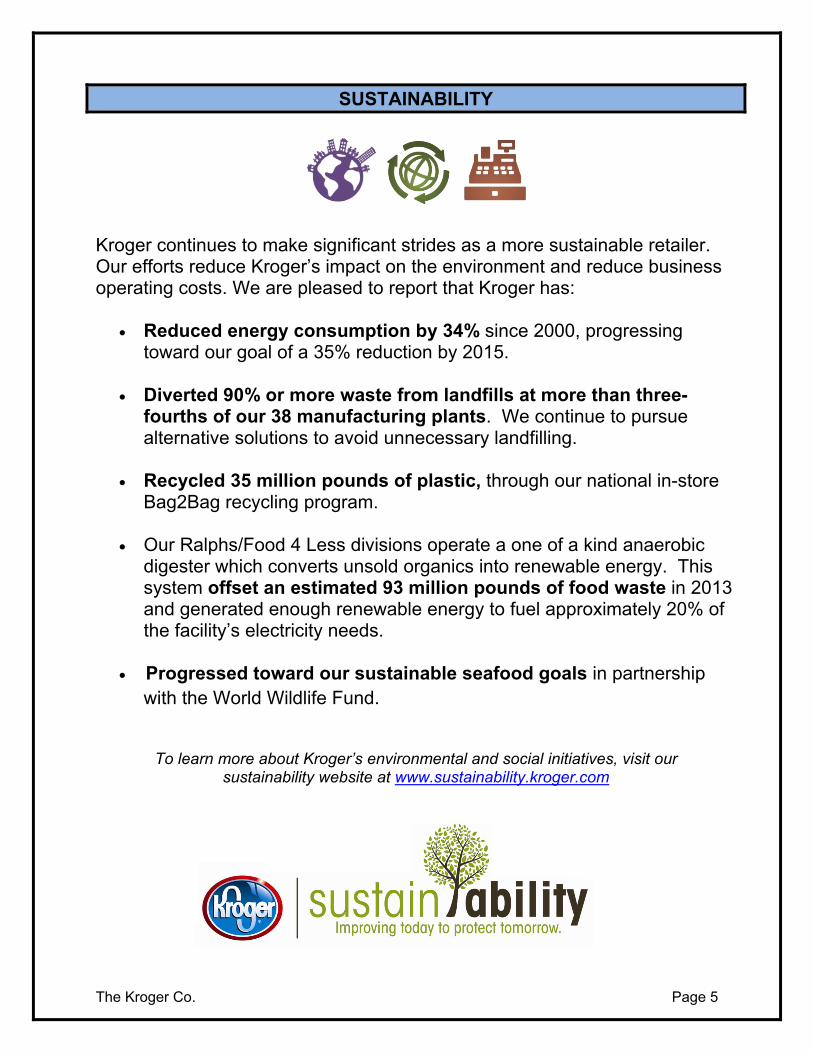
SUSTAINABILITY
Kroger continues to make significant strides as a more sustainable retailer. Our efforts reduce Kroger’s impact on the environment and reduce business operating costs. We are pleased to report that Kroger has:
Reduced energy consumption by 34% since 2000, progressing
toward our goal of a 35% reduction by 2015.
Diverted 90% or more waste from landfills at more than three-fourths of our 38 manufacturing plants. We continue to pursue alternative solutions to avoid unnecessary landfilling.
Recycled 35 million pounds of plastic, through our national in-store
Bag2Bag recycling program.
Our Ralphs/Food 4 Less divisions operate a one of a kind anaerobic digester which converts unsold organics into renewable energy. This system offset an estimated 93 million pounds of food waste in 2013 and generated enough renewable energy to fuel approximately 20% of the facility’s electricity needs.
Progressed toward our sustainable seafood goals in partnership
with the World Wildlife Fund.
To learn more about Kroger’s environmental and social initiatives, visit our sustainability website at www.sustainability.kroger.com
The Kroger Co. Page 6
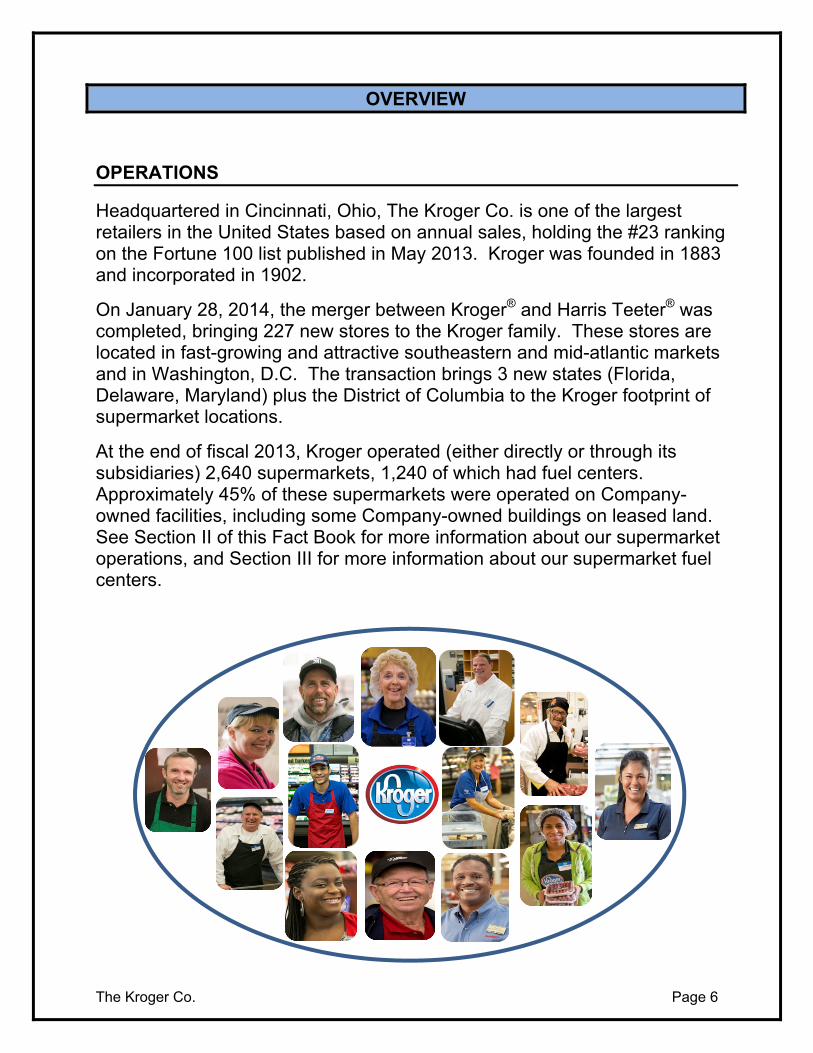
OVERVIEW
OPERATIONS
Headquartered in Cincinnati, Ohio, The Kroger Co. is one of the largest retailers in the United States based on annual sales, holding the #23 ranking on the Fortune 100 list published in May 2013. Kroger was founded in 1883 and incorporated in 1902.
On January 28, 2014, the merger between Kroger® and Harris Teeter® was completed, bringing 227 new stores to the Kroger family. These stores are located in fast-growing and attractive southeastern and mid-atlantic markets and in Washington, D.C. The transaction brings 3 new states (Florida, Delaware, Maryland) plus the District of Columbia to the Kroger footprint of supermarket locations.
At the end of fiscal 2013, Kroger operated (either directly or through its subsidiaries) 2,640 supermarkets, 1,240 of which had fuel centers. Approximately 45% of these supermarkets were operated on Company-owned facilities, including some Company-owned buildings on leased land. See Section II of this Fact Book for more information about our supermarket operations, and Section III for more information about our supermarket fuel centers.
The Kroger Co. Page 7
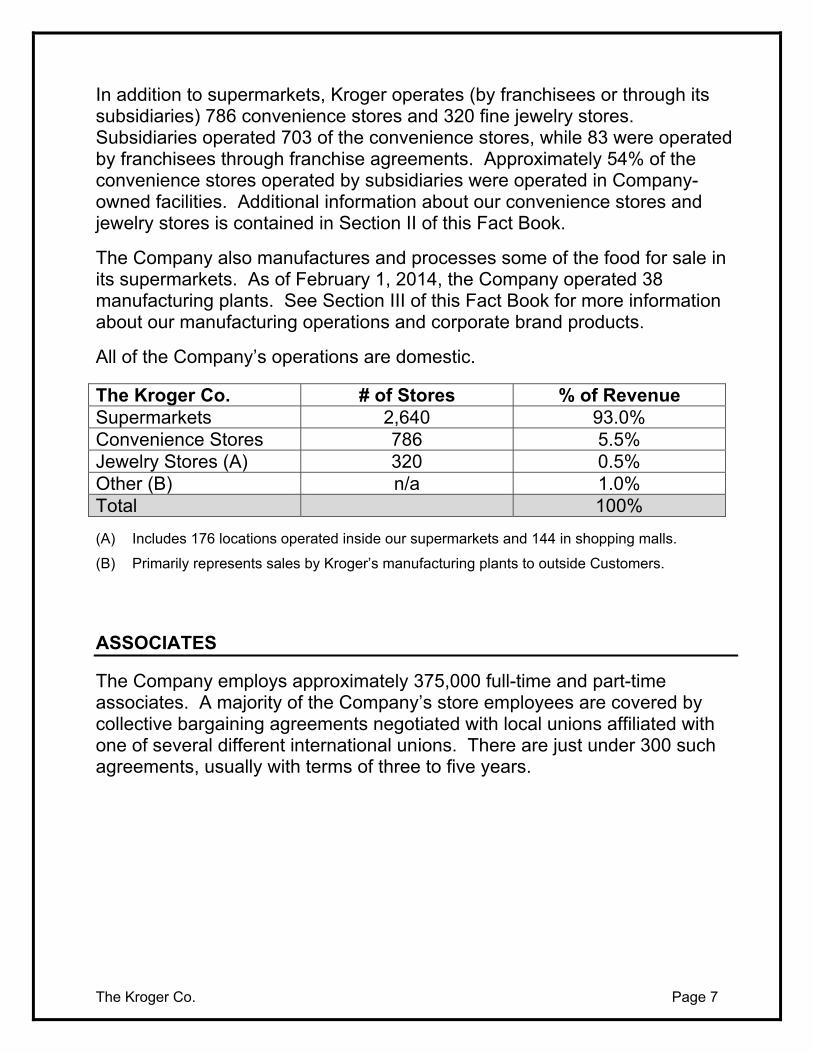
In addition to supermarkets, Kroger operates (by franchisees or through its subsidiaries) 786 convenience stores and 320 fine jewelry stores. Subsidiaries operated 703 of the convenience stores, while 83 were operated by franchisees through franchise agreements. Approximately 54% of the convenience stores operated by subsidiaries were operated in Company-owned facilities. Additional information about our convenience stores and jewelry stores is contained in Section II of this Fact Book.
The Company also manufactures and processes some of the food for sale in its supermarkets. As of February 1, 2014, the Company operated 38 manufacturing plants. See Section III of this Fact Book for more information about our manufacturing operations and corporate brand products.
All of the Company’s operations are domestic.
The Kroger Co. # of Stores % of Revenue Supermarkets 2,640 93.0% Convenience Stores 786 5.5% Jewelry Stores (A) 320 0.5% Other (B) n/a 1.0% Total 100%
(A) Includes 176 locations operated inside our supermarkets and 144 in shopping malls.
(B) Primarily represents sales by Kroger’s manufacturing plants to outside Customers.
ASSOCIATES
The Company employs approximately 375,000 full-time and part-time associates. A majority of the Company’s store employees are covered by collective bargaining agreements negotiated with local unions affiliated with one of several different international unions. There are just under 300 such agreements, usually with terms of three to five years.
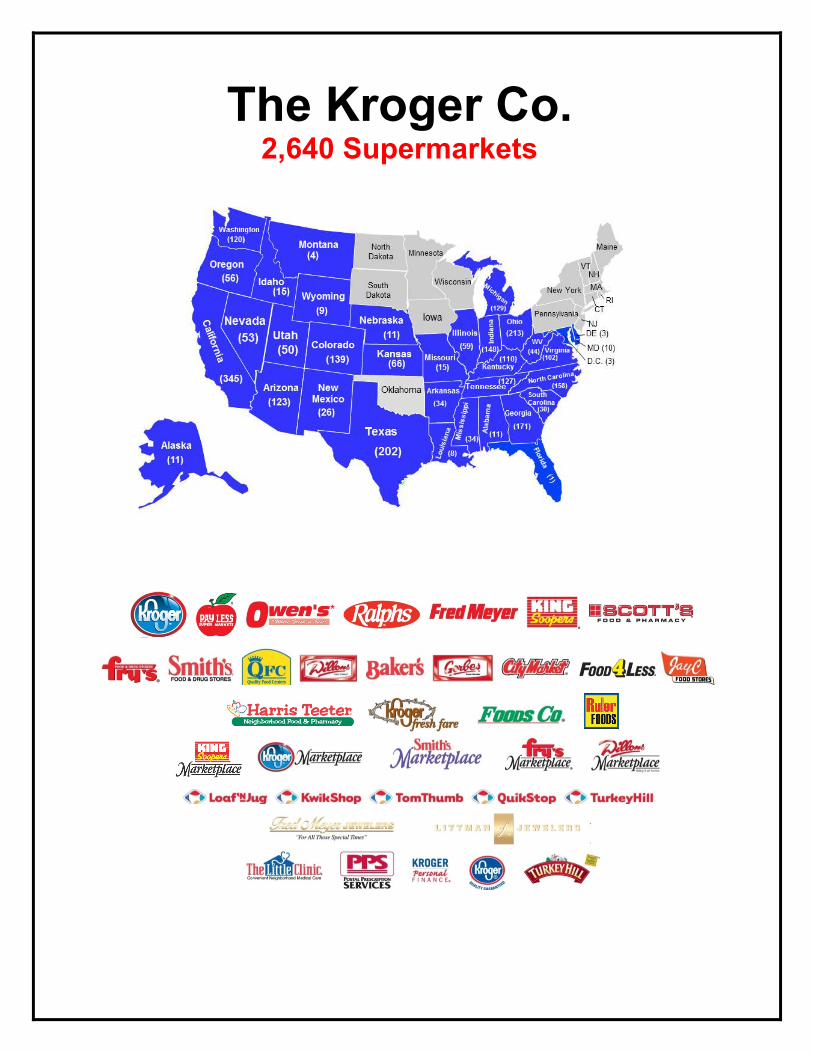
The Kroger Co. 2,640 Supermarkets
The Kroger Co. Page 8
SUPERMARKETS
STORE FORMATS
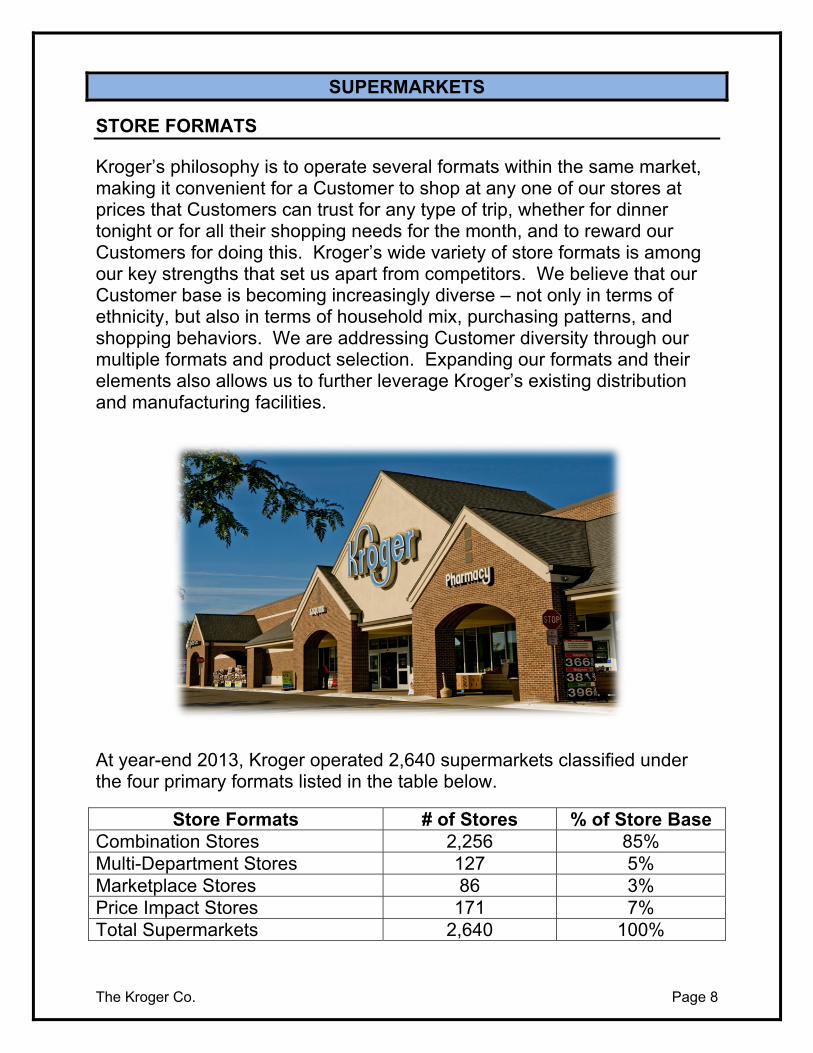
Kroger’s philosophy is to operate several formats within the same market, making it convenient for a Customer to shop at any one of our stores at prices that Customers can trust for any type of trip, whether for dinner tonight or for all their shopping needs for the month, and to reward our Customers for doing this. Kroger’s wide variety of store formats is among our key strengths that set us apart from competitors. We believe that our Customer base is becoming increasingly diverse – not only in terms of ethnicity, but also in terms of household mix, purchasing patterns, and shopping behaviors. We are addressing Customer diversity through our multiple formats and product selection. Expanding our formats and their elements also allows us to further leverage Kroger’s existing distribution and manufacturing facilities.
At year-end 2013, Kroger operated 2,640 supermarkets classified under the four primary formats listed in the table below.
Store Formats # of Stores % of Store Base Combination Stores 2,256 85% Multi-Department Stores 127 5% Marketplace Stores 86 3% Price Impact Stores 171 7% Total Supermarkets 2,640 100%
The Kroger Co. Page 9
Combination Store
Banners Baker’s City Market Dillons Food Stores Fry’s Food & Drug Gerbes Super Markets
Harris Teeter Jay C King Soopers Kroger Owen’s
Pay Less Super Markets QFC Ralphs Scott’s Smith’s
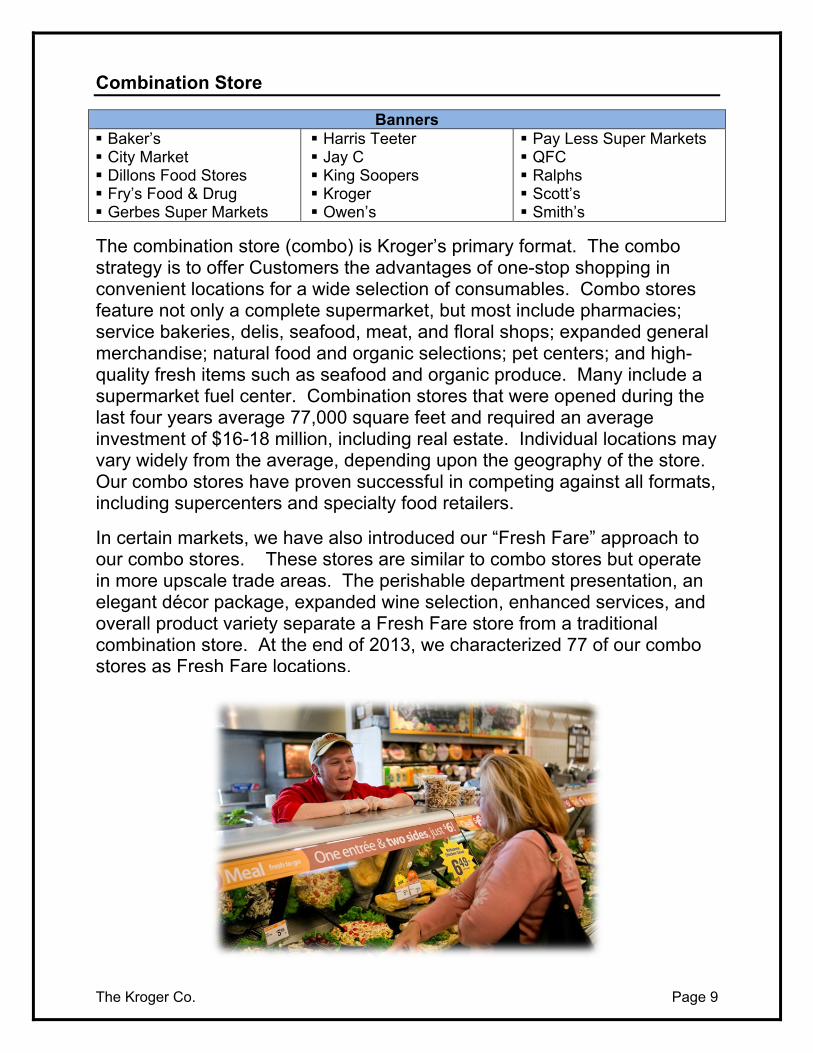
The combination store (combo) is Kroger’s primary format. The combo strategy is to offer Customers the advantages of one-stop shopping in convenient locations for a wide selection of consumables. Combo stores feature not only a complete supermarket, but most include pharmacies; service bakeries, delis, seafood, meat, and floral shops; expanded general merchandise; natural food and organic selections; pet centers; and high-quality fresh items such as seafood and organic produce. Many include a supermarket fuel center. Combination stores that were opened during the last four years average 77,000 square feet and required an average investment of $16-18 million, including real estate. Individual locations may vary widely from the average, depending upon the geography of the store. Our combo stores have proven successful in competing against all formats, including supercenters and specialty food retailers.
In certain markets, we have also introduced our “Fresh Fare” approach to our combo stores. These stores are similar to combo stores but operate in more upscale trade areas. The perishable department presentation, an elegant décor package, expanded wine selection, enhanced services, and overall product variety separate a Fresh Fare store from a traditional combination store. At the end of 2013, we characterized 77 of our combo stores as Fresh Fare locations.
The Kroger Co. Page 10
Multi-Department Stores
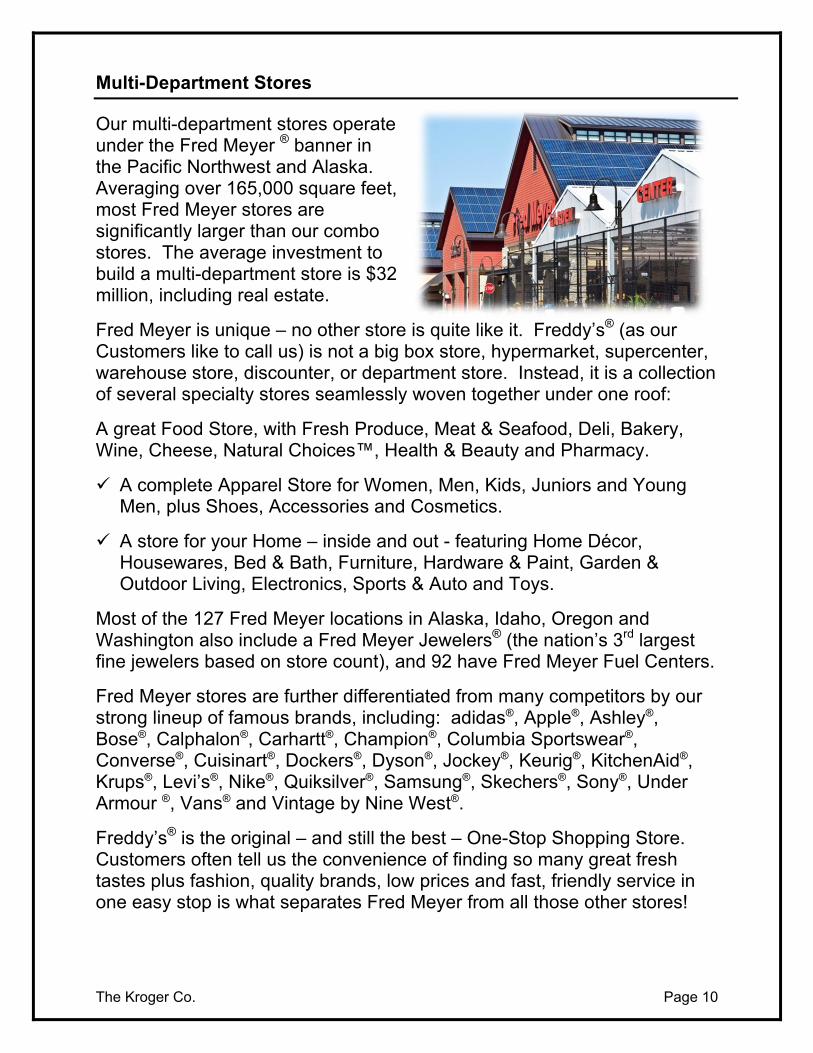
Our multi-department stores operate under the Fred Meyer ® banner in the Pacific Northwest and Alaska. Averaging over 165,000 square feet, most Fred Meyer stores are significantly larger than our combo stores. The average investment to build a multi-department store is $32 million, including real estate.
Fred Meyer is unique – no other store is quite like it. Freddy’s® (as our Customers like to call us) is not a big box store, hypermarket, supercenter, warehouse store, discounter, or department store. Instead, it is a collection of several specialty stores seamlessly woven together under one roof:
A great Food Store, with Fresh Produce, Meat & Seafood, Deli, Bakery, Wine, Cheese, Natural Choices™, Health & Beauty and Pharmacy.
A complete Apparel Store for Women, Men, Kids, Juniors and Young Men, plus Shoes, Accessories and Cosmetics.
A store for your Home – inside and out - featuring Home Décor, Housewares, Bed & Bath, Furniture, Hardware & Paint, Garden & Outdoor Living, Electronics, Sports & Auto and Toys.
Most of the 127 Fred Meyer locations in Alaska, Idaho, Oregon and Washington also include a Fred Meyer Jewelers® (the nation’s 3rd largest fine jewelers based on store count), and 92 have Fred Meyer Fuel Centers.
Fred Meyer stores are further differentiated from many competitors by our strong lineup of famous brands, including: adidas®, Apple®, Ashley®, Bose®, Calphalon®, Carhartt®, Champion®, Columbia Sportswear®, Converse®, Cuisinart®, Dockers®, Dyson®, Jockey®, Keurig®, KitchenAid®, Krups®, Levi’s®, Nike®, Quiksilver®, Samsung®, Skechers®, Sony®, Under Armour ®, Vans® and Vintage by Nine West®.
Freddy’s® is the original – and still the best – One-Stop Shopping Store. Customers often tell us the convenience of finding so many great fresh tastes plus fashion, quality brands, low prices and fast, friendly service in one easy stop is what separates Fred Meyer from all those other stores!
The Kroger Co. Page 11
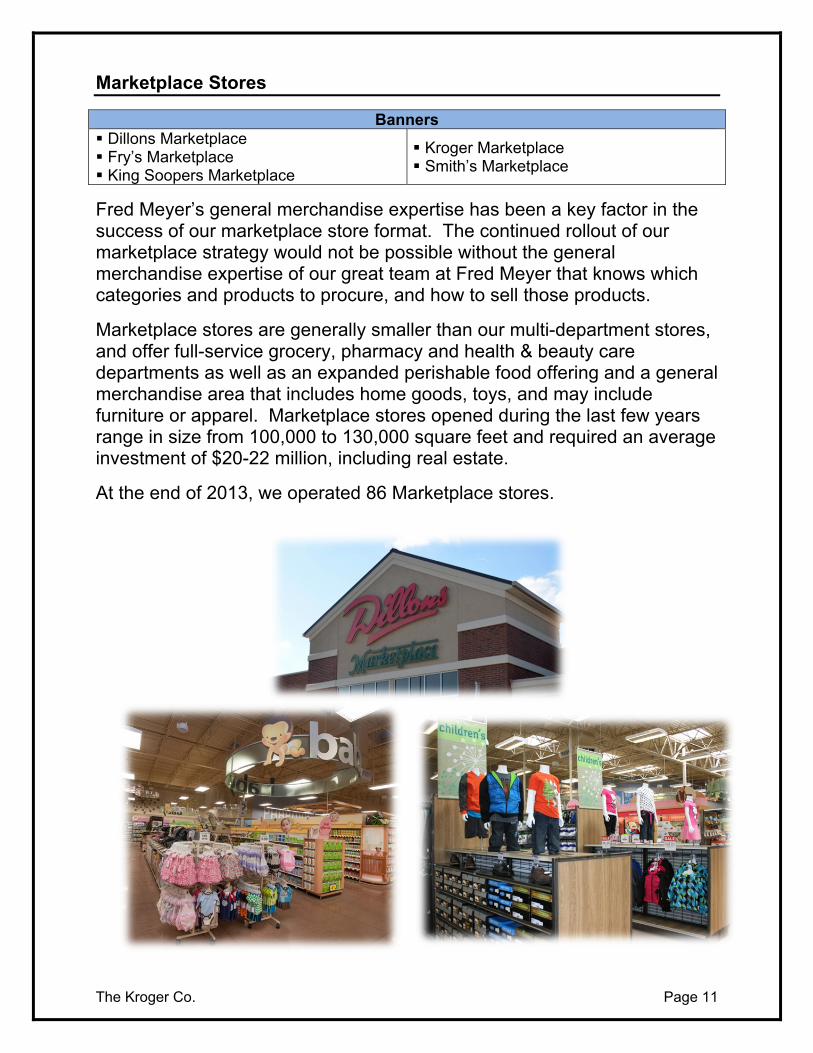
Marketplace Stores
Banners Dillons Marketplace Fry’s Marketplace King Soopers Marketplace
Kroger Marketplace Smith’s Marketplace
Fred Meyer’s general merchandise expertise has been a key factor in the success of our marketplace store format. The continued rollout of our marketplace strategy would not be possible without the general merchandise expertise of our great team at Fred Meyer that knows which categories and products to procure, and how to sell those products.
Marketplace stores are generally smaller than our multi-department stores, and offer full-service grocery, pharmacy and health & beauty care departments as well as an expanded perishable food offering and a general merchandise area that includes home goods, toys, and may include furniture or apparel. Marketplace stores opened during the last few years range in size from 100,000 to 130,000 square feet and required an average investment of $20-22 million, including real estate.
At the end of 2013, we operated 86 Marketplace stores.
The Kroger Co. Page 12
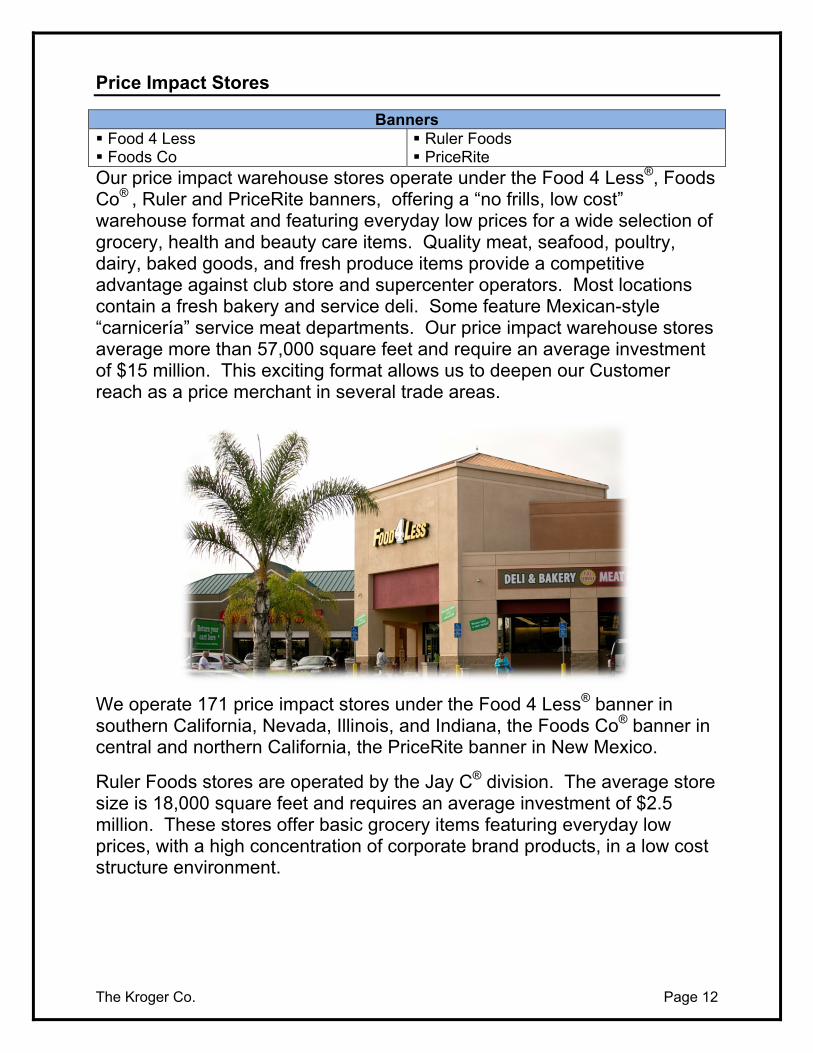
Price Impact Stores
Banners Food 4 Less Foods Co
Ruler Foods PriceRite
Our price impact warehouse stores operate under the Food 4 Less®, Foods Co® , Ruler and PriceRite banners, offering a “no frills, low cost” warehouse format and featuring everyday low prices for a wide selection of grocery, health and beauty care items. Quality meat, seafood, poultry, dairy, baked goods, and fresh produce items provide a competitive advantage against club store and supercenter operators. Most locations contain a fresh bakery and service deli. Some feature Mexican-style “carnicería” service meat departments. Our price impact warehouse stores average more than 57,000 square feet and require an average investment of $15 million. This exciting format allows us to deepen our Customer reach as a price merchant in several trade areas.
We operate 171 price impact stores under the Food 4 Less® banner in southern California, Nevada, Illinois, and Indiana, the Foods Co® banner in central and northern California, the PriceRite banner in New Mexico.
Ruler Foods stores are operated by the Jay C® division. The average store size is 18,000 square feet and requires an average investment of $2.5 million. These stores offer basic grocery items featuring everyday low prices, with a high concentration of corporate brand products, in a low cost structure environment.
The Kroger Co. Page 13
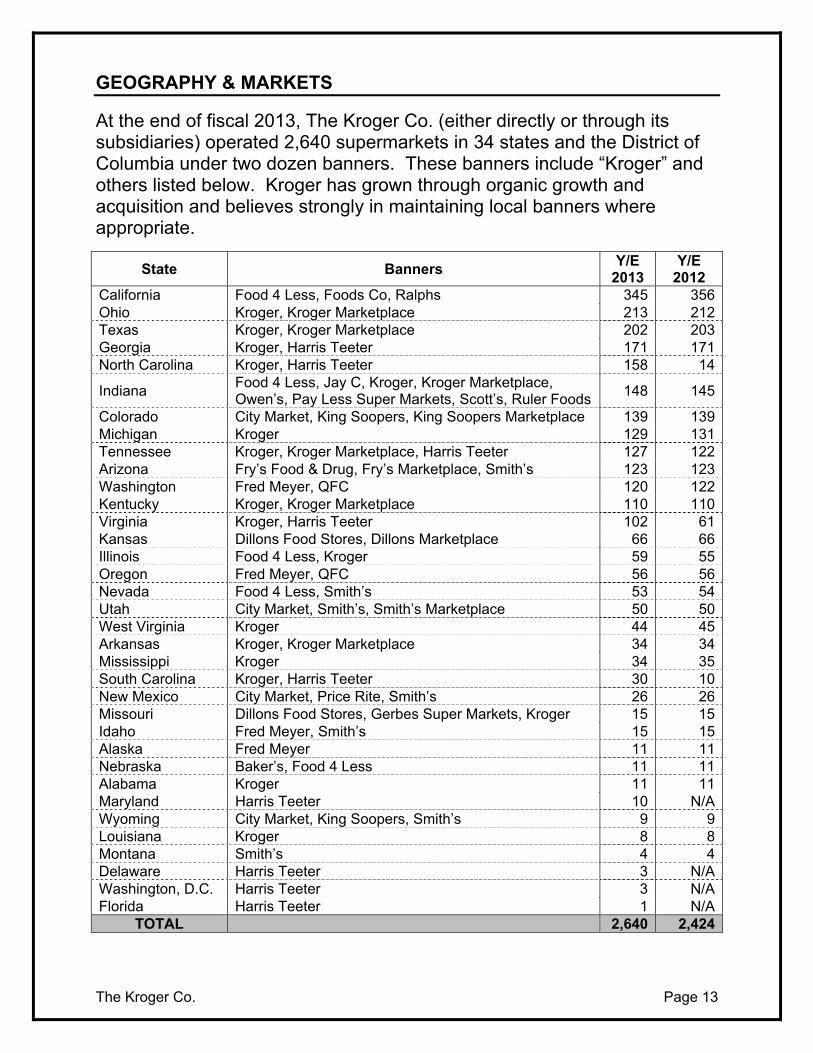
GEOGRAPHY & MARKETS
At the end of fiscal 2013, The Kroger Co. (either directly or through its subsidiaries) operated 2,640 supermarkets in 34 states and the District of Columbia under two dozen banners. These banners include “Kroger” and others listed below. Kroger has grown through organic growth and acquisition and believes strongly in maintaining local banners where appropriate.
State Banners Y/E
2013 Y/E
2012 California Food 4 Less, Foods Co, Ralphs 345 356Ohio Kroger, Kroger Marketplace 213 212Texas Kroger, Kroger Marketplace 202 203Georgia Kroger, Harris Teeter 171 171North Carolina Kroger, Harris Teeter 158 14
Indiana Food 4 Less, Jay C, Kroger, Kroger Marketplace, Owen’s, Pay Less Super Markets, Scott’s, Ruler Foods
148 145
Colorado City Market, King Soopers, King Soopers Marketplace 139 139Michigan Kroger 129 131Tennessee Kroger, Kroger Marketplace, Harris Teeter 127 122Arizona Fry’s Food & Drug, Fry’s Marketplace, Smith’s 123 123Washington Fred Meyer, QFC 120 122Kentucky Kroger, Kroger Marketplace 110 110Virginia Kroger, Harris Teeter 102 61Kansas Dillons Food Stores, Dillons Marketplace 66 66Illinois Food 4 Less, Kroger 59 55Oregon Fred Meyer, QFC 56 56Nevada Food 4 Less, Smith’s 53 54Utah City Market, Smith’s, Smith’s Marketplace 50 50West Virginia Kroger 44 45Arkansas Kroger, Kroger Marketplace 34 34Mississippi Kroger 34 35South Carolina Kroger, Harris Teeter 30 10New Mexico City Market, Price Rite, Smith’s 26 26Missouri Dillons Food Stores, Gerbes Super Markets, Kroger 15 15Idaho Fred Meyer, Smith’s 15 15Alaska Fred Meyer 11 11Nebraska Baker’s, Food 4 Less 11 11Alabama Kroger 11 11Maryland Harris Teeter 10 N/AWyoming City Market, King Soopers, Smith’s 9 9Louisiana Kroger 8 8Montana Smith’s 4 4Delaware Harris Teeter 3 N/AWashington, D.C. Harris Teeter 3 N/AFlorida Harris Teeter 1 N/A
TOTAL 2,640 2,424
The Kroger Co. Page 14
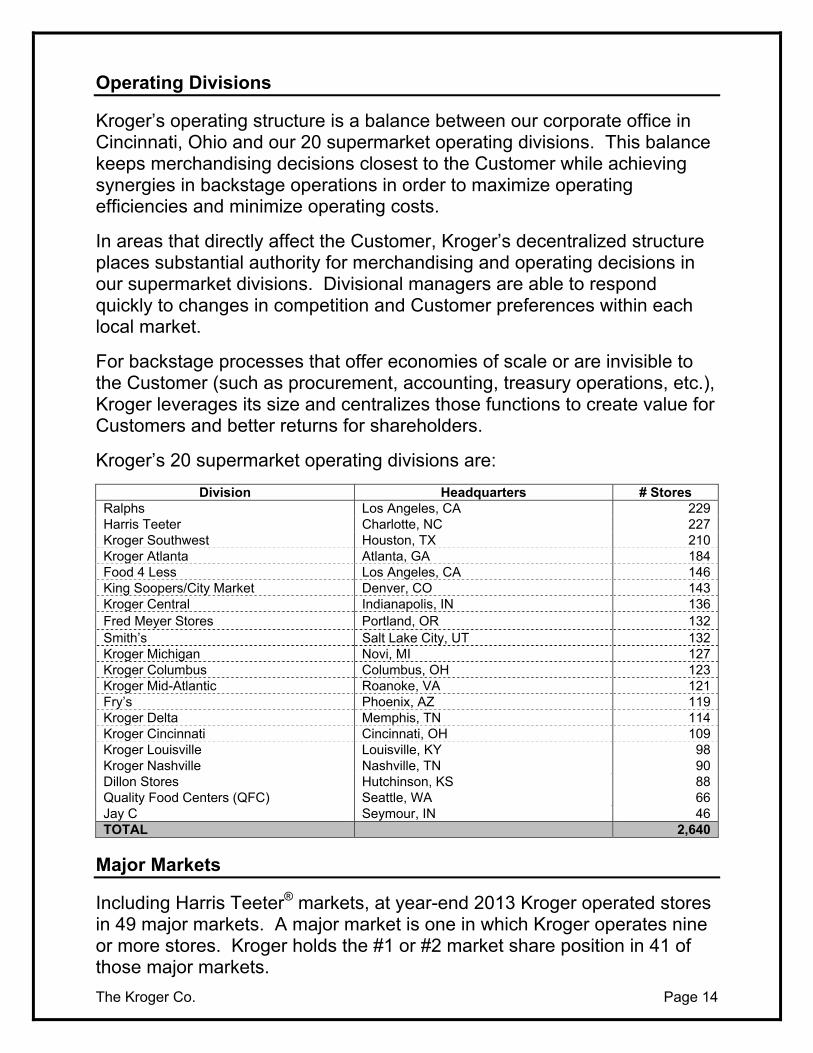
Operating Divisions
Kroger’s operating structure is a balance between our corporate office in Cincinnati, Ohio and our 20 supermarket operating divisions. This balance keeps merchandising decisions closest to the Customer while achieving synergies in backstage operations in order to maximize operating efficiencies and minimize operating costs.
In areas that directly affect the Customer, Kroger’s decentralized structure places substantial authority for merchandising and operating decisions in our supermarket divisions. Divisional managers are able to respond quickly to changes in competition and Customer preferences within each local market.
For backstage processes that offer economies of scale or are invisible to the Customer (such as procurement, accounting, treasury operations, etc.), Kroger leverages its size and centralizes those functions to create value for Customers and better returns for shareholders.
Kroger’s 20 supermarket operating divisions are:
Division Headquarters # Stores Ralphs Los Angeles, CA 229Harris Teeter Charlotte, NC 227Kroger Southwest Houston, TX 210Kroger Atlanta Atlanta, GA 184Food 4 Less Los Angeles, CA 146King Soopers/City Market Denver, CO 143Kroger Central Indianapolis, IN 136Fred Meyer Stores Portland, OR 132Smith’s Salt Lake City, UT 132Kroger Michigan Novi, MI 127Kroger Columbus Columbus, OH 123Kroger Mid-Atlantic Roanoke, VA 121Fry’s Phoenix, AZ 119Kroger Delta Memphis, TN 114Kroger Cincinnati Cincinnati, OH 109Kroger Louisville Louisville, KY 98Kroger Nashville Nashville, TN 90Dillon Stores Hutchinson, KS 88Quality Food Centers (QFC) Seattle, WA 66Jay C Seymour, IN 46TOTAL 2,640
Major Markets
Including Harris Teeter® markets, at year-end 2013 Kroger operated stores in 49 major markets. A major market is one in which Kroger operates nine or more stores. Kroger holds the #1 or #2 market share position in 41 of those major markets.
The Kroger Co. Page 15
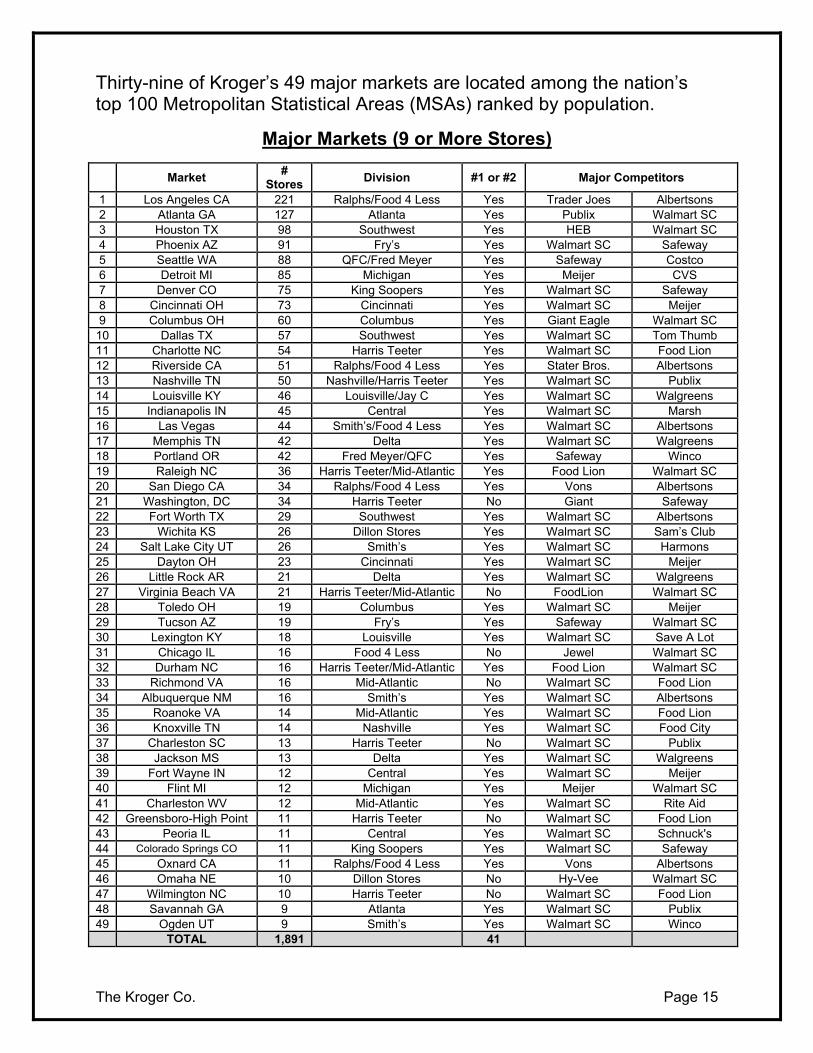
Thirty-nine of Kroger’s 49 major markets are located among the nation’s top 100 Metropolitan Statistical Areas (MSAs) ranked by population.
Major Markets (9 or More Stores)
Market #
Stores Division #1 or #2 Major Competitors
1 Los Angeles CA 221 Ralphs/Food 4 Less Yes Trader Joes Albertsons 2 Atlanta GA 127 Atlanta Yes Publix Walmart SC 3 Houston TX 98 Southwest Yes HEB Walmart SC 4 Phoenix AZ 91 Fry’s Yes Walmart SC Safeway 5 Seattle WA 88 QFC/Fred Meyer Yes Safeway Costco 6 Detroit MI 85 Michigan Yes Meijer CVS 7 Denver CO 75 King Soopers Yes Walmart SC Safeway 8 Cincinnati OH 73 Cincinnati Yes Walmart SC Meijer 9 Columbus OH 60 Columbus Yes Giant Eagle Walmart SC
10 Dallas TX 57 Southwest Yes Walmart SC Tom Thumb 11 Charlotte NC 54 Harris Teeter Yes Walmart SC Food Lion 12 Riverside CA 51 Ralphs/Food 4 Less Yes Stater Bros. Albertsons 13 Nashville TN 50 Nashville/Harris Teeter Yes Walmart SC Publix 14 Louisville KY 46 Louisville/Jay C Yes Walmart SC Walgreens 15 Indianapolis IN 45 Central Yes Walmart SC Marsh 16 Las Vegas 44 Smith’s/Food 4 Less Yes Walmart SC Albertsons 17 Memphis TN 42 Delta Yes Walmart SC Walgreens 18 Portland OR 42 Fred Meyer/QFC Yes Safeway Winco 19 Raleigh NC 36 Harris Teeter/Mid-Atlantic Yes Food Lion Walmart SC 20 San Diego CA 34 Ralphs/Food 4 Less Yes Vons Albertsons 21 Washington, DC 34 Harris Teeter No Giant Safeway 22 Fort Worth TX 29 Southwest Yes Walmart SC Albertsons 23 Wichita KS 26 Dillon Stores Yes Walmart SC Sam’s Club 24 Salt Lake City UT 26 Smith’s Yes Walmart SC Harmons 25 Dayton OH 23 Cincinnati Yes Walmart SC Meijer 26 Little Rock AR 21 Delta Yes Walmart SC Walgreens 27 Virginia Beach VA 21 Harris Teeter/Mid-Atlantic No FoodLion Walmart SC 28 Toledo OH 19 Columbus Yes Walmart SC Meijer 29 Tucson AZ 19 Fry’s Yes Safeway Walmart SC 30 Lexington KY 18 Louisville Yes Walmart SC Save A Lot 31 Chicago IL 16 Food 4 Less No Jewel Walmart SC 32 Durham NC 16 Harris Teeter/Mid-Atlantic Yes Food Lion Walmart SC 33 Richmond VA 16 Mid-Atlantic No Walmart SC Food Lion 34 Albuquerque NM 16 Smith’s Yes Walmart SC Albertsons 35 Roanoke VA 14 Mid-Atlantic Yes Walmart SC Food Lion 36 Knoxville TN 14 Nashville Yes Walmart SC Food City 37 Charleston SC 13 Harris Teeter No Walmart SC Publix 38 Jackson MS 13 Delta Yes Walmart SC Walgreens 39 Fort Wayne IN 12 Central Yes Walmart SC Meijer 40 Flint MI 12 Michigan Yes Meijer Walmart SC 41 Charleston WV 12 Mid-Atlantic Yes Walmart SC Rite Aid 42 Greensboro-High Point 11 Harris Teeter No Walmart SC Food Lion 43 Peoria IL 11 Central Yes Walmart SC Schnuck's 44 Colorado Springs CO 11 King Soopers Yes Walmart SC Safeway 45 Oxnard CA 11 Ralphs/Food 4 Less Yes Vons Albertsons 46 Omaha NE 10 Dillon Stores No Hy-Vee Walmart SC 47 Wilmington NC 10 Harris Teeter No Walmart SC Food Lion 48 Savannah GA 9 Atlanta Yes Walmart SC Publix 49 Ogden UT 9 Smith’s Yes Walmart SC Winco TOTAL 1,891 41
The Kroger Co. Page 16
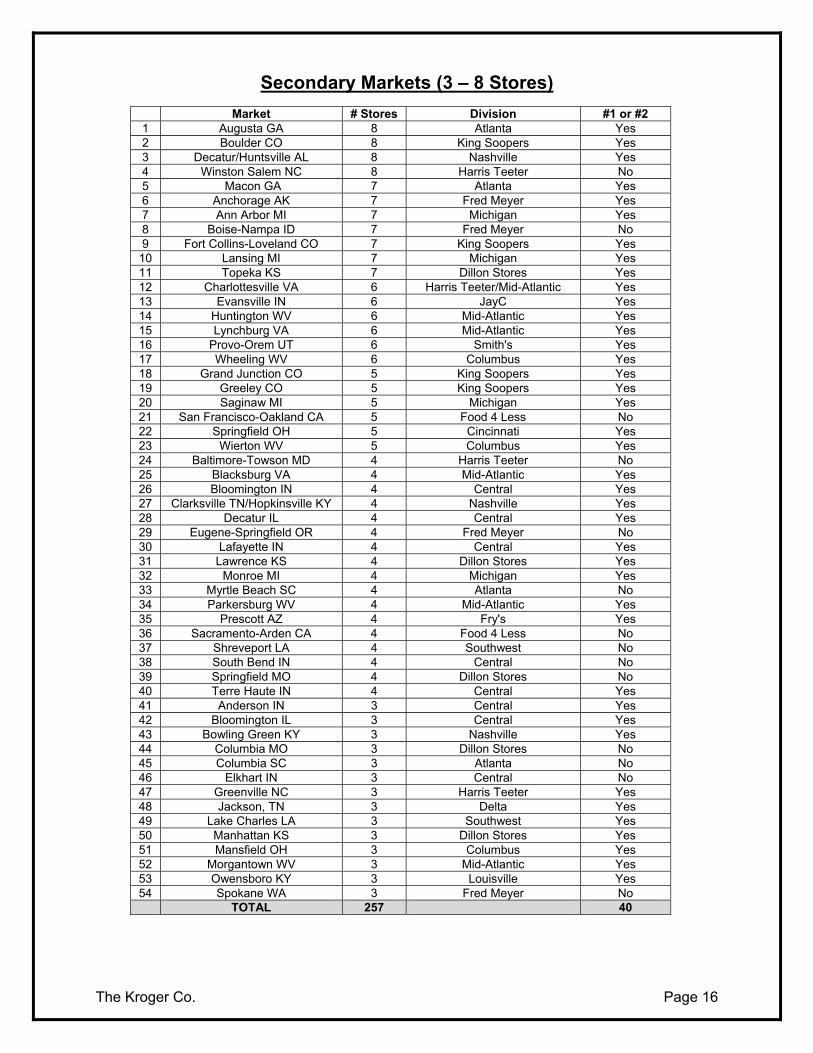
Secondary Markets (3 – 8 Stores)
Market # Stores Division #1 or #2 1 Augusta GA 8 Atlanta Yes 2 Boulder CO 8 King Soopers Yes 3 Decatur/Huntsville AL 8 Nashville Yes 4 Winston Salem NC 8 Harris Teeter No 5 Macon GA 7 Atlanta Yes 6 Anchorage AK 7 Fred Meyer Yes 7 Ann Arbor MI 7 Michigan Yes 8 Boise-Nampa ID 7 Fred Meyer No 9 Fort Collins-Loveland CO 7 King Soopers Yes
10 Lansing MI 7 Michigan Yes 11 Topeka KS 7 Dillon Stores Yes 12 Charlottesville VA 6 Harris Teeter/Mid-Atlantic Yes 13 Evansville IN 6 JayC Yes 14 Huntington WV 6 Mid-Atlantic Yes 15 Lynchburg VA 6 Mid-Atlantic Yes 16 Provo-Orem UT 6 Smith's Yes 17 Wheeling WV 6 Columbus Yes 18 Grand Junction CO 5 King Soopers Yes 19 Greeley CO 5 King Soopers Yes 20 Saginaw MI 5 Michigan Yes 21 San Francisco-Oakland CA 5 Food 4 Less No 22 Springfield OH 5 Cincinnati Yes 23 Wierton WV 5 Columbus Yes 24 Baltimore-Towson MD 4 Harris Teeter No 25 Blacksburg VA 4 Mid-Atlantic Yes 26 Bloomington IN 4 Central Yes 27 Clarksville TN/Hopkinsville KY 4 Nashville Yes 28 Decatur IL 4 Central Yes 29 Eugene-Springfield OR 4 Fred Meyer No 30 Lafayette IN 4 Central Yes 31 Lawrence KS 4 Dillon Stores Yes 32 Monroe MI 4 Michigan Yes 33 Myrtle Beach SC 4 Atlanta No 34 Parkersburg WV 4 Mid-Atlantic Yes 35 Prescott AZ 4 Fry's Yes 36 Sacramento-Arden CA 4 Food 4 Less No 37 Shreveport LA 4 Southwest No 38 South Bend IN 4 Central No 39 Springfield MO 4 Dillon Stores No 40 Terre Haute IN 4 Central Yes 41 Anderson IN 3 Central Yes 42 Bloomington IL 3 Central Yes 43 Bowling Green KY 3 Nashville Yes 44 Columbia MO 3 Dillon Stores No 45 Columbia SC 3 Atlanta No 46 Elkhart IN 3 Central No 47 Greenville NC 3 Harris Teeter Yes 48 Jackson, TN 3 Delta Yes 49 Lake Charles LA 3 Southwest Yes 50 Manhattan KS 3 Dillon Stores Yes 51 Mansfield OH 3 Columbus Yes 52 Morgantown WV 3 Mid-Atlantic Yes 53 Owensboro KY 3 Louisville Yes 54 Spokane WA 3 Fred Meyer No TOTAL 257 40
The Kroger Co. Page 17
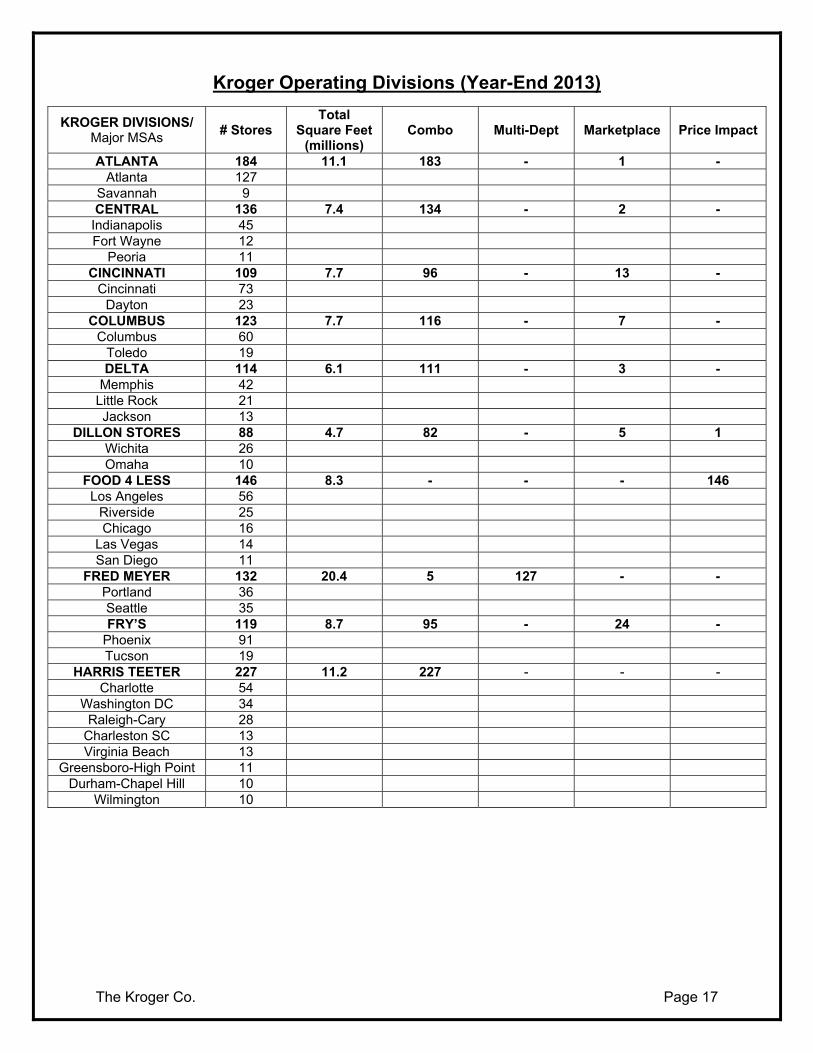
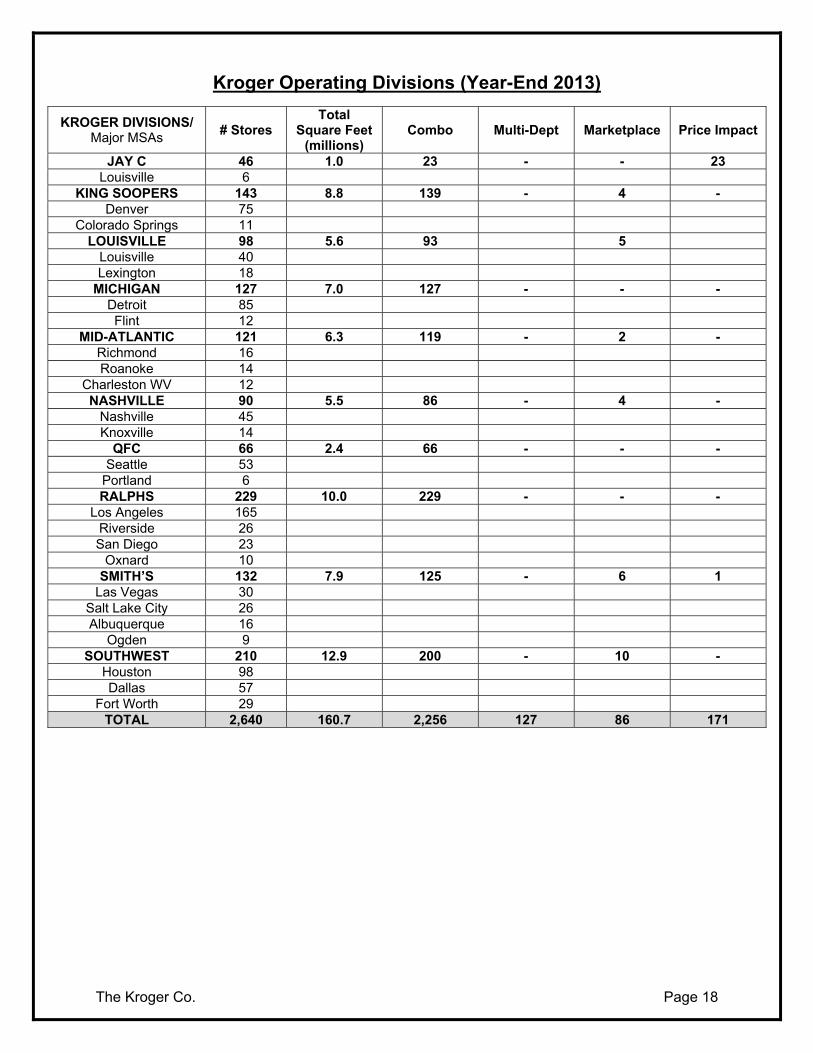
Kroger Operating Divisions (Year-End 2013)
KROGER DIVISIONS/ Major MSAs
# Stores Total
Square Feet (millions)
Combo Multi-Dept Marketplace Price Impact
ATLANTA 184 11.1 183 - 1 - Atlanta 127
Savannah 9 CENTRAL 136 7.4 134 - 2 -
Indianapolis 45 Fort Wayne 12
Peoria 11 CINCINNATI 109 7.7 96 - 13 -
Cincinnati 73 Dayton 23
COLUMBUS 123 7.7 116 - 7 - Columbus 60
Toledo 19 DELTA 114 6.1 111 - 3 -
Memphis 42 Little Rock 21 Jackson 13
DILLON STORES 88 4.7 82 - 5 1 Wichita 26 Omaha 10
FOOD 4 LESS 146 8.3 - - - 146 Los Angeles 56
Riverside 25 Chicago 16
Las Vegas 14 San Diego 11
FRED MEYER 132 20.4 5 127 - - Portland 36 Seattle 35 FRY’S 119 8.7 95 - 24 -
Phoenix 91 Tucson 19
HARRIS TEETER 227 11.2 227 - - - Charlotte 54
Washington DC 34 Raleigh-Cary 28
Charleston SC 13 Virginia Beach 13
Greensboro-High Point 11 Durham-Chapel Hill 10
Wilmington 10
The Kroger Co. Page 18
Kroger Operating Divisions (Year-End 2013)
KROGER DIVISIONS/ Major MSAs
# Stores Total
Square Feet (millions)
Combo Multi-Dept Marketplace Price Impact
JAY C 46 1.0 23 - - 23 Louisville 6
KING SOOPERS 143 8.8 139 - 4 - Denver 75
Colorado Springs 11 LOUISVILLE 98 5.6 93 5
Louisville 40 Lexington 18
MICHIGAN 127 7.0 127 - - - Detroit 85 Flint 12
MID-ATLANTIC 121 6.3 119 - 2 - Richmond 16 Roanoke 14
Charleston WV 12 NASHVILLE 90 5.5 86 - 4 -
Nashville 45 Knoxville 14
QFC 66 2.4 66 - - - Seattle 53
Portland 6 RALPHS 229 10.0 229 - - -
Los Angeles 165 Riverside 26 San Diego 23
Oxnard 10 SMITH’S 132 7.9 125 - 6 1
Las Vegas 30 Salt Lake City 26 Albuquerque 16
Ogden 9 SOUTHWEST 210 12.9 200 - 10 -
Houston 98 Dallas 57
Fort Worth 29 TOTAL 2,640 160.7 2,256 127 86 171
The Kroger Co. Page 19
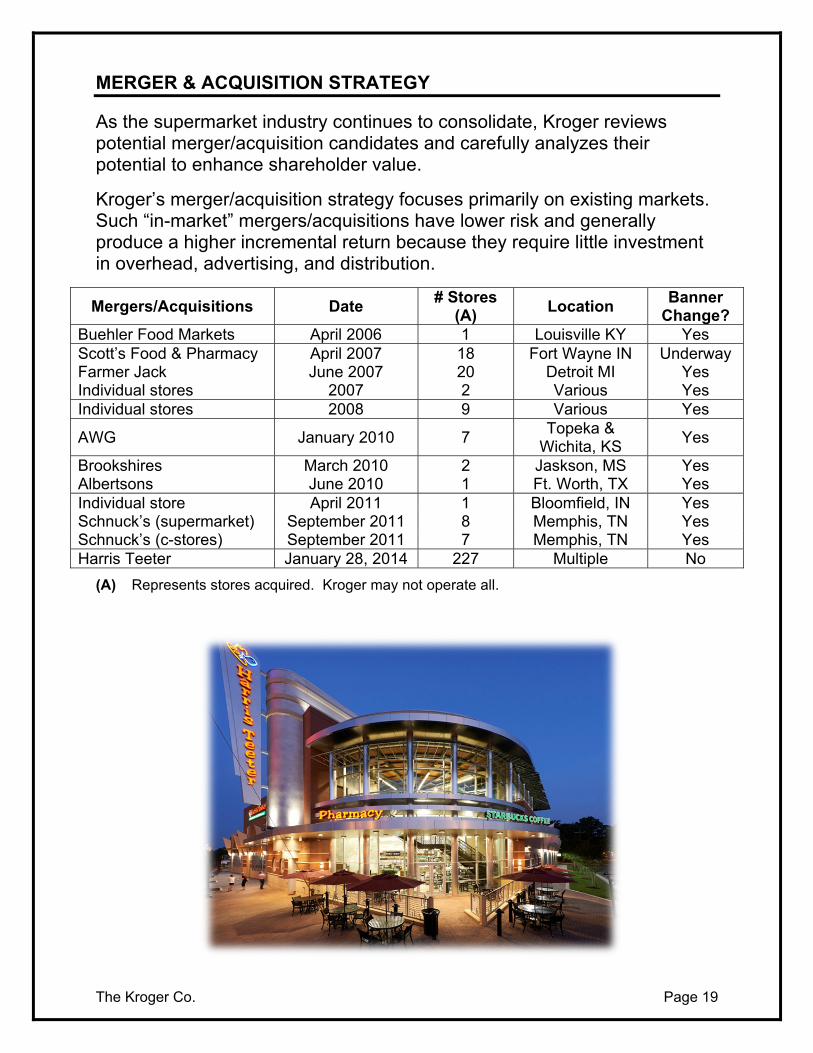
MERGER & ACQUISITION STRATEGY
As the supermarket industry continues to consolidate, Kroger reviews potential merger/acquisition candidates and carefully analyzes their potential to enhance shareholder value.
Kroger’s merger/acquisition strategy focuses primarily on existing markets. Such “in-market” mergers/acquisitions have lower risk and generally produce a higher incremental return because they require little investment in overhead, advertising, and distribution.
Mergers/Acquisitions Date # Stores
(A) Location
Banner Change?
Buehler Food Markets April 2006 1 Louisville KY Yes Scott’s Food & Pharmacy Farmer Jack Individual stores
April 2007 June 2007
2007
18 20 2
Fort Wayne IN Detroit MI Various
Underway Yes Yes
Individual stores 2008 9 Various Yes
AWG January 2010 7 Topeka &
Wichita, KS Yes
Brookshires Albertsons
March 2010 June 2010
2 1
Jaskson, MS Ft. Worth, TX
Yes Yes
Individual store April 2011 1 Bloomfield, IN Yes Schnuck’s (supermarket) September 2011 8 Memphis, TN Yes Schnuck’s (c-stores) September 2011 7 Memphis, TN Yes Harris Teeter January 28, 2014 227 Multiple No
(A) Represents stores acquired. Kroger may not operate all.
The Kroger Co. Page 20
CONVENIENCE STORES
OVERVIEW
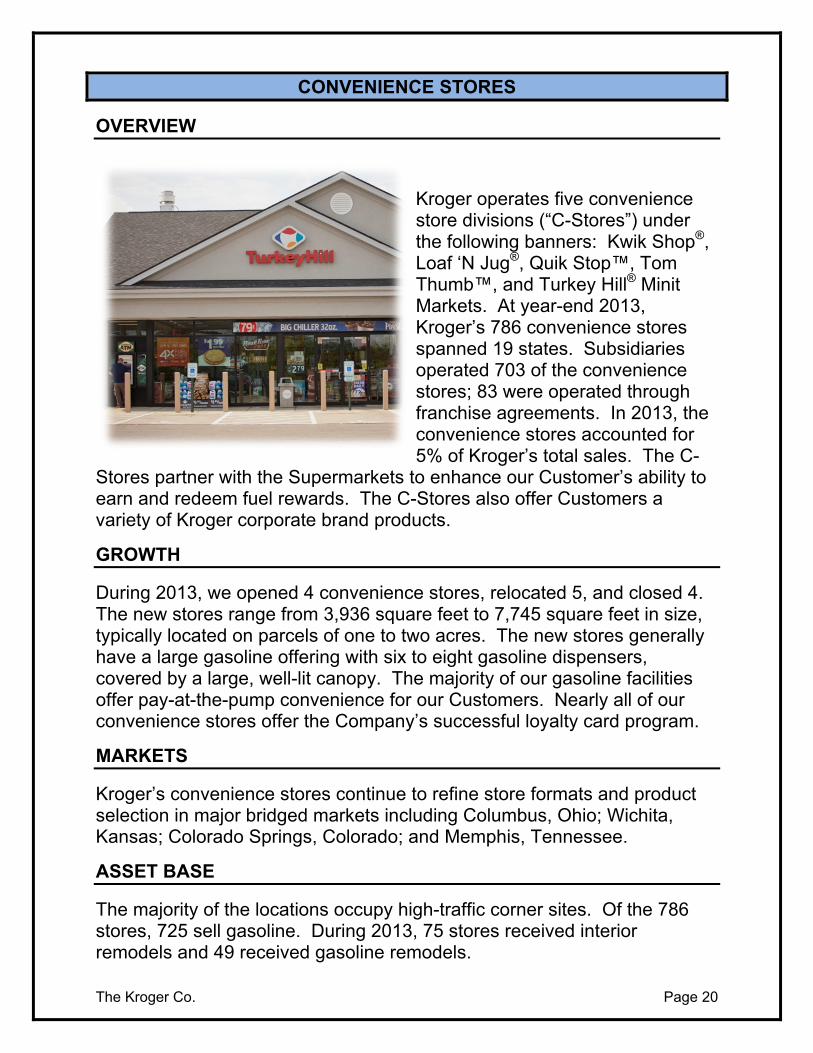
Kroger operates five convenience store divisions (“C-Stores”) under the following banners: Kwik Shop®, Loaf ‘N Jug®, Quik Stop™, Tom Thumb™, and Turkey Hill® Minit Markets. At year-end 2013, Kroger’s 786 convenience stores spanned 19 states. Subsidiaries operated 703 of the convenience stores; 83 were operated through franchise agreements. In 2013, the convenience stores accounted for 5% of Kroger’s total sales. The C-
Stores partner with the Supermarkets to enhance our Customer’s ability to earn and redeem fuel rewards. The C-Stores also offer Customers a variety of Kroger corporate brand products.
GROWTH
During 2013, we opened 4 convenience stores, relocated 5, and closed 4. The new stores range from 3,936 square feet to 7,745 square feet in size, typically located on parcels of one to two acres. The new stores generally have a large gasoline offering with six to eight gasoline dispensers, covered by a large, well-lit canopy. The majority of our gasoline facilities offer pay-at-the-pump convenience for our Customers. Nearly all of our convenience stores offer the Company’s successful loyalty card program.
MARKETS
Kroger’s convenience stores continue to refine store formats and product selection in major bridged markets including Columbus, Ohio; Wichita, Kansas; Colorado Springs, Colorado; and Memphis, Tennessee.
ASSET BASE
The majority of the locations occupy high-traffic corner sites. Of the 786 stores, 725 sell gasoline. During 2013, 75 stores received interior remodels and 49 received gasoline remodels.
The Kroger Co. Page 21
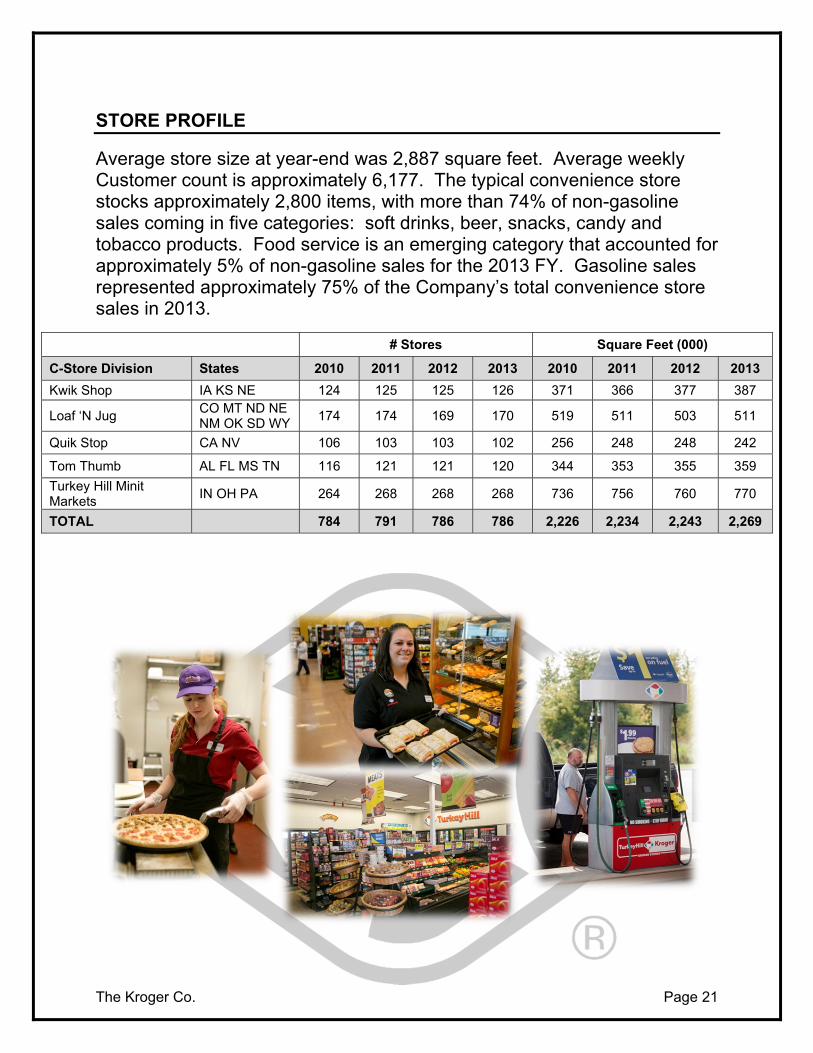
STORE PROFILE
Average store size at year-end was 2,887 square feet. Average weekly Customer count is approximately 6,177. The typical convenience store stocks approximately 2,800 items, with more than 74% of non-gasoline sales coming in five categories: soft drinks, beer, snacks, candy and tobacco products. Food service is an emerging category that accounted for approximately 5% of non-gasoline sales for the 2013 FY. Gasoline sales represented approximately 75% of the Company’s total convenience store sales in 2013.
# Stores Square Feet (000)
C-Store Division States 2010 2011 2012 2013 2010 2011 2012 2013
Kwik Shop IA KS NE 124 125 125 126 371 366 377 387
Loaf ‘N Jug CO MT ND NE NM OK SD WY
174 174 169 170 519 511 503 511
Quik Stop CA NV 106 103 103 102 256 248 248 242
Tom Thumb AL FL MS TN 116 121 121 120 344 353 355 359
Turkey Hill Minit Markets
IN OH PA 264 268 268 268 736 756 760 770
TOTAL 784 791 786 786 2,226 2,234 2,243 2,269
The Kroger Co. Page 22
JEWELRY STORES
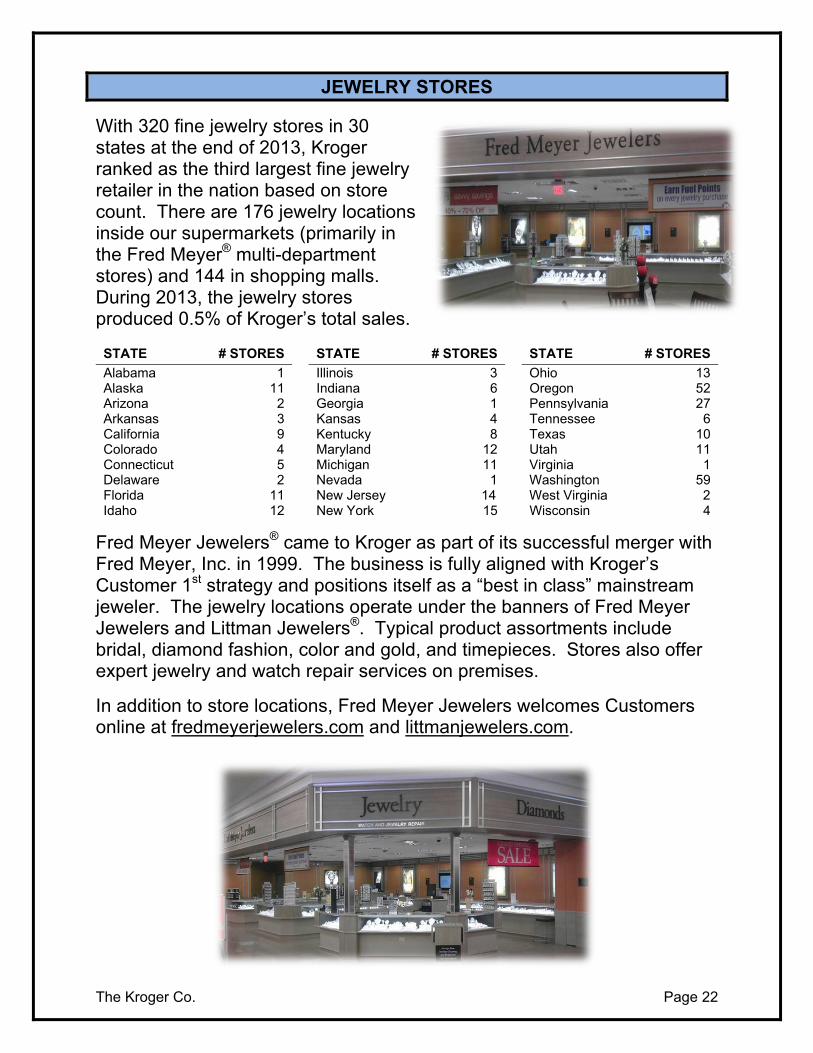
With 320 fine jewelry stores in 30 states at the end of 2013, Kroger ranked as the third largest fine jewelry retailer in the nation based on store count. There are 176 jewelry locations inside our supermarkets (primarily in the Fred Meyer® multi-department stores) and 144 in shopping malls. During 2013, the jewelry stores produced 0.5% of Kroger’s total sales.
STATE # STORES STATE # STORES STATE # STORES
Alabama 1 Illinois 3 Ohio 13 Alaska 11 Indiana 6 Oregon 52 Arizona 2 Georgia 1 Pennsylvania 27 Arkansas 3 Kansas 4 Tennessee 6 California 9 Kentucky 8 Texas 10 Colorado 4 Maryland 12 Utah 11 Connecticut 5 Michigan 11 Virginia 1 Delaware 2 Nevada 1 Washington 59 Florida 11 New Jersey 14 West Virginia 2 Idaho 12 New York 15 Wisconsin 4
Fred Meyer Jewelers® came to Kroger as part of its successful merger with Fred Meyer, Inc. in 1999. The business is fully aligned with Kroger’s Customer 1st strategy and positions itself as a “best in class” mainstream jeweler. The jewelry locations operate under the banners of Fred Meyer Jewelers and Littman Jewelers®. Typical product assortments include bridal, diamond fashion, color and gold, and timepieces. Stores also offer expert jewelry and watch repair services on premises.
In addition to store locations, Fred Meyer Jewelers welcomes Customers online at fredmeyerjewelers.com and littmanjewelers.com.
The Kroger Co. Page 23
CORPORATE BRANDS
Corporate Brands play a central role in Kroger’s Customer 1st strategy and provide a key competitive advantage to Kroger. We are using our own brands to build and solidify Customer loyalty. Our vision:
“Build lifetime, loyal Customers with our differentiated, preferred brands to become the primary reason Customers drive by our competitors to
shop at Kroger.”
Corporate Brands, such as our Banner Brands, Private Selection®, Simple Truth®, Big K®, Home Sense®, and Comforts for Baby® are Kroger’s ultimate loyalty program because Customers can only buy these brands in our stores. In addition, we manufacture 40% of our Corporate Brand products, which gives us margin and speed-to-market advantage.
Our supermarket divisions typically stock approximately 13,000 Corporate Brands items per store. Corporate Brands continue to gain market share, and in the fourth quarter represented approximately 27% of total units sold, and 24% of sales dollars, excluding fuel and pharmacy. High velocity, lower retail items – such as bread, canned tuna and canned vegetables – explain a substantial portion of the difference between these two figures.
Kroger carries a wide selection of our own brand products in every department throughout our stores. We continue to expand and refine our offering in meat, seafood, deli, floral, produce, pet, health & beauty care and general merchandise in support of our Corporate Brands vision.
Product Quality
Consumer research, select ingredients and our rigorous development process deliver the quality behind Kroger’s own brands. This is an important part of the everyday value that is found in all of our products. This consistent focus on quality and innovation provides the foundation of our strong Corporate Brands program.
Our own brand strategy focuses on providing choices to our Customers through a multi-tier offering of price points and product experiences.
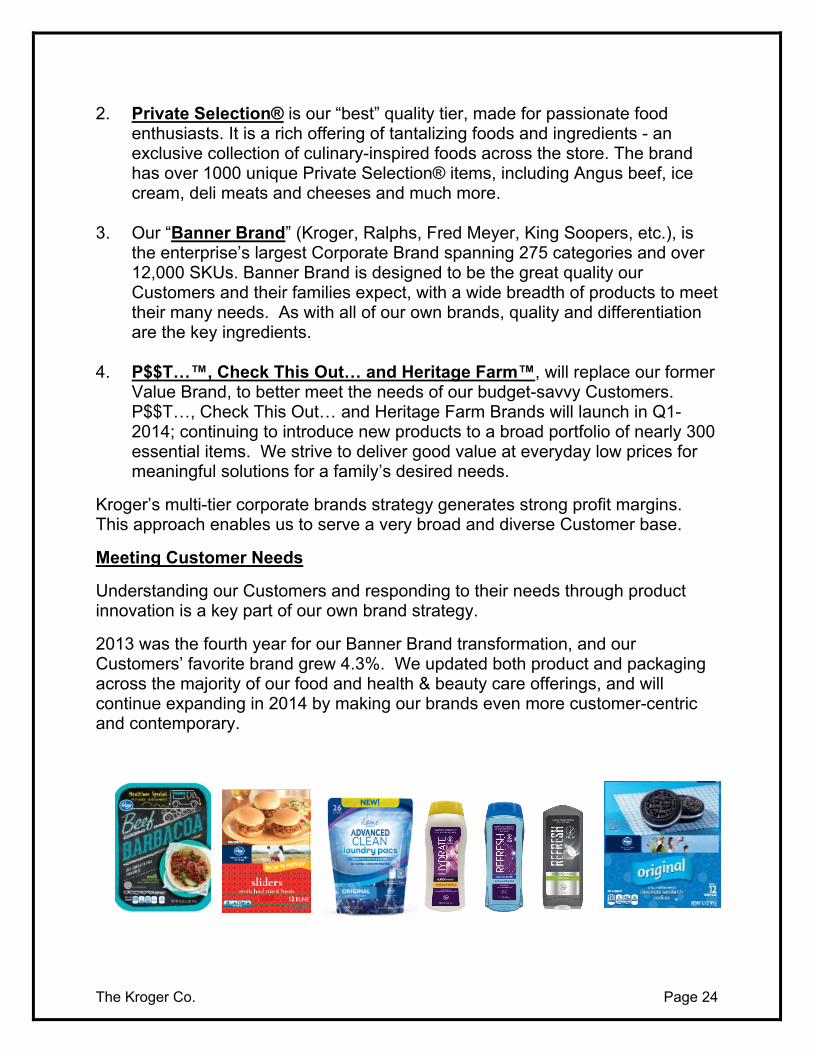
1. Simple Truth® and Simple Truth Organic™ branded products are Free From 101+ artificial preservatives and ingredients. Simple Truth Organic branded products are certified organic by the USDA. Simple Truth and Simple Truth Organic deliver products that are honest, easy and affordable. Simple Truth launched 100 new items in 2013 and we expect to bring even more options to our Customers in 2014.
The Kroger Co. Page 24
2. Private Selection® is our “best” quality tier, made for passionate food
enthusiasts. It is a rich offering of tantalizing foods and ingredients - an exclusive collection of culinary-inspired foods across the store. The brand has over 1000 unique Private Selection® items, including Angus beef, ice cream, deli meats and cheeses and much more.
3. Our “Banner Brand” (Kroger, Ralphs, Fred Meyer, King Soopers, etc.), is the enterprise’s largest Corporate Brand spanning 275 categories and over 12,000 SKUs. Banner Brand is designed to be the great quality our Customers and their families expect, with a wide breadth of products to meet their many needs. As with all of our own brands, quality and differentiation are the key ingredients.
4. P$$T…™, Check This Out… and Heritage Farm™, will replace our former Value Brand, to better meet the needs of our budget-savvy Customers. P$$T…, Check This Out… and Heritage Farm Brands will launch in Q1-2014; continuing to introduce new products to a broad portfolio of nearly 300 essential items. We strive to deliver good value at everyday low prices for meaningful solutions for a family’s desired needs.
Kroger’s multi-tier corporate brands strategy generates strong profit margins. This approach enables us to serve a very broad and diverse Customer base.
Meeting Customer Needs
Understanding our Customers and responding to their needs through product innovation is a key part of our own brand strategy.
2013 was the fourth year for our Banner Brand transformation, and our Customers’ favorite brand grew 4.3%. We updated both product and packaging across the majority of our food and health & beauty care offerings, and will continue expanding in 2014 by making our brands even more customer-centric and contemporary.
The Kroger Co. Page 25
We continued driving new product growth with marinated meats, baked goods, pet treats, salty snacks, health and beauty care, vitamin enhanced water and key perishable segments to mention just a few.
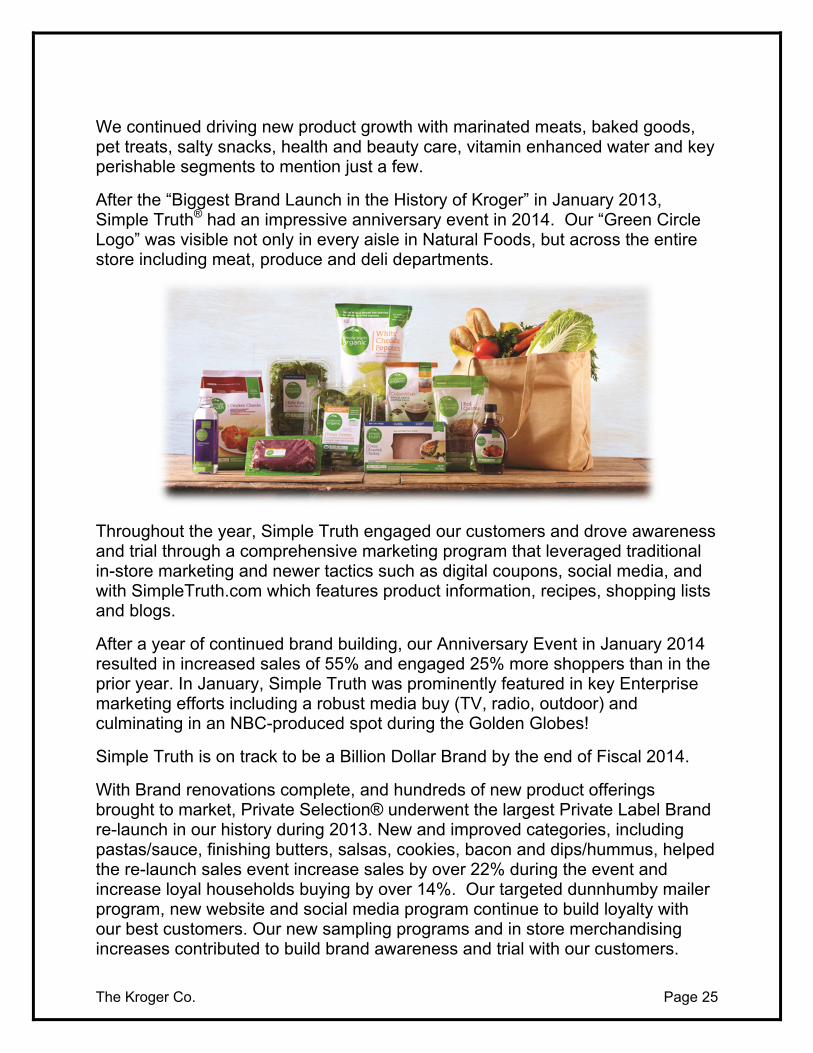
After the “Biggest Brand Launch in the History of Kroger” in January 2013, Simple Truth® had an impressive anniversary event in 2014. Our “Green Circle Logo” was visible not only in every aisle in Natural Foods, but across the entire store including meat, produce and deli departments.
Throughout the year, Simple Truth engaged our customers and drove awareness and trial through a comprehensive marketing program that leveraged traditional in-store marketing and newer tactics such as digital coupons, social media, and with SimpleTruth.com which features product information, recipes, shopping lists and blogs.
After a year of continued brand building, our Anniversary Event in January 2014 resulted in increased sales of 55% and engaged 25% more shoppers than in the prior year. In January, Simple Truth was prominently featured in key Enterprise marketing efforts including a robust media buy (TV, radio, outdoor) and culminating in an NBC-produced spot during the Golden Globes!
Simple Truth is on track to be a Billion Dollar Brand by the end of Fiscal 2014.
With Brand renovations complete, and hundreds of new product offerings brought to market, Private Selection® underwent the largest Private Label Brand re-launch in our history during 2013. New and improved categories, including pastas/sauce, finishing butters, salsas, cookies, bacon and dips/hummus, helped the re-launch sales event increase sales by over 22% during the event and increase loyal households buying by over 14%. Our targeted dunnhumby mailer program, new website and social media program continue to build loyalty with our best customers. Our new sampling programs and in store merchandising increases contributed to build brand awareness and trial with our customers.
The Kroger Co. Page 26
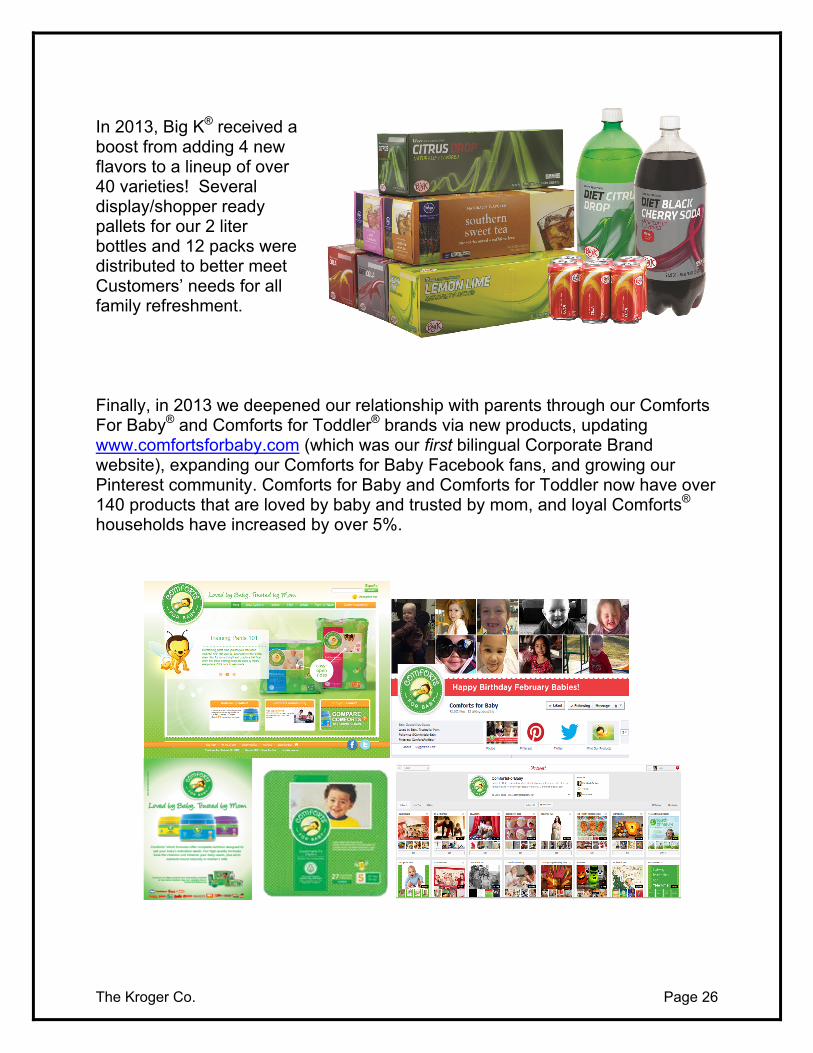
In 2013, Big K® received a boost from adding 4 new flavors to a lineup of over 40 varieties! Several display/shopper ready pallets for our 2 liter bottles and 12 packs were distributed to better meet Customers’ needs for all family refreshment.
Finally, in 2013 we deepened our relationship with parents through our Comforts For Baby® and Comforts for Toddler® brands via new products, updating www.comfortsforbaby.com (which was our first bilingual Corporate Brand website), expanding our Comforts for Baby Facebook fans, and growing our Pinterest community. Comforts for Baby and Comforts for Toddler now have over 140 products that are loved by baby and trusted by mom, and loyal Comforts® households have increased by over 5%.
The Kroger Co. Page 27
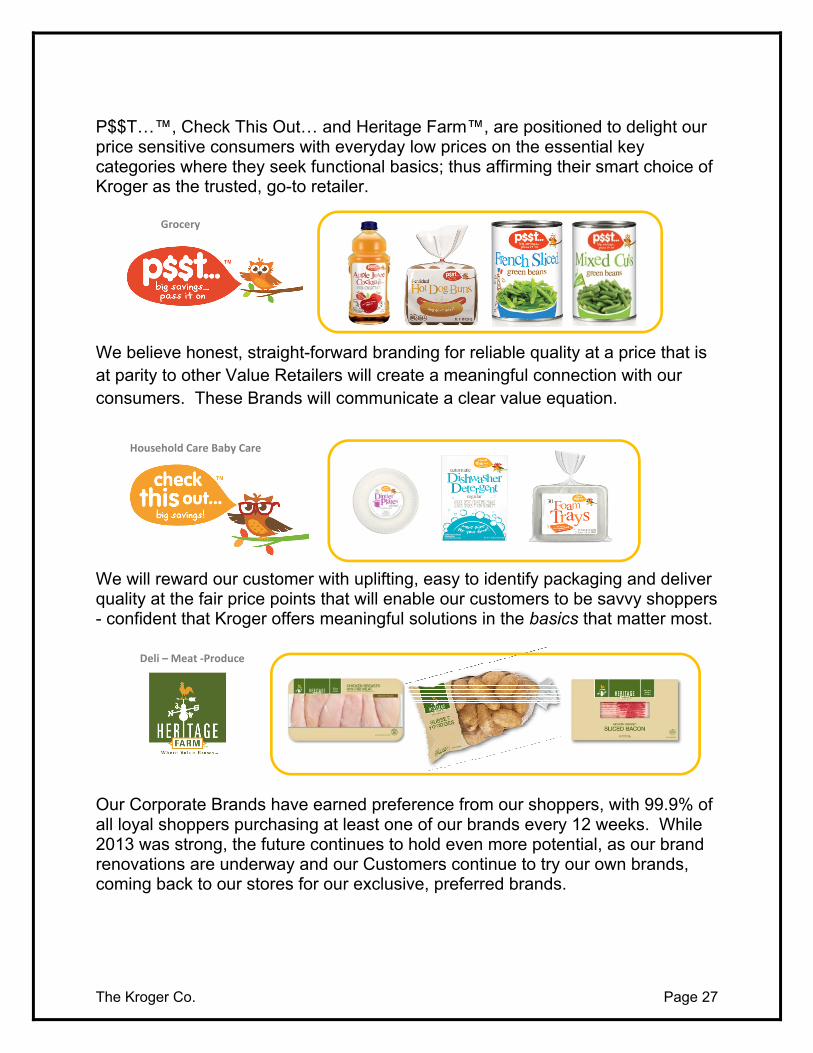
P$$T…™, Check This Out… and Heritage Farm™, are positioned to delight our price sensitive consumers with everyday low prices on the essential key categories where they seek functional basics; thus affirming their smart choice of Kroger as the trusted, go-to retailer.
We believe honest, straight-forward branding for reliable quality at a price that is at parity to other Value Retailers will create a meaningful connection with our consumers. These Brands will communicate a clear value equation.
We will reward our customer with uplifting, easy to identify packaging and deliver quality at the fair price points that will enable our customers to be savvy shoppers - confident that Kroger offers meaningful solutions in the basics that matter most.
Our Corporate Brands have earned preference from our shoppers, with 99.9% of all loyal shoppers purchasing at least one of our brands every 12 weeks. While 2013 was strong, the future continues to hold even more potential, as our brand renovations are underway and our Customers continue to try our own brands, coming back to our stores for our exclusive, preferred brands.
Deli – Meat ‐Produce
Household Care Baby Care
Grocery
The Kroger Co. Page 28
KROGER MANUFACTURING
Approximately 40% of the Corporate Brand units sold in our stores are produced in Kroger’s 38 manufacturing plants; the remaining corporate brand items are produced to Kroger’s strict specifications by outside manufacturers. Kroger performs a “make or buy” analysis on corporate brand products and decisions are made based upon a comparison of market-based transfer prices adjusted for plant profit versus open market purchases. Kroger’s manufacturing plants produce breads, dairy products, meat and thousands of other grocery items. By manufacturing our own products, we lower our costs and pass on savings to our Customers.
Kroger’s 16 dairies and two ice cream plants operate at nearly full capacity and produce all varieties of fluid milk, orange juice, cultured products such as yogurt and cottage cheese, ice cream, novelty treats and non-carbonated beverages. In all of our markets, our Banner Brand milk is the “national brand” for most Customers. Kroger also operates two cheese plants, which produce a variety of natural and processed cheeses for our supermarkets. The Harris Teeter Dairy located in High Point, NC was added to the overall Manufacturing network in January 2014.
A new facility is under construction in Denver that will produce milk and other fluid products, including small bottle extended shelf life dairy items. The plant is scheduled to begin supplying our stores in May 2014.
Kroger’s two meat plants produce a variety of packaged meats, retail meats, sausages, and home meal replacements.
Six Kroger bakeries supply bread, cakes, donuts, cookies, bagels, muffins, crackers, snacks, and rolls to Kroger retail stores and outside Customers. Two frozen dough plants in Bowling Green, Kentucky, and Salt Lake City, Utah, supply frozen cakes and dough to our retail stores. KB Specialty Foods, a deli plant, manufactures a wide variety of deli salads, puddings, desserts, glazes, icings, etc.
Grocery products, beverages, and water are produced in the Kroger’s five grocery and two beverage plants. Corporate brand grocery items include pet foods, sugar-based products like drink mixes, hot cereal, coffee, spices, salad dressings, and peanut butter. Beverages include Kroger’s Big K® brand soft drink line.
The quality of product carrying our Banner Brands is monitored by Kroger’s in-house quality assurance group.
The Kroger Co. Page 29
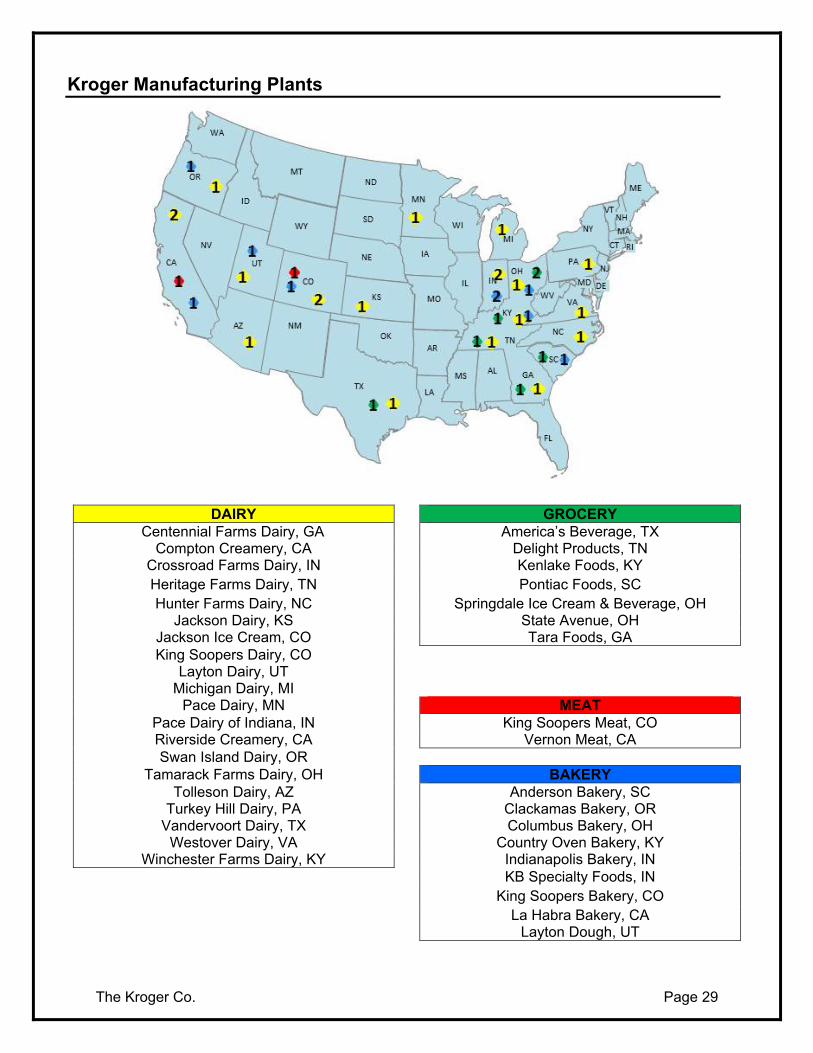
DAIRY GROCERY Centennial Farms Dairy, GA America’s Beverage, TX
Compton Creamery, CA Delight Products, TN Crossroad Farms Dairy, IN Kenlake Foods, KY Heritage Farms Dairy, TN Pontiac Foods, SC Hunter Farms Dairy, NC Springdale Ice Cream & Beverage, OH
Jackson Dairy, KS State Avenue, OH Jackson Ice Cream, CO Tara Foods, GA King Soopers Dairy, CO
Layton Dairy, UT Michigan Dairy, MI
Pace Dairy, MN MEAT Pace Dairy of Indiana, IN King Soopers Meat, CO Riverside Creamery, CA Vernon Meat, CA Swan Island Dairy, OR
Tamarack Farms Dairy, OH BAKERY Tolleson Dairy, AZ Anderson Bakery, SC
Turkey Hill Dairy, PA Clackamas Bakery, OR Vandervoort Dairy, TX Columbus Bakery, OH
Westover Dairy, VA Country Oven Bakery, KY Winchester Farms Dairy, KY Indianapolis Bakery, IN
KB Specialty Foods, IN King Soopers Bakery, CO
La Habra Bakery, CA
Layton Dough, UT
Kroger Manufacturing Plants
The Kroger Co. Page 30
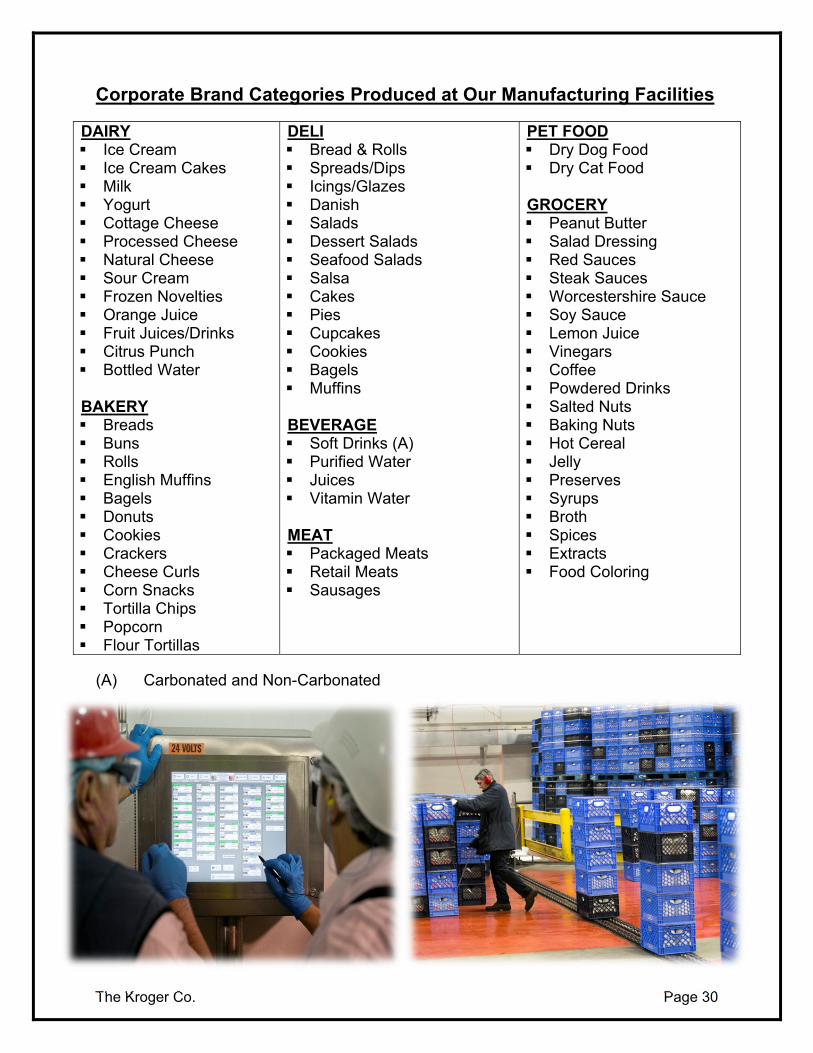
Corporate Brand Categories Produced at Our Manufacturing Facilities
DAIRY Ice Cream Ice Cream Cakes Milk Yogurt Cottage Cheese Processed Cheese Natural Cheese Sour Cream Frozen Novelties Orange Juice Fruit Juices/Drinks Citrus Punch Bottled Water BAKERY Breads Buns Rolls English Muffins Bagels Donuts Cookies Crackers Cheese Curls Corn Snacks Tortilla Chips Popcorn Flour Tortillas
DELI Bread & Rolls Spreads/Dips Icings/Glazes Danish Salads Dessert Salads Seafood Salads Salsa Cakes Pies Cupcakes Cookies Bagels Muffins BEVERAGE Soft Drinks (A) Purified Water Juices Vitamin Water MEAT Packaged Meats Retail Meats Sausages
PET FOOD Dry Dog Food Dry Cat Food GROCERY Peanut Butter Salad Dressing Red Sauces Steak Sauces Worcestershire Sauce Soy Sauce Lemon Juice Vinegars Coffee Powdered Drinks Salted Nuts Baking Nuts Hot Cereal Jelly Preserves Syrups Broth Spices Extracts Food Coloring
(A) Carbonated and Non-Carbonated
The Kroger Co. Page 31
PHARMACY
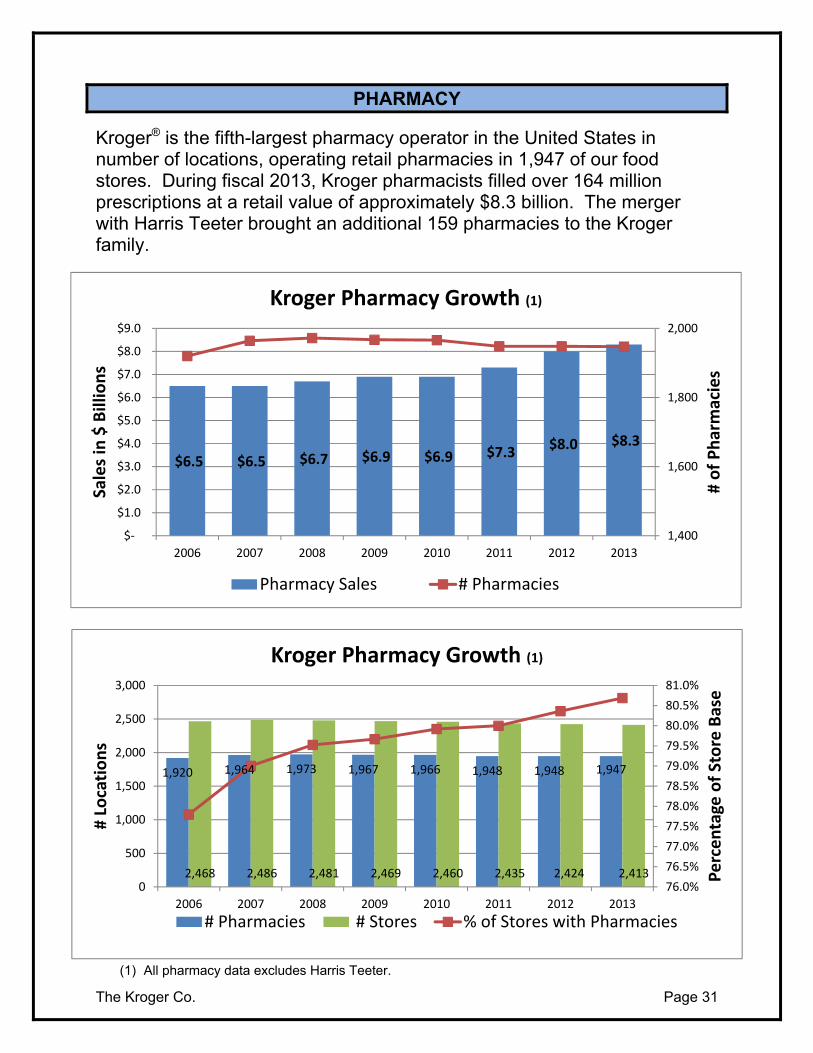
Kroger® is the fifth-largest pharmacy operator in the United States in number of locations, operating retail pharmacies in 1,947 of our food stores. During fiscal 2013, Kroger pharmacists filled over 164 million prescriptions at a retail value of approximately $8.3 billion. The merger with Harris Teeter brought an additional 159 pharmacies to the Kroger family.
(1) All pharmacy data excludes Harris Teeter.
$6.5 $6.5 $6.7 $6.9 $6.9 $7.3 $8.0 $8.3
1,400
1,600
1,800
2,000
$‐
$1.0
$2.0
$3.0
$4.0
$5.0
$6.0
$7.0
$8.0
$9.0
2006 2007 2008 2009 2010 2011 2012 2013
# of Pharmacies
Sales in $ Billions
Kroger Pharmacy Growth (1)
Pharmacy Sales # Pharmacies
1,920 1,964 1,973 1,967 1,966 1,948 1,948 1,947
2,468 2,486 2,481 2,469 2,460 2,435 2,424 2,41376.0%
76.5%
77.0%
77.5%
78.0%
78.5%
79.0%
79.5%
80.0%
80.5%
81.0%
0
500
1,000
1,500
2,000
2,500
3,000
2006 2007 2008 2009 2010 2011 2012 2013
Percentage of Store Base
# Locations
Kroger Pharmacy Growth (1)
# Pharmacies # Stores % of Stores with Pharmacies
The Kroger Co. Page 32
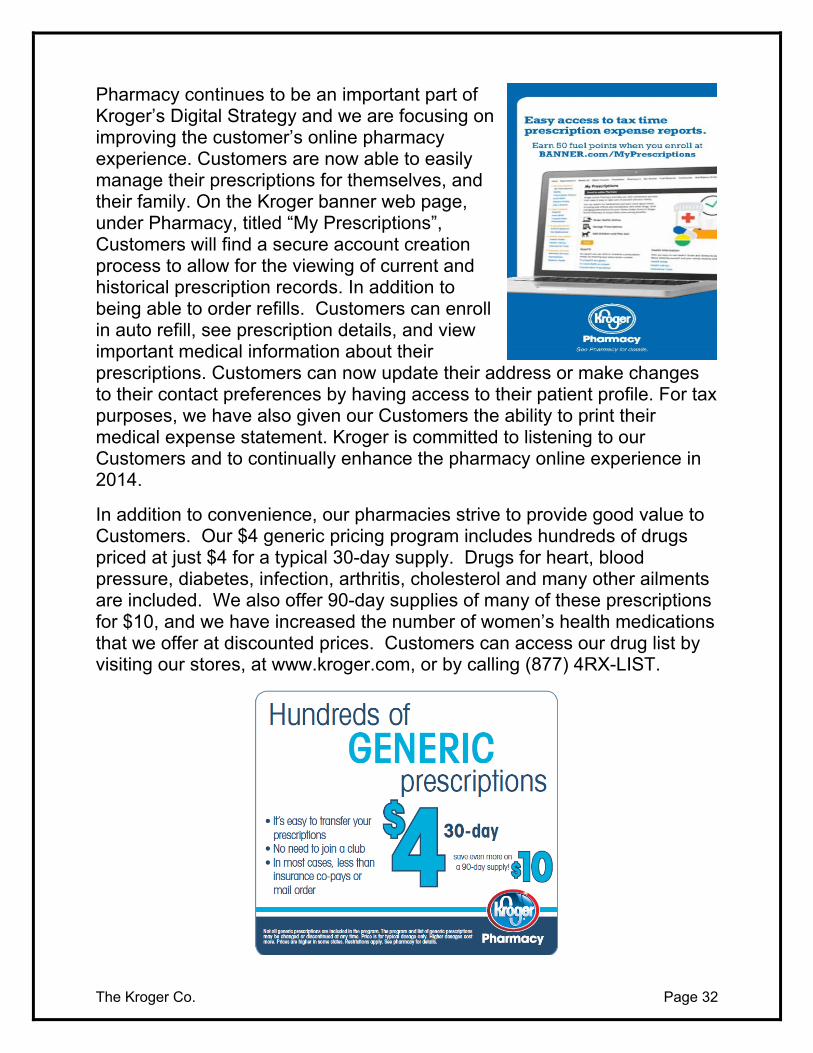
Pharmacy continues to be an important part of Kroger’s Digital Strategy and we are focusing on improving the customer’s online pharmacy experience. Customers are now able to easily manage their prescriptions for themselves, and their family. On the Kroger banner web page, under Pharmacy, titled “My Prescriptions”, Customers will find a secure account creation process to allow for the viewing of current and historical prescription records. In addition to being able to order refills. Customers can enroll in auto refill, see prescription details, and view important medical information about their prescriptions. Customers can now update their address or make changes to their contact preferences by having access to their patient profile. For tax purposes, we have also given our Customers the ability to print their medical expense statement. Kroger is committed to listening to our Customers and to continually enhance the pharmacy online experience in 2014.
In addition to convenience, our pharmacies strive to provide good value to Customers. Our $4 generic pricing program includes hundreds of drugs priced at just $4 for a typical 30-day supply. Drugs for heart, blood pressure, diabetes, infection, arthritis, cholesterol and many other ailments are included. We also offer 90-day supplies of many of these prescriptions for $10, and we have increased the number of women’s health medications that we offer at discounted prices. Customers can access our drug list by visiting our stores, at www.kroger.com, or by calling (877) 4RX-LIST.
The Kroger Co. Page 33
THE LITTLE CLINIC
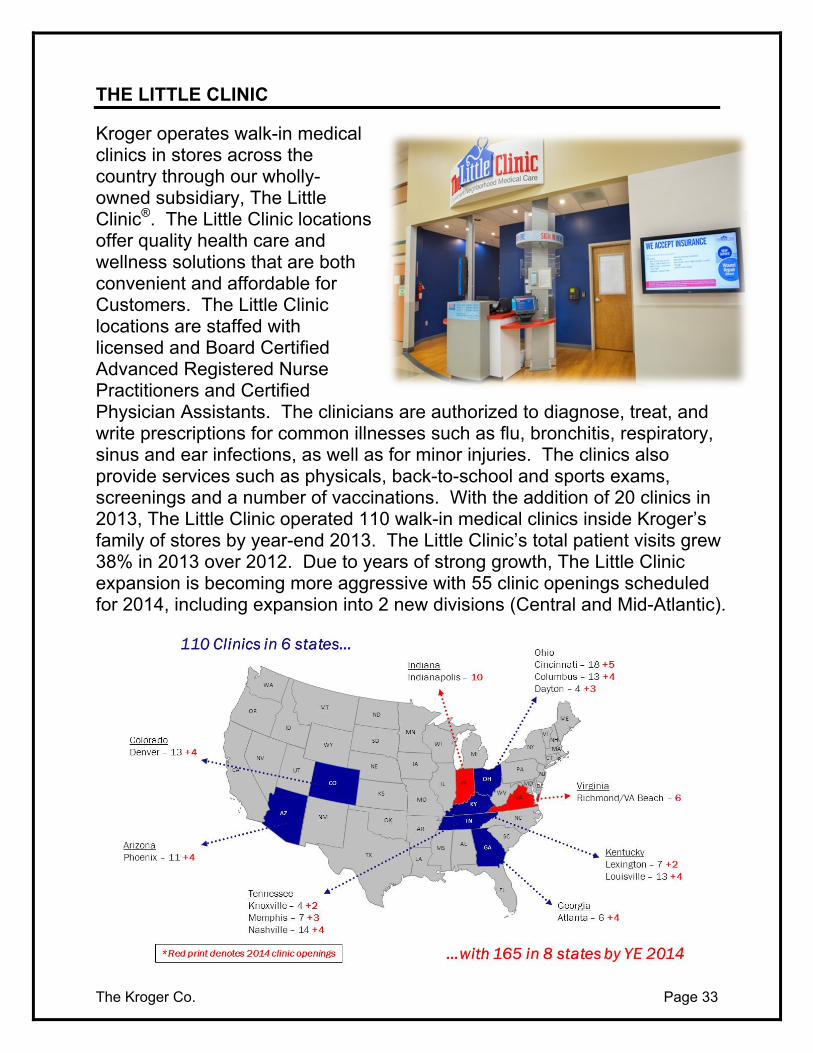
Kroger operates walk-in medical clinics in stores across the country through our wholly-owned subsidiary, The Little Clinic®. The Little Clinic locations offer quality health care and wellness solutions that are both convenient and affordable for Customers. The Little Clinic locations are staffed with licensed and Board Certified Advanced Registered Nurse Practitioners and Certified Physician Assistants. The clinicians are authorized to diagnose, treat, and write prescriptions for common illnesses such as flu, bronchitis, respiratory, sinus and ear infections, as well as for minor injuries. The clinics also provide services such as physicals, back-to-school and sports exams, screenings and a number of vaccinations. With the addition of 20 clinics in 2013, The Little Clinic operated 110 walk-in medical clinics inside Kroger’s family of stores by year-end 2013. The Little Clinic’s total patient visits grew 38% in 2013 over 2012. Due to years of strong growth, The Little Clinic expansion is becoming more aggressive with 55 clinic openings scheduled for 2014, including expansion into 2 new divisions (Central and Mid-Atlantic).
The Kroger Co. Page 34
The Little Clinic® received accreditation by The Joint Commission in 2009 and reaccreditation in 2012. The gold standard in the healthcare industry, The Joint Commission accreditation demonstrates The Little Clinic commitment to deliver high quality care in an environment that emphasizes patient safety.
.
The Kroger Co. Page 35
NATURAL AND ORGANIC FOODS
Consumer demand for Natural & Organic foods continues to grow in the industry and for Kroger Customers. In 2013, Kroger sales of Natural & Organic foods grew double digits for the fourth consecutive year. Kroger plans to continue a significant focus on growing this aspect of the business.
Kroger offers a wide variety of items to those Customers looking for easy, honest, affordable quality Natural & Organic items helping all shoppers enjoy simply better living. Kroger’s investment in pricing of Natural & Organic items has also helped fuel growth in this area of the business.
Kroger’s Family of Stores is expanding the offerings to meet this need through varying department formats based on a particular store’s size and Customer segmentation. Natural & Organic offerings can be found in all formats across the enterprise. In 2013, Kroger increased variety and offerings of Natural Foods as we heard strongly from our customers they continue to want more Natural & Organic foods.
2013 was an outstanding year growing the Simple Truth® brand of products launched very early in 2013. The success of the launch and growth of the Simple Truth brand of Kroger exclusive Natural & Organic products has exceeded all expectations in sales and connection with the customer. Simple Truth offers over 400 items in over 45 categories under our exclusive Simple Truth® and Simple Truth Organic™ brands all across the store. A wide variety can be found throughout the store, including milk, eggs, meats, produce, trail mix, cereals, sodas, yogurt, chips and grains. Simple Truth® and Simple Truth Organic™ products are made from the finest quality ingredients that are “Free From 101+” artificial preservatives & ingredients that Customers have told us they do not want in their food. Consumers may visit www.simpletruth.com for a list of the 101+ artificial preservatives & ingredients that are not found in the “Free From 101+” products. Simple Truth Organic™ products contain at least 95% organic ingredients and are USDA certified. We continue to add new items to this exclusive product line to make organics accessible and affordable for everyone.
The Kroger Co. Page 36
RETAIL FUEL OPERATIONS
Kroger believes that gasoline is a natural addition to our “one-stop” shopping strategy because it offers our Customers tremendous convenience and value. Fuel centers also allow Kroger to build on our decades of experience in selling gasoline at our convenience stores. Despite low margins, fuel centers can deliver a high return on investment because of their extraordinary inventory turns and positive effect on overall store sales.
The typical supermarket fuel center consists of three to nine multi-product dispensers covered by a well-lit canopy, and an 8’ x 12’ kiosk from which cigarettes, soft drinks, snacks, candy and miscellaneous automotive-related products are sold.
At year-end 2013, Kroger’s retail fuel operations included 1,240 supermarket fuel centers in 31 states and 725 convenience stores that sell fuel. (We operate 786 convenience stores in total. See the “Convenience Stores” section on Page 20 of this Fact Book.)
Financial Impact
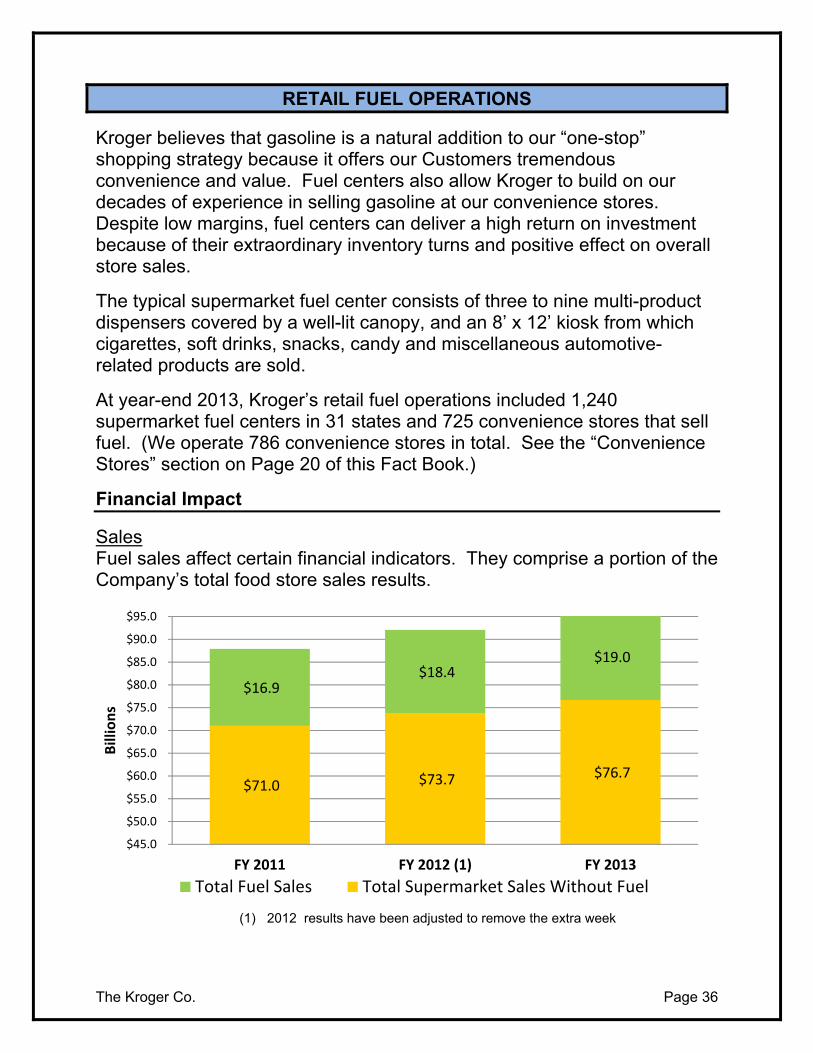
Sales Fuel sales affect certain financial indicators. They comprise a portion of the Company’s total food store sales results.
(1) 2012 results have been adjusted to remove the extra week
$71.0 $73.7 $76.7
$16.9 $18.4
$19.0
$45.0
$50.0
$55.0
$60.0
$65.0
$70.0
$75.0
$80.0
$85.0
$90.0
$95.0
FY 2011 FY 2012 (1) FY 2013
Billions
Total Fuel Sales Total Supermarket Sales Without Fuel
The Kroger Co. Page 37
Fuel sales also affect identical and comparable supermarket sales:
Identical Supermarket Sales FY 2012 FY 2013
Including Supermarket Fuel Centers 4.5% 3.3%
Excluding Supermarket Fuel Centers 3.5% 3.6%
Difference (basis points) 100 bp <30 bp>
FIFO Gross Margin (Note A)
Our FIFO gross margin rates, as a percentage of sales, were 20.62% in 2013, 20.65% in 2012 and 21.15% in 2011. Our retail fuel sales reduce our FIFO gross margin rate due to the very low FIFO gross margin on retail fuel sales as compared to non-fuel sales. Excluding the effect of retail fuel operations, our FIFO gross margin rate decreased 14 basis points in 2013 vs. 2012 and 40 basis points in 2012 vs. 2011. FIFO gross margin in 2013, compared to 2012, decreased primarily from continued investments in lower prices for our Customers and increased shrink and advertising costs as a percentage of sales.
<Decrease> in FIFO Gross Margin Rate FY 2011 FY 2012 FY 2013
Including Retail Fuel Operations <118 bp> <51 bp> <2 bp>
Excluding Retail Fuel Operations <32 bp> <40 bp> <14 bp>
Note A: FIFO gross margin is an important measure used by management to evaluate merchandising and operational effectiveness. We calculate First-In, First-Out (“FIFO”) gross margin as sales minus merchandise costs, including advertising, warehousing and transportation, but excluding the Last-In, First-Out (“LIFO”) charge. Merchandise costs exclude depreciation and rent expense.
The Kroger Co. Page 38
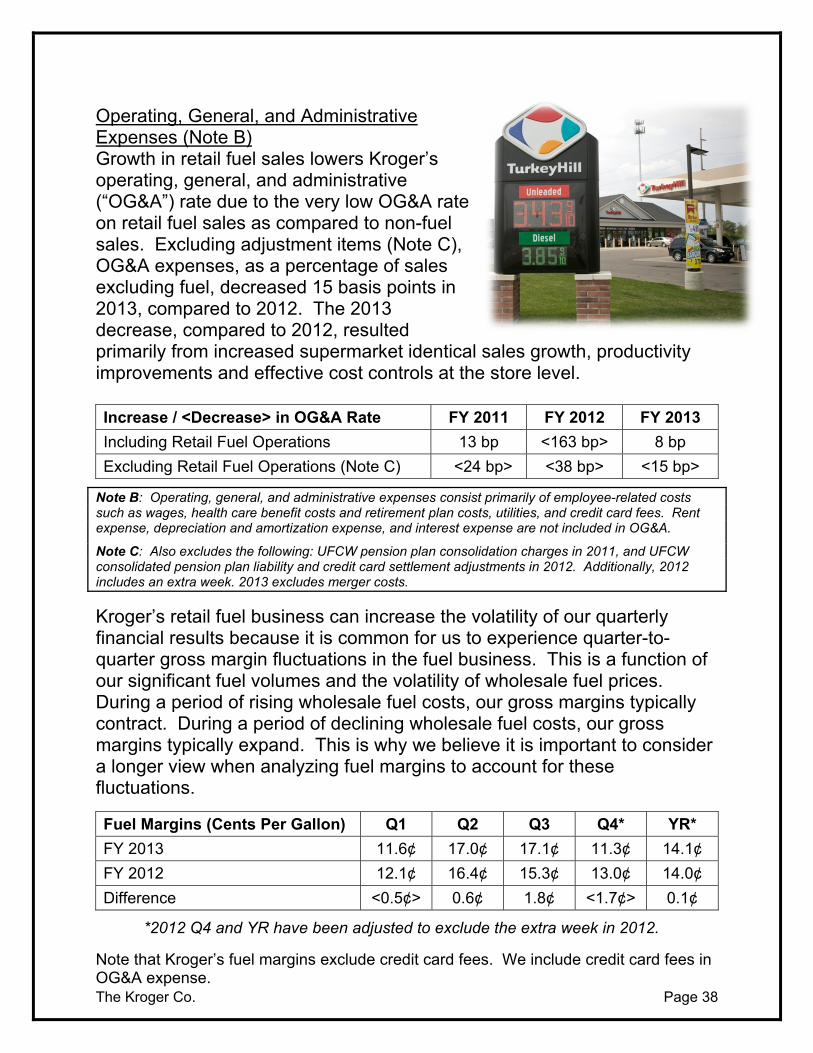
Operating, General, and Administrative Expenses (Note B) Growth in retail fuel sales lowers Kroger’s operating, general, and administrative (“OG&A”) rate due to the very low OG&A rate on retail fuel sales as compared to non-fuel sales. Excluding adjustment items (Note C), OG&A expenses, as a percentage of sales excluding fuel, decreased 15 basis points in 2013, compared to 2012. The 2013 decrease, compared to 2012, resulted primarily from increased supermarket identical sales growth, productivity improvements and effective cost controls at the store level. Increase / <Decrease> in OG&A Rate FY 2011 FY 2012 FY 2013
Including Retail Fuel Operations 13 bp <163 bp> 8 bp
Excluding Retail Fuel Operations (Note C) <24 bp> <38 bp> <15 bp>
Note B: Operating, general, and administrative expenses consist primarily of employee-related costs such as wages, health care benefit costs and retirement plan costs, utilities, and credit card fees. Rent expense, depreciation and amortization expense, and interest expense are not included in OG&A.
Note C: Also excludes the following: UFCW pension plan consolidation charges in 2011, and UFCW consolidated pension plan liability and credit card settlement adjustments in 2012. Additionally, 2012 includes an extra week. 2013 excludes merger costs.
Kroger’s retail fuel business can increase the volatility of our quarterly financial results because it is common for us to experience quarter-to-quarter gross margin fluctuations in the fuel business. This is a function of our significant fuel volumes and the volatility of wholesale fuel prices. During a period of rising wholesale fuel costs, our gross margins typically contract. During a period of declining wholesale fuel costs, our gross margins typically expand. This is why we believe it is important to consider a longer view when analyzing fuel margins to account for these fluctuations.
Fuel Margins (Cents Per Gallon) Q1 Q2 Q3 Q4* YR*
FY 2013 11.6¢ 17.0¢ 17.1¢ 11.3¢ 14.1¢
FY 2012 12.1¢ 16.4¢ 15.3¢ 13.0¢ 14.0¢
Difference <0.5¢> 0.6¢ 1.8¢ <1.7¢> 0.1¢
*2012 Q4 and YR have been adjusted to exclude the extra week in 2012.
Note that Kroger’s fuel margins exclude credit card fees. We include credit card fees in OG&A expense.
The Kroger Co. Page 39
LOYALTY DATA & CUSTOMER INSIGHT
Kroger’s growth strategy is squarely focused on consistently meeting the needs of our Customers. Through shopper data, surveys, and research we strive to understand our Customers. These insights help us create solutions that help Customers save time, money, and deliver value. In-turn, Customers are more satisfied and choose Kroger more often.
The key to unlocking that insight and creating value for our Customers has been a partnership with dunnhumby that was formed in 2003. London-based dunnhumby is a leading global Customer science company.
This partnership (dunnhumbyUSA) is a unique competitive advantage for Kroger. It allows us to design personalized offerings for individual needs. It also gives us the tools to target our promotional dollars and pricing investments toward our most loyal Customers.
dunnhumbyUSA continues to grow and evolve. Each year this partnership helps us analyze our business to bring new perspectives and insights. In addition to helping Kroger build Customer loyalty and brand value, dunnhumbyUSA serves other manufacturing and non-grocery retail clients through offices in Boston, Chicago, Cincinnati, New York, Portland and Sacramento.
The Kroger Co. Page 40
KROGER PERSONAL FINANCE
Another unique competitive advantage for Kroger is Kroger Personal Finance® (“KPF”). KPF believes that loyalty is earned by respecting the individual and their unique financial goals: we’ll meet people where they are and provide them with simple, innovative and transparent money management solutions.
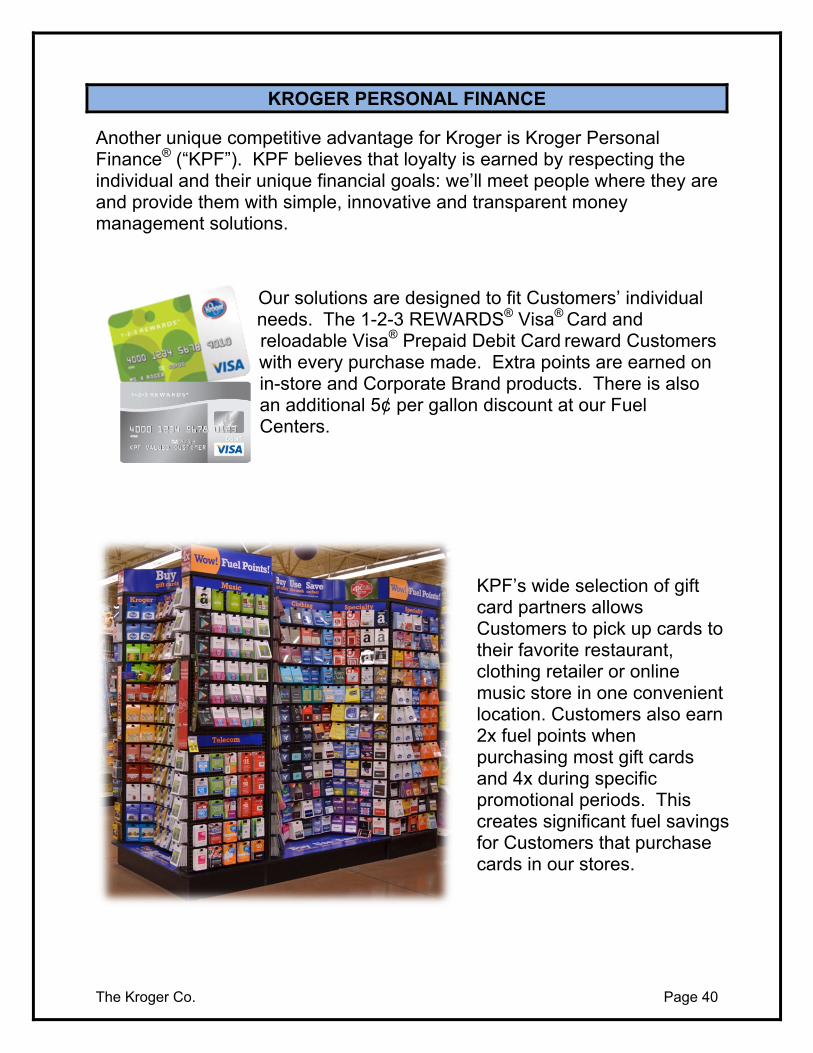
Our solutions are designed to fit Customers’ individual needs. The 1-2-3 REWARDS® Visa® Card and reloadable Visa® Prepaid Debit Card reward Customers with every purchase made. Extra points are earned on in-store and Corporate Brand products. There is also an additional 5¢ per gallon discount at our Fuel Centers.
KPF’s wide selection of gift card partners allows Customers to pick up cards to their favorite restaurant, clothing retailer or online music store in one convenient location. Customers also earn 2x fuel points when purchasing most gift cards and 4x during specific promotional periods. This creates significant fuel savings for Customers that purchase cards in our stores.
The Kroger Co. Page 41
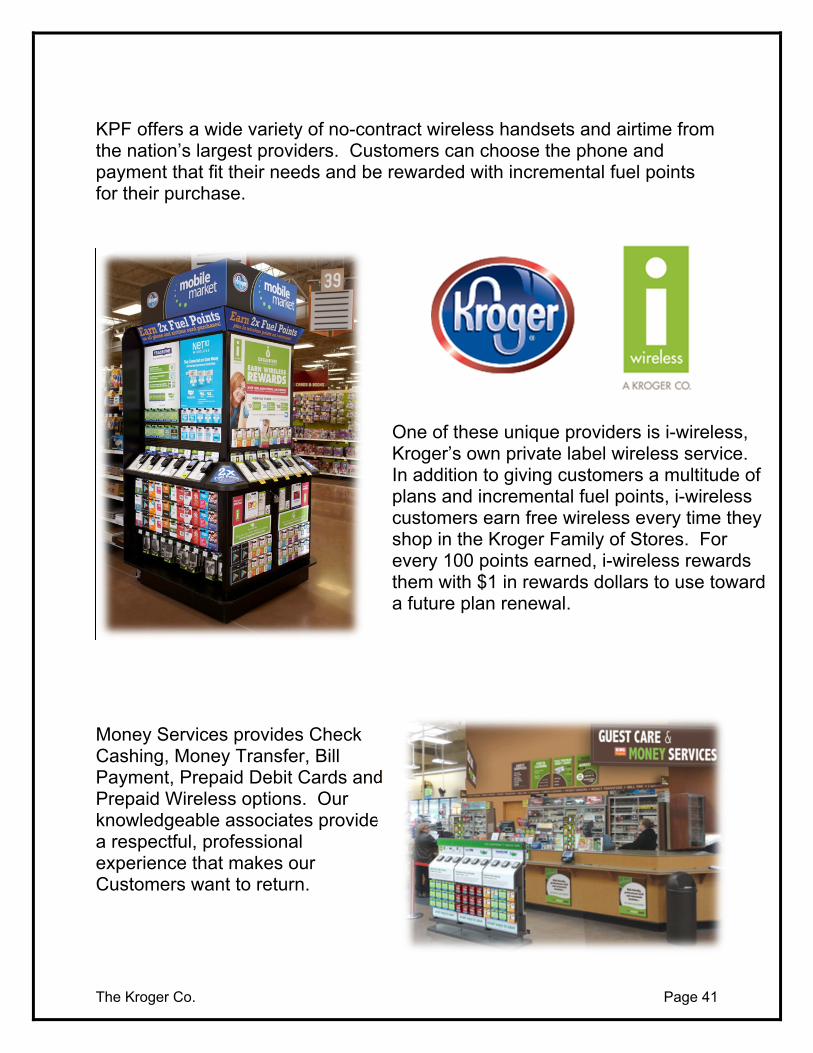
KPF offers a wide variety of no-contract wireless handsets and airtime from the nation’s largest providers. Customers can choose the phone and payment that fit their needs and be rewarded with incremental fuel points for their purchase.
Money Services provides Check Cashing, Money Transfer, Bill Payment, Prepaid Debit Cards and Prepaid Wireless options. Our knowledgeable associates provide a respectful, professional experience that makes our Customers want to return.
One of these unique providers is i-wireless, Kroger’s own private label wireless service. In addition to giving customers a multitude of plans and incremental fuel points, i-wireless customers earn free wireless every time they shop in the Kroger Family of Stores. For every 100 points earned, i-wireless rewards them with $1 in rewards dollars to use toward a future plan renewal.
The Kroger Co. Page 42
TECHNOLOGY SYSTEMS & INFRASTRUCTURE
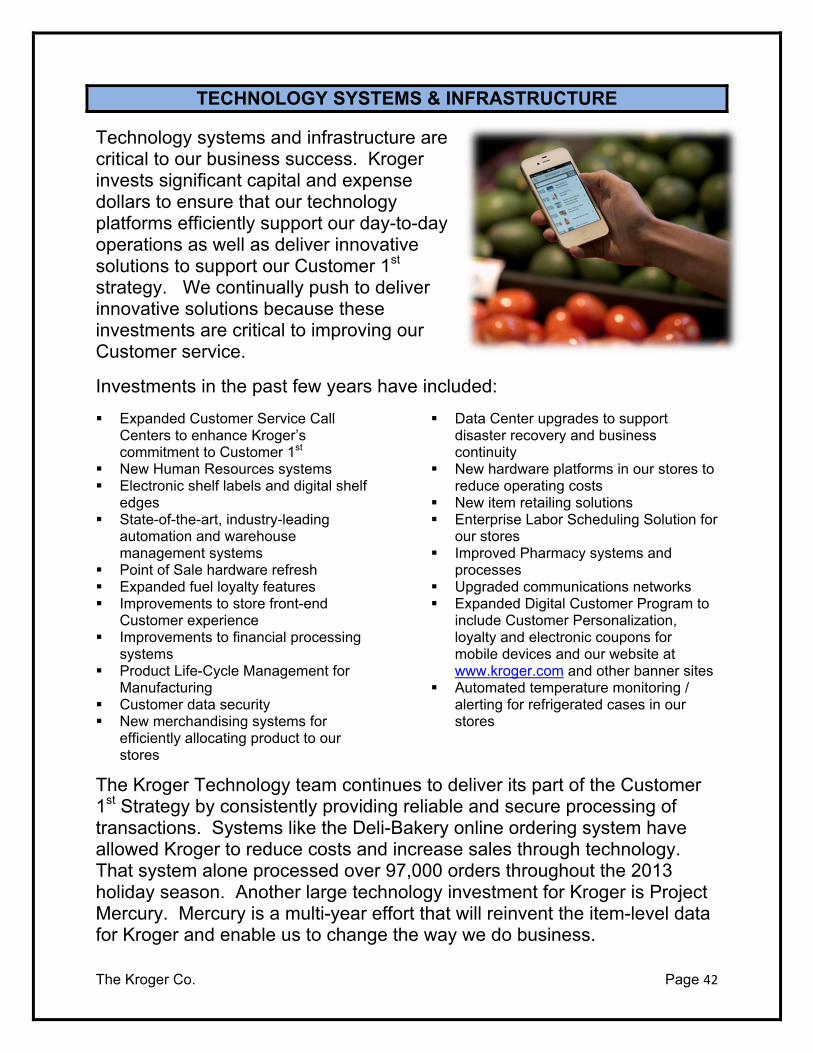
Technology systems and infrastructure are critical to our business success. Kroger invests significant capital and expense dollars to ensure that our technology platforms efficiently support our day-to-day operations as well as deliver innovative solutions to support our Customer 1st strategy. We continually push to deliver innovative solutions because these investments are critical to improving our Customer service.
Investments in the past few years have included:
Expanded Customer Service Call Centers to enhance Kroger’s commitment to Customer 1st
New Human Resources systems Electronic shelf labels and digital shelf
edges State-of-the-art, industry-leading
automation and warehouse management systems
Point of Sale hardware refresh Expanded fuel loyalty features Improvements to store front-end
Customer experience Improvements to financial processing
systems Product Life-Cycle Management for
Manufacturing Customer data security New merchandising systems for
efficiently allocating product to our stores
Data Center upgrades to support disaster recovery and business continuity
New hardware platforms in our stores to reduce operating costs
New item retailing solutions Enterprise Labor Scheduling Solution for
our stores Improved Pharmacy systems and
processes Upgraded communications networks Expanded Digital Customer Program to
include Customer Personalization, loyalty and electronic coupons for mobile devices and our website at www.kroger.com and other banner sites
Automated temperature monitoring / alerting for refrigerated cases in our stores
The Kroger Technology team continues to deliver its part of the Customer 1st Strategy by consistently providing reliable and secure processing of transactions. Systems like the Deli-Bakery online ordering system have allowed Kroger to reduce costs and increase sales through technology. That system alone processed over 97,000 orders throughout the 2013 holiday season. Another large technology investment for Kroger is Project Mercury. Mercury is a multi-year effort that will reinvent the item-level data for Kroger and enable us to change the way we do business.
The Kroger Co. Page 43
Once completed, this system will provide other Kroger systems with the most accurate item level data available in the industry, which in turn will allow Kroger to engage Customers at a whole new level.
Our technology investments are producing returns above Kroger’s goal of 11.3%, after-tax, for capital projects. In addition, all of these efforts are tied to the Four Keys and the Customer 1st Strategy.
Research and Development
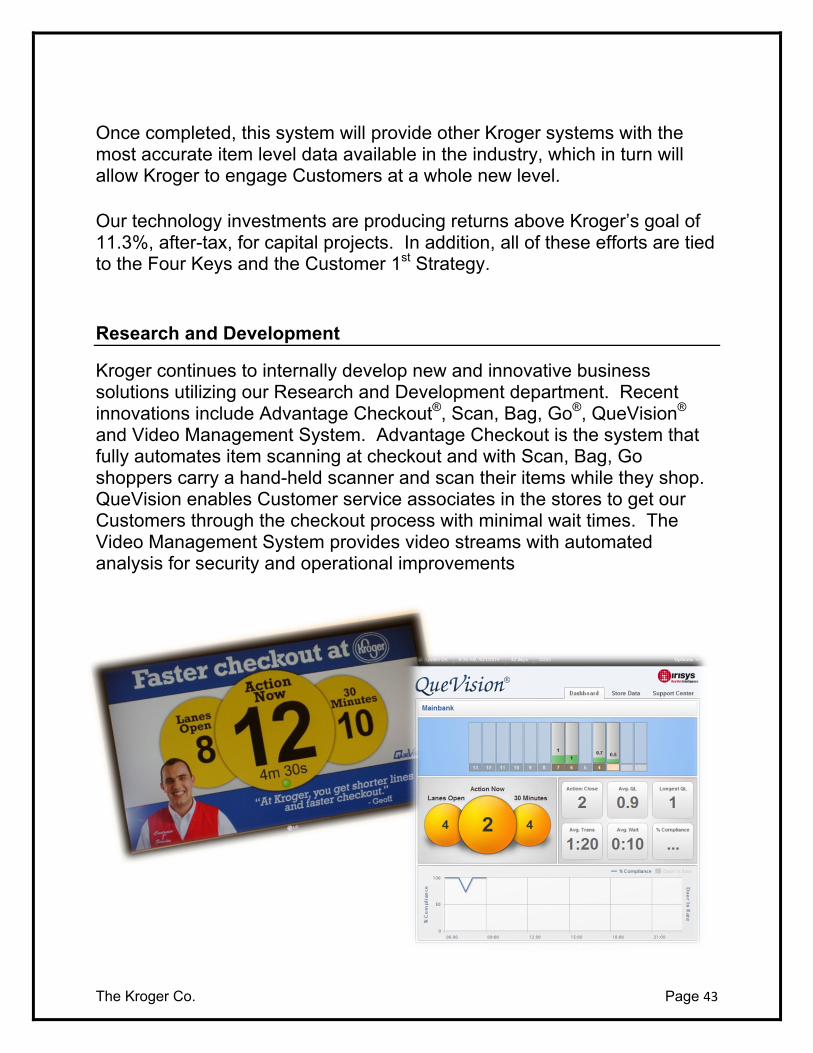
Kroger continues to internally develop new and innovative business solutions utilizing our Research and Development department. Recent innovations include Advantage Checkout®, Scan, Bag, Go®, QueVision®
and Video Management System. Advantage Checkout is the system that fully automates item scanning at checkout and with Scan, Bag, Go shoppers carry a hand-held scanner and scan their items while they shop. QueVision enables Customer service associates in the stores to get our Customers through the checkout process with minimal wait times. The Video Management System provides video streams with automated analysis for security and operational improvements
The Kroger Co. Page 44
LOGISTICS
Kroger’s logistics network includes 36 distribution centers (“DCs”). An important part of our Customer 1st Strategy involves investing in our logistics infrastructure to improve operational efficiency, lower costs, and upgrade product freshness, quality, and safety. Over the past several years, Kroger has made significant investments in leading edge distribution technology – including warehouse, transportation, and advanced automation systems. Our DCs contain state-of-the-art product handling systems, refrigeration, temperature and lighting controls. These technologies have allowed us to significantly reduce our energy use in the DCs, saving costs and reducing Kroger’s carbon footprint.
Kroger employs a rigorous program of lean process engineering to continuously improve the efficiency of the supply chain. The program examines each step – from suppliers to the stores – streamlining processes, driving out waste and reducing costs to enable continued investment in our Customer 1st Strategy.
Some of Kroger’s distribution centers and store delivery fleets have been outsourced to third-party logistics providers, giving our company access to evolving approaches in distribution and more flexibility to implement them.
Ongoing optimization analysis reduces the capital needed to maintain and modernize the network, reduces working capital and lowers product acquisition costs since larger quantity purchases are possible.
Three-Tier Distribution Network
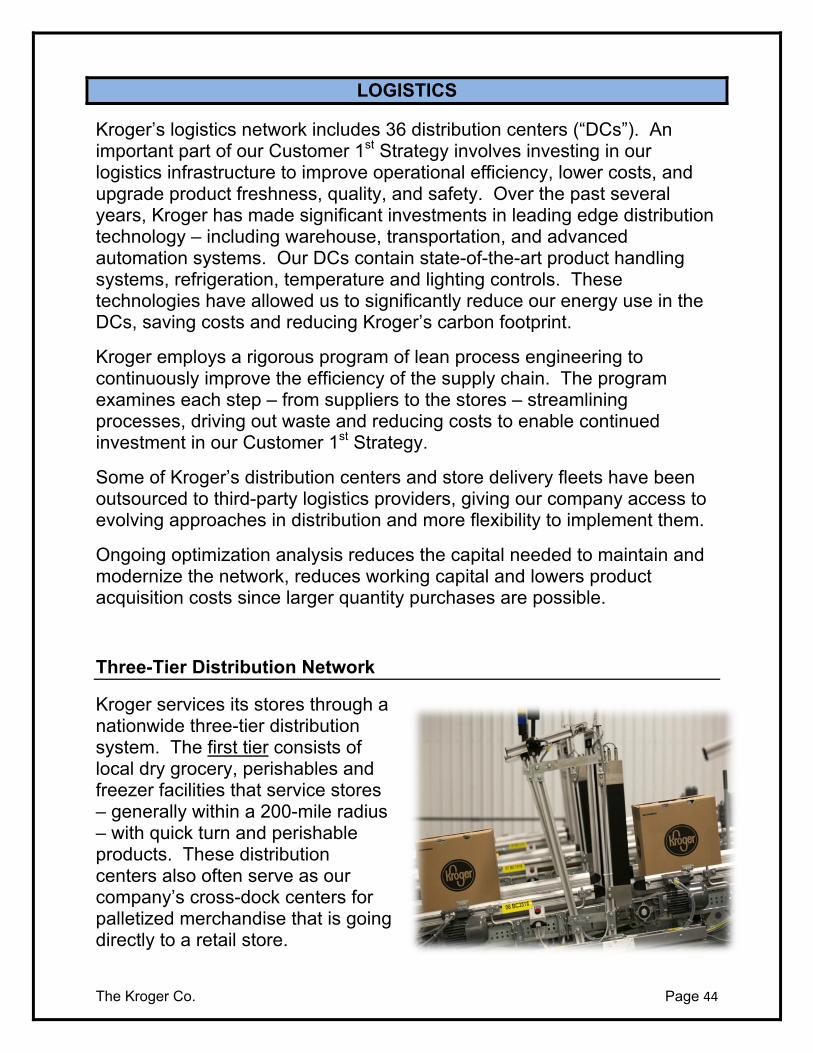
Kroger services its stores through a nationwide three-tier distribution system. The first tier consists of local dry grocery, perishables and freezer facilities that service stores – generally within a 200-mile radius – with quick turn and perishable products. These distribution centers also often serve as our company’s cross-dock centers for palletized merchandise that is going directly to a retail store.
The Kroger Co. Page 45
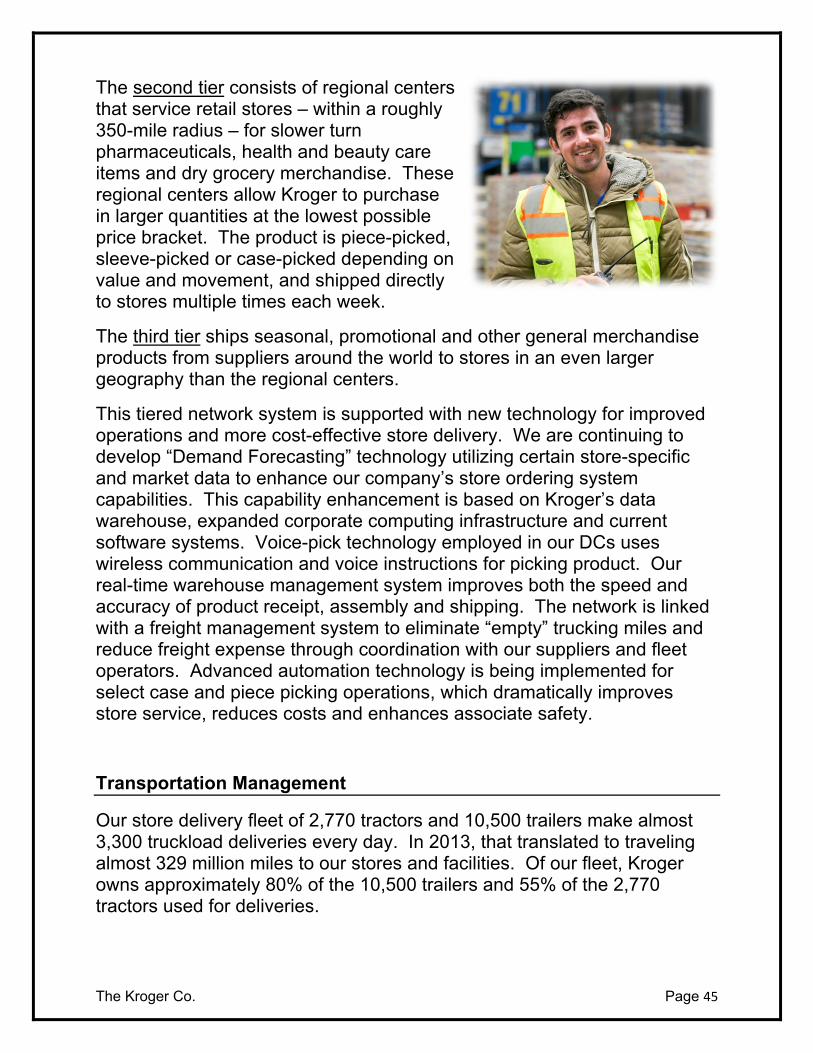
The second tier consists of regional centers that service retail stores – within a roughly 350-mile radius – for slower turn pharmaceuticals, health and beauty care items and dry grocery merchandise. These regional centers allow Kroger to purchase in larger quantities at the lowest possible price bracket. The product is piece-picked, sleeve-picked or case-picked depending on value and movement, and shipped directly to stores multiple times each week.
The third tier ships seasonal, promotional and other general merchandise products from suppliers around the world to stores in an even larger geography than the regional centers.
This tiered network system is supported with new technology for improved operations and more cost-effective store delivery. We are continuing to develop “Demand Forecasting” technology utilizing certain store-specific and market data to enhance our company’s store ordering system capabilities. This capability enhancement is based on Kroger’s data warehouse, expanded corporate computing infrastructure and current software systems. Voice-pick technology employed in our DCs uses wireless communication and voice instructions for picking product. Our real-time warehouse management system improves both the speed and accuracy of product receipt, assembly and shipping. The network is linked with a freight management system to eliminate “empty” trucking miles and reduce freight expense through coordination with our suppliers and fleet operators. Advanced automation technology is being implemented for select case and piece picking operations, which dramatically improves store service, reduces costs and enhances associate safety.
Transportation Management
Our store delivery fleet of 2,770 tractors and 10,500 trailers make almost 3,300 truckload deliveries every day. In 2013, that translated to traveling almost 329 million miles to our stores and facilities. Of our fleet, Kroger owns approximately 80% of the 10,500 trailers and 55% of the 2,770 tractors used for deliveries.
The Kroger Co. Page 46
With rising fuel and operational costs, Kroger leverages its investments in network-based transportation management systems to improve utilization of its store delivery and inbound fleets. Additionally in 2013, our tractors continue to be equipped with the latest on-board computer technology providing real-time visibility of store deliveries in route which allows the driver to be more effective and make the appropriate adjustments when necessary to protect on-time deliveries. Fleet capacity management across all markets and business units is being integrated into these tools to maximize coordination and utilization. Some of our other efforts in this area include: improving the aerodynamic design of tractors and trailers for better fuel economy; utilizing the latest clean engine technology that also improves tractor fuel efficiency; installing an automatic tire inflation system; expanding the usage of multi-temperature trucks to transport frozen, refrigerated or dry goods in one truck; improving the insulation of our refrigerated trucks; and standardizing top speeds and idling protocols.
Improving the operational efficiency of our fleet not only lowers our costs, it also helps reduce Kroger’s impact on the environment. Please see our most recent Sustainability Report (www.sustainability.kroger.com) for additional information about our efforts and achievements in this important area.
The Kroger Co. Page 47
DIGITAL
Kroger uses digital channels as a means to better engage directly with Customers as they plan and shop. As our Customers spend more of their time online and increasingly adopt and use mobile technologies, our investments into the digital channels provide our Customers with easy, instant access to content and tools. Capabilities available include:
Websites for each of our Banners provide Customers with a single place to find information about their local store, view the weekly ad and online promotions, load digital coupons to the shopper card, create shopping lists, refill a prescription, set up an online account and view points and rewards balances.
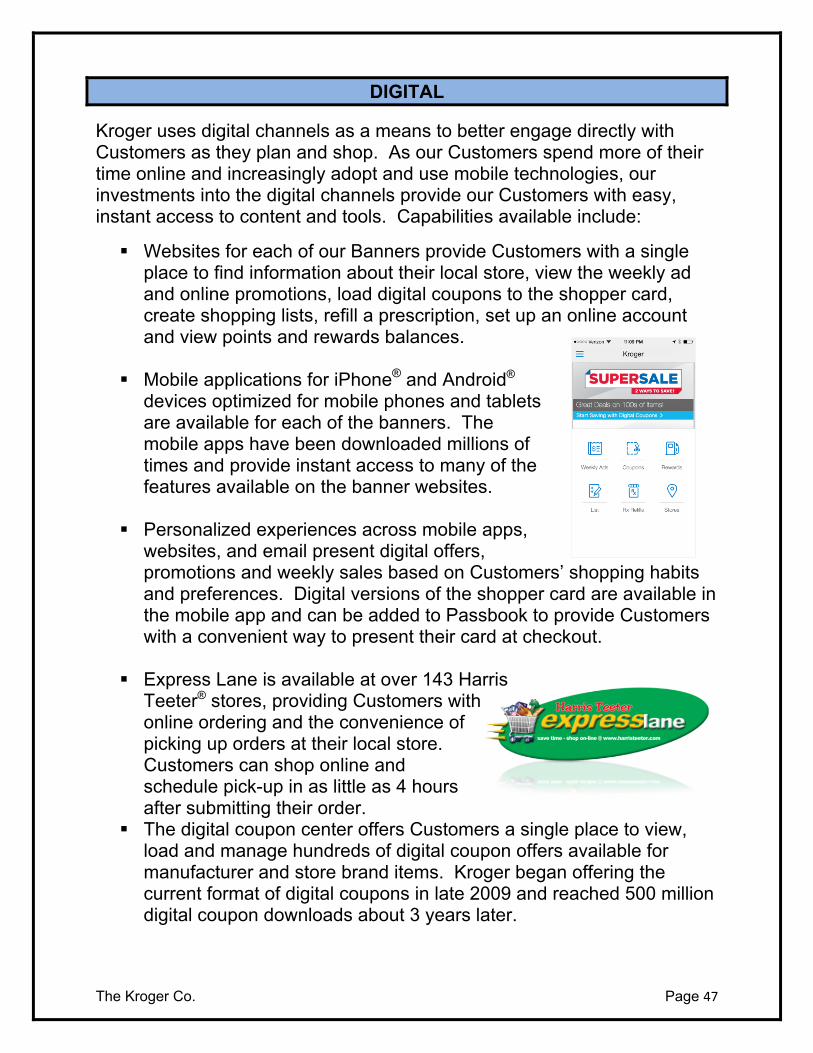
Mobile applications for iPhone® and Android® devices optimized for mobile phones and tablets are available for each of the banners. The mobile apps have been downloaded millions of times and provide instant access to many of the features available on the banner websites.
Personalized experiences across mobile apps, websites, and email present digital offers, promotions and weekly sales based on Customers’ shopping habits and preferences. Digital versions of the shopper card are available in the mobile app and can be added to Passbook to provide Customers with a convenient way to present their card at checkout.
Express Lane is available at over 143 Harris Teeter® stores, providing Customers with online ordering and the convenience of picking up orders at their local store. Customers can shop online and schedule pick-up in as little as 4 hours after submitting their order.
The digital coupon center offers Customers a single place to view, load and manage hundreds of digital coupon offers available for manufacturer and store brand items. Kroger began offering the current format of digital coupons in late 2009 and reached 500 million digital coupon downloads about 3 years later.
The Kroger Co. Page 48
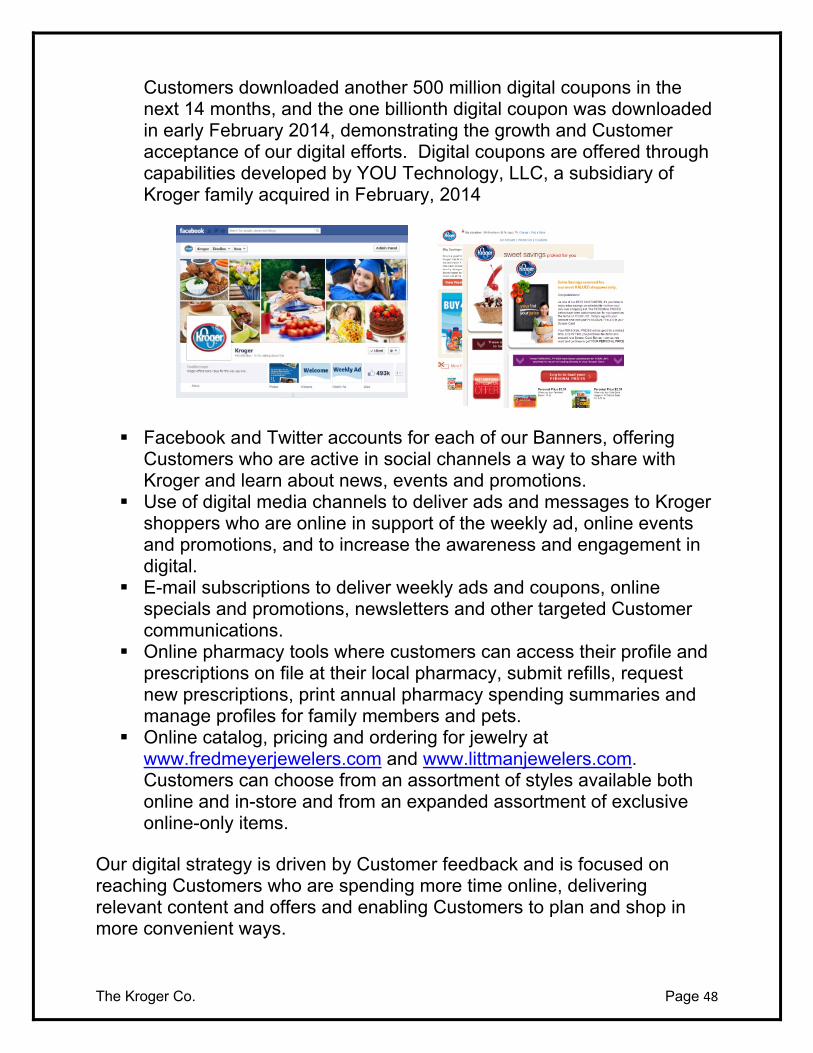
Customers downloaded another 500 million digital coupons in the next 14 months, and the one billionth digital coupon was downloaded in early February 2014, demonstrating the growth and Customer acceptance of our digital efforts. Digital coupons are offered through capabilities developed by YOU Technology, LLC, a subsidiary of Kroger family acquired in February, 2014
Facebook and Twitter accounts for each of our Banners, offering Customers who are active in social channels a way to share with Kroger and learn about news, events and promotions.
Use of digital media channels to deliver ads and messages to Kroger shoppers who are online in support of the weekly ad, online events and promotions, and to increase the awareness and engagement in digital.
E-mail subscriptions to deliver weekly ads and coupons, online specials and promotions, newsletters and other targeted Customer communications.
Online pharmacy tools where customers can access their profile and prescriptions on file at their local pharmacy, submit refills, request new prescriptions, print annual pharmacy spending summaries and manage profiles for family members and pets.
Online catalog, pricing and ordering for jewelry at www.fredmeyerjewelers.com and www.littmanjewelers.com. Customers can choose from an assortment of styles available both online and in-store and from an expanded assortment of exclusive online-only items.
Our digital strategy is driven by Customer feedback and is focused on reaching Customers who are spending more time online, delivering relevant content and offers and enabling Customers to plan and shop in more convenient ways.
The Kroger Co. Page 49
CUSTOMER 1st STRATEGY
Kroger stands apart from others in our industry because of our Customer 1st Strategy. The Kroger team has been executing this consistent strategy for over a decade. As a result of this approach, we have been growing our business by increasing Customer loyalty to Kroger’s family of stores.
Listening to our Customers is the foundation of this approach. Based on Customer feedback, we invest in four key areas of our business, so that our Customers say:
Our people are great! I get the products I want, plus a little. The shopping experience makes me want to return. Our prices are good.
These investments can take several forms – including improved Customer service, better product quality and selection, enhancements to our shop-ping environment and lower prices. We seek to fund these investments through operating cost reductions and productivity improvements across all areas of our business.
Our long-term business model reflects our Customer 1st Strategy. We believe it is the right approach to create sustainable shareholder value in a highly competitive industry. Our objective is to increase annual earnings per share through the combination of strong, sustainable identical sales growth and slightly improved operating margins, both excluding our retail fuel operations. Investments in the Four Keys of our Customer 1st Strategy help us drive strong and sustainable identical sales and market share growth.
A cornerstone of our business strategy is balance. We seek to consistently deliver solid financial results in the near-term while making meaningful investments for our future. We believe our Customer 1st Strategy can serve Customers, associates, and investors well in a variety of economic and competitive conditions.
The Kroger Co. Page 50
MARKET SHARE
Growing market share is an important part of Kroger’s long-term strategy. Market share is important to us because it allows Kroger to leverage the fixed costs in our business over a wider revenue base. Our fundamental operating philosophy is to maintain and increase market share by offering Customers good prices and superior products and service.
In the past, we used Nielsen Homescan data as our source for market share. We are now using a different Nielsen product, Nielsen POS+, which includes all point of sale data from several competitors and includes all departments in our stores except for pharmacy. We believe Nielsen POS+ data is a good and consistent source. While POS+ does not include all of our competitors today, it captures roughly 85% of the items we sell, including most perishable items, which Nielsen Homescan did not include.
Based on Nielsen POS+ data, our estimated market share increased in total by approximately 50 basis points in 2013 across our 18 marketing areas outlined in the Nielsen report. This information also indicates that our market share increased in 16 of the 18 markets and declined slightly in two. Walmart Supercenters are one of our top two competitors in 13 of the 18 marketing areas, and our market share increased in 12 of these marketing areas and declined in one.
We plan to continue to grow our business by maintaining Kroger’s existing strong market share while continuing to build on additional opportunities for sales growth.
The Kroger Co. Page 51
IDENTICAL SUPERMARKET SALES
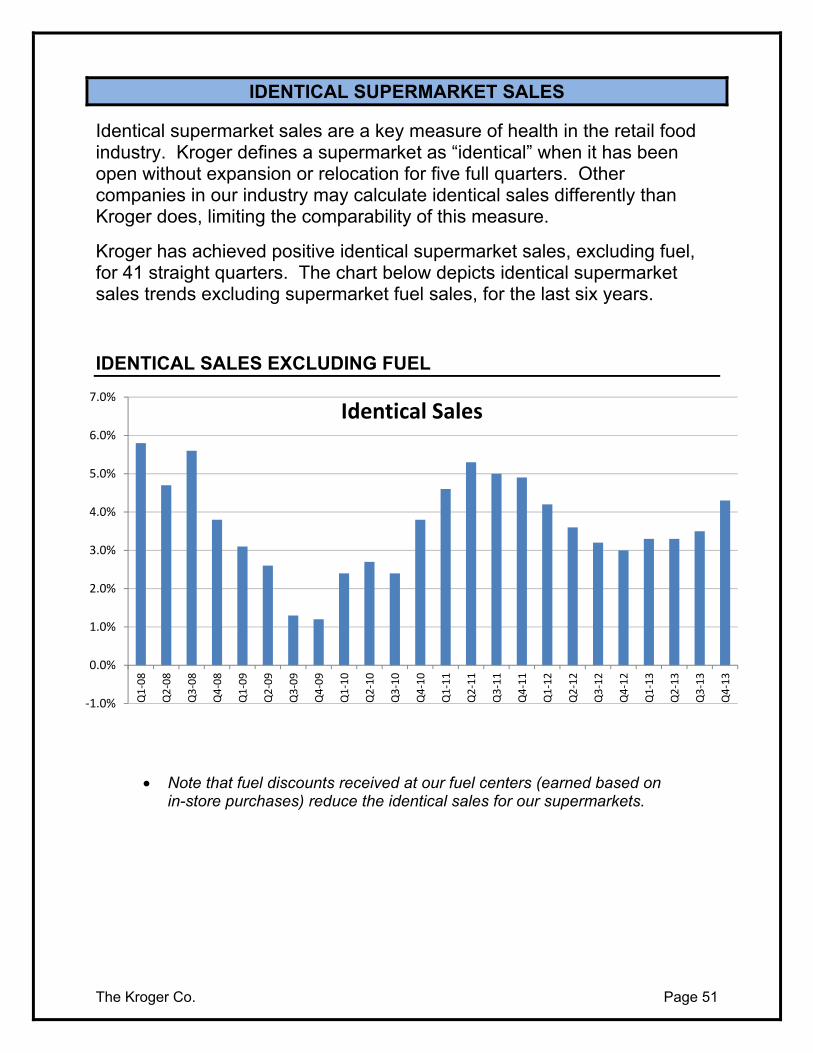
Identical supermarket sales are a key measure of health in the retail food industry. Kroger defines a supermarket as “identical” when it has been open without expansion or relocation for five full quarters. Other companies in our industry may calculate identical sales differently than Kroger does, limiting the comparability of this measure.
Kroger has achieved positive identical supermarket sales, excluding fuel, for 41 straight quarters. The chart below depicts identical supermarket sales trends excluding supermarket fuel sales, for the last six years.
IDENTICAL SALES EXCLUDING FUEL
Note that fuel discounts received at our fuel centers (earned based on in-store purchases) reduce the identical sales for our supermarkets.
‐1.0%
0.0%
1.0%
2.0%
3.0%
4.0%
5.0%
6.0%
7.0%
Q1‐08
Q2‐08
Q3‐08
Q4‐08
Q1‐09
Q2‐09
Q3‐09
Q4‐09
Q1‐10
Q2‐10
Q3‐10
Q4‐10
Q1‐11
Q2‐11
Q3‐11
Q4‐11
Q1‐12
Q2‐12
Q3‐12
Q4‐12
Q1‐13
Q2‐13
Q3‐13
Q4‐13
Identical Sales
The Kroger Co. Page 52
FINANCIAL STRATEGY
Kroger’s financial strength has long been a competitive advantage and is even more so in the current economic environment. We believe it is important to allocate the strong cash flow that our business generates to invest in our store base and infrastructure, maintain Kroger’s leverage ratios, and provide a solid return for shareholders.
FINANCIAL GOALS & STRATEGY
1. Achieve solid, steady identical sales growth, with a slightly expanding FIFO operating margin (excluding fuel) and consistent earnings per share growth, equal to or above overall market returns.
2. Financial strategy and use of cash flow:
a. Maintain a consistent, solid investment grade rating. To achieve this, our objective is to maintain a net total debt to adjusted EBITDA ratio between 2.0 and 2.2.
At fiscal year-end 2013, our leverage ratio was 2.43. Net total debt increased $2.3 billion from a year ago as a result of the Harris Teeter transaction, and, due to the timing of closing late in our fiscal year, we realized no incremental EBITDA in 2013 from this transaction. We have committed to the rating agencies that we will return this ratio to the 2.0 to 2.2 times range within 18-24 months of the transaction closing.
b. Return value to shareholders via:
i. Target long-term EPS growth averaging 8% to 11% per year.
ii. Pay a dividend on a quarterly basis, with expectations of growing the dividend over time.
iii. Maintain a steady stock repurchase program, contributing to annual EPS growth.
c. Increase capital investments by $200 million each year for several years. This incremental capital will be used to support the company’s strategy to expand its presence in a few targeted existing markets, establish a major presence in one or two new markets, as well as invest in other high-return capital projects. This plan is designed to support the Company’s goal of continual market share growth.
3. Generate a return on invested capital (ROIC) that increases over time.
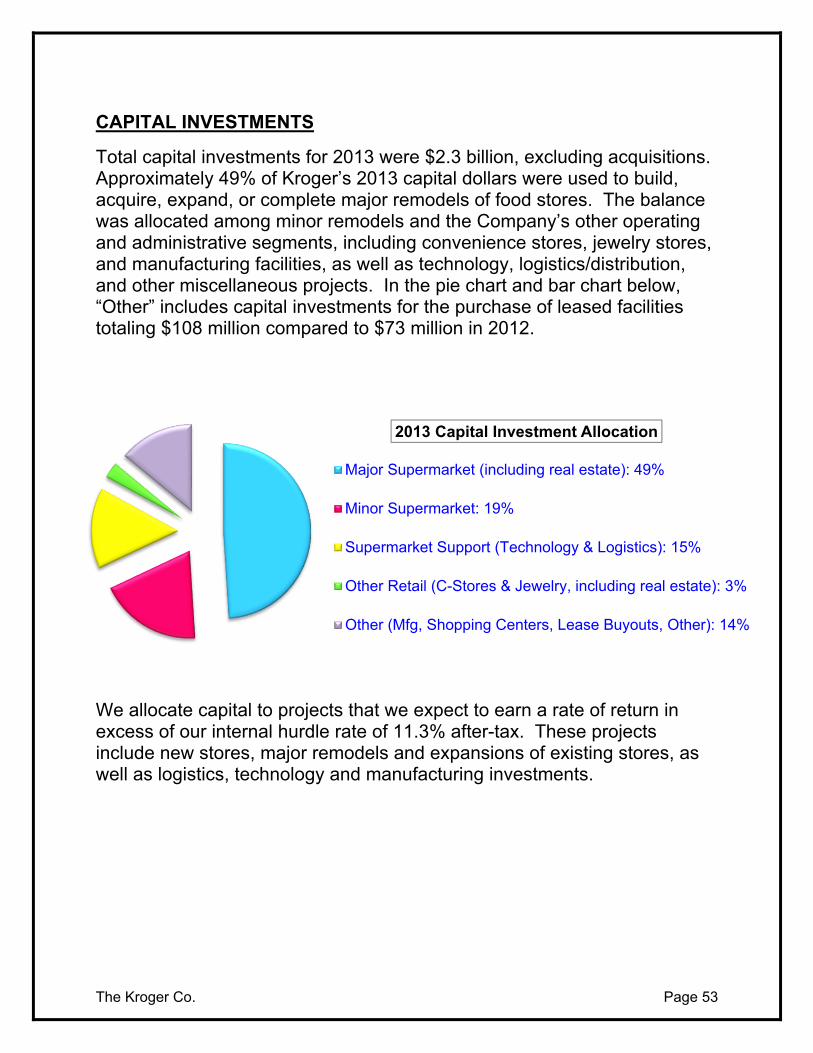
The Kroger Co. Page 53
CAPITAL INVESTMENTS
Total capital investments for 2013 were $2.3 billion, excluding acquisitions. Approximately 49% of Kroger’s 2013 capital dollars were used to build, acquire, expand, or complete major remodels of food stores. The balance was allocated among minor remodels and the Company’s other operating and administrative segments, including convenience stores, jewelry stores, and manufacturing facilities, as well as technology, logistics/distribution, and other miscellaneous projects. In the pie chart and bar chart below, “Other” includes capital investments for the purchase of leased facilities totaling $108 million compared to $73 million in 2012.
We allocate capital to projects that we expect to earn a rate of return in excess of our internal hurdle rate of 11.3% after-tax. These projects include new stores, major remodels and expansions of existing stores, as well as logistics, technology and manufacturing investments.
2013 Capital Investment Allocation
Major Supermarket (including real estate): 49%
Minor Supermarket: 19%
Supermarket Support (Technology & Logistics): 15%
Other Retail (C-Stores & Jewelry, including real estate): 3%
Other (Mfg, Shopping Centers, Lease Buyouts, Other): 14%
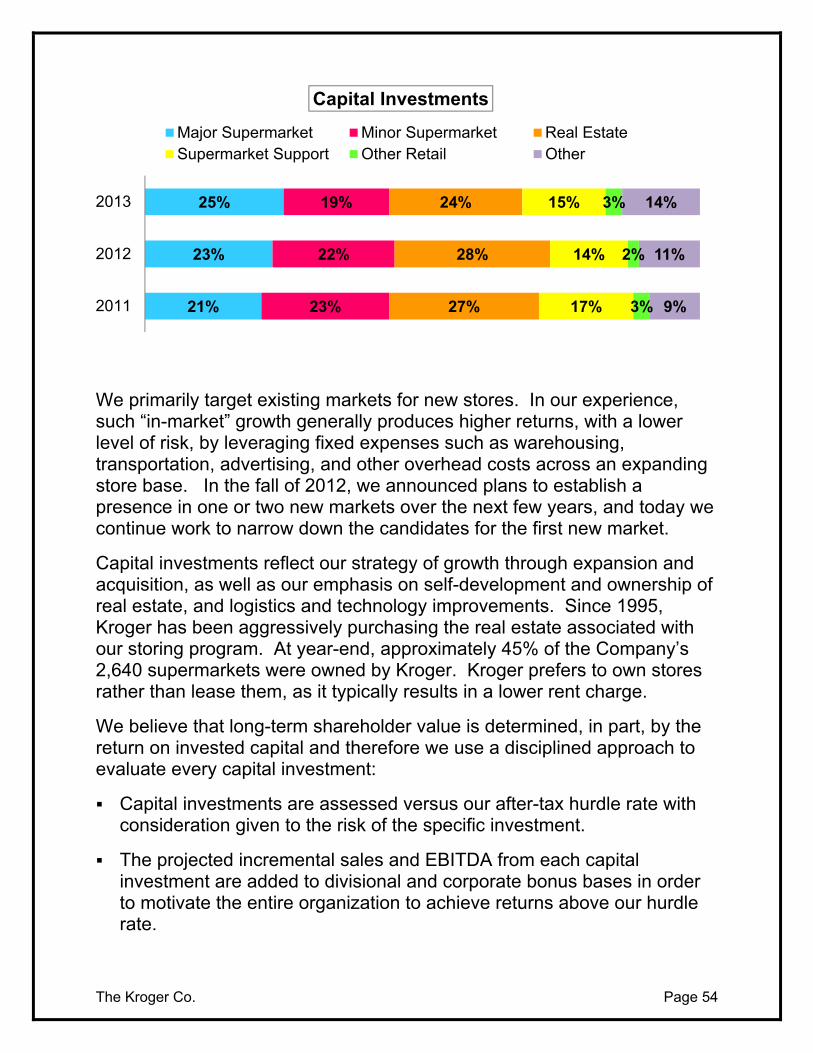
The Kroger Co. Page 54
We primarily target existing markets for new stores. In our experience, such “in-market” growth generally produces higher returns, with a lower level of risk, by leveraging fixed expenses such as warehousing, transportation, advertising, and other overhead costs across an expanding store base. In the fall of 2012, we announced plans to establish a presence in one or two new markets over the next few years, and today we continue work to narrow down the candidates for the first new market.
Capital investments reflect our strategy of growth through expansion and acquisition, as well as our emphasis on self-development and ownership of real estate, and logistics and technology improvements. Since 1995, Kroger has been aggressively purchasing the real estate associated with our storing program. At year-end, approximately 45% of the Company’s 2,640 supermarkets were owned by Kroger. Kroger prefers to own stores rather than lease them, as it typically results in a lower rent charge.
We believe that long-term shareholder value is determined, in part, by the return on invested capital and therefore we use a disciplined approach to evaluate every capital investment:
Capital investments are assessed versus our after-tax hurdle rate with consideration given to the risk of the specific investment.
The projected incremental sales and EBITDA from each capital investment are added to divisional and corporate bonus bases in order to motivate the entire organization to achieve returns above our hurdle rate.
21%
23%
25%
23%
22%
19%
27%
28%
24%
17%
14%
15%
3%
2%
3%
9%
11%
14%
2011
2012
2013
Capital Investments
Major Supermarket Minor Supermarket Real EstateSupermarket Support Other Retail Other
The Kroger Co. Page 55
A quarterly re-analysis of each major project is conducted to ensure we understand the return from major capital projects.
A new goal of a steadily improving ROIC was established in late 2012. Beginning in 2013, this became a component of the long-term incentive plan for company executives. The ROIC at the end of fiscal 2013 was 13.43% versus 13.41% in 2012, excluding Harris Teeter and the extra week in fiscal 2012.
Kroger continues to aggressively close underperforming stores. In fiscal 2013, we closed 35 stores – 28 of these were operational closures. The term “operational closure” describes a store location that has been closed without opening another store in the same vicinity to replace it.
The chart on the following page provides Kroger’s real estate activity by quarter for fiscal 2011, 2012, and 2013.
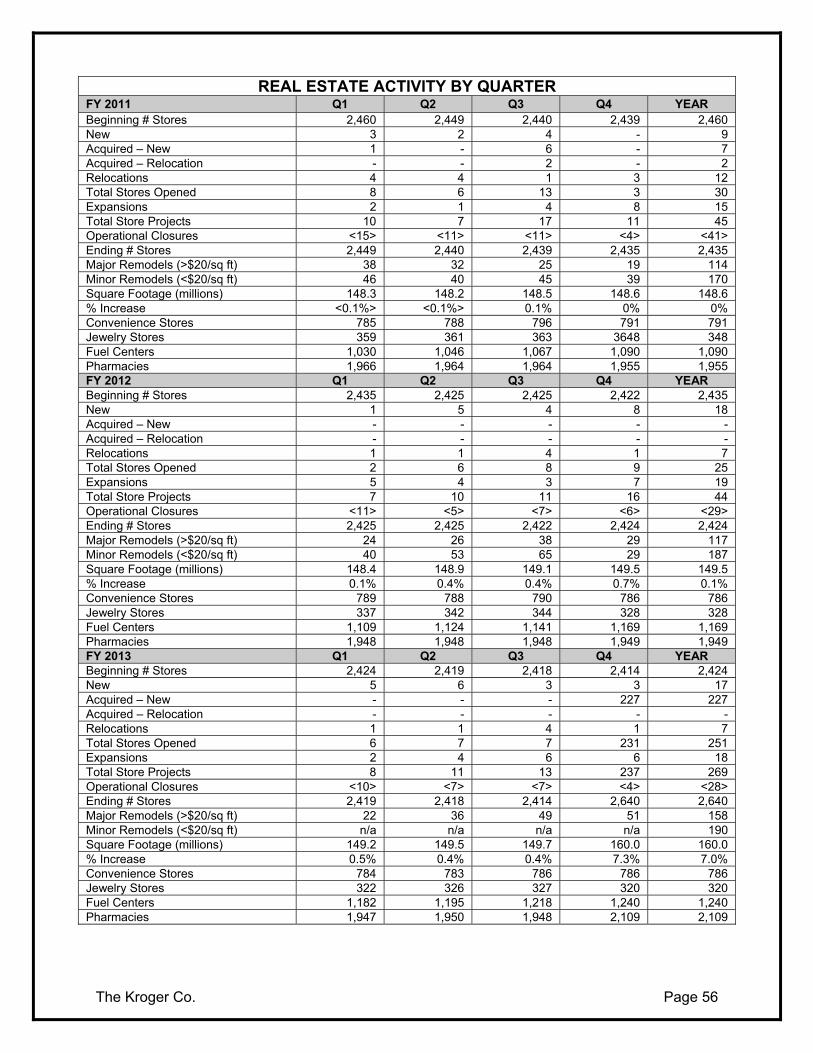
The Kroger Co. Page 56
REAL ESTATE ACTIVITY BY QUARTERFY 2011 Q1 Q2 Q3 Q4 YEAR Beginning # Stores 2,460 2,449 2,440 2,439 2,460 New 3 2 4 - 9 Acquired – New 1 - 6 - 7 Acquired – Relocation - - 2 - 2 Relocations 4 4 1 3 12 Total Stores Opened 8 6 13 3 30 Expansions 2 1 4 8 15 Total Store Projects 10 7 17 11 45 Operational Closures <15> <11> <11> <4> <41> Ending # Stores 2,449 2,440 2,439 2,435 2,435 Major Remodels (>$20/sq ft) 38 32 25 19 114 Minor Remodels (<$20/sq ft) 46 40 45 39 170 Square Footage (millions) 148.3 148.2 148.5 148.6 148.6 % Increase <0.1%> <0.1%> 0.1% 0% 0% Convenience Stores 785 788 796 791 791 Jewelry Stores 359 361 363 3648 348 Fuel Centers 1,030 1,046 1,067 1,090 1,090 Pharmacies 1,966 1,964 1,964 1,955 1,955 FY 2012 Q1 Q2 Q3 Q4 YEARBeginning # Stores 2,435 2,425 2,425 2,422 2,435 New 1 5 4 8 18 Acquired – New - - - - - Acquired – Relocation - - - - - Relocations 1 1 4 1 7 Total Stores Opened 2 6 8 9 25 Expansions 5 4 3 7 19 Total Store Projects 7 10 11 16 44 Operational Closures <11> <5> <7> <6> <29> Ending # Stores 2,425 2,425 2,422 2,424 2,424 Major Remodels (>$20/sq ft) 24 26 38 29 117 Minor Remodels (<$20/sq ft) 40 53 65 29 187 Square Footage (millions) 148.4 148.9 149.1 149.5 149.5 % Increase 0.1% 0.4% 0.4% 0.7% 0.1% Convenience Stores 789 788 790 786 786 Jewelry Stores 337 342 344 328 328 Fuel Centers 1,109 1,124 1,141 1,169 1,169 Pharmacies 1,948 1,948 1,948 1,949 1,949 FY 2013 Q1 Q2 Q3 Q4 YEAR Beginning # Stores 2,424 2,419 2,418 2,414 2,424 New 5 6 3 3 17 Acquired – New - - - 227 227 Acquired – Relocation - - - - - Relocations 1 1 4 1 7 Total Stores Opened 6 7 7 231 251 Expansions 2 4 6 6 18 Total Store Projects 8 11 13 237 269 Operational Closures <10> <7> <7> <4> <28> Ending # Stores 2,419 2,418 2,414 2,640 2,640 Major Remodels (>$20/sq ft) 22 36 49 51 158 Minor Remodels (<$20/sq ft) n/a n/a n/a n/a 190 Square Footage (millions) 149.2 149.5 149.7 160.0 160.0 % Increase 0.5% 0.4% 0.4% 7.3% 7.0% Convenience Stores 784 783 786 786 786 Jewelry Stores 322 326 327 320 320 Fuel Centers 1,182 1,195 1,218 1,240 1,240 Pharmacies 1,947 1,950 1,948 2,109 2,109
The Kroger Co. Page 57
DEBT OBLIGATIONS
At year-end 2013, Kroger had one credit facility:
$2.0 billion Credit Agreement (with ability to increase by $500 million) maturing in January 2017, unless earlier terminated by Kroger.
In addition to the Credit Agreement, Kroger maintained two uncommitted money market lines totaling $75 million in the aggregate. As of February 1, 2014, the Company had $1.2 billion of borrowings of commercial paper and no borrowings under its Credit Agreement or money market lines. The outstanding letters of credit that reduce funds available under Kroger’s Credit Agreement totaled $12 million as of February 1, 2014.
The table on the following page details Kroger’s debt obligations as of year-end 2013.
Debt Rating
Kroger’s debt rating remains important to us as we execute our Customer 1st strategy. Management believes maintaining a solid investment grade rating provides the best cost of capital and the flexibility to execute our growth strategy in a competitive and consolidating industry.
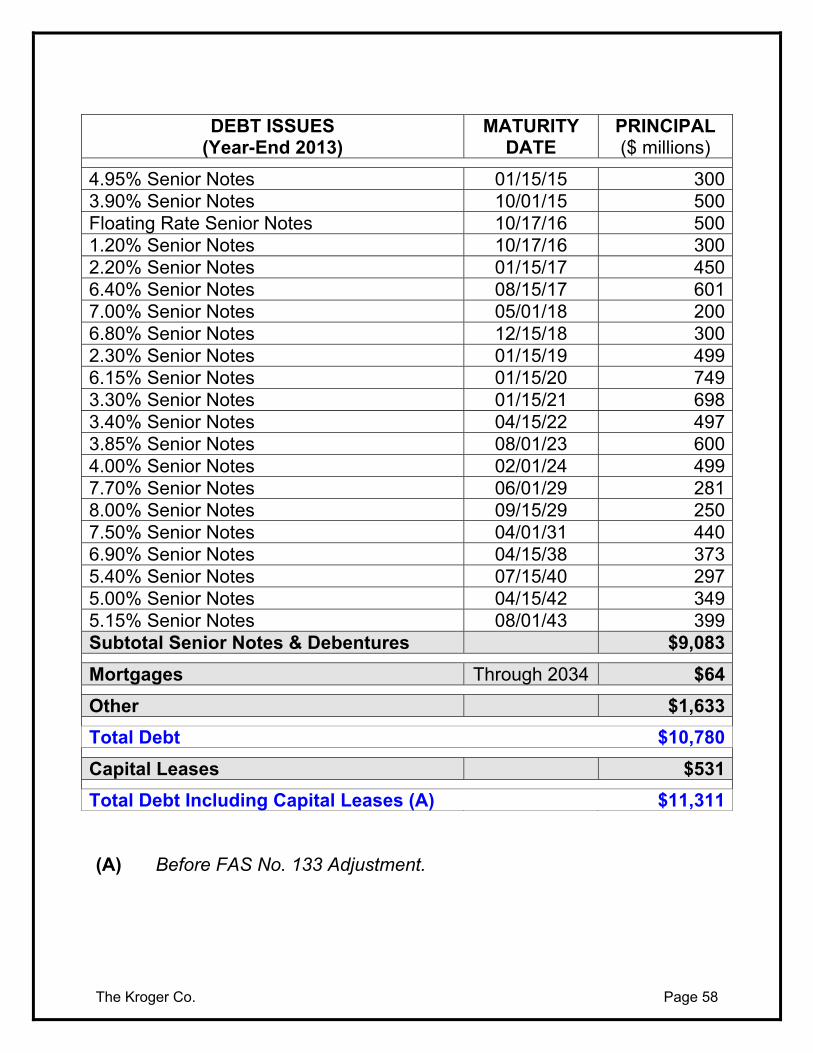
The Kroger Co. Page 58
DEBT ISSUES (Year-End 2013)
MATURITY DATE
PRINCIPAL ($ millions)
4.95% Senior Notes 01/15/15 3003.90% Senior Notes 10/01/15 500Floating Rate Senior Notes 10/17/16 5001.20% Senior Notes 10/17/16 3002.20% Senior Notes 01/15/17 4506.40% Senior Notes 08/15/17 6017.00% Senior Notes 05/01/18 2006.80% Senior Notes 12/15/18 3002.30% Senior Notes 01/15/19 4996.15% Senior Notes 01/15/20 7493.30% Senior Notes 01/15/21 6983.40% Senior Notes 04/15/22 4973.85% Senior Notes 08/01/23 6004.00% Senior Notes 02/01/24 4997.70% Senior Notes 06/01/29 2818.00% Senior Notes 09/15/29 2507.50% Senior Notes 04/01/31 4406.90% Senior Notes 04/15/38 3735.40% Senior Notes 07/15/40 2975.00% Senior Notes 04/15/42 3495.15% Senior Notes 08/01/43 399Subtotal Senior Notes & Debentures $9,083
Mortgages Through 2034 $64
Other $1,633
Total Debt $10,780
Capital Leases $531
Total Debt Including Capital Leases (A) $11,311
(A) Before FAS No. 133 Adjustment.
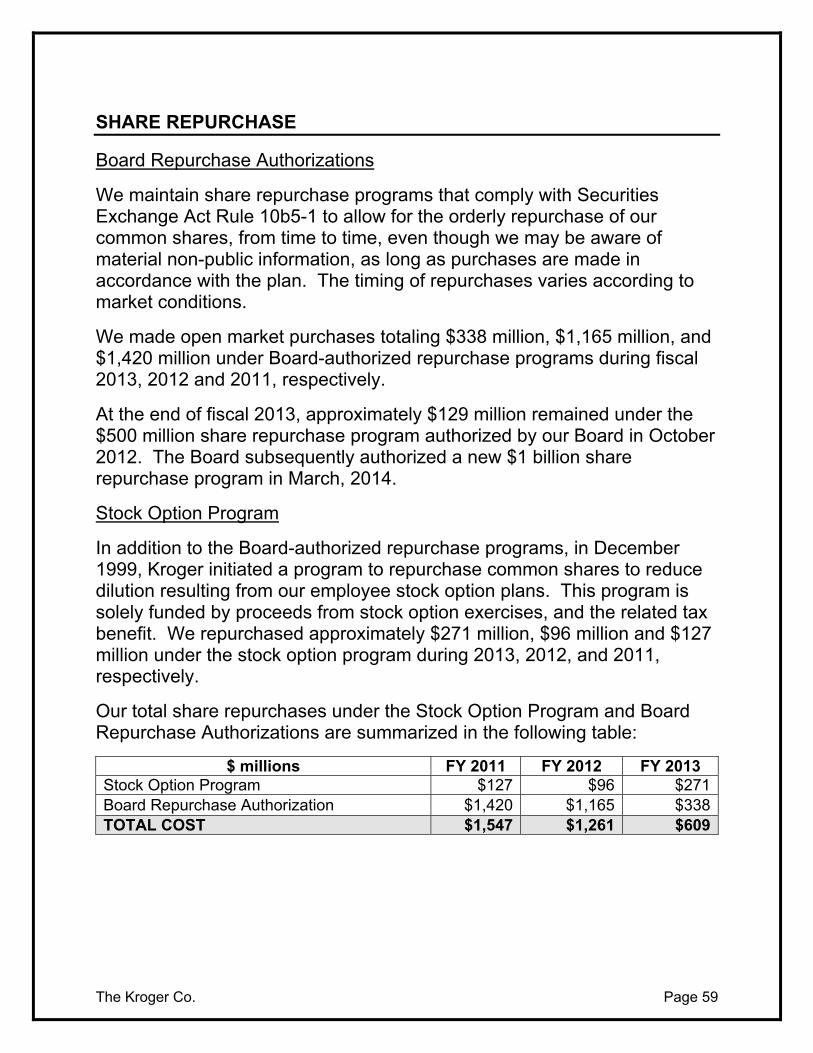
The Kroger Co. Page 59
SHARE REPURCHASE
Board Repurchase Authorizations
We maintain share repurchase programs that comply with Securities Exchange Act Rule 10b5-1 to allow for the orderly repurchase of our common shares, from time to time, even though we may be aware of material non-public information, as long as purchases are made in accordance with the plan. The timing of repurchases varies according to market conditions.
We made open market purchases totaling $338 million, $1,165 million, and $1,420 million under Board-authorized repurchase programs during fiscal 2013, 2012 and 2011, respectively.
At the end of fiscal 2013, approximately $129 million remained under the $500 million share repurchase program authorized by our Board in October 2012. The Board subsequently authorized a new $1 billion share repurchase program in March, 2014.
Stock Option Program
In addition to the Board-authorized repurchase programs, in December 1999, Kroger initiated a program to repurchase common shares to reduce dilution resulting from our employee stock option plans. This program is solely funded by proceeds from stock option exercises, and the related tax benefit. We repurchased approximately $271 million, $96 million and $127 million under the stock option program during 2013, 2012, and 2011, respectively.
Our total share repurchases under the Stock Option Program and Board Repurchase Authorizations are summarized in the following table:
$ millions FY 2011 FY 2012 FY 2013 Stock Option Program $127 $96 $271Board Repurchase Authorization $1,420 $1,165 $338TOTAL COST $1,547 $1,261 $609
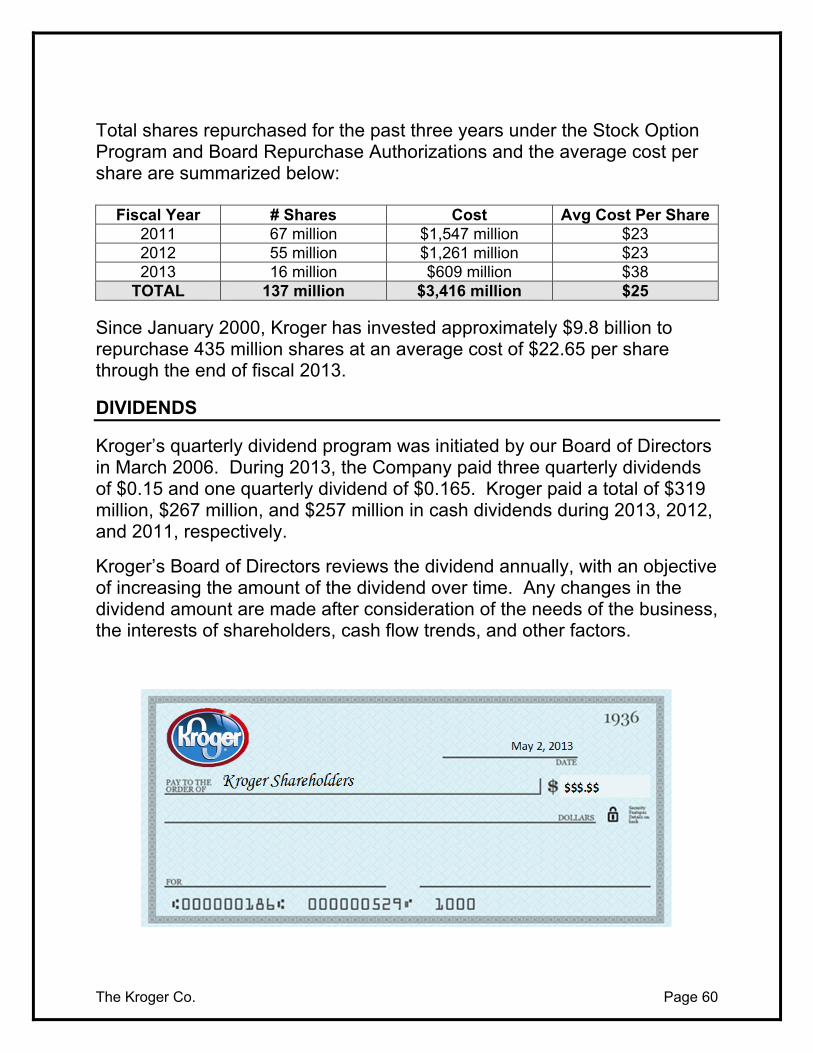
The Kroger Co. Page 60
Total shares repurchased for the past three years under the Stock Option Program and Board Repurchase Authorizations and the average cost per share are summarized below:
Fiscal Year # Shares Cost Avg Cost Per Share2011 67 million $1,547 million $23 2012 55 million $1,261 million $23 2013 16 million $609 million $38
TOTAL 137 million $3,416 million $25
Since January 2000, Kroger has invested approximately $9.8 billion to repurchase 435 million shares at an average cost of $22.65 per share through the end of fiscal 2013.
DIVIDENDS
Kroger’s quarterly dividend program was initiated by our Board of Directors in March 2006. During 2013, the Company paid three quarterly dividends of $0.15 and one quarterly dividend of $0.165. Kroger paid a total of $319 million, $267 million, and $257 million in cash dividends during 2013, 2012, and 2011, respectively.
Kroger’s Board of Directors reviews the dividend annually, with an objective of increasing the amount of the dividend over time. Any changes in the dividend amount are made after consideration of the needs of the business, the interests of shareholders, cash flow trends, and other factors.
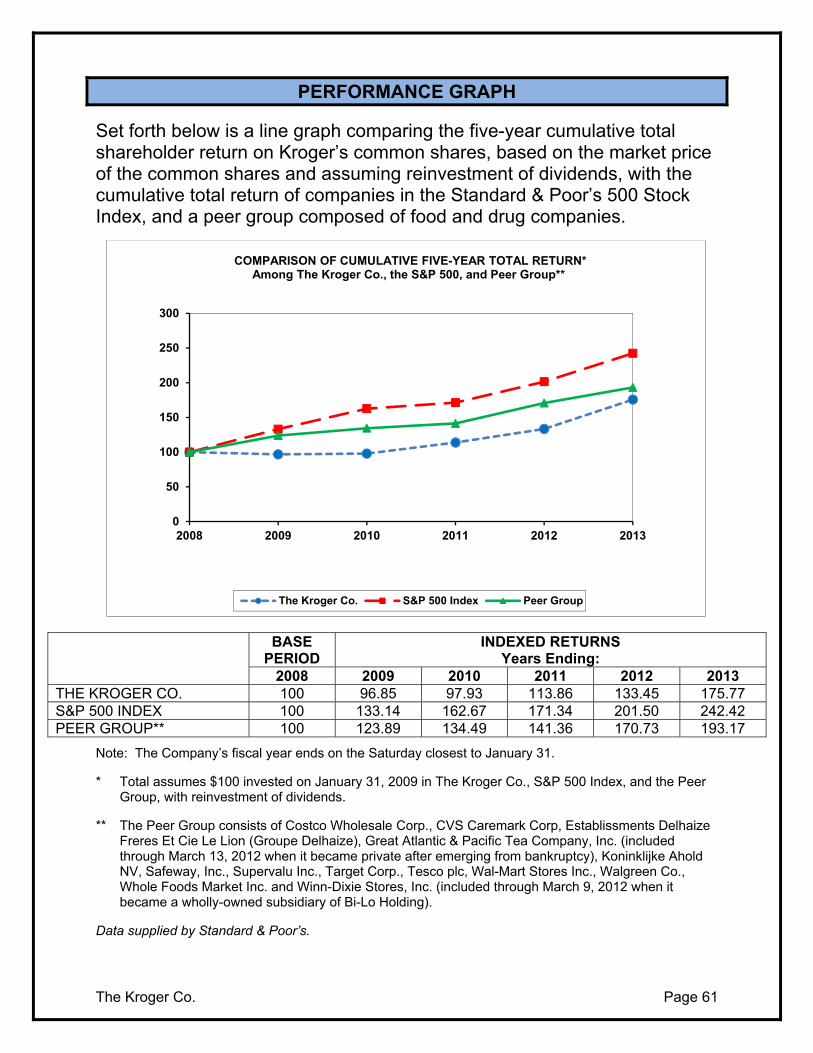
The Kroger Co. Page 61
PERFORMANCE GRAPH
Set forth below is a line graph comparing the five-year cumulative total shareholder return on Kroger’s common shares, based on the market price of the common shares and assuming reinvestment of dividends, with the cumulative total return of companies in the Standard & Poor’s 500 Stock Index, and a peer group composed of food and drug companies.
BASE INDEXED RETURNS PERIOD Years Ending: 2008 2009 2010 2011 2012 2013 THE KROGER CO. 100 96.85 97.93 113.86 133.45 175.77 S&P 500 INDEX 100 133.14 162.67 171.34 201.50 242.42 PEER GROUP** 100 123.89 134.49 141.36 170.73 193.17
Note: The Company’s fiscal year ends on the Saturday closest to January 31.
* Total assumes $100 invested on January 31, 2009 in The Kroger Co., S&P 500 Index, and the Peer Group, with reinvestment of dividends.
** The Peer Group consists of Costco Wholesale Corp., CVS Caremark Corp, Establissments Delhaize Freres Et Cie Le Lion (Groupe Delhaize), Great Atlantic & Pacific Tea Company, Inc. (included through March 13, 2012 when it became private after emerging from bankruptcy), Koninklijke Ahold NV, Safeway, Inc., Supervalu Inc., Target Corp., Tesco plc, Wal-Mart Stores Inc., Walgreen Co., Whole Foods Market Inc. and Winn-Dixie Stores, Inc. (included through March 9, 2012 when it became a wholly-owned subsidiary of Bi-Lo Holding).
Data supplied by Standard & Poor’s.
0
50
100
150
200
250
300
2008 2009 2010 2011 2012 2013
COMPARISON OF CUMULATIVE FIVE-YEAR TOTAL RETURN*Among The Kroger Co., the S&P 500, and Peer Group**
The Kroger Co. S&P 500 Index Peer Group
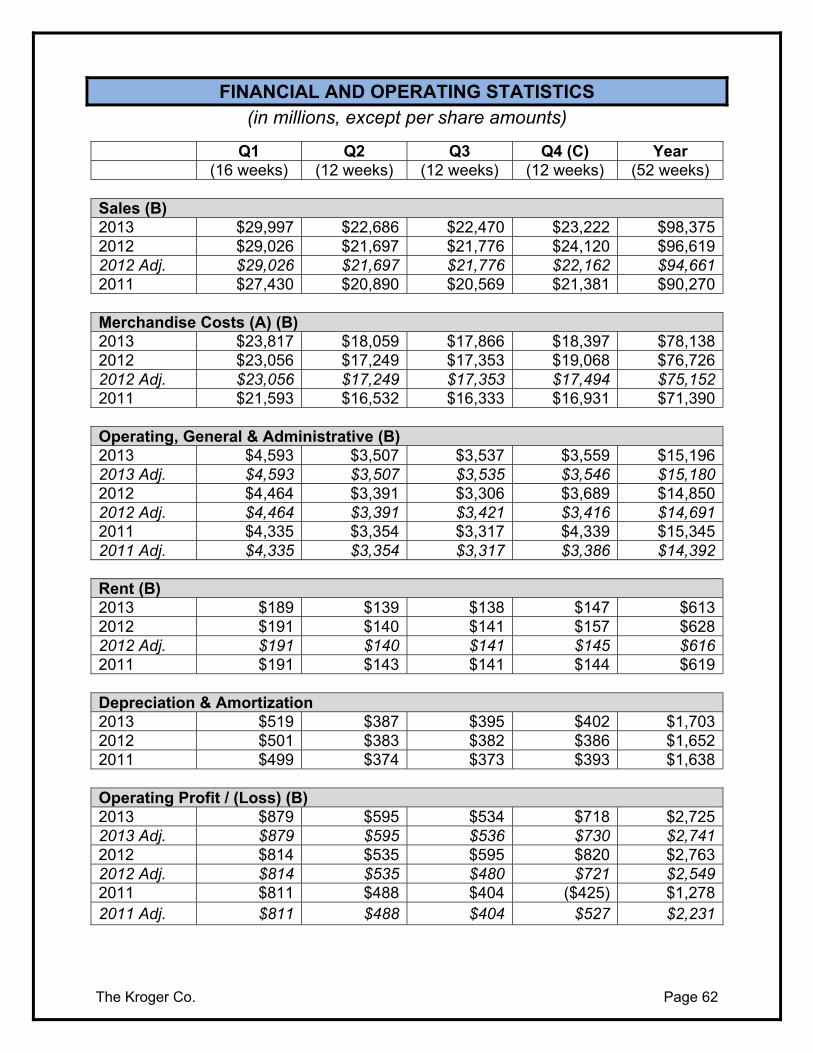
The Kroger Co. Page 62
FINANCIAL AND OPERATING STATISTICS (in millions, except per share amounts)
Q1 Q2 Q3 Q4 (C) Year (16 weeks) (12 weeks) (12 weeks) (12 weeks) (52 weeks) Sales (B) 2013 $29,997 $22,686 $22,470 $23,222 $98,3752012 $29,026 $21,697 $21,776 $24,120 $96,6192012 Adj. $29,026 $21,697 $21,776 $22,162 $94,6612011 $27,430 $20,890 $20,569 $21,381 $90,270 Merchandise Costs (A) (B) 2013 $23,817 $18,059 $17,866 $18,397 $78,1382012 $23,056 $17,249 $17,353 $19,068 $76,7262012 Adj. $23,056 $17,249 $17,353 $17,494 $75,1522011 $21,593 $16,532 $16,333 $16,931 $71,390 Operating, General & Administrative (B) 2013 $4,593 $3,507 $3,537 $3,559 $15,1962013 Adj. $4,593 $3,507 $3,535 $3,546 $15,1802012 $4,464 $3,391 $3,306 $3,689 $14,8502012 Adj. $4,464 $3,391 $3,421 $3,416 $14,6912011 $4,335 $3,354 $3,317 $4,339 $15,3452011 Adj. $4,335 $3,354 $3,317 $3,386 $14,392 Rent (B) 2013 $189 $139 $138 $147 $6132012 $191 $140 $141 $157 $6282012 Adj. $191 $140 $141 $145 $6162011 $191 $143 $141 $144 $619 Depreciation & Amortization 2013 $519 $387 $395 $402 $1,7032012 $501 $383 $382 $386 $1,6522011 $499 $374 $373 $393 $1,638 Operating Profit / (Loss) (B) 2013 $879 $595 $534 $718 $2,7252013 Adj. $879 $595 $536 $730 $2,7412012 $814 $535 $595 $820 $2,7632012 Adj. $814 $535 $480 $721 $2,5492011 $811 $488 $404 ($425) $1,2782011 Adj. $811 $488 $404 $527 $2,231
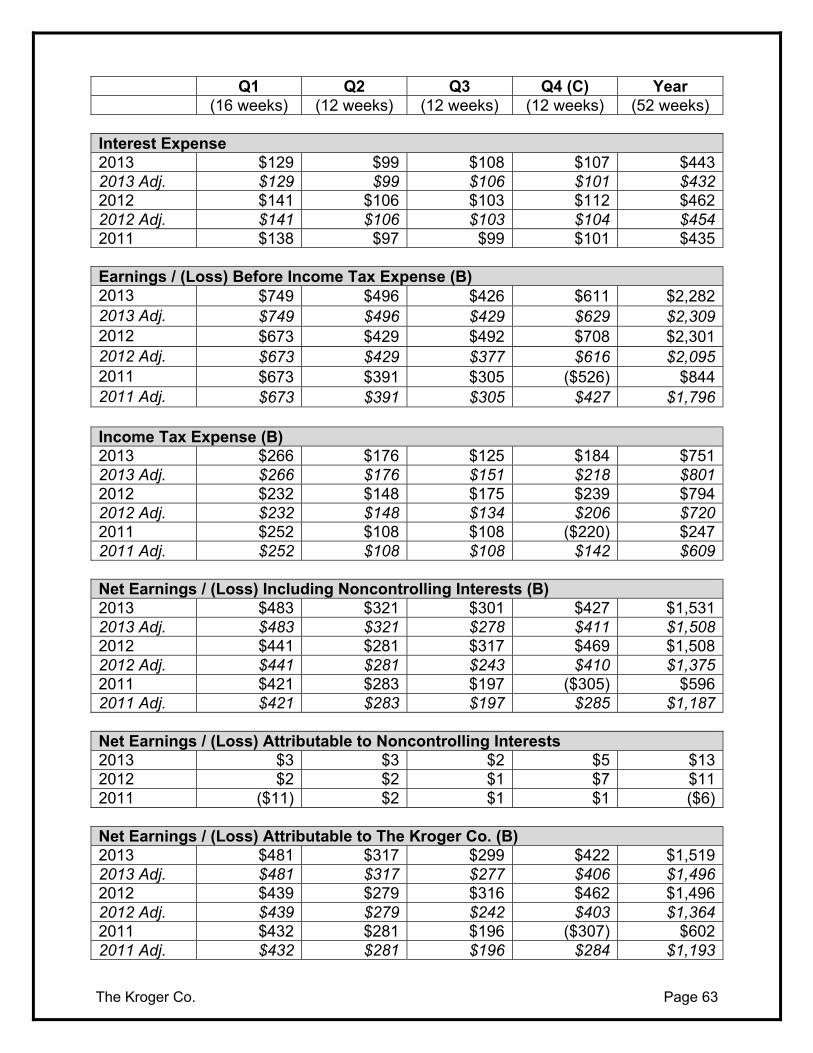
The Kroger Co. Page 63
Q1 Q2 Q3 Q4 (C) Year (16 weeks) (12 weeks) (12 weeks) (12 weeks) (52 weeks) Interest Expense 2013 $129 $99 $108 $107 $4432013 Adj. $129 $99 $106 $101 $4322012 $141 $106 $103 $112 $4622012 Adj. $141 $106 $103 $104 $4542011 $138 $97 $99 $101 $435 Earnings / (Loss) Before Income Tax Expense (B) 2013 $749 $496 $426 $611 $2,2822013 Adj. $749 $496 $429 $629 $2,3092012 $673 $429 $492 $708 $2,3012012 Adj. $673 $429 $377 $616 $2,0952011 $673 $391 $305 ($526) $8442011 Adj. $673 $391 $305 $427 $1,796 Income Tax Expense (B) 2013 $266 $176 $125 $184 $7512013 Adj. $266 $176 $151 $218 $8012012 $232 $148 $175 $239 $7942012 Adj. $232 $148 $134 $206 $7202011 $252 $108 $108 ($220) $2472011 Adj. $252 $108 $108 $142 $609 Net Earnings / (Loss) Including Noncontrolling Interests (B) 2013 $483 $321 $301 $427 $1,5312013 Adj. $483 $321 $278 $411 $1,5082012 $441 $281 $317 $469 $1,5082012 Adj. $441 $281 $243 $410 $1,3752011 $421 $283 $197 ($305) $5962011 Adj. $421 $283 $197 $285 $1,187 Net Earnings / (Loss) Attributable to Noncontrolling Interests 2013 $3 $3 $2 $5 $132012 $2 $2 $1 $7 $112011 ($11) $2 $1 $1 ($6) Net Earnings / (Loss) Attributable to The Kroger Co. (B) 2013 $481 $317 $299 $422 $1,5192013 Adj. $481 $317 $277 $406 $1,4962012 $439 $279 $316 $462 $1,4962012 Adj. $439 $279 $242 $403 $1,3642011 $432 $281 $196 ($307) $6022011 Adj. $432 $281 $196 $284 $1,193
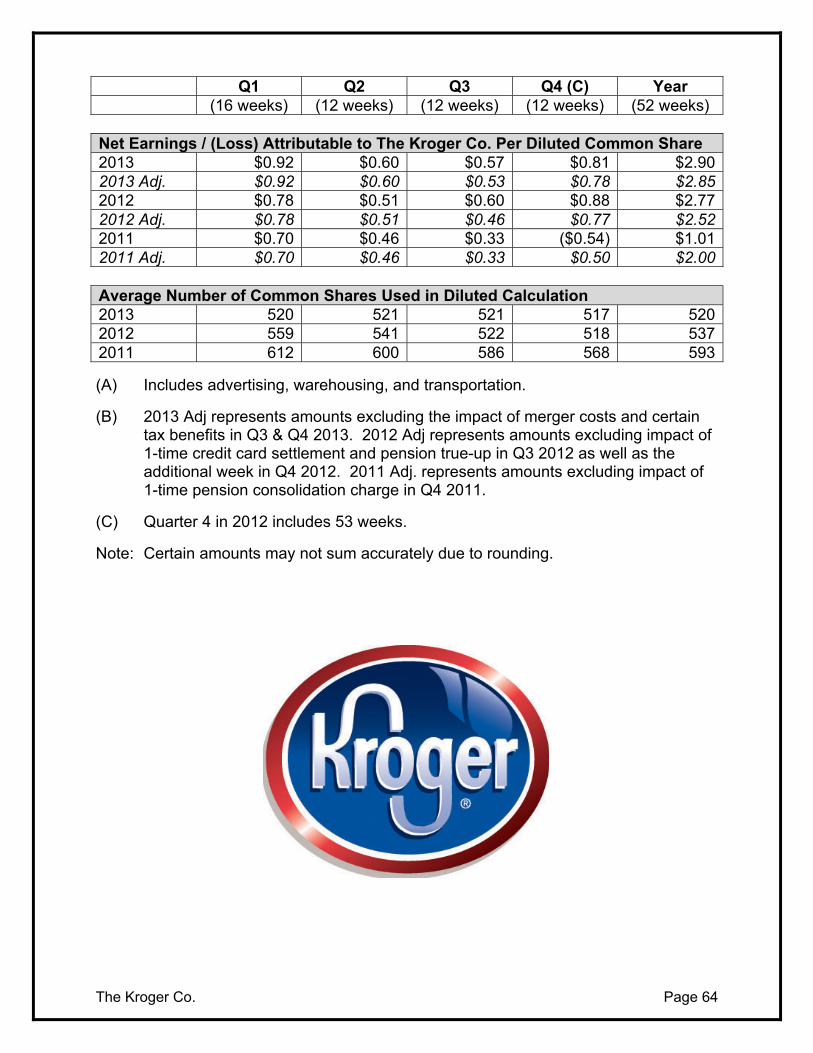
The Kroger Co. Page 64
Q1 Q2 Q3 Q4 (C) Year (16 weeks) (12 weeks) (12 weeks) (12 weeks) (52 weeks) Net Earnings / (Loss) Attributable to The Kroger Co. Per Diluted Common Share 2013 $0.92 $0.60 $0.57 $0.81 $2.902013 Adj. $0.92 $0.60 $0.53 $0.78 $2.852012 $0.78 $0.51 $0.60 $0.88 $2.772012 Adj. $0.78 $0.51 $0.46 $0.77 $2.522011 $0.70 $0.46 $0.33 ($0.54) $1.012011 Adj. $0.70 $0.46 $0.33 $0.50 $2.00 Average Number of Common Shares Used in Diluted Calculation 2013 520 521 521 517 5202012 559 541 522 518 5372011 612 600 586 568 593
(A) Includes advertising, warehousing, and transportation.
(B) 2013 Adj represents amounts excluding the impact of merger costs and certain tax benefits in Q3 & Q4 2013. 2012 Adj represents amounts excluding impact of 1-time credit card settlement and pension true-up in Q3 2012 as well as the additional week in Q4 2012. 2011 Adj. represents amounts excluding impact of 1-time pension consolidation charge in Q4 2011.
(C) Quarter 4 in 2012 includes 53 weeks.
Note: Certain amounts may not sum accurately due to rounding.