co OMCSURV Y - 1988 - the United Nations
185
co OMCSURV Y 1988 CURRENT TRENDS AND POLICIES IN THE WORLD ECONOMY UNITED NATIONS
-
Upload
khangminh22 -
Category
Documents
-
view
2 -
download
0
Transcript of co OMCSURV Y - 1988 - the United Nations

co OMCSURV Y1988CURRENT TRENDSAND POLICIES IN THE WORLD ECONOMY
UNITEDNATIONS

Department of International Economic and Social Affairs
WORLD·ECONOMIC SURVEY1988CURRENT TRENDSAND POLICIES IN THE WORLD ECONOMY
UNITED NATIONSNew York. 1988
EI19BB/50ST/ESAl205

NOTE
Symbols of United Nations documents are composed of capital letters combined withfigures.
E/1988/50ST/ESA/205
UNITED NATIONS PUBLICATION
Sales No. E.88.II.C.1
03200ISBN 92-1-109114-4

PREFACE
The World Economic Survey 1988 reviews main international economic developments, analyses their implications andpresents short-term forecasts for the different regions of the world.
A noteworthy feature of 1987 was that the dramatic financial shocks and instability in primary commodity markets,including oil, seemed to have had only minor repercussions on the growth of output. Economic expansion, thoughmodest, has been maintained in the industrial world so far, despite the abrupt fall in stock markets (discussed in chapterIV of the Survey, as requested by the General Assembly in its resolution 42/195) . Nor did developments during the yearhave any effect on the diversity in the performance of developing countries: chapter VIII analyses the growth differentials that have persisted since they emerged in the early 1980s.
The Economic and Social Council, in its decision 1987/187, requested the Secretary-General "to include in the WorldEconomic Survey 1988 a comprehensive analysis of the global effects of the indebtedness and persistent fiscal andexternal imbalances of developed countries on the international economic environment and in particular on the development process in developing countries". Chapter VII responds to that request, although other chapters also analyse howthese imbalances relate to present macro-economic policies, to trends in international trade and to the changing pattern ofinternational financial flows in the late 1980s.
Chapters II to IV discuss various elements of the analysis of the external debt of developing countries, including thelink between the debt problem and the reverse transfer of financial resources affecting a large number of developingcountries. Chapter V examines developments in oil markets and the changing structure of the oil industry. Chapter VIfocuses on events likely to have far-reaching consequences both domestically and internationally, that is, the currenteconomic reforms of China and the Union of Soviet Socialist Republics. As requested by the General Assembly in itsresolution 42/178, annex I summarizes relevant economic indicators of the economic attainment of women throughoutthe world.
As in the past, the World Economic Survey 1988 has benefited from analyses and studies of several institutions,including the regional commissions, the United Nations Conference on Trade and Development, the International Monetary Fund, the World Bank and the General Agreement on Tariffs and Trade. Our hope is that the Survey, in turn, will beof use to academic institutions, the public at large and, in particular, the Economic and Social Council in its efforts toimprove the present performance of the world economy so that growth is of benefit to all. Chapter I contains policyconclusions to that end.
Ih -'./ ~. //&\-U'-A_,~L'-~
(/ / ,~
p/ Rafeeuddin AhmedUnder-Secretary-General for
International Economic and Social Affairs
iii

CONTENTS
Page
Preface . . . . . . . . . . . . . . . . . . . . . . . . . . . . . . . . . . . . . . . . . . . . . . . . . . . . . . . . . . . . . . . . . . . . . . . . . . . . . . . . . . 111
Explanatory notes. . . . . . . . . . . . . . . . . . . . . . . . . . . . . . . . . . . . . . . . . . . . . . . . . . . . . . . . . . . . . . . . . . . . . .. . . . viii
Chapter
I. THE WORLD ECONOMY IN THE LATE 1980s . . . . . . . . . . . . . . . . . . . . . . . . .. . . . . . . . . . . . . . . 1
Output and income trends 1International policy issues . . . . . . . . . . . . . . . . . . . . . . . . . . . . . . . . . . . . . . . . . . . . . . . . . . . . . . . . . . . 2An agenda for international adjustment. . . . . . . . . . . . . . . . . . . . . . . . . . . . . . . . . . . . . . . . . . . . . . . . . 3
II. WORLD ECONOMIC DEVELOPMENTS: MAIN FEATURES ANDPROSPECTS . . . . . . . . . . . . . . . . . . . . . . . . . . .. . . . . . . . . . . . . . . . . . . . . . . . . . . . . . . . . . . . . . . . 5
World economic growth in 1987 . . . . . . . . . . . . . . . . . . . . . . . . . . . . . . . . . .. . . . . . . . . . . . . . . . . . . . 5The developed market economies: sustained growth, but slow adjustment. . . . . . . . . . . . . . . . . . . . . 11Developing countries: adjustment and development. . . . . . . . . . . . . . . . . . . . . . . . . . . . . . . . . . . . . . . 18Centrally planned economies: reform amidst a mixed performance ~ . . . . . . . . . . . 21Short-term outlook for the world economy. . . . . . . . . . . . . . . . . . . . . . . . . . . . . . . . . . . . . . . . . . . . . . 24
III. INTERNATIONAL TRADE. . . . . . . . . . . . . . . . . . . . . . . . . . . . . . . . . . . . . . . . . . . . . . . . . . . . . . . . . 29
Overview: an improvement in the growth of world trade in 1987-1988 . . . . . . . . . . . . . . . . . . . . . . . . 29The trading system: the need for action. . . . . . . . . . . . . . . . . . . . . . . . . . . . . . . . . . . . . . . . . . . . . . . . . 30Commodity prices: some short-term improvement and continuing instability. . . . . . . . . . . . . . . . . . . 38Changes in trade flows among countries and balance of trade. . . . . . . . . . . . . . . . . . . . . . . . . . . . . . . . 44
IV. INTERNATIONAL FINANCE, DEBT AND INSTABILITY. . . . . . . . . . . . . . . . . . . . . . . . . . . . . . . 49
Debt and the negative transfer of financial resources of developing countries . . . . . . . . . . . . . . . . . . . 50United States foreign debt, related capital flows and the instability of major currency exchange rates 67Causes and consequences of the stock market crash of October1987 . . . . . . . . . . . . . . . . . . . . . . . . . . 76
V. THE INTERNATIONAL OIL MARKET. . . . . . . . . . . . . . . . . . . . . . . . . . . . . . . . . . . . . . . . . . . . . . . 83
Developments in oil markets in 1987 . . . . . . . . . . . . . . . . . . . . . . . . . . . . . . . . . . . . . . . . . . . . . . . . . . . 83Changes in the structure of the petroleum industry . . . . . . . . . . . . . . . . . . . . . . . . . . . . . . . . . . . . . . . . 88Medium-term outlook and conclusions . . . . . . . . . . . . . . . . . . . . . . . . . . . . . . . . . . . . . . . . . . . . . . . . . 90
VI. ECONOMIC REFORMS IN THE CENTRALLY PLANNED ECONOMIES AND CHINA. . . . . . 93
Key concepts of economic restructuring . . . . . . . . . . . . . . . . . . . . . . . . . . . . . . . . . . . . ... . . . . . . . . . . 93Economic reforms in Eastern Europe to the mid-1980s. . . . . . . . . . . . . . . . . . . . . . . . . . . . . . . . . . . . . 94Economic reforms in China since 1978 . . . . . . . . . . . . . . . . . . . . . . . . . . . . . . . . . . . . . .. . . . . . . . . . . 99Renewal and reform in the Soviet Union. . . . . . . . . . . . . . . . . . . . . . . . . . . . . . . . . . . . . . . . . . . . . .. . 109Conclusions. . . . . . . . . . . . . . . . . . . . . . . . . . . . . . . . . . . . . . . . . . . . . . . . . . . . . . . . . . . . . . . . . . . . . . 118
VII. THE EXTERNAL AND FISCAL IMBALANCES OF DEVELOPED COUNTRIES: CAUSESAND EFFECTS. . . . . . . . . . . . . . . . . . . . . . . . . . . . . . . . . . . . . . . . . . . . . . . . . . . . . . . . . . . . . . . . . . . 121
Origins and course of the external imbalances. . . . . . . . . . . . . . . . . . . . . . . . . . . . . . . . . . . . . . . . . . . . 122Effects of the external imbalances on the international economic environment. . . . . . . . . . . . . . . . . . 128The correction process. . . . . . . . . . . . . . . . . . . . . . . . . . . . . . . . . . . . . . . . . . . . . . . . . . . . . . . . . . . . . . 132Narrowing of the imbalances: the possibilities and their effects. . . . . .. . . . . . . . . . . . . . . . . . . . . . . . 136Some conclusions. . . . . . . . . . . . . . . . . . . . . . . . . . . . . . . . . . . . . . . . . . . . . . . . . . . . . . . . . . . . . . . . . . 138
IV

CONTENTS (continued)
Chapter Page
VIII. GROWTH AND ADJUSTMENT IN SMALL AND MEDIUM-SIZED DEVELOPINGCOUNTRIES DURING THE 1980s . . . . . . . . . . . . . . . . . . . . . . . . . . . . . . . . . . . . . . . . . . . . . . . . . . . 141
Diversity around a declining trend. . . . . . . . . . . . . . . . . . . . . . . . . . . . . . . . . . . . . . . . . . . . . . . . . . . . . 141Growth ofGDP in the sample countries. . . . . . . . . . . . . . . . . . . . . . . . . . . . . . . . . . . . . . . . . . . . . . . . 142The diversity of growth experience during the 1980s . . . . . . . . . . . . . . . . . . . . . . . . . . . . . . . . . . . . . . 142Coping with the shocks of the 1980s: the adjustment efforts. . . . . . . . . . . . . . . . . . . . . . . . . . . . . . . . . 147
ANNEXES
I. Selected indicators of the socio-economic attainment of women. . . . . . . . . . . . . . . . . . . . . . . . . . . . . . 151
II. Were the equity markets overvalued before 19 October? . . . . . . . . . . . . . . . . . 159
III. S.tatistical tables . . . . . . . . . . . . . . . . . . . . . . . . . . . . . . . . . . . . . . . . . . . . . . . . . . . . . . . . . . . . . . . . . . . 163
BOXES
ILL The consequences of more expansionary policies. . . . . . . . . . . . . . . . . . . . . . . . . . . . . . . . . . . . . . . . . 24
III. 1. The diversity behind the commodity price index. . . . . . . . . . . . . . . . . . . . . . . . . . . . . . . . . . . . . . . . . . 39
IV.1. Trade, the net transfer of resources and the official reserves buffer. . • . . . . . . . . . . . . . . . . . . . . . . . . 53
IV.2. Debt management and integration of socialist countries into the international financial system ..... 58
IV.3. How large was officialfinancing of the United States balance of payments in 1987? . . . . . . . . . . . . . 72
IVA. Exchange rate management in the European Monetary System in 1987 74
VII. 1. The relationship between fiscal and external deficits . . . . . . . . . . 126
TABLES
II.1. Growth of population and output by region, 1971-1989 . . . . . . . . . . . . . . . . . . . . . . . . . . . . . . . . . . . . . 5
II.2. Developing countries: rates of growth of gross domestic product by analytical country groupings,1981-1989 . . . . . . . . . . . . . . . . . . . . . . . . . . . . . . . . . . . . . . . . . . . . . . . . . . . . . . . . . . . . . . . . . . . . . . . . 6
II.3. Structure of imports and exports of developing country regions by region of origin and destination,1985 . . . . . . . . . . . . . . . . . . . . . . . . . . . . . . . . . . . . . . . . . . . . . . . . . . . . . . . . . . . . . . . . . . . . . . . . . . . . 7
IIA. Indicators of the international economic environment, 1980-1987 . . . . . . . . . . . . . . . . . . . . . . . . . . . . 8
II.5. Savings and investment rates in selected groups of developing countries. . . . . . . . . . . . . . . . . . . . . . . 12
II.6. Developing countries: frequency distribution of rates of growth of output, 1981-1987 17
II.7. Developing countries: geographical distribution of countries with negative rates of growth of percapita output, 1981-1987. . . . . . . . . . . . . . . . . . . . . . . . . . . . . . . . . . . . . . . . . . . . . . . . . . . . . . . . . . . . . 17
II.8. Developing countries: annual rates of inflation, 1982-1987 . . . . . . . . . . . . . 19
11.9. Centrally planned economies: selected macro-economicindicators, 1981-1989. . . . . . . . . . . . . . . . . . 22
II.lO. Developed market economies: short-term outlook for inflation and unemployment rates, 1987-1989. 26
III. I. World trade, 1980-1987 . . . . . . . . . . . . . . . . . . . . . . . . . . . . . . . . . . . . . . . . . . . . . . . . . . . . . . . . . . . . . 30
III.2. World trade: annual rates of change in volume and prices, 1976-1988 . . . . . . . . . . . . . . . . . . . . . . . . . 31
III. 3. Number of export restraint arrangements in operation . . . . . . . . . . . . . . . . . . . . . . . . . . . . . . . . . . . . . 32
v

Chapter
CONTENTS (continued)
TABLES (continued) Page
IlIA. Extent of quantitative restrictions in international trade in the 1980s . . . . . . . . . . . . . . . . . . . . . . . . . . 33
III. 5. Indices of prices of non-fuel primary commodities exported by developing countries, 1982-1987 . . . 38
II1.6. Developed market economies: merchandise trade balance, 1980-1987. . . . . . . . . . . . . . . . . . . . . . . . . 44
II1.7. Developing countries: merchandise trade balance, 1980-1987 . . . . . . . . . . . . . . . . . . . . . . . . . . . . . . . 45
III. 8. European centrally planned economies and China: merchandise trade balance, 1980-1987. . . . . . . . . 46
IV.l. World balance of payments on current account, by country group, 1980-1988. . .. . . . . .. . . .. . . . . . 49
IV.2. Net transfer of financial resources of the capital-importing developing countries, 1980-1987. . . . . . . 50
IV.3. Resource commitments of multilateral development institutions, 1980-1987. . . . . . . . . . . . . . . . . . . . 55
IVA. Gross foreign debt of the capital-importing developing countries, 1980-1987 . . . . . . . . . . . . . . . . . . . 60
IV.5. Net international investment position of the United States. . . . . . . . . . . . .. . . . . . . . . . . . . . . . . . . . . 68
IV.6. Phases in the depreciation of the dollar, February 1985-January 1988 . . . . . . . . . . . . . . . . . . . . . . . . 75
IV.7. Selected financial transactions between the United States and other countries, 1986-1987. . . . . . . . . . 78
V.l. Value of oil exports of OPEC member countries. . . . . . . . . . . . . . . . . . . . . . . . . . . . . . . . . . . . . . . . . . 84
V.2. Planned and actual production of OPEC oil, 1987. . . . . . . . . . . . . . . . . . . . . . . . . . . . . . . . . . . . . . . . . 85
V.3. Consumption of energy petroleum products . . . . . . . . . . . . . . . . . . . . . . . . . . . . . . . . . . . . . . . . . . . . . 85
VA. World consumption of residual fuel oil. . . . . . . . . . . . . . . . . . . . . . . . . . . . . . . . . . . . . . . . . . . . . . . . . 86
Y.5. Changes in operations of major oil companies, 1976 and 1986. . . . . . . . . . . . . . . . . . . . . . . . . . . . . . . 89
V.6. Ratios of crude oil reserves to production, 1987 . . . . . . . . . . . . . . . . . . . . . . . . . . . . . . . . . . . . . . . . . . 89
VLl. Economic reforms in the European planned economies, 1957-1985 95
VILI. Current account imbalances in relation to gross national product and exports for the developedmarket economies and selected groups of developing countries, 1980-1987. . . . . . . . . . . . . . . . . . . . . 122
VII.2. Growth of real domestic demand, real gross national product, exports and imports in the FederalRepublic of Germany, Japan and the United States, 1980-1986. . . . . . . . . . . . . . . . . . . . . . . . . . . . . . . 123
VIL3. Long-term real interest rates in the Federal Republic of Germany, Japan and the United States,1973-1987 . . . . . . . . . . . . . . . . . . . . . . . . . . . . . . . . . . . . . . . . . . . . . . . . . . . . . . . . . . . . . . . . . . . . . . . . 132
VIILl. Dispersion ofGDP growth rates. . . . . . . . . . . . . . . . . . . . . . . . . . . . . . . . . . . . . . . . . . . . . . . . . . . . . . 141
VIII.2. Growth ofGDP . . . . . . . . . . . . . . . . . . . . . . . . . . . . . . . . . . . . . . . . . . . . . . . . . . . . . . . . . . . . . . . . . . . 142
VIII. 3. Factors underlying growth differentials: results of regression analysis . . . . . . . . . . . . . . . . . . . . . . . . 144
FIGURES
ILL Nominal effective exchange rates of the Federal Republic of Germany, Japan and the United States,1980-1987 . . . . . . . . . . . . . . . . . . . . . . . . . . . . . . . . . . . . . . . . . . . . . . . . . . . . . . . . . . . . . . . . . . . . . . . . 9
11.2. Yields on long-term government bonds in the Federal Republic of Germany, Japan and the UnitedStates, 1980-1987 . . . . . . . . . . . . . . . . . . . . . . . . . . . . . . . . . . . . . . . . . . . . . . . . . . . . . . . . . . . . . . . . . . 11
II.3. Unemployment in Japan, the United States and Western Europe, 1980-1987. . . . . . . . . . . . . . . . . . . . 13
11.4. Total employment in Japan, the United States and Western Europe, 1980-1987. . . . . . . . . . . . . . . . . . 14
II.5. Volume of exports and imports of the Federal Republic of Germany, Japan and the United States,1986 and 1987 15
VI

Chapter
CONTENTS (continued)
FIGURES (continued) Page
II.6. Ratio of exports to imports for the Federal Republic of Germany, Japan and the United States,1985-1987 . . . . . . . . . . . . . . . . . . . . . . . . . . . . . . . . . . . . . . . . . . . . . . . . . . . . . . . . . . . . . . . . . . . . . . . . 1'6
11.7. Trends in per capita output in selected groups ofdeveloping countries, 1980-1987 . . . . . . . . . . . . . . . 18
m.l. Prices of groups of commodities, 1980-1987. . . . . . . . . . . . . . . . . . . . . . . . . . . . . . . . . . . . . . . . . . . . . 41
m.2. Prices of commodities and export unit values of manufactures, 1970-1987 . . . . . . . . . . . . . . . . . . . . . 41
IV.l. Net financial resource transfers from foreign creditors of middle-income and African country groups 51
IV.2. Net resource transfers and investment in middle-income and African country groups. . . . . . . . . . . . . 54
IV.3. Gross capital market borrowing by developing countries. . . . . . . . . . . . . . . . . . . . . . . . . . . . . . . . . . . 56
IV.4. Net flow of IMF credit to the main regions of the developing world. . . . . . . . . . . . . . . . . . . . . . . . . . . 57
IV.5. Debt-servicing ratios of middle-income and African country groups. . . . . . . . . . . . . . . . . . . . . . . . . . 61
IV.6. Capital outflows of the Federal Republic of Germany and Japan. . . . . . . . . . . . . . . . . . . . . . . . . . . . . 70
IV.7. Net foreign financial flows vis-a-vis United States residents. . . . . . . . . . . . . . . . . . . . . . . . . . . . . . . . . 72
IV.8. Industrial share prices. . . . . . . . . . . . . . . . . . . . . . . . . . . . . . . . . . . . . . . . . . . . . . . . . . . . . . . . . . . . . . 77
V.l. Crude oil prices, 1985-1988 . . . . . . . . . . . . . . . . . . . . . . . . . . . . . . . . . . . . . . . . . . . . . . . . . . . . . . . . . . 84
VII. I. Domestic demand in EEC, Japan and the United States . . . . . . . . . . . . . . . . . . . . . . . . . . . . . . . . . . . . 124
VII.2. Difference between interest rates in the Federal Republic of Germany, Japan and the United States,1980-1987 . . . . . . . . . . . . . . . . . . . . . . . . . . . . . . . . . . . . . . . . . . . . . . . . . . . . . . . . . . . . . . . . . . . . . . . . 125
VII.3. International interest rates, 1980-1987. . . . . . . . . . . . . . . . . . . . . . . . . . . . . . . . . . . . . . . . . . . . . . . . . . 131
vii
EXPLANATORY NOTES
The following symbols have been used in the tables throughout the report:
Two dots (..) indicate that data are not available or are not separately reported.
A dash (-) indicates that the amount is nil or negligible.
A hyphen (-) indicates that the item is not applicable.
A minus sign (-) indicates a deficit or decrease, except as indicated.
A full stop (.) is used to indicate decimals.
A slash (I) indicates a crop year or financial year, for example, 1986/87.
Use of a hyphen (-) between dates representing years, for example, 1985-1987, signifies the full period involved,including the beginning and end years.
Reference to"tons" indicates metric tons and to "dollars" ($) United States dollars, unless otherwise stated.
Annual rates ofgrowth or change, unless otherwise stated, refer to annual compound rates. In most cases, the growthrate forecasts for 1988 and 1989 are rounded to the nearest half of a percentage point.
Details and percentages in tables do not necessarily add to totals, because of rounding.
The following abbreviations have been used:
ADBADFAfDBCAPCFACFFCMEADAC
EECEIBEMSESAFf.o.b.FTOGATTGDPGNPIDAIDBlEAIFADIMFJSFLIBORMERMMFAMITINMPODAOECDOECFOPECProject LINK
SAEC
Asian Development BankAsian Development FundAfrican Development BankCommon Agricultural Policy of the European Economic CommunityCommunaute financiere africaineCompensatory Financing Facility of the International Monetary FundCouncil for Mutual Economic AssistanceDevelopment Assistance Committee of the Organization for Economic Co-operation and DevelopmentEuropean Economic CommunityExport-Import BankEuropean Monetary SystemEnhanced Structural Adjustment Facility of the International Monetary Fundfree on boardforeign trade organizationGeneral Agreement on Tariffs and TradeGross domestic productGross national productInternational Development AssociationInter-American Development BankInternational Energy AgencyInternational Fund for Agricultural DevelopmentInternational Monetary FundJapan Special FundLondon inter-Bank offered rateMultilateral Exchange Rate Model of the International Monetary FundMultifibre ArrangementMinistry of International Trade and Industry of the Government of Japannet material productOfficial development assistanceOrganization for Economic Co-operation and DevelopmentOverseas Economic Co-operation FundOrganization of the Petroleum Exporting CountriesInternational Research Group of Econometric Model Builders, with headquarters at the University of Pennsylvania at PhiladelphiaState Administration of Exchange Control of the Government of China
viii

SDRSFAUNCTADUNICEF
special drawing rightsSpecial Facility for Africa of the World BankUnited Nations Conference on Trade and DevelopmentUnited Nations Children's Fund
Capital-surplus countries:
The designations employed and the presentation of the material in this publication do not imply the expression of anyopinion whatsover on the part of the United Nations Secretariat concerning the legal status of any country, territory, cityor area or of its authorities, or concerning the delimitation of its frontiers or boundaries.
The term "country" as used in the text of this report also refers, as appropriate, to territories or areas.
For analytical purposes, the following country classification has been used:
Centrally planned economies: Eastern Europe, Union of Soviet Socialist Republics
China (In contrast with previous World Economic Surveys, China is not included in the groupof centrally planned economies)
Developedmarket economies: North America, southern and western Europe (excluding Cyprus, Malta and Yugoslavia), Australia, Japan, New Zealand, South Africa
Developing countries: Latin America and the Caribbean, Africa (other than South Africa), Asia (excludingChina, in certain cases, and Japan), Cyprus, Malta, Yugoslavia
For particular analyses, developing countries have been subdivided into the following groups:
Brunei Darussalam, Iran (Islamic Republic of), Iraq, Kuwait, Libyan Arab Jamahiriya, Qatar, Saudi Arabia, United Arab Emirates
Deficit countries (or capital-importing countries), subdivided into the following two subgroups:
Other net energy exporters(or deficit energyexporters):
Net energy importers:
Algeria, Angola, Bahrain, Bolivia,Cameroon, Congo, Ecuador, Egypt, Gabon,Indonesia, Malaysia, Mexico, Nigeria, Oman, Peru, Syrian Arab Republic, Trinidadand Tobago, Tunisia, Venezuela
All other developing countries
The designations of country groups in the text and the tables are intended solely for statistical or analytical convenience and do not necessarily express a judgement about the stage reached by a particular country or area in the development process.
ix
Chapter I
THE WORLD ECONOMY IN THE LATE 1980s
Output and income trends
The growth of gross world product in 1987 was slightlyabove 3 per cent - 1.8 per cent in per capita terms - whichis somewhat higher than in 1986. Short-term trends indicatethat the world economy will continue to expand during thenext two years, but at a lower rate. There was wide diversityin the economic performance of regions and individualcountries in 1987.
In much of Asia and North America, economic expansionaccelerated. There was no change in the modest rate of increase in the combined gross domestic product of WesternEurope, which, nevertheless, remained about two percentage points above population growth. Growth slowed in LatinAmerica, the. Mediterranean region, Eastern Europe andWest Asia. In Africa, the rate of increase in gross domesticproduct was 1 per cent, less than half the rate of increase inpopulation.
The instability of financial markets culminated in October1987 in an abrupt drop of the stock markets in all majorfinancial centres. It was the first global stock exchange crisisand evidence of the internationalization of financial relations. As central banks reacted swiftly to prevent a liquiditysqueeze, the reverberations of the drastic reduction inwealth remained largely confined to the financial sphere.Stock prices have partly recovered in the past six months;yet the events of October 1987 continue to instil fears ofsimilar turbulence to come, despite government action ondomestic financial practice and more effective policy coordination among major actors. Key parameters of the international economy - exchange rates and interest rates - remain unstable. Their instability helped trigger the marketcrash and might again lead to major financial disruption.Other international parameters - prices of primary commodities, including oil- also remain volatile.
Large losses and gains from price fluctuations andchanges in interest rates have been superimposed on movements in output, leading to erratic variations in per capitaincomes. None the less, some regional trends can be discerned.
Per capita incomes in virtually all industrial countrieshave continued to grow steadily in the current decade. Moderate increases in gross domestic product, some improvement in the terms of trade - particularly for oil importers and slow population growth have raised per capita incomesat an annual rate ofbetween 1 to 3 per cent in most countriessince 1982. This trend is likely to continue in the mediumterm.
The majority of countries in South and East Asia, including the most populous, have achieved consistent increases inper capita income in the current decade. Underlying economic trends and current policy stances indicate a consolidation of these gains in the short to medium term. In WestAsia, armed conflicts and a large drop in oil prices at mid-
decade have adversely affected incomes and output. Whilethe considerable drop in per capita incomes came to a halt in1987 - and per capita incomes in this region are still abovethose of most developing countries - prospects for a decisive improvement in the short term remain uncertain.
In most countries ofAfrica, per capita incomes have fallenwithout respite during the 1980s. A legacy of policy failuresin agriculture, ineffective industrialization strategies and extremely low primary commodity prices largely explain thedisappointing performance in sub-Saharan Africa. Since1986, output growth has also slowed markedly in the economies of North Africa. At least in the short term, prospectsfor the whole continent remain highly uncertain: the roomfor manoeuvre on the domestic front appears limited, structural policies will take time to bear fruit, and export earningsand prices of primary commodities will probably remainweak.
The debt overhang and failed attempts to correct domesticdisequilibria in the large economies in the recent past cast along shadow over the economic prospects of Latin Americaand the Caribbean. For the majority of these countries, percapita incomes have fallen since 1981; for almost half ofthem, they fell again in 1987. There is little prospect of anearly reversal. Inflation accelerated considerably in 1987,reaching three digits in the large countries by early 1988.The need to confront domestic disequilibria and a heavy debtburden (which may increase if interest rates rise) make itunlikely that investment ratios (which have fallen markedlysince the onset of the debt crisis) will soon recover. Unprecedented adjustment has taken place in the trade balance ofthe region, which has shifted from deficit into surplus to thetune of $30 billion dollars. Largely as a result of this shift,which has absorbed savings and cut into investments, sustainable growth is not expected in the foreseeable future, ifpresent policies continue.
The combined population of Africa, Latin America andthe Caribbean and other developing countries with laggingeconomies exceeds 1 billion at the end of the 1980s. Therevitalization of growth remains a major challenge for policy makers in these economies. Yet a more supportive international economic environment is also critical. Concertedaction is required both for a smooth unwinding of the imbalances among key actors in the world economy and to pullthese developing countries out of the vicious circle of stagnation and low investment. If this fails, there is the risk thatsocial tensions and financial difficulties will intensify anddisruptive courses of action will be taken. For many countries, it will become harder to reconcile legitimate aspirations of different social groups with dwindling or stagnantper capita incomes. The period ahead will be one in whichmultilateral institutions and traditional economic relationswill be put to a major test.

International policy issues
Although the principal policy concerns relating to thefunctioning of the international economy are much the sameas they were a year ago and the major issues are still unresolved, events in 1987 and early 1988 contributed to certainchanges in the climate of international co-operation.
The immediate problems have not completely overshadowed long-term concerns, some of which received greaterattention in 1987 than ever before. Environmental considerations and the need for sustainable development were morewidely recognized. The status and participation of womencontinued to be given greater importance in the internationalagenda. The re-examination of economic structures with aview to raising productivity proceeded in all parts of theworld, with deregulation of markets, notably financial ones,and extensive privatization of enterprise in market economies and far-reaching reforms in centrally planned economies. There was growing interest in the promotion of entrepreneurship and the improvement ofpublic and private management.
In the short- and medium-term policy areas, which are theprincipal subject of this Survey, government positions havein some cases moved closer, and old and new proposals fortackling the. serious imbalances in the world economy havereceived increasing attention from the general public. Important negotiations in international financial institutionswere concluded successfully in 1987 and others are underway, notably in trade. In such areas as debt and adjustment,however, many Governments seem to be running out of options, having tried one approach after another, and a widespread sense of frustration and deadlock prevails.
The extreme fluctuations in the exchange rates among themajor currencies of the world are but one manifestation ofthe instability of the international economic environment inrecent years. In 1987, however, the steep decline in the valueof the dollar continued with less disruption than many hadfeared. In spite of - or perhaps due to - the turbulence ininternational financial markets that marked the year, therewas, early in 1988, greater determination and readiness onthe part of the major industrial countries to co-ordinate theirintervention in exchange markets. Whether or not furthershifts occur in the near future in the relationship between thedollar and other principal currencies, they are likely to besignificantly smaller than in the recent past. This representsan important step towards greater stability in internationaleconomic relations, although it will be put to a test whenmarket pressures eventually begin to push the value of thedollar up again.
There was not much progress in 1987 in reducing the imbalances between the major industrial countries, but theproblem was more widely recognized, and negotiationswere oriented towards mitigating it. On the whole, however,the year brought into sharp relief the difficulties of co-ordinating macro-economic policies among even a small numberof countries with divergent interests, different interpretations of how macro-economic policies work, and strong domestic political forces that constrain Governments in mone-
2
tary and fiscal policy making, even were they to agree ondesirable directions. Major Governments have becomemore aware of their interdependence and of the internationalimplications of their own policies as well as those of theirpartners . None the less, if it is to serve as the foundation ofthe international monetary system, macro-economic policyco-ordination will have to evolve in the direction of agreedprinciples and rules: progress in that direction, however, hasbeen very slow. The search for an international monetarysystem that meets the needs oftoday's world, in which financial markets have become global, must continue. What isneeded is an anchor. In the view of an increasing number ofexperts, the system should be based on a standard, for instance a commodity standard. Such views, however farfetched they may seem today, deserve careful examination.
The debt crisis in developing countries did not move towards a solution in 1987 or early 1988. In some respects itdeepened, as an increasing number of debtors took unilateral action and went into arrears not only to commercialcreditors butto the International Monetary Fund (IMF) andthe World Bank as well. The seriousness of this trend mustnot be underestimated. On the other hand, a number of important initiatives were taken. In the spring of 1987, theUnited States commercial banks, following the example ofthe largest one, decided to increase their provisions againstdebts of countries with debt-servicing problems and to takesignificant profit losses; these actions raised the market valuation of their stock and reduced the risk to the banking system. Schemes were floated to allow debtor countries to benefit from the discounts commercial banks were willing toaccept in selling off their claims. With the help of bilateraldonors, Bolivia was able to buy back a significant part of itsdebt at 11 per cent of the face value. A plan to convert part ofMexico's debt into long-term bonds at adiscount was lesssuccessful than hoped for, but by no means a failure.
New proposals to engage the World Bank and/or IMF inthe creation of some kind of debt reconstruction facility havebeen made; one such proposal was made in the spring of1988 by the Chairman and Chief Executive Officer of theAmerican Express Company. These proposals for debt reduction command increasing attention. The weightiest objection to them is that countries which admit they cannotservice past debts might find it more difficult to persuadecreditors that they will be able to service new ones. A practical problem is that of enlisting a large number of creditors,some of which would be more likely to be paid in full ifothers waived part of their claims. These problems are notinsuperable, and approaches of this kind seem necessary toovercome the prevailing gridlock. Anyone creditor is naturally reluctant to give up more than another does. Debtorswill press for the relief given to the most favoured ones.Both creditors and debtors are torn between case-by-caseapproaches and general rules of fairness.
The United Nations system has provided political andtechnical support to the process of case-by-case experimentation in the search for solutions to the debt problem thatpromote future growth rather than compromise it. This is

helping to shape broad notions of the appropriate approachto different situations, which may include debt reduction insome cases and new financing in others.
Important guidelines for the approach to debt and adjustment have already been agreed upon by the internationalcommunity in numerous resolutions and communiques, allof which emphasize the mutual responsibility of all partners.The proposals for an international facility for the restructuring of international debt deserve careful study, possibly inthe joint IMF/World Development Committee, which seemseminently suited to such a task.
In the area of international trade, one concern which spurred co-operation in exchange rate policy was the rising protectionist pressures induced by the high dollar. So far, thesharp correction of the dollar and its impact on United Statestrade has not led to any significant abatement of politicalpressure for measures to restrain trade. None the less, theproposed free-trade arrangements between the United Statesand Canada are'important because they indicate that the benefits of free trade are recognized. The great ferment produced by the intention of the European Economic Community to achieve an integrated internal market by 1992 alsotestifies to the power of the concepts of liberalization andintegration. For non-members of the Community, however,regional liberalization and integration pose the threat ofgreater exclusion.
From a global point of view, special importance attachesto the Uruguay Round of multilateral trade negotiations, theobjective of which is to strengthen the open internationaltrading system. The preparatory phase has been completedwith great dispatch. It is now essential that progress be madewith regard to the standstill and rollback commitments. Asto agricultural trade and trade in services, the process will bedifficult and prolonged. It is encouraging that developingcountries are participating vigorously in these important negotiations.
Trade in petroleum is a big part of world trade andchanges in oil prices have a large impact on both exportingand importing countries. In 1987, prices stabilized and tentative co-operation between OPEC and non-OPEC supplierswas initiated. The risk of sudden changes in response to minor disruptions remains high, however, and progress in the
dialogue between producers and consumers has been disappointing. It is as essential as ever to enhance the multilateralcapacity to monitor and analyse world oil markets.
The prices of other primary commodities have for manyyears been extremely low in real terms. The many developing countries depending on them for most of their exportearnings have experienced extreme financial strains. Existing mechanisms to compensate for shortfalls in earnings arequite inadequate in the face of the amounts involved, and it isin any case uncertain whether prices will recover significantly in the future. The issues faced by most commodityproducing countries are how to raise productivity in order toremain competitive and, particularly, how to diversify intoprocessing, production offood crops and industrialization inorder to reach sustainable patterns of development, with lessdependence on commodities which in the future seem to offer no secure livelihood.
As a result of multilateral negotiations, the United NationsConference on Trade and Development (UNCTAD), at itsseventh session in 1987, adopted a Final Act, which spelt outgeneral obligations of different groups of countries in meeting the major problems facing the world economy and wentinto considerable detail on issues of money, finance andtrade.
As for the international financial institutions, in December 1987, the World Bank secured agreement on a programme for extensive co-financing of projects for Africa'srecovery and IMF negotiated the Enhanced Structural Adjustment Facility, which tripled its capacity to extend structural adjustment loans to low-income countries on concessional terms. In the spring of 1988, a General Capital Increase for the World Bank was ratified and an extendedCompensatory Financing Facility in IMF, including a contingency credit line, began to emerge. These developmentshave gone a long way towards meeting the concern that themultilateral financial institutions are collecting from developing countries as much money as they are lending to them(or even more), thus in effect contributing to the negativetransfer of resources from those countries. Another concern, however, is that, in spite of their privileged position ascreditors, these institutions are becoming more deeply involved in the international debt crisis as more debtors incurarrears to them.
An agenda for international adjustment
The World Economic Survey 198'1 concluded its discussion of the global economy by enumerating domestic andinternational policies that seemed called for in order to reduce the precariousness and lopsidedness of the international economic situation. While a collapse of the international financial system has been averted, it is a measure ofthe prevailing deadlock that virtually all of the conclusionsreached in 1987 are just as valid today. At this stage, consideration needs to be given to a major global effort of co-
United Nations publication, Sales No. E.87JI.C.l and corrigendum.
3
operation with an agreed time horizon for the unwinding ofthe present imbalances and incongruities in financial flows.
There is as much need for domestic efforts as for international ones, but there will be little scope for improved cooperation unless there is a stronger perception all round thatthe commitments to undertake the necessary domestic efforts are credible and sustainable. Yet such domestic effortsto restore growth and stability are in many cases frustratedby the present international financial situation, notably by

the net outflow of resources from several large debtor countries.
Net financial flows are the mirror image of net flows oftrade in goods and services. They cannot be adjusted withoutcorresponding changes in trade, which in turn have implications for production, employment and living standards in theeconomies involved. To narrow the current account balance, spending has to be reduced and resources shifted intoimport-competing and export sectors. Corresponding shiftshave to take place in trading partners.
If the United States is to reverse its deficit and run a tradesurplus sufficient to meet the interest payments on its debt,that shift would be of the order of 5 per cent of its GNP. Sucha shift could not take place within a short period of time, norwould that be desirable. Even if the deflationary effect onthe world economy were offset by stimulative policies inother countries, there would be a need for extensive adjustments of capacity. Added to the structural transformationalready imposed on the world economy by accelerated technological change, such adjustments would put further pressure on the trading system, on labour markets and on publicpolicy.
In the case of developing countries, where a revival ofinvestment is necessary, the required shift is in the oppositedirection. Reducing the debt service obligation to bring itinto line with the capacity to pay, which is a frequent recommendation, might contain the debt crisis, but that goes onlyhalf way towards restoring the transfer of resources intothese countries rather than out of them. In the end, a renewed flow of capital is needed, not decades of merely paying off past debts.
In both cases much time will be required, and it is widelyassumed that correction of these situations will continue intothe 1990s. This is no more than a manner of saying that it
4
will take substantially more than two years to correct suchsituations and present prospects and policies offer no assurance that the correction will not drag on until the end thecentury.
The political economy of the world in the late 1980s is notlikely to let that happen, however. In the case of the imbalances among the main industrial countries, the financialmarkets may impose their solutions if government policiesdo not change. In the heavily indebted developing countritis,political solutions may overrule market solutions. Governments straining to honour past debts will do so as long as thecost of unilateral refusal to pay seems greater.Their,deepinvolvement in the dynamic world economy is a strong disincentive to measures that would disrupt their trade., aut thelimits are ultimately set by what political conditions will permit.
The present situation is highly precarious. It is universallyrecognized as unsustainable and the signs of strain are multiplying. It will be resolved one way or another, but an orderlyresolution is preferable to one dictated by crises in the market place or unilateral rejection of obligations.
It would reduce the prevailing uncertainty and insecurityin the world economy if a co-operative framework were established, embodying at least three elements:
The objective of redirecting capital and trade flows in amanner consonant with the needs of stability and widespread growth in the world economy;
A timetable for the achievement of this;
Recognition of the need to sustain adequate financialflows throughout the adjustment process in order to avertthe disruptive effect of sudden financial contraction.

Chapter II
WORLD ECONOMIC DEVELOPMENTS: MAIN FEATURES AND PROSPECTS
World economic growth in 1987
Structural adjustments of different kinds continued to preoccupy all countries in the world economy in 1987. Many ofthem, including both industrial and developing countries,suffer from deficits in their trade balances and current accounts which will require extensive reallocation of resources and restructuring of economic activity to take advantage ofnew technological and other opportunities. Manycountries seek to restructure the framework of economic activity in order to make it more flexible and effective, andsome are reconsidering the roles of the State and the privatesector in the economy.
Notwithst~ding these widespread structural adjustments,the world economy performed in 1987 broadly as anticipated because there were few unforeseen shocks to the system. In previous years, sudden changes in key internationalprices have had profound effects on groups of countries andon the world economy as a whole. In 1987, the major disruptions in national and international financial markets in thelast quarter did little to disturb the prevailing trends and patterns in economic growth. Contrary to expectations at the
beginning of the year, and particularly after the decline inequity prices in October, economic activity in the developedmarket economies picked up and even accelerated in the latter part of the year. International trade also regained momentum. Despite these developments, growth in the developing countries as a group slowed in 1987.
Preliminary estimates suggest that the gross world product continued to grow at over 3 per cent in 1987, as in theprevious year (see table 11.1). In the developed market economies, which account for some three fifths of world output,the rate of growth increased. In the centrally planned economies of Europe, the growth of net material product fell backby over 1 percentage point, while it rose as much in China.Among the developing countries, the pattern of growth wasbroadly as anticipated in the World Economic Survey 1987.In South-East Asia, particularly in the rapidly industrializing economies of that region, it was more rapid than estimated. South Asia, on the other hand, was afflicted bydrought in some areas and floods in others and failed to liveup to expectations. Growth in the Mediterranean region was
Table II.l. Growth of population and output by region, 1971-1989
GrossPopulation domestic Rate of change of gross
growth product domestic productrate 1985 (annual percentage)
Population 1985-1990 (billions1985 (annual of 1980 1971- 1981-
(millions) percentage) dollars) 1980 1985 1986 1987" 1988b 1989b
World 4837 1.6 3.9 2.7 3.3 3.3 3.2 2.8
Developed market economies 789 0.6 7640 3.1 2.2 2.7 3.0 2.4 1.8North America 264 0.9 2866 2.9 2.4 2.9 3.0 2.4 1.4Western Europe 353 0.2 3467 2.9 1.5 2.6 2.5 1.9 2.0Developed Asia 121 0.5 1060 4.7 3.6 2.5 4.2 3.9 2.6
Centrally planned economies394 0.8 5.2 3.3 4.3 2.6 4.0of Europe' 4.0
China' 1060 1.2 5.7 9.4 7.4 9.3 8.0 7.5
Developing countries 2595 2.3 2217 5.6 1.5 2.9 2.7 3.0 3.1
Western hemisphere 405 2.2 822 5.5 1.0 3.6 2.5 1.5 1.6West Asia 108 3.2 343 6.5 -0.9 0.1 -1.0 2.9 2.9South and East Asia 1486 1.9 606 5.6 4.8 5.5 5.6 5.5 5.2Africa 523 3.1 305 4.9 -0.9 -2.1 1.0 2.0 2.5Mediterranean 74 1.6 141 5.3 2.9 5.6 2.9 3.8 3.8
Source: Department oflnternationalEconomic and Social Affairs ofthe United Nations Secretariat. Data on popul-ation and population gr\lwth rates are those published by the Department in World Demographic Estimates and Project-ions, 1950-2025 (Unitl~d Nations publication, Sales No. E.86.XIIl.3).
a Preliminary estImates.b Forecast, based on Project LINK and Secretariat estimates.c Net material product.
5

Table 11.2. Developing countries: rates ofgrowth of gross domesticproduct by analytical country groupings, 1981-1989
(Annual percentage change)
1981 1982 1983 1984 1985 1986 1987 1988 1989
All developing countries 1.1 0.2 0.8 2.2 2.0 2.9 2.7 3.2 3.5
Seven largest countries 3.0 1.2 -0.8 3.6 4.9 3.1 2.4 3.6 3.8Bangladesh' 6.8 0.8 3.6 4.2 4.1 4.5 3.0Brazil' -2.0 1.4 -2.7 4.8 8.2 8.0 3.0India' 2.9 5.4 4.9 4.5 4.8 2.5Indonesia' 7.9 2.2 4.5 4.2 1.9 3.0 3.5Mexico' 8.3 0.0 -5.2 3.5 2.7 -3.5 1.3Nigeria' -'5.9 -1.9 -6.4 -5.5 2.4 -5.0 -2.0Pakistan' 7.7 4.3 6.5 5.3 8.2 7.0 7.0
Other developingcountries 0.2 -0.4 1.8 1.3 0.2 2.8 2.8 4.1 3.4
Net energy-exportingcountries -2.2 -0.4 -0.8 -1.1 -1.3 -0.7 -0.2 -2.4 1.8
Net energy-importingcountries 1.5 -0.4 2.7 3.2 1.3 5.3 4.9 4.7 4.1
Memorandum itemsFifteen heavily indebted
countries 0.0 -0.8 -2.5 2.1 2.5 3.1 2.2 3.2 3.0Sub-Saharan African
countries' 2.1 -1.1 1.1 0.8 3.0 2.3 2.4 3.5 3.5China' 4.9 8.3 9.8 12.0 12.3 7.4 9.3 8.0 7.5
Source: Department oflnternational Economic and Social Affairs of the United Nations Secretariat.
a Preliminary estimates.
b Forecast.
c Net energy-importing country.
d Net energy-exporting country.
e Excluding Nigeria.
f Net material product. China is not included in the total for all developing countries.
also modest. Africa's situation improved somewhat, but thegrowth of output for the region as a whole remained below 1per cent. In Latin America, the debt-related difficulties ofsome of the larger countries caused a greater than expectedslow-down. Output in West Asia resumed the decline thatwas interrupted in 1986.
World trade and commodity prices
International trade grew more than anticipated in 1987,increasing by about 4 per cent in volume terms, compared to3.5 per cent in 1986 (see chap. III below). That trade flowsbegan to change in response to the realignments of exchangerates and to the differentials in growth rates among the developed market economies was as important as the growthof trade in influencing the global pattern of economic activity during the year. The appreciation of almost all major currencies vis-it-vis the dollar encouraged net imports into Japan and the Western European economies, while dampeningthose flowing to the United States. Countries in a position toexploit the former markets benefited, with those orientedtowards Japan being in a particularly advantageous position
6
because of that country's resumed rapid growth. Exporterscompeting with United States' producers found themselvesin a more difficult position, although this was mitigated tosome extent by that country's continued growth and still increasing demand for imports.
The developed market economies were the most affectedby these changes, since the majority of trade flows arewithin that group of countries. However, developing countries were also affected to varying degrees. As indicated intable II.3, countries in Asia and Africa rely more heavily onexports to Japan and Western Europe than countries in LatinAmerica and therefore stand to gain most from the changingpattern of trade flows.
This was illustrated in 1987 when a few countries in EastAsia achieved increases in their volumes of exports of morethan 20 per cent. These countries benefited from the depreciation oftheir currencies vis-it-vis most other major currencies, most notably the yen. The strength of the Japaneseeconomy reinforced this price effect and boosted demandfor these countries' exports, not only in Japan itself but alsoin third markets. The change in relative prices also encour-

Table II. 3. Structure of imports and exports of developing countryregions by region of origin and destination, 1985
(Percentage)
Share of 1985 imports from Share of 1985 exports to
United Western United Western
Region States Europe Japan States Europe Japan
Latin America and the
Caribbean 30.0 17.5 7.9 37.5 20.6 4.3
Africa 8.6 54.4 5.5 11.7 65.1 1.5
West Asia 8.3 39.1 12.6 3.5 22.3 23.0
South and South-East
Asia 13.8 14.9 20.0 13.1 28.6 16.4
Source: Handbook ofInternational Trade and Development Statistics: 1987 Supplement (United Nations publication, Sales No. E/F.87.II.D.1O), tables 3.2 and 3.3.
aged many Japanese corporations to establish or expandtheir own facilities in the subregion or to contract out part oftheir production process to firms there.' No other developing region matched the export performance of East Asia, butincreased growth in trade was an important characteristic ofthe developing countries in 1987 (see chap. III).
There were few dramatic changes in the prices of tradedgoods in 1987. Oil prices did not suffer further declines andwere generally higher than in 1986 (see table 11.4 and chap.V below). As a result, and in contrast with the previous year,imports by the energy-exporting countries were not drawndown, but served as a positive rather than negative influenceon their trading partners.
Trends in the prices of other primary commodities weremixed in 1987, but most indices suggest that, measured inreal terms, these prices reached an all-time low in the firstquarter of 1987 and have risen modestly since. As discussedin chapter III, measures of the average prices of commodities for the year as a whole hide important changes within thetotal. In some cases, notably beverages, prices continuedtheir decline in 1987; in other instances, particularly metals,there was a sustained recovery throughout the year, whileagricultural raw materials reversed their downward trend inthe course of the year. Overall commodity prices did nothave a major effect on the international balance of trade in1987, although individual countries were affected more thanaverage indices suggest. More importantly, however, theimport prices of manufactures faced by developing countries increased steadily throughout the year when measuredin dollars, with a negative effect on the terms of trade.
The higher rates of growth in the developed market economies and in international trade in 1987 were insufficient to
increase the average rate of growth in the developing countries. There are several reasons why the developing countries benefit less than previously from growth elsewhere.The first is that the nature of many developing countries'trade linkages with the rest of the world has changed. Technical progress and other factors have resulted in both a shiftin demand and a reduction in the income elasticity of demand for many commodities. The developing countries' dependence on exports of primary commodities has been reduced, even though it remains high in many countries orsubregions.
A partial corollary to the decreased commodity-intensityof growth in the developed market economies has been therapid expansion of services. Many services are non-tradable, and few developing countries have a comparative advantage in those that are tradable. The stimulatory effect ofrising· incomes in the developed market economies is reduced as the developing countries find themselves in the position of producing goods with a low income elasticity ofdemand and are unable to participate in the market for services where there is a high income elasticity ofdemand.
These changes in the pattern of demand help to explain thereduced interaction between developing and developedcountries and the increased ties within the groups. Tradeamong developing countries increased from 23 per cent oftheir total exports in 1975 to 30 per cent in 1985; the corresponding figures for the developed market economies were69 and 74 per cent. Conversely, the developed market economies accounted for only 62 per cent of developing countries' exports in 1985 compared to 69 per cent in 1975.2
Another consideration is that growth in the 1980s hastended to be concentrated in the larger economies, both de-
1 A similar process is occurring as Japanese firms and European firms establish themselves in the United States.2 Handbook ofInternational Trade and Development Statistics: 1987 Supplement (United Nations publication, Sales No. E/F.87.II.D.1O), table 3.2.
7

Table 11.4. Indicators of the internationaleconomic environment, 1980-1987
1980 1981 1982 1983 1984 1985 1986 1987
(Annual percentage change)World trade
Value (in dollar terms) 22.0 -1.6 -6.5 -1.3 5.6 1.0 8.5 13.3'Volume of world exports 0.0 1.0 -2.4 3.1 7.6 3.0 4.5 4.1'
World prices
Oil 65.8 11.5 -4.3 -10.3 -4.3 -3.5 -45.6 16.4Non-fuel primary
commodities 13.4 -15.4 -16.1 6.4 1.2 -10.7 5.3 -3.8Manufactured exports 11.1 -6.0 -2.1 -4.3 -2.3 0.0 19.8 18.4'
Dollar exchangerate" 0.1 12.7 11.7 5.8 7.9 4.5 -18.4 -11.9
Interest rate'(percentage) 14.0 16.7 13.6 9.9 11.3 8.6 6.8 7.6
(Billions of dollars)
World finance
Total flow of resources todeveloping countries' 128.4 139.1 117.8 97.7 86.1 82.3 84.0
of which:
Official developmentassistance 37.5 37.2 34.1 33.4 34.9 37.1 44.0
Net transfer of resourcesto developing countries' 40.3 41.8 11.8 0.1 -9.5 -22.7 -20.1 -22.5
Capital flowsinto the United States -28.1 -27.9 -27.4 35.0 80.2 98.5 117.4 138.8
Source: Department oflnternationa1 Economic and Social Affairs of the United Nations Secretariat, based onIMF, International Financial Statistics, various issues; OECD, Development Co-operation: 1987 Report (Paris,1987); United States Department of Commerce, Survey of Current Business, various issues; United Nations,Monthly Bulletin ofStatistics, various issues; and UNCTAD, Commodity Price Bulletin, various issues.
a Preliminary estimates.
b Based on the IMF Multilateral Exchange Rate Model, which is an index of the effective exchange rate.
c London Inter-Bank Offer Rate on six-month dollar deposits.
d OECD definition.
e For details, see table IV.2.
veloped and developing. These countries have proportionally weaker trading links than small and medium-sized countries and are likely to stimulate world trade less than ifgrowth were concentrated in the latter group of countries.
Outside the area of trade, since the 1970s, financial flowsand financial markets have come to play a more importantrole as a transmission mechanism between the developedmarket economies and the developing countries. However,net financial transfers to developing countries have diminished and become negative, while the effects of growthtransmitted by financial markets may be inverse rather thanpositive. For example, faster growth in the developed market economies may be accompanied by an increase in interest rates; this would slow the growth of the developing countries as a group because of the higher debt-servicing costs ofindebted countries, as appears to have been the case in 1987.
8
A further reason why growth in the developing countriesis less correlated than previously with global trends is thatexternal constraints have been joined by tighter domesticconstraints in many developing countries. Many of the hardpressed countries find themselves with less room for manoeuvre in economic policy than they had a few years ago,which makes it harder for them to respond to new opportunities.
International financial markets
Capital flows and the role of official finance
There was little change in the overall pattern of international capital flows in 1987. This was a reflection of the lackof progress in resolving the dual problems of external imbalances amo~g the developed market economies and exter-

nal indebtedness on the part of many developing countries.The former meant that there were large capital flows into theUnited States and out of the Federal Republic of Germanyand Japan as a counterpart to their current account imbalances; the latter remained an impediment to the revival ofnet private capital flows to developing countries and was thereason for the continued net transfer of resources from developing to developed countries (see table 11.4 and chap.IV).
Concern about the sustainability ofthe United States' current account deficit increased. In previous years, privateflows had been the main source of finance for this deficit,but official flows assumed this role on a large scale in 1987.The United States' external deficit was thus financed not bymarkets but by policy-induced decisions in partner countries.
The total debt of the developing countries increased byabout 6 per cent in dollar terms in 1987, equivalent to anincrease of abo~t 2.5 per cent when changes in exchangerates are taken into account. This increase did not, however,reflect a revival of voluntary private capital flows to developing countries, but was largely official lending and concerted lending provided as a part of debt-reschedulingagreements. Some borrowers were able to reduce their indebtedness to commercial banks by devices such as debtequity swaps and securitization. Such measures simultaneously enabled individual lenders to reduce their exposure;they also greatly increased their reserves to cover such debtsand sold off debt in the secondary market.
Debt-servicing problems were aggravated by rising interest rates. This was not reflected in higher interest payments,which were almost unchanged from 1986 at $49 billion. Onereason for this apparent inconsistency was that financialconstraints prevented an increasing number of countriesfrom remaining current on their debt payments, causingthem to accumulate arrears. In other instances, paymentscould be maintained only through the provision of newloans. Like arrears, "new money" has the effect of increasing future liabilities but, under current circumstances, itmaintains the standing of the borrower in international financial markets.
Overall, there was no breakthrough in the internationaldebt strategy in 1987, despite the recognition of both thecosts involved for all concerned and the fact that the problemis not going to disappear of its own accord. All forecastspoint to a continuation of those problems until well into the1990s unless there is a new approach to the debt problem.There was some progress in 1987 on the debts of sub-Saharan African countries which received some official debtrelief from a few bilateral creditors and whose debts werebeing rescheduled on increasingly lenient terms. The mostimportant new element, however, was the mobilization ofadditional concessional resources for sub-Saharan Africa bythe multilateral financial institutions-the Enhanced Structural Adjustment Facility of IMF, the Special Programme
for Africa of the World Bank and the increase in the resources of the African Development Bank.
The persistent instability in exchange rates and interest rates
The continued decline in the value of the United Statesdollar that started some two years earlier (see figure ILl)was the most important development in financial markets in1987. This change in the value ofthe dollar affected trends inthe world economy in 1987 and will continue to do so for thenext several years.
The decline in the value of the dollar was from 160 yen to128 yen and from 2.0 deutsche mark to 1.68 deutsche mark3
between the last quarter of 1986 and the first quarter of1988. Overall, the weighted average decline was some 12per cent during 1987, making the cumulative fall about 35per cent since the first quarter of 1985.
This transition to a new pattern of exchange rates has notbeen accomplished smoothly, but has been characterized byshort-term fluctuations around the long-term trend. The gyrations in international currency markets in 1987 highlightthe conflicting financial pressures on exchange rates in aglobalized and deregulated market. In a market system, exchange rates influence the international allocation of resources and would be expected to tend towards equilibriumlevels. However, they have to perform this function for twodistinct markets-that for goods and services and that forfinance. The equilibrium exchange rates in these two markets may not coincide in the short term. In addition, policymakers may have different views on the roles that they expect exchange rates to fulfil, most notably between the needsof domestic and international policy.
In the 1980s, halting inflation has been, and still is, a major objective, and monetary policy has been considered themost effective means of controlling inflation. However,changes in monetary policy also affect exchange rates. Forexample, a Government may counter perceived threats ofimpending inflation by raising domestic interest rates. Inpresent financial markets, domestic interest rates are onlyone element in a spectrum of interrelated international rates.If other things remain unchanged, a rise in one country'sinterest rates is likely to prompt an inflow of funds and, inthe absence of intervention to prevent it, an appreciation ofthe exchange rate. This will affect the relative profitabilityof importing and exporting activities and, in due course, islikely to reduce the trade balance. The use of monetary policy to control inflation may therefore conflict with the objective of maintaining stability in exchange rates. On the otherhand, manipulation of interest rates to influence international capital flows (and thereby the exchange rate) mayconflict with the objectives of domestic monetary policy.
The upward trend in interest rates that prevailed in mostfinancial markets in the first half of 1987 (and that has emerged in the United States again early in 1988) reflected the
3 The existence of the European Monetary System makes the exchange rate with the deutsche mark broadly representative of that with mostEuropean currencies except the British pound.
9

Figure ILL Nominal effective exchange rates of theFederal Republic of Germany, Japan andthe United States, 1980-1987
(1980 = 100)190 -,-----------------------,
130
110
160
150
140
130
120
110
1980 1931 198Z 1983 1984- 1985 1986 1981
o Deustche Mark + Dollar o Yen
Source: IMF, International Financial Statistics, various issues.
perception of both Governments and markets that inflationwas about to increase. Prior to 1987, nominal interest rateshad declined relatively steadily from their peaks around thebeginning of 1982 (see figure 11.2). During 1987, the trendbecame erratic. Early in the year, the downward trend continued and nominal long-term rates in the three largest market economies reached their lowest levels of the decade.This trend was reversed around the middle of the year asmonetary authorities raised interest rates in an effort to fendoff signs of accelerating inflation and to defuse inflationaryexpectations. Following the collapse of equity prices in October 1987 (see chap. IV below), Governments promptlyrelaxed monetary policy, inter alia, through a reduction ininterest rates. This was reinforced early in 1988 by furtherreductions in interest rates in the Federal Republic of Germany, Japan and the United Kingdom. On these occasions,however, the adjustments were prompted by considerationsother than inflation. In the first two instances, the interestrate cuts were part of an internationally agreed package ofmeasures designed to reduce the imbalances among the developed market economies by stimulating the economies of
the Federal Republic ofGermany and Japan. In the last case,the United Kingdom Government reduced interest rates inan attempt to slow the appreciation of its currency vis-ii-visthose of the European Monetary System, notably thedeutsche mark.
The net result of these developments is that long-term interest rates in early 1988 are at broadly the same level as ayear previously, although somewhat higher in the UnitedStates. Short-term interest rates are lower than a year ago.One reason for this is the large liquidity in the global financial system, due to a large extent to the apprehensions occasioned by the precipitous decline in equity values.
Real interest rates' remain high by historical standards andappear to be having a damaging effect on capital investment.Combined with the high degree of uncertainty among bothconsumers and investors, particularly the latter, they are disrupting the interaction between the real and financial sectorsof the economy. With the prospects for the medium termunclear, there is a preference for financial instruments rather
4 In this context, real interest rates are measured ex post as the difference between nominal interest rates and the rate of inflation.
10
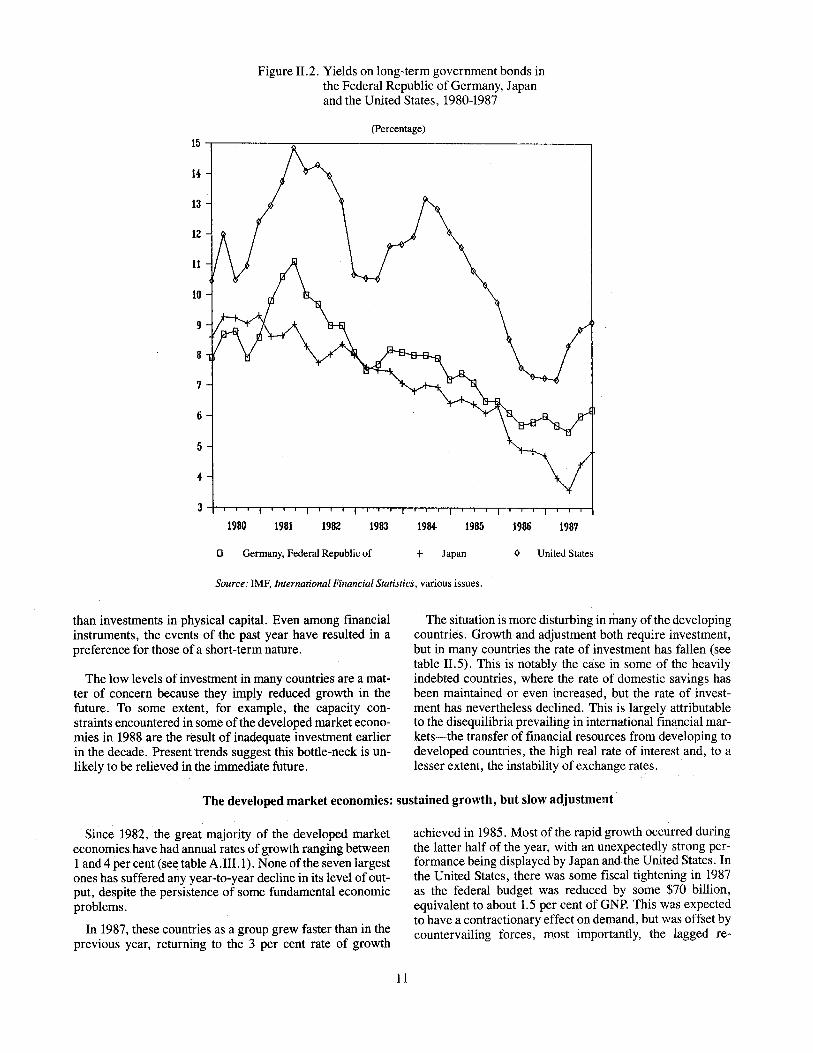
Figure 11.2. Yields on long-term government bonds inthe Federal Republic of Germany, Japanand the United States, 1980-1987
(Percentage)
15 .------,-----,.-----------------~
14
13
12
11
10
9
8
7
6
5
4
1980 1981 1982 1983 1984 1985 1986 1987
o Germany, Federal Republic of + Japan o United States
Source: IMF, International Financial Statistics, various issues.
than investments in physical capital. Even among financialinstruments, the events of the past year have resulted in apreference for those ofa short-term nature.
The low levels of investment in many countries are a matter of concern because they imply reduced growth in thefuture. To some extent, for example, the capacity constraints encountered in some of the developed market economies in 1988 are the result of inadequate investment earlierin the decade. Present trends suggest this bottle-neck is unlikely to be relieved in the immediate future.
The situation is more disturbing in many of the developingcountries. Growth and adjustment both require investment,but in many countries the rate of investment has fallen (seetable 11.5). This is notably the case in some of the heavilyindebted countries, where the rate of domestic savings hasbeen maintained or even increased, but the rate of investment has nevertheless declined. This is largely attributableto the disequilibria prevailing in international financial markets~the transfer of financial resources from developing todeveloped countries, the high real rate of interest and, to alesser extent, the instability of exchange rates.
The developed market economies: sustained growth, but slow adjustment
Since 1982, the great majority of the developed marketeconomies have had annual rates of growth ranging between1 and 4 per cent (see table A.III.I). None of the seven largestones has suffered any year-to-year decline in its level of output, despite the persistence of some fundamental economicproblems.
In 1987, these countries as a group grew faster than in theprevious year, returning to the 3 per cent rate of growth
11
achieved in 1985. Most of the rapid growth occurred duringthe latter half of the year, with an unexpectedly strong performance being displayed by Japan and the United States. Inthe United States, there was some fiscal tightening in 1987as the federal budget was reduced by some $70 billion,equivalent to about 1.5 per cent of GNP. This was expectedto have a contractionary effect on demand, but was offset bycountervailing forces, most importantly, the lagged re-
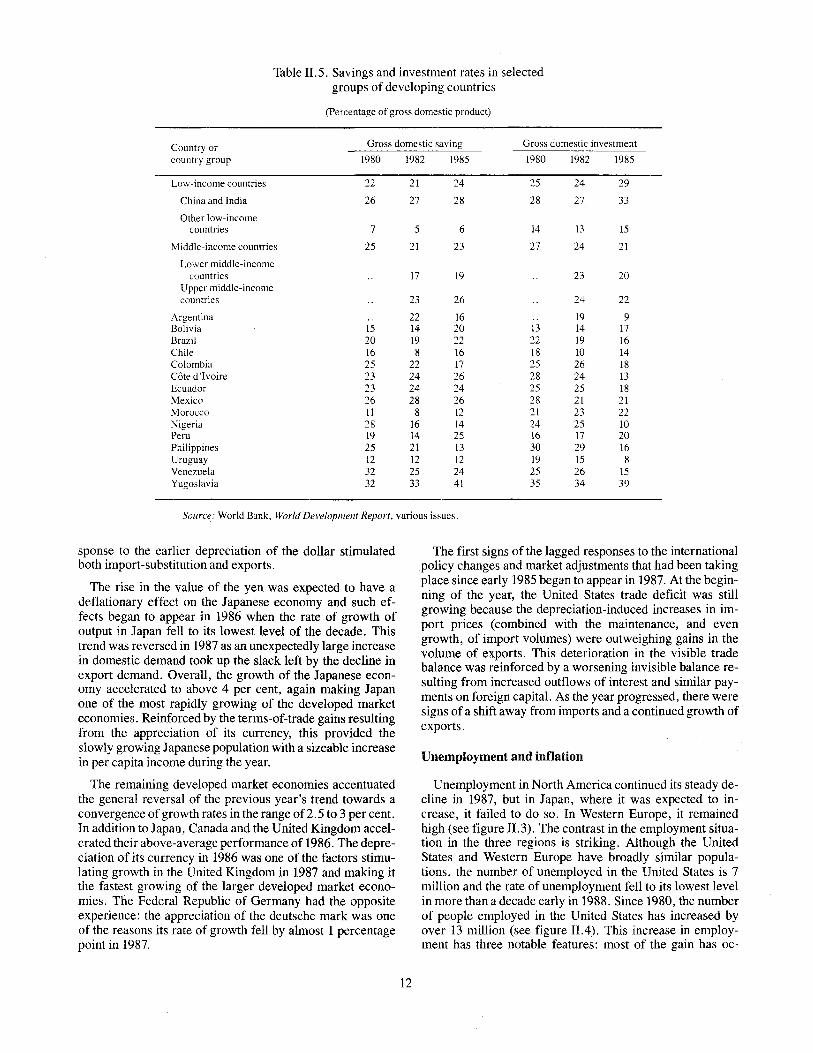
Table 11.5. Savings and investment rates in selectedgroups of developing countries
(Percentage of gross domestic product)
Country or Gross domestic saving Gross domestic investment
country group 1980 1982 1985 1980 1982 1985
Low-income countries 22 21 24 25 24 29
China and India 26 27 28 28 27 33
Other low-incomecountries 7 5 6 14 13 15
Middle-income countries 25 21 23 27 24 21
Lower middle-incomecountries 17 19 23 20
Upper middle-incomecountries 23 26 24 22
Argentina 22 16 19 9Bolivia 15 14 20 13 14 17Brazil 20 19 22 22 19 16Chile 16 8 16 18 10 14Colombia 25 22 17 25 26 18Cote d 'Ivoire 23 24 26 28 24 13Ecuador 23 24 24 25 25 18Mexico 26 28 26 28 21 21Morocco 11 8 12 21 23 22Nigeria 28 16 14 24 25 10Peru 19 14 25 16 17 20Philippines 25 21 13 30 29 16Uruguay 12 12 12 19 15 8Venezuela 32 25 24 25 26 15Yugoslavia 32 33 41 35 34 39
Source: World Bank. World Development Report. various issues.
sponse to the earlier depreciation of the dollar stimulatedboth import-substitution and exports.
The rise in the value of the yen was expected to have adeflationary effect on the Japanese economy and such effects began to appear in 1986 when the rate of growth ofoutput in Japan fell to its lowest level of the decade. Thistrend was reversed in 1987 as an unexpectedly large increasein domestic demand took up the slack left by the decline inexport demand. Overall, the growth of the Japanese economy accelerated to above 4 per cent, again making Japanone of the most rapidly growing of the developed marketeconomies. Reinforced by the terms-of-trade gains resultingfrom the appreciation of its currency, this provided theslowly growing Japanese population with a sizeable increasein per capita income during the year.
The remaining developed market economies accentuatedthe general reversal of the previous year's trend towards aconvergence of growth rates in the range of2.5 to 3 per cent.In addition to Japan, Canada and the United Kingdom accelerated their above-average performance of 1986. The depreciation of its currency in 1986 was one of the factors stimulating growth in the United Kingdom in 1987 and making itthe fastest growing of the larger developed market economies. The Federal Republic of Germany had the oppositeexperience: the appreciation of the deutsche mark was oneof the reasons its rate of growth fell by almost 1 percentagepoint in 1987.
12
The first signs of the lagged responses to the internationalpolicy changes and market adjustments that had been takingplace since early 1985 began to appear in 1987. At the beginning of the year, the United States trade deficit was stillgrowing because the depreciation-induced increases in import prices (combined with the maintenance, and evengrowth, of import volumes) were outweighing gains in thevolume of exports. This deterioration in the visible tradebalance was reinforced by a worsening invisible balance resulting from increased outflows of interest and similar payments on foreign capital. As the year progressed, there weresigns ofa shift away from imports and a continued growth ofexports.
Unemployment and inflation
Unemployment in North America continued its steady decline in 1987, but in Japan, where it was expected to increase, it failed to do so. In Western Europe, it remainedhigh (see figure 11.3). The contrast in the employment situation in the three regions is striking. Although the UnitedStates and Western Europe have broadly similar populations, the number of unemployed in the United States is 7million and the rate of unemployment fell to its lowest levelin more than a decade early in 1988. Since 1980, the numberof people employed in the United States has increased byover 13 million (see figure 11.4). This increase in employment has three notable features: most of the gain has oc-

Figure II.3. Unemployment in Japan, the United States andWestern Europe, 1980-1987
(Percentage oftotallabour force)
12.---------------------------,
11
10
9
8
7
6
5
1987198619851984198319821931
o-t----r-----,,----,----r---,----,----j
1980
o Japan + United States o Western Europe
Source: GECD, Main Economic Indicators (Paris, March 1988); andGECD, Employment Outlook (Paris, September 1987).
curred in the service sector; more than half the new employees are women; and almost none of the increase has beenaccounted for by the large enterprises that play a dominantrole in the economy as a whole.
In 1986, the appreciation of the yen contributed to an increase in unemployment in Japan. Contrary to expectations,this trend was reversed in 1987, as the strong growth of domestic demand created sufficient additional employment opportunities to reduce the unemployment rate. As a result,unemployment in Japan remains atypically low by the standards of the other developed market economies at below 3 percent.
In contrast, total unemployment in Western Europe is stillmore than 19 million people. No net new jobs have beencreated in the region this decade: the average rate of unemployment of approximately 11 per cent is about double whatit was in 1980 and about four times the level prevailing in1973. Within this average, there are some very high ratesabout 20 per cent in Ireland and Spain.
Progress in reducing Western Europe's unemploymentproblem was muted in 1987. Unemployment fell in the
United Kingdom, but rose in France, the Federal Republicof Germany and Italy. There were signs of progress in reducing unemployment in some of the chronically affectedcountries, but in Ireland the unemployment rate continued togrow. With regard to the most seriously affected segmentsof the population, there was a slight reduction in the numberof unemployed youths in 1987. This was partly attributableto the decline in the proportion of youth in the work-force,but more importantly to a number of policy measures, suchas the youth employment programmes in France and theUnited Kingdom. The number oflong-term unemployed didnot show any widespread improvement.
The continued high rates ofunemployment in Western Europe have to be seen in the context of the region's steadygrowth over the past five years. This growth has failed tobring unemployment even close to the levels of a decadeearlier, and a slow-down in economic activity would posethe threat ofa further increase in the number of people out ofwork. As indicated above, economic growth-and thereforeemployment-in the United Kingdom benefited in 1987from the earlier depreciation of its currency, while the opposite applied in the Federal Republic of Germany. The re-
13

Figure 11.4. Total employment in Japan, the United Statesand Western Europe, 1980-1987
(1980 = 100)
19871986198519841983191121981
Wi -,-----------------------,
114
113
112
111
110
109
108
107
106
105
104
103
102
101100 -DE;::::.---I-----+-
99
98
97
9695 -+----,-----,-----,-------,---,----,-----1
1980
o Japan + United States o Western Europe
Source: DECD, Employment Outlook (Paris, September 1987); andDECD, Main Economic Indicators (Paris, March 1988).
sponses in future years to the changes in exchange rates thatoccurred in 1987 are likely to have an adverse effect onWestern Europe's employment, unless accompanied bystimulatory policy measures. This possibility is investigatedfurther in the last section of the chapter.
Inflation in the developed market economies remained beIowan average of 4 per cent in 1987. One measure of inflation-the rate of increase in consumer prices-showed amodest rise over its level in 1986 when it had been the lowestin more than two decades (see table A.III.2). Within thisaverage, there was a decline in inflation in 1987 in somecountries, particularly the smaller ones, that had had aboveaverage inflation in 1986. Among the larger economies,there was almost no increase in consumer prices in the Federal Republic ofGermany and Japan in 1987. Another measure of inflation, the deflator for gross domestic product, increased by the smallest amount this decade.
Inflationary pressures in Western European countries andJapan were eased in 1987 by the continuing appreciation oftheir currencies. The increase in the dollar price of oil, forexample, was offset by the depreciation of the dollar. Withinthe United States, depreciation has not yet accelerated therate of inflation, in part because of the relatively small role
of imports in the economy, but also because some importersseem to have absorbed a large part of the implicit increase indomestic prices.
In the middle of 1987 and again early in 1988, inflationwas expected by both Governments and other economicagents to accelerate. Analysts pointed to the apparent reversal of the downward trend in commodity prices (particularlythose for' industrial raw materials), and the pressure onwages in many countries. On the supply side, concern wasexpressed about the increasing rate of capacity utilization(perceived to be close to its non-inflationary maximum insome developed market economies, notably the UnitedStates), To date, however, increasing levels of capacity utilization have not been accompanied by any sizeable increasein inflation. The change in the composition of demand, particularly the shift towards service industries, may have reduced the relevance of industrial capacity utilization as abarometer for inflation. The concerted supply-side reformsthat have taken place in many developed market economiesin recent years may also have had the effect of reducing therigidities of the market in responding to increases in demand. Finally, the high rates of unemployment in WesternEurope suggest that there is scope for a non-inflationary expansion of output in that region.
14

Figure 11.5. Volume of exports and imports of theFederal Republic of Germany, Japanand the United States, 1986 and 1987
(Annual percentage change)14 -,----------------------------,
12
10
8
6
4
2
o
-2
---4..l-------------------------..JGermany, Federal Republic of
.. 1986 exports ~ 1987 exports
Japan
D 1986 imports
United States
m 1987 imports
Source: IMF, International Financial Statistics, various issues.
External imbalances and policy co-ordination
Most balance-of-payments deficits of developed marketeconomies increased in 1987 and so did their surpluses (seetable IV.l). Among the three major economies, there was arelative narrowing only in the case ofJapan (see figure 11.4).
The magnitude of the changes in the exchange rates of themajor currencies since 1985 did not begin to be reflected inforeign trade flows until 1987.5 Despite the depreciation ofthe dollar, the volume of United States' imports continued togrow in 1987, although at a much slower rate than in 1986(see figure 11.5). Imports of the Federal Republic of Germany and Japan grew at a slower rate in 1987 than in 1986,notwithstanding the appreciation oftheir currencies. The behaviour of exports corresponded more closely to the patternthat would be expected from the exchange rate changes: thevolume of United States merchandise exports grew by over10 per cent in 1987, while those ofJapan fell for the secondconsecutive years; exports of the Federal Republic of Germany, on the other hand, increased faster in 1987 than in1986. The year therefore marked a tentative beginning in thecorrection of the external imbalances among the developedmarket economies.
At the same time, the imbalances remained large in absolute terms and the enormity, complexity and dangers of thenecessary task of narrowing them became more apparent.
The absolute size of the imbalances is important in termsof the financial flows to which they give rise (see chap. IV),
but it is their magnitude in relation to a number of othervariables that explains the difficulty being encountered inovercoming them. In the case of the United States, for example, exports had fallen to about 60 per cent of the value ofimports at the end of 1987, whereas in Japan the corresponding ratio was about 175 per cent (see figure 11.6). This meansthat, on the unrealistic assumption that all the adjustment ison only one side of each country's account, United States'exports would have to increase by about 50 per cent or Japan's exports fall by an equivalent proportion in order torestore balance on their trade accounts.
The persistence of the imbalances, their apparent unsustainability and the threat that this was believed to pose to thestability of the global economy were the driving forces behind the international economic policy co-ordination thatwas initiated with the Plaza Accord ofSeptember 1985. Thismove towards economic co-operation among the leading industrial economies followed a period of benign non-intervention, during which inconsistent macro-economic policieswithin those countries contributed to the development of theimbalances (see chap. VII below). During the first phase ofinternational economic co-operation among the leading industrialized countries, progress was halting and frequentlyprompted by the possibility of a crisis. The Louvre Accordof February 1987 marked a more determined effort by thesecountries to co-ordinate economic policy.
The Plaza Accord reflected official recognition that one ofthe measures necessary to remedy the imbalances was a de-
5 This is only what should be expected in view of past experience. Reorientation of long-standing customer~supplier relationships takes time.
15

Figure II.6. Ratio of exports to imports for theFederal Republic of Germany, Japan andthe United States, 1985-1987
2,---------------------------,
1.5
0.5
TI
Germany, Federal Republic of
b:~ 1985
Japan
I;:::::j 1986 ~ 1987
United States
Source: IMF, International Financial Statistics. various issues.
preciation of the dollar. This joint effort to narrow the surpluses of the Federal Republic of Germany and Japan andthe deficit of the United States through an adjustment of exchange rates recognized that there would be a delay beforecorrective changes in the volume of imports and exportswould outweigh the negative price effects of currency realignments on the external financial balances. The durationof this delay has always been unknown, but the continueddeterioration of the imbalances, even after the dollar beganits prolonged depreciation, was initially tolerated by markets and accepted by Governments on the implicit understanding that a turnaround was imminent.
In 1987, it was not only the level of the imbalances thatgave rise to concern in financial markets but also emergingdoubts about the validity, in the prevailing situation, of thisso-called J-curve effect. The failure of the current imbalances to respond in the anticipated way and in a timelyfashion was seen as jeopardizing the holding strategy thathad been adopted. As a result, markets often responded precipitously to fragments of economic or other informationthat suggested an inadequacy in either the strategy itself orthe determination of Governments to adhere to it. One general consequence was that the value of the dollar continuedto fall.
By February 1987, the consensus among policy makerswas that the continuing depreciation of the dollar should beslowed and possibly halted. This understanding formed thebasis of the Louvre Accord. A secondary objective of thisagreement-and one that, it was hoped, might be achievedas a by-product of the first-was to reduce the prevailingerratic short-term movements in exchange rates. To theseends, the Governments of the leading developed market
16
economies agreed to intervene in foreign exchange marketswith a view to supporting the price of the dollar. The agreedtarget level for the dollar was not publicized. Recognizingthe deflationary effects that depreciation of the dollar waslikely to have on the world economy, surplus countriesagreed to stimulate their economies.
The measures adopted to give effect to this agreementwere a widening of the differential between interest rates inthe United States and those of other key currency countries(in an effort to make the dollar more attractive to privateinvestors) and official intervention in foreign exchange markets. In addition, the Governments of the Federal Republicof Germany and Japan announced some expansionary fiscalpolicies (see chap. VII).
These measures were initially successful in achievinggreater stability in the value of the dollar, but the attention ofpolicy makers then appeared to drift away from the fundamental problem of redressing the underlying imbalances thatwere the raison d'etre of the Louvre Accord. In the UnitedStates, there was a feeling that the trade balance was about toimprove; in Western Europe and Japan, there was a resurgence of concern about inflation and interest rates wereraised accordingly. These de facto departures from the Louvre Accord resulted in a corresponding failure to achieve itsshort-term objective of more stable exchange rates amongmajor currencies.
Financial markets became volatile because investors feltthat international macro-economic co-ordination had weakened and that policy makers had abandoned efforts to address the underlying problems. On occasion, Governmentsacted in response to these concerns, but the actions some-

Table 11.6. Developing countries:' frequency distributionof rates of growth of output, 1981-1987
(Number of countries)
Populationof countries
in 1987 column
Zero or below0.1- 2.5 per cent2.6 - 5.0 per cent5.1- 7.5 per cent7.6 per cent and over
Total
PercentageNumber of
1981 1982 1983 1984 1985 1986 1987h (millions) total
25 40 3 27 25 19 19 270 10.715 18 17 19 21 21 24 1096 43.512 11 20 21 25 33 28 819 32.517 9 8 10 8 5 9 283 11.214 5 5 6 4 5 3 51 2.0
83 83 83 83 83 83 83 2520 100.0
Source: Department of International Economic and Social Affairs of the United Nations Secretariat. The dataon population and population growth rates are those published by the Department in World Demographic Estimates and Projections, 1950-2025 United Nations publication, Sales No. E.86.XIII.3).
a Based on data for 83 countries that account for 97 per cent of the population of developing countries.
b Based on preliminary data.
Table 11.7. Developing countries:' geographical distributionof countries with negative rates of growth ofper capita output, 1981-1987
(Number of countries)
Populationof countries
in 1987 column
PercentageNumber of
1981 1982 1983 1984 1985 1986 1987b (millions) total
Western hemisphere 13 21 19 10 14 13 10 132.0 32.5West Asia 4 7 7 8 6 6 6 77.8 76.8South and East Asia 0 2 3 1 5 2 1 17.3 1.2Africa 19 24 22 24 20 20 16 252.7 49.2Mediterranean 0 0 2 0 1 0 1 23.5 30.9
Total 36 54 53 43 46 41 34 503.3 20.0
Source: Department of International Economic and Social Affairs of the United Nations Secretariat. The dataon population and population growth rates are those published by the Department in World Demographic Estimates and Projections, 1950-2025 (United Nations publication, Sales No. E.86.XIII.3).
a Based on data for 83 countries that account for 97 per cent of the population of developing countries.
b Based on preliminary data.
times had an effect contrary to that intended and the enthusiasm of Governments for reassuring measures waned. As indicated in chapter IV, the consequential loss of confidence ininternational economic policy may have been one of the underlying causes ofthe global downward adjustment in equitymarkets in October 1987. This change in equity market sentiments was parallelled in currency markets, where it wasreinforced by an apparent ambivalence on the part of theUnited States administration regarding the value of the dollar.
The turbulence in financial markets in October 1987 produced a prompt response on the part of policy makers. Fears
17
of a global recession emerged, and monetary policy was rapidly relaxed accordingly. Governments also began to refocustheir attention on the long-term underlying problem of theimbalances, with the United States Government announcingnew measures to reduce its budget deficit.
A series ofdisappointing United States trade figures againraised doubts in the minds of financiers in December andthere was another short period of rapid decline in the valueof the dollar on international currency markets. The authorities again acted speedily, announcing their determination tomaintain the dollar around its prevailing level. Nevertheless, the dollar's decline continued briefly until, in early Jan-

Figure II.7. Trends in per capita output in selected groupsof developing countries, 1980-1987
(1980 = 100)
198770
1980 1981 198Z 1983 1984- 1985 1986
0 Heavily indebted countries 6. South-East Asia
+ West Asia X Sub-Saharan Africa
0 South Asia
80
130 -,--------------------------------,
90
110
1Z0
Source: Department of International Economic and Social Affairs of the United Nations Secretariat.
uary 1988, the. authorities co-operated in intervening on alarge scale to reverse the downward trend.
The responses of Governments to the market's lack ofconfidence have become fewer in number but more decisivein nature as time has progressed. As a result, markets seemto have become convinced of the determination of Governments to adhere to their long-term policy goals and a higherdegree of stability has prevailed in foreign exchange markets
in early 1988. This should simplify the process of attainingsustainable balances among and within the leading developed market economies, but it is unlikely to be sufficient todo so. Further corrective actions appear necessary, some ofwhich are likely to have a deflationary effect on the worldeconomy. If this is to be avoided, some additional stimulatory fiscal measures in the surplus countries seem indispensable.
Developing countries: adjustment and development
Climatic conditions, which exercise a decisive influenceon the economies of many developing countries, were, withthe exception of South Asia and some countries in Africa,closer to normal in 1987 than in several of the earlier yearsofthe decade. Some countries in these two regions sufferedfrom inadequate or inappropriately timed rainfall, but therewas no widespread regional drought. Wars and other forms
of internal and external destabilization beset many developing countries. In some instances in Africa, poor harvests in1987 were superimposed on, and partly attributable to, military conflicts, and the ensuing human suffering was increased as a result of obstacles to international efforts torelieve potential famines.
18

Table 11.8. Developing countries:" annualrates of inflation, 1982-1987b
(Percentage)
1982 1983 1984 1985 1986 1987
All countries 39.9 65.1 93.7 125.9 45.3 67.1(Median) (ll.l) (11.5) (11.8) (10.5) ( 8.7) ( 9.5)
Net energy exporters 22.6 36.2 34.8 97.0 27.8 39.8Net energy importers 52.3 85.8 136.1 146.6 57.9 86.7
Western hemisphere 78.8 135.7 198.6 287.4 93.0 138.3(Median) (11.8) (16.7) (20.4) (25.7) (19.5) (21.8)
West Asia 17.1 18.7 33.0 24.3 5.9 6.2South and East Asia 8.0 8.8 10.1 5.7 5.2 6.5Africa 11.7 23.2 23.4 11.2 12.4 25.8Mediterranean 30.6 35.9 50.5 57.9 62.1 83.5
Frequency distribution5 per cent or lower 6 14 19 22 28 245.01-10 per cent 24 19 13 13 13 1510.01-20 per cent 26 22 16 16 II 1220.01-50 per cent 13 12 15 14 13 1450.01-100 per cent 4 2 8 4 8 4Over 100 per cent 3 7 5 7 3 7
Source: Department ofInternational Economic and Social Affairs of the United Nations Secretariat, based on IMF, International Financial Statistics.
a Based on a sample of76 countries.
b Annual rate of change in consumer prices.
c Preliminary estimates.
The diversity that has characterizedgrowth in the developing countries during the 1980s was not fundamentally altered in 1987 (see table 11.6). The rate of growth of two ofthe largest economies, Brazil and India, slipped in 1987,with the result that more than half the population of the developing world (excluding China) lived in countries wherethe increase in output during the year was less than 2.5 percent. One fifth of the developing world's population suffered a decline in per capita output in 1987 (see table 11.7);for some groups of countries, this was the continuation of atrend that has existed since the beginning of the decade (seefigure II .7) .
Many developing countries continued to focus their attention during 1987 on adjusting to their economic predicament. Most of the countries that are heavily indebted to commercial lenders have been implementing policies designedto improve their external payments position for as long asfive years. The failure of such measures to yield significantresults, or even to offer the prospect of progress in the foreseeable future, is leading to frustration among both the Governments and the populations of the countries concerned."Adjustment fatigue" manifested itself in 1987 in a debtmoratorium by the largest debtor and various signs of intransigence on the part of others (see chap. IV).
Regional situations
Latin America: slow-down in output growth
Most of the economies in Latin America continue to be ina precarious situation. Noticeable increases in per capita in-
19
come in 1987 occurred only in Chile, Colombia, Peru andUnJgtwy. For the region as a whole, the average increase inper capita output during the year was reduced to negligibleproportions. This was so despite the structural improvements that have been made in the economies of the regionsincethe debt crisis broke in 1982. The diversification oftheregion's export base has proceeded: primary commoditiesnow account for less than one fifth of non-oil exports, compared to about a quarter in 1980. Even the energy-exportingcountries have diversified considerably: more than half ofMexico's export revenue is from non-oil sales and Venezuela's non-oil exports are growing rapidly.
Despite this, the prospects for the Latin American regionare for a continuation of a large net financial transfer abroadto service external debt obligations. This wilLentail negligible per capita income growth into the next decade. Even thisprognosis is likely to prove optimistic if there are any unfavourabledevelopments in the United States. Latin Americancountries would be seriously affected by an economic slowdown in the United States, particularly if it were accompanied, or induced, by an increase in interest rates. Such aslow-down would repeat the pincer effect of the early 1980sby reducing export earnings and increasing debt-servicingobligations.
A disturbing development in Latin America in 1987 wasthe resurgence of inflation. After a slow-down in 1986, several countries experienced a rapid escalation in prices thefollowing year (see table 11.8). In some countries, annualincreases of over 100 per cent were recorded; early in 1988,

the average monthly rate was about 10 per cent in Argentinaand Mexico and above 15 per cent in Brazil.
The high rates of inflation in Argentina and Brazil reflectthe collapse in 1987 of the two countries' heterodox recovery strategies (the so-called "austral" and "cruzado"plans). In both cases, the failure to reduce fiscal disequilibria resulted in larger than expected government deficits andfuelled inflation. Mexico, the region's other large economyand major debtor, suffered a decline in gross domestic product as a result of the collapse in oil prices in 1986; its modestgrowth in 1987 was less than that ofpopulation and the country ended the year fighting the problems of inflation and abudget deficit.
Africa: insufficient recovery
For Africa as a whole, the modest gain in output in 1987fell short of that in population and was insufficient to recoupthe decline of more than 2 per cent in the previous year. Thisaggregate figure was heavily influenced by the performanceof Nigeria, which suffered another year of declining output,brought about by the continuation of comparatively low oilprices and difficulties created by its external debt. The countries of North Africa also continued to be adversely affectedby the earlier collapse in oil prices and export earnings. Forsub-Saharan Africa excluding Nigeria, 1987 was a betteryear, with output increasing at roughly the same rate as population.
With the adoption in 1986 of the United Nations Programme of Action for African Recovery and Development1986-1990, it was hoped that a turnaround in Africa's economic fortunes would become apparent in 1987. However,Africa's economic plight continued because of the persistence of two of its underlying economic difficulties-weakmarkets for its primary commodity exports and a precariousexternal debt situation. The lack offoreign exchange and thebudgetary crises resulting from loss of trade-related government revenues continue to have a debilitating effect throughout the region.
The upturn in the prices of some commodities in 1987 didnot extend to tropical beverages, on which sub-Saharan Africa is heavily dependent, and the exporters of copper couldnot fully exploit the upturn because of production bottlenecks, in part attributable to earlier retrenchment in the industry. There was, however, some improvement in the termsof trade for the region as a whole, and an accompanyingincrease in total export earnings. Despite this, the exportearnings of the region in 1987 were probably no more than$65 billion-less, in dollar amount, than at the beginning ofthe decade, and far less in real terms.
The previous slow-down in capital inflows to sub-SaharanAfrica was halted in 1987 as official flows increased. However, this improvement was offset by the inexorable increasein debt-service obligations. Many countries in Africa stillhave large outstanding amounts of non-concessional debt,primarily to official creditors. Some creditors have adjustedthe terms of some of these debts, but many countries in theregion were still unable to meet their debt-servicing commitments in 1987, leading to more reschedulings, the accumula-
20
tion of additional external debt, and arrears in payments tothe international financial institutions, which make thedebtors ineligible for further assistance from those sourcesand jeopardizes their chances of obtaining external resources from other sources.
Yet there was progress in other key areas. Most importantly, there was a consolidation of domestic economic reform within the continent. There are programmes of economic reform in place in the majority of the countries in thecontinent, almost all of them drawn up in consultation witheither the World Bank or IMP. Reforms are broadly aimed atimproving economic efficiency, particularly in export-oriented and import-substituting industries. This usually involves a depreciation of the exchange rate and a reduction oftrade barriers, the elimination of subsidies and other formsof government price intervention, the privatization orstreamlining of state enterprises and measures to increaseboth public and private domestic savings, notably reducingpublic sector deficits. However, there is no assurance thatthe countries concerned will have the resources necessary toimplement such programmes. Such difficulties caused somecountries, notably Zambia, to discontinue their agreementswith IMF during 1987.
A more encouraging note was the widespread recognitionof the predicament of sub-Saharan Africa and of the continued deterioration of its external resource situation. Therewere many signs in 1987 of a positive international responseto this crisis.
Asia: subregional diversity
Most of Asia was able to maintain the relatively steadygrowth of the past five years in 1987. Drought in India andsome of its neighbouring countries disrupted a period of improvement in economic performance, reducing growth forthe almost one billion people of the South Asia region toabout 3 per cent, only 0.5 per cent more than the rate ofgrowth of population. Despite this set-back-which mightextend beyond the period of the drought itself-encouragement could be found in the fact that India was able to withstand such adverse climatic conditions without resort tolarge-scale external food aid. Such was far from the case oneor two decades ago. .
China's exports played an important role in facilitating itsacceleration in growth in 1987 since foreign exchange constraints were threatening to disrupt the country's recent period of continuous high growth. Exports grew by about aquarter in 1987 while imports remained almost unchanged,with the result that the country's trade deficit fell from almost $16 billion to about $12 billion. Nevertheless, 1987provided some support for the fear that China's present highrate of overall growth cannot be sustained. Industry againout-performed agriculture and imposed a strain on energyand transportation infrastructure. The result was an acceleration in inflation, with prices rising by more than 7 per centduring the year. The Government responded by tighteningcredit and this has already had the effect of slowing the rateof growth of the economy. Some further deceleration in China's high rate of growth seems unavoidable, whether in-

duced by policy, arising from imbalances between supplyand demand within the economy or produced by an emerging foreign exchange constraint.
In South-East Asia, 1987 was another year of solid overalleconomic growth. Two economies in the region grew at adouble-digit rate and others achieved increases in per capitaincome of more than 5 per cent. All the countries in theregion benefited from expanded export opportunities in Japan, without appearing to have lost the momentum of theirexports to the United States. Indonesia was constrained bythe continued weakness in the international oil market, butstill managed to grow at a rate in excess of 3 per cent.
Formerly, only a handful of countries in South-East Asiarelied heavily on exports of manufactures to fuel their economic growth, but these have been joined by several othersin recent years. Indonesia, Malaysia, the Philippines andThailand have begun to compete in markets that were formerly dominated by exports from Hong Kong, Japan, theRepublic of Korea and Taiwan, Province of China. Startingfrom a low base~ their rates of growth of manufactured exports have been high and have stimulated economic growth.Meanwhile, the countries in the region that initially adoptedthis strategy have been so successful that their trade surpluses have become a matter of concern to the developedmarket economies and the economies themselves have advanced to the stage that there is discussion of a possible'~sian DECD".
Despite double-digit rates of growth of imports, HongKong, the Republic of Korea and Taiwan, Province ofChina, together amassed a current account surplus of some$27 billion during 1987 (see table IV.2), which made it possible for them to reduce their external debt. However, theseexamples of successful adjustment gave rise to bilateralpressure for a realignment of their exchange rates vis-a-visthe dollar and a liberalization of their import regimes. Somemovements in this direction took place in 1987 and early1988 and may be expected to continue. This would dampenthe future growth prospects of these economies, but seemsunlikely to dislodge them from their position among theworld's most rapidly growing economies.
Developments in the economies ofWest Asia in 1987 weredominated by regional conflicts and the limited recovery ofoil prices. For several countries in the region, economicprogress takes second place to the widespread human suffering resulting from continued large-scale intraregional warand other hostilities. The region encompasses both countriesin the upper echelons of the per capita income scale and afew countries classified as least developed. These characteristics give rise to a mixed economic performance, but oilcontinues to playa dominant role. In 1987, as for most of thedecade, the decline in oil revenues had a negative impact onthe region as a whole, but the commencement of large-scaleoil production in two of the least developed countries in theregion should boost those economies.
Centrally planned economies: reform amidst a mixed performance
Growth in the centrally planned economies of Eastern Europe and the USSR slowed from 4.2 per cent in 1986 to anestimated 2.6 per cent in 1987. The slow-down in theseeconomies in 1987 was attributable in part to agriculturalproduction, which fell by 0.1 per cent (after growth of 5.2per cent in 1986), instead of increasing by 2.3 per cent asenvisaged by the annual plans (see table II.9). In mostcountries of the group, 1987 was marked by an intensive reassessment of economic policies and the launching of initiatives aimed at economic reform (see chap. VI). Weak exportdemand, depreciation of the dollar and deteriorating termsof trade adversely affected foreign trade with market economies and the external indebtedness of countries in the region.
Reform and restructuring policy
In many countries, the drive to reinforce and advance reform encountered difficulties in 1987. Innovations in theregulatory and institutional framework, mostly unanticipated at the outset of the current five-year plan period andtherefore not reflected in medium-term policies, had a disruptive short-term effect on sectoral performance. The attainment of growth targets might not be compatible with therestructuring called for by the economic reforms. As aresult, intended increases in multisectoral investment sometimes gave way to the concentration of capital resources insectors that offered the possibility of benefits from hightechnology.
21
A seminal event was the initiation of extensive economicreforms in the Soviet Union, analysed in detail in chapterVI. These had major repercussions for the Eastern Europeaneconomic scene. The proposed reforms provided an opportunity for unconventional policies throughout the region andgave impetus to the elaboration of operational formulas. Atthe same time, the short-term need to remedy domestic imbalances and to achieve external equilibrium remainedpressing.
The intended increases in total output in the Europeanplanned economies in 1987 ranged from 2 to 5 per cent, withthe exceptions of Bulgaria and Romania where the targetswere set at 8.5 and 5.7 per cent, respectively. These targetsreflected the adjusted medium-term policy which emphasizes restructuring and institutional reorganization ratherthan rapid growth in the short run. The plans for 1987 assume that industrial output would increase by about the sameproportion as overall output, and that agricultural production would increase by 1 to 2.5 per cent more than in 1986.The weather, however, interfered with these plans, causingagricultural production to grow by only 0.2 per cent in theUSSR and to fall by 3 per cent in Poland and by 4.3 per centin Bulgaria. The failure to meet crop targets adversely affected user industries and, coupled with the limited availability of imports of feedstock, inhibited production in thelivestock sector. Compared to previous years with similarclimatic conditions, the resilience of the agricultural sectorin 1987 appears to have been enhanced by new managerial

Table 11.9. Centrally planned economies: selectedmacro-economic indicators, 1981-1989
(Annual percentage rate ofgrowth)
1981- 1986- 19871985 1990 1985 1986 1988 1989
Actual Planned Actual Actual Planned Actual' Planned Plannedb
Total outputEastern Europe 2.2 4.0' 3.7 4.7 4.7 3.2 4.8 6.1Soviet Union 3.6 4.2' 3.5 4.1 3.9 2.3 5.9 4.9
Industrial outputEastern Europe 2.8 4.4' 4.1 4.7 4.1 3.5 4.1 4.4Soviet Union 3.7 4.6 3.9 4.9 3.8 3.8 4.5 4.6
AgricultureEastern Europe 1.1' 2.7'·d -1.3 5.1' 2.4 -0.6 3.4 2.7Soviet Union 1.1' 2.7' 0.1 5.3 2.2 0.2 5.5 2.7
InvestmentEastern Europe -1.3' 3.4'·d 4.0 2.6' 4.4 3.9 2.0 2.2Soviet Union 3.7' 4.3' 3.0 8.4 5.4 4.7 4.3 1.4
Source: Department ofInternational Economic and Social Affairs of the United Nations Secretariat, based onnational and international sources.
a Preliminary estimates.
b Secretariat estimate of the rate of growth required to attain the five-year target for 1986-1990, adjusted for actualperformance in 1986 and 1987 and the plan for 1988. Forecasts suggest that the rate of growth achieved will belower than this estimate.
c Secretariat estimate.
d Growth over the five-year period relative to the preceding five years on an annual basis.
methods and policies which increased the autonomy and financial independence of farms.
Overall industrial production in the Eastern Europeaneconomies in 1987 grew according to plan, although individual sectors deviated from planned levels. Some sectors ofcrucial importance, such as fuel and energy in Poland andthe USSR, benefited from earlier investment and performednoticeably better than expected. Others-machine-buildingin the USSR in particular-were under stress, striving notonly to meet stringent new quality criteria and technologicalstandards but also to raise the volume of output. These goalswere hard to achieve concurrently: in the Soviet Union, theoutput of machine-tools increased by 4.6 per cent instead ofthe planned 7.3 per cent. In contrast, the high technologysectors in most Eastern European countries, especially electronics and electrical engineering, had a strong performanceand increased their export earnings. None the less, the overall industrial picture continued to be marred by the limitedavailability of energy, the sluggishness of construction andslow progress in the conservation of energy and materialinputs.
Although shortages of energy and material inputs havebecome less of a constraint on growth, the energy situationremains tight in most countries of the area. The output offuel and energy increased by about 3.5 per cent in 1987:production of oil and of gas in the Soviet Union grew fasterthan planned, by 2 and 6 per cent, respectively, and Polishcoal production increased 3.1 per cent, rather than theplanned 0.5 per cent. Nevertheless, the increases in supply
22
were still not large enough to meet the demands imposed bythe severe winter. Progress in reducing the energy and material intensity of production was uneven, apparently due toexcessive reliance on administrative measures and mandatory quotas, as well as to the slow pace of structural change.The persistently high energy intensity ofeconomic growth isbelieved to reflect insufficient progress in economic adjustment and restructuring; further measures intended to remedy this are envisaged.
Investment in 1987 was below that of the previous yearand directed towards the medium-term objective of an indepth modernization programme. The re;l.1ization that industrial modernization cannot be achieved merely throughincreased investment resulted in a more modest approach toinvestment planning in 1987. The average planned rate ofgrowth for 1987 ranged from 0.5 to 1.0 per cent in the German Democratic Republic and Hungary, to targets of 5.4 percent in the USSR, 6.5 per cent in Romania and 8.9 per centin Bulgaria. In some countries, the growth achieved wasonly 0.5 to 1 per cent because of an unanticipated curtailment of imports and a lag in the supplies of machinery andbasic materials. In other countries, capital formation increased more than anticipated, either because reformsopened up additional sources of credit financing and gaveenterprises more leeway in investment decisions or becausea long-delayed drive to renovate and modernize fixed assetsgot under way. The former was the case in Hungary, whereinvestment rose by 6 per cent instead of the 1 per centplanned, mainly because of an increase of 9 per cent in capi-

tal outlays by enterprises and local authorities. In the German Democratic Republic, renovation and modernizationresulted in investment growth of 6 per cent in 1987, following a 5.3 per cent increase in 1986; the 1987 figure was thehighest since the mid-1970s.
Consumption and changing price policies
Public and private consumption and the related question ofstreamlining the price system to reflect existing scarcitiesloom large in economic policy in the centrally planned economies. The desire for reform gave a new impetus to bothdebate and actions in these areas in 1987. Open popular discussions and the growing transparency of policy-makinghave led to the formulation of feasible and realistic compromises.
Pricing policy is aimed at balancing supply and demand inconsumer markets. The instruments for dealing with thisproblem vary among countries, but three different approaches towards pricing can be identified. 6 countries whichhave targeted· comparatively rapid reform implement retailprice increases (usually in conjunction with monetary compensation to consumers) in order to reduce subsidies and tomake price signals to producers and consumers more meaningful. Countries with a more reserved attitude towards therole of prices in economic management focus on adjustments in wholesale prices and usually prevent such changesfrom influencing retail prices. In a third group of countries,the emphasis is on price stability.
In addition to the need to rationalize prices and price setting, there is a need to make rational trade-offs between consumption and investment. Price policies are supported bymeasures aimed at containing inflationary pressure by imposing budgetary constraints on enterprises so that their future over the long term will depend on their efficiency. Industrial restructuring intended to increase competition andreduce monopolistic practices will assist in creating a priceenvironment that will lead to increased efficiency.
Hungary and Poland provide examples of pronounced reliance on price policy at different macro-economic levels. Inother countries, the focus is not directly on retail prices buton adjusting prices for material and energy inputs. Whenincreases in retail prices are introduced, as in Hungary in1987 and in Poland at the beginning of 1988, Governmentstry to mitigate the impact on consumers by providing directsubsidies to the most affected groups of the population tomaintain their living standards. The adjustment and elimination of subsidies to retail prices is being discussed in theUSSR, but the situation seems to be such that these ideas areunlikely to be translated into action in the near future.
The general objective of all price reforms is to widen thesphere of free contractual prices, but the extent to which thishas occurred varies considerably among countries. In Hungary, the aim is to increase the proportion of free market
prices at the retail level from 10 per cent of agriculturalproducts in 1987 to 50 per cent in 1988. The same broadtarget applies in Poland. Another important objective is togear wage increases to the growth in productivity.
In the Eastern European countries with a problem of external indebtedness (see chap. IV below), the need to maintain external balance has become a growing influence onpricing policy. In some cases, steps to limit the absolute levelof consumption have been taken. In Hungary, for example,there was a drop of about 2 per cent in personal consumptionin 1987.
Foreign trade and payments
As in previous years, the majority of the Eastern European countries are placing high priority on rectifying external imbalances, especially with developed market economies. None the less, the policies of export promotion, import restraint and limited domestic absorption that enabledthese countries to start amortizing their external debt duringthe period 1982-1985 were not applied as forcefully in 1986and 1987. The more relaxed approach to import control,which coincided with the depreciation of the United Statesdollar, resulted in more foreign borrowing and renewedgrowth in external indebtedness. However, the situation appears to be under control and the international credit-worthiness of the European planned economies has been maintained. Their external financial standing in the immediatefuture will depend on whether fears of an economic slowdown and rising protectionism in the market economies arerealized. To prepare themselves for the possibility of such achange in the global environment, to improve their externaleconomic position and to improve their bargaining strength,the European planned economies intend to invigorate theirown regional market.
The foreign trade of the European planned economies in1987 had some notable characteristics: demand for their exports weakened in developed market and developing economies; terms of trade deteriorated for the USSR7 and improved slightly for Eastern Europe; energy imports increased due to a severe winter; and demand for agriculturalimports fell. The cumulative effect was to undermine effortsto increase the trade surplus which, nevertheless, grew to$16.4 billion from $10.1 billion in 1986. Part of this improvement was accounted for by the depreciation of theUnited States dollar, but the biggest contribution to the overall increase was the estimated 17 per cent growth in the dollar value of USSR exports to the developed market and developing economies. Eastern Europe's surplus with thesepartners decreased.
After the increase in external indebtedness in 1986, European planned economies were more cautious in their international borrowing in 1987. However, the net indebtednessof the group grew in dollar terms, as the result ofthe bookkeeping translation of non-dollar liabilities into dollars.
6 A more extensive discussion of pricing policy is contained in chapter VI.7 This decline was partially attributable to the fact that the increase, in dollars, in the world market price for oil, the major export of the USSR,
was offset by the fall in the value of the dollar.
23

Short-term outlook for the world economy
The early months of 1988 have passed uneventfully andeconomic indicators, particularly output, have shown morestrength than expected. Forecasts must be treated with morethan the usual degree of caution. Under present conditions,growth in the developed market economy countries is expected to slow in 1988 and to continue to do so in 1989.Improved policy co-ordination and appropriate domesticpolicy measures could smooth the downturn (see box ILl),but are unlikely to eliminate it. The centrally planned economies, on the other hand, are expected to follow the oppositepattern; China, while continuing its rapid growth, seems unlikely to be able to maintain its 1987 pace. The developingcountries are expected to accelerate their growth slightly andto exert a moderating influence on the year-to-year fluctuations in world output.
Policy assumptions in the forecast
The forecasts for the growth of world output in table II.lare based on the following assumptions. Among the developed market economies, it is assumed that there will be an exante reduction in the United States federal government deficit of $40 billion in 1989 and somewhat less in subsequentyears. However, the forecast slow-down in growth in 1989will reduce tax receipts, so that there will be little ex postreduction in the deficit. Monetary policy in the United Statesis expected to be tightened somewhat, leading to an increase
in interest rates of half a percentage point in 1989. In theFederal Republic of Germany, it is assumed that the secondphase of the reductions in income tax scheduled for 1990will be implemented. For Japan, the assumption is that the1987 decision to stimulate domestic demand will be continued and will include an income tax reduction in the secondhalf of 1988. In the remaining developed market economies,no major changes in either fiscal or monetary policy havebeen assumed.
In the developing countries, it is assumed that those withexternal debt problems will continue to exercise budgetaryand monetary restraint, sometimes accompanied by importrestrictions, in order to contain import demand and, in somecountries, reduce inflation. The few developing countrieswith current account surpluses are expected to liberalizetheir import regimes and allow their currencies to appreciate. The centrally planned economies of Eastern Europe areexpected to increase investment and to proceed with theirother announced economic reforms.
International trade and prices of primary commodities
It has been assumed that the OPEC average export price ofoil will be $16.50 a barrel in 1988 and will increase in nominal terms by 3 to 4 per cent in 1989 in line with world inflation. Non-oil commodity prices are expected to be approxi-
Box II .1. The consequences ofmore expansionary policies
The most important characteristic of the baseline forecastpresented in this chapter is the anticipated slow-down in demand, particularly of private consumers, in the developedmarket economies. The forecast assumes that there will belittle change in present fiscal or monetary policies to offsetthis slowing of demand; to the contrary, it is assumed that theUnited States Government will make an ex ante cut in thefederal deficit, thereby aggravating the overall decrease indemand.
The following alternative scenario is based on a packageof monetary and fiscal measures intended to moderate theslow-down in world economic output projected for 1989 inthe baseline forecast. The scenario assumes that the UnitedStates will relax monetary policy in 1989 in order to offsetthe deflationary impact of its restrictive fiscal measures. Inthe absence of policy co-ordination, this relaxation of monetary policy would tend to cause further dollar depreciation,to increase United States' net exports at the expense of itsmajor trading partners, and thus to lower their GDP. To offset this impact, it has been assumed that the Federal Republic of Germany, Italy, Japan and the United Kingdom wouldintroduce additional stimulatory measures.
The results of such policies would be a cumulative increase in world output over a three-year period of 0.6 per
24
cent (see table). Two thirds of the increase would occur inthe first year, raising the growth rate of global GDP by 0.4per cent and eliminating the slow-down projected in the baseline forecast. The timing ofthe additional stimulus to coincide with the forecast weakening of economic activity wouldcause the rate of inflation to be only 0.2 per cent higher by1991. Unemployment in the developed market economycountries would decline by 0.4 per cent but not until 1990,reflecting a lagged response to the 1989 stimulus. The impact would vary considerably among regions: the cumulative increases in output over the three-year period of theEEC countries and Japan would be more than twice that ofthe United States; the developing countries would gain onlyone tenth of a percentage point in GDP because of the assumed continuation of stringent adjustment policies.
The rate of growth in world trade would increase by 0.5per cent in the first year and by 1.1 per cent over a three-yearperiod; developing countries' exports would increase byseven tenths of a percentage point and their imports by onlyone tenth of a percentage point, with the resulting improvement in trade balances permitting a net addition to reservesand a reduction in net debt. A similar pattern would resultfor the centrally planned economies of Eastern Europe andChina.
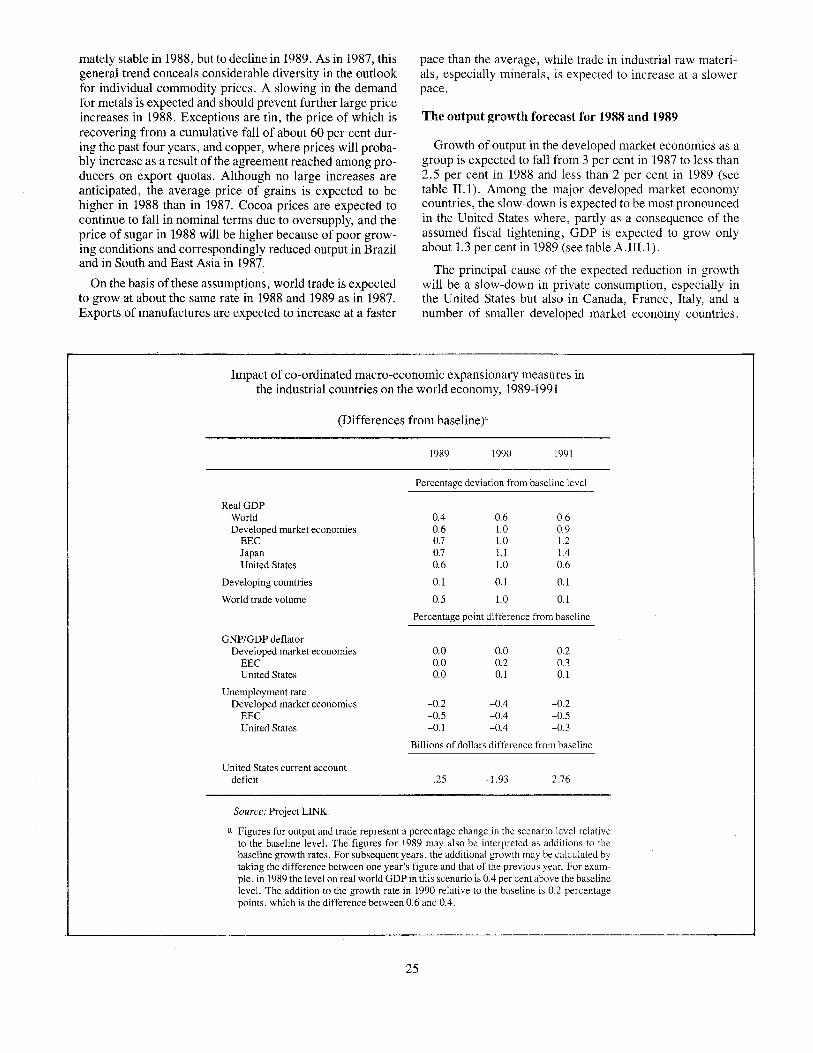
mately stable in 1988, but to decline in 1989. As in 1987, thisgeneral trend conceals considerable diversity in the outlookfor individual commodity prices. A slowing in the demandfor metals is expected and should prevent further large priceincreases in 1988. Exceptions are tin, the price of which isrecovering from a cumulative fall of about 60 per cent during the past four years, and copper, where prices will probably increase as a result of the agreement reached among producers on export quotas. Although no large increases areanticipated, the average price of grains is expected to behigher in 1988 than in 1987. Cocoa prices are expected tocontinue to fall in nominal terms due to oversupply, and theprice of sugar in 1988 will be higher because of poor growing conditions and correspondingly reduced output in Braziland in South and East Asia in 1987.
On the basis ofthese assumptions, world trade is expectedto grow at about the same rate in 1988 and 1989 as in 1987.Exports of manufactures are expected to increase at a faster
pace than the average, while trade in industrial raw materials, especially minerals, is expected to increase at a slowerpace.
The output growth forecast for 1988 and 1989
Growth of output in the developed market economies as agroup is expected to fall from 3 per cent in 1987 to less than2.5 per cent in 1988 and less than 2 per cent in 1989 (seetable 11.1). Among the major developed market economycountries, the slow-down is expected to be most pronouncedin the United States where, partly as a consequence of theassumed fiscal tightening, GDP is expected to grow onlyabout 1.3 per cent in 1989 (see table A.III.l).
The principal cause of the expected reduction in growthwill be a slow-down in private consumption, especially inthe United States but also in Canada, France, Italy, and anumber of smaller developed market economy countries.
Impact of co-ordinated macro-economic expansionary measures inthe industrial countries on the world economy, 1989-1991
(Differences from baseline)'
1989 1990 1991
0.4 0.6 0.60.6 1.0 0.90.7 1.0 1.20.7 1.1 1.40.6 1.0 0.6
0.1 0.1 0.1
0.5 1.0 0.1
0.0 0.0 0.20.0 0.2 0.30.0 0.1 0.1
-0.2 -0.4 -0.2-0.5 -0.4 -0.5-0.1 -0.4 -0.3
Percentage deviation from baseline level
RealGDPWorldDeveloped market economies
EECJapanUnited States
Developing countries
World trade volume
Percentage point difference from baseline
GNP/GDP deflatorDeveloped market economies
EECUnited States
Unemployment rateDeveloped market economies
EECUnited States
Billions of dollars difference from baseline
United States current accountdeficit .25 -1.93 -2.76
Source: Project LINK.
a Figures for output and trade represent a percentage change in the scenario level relativeto the baseline level. The figures for 1989 may also be interpreted as additions to thebaseline growth rates. For subsequent years, the additional growth may be calculated bytaking the difference between one year's figure and that of the previous year. For example, in 1989 the level on real world GDP in this scenario is 0.4 per cent above the baselinelevel. The addition to the growth rate in 1990 relative to the baseline is 0.2 percentagepoints, which is the difference between 0.6 and 0.4.
25

Any tightening of monetary policy in response to fears ofresurgent inflation would only reinforce this trend. There isexpected to be little, if any, growth of private residentialconstruction; inventory accumulation is also likely to cometo an end. Private investment in real terms is expected to fallsomewhat in 1988 and more noticeably in 1989.
These trends in domestic demand are expected to be offsetby a slight improvement in the net exports of the major developed market economies. A higher volume of exports andreduced demand for imports will contribute to growth in theUnited States in both 1988 and 1989, but will come mainly atthe expense of other developed market economies, so thatthe contribution of the external sector to the growth of thegroup is expected to be slight.
The general slow-down in the developed market economies is expected to end the decline in unemployment rates ofthe past four years: the average unemployment rate is expected to remain at its 1987 level in 1988 and to increaseslightly in 1989 (see table IUO). The rate of inflation is expected to increase by less than half a percentage point in both1988 and. 1989, and should remain below 5 per cent, thusproviding scope for some relaxation of either monetary orfiscal policy.
Table n.lO. Developed market economies: short-term outlook for inflation and unemployment rates,1987-1989
1987" 1988 1989
GDP/GNP deflator (annual percentage)All developed market economies 3.6 4.0 4.3
Western Europe 4.2 3.9 3.7Japan 0.9 1.5 2.0North America 3.0 4.1 4.6
Unemployment rate (percentage)All developed market economies 8.0 7.9 8.0
Western Europe 10.8 10.8 10.9Japan 2.8 3.0 3.2North America 6.2 6.0 6.5
Source: Department of International Economic and Social Affairs ofthe United Nations Secretariat, based on projections of Project LINK and other national and international sources.
a Preliminary estimates.
International capital markets will continue to be dominated by the large capital flows which are the counterpart ofthe current account imbalances among the developed marketeconomy countries. These imbalances will persist, but areforecast to decline; the improved export performance of theUnited States and the effect of the slow-down in 1989 on itsimports are expected to reduce that country's current account deficit by about $30 billion over the two-year period1988-1989. This would be consistent with a further depreciation of the United States dollar against the currencies of itsmajor trading partners of about 5 per cent by the end of 1988and declines of 2 to 3 per cent per year thereafter.
The rise in interest rates anticipated in the United States in1988 is expected to be accompanied by declines in other de-
26
veloped market economy countries. In 1989, however, interest rates are expected to increase throughout the developed market economies to a higher average level than in1987. Widening the interest rate differential in favour of theUnited States should ensure the inflow of the external capitalrequired to finance that country's expected current accountdeficits in 1988 and 1989 andshould reduce currency fluctuations.
Little improvement is expected in international capitalflows to developing countries. Net lending by the privatesector is expected to be virtually zero, with gross borrowingapproximately equal to debt repayments. Net borrowing bythese countries from official lenders (including the International Monetary Fund) is expected to remain roughly at 1987levels.
These unfavourable prospects for capital flows to developing countries are expected to be compounded by the weakening of world demand for their exports. With these predominant influences on the pattern of growth remaining fundamentally unchanged, the divergence in rates of growthamong the developing countries is unlikely to be attenuatedin the forecast period.
Growth in Africa in 1988 is expected to accelerate as aresult of more normal weather conditions and improved agricultural production incentives. It will nevertheless continue to be below the rate of growth of population in theregion. Growth in 1989 could approach a more acceptablelevel of 3 per cent if there are favourable weather conditions,stable exports of petroleum products and an increased donorresponse to the call for additional net capital inflows. Thiswould halt the persistent decline in per capita incomes in theregion.
The absence of a major advance in the present international debt strategy will severely restrict Latin America'sprospects for the foreseeable future. In the near term, theexpected slow-down in the United States economy, particUlarly its decreased import demand, will reduce Latin America's export opportunities and further aggravate its net transfer problem; the anticipated rise in interest rates in 1989would worsen the position further. Expectations are for adecline in the rate of growth of the region to about 1.5 percent annually over the next two years, resulting in a declining per capita income for the last two years ofthe decade.
Prospects are more favourable in South and East Asia.Slower growth of exports of manufactures is expected todull the recent exceptional rates of growth, but they will stillexceed 5 per cent annually. Contraction of oil output in 1987and decreases in government expenditures in response tofalling oil prices caused GDP in Western Asia to declinefrom 1984 until 1987. Amelioration of these factors in 1988and 1989 is expected to result in growth averaging about 3per cent annually in 1988 and 1989.
The Soviet Union annual plan for 1988 aims at a 4.1 percent growth in net material product over the planned levelfor 1987. Since the result achieved in 1987 was lower thanthe planned target (2.3 per cent versus 3.9 per cent), thegrowth rate implicitly envisaged for 1988 is 5.9 per cent.However, official statements and other sources suggest that

4.1 per cent is considered a feasible growth target. This forecast may appear ambitious in the light of the low growth in1987, but incorporates the expectation that economic reformwill bring about improvements in efficiency and productivity and a better trade balance.
As for 1989, the tentative growth target in the five-yearplan for 1986-1990 was set at 4.2 per cent for NMP utilized,or approximately 4.6 per cent growth in NMP produced.Under present circumstances, this target appears ambitiousand growth in the neighbourhood of 4 per cent seems a morelikely outcome.
For the centrally planned economies of Eastern Europe,official plans aim at an average of 4.8 per cent growth in1988 and the five-year plans adopted in 1985 envisage anincrease in NMP of about 5.2 per cent in 1989. However,planned growth rates have been higher than the ratesachieved in recent years, and the possibility of increasedexternal constraints suggest growth in the region of 3.8 percent and 3.5 per cent in 1988 and 1989, respectively.
In China, moderation in economic expansion is the objective of economic policy and the Government is expected torestrain domestic demand, especially fixed capital investment, because of emerging pressure on both the governmentbudget and on the current account of the balance of payments. As a result, growth is expected to moderate to 8 percent in 1988 and 7.5 per cent in 1989.
This forecast for the world economy suggests that, witheconomic policies being maintained broadly as currently envisaged, growth will slow in the next two years, but its underlying pattern will not change. Moreover, the problems ofthe external imbalances among the developed market economies and the indebtedness of many developing countries willremain largely unresolved. The financial situation will re-
27
main fragile and this fragility will continue to be a source ofdownward risk in the forecast. On the other hand, despitethe instability in the financial sphere in the past six months orso, production has maintained a significant momentum indeveloped market economies. If the confidence of consumers and investors remains unaffected in the near future,growth in 1988 and 1989 could exceed the forecast by half apercentage point in each of the major developed marketeconomies. This should also require slight upward revisionin the forecasts of developing countries and centrallyplanned economies. The question arises as to whether policychanges could improve on this performance.
A simulation scenario based on more stimulatory policieson the part of the three major developed market economies(see box ILl) suggests that it is possible to avert the slowdown in the world economy with only a modest increase ininflation, but that this would produce very limited progressin resolving the problems of the imbalances and externaldebt. These will therefore continue to pose a threat to theworld economy, The imbalances among the developed market economies present potentially the larger problem. A decreased willingness to finance them could have adverse consequences for developed and developing countries alike.However, the imbalances may continue to be financed to theextent required and without serious disruption to international markets.
Such is not the case with the developing countries' problem of external indebtedness. Measures adopted by creditors and others have reduced the threat that this poses for theinternational financial system but have not yet reduced itsconstraining impact ofdebtor countries. Under such circumstances, even an acceleration of growth in the developedmarket economies would fail to elicit much of an improvement in growth in the developing countries.


Ch.apter III
INTERNATIONAL TRADE
Overview: an improvement in the growth of world trade in 1987-1988
World trade was somewhat more buoyant in 1987 than ithas been so far in the 1980s, with the exception of 1984. Itgrew faster than expected! and, in comparison with the trendof the 1980s, substantially exceeded the growth of worldincome. The improvement, however, still leaves it below thegrowth rates attained in the 1960s and 1970s and does notappear to be the beginning of a significant alteration of therecent trend. The growth and pattern of world trade continued to be dominated by sharp changes in currency values,trade imbalances between the major developed market economies and the debt burden of the developing countries. Thetrading system remains under severe strain. Prices of primary commodities have shown some improvement, enhancing the impOl;t capacity of some commodity producers, butthis has, on the average, been more than offset by a largeincrease in the prices of manufactures, and a significant improvement in their purchasing power is not in sight.
Yet there are indications that the rate of increase of worldexports in 1988 will remain well above the average for the1980s. International trade dynamics will continue to be fuelled by changes in comparative advantage, by the selectiveremoval of restrictions in many developed and developingcountries and by import-enhancing macro-economic measures in several economies that have large current-accountsurpluses.
The volume of world trade increased by just over 4 percent in 1987 after a 4.5 per cent increase in 1986 (see tableIlL 1). The increase was actually more robust than this figuresuggests. The growth in world exports in 1986 was largelydue to an increase in oil trade, which accounted for approximately a third of the increase in total world exports. Thevolume ofimports ofoil by the developed market economiesincreased by almost 11 per cent during the year, comparedwith a decline of about 3 per cent over the preceding fiveyears. As the volume of trade in oil changed little in 1987,the 4 per cent growth was mostly accounted for by non-oiltrade and was thus a noticeable improvement on its growthin 1986. Nevertheless, the growth of trade in 1987 was closeto the average rate of growth in the 1980s and below the 5per cent for the 1970s. Projections even for the short runhave become more than usually difficult in the present unstable circumstances. A likely scenario is that in 1988 worldtrade will grow marginally faster than in 1987, but slip backto just under 4 per cent in 1989.
Trade in non-fuel commodities accelerated in 1987. Agricultural exports increased by an estimated 4 per cent, muchhigher than the average of 1.5 per cent for the 1980s. World
exports of manufactures showed a marked recovery, growing by about 5 per cent after a 3.5 per cent increase in 1986.
The value of world trade rose by around 15 per cent indollar terms, partly reflecting the further fall of the dollar in1987. The value of world exports, which had reached $2.1trillion in 1986, increased to around $2.4 trillion in 1987.The divergent rates of changes in trade volume and pricesfor the different country groups led to changes in their shareof world trade, which continued the trend of the 1980s. Theshare of the developed market economies increased from 63per cent in 1980 to 71 per cent in 1987, while that of thedeveloping countries declined from 28 per cent to 19 percent, mainly because of a sharp fall in commodity prices.The centrally planned economies accounted for 10 per centofworld exports in 1981 and the proportion remained practically constant throughout the 1980s (see table III.1).
An increase in the imports of developed market economies was the major factor behind the growth of world tradein 1987 (see table IIL2). Total imports of these economiesincreased by over 5 per cent. Their exports also picked upafter weak growth in 1986. The expansion of exports of themain deficit country, the United States, was stronger thanexpected in some of the more pessimistic scenarios and imports of Japan, the largest surplus country, also increasedfast. Trade among developed market economies increasedfaster than world trade.
Despite the expansion of exports of the United States andimports of the main surplus countries, the trade imbalancesbetween the major developed market economies remainedvery large. The apparent failure of the sharp depreciation ofthe dollar against all other major currencies to bring aboutthe expected correction in these imbalances dominated thethinking on trade policy in 1987. It also further increased thethreat of protectionism in international trade. By early 1988,however, there was clear evidence that trade imbalances hadbegun to shrink even in dollar terms, following the reductionin real terms that had started earlier.
The expansion of trad~ in 1987 also owed much to theincrease in non-fuel exports of the developing countries.Much of this increase came from the exports of manufactures of the newly industrializing countries. On the otherhand, the continuing decline in the imports of the energyexporting developing countries remained a drag on thegrowth of world trade. A substantial increase in oil prices in1987 was partly offset by an increase in the prices ofmanufactured imports of these countries. This, combined
Major multilateral organizations revised their estimation of growth of the volume of world trade by at least 0.5 percentage points. The latestGECD estimate, for example, puts it at 3.75 compared with 2.25 projected earlier (GECD, Economic Outlook, June 1987 and December 1987).IMF raised its estimate from 3.3 to 4.7 per cent (IMF, World Economic Outlook, April 1987 and April 1988). The World Economic Survey 1987(United Nations publication, Sales No. E.87.I1.C.I and corrigendum) projected a growth rate of 3.0 per cent.
29

Table III. I. World trade, 1980-1987
1980 1981 1982 1983 1984 1985 1986 1987"
Value of world exports(billions of dollars) 1998 1972 1 830 1 808 I 902 1927 2 115 2431
Developed marketeconomies 1252 1228 1 151 1 148 1221 1266 1468 1727
(0.63) (0.62) (0.63) (0.63) (0.64) (0.66) (0.69) (0.71)
Developingcountries 569 562 490 457 477 457 422 455
(0.28) (0.28) (0.27) (0.25) (0.25) (0.24) (0.20) (0.19)
Centrally plannedeconomies 177 182 190 203 205 203 225 247
(0.09) (0.10) (0.10) (0.11) (0.11) (0.11) (0.11) (0.10)
Volume of world exports(annual percentagechanges) 1.0 -2.4 3.1 7.6 3.0 4.5 4.1
Source: United Nations, Monthly Bulletin ofStatistics, December 1986 and March 1988. Rates of growth of volumeare estimates of the Department ofInternational Economic and Social Affairs of the United Nations Secretariat.
Note: Figures in parentheses are shares of the country group in total trade.
a Preliminary estimates.
with the lagged effects of the precipitous decline in oil pricesin 1986, led to a further decline in the imports of these countries in real terms.
The expansion of trade in 1987 also owed much to theincrease in non-fuel exports of the developing countries.Much of this increase came from the exports of manufactures of the newly industrializing countries. On the otherhand, the continuing decline in the imports of the energyexporting developing countries remained a drag on thegrowth of world trade. A substantial increase in oil prices in1987 was partly offset by an increase in the prices of manufactured imports ofthese countries. This, combined with thelagged effects of the precipitous decline in oil prices in 1986,led to a further decline in the imports of these countries inreal terms.
A further factor constraining the growth of world tradewas the unresolved problem of the external debt of the developing countries. The heavily indebted countries continued to restrict their imports in order to service their externaldebt. There is little reason to expect that the import capacityof these countries and of energy exporters will improve
greatly in the immediate future, which will keep the growthof world trade well below its potential.
Many commodity prices increased in 1987, some signifi.cantly, but a decline in the prices of tropical beverages depressed the overall index of non-fuel commodity prices. Theimprovement in commodity prices was, moreover, morethan offset by a substantial increase in the prices of manufactures. The real prices of commodities (in terms of prices ofmanufactures) declined on the average for the fourth year inarow.
The changes in the terms of trade in 1987, resulting fromthese price movements, were modest in comparison withthose in 1986 (see table m.2). For the developing countriesas a whole, the terms of trade improved somewhat, mainlybecause of a large improvement for energy exporters. Fornet energy-importing countries, the terms of trade declinedfurther in 1987, continuing the unbroken downward trend ofthe 1980s. The large gain for the developed market economies in 1986 was followed by a further modest improvementin 1987, while the terms of trade of the centrally plannedeconomies remained practically unchanged after a sharp deterioration in 1986.
The trading system: the need for action
The maintenance of the open trading system assumes special importance in a period of slow growth and large imbalances and uncertainties in the international economy because any weakening of the system is likely to make theseproblems worse. A highly restrictive trading system aggravated the depression of the 1930s. In an environment of slowworld economic growth in the mid- and late 1980s, the multilateral trading system remained under severe strain. Although some steps were taken at the international level to
30
strengthen the system, various national policies cdntinued toundermine it. The trend towards bilateralism and quantitative restrictions, the two major threats to the system, continued unabated and international commitments to roll backprotectionism, or at least stem its tide, were not followed up.Macro-economic imbalances in developed market economies and great instability of exchange rates have furthercontributed to the weakening of the trading system.

Table m.2. World trade: annual rates of change involume and prices, 1976-1988
(Percentage)
1976- 1981-1980 1987 1985 1986 1987" 1988b
Volume of exports
World 5.1 2.6 2.8 4.5 4.1 4.3Developed market economies 6.6 3.2 4.5 2.6 4.0 4.5Developing countries 1.9 1.0 -0.8 10.3 5.7 5.5
Capital-surplus countries -1.6 -9.0 -10.0 16.0 -0.9 2.1Other net energy-exporters 2.1 0.9 -4.8 11.0 -0.7 3.5Net energy-importers 7.4 8.3 5.5 7.7 10.0 7.6
Centrally planned economies 5.7 3.5 -0.9 5.0 3.1 2.6China 14.2 8.8 18.4 27.0 10.0
Volume of importsWorld 5.5 3.2 3.1 4.2 4.0 4.2Developed market economies 5.6 4.3 5.3 8.0 5.1 4.2Developing countries 5.5 -0.3 -4.7 -6.3 2.0 5.4
Capital-surplus countries 11.4 -6.3 -19.1 -23.8 -12.5 0.3Other net energy-exporters 6.1 -4.4 -4.7 -20.5 -8.1 1.2Net energy-importers 3.8 2.6 0.1 2.0 7.5 7.3
Centrally planned economies 4.8 1.8 5.3 -0.6 -0.8 2.8China 9.3 58.2 -14.5 -8.4 4.1
Unit value of exports
World 12.2 0.5 -1.8 6.6 11.4 7.0Developed market economies 9.8 1.4 -1.0 14.8 12.0 8.0Developing countries 19.0 -2.5 -4.2 -14.4 12.9 4.3
Capital-surplus countries 23.5 -3.6 -2.2 -32.4 21.9 3.9Other net energy-exporters 20.9 -3.4 -3.6 -25.5 16.0 3.3Net energy-importers 11.2 -1.7 -4.6 0.3 7.9 4.0
Centrally planned economies 8.7 1.0 -1.5 5.9 8.1 0.8China -2.9 -3.8 -4.6 0.6 4.1
Unit value of imports
World 11.7 -0.3 -2.0 6.2 9.1 6.1Developed market economies 12.1 -0.5 -2.0 5.9 9.6 8.3Developing countries 12.5 0.5 -1.7 6.2 1l.6 5.8
Capital-surplus countries 10.8 0.7 -1.7 11.0 10.5 7.2Other net energy-exporters Il.l 0.7 -1.6 8.6 11.3 7.3Net energy-importers 13.4 0.4 -1.8 4.3 12.0 5.2
Centrally planned economies 6.8 1.5 -1.4 11.5 8.4 0.6China 0.7 -1.7 18.8 9.9 4.4
Terms of tradeDeveloped market economies -2.1 1.9 1.0 8.0 2.1 -0.3Developing countries 5.8 -3.0 -2.5 -19.5 1.2 -1.7
Capital-surplus countries 11.5 -4.3 -0.5 -39.1 10.4 -3.1Other net energy-exporters 8.8 -4.0 -2.0 -31.4 4.3 -·3.6Net energy-importers -2.0 -2.1 -2.9 -3.9 -3.7 -1.1
Centrally planned economies 1.7 -0.6 -0.1 -5.0 -0.3 0.2China -3.6 -2.1 -19.7 -8.5 0.0
Source: Department of International Economic and Social Affairs of the United Nations Secretariat.Note: The large difference between world unit values of exports and imports in 1987 is partly due to incomplete informa-tion and different definitions among countries.
a Preliminary estimates.
b Forecast.
31

a Excluding restrictions under MFA.
Non-tariff barriers to trade
Source: GATT, "Developments in the trading system" (L/6087, L/6205and L/6289)
Table III.3. Number of export restraint arrangements in operation a
The table also shows the distribution of the frequency ofquantitative barriers by country and commodity groups. Developing countries make more extensive use of restrictionson trade than the developed market economy countries:about 40 per cent of the commodities traded are subject torestrictions by the developing countries, compared witharound 20 per cent for the developed countries. The proportion of agricultural commodities facing barriers is muchlarger than that of manufactures in both groups of countries.
In terms of value, too, the proportion of trade affected bynon-tariff measures is large. In 1986, around 20 per cent ofthe total value of imports of the developed market economies (23 per cent for non-fuel imports) was subject to suchrestrictions. 4 There is also evidence that the proportion ofnon-fuel tradeaffected by quantitative restrictions has beenincreasing during the 1980s.5
There were many different reasons behind the impositionof the various quantitative barriers to trade, as shown by theGATT provisions invoked to justify them. Many of the restrictive measures used by the developing countries havebeen taken under article XVIII of the Agreement, by whichthese countries are permitted to take such measures to protect their balance of payments. This provision was made inrecognition of the special needs of the developing countriesto increase imports for the purpose of economic development. Trade restrictions imposed by the developed countriesfor balance-of-payments purposes are now rare. Emergencymeasures to protect domestic industry from surges in imports have often been taken by the developed market economies under article XIX. Action under this article has oftenhad a large impact on individual imports, but it has beenused less frequently than other measures in recent years.Article XI prohibits quantitative restrictions, but many ofthe measures have been taken under exceptions to the articlewhich permit, among others, measures to protect domesticagriculture. By far the largest number of restrictive actionshave, however, been taken under the general exceptions toGATT rules allowed under article XX, many of which arebased on non-economic considerations. For many other re-
country exports. Restrictions on the more traditional exports of the developing countries remain numerous, however, and have tended to intensify. There were about 70 bilateral agreements under MFA between developing countries and the European Economic Community (EEC) and theUnited States and about 25 outside it.3
The use of the various forms of non-tariffbarriers to tradeis more pervasive than suggested by the figures above. Examined at a disaggregated level of commodity classification,a large proportion of commodities traded internationally isfound to be affected by non-tariff barriers of one kind oranother. As table IlIA shows, over 30 per cent of all commodities traded were subject to quantitative restrictions inthe 1980s.
April-Seprember1987
135118
October 1986-March1987
April-September1986
93
Of the 135 export restraint arrangements in operation in1987, 64 were directed against developing countries, 51against developed market economy countries and 20 againstthe centrally planned economies. Most of the restrictions ondeveloping country exports were directed against the newlyindustrializing countries, of which the Republic of Koreafaced by far the largest number (23). Japan faced the largestnumber (24) among the developed market economies.
Since the 1970s, quantitative restrictions have beenspreading to sectors other than those traditionally associatedwith labour-intensive developing country exports. In 1987,known export restraints on steel and steel products (38), machine tools (7), motor vehicles (19) and electronics (11), accounted for more than half of the total. Almost half of therestrictions in steel and electronics were on developing
After three decades of negotiated reduction of tariffs, international trade is now impeded mainly by quantitative restrictions. These restrictions have taken many forms,' ranging from bans on imports to surveillance and monitoring ofprices and volumes of imports. Some of the restrictions areoutright violations of the rules of the General Agreement onTariffs and Trade (GATT), which prohibit quantitative restrictions in general, or are "grey area" measures, such as"voluntary" export restraints, which circumvent the rules.Many of the restrictions are in areas which have been keptoutside the purview of GATT rules, such as the MultifibreArrangement (MFA), while others are practised under exceptions to the rules, such as emergency import restrictionmeasures necessitated by threats to domestic industry. Together, they constitute a formidable tangle of barriers to international trade.
Even excluding those quantitative restrictions which arepermitted under exceptions to GATT rules, the use of nontariff barriers to trade is extensive and appears to be on theincrease. GATT was notified, or knew, of 135 major exportrestraint arrangements of various types in operation in 1987.Such restraints have become more numerous in recent years(see table III.3).
2 GATT lists 33 types of quantitative restrictions in existence (see GATT, Group on Quantitative Restrictions and other Non-Tariff Measures,'?\nalysis of the Group's Documentation: note by the secretariat" (NTM/WI17)), 1 September 1986.
3 GATT, "Developments in the trading system, April 1987-September 1987" (1/6289), p. 24.4 UN!2TAD," Problems of protectionism and structural adjustment" (TD/B/1126/Add.1), 22 January 1987.5 Ibid. This refers to imports of developed market economies only.
32

Table IlIA. Extent of quantitative restrictions in internationaltrade in the 1980s
All commodities'
Agriculturalcommodities
Manufactures
Number of restrictions Proportion of commoditiesper country affected by restrictions
Developed Develop- All Developed Develop- Allmarket ing coun- market ing coun-economies countries tries economies countries tries
170 355 290 0.19 0.38 0.32
47 100 77 0.29 0.61 0.47
115 243 213 0.15 0.32 0.28
Source: Department of International Economic and Social Affairs of the United Nations Secretariat, based on data from GATT, Group of Quantitative Restrictions and Other Non-Tariff Measures, '~nalysis of the Group's documentation: note by the secretariat" (NTM/W117, I September 1986).
a Including minerals and precious stones.
strictions there is no clear justification under GATT rules. 6
Indeed, measures circumventing GATT rules include someof the major trade restrictions imposed by developed marketeconomies and protect some of the largest industries (textiles, steel, transport equipment and electronics) in thesecountries.
The multiplicity of restrictions makes it likely that, at thenational level, they sometimes work at cross purposes.There is rarely any examination of the consistency of theobjectives that the various trade barriers are intended toserve. Even for specific measures, the rationale of trade barriers and the form they take only rarely come under closescrutiny. Examination of the grounds for protecting declining industries in terms of the costs and benefits for the national economy is not very common. Similarly, while theremay be justification for national measures to protect the balance of payments, quantitative restrictions may not be thebest way to do so, especially in a regime of flexible exchange rates. 7 The great variety of trade barriers erected bynational authorities has tended to weaken the multilateraltrading system.
Some recent developments
Although trade tension appears to have lessened comparedwith a year ago, frictions continue and there have been anumber of disappointing developments and setbacks in recent months. Many of these frictions arise out of an increased concern with bilateral trade balances, while othershave their origin in deep-seated issues of structural change. 8
Expectations have been raised by the renewed interest inthe major developed market economies in the liberalizationof trade in agriculture. The large cost of protecting agriculture in industrial countries has been the subject of numerous
studies. A major study conducted by the Organisation forEconomic Co-operation and Development (DECD) in 1987estimated these costs and emphasized the need for urgentaction. 9 A number of proposals have been made to reformtrade in agriculture, including proposals submitted in multilateral negotiating groups under the Uruguay Round. Littleprogress towards an agreement has, however, been made.The Common Agricultural Policy (CAP) of EEC is widelyrecognized as one of the prime examples of protection toagriculture and in need of major reform. The EEC Ministersof Agriculture have initiated a move for reforms, includingcuts in milk output and reduction of support prices of beef,but little action has so far been taken. The EEC summitmeeting in February 1988 agreed, however, on measures tolimit production ofcereals and oilseeds and set limits to agricultural spending as part of a package to control Communityspending. The United States has initiated changes in its farmprogramme, under the Food Security Act 1985, whichwould cut government support to agriculture, but providefor subsidies to agricultural exports. In July 1987, theUnited States increased the funding of its Export Enhancement Program, which subsidizes United States exporters ofagricultural products facing subsidized foreign competition.Australia decided to give direct producer subsidies to itsfarmers for the first time. An international understanding onagricultural subsidies remains out of reach. In December1987, the United States decided, also under the Food Security Act, to cut its sugar imports in 1988 by 25 per cent inorder to keep domestic sugar prices above world prices.
In other sectoral developments, a number of major suppliers of footwear agreed' 'voluntarily" to restrict their exportsto some developed market economies. The Republic ofKorea agreed to a "voluntary" restraint on its exports of electronics to the United States. Additional restrictive measureswere taken by EEC and the United States on their steel im-
6 For information on the relative importance of the various types of measures described here, see GATT, Group on Quantitative Restrictions andother Non-Tariff Measures, '~nalysis of the Group's Documentation: note by the secretariat" (NTM/W/17, annex 7), I September 1986.
7 See Jagdish N. Bhagwati, Anne O. Krueger and Richard H. Snape, Introduction, The World Bank Economic Review, vol. 1, No.4 (September1987), a symposium issue on the multilateral trade negotiations and developing country interests, p. 544.
8 Much of the information on recent developments in the field of trade is derived from GATT, "Developments in the trading system, October1986-March 1987" (L/6205) and "Developments in the trading system, April 1987-September 1987" (L/6289).
9 See OEeD, National Policies and Agricultural Trade, (Paris, 1987).
33

ports, as the problem of over-capacity in the steel industrypersisted. Japan continued to restrain its exports of vehiclesto EEC and the United States. On the positive side, theUnited States decided to remove the high tariff it had imposed on Japanese motor cycles, citing revived competitiveness of United States industry.
In textiles, the major development, with potentially serious consequences for developing country exports, is the setof textile bills currently before the United States Congress.Even a moderate version of the bills would severely limitimports of textiles into the country. The present Administration has, however, opposed the bills.
Trade tension between Japan and the United States continued in 1987, but there have been some important positivedevelopments in recent months. Early in 1987, the UnitedStates imposed tariffs of 100 per cent on some Japanese electronic goods in retaliation for what it regarded the latter'sbreach of an agreement between the two countries on tradein semiconductors. Later in the year, the tariff on some ofthe items was reduced, but not entirely removed. Individualcases of trade friction between the two countries reflectheightened general tension produced by the very largeUnited States trade deficit with Japan. In some cases, continuing United States pressure has yielded what is seen as anopening ofthe Japanese market to United States industriesfor example, Japan's offer to facilitate access of foreignfirms to Japanese government contracts for supercomputers. Japan also agreed to eliminate import quotas on a number of agricultural products, but a major dispute on the lifting of quotas on beef and citrus products continued. In asignificant development, an agreement was reached early in1988 allowing United States firms to bid for governmentfinanced construction projects in Japan. The impact of thesesteps on the trade balance is, however, uncertain and probably minor, and some ofthese agreements have only helped tostrengthen bilateralism in international trade. Such agreements have not always produced salutary results. The agreement between the United States and Japan on computerchips, by restricting total output, was widely held responsible for a sharp increase in chip prices early in 1988.
The trade legislation that has received the most attentionbecause of its implications for international trade is the omnibus United States trade bill passed by Congress at the endof April 1988. Although some of the original extremely protectionist proposals were omitted from the final version, thebill is widely perceived as a major setback to free trade. Itappears to further strengthen the trend towards reciprocityand bilateralism in trade relationships by requiring the Administration to retaliate against countries which are perceived to restrict United States exports. As at the end ofApril, the bill was under the threat of a presidential veto overcertain of its provisions not strictly related to trade. Apartfrom creating an atmosphere of uncertainty about the evolution of United States trade policy, the delay in its passagemight hinder negotiations in the Uruguay Round because thelegislation contains provisions giving the United States Administration the authority needed to negotiate multilateral
trade agreements. On the other hand, the bill in its presentform, which the negotiating partners may perceive as overlyprotectionist, is unlikely to help the negotiating process.
One bilateral agreement in recent months does appear,however, to constitute a significant step towards freer trade.In December 1987, after a long series of negotiations, Canada and the United States signed an agreement to removetariffs from a large proportion of trade between the twocountries. For some products, tariffs are to be abolished immediately; for others, they are to be cut over a number ofyears. The agreement also lowers a wide range of non-tariffbarriers and covers a number of aspects of trade in services.In another development, Mexico and the United States havemoved close to an agreement to curb barriers to trade andinvestment. The two initiatives, especially the first, shouldsignificantly expand the area of freer trade and may mean anet creation of world trade rather than its diversion from therest of the world. Genuine concerns have nevertheless beenexpressed on the implications of too many regional tradingarrangements for the multilateral trading system.
An encouraging sign in recent months is that GATT member countries appear to be making greater use of GATT machinery for dispute settlement and reconciliation. Whilemost trade disputes continue to be resolved through bilateralaccords, including those under which supplying countries"voluntarily" agree to limit exports, a recent GATT reportnotes a rising trend towards the use of the multilateral forumof GATT. 10 .A significant development in this area was thesettling early in 1988 of the dispute between Japan and theUnited States on the former's use of quotas, covering 12categories of agricultural products. The GATT Council upheld the finding of the GATT dispute settlement panel thatthese quotas violated the rules and Japan agreed to abide bythe finding. The dispute settlement procedure of GATT hasbeen invoked in a fairly large number of cases, includingcomplaints by Japan and EEC regarding the discriminatoryimplications of the agreement between the United States andJapan on semiconductors and the action of the United StatesGovernment under it, and the GATT ruling on United Stateslegislation which would tax imported petroleum at a higherrate than domestic production. .
In the midst of these mixed developments, a further signof support for the multilateral trading system is the numberof countries joining GATT or wishing to join it. Among thefive countries and territories which have joined in the pasttwo years are Hong Kong, Mexico and Morocco, which together account for a large proportion of the trade of the developing countries. Tunisia has provisionally acceded to theAgreement and, as at the middle of 1987, 11 countries hadtaken initiatives to obtain GATT membership. China, withsignificant and rapidly growing external trade, has appliedfor the resumption of its membership in GATT and Bulgariahas applied to join. The Soviet Union is expected to resubmitits application for observer status at the GATT multilateralnegotiations.
10 GATT, "Developments in the trading system, April1987-September 1987" (L/6289), p. 5.
34

The Uruguay Round of multilateral trade negotiations
The year 1987 was the first full year of multilateral tradenegotiations under the Uruguay Round, launched at Puntadel Este in September 1986, which is seen by many as themain hope for strengthening the multilateral trading system.In scope and complexity, the Uruguay Round surpasses itspredecessors and the negotiations are widely expected to bedifficult and lengthy. The assessment of progress made bythe end of the first year, however, appears on the whole to befavourable.!! It is also possible that the process of negotiations itself helped some Governments to resist protectionistpressures.!2 Fourteen negotiating groups on goods wereformed, negotiating plans were drawn up and a series ofmeetings of the groups were held. Before the end ofthe year,168 proposals had been presented to the groups. The developing countries have participated actively, presenting about40 proposals. Much of the progress made concerns technicalmatters of procedure. Many proposals on substantive matters also have been presented in the groups.
A major failure was the lack of progress in the implementation of commitments made at Punta del Este on standstillon new illegal trade measures and rollback of existing measures, although a mechanism for surveillance of these commitments was agreed on. Fresh violations of the commitments have been reported to the Surveillance Body.
Agriculture remained a crucial and difficult area of negotiation. In July 1987, the United States presented a comprehensive set of proposals to phase out all agricultural subsidies and import barriers by the year 2000. The Cairns Groupofcountries!3 and EEC also presented far-reaching proposalsfor reform of trade in agriculture. These proposals are stillunder discussion in the negotiating group on agriculture, butlittle substantive progress has been made. National action tosubsidize agriculture has in fact paralelled multilateral discussion on liberalization of agricultural trade.
Some progress has been made in negotiations on trade intropical products, which are mostly of interest to developingcountries. EEC made an offer to reduce or eliminate tariffsand quantitative restrictions on a wide range of these products. The proposal is, however, conditional on a satisfactorylevel of reciprocity by the beneficiaries. A number of developing countries and the United States also submitted proposals for liberalization of trade in tropical products.
Negotiations on trade in services is a major new dimension of the Uruguay Round. The Group of Negotiations onServices, working in parallel with the Group of Negotiationon Goods, has, as its negotiating objective, the establishment of a multilateral framework of principles and rules fortrade in services. In accordance with its mandate, during1987 the Group dealt mainly with definitional, conceptual
and statistical problems, the coverage of the multilateralframework for trade in services, existing international arrangements for trade in services and current practices limiting such trade. A number of proposals were made. TheUnited States, for example, submitted a set of comprehensive proposals for the inclusion of the principles oftransparency, non-discrimination and national treatment.
Little progress has so far been made on the importantquestion of safeguards. Article XIX of the Agreement allows emergency action to protect domestic industry temporarily when it is threatened with "serious injury" as a resultof increased imports. In practice, it has become a major vehicle of protection. There is a wide area of disagreement onthe interpretation of "serious injury", the duration of theemergency measures, the treatment of the "grey area"measures (i.e., measures which do not technically violateGATT rules but circumvent them by such practices as voluntary export restraints) and the application of the principles ofnon-discrimination. It may be recalled that the inability toagree on safeguard measures was a major failure of the Tokyo Round. The negotiating group on safeguards in the Uruguay Round has only begun deliberations on these complexbut well-known issues.
Issues of removal of quantitative restrictions and othernon-tariff barriers to trade lie at the heart of the negotiationsin the Uruguay Round. These issues not only concern thenegotiating group on non-tariff measures, but pervade theexamination of many of the questions raised in other groupsas well. The very diversity of the types of trade restrictionsin use raises complex issues of substance and makes theirquantification for the purpose of negotiation difficult. In thisregard, a recently submitted proposal, based on the wellknown concept of effective rate of protection, to bring thevarious tariff and non-tariff barriers into a single measure ofprotection called the "effective rate of assistance", shouldfacilitate the evaluation of existing protection in individualcountries and thus help the negotiating process.!4
In recent months, considerable emphasis has been placed,both in the negotiations under the Uruguay Round and inother forums, on the strengthening of the GATT system.There is a widespread perception that many of the GATTrules are porous and that GATT has been less effective in themaintenance of an open trading system than its founders expected. In the negotiating group on the functioning of theGATT system, there appears to be a convergence of viewson the need for greater ministerial involvement in GATTmeetings and for transparency and regular reviews of tradepolicies of member countries. Strong backing for efforts tostrengthen the system was given in March 1988 at a meetingof trade ministers from 30 major trading countries.
11 See "forty-third session ofthe GATT Contracting Parties: opening statement by the Chairman", GATT press release, (GATT/1424), 1 December 1987; and "TNC Chairman reviews first year of the Uruguay Round", GATT, News ofthe Uruguay Round ofMultilateral Trade Negotiations (NUR 008),2 October 1987.
12 GATT, News ofthe Uruguay Round ofMultilateral Trade Negotiations (NUR 013), 21 December 1987.13 Argentina, Australia, Brazil, Canada, Colombia, Hungary, Inddnesia, Malaysia, New Zealand, Philippines, Thailand and Uruguay.14 GATT, Uruguay Round of multilateral trade negotiations, Group of Negotiations on Goods, Negotiating Group on Tariffs and Negotiating
Group on Non-Tariff Measures, "Communication from Australia" (MTN.GNG/NGl/WI14 and MTN.GNG/NG2/W18, November 1987).
35

Trade, exchange rates and macro-economic imbalances
The proper functioning of the trading system and the success of current efforts to strengthen it will largely depend onthe strength of the political commitment to freer trade andthe micro-economic policies of structural adjustment thatmust accompany it. These efforts will also depend on thefunctioning of the international monetary system, especiallythe exchange rate regime. The events of the 1980s have castserious doubts on the ability of a regime of freely floatingexchange rates to restore and maintain equilibrium in external balances among countries. As a former Chairman of theUnited States Federal Reserve Board said recently, "thehealth and viability of an open international trading orderwill be importantly dependent over time upon the willingness of governments oflarge trading countries to reach somerealistic collective judgement about the broadly appropriatelevel of exchange rates" .15
The growth of trade is affected both by a prolonged misalignment of currencies, through their impact on the supplycapacity of the domestic tradable sector, and by macro-economic policies aimed at reducing trade imbalances, throughthe total demand for tradables. The impact of these two factors on trade is examined briefly below.
Unstable exchange rates and supply capacity
It is widely recognized that in recent years exchange ratesamong major currencies have been influenced more by capital movements than by relative rates of inflation or productivity growth. The sensitivity of exchange rates to investorpreferences among assets denominated in different currencies has weakened the traditional links between current accounts, purchasing power parity relationships and exchangerates. The floating rate regime has often experienced medium-term swings involving considerable misalignment ofexchange rates, in the sense that actual rates deviated substantially and for a prolonged period from their long-runequilibrium level. 16 Such misalignments have been an impediment to free trade because of the protectionist tendencies they generate. More important, they may also havebeen a source of significant resource misallocation.
Exchange rates perform a crucial function in the international trading system as the relative price of tradables. Anappropriate and predictable rate is thus essential for planning the optimal level of investment in export- and importcompeting sectors. An overvalued exchange rate places acountry at an across-the-board disadvantage in trade becauseits prices in both export- and import-competing industrieswill be above equilibrium levels. Domestic tradables outputwill be dearer than foreign products. Reducing prices to ensure competitive levels erodes profits. This may inducefirms in the tradables sector to layoff workers and scrapcapacity that could otherwise be productively employed atequilibrium prices. As and when the exchange rate swingreverses itself, however, new investment may be called forin these same industries as their initial viability is restored.Clearly, there are significant costs of adjustment associatedwith such shifts in resources, as is the case with any resourcereallocation. However, when costs are incurred to effect along-run improvement in the allocation of resources, there isa corresponding long-term gain that more than offsets it.This is not true when resource movements are imposed byinappropriate or misaligned exchange rates. The impact ofthe dollar's misalignment on resource movement bears testimony to that. There is evidence to suggest that an appreciation- induced decline in competitiveness over a long periodmay have led to disinvestment and thus to reduced capital,skills and organization in the United States tradables sector.
The nominal effective exchange rate of the United Statesdollar appreciated by around 55 per cent between 1980 and1985. 17 The real exchange rate changed by similar magnitudes. This implied that there was a significant degree ofmisalignment. 18 As a result, the relative profitability of thetradables sector fell. However, expectations of a correctionin exchange rates and, of course, the cost of shifting resources may have slowed down the actual process of resource reallocation. Not all industries producing tradablesexperienced similar reductions in profitability, however.Some avoided it, through offsetting increases in productivity. Others proved to be more vulnerable and may have suffered significant losses. 19 Industrial subsectors whose employment and installed capacity appear to have been mostadversely affected by the dollar's appreciation are textilemill products, leather and leather goods, primary metal industries, non-electrical machinery and transportation equip-
15 Statement made on 30 November 1987 by Mr. Paul Volcker on the occasion of the fortieth anniversary of GATT (see GATTNewsletter, No. 51(January, 1988».
16 The long-run equilibrium level is that at which exchange rates, obtainable without trade or exchange restrictions, would generate a currentaccount balance consistent with some notion of normal or underlying capital flow. This rate has been called "fundamental equilibrium realeffective exchange rate" (J. Williamson, The Exchange Rate System, 2nd ed. (Washington, D. C., Institute for International Economics, 1985),p.27).
17 This is based on the MERM index of exchange rates, line am x (see IMF, International Financial Statistics (Washington, D.C.), various issues).18 There is no estimate of actual misalignment in 1985. However, by end of 1983, when the dollar's nominal effective exchange rate had appreci
ated by 33 per cent over 1980, misalignment or overvaluation was estimated to be 18 per cent (Williamson, op cit.).19 One simple indicator of such vulnerability is the price-cost margin of different industries. The average price-cost margin for United States
manufacturing is around 0.5 with considerable dispersion around it: a high of0.96 and a low of0.30 for 20 two-digit industries;appreciation-induced price reductions could have generated losses for firms in industries with below average price-cost margins (R. G. Hubbard, "Comment on Hall's market structure and macro-economic fluctuations", Brookings Papers on Economic Activity. No.2 (1986».
36

ment. 20 Surveys of workers displaced during this period confirm that the layoffs that occurred in these sectors werelargely due to plant closings. 21
The dollar has been depreciating since the middle of 1985.Its current real exchange rate is around the same level as itwas in 1980. This depreciation has been accompanied by agreat resurgence in demand for United States exports. Although the full demand effect of depreciation is still workingitself out, capacity utilization rates of 95 per cent have already been reported in several industries. How rapidly theseemerging supply bottle-necks are overcome will depend oninvestment in new capacity. The potential of the floating rateregime to reverse exchange rate swings, in directions notalways consistent with the needs of the real sector, will nodoubt affect the speed and volume of that investment andthus the supply capacity of the tradables sector.
Policies for reducing imbalances and emerging tradepatterns .
It is doubtful that the current level of the dollar's real exchange rate will be adequate to ensure major reductions inthe external imbalance. The burden of further reductions inthe current-account deficit of the United States is thereforelikely to be borne by adjustments in the relative growth ofdomestic demand. Though estimates vary, some suggest thatgrowth of demand of foreign industrialized countries willhave to exceed that of the United States by 2.5 per cent overthe next three years to ensure substantial reductions in theexternal imbalance of the United States at prevailing realexchange rates. 22 However, there appears to be considerableuncertainty about the nature of aggregate demand policiesthat countries will carry out for the purpose of achieving thenecessary differential in relative growth of their domesticdemand, as well as about the evolution of exchange rates. Itis clear, however, that whatever mix of demand adjustmentamong countries is chosen, it will have a considerable impact on growth of world trade and of exports of developingcountries.
An effective country mix of policies for reducing the current imbalances consists of a contraction in United Statesdomestic demand offset by a commensurate rise in demandof Japan and Western Europe. This would be the least dam-
aging to overall growth of world trade. To the extent that theincome elasticity of demand for imports from developingcountries is greater in the United States, the stimulus to export growth of developing countries as a whole will ofcourse be lower, but not substantially. In addition, the geographical distribution of that stimuius will differ dependingon commodity and market concentration of their exports. Inview of the greater commodity- intensity of Japanese andEuropean imports from the developing world, commodityexports may experience faster growth rates, relative to manufactured exports. Africa, with its greater dependence oncommodity exports to Europe, will benefit more than eitherEast Asia or Latin America which is more dependent on theUnited States market. Despite the attractiveness of this policy scenario, it seems unlikely to materialize. Western Europe, including the Federal Republic of Germany, appearsreluctant to carry out such expansionary policies. Part of thereason is to be found in the fact that the prevailing output gapis low and the rate of growth ofpotential output appears to beslow,23 both of which suggest that the spectre of early inflationary pressures may inhibit the necessary expansion of demand.
It is equally unlikely that the United States will make avery significant cut in the fiscal deficit and thus domesticdemand if a good part of it is not expected to be offset by arise in net export demand. The cut in the 1988 budget deficitof the United States is not large. The adverse impact oflarger cuts on growth of world output and growth of worldtrade would be quite substantial.
What is more likely to emerge, therefore, is a reduction inthe United States fiscal deficit accompanied only by a rise ingrowth of spending in Japan. This was evident in 1987, whengrowth of United States domestic demand fell from 3.9 percent to 2.5 per cent under the impetus of Gramm-RudmanHollings cuts, while Japanese demand rose from 4 per centto 5.1 per cent,24 Western Europe, on the other hand, reduced its rate of growth of spending slightly that year, from4.0 per cent to 3.4 per cent. Extrapolation of existing trendssuggests a continuing decline in the rate of growth of demand of the United States and Europe and a rise only in thatof Japan. Thus growth of output ofthe industrialized worldis expected to be lower under such a scenario. This will nodoubt affect world trade. More important, since a larger
20 An econometric study of the determinants of employment in each two-digit industry category has been carried out, with'trend, a proxy foraggregate demand, the relative price of energy and the real exchange rate as the determinants. The study indicates that a 60 per cent appreciationof the dollar from 1980 to 1985 may have reduced overall manufacturing employment by 8.4 per cent (i.e., a loss of 1.7 million jobs) (W. H.Branson and J. P. Love, "The real exchange rate and employment in U.S. manufacturing 1974-85", National Bureau of Economic Research,Working Paper No. 2435 (Cambridge, Mass., 1987, p. 175). Most of the reduction would occur in the durable goods sector, which was found tobe more sensitive to the real exchange rate (i.e.,a 60 per cent appreciation would lead to a 12 per cent decline in employment in the durablegoods sector). Movements in the book-value offixed assets between 1980 and 1985 suggest declines in installed capacity (see United StatesDepartment of Commerce, Annual Survey ofManufactures, various issues).
21 P. O. Flaim and E. Sehgel, "Displaced workers of 1981-85", Monthly Labor Review, June 1987.22 R. Dornbusch, "External balance correction: depreciation or protection?", Brookings Papers on Economic Activity, No.1 (1987), p. 259,
shows that the non-interest current account of the United States will be balanced by 1991 if such a differential in relative growth of demand canbe sustained.
23 An output gap of around 3 per cent has been estimated for many countries in Europe; this is largely because growth in potential output is soslow, not exceeding 2.6 per cent a year (see C. Adams, P. R. Fenton and F.Larsen, "Potential output in major industrial countries", StaffStudiesfor the World Economic Outlook, August 1987, Washington, D.C., IMF, 1987) p. 24.
24 IMF, World Economic Outlook, April 1988: A survey by the Staffofthe International Monetary Fund (Washington, D.C., April 1988), statistical appendix, table A.2.
37

TableIII.5. Indices of prices of non-fuel primary commoditiesexported by developing countries, 1982-1987
(1979-1981 = 100)
Vege- Agri-table cul- Prices Real
Tropi- oil- tural Mine- of pricescal seeds raw rals Combined manu- ofbeve- and mate- and index fac- commo-
Food rages oils rials metals Dollar SDR tures' ditiesb
1982 70 81 72 82 82 78 89 97 80
1983 75 85 88 88 85 83 98 93 89
1984 64 97 119 86 78 84 103 91 92
1985 57 89 82 77 76 75 93 92 82
1986 62 110 51 77 71 79 85 108 73
I 64 128 56 77 76 85 96 104 82
II 65 114 50 78 69 81 87 107 76
III 59 103 45 75 69 75 78 112 67
IV 61 97 54 79 69 75 79 114 66
1987 66 72 60 96 82 76 74 122 62
I 63 75 56 89 72 73 72 120 61
II 64 69 60 95 76 74 71 123 60
III 64 67 59 100 84 75 74 123 61
IV 71 74 65 102 97 84 78 127 66
Sources: UNCTAD, Monthly Commodity Price Bulletin; and United Nations, Monthly Bulletin ofStatistics, December 1986 and March1988.
a Unit values of exports of manufactures from developed market economies. The base of the original index was shifted to 1979-1981.
b Dollar index deflated by prices of manufactures.
share of growth of demand will come from Japan, the import-intensity of which is lower than that of other industrialcountries, the adverse effect may be greater than is impliedby lower output-growth alone. Export growth of developingcountries will also suffer. With the share of the United Statesand Western Europe in total developing country exports exceeding 45 per cent, the slow-down will undermine theirexport growth. This adverse impact will also be unevenlydistributed. The share of the United States and Western Eu-
rope, together, in the total exports ofAfrica and Latin America, exceeds the average for developing countries by a substantial margin. Nearly two thirds of their exports are marketed there. Asia is less vulnerable as its dependence onthose markets is only around 35 per cent. While the magnitude of the potential impact is not easy to quantify, the unwinding of large payments imbalances cannot but continueto affect international trade over the next few years.
Commodity prices: some short-term improvement and continuing instability
Trends in commodity prices
The continuing weakness in commodity prices remainsone of the critical issues of international trade of the 1980s.While the share of commodities in world trade has declinedsteadily, to around 35 per cent in 1986 from 47 per cent in1960, for a large majority of the developing countries commodity prices still determine their capacity to import and toservice their external debt. The low level of prices hasgreatly added to their difficulties of adjustment and growthin the 1980s. At the same time, their reduced import capacity has contributed to the slow growth of exports from the
developed market economies. Some of these economies arethemselves dependent on exports of primary commoditiesand have been suffering because of weak prices.
Prices of non-fuel primary commodities exported by thedeveloping countries declined slightly, in dollar terms, in1987. The UNCTAD index of commodity prices for the yearas a whole was about 4 per cent lower than in 1986.25 Thisrepresents the continuation of a trend which has taken theseprices to record low levels (see figure III. 1).
The average annual changes, however, conceal the variations in price movements during the year and the widely
25 Other indices of prices give a somewhat different picture. The IMF index for the developing countries shows an increase of 3 per cent. Thediscrepancy is largely due to the difference in weights of individual commodities in the two indices, especially in the weights used for tropicalbeverages. UNCTAD uses a higher weight for this category than IMP. Beverage prices declined steeply in 1987. The Economist dollar index ofcommodity prices shows an increase of7.5 per cent in 1987 over the average for 1986 (The Economist, 12 March 1988).
38

divergent changes in the prices of individual commodities.Quarterly data show that prices in dollar terms moved upnoticeably in the second half of 1987 (see table IlLS). Theprice index for the last quarter of the year was about 10 percent higher than for the corresponding quarter of 1986.
There was, in fact, a general upsurge in commodity pricesduring the second half of 1987 and the beginning of 1988.For the year as a whole, of the 40 commodities in theUNCTAD index, 24 increased in price and 15 declined. Thiscontrasts with 30 declines and 8 increases in 1986 (see boxI1I.l).
Box IlL!. The diversity behind the commodityprice index
In 1987, prices of beverages declined while prices of mostother commodities increased. Yet the index of commodityprices showed a decline for the year. The weights used in theprice indices of commodities exported by developing countries are the relative importance of individual commoditiesin the total value of exports of these countries. Constructionof any index normally involves weighting of this nature,which serves the purposes of an index in most cases. Theweight of a commodity in the total exports of the developingcountries will, however, rarely correspond to its importanceto an individual country. A commodity with a large tradeweight in total trade may be of little importance to an individual country and a change in its price may not thereforemean much to that country. The diversity of changes in commodity prices and the inadequacy of any value-weighted in-
dex to reflect the distribution of the impact of price changesare illustrated in the table below.
The decline in the price of coffee (the item with the largestweight) in 1987, for example, indeed affected a large number of countries where it accounted for a significant proportion of their foreign exchange earnings. Nevertheless, thereis an even larger number of countries which are dependent,some of them heavily, on, for example, sugar, oilseeds, copper or cotton, the prices of all of which rose during the year.Few ofthese countries are also coffee producers. The movement of commodity prices in general, which is largely influenced by coffee prices, does not capture the welfare implication of an increase in the prices of the exports of these , morenumerous, countries. The same would be true if coffeeprices were to rise and most other prices fall, a situationclose to what prevailed in 1986.
DeclineDeclineDecline
2415
Decline
IncreaseIncreaseIncreaseDeclineIncreaseIncreaseIncreaseIncreaseIncrease
Changes in prices1986 1987
IncreaseDeclineDeclineDeclineDeclineIncreaseDeclineDeclineDecline
830
Increase
IncreaseDeclineDecline
Number ofcountries Number ofaccounting countriesfor 0.50 for whichper cent the commodityor more of account fortotal de- 20 per centve10ping or more ofcountry their totalexports' exports'
28 1518 315 2
61 20
18 626 327 6
79
1011 316 18 1
132 21
27.1
8.76.84.70.71.55.57.43.63.6
19.45.12.6
Weight(Percentage)
Majorcommodities
CoffeeCocoaTea
Total,beverages
SugarOilseeds and oilCottonWheatRiceRubberCopperAluminiumTin
Total,other thanbeverages 42.5
Number of prices which increasedb
Number of prices which declinedb
Change in price indexb
a In 1982-1983.b In the UNCTAD index.
39

Prices of tropical beverages declined sharply, which depressed the index. Coffee prices, which have the largestweight in developing country exports, rose through most of1986, but started to fall in the latter part of the year, thedecline continuing well into the second half of 1987. Themovement of prices broadly reflected the state of the coffeecrop in Brazil, where production was reduced by drought in1986, but recovered in the next crop season. In mid-I987prices of some varieties of coffee were 40 per cent lowerthan a year earlier. Later in the year prices started to recover,partly as a result of the International Coffee Council agreeing on the allocation of export quotas. Cocoa prices weredepressed in 1986 and fell further in 1987. By the first quarter of 1988, prices were at a five-year low. Tea prices declined in 1987, for the third consecutive year.
But prices of most products rose, in dollar terms, duringthe year, from the historically low levels they had reached in1986. Sugar prices which, by 1985, had reached their lowestlevel since 1970, recovered moderately in 1986 and again in1987. Prices of agricultural raw materials on the averagerose by around 25 per cent in 1987 and metal prices by 15 percent over 1986 levels. There were large variations withinthese groups: prices of some varieties of cotton increased byalmost 50 per cent, while rubber prices rose by around 20per cent; copper prices were about 15 per cent higher thanthe average for 1986, but by the end of 1987 they were almost 70 per cent higher than a year earlier; aluminium andtin prices increased by around 20 per cent.
Persistent excess supply has been a major cause of thedecline in commodity prices during the 1980s. The International Monetary Fund (IMF) index of commodity stocks increased by around 28 per cent during the period 1983-1986.26
A reversal of this trend, brought about by a decline in excesscapacity in some cases and a localized fall in production dueto adverse weather conditions in others, contributed to theupsurge of prices in 1987. The world stock of foodgrainsremained at high levels, but there was a production shortfallin 1987, partly because of weather on the Indian subcontinent, and a slow-down of the growth of output in China.World production of cereals declined by 4 per cent in 1987and stocks fell by about 14 per cent. 27 Production of sugar inthe 1987/88 season is estimated to remain at its level of thepreceding year and to fall short of consumption for the firsttime since the 1970s. There has also been a decline in theproduction ofoilseeds and cotton. The changes in the supplyof metals have been particularly large. Copper stocks declined and were, at the end of 1987, much lower than at anytime during the 1980s. Aluminium and tin stocks also fell.
The upsurge in commodity prices in 1987 and the beginning of 1988 has benefited the developing countries, in somecases substantially. However, the increase in dollar prices isnot an adequate measure of the change and can even be misleading. Measured in terms of a basket of currencies repre-
sented by the special drawing right (SDR), average prices ofnon-fuel primary commodities exported by the developingcountries declined significantly, even in indexes which showa slight increase in dollar terms. The UNCTAD SDR indexdeclined by 13 per cent,28
In real terms, the decline in commodity prices has beeneven more ,significant. When corrected for the changes inthe prices of manufactures, which increased by around 13per cent in dollar terms in 1987, commodity prices declinedby almost 15 per cent, following an 11 per cent fall in 1986(see table III.5 and figure III.2). During the period 19801987, commodity prices in real terms have declined byaround 6 per cent annually. While a fall in these prices hasbeen beneficial to those developing countries which arelargely importers of commodities and exporters of manufactures, the majority of developing countries have suffered aloss of purchasing power of their exports during the 1980sand for many of them the recent increase in commodityprices was partly or wholly offset by an increase in theprices of their manufactured imports.
Furthermore, it does not appear that the recent upsurge incommodity prices is the beginning of a period of sustainedimprovement in prices. Some of the long-term and mediumterm factors which have contributed to the depressed pricelevels of the 1980s remain at work. The long-term trendtowards diminishing requirements of commodity inputs perunit of final output continues. 29 With unchanged policies,there is little evidence of a revival of high rates of growth inthe industrial countries in the near future which might boostthe demand for commodities. Moreover, though stocks ofsome conmlodities have declined in some cases, they remainlarge in others and excess capacity remains in a number ofmetal industries. The short-term response to an increase inprices of many agricultural commodities has often been anexpansion ofproduction which, in the absence of a sustainedincrease in demand, has led to a new round of decline inprices. These considerations suggest that price increases inrecent months may, in general, be about to peak. Any furtherincrease in 1988 and 1989 is expected to be only modest. InJanuary and February 1988, there were already signs of aweakening of commodity prices. Agricultur;tl raw materialsand metal prices actually declined in February, leaving prospects for the near future in a state of uncertainty.
Oil prices increased by around 30 per cent in 1987 in dollar terms after a decline of 40 per cent in 1986. As a result,the terms of trade of the oil-exporting developing countriesimproved significantly, but not nearly enough to offset thesharp deterioration of the preceding year. Long-term demand and supply factors do not, however, suggest a sustainable further increase in oil prices for the near future. Early in1988, there were already signs of weakness in prices as supply tended to outpace growth in demand. During the first
26 IMF, Primary Commodities: Market Developments and Outlook (Washington, D.C., May 1987), p. 8.27 FAG, Food Outlook, No. 1/2 (February 1988).28 The IMF index shows a decline on per cent in SDR terms.29 For a brief discussion of these factors, see World Economic Survey 1987 (United Nations publication, Sales No. E.87.II.C.l and corrigendum).
40

Figure IlL!. Prices of groups of commodities, 1980-1987(Indices of dollar prices: 1979-1981 = 100)
160 -y----------------------.
140
120
80
60
4
I \
I \I ~
I h \
\,', .... I',.,"1
: \ ~.
\ \...... ... ... /~ .. ---./
...... ~,\ .... ,/ ./--.. .\ /
"
Food
Vegetable oils
Agriculturalraw materials
Minerals
Combined indollars
Source: UNCTAD, Monthly Commodity Price Bulletin.
Figure m.2. Prices of commodities and export unit valuesof manufactures, 1970-1987
(Indices of dollar prices: 1980 = 100)
140.-.-...--------------~--- ...
120
100
80
60
40
Commodity Exports
Manufactures
Ratio
Source: UNCTAD, Monthly Commodity Price Bulletin; and United Nations, Monthly Bulletin o/Statistics.
41

quarter of the year, prices actually declined. The futurecourse of oil prices is extremely difficult to predict. Mostestimates for the year as a whole suggest little improvementover their 1987 level (for a fuller discussion ofoil prices, seechap. V below).
Instability of commodity prices and commodity agreements
Prices ofprimary commodities not only are on a decliningtrend but also fluctuate widely. The magnitude of measuredprice instability differs depending on the method and periodof measurement, but prices of primary commodities havebeen found to be considerably more variable than prices ofmanufactures. Not all commodity prices are equally variable. Subgroups such as food and agricultural raw materialsexperience greater instability than minerals and metals. Export volumes are much less unstable. Thus instability invalue ofcommodity exports at the global level is attributablemostly to instability in prices.
At the country level, however, instability in the worldprice of commodities arising mainly from shifts in worlddemand is not always the dominant source of fluctuations ina country's export earnings. Variations in country supplyare often greater than those in world supply of a commodity.30 Thus variations in a developing country's export earnings are a function of both price instability and volume instability. Countries have sought to reduce domestic supply instability through marketing boards or loan facilities aimed atencouraging private stocking, with different degrees of success. World price instability has been addressed at the international level. Past policies have aimed either at reducinginstability in world prices through commodity agreementsbetween producers and consumers or at neutralizing the effect of unstable export earnings through compensatory financing schemes. Experience over the past 30 years suggests that single commodity agreements are less likely to beeffective instruments for price stabilization than originallyenvisaged.
The recent collapse of the International Tin Agreement,long regarded as the most successful agreement, has emphasized the inadequacy of international commodity agreements as instruments of price stabilization. The experienceof three decades has revealed the difficulty of negotiatingsuch agreements and, once negotiated, the problem of sustaining their effective operation. The most fundamentalweakness of the agreements stems from the fact that the basis of co-operation between producers and consumers implicit in them is extremely fragile. Generally, producers arereluctant to enter into a commodity agreement when pricesare high and rising, while consumers are unwilling to join an
agreement when prices are depressed and falling. Since markets have usually been in one state or the other, commodityagreements have been difficult to establish. The International Cocoa Agreement was signed after 10 years of negotiation' but not even a weaker agreement could be renewed in1980 as its largest importer and exporter could not agree ona price-support range. Support for the Common Fund forCommodities of UNCTAD was hesitant in many consumingcountries in a climate of depressed prices. 3
! Only four newagreements could be negotiated in the post-war period despite considerable intergovernmental efforts. These agreements became possible when perceptions of producingcountries about the future evolution of prices differed fromthose of consuming countries, so that both found it in theirinterest to agree. On some occasions, consuming countriesjoined even when that was not the case. For example, thelargest importer is said to have joined the coffee agreementin 1956 because of its interest in supporting development inthe exporting countries. 32 Similarly, many consuming countries supported new commodity agreements in the 1970s inthe hope of maintaining some influence with producers.However, since the actual evolution of prices was not usually consistent with expectations of both groups, or if theinitial non-economic motive was not sustained, tensions anddisagreements emerged over the life of the agreement. Thisinfluenced the initial design of the agreements, the instruments chosen for price stabilization (e.g., export quotas versus buffer stocks), the level of the price-support range, thesize of financing for buffer stocks and the allocation of export quotas, as well as the flexibility with which thesechoices were altered or updated when the situation warranted such action. The relative success or failure of international commodity agreements to maintain prices within thestated ceilings and floors can be traced to these choices.
Of the five commodity agreements that have existed in thepost-war period, sugar and coffee used export controlswhile natural rubber and cocoa depended on buffer stocksonly to stabilize prices; only tin used both export quotas andbuffer stocks-this was prompted by the fact that the agreedsize of buffer-stock financing was not large enough to prevent substantial price declines in situations of excess supplywithout the benefit of export quotas to restrain supply. Unfortunately, the joint use ofexport controls and buffer stockstended to undermine the capacity of such agreements to stabilize prices, even when available finance was adequate.Stock accumulation could not be large since potential excesssupply was reduced through export quotas rather thanthrough purchases, and those stocks later proved insufficient to contain prices within the specified ceiling. Agreements that depended on export controls alone frequentlyfailed to protect price ceilings. In many cases, the negotiated
30 Because shifts in supply in different countries partially offset each other, volume instability is more pronounced at the country level.31 Econometric simulation for 10 core commodities of the Integrated Programme for Commodities of UNCTAD suggests substantial gains for
producers and consumers, as well as considerable economy of resources through pooling (J. Behrman and P. K. Ramangkura, "Evaluatingintegrated schemes for commodity market-stabilization", Econometric Modelling ofWorld Commodity Policy, C. Adams and J. Behrman, eds.(Lexington, Mass., Lexington Books, 1978), p. 170). Yet these gains were not perceived by consuming countries in the context of the depressedcommodity prices of the 1980s.
32 C. P. Brown, The Political and Social Economy ofCommodity Control (London, Macmillan, 1980).
42

price-support ranges were inconsistent with underlying market conditions; in others, there were no automatic mechanisms for updating the support prices. In large measure,both situations were due to the intrinsic difficulty of predicting price trends. As for protecting price floors, allocatingand enforcing quotas were the main problems. The experience of the five agreements confirms these inherent difficulties.
The International Cocoa Agreement of 1972 repeatedlyfailed to maintain prices within the ceiling of the specifiedprice-support range. In part, this was due to the inability ofthe agreement to identify and negotiate a range that reflectedrealistic market conditions. But it was also attributable to thelow level of available stocks that could be deployed to restrain price increases. The lagged supply response to thisperiod of high prices created downward pressure on cocoaprices, which breached the floors. Attempts to control thisfoundered against the backdrop of disagreements on theterms of renewal. As a result, the third cocoa agreementfailed not only to agree on export quotas but also to obtainadequate financing for buffer stocks because of the absenceof two of its largest producing and consuming members.Thus the objective of cocoa price stabilization has remainedelusive.
The limitations of export quotas as a means of stabilizingprices is borne out by the International Coffee Agreement of1962. 33 Even in the agreement's heyday, coffee prices werehighly unstable. 34 The predominance of Brazil in world output permitted a sufficient degree of control over supply tokeep coffee prices higher than the 1962 level for nearly adecade. However, supply responses to high prices from nontraditional producers in Africa reduced the dominance oftraditional suppliers and generated downward pressure onworld prices. The old quota allocations became unacceptable and thus difficult to enforce. Consuming countries, especially the largest among them, became less willing to sanction price-raising efforts, and the economic provisions ofsubsequent agreements remained suspended for most of the1970s. Though revived in 1980 at considerable cost to Brazi1,35 the agreement proved difficult to sustain continuously.
The International Sugar Agreement was also based on export quotas. Considerable difficulty was experienced in renewing it during the period 1964-1969 and 1974-1977. Whenin operation, it failed not only to maintain prices within the
agreement's ceiling, which was expected in the absence ofbuffer stocks, but also to defend the price floor. Identifyingthe appropriate trend-price was also a factor. More important, as EEC transformed itself from a large net importer to alarge net exporter and the United States reduced its importsby half, the agreement was unable to control supply, whichled to its collapse.
The buffer stock facility of the International Natural Rubber Agreement of 1979 did succeed in averting the recession-induced price collapse of the early 1980s. The agreement's provision for substantial financing of stocks,36 as wellas the explicitly articulated provisions for updating pricesupport ranges, imparted a degree of strength and flexibilitythat had not been available to other agreements. However, inthe process of supporting prices over the 1980s, buffer-stocklevels reached their limits, requiring review of supportprices. It is likely that downward adjustments in supportprices undertaken in line with automatic provisions of theagreement may have been inadequate. However, large salesof stock over the past nine months have helped restore theviability of the agreement.
Until recently, the International Tin Agreement appearedto have overcome most of these problems. Using both bufferstocks and export quotas, it was successful in maintainingprices within the agreed range, except for a few breaches intheir price ceilings. These breaches were largely due to exhaustion of the agreement's buffer stock, a reflection of inadequate accumulation of stocks resulting from the use ofexport quotas. 37 The reason that this problem did not revealitself in a much greater frequency of breaches in price ceilings is probably to be found in the activity of the UnitedStates tin stockpile. 38 Starting with stocks substantiallylarger than those of the tin agreement, the United States intervened in the upper price ranges; this compensated for theinadequacy of the agreement's buffer stocks. Export quotasunder the agreement were, however, quite successful in defending the price floor. Jointly, they produced greater pricestability than the tin agreement's intrinsic limitations wouldhave permitted. 39 In the 1980s, activity of the United Statestin stockpile was minimal and tin production by Brazil, anon-member, was substantial. China, another non-member,also emerged as an important producer. In addition, the sixthtin agreement in 1982 lacked the participation of the UnitedStates, the largest consumer, and Bolivia, the fourth largestproducer. Given conditions of weak demand, members' pro-
33 An agreement among Latin American producers was converted to an international coffee agreement when it received official approval fromconsuming nations. United States support for it has been perceived as a charitable gesture for promoting development by some (Brown, op. cit.)and as a means of exerting some influence over producers by others.
34 A. D. Law, International Commodity Agreements (Lexington, Mass., Lexington Books, 1975), p. 76.35 Brazil withheld 12 million tons of coffee at a cost of $1 billion to sustain the agreement.36 Negotiated during a period of heightened interest in commodity arrangements and of high prices in 1976-1979, it proved easier to obtain agree
ment on a buffer-stock facility as large as 550,000 tons.37 Export controls instituted at the end of 1957 were maintained for too long into 1959 and 1960, with the result that the buffer stock was run down
so much that the ceiling could not be defended in 1961. The use of controls in January 1973 led to a breach of the ceiling in 1976 and 1975-1976controls resulted in inactivity of the fifth agreement (see C. L. Gilbert, "International commodity agreements: design and performance", WorldDevelopment, vol. 15, No.5, (May 1987), p. 610).
38 At the start of the International Tin Agreement in 1956, the United States held a stock of 347,000 tons (18 months of non-socialist world consumption). An econometric model shows that the effect of the tin agreement's buffer-stock was minimal in comparison with the effect on priceof releases by the United States tin stockpile (G. W. Smith and G. R. Schink, "The International Tin Agreement: a reassessment", EconomicJournal, vol. 86 (1976).
39 Smith and Schink, op. cit., p. 21.
43

duction was restricted to two thirds of the base level duringthe period 1982-1985. This became increasingly difficult toenforce. Brazil and Bolivia were unwilling to be regulatedand Malaysia was unwilling to operate as swing producer.With resources for buffer stocking insufficient to mop up theexcess supply, the agreement collapsed in November 1985.
In the light of this experience, the second window of theUNCTAD Common Fund for Commodities-support for diversification purposes-assumes particular relevance. Efforts to stabilize prices in the long run become ineffectivewhen market pressures accumulate and fixed prices orprices fluctuating in a narrow band tend to exacerbate ratherthan ease those pressures. It can nevertheless be argued thatan integrated programme to stabilize commodity pricesshould, under normal circumstances, be more effective thanone involving an individual commodity as it is very unlikelythat supply cycles-an important cause of instability for certain products-of the commodities under an integrated programme are going to coincide.
In any event, policies to reduce the deleterious effects ofinstability in prices and export earnings remain crucial. At
the country level, they help to ensure that development programmes are not seriously affected by fluctuations thatmight be transitory. At the global level, they are importantsince they play an anticyclical role when there is a pervasiveslow-down in world demand, as occurred in 1982. The compensatory financing facility (CFF) of IMF and the Stabexscheme of EEC have sought to fulfil such a role by preventing fluctuations in import capacity arising from fluctuationsin export receipts, through compensating financial flows.However, only Stabex compensations are commodity-specific and on a grant basis, which makes them particularlysuitable for low-income countries or highly indebted ones.CFF envisages no compensation if the shortfall in commodity exports is offset by a rise in manufactured exports. Thecost of unstable commodity exports thus cannot be avoided.At present, the IMF facility is unlikely to cover commodityspecific shortfalls. A revamped facility is likely to emergeone that will also include contingency financing. Theoretically, it could lead to increased compensatory financing. It isyet to be seen, however, what the modalities for access willbe and what amounts countries will be able to draw whenfaced with abrupt shortfalls in export earnings.
Changes in trade flows among countries and balance of trade
The overall pattern of trade has been greatly affected by(a) macro- economic adjustments in the industrial economies and currency realignments, (b) changes in relativeprices of primary commodities , (c) the burden of debt of thedeveloping countries and (d) the successful export-orientedpolicies of the newly industrializing countries.
Developed market economies
The volume of imports of the developed market economies increased by over 5 per cent in 1987, compared with 8
per cent in 1986 (see table III.2). A large proportion of theincrease in 1986 was accounted for by the import of energy,which did not change much in 1987. The volume of exportsrose by over 4 per cent in 1987, compared with 2.5 per centin 1986.
Behind these aggregates were much larger changes in imports and exports of individual countries. Exports of theUnited States increased by 8 per cent in 1986 and 12 per centin 1987 and are expected to grow even faster in 1988. Thegrowth of the United States economy in 1987 was in fact
Table III.6. Developed market economies: merchandisetrade balance, 1980-1987
(Billions of dollars)
Country 1980 1984 1985 1986 1987'
All countries -69.4 -47.6 -37.6 -1.9 -14.4Excluding the United States -43.9 64.9 82.9 142.4 144.8
Major industrial countries -33.1 -46.1 -38.7 1.4 -8.2Canada 8.0 16.6 13.2 8.1 8.8France -13.4 - 4.6 -5.4 - 2.4 - 9.0Germany, Federal Republic of 8.7 22.0 28.3 55.3 69.8Italy -16.4 - 6.0 - 6.2 4.9 0.6Japan 2.1 44.3 55.6 92.2 96.5United Kingdom 3.4 - 5.9 - 2.6 -12.4 -15.5United States -25.5 -Il2.5 -121.6 -144.3 -159.2
Other countries -36.3 - 1.5 I.I - 3.3 - 6.2
Source: Department of International Economic and Social Affairs of the United NationsSecretariat, based on IMF, International Financial Statistics; OEeD, Economic Outlook; andnational sources.
a Preliminary estimates.
44

fuelled by foreign demand. Exports of the United Kingdomregistered strong growth in 1987, while those of the FederalRepublic of Germany increased only marginally and thoseof Japan declined by around 3 per cent.
The growth of import demand of the developed marketeconomies in 1987 was more evenly distributed among major countries. Japan increased its imports by over 7 per cent,after a 13 per cent increase in 1986, as domestic demandexpanded faster and somewhat more strongly than expected.The Federal Republic of Germany also increased its importssubstantially, by 5 per cent. Both Italy and the United Kingdom increased their imports faster than in 1986. UnitedStates imports also increased by about 5 per cent. Thegrowth of trade among developed market economies was themost important source ofgrowth oftheir total imports and ofworld trade, but imports of those economies from the developing countries also increased.
The trade surplJ.ls of Japan and the Federal Republic ofGermany and the deficit of the United States increased further (see table III.6). The trade surplus of Japan increasedslightly from $92 billion in 1986 to around $97billion in1987, having increased by $37 billion between 1985 and1986. The trade surplus of the Federal Republic of Germanyrose to around $70 billion, after doubling to $55 billion between 1985 and 1986. The United States trade deficit widened from $144 billion in 1986 to $159 billion in 1987, proportionally less than in the preceding year. There were,however, indications early in 1988 that the trade deficit ofthe country had begun to shrink. A strong economy andweak oil prices led to a deterioration of the trade balance ofthe United Kingdom. The trade deficit of France widened.Canada continued to have a large trade surplus, most of itwith the United States.
Developing countries
Exports from the developing countries increased significantly in 1987. Exports of the net energy-exporting developing countries declined somewhat, but those of the energyimporting countries increased by 9 per cent in real terms,after an 8 per cent increase in 1986. Much of this increasewas due to the growth of manufactured exports, but therewas also a modest growth of exports of non-fuel commodities.
After two consecutive years of decline, imports of the developing countries increased by around 2.5 per cent in 1987,considerably above the average for the 1980s. However, thegrowth of imports varied widely between country groups,partly reflecting changes in their terms of trade and the commodity composition of their exports. Imports of energy-exporting developing countries declined for the sixth year in arow; after a 20 per cent decline in 1986, they fell by a further12 per cent in 1987. Though there was a substantial recoveryin energy prices during the year, the value of their exportsremained below the 1985 level and the purchasing power ofthese exports remained even lower. The energy-importing
developing countries, on the other hand, increased the volume of their imports in 1987 by about 7 per cent, which washigh compared not only with the 2 per cent growth in 1986,but with the average for the 1980s as well.
The volume of imports of heavily indebted countries hasbeen declining since the beginning of the debt crisis in 1982as debt-servicing requirements eroded their import capacity.The general increase in commodity prices in 1987 benefittedsome of the heavily indebted countries, but their imports, onthe average, did not increase significantly in 1987.
The trade surplus of the energy exporters, which hadshrunk from around $69 billion in 1985 to $16 billion in1986, increased to an estimated $45billion in 1987 (see tableIII.7). The trade deficit of the net energy importers declinedfrom $11 billion in 1986 to $8 billion in 1987. The continuing decline in their trade deficit in the 1980s is, of course, areflection of the decline in the flow of resources to many ofthese countries over the years and the success of the newlyindustrializing countries in increasing their exports at a fastpace.
The trade performance of the newly industrializing countries has drawn considerable attention. These countries havebeen successful in increasing their exports, mostly manufactures, even in the 1980s when exports of other countrieshave been growing only slowly. Exports from the 10 leadingexporters of manufactures40 to the developed market economies continued to grow in 1987 (see table A.IIL4). In current dollar terms, they increased by almost 23 per cent in1987, compared with an 11 per cent increase in the precedingyear, part of which is attributable to the depreciation of thedollar. The growth of exports of the Asian newly industrializing countries4
! was even higher. Still accounting for a smallproportion of world trade, exports of these countries are thefastest growing component of world exports.
Table IIL7. Developing countries: merchandise trade balance, 1980-1987
(Billions of dollars)
1980 1985 1986 1987'
All developing countries 111.0 55.0 5.7 37.0
Energy-exporting countries 173.3 68.7 16.3 45.3Capital surplus countries 140.3 35.0 7.0 24.8Other energy exporters 33.0 33.7 9.3 20.5
Net energy-importers -62.3 -13.2 -10.6 -8.3
Source: Department of International Economic and Social Affairs of the United Nations Secretariat, based on IMF, InternationalFinancial Statistics, and other international sources.
a Preliminary estimates
The growth of the exports of the newly industrializingcountries has sometimes been perceived as "disruptive" andhas fuelled protectionist sentiments in some developed coun-
40 Argentina, Brazil, Hong Kong, India, Malaysia, Philippines, Republic of Korea, Singapore, Thailand and Yugoslavia41 Hong Kong, India, Malaysia, Philippines, Republic of Korea, Singapore and Thailand.
45

Thble m.8. European centrally planned economies and China:merchandise trade balance, 1980-1987
(Billions of dollars)
1980 1984 1985 1986 1987'
European centrally plannedeconomies
World 2.2 17.9 8.8 9.0 16.5Centrally planned
economies 2.3 3.8 3.8 5.2 5.7Developed market
economies -3.6 6.1 1.3 -3.4 0.9Developing countries 3.5 8.0 3.6 7.2 9.8
Eastern Europe
World -5.8 6.9 4.9 0.8 4.7Centrally planned
economies -1.8 -0.2 0.4 -1.6 2.0Developed market
economies -3.8 4.0 2.2 0.5 0.3Developing countries -0.2 3.1 2.3 1.9 2.3
USSR
World 8.0 11.0 3.9 8.2 11.8Centrally planned
economies 4.1 4.0 3.4 6.7 3.8Developed market
economies 0.2 2.1 -0.9 -3.9 0.5Developing countries 3.7 4.9 1.3 5.3 7.5
China'
World -1.4 -1.1 -15.2 -12.1 -2.8Centrally planned
economies -0.2 -0.4 -0.4 -0.9 -0.2Developed market
economies -6.2 -7.5 -18.4 -16.6 -9.7Developing countries 5.0 7.0 3.7 5.7 7.5
Source: Department oflnternational Economic and Social Affairs of the United Nations Secretariat, based on national and international sources.
a The 1987 figures pertain to January to November.
b Preliminary estimates
tries. A less well recognized fact is that their imports haveincreased pari passu by around 20 per cent a year.
The main factor behind the trade tension resulting fromthe export performance ofAsian newly industrializing countries is that their trade surpluses are unevenly distributedamong the developed market economies (see table A.I1LS).Most of the surplus arises in their trade with the UnitedStates (around $24 billion in 1987).42 Their surplus with Europe is small ($4 billion) and they ran a substantial tradedeficit ($12 billion) with Japan.
It is widely recognized that some of the newly industrializing countries with large trade surpluses should open theireconomies more fully by lowering trade barriers and lettingtheir currencies appreciate when this is called for. This question, however, is often addressed in a bilateral rather than amultilateral context. It also often ignores a number of other
considerations. First, the markets of some of the highly export-oriented newly industrializing countries are far lessprotected than is often supposed. 43 Secondly, these surpluseshave emerged only recently for most countries after a longhistory of trade deficits, as in the case of Singapore and theRepublic of Korea, and they may disappear rather quickly.Thirdly, the surpluses in some cases are being used to repaya large external debt which helped finance earlier deficits.These surpluses are thus largely a reverse financial flowfrom debtors to creditors and are not all designed for theaccumulation of large foreign assets.
European centrally planned economies and China
The trade flows of the centrally planned economies ofEurope in 1987 were largely characterized by slower thanplanned growth, adverse weather conditions, weak com-
42 Excluding exports of Taiwan, Province of China.43 Empirical evidence is scanty but see, for example, World Bank, World Development Report, 1987 (Washington, D.C., 1987), p. 89, which
shows that the effective rate of protection of the Republic of Korea and Singapore are particularly low. Hong Kong is well known as a relativelyunprotected economy.
46

modity prices, the depreciation of the dollar and a pressingneed to increase earnings of convertible currencies. The restructuring and economic reform of these economies alsoplayed a role. The volume of their exports increased byaround 3 per cent in 1987, less than in 1986. The slow-downwas entirely due to a slower growth of exports of the SovietUnion. Nevertheless, growing at 4 per cent in 1987, the exports of that country were the main source of growth of theEuropean centrally planned economies as a whole. Exportsofthe Soviet Union to the market economies increased by 10per cent. Exports of the Eastern European economies increased only slightly above their 1986 rate of around 2 percent. As in 1986, exports of the European centrally plannedeconomies to the market economies grew faster than exportsamong centrally planned economies.
Imports of the European centrally planned economiescontinued to decline, falling by around 1 per cent in 1987after a similar decline in 1986. Imports of the Soviet Unionfell by about 2 per cent, following a 5 per cent fall in 1986.Lower fuel priCes in dollar terms and the depreciation of thedollar against other convertible currencies largely explainthe fall in imports of that country in 1986 and 1987. Importsof the Eastern European economies increased only marginally, owing chiefly to a deteriorating current-account position and in some cases worries about their external debt.Thus both Poland and Romania, two of the large debtors,significantly reduced imports in 1987.
47
The overall trade balance of the European centrallyplanned economies improved in 1987 (see table III.8). TheSoviet Union, which had a large trade deficit with the developed market economies in 1986, had a small surplus the following year. The Eastern European economies maintained asmall surplus with the developed market economies. Thetrade surplus of the European centrally planned economieswith the developing countries remained substantial and increased in 1987.
Developments in China's foreign trade were very largelydetermined by the pace and pattern of growth of the domestic economy and the continuing policy of outward-orientation of the economy. The volume of exports increased by anestimated 27 per cent in 1987, after an 18 per cent growth in1986. Much of the increase was in the export of manufactures, especially textiles and light industrial goods, domesticproduction of which rose sharply. The growth of exports ispartly attributable to the effective depreciation of the yuanrenminbi against the yen and the major European currencies. Imports had been growing very rapidly in the early andmid-1980s, almost 60 per cent in 1985 alone. This growth,however, had to be curtailed for the second year running,following a sharp deterioration of the trade balance in 1985.The volume of imports declined by over 8 per cent in 1987after, an almost 20 per cent drop in 1986. The sharp increasein exports, an improvement in oil prices and the reduction inimports reduced the country's trade deficit from $12 billionin 1986 to around $3 billion in 1987.


Chapter IV
INTERNATIONAL FINANCE, DEBT AND INSTABILITY
Three sets offinancial events captured the attention ofpolicy makers around the world in 1987: severe strains in theinternational strategy for managing developing countrydebt, the need for central banks to finance increasedamounts of the current-account deficit of the United States,and the October crash in all the major stock markets of theworld. These developments highlighted the instability of international financial relations in the late 1980s. As it turnedout, however, none of the events erupted into a full-blowninternational crisis, but the potential for crisis remained.
A brief review of the global international financial accounts shows that there were no sharp breaks with the recentpast (see table IV.l). The aggregate current-account deficitof the developing countries shrank considerably in 1987, after climbing suddenly in 1986. But both the 1986 and 1987changes were largely due to the sharp swing in petroleumprices, down in 1986 with a partial recovery in 1987. On theother hand, the accounts of the energy-importing developingcountries seem to have improved considerably since mid-
decade, registering a deficit of under $10 billion in 1986 andunder $5 billion in 1987; under $10 billion is forecast for1988. These figures are very much the result of the strongperformance of three Asian economies-Hong Kong, theRepublic of Korea and Taiwan, Province of China-whosetotal annual surpluses on current-account have been above$20 billion since 1986. The current-account deficit of theother energy-importing countries has been about $30 billiona year since 1985. Although they benefited from the fall inoil prices in 1986, they were hurt by the fall in the prices oftheir commodity exports. Their trade balance-a deficitwas virtually the same in 1987 as it was in 1985. In the sameperiod the trade surplus of the three Asian economies morethan doubled (see table A.III.6).
The international financial accounts of the developedeconomies remain highly differentiated, the United Statesbeing the most notable deficit country and the Federal Republic of Germany and Japan being the largest surplus countries. The imbalances grew again in 1987, to -$149 billion
Table IV. I. World balance of payments on current account,' by country group1980-1988
(Billions of dollars)
1980 1982 1984 1985 1986 1987" 1988'
Developed market economies -36.9 -6.7 -39.0 -21.7 14.1 -12.7 -17.0
Large industrial countries -10.5 15.2 -37.8 -24.5 13.4 -10.6 -11.0of which:
Germany, Federal Republic of -6.8 11.3 16.0 22.9 46.1 55.2 52.0Japan -9.4 8.3 36.5 50.1 86.7 88.7 75.0United States 8.4 -1.2 -96.6 -102.9 -127.2 -148.5 -128.0
Other industrial countries -26.4 -21.9 -1.2 2.9 0.8 -2.1 -6.0
Developing countries 36.7 -77.5 -29.9 -29.5 -45.6 -9.3 -13.0
Capital-surplus countries 105.8 16.2 -2.2 8.0 -8.6 5.6 5.0Capital-importing countries -66.7 -99.6 -30.1 -26.0 -29.8 -14.5 -20.0
Energy exporters 2.1 -34.9 -0.2 -3.5 -20.9 -10.0 -12.0Energy importers -68.8 -64.7 -29.9 -22.5 -8.9 -4.5 -8.0
Recent surplus economies' -7.4 -1.6 7.1 10.4 22.5 27.0 22.5Other -61.5 -63.1 -37.0 -32.9 -31.4 -31.5 -30.5
China -2.4 5.9 2.4 -11.5 -7.2 -0.4 2.0
Centrally planned economiesof Europe' -5.2 3.3 10.0 2.3 -0.2 7.0 3.5
Eastern Europe -8.3 0.4 3.8 2.0 -1.4 0.6 -1.0Soviet Union 3.6 3.5 6.6 0.5 1.4 6.8 5.0
Residual' 5.5 80.9 58.9 48.9 31.7 15.0 26.5
Source: Department ofInternational Economic and Social Affairs ofthe United Nations Secretariat, based on dataof IMF, other official national and international sources and private sources.
a Balance of payments on goods, services and private transfers.b Preliminary estimates.c Forecast, rounded to the nearest half-billion dollars (see chap. II for assumptions and other forecast details).d Hong Kong, Republic of Korea and Taiwan, Province of China.e Balance with market economies; total includes estimated investment income deficits of CMEA banks.f Reflects errors in reported data, balances of economies whose data are not included, and timing asymmetries in
national inflows and outflows. Errors include under-reporting of services earnings, especially involvinginvestment income channelled through offshore financial centres and non-factor services exported by thedeveloped market economies to energy-exporting countries.
49

for the United States and $144 billion for Japan and the Federal Republic of Germany taken together (all measured asthe balance of payments on goods, services and privatetransfers). The forecast for 1988 is that this imbalance willbegin to narrow, although the improvement will not belarge. In addition, the net current-account position of thedeveloped market economies is forecast to remain unchanged, so that the reduction in the deficit of the UnitedStates is essentially matched by the reduction in the sur-
pluses of the Federal Republic of Germany and Japan; therest of the world will be largely unaffected.
In any event, the forecast assumes no sharp break in thetrade or financial relationships of the major groups of countries: developed, developing and centrally planned economies. Given the unresolved international financial difficulties that are the focus of the present chapter, the forecastshows the likely outcome of another year of muddlingthrough.
Debt and the negative transfer of financial resourcesof developing countries
The world debt crisis has been a central topic of international concern from at least 1982. Since then, many treatments have been recommended. Of those tried, some alleviated the situation in debtor countries. Yet, as at early 1988,few would argue that the problem is close to being solved.The word "crisis" seems inappropriate: it generally impliesa decisive turning point, a crucial event, something of relatively short duration. In 1982, the debt crisis was thought ofas a liquidity problem; today it is widely regarded as a question of insolvency.
The narrowed flow of resources to the capital-importingdeveloping countries
The debt problem has mainly affected the developingworld, although it is a problem neither of all developingcountries nor exclusively of developing countries. But thedebt crisis affected so many developing countries that financial indicators calculated for the aggregate of all the developing countries that are conventionally thought of as beingnet users of foreign capital began to show unusual results.
Table IY.2. Net transfer of financial resources of the capital-importingdeveloping countries, 1980-1987
(Billions of dollars)
1980 1982 1984 1985 1986 1987"
Transfer on account ofdirect investment"
Net investment flow 6.4 7.9 6.2 7.5 5.7 7.5Net investment income -10.9 -10.0 -8.8 -8.1 -7.0 -8.5
Net transfer -4.5 -2.1 -2.6 -0.6 -1.3 -1.0
Net transfer on account ofprivate credit flows'
Net credit flow 34.0 24.2 8.8 2.0 1.6 -1.0Net interest paid -18.5 -42.4 -41.4 -39.3 -33.6 -31.5
Net transfer 15.6 -18.2 -32.5 -37.2 -32.0 -32.5
Net transfer on account ofofficial flows"
Official transfers (grants) 13.5 11.3 12.5 14.4 14.4 15.0Net credit flow 22.0 29.5 25.0 14.2 15.0 13.5Net interest paid -6.2 -8.8 -11.8 -13.5 -16.2 -17.5
Net transfer 29.2 32.0 25.7 15.2 13.1 11.0
Total transfer 40.3 11.8 -9.5 -22.7 -20.1 -22.5
Source: Department of International Economic and Social Affairs of the United Nations Secretariat,based on IMF, Balance of Paymellts Statistics: World Bank, World Debt Tables; and other national andmultilateral sources. Data are for a sample of 98 countries for which adequate information was available.
a Preliminary estimate, rounded to the nearest half-billion dollars.
b Direct investment income excludes retained earnings and investment flow is shown net of reinvested earnings. In principle, retained earnings should be treated as paid out to foreign shareholders and returned as new investment flows. However, since reporting of these data is highly incomplete, and since the two items have completely offsetting effects on the net transfer, they areomitted here.
c Including long-term and short-term flows of foreign private liabilities and assets of the developingcountries.
d Including use of IMF credit and other international monetary arrangements.
50
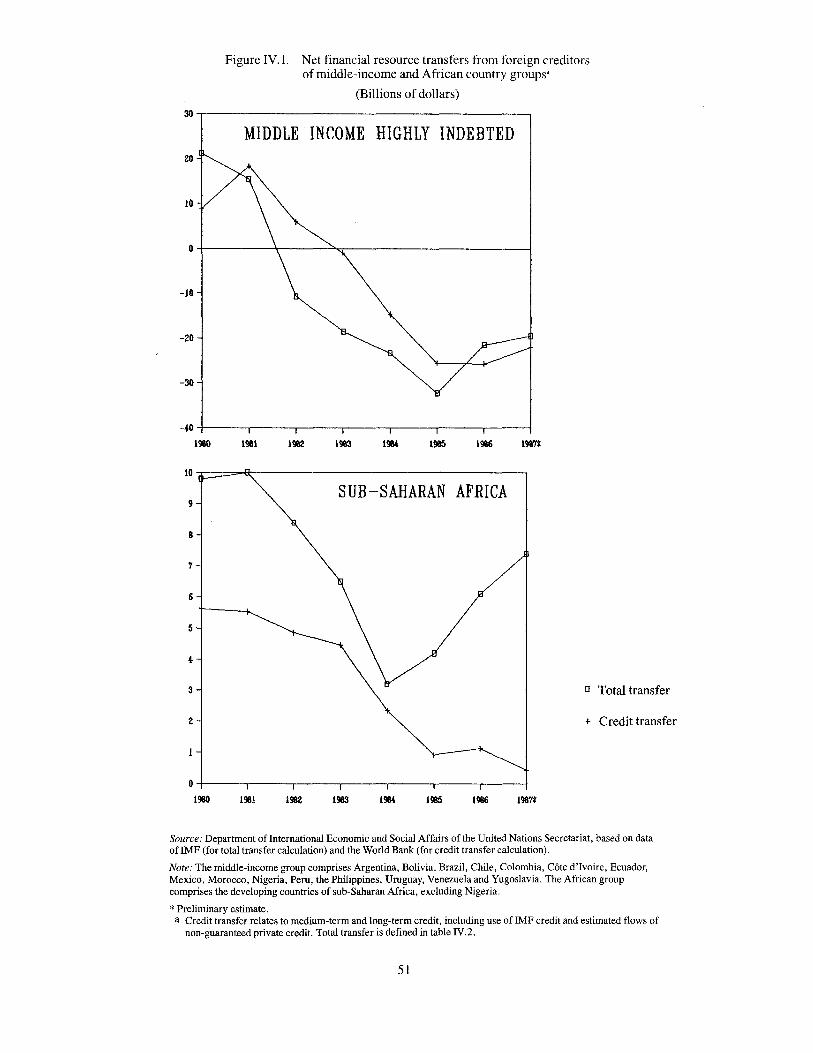
Figure IV. I. Net financial resource transfers from foreign creditorsof middle-income and African country groups"
(Billions of dollars)
30.,.....------------------------,MIDDLE INCOME HIGHLY INDEBTED
20
10
O+------\-----"'''<:r'""--------------!
-10
-20
-30
SUB-SAHARAN AFRICA
-40
1960 1981
10
9
8
7
6
5
4
3
2
1983 1985 1986
o Total transfer
+ Credit transfer
1987*19861985198419831981
O+-----,---,-----.---,-----.---~--__l
1980
Source: Department oflnternational Economic and Social Affairs of the United Nations Secretariat, based on dataoflMF (for total transfer calculation) and the World Bank (for credit transfer calculation).
Note: The middle-income group comprises Argentina, Bolivia, Brazil, Chile, Colombia, Cote d'Ivoire, Ecuador,Mexico, Morocco, Nigeria, Peru, the Philippines, Uruguay, Venezuela and Yugoslavia. The African groupcomprises the developing countries of sub-Saharan Africa, excluding Nigeria.
* Preliminary estimate.a Credit transfer relates to medium-term and long-term credit, including use of IMF credit and estimated flows of
non-guaranteed private credit. Total transfer is defined in table IV. 2.
51

In particular, the net transfer of financial resources-defined as the net capital or resource flow minus the net payment of interest and dividends-turned negative in 1984 andhas remained negative, showing a net outflow of at least $20billion in each of the past three years (see table IV.2). Although the total capital flow (i .e., the sum of credit, directinvestment and grants in aid) to these countries has remainedpositive, the net payment of interest and dividends has become the larger amount. The relationship to the debt problem is clear: the part of the capital flow that has shrunk is thecredit flow and the part of the investment income paymentthat has grown is the interest paid.
The relationship between the overall net transfer and thetransfer related to foreign lending is most clearly seen in thegroup of countries that has been a focus of international discussions of debt and development, namely, the 15 middleincome countries associated with the 1985 debt-managementproposal of the United States Secretary of the Treasury. I Indeed, the negative transfer of resources of the aggregate ofdeveloping countries, shown in table IV.2, is largely a reflection of the transfer from this group. As these countriesare not, in general, recipients of large amounts of grantassistance and since direct investment flows have been relatively stagnant, changes in the overall net transfer have beenclosely related to changes in the net transfer arising fromforeign credit activities: they were largely responsible forthe substantial positive net transfers in the years leading upto 1982 and for the negative transfers thereafter.
Figure IV.1 shows for this group of countries the overallmeasure of the net transfer of financial resources and the nettransfer arising from medium-term and long-term foreigncredit flows. 2 The bulge in 1982-1983 in the difference between the overall net transfer measure and the net foreigncredit transfer shown in the figure has proved temporary. Tothe degree that the bulge was due to what various authorshave described as "capital flight", subsequent data suggestthat capital flight is now, at least, a less serious problem. 3
Significantly improving the overall net transfer of resourcesto the middle-income highly indebted countries will thus require major adjustments in the financial relations of thosecountries with their foreign creditors. As almost 70 percentof their debt is with private creditors, predominantly foreigncommercial banks, this will largely entail new relationshipswith the banks.
Figure IV.1 also shows the relationship of the net foreigncredit transfer and the overall net financial transfer for asecond group of countries, one that has been a special focusof policy attention in donor countries, namely, countries ofsub-Saharan Africa. A group of those countries, excludingNigeria, has been obtaining a small positive net transferfrom medium-term to long-term foreign lending. 4 Reflecting the dominant share of official lenders to the region, accounting for 70 percent of the debt, all of the positive transfer has been from official sources, although individual official creditors have become net recipients of resources. Inparticular, IMF received almost $1.2 billion in net resourcetransfers from the region in 1987. It is also important that thenet transfer from creditors is much reduced from the levelsof the early years of the decade: $5 billion annually duringthe period 1980-1983 has been reduced to roughly $1 billiona year since 1985. During the first half of the decade, aboutthe same drop took place in the overall net transfer, calculated by adding together all sources of flows. The contribution of foreign creditors has thus virtually disappeared, but,more recently, the overall transfer to the group has recovered part of its initial decline as official grant assistance hasgrown (and as 'repayment arrears, which are treated in partas short-term credit flows, have accumulated).
The economic meaning of the shift in resource transfers ismost simply seen in the changes in the balance of trade ingoods and non-financial services. This form ofthe trade balance is roughly the mirror image ofthe net financial transfer,the difference between the two being the net change in official reserves (see box IV.1). Usually, the trade balances ofdeveloping countries are negative and international financehelps to pay for imports, investment and consumption. Aspositive net resource transfers fell, the financial contributionfell and the trade deficit moved to zero. As the resourcetransfer became negative for some countries, their trade balances moved into surplus.
Since the net transfer for all the capital-importing countries combined turned negative, large amounts of domestically earned foreign exchange have had to be transferredabroad instead of being used at home. That is, the roughly$20 billion annual resource transfer out of the developing'countries since 1985 should be seen against the approximately $40 billion annual inward transfer. that took placearound the beginning of the decade.
'I See IMF, Surmnary Proceedings ofthe Fortieth Annual Meeting ofthe Board ofGovernors, 8-11 October 1985 (Washington, D.C., 1985), pp.50-58. The countries, which were not formally mentioned in the proposal but which have been associated with it, are Argentina, Bolivia,Brazil, Chile, Colombia, Cote d'Ivoire, Ecuador, Mexico, Morocco, Nigeria, Peru, Philippines, Uruguay, Venezuela and Yugoslavia.
2 Information on the flow of short-term credit and interest paid is not sufficient to extend the estimates of net transfers from creditors to includethose involving short-term transactions. For example, some data are available only on a basis that lumps together transactions of foreign anddomestic entities, and other data are not directly recorded, such as changes in open-book credit of trading establishments.
3 The concept and issues in the measurement of capital flight were discussed in World Economic Survey 1986 (United Nations publication, SalesNo. E.86.II.C.l), pp.74-76 (see also Michael Deppler and Martin Williamson, "Capital flight: concepts, measurement and issues", StaffStudies for the World Economic Outlook (Washington, D. C. , IMF, August 1987), pp. 39-58).
4 Nigeria, which is included in the group of middle-income highly indebted countries, has itself had a substantial negative net transfer from itsforeign creditors since 1984.
52

Box IV. I. Trade, the net transfer of resources andthe official reserves buffer
The relationship between the net transfer of resources asshown in tableIV.2 and the trade balance is not exact becausean important buffer exists between the two, namely, thechange in official reserves. *For example, in 1986, the foreign exchange earnings of the sample of 98 capital-importing developing countries fell by $19 billion (see the table).No significant relief was accorded in the transfer of resources, but there was a major shift in the reserve accounts.Instead of $6 billion being added to reserves as had beendone in 1985, $5 billion was expended, which meant thatinstead of import expenditure having to fall by roughly theamount of the drop in export earnings, it fell by only $5billion.
One important aspect of the reserves buffer is that it mustbe replenished after use and this is what happened in 1987, atleast at the aggregate level. With the rebound in oil prices, inparticular, and with the continuing rapid growth of exportsfrom some Asian countries, total export earnings of the sam-
pIe of countries rose by $64 billion. Again, the overall netfinancial transfer from these countries was largely unchanged; but this time, instead of reserves being drawndown by $5 billion, they were built up by $7 billion.
Reserve accumulation-along with the increase in thevalue of the non-dollar portion of reserves arising from thefall in the dollar's exchange rate-has returned the capitalimporting developing countries as a whole to the reservelevels of the early 1980s, both in terms of dollar value and inrelation to total import expenditure (see table A.III.7). Butthe distribution of reserves among countries remains highlyuneven, sub-Saharan Africa, for example, having not eventwo-months of import coverage. Moreover, when reservescover less than three-months of total expenditure on imports, interest and other categories, as they do for mostcountries, there remains little room for manoeuvre when export earnings drop, as was seen in aggregate in 1986 and formany countries, particularly in Africa, in 1987 as well.
Trade, resource transfers and reserve changes ofthe capital-importing developing countries
(Billions of dollars)
1980 1982 1984 1985 1986 1987'
Trade accountb
Exports 388.2 379.7 404.7 391.8 373.2 437.5Imports -412.3 -413.8 -376.5 -363.0 -357.9 -408.0Balance -24.1 -34.1 28.2 28.8 15.3 29.5
Net transfer ofresources 40.3 11.8 -9.5 -22.7 -20.5 -22.5
Use of officialreserves' -16.3 22.4 -18.7 -6.1 4.8 -7.0
Source: Table IV.2 and the sources cited therein (sample of98 countries).a Preliminary estimates rounded to nearest half-billion dollars.b Trade in goods and services other than investment income, and private transfers.c Additions to reserves are shown as negative numbers.
* For a formal derivation of the relationship between reserve changes and the net transfer, using national income accounting concepts, see WorldEconomic Survey 1986 (United Nations publication, Sales No. E.86.II.C.l), annex III, "Definition and measurement of the net transfer ofresources" .
Social costs of the transfer have been high.5 Moreover,there is little controversy that economic recovery requires astepped-up investment effort that is not feasible with the current trends in resource transfers. That investment shareshave been very closely related to the net transfer is illustrated in figure IY.2 for the middle-income highly indebtedcountries and the countries of sub-Saharan Arica, excluding
Nigeria. In the middle-income countries, pre-crisis rates ofinvestment need to be restored. In sub-Saharan Africa, thoserates were already woefully inadequate, not only in comparison with the rates that had become standard in other regionsof the developing world, but also given the depth of the development problem facing those countries.
5 See Giovanni Andrea Cornia, Richard Jolly and Frances Stewart, Adjustment with a Human Face: Protecting the Vulnerable and PromotingGrowth (Clarendon Press, Oxford, 1987); papers prepared for the International Conference on the Human Dimension of Africa's EconomicRecovery and Development, Khartoum, 5-8 March 1988 (Economic Commission for Africa documents ECA/ICHD/88/l-50); and "Report ofthe Working Group on Human Resource Development", paper prepared for the United Nations Committee for Development Planning,twenty-fourth session, 12-15 April 1988.
53

Figure IV.2. Net resource transfers and investment in middle-incomeand African country groups
(Percentage ofGDP)
MIDDLE INCOME HIGHLY INDEBTED26
U
22
20
18
16
I!
12
10
8
6
!
2
0
-2
-!
-6
1980 1981 1982 1983
SUB-SAHARAN AFRICA
+ Investment
a Net transfer
1987:t1986198519M198319821981
21-,----------------------,
20
19
18
17
16
15
I!
13
12
11
10
9
8
7
6
5
!
3
2-t----,-----r------,----,r----.----.----j
1980
Source: Department ofInternational Economic and Social Affairs of the United Nations Secretariat, based ondata ofIMF (see the note to figure IV. I for the composition of the country groups; net transfer includes changes inreserves, for consistency with national income accounting concepts).
*Preliminaryestimate.
54

Components of the net financial transfer
As noted above, the largest source of the negative transferhas been private credits. These are primarily bank loans, butinclude private suppliers' credits, small amounts of bond finance and a large residual in balance-of-payments statisticsthat is thought to comprise mainly short-term commercialand bank credits to and from the developing countries. In1987, there was a small net private credit outflow, accordingto preliminary estimates. On the positive side, however, apart of that result was due to the decision of the Republic ofKorea to apply some of its recent balance-of-payments surpluses to reducing its outstanding debt. 6 Most other countries, in contrast, are in need of considerably more financialresources than are currently being made available to them.
In the early years of the decade, developing countries tookup to 40 per cent of total international medium-term bankcredits. Since 1985, they have taken about 17 percent, muchof which is "forced lending" arranged as part of debt-re-
scheduling operations and used mainly to help pay debtservicing on already outstanding debt. In 1987, forced lending made up almost half of the total of gross medium-termloans that the private markets extended to developing countries (see figure IV.3).
The net transfer provided through official channels is theone major financial category of flows that is still positive,albeit reduced by some 60 percent from the levels in theearly years of the decade. Official assistance in the form ofgrants has not significantly exceeded the levels of the beginning of the decade although it has recovered, if slowly, fromthe trough of 1982.
In 1987, if not for the grants, the net transfer through official sources would also have been negative, according topreliminary estimates of the United Nations Secretariat.Data on the 1987 flow of official development assistancefrom member countries of the Development AssistanceCommittee (DAC) of OECD will not be available until June,
Table IV.3. Resource commitments of multilateral development institutions,1980-1987'
(Millions of dollars)
1980 1982 1984 1985 1986 1987
Financial institutions
African Development Bank 571 766 879 1 154 1639 2 140Asian Development Bank 1929 1 837 2380 2093 2047 2439Caribbean Development Bank 45 45 65 48 59 46Inter-American Development
Bank 2341 2793 3615 3102 3057 2407International Fund for
Agricultural Development 394 338 211 131 147 233World Bank group 13 434 13 098 13 528 17896 18294 20580
World Bank 8802 9801 9721 13 321 13 882 15310International Development
Association 3817 2832 3222 3541 3373 3841International Finance
Corporation 815 465 585 1034 1039 1429
Subtotal 18714 18877 20678 24424 25243 27845
Operational agencies of theUnited Nations
United Nations DevelopmentProgramme' 639 621 531 567 656 809
United Nations Population Fund 146 115 134 141 116 134United Nations Children's Fund 279 405 204 452 248 330World Food Programme 479 613 925 642 629 621
Subtotal 1543 1 754 1794 1 802 1649 1 894
Total commitments 20257 20631 22472 26226 26892 29739
Memorandum itemCommitments in units of
1980 purchasing power' 20257 22425 26130 30145 26109 25637
Source: Annual reports and information supplied by individual institutions.a Loans, grants, technical assistance and equity participation, as appropriate; all data are on a calendar year basis.b Including UNDP-administered funds.c Total commitments deflated by the United Nations index of mapufactured export prices in dollars of developed
market economies, 1980= 100 (see United Nations, Monthly Bulletin ofStatistics, March 1988 (STIESA/STATISER.Q/183)).
6 In the first three quarters of 1987, the Republic of Korea reduced its liabilities to international commercial banks by almost $6 billion at constantexchange rates, after an almost $2 billion reduction in the fourth quarter of 1986, according to data of the Bank for International Settlements(International Banking Developments, Third Quarter 1987, Basle, February 1988).
55

Figure IV.3. Gross capital market borrowingby developing countries
(Billions of dollars)
60,---------------------------,
50
40
30
0 ..........- ....-----...----.......----...---
20
10
1981 1962 1963 1964 1965 1966 1967
o Forced bank loans
[:::::'id Voluntary bank loans
_ Bonds
Source: Data from OECD, Financial Statistics Monthly, re-aggregated into World Economic Survey country grouping. Forced bank loans are arrangements for' 'new money" made as part of multilateral agreements torestructure commercial bank debt.
but if 1986 commitments are a guide, the net disbursementsof DAC aid are poised to rise significantly, although only innominal terms.? Partial year data on development financecommitments of Arab national and regional development institutions continue to suggest that the aid efforts made earlyin the decade by oil-exporting countries are no longer feasible (see table A.IlL8).
Multilateral development financing activities are showingsignificant dollar increases, but they do not translate into"real" additions to assistance. Resource commitments bythe multilateral financial institutions in 1987 rose by morethan 10 percent in dollar terms (see table IV.3). Falling shortof the nearly 17 percent increase in 1985, it neverthelessrepresents a recovery from the 2.5 percent rise in 1986. Total resource commitments have now reached an annual levelof $30 billion. However, when deflated by the index ofprices of manufactures, multilateral commitments werelower in 1987 than in 1986, and in 1986 they were belowthose of 1985, as the table indicates.
Preliminary data suggest that loan disbursements in nominal dollar terms increased in 1987 by around 5 percent, ending the previous year's decline. In real terms this is quitedisappointing, especially in the light of increasing repayment obligations on outstanding loans.
The lag between commitments and disbursements continues to be important. Indeed, for the World Bank group,which accounts for almost 70 percent of the multilateral total, the rise in resource commitments has been increasinglyconcentrated on lending that is intended to be quick-disbursing and in support of adjustment efforts. In fiscal year 1987,which ended in June that year, the share had already risen to23 percent from 19 percent the year before. The agreementof March 1988 to increase the World Bank's capital base by$75 billion will significantly expand the Bank's lending ability.
At the regional development banks, important developments have also been taking place, while the dollar value ofcommitments by the operational agencies of the United Nations reversed their overall decline of 1986. Implementationof the international policy of strengthening the African Development Bank continues, and lending commitments thererose more than 30 percent in 1987, reaching almost fourtimes the lending activity of 1980. Gross disbursements in1987 also rose at about the same rate. Lending commitmentsat the Asian Development Bank also rose sharply, the resultof its decision to expand programme lending in support ofpolicy adjustment. The strong growth in lending was largelydue to the sharp increase in the concessional loans of theAsian Development Fund (ADF), particularly to Bangla-
7 aDA commitments of DAC countries rose 21 percent in 1986 in dollar terms, after stagnating since 1983 (see OECD, DevelopmentCo-operation, 1987Report (Paris, December 1987), p.256). However, the real value of those commitments when disbursed would be far less,owing especially to the devaluation of the dollar; if disbursed entirely in 1987, they would have represented an increase on.5 per cent measuredin purchasing power over manufactured exports of DAC countries; if disbursed entirely in 1986, they would have represented an increase of 2per cent.
56

Figure IVA. Net flow of IMF credit to the main regionsof the developing world
(Billions ofdollars')
8r---------------------------,
6
2
o
....(L-__.-- .-- .-- .--_-.J
1981 1983 1985 1987
• Africa 'i!iml Asia Iv:::A Western hemisphere _ Other
Source: Department ofInternational Economic and Social Affairs of the United Nations Secretariat, basedon IMF, International Financial Statistics.
a Net flows in SDRs, including those of the IMF Trust Fund, converted to dollars at yearly averageexchange rates.
desh. In addition, the Bank allowed Indonesia access to theFund. Gross disbursements registered strong gains, as recent problems of limited absorptive capacity and lack of local currency counterpart financing in Asia have eased somewhat. At both regional development banks, the increase incommitments was concentrated in concessionallending, inrecognition of the need to provide assistance to borrowingcountries on terms that are more affordable.
In sharp contrast, resource commitments of the InterAmerican Development Bank, even in nominal dollars,plunged from $3.1 billion in 1986 to $204 billion in 1987.This contraction in lending levels reflected the continuingeconomic recession that has affected the region since theearly 1980s and, perhaps more important, the dispute on thevoting power of members in taking key decisions. That dispute has stood in the way of agreement on the seventh general increase of the Bank's resources.
One large source of multilateral financial support of developing countries has instead become a net recipient of resources from those countries, namely, IMP. Even excludingFund charges (i.e., interest payments), IMF has been a netrecipient of funds from these countries since 1986; but theamount returned in 1987 rose to almost $5 billion (see tableA.II1.9). The reverse flow applied to almost every Fund"window" and to every geographical region (see figureIVA).
It is sometimes argued that IMF is not a development finance institution but is more like a revolving fund. In this
argument, it is presumed that the emergency ends within theprescribed period of Fund-supported adjustment programmes. In 1984, that period averaged 14 months. By1987, it had risen to 26 months (see table A.II1.9). Thislengthening is encouraging, as is now the recognition by theFund's Governors that the Fund needs to provide largerscale, longer-term and concessional resources for the lowincome countries seeking its assistance. The Fund is nowproviding such assistance through the Enhanced StructuralAdjustment Facility, created at the end of 1987. It is nevertheless troublesome that adjustment is still a major problemand that the Fund has found itself agreeing to an average of27 separate adjustment programmes a year since 1980. Inthat regard, 1987 was an average year. The time when theimperative to achieve adjustment in the balance of paymentswill be supplanted by a development imperative continued torecede.
Debt and the heavy debt-servicing burden
Several developing countries, the sum of whose population accounts for over half the population of the developingworld, do not currently have serious debt problems as commonly understood. 8 Those countries may often be strugglingwith serious development problems, but they meet theirdebt-servicing obligations without disruption because thoseobligations are not overly large relative to their export earnings. In some cases, this is mainly the result of the earlierreluctance of policy makers to accumulate large amounts ofthe kinds of debt that entail heavy debt-servicing payments.
8 Including China among the developing countries raises the population proportion to about 70 percent.
57

Box IV.2. Debt management and integration of socialist countriesinto the international financial system
Centrally planned economies have traditionally had ratherlimited relations with the international financial system.However, this has been changing since the 1970s, marked bythe increasing number of socialist country members of IMFand the World Bank, by institutional experimentation to enhance economic flexibility and openness in foreign trade,and by the growing use of foreign private credit flows andforeign direct investment in joint ventures.
By the early 1980s, three of the centrally planned economies of Europe had accumulated foreign debts that had become an especially heavy burden to service. These wereHungary, Poland and Romania, which together account formore than 80 percent of total Eastern European debt. By theend of 1987, according to national authorities, the gross debtin convertible currencies of Hungary had reached $18 billion, representing four times the value of merchandise exports to non-socialist countries; that of Poland exceeded $37billion, representing almost six times the value of those exports; and that of Romania stood at $6 billion, which wasequal to the value of those exports.
The international financial markets reacted early in thedecade to the debt strains of Eastern Europe by reducingcountry risk ratings, which reached their lowest level in1982-1983, at the bottom of the payments crisis. Adjustmentmeasures and world economic recovery improved the tradesituation and the ratings recovered, peaking in 1985, afterwhich the trade of the Eastern European region again deteriorated.
Among the different approaches that countries have takento cope with the debt burden, Romania's has been unique.Like other indebted countries, Romania has been undergoing debt restructuring through renegotiation, but it has alsobeen reducing the level of foreign debt outstanding. It isseeking to repay all its hard-currency debt by 1990 and torefrain from resorting to any form of foreign credit. a Hungary has given high priority to avoiding debt renegotiations,although it is undertaking major economic restructuring andis seeking to sharply curtail the growth of its debt. b
In retrospect, some countries of Eastern Europe may besaid to have overextended their use of international financialmarkets in the 1970s, based on expectations of interest ratesand debt-servicing capacity that in the end were over-optimistic, as in the case of many developing countries. TheSoviet Union, in contrast, whose economy is in any event
less dependent on trade, has long taken a highly cautiousapproach to external borrowing. Soviet activity in privatecredit markets has traditionally been low-key, the bulk of itinvolving short-term finance. However, financial experimentation has grown recently, as in the floating of a smallSwiss franc bond issue by the Bank for Foreign EconomicRelations in January 1988, as a test for future Soviet issues.
The evolution of new Soviet approaches to external financing will be heavily influenced by the pace of domesticreform, including reform in the area of finance, which involves decentralization and creation of a potentially morecompetitive banking system. A new sign of this is that Sovietbanks have begun to provide hedging against exchange raterisks to Soviet firms involved in foreign trade, which is quitea novelty in Soviet banking practice.c Traditionally, thehedging function has been carried out by the State Monopolyof Foreign Trade and Payments and absorbed by the centralgovernment budget. Soviet policy makers are also considering measures to enhance convertibility of the rouble (seechap.VI below).
China has been increasing its activity in international financial markets since 1978.d Foreign financing is to be usedin development and modernization, although cautiously,subject to expected foreign exchange earnings. Over-indebtedness is to be avoided and official and preferably concessionalloans are to be sought whenever feasible. A ceiling onthe debt-service ratio of 15 per cent, used as a guide in theinitial years of reform, has been retained.
Application of these principles, however, at first seemedto elude Chinese authorities-except adherence to a lowdebt-service ratio-as a consequence of the sequence andpacing of the domestic economic decentralization that wasbeing undertaken. Decision-making on external trade, borrowing and domestic industry was decentralized without establishing institutions and indirect policy instruments to replace direct controls. The demand for foreign loans by localauthorities and enterprises exceeded planned amounts andthe current-account deficit soared in 1985. By 1987, grossforeign debt outstanding had more than tripled from the $8billion level of 1980, reaching about $28 billion, althoughthe increase in the past few years has been due in part to therise in the exchange rate of the yen relative to the dollar, aproblem that has affected many countries with relativelyheavy shares of Japanese or European currency debt.
a Executive Political Committee of the Central Committee of the Romanian Communist Party, 28 December 1987 (see Agerpres (Bucharest), 28 December 1987; andScinteza (Bucharest), 29 December 1987, p.1).
b Parliamentary speech of the Prime Minister (see Nepszabadsag (Budapest), 19 September 1987, p. 2);and address by the Deputy Prime Minister (see Magyar Hzrlap (Budapest), 20 February 1988, p. 5).
c B. Fedorov, "Novye funktsii bankov", Ekonomicheskaya Gazeta, No.9 (February 1988), p. 20.d The decision was promulgated at the Third Plenum of the Eleventh Central Committee, held in Decem
ber 1978.
58

To regain control, some degree of recentralization of external borrowing was carried out by authorizing the StateAdministration of Exchange Control to monitor and approvenew debt. In addition, efforts have been made to refinancesome of the short-term commercial debt incurred in financing the current-account surge of 1985-1986. Although improvements have clearly been made, the system ofdebt management remains rudimentary and under strain because ofinappropriate signals from the domestic price system and theinsufficient degree of accountability of local authorities andenterprises.e
Finally, in China, Eastern Europe and the Soviet Union, agreater policy interest has emerged in increasing direct investment by transnational corporations in joint venture projects in their economies. Indeed, since 1986, all the centrallyplanned economies of Europe have passed or substantiallymodified legislation concerning direct investment, exceptthe German Democratic Republic, which uses other formsof co-operation with foreign private corporations. The Soviet Union is in the process of negotiating framework agreements with consortiums of private companies in the UnitedStates and Europe (including banks in Europe). Some members of the consortium would generate foreign exchange
earnings directly, while others would have a primarily domestic orientation. One important advantage of such arrangements, as distinct from individual joint ventures, isthat they would facilitate the repatriation of profits in convertible currencies earned and establish limited convertibility within the consortium.
China reversed its policy towards joint ventures in 1979after two decades of rejection of foreign direct investment asa means of importing technology and capital. Policy and itsimplementation have been evolving since then,! and will undoubtedly continue. Since late 1987, for example, some politicalleaders have been discussing ways of reducing foreignexchange and related restrictions on joint ventures-in particular, by giving virtually full management responsibility tothe foreign investor.
Together, the international financial experiences of thesecountries, in particular with regard to foreign borrowing,seem to highlight a lesson that has also been learned by developing countries, namely, that while international financing provides a great opportunity to increase the resources fordevelopment, excessive use, especially offinancing on commercial terms, can be dangerous.
e China Daily, 21 May 1987, p. 4; and Business Weekly of China Daily, 22 February 1988, p. 1.f See Foreign Direct Investment in the Peoples Republic of China (United Nations publication, Sales
No.E.88.II.A.3).
Some countries were never accorded significant access tocredit because of the fragility of their economies and thepoverty of their people, financial flows having instead beenlargely in the form of grants-in-aid. In yet other cases, large,debts were accumulated, but export growth was very successfully promoted and the terms of trade did not deteriorateto any significant extent. For such countries, the debt problem is a potential one: only if their export earnings were cutback by an economic slow-down in their major markets orby protectionist exclusion of their exports, or if interest ratesjumped appreciably, would their debt-servicing situation belikely to deteriorate seriously.
The reasons that some countries found themselves withexcessive debt burdens and others did not are varied (see, forexample, the different experiences of the socialist countriesof Eastern Europe, the Union of Soviet Socialist Republicsand China described in box IV.2). A key factor is that it takestime for an excessive debt burden to accumulate; three otherfactors are responsible: first, a readily expanded-highlyelastic-supply of credits; secondly, a shared expectation byborrowers and lenders that capacity to pay will not deteriorate in the future, possibly accompanied by a political stalemate or lack of governmental mandate that makes decisiveeconomic policy action difficult to take; and thirdly, a lackof national official accounting and control of the aggregaterun-up of foreign obligations. Indeed, when the debt crisis
59
erupted in some of the major indebted countries, there wasno readily available record of how much debt was outstanding or even how large the Government's own obligationswere. With the benefit of experience, national managementof foreign debt has become a more salient policy issue andeven an area of international co-operation, as shown by thetechnical assistance programmes in debt management offered by UNCTAD and the Commonwealth Secretariat.
Meanwhile, the developing countries that have accumulated excessive debt burdens have been unable to grow out ofthem or "adjust" out of them. Governments have changedand political mandates for decisive action have come andgone without a resolution of the problem. Increasingly, it isrealized that the economic strains of adjustment under aheavy debt burden make it politically impossible to carryprogrammes of policy reform through to completion. Thesolution requires a reduction of the debt-servicing obligations immediately in the long run, which is to say that part ofthe answer for some countries is for creditors-both officialand private-not to receive full, let alone timely, servicing oftheirloans.
The total amount of the loans outstanding to developingcountries-not all of which need be candidates for debt relief-reached almost $1 trillion by the end of 1987 (see table
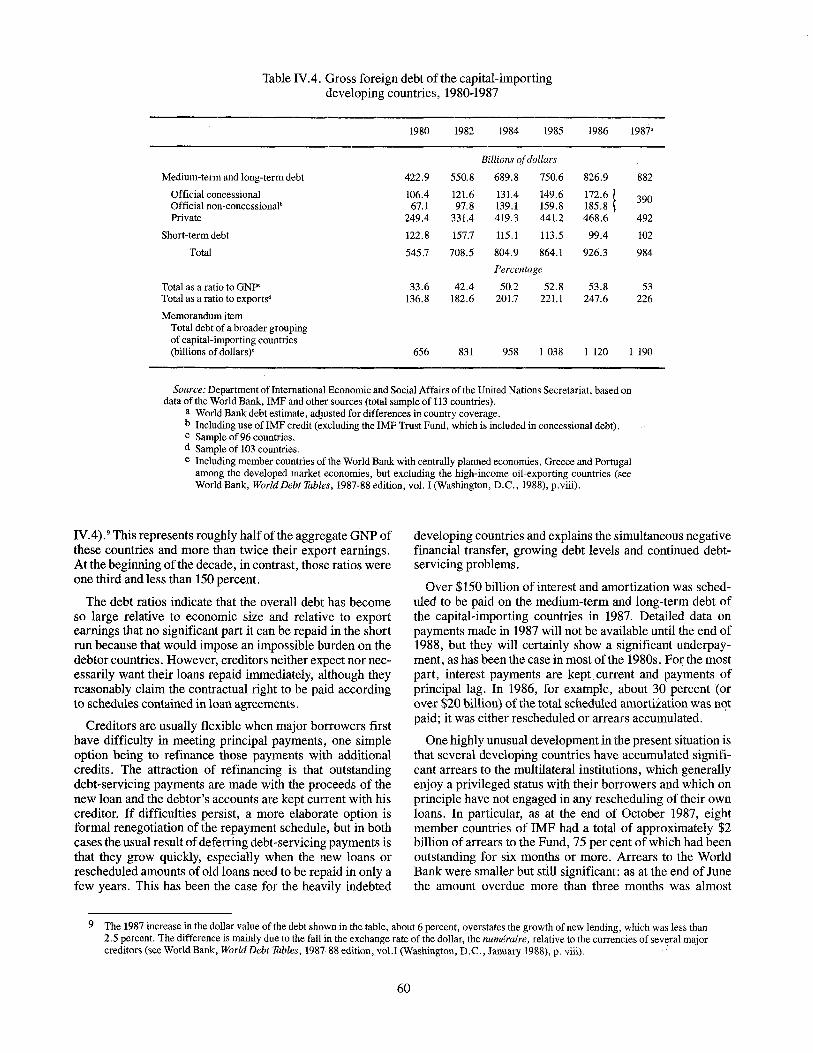
Table IVA. Gross foreign debt of the capital-importingdeveloping countries, 1980-1987
1980 1982 1984 1985 1986 1987"
Billions ofdollars
Medium-term and long-term debt 422.9 550.8 689.8 750.6 826.9 882
Official concessional 106.4 121.6 131.4 149.6 172.6 ~ 390Official non-concessionalb 67.1 97.8 139.1 159.8 185.8Private 249.4 331.4 419.3 441.2 468.6 492
Short-term debt 122.8 157.7 115.1 113.5 99.4 102
Total 545.7 708.5 804.9 864.1 926.3 984
Percentage
Total as a ratio to GNP' 33.6 42.4 50.2 52.8 53.8 53Total as a ratio to exports' 136.8 182.6 201.7 221.1 247.6 226
Memorandum itemTotal debt of a broader groupingof capital-importing countries(billions of dollars)' 656 831 958 1038 1 120 1 190
Source: Department ofInternational Economic and Social Affairs of the United Nations Secretariat, based ondata ofthe World Bank, IMF and other sources (total sample of 113 countries).
a World Bank debt estimate, adjusted for differences in country coverage.b Including use of IMF credit (excluding the IMF Trust Fund, which is included in concessional debt).c Sample of96 countries.d Sample of 103 countries.e Including member countries of the World Bank with centrally planned economies, Greece and Portugal
among the developed market economies, but excluding the high-income oil-exporting countries (seeWorld Bank, World Debt Tables, 1987-88 edition, vol. I (Washington, D.C., 1988), p.viii).
IVA).9 This represents roughly half ofthe aggregate GNP ofthese countries and more than twice their export earnings.At the beginning of the decade, in contrast, those ratios wereone third and less than 150 percent.
The debt ratios indicate that the overall debt has becomeso large relative to economic size and relative to exportearnings that no significant part it can be repaid in the shortrun because that would impose an impossible burden on thedebtor countries. However, creditors neither expect nor necessarily want their loans repaid immediately, although theyreasonably claim the contractual right to be paid accordingto schedules contained in loan agreements.
Creditors are usually flexible when major borrowers firsthave difficulty in meeting principal payments, one simpleoption being to refinance those payments with additionalcredits. The attraction of refinancing is that outstandingdebt-servicing payments are made with the proceeds of thenew loan and the debtor's accounts are kept current with hiscreditor. If difficulties persist, a more elaborate option isformal renegotiation of the repayment schedule, but in bothcases the usual result ofdeferring debt-servicing payments isthat they grow quickly, especially when the new loans orrescheduled amounts of old loans need to be repaid in only afew years. This has been the case for the heavily indebted
developing countries and explains the simultaneous negativefinancial transfer, growing debt levels and continued debtservicing problems.
Over $150 billion of interest and amortization was scheduled to be paid on the medium-term and long-term debt ofthe capital-importing countries in 1987. Detailed data onpayments made in 1987 will not be available until the end of1988, but they will certainly show a significant underpayment, as has been the case in most of the 1980s. For the mostpart, interest payments are kept current and payments ofprincipal lag. In 1986, for example, about 30 percent (orover $20 billion) of the total scheduled amortization was notpaid; it was either rescheduled or arrears accumulated. .
One highly unusual development in the present situation isthat several developing countries have accumulated significant arrears to the multilateral institutions, which generallyenjoy a privileged status with their borrowers and which onprinciple have not engaged in any rescheduling of their ownloans. In particular, as at the end of October 1987, eightmember countries of IMF had a total of approximately $2billion of arrears to the Fund, 75 per cent of which had beenoutstanding for six months or more. Arrears to the WorldBank were smaller but still significant: as at the end of Junethe amount overdue more than three months was almost
9 The 1987 increase in the dollar value of the debt shown in the table, about 6 percent, overstates the growth of new lending, which was less than2.5 percent. The difference is mainly due to the fall in the exchange rate of the dollar, the numiraire, relative to the currencies of several majorcreditors (see World Bank, World Debt Tables, 1987-88 edition, voLl (Washington, D.C., January 1988), p. viii). .
60

Figure IV.5 . Debt-servicing ratios of middle-incomeand African country groups
(Percentage of exports of goods and services)
50
48
46
«42
40
38
35
34
32
30
28
26
U
22
20
18
16
l!l8O lCJ81 1CJ82 1CJ83
D Middle-income group
+ African group
Source: Based on data from IMF, World Economic Outlook (Washington, D.C., April 1988), adjusted. Debtservicing includes interest paid on all debt plus principal payments on medium-term and long-term debt, including debt to IMF (see the note to figure IV. 1 for the composition of the country groups).
*Preliminary estimate.
$200 million. 10 By March 1988, at least five countries werein arrears to the Bank.
Difficulties in timely debt-servicing have been concentrated in two regions: Africa and Latin America and the Caribbean. The problem is most readily analysed, however, interms of groups of countries that do not follow geographicallines closely, such as the 15 middle-income, highly indebtedcountries, two thirds of which are Latin American, butwhich also include three major African economies, and thedeveloping countries of sub-Saharan Africa, excluding Nigeria.
In the late 1960s and early 1970s, it was taken as a rule ofthumb that a country's debt-servicing ratio should not exceed 15 percent of its export earnings. In 1981, the ratio forthe middle-income highly indebted group of countries wasmore than twice that figure and the ratio for sub-SaharanAfrica exceeded 20 percent (see figure IV.5). For the 1980sas a whole, the debt-servicing ratios of both groups of countries have been on an upward trend. The 1982 peak for thegroup of middle-income countries was one indication of theonset of the debt crisis. There was some improvement in
1983, as interest rates fell and the first major wave of debtrenegotiations reduced amortization payments, but the aggregate debt-servicing ratio of these countries has been stuckat roughly 40 percent since 1983. Export earnings began torecover in 1984, but plummeted thereafter. Meanwhile, falling international interest rates and successive rounds of debtrescheduling have kept the debt-servicing ratio from againjumping, except in 1986 when the sharp drop in oil and someother commodity prices depressed export earnings. The improved debt-servicing ratio in 1987 was due to higher exportearnings and lower amortization and interest payments. Butreversals in the last two factors are expected in 1988, whichmay again raise the debt-servicing ratio.
In the case of the sub-Saharan Africa group, the debt-servicing ratio has risen almost without pause. Since over a quarter of that debt is on concessional terms and since much ofthe rest is at fixed interest rates, the upward trend in theaggregate debt-servicing ratio is less ascribable to debt-service trends than to disappointing export trends. Given theslow growth in export earnings, the rise in the debt-servicing ratio was almost inevitable.
10 See IMF "Financial statements of the General Department", quarter"ended 31 October 1987, p. 13, and World Bank, Annual Report, 1987(Washington, D.C., 1987), pp. 181-182.
61

Current management ofthe international debt problem
Despite the statements of spokesmen for creditor institutions and debtor countries and of international financial policy makers, the actual management of the international debtsituation is less a comprehensive strategy being implemented than a tentative, piecemeal and thus far unfinishedscheme. Much has been learned and participants have cometo better appreciate the needs, constraints and abilities ofothers. A consensus on the broad outline of the problem andpolicy needs was reached at a political level in the UnitedNations General Assembly (resolution 41/202 of 8 December 1986) and reiterated in the Final Act adopted by theUnited Nations Conference on Trade and Development at itsseventh session (July/August 1987) and in subsequent international meetings. The issue has been monitored closely bythe Interim Committee of IMF, the joint IMF/World BankDevelopment Committee, and in numerous official and private forums. Yet, with action falling short of needs, collective government pleas for relief continue to be made, notably by the Organization of African Unity at a special summitmeeting held at Addis Ababa at the end of 1987, and by eightLatin American presidents at a meeting at Acapulco, Mexico, also at the end of the year.
But progress, even if insufficient, has been made since1982. A report on the debt situation prepared for the GeneralAssembly at its forty-second session, in 1987, traced improvements through mid-year in the terms of debt rescheduling and discussed innovative features of debt restructuring. 11
Progress has continued to be made so that, for example, theaverage terms of commercial bank rescheduling in 1987were a considerable improvement over those of 1986. Thespread added to the LIBOR interest rate base, which hadbeen 2 percent on average in the first round of negotiations,fell to 1.3 percent in 1986 and to 1.0 percent in 1987. Theaverage grace period rose to five years, from four in 1986and three in 1983 and 1984. The period over which the repayments had to be made was also lengthened, from 10 yearson average in 1986 (6 in 1983) to 15 years in 1987. 12 Theaverage terms should further improve in 1988, if the 20-yearmaturity with an 8-year grace period that Brazil and its creditors agreed to in March is a guide. By the same token, arrangements in the Paris Club for the rescheduling of interofficial debt have been eased, in particular for low-incomecountries, some of which have won 20-year reschedulingswith 1O-year grace periods.
But the atmosphere during much of 1987 was highlystrained and may be characterized as one of fatigue and frustration among debtor countries and disillusionment amongcreditor institutions. Ecuador, which in late 1986 had begunto tap the private financial markets outside the context ofdebt-restructuring agreements, although in a limited wayand under special circumstances, found it necessary in early1987 to unilaterally suspend interest payments to its bank
creditors. Brazil, soon after reaching an unprecedentedagreement in the Paris Club to reschedule bilateral officialdebt without having secured an IMF stand-by agreement,found itself unilaterally suspending interest payments to itscommercial bank creditors. In addition, Bolivia, CostaRica, Cuba, the Dominican Republic, Honduras, Nicaraguaand Peru were explicitly or implicitly in a state of moratorium with their bank creditors for most of the year. 13 In Africa, among the many countries that have fallen into arrears,two stood out. By the end of May, Cote d'Ivoire and Zambiahad to suspend debt-servicing and, especially significant inthe latter case, suspend a difficult and complicated internationally supported adjustment programme for lack of adequate financial resources.
In addition, the commercial banks, most prominently inthe United States, took a new stance towards the debtorcountries. Acknowledging to an unprecedented degree thefinancial weakness of their sovereign loans, banks addedsubstantially to their loan-loss reserves. In some countries, 'this was an initiative of the banks; in others the regulatoryauthorities requested higher provisioning. 14 At the sametime, banks continued to add to their equity, thereby reducing their relative exposure to problem debtors; Europeanand Japanese banks were helped by the effect of the fall inthe exchange rate of the dollar on the local currency value ofdollar-denominated loans.
But although banks took major accounting losses in 1987and debtor countries experimented with unilateral moratoriums, by early 1988 some major debtors and their creditorshad returned to the negotiating table to seek more normalrelationships. At the same time, several countries sought renewed adjustment programmes with IMF and the WorldBank, and both institutions tried to improve their ability toaddress the adjustment needs of the developing countriesthe Bank through a major reorganization and redirection ofactivities, and the Fund through an internal re-examinationof its policies on the use of some of its facilities.
What has occurred is not a return to orthodoxy, but rathera recognition that so far no practical alternatives to "muddling through" have been offered. There is little expectationon any side that muddling through will achieve more than alittle more time in which to find a solution tQ the debt problem. In the meantime, debtor countries continue to be hardpressed to increase exports in an international trading system under strain, while the political need grows in debtorcountries to begin to derive benefits to incomes and growth,while making adjustments under a heavy debt burden.
Novel features of rescheduling
Various solutions to the debt problem, however, are beingattempted through innovations in debt-restructuring that arebeing tested with increasing frequency. In recent years, sev-
11 See the report of the Secretary-General on the international debt situation in mid-1987 (A/42/523), 16 September 1987, sects. V and VI.12 Data for 1987 cover the first nine months (see World Bank, World Debt Tables, ... , p. xxxiv).13 See Economic Commission for Latin America and the Caribbean, "The evolution of the external debt problem in Latin America and the Carib
bean" (LC/G.l497), 16 February 1988, p. 18.14 For a summary of the action taken in 1987 in major creditor countries, see World Bank, World Debt Tables, ... , pp. xxiv-xxvii.
62

eral new features have been added to the menu of optionsfrom which debtors and creditors design their debt-restructuring packages. 15 To a degree, they are aimed at meeting theincreasing reluctance of some creditors, especially smallerbanks, to extend new loans to finance old ones. Many creditors have preferred to reduce their lending exposure to selected debtors, even at a loss. As more and more of the newrescheduling features have been designed, however, theyhave also pointed to new ways of addressing the need of thedebtors to improve their net transfer of financial resourceswithout increasing their debt burden.
Until recently, the major concessions to debtors in renegotiations did not entail significant losses to their creditors.Principal repayments were stretched out over longer andlonger periods, but the extensions themselves were financedat market interest rates. In commercial bank restructurings,spreads over base interest rates and renegotiation fees werereduced, but they had risen to excessive levels at the onset ofthe debt crisis and the newer spreads still exceeded thespreads non-rescheduling countries obtained in the marketfor sovereign risk borrowing. Certainly, participating creditors were required to lend new money to help pay interestcharges and were thereby forced to increase their exposureto troubled borrowers; but losses have not been realized onthose loans either.
Other features of agreements gave banks the option of redenominating their loans into their home currency or another currency, which could spare them the exchange riskfrom devaluation of the original currency, usually the UnitedStates dollar. The banks also were allowed to change thebase interest rate to which the spread was added in figuringinterest charges. Whereas the former change shifted a newexchange risk to the debtor, the latter generally promised alower interest payment. Another arrangement allowedlonger periods between interest payments, from quarterly tosemi-annually to annually, although the net benefit receivedby the debtor depends on the structure of the yield curveover time. The Philippines experimented with a scheme bywhich bank creditors could have the spread over the baseinterest rate paid to them in an instrument referred to as Philippine Investment Notes (PINs). Although the scheme hasbeen discontinued, PINs were to be tradable and, in particular, could be swapped for local equity investments on favourable terms.
Additional features introduced largely for the benefit ofcreditors included putting up the forced "new" money in theform of a trade credit facility rather than straightforwardbalance-of-payments financing. The advantage of theformer to creditors is the self-liquidating nature of trade finance and the association of the credits with actual shipments of goods; for the debtor, the new money is seen to befinancing trade. Creditors have also been offered "on-lending" options, in which the new money is transferred to anew borrower who takes on the repayment obligation. Thishas advantages to banks that have other commercial interests
in the debtor country and wish to give more emphasis toprivate sector banking relations than to sovereign risk lending. New money requirements have also been made morepalatable to banks by arranging them as co-financing ofWorld Bank loans-or "parallel financing" when no formalco-financing is arranged-which entails explicit guaranteesor important cross-default clauses.
Other innovations in 1987 added a new dimension. Insteadof trying to entice reluctant creditors to stay the course andput up new funds, the bank negotiating committees and thedebtors devised measures that allowed creditors to withdrawfrom the process altogether. Indeed many banks, especiallysmaller ones, were already doing so through the secondarymarket in loan participations (in which loans are swapped orsold at a discount) or directly through debt/equity swapschemes in debtor countries. In the latter case, a loan is exchanged for equity in a domestically registered company,often a foreign firm or even a subsidiary of the bank's ownholding company.
Argentina pioneered the new approach in 1987 throughthe introduction of "alternative participation instruments"and "new money instruments" . The former offered creditorbanks the option of exchanging up to $5 million of theirloans (or $30 million if that was their entire exposure) for abond paying lower interest and having a longer maturitythan their existing holdings. For a creditor bank, one advantage of those bonds (known as "exit bonds") was that theamount of "new money" it would have to put up as its shareof the restructuring package would be reduced or eliminated. In addition, throughout the debt crisis, developingcountries have almost uniformly serviced their bonds without interruption and are widely expected to continue givingthem priority servicing. In that sense, the bonds are-if onlyinformally-priority debt.
That was one main advantage of the new money instruments, which were bonds with the same financial terms asthe new money loan that was part of the debt package. Thebonds were bearer bonds and thus more liquid than bankloans, and called for somewhat different accounting treatment. Each participating creditor bank was given the optionof taking up to $1 million of its new money share in the formof these bonds instead of the standard new bank loan. Thisfeature is important because it shows a growing recognition,however peripheral, that foreign bank debt can be subordinated to other privately held debt.
The Argentine package was made final in August 1987. InOctober, Ecuador reached agreement with its creditor bankson a package containing both exit bonds and a version of thenew money instrument, called "A bonds". Brazil took theseideas several steps further by proposing large-scale refinancing of its bank debt using a form of exit bonds thatwould have paid interest rates significantly lower than market rates. But what was acceptable to the creditor banks atthe margin was a "non-starter" when proposed as a means
15 For a review of the recent evolution of commercial bank debt-restructuring, see IMF, International Capital Markets Developments and Prospects (Washington, D.C., January 1988), pp. 50-63, and, for greater detail, World Bank, Mmiet-Based Menu Approach, Debt Managementand Financial Advisory Service Department, January 1988.
63

for handling the bulk of the debt of the most indebted developing country.
A further proposal, which improved upon that ofBrazil inseveral respects, was made by Mexico at the end of the year.First, the arrangement was to be more fully voluntary in thatit was designed outside the multilateral debt renegotiationprocess and the resulting loss for creditor participants was tobe "market related"-the result of an auction-rather thannegotiated. 16 Secondly, the subordination of the existingbank debt to the new bonds was to be made explicit. It wasassisted by a special issue of zero coupon bonds by theUnited States Government, which was made available toMexico. The bonds were scheduled to mature on the sameday as the Mexican bonds. Thus, their purchase by Mexicowould effectively guarantee full repayment of principal onthe Mexican bonds on the date of maturity. Mexico wouldpay a competitive interest rate on its bonds, but would benefit from the discount in the original swap, which it washoped would be up to 50 percent. The creditors still perceived themselves as subject, to large risks as the interestpayments were not guaranteed by any mechanism comparable to that for the principal; and for 20-year bonds, most ofthe cash flow is interest.
The Mexican arrangement thus did not work out as anticipated. Based on the prices of Mexican debt in the secondarymarket, it was hoped that $20 billion of bank debt could beexchanged for somewhat more than $10 billion in bonds.Instead, $3.7 billion of bank debt was retired and the Mexican debt was reduced by only $1.1 billion. The average discount was slightly above 30 percent and although almost $7billion in debt had been offered in bid by 139 banks from 18countries, much of it was considered to have been at an insufficient discount.
Specialists in the financial markets had felt for some timethat the discounts on the Mexican debt and the debt of othermajor developing countries understated the "true" value ofthe loans based on economic fundamentals. I? The market isthin and trades do not take place every day. In short, thesecondary market tends to reflect the sentiment of a marginal share of the bank creditors.
Besides the size of the discount, in the Mexican deal thevolume of debt being offered for bid was smaller than expected. Indeed, the same observation applies to the exit bondoption in the Argentine programme. In both cases the reasonappears to lie in an inherent shortcoming of voluntarist ormarket-oriented methods of seeking to address the debtproblem.
Towards a solution to the problem of bank debt
If not for the debt overhang and unmet structural adjustment needs, the economies of the middle-income highly in-,debted countries could regain, if not surpass, their substantial economic dynamism of the previous two decades. Although institutional memories can be short and the politicalpressures that lead to unsustainable macro-economic policies may still be present in some countries, there is reason tobe hopeful that sound and more equitable economic management will be widely popular in an environment of rising percapita incomes. The existing situation, in contrast, is notsocially, politically or economically sustainable in the long·run. How to unwind that situation is a political question,involving an apportioning of the adjustment costs betweenthe debtor and its creditors and among the creditors.
For example, if several creditors were to take large lossesin a given country now, it would relieve the country's debtburden, allow structural adjustment and broader development to resume and enhance the value of the loans held bythe other creditors, some private, some offical and frommany countries. Unless the banks are in dire need of additionalliquidity in their portfolio, there is little incentive totake a loss now and subsidize their competitors. Instead, itmay be a reasonable strategy for them to provide against theloans becoming non-performing and otherwise hold on to atleast the bulk of them.
This is not to say that the banks would not quickly accept aswap of their debtor country loans for assets that would convincingly guarantee payment of interest and principal, evenat lower interest rates,-for example, at rates paid on government paper in the major industrial countries. Banksmight even absorb capital losses of 25 percent or more in aswap into such instruments if all the creditors agreed or wereforced to participate (25 percent is mentioned because thatrepresents the rough average of the provisioning already undertaken by United States banks). But this is not yet on thetable; nor is implementation at hand of any of the large number ofproposals for international facilities to restructure andreduce the debt burden of the developing countries. 18 Thelegislatures of the creditor countries have not yet reached thestage of being able to vote the resources required to underwrite such proposals, although if the United'States Senateand House of Representatives are a guide, some are willingto encourage negotiations among Governments of creditorcountries aimed at establishing a facility which would passthe discount on the debt to the debtor countries. 19 By thesame token, prospective legislation to approve the $75 bil-
16 The loss was to be in the form of a discount on the bank debt as exchanged for bonds, rather than in the setting of an artificially low interest rate;but these formal differences are of less economic significance.
17 For exploratory econometric work in this area, see "The secondary market and the international debt problem", DIESA Working Paper Series,No.7, Department ofInternational Economic and Social Affairs of the United Nations Secretariat, November 1987.
18 Two prominent additions to the many proposed facilities were made early in 1988: the proposal of Arjun K. Sengupta, an Executive Director ofIMF, made before an Executive Board Seminar on 9 February 1988, and that of James D. Robinson, Chairman and Chief Excutive Officer ofthe American Express Company (see ';.\ comprehensive agenda for LDC debt and world trade growth", AMEX Bank Review Special Papers,No. 13 (March 1988».
19 This was a provision of the omnibus trade bill adopted by both Houses and sent to the President for signature in April 1988; the bill has sincebeen vetoed.
64

lion capital increase of the World Bank is very much discussed in terms of whether or not the envisaged expansion inBank lending for structural adjustment would serve indirectly to refinance private bank debt with multilateral official debt.
Governments of industrial countries have the capacity toact in the area of international debt and have done so. Anumber of significant advances were recorded in 1987alone, largely with respect to the difficulties of low-incomecountries, as there is general agreement on the need of thosecountries for relief and on the pointlessness of a policy ofinaction.
The arrangements recently completed for the Bolivianbuy-back scheme are a case in point. The plan, which waselaborated during much of 1987, is part of a debt-restructuring and economic adjustment programme. Donor countries provided grant assistance to a facility especially createdfor that purpose in IMF, from which the Bolivian Government could draw to buy back some of its debt directly fromits commercial bank creditors at a steep discount. The bankshad formally agreed to the plan and had specified how thediscounts would be allotted and the debt extinguished. Theresult, as at mid-March 1988, was that the banks agreed tosell over $300 million of the debt at 11 per cent of face valueand waive the interest and charges in arrears, which broughtthe value of obligations extinguished to over $500 million.The remaining commercial bank debt of almost $700 millionwould be renegotiated.
The most important characteristic ofthe Bolivian arrangement was that all parties understood that Bolivia could notand would not service its debts in full. From that point, itwas possible to design an arrangement in which the commercial banks took substantial losses in an orderly way (indeed,by 1985, most bank creditors had already heavily writtendown the value of those assets in their balance s!:teets), donors made a modest financial contribution that would not beinterpreted as "bailing out the banks", a multilateral institution was involved in the role of honest broker, and an internationally supported reform and stabilization programmewas instituted that would help underwrite economic adjustment efforts of a new Bolivian Government. An importantissue is whether the experience gained by the creditor, donorand multilateral parties to the Bolivian case can be applied toother countries in comparable situations.
The difficult question pertains to the incomparable situations, namely, those of the major debtor countries. The threelargest debtor countries alone-Argentina, Brazil and Mexico-owe well over $200 billion just to the commercialbanks. A Bolivian type of operation could not be mountedfor those countries. The scale of the necessary increase inofficial assistance would be prohibitive in terms of what legislators-and public opinion in donor countries-wouldseem to support at present. But other sources of the re-
sources for retiring a significant part of the debt can be envisaged. The debtor countries might even borrow the moneythemselves on the private markets if such borrowing wereconvincingly guaranteed by donor country Governments orthe multilateral institutions. Various methods might also bedevised to share and spread the risk of such guarantees beyond the initial guarantor, but the time for such action isapparently still not ripe.
However, the time was ripe in 1987 for certain otheractions by creditor Governments, which might also be builtupon in 1988. The United States, for example, relaxed specific regulations to allow banks to purchase full ownershipthrough debt-equity swaps of non-financial companies thatwere being privatized in debtor countries. Banks were alsogranted a deduction from taxable income for the face valueofloans donated to environmental and humanitarian groups,including the United States Committee for UNICEF, whichcould then swap them into local currency or otherwise usethem for programmes in the debtor country. Additional regulatory and tax measures can be envisaged which would further encourage the pass-through of discounts on outstandingobligations to the debtor countries and broaden the menu ofoptions that banks from different countries could adopt indebt-restructuring negotiations. 20
Indeed, one regulatory measure considered at the end of1987 by the Group of Ten industrialized countries may set aneffective time limit for an orderly, negotiated reduction ofthe developing country debt. This was the decision by theCommittee on Banking Regulations and Supervisory Practices (the Cooke Committee) to recommend a common capital requirement for commercial banks in different countries.'! Banks whose regulatory authorities have permittedlower capital backing would need to raise their reserves orequity by 1993. In the United States, where loan-loss reserves form part of the capital base, taking losses on developing country debt would become expensive if they had tobe replaced immediately to meet the newly raised minimumcapital standards. For these banks-and for banks in countries in which harmonization of capital requirements willrequire additions to capital, especially to back problematicloans to developing countries-there is good reason to seekto settle the debt overhang now.
But, as discussed above, competitive pressures and different business interests make it unlikely that banks will actindividually to implement a market-based solution. Whatthey need is political leadership from the Governments ofcreditor countries to decide upon a solution that is effectiveand equitable, and that the bank managements-not to mention debtor country Governments-would probably acceptwith a large sigh of relief. That solution could be to set broadguidelines for effective debt-reduction packages, withinwhich there would still be scope for a case-by-case approach, as negotiations would have to proceed with individual countries.
20 For a list of proposals, see Mary Williamson, "Banking regulation and debt: A policy of flexible response", Policy Focus. 1988, No.1 (Washington, D.C., Overseas Development Council, March 1988).
21 For a discussion of the proposal and its background, see '~proposal for an international bank capital standard," Monthly Report oftheDeutsche Bundesbank, January 1988, pp. 34-39.
65

Relations with official creditors
It might appear paradoxical that the unusual Bolivian restructuring of bank debt was arranged for a country that haspaid and is scheduled to pay more interest to official bilateraland multilateral agencies than to commercial banks on public and publicly guaranteed medium-term debt. Indeed, attention must also focus on the international treatment of debtto official creditors.
Several important strides were made in 1987 in the treatment of the debt of low-income countries owed to officialcreditors. Some of them were intended to alleviate the difficulties of African countries, but the facilities and precedentsestablished are potentially applicable to all similarly situatedcountries.
International consciousness of the African developmentcrisis had been building up since the beginning of the decade, debate having been galvanized by a series of reportsand a special programme ofthe World Bank for low-incomecountries of the sub-Saharan region, by the United Nationsemergency programme to counter the effects of Africa'sdrought, and by the special session ofthe General Assemblyin May 1986, at which the Assembly adopted the UnitedNations Programme of Action for African Economic Recovery and Development 1986-1990 (resolution S-13!2).
This notwithstanding, both overall resource flows to theregion and official development assistance fell in real termsin 1986. 22 But real commitments rose and the pass through tohigher net flows should begin to appear. It nevertheless became clear during 1987 that the emergency adjustment needsof the continent were not being met, let alone the long-termdevelopment financing requirements. In country after country in 1987, foreign debts could not be serviced and importshad to be held down by excessive amounts. However, theneed to do more was widely felt in the donor community andseveral initiatives were set in motion.
Some were directly addressed to debt problems, such asthe lengthening of maturity and grace periods in Paris Clubrescheduling ofofficial bilateral debt, although no cash flowbenefit would be felt by the debtor until after the expirationof the previous maximum grace period of five years for lowincome countries. Others were directed towards a more general provision of financial resources that could be applied,inter alia, to debt refinancing. One such initiative was that ofthe Managing Director of IMF, which led to the creation atthe end of 1987 of the Enhanced Structural Adjustment Facility (ESAF), marking a return of the Fund to concessionallending on a substantial scale. The predecessor of ESAF, theStructural Adjustment Facility, had itself been financed bythe repayments of the last major concessional effort ofIMF,the 1970s Trust Fund. ESAF will provide $8.4 billion in newresources to African and other low-income countries forcommitment in 1988 and 1989. Loans will be provided for a
period of 10 years at an interest rate of 0.5 percent and areintended to support medium-term balance-of-payments adjustment programmes. They should also help reverse thenegative transfer of resources that Africa is currently experiencing vis-ii-vis the Fund.
The World Bank also proposed a major enhancement of itsspecial programme for debt-distressed developing countries, especially those in Africa. The Bank had establishedthe Special Facility for Africa (SFA) in 1985 and mobilizedalmost $2 billion in additional resources for it, both directsupport and bilateral co-financing. But SFA was due to endoperations in June 1988. A series of meetings with majordonors, which began in the summer of 1987, ended when theBank won agreement (at a special meeting in Paris in December) for an increase of about $3 billion of co-financingof Bank-supported adjustment programmes, to be committed over three years.
The new concessional resources of the Bank and the Fund,along with other increased bilateral flows and an expandedAfrican Development Fund at the African DevelopmentBank, were seen as meeting a significant part of the emergency cash flow shortage of the target group of hardpressed, low-income sub-Saharan countries. In the Bank'sinitial proposal, these flows were not expected to meet allthe needs, as the Bank had also considered concessional debtrelief as a legitimate source of enhanced resource transfers.
Indeed, the Governments of France, Sweden and theUnited Kingdom had informally circulated proposals in thefirst half of 1987 to introduce a concessional element to debtrelief arranged through the Paris Club. The Nordic countrieshave also proposed establishing a fund at the World Bank tohelp reduce the servicing of non-concessional debt owed directly to the World Bank by the hard-pressed countries. Inaddition, the African Development Bank devised a comprehensive plan for concessional debt-restructuring that extends to official as well as private credit some of the ideas onsecuritization with guarantees at reduced interest rates discussed above.
Parallel with those efforts and with the implicit concernthat the various proposals add up to an international packagethat is politically feasible and financially adequate, the Secretary-General of the United Nations convoked in April1987 a group of high-level experts from the world of international finance and asked them to recommend concretemeans, within agreed programmes, for alleviating the financial burden of the affected African countries. The Group, inits report to the Secretary-General of February 1988,23 observed that the international community was acting in several ways to address emergency financing needs of the region, but that even under highly conservative assumptionsnot even the minimum necessary resources had yet been arranged. In the view of the Group, increasing the capacity ofthese countries to import was a critical precondition for recovery.
22 Real terms here refer to unchanged prices and exchange rates of OECD countries (see OECD, Development Co-operation, 1987Report ... , pp.214-219).
23 Financing Africa's Recovery: Report and Recommendations ofthe Advisory Group on Financial Flows for Africa (New York, United Nations,February 1988).
66

Adding together the new financial commitments as atearly 1988, the Group saw a potential increase in flows ofapproximately $3 billion a year to 1990. But it concludedthat an additional $2 billion annually was needed by the subSaharan countries, excluding Nigeria, "simply to restore theprospects for development and growth as ofthe early 1980s,which were already highly constrained in many countries ofthe region."24 The Group suggested that about $1 billion ofthat amount might take the form of official debt relief andthe rest increased official development assistance. Addingin the needs of Nigeria and North Africa, the requirementsof Africa as a whole would be far larger and the amountneeded would multiply again when the needs of lower-income countries throughout the world were considered.
The most significant conclusions of the Group, however,do not pertain to the quantitative estimates of the overallfinancial needs of one developing region, but to the modalities by which increased net resource transfers might bebrought about. The resources accorded to any particularcountry would in any event be determined on a case-by-casebasis.
Thus, one significant recommendation of the Group wasthat countries in especially difficult medium-term circumstances should receive from the Paris Club a rescheduling ofall their debt service obligations to bilateral official creditorsover the next three years, at virtually no interest (i.e., onterms comparable to those of IDA). For debtor countrieswhose debt-servicing capacity was less impaired and whichcould foresee a return to conventional financing at some future date, annual rescheduling was proposed, but at a moratorium interest rate, which, although somewhat higher thanin the first case, would still be substantially below marketrates. For a third group of countries, whose future creditrating was not in question, existing practices would continue. At the present time, Paris Club reschedulings embodyno subsidy of interest rates on rescheduled loans. These recommendations of the Group, in particular, should be passedon to donor Governments and introduced into Paris Clubdeliberations as soon as possible.
United States foreign debt, related capital flowsand the instability of major currency exchange rates
The United States has the world's largest net foreign debt.It is, however, a unique international debtor. As the supplierof the major currency for international transactions, theUnited States has been able to borrow almost entirely in itsown currency. Thus, it is not susceptible to a foreign exchange crisis of the sort that afflicts developing countrieswhen foreign lenders and purchasers of their financial instruments lose confidence in their economies and cease extending new credit.
A real danger exists, however, that a loss of confidenceleads foreign holders of dollar assets to exchange them forassets in other currencies. In such a scenario, the ability andwillingness of United States and foreign central banks to absorb the glut of dollars would be severely tested. To the degree that the inflows needed to finance the large UnitedStates payments deficits thereby became insufficient, theconsequences for exchange rates and interest rates, and foreconomic growth, could be disruptive.
Such a turbulent scenario appears highly unlikely, although it cannot be dismissed as impossible, especially inthe light of developments in financial and currency markets
in 1987 and the continuing rapid growth of the United Statesforeign debt position. Even on optimistic assumptions,United States net external indebtedness would grow by morethan $350 billion from 1988 to the second half of 1991.25
The size of the United States foreign debt
The external indebtedness of the United States can bemeasured in a number of ways.26 The net international investment position, the most inclusive measure, is the difference between foreign assets held by residents of the UnitedStates and assets in the United States owned by foreign residents-where residents are individuals, corporations or offi-·cial entitities. Gross debt, another measure, is simply thesum of a country's liabilities to foreign entities, which areheld in the form of debt instruments. Finally, the term "netdebt" is applied to various concepts. Sometimes it is thedifference between all foreign credit, including foreign currency bank deposits, and gross foreign debt. Several analysts use the term to mean the difference between gross debtand liquid, or easily accessible, claims on foreigners. Allother private and government claims on non-resident entit-
24 Ibid., p. vi.25 The key assumption in the exercise is that the United States trade deficit is largely eliminated by 1991 (but not the current-account deficit), in a
scenario in which United States GNP grows 2.5 to 3.0 per cent a year (and demand grows by much less); the rest ofthe industrialized worldgrows at a rate of about 3 percent (demand at 3.5 percent); United States manufacturing grows at least 4 percent a year (which requires considerable investment); and the United States fiscal deficit is sharply curtailed (E. Gerald Corrigan, President of the Federal Reserve Bank of NewYork, in an address before the annual meeting of the New York State Bankers' Association, 28 January 1988 (see Federal Reserve Bank of NewYork, Quarterly Review, vo1.12 (Winter 1987-88), pp. 1-5). This scenario is more optimistic than the baseline forecast presented in chapter IIabove. Mr. Corrigan also said that "sadly, and despite great effort, the details of a credible budget deficit reduction programme in the neededamount are not yet in place. In sum, the accretion of United States foreign debt is likely to have to be far larger than the $350 billion noted".
26 See ShafiqulIslam, ')\merica's foreign debt: is the crisis moving north?", Stanford Journal ofInternational Law, 1987, pp. 99-129, and "TheUnited States as a debtor country: indicators of resource transfer and solvency", DIESA Working Paper Series, No.2, Department ofInternational Economic and Social Affairs of the United Nations Secretariat, February 1987.
67

Table IV.5. Net international investment position of the United States
(Billions of dollars; end of year)
1980 1982 1984 1985 1986 1987'
I. United States foreign assets 607 825 896 949 1068 I 169
Official assets 91 109 120 131 138 136Official reserves 27 34 35 43 49 46Other Government assets 64 75 85 88 89 91
Private assets 517 716 776 819 930 1032Direct investment 215 208 212 230 260 298Securities 63 75 89 113 131 156Banking and other 239 433 476 476 539 578
II. Foreign assets in the United States 501 688 892 1061 I 331 I 515
Foreign official assets 176 189 199 203 241 286
Private assets 325 499 693 859 I 091 1229Direct investment 83 125 165 185 209 250Securities 90 119 186 290 405 408Banking and other 151 256 343 384 476 571
III. Net international investmentposition (I-II) 106 137 4 -112 -264 -347
Memorandum itemIndicators as a percentage of GNP
Net position 3.9 4.3 0.1 -2.8 -6.2 -7.7Gross foreign debt" 13.4 15.4 16.8 18.8 22.5 24.4
Source: United States Department of Commerce, Survey afCurrent Business, June 1987, for data to 1986; andestimates of the United Nations Secretariat for 1987, based on balance-of-payments data and roughly approximatedvaluation adjustments.
a Preliminary estimates.b Foreign assets in the United States, excluding direct investment and corporate stocks.
ies held as debt instruments are excluded from that calculation because they cannot be readily mobilized.
The net investment position is the most commonly usedmeasure of United States external indebtedness, although itis an inexact measure that variously overcounts or undercounts assets and liabilities. First, it includes some itemsthat are not debt as such-in particular, foreign direct investment in the United States and foreign holdings of equityshares in United States corporations. Earnings paid on these·assets are more variable and more directly related to earnings of the underlying investments than is interest on debtinstruments. In addition, the net investment position misrepresents net indebtedness to the degree that certain UnitedStates assets included in the calculation are valued at an artificially low price. For example, gold held by the UnitedStates Government is valued at SDR 35 an ounce. Similarly,direct investments are carried at book value, which tends toundervalue the net direct investment position becauseUnited States investments abroad are on average much olderthan the foreign direct investments in the United States.
Measured by changes in the net investment position, theUnited States became a net debtor in 1985 (see table IV.5).Measured by gross debt, the United States debt has longexceeded that of all the developing countries combined;measured by net debt-that is, the net value of all interestbearing or discounted securities and loans-the UnitedStates was a debtor through virtually all of the 1970s.
68
The net investment position of the United States appears tohave dropped by more than $80 billion in 1987, bringing itsnet debtor position to almost $350 billion. The amount of netcapital inflows were far larger-$16l billion, the size of thecurrent-account deficit-but the combination of exchangerate changes and falling securities prices cut the deterioration of the net asset position in half. Because the outstandingamounts of foreign-held equity shares and bonds havegrown so large, the reduction in the value of those amountsduring the year almost matched the value of the new purchases. On the other side of the ledger, the 18 percent drop inthe nominal effective exchange rate of the dollar from December 1986 until December 1987 gave a considerable boostto the dollar value of United States foreign assets (excludingdirect investments which are carried at original book value).Nevertheless, even with these favourable valuation effects,the net debtor position deteriorated to almost 8 percent ofGNP. In terms of the measure more conventionally appliedto indebted developing countries, the gross indebtedness approached 25 percent of GNP.
It is not self-evident, however, that the growing net debtorposition of the United States is a problem. Many analystspoint to the fact that United States external debt is denominated in dollars. The United States thus runs no risk of insolvency since it always has the option of increasing the supplyof dollars to service its debt. In addition, they argue that theexternal debt of the United States is small relative to the size

of its GNP. Assuming a 5 per cent real rate of return, theincome needed to service these claims would amount to lessthan one half of one per cent of GNP. 27 Furthermore, reflecting the undervaluation of United States foreign assets, netearnings on United States investments abroad remain sizeable;" indeed, they exceeded foreign earnings on investmentin the United States by $21 billion in 1986 and $14.5 billionin 1987, although this was in part due to the fact that profits,interest and dividends were received from abroad in currencies that strengthened relative to the dollar. It is notable,nevertheless, that in the third quarter of 1987, payments onforeign-owned assets exceeded income on United States assets abroad for the first time in recent history.
The concern expressed about the growing external indebtedness of the United States relates, rather, to the risks itposes for the stability of the world financial system. First,the heavy indebtedness holds the United States hostage toforeign capital inflows. Much of the increase in net debt ofthe United States has coincided with the accumulation oflarge budget deficits. This suggests that the capital inflowshave been used largely to finance government and privateconsumption, rather than productive investment. To the degree that the debt pile-up feeds perceptions ofeconomic mismanagement, it may weaken investor confidence.
A second concern stems from the rate of growth of thedebt. In 1987, the ratio of net foreign claims to GNP grew by1.5 percentage points (see table IV.5). If not for the valuation effects described above, it would have grown by about3.5 percentage points. If the dollar and financial marketsremain stable and this rate of increase is maintained, netforeign claims on the United States would reach 40 per centof GNP by the end of the century. As the value of GNPgrows, a current-account deficit that maintains a constantratio to GNP would soon require very large net incrementsto the debt. The objective of current-account adjustment inthe United States is to reduce the deficit as a share of GNP, ifnot necessarily to bring the deficit to zero. The annual deficitratios since 1984 have thus far been 2.9 per cent in 1984 and1985,3.4 per cent in 1986 and about 3.5 per cent in 1987. Itseems impossible to maintain the ratio at this level and thebasic question is therefore not whether the deficit will beadjusted, since it cannot go on indefinitely, but whether theadjustment will be done smoothly.
Thirdly, although United States debt as a share of GNPmay currently be modest, the absolute magnitude ofthe debtis already vast. Indeed, to the extent that the annual statistical discrepancy in the United States balance of paymentsreflects unreported capital inflows, United States net indebtedness is understated, not overstated as the debt optimistsclaim. The amount of understatement could be large as thestatistical discrepancy is large-$24 billion in 1986 and $22billion in 1987.
Finally, there is another concern about the large and growing United States indebtedness. Should the world's wealthiest country appropriate such a large portion of the surplus
savings of the rest of the world as a way of sustaining levelsof domestic expenditure that substantially exceed domesticoutput?
Capital movements;: Federal Republic of Germany,Japan and the United States
The net external debt of the United States continues togrow and its current-account deficit persists because foreignfirms, individuals and Governments are willing to continuelending to the United States. Two factors determine the increase of foreign holdings of dollar-denominated assets. Onthe one hand, as income and wealth grow outside the UnitedStates, the pool of financial resources grows and with, forexample, a constant share of dollar assets in investor portfolios, the flow of new lending to the United States also grows.On the other hand, foreign investors may decide to changethe dollar share of their portfolios, which would affect thedemand for dollar-based financial instruments.
One implication of the pattern of current-account imbalances among the major industrialized countries (see tableIV.1) is that the international ability to continue lending tothe United States has grown pari passu with the need of theUnited States to borrow. The two single most importantsources have been the Federal Republic of Germany andJapan, although their financial flows have followed somewhat different paths.
Japan's large current-account surpluses and its increasingrole in global capital markets have transformed it into thelargest international lender in recent years. Net long-termcapital outflows more than doubled to a record $131 billionin 1986, rising to $137 billion in 1987 (see table A.IIU1).Long-term capital movements have been dominated by Japanese investors' purchases of foreign securities; such purchases totalled nearly $88 billion in 1987-mainly in theform of dollar-denominated government bonds. Japanesepurchases of foreign equities have been of far smaller magnitude; they rose sharply in 1986, however, and acceleratedfurther in the first half of 1987 before falling off in the second half.
But Japan's overall net capital outflow is smaller than theoutflow of long-term credit since the short-term capital account has shown large net inflows in recent years-reaching$96 billion in 1987 (see figure IV.6). The heavy net inflowthat year can be attributed in large measure to net borrowingby foreign exchange banks, reflecting both the increasinginternational demand for yen deposits and Japan's growingrole as a financial intermediary for the transfer of international capital. In addition, short-term foreign borrowingprovides Japanese financial institutions with a hedge againstdollar exchange rate losses on their investment in dollar assets.
The Federal Republic of Germany recorded a $30 billionincrease in net long-term capital outflows in 1987; nevertheless, since there had been a net inflow in 1986, the outflow in1987 amounted to only $14 billion (see table A.m.1O). This
27 Economic Report ofthe President (Washington, D.C., United States Government Printing Office, February 1988), p. 99.28 See John Makin, "The U.S. debtor status has been overblown", International Economy, January/February 1988.
69

Figure IV.6. Capital outflows of the Federal Republicof Germany and Japan
(Billions of dollars)
FEDERAL REPUBLIC OF GERMANY60....-----------------------,
~ Short term
IZZJ Long term
198'119861985
50
40
20
10
30
-10
-20
1980 1981 1982 1983 1984
JAPAN140
120
100
80
60
40
20
-40
-80
-20
-60
-100 -'-,---,----,-------,,------,----,---.....--,--1
1980 1981 1982 1983 1984 1985 1986 198'1
Source: Balance-of-payments data of the Deutsche Bundesbank and the Bank of Japan(excluding official reserve transactions).
70

swing nevertheless restored a pattern of financial flows thathad been uncharacteristically reversed in 1986, when heavyforeign purchases of bonds of the Federal Republic of Germany caused a large net inflow of long-term capital. In1987, net long-term outflows were mainly the result of substantial increases in purchases by the Federal Republic ofGermany of foreign securities and in long-term credit outflows, combined with a sharp fall-back in foreign purchasesof that country's securities. All together, long-term investment abroad by the Federal Republic of Germany reached$35 billion in 1987, compared with less than $25 billion ineach of the previous two years. Coinciding with the 10ngterm net inflows in 1986 were heavy net short-term outflows, driven by strong demand for deutsche mark in theEuromarkets; in 1987, however, they fell back to more usuallevels.
The path by which surpluses of the Federal Republic ofGermany help to finance the United States deficit appears tobe largely indirect. In contrast to Japan, which was itselfacting as a financial intermediary, European financial markets seem to be an important intermediary of the outflows ofthe Federal Republic of Germany, which helps to explainwhy that country persistently shows a substantial net outflow of short-term capital as well as, usually, an outflow onlong-term account (see figure IY.6).
Thus, the international financial activities ofJapan and theFederal Republic of Germany, along with other surpluseconomies, have provided large volumes of resources that,through various channels, help to finance the United Statesbalance-of-payments deficit. In fact, the composition of thenet flows coming into the United States has changed significantly in recent years, as longer-term financial instrumentssuch as securities and direct investments have increasinglycome to dominate net private inflows (see table A.III.12).
From 1983, when the deficit opened up, until 1985, netfinancing was entirely by private capital flows. The magnitude and composition of these flows were dictated largely byinterest-rate and exchange-rate expectations, the desire ofmajor surplus countries of Asia to accumulate United Statesassets, and the globalization of capital markets. Privateflows took the form mainly of banking inflows, foreign purchases of United States Treasury securities and corporateEuro1Jonds, and a sizeable increase in foreign direct investment in the United States, spurred partly by increased fearsof United States protectionism. Purchases of United Statesequities were modest, however, because of foreign concernsabout the profitability of United States industry in the lightof a strongly appreciating currency.
Beginning in 1986, mainly in response to the depreciationof the dollar, the mix ofcapital inflows into the United Stateschanged dramatically. Coinciding with a further sharp widening in the United States current-account deficit was a $22billion fall in net private inflows. This was due to a $70
billion rise in United States private outflows, almost all of itin the banking sector,29 while foreign private inflows to theUnited States also increased, but by only $48 billion. In1987, the private outflow slowed but so did the private inflow, so that the measured net private inflow was unchanged. Foreign private purchases of Treasury securitiesmore than halved in 1986 and there was a $6 billion net selloff in 1987, due to fears about the likely further fall of thedollar and about the ability of the United States Governmentto curb its large budget deficit. Foreign investors purchasedalmost $40 billion worth of United States corporate bonds in1986, but only $22 billion worth in 1987, as investors outside the United States grew concerned about the direction ofthe dollar and the credit quality of many United States issuers. Banking inflows were about the same in 1987 as in1986, but banking outflows fell back so that the net inflowfrom banks roughly doubled, to about $45 billion. Thechange reflected a widening of interest rate differentials onaverage for the year in favour of United States dollar investments.
Accompanying the decrease in foreign holdings of UnitedStates Treasury securities was a substantial increase in foreign purchases of United States corporate equities in the firstthree quarters of the year. The increased demand for UnitedStates equities reflected the potential they offered for relatively higher returns as United States industry was growingincreasingly competitive after successive rounds of dollardepreciation.
For 1987 as a whole, Japanese buyers accounted for over70 per cent offoreign purchases of United States stocks. Thereason the share of Japan was so high was that Japaneseinvestors continued to be net buyers of stocks in the fourthquarter of the year, when foreign shareholders as a wholesold off almost $8 billion in stocks in the aftermath of thestock market crash.
The shift to equities was accompanied by an increase inforeign direct investment in the United States in 1986 and1987, exceeding $40 billion in the latter year. In fact, totaldirect investment was probably considerably higher since alarge portion is financed through borrowing, mostly in theUnited States. 30 The net flow of direct investment in theUnited States as measured, however, has been small, asUnited States direct investment outflows have doubled overthe past two years, in part reflecting exchange gains on overseas profits that are reinvested in the foreign affiliates.
The above notwithstanding, the most striking of the recentchanges in the financial flows to the United States is thegrowing importance of official capital inflows. Net inflowsto United States residents from private sources have stagnated at around $85 billion since 1984 (see figure IV.7),while the current-account deficit has grown steadily. Inflowsdirectly from foreign official sources have grown, reaching34 percent of the total current-account financing in 1987.
29 An interesting asymmetry is that in some discussions ofdeveloping countries' international financial relations, sharp increases in private outflows such as those shown for the United States banking sector in 1986, are called "capital flight" , while in the case of the United States, thediscussion is usually in terms of the financial incentives of investing in different international capital markets.
30 See Morgan Guaranty Trust Company of New York, World Financial Markets, November/December 1987, p. 8.
71

Figure IV.7. Net foreign financial flows vis-ii-visUnited States residents
(Billions of dollars)110
100
90
80
70
60
50
to
30
20
10
0
-10
-20
-30
-to1980 1981 1982
lZZI Private
rz;zj Official
Source: United States Department of Commerce, Survey ofCurrent Business (official flowsunderstate total flows originating from foreign official sources, as discussed in box IV.3).
This, however, understates the total inflow that originatesfrom official sources, which seems to have accounted forabout two thirds of the total financing (see box IV.3).
Official finance and exchange rate management
Central banks of the major industrial countries intervenedheavily, and in a co-ordinated manner, during 1987 in aneffort to stabilize exchange rates. United States intervention, the first in the dollar's three-year decline, amounted toabout $9.2 billion in dollar purchases. Intervention by the'Group of Seven, excluding the United States, is estimated at
over $60 billion in dollar purchases in 1987. The Presidenfof the Deutsche Bundesbank has stated that the dollar reserves of the bank rose by $15 billion over the full year.Japanese reserves grew by $38 billion, almost all of whichwere probably dollar purchases. Not all the intervention activity was aimed at stabilizing the dollar-indeed, significantintervention took place to support parities within the European Monetary System (see box IVA). But much of it wasdollar-related, particularly following the Louvre Accord of22 February 1987, and, in any event, by building up centralbank dollar holdings, it served to reduce the excess supply ofdollars on the world's foreign exchange markets.
Box IV.3. How large was official financing of the United Statesbalance of payments in 19877
Measuring the magnitude of official financing of theUnited States current-account deficit entails considerable estimation. United States balance-of-payments data, in particular, tend to understate the magnitude. Balance-of-paymentsdata show that in 1987 net private capital inflows-definedto include the statistical discrepancy-amounted to $106 billion, insufficient to finance the country's $161 billion current-account deficit. Official flows ofabout $55 billion covered the balance (34 per cent); these flows largely took the
72
form of purchases of United States Treasury securities ascentral banks invested the proceeds of intervention operations in exchange markets.
While these data point to a larger role for foreign officialfinancing of the United States payments deficit, they understate the magnitude of official financing. This is becauseforeign central banks may acquire dollar-denominated assetson the Euromarkets or from Japanese and other financialinstitutions outside the United States and, by however circu-

itous a route, they subsequently appear in United States balance-of-payments data as private inflows. Changes in theofficial reserves of key trading partners of the United Statescould thus be taken as a second indicator of the extent ofofficial financing of the United States deficit.
Since the members of the Group of Seven industrial countries agreed to intervene in foreign exchange markets to support the dollar, they were expected to account for the bulk ofthe official dollar financing, as indeed they did (see the table), nevertheless, all foreign dollar accumulation has thesame financial flow effect on the world dollar market, and sototal reserve accumulation outside the United States is alsoof interest.
Official foreign exchange reserves of the Group of Seven,excluding the United States, expanded by $104 billion during 1987. The increase of $38 billion in Japanese reservesalone could account for the bulk of the official inflows, assuggested by the United States payments data cited above. Ifthe increases in foreign exchange reserves of Taiwan, Province of China; are added, the total gain in reserves rises to$134 billion. Including the changes in reserves for all othercountries, again excluding the United States, raises the totalincrease to over $200 billion. If the previous share of dollarsin total world foreign exchange reserves-that is, a little
over two thirds-is applied, the increase in reserves outsidethe United States implies central bank purchases of about$142 billion in dollars in 1987.
When exchange rates change, however, nominal changesin the level of reserves do not adequately reflect the officialfinancing flow. Since central banks accumulate non-dollarreserve assets as well as dollar assets, there is a valuationadjustment problem. Because the depreciation of the dollarraises the dollar value of the non-dollar reserves, changes inthe stock of total reserves overstate the flow of purchases ofreserve assets.
Estimates by IMF of the currency composition of foreignexchange reserves (as published in aggregate in IMF AnnualReports) permit a direct estimation of reserve changes. Thisreveals a somewhat smaller gain in 1987 in the reserves ofthe Group of Seven, excluding the United States: $86 billion, compared with the $104 billion increase in unadjustedreserves, as shown in the table. The same exercise applied tothe world as a whole implies total reserve accumulation outside the United States of $161 billion. The dollar componentof that was approximately $108 billion, which was almosttwo thirds of the United States current-account deficit andmay be taken as a gross estimate of the share being financedthrough official channels in 1987.
Changes in foreign exchange reservesoutside the United States in 1987
(Billions ofdollars)
Quarter
II III IV
Group of Seven countriesexcluding the United States 36.2 16.4 3.4 47.5
Germany, Federal Republic of 8.2 2.3 1.5 15.0Japan 15.8 10.5 2.8 8.9United Kingdom 3.1 7.4 0.5 12.7Canada, France, Italy 9.2 -3.8 -1.4 10.8
Other industrial countries 6.7 14.5 10.7 13.3
Other economies 11.6 12.6 11.2 19.0Taiwan, Province of China 8.2 6.2 4.2 11.8Other 3.4 6.4 7.0 7.1
Total 54.5 43.4 25.2 79.7
Memorandum itemChange in foreign exchange reservesat constant, start-of-quarterexchange rates
Group of Seven, excluding theUnited States 30.7 16.8 3.1 35.5
World, excluding the United States 43.0 42.3 22.3 53.2
Source: IMF, International Financial Statistics, and estimates of the United NationsSecretariat, based on data supplied by IMP.
73

On balance, the trade-weighted value ofthe United Statesdollar-as measured using the IMF Multilateral ExchangeRate Model (MERM)-fell by 13 per cent between the timeof the Louvre meeting and the end of 1987,most of theweakness following the global equity market decline of lateOctober. During this period, the dollar depreciated the mostagainst the yen and the pound sterling (16 percent each); itweakened by 10 per cent against the continental Europeancurrencies.
The magnitude and co-ordinated nature of central bankintervention may have slowed the pace of dollar depreciation, relative to previous bouts of weakness since the dollar'speak in February 1985 (see table IY.6). The massive intervention, however, was supported by co-ordinated interest
rate adjustments and other efforts to redress underlying economic imbalances. Thus, in mid-March, less than a monthafter the Louvre Accord, downward pressure on the dollarmounted and the dollar fell despite heavy intervention byUnited States and European central banks. But United Stateslong-term interest rates rose sharply and the Federal Reserve acted to tighten monetary conditions at the end ofApril. From early May to mid-August 1987, the dollargained strength, bolstered by the release of favourable dataon United States economic activity, by tensions in the Middle East, by the announcement of expansionary fiscal measures by Japan, and by the reaffirmation of the Louvre Accord at the Venice summit of industrial countries in June.Nevertheless, between mid-August and mid-October, thedollar came under renewed downward pressure, owing to
Box IVA. Exchange rate management in the EuropeanMonetary System in 1987
Developments within the European Monetary System(EMS) in 1987 generally mirrored pressures on global foreign exchange markets. The year began with a realignmentof EMS currencies that revalued the deutsche mark and theNetherlands guilder by 3 per cent and the Belgian franc by 2per cent, relative to bilateral central rates against other currencies in the System. The realignment, the second in lessthan a year, occurred in the light of the massive capitalmovements associated with the weakness of the UnitedStates dollar. Indeed, both the April 1986 and the January1987 realignments were associated with particular dollarweakness, which emphasizes the tendency for strains withinEMS to be greatest during such episodes, owing to the position of the deutsche mark as the strongest EMS currency andthus the closest substitute for the dollar. Tensions withinEMS were largely absent during the period of dollar strengthfrom May to August; difficulties re-emerged in September,however, when the dollar came under added pressure as theweaker EMS currencies failed to keep pace with thestrengthening deutsche mark. As a result, there was someexpectation ofa further realignment; when this did not occurand Italy announced a series of measures to dampen speculation on the lira, tensions subsided. The dollar's furtherweakness in the wake of the 19 October stock market decline, however, put EMS under renewed pressure at the endof the year.
The response to the tensions arising in the final months of1987 partly reflected the Nyborg (Denmark) Agreement,adopted on 8 September by the governors of central banks ofStates members of the European Economic Community. TheAgreement aims at strengthening the operating mechanismsof EMS to foster greater exchange rate cohesion, in particular by permitting joint financing of exchange market intervention to take place before a member currency reaches itsfloor or ceiling price. It also provides for stronger procedures for policy co-operation. Extension of the financingfacilities for EMS intervention is another significant compo-
74
nent of the package. The Agreement apparently guided theco-ordinated changes in official interest rates in early November-cuts in the Federal Republic of Germany, theNetherlands and the United Kingdom and an increase inFrance-and reductions in late November by Belgium,France, the Federal Republic of Germany, the Netherlands,the United Kingdom and other European countries.
Although the pound sterling has remained outside the exchange rate mechanism of EMS, the United Kingdom interest rate and intervention policies between early 1987 andearly 1988 were directed partly at stabilizing the sterlingexchange rate against the deutsche mark at around DM 3.00.In October, when the pound was pushing up against the unofficial DM 3.00 ceiling, the Bank of England intervened inthe amount of $6.7 billion to restrain sterling. And in November, a period of dollar weakness, the pound was keptbelow the ceiling most days, showing up in a $31 million risein reserves. However, the United Kingdom authorities finally capitulated to the relentless upward pressure on thepound in the early months of 1988, forsaking interventionand allowing the pound to rise above DM 3.10.
The strengthening of co-operation within EMS in 1987meant that a larger share of exchange market interventionwas aimed at supporting EMS parities. This suggests that afair part of the 1987 reserve gains of the Group of Sevenexcluding the United States, was aimed in the first instanceat supporting EMS parities rather than the dollar.
Part of the plans for a unified European market by 1992includes complete liberalization of capital flows, as proposed by the Commission of the European Communities.Any further freeing of capital flows, however, may complicate the achievement of exchange rate stability within EMSand thus requires a simultaneous strengthening of the System. In this connection, the Nyborg Agreement contributesto the objective of enhanced exchange rate stability.

Table IV.6. Phases in the depreciation of the dollar,February 1985-January 1988
Cumulative Average monthlyreal rise in reserves
depreciation of Group of Seven,Average monthly to last month excluding the
depreciation' ofperiodb United States' Intervention byUnited States
(percentage) (percentage) (billions of dollars) authorities
Pre-Plaza Accord I.3 9.0 0.5 $565 million pur-(Feb.-Sept. 1985) chases of foreign
currency
Post-Plaza Accord 2.3 25.0 l.l $3,301 million(Sept. 1985-May purchases offoreign
1986) currency
Pre-Louvre Accord l.l 34.0 4.3 $50 million sales(May 1986-Feb.) of foreign currency
1987)
Post-Louvre Accord 0.9 41.0 6.1 $661 million pur-(Feb. 198Han.) chases and $9,909
1988) million sales offoreign currency
Source: Information supplied by the International Monetary Fund and estimates of the United Nations Secretariat.a In terms of nominal effective exchange rate (MERM index), monthly averages.b Real effective exchange rate of the United States dollar, defined in terms of normalized unit labour costs.c Average change in foreign exchange reserves at constant, start-of-the-period exchange rates.
disappointing trade figures and rising concern about morerapid growth of the money supply in the Federal Republic ofGermany and Japan-which was related to interest-ratemovements in support of the dollar and central bank intervention. In the weeks immediately preceding the 19 Octoberstock market drop, interest rates rose in a number of countries, including the United States and the Federal Republicof Germany.
Following the equity market drop, the dollar once againcame under heavy downward pressure, partly because interest differentials in favour of the dollar narrowed whenUnited States interest rates fell substantially. But this wasfollowed by three rounds ofconcerted European interest ratereductions in November and December-including a 50basis-point drop in the Bundesbank discount rate to 2.5 percent-which restored the interest differentials to their levelsprior to the equity market crash. Although the interest ratemoves were accompanied by substantial intervention, thedollar fell sharply in the last two months of 1987 because ofdisappointment with measures to reduce the United Statesbudget deficit, a fall in oil prices, poor United States tradefigures and uncertainty about a prospective new agreementon policy co-ordination. The joint statement made on 22 December by the finance ministers of the Group of Seven coun-
tries reaffirming the objectives and policy directions of theLouvre Accord also failed to reverse the trend, the marketapparently being disappointed at the statement's lack of newpolicy initiatives.
In sum, the record of exchange market intervention in1987 suggests that it is most successful when combined withsupporting interest rate moves-that is, when it is partially"unsterilized" .31 Indeed, perhaps the greatest success of intervention in 1987 was that it helped to alter the course ofmonetary policy in the Federal Republic of Germany andJapan in the direction of increased expansiveness. It shouldalso be seen in conjunction with co-ordination of fiscal policies, such as the announcement during the year by Japaneseauthorities of fiscal stimulus measures.
But caveats about the limits of intervention are also in order. First, market nervousness is not something immediatelyallayed by policy. Exchange rate stability eluded the marketsat the end of the year, although the markets stabilized in thefirst quarter of 1988. Secondly, the consequence of a periodof extensive intervention is that it can have economic costs,including the losses borne by central banks when a depreciating dollar reduces the value of substantially enlarged dollar reserves. Even in 1987, for example, the Bundesbank
31 Intervention to support a falling dollar entails central bank purchases of dollars with, say, deutsche mark. This increases the supply of deutschemark in world financial markets and reduces the amount of dollars somewhat, tending to reduce interest rates of the Federal Republic of Germany and raise those of the United States. When central banks counter the money supply effects of intervention by buying or selling their ownGovernment's securities, they are said to sterilize the intervention, which is the usual practice.
75

reported a sharp fall in its profits due to exchange ratelosses; this, in turn, led to a deterioration in the fiscal balance of the Federal Republic of Germany and made it moredifficult for the authorities to adopt an expansionary fiscalstance. 32
But even if losses not resulted from the dollar's fall in1987, the exposure to losses would remain and the size of the
potential losses would grow as continued intervention keptincreasing the size of the dollar balances held. That possibility could strengthen the commitment of monetary authoritiesto support the dollar longer in order to prevent its decline, aslong as it is part of a concerted programme for a smoothunwinding of current imbalances.
Causes and consequences of the stock market crashof October 1987
The crash on 19 October 1987 abruptly ended the unusually rapid run-up in world equity values that had begun in1982 and accelerated in most markets in the last quarter of1986 (see figure IV.8). Average stock prices rose more inmarkets outside the United States during most of the period1982-1987, and in many they fell significantly further duringthe crash, with the notable exception of the Japanese marlet.The stock-price decline was unprecedented in magnitudeon the day of the crash alone, the Dow Jones Industrial Average of the United States lost 508 points or 22.6 percent.Subsequently, stock prices in world markets were highlyvolatile and average share prices stayed down for the remainder of the year. The drop in the monthly average industrial share indexes between September and December was26 per cent for the United States; it ranged between 20 percent and 33 percent for Canada, France, the Federal Republic of Germany, Italy and the United Kingdom; and was 12percent for Japan. Smaller markets showed similar variations in their decline during the period September-December, although considerably greater declines were registeredin some economies, such as Australia (over 40 per cent) andHong Kong (over 50 per cent). The decline of the Mexicanmarket was particularly dramatic: from its all-time peak on6 October to the end of December it fell 72 percent, but thisoccurred after a very large increase in prices earlier in theyear. 33
The crash highlighted the importance of the growing globalization of equity markets that has taken place in recentyears and the strength of equity markets outside the UnitedStates. The current dollar value of equities listed on the Tokyo market, in particular, has recently comprised 44 percentof world-wide equity value outstanding, as compared with30 percent in United States markets, according to industrysources. Linkages between stock markets are expanding aswell. In 1986, cross-border trading volume reached $750billion and increased in the first half of 1987 by an additional50 percent.
The rising importance of cross-border equity trading canbe attributed to several factors: sophisticated communications and trading technology, which make it profitable fortraders and even issuers to move between markets whenprices appear out of line; volatility of exchange rates, whichhas created both speculative and hedging incentives to holdsecurities whose prices are denominated in different currencies; and relaxation of both official restrictions and barriersto competition in equity markets, especially outside theUnited States. Part of international equity market activitycan also be associated with the current-account deficits ofthe United States and the large capital flows it has pulled tothat country, some of which took the form of equity purchases.
Globalization of equity markets is a natural extension ofthe internationalization that has already taken place in theinterbank and securities markets, although the process carries with it some new implications and challenges. Shareprices are driven much more by expectations than are bondprices. Depending on the expectations of investors in different parts of the world, stock prices in different markets cansuddenly move in harmony or discord.
The crash of 19 October presents the most dramatic example to date of a sympathetic drop in equity values. Apparently driven by the New York market, foreshocks havingappeared the previous week, the impulse spread to othermarkets in developed and developing countries, includingJapan. 34 There followed a widespread repatriation of fundsthat had been invested in foreign equities. In the UnitedStates, for example, the third and fourth quarters of 1987were marked by substantial declines in foreign stocks heldby United States residents as well as even larger declines inUnited States stocks held by foreign residents (see tableIV.7).
By the spring of 1988, stock indexes had recovered bysizeable amounts, but at highly divergent rates. By the first
32 The Deutsche Bundesbank recently reported profits ofDM 0.3 billion for 1987, down from DM 7.8 billion in 1986, and that DM 0.2 billionwould be remitted to the Government, down from DM 7.3 billion the year before.
33 Although the Mexican decline began before the 19 October crash, one third of the total fall to the end of December took place on 19 and 20October. The Mexican index finished the year 124 percent above the level of the previous year, which was less than the year's inflation rate (seeEl Mercado de Va/ores (Nacional Financiera), 1 February 1988, pp. 32-34).
34 Prior to 19 October, a few forecasters had predicted that a global crash would begin with a drop in the Tokyo market. Ratios of stock prices todividends in Japan had become over five times those in the United States, which was thought to be part of the same phenomenon that led tosoaring real estate prices. Among other factors, speculative investments by Japanese non-financial corporations were channelling surplus fundsinto equity markets.
76

Figure IV.8. Industrial share prices
(1980= 100)
1983
Source: OECD, Financial Market Statistics.
quarter of 1988, the Japanese Nikkei index had nearly returned to its pre-crash high, growing over the quarter by19.7 percent, and with a net increase in foreign purchases.The indexes of some smaller markets such as those of Be19ium and Sweden increased even more, while the DowJones Industrial Average of the United States grew by only
V Canada
A France
¢ Germany, FederalRepublic of
+ Japan
X United Kingdom
D United States
2.5 percent over the quarter, leaving the index 8.1 percentbelow its 13 October level.
Main factors behind the crash
The crash revealed strengths and weaknesses of the major-and some of the smaller35-stock markets around the
35 At one extreme, the Hong Kong stock exchange closed for four days (20-23 October), after a 9-day period in which the Hang Seng Share PriceIndex fell 41 percent. When the market reopened, prices fell by roughly another third as the sell orders accumulated during the closure weretransacted. A major private and official rescue effort sought to restore liquidity to the stock market and the related futures market, and a processof reform was set in motion. In marked contrast, stock markets that were insulated from international stock trading largely escaped the crash,as, for example, in the Republic of Korea and Venezuela.
77

Table IV.7. Selected financial transactions between the United Statesand other countries, 1986-1987
(Billions ofdollars)
1986 1987
II III IV II III IV'
Net purchases offoreign securitiesby United States residents 5.9 1.1 -0.6 -3.1 1.3 -0.4 0.9 1.8
of which:Foreign stocks 1.9 2.0 -1.2 -2.0 1.2 0.5 -0.4 -3.9Foreign bonds 4.0 -0.8 0.6 -1.1 0.1 -0.9 1.3 5.7
Net private foreign purchases ofUnited States private securities 18.6 22.9 17.1 12.3 18.5 15.9 12.7 -4.9
of which:United States stocks 5.9 6.8 4.2 0.1 9.8 8.4 5.0 -7.8Corporate and other
private bonds 12.7 16.1 12.8 12.2 8.7 7.5 7.7 2.9
Net foreign official purchasesof marketable United StatesTreasury bonds 1.4 5.6 3.4 4.0 8.2 10.7 6.2 6.1
Source: United States Department ofCornmerce, Survey ofCurrent Business.
a Provisional.
world. One concern was whether the markets had becomevictims of a generalized speculative bubble that had suddenly burst. As discussed in annex II below, the ratios ofshare prices to current dividends in most major marketswere at levels substantially higher than would ordinarily beexpected given long-term interest rates. Further, theamounts of the apparent "overvaluation" in share prices inlate summer were roughly consistent with the subsequentdeclines in equity prices that occurred between late summerand the end of 1987.
Another concern was whether there were specific featuresof each market that were dominant determinants. The Japanese market showed itself to be particularly strong, theUnited States market relatively vulnerable. The superiorperformance of the Japanese market can be attributed to anumber of factors. A high percentage of market capitalization is accounted for by domestic Japanese funds, and therewas considerable Japanese repatriation of funds previouslyinvested in foreign markets, especially New York. Macroeconomic variables-strong real growth forecasts, low interest rates and a stable yen-continued to attract domesticfunds and foreign investors into Japanese equities. In addition, Japanese regulations included daily limits of about 15percent on the variation in stock prices, which may haveforestalled panic selling in October. Moreover, investorsperceived the market as receiving protection from the Government ofJapan. As ifto confirm that expectation, in January 1988 Japanese authorities postponed adopting a new accounting rule for tokkin investment funds that would haveincreased tax liabilities against these funds, and life insurance companies were allowed to increase from 3 percent to 5
78
percent the level of total assets that could be invested in suchfunds.
In the United States, where large paper losses shook theconfidence of investors, policy makers and market professionals, explaining the crash became the subject of muchstudy and controversy. As shown in annex II, there are indications that United States stocks were overvalued. In addition, the principal focus of studies by many of those mostdirectly involved in financial markets has been possibleweaknesses in market mechanisms. Recent innovations intrading techniques and instruments-in particular, "programme trading" involving stock index futures-were alleged to cause destabilizing trading behaviour, which in turnwas said to have weakened overall confidence in the market.Another view pointed to economic fundamentals. It attributed the crash and subsequent volatility in stock prices torising pessimism and uncertainty regarding economic policies, with major emphasis on the fiscal and current-accountdeficits of the United States, and how adjusting them wouldaffect world financial and currency market stability, tradeand growth. These two sets of views on the crash may bestrongly related, since fragile markets are likely to be vulnerable to adverse information about macro-economictrends.
Faults in the stock market mechanism
The subject of most study and controversy has been the socalled programme trading involving stocks sold on the NewYork market and futures contracts tied to movements of indexes of stock prices that are sold on futures exchanges,

mainly in Chicago. 36 Buying or selling index futures contracts is significantly less expensive than buying and sellingthe corresponding set of stocks, and large investors haveused index contracts as a means of speculating on movements in stock prices. In addition, large institutions such aspension funds have used the technique in hedging their portfolios-that is, protecting against a drop in the price of theirstocks by selling futures contracts. If prices of the stocksrepresented in the index were to fall, the value of the indexwould also fall, resulting in a profit when the investor delivers the contract and is paid an amount related to the earlier,higher index. A popular type of hedging strategy which usesthis approach has become known as "portfolio insurance".It was offered by investment advisory firms to pension fundclients on a large scale in 1987. Computer programmeswould identify trigger points-usually after the Standard andPoor's index had taken a distinct downturn-at which salesof futures contracts in specified amounts should take place.
For the hedge or "insurance" to work efficiently, it wasnecessary that the value of the futures contract move closelyin line with the Standard and Poor's index. Arbitrageurs infact operated at low enough cost to keep the price of thefutures contract and the Standard and Poor's index withinrather close limits of each other. The combination of arbitrage and hedging capability appeared to reduce the risk ofmarket fluctuations to large investors and permit large-volume trades without inducing serious price variability-thatis, adding "liquidity" to the market-at low cost.
Some time before the crash, questions about the functioning of programme trading began to arise. As several postcrash studies revealed, many regulators and market participants came to believe that the futures market was linkingstock and futures markets only too well. There was a suspicion that speculation in the futures market was at times driving the cash prices of the stocks included in the index, although this has been impossible to prove. Difficulties wereseen in the way in which stocks and futures contracts couldbe purchased with borrowed funds. In both cases, the investors have to maintain a "margin" account, usually through abroker firm acting as an intermediary. Although margin requirements on stock purchases on the New York Stock Exchange are 50 percent for most investors, futures index contracts can be purchased with margins of only 15 percent orless, making them susceptible to greater speculative flows.
There were also complaints that, with the growth of institutional investors that deal rapidly and in large volume, too
little attention was being paid to "company news" reflectingthe true worth of firms and too much to speculating onbroader macro-economic developments. Futures marketsand related options markets, many believed, had providedthe vehicles by which speculative tendencies and "herd instincts" could more easily drive stock market prices.
Another complaint was that the futures market was beingmisused or misunderstood. The system was designed to provide protection against modest, day-to-day fluctuations inprice, not generalized and sustained drops. There is nomeans by which large drops in stock prices can be hedged;yet, it was argued, many firms were taking positions instocks without regard to the possibility that a large numberof firms would try to sell stocks or futures at the same time.This not only made the market vulnerable to declines, butmay actually have produced excessive confidence on thepart of institutional investors which encouraged the rapid,pre-craSh run-up in equity prices.
Some believed that programme traders were culpable indeepening, if not causing, the crash. The Securities and Exchange Commission of the United States, in a study of theweek of decline that culminated in the crash, reported that30 per cent to 68 per cent of the sale of stocks at varioustimes in the week from 14 to 20 October were accounted forby programme traders. According to the report of the Presidential Task Force on Market Mechanisms (the Brady Commission), portfolio insurance accounted for 20 per cent offutures selling and 10 percent of stock selling in the 19 October plunge. One institution did most of the selling on thatday. The Securities and Exchange Commission reported thatstock-index arbitrage accounted for more than one third ofall stock transactions during two short, but critical, transaction periods on 19 October. 37
Another argument is that imperfections in the links between the stock and index-futures markets produced or exacerbated the decline. For example, inadequacies in computercapability in the New York market and in financial resourcesof market-makers (also primarily in the New York market)led to frantic dumping of stocks at the New York Stock Exchange on 19 and 20 October. Sell orders overloaded theExchange's Direct Order Turnaround (DOT) system, making it impossible to execute many sales. No such problemexisted at the Chicago futures market, where traders couldsell stock index contracts cheaply and quickly.38 As a result,the spreads between the average prices of the actual shares inthe New York market and the prices implied by the futures
36 The Kansas City Futures Exchange opened the first futures contracton a stock index (the Value Line index of stocks) in February 1982. Thiswas followed in April 1982 by the contract on the Standard and Poor's 500 index at the Chicago Mercantile Exchange and on the New YorkStock Exchange composite index in New York in May 1982. The Standard and Poor's 500 has dominated the market. This, like most of theother index contracts, involves "cash settlement"-that is, at maturity, the deliverer (the one who has sold the futures contract) must pay $500for each point that the Standard and Poor's index has risen above the originally contracted price or, if the price falls below the contracted price,the deliverer will receive $500 for each point.
37 Report ofthe Presidential Task Force on Market Mechanisms (The Brady Commission Report), (Washington, D.C., United States GovernmentPrinting Office, 8 January 1988); The October 1987Market Break, Securities and Exchange Commission Staff Report, (Washington, D.C.,United States Government Printing Office, February 1988).
38 A different problem, however, did exist in Chicago, namely, the failure of floor traders on the Chicago Mercantile Exchange to absorb more ofthe large sales in index futures contracts that were coming in. Greater participation of these traders on the buying side of these contracts mighthave helped support the futures contract prices during critical periods, but traders were insufficiently capitalized and could not substantiallyincrease their own holdings of the contracts.
79

contracts became the widest ever seen. This would havebeen prevented if arbitrageurs had sold stocks in the NewYork market and bought the lower-priced futures contractsin Chicago, but since sales could not be quickly executed inthe New York market, the arbitrage broke down. The situation was aggravatec by the many "specialist" firms on theNew York exchange that are given trading control over specific stocks in exchange for a commitment to stabilize pricesin those stocks. The firms were unable to function with theirexisting levels of capital when the volume of traded sharesjumped. As stock prices fell, the resulting loss of capitalmade many specialist firms suspend trading in certainstocks, including some which make up the index underlyingthe Chicago futures contract. Thus, while traders could stillconveniently buy futures contracts representing certaincombinations of stocks, there was temporarily no means bywhich the corresponding New York Stock Exchange stockscould be traded.
Uncertainty about macro-policies
The second major interpretation of the reason for the crashand subsequent stock market volatility directly addressed thefact that the crash was not restricted to the United Statesmarket, but reflected investor concerns in Europe, Asia andsome Latin American countries as well. In all these centres,there was a rising level of adverse expectations or uncertainty about the course of macro-economic policies of themajor economies. As discussed previously, there had beensome early signs of success in 1987 in policy co-ordinationamong the major industrialized market economies. Both theFederal Republic of Germany and Japan had pushed fiscalpolicies into moderately expansive directions in 1987, andmassive official purchases of dollars in foreign exchangemarkets were partially unsterilized, leading to an easing ofmonetary conditions in both countries. The fiscal policies ofthe United States had become moderately contractionaryand United States monetary conditions began to tighten.
Yet, several other developments, however, were disturbing to investors. First, the pace of United States adjustmentwas extremely slow and appeared to require a further buildup of the external debt of that country in the medium term.Although the United States federal deficit as a percentage ofGNP had declined from 5.3 percent in 1985 to 3.4 percent in1987, this was slow progress and Congressional budget negotiations did not seem to be accelerating the adjustment.Inability to correct the fiscal imbalance implied that at sometime there would have to be a strong downward adjustmentin dollar exchange rates, if only to reduce domestic privateexpenditure and thereby shift resources towards financingthe fiscal deficit; or there could be a tightening of monetarypolicy by the United States Federal Reserve to prevent theexchange rate from falling, while also shifting expenditure.The dollar "free-fall" scenario entailed several distressingimplications, including a cut-off in foreign purchase of dollar-denominated securities, renewal of United States inflation, high interest rates and domestic recession. But to
monetarists in the financial markets, the threat of dollar-support by means of monetary policy was the more troublesomepossibility. Noting that economic activity and stock pricemovements have been correlated with changes in the rate ofgrowth of the money supply (the former lagging behind thelatter), monetarists were already watching reduced rates ofmoney growth in the United States with concern. Largescale defence of the dollar through additional monetarytightening was, to them, tantamount to inducing a recessionand a stock slump.39
A second development that was disturbing to financialmarket participants in 1987 was the rise of United Statesinterest rates in the spring, associated with reduced willingness of private foreign investors to acquire United StatesTreasury obligations. The rise in interest rates was primarilyat the long-term end (i.e., the yield curve "steepened" at atime of rising interest rates), a phenomenon often associatedwith expectations of inflation over the longer term. Whilethe rise in United States interest rates could be perceived asdue in part to monetary policy actions, it also seemed toimply serious scepticism about the willingness or ability ofthe United States to correct its fiscal and external imbalance.
Finally, questions were raised about the sustainability ofthe dollar-support programme as carried out after the Louvre Accord in February 1987. The major form of this support was intervention in foreign exchange markets in whichGovernments other than that of the United States purchaseddollars and converted those balances into United StatesTreasury securities. The fact that some private flows hadceased moving towards the United States itself implied negative expectations in the private sector. How long the officialflows would be maintained became an issue of some uncertainty.
Short-term consequences of the crash
First, although the crash caused an almost immediatedownward revision of most forecasts of world growth, concern seemed to have dissipated by the spring of 1988. Realgrowth prospects have been revised to pre-October levels.The widely feared "wealth-effects" were to have induced acut-back in expenditure by people who felt less well off,plunging the industrialized countries into a recession or atleast slowing growth. But none of this occurred-in part,because stock ownership is a relatively small component ofprivate wealth, and because of positive wealth effects fromrising bond prices and falling interest rates. In addition, economic indicators did not point to fragility in the real side ofthe economy40 and so expenditure cut-backs were notprompted on that score either. As pointed out by many financial analysts, the robustness of the real side distinguishesthose instances in which an equity market crash does notprecede a general financial collapse and real-side downswing, as in 1962, and those in which it does, as in 1929. Themajor symptoms of international imbalance-the developing country debt problem and the United States external def-
39 Many monetarists posit a more direct relation between money stock growth and stock prices. A slow-down in monetary growth, for example,would raise real interest rates and induce investors to shift from equity investment to bonds.
40 Most evidence has been favourable: leading indicators, low reported inflation rates and consumer confidence surveys.
80

icit-of course continued to be important issues, althoughapparently they were not sufficient to cause major downward shifts in private spending.
The major studies of the United States stock and futuresmarket mechanisms produced proposals that were designedto (a) strengthen the technical efficiency of both the stockand stock-index markets in ways that would strengthen eachmarket separately as well as improve the functioning of thearbitrage process; (b) increase surveillance and control overthe individual markets, especially by means of price limitsand other market "circuit breakers" that stop trading forshort times during periods of extreme volatility; (c) createconsolidated surveillance and control over the stock and index-futures markets; and (d) better balance the costs ofoperating in the futures and cash markets primarily by increasingmargin requirements in the futures market.
Action taken thus far has been rather modest. Measureshave been taken to increase market efficiency, such as requiring "specialist" firms to have more capital. Since mosthad already added to their capital, this appeared to be primarily for public relations purposes. Additional circuitbreakers have included new price limits in futures marketsand suspension of access to the Direct Order Turnaroundsystem by programme traders on the New York Stock Exchange when the Dow Jones Industrial Average of stockprices rises or falls more than 50 points. No explicit co-
81
ordination of the futures and cash markets was introducedand there has been almost no progress in consolidating control and surveillance.
At the private level, a number offirms have curtailed programme trading activities in the interest of investor relationsand portfolio insurance is a much less heavily practiced investing strategy by large brokerage houses on behalf of theirclients, although some brokerage houses have been engagedin more speculative use of programme trading on their ownaccount. Although the issue is undecided, a movement hasemerged in the financial community to ban programme trading entirely.
In the area of regulation of the banking and financial sectors, the shock to financial stability appears to have createdmomentum for a movement that seeks to re-examine the recent push towards deregulation of financial markets. In theUnited States, in recent years, pressures on commercialbank earnings have created a strong sentiment for repeal ofthe Glass-Steagall Act which separates securities underwriting activities from commercial banking. Although it is tooearly to say whether this repeal movement will be significantly diluted because of the crash and recent financial volatility, it is certain that the crash has extended the debate andprovided arguments for the opponents of the deregulation ofbanking.


Chapter V
THE INTERNATIONAL OIL MARKET
For almost the whole of 1987, international oil prices remained within a narrow range of$17 to $18 a barrel, higherthan the average price of approximately $14 a barrel in 1986but well below the price of $28 a barrel which had prevailedin the previous three years. Oil demand continued to increase, although at a lower rate than in 1986.
Many oil-importing countries benefited from the lowprices of crude oil, especially those with appreciating national currencies vis-a-vis the United States dollar. Severalof the oil-exporting developing countries, however, experienced foreign exchange difficulties.
Throughout 1987, a lack of timely and accurate information caused serious uncertainties about the level of oil consumption, production, stocks rmd prices.
Accurate information about market conditions and theoutlook for the world's most important commodity is obviously essential to the planning both of Governments and ofcompanies. The information available, however, is unreliable. Traders swap billions ofbarrels of oil, speculators tradebillions of dollars in futures contracts and oil companiesmake huge business expenditures based partly on statisticsthat are likely to be inaccurate. l
Some of the uncertainty is due to national policies in countries which regard information on petroleum reserves, production, stocks and even trade as secret; much of it, how-
ever, is due to weaknesses in national reporting capacitiesand the lack of an agreed international reporting system.2 Atpresent, apart from national sources, the main reporting systems are managed separately by the secretariats of the Organization of the Petroleum Exporting Countries (OPEC) atVienna and the International Energy Agency (lEA) in Parison behalf of their governing bodies and member countries.
Two recent examples-in addition to uncertainties aboutproduction levels in some member countries of OPEC, despite data reported from several sources-show the difficulty of making projections based on inadequate information. In January 1987, the Energy Information Administration of the United States Department of Energy revised itsproduction estimates, showing actual output substantiallylower than was reported throughout 1986: "The miscalculations through most of 1986 stemmed from the Energy Department's practice of projecting oil production using pasttrends. The system, which worked well when prices werefairly constant, was thrown awry by last year's (1986) sudden price drop."J
Similarly, lEA, in its Oil Market Report of end-December1987, revised its estimates, particularly on oil consumptionin developing countries since 1981: consumption in 1987was 12.9 million barrels a day or 7.5 per cent higher than thefigure of 12 million barrels a day originally published. 4 Thelack of an adequate system for the collection and reportingof information deserves international attention.
Developments in oil markets in 1987
Oil price stability remains uncertain
After the great volatility of oil prices in 1986, membercountries of OPEC, at their meeting in December that year,decided to implement production policies which aimed atstabilizing the market at $18 a barrel during 1987.
At the time of the OPEC meeting, oil prices were about$13 to $14 a barrel after recovering from their lows of lessthan $10 a barrel in July 1986 (see figure V.1). Because oflow oil prices, the foreign exchange income of OPEC member countries dropped from $132 billion in 1985 to $77 billion in 1986. This loss of $55 billion in just one year causedserious financial difficulties in most of the countries concerned and individual pressures for persistent increases inproduction and exports were expected to continue.
Despite these expectations, production restraint duringthe first half of 1987 resulted in the stabilization of the reference price which resulted in a 17 per cent improvement in oil
export earnings for OPEC member countries (see tableY.1).
Price stability was threatened during the summer of 1987by increasing tensions in the Persian Gulf, which resulted inthe protection of Kuwaiti tankers by the United States navyand the involvement of the navies of the Union of SovietSocialist Republics and Western European countries withthe stated aim of assuring oil shipments through the Strait ofHormuz. Prices on the spot market reached their highs inJuly and August ($20-$22.60 a barrel in the United States),but sizeable production above the agreed quotas by some ofthe OPEC member countries, particularly in the PersianGulf, led to a decline in prices in the last two months of theyear.
Questions about the stability of the international financialsystem and its possible effects on the world economy afterthe stock market crash of October 1987 added to the uncer-
1 James Tanner, "Vaporous oil", The Wall Street Journal, 24 November 1987.2 The information on developments in world oil markets provided in this chapter necessarily reflects the inadequacies of the reported data.3 Frederick Rose, "U.S. oil output falloff is worse thanestimated, new data show", The Wall Street Journal, 21 January 1988, p. 6.4 "lEA boosts estimates of oil use by third world", Oil and Gas Journal, 18 January 1988, p. 66.
83

Figure V.l. Crude oil prices, 1985-1988(Dollars per barrel)
30 ,----t:------------------------,2928272625
24
23
222120
1918
17161514131211
109 -+--ro--r-.-,-,;-r-.-,-,--r-.--.-+......,-,....,.--.-...--,.-,---.-...--,.-,---.-...--r-T--.--,-r-l
1985
o Arab Light
1986
+ Brent Blend
1987
-- World Average
1988
Source: Department of International Economic and Social Affairs of the United Nations Secretariat,based on United States Department of Energy, Energy Information Administration, Weekly PetroleumStatus Report, 1985-1988 issues.
Table V.l. Value of oil exports ofOPEC member countries'
(Millions of dollars)
Country 1970 1980 1985 1986 1987'
Algeria 681 12647 9170 3760 3300Ecuador 1 1563 1927 983 600Gabon 58 1 876 1668 848 900Indonesia 446 15595 9083 5451 4500Iran (Islamic Republic ot) 2358 13 286 13115 6600 9200Iraq 788 26296 11 380 6980 11 300Kuwait 1596 17678 9729 6200 6550Libyan Arab Jamahiriya 2357 21 396 10 520 4700 5800Nigeria 715 25277 12338 6300 7300Qatar 228 5428 3355 1460 1900Saudi Arabia 2418 108 174 25936 21 190 22750United Arab Emirates 485 19496 13 395 5890 8800Venezuela 2371 18248 10 352 6713 7400
Total 14501 286959 131 967 77 073 90300
Source: OPEC, Annual Statistical Bulletin, 1986for 1970, 1980, 1985 and 1986; and PetroleumIntelligence Weekly, 7 December 1987, p. 3, for 1987 estimates.
a Including, where applicable, oil product exports. For some countries, exports of condensatemay be included.
b Estimates.
84

Table V.3. Consumption of energy petroleum products
(Percentage annual growth rates)
Source: Department of International Economic and Social Affairs of the United Nations Secretariat, based on United Nations,Energy Statistics Yearbook, various issues,
day (see table A.III.l3). Increases in consumption were registered for all the four main energy petroleum products: 5.4per cent for aviation fuels, 2.7 per cent for gasoline, 2.4 percent for middle distillates and 1. 8 per cent for heavy fuel oil.
This significant reversal of declining trends in oil consumption was somewhat marred by the poor performance ofheavy fuel oil, which had previously caused most of the decline because of expanded use of coal, nuclear power andnatural gas for electricity generation and industrial use. Apparently fuel oil prices became competitive enough to encourage switching in the United States, where consumptionincreased by 14.1 per cent. Fuel oil use, however, continuedto decline in both Japan and Western Europe.
In 1987, oil consumption in the developed market economies increased by 1.5 per cent. Aviation fuels, motor gasoline and middle distillates increased by 3.0, 2.8 and 0.7 percent, respectively, but heavy fuel oil consumption declinedby 4.8 per cent because the increase in oil prices discouragedeven limited switching with competing fuels, as in 1986.
In view ofthe expected slow-down in the rate of economicgrowth in the developed market economies, an increase inoil consumption of only 1.0 per cent is forecast for 1988.
Average annual increases in oil consumption have beenconsistently higher in the developing countries than in thedeveloped market economies because of the greater dependence of the developing countries on oil and gas as theirmain sources of commercial primary energy (about 75 percent in recent years), the lack of alternative sources of energy, higher rates of growth in population, rapid urbanization and, in some cases, good overall economic performance. Oil consumption increases were particularly high during the 1970s in OPEC member countries and other oilexporting developing countries because of generally rapiddevelopment based on high oil exports and oil prices and lowor subsidized prices of petroleum products for national consumption. Even in the oil-importing developing countries,during the 1970s the average annual increase in demand wasmaintained at approximately 6 per cent, or more than fourtimes the rate in the developed market economies. (see tableV.3).
1971-1980 1981-1986
-1.303.502,854,654.180.70
1.435.447.70
11.688.016.09
Developed market economiesCentrally planned economiesDeveloping countries
OPECOther oil-exporting countriesOil-importing countries
First Second Third Fourthquarter quarter quarter quarter
Planned 15 800" 15 800' 16600" 16600·,b
Actual 15622 16833 19404 18879
Difference -178 1033 2804 2279
tainties in the oil markets during this period. By mid-December, prices on the spot market had plunged to between$15 and $16 a barrel in view of fears of a major slow-downin the world economy and the difficulties of OPEC membercountries in reaching an agreement during their meeting atVienna from 9 to 14 December. Nevertheless, an agreementwas reached to continue production with the same quotas asthose set for the third quarter of 1987 (see table V.2); noquota was set for Iraq.
Source: Department of International Economic and Social Affairs of the United Nations Secretariat, based on Middle East Economic Survey, 18 May 1987; and Petroleum Intelligence Weekly, 15February 1988,
a Including a theoretical quota for Iraq of 1,466,000 barrels a day forthe first and second quarters and 1,540,000 barrels a day for thethird and fourth quart~rs,
b Revised in June 1987 from the original18,300,000 barrels a day setin December 1986.
After a brief recovery, oil prices remained weak duringthe first three months of 1988, despite considerable restraintin OPEC output, because of reduced demand especially inWestern Europe and Japan, increased supplies from nonOPEC sources and stock drawdowns. By the end of Marchspot market prices had reached their lowest levels since 1986at about $14 to $15 a barrel. 5 Prices, however, can be expected to improve towards the $18 a barrel level for the restof the year on the assumption that OPEC production willcontinue to be near the agreed level and that some nonOPEC oil-exporting countries will also support cut-backs.
Deceleration in consumption growth
After reaching a peak ofalmost 42 million barrels a day in1979, oil consumption in the developed market economiesdeclined to 34 million barrels a day in 1983 and remainedvirtually stagnant until 1986, when oil prices fell by about 50per cent from $28 a barrel.
Taking into account inflation and the weakening of theUnited States dollar in 1986, the fall in crude oil prices inreal terms was about 57 per cent. Because of excise andsimilar taxes, however, prices of petroleum products fell onaverage by only 28 per cent in the developed market economies, so that approximately half the crude price fall passedthrough to consumers. 6
This fall in oil prices was accompanied by an increase inconsumption of 2.7 per cent in 1986 or 1.0 million barrels a
Table V.2. Planned and actual production ofOPEC oil, 1987
(Thousands of barrels per day)
5 Eo.b. Middle East; in terms of constant dollars, these prices were very close to the lows of 1986.6 Michael B. Morrison, "Will oil demand recover? A challenge to a consensus", Petroleum Review, July 1987, p. 47.
85

Table VA. World consumption of residual fuel oil
(Millions of barrels per day)
Sourr:e: Department of International Economic and Social Affairs of the United Nations Secretariat, based on United Nations,Energy Statistics Yearbook. various issues.
Unlike the developed market economies, where heavyfuel oil use for electricity and industrial purposes dropped byabout 49 per cent during the period 1970-1986, developingcountries more than doubled fuel oil consumption during thesame period (see table VA).
Higher oil prices in the early 1980s, as well as the impactofeconomic recession in many of the oil importing developing countries, caused a drastic deceleration in the rate ofincrease of oil consumption to about 0.7 per cent annually.About a third of these countries registered negative annualgrowth rates during the period 1980-1986.
In only 23 of 90 oil-importing developing countries wasoil consumption more than 1 million tons annually (about20,000 barrels a day): Argentina, Bangladesh, Brazil,Chile, Cote d'Ivoire, Cuba, Dominican Republic, Guatemala, India, Jamaica, Jordan, Lebanon, Morocco, Panama,Pakistan, Philippines, Republic of Korea, Singapore, SriLanka, Thailand, Turkey, Uruguay and Yugoslavia. Duringthe period 1980-1986, annual increases in oil consumptioncomparable to those ofthe 1970s or better were registered byonly 4 of the 23 countries (India, Jordan, Pakistan and Republic of Korea); eight of them registered negative annualrates.
Production shift to developing countries
Once again the oil production policies of OPEC membercountries dominated developments in the world oil marketsin 1987. During the first half of the year, oil production levels were close to the quotas set for most of the OPEC countries, with the result that most trade transactions were carried out at the reference price of $18 a barrel.
In the summer of 1987, with fears of oil supply interruptions related to the conflict between the Islamic Republic ofIran and Iraq and intensified tensions in the Persian Gulfresulting in the damage of oil tankers and oil installations,oil production in a number of countries of the region increased well above quotas, apparently to meet increasingdemand, particularly for stockpiling in consuming countries. The expanded output continued to be sold either atofficial prices or even at premium prices well into the autumn and considerable discounting was reported only duringthe last two months of 1987, particularly after the boycott ofIranian oil by France and the United States.
At the meeting of OPEC member countries in December1986, production targets were set for each of the four quarters of 1987 (see table Y.2). Since no quota was set for Iraq,it was expected that actual production in that country wouldcontinue at a higher rate than its previous quota and therefore some apparent over-production was built into the plan.However, over-production by the third quarter of 1987 hadapparently reached 2.8 million barrels a day and by thefourth quarter, 2.3 million barrels a day. At the meeting ofOPEC members in December 1987, it was agreed that theproduction levels of all members, with the exception ofIraq,would be 15.06 million barrels a day during the first half of1988, with national production levels assigned in the sameway as in the December 1986 agreement for the third quarterof 198T (see table Y.2 and table A.III.l4).
For the first three months of 1988, OPEC production appeared to have been reduced substantially from its high levels of the second half of 1987 but it was still higher than theagreed quotas.
Because of consumption levels apparently lower than expected during the first few months of 1988, higher suppliesfrom non-OPEC countries and stock drawdowns, variousreports at the end of March indicated that consideration wasbeing given to convening an extraordinary meeting of the
developed market economies, during the past 10 years, inenergy conservation and efficiency improvements, as wellas in the development of substitutes, especially for producing electricity. However, an increasing perception that oilprices could remain lower in real terms than the high levelsexperienced in the early 1980s could result in the relaxationof government measures inhibiting oil consumption, reducesubsidies for high-cost energy substitutes and promote reverse substitution. A resumption ofhigher rates of economicgrowth, particularly in the developing countries, could leadto a rate of increase in consumption above the 1 to 2 per centannual trend of recent years.
4.134.022.84
10.99
4.093.842.77
10.70
7.553.812.67
14.03
1970 1980 1985 1986
8.032.091.33
11.45
Developed market economiesCentrally planned economiesDeveloping countries
World
In 1987, oil consumption in all the developing countriesincreased by 2A per cent and is expected to increase byabout 2.5 per cent in 1988.
Oil consumption in the centrally planned economies increased rapidly during the 19708 but decelerated somewhatin the 1980s. During the period 1981-1986, the average annual rate of growth of 3.5 per cent was higher than in boththe developed market economies and the developing countries (see table V.3).
Growth of consumption was particularly strong in the Soviet Union. In Eastern European countries, however, oilconsumption remained stagnant throughout the 1980s because of foreign exchange problems in obtaining supplies.Instead, consumption of energy focused on alternativesources, especially natural gas, mainly from the Soviet Union, and nuclear power.
Forecasts of world oil consumption in the medium termcontinue to be influenced by the experience gained by the
7 OPEC press release, 14 December 1987.
86

Conference of OPEC with a view to deciding on the necessary production level so as to restore the desired price stability as provided for in the agreement reached in December1987.
It was also reported that non-OPEC oil-exporting countries (Angola, China, Colombia, Egypt, Malaysia, Mexicoand Oman), at a meeting in London in March 1988,8 wereconsidering reducing their levels of oil production. 9
Crude oil production in non-OPEC developing countriesexpanded substantially during the 1970s and accelerated further during the 1980s. As shown in table A.IIU5, crude oiloutput increased from 1 billion barrels in 1970 to 2 billionbarrels in 1980. By 1987, output had increased by a furtherbillion barrels.
Much of this increase was due to expansion of output innon-OPEC oil exporting developing countries such as Angola, Egypt, Malaysia, Mexico, Oman as well as in Yemen,which began exporting oil in December 1987. Among thisgroup of countries, however, output reductions due to lackof adequate reserves and maturity of oil fields were reportedby Brunei Darussalam, Peru, Trinidad and Tobago and Tunisia.
China also achieved considerable increases in oil production, doubling output from 1.1 million barrels a day in 1973to 2.1 million barrels a day in 1979. During 1980 and 1981,production declined to 2.0 million barrels a day but sincethen production has steadily improved, reaching a level of2.7 million barrels a day in 1987. Targets for future production are 3.0 million barrels a day in 1990 and 4.0 millionbarrels a day by the year 2000.
Significant expansion of oil output was also registered inthe oil-importing developing countries but it was limited especially to Brazil and India during the 1980s. Small new oilproduction was also reported in Bangladesh, Benin, Coted'Ivoire, Ghana, Guatemala, Jordan, Pakistan, the Philippines and Suriname.
In the developed market economies, the most significantevent was the continued decline of oil production in theUnited States. As indicated in the World Economic Survey1987 10 the oil price decline of 1986 brought about a reduction of about 0.9 million barrels a day in oil production inthat country between January and December 1986, mainlybecause of the closing of high cost, small output wells-theso-called stripper wells.
For 1987 as a whole, United States output was about 8.3million barrels a day which was a 4.7 per cent decline fromthe average of 1986. Production in Alaska increased somewhat because of the start-up of new fields but in the contiguous United States production fell by 7.3 per cent to reach thelowest level since 1965. This declining trend was not expected to be reversed unless prices increased substantially.
Production of oil in the North Sea has been on the risesince the beginning of the 1970s, reaching a level of 3.5million barrels a day in 1986. Production in the United Kingdom sector, however, was static at about 2.5 million barrelsa day during the period 1984-1986, while increases wereregistered in the Norwegian and other sectors.
Crude oil production in the North Sea in 1987 remainedvirtually the same as in 1986. Although three oilfieldsstarted production in the United Kingdom sector during theyear, output declined, averaging 2.45 million barrels a day;apparently, as a result of maturation of the biggest fields, thenew production was not sufficient to reverse the slow decline. The drop in output in the United Kingdom sector wasoffset by substantially higher production in the Norwegiansector, up 12 per cent to an average of about 973,300 barrelsa day despite production cuts of about 80,000 barrels a dayacross the board, made in support ofOPEC. Output was alsoincreased by Denmark and the Netherlands. II
Crude oil production in the Soviet Union, after a very impressive growth of 44.2 per cent, from 8.6 million barrels aday in 1973 to 12.4 million barrels a day in 1983, registeredconsecutive declines during 1984 and 1985. The decline wasreversed in 1986 and 1987, production reaching a new highof 12.6 million barrels a day in 1987.
The improvement of the past two years was due to additional investments and managerial reorganization, particularly concerning the Western Siberian oil fields. For example, capital investment was to increase by 31 per cent in 1986over 1985, particularly in development drilling. 12
Small oil output in Bulgaria, Czechoslovakia and Polandremained static during the 1980s, while Hungary experienced a decline. Romania, the only other important oil producer in Eastern Europe, also registered a decline during1985 and 1986.
Investment levels still depressed
Lower oil prices since the early 1980s have led to a downward trend in investments in petroleum exploration and production. The trend was particularly pronounced in 1986.Despite the relative stability of 1987, uncertainty and fearsof yet another oil price collapse, coupled with the world financial crisis and its effect on oil corporations, have workedagainst a definite resumption of petroleum investmentsworld wide.
Comprehensive statistics on investments in oil explorationand development are not available. However, informationprovided by the world-wide activities of seven major oilcompanies from the United States and Western Europe arean indication of the main trends (see tables A.III.l6 andA.III .17). Oil exploration expenditures decreased from $9.2billion in 1982 to $4.9 billion in 1986; investments in pro-
8 Norway and the USSR attended as observers.9 YoussefM. Ibrahim, "5% output cut studied by OPEC", The New York Times, 10 March 1988, pp. D1 and D17.10 United Nations publication, Sales No. E.87.II.C.1, p. 107.11 For a comprehensive survey of the North Sea to end of 1986, see Clive Jones "A review of petroleum exploitation and production activities in
North-West Europe" , Energy Exploration and Exploitation, vol. 5 (1987).12 Oil and Gas Journal, 5 August 1986, p. 20.
87

duction fell from $19.6 billion to $11.3 billion during thesame period.
Capital expenditures of United States companies abroadhave also been reduced substantially since 1982, as shown intable A.Ill.18. Although these estimates include both upstream (exploration and production) and downstream (refining and marketing) investments, by far the greatest proportion has been devoted to exploration and production. Investments fell from $11.4 billion in 1982 to $6.0 billion in 1987in the developed market economies and from $8.3 billion toonly $3.3 billion in the developing countries during the sameperiod. Among the developing countries, the main recipients were such oil exporting countries as Colombia, Ecuador, Egypt, Indonesia, Malaysia, Nigeria, Peru, Trinidadand Tobago and United Arab Emirates.
The stabilization of oil prices in 1987 and expectations thatany declines would be of short duration led to some increases in investment plans for 1988. According to a surveyof 35 United States companies, investments in explorationand production in the United States were expected to increase by 14 per cent, from $15.6 billion in 1987 to $17.8billion in 1988. This would follow a decline for six consecutive years since the peak of $57.8 billion in 1981.
Similar investments outside the United States by the samegroup of companies would increase by 23 per cent to $7.6billion in 1988 from $6.2 billion in 1987. 13
Because of lower prospects for oil and gas discoveries inthe United States, as well as lower profit margins, a shiftwas developing in favour of investments abroad. As shownin table A.III.19, profit margins for each barrel of oil equivalent remained high even during the low price levels of 1986,mainly because of a drastic reduction in government take oncrude oil and gas production.
Since oil and gas exploration and development costs havebeen reduced considerably in the past two years, the aboveincreases in financial outlays indicate an improvement fromthe lows of 1986 and 1987, but their levels remain far belowthe peaks of the early 1980s. A definite resumption ofinvestments will depend on higher cash flows to oil corporationsand, because of the long lead times involved, their expectations of the condition of the oil market in the early 1990s.
The slow-down in investments is bound to affect futureproduction levels and oil discoveries in the developed market economies and the developing countries. Consequently,increases in oil demand will be met by those oil-exportingcountries which continue to have unused production capacities.
Developments in the oil market, particularly since the oilprice collapse of 1986, have brought about some rapid
changes in the structure of the petroleum industry in its efforts to adjust to the new circumstances. Changes related tooil company mergers and consolidations and the integrationof major oil-exporting countries into downstream operations, often in the form of joint ventures, are briefly reviewed below.
Changes in the structure of the petroleum industry
Nationalization of oil reserves by a number of developingcountries in the late 1960s and the 1970s had a profoundeffect on the position of the major oil companies. By 1986,their control of oil supplies had dropped to 33 per cent of theworld total (excluding North America and the centrallyplanned economies), from 56 per cent in 1976. They continued, however, to show considerable strength in downstreamoperations, particularly in the marketing of petroleum products (see table V.5).
Since the energy crises of the 1970s, the major oil companies, as well as a large number of independent oil companies, have concentrated their exploration and developmentinvestments in the developed market economies (Australiaand North American and North Sea producers), where despite relatively high costs returns were favourable until themid-1980s, because ofhigh oil prices. Their objectives werethe diversification of crude oil supplies and an improvementin the proportion of equity oil which would remain undertheir control. In pursuit of similar objectives, investmentshad also been directed especially towards non-OPEC developing countries, mostly oil exporters, where costs weresomewhat lower and prospects of discoveries greater than inthe developed market economies. 14
Despite these efforts, a recent survey of 30 big oil companies found that each dollar spent on exploration during thefour years to 1986 yielded reserves worth 58 cents, with theresult that, at current production levels the companies hadless than 10 years of reserves left; consequently, the samesurvey indicated that the number of big integrated oil companies was likely to halve by the year 2000. 15
Declining real oil prices since 1984, particularly the oilprice collapse of 1986, resulted in a financial shake-up ofmany of the independent oil companies in the United Statesand the North Sea, which had been attracted into the oil playduring the 1970s because of high prices and profitability.Their predicament was aggravated further by the stock market crash of October 1987, which made it even more difficultto attract additional financing. With many banks burdenedby a multitude of non-performing energy loans to independent oil companies and with the persistent uncertainty aboutthe level of oil prices in the short term, further bankruptciescan be expected, with consequent consolidation into themore financially secure oil companies. 16
13 Robert J. Beck and Bob Williams, "U.S. industry's spending plans show first increase in seven years", Oil and' Gas Journal, 22 February1988, p. 17.
14 See the report of the Secretary-General on energy exploration and development trends in developing countries (A/41/383-E/1986/101), paras.14-23.
15 "Drilling for oil on Wall Street", The Economist, 20 February 1988, p. 71.16 According to a report in the newsletter section of the Oil and Gas Journal, 29 February 1988, oil company mergers and acquisitions numbered
244 in 1987, a 66 per cent increase over 1986.
88

Table V.5. Changes in operations of major oil companies, 1976 and 1986'
(Thousands ofbarrels per day)
Percentage of Percentage of1976 world tota1b 1986 world total"
Crude oil supply" 25362 56.1 13 625 33.4Refining runs 19 194 43.2 13 426 30.1Petroleum productsales 21 359 47.4 18876 42.9
Source: Department of International Economic and Social Affairs ofthe United Nations Secretariat, based onPetroleum Economist, May 1978 and June 1987, and United Nations, Energy Statistics Yearbook, various issues.
a The 1976 operating statistics included two Europe-based groups: British Petroleum and Royal/Dutch Shell andfive United States-based majors: Exxon, Gulf Oil, Mobil, SoCal and Texaco. Gulf Oil and SoCal merged to formChevron in 1984.
b Excluding the centrally planned economies.
c In most cases, figures show net production of crude oil and natural gas liquids, plus purchases under specialsupply arrangements.
Table V.6. Ratios of crude oil reserves to production, 1987
Estimated proved Reserves/productionreserves" Production ratio
(millions of barrels) (years)
Developed marketeconomies 56292 5225 10.8
North Americab 32095 3568 9.0Western Europe 22448 1432 15.7
Centrally plannedeconomies 60800 4712 12.9
USSR 59000 4558 12.9
OPEC 670655 6459 103.8OPEC countries ofthe Persian Gulf' 558215 4270 130.7
Non-OPEC oil-exportingdeveloping countries 70808 2332 30.4
Mexico 48610 926 52.5
Oil-importing developingcountries 10 394 644 16.1
China 18400 966 19.0
World total 887 348 20338 43.6
Source: Department of International Economic and Social Affairs of the United Nations Secretariat, based onOil and Gas Journal, 28 December 1987.
a As at 1January 1988.
b Canada and the United States.
c Iran (Islamic Republic of), Iraq, Kuwait, Qatar, Saudi Arabia and United Arab Emirates.
The oil industry in some of the OPEC member countriesand state-owned petroleum enterprises in both the developedmarket economies and the developing countries have alsoexperienced significant restructuring.
The reversal of decision-making power in oil productionand prices from the oil companies to host Governmentssince the early 1970s led to the strengthening of existingstate-owned petroleum enterprises and the organization andestablishment of new ones in both the developed market
89
economies and the oil-exporting developing countries.However, the emergence of more abundant oil supplies anddecreasing prices, particularly in the mid-1980s, have already led to a de-emphasis of the importance of these enterprises in the developed market economies. This trend hasbeen strengthened further by an approach more generallyoriented towards private markets in at least some of thesecountries. As a result, the state-owned petroleum enterprises of the United Kingdom-British Gas and the BritishNational Oil Corporation-have been privatized and similar

objectives have been declared in other countries (e.g., Canada and New Zealand). 17
Parallel trends have also been noted in non-OPEC developing countries where state-owned petroleum enterpriseshad been strengthened and new ones organized either forexpanded exploration and production or for assuring imports through the oil companies or directly from the oil-exporting countries. In a few of the oil-importing developingcountries, decisions have been made to privatize a large partof their oil industry. This process has been increasingly supported by at least some of the developed market economiesthrough their aid agencies or through multilateral organizations. State-owned enterprises in oil-importing developingcountries had serious problems to face. Oil import billsclimbed so rapidly that many of these countries had to resortto borrowing foreign exchange; at the same time, additionalborrowing was required for investments in exploration anddevelopment. As a result, a sizeable proportion of the debtproblem-ofthe developing countries was attributable to suchloans, which could hardly be avoided in the absence of adequate interest by the foreign oil companies to invest in thesecountries and with the general expectation of even higher oilprices in the future.
Overall, it may be expected that the number of oil companies will be further reduced by further consolidations, including the privatization of some state-owned petroleum enterprises in both developed and developing countries.
Similarly, a reduction may occur in the number of significant oil-exporting countries given the concentration of oilreserves in the Persian Gulf and increasing depletion of reserves in non-OPEC countries, including in particular,North American and the North Sea producers and a numberof oil-exporting developing countries (see table V.6).
In this connection, a recent study, after taking into accountthe totality of cumulative oil production, proved and inferred reserves and undiscovered resources, has projecteddeclines beginning during the period 1987-1990 in Brazil,Colombia, Peru, the United Kingdom and United States;during 1991-1995 in Argentina, Canada, Egypt and the So-
viet Union; and during 1996-2000 in Australia, BruneiDarussalam, India and Malaysia. 18
The oil companies' loss of control over the reserves ofseveral of the OPEC countries led to .new trading conditionsin the international market, especially after 1980 when fearsof oil shortages were replaced by the prevalence of substantial production over-capacity in the OPEC countries. Longterm agreements between the oil companies and oil-exporting countries lost favour and, even when they continued tobe made, their significance was minimized through theadoption of very flexible terms with regard to both quantityand price. At the same time, trade on spot markets or on thebasis ofprices established in those markets has been expanding rapidly.
In contrast to a pre-1970 oil market of relative stabilitybecause of the influence of the major integrated oil companies, the above-mentioned developments led to wide fluctuations in both oil supplies and prices and such instability canbe expected in the future in the absence of further structuralchanges.
However, a variety of such changes as shown have alreadyoccurred and others are in the process of being made. Forexample, a number of OPEC member countries have embarked on programmes for downstream integration into refining and marketing operations in the developed marketeconomies ofWestern Europe and the United States. Kuwaithas established such operations in Western Europe on itsown and Nigeria, the United Arab Emirates and Venezuelahave entered into joint ventures in industrial countries.Other OPEC countries, including Saudi Arabia, have beenreported to be planning similar moves. 19
Whether the consolidation of the oil companies of the developed market economies and similar developments in theOPEC member countries, particularly in the Persian Gulf,will result in a reconciliation of interests remains to be seen.A new kind of integration in the oil industry might have adifferent impact on the world oil market in the future, particularly when the current abundance of oil supplies may onceagain turn into a scarcity. 20
Medium-term outlook and conclusions
Since the dramatic drop in oil prices in 1986 and theirstabilization during 1987 at around $18 a barrel, a likelyscenario has developed, which may be summarized in expectations that (a) world demand for oil will continue to expand moderately at about 2 per cent annually; (b) if developing countries resume normal rates of output expansion, asomewhat higher growth rate of oil demand may occur; (c)despite new oil discoveries in a number of non-OPEC developing countries, the probability of large to giant discoveriesremains small; (d) a few OPEC member countries will find it
difficult to maintain their current export volumes (even withaccelerated exploration and development investments) because of their limited geological resources and an increase innational demand due to population and economic growth; (e)in the developed market economies, oil production will decline because of limited reserves and resources and the relatively high cost of developing frontier areas such as the Arctic and offshore; (f) in the centrally planned economies, highinvestment requirements will hinder the fast development ofresources (mostly in frontier areas of the Soviet Union and
17 "Gathering pace of energy privatisation in West Europe", Petroleum Economist, January 1987, p. 11.18 Joseph P. Riva, Jr., "Oil distribution and production potential", Oil and Gas Journal, 18 January 1988, p. 58.19 YoussefM. Ibrahim, "Going Downstream" , The Wall Street Journal, 25 June 1987, p. 1; and "Oil producers reaching for the pump", The
Economist, 19 September 1987, p. 78.20 See Alessandro Roncaglia, The International Oil Market: A Case ofTrilateral Oligopoly, (London, Macmillan, 1985).
90

China) that will be required to meet increases in nationaldemand; and (g) OPEC countries will continue their currentpolicies of increasing their share of world supplies withprospects for moderately higher prices in the medium term,but not high enough to encourage once again investments inenergy conservation and alternative sources of energy, particularly in the developed market economies, which constitute by far the most important oil markets.
This scenario is not without challengers. On the demandside, they expect more intensive energy conservation measures, including improvements in the efficiency of transportation fuels. On the supply side, they envisage substantialcost-cutting through technological improvements and perhaps breakthroughs in the development ofalternative energysources, as well as in the oil industry itself, which is alreadyexperiencing considerable cost reductions through suchtechnologies as three-dimensional seismic surveys, enhanced oil recovery techniques and horizontal drilling.Given these developments, they believe that future costs offrontier exploration and production are exaggerated, especially when the probabilities of discovering giant oil fieldsare considered. Under this scenario, requirements forOPEC oil will remain moderate, with possibilities for thecontinuation of the current level of oil prices for severalyears and an even lower level if cohesive policies amongOPEC member countries cannot be sustained.
91
The lack of timely and accurate information and statisticson a variety of important parameters in the petroleum industry and the world oil market may have resulted in seriousmiscalculations, not only with regard to commercial transactions but, more important, with regard to massive andcostly investments in both the energy and other sectors of theworld economy.
Changes in the structure of the petroleum industry havehad a considerable impact on energy prices and the necessityof analysing and monitoring developments is indicated forthe future, particularly with regard to increasing corporateconcentration and its possible impact on the international oilmarket.
A resumption of economic growth, especially in the developing countries, will be accompanied by increases in oilconsumption, which may best be met through additional investments in exploration and development of indigenous resources. Particularly in oil-importing developing countries,such investments will require expanded co-operation withmultilateral and bilateral sources of financial and technicalassistance, as well as new strategies for co-operation withtransnational oil corporations and among the developingcountries themselves.


Chapter VI
ECONOMIC REFORMS IN THE CENTRALLY PLANNED ECONOMIES AND CHINA
Since about the middle ofthe 1980s, virtually all centrallyplanned economies have announced their intention of changing economic policies, policy instruments and associated institutions. Some have already embarked on far-reachingmodifications. Others are in the process not only of formulating the purposes to be served by changes as yet incompletely defined but of designing the broad steps of the transition phase leading to a modified economic environment. Finally, some countries have not yet committed themselves tobroad-based transformations. But even in these countriessuch shifts are bound to take place in time, if only becausethe mechanisms for reaching and implementing economicdecisions in partner countries are being modified. This isalso likely to require adjustments in the mechanisms and policies of regional economic integration established for theCouncil for Mutual Economic Assistance (CMEA). Becauseof the importance ofCMEA relations, changes in the framework of CMEA will have repercussions on all members.
The principal features of the process of economic reformin the centrally planned economies are analysed in this chapter. The reforms in China and the Union of Soviet SocialistRepublics in particular are discussed in detail owing to thesize of these two countries, their role in the world economy,the far-ranging objectives of the ongoing reforms and thesubstantial degree of policy autonomy they enjoy. 1 The firstsection defines key concepts relating to economic reforms,models and mechanisms for the purposes of this chapter.Because the current cycle of broad-based economic restructuring is by no means without precedent, the second sectionsummarizes reform experiences, particularly in Eastern Europe, during the two decades prior to the mid-1980s. Thenext two sections deal with the principal features of the current reforms in China and the Soviet Union. The final sec-
tion describes the similarities and differences between thereforms in these two countries and discusses the potentialimpact on growth, economic organization and trade.
Because the societal organization of the centrally plannedeconomies and the prevailing precepts that guide socio-economic policies are deeply rooted in Marxist-Leninist ideology and principles, economic reform in these countries is acomplex social phenomenon that affects virtually all layersof society. Even its principal features are rarely confined toeconomics, if only because modifications sought in economic behaviour cannot but spill over into social attitudesand politics more generally.
Perhaps more important are the intricate interrelations ofthe social and economic policy dimensions of these countries, particularly in such areas as employment, the pricesystem and provisions concerning wages and incomes. Infact, in all these countries reforms have been prompted to agreater or lesser extent by social concerns, including theneed to accord a larger role to economic accounting as atechnical instrument for improving resource allocationseven when resource allocation has a direct impact on socialissues. A number of planned economies are therefore consciously attempting to separate the social and economicspheres to a much greater degree than in earlier reforms inthe hope of dealing sequentially with the myriad issues involved. Similarly, economic reforms have an important political dimension. They may even be sought as an inducement to political restructuring. Although the sociopoliticalramifications of economic reform are essential to an understanding of the dynamics of socialist society, this chapterdoes not specifically consider the sociopolitical aspects ofthe planned economy in evolution.
Key concepts of economic restructuring
Economic reform is essentially a process aimed at improving the way in which resources are mobilized and allocated with the goal of satisfying present and future, privateand social needs better than before. Its features may rangefrom the broad philosophy and objectives of developmentpolicies (i.e., the "strategy") to economic institutions andtechnical guidelines for economic behaviour (i.e., the "economic model"). The development strategy adopted by socialist policy makers at the outset of socialist constructionaims, among other objectives, at full employment, rapidgrowth, broad industrialization as the foundation for steadyeconomic development and substantial domestic policy au-
tonomy. A pronounced priority is accorded to selected industrial sectors as policy makers mobilize resources chieflyfor fast industrialization on a broad front. Macro-economicdecisions on accumulation and investment pay at best marginal attention to domestic or external static scarcities.
Though rapid industrialization can be sought through alternative policy instruments and institutions, socialist policymakers deliberately opted for a particular economic modelbased on economies of scale, use of modern technologiesand tight central control oflarge firms. This highly centralized model provides for central planning of nearly all eco-
1 The adjustments made in the early 1980s and the agenda ahead, particularly for Eastern Europe, were examined in earlier issues of the WorldEconomic Survey (see '~djustment, investment and structural change in centrally planned economies", World Economic Survey 1986 (UnitedNations publication, Sales No. E.86.II.C.1), pp. 121-134; and "Changes in economic mechanisms", World Economic Survey 1987 (UnitedNations publication, Sales No. E.87.II.C.1), pp. 127-129).
93

nomic decisions and strict regulation of the decision-makingrole of economic agents; nationalization of virtually all factors of production certainly capital and natural resourcesand in most cases land, but with some variations amongcountries; strong regulation of labour mobility; collectivization of agriculture in combination with state agricultural enterprises; a pronounced disregard of indirect co-ordinationinstruments and associated policies and institutions in favourof directive planning of resource allocation in physical detail; managerial autonomy strictly circumscribed by centralplanning and subordinated to the controls oflocal Party and,in most countries also, trade union interest groups; the channelling of most economic decisions through a complex administrative hierarchy, which tends to handle matters bureaucratically; and nearly complete insulation of domesticeconomic activity from foreign economic relations and influences.
Economic reforms include measures that modify one ormore aspects of the highly centralized model. Becausechanges must necessarily start from the policy instrumentsand institutions already in place, gradualism is required, notonly in formulating the reform laws and regulations and putting them in place, but also in changing the psychology of allactors in the economy. Thus, the transition from a situationcharacterized by pervasive quantitative planning to one relying on economic accounting through indirect co-ordinationinstruments requires adjustments in monetary and fiscal policies, in the financial sphere (including the role of the budgetand the banks) and in managerial behaviour. Perhaps moreimportant, these modifications depend on the maturation ofnew managerial styles and worker and consumer attitudes, aprocess that takes time. The speed and depth of the changesthat can realistically be anticipated depend largely on theinstitution of appropriate incentive structures,
The traditional economic model of the centrally plannedeconomy may be defined as the combination of institutions,behavioural rules and policy instruments that help to bringabout mainly planned industrialization on a broad scale.Though there have been nearly continuous modifications ofthis model since about the mid-1950s, mainly because thebottle-necks that had earlier inhibited growth had beencleared,2 three variations may suffice to set the stage for thediscussion of the ongoing changes in the economic mechanisms of selected centrally planned economies: the selectively decentralized model, which was the aim of severalcountries in the 1960s, though there were palpable differences among reform blueprints; the modified centralizedmodel that came about after the reform attempts of the 1960s
were reversed or temporarily stalled; and the decentralizedmodel currently envisaged in several countries.
The selectively decentralized model essentially aims at theadministrative and organizational streamlining of the traditional model. It calls for some transformation in the policyinstruments and some of the supporting institutions of thehighly centralized economic model. But the basic preceptsof the highly centralized model and the broad goals of development strategies are kept intact. The reform efforts of the1960s came to an abrupt halt, except in Hungary, in the1970s. Some of the reforms were derailed for sociopoliticalreasons. Others faltered because the hoped-for stimulus tofactor productivity growth did not materialize. To rectify thesituation, most countries reverted to greater centralism inthe allocation of resources, less enterprise autonomy,greater rigidity in decision-making instruments and other retreats from the reform intentions of the 1960s. This was followed by the third wave ofreforms, which concerned partialrecentralization of organization and management. The thirdmodel is, however, unstable in the sense that it is frequentlyaltered in both major and minor respects, chiefly as a resultof changes in the domestic and external economic environment.
Because in the end partial reforms can only bring partial,temporary results, comprehensive reforms will eventuallybe required to obtain steady growth primarily from factorproductivity gains rather than physical inputs. Since themid-1980s, the trend has been towards effective decentralization and co-ordination of decisions through indirect policy instruments and their supporting institutions under theguidance of macro-economic policies. To move well beyondthe simple devolution of administrative authority typical ofearlier reforms requires the support of a broad-based, fullydeveloped economic mechanism. A properly functioning economic mechanism not only encompasses macro-economicplanning but also seeks to allot a comparatively importantrole in resource allocation to monetary, financial, fiscal,trade, prices and incomes policies as a means of co-ordinating economic decisions and harmonizing them with the medium-term to long-term structural changes planned at central policy-making levels. This necessarily includes the creation of new institutions and policy ins'truments andactivation of existing components of the model. Moreover,an economic mechanism as a rule incorporates active macroeconomic policies. Although many such policies are incorporated in the traditional model, central planning in physicaldetail tends to neutralize them or render them superfluous.
Economic reforms in Eastern Europe to the mid-1980s
Since the late 1950s, as a central element of their overallstrategy to modernize and improve allocative efficiency, theEastern European planned economies have sought to modifytheir economic model. Until the mid-1980s, modificationsincluded decentralization of decision-making in favour offirms, enhancement of the autonomy of economic agents,
material incentives and value indicators as the key guidelines for resource allocation and more flexible macro-economic management. Such flexibility was apparent in themodification of sectoral output priorities and a shift in fiscaland monetary policy stances. Most of the measures wereintroduced in a cautious, incremental manner and without
2 Problems included an unstable regional or global economic environment, initial domestic strife over sociopolitical organization, inexperiencedmanagement, a labour force unaccustomed to the system of industrial production and burdensome rural over-population.
94

co-ordination among the economies concerned. Table Vr.lidentifies the most important phases of the measures in theEuropean planned economies.
Salient features of the reforms
Reforms are invariably directed towards some form of decentralization of production decision-making. By itself, thiscannot ensure efficient production. At the very least, a direct link needs to be forged between the economic results of
a firm and the material rewards to its managers and workers.Owing to the oligopolistic nature of the typical centrallyplanned economy, such guidance must initially proceed bysome means other than competition. Firms therefore need tobe transformed into separate accounting entities responsiblefor their own profit. Reform of the price mechanism, including pricing policies, and greater reliance on other instruments of indirect economic co-ordination are required toguide the decision-making of all economic agents. Efficientfinancial intermediation between savers and investors could
Table VI.l: Economic reforms in the European planned economies, 1957-1985
Year
1957
19591963
1964
1965
1966
1967
1968
1969
19721973-19751976
19781979
1983
1985
Country
Bulgaria and theSoviet UnionHungary
CzechoslovakiaGerman DemocraticRepublic
Hungary
PolandPoland
HungarySoviet Union
Poland
Bulgaria
Czechoslovakia
BulgariaGerman DemocraticRepublic and Romania
Hungary
Romania
PolandSoviet UnionHungary
RomaniaGerman DemocraticRepublicHungarySoviet Union
German DemocraticRepublicHungaryPolandHungary
Details of reform
Substitution of regional planning for planning byministries.Introduction of agricultural contracts and procurementprices.Introduction of enterprise associations.New system of economic planning and management, withgradual changes in planning, management, pricing policiesand wages tied to profit.Partial decentralization ofplanning and management,mainly in agriculture.Some decentralization in industry.Greater role for material incentives in rewarding labour andfor interest rates and profits in enterprise management.Abolition of the centralized supply system.Profit introduced as the main indicator of economicperformance of firms that have obtained greaterindependence. Liberalization of individual plot farming.Reform of material incentives and factory prices.Extension of enterprise self-financing. Bonuses in exportsectors based on net foreign exchange earnings.Decentralization of planning and management. Greater rolefor material incentives and financial instruments.Broad decentralization of planning and management.Strengthening of economic levers, especially prices.Comprehensive price reform.Greater flexibility in banking and credit.
Start of the New Economic Mechanism, with flexibleprices, further decentralization of management,strengthening of material incentives in agriculture, andbanking and credit reforms combined with strongerfinancial control.Extension of material incentives, some enterpriseindependence and decentralization of foreign trade.Reform around enterprise associations.Formation of enterprise associations.Recentralization in industry, restriction of enterprisedecision-making, stricter price regulation and a moreegalitarian wage policy.Reform of the economic and financial mechanism.
Industrial reorganization around Kombinate.Relaunching of managerial decentralization.Improved planning around a strengthened economicmechanism.Regulation on norms for economic agents, with stricterfinancial rules.Administrative controls curtail some enterprise autonomy.Increased role for indirect regulators in management.New forms of management of enterprises, includingforeign trade enterprises.
Source: Department ofInternational Economic and Social Affairs of the United NationsSecretariat.
95
be an essential element of reform of the production sector.Managerial and financial reforms have, in turn, major implications for the role of government in economic administration. As their involvement in micro-economic decisionswanes, central policy makers must regulate and guide decisions through macro-economic policies and institutionalsupports-relating to fiscal and monetary affairs, for example.
Decentralization of decision-making
During the first wave of economic reforms in Eastern Europe, chiefly during the 1960s, the administrative hierarchyof decision-making, especially in industry, was partly decentralized. The main aim was to dismantle the ministerialplanning hierarchy, which was viewed as over-centralized,prone to autarky, impeding intersectorallinks and inhibitingfactor productivity growth. The newly formed agencies between the planning centre and firms were expected to bemore flexible and efficient than central administration.These new bodies, however, merely reproduced and in somecases even aggravated the earlier problems of economic administration.
To counteract the new "localism" , the power of the ultimate producers was steadily eroded as central managementagencies, in some cases ministries, were gradually reinstated with even more authority than before. One importantconsequence was that there were frequent shifts of responsibility for specific firms among government agencies, whichput the firms in a peculiar situation. Although managers ofstate enterprises or associations were given greater responsibility for the implementation of the plan, the division of authority between them and government organizations remained ambiguous, which aggravated the situation. In addition, economic instruments were still only incidental to planformulation and implementation.
There have been various attempts to define the rights andobligations of state firms. In some cases, their role and placewere spelt out in specific legal provisions, on the basis ofwhich further decentralization measures were taken. InHungary, such measures even included the abolition of intermediate organs of the management hierarchy. Elsewhere,however, sectoral ministries were reinstated at the centre ofdecision-making at first as a result of curtailing the authority and rights ofthe intermediate organs and later by repealing managerial decentralization.
Several attempts were made to introduce performance incentives and to hold firms and associations accountable fortheir own decisions. In most countries, increased micro-economic autonomy was instituted but the potential for centralguidance and control remained. Yet the structure of the reform measures failed to provide for successful decentralization. For example, in the absence of proper economic signals, there is a fundamental conflict between setting outputplans and prices at the central level and delegating decisionmaking power and responsibilities to lower levels of the
planning hierarchy on the basis of indirect co-ordination instruments.
New performance indicators and planning
All reforms without exception seek to reduce the numberof mandatory performance criteria and to substitute net orvalue magnitudes for gross or physical success indicators.Material incentives are linked to plan indicators including insome cases indicators on revenue, profit, sales or net output.Profitability becomes in principle an important criterion forevaluating a firm's performance and supporting its financialautonomy. However, because firms do not have discretionover the quantities and prices of their material and factorinputs or, for that matter, over the disposition of their outputsand at what prices, considerable obstacles to effective selfaccounting remain. In some cases central authorities haveintervened, as they did in the late 1960s and early 1970s, byresorting to material balances or norms on material inputs,primarily at the sectoral level. 3
Pricing policies and price tiers
Proper pricing of labour and capital services and foreignexchange, for example is critical to enhancing the efficiencyof resource use, particularly under decentralized decisionmaking. Thus profit can be a fair indicator ofefficiency onlyif firms have some say over the prices they pay for theirinputs and charge for their products. Because relative pricesin the highly centralized model are as a rule heavily distorted, partly because of government preferences that are nolonger relevant and because price changes are enacted onlyat long intervals, price reform becomes a crucial componentof more general reform. But sociopolitical constraints onpolicy latitude permit only gradual price changes. Eventhese are influenced by ad hoc social and economic considerations. Furthermore, the price regime envisaged by thereform may fall far short of what is required to permit efficient enterprise decisions to be taken. Price policy is still setby the centre, which in addition directly declares a largenumber of prices. This applies more to consumer (retail)prices than to producer (wholesale) prices.
Traditionally, producer prices were set intermittently onthe basis of average cost in the sector plus a profit mark-up.Profitable enterprises could not utilize earnings for expansion purposes as they were taxed away and partly redistributed to loss-making enterprises. Changes in input and outputdecisions were reached by means other than prices and related instruments. Retail prices were determined on the basis of the corresponding wholesale prices plus a retail markup and a complex network of other fiat adjustments, usuallyin the form of positive or negative excise taxes, to try toensure equilibrium between supply and demand. Priceswere intended to clear markets, but they often failed to dothat, and so gave rise to endemic shortages in partial retailand wholesale markets and not infrequently also to macroeconomic imbalances. Agricultural procurement prices remained low relative to the corresponding retail prices and toprices of industrial inputs.
3 In several instances, norms on labour productivity, quality of output mix and fulfilment of delivery plans according to supply contracts wereintroduced in the late 1970s to replace gross output as the central plan performance indicator. But many other gross physical performanceindicators did not lose their significance in planning practice and gradually, in the 1980s, the scope of central planning was once again increased.
96

Domestic price autonomy could be preserved thanks to thebuffers against foreign competition-the State's monopolyof foreign trade and price equalization. The latter in particular ensured a nearly complete disjunction between the external sector and the domestic economy as transactions intraded goods were carried out domestically at prevailing fiatprices. Differences with actual trade prices converted at theofficial or commercial exchange rates were offset through aspecial budget account. As a result, prices and exchangerates remained incidental in allocative decisions. But theprice stability attained in this way conflicted with the ambition of policy makers to improve aggregate efficiency, a dilemma that came to the fore in every single reform effort.
Although there have been many variants of price reform,its main features are described below. All economies soughtto align, at least intermittently, producer prices with actualproduction costs and the real cost of imports, thus reducingstate subsidies. Similarly, agricultural procurement priceswere raised, also in relation to industrial prices, to encourage output and improve rural levels of living. Retail pricechanges, while frequent in some countries, were not sufficiently large to promote a better balance in retail markets.
In some countries (e.g., Hungary and Poland), changes inretail and wholesale trade prices were comparatively frequent. In others (e.g., Czechoslovakia and the GermanDemocratic Republic), price changes, including the filteringthrough of foreign trade prices, were enacted only at discrete intervals offive years or more. As a result, prices werenot rational instruments for efficient resource allocation.
In some planned economies, the pricing system encompassed both market-based and centrally administered mechanisms. The reforms were intended to improve the responsiveness of the price system to changing cost-price relationships in the world economy and to allow domestic marketforces to affect prices. But these mechanisms were neverreally adhered to. As a result, firms willy-nilly adapted thecomposition of both inputs and outputs at times against policy makers' intentions. Firms requested, and were granted,various formal and informal subsidies and exemptions.
Monetary and fiscal policies
In the highly centralized model, micro-economic management rarely concerns itself with financial decisions. The siphoning off ofprofits by the government prevents any significant accumulation of reserves. Furthermore, enterprisesholding temporary liquidity have virtually no access to interest-bearing financial assets. Firms have no flexibility to administer funds, either to finance investments or to augmentprofits through cash-flow management. Profit retention,greater managerial authority and autonomy, and greateravailability and diversity of financial instruments were allenvisaged in the reforms.
. The overall objective of monetary policy was to provide afinancial base conducive to plan fulfilment and monetaryequilibrium. Because money performed a passive function,the scope for monetary policy was limited. The mono-banking system provided the financial means to implement theplan but could not influence it. In place of direct or indirect
97
allocation of budgetary funds, the reforms sought to introduce financial incentives and penalties administered flexiblyby monetary authorities but the variants diverged widely. Alending policy with differentiated credit terms and maturities to facilitate self-financing and.make it more meaningfulwas the most important financial instrument experimentedwith.
Banks were granted authority to lend according to the economic soundness of the purpose for which credit wassought. In some cases, new banks were established to service the specialized needs of industry, construction, agriculture, foreign trade and the co-operative sector, for example.Differentiated interest rates, although still fixed centrally tosuit a variety of objectives, were actively used to promotethe more efficient distribution of credits. But their intendedimpact on allocation was neutralized by the lack of financialaccountability of borrowers and by the fact that the monobanking system was kept essentially intact. The banking system thus remained exceedingly vulnerable to the pressuresof government agencies for the financing of projects and thecontinuing expectation that banks automatically meet allcapital requirements.
On the fiscal front, the budget in the highly centralizedmodel performs three basic functions: control and co-ordination ofphysical economic processes through financial discipline, promotion of economic activities through fiscal incentives and penalties, and redistribution of national incomeamong different layers of society. The scope of public finance is substantial as the budget includes not only the receipts and expenditures of the central Government but alsoof provincial and local authorities, other non-productive organizations and, in many cases, the balances of gross profitof state enterprises. The importance of the budget is furtherenhanced by the fact that it is integrated with other financialplans, including cash and credit plans, and the personalwage fund.
Reforms generally sought to bolster the economic role ofthe budget by replacing directives with more modern fiscaland financial instruments. The new emphasis attached toself-financing and bank credits as sources of investment outlays by firms tended to reduce the portion of funds passingdirectly through the state budget. None the less, the systemof revenue collection remained complicated and poorlygeared to the needs of economic agents. In nearly all countries of the group, turnover taxes and profit transfers continued to be the principal sources of revenue.
Sectoral impacts of the reforms
The reforms introduced in Eastern Europe since the early1960s had different objectives and impacts. In most cases,changes were primarily intended to foster greater efficiencyin resource use in manufacturing, to shift investments in favour of technology geared to saving energy and raw materials and to promote scientific and technological progress.The latter in particular became a critical concern once theglobal price shifts in energy began to be funnelled intoCMEA pricing. Since the late 1970s, emphasis has beenplaced on domestic energy, raw material extraction and newtypes of entrepreneurship.

Agriculture passed through several changes. In Hungary,the sequence of economic reform measures started with arevamping of the rural economy. During the mid-1960s, investment constraints on state and co-operative farms wereeased, agricultural management systems were revised and amore coherent relationship between the state and co-operative sectors was established. As a result, farming becamemore intensive and labour productivity rose substantially.There were side effects, however, that held the growth of netproduction below that of the use of materials, particularly incrop production, basically because profitability did notcarry as much weight in measuring success as gross output.This was true also for the non-farming branches of the ruraleconomy, though their net production expanded somewhatfaster. The raising of income levels in agriculture, in somecases also in industry, proceeded along three lines: increasesin state procurement prices in combination with some reduction in the prices of industrial inputs, easing ofconstraints onpersonal household plots and some reduction of the directtax burden on collective farms. In almost all planned economies, plan indicators for agriculture were simplified, although here also temporary recentralization occurred tosafeguard overall allocation priorities, to maintain the priority of exports and to curb domestic consumption by imposing strict rationing.
Foreign trade is also an area where some decentralizationwas introduced. Foreign trade organizations (FTOs) underthe ministry of foreign trade were streamlined and moreflexible export and import licensing was instituted. Associations of firms, selected firms producing for export and evensome domestic trading enterprises were granted the right toengage directly in external trade. The overall tendency wasto entrust the trade ministry with the co-ordination of tradewith the overall economic plan, or with coming to grips withunforeseen developments. However, the pervasiveness ofbilateralism in foreign trade complicated effective decentralization ofdecision-making.
Foreign trade and specialization acquired a critical role inthe evolving structure, especially in manufacturing, of theplanned economies and in buttressing factor productivitygains. The disjunction between trade and the domestic economy was partially lifted. The modalities for CMEA co-operation were changed too. All centrally planned economiesentered into major co-operation agreements with marketeconomy firms in the hope of acquiring equity capital, advanced technology and access to new convertible currencyexport markets. With the exception of the German Democratic Republic, all countries promulgated a legal framework for the creation and operation of domestic joint ventures that permit the acquisition of foreign know-how andtechnology. But the results have so far been modest, largelybecause it is difficult to harmonize the interests of partlyforeign-owned economic agents with the central planningframework.
There was a significant reduction in payment restrictionswith other countries. The number of clearing arrangementswith developing market economy centrally planned economies countries shrank in favour of convertible currency settlements. Some of the countries joined the Bank for Interna-
98
tional Settlements, the World Bank, IMF and GATT. Therole and use of exchange rates became more prominent, although these economies still administer multiple exchangerates in at least the rouble and convertible currency areas.The attitude of these economies towards regulating tradewith the assistance of tariffs, among other instruments,changed as well. Some of them decided to activate or tointroduce two-column tariffs to be able to reciprocate in tariff negotiations.
Lessons from the Eastern European experience
Though reforms in comparatively small developed economies, such as those of Eastern Europe, are by their verynature different from the reforms pursued in large countriesthat enjoy substantial policy autonomy, several lessons canbe drawn from the former's experiences. Perhaps the mostcharacteristic was that none of the reform blueprints wasable to tackle the economy comprehensively, foresee manypractical complications and avert resistance to the reforms.These factors proved formidable barriers to the consistentadjustment of the economic mechanism to evolving circumstances. Particularly deleterious was the inability of policymakers to weaken the deeply entrenched interests in thepreservation of the status quo ante of important layers of theadministrative hierarchy. Those opposing reform found support in three widely shared sociopolitical concerns: the conflict between greater income differentiation and the preceptsof a socialist society, profit maximization, which could leadto unemployment and the reduction or elimination of pricesubsidies, which could fuel inflation.
Among the economic difficulties with partial reform,three stand out. First, the efficiency and output gains registered were well below expectations, in part owing to theabsence of economic signals. Secondly, factor productivity,which was perhaps the central goal of reform, lagged farbehind expectations. Finally, technological change was expected to alter economic structures in major ways and bolster productivity; it did neither, not even in countries thatincreased their imports of advanced technology. The failureof selective decentralization of the centralized model tobring about those shifts can be attributed in part to majorweaknesses of directive planning. Such weaknesses includeinsufficient flexibility; unwillingness or inability of centralauthorities to deny resources to entrenched ministerial interest groups; lack of adequate incentives to promote quality,innovation and efficiency; and a chronic inclination of economic units to overspend.
The growing pressures to keep reform on track in spite ofapparent resistance and initial set-backs in terms of belowplan performance tended to impart a cyclical element to thereform process. After the first phase of reform, unforeseenside effects or unexpected opposition slowed down, haltedor reversed the follow-up process at unpredictable intervals.A few years later, policy makers sought to resume the reform process by different means, with mixed results. Thecontradiction between the new economic regulators and thecustomary planning and management carried out by centralorgans was perhaps the most pronounced in setting norms,for example, on gross output, material inputs, the wage

fund, the distribution of net and gross profit, various measures of productivity, capacity utilization, exports, productinnovation, sales and the product mix in physical terms assubstitutes for directive plan assignments, which becamepervasive in the 1970s. Identifying all these elements was ahuge and intricate task. 4 Under the circumstances, it is notsurprising that many norms were set arbitrarily or were tooimprecise to guide firms and hence resulted in unbalancedand inconsistent plans.
Such economic indicators as enumerated above undoubtedly helped to modify the behaviour of firms. In practice,however, directives issued tacitly or overtly by industrialministries gained ascendency once again. Central agenciessuccessfully re-established the power they lost when reforms were introduced. One principal reason was that thecentre had not meaningfully changed the implicit successindicators for central agencies themselves. In such a situation, those agencies could not help but interfere in enterpriseactivities by formal and informal means. Requests for temporary exceptions and exemptions from the provisions of thereforms were common.
Until the mid-1980s, reforms in Eastern Europe were partial in both conception and results. This was perhaps mostpronounced in the entrepreneurial sphere: opportunities forthe macro-economic steering of economic activity throughindirect co-ordination instruments were limited as a result offrequent and rather pervasive administrative and political intervention. Central authorities exercising ownership andcontrol over state firms may intrinsically have conflictingobjectives of efficiency and stability. It is therefore criticalto lay down an unambiguous framework, including a framework for ownership and control, within which micro-economic units can seek to improve their performance and beheld accountable for it. Experience has shown that it is notthe consistency or ambitiousness of declared reform principles that determines their ultimate fate but rather the tenacitywith which they are defended during the promulgationphase. This is required particularly because these economieslack a coherent macro-economic framework for co-ordinating decisions, even those of the various planning tiers themselves.
Economic reforms in China since 1978
Until 1978, management of the Chinese economy was essentially highly centralized. Certainly, since the early 1950s,there had been vacillations in strictness in adherence to thevarious components of this model. Such vacillations reflected temporary shifts in strategies, allocative prioritiesand methods of implementation of economic programmes.In 1976, however, the change in the political leadershipplaced the revitalization of the economy and the establishment of a solid basis for long-term economic growth as urgent tasks on the policy agenda. The blueprint for growthwas the lO-year plan (1977-1986) formulated in 1977 fundamentally within the parameters of the traditional development model but with greatly expanded reliance on foreigntechnology.
After a year, the rapid growth attained under the plan,largely on the strength ofdomestic and foreign resource mobilization, had created serious domestic and external imbalances. At the end of 1978, a major change in developmentstrategy was announced and the plan was effectively discarded. Although the goal of rapid economic growth wasretained, this decision called for fundamental changes in themodel ofdevelopment. The next three years, however, wereto be devoted primarily to "readjustment" of the economicstructure so as to rectify existing imbalances and reshuffleresource allocation in a manner consistent with current development objectives. 5
Ambitious reform centred on the rural economy
Every major aspect of the traditional model was to bemodified. There was to be decentralization ofdecision-making to individual economic agents with greater reliance onefficiency indicators and on material incentives within theplanning framework. Though the thrust behind economicgrowth was to continue to be rapid capital formation, theimprovement of consumption was given the highest priority.The economy was to be more open to the international economic system through increased trade and capital flows,which would bolster modernization. The ramifications forthe economic model as a whole were expected to be considerable.
Unlike earlier reforms in the European planned economies, China embarked on system-wide reforms by first tackling on a broad front a number of fundamental economicissues regarding decision-making and organization in the rural sector, particularly agriculture. Concurrently, morepiecemeal changes in other sectors were also instituted. After the success of agricultural reforms, the decision to embark on extensive reform of the entire economic system waspromulgated in 1984. 6 Implementation has proceededslowly, however, as many economic consequences of reformhave proved to be socially and politically unacceptable.Where implementation had not progressed far, various compromise solutions had to be resorted to. This has resulted in
4 To illustrate from recent Soviet experience, which will be important in examining ongoing reforms, the number of norms on the use of materialsand fuels for metal products in industry increased from 120,000 in 1978 to 180,000 in 1980 and 200,000 in 1981 (see G. Pokarev, "Normativnaya baza planirovaniya: sostoyanie, problemy, zadachi", Planovoe khozyaistvo (Moscow), No.8 (1981), pp. 31-32).
5 This decision was promulgated at the Central Committee Plenum of December 1978. The basis for the implementation of the strategy was thereport on the work of the Government, presented at the second session of the fifth National People's Congress, in June 1979.
6 Decision of the Central Committee of the Communist Party of China on reform of the economic structure (adopted by the twelfth CentralCommittee of the Communist Party of China at its third plenary session, on 20 October 1984).
99

partial reform of major aspects of the system, includingmarkets, prices, labour remuneration and the monetary andfiscal systems.
Increased use of markets and price signals
In China, isolated markets with flexible prices existed inthe mid-1960s and, at times, flourished, notably in non-staple agricultural commodities, handicrafts and small self-employed businesses in urban and rural areas. These have beenrevived since 1979 as part of the process of decentralization.Markets have also been set up for industrial commoditieswhose allocation has been decontrolled. For broad segmentsof the economy, however, markets, if they exist at all, remain highly segmented, prices are not flexible and allocation is based primarily on administrative means.
As a result of the price reform, which does not seek todecontrol all prices, fewer commodities are subject to central price controls. Furthermore, even for prices that areregulated, the reform has led to price differentials for quality variations and has endeavoured to make the administration of state-determined prices more flexible and responsiveto demand and supply conditions.
A series ofprice reform measures taken between 1977 and1982 raised procurement prices paid by the central Government to farmers for the major agricultural commodities(grain, oilseeds and cotton). Prices ofcash crops were raisedrelative to staples to promote the desired output level, reduce reliance on compulsory procurement and reflect factorproduction costs. 7 Since 1982, a series of smaller pricechanges have been implemented. At the same time, a privatesystem of distribution known as "free markets" with fluctuating prices for quantities in excess of planned procurementshas been revived.
Price reform has been constrained by the priority accorded to maintaining overall price stability and, in particular, the purchasing power of the urban population. As aresult, either urban retail prices have not been raised or elseprice increases have been offset by income subsidies to urban workers. Both shifts have been financed from the centralbudget, which has created a conflict between price rationality, price stability and fiscal balance. In some cases, the reduction of compulsory purchases has resulted in government procurements falling short of planned goals becausefarmers tended to sell to free markets at prices higher thanthe procurement price or shift resources to more profitableagricultural and other activities.
At the outset of the reform, prices of manufactured goodshad been frozen for many years at a level that well exceeded
those of raw materials and energy and prevailing productioncosts. The rationale ofthis relationship involves history, ideology, fiat pricing and preferences of the Communist Partyfor the promotion of new industrial capacity during the1950s. Consumer prices were uniform for broadly similarproducts without taking into account quality or demand differences. Prices of goods subject to mandatory procurementand distribution by the State were fixed by central planningin collaboration with the industrial ministries concerned.Prices of other goods were set by the Ministry of Commercein consultation with central planning organs and the appropriate industrial ministries. With the ascendency of localself-sufficiency in production in the late 1960s, an additionalsystem ofpricingcontrolled by local governments for goodsproduced by locally funded, small-scale industries came intoexistence. 8
The intent of price reform in China was originally to supplement but not replace the existing system. The reform ofprices and distribution of industrial goods has so far beenpartial. It has freed a large number of commodities fromcentralized administration and control, but the result is atwo-tiered system of pricing and supply. The distributionand pricing of products subject to output quota under thecentral plan are centralized. Above-plan output, however, ispriced and distributed according to supply and demand andby individual economic units within a price range set by theState. 9 With persistent excess demand, the decontrolledprice has consistently exceeded the controlled one. Someundesired effects of the system are unofficial secondarytrading and incentives for investment in expansion of aboveplan output at the expense of planned output. 10 The trend inreform has been a steadily increasing share of "market"transactions in the total distribution of industrial goods. Atthe same time, pricing authorities have raised administeredprices of commodities for which the gap between fiat andmarket prices has been very large.
The insulation of domestic prices from trade prices wasanother characteristic of the price system. Given the overvaluation ofthe currency and the lack of a link between domestic and external prices, this system effectively favoured exports of agricultural goods, fuels and raw materials, and imports over exports of manufactured goods .. As discussedbelow, the reforms since 1978 have improved the link between domestic and international prices by increasing theautonomy of the trading corporations and some producers inthe direct handling of foreign currency and in price negotiations. More important, the national currency has been repeatedly devalued since 1983 to bring domestic ptices morein line with international prices.
7 The guideline for the initial price adjustment was to allow farmers to at least break even (see R. H. Myers, "Can Communist China's new pricesystem work?", Issues and Studies, October 1983, p. 35).
8 Prices were fixed at the ex-factory, wholesale and retail levels. They included average costs, profit margins and the so-called industrial andcommercial tax, which is essentially a turnover tax. Costs were based on the average for the whole sector with local variations; taxes and profitswere determined centrally but could be adjusted to maintain prices at each level of distribution (for details, see K. Furusawa, "Pricing China'sindustrial products: difficulties in the reform of China's pricing system", China Newsletter (Tokyo), No. 52, p. 3; and C. Wong, "Betweenplan and market: the role of the local sector in post-Mao China", Journal ofComparative Economics, No.3 (1987), pp. 385-398).
9 China Daily (Beijing), 13 April 1987, p. 4.10 W. Byrd, "The impact of the two-tier plan/market system in Chinese industry", Journal ofComparative Economics, No.3 (1987), pp.
295-308.
100

Towards wage differentiation and labour marketflexibility
Before reform of the urban employment system and decollectivization of agriculture, wages and labour allocationwere administratively determined by either the central Government or local authorities. Wages were set on the basis ofneed rather than productivity, with the result that only smalldifferentials between individuals existed. Because labourmobility was virtually absent, serious distortions in the allocation of labour resulted. In rural areas, cultivation of private plots and private sales were abolished even though thecollectivized sectors were unable to generate sufficient employment growth to improve productivity while absorbingthe growing labour force. Restrictions in rural-to-urban migration severely limited the reallocation of labour from agriculture to industry. Self-employment in urban areas was prohibited and all employment of new workers was centrallyassigned by the local branch of the state labour bureau. Employment tended to be viewed as an entitlement and dismissals and transfers were rare.
Since 1978, there has been more of a labour market inrural areas than urban areas, although migration is stillhighly restricted. Rural incomes are largely based on outputand many of the underemployed have either moved into nonagricultural employment or become visibly unemployed.Self-employment has been reinstituted and individuals arefree to seek employment in rural industries. The one area oflabour allocation that has remained totally centralized is theassignment of newly trained skilled manpower, primarilyuniversity graduates. They are allocated by the Ministry ofLabour and Personnel, in consultation with the Ministry ofEducation and the universities.
Labour reforms in urban areas initially focused on the decentralization of the system by which unskilled labour is allocated and the reinstitution of self-employment to improvejob opportunities for new entrants to the labour force. Therehas been some improvement in the efficiency of job placement through the use of locally established labour servicecompanies, which operate much like employment agencies.Bonuses have been reinstituted to foster productivity bylinking rewards to performance. In practice, however, bonuses are still awarded across-the-board owing to strong resistance on the part of workers to large pay differentials.Wage differentials due to skill and education have been increased since 1978 but are still very small. Piece rate wages,floating wages based on performance and wages linked toenterprise profits have been experimented with. It is plannedto extend them to the national level in 1988. In effect, alabour market in urban areas does not exist as most wagesare centrally determined and mobility is greatly restricted.
More recently, reforms have been proposed that seek toallocate labour through economic mechanisms and removeinstitutions that obstruct such allocation. One ofthe reformsaims at gradually eliminating the "life-time employment"system by placing newly employed workers on renewablecontracts of fixed duration, usually five years. These contracts are in principle negotiated between the two parties and
101
include job requirements and performance criteria. An unemployment insurance scheme has been instituted to compensate workers who are laid off. So far, this employmentsystem covers only a small proportion (4 per cent) of allworkers in the state sector. Its flexibility depends on exercis- .ing the option of contract termination. There is evidence thatsome managers find it difficult to terminate employees owing to pressures from workers and Party cadres. At the sametime, the most highly skilled workers are more likely not torenew their contracts because ofbetter employment options.As a result, managers are not always favourably disposedtoward this more flexible arrangement. The efficacy of thenew employment system in improving labour allocation remains to be seen. There has been some experimentation withmechanisms for the transfer of skilled and professionalworkers as another means to improve mobility but their implementation on a more extensive scale has yet to begin. Inthe short term, reforms in wages and the labour market focus on the wider application of contract employment and amore effective linkage between productivity and labour rewards.
Even if markets existed for all economic resources theremust be a structure of incentives to induce economic agentsto respond in the expected manner. The most glaring deficiency is in urban, state-owned factories, which account formost of the urban industrial output. Managerial reforms implemented since 1979 have attempted to create incentives byallowing firms to retain profits. But other disincentives toprofit-making have not been reduced substantially. Most notable are the lack of financial accountability of firms, thecontinued subjugation of the autonomy of managers to theParty and central Government and, on the whole, guaranteed employment and bonus and promotion systems, oftenirrespective of performance. In contrast, the self-employedand rural farm households have many fewer disincentives astheir operational autonomy is relatively greater.
Banking reform in a rudimentary monetary system
The long-term goal of financial reform is the developmentof a financial market with commercial lending and a diversified asset structure regulated by a strong central bankinginstitution through effective policy instruments. Reformssince 1978 have focused primarily on institutional changewith the creation ofa central bank and the delegation oflending functions to specialized banks each with its own networkoflocal agencies. Banks are specialized by sector oflending,such as agriculture and industry, and by type of lending,whether for long-term investment, circulating capital orother current expenditures. Though loan decisions can bemade by specialized and local banks, no effective indirectrestraints on lending in the form of financial accountabilityof the banks have been instituted. As a result, loan decisionsat the micro-economic level are primarily based on politicalrather than economic considerations.
Greater use has also been made of interest rates in reconciling credit demand and supply. Interest paid on savingsaccounts has been raised several times to bolster household

and enterprise savings. 11 Attempts have also been made touse interest rates to curb loan demand by firms. Owing to theabsence of financial accountability of economic agents andthe laxity of enforcement of loan repayments, these instruments have not achieved the results intended. In practice,direct rationing of credit and other controls remain the mosteffective measures available.
Continued reform of the financial system will focus on thedevelopment of a central banking institution, greater rationality in credit creation at the level of specialized banks andthe development of a financial market to facilitate the flowof financial resources.
Reduced role ofthe central budget in financing theeconomy
As the monetary system in the highly centralized model isundeveloped, the fiscal system is one of the main channelsthrough which the government influences the economy. Thisis still the case in China. The main outlays of the centralbudget are capital construction, enterprise expenditures (including expenditures on wages) and price subsidies to adjustthe level of real consumption. The primary sources of revenue before the reforms were profits from state-owned firms,the indirect industrial and commercial tax and the agricultural tax. Through this centralized fiscal system the Statehad direct control ofmost investments, much of total savingsand consumption. Prior to recent reforms, the mainstay oftax revenues was the industrial and commercial tax, whichwas incorporated into the price of products. The primarydirect tax was the agricultural tax, which was based onstandard yield per acre of land, with the rate, in principle,rising progressively with income yieldsY In practice, however, it became a proportional flat rate tax. Payments weremade in kind in grain-growing areas or in cash in cash-cropareas.
With reform of the fiscal system, part of the control offunds devolved upon local authorities, firms and, indirectly,individuals. There is more revenue-sharing with local governments; firms remit only part of their profits in the formof taxes and retain the rest, while individuals share in someof the retained profits through bonus payments. At the sametime, there has been a shift in responsibility for investmentexpenditures from the centre to firms and local authorities.The share of out-of-plan (and budget) investment in totalinvestment rose from 17 per cent in 1979 to 55 per cent in1986. The disbursement mechanism for centrally plannedinvestment was shifted to banks. Thus, a large proportion ofinvestment, savings and consumption is beyond the directcontrol of the central Government.
In fixed investments, for example, expenditures are controlled by an investment plan and a credit plan. In principle,the two plans are co-ordinated so that only planned projectsare funded. In practice, there appears to be a breakdown in
the planning process at the lower levels of government sothat unplanned projects get funded, leading to deficits in thebudget. Indirect policy instruments to control out-of-plan investments by economic agents and local governments arequite ineffective, owing to the existing structure of incentives.
The reforms have resulted in only partial changes in thesystem of taxation. The primary modification has been theprofit tax, which has become the major source of government revenue in lieu of profit remittance. The industrial andcommercial tax remains an important source of revenue, although it has been differentiated into four distinct components. In addition to a turnover tax, there are now also avalue-added tax, a differentiated product tax and severalother indirect taxes, such as charges on fixed assets and circulating capital of firms, instituted experimentally. Withgreater decentralization ofproduction and distribution in agriculture more use has been made of taxation of earnings inlieu of direct remittance of earnings or output. An individualincome tax exists but its incidence is negligible as only veryhigh personal incomes are affected.
Reforms in various production sectors
Reforms in the various aspects of the economic systemhave affected different sectors in varying degrees, depending on the organization and incentive structure targeted forchange. To date, reform in the agricultural sector has beenthe most far-reaching although reform is continuing in allsectors.
The paramount role of agriculture
The agricultural sector was designated in 1978 as the firstto undergo reform. Because its current output was nearly atsubsistence level, growth in the sector was seen as critical todevelopment of the overall economy. Reforms in the agricultural sector have been the most far-reaching. The focus ofagricultural policy since 1978 has been on reducing inefficiencies by relying on material incentives to raise agricultural output and by diversifying production away from theoverwhelming emphasis on grain and local self-sufficiencyin grain production. 13
The changes in agricultural policy announced in December 1978 were directed towards changing the structure ofoutput in favour of cash crops such as cotton, oilseeds andlivestock. The geographical distribution ofoutput was modified to seek productivity gains through regional specialization. These goals were pursued by decentralizing decisionmaking with regard to cropping and structure of outputthrough increased use ofprices as a means of indirect controlagainst the former direct control at the local level. Cropacreage targets at the local (commune) level were abolishedin 1980, although broad, centrally determined productiontargets were retained. For price changes to be effective, it
11 B. Naughton, "Finance and planning reforms in industry", China's Economy Looks Towards the Year 2000, vol. 1, The Four Modernizations,selected papers submitted to the Joint Economic Committee, Congress of the United States (Washington, D.C., 21 May 1986), pp. 616-617.
12 A. Eckstein, China's Economic Revolution (New York, Cambridge University Press, 1977), p. 185.13 N. Lardy, "Overview: agricultural reform and the rural economy", in China's Economy Looks 'Ibwards the Year 2000, vol. 1, The Four Mod
ernizations, selected papers submitted to the Joint Economic Committee, Congress of the United States, (Washington, D.C., 21 May 1986), p.327.
102

was felt that more direct linkages between effort and incomepayments to peasants were necessary. The so-called "agricultural production responsibility system" (nongye shengchan zeren zhi) replaced the collective system of productionin the early 1980s. Subsequent reforms have reinforced thissystem of household production while retaining collectiveownership.
Decentralization of pricing and distribution in the sectorhas been the biggest problem. Prior to 1979, centrally controlled distribution and pricing of major agricultural commodities were the primary means of ensuring an adequatedomestic food supply at a low price. Within the frameworkof planned national output levels, the procurement and pricing systems were used to implement these targets at the micro-economic level by setting obligatory procurement quotas for local areas and production units or by manipulatingprices and procurement quotas for three categories of productS. 14 All category one products (grain, cotton and edibleoilseeds) were subject to state procurement. Some categorytwo products (induding pork, eggs, silk, tea, tobacco, sugarcane and sugar beets) were subject to procurement. Category three products were minor commodities and nativeproducts not subject to procurement. To meet procurementtargets handed down from the central to the provincial andthen to the local governments, physical procurement quotasby product were set by the local authorities for each production unit.
Although prices for all procured commodities within thequota amount were centrally set, category one commoditieswere subject to a three-tier pricing system. For output up tothe compulsory quota, there were two prices-the "quota"price and the "above-quota" price. In principle, quantitiessubject to the quota prices were fixed for three or five years,while those subject to above-quota price were adjusted annually according to anticipated changes in output. The proportion of output increments that could be sold at above-quotaprices was usually 40 per cent. Quantities in excess of theobligatory quota sales were purchased at "negotiated"prices, which were usually above the other two prices.
Initial changes in agricultural policy emphasized price incentives to promote output growth. The virtual monopoly ofthe State in the distribution of major agricultural commodities remained basically intact, with the exception of the promotion of free markets where prices move in accordancewith demand and supply. As grain procurements purchasedat the lowest quota prices were reduced in 1979-1980 andproduction rose rapidly between 1982 and 1984, the share ofprocurement at above-quota and negotiated prices expandedmarkedly, resulting in steady increases in the overall procurement price of grain. None the less, the proportion offree market sales remained very 10w-4 per cent in 1984.
Since the mid-1980s, policy makers have sought to simplify centralized pricing, reduce the share of state procure-
ment and increase market sales of cotton or grain. IS This isconsistent with the overall trend toward decentralization andrepresents a means of preventing continuing increases inprocurement prices and the resultant fiscal burden. The timing of changes for cotton and grain was probably also influenced by several years ofhigh production and, in the case ofcotton, substantial excess supply.
The decentralization of decisions on cropping, price increases and the revival of private markets contributed to theunprecedented growth of output and yield of all the majorcrops in the early 1980s. However, the outcome did not coincide with planned physical goals. Using prices as an outputincentive also conflicts with maintaining stable retail pricesin urban areas unless the gap is closed through subsidies.The return to farmers from staples remains significantly below that of other commodities and, in consequence, thegrowth in output has lagged behind that of demand, contributing to rising grain prices in the free market. As a result, thecentral Government has had to resort to other incentivessuch as subsidies on input prices and prepayment for purchases. The decontrolling of prices of non-staples, such asvegetables and pork, has led to exorbitant price increasesand a subsequent retreat to rationing and price control, suggesting that much remains to be done to streamline agricultural pricing.
The changes in the incentive system since 1979 werepartly a function of decollectivization. The break with thecollective organization ofproduction was complete by 1984,though social ownership of land and some capital was retained. The "agricultural production responsibility system"made the household the unit of production and based renumeration on output realized rather than on labour inputs.Although reforms were initiated in 1979, the pace was ratherslow until 1981. By late 1981, less than 40 per cent of ruralhouseholds were producing under the most rewarding formof the responsibility system-"household output delivery"(baogan daohu). By the end of 1983, however, 95 per cent ofall peasant households were under this system.
The "household output delivery" system was based on anegotiated contract between the collective unit that had jurisdiction over the land and the peasant household. The contract stipulated the length of tenure, the area of land to beworked, the means ofproduction to be made available to thehousehold and the types and quantities of output to be delivered to the State and the collective. Excess output belongedto the household and could be sold or retained as desired.The contract also specified obligatory contributions to thecollective for investment, maintenance of irrigation and water-management systems and the welfare fund. Tenure of theassigned area of land was initially for a season or a year; itwas extended in 1984 to 15 years for most types of land.Since 1984, the transfer of land tenure among households,subject to the approval of the collective, has been permitted.
14 K. Walker, Food Grain Procurement and Consumption in Chinn (New York, Cambridge University Press, 1984); and R. Hsu, "Grain procurement and distribution in China's rural areas", Asian Survey, vol. XXIV, No. 12 (1984), pp. 1229-1246.
15 Economic Daily (Beijing), 30 January 1985, p. 1; and Daiiy Report: Chinn (Foreign Broadcast Information Service, 5 August 1986), pp.KI2-KI4.
103

A further stage of reform could be to increase the size ofleased plots by allowing subleasing. This has been experimented with in local areas. 16
Central control at the local level was greatly reduced bythe elimination ofthe economic function ofrural communes.The commune system as it had existed since 1958 was dismantled in 1983 and its economic functions reorganized under co-operatives. The major economic co-operative unit replaces the team, brigade and commune of the old communesystem and is responsible only for economic functions, suchas ownership of land and means of production, negotiatingcontracts with households and capital accumulation. The political and administrative functions were reorganized underlocal units of government renamed "township" and "village" corresponding to the "commune" and "brigade" ofthe old system. I7 Thus, decisions with regard to output, inputs, technology, marketing and investment have becomemuch less subject to the direct control of the Government.
Rapid expansion of rural industries
An integral part of agricultural reform has been the promotion of rural industries using collective and individual resources. This was felt to be crucial particularly to facilitatingthe transfer of labour from agriculture to other sectors,which made it easier to raise agricultural productivity. Further, rural industrialization was expected to reduce the inequality of income distribution between urban and rural areas. 18
Initial measures announced in 1978 emphasized the development of commune and brigade enterprises for processingagricultural products. Urban firms were encouraged to subcontract simple manufacturing processes to those enterprises, which were to be financed primarily by communesand brigades and through certain tax concessions and easieraccess to credit. Some state assistance was provided topoorer brigades. By 1980, there was a move towards consolidation and reform of commune and brigade enterprises.Their number declined as the small and inefficient amongthem were closed down or merged. The relative share ofindustrial firms shrank (but less so for light industry, in particular food processing, textiles and consumer goods), whilethat of construction and service firms rose. Measures werealso taken to improve productivity of the enterprises byadopting a responsibility system in wage determination inlieu of the previous egalitarian system of distribution. Thesemeasures were reconfirmed along with the announcement of
further rural reforms in 1984, thereby continuing the consolidation and readjustment of the enterprises.
The new policies announced in 1984 essentially extendedprevious measures to promote rural industrialization by further relaxing controls. They allowed more diverse forms ofownership and eased previous geographical restrictions onthe flow oflabour, capital and trade between rural and urbanareas. Private (household) firms in industry and serviceswere encouraged. Private ownership of small transportequipment, such as small motor boats, tractors and trucks,was allowed to stimulate the development of rural transportservices. Joint private ownership was also encouraged toraise efficiency of production. The development of production units was to be directed towards joint ownership (between collectives across geographical boundaries, collectives and households and collectives and government) totake advantage of available physical and human resources.Migration by rural residents was officially permitted, butonly to the smallest urban areas (towns) to establish smallfirms. Trade with urban areas in agricultural and light manufactured goods produced by households was also liberalized. The concentration of rural industries in towns was encouraged to make more efficient use of scarce infrastructure. Since 1984, large increases of capital for thedevelopment of rural industries have been financed throughindirect government capital in the form of bank loans anduse of the resources oflocal savings co-operatives.
One of the major consequences of rural reform has been aremarkable growth in rural net income per capita-16 percent annually between 1978 and 1985. This stemmed fromthe rapid rise in agricultural income (at 12 per cent) and fromthe even faster gain in non-agricultural income (at 32 percent), thanks to the development of rural industries. 19 Butgrowth has been uneven, leading to increased income inequality within the rural population. 20 Although this runscounter to socialist principles of income distribution, it isviewed as a transitory price to be paid for the substantialimprovement of rural incomes as a whole in the long run.
The rural non-agricultural sector has been absorbing themajority-over 60 per cent-of the total increase in the rurallabour force. But underemployment in rural areas is still serious and continued restrictions on migration pose a barrierto the reallocation oflabour to employment with higher productivity, even within agriculture itself. The limitation ofrelying solely on rural industries to absorb rural labour isfurther illustrated by the recent consolidation of these industries with a view to bolstering productivity. 21
16 Sing Tao Jih Pao (Hong Kong), 30 November 1987, p. 16.17 F. W. Crook, "The reform of the commune system and the rise of the township-collective-household system", China sEconomy Looks Towards
the Year 2000, vol. 1, The Four Modernizations, selected papers submitted to the Joint Economic Committee, Congress of the United States,(Washington, D.C., 21 May 1986), pp. 354-375.
18 H. Oshima, "The transition from an agricultural to an industrial economy in East Asia", Economic Development and Cultural Change, No.4(1986), pp. 783-810.
19 A recent survey of 30,000 rural households shows that, in 1984, households with per capita net income of below ¥RMB 200-500 received 90per cent of their net income from agriculture, in contrast with 74 per cent for households with incomes of ¥RMB 200-500 and 44 per cent forhouseholds with incomes of over ¥RMB 1,000 (see Renmin Ribao (Beijing), 11 April 1986, p. 5).
20 While rural per capita income grew by a total of 66 per cent between 1978 and 1984 at the national level, per capita income in one of the poorestprovinces in the north-west (Gansu) grew by only 25 per cent; in an affluent eastern province (Jiangsu) and in the Beijing municipality, it grewby 95 per cent and 195 per cent, respectively.
21 China Daily (Beijing), 12 January 1988, p. 3.
104

Gradual extension of reform to urban industry
The decision-making autonomy of state-owned enterprises continues to be limited, despite some attempted decentralization since 1980. Because these enterprises accountfor the bulk of industrial output, the entire system of industrial production remains centrally controlled. This involvesa two-track system ofcontrol, one by the Party in the form ofParty cadres in the firm hierarchy and the other by the central Government in the form of supervision by a lower unitof central ministries over the firm's budgets, expendituresand personnel.
The earlier reforms focused on creating material incentives to improve productivity from retained profits, withsome decentralization of decision-making in pricing andmarketing. 22 This could be sought either through bonus payments to induce workers to be more productive or throughreinvestment to improve capital efficiency. This systemevolved into one of profit taxation, which began on an experimental basis in the early 1980s. It was intended to improve efficiency incentives for the more profitable firmsthrough differentiated taxation. Because it is very difficultto ascertain efficiency based on value magnitudes derivedfrom seriously distorted prices, this system has yet to befully implemented.
The outcome of these reforms in terms of gains in totalproductivity has not been as positive as desired. The root ofthe problem has been the lack of a comprehensive approachto a rational economic system or structure of incentives. Besides the distortion of prices of goods and services, the priceof capital to producers remains artificially low. As a result,the demand for capital investment consistently exceeds thatdesired by planners. The general lack of autonomy and offinancial accountability of economic agents inhibits theproper response of managers to the material incentives instituted and makes them more vulnerable to non-economicpressures by political leaders and workers. 23
The most recent reforms in industry have been directedtowards the problems of micro-economic management. Thereforms were first implemented experimentally and then incorporated into new legislation, which has not yet been ratified because of resistance from government officials, partycadres and workers, for example. The legislation created alegal framework for state-owned firms to go into bankruptcyand be responsible for any debt. Provisions were made tohold management accountable for failure and for the redeployment of workers of the bankrupt firm. The legislationalso conferred autonomy in operational decisions on managers and freed them from administrative and political intervention, including intervention in labour matters. These decisions covered personnel and production areas but managers continued to be subjected to largely centrallydetermined prices, wages and output and employment quotas.
The problems that have stymied the finalization of legislation on bankruptcy have not been overcome to date but someresolution is expected in 1988. Progress has been made sincethe thirteenth Party Congress (25 October to 1 November1987) in the formulation of a draft law on the separation ofownership and management of state-owned firms. 24 Amongother provisions, the function of the Party in micro-economic entities is curtailed and the rights of ownership andmanagement are more clearly defined.
Increased managerial autonomy takes the form of the contract system ofmanagement. This is implemented in variousways and to different degrees at the micro-economic level. 25
The general principle is that firms enter into a contract withthe government agencies administering them to decide onthe proportion of profits to be remitted. Ifprofits exceed theamount contracted, firms can retain a larger proportion. Ifprofits are insufficient to meet the amount contracted, theyare expected to make up the deficit. The implication is thatmanagers will have greater autonomy in decision-makingwith regard to production, but details have not yet been released. Small firms have been using a leasing system that,for a fee, grants an individual the authority to manage and befinancially responsible for a specified period of time. Thepotential for retaining any profit is expected to be an incentive for more efficient management.
Activation offoreign trade and exchange policy
The decentralization of the foreign trade system necessitated greater integration of domestic and foreign marketswith an effective price system to guide decisions. But decentralization was first implemented with an essentially unreformed price system. Even subsequent attempts at price reform have been tentative and piecemeal. The objective wasprimarily to improve the capability of the system to handle agreatly expanding volume and diversity of trade. Such expansion was anticipated in view of the country's ambitiousmodernization, growth objectives and changing economicstructure.
The initial reforms ended the trading monopoly of ninenational FTOs, the centralization of foreign exchange holdings and centralized control of commodities traded. With thereforms, industrial ministries were allowed to establish theirown FTOs to handle trade transactions directly. Provincialbranches of the original national FTOs were increasinglyfreed from the operational supervision of the central corporations. Some coastal provinces and principalities were authorized to set up their own FTOs. This devolution greatlywidened the segments of the Chinese economy coming intodirect contact with international markets. Its effect was significant but small: by the end of 1984, prior to the mostrecent reforms, over 80 per cent of total exports and almost70 per cent of imports were still handled by the nationalFTOs.
22 World Bank, China: Recent Economic Trends and Policy Developments (Washington, D.C., 31 March 1983), pp. 56-58.23 Examples of this were the preferential hiring of the children of workers and the indiscriminate payment of bonuses across the board.24 China Daily (Beijing), 12 January 1988, p. 1; and Renmin Ribao (Beijing), 12 January 1987, p. 2.25 China Daily (Beijing), 30 December 1987, p. 4.
105

Besides decentralization of foreign trade activities, newincentives to export and increase the efficiency of foreigntrade were implemented. FTOs became independent accounting units with an obligation to record profit and lossand the right to retain a proportion (up to 30 per cent) of theirforeign exchange earnings to finance imports through thelocal branch of the Bank of China. Control of foreign exchange also devolved upon FTOs at the provincial level. 26
An internal rate of settlement for the conversion to yuanrenminbi of foreign exchange export earnings was established in 1981 to provide an incentive for exporters of manufactures,27 pending more fundamental price reform. Thismeasure was effective in increasing the number of FTOs thatbecame profitable and boosted exports, but at a substantialcost to ministries and the central Government. But manyFTOs remained unprofitable, and so were supported by theministry or provincial government that had jurisdiction overthem.
Although these initial reforms promoted trade, they alsocreated unanticipated problems. Most publicized were thesurge of imports without a commensurate rise in exports in1980 and price competition among exporters, referred to asthe sale ofparallel goods. The first problem was the result ofthe internal price structure of China, aggravated by growingdemand for over-valued currency and the newly institutedprofit incentive of the decentralized FTOs. The second wasthe result of the larger number of exporters. Whereas exportprices were centrally determined and trading monopolizedby national FTOs before the reform, exporters of manycommodities could set their own prices after the reform.Price competition was, in part, an expected response to theover-valued yuan renminbi and probably had the effect ofboosting foreign exchange revenues from price-elastic exports. The prices of some commodities were reduced farbelow the state export price and threatened to compress foreign exchange revenues. But competition also resulted because of clamouring for very scarce rationed foreign exchange. The Government's response to the undesired resultsof the reforms was to recentralize somewhat by restrictingimports and co-ordinating export prices through the reintroduction of import and export licences in 1980. But the general thrust of promoting trade through a more decentralizedsystem was retained.
The reform announced in 1984 was regarded as the secondphase of the reform of the foreign trade system begun in1979. It represented an attempt at the total separation of government administration and micro-economic management inforeign trade activities. 28 The initial reforms had sought toentrust the management of foreign trade to provincial andmunicipal governments. The second phase shifted the management of foreign trade to firms and attempted to exposedomestic prices to the world price structure. The number ofindependent corporations was increased several fold. At the
same time, the reform adopted an agency system to mediatebetween FTOs and the firms they service. Under this system, FTOs provide handling services for a fee to the exporters of industrial and mineral products and to all importers who are ultimately responsible for the profitabilityof trade transactions. Firms are allowed to retain a largershare of foreign exchange earnings (30 to 70 per cent). Theinternal settlements rate was abolished in January 1985 asthe official exchange rate of the yuan renminbi had depreciated to the internal rate. The official rate continued to depreciate in 1985 and was further devalued by over 15 per cent inJuly 1986.
With decentralization, macro-economic planning of exports and imports was to be reduced. The Ministry of Foreign Economic Relations and Trade, which incorporates theformer Ministry of Foreign Trade, no longer drew up orimposed procurement and allocation plans for exports.Mandatory export plans were to be limited to a few commodities deemed to be "critical to national livelihood".They included oil, coal, agricultural commodities, handicrafts, textiles and garments, which together constitute overhalf the total export value. Central planning of imports wasto be limited to whole plants, bilateral trade agreements andkey commodities purchased from centralized foreign exchange earnings, including steel, grain, chemical fertilizers,rubber, tobacco and synthetic fibres. The latter account forabout 40 per cent of imports. As part of the guidance plan,targets of gross export volume would continue to be issuedfor the roughly 100 commodities first selected in 1980. Imports were regulated through quotas by broad commoditycategories and inputs essential to central investment projects. The volume and composition of imports were to becontrolled through the allocation offoreign exchange.
With the shifting of financial accountability to the microeconomic sphere since 1984, the trading network was further widened. However, existing problems, such as the export of parallel goods, persisted while new ones emerged.The initial depreciation of the currency also proved to beinsufficient to sustain the profitability of exports. Exportgrowth decelerated and actually became negative during thefirst half of 1985. The disincentive effect of the existing discrepancy between domestic and world pric~s of manufactured goods was accentuated by the newly instituted profitincentive for FTOs, as they became less inclined to exportthan import manufactured goods in order to raise profits.Decentralization had little immediate impact on the dispersion or growth of exports as the top 10 FTOs in 1985 continued to handle approximately 80 per cent of total exports.
With the decontrol of some domestic prices in 1985 andthe rapid growth of investment, domestic prices of somemanufactured goods rose further, thus widening the gap between domestic and world prices. Combined with decentralized control over imports, this led to soaring import growth
26 Despite this, the allocation offoreign exchange before the 1984 reforms remained centralized at the provincial level, that is, under the control ofprovincial governments and ministries rather than FTOs.
27 The official exchange rate was YRMB 1.705 to the dollar in 1981 and the internal settlement rate was ¥RMB 2.8.28 Renmin Ribao (Beijing), 20 September 1984, p. I.
106

of 58 per cent for the year. The impact of decentralization onthe dispersion and growth of imports was dramatic. 29
In response, various recentralization measures were takento stem import growth. Some local governments reverted tosubsidization of exporters by paying a premium for theirforeign exchange earnings in yuan renminbi in 1985/°which was subsequently sanctioned by the central Government. In addition, exporters were also permitted to importcommodities that yielded very large profit margins to compensate for their losses. Import licensing was extended earlyin 1985 to slow the growth of imports and outright bans ofcertain consumer durables and automotive equipment wereimposed. Measures were also taken to control access to foreign exchange by ordering firms to repatriate all their foreign exchange holdings to the Bank of China and by requiring prior approval to gain access to holdings.3
! Export licences to control parallel goods were issued for a largernumber of commodities. At the same time, price adjustments were induced by currency depreciation, of 15 to 16per cent annually in 1985 and 1986.
Thus, implementation of trade reforms has been slow andhas involved a sequence ofdecentralization and recentralization measures. None the less, the system has become muchmore decentralized than it was in 1984. But the second phaseof reforms has encountered considerable resistance from theorganizations that would have had their influence reduced.There has also been resistance from firms that fear the consequences of competition and full financial accountability.Domestic prices remain highly insulated from world pricesas a result of a trade pricing system that has essentiallychanged little.32
With decentralization of foreign trade, the exchange ratepolicy was modified and exchange controls were relaxed.The exchange rate was based on a basket of major convertible currencies from 1973 until 1986 with infrequent adjustments. Since then the objective has been to reset the ratemore frequently to take account of balance-of-payments developments, the cost of earning foreign exchange and exchange rates ofChina's major trading partners. 33 In practice,however, adjustments are made infrequently. Major movements of the yuan renminbi, determined by the State Administration of Exchange Control (SAEC), have to be approvedby the State Council. As mentioned above, a two-tier exchange rate system was in existence briefly from 1981 and1984. The use of an internal settlements rate substantiallybelow the official one was an attempt to correct the balanceof-payments deficit without an outright devaluation. Fromthe end of 1983 until 1986, the exchange rate in terms of theSDR was adjusted downwards by an average of 26 per cent
annually in response to imbalances in external accounts.Since then, substantial balance-of-payments improvementshave obviated large exchange rate movements; the yuan renminbi has in fact remained fairly constant in terms of theUnited States dollar but has depreciated against other majorcurrencies.
Prior to reform, exchange controls were strict and thoroughly enforced, as foreign exchange entered through twoprimary channels: bank transfers to national FTOs and remittances to residents. All access to possession and trade offoreign exchange was centralized in the State through thecentral banking system. With the decentralization of tradeand foreign exchange holdings and the growth of tourism,the managed, over-valued exchange rate was undermined bysecondary trading. As a result, since 1980, new regulationson foreign exchange possession, access and trading havebeen issued periodically in an attempt to maintain the official rate. Decentralization progressed until 1985, when recentralization measures were taken in response to a sharpdeterioration in the balance of payments. Some further devolution is planned for 1988.
There were several major reforms in exchange control.The central handling of foreign exchange was delegatedfrom the central bank to the Bank of China, which is a specialized bank. Trust and investment corporations were created and authorized to engage in foreign exchange trading inthe context of foreign investment in China and transactionsin the special economic zones. Much less restrictive exchange regulations were instituted for special economiczones and certain designated coastal cities. Firms involvedin trade and subnational FTOs were allowed to retain a certain portion of their foreign exchange earnings for their owndisposal but authority for access to these holdings was vestedin SAEC. A limited, experimental system for foreign exchange trading was established in selected regions but withinthe Bank of China's purview. Participation was limited tothe firms mentioned above and prices were determined bysupply and demand. This created a two-tier price system,similar to that applied in the distribution of industrial goods.However, in this case, the system was not supported by theGovernment and the differential between the two prices increased. Individuals are allowed to hold foreign exchangebut not to trade in it. For a while, foreign exchange couponswere issued to foreign tourists, in lieu of the domestic currency, at the official exchange rate. This attempt at restricting unsanctioned foreign exchange markets in tourist areaswas unsuccessful, as secondary trading in these couponsflourished.
29 In 1985, the share of total import value handled by the top 10 importers (9 of which were national FTOs) fell to 50 per cent from almost 70 percent before the 1984 reform. The value of imports ($21.0 billion) handled by the smaller importers in 1985 was greater than the increase in totalimports from 1984 to 1985 (about $15.6 billion).
30 Some localities were paying up to ¥RMB 4.0to the dollar compared with the then official exchange rate of¥RMB 2.95 to the dollar (T. Chan,Reform in China's Foreign Trade System, Paper No. 22 (Hong Kong, Centre of Asian Studies, University of Hong Kong, 1986).
31 This resulted in the control of an additional $3.5 billion or more by the Government (T. Chan, op. cit.).32 Exports are still largely procured at domestic prices. Imports outside of the mandatory plan are priced at the import price plus the cost of trans
action charged by the FTO. If this price is lower than the domestic price, the domestic price is charged.33 IMF, Exchange Arrangements and Exchange Restrictions: Annual Report 1987 (Washington, D. C., 1987), p. 154. Adjustments are probably
against a basket of currencies but with weights that are much more malleable than in the past.
107

Foreign exchange allocations and transactions remaincentralized and are generally not guided by adequate pricingor co-ordinated macro-economic policies. Rather, the foreign exchange plan in principle regulates all transactions in~
eluding those in bilateral trade and involving locally retainedforeign exchange. 34 The central bank is responsible for foreign exchange reserves and external borrowing; it recommends broad planning guidelines. The various componentsof the plan, including foreign trade and loans, governmentalforeign exchange needs and remittances, are drawn up bythe ministries concerned. The overall plan is co-ordinatedand balanced by the State Planning Commission and submitted to the State Council for approva1. SAEC supervises implementation of the plan by localities and ministries. In practice, there are breakdowns in the controls over implementation. This was manifested, for example, in the unplannedprecipitous decline in China's exchange reserves in 1985.Further reform considered for 1988 focuses on the re-institution of a limited foreign exchange trading system as a firststep toward increased market orientation of foreign exchange allocation.
Increased utilization of international loans and decentralization of borrowing have resulted from policy changes andreforms implemented since 1978. Previously, internationalborrowing was limited in accordance with the policy of selfreliance. Reforms included opening access to commercialfinancial markets and increasing the number of ministriesand other institutions, including investment and trust corporations and certain local authorities, authorized to borrow.Control of the implementation of the plan for internationalborrowing, which is part of the foreign exchange plan, bylower level units is exercised through the issuance of loanguarantees usually demanded by foreign banks. Demand forforeign loans by local authorities and enterprises invariablyexceed the planned amount, owing to the over-valued official exchange rate and lack of financial accountability ofthese units. When many foreign banks no longer demandedguarantees in 1985-1986, control broke down. As a result,there was greatly increased central borrowing to cover asoaring trade deficit, resulting in a rise in the ratio of debt toexport earnings from 45 per cent in 1984 to 75 per cent in1986. This raised the relative debt-to-national income level,which until then had hovered at most around 2 to 3 per cent.
Will reform continue?
Before the thirteenth Party Congress (October/November1987), prospects for continued rapid reform were uncertain.This was not altogether new. Even the earliest reform of theagricultural sector, although implemented with great success, had not been without resistance, especially with respect to the institution of the "agricultural production responsibility system". Though overall implementation of thesystem was gradual, it met with resistance from local and
national Party officials, whose authority was being undermined and who did not agree with the decentralization ofdecision-making and the essential dismantling of the entirecollective system of production. This resistance, however,was overcome by first applying the system in poorer regionsand justifYing it as a means of letting the poorer peasantsimprove their incomes. The much heralded rise in agricultural productivity and incomes provided the momentum topush forward subsequent reforms in agriculture, the ruraleconomy and the urban sector.
Concurrent with these attempts at more complex restructuring, some of the unanticipated negative consequences ofearlier changes emerged. This resulted in greater oppositionto the reforms. Even the success of agricultural reforms began to falter in 1985 as grain output fell below target, resulting in a call for a return to the traditional centralized mode1.The over-expansion of the economy, soaring prices andwages and a surge in the external deficit in 1985 furtherstalled the momentum of reform and favoured stabilizationthrough recentralization.
Upheavals at the end of 1986 over reform of the politicalsystem and significant upward price pressure on prices convinced some of the leaders that there should be stricter adherence to the traditional economic mode1. Consequently,reforms slowed significantly in 1987, particularly in themore controversial areas of pricing, managerial autonomyand accountability. With renewed overheating of the economy in 1987 the focus of policy turned to "cooling off"economic growth and promoting grain output. However,since the middle of 1987 there have been growing signs of arevival of momentum towards continued reform with thereiteration of the importance to socialism of the development of productive forces. This was affirmed at the thirteenth Party Congress.
The Congress gave renewed impetus to further reform ofthe economic and political systems. The event that consolidated the political forces behind reform was the unanimousadoption of the report presented by Chairman Zhao Ziyang.This provides in-depth ideological reconciliation of past andfuture economic reforms with the principles of a socialistsystem. It also stresses the importance of continued devolution of decision-making. It calls for reform of the politicalsystem to separate the functions of Party and Government,which should mean greater autonomy for economic units.Thus, the official policy direction of the Party, supported byall members, is continued reform. 35 Though powerful criticsof reform were replaced, the members of the top decisionmaking body, the Politburo Standing Committee, are by nomeans unanimous on the pace of reforms. 36 Obstacles to reforms that are difficult to surmount include their potentiallynegative economic consequences, such as price increasesand supply shortages.
34 IMF, Exchange Arrangements and Exchange Restrictions: Annnal Report 1987 (Washington, D. C., 1987), and Almanac ofChina's ForeignEconomic Relations and Trade 1987 (Hong Kong, China Resources Advertising, 1987), p. 812.
35 Renmin Ribao (Beijing), 4 November 1987, pp. 1-4, and 2 November 1987, p. 1.36 Renmin Ribao (Beijing), 3 November 1987, pp. 1-2.
108

Renewal and reform in the Soviet Union
Variants of the Eastern European reforms discussed earlier were tried out in the USSR from the late 1950s until theearly 1980s, as shown in table VI. 1.2. There were two majordifferences, however. First, decentralization of management in the USSR remained by and large confined to theadministrative streamlining of planning and decision-making in firms. Even so, policy makers never progressed veryfar beyond the initial stages of the reforms. Secondly, external trade provided the major impetus to economic reform inEastern Europe and up to the present has exhibited the moreinteresting features of reform. But such major reconsideration of the role of foreign trade in bringing about growthintensification never occurred in the Soviet Union. EarlierSoviet reforms relate in particular to the territorial restructuring ofplanning and administration introduced in 1957 andto the managerial decentralization attempted in 1965. Several experiments were also launched in the 1970s and in theearly 1980s that modified the central model.
Broad backdrop to Soviet economic reform
In 1987, however, a major new thrust in reshaping theSoviet economic mechanism was launched. This was a logical evolution of the reform intentions announced since mid1985, which were themselves based on the various managerial experiments of the early 1980s. These experiments wereintended to give firms greater responsibility for their ownperformance. The measures announced in 1987, however,and even more so the policy intentions regarding follow-upin the years to come, amount to an important new phase inSoviet economic policies. Indeed, policy makers have madeit clear that the measures announced constitute only theopening phase of a much broader-based reform, whose nature and scope is without precedent. The measures enactedthus far provide the very first steps in the direction ofassimilating new micro-economic and macro-economic management methods throughout the economy.
Perhaps more important, the drift towards reform hasbeen associated with protracted political, academic and societal discussions of economic and social issues for whichthere is no precedent in either the Soviet Union or any otherplanned economy, including China. In combination, theyhave set the stage for the creation of an overall sociopoliticalenvironment that is more congenial and, indeed, conduciveto launching new economic policies and establishing newinstitutions and policy instruments, even if only experimentally.
Of the measures introduced or discussed so far, the topicsthat have been elaborated fairly comprehensively concernindividual and co-operative firms, foreign economic ties,
income distribution and managerial autonomy. In March1987, economic activity by individual and family firms waslegalized for consumer goods and services and regulationswere introduced to facilitate the establishment of co-operative businesses. A draft law promulgated in March 1988 signals further relaxation of these provisions with a view tobolstering employment opportunities, mobilizing capitaland increasing the supply of consumer goods and services.New procurement rules in agriculture allow farms to sellmore of their produce at market prices. Bold moves weremade to introduce larger differentials in wages and labourrelated benefits on the basis of productivity gains. Decreesin January and October 1987 authorized a number of industrial entities, in some cases individual firms, to engage directly in trading on their own account and to set up jointcommercial ventures, including ventures with partners frommarket economies. Because the changes sought in the foreign trade sector since early 1987 were too minor to generatesufficient interest, the law on joint ventures was overhauledin October 1987. These examples illustrate the swift shifts intraditionally sensitive aspects of policy-making. They showthe determination and pragmatism with which the Sovietleadership attempts to create a favourable setting for modernizing economic structures. This flexibility on the part ofpolicy makers, including flexibility through the mobilization of resources, has been illustrated particularly well bythe vigorous debate on the draft enterprise law in 1986 and1987, which resulted in numerous amendments that in somecases significantly reinforced provisions for managerial independence. 37
Ambitious scope ofthe reform
Perhaps the most outstanding feature of the perceivedneed for basic change in the economy is that Soviet policymakers now rule out the earlier piecemeal approaches to reforming the economy. The present reform strategy reacheswell beyond such traditional remedies as shifts in investmentpolicies, partial streamlining of organizational links andpressuring unprofitable firms to change by administrativemeans. Policy makers have committed themselves openly tocomprehensive changes that will reverberate throughout society.
An important milestone was the adoption in June 1987 oftwo documents: "Basic provisions for fundamentally reshaping economic management" and the Law on State Enterprise (Association). 38 These represent the initial stage ofthe "radical reform aimed at constructing a new economicmechanism" publicly enunciated at the twenty-seventhParty Congress, in February 1986. However, by January1988, when the law went into effect, only isolated components of a new system of economic management had been
37 For example, the draft law (art. 10, para. 4) stated that the firm "formulates" its annual plans, whereas the approved provision states that it"formulates and approves" its annual plans. Likewise, the provision that enables the firm to contest ministerial and similar regulations that itconsiders to be in violation of legislative requirements was added (as art. 9). The same attitude is reflected in the treatment of the structure of thewage fund. The draft law (art. 14, para. 4) called for norms on the maximum share of managerial and professional salaries, but the final textdropped this provision.
38 Izvestia (Moscow), 1 July 1987.
109

put in place. Administrative decision-making remained thebackbone of macro-economic and micro-economic control.The substance of the new measures is the switch from whatwas primarily planning by injunction to cost-benefit controlat every level of the economic hierarchy, to management ofvarious interest groups, to effective human involvement andeventually to full participatory management. 39
Economic reform measures enacted or formulated duringthe past two years have focused on two spheres: the reshaping of the organization of firms to overcome persistent bottle-necks and the revision of the economic environment affecting individual firms. Practical measures in the first areaincluded the establishment of six "super-ministries" orhigh-level bodies that co-ordinate and oversee relatedgroups of industries; the creation of a special state qualitycertification agency; and the formation of some 20 intersectoral organizations to co-ordinate research, developmentand production of major industrial items in the forefront oftechnological innovation.
The new arrangements for the economy at la~ge includereducing the number of centrally set plan targets; providingfirms with greater latitude in determining employment,wages, prices and investment; linking managerial incentivesto fulfilment of delivery contracts; and requiring firms tofinance a greater share of their current and capital outlaysfrom their own revenues. These measures allow organs ofstate control to concentrate on strategy and rates and proportions of development, they prevent central interference inthe day-to-day matters of economic units at lower levels ofthe planning hierarchy and they foster the transition from anexcessively centralized system of management to one actively encouraging self-management. At the same time,these measures are aimed at eventually demarcating unambiguously the functions of Party organs, local governmentand socio-economic organizations in economic decisionmaking. In the end, their success is predicated on fundamentally changing the working style ofall sociopolitical and economic organs. Some of the measures are intended as leversto accelerate this attitudinal transformation.
Economic reform is considered to be the key factor ingearing the system of planning and management towardslaying the foundations for obtaining sustainable growth at arather high level from gains in factor productivity. It is conceived as a sequence of gradual transformations ofeconomicsectors, rather than as an abrupt switch to a completely new,internally consistent, economic mechanism. The reformmeasures enacted thus far are the first steps in that direction.Continued progress must be ensured through detailed legislation on various aspects of reform implementation as wellas its legal interpretation and administrative application.
A critical feature of the two documents adopted in June1987 is the modification in the philosophy of social ownership. Earlier views advocated that only the State can fullyrepresent the preferences emanating from the social ownership of the means of production, including those appropriated in the micro-economic sphere. With reform, strong
support has emerged for the view that the firm as such represents the interests of public ownership. The firm is expectedto utilize the means of production assigned to it for the benefit of society as a whole under the guidance ofan appropriateeconomic mechanism. The practical ramifications of thisdoctrinal shift can be quite far-reaching, provided they aresupported by simultaneous adjustment in planning procedures and management practices.
Towards autonomy, increased responsibility and selffinancing of firms
Basic to the reform provisions to date is the creation of aneconomic environment conducive to self-financing and selfmanagement of firms. To this end, each firm is to be authorized to adopt annual and five-year plans based on contractual obligations and government orders and to procure thenecessary inputs primarily through wholesale trade. Thevolume of compulsory state orders is to remain well belowthe unit's productive capacity, so that direct relations amongfirms can be fostered. Because of the initial conditions inwhich the reform is being promulgated, the share of stateorders will remain high for the near term. How state ordersaffect micro-ecoomic latitude for manoeuvre needs to bemonitored closely to avoid state orders replacing centralplanning. Only thus can genuine wholesale trade be fostered.
Firms are expected to bear the full responsibility for theiroverall performance and the way in which they dischargetheir obligations. Financing of enterprise investments fromthe central budget is to be restricted to major investmentprojects only. In other words, because there is no effectivecapital market in place a new venture can be established orfundamentally restructured only through funds from thecentral budget. But even these relationships, unlike those inthe traditional planning system, are to be regulated throughlong-term, stable parameters for payments for fixed assetsand natural resources, which complement the norms on labour and profit taxes.
The changeover to cost-accounting and self-financing canbe done in one of two ways. The newly formed workers'councils in each firm make the choice. The first option isbased on retention ofprofit. It can be selected,when the wagefund, essentially the total wage bill, is set according toagreed norms in relation to net output. Net profit after settlement with the central budget or superior body (ministry) andafter repayment ofbank loans is at the disposal of the firm. Itcan be appropriated for investment, social and cultural development, technological modernization and bonus payments. The second option is based on collective contractprinciples. In it the wage fund is a residual of net profit aftersettlement with the central budget and after transfers intofunds for production development, technological promotionand social development constituted according to establishednorms.
Soviet policy makers emphasize that interfirm competition should be encouraged so as to cater to consumer demand
39 "Osnovnye polozhenia korennoy perestroiki upravlenia ekonomikoy", Kommunist (Moscow), No. 10 (1987), pp. 54-72.
110

and ease the effects of the monopolistic position of producers in a seller's market. On the other hand, there must bea transition to self-management with the help of workers'councils, which elect their own managers. Firms must haveconsiderable leeway in selecting inputs, outputs and business partners. Fulfilment of contractual obligations is to bethe main performance indicator. But the effectiveness of thenew potential for competition and the matching of demandand supply depend to a considerable extent on the flexibilityof the prices at which inter-firm transactions are effected.For the time being, as long as the sellers' market persists,the state quality-certification agency acts as a surrogate ofcompetition. In the future, however, contractual freedomamong state units should stimulate competition, but its impact is difficult to gauge at this juncture.
Centralized macro-economic control should guide individual agents by means of appropriate economic levers withthe goal of optimizing the benefits to society as a whole. Inaddition to streamlined central planning, these levers include financial and credit relations, prices and exchangerates, material and technical supplies and foreign exchangecontrols. The central planning agency is entrusted with theelaboration of the concept and the guidelines for the economic and social development of the USSR for the next 15years, the five-year plan being the principal instrument ofeconomic control. But the main operative components of theplan should be indicative target figures rather than compulsory quotas; long-term stable economic "normatives",which are essentially approved standard ratios between indicators-ofperformance and the distribution of revenue amongthe central budget, the ministry and the firm itself accordingto performance indicators; government orders for the mostimportant products; and quotas for centralized investmentsand centrally distributed supplies.
The centrally set distribution parameters should preventthe firm from channelling an excessive share of income intolabour remuneration. Where desirable, they should encourage decision makers to explore new avenues of improvingperformance. To that end, they should be predictable. Thenorms are therefore to remain stable in the medium run,perhaps within the context of the five-year plan. The selection of performance indicators and of norms with a view torewarding improvement as fully as feasible is critical to thethrust of the reform and to steering a steady course towards afully reconstructed economic mechanism. Organizationalinnovations include granting firms the right to establish jointproduction facilities on a co-operative basis or through complete merger. Industrial ministries are to be relieved ofexecutive control over producers. They are to be transformedinto centres for the co-ordination of research and development, the promotion of steady gains in the quality of outputand quality control, technological policy-making and relatedtasks.
Emergence of negotiated wholesale trade
One salient feature of the new regulations is the gradualintroduction of genuine wholesale trade in the means of pro-
duction, including trade in capital goods, over the next several years. Negotiated intermediation of demand and supplywill replace major components of the present administrativedistribution of resources. This commercialization is to startfirst in the sphere of material inputs into the state productionof consumer goods, machine-building, construction and agriculture. It also encompasses supplies for co-operatives andstate firms. Government requests or state orders channelledthrough the state supply system are to be the only exceptionto the gradual dismantling of the state supply system in favour of direct inter-firm relations. But even they are intended to result from genuine economic bargaining betweenthe centre and economic agents, rather than being imposedhierarchically upon micro-economic units.
The centralized material supply system should ultimatelybe confined to a comparatively small share of fuel and energy resources, raw materials and high-technology products. The agencies at present entrusted with material supplyare expected to intermediate between demand and supplyand to be remunerated p'rimarily on a commission basis. Fulfilment of contractual obligations is to become the most important indicator of micro-economic performance once stateorders are reduced to the role envisaged by policy makers.Violations ofcontractual obligations can result in fines of upto 8 per cent of the contract's value.
As a proportion of total inter-enterprise transactions, therole of wholesale trade in the means of production is stillnegligible less than 1.5 per cent of total industrial output in1987; around 4 per cent is forecast for the end of 1988.40 Inspite of the limited scope for wholesale trade in capitalgoods, increased contractual responsibility and restraintsapplied to investment demand on account of self-financingare already bearing fruit. As an example, for the first time inthe past 10 years inventories in 1987 increased more slowlythan total output (see chap. II above).
The paramount role of scarcity-related pricing
The shifting of price determination away from the traditional average cost-plus basis is one central aspect of thereform. Increasingly, first for selected products and gradually for a growing number of products, prices are to be determined by supply and demand. Some modest changes havealready been made in the system of price mark-ups and discounts for many products to encourage firms to improveproduct quality, expand their output mix and introduce newproducts. The highest placed policy makers have left nodoubt that a radical reform of pricing must eventually become an integral part of restructuring.
Instead of price reform being partial and fragmentary, asin virtually all previous reform attempts in the Europeanplanned economies, it is now envisaged as comprehensive inthe sense of involving a co-ordinated revision of wholesale,procurement and retail prices. Industrial and agriculturalprocurement prices need to reflect economic trade-offs andto provide appropriate guidance for managerial decisions oninput-output mixes, including interregional and intertem-
40 Ekonomicheskaya gazeta (Moscow), No. 34 (1987), p, 6; and Izvestia (Moscow), 27 August 1987, p. 2.
III

poral ones, and for the proper assessment of factor productivity. Similarly, retail prices must become a lever forstreamlining distdbution and balancing consumer supplyand demand. An important objective in reforming wholesaleprices in particular is to bridge the gap between prices ofmanufacturing and extractive industries without raising theoverall price level. Procurement prices for agriculturalproducts and prices for construction services should increasingly result from contractual negotiations. Once such pricesare set, current policy discussions emphasize, they shouldbe kept stable for perhaps two to three years. In that respect,macro-economic policies regarding the overall price leveland shifts in relative prices should become an importantcomponent of five-year plans with a view to reflecting morefully the tasks and conditions of the national economy. Theconsumer's role in the determination of prices is to risesharply and price-setting procedures are to be simplified bydrastically curtailing the share of centrally determinedprices.
Policy makers are hoping to contain the upward pressureon prices by increasing domestic competition, eliminatingshortages and curtailing all forms of monopolistic pressure.Regulations governing the foundation for negotiating contract prices are to be worked out as well. 41 Because retainedprofits are intended to become the major source of investment financing, firms are expected to become more interested in active price negotiations. The negotiated and approved contractual price for a specific product is to remainin effect for two years. Contractual pricing will initially beapplied to products that have a direct and specific consumer,such as agricultural equipment or machinery for specificproduction processes. The share of prices determined centrally, once price reform and reforms are firmly in placewell into the 1990s, should not exceed 10 per cent. 42
Although policy makers have committed themselves tocomprehensive price reform, the details of critical elementsof such reform have still to be elaborated. It is as yet unclearwhich prices will be set by administrative fiat and whichestablished as a result of direct agreements between producers and purchasers. From the ongoing policy discussions, the majority ofprices will initially be constructed on acost-plus basis.
Devolution in banking and monetary reform
The reform envisaged seeks to co-ordinate improvementsin the price system with changes in the fiscal and monetarymechanisms. In reforming the monetary system, the priorities of gearing monetary circulation to the turnover of material resources, reducing gratuitous disbursements of financial funds for investment purposes and transferring budgetary receipts on a normative basis are stressed. Budgetaryfinancing ofinvestments is to be restricted to a narrow rangeof high-priority, goal-specific programmes of national importance and is to be kept separate from loans issued byspecial banks strictly on the basis of the economic viabilityof the loan request.
Policy makers are keen to consolidate the purchasingpower of the rouble at home and to create the conditionsnecessary to utilize the rouble in foreign transactions. Giventhe dichotomy between domestic and external pricing systems, rouble convertibility is potentially a critical objectiveof change, a beacon for policy makers rather than a shortterm policy goal. Convertibility of the rouble would requiresubstantial institutional and policy transformations, in addition to those currently set in train. Judging from recent policy discussions, it is more likely that limited convertibility ofthe rouble and other national currencies of CMEA memberswithin the context of selected regional transactions will firstbe promoted.
The reorganization of banking institutions involves givingthem complete financial accountability and creating forthem adequate incentives to improve the return on loans,making the financial performance of enterprises a basic criterion for loan disbursements and preventing intra-ministerial redistribution of circulating capital, depreciation fundsand profits among subordinate firms. The first practical stepin this direction was taken in July 1987 with the establishment of six specialized banks.
Wage reform, employment and consumption
The new provisions call for further strengthening of thelinks between labour remuneration and average productivity(i.e., output per worker). This endeavour is to be fostered bythe introduction on a wide scale of the collective contractsystem (which governs the determination of wages and bonuses), by making profits the sole source of the social consumption fund set aside by firms and by lifting all restrictions on combining jobs. The wage reform introduced fullyin January 1988 in essence grants enterprises nearly fullrights, and imposes on them corresponding obligations, insetting payment scales according to merit and productivity.These differentiations can be undertaken within the provisions of the total wage fund. The reform sets growth in labour productivity as the upper limit for the expansion ofnominal wages.
The wage increases envisaged are to be almost wholly financed from enterprise profits and are thus.to be introducedin individual firms as resources are earned. The bonus system will undergo far-reaching changes. Bonuses are to bedistributed at the discretion of the firm and limited only byits "labour stimulation fund". All central regulations on bonuses for different categories of employees are to be lifted.Within brigades and engineering and design bureaux, thesize of individual bonuses is to be determined by the members. Basic salaries before bonuses remain regulated by centrally set payment scales, however. These are being raisedby 20 to 30 per cent, but the increase is to come out ofprofitsrealized. The centrally set payment scales now serve as areference, with the individual firm itself determining therates for different categories of its employees, given theworking conditions.
41 Ekonomicheskaya gazeta, (Moscow) No. 34 (1987), p. 7; and No. 48 (1987), p. 14.42 Izvestia (Moscow), 30 August 1987, p. 2.
112

The changes envisaged in labour remuneration contrastsharply with the practice of previous reforms in at least tworespects. First, implementation of a unified wage reformacross all enterprises in an industry or region simultaneouslyis not envisaged at present. Secondly, most of the wage gainscurrently tabled will be financed from profits realized byenterprises, not from the central budget. Gradualism andpay-as-you-earn are the mottoes at this stage. By the middleof 1987, these new conditions covered 2,700 entities (around6 per cent ofthe total), but more than 70 per cent of them didnot noticeably change their bonus systems and failed to tie inwages to productivity.43 It is hoped that this conservative attitude toward labour remuneration and inclination to link bonuses to gross output indicators rather than efficiency can beovercome by mid-1988, when the new wage regulations areto apply to over 65 per cent of the total non-agricultural labour force.
Another important component of the labour reform isthat, instead of clinging to the de facto lifetime job guarantee, current employment policy emphasizes the urgency ofutilizing labour more effectively. This may require temporary lay-offs, but their deleterious implications will be mitigated by providing, in effect, unemployment compensation.This is being introduced in conjunction with the creation ofanetwork of job placement centres entrusted with the relocation and retraining of released and idle workers. These centres themselves are to be self-financing from placementcommissions. Labour mobility is to be encouraged to staffprivate and co-operative enterprises under the provisions ofthe draft law of March 1988. This legislation may be enactedin anticipation of what, in a decade or so, may amount to amassive redeployment oflabour (15-17 million people).
Fostering labour productivity through wage and relatedincentives places higher demands on the process ofdiversification of assets available to households and especially thesupply of consumer goods with a high income elasticity. Tomeet these demands soon, the provisions adopted also established a practical framework for implementing the new economic policy with respect to the composition of output. Implementation is expected to be completed by 1990. An urgent task is to balance supply and demand in retail marketsby promoting the output of consumer goods and services.Recently enacted provisions on private and co-operativeventures, which have been described as "market medics" ,44
are aimed especially at improving the supply of foodstuffs,services and selected consumer durables.
Changing attitudes toward agricultural reform
The principal provisions ofthe new policy permit farms tosell a larger share ofproduction at decontrolled prices and tomarket products more flexibly. Many of the arrangementsintroduced already in the industrial sector, such as normative planning, self-financing and the use of contracts, are tobe extended to farms too. Emphasis on local decision-making, within the context of the contract brigades or similarproduction units within the farm, is evident. Such units are
43 Izvestia (Moscow), 11 September 1987, p. 2.44 Pravda (Moscow), 10 March 1988, p. 3.
113
allocated land and livestock on a long-term contractual basis. Remuneration is based on output. These important features ofthe rural reform provide the basis for the functionaldecentralization of decision-making in agriculture, whichmay be a prerequisite for a breakthrough in the level andcomposition of farm output in the years to come. The question of further development of rural reform is to be addressed again at a meeting of the Central Committee in thefirst half of 1988.
The rural sector is increasingly encouraged to fostersmall-scale private or co-operative firms, including thoseengaged in manufacturing activities and services. Not onlyis this aimed at mobilizing available resources, it should alsofacilitate the redeployment of labour, enhance the allocationof capital in rural segments of the economy and indeed improve the supply of consumer goods and services.
Redesigning the role offoreign trade
In 19 August 1986, the Presidium of the Council of Ministers passed a decree which formally authorized the reorganization of Soviet organs involved in foreign economic relations and the restructuring offoreign trade practices and procedures. This permitted some 20 industrial ministries and 70firms to engage in trade on their own account. One of themost significant changes was the possibility of entering intojoint ventures both within and outside the territory of theUSSR. At the end of October 1987, the joint venture regulations were amended by broadening the domestic base of theprogramme while an attempt was made to speed up approvals and decentralize responsibility.
The foreign trade reform introduced early in 1987 hasproceeded rather fitfully, partly because it was drawn upwithout thorough preparation of either domestic or foreignpartners, including CMEA members, and without a comprehensive assessment of how it would fit into the planningframework in 1987 and beyond. Domestic enterprises wereunaccustomed to competing for markets and so were ratherbewildered about how best to take advantage of their newlyacquired latitude. Further, the financial and related infrastructure for direct trade relations was inadequate. Poor-tofair results also stemmed from constraints on flexibility builtinto the five-year and annual trade agreements earlier concluded primarily with CMEA partners and the fact that thevast bulk of exports to market economies consists of fuelsand industrial raw materials, which remain under centralcontrol. Finally, for several years, the Soviet trade environment has been under pressure from weak energy exportearnings and rising prices for manufactures procured inmarket economies. Even considerable borrowing in financial markets did not suft1ce to permit policy makers to fosterthe modernization of engineering sectors that the currentfive-year plan (1986-1990) was to have vigorously encouraged from its inception.
Given the prevailing payments constraints, the lingeringimplications of the long years of separation between domes-
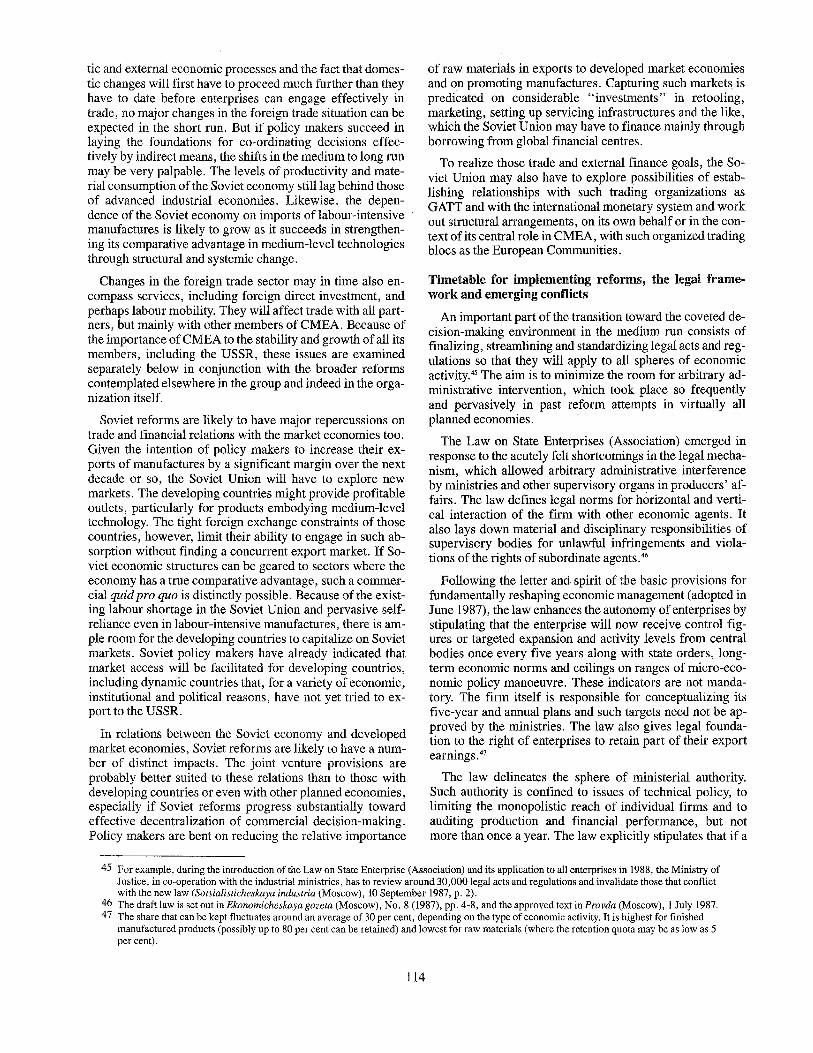
tic and external economic processes and the fact that domestic changes will first have to proceed much further than theyhave to date before enterprises can engage effectively intrade, no major changes in the foreign trade situation can beexpected in the short run. But if policy makers succeed inlaying the foundations for co-ordinating decisions effectively by indirect means, the shifts in the medium to long runmay be very palpable. The levels of productivity and material consumption ofthe Soviet economy still lag behind thoseof advanced industrial economies. Likewise, the dependence of the Soviet economy on imports oflabour-intensivemanufactures is likely to grow as it succeeds in strengthening its comparative advantage in medium-level technologiesthrough structural and systemic change.
Changes in the foreign trade sector may in time also encompass services, including foreign direct investment, andperhaps labour mobility. They will affect trade with all partners' but mainly with other members of CMEA. Because ofthe importance of CMEA to the stability and growth ofall itsmembers, including the USSR, these issues are examinedseparately below in conjunction with the broader reformscontemplated elsewhere in the group and indeed in the organization itself.
Soviet reforms are likely to have major repercussions ontrade and financial relations with the market economies too.Given the intention of policy makers to increase their exports of manufactures by a significant margin over the nextdecade or so, the Soviet Union will have to explore newmarkets. The developing countries might provide profitableoutlets, particularly for products embodying medium-leveltechnology. The tight foreign exchange constraints of thosecountries, however, limit their ability to engage in such absorption without finding a concurrent export market. If Soviet economic structures can be geared to sectors where theeconomy has a true comparative advantage, such a commercial quid pro quo is distinctly possible. Because of the existing labour shortage in the Soviet Union and pervasive selfreliance even in labour-intensive manufactures, there is ample room for the developing countries to capitalize on Sovietmarkets. Soviet policy makers have already indicated thatmarket access will be facilitated for developing countries,including dynamic countries that, for a variety of economic,institutional and political reasons, have not yet tried to export to the USSR.
In relations between the Soviet economy and developedmarket economies, Soviet reforms are likely to have a number of distinct impacts. The joint venture provisions areprobably better suited to these relations than to those withdeveloping countries or even with other planned economies,especially if Soviet reforms progress substantially towardeffective decentralization of commercial decision-making.Policy makers are bent on reducing the relative importance
of raw materials in exports to developed market economiesand on promoting manufactures. Capturing such markets, ispredicated on considerable "investments" in retooling,marketing, setting up servicing infrastructures and the like,which the Soviet Union may have to finance mainly throughborrowing from global financial centres.
To realize those trade and external finance goals, the Soviet Union may also have to explore possibilities of establishing relationships with such trading organizations asGATT and with the international monetary system and workout structural arrangements, on its own behalf or in the context of its central role in CMEA, with such organized tradingblocs as the European Communities.
Timetable for implementing reforms, the legal framework and emerging conflicts
An important part of the transition toward the coveted decision-making environment in the medium run consists offinalizing, streamlining and standardizing legal acts and regulations so that they will apply to all spheres of economicactivity.45 The aim is to minimize the room for arbitrary administrative intervention, which took place so frequentlyand pervasively in past reform attempts in virtually allplanned economies.
The Law on State Enterprises (Association) emerged inresponse to the acutely felt shortcomings in the legal mechanism, which allowed arbitrary administrative interferenceby ministries and other supervisory organs in producers' affairs. The law defines legal norms for horizontal and vertical interaction of the firm with other economic agents. Italso lays down material and disciplinary responsibilities ofsupervisory bodies for unlawful infringements and violations of the rights of subordinate agents. 46
Following the letter and spirit of the basic provisions forfundamentally reshaping economic management (adopted inJune 1987), the law enhances the autonomy of enterprises bystipulating that the enterprise will now receive control figures or targeted expansion and activity levels from centralbodies once every five years along with state orders, longterm economic norms and ceilings on ranges of micro-economic policy manoeuvre. These indicators are not mandatory. The firm itself is responsible for conceptualizing itsfive-year and annual plans and such targets need not be approved by the ministries. The law also gives legal foundation to the right of enterprises to retain part of their exportearnings. 47
The law delineates the sphere of ministerial authority.Such authority is confined to issues of technical policy, tolimiting the monopolistic reach of individual firms and toauditing production and financial performance, but notmore than once a year. The law explicitly stipulates that if a
45 For example, during the introduction of the Law on State Enterprise (Association) and its application to all enterprises in 1988, the Ministry ofJustice, in co-operation with the industrial ministries, has to review around 30,000 legal acts and regulations and invalidate those that conflictwith the new law (Sotsialisticheskaya industria (Moscow), 10 September 1987, p. 2).
46 The draft law is set out in Ekonomicheskaya gazeta (Moscow), No.8 (1987), pp. 4-8, and the approved text in Pravda (Moscow), 1 July 1987.47 The share that can be kept fluctuates around an average of 30 per cent, depending on the type of economic activity. It is highest for finished
manufactured products (possibly up to 80 per cent can be retained) and lowest for raw materials (where the retention quota may be as low as 5per cent).
114

ministry, department or other agency superior to the firmissues a directive that is outside the jurisdiction of thatagency or that violates legislative provisions, the economicagent has the right to contest it in a court of law with a viewto having it rescinded in full or in part. Losses sustained by afirm as a result of compliance with instructions issued by ahigher-level agency that violate the firm's rights, as well asthose incurred because of the improper exercise of thehigher-level agency's duties with respect to the firm, aresubject to compensation by that agency. Though reform provisions allow economic agents to contest unrealistic state orders in a court oflaw, most firms are unwilling or hesitant totake such measures except as a last resort. They fear seriousreprisals and arm-twisting by higher-level agencies or aresimply unfamiliar with the proper procedures. So far, onlyone instance of such litigation has been reported and, apparently, the judicial authorities encountered serious difficultiesin arranging a competent legal investigation of the problem.48
Transferring. producers expeditiously to a system of fullcost-accounting and reforming top management bodies inaccordance with the new conditions remain the most important issues on the policy agenda for the next several years.By 1990, reforms of finances, prices, banking and the material-supply system are slated to be completed. Wholesaletrade in the means of production should account for 60 percent of total turnover by 1990 and around 90 per cent by1992.49
Perhaps the most important problems to be tackled duringthe initial stage of the reform concern the definition of thesubstance and legal status of new economic levers such asstate orders, control figures and the regulations on the distribution of gross profits. Serious problems have alreadyarisen early in 1988 because ofvague details, definitions andinterpretation of reform regulations, which can seriously retard or blunt their desired impact. This feature is alreadyparticularly evident for state orders.
According to the spirit of the reform, contracts should benegotiated between central bodies and enterprises. Becauseof the inertia of traditional administrative practice, however,the planning centre and ministries have so far tended to resort to compulsory assignments through administrative
pressure, even without the ministries ensuring the requisiteresources. By these and other means the share of state ordersin total enterprise output has remained very close to 100 percent of capacity in many activities. Not only that, instead ofconcentrating on the most important products, state ordershave been loaded with detailed regulations on the mix andvolume of output. 50 Central control has therefore remainedthe order of the day. 51 Because this administrative pressure issupported by the ministries' hold over resource allocation,enterprises are nearly powerless to avoid or to alleviate itand in the end the whole attempt to foster their independencemay be in jeopardy. 52 Because of this adverse situation, highpriority is being given to enforcing the provisions on government orders. It is envisaged that in 1989 they are to bereduced to 70 per cent of total industrial output; and after1991, to no more than 30 per cent. 53
Similarly, the shape and scope of the emerging wholesaletrade in the means of production are as yet unclear. The introduction of wholesale trade in earlier reform attempts,most notably that of 1965, was thwarted by persistent shortages and imbalances that encouraged hoarding. This in turnmade it necessary to continue the fiat rationing of the meansof production. Policy makers are at present attempting tocombine a more balanced central plan with micro-economicautonomy based on genuine self-financing and adequate,built-in incentives to husband scarce inputs. Although thescale of the state supply system cannot be compressed noticeably in the short run, policy discussions stress that thesupply system needs to ensure timeliness and an appropriatemix of supplies. Imbalances between financial and materialresources that are bound to entail shortages and the lack ofpreparation of and familiarity with the material-supply system through which wholesale trade is to flourish may seriously impair the practical impact of these reform provisions. 54
Control indicators are another important component of thereform provisions that have experienced a transformationsimilar to that of state orders. They were to replace mandatory quotas, volumes and levels for different characteristicsofenterprise performance previously imposed by the centre.Although control indicators are intended to be non-bindingand serve only as a reference for accounting purposes, the
48 For details, see "Isk ministerstvu", Moskovskie novosti (Moscow), 21 February 1988, p. 9. This is the first legal case in half a century of aSoviet enterprise contesting a ministry's order. This possibility was even recently considered only rhetorically (see "Mozhno Ii podat' v sud naministerstvo?", Sotsialisticheskaya industria (Moscow), 22 November 1987, p. 2).
49 See the interview with A. Aganbegyan in Izvestia (Moscow), 25 August 1987, p. 2.50 See, for example, "Vot priedetministr", Pravda (Moscow), 9 February 1988, p. 2, and "Shtrafnoy udar", Pravda (Moscow), 17 February
1988, p. 2. On average, state orders accounted for 91.6 per cent of output in machine-building, 92.1 per cent in metallurgy and 97.2 per cent infuel and energy, whereas for many other branches and enterprises they covered 100 per cent of production plans. In direct contradiction to theprovision that state orders are to deal only with final products, they are more often than not issued for intermediate goods and services. Stateorders did not receive preferential treatment in the provision of inputs and the financial responsibility of the intended consumer was not secured(see E. Figurnov, "Zakazyvaet tot, kto platit", Ekonomicheskaya gazeta (Moscow), No.6 (1988), p. 5, and "Otkazat'sya ot starykh metodov" ,Ekonomicheskaya gazeta (Moscow), No.7 (1988), p. 5).
51 For an extensive discussion of this and related issues, see the interview with L. Abalkin, "Pobedit' byurokrata", Izvestia (Moscow), 1 March1988, p. 2.
52 E. Yasin, "Sovetskaya ekonomika na perelome", Kommunist (Moscow), No. 12 (1987), p. 39.53 See the interview with A. Aganbegyan in Svenska dagbladet (Stockholm), 2 February 1988, p. 2.54 That this is a very real danger can be shown by the fact that requests for material supplies from enterprises included in the experiment on
self-financing are 60 to 70 per cent satisfied. A survey of enterprise management showed that though 72 per cent of managers are in favour ofwholesale trade, only 29 per cent believe that it can be properly handled by the existing material supply system (see E. Yasin, loc. cit., p. 39,and Pravda (Moscow), 14 July 1987, p. 2).
115

ministerial bureaucracy is urging that they be made mandatory and that enterprises be required to report frequently ontheir fulfilment. 55 That would shift the emphasis in economicdevelopment from its qualitative aspects back to maximizingoutput growth, thus essentially nullifying the entire strategyof reform.
Although the set of regulations adopted in June 1987 (the"Basic provisions for fundamentally reshaping economicmanagement") is regarded as the foundation of the reformprocess and is expected to be continuously amended, refinedand supplemented, the drawbacks and inconsistencies citedpoint to some weaknesses in the legal foundation of reformat this stage of the restructuring effort. 56 Because of theseinadequacies, work on preparing a number of new legal decrees has been intensified. The most important are "Regulations on state orders", "Regulations on branch ministries"and "Regulations on deliveries of material-technical andconsumer supplies". These documents are soon to becomemajor components of an economic code as the integral legalbasis of the reform processY This approach is reflected inrecently adopted decisions, one of which aims at reinforcingthe statute of the production association as the main component of the economic structure, thus encouraging the processofboth vertical and horizontal economic integration. Insteadof being enforced from the centre, integration shouldemerge from the mutual interests of firms entering into suchan association. Another decision aims at bringing the economic environment of industrial research and developmentin line with the general principles of cost accounting. From1987 onwards, research and development institutes are to befinanced through a system of contracts for specific designand engineering projects, rather than, as heretofore, fromthe budget of industrial ministries.
Potentially the most serious issue in keeping the reform ontrack stems from the conflict between the goals of economicreorganization and accelerating aggregate growth. 58 Highgrowth targets have usually meant "taut" planning. Full resource utilization normally generates tensions and shortagesthat could call for dysfunctional intervention by central authorities. This, in turn, could legitimize bargaining for temporary exceptions or exemptions from the reform measures for example, more favourable treatment, concessions, additional allocations and permission to hoardresources. None of these traits of economic behaviour in
typical centrally planned economies accords with the intentions of the reform. The target for maximum growth maytherefore have to be relaxed to accommodate steady reformof the economic mechanism. 59
There are also serious contradictions between reformprinciples and short-term policy precepts that encourage theabove-mentioned abuses. The major one is that while theLaw on State Enterprise (Association) provides for microeconomic autonomy and self-reliance, current ordinancesand government resolutions put the complete responsibilityfor ensuring planned volume and mix of manufactures onbranch ministries. Plan fulfilment is perceived as the foremost political task of the ministries. This gives them powerfulleverage over subordinate economic agents. The perception has been strong enough to permit the ministries to blatantly disregard legal curbs on their day-to-day interventionin the management offirms. 60 In 1988, drastic cut-backs inthe number of civil servants attached to ministries (by 30 to50 per cent on average), which noticeably disrupted the conventional vertical network of ministerial management. Although in the long-term this administrative measure will undoubtedly have a salutary effect on the reform process, forthe time being it has seriously demoralized the ministerialbureaucracy and further slowed down the already protracteddecision-making process.61
The gradual approach to reform may also emphasize thecontradiction between short-term and long-term development goals. Short-term targets are conventionally represented by increases in output growth. An abrupt switch to anew economic mechanism is too risky. The gradual approach to reform therefore appears more attractive. However, in the long term, such gradualism may seriouslyweaken the impact of reform measures and undermine theireffect on economic efficiency.62
Another crucial issue is the proper degree ofco-ordinationof the reform process among the different components of theeconomic mechanism. The promotion of micro-economicautonomy is at the heart of the reform. Its real extent depends not only on the amount of financial resources at thedisposal of a firm but, more important, on gaining access toprimary and intermediate inputs, which in turn depends onthe flexibility of the distribution system. Results as at early1988 are not particularly encouraging. 63
55 In extreme cases, technically illegal demands from the ministries to report monthly volume and structure of gross output are reported (see"Muskuly khozrascheta", Sovetskaya rossia (Moscow), 25 February 1988, pp. 1 and 2, and L. Aba1kin, lac. cit).
56 B. Kurashvili, "Direktiva 0 direktore", Moskovskie novosti (Moscow), 28 February 1988, p. 9.57 V. Laptev, "Pravovaya osnova samostoyatel'nosti predpriyatiy", Ekonomicheskaya gazeta (Moscow), No. 10 (March 1988), p. 16; and L.
Aba1kin, lac. cit.58 Maintaining high growth is the main concern of the five-year plan and long-term targets to the year 2000.59 According to one Soviet observer, "it is unreasonable to speed up the machine when the engine is under repair" (E. Yasin, lac. cit., p. 37).60 They demand detailed information and issue frequent instructions despite explicit legal proscription of these actions under the reform. Thus, the
Ministry of Ferrous Metallurgy was demanding its enterprises on average to report daily on 220 indicators (with an upper limit of4,100 indicators in the case of one major plant) instead of the 10 to 15 legally allowed (see "Informatsia k razmysh1eniyu ... ili k soveshchaniyu", Izvestia(Moscow), 11 January 1988, p. 2). The non-binding status of control indicators is still conspicuously abused by the ministries that continue toincrease the number of "additional" and "special" assignments (see "Ekonomicheskaya reforma i sily tormozhenia", Ekonomicheskayagazeta (Moscow), No.7 (1988), p. 14).
61 "Chemodannye nastroenia", Sovetskaya rossia (Moscow), 28 February 1988, p. 2.62 For a discussion of this issue, see E. Gaidar, "Kratkosrochnye i do1gosrochnye tseli v ekonomike", Kommunist (Moscow), No. 10 (1987), p.
95.63 "Prorvat' osadu nenuzhnykh predpisaniy", Sovetskaya rossia (Moscow), 6 January 1988, p. 2, and "Tot Ii eto khozraschet?", Sotsialisti
cheskaya industria (Moscow), 29 November 1987, p. 2.
116

Autonomy of firms is also a function of the soundness ofprice signals and the availability ofbank credit. Because prevailing prices do not reflect scarcities and because currentviews on price reform continue to be expressed in terms ofaverage sectoral costs plus some profit margin, the role ofthe price mechanism in the efficient allocation of resourceswill in effect remain secondary. A major change can occuronly if central policy makers decide to proceed with comprehensive price reform and to infuse much greater flexibilityinto the price system than appears to be envisaged at thisstage.
If provisions on self-financing are well ahead of effectiveeconomic reorganization and price reform, profits will necessarily reflect the lack of competition, administrativelyfixed prices and the prevailing conditions with regard tofixed assets, which firms themselves are unable to improveupon for lack of funds. At a more practical level, the impactof reform on the producer will depend heavily on such details as how and by whom the regulations on profit distribution are determined, how flexible prices are, who will havethe final say in approving them and what criteria will governthe creation and distribution of credit. 64
As the results of the experiment in self-financing indicateto date, the legacy of the traditional approach to management is still pervasive. The weight attached to indicators ofthe volume ofperformance, particularly gross output, is stillconsiderable. Attempts to exert administrative pressure tocoax agents into fulfilling unbalanced and unrealistic planscontinue to encourage shortages and disrupt productive cooperation. Attempts to curb inefficient production are futile,more often than not. 65 Firms are still so heavily burdenedwith state orders that there is little or no room for managerialflexibility to mobilize resources to meet unexpected demand. Administrative sequestering of accumulated retaineddepreciation funds occurs, as do arbitrary changes in outputquotas, supply allocations and surcharges for extra qualityand export production. All this undermines investment capabilities and financial stability of de jure self-financing enterprises. 66 Deductions from profit for budget payments areas yet not governed by economic concerns. But managerscontinue to expect ministries to muster emergency financialaid in case of a liquidity crisis. Perhaps the only difference isthat the volume of tradable (saleable) production is used asan indicator of performance instead of gross output. Nonethe less, the increase in volume of production from the levelachieved in the previous year-the so-called ratchet principle-is still considered by ministries as the central successcriterion. In the same vein, norms lack uniformity becausethey are individualized for the different enterprises. Normstherefore put additional pressure on enterprises alreadyworking efficiently and provide unjustified benefits to those
with concealed reserves for improvement. Instead of beingstable, norms tend to fluctuate from year to year. 67
All this strengthens the growing conviction that the maintask ahead is to further improve the economic mechanismand make its introduction more ambitious, consistent andtransparent. The end of the 1980s is generally viewed as atransitional period leading to comprehensive reform, duringwhich managerial autonomy and a more solid legal framework for public scrutiny in economic activity should takefirm hold, the pace and scale of reform in pricing and in thebanking sphere are to be determined and contradictions between reform strategy and remnants of the command economy are to be resolved. It is recognized that the remainingyears of the decade will be difficult, painful and perhapstumultuous.
Soviet economic reform and CMEA economic co-operation
The reform intentions of the Soviet Union have alreadyhad measurable repercussions on policy stances of the majority of its partners in CMEA. All Asian and EuropeanCMEA members, except the German Democratic Republicand Romania, are currently engaged in some type of economic reform as defined in this chapter. The drift towardsreform has created a new ambiance for changing the organization, policy instruments, institutions and policies of economic co-operation in the context of CMEA. This was especially manifest at the forty-third CMEA Council Session(Moscow, 13 and 14 October 1987), preparations for whichwere made in November 1986 by a "working summit" ofkey Party and government leaders from all member countries. Accordingly, CMEA as a regional organization and itsunderlying policies, instruments and institutions are toundergo radical restructuring too, as will the policies underlying economic co-operation among members.
As mandated by the forty-third Council Session, membersare proceeding on several different fronts. First, it wasagreed to reform the organizational structure of CMEA.This involves abolishing organs that have not performedwell over the years, consolidating units that have in effectduplicated one another and generally gearing the work of theorganization less to actual day-to-day planning of production and distribution than to the medium-term to long-termstrategic planning of the key directions for structural changethat members should fully explore. Thus, the staff of theorganization is to be reduced by one third, 19 formal CMEAorgans are planned to be abolished and 6 are to be created orrecreated by combining existing institutions. In that respect,there is a close parallel with the intended planning reforms inindividual CMEA members.
64 For example, according to the regulations on bank self-financing, starting in 1988, part of revenue is expected to accrue from penalties onenterprises that utilize credits inefficiently. Ifnot counter-balanced by other guidelines, this rule can motivate banks to be excessively harsh inassessing credit utilization. On the other hand, banks are allowed to give, at their discretion, 50 per cent discounts on rates for credits for technological innovation and modernization. But since wage funds and bonuses of banks depend on revenue, the banks may be reluctant to providesuch discounts.
65 E. Gaidar, "Kursom ozdorovlenia", Kommunist (Moscow), No.2 (1988), p. 41.66 "Samostoyatel'nost' pod opekoy", Sotsialisticheskaya industria (Moscow), 19 December 1987, p. 1.67 More than 170 types of fines, sanctions and penalties can be applied to an enterprise by the ministry and other central bodies for disobeying their
directives (see Ekonomicheskaya gazeta (Moscow), No.2 (1987), p. 6, and No. 31 (1987), p. 8 .
117

Secondly, there was apparently widespread agreement torechart assistance policies to the non-European members ofCMEA (Cuba, Mongolia and Viet Nam). Past developmentassistance efforts were deemed less effective than they couldhave been from both the recipient's and the donor's point ofview. Donor countries agreed to work out a dovetailed multilateral approach within a medium-term to long-term coordinated programme targeted at providing economic assistance to the three non-European members so that their jointefforts would measurably improve the shared benefits of economic assistance.
In a similar vein, it was agreed to work out a new integration strategy for the period 1991-2005. Efforts to draw upsuch a programme have been on the table since the first callsfor the CMEA economic summit meeting that took place inJune 1984. The purpose then, as now, was to come to gripswith the severe internal and domestic economic constraintsfaced by virtually all of Eastern Europe in the early 1980s. Itis expected that the first draft of the programme will becomeavailable in time for consideration by the Council Session inJuly 1988. The Council Session is to re-examine the objectives, policies, instruments and basic institutional supportsfor regional economic integration.
The other major decisions adopted at the forty-third Council Session focused on the precise mechanism of economicintegration to be elaborated by CMEA countries, given theongoing reform process in key members. Although therewas apparently broad agreement on the need to revise keyelements of planning and monetary and financial co-operation, members were divided on a number of critical economic issues, including the introduction of a form of limitedregional convertibility, the revision of the price-settingmechanism and the role of capital movements withinCMEA. Some members continue to stress that a solution tothese integration problems should be worked out primarilythrough the customary dovetailing of plans and the streamlined central command system that have been at the heart ofpast efforts directed towards advancing economic co-operation. In this connection, the Council Session also sought to
reinvigorate the economics of inter-firm relations and thepivotal need to invest such relations with economic guidancerules and institutional instruments to facilitate management,including management in the sphere of settlement of accounts for selected transactions. This appears to apply inparticular to the products emanating from selected scientificand technological co-operation efforts made within theframework of the Comprehensive Programme to Promotethe Scientific and Technological Progress of the MemberCountries of the Council for Mutual Economic Assistanceup to the Year 2000, adopted in December 1985.
Some members are apparently hoping to provide selecteddirect enterprise relations with a limited type of convertibility: the relevant transactions would presumably be confinedto the most important inter-firm relations established underthe provisions of the Comprehensive Programme; convertibility would be restricted to intra-regional transactions(Hungarian forint against Bulgarian leva, but not levaagainst United States dollars) and the envisaged variant ofconvertibility would be introduced gradually, perhaps over aperiod of 10 years. The majority ofCMEA members agreedto move ahead vigorously with establishing direct relationsamong firms from different countries and decided to put inplace some critical indirect supports to facilitate such transactions. The first bilateral agreements on introducing regional convertibility for selected exchanges were signedearly in 1988 by the Soviet Union with Czechoslovakia andapparently with Bulgaria also. 68
Finally, the Council Session called for improvements inthe traditional areas of co-ordination of economic plans andindeed to support direct business relations among firms atthe regional level. This is a familiar statement, signallingthat the policy debate on the prospective course of socialisteconomic integration is far from over at this juncture. Giventhe sheer size of the Soviet economy in CMEA relations,what happens to reforms in the Soviet Union is bound toexert considerable pressure for modifications in CMEA as awhole.
Conclusions
There are a number of similarities and differences between the multifaceted reform processes in China and theSoviet Union. Among the similarities, five stand out. Perhaps the overriding common element is the desire of policymakers to mobilize the resourcefulness, knowledge and initiative of economic agents through devolution of decisionmaking. These can be mobilized only if the proper incentives for both managers and labour are put in place. At thesame time, the central planning agencies have to be reinforced in selected functions, including those related to structural change and medium-term to long-term developmentstrategies. Responsibility for day-to-day activities devolves
more and more upon individual firms, sometimes in combination with medium-level associations of businesses.
Secondly, it is now realized in virtually all reformingeconomies, particularly in the two selected for detailed discussion here, that such decentralization can succeed only intime, after putting in place a full-scale, comprehensive andintegrated economic mechanism. Because key elements ofthe indirect policy instruments, the supporting institutionsand particularly the macro-economic policies to guide decisions of household and firm in the desired direction are stillrudimentary, gradualism and frequent adjustment of reform
68 Rude Pravo (Prague), 4 March 1988, p. 1. A useful backdrop to the convertibility debate is provided by G. Rybalko, "Konvertabelnost rubliapovestke dnia", Ekonomicheskaya gazeta (Moscow), No.9 (1988), p. 20, and V. Valek, "Hodnoceni prvnich zkusenosti", Svet Hospodcirstv£(Prague), No. 25 (1988), p. 1.
118

policies and intentions will be required during the transitionphase.
Thirdly, both economies enjoy a substantial degree of policy autonomy, given their size and resource base. Yet bothhave undertaken reforms explicitly with a view to bolsteringsignificantly their involvement in international economic relations. These efforts have not just been confined to the traditional trade and financial links . They also call for setting inmotion the process of foreign direct investment, joint ventures and other forms of international economic co-operation, including co-operation with and in market economies.
Fourthly, policy makers in both economies have embarked on economic reforms that, within a short period oftime, were stymied by the obstacles emanating from theweak environment inherited from their highly centralized ormodified centralized models. The underdeveloped monetary and fiscal systems affected particularly the scope fordovetailing decentralized decision-making. Both economiesare aware of the critical role of prices (including wage andbonus rates, interest and exchange rates and other scarcityindicators). However, transforming the pricing systems sothat they can effectively support micro-economic decisionmaking without giving rise to substantial adjustments in relative prices and income inequalities that may be dysfunctional has been much more arduous. The greatest obstaclesto economic reforms, from both economic and othersources, emanate particularly in connection with the completion of the economic mechanism that is anchored to indirect economic co-ordination. It is here that fundamental social and political precepts tend to come into play and theyusually slow down or even inhibit reform.
Finally, features shared by virtually all reforms are theconsiderable degree of incompleteness of reform blueprintswhen put in place, marked underestimation of the difficulties bound to crop up during implementation and palpablewavering in complying with reform intentions, whatever theobstacle.
Some of the differences stem from the very different nature ofthe economies of the two countries, including level ofdevelopment, geographical dimension, population pressure,support found abroad, managerial skills and disposition towards changing long-standing ideological commitments. Asfar as the reforms per se are concerned, the main differencesare described below.
First, Soviet reforms (and virtually all earlier Eastern European experiments) have stressed the transformation of themanagerial sphere, particularly in manufacturing, as thecore of the initial reform movement. In China, the focus ofinitial reforms since 1978 was agriculture and rural activitiesgenerally; since 1984, it has shifted gradually to reform ofthe industrial sector, pricing and distribution.
Secondly, Chinese reforms have matured at a time ofbuoyant economic growth, after a decade of stagnation at alow level of economic development. In fact, the circumstances in which the reforms matured can only be describedas chronically overheated. For the past several years, Chinahas been one of the few countries in the world where policy
makers have tried to curb the buoyancy of economic activityand yet ended up with a much faster pace of expansion thandesired, largely on account of the inability of central policymakers to guide decisions. The result has been rapid growth,including growth in personal incomes, at the cost of seriousimbalances that will have to be faced directly in the years tocome. Soviet reforms and the ongoing experiments in Eastern Europe are in part attempts to come to grips with thefundamental conditions that have led to a long-term declinein the pace of growth and to chronic domestic and externalimbalances. Reform requires technological innovation andmodernization, which have been hampered in the Soviet Union by inadequate links between research and development,on the one hand, and production and distribution, on theother. In China, the resources for technological innovationand modernization were simply not available domestically.
Thirdly, from the very start it was estimated that modernization in China would have to depend extensively on theimportation of foreign technology and capital and measureswere put in place in two phases to facilitate foreign directinvestment and boost export earnings. Export earningsboomed in the early 1980s on account of the felicitous gainin oil export revenues. But growth in exports and continuedreform of the foreign trade and finance systems have continued to be pivotal concerns of ongoing reforms. In the SovietUnion, reform has had to proceed in the face of weak exportearnings and the lingering effects of deep-rooted East-Westtensions, which have only recently shown signs of abating.It has also suffered because of decades of neglect of linksbetween domestic and foreign sectors and because enterprises lack experience in marketing their products abroad.
Fourthly, the Soviet Union committed itself to revisingvery thoroughly key instruments, policies and institutions ofthe economic mechanism, even though it has been encountering difficulties in turning these commitments into practical measures and implementing them. Although Chinesepolicy makers at times pay lip-service to the need to tackleall those elements also, their actions over the years to liberalize pricing in the broad sense and to complete the macroeconomic policy infrastructure have been piecemeal, basedon trial and error. This is largely because of practical political difficulties, not ideological obstacles. Such obstacles appear to be more fundamental in the Soviet Union. This mayin part be explained by the fact that the highly centralizedeconomic system of the Soviet Union evolved as a homegrown response to the felt need to bring about the plannedsocialist economy; in China, as in all of Eastern Europe, themodel was to a large extent imported; there is, therefore,perhaps less commitment to it in China than in the USSR.
Finally, in foreign economic relations the prospects andsituations ofChina and the Soviet Union differ considerably.For example, China has found the East-West political andsecurity climate much less antagonistic towards reform thanthe Soviet Union; it trades chiefly in convertible currencies,whereas about half of Soviet trade is with CMEA partners intransferable roubles and a substantial share of trade with developing countries continues to be on clearing account; andit has been very successful in conquering markets for labourintensive manufactures, particularly textiles, in contrast
119

with. Soviet reforms, which aim at bolstering the export ofmedIUm-level technology, for which the appropriate infrastructure is required.
The similarities and differences mentioned above showthat, for both China and the Soviet Union, and for otherplanned economies committed to reform on a wide scalemeasures to provide for an orderly transition from the oldeconomic mechanism to a new one that is as yet incomplete~y defined will be at the centre of reform efforts duringthe fmal years of the decade. Concrete and unambiguousresults of the ambitious economic reform in the Soviet Union, ~n particular, are not likely to become transparent until~elllllto the 1990s, when the interrelated problems of price,fmance and material and factor supply will have been tackled a?d, .it is hoped, resolved. In the meantime, the gradualphasmg.m of the components of reform may impose shortterm adjustment costs or even impede the full validation ofnew indicators of a firm's success. Similarly for China, continued reform is contingent on success in urban industriesand on improving significantly the macro-economic policiesto guide decisions of both firms and households.
120
The.economic initiative at the core of the reform philosophy will not be the only way of improving the economy, butone of many which will include marked improvements intechniques of management and control. The most importantfactors in ensuring success with the reforms will be persistence and the political will of the leadership to remove ambiguities and outright distortions in the implementation of ref?rm measures, to streamline and strengthen reform regulatIons and, at the same time, to guard against continuouschanges in the rules of the game detracting from the mainobjective, which is to put economic decisions on a solid econ~mic footing. The experiences of Eastern European countnes may be sobering in this respect. In addition to the com~i!ment ofpo.licy makers, a major effort is required to mobIlIze the actIve support of the population for economicreorganization, even in the wake of the initial uncertaintiesabout availability of goods, job security, prices, labour incomes based on productivity and related factors and to overcome the resistance to reform of those whose social standing, privileges and influence the reform may jeopardize.

Chapter VII
THE EXTERNAL AND FISCAL IMBALANCES OF DEVELOPEDCOUNTRIES: CAUSES AND EFFECTS
The huge external payments imbalances of the leading developed market economies have become a dominant worldeconomic concern. The conditions that gave rise to theseimbalances have deeply affected the well-being of developing countries-to a greater extent than the developed countries-and the way in which these imbalances are resolvedover the next few'years will exercise a large influence on theeconomic growth of developing and developed countriesalike.
Previous issues of the World Economic Survey have examined the development of these imbalances and some of theireffects. \ This chapter presents an overview ofthe subject, inpart to identify the developmental implications of actionsand measures that frequently have had primarily short-termobjectives. The chapter traces the evolution of the imbalances, examines their effects on the development process, reviews measures to remedy them, and investigates thepossible effects of these corrective measures on the worldeconomy.
The imbalances in question are essentially the large balance-of-payments current account surpluses of the FederalRepublic of Germany and Japan and the current account deficit of the United States. These imbalances present a problem because their absolute size means that they are an important element in world trade and global financial flows. Thereis less international concern about a number of other countries that have external imbalances of a similar magnitude inrelation to their exports or gross national product. On theother hand, the three major imbalances have now reachedsizeable proportions even in relation to these two comparators, despite the size of their economies (see table VII. 1).Their size relative to their domestic economies makes thenecessary correction that much more difficult from a domestic point of view.
It has to be recognized, however, that attainment of perfect balance in each country's current account is probablynot possible and certainly not desirable as a policy objective,particularly in the short term. The present concern is therefore not with imbalance per se. but rather with the magnitude, nature and pattern of the imbalances. The current imbalances are considered to be too large and too long-lastingand to be inconsistent with the desirable long-term pattern ofinternational capital flows, whereby surplus capital in richercountries should be used to finance investments in poorercountries. These difficulties with the present imbalances imply that the objective of policy makers should be to reducetheir size and longevity and change their pattern, but notnecessarily to eliminate them.
The need to reduce the imbalances is reinforced by the factthat both Governments and financial markets have come to
doubt whether the large external deficit of the United Statescan be sustained. While there is no definition of a "sustainable" deficit, it would seem that, under present-day circumstances, at least three conditions must be met for a currentaccount deficit to be sustainable: first, a large part of thesource of financing of the deficit should be voluntary; secondly, that part financed by official credit should not involvemajor policy changes in the deficit country; and, thirdly, thedeficit should not give rise to sharp fluctuations in currencymarkets, interest rates, trade policies and capital flows.These conditions are no longer met in the case of the presentUnited States' deficit.
The large-scale deterioration in the external balance of theUnited States dates from 1983. In 1987, the current accountdeficit amounted to $161 billion (see table A.IIU2). Thishas been mirrored in the rising surpluses among other developed market economies, particularly the Federal Republicof Germany and Japan (see tables A.m.1O and A.m.ll);they have been joined in more recent years by Hong Kong,the Republic of Korea and Taiwan, Province of China (seetable A.IIL6).
Limited signs of reversal in some of these trends becameapparent in 1987. However, the scale and pace of the neededadjustment are still very large and consequently the way inwhich the adjustment is managed is critical for the world atlarge. This is for two reasons. The first is the absolute size ofthe United States as an exporter and as a market for othercountries. The United States accounts for about one eighthof world trade; an increase in exports or reduction in imports of the magnitude required to restore the United States'balance of trade would have a sizeable direct bearing onother countries' export opportunities. Such a reduction inthe United States' imports in order to improve its externalbalance would, unless offset by expansionary policies elsewhere, reduce external demand and weaken economic activity in the rest of the world's market economy.
The second reason why the management of the UnitedStates' current account deficit has international significanceis the large and growing volume of dollar-denominated debtheld by foreign investors and central banks (see table IV.5).As the dollar is the principal reserve currency, the UnitedStates has been able to contract debt in its own currency tofinance its external deficits. If, however, its large currentaccount deficits continue, external debt will increase at arapid rate, particularly since bulging interest payments willaccelerate the process. Under such circumstances, foreigners are likely to become increasingly reluctant to add totheir stock of dollar assets and, at some point, fear of furtherdollar depreciation could precipitate a large and sudden netoutflow of financial assets from the United States. Such aloss of confidence would also be extremely damaging to
See, in particular, World Economic Survey 1987 (United Nations publication, Sales No. E.87.11.C.I and corrigendum), pp. 41-47.
121
Table VILI. Current account imbalances' in relation to gross nationalproduct and exports for the developed market economies andselected groups of developing countries, 1980-1987
(Percentage)
1980 1982 1984 1985 1986 1987b
As a share ofgross national product
Developed market economies"d -0.8 -0.3 -0.7 -0.6 -0.2 -0.3of which:
Germany, Federal Republic of -1.7 0.8 1.5 2.7 4.3 4.0Japan -1.0 0.6 2.8 3.7 4.4 3.7United States 0.1 -0.3 -2.8 -2.9 -3.3 -3.5
As a share ofexports ofgoods and services
Developed market economiesof which: 3.4 -1.3 -3.3 -2.8 -0.8 -1.6
Germany, Federal Republic of -7.3 2.8 5.6 9.1 15.8 15.2Japan -8.2 5.0 20.6 27.8 40.7United States 0.8 -4.1 -49.2 -54.6 -65.1
Fifteen heavily indebted developingcountries -18.3 -35.6 -1.0 0.1 -12.1 8.1
Sub-Saharan African developingcountries (excluding Nigeria) -28.2 -33.4 -12.8 -11.6 -17.8 -24.7
East Asian exporters of manufactures -13.1 -2.5 8.4 12.0 20.8 19.4
Source: Department of International Economic and Social Affairs of the United N~tions Secretariat, based onOEeD, Economic Outlook, No. 42, December 1987; IMF, World Economic Outlook, October 1987; and other officialnational and international sources.
a Including official transfers.
b Preliminary estimates.c Figures for developed market economies as a group are those of IMF (i.e., they exclude Greece, Portugal and
South Africa).
d GDP (instead of GNP) is used for all countries other than the Federal Republic of Germany, Japan and the UnitedStates in the calculation for the developed market economies as a group.
trade financing and other, longer-term borrowing and lending for which the dollar is used extensively by third partiesoutside the United States. The subsequent turbulence in financial markets could bring about the often-mentioned"hard landing" for the dollar. A likely response by theUnited States' authorities would be to tighten the moneysupply. The heavily indebted developing countries wouldthen be faced with an escalation in interest rates, eventhough the value of the dollar-denominated component oftheir debt would fall. More generally, the sharply shiftingexchange rates and interest rates would adversely affect realeconomic activity world-wide.
Such turbulence may be avoided if the policies of the leading developed market economies are seen to be moving theirexternal accounts into more sustainable balance with each
other. There are serious doubts, however, whether theactions taken so far are sufficient for this purpose. Manyquestion whether the dollar exchange rate has depreciatedenough. Equally, it remains an open question whether thefiscal measures adopted to date in both surplus and deficitcountries are sufficient to restore a better balance betweendomestic demand and output in each of those countries. Finally, there is not yet adequate recognition that the restoration of capital flows from, the surplus developed marketeconomies to the developing countries constitutes a necessary element of any comprehensive solution to the presentimbalances. The remainder of the chapter elaborates on theevents that caused this situation to arise, its effects and thecrucial policy choices that it now poses for the world community.
Origins and course of the external imbalances
The external imbalances prevailing among the major developed market economies have their origins in the differentmacro-economic policies pursued by these countries fromthe early years of the decade. These gave rise to divergencesamong countries in the rates of growth of domestic demandand to a sweeping appreciation of the dollar exchange rate.Together these movements pushed external payments balances increasingly out of equilibrium. Though the externalsurpluses and deficit grew to huge magnitudes, the general
122
thrust of fiscal and monetary policies in the different countries continued largely unaltered until early 1987; adjustment was mainly confined to the depreciation of the dollarthat took place in financial markets after 1985.
At the outset of the 1980s, the major developed marketeconomies largely shared the same broad economic ideasand aims. Theiroverriding immediate concern was to bringan end to the accelerating inflation of the late 1970s. Tight

control of the money supply was seen as the principal instrument for achieving this objective. For the longer run, theirviews were dominated by the wish to limit and reduce therole of the State in economic life: lower tax burdens and lessregulated markets were seen as key conditions for more stable growth.
Despite these broadly shared views, the fiscal policies ofthe United States and the other major developed marketeconomies diverged widely in practice. In the United States,first priority was given to the reduction of taxes and legislation introduced in 1981 authorized major tax cuts in threesuccessive years beginning in 1982. However, these cutswere accompanied by an increase in government expenditure, including increases in defense expenditure, one argument in favour of the tax cuts was that the ensuing budgetdeficit would ease the political task of restraining the growthin government expenditure. Another argument was themuch publicized supply-side contention that lower taxeswould stimulate output and income to such an extent that losttax revenue would soon be recouped. In the event, theUnited States did subsequently enter a period of recoveryand sustained growth that has been exceptional in its length,but it was accompanied, until 1986, by ever-increasingbudget deficits.
In Western Europe and Japan, a different approach to fiscal policy was adopted. Budget deficits in most of thesecountries had reached substantial proportions in the later1970s and their Governments gave high priority to reducingthem. This was Viewed not only as an anti-inflationarymeasure, but also as a step towards containing the rise ofpublic expenditure relative to gross national product and,eventually, towards lowering tax burdens. In Western Europe in particular, the reduction of the budget deficit wasseen as an integral part of a broader medium-term strategy torestore growth in non-inflationary conditions. The dominantview was that the root cause of the accelerating inflation andrising unemployment of the 1970s lay in supply-side rigidities, particularly of wages. It was felt that, because of theserigidities, expansionary fiscal policies failed to elicit greateroutput but rather pushed up prices. Rising wage and othercosts were viewed as lowering the profitability of investment, and inadequate investment gave rise to growing unemployment. Some observers argued that fiscal deficitswere considered to aggravate the situation because they putupward pressure on interest rates and "crowded out" newinvestment. Since the initiation of policies designed to overcome these problems, budget deficits in Western Europehave been reduced significantly. Rates of economic growth,however, have generally remained lower than in the mid tolate 1970s and the very high levels of unemployment havepersisted.
The consequence of these differences in fiscal policies between the United States and the other developed marketeconomies was divergent rates of growth in domestic demand. This was sharply higher in the United States thanelsewhere, notably the Federal Republic of Germany and
Japan, during the period of recovery in 1983 and 1984 (seefigure VII.1) and led to a faster rate of increase in demandfor imports by the United States than by other developedmarket economies (see table VII.2).
Table VII.2. Growth of real domestic demand,real gross national product,exports and imports in theFederal Republic ofGermany, Japan and theUnited States, 1980-1986
(Annual average percentage rate of change)
Realdomestic Export Importdemand Real GNP volume' volume'
Federal Republic ofGermany
1974-1979 2.6 2.4 4.6 5.31980-1982 -1.2 0.2 5.5 0.81983-1986 2.3 2.4 3.9 3.5
Japan1974-1979 3.0 3.7 9.2 3.91980-1982 1.9 3.7 12.3 0.21983-1986 3.4 3.9 5.6 2.4
United States1974-1979 2.4 2.6 6.8 4.71980-1982 -0.5 -0.3 0.7 -1.61983-1986 5.3 4.1 1.2 12.0
Source: OECD, Economic Outlook, No. 42 (Paris, December 1987),tables Rl, R8, R9 and RIO.
a Goods and services.
There was much less divergence among the developedmarket economies in their monetary policy. The late 1970sand early 1980s was a period when the more rigorous interpretations of monetarist theory were at their most influentialamong central banks. Stress was laid on the control of monetary aggregates as a determinant of the rate of increase inoutput or, if unemployment had fallen below its non-inflationary level, of prices. The avowed aim of policy was tobreak inflationary expectations in financial markets by control of these aggregates. In practice, however, the monetarytargets of central ,banks were honoured more often in thebreach than in the observance and the notion of automaticrules for the growth of monetary aggregates lost sway fairlyquickly. Nevertheless, the credibility of monetary policy asan anti-inflationary measure has at no time been seriouslyquestioned in any of the major countries. 2 As a result, monetary policy has tended to be non-accommodating, particularly in the first half of the 1980s. Moreover, judged by thebehaviour of interest rates, the monetary policy pursued bythe United States at the beginning of the 1980s was morerestrictive than elsewhere. Interest rate differentials between the United States and the other major economies be-
2 See K. Clinton and J. Chanaqui, Monetary Policy in the Second Halfofthe Nineteen Eighties: How Much Roomfor Manoeuvre? OECD Working Papers, No. 39 (1987).
123

Figure VIL1. Domestic demand in EEC, Japan and theUnited States
(1980 = 100)
130 -,-------------------------:1.128
126
124
122
120
118
116
114
112
110
108
106
104
102
100 I-t-\I;~k.
98
96 -r-.--......-.-".....-"":;:--,---,,.....--.---,---,,.....--,-.,--,.....--,--,---,,.....--,-.,--......,.-,--.--.-.--J
1980 1981 1982 1983 1984 1985 1986 1987
o EEe + Japan o United States
Source: GEeD, Economic Outlook, various issues.
came very wide and remained strongly pOSltive, eventhough they fluctuated in response to changing credit conditions as the United States economy swung upward (see figure VII.2).
The expanding demand for savings in the United States (inpart to finance the fiscal deficit-see box VII. 1), the higherinterest rates in that country, the large and diversified natureof its financial market and the continuing international deregulation ofcapital flows combined to produce large capitalflows from the Federal Republic of Germany and Japan tothe United States, generating a strong demand for dollars inforeign exchange markets. This demand for dollars exceeded the supply made available by the surplus of UnitedStates imports over its exports, with the result that the dollarexchange rate appreciated (see figure 11.1), cheapening imports and raising the price ofexports. These changes in relative prices reinforced the effects of the divergences amongcountries in the rates of growth of domestic demand. In thefirst half of the 1980s, therefore, the system of floating exchange rates was one of the factors that appears to have con-
124
tributed to the persistence of the external imbalances amongthe developed market economies.
From the last quarter of 1982 to mid-1984, there was arecovery and upsurge of domestic demand in the UnitedStates. In the three years that followed, macro-economicpolicies in Japan and Western Europe dId little to reverse thedivergence in the growth of demand. In line with their medium-term strategies, fiscal policies in the Western European economies remained restrictive. In addition, at leastuntil early 1985, the inflationary effects ofcurrency depreciation were quoted as a reason for monetary restraint. Inflation was aided initially by weak world commodity prices andsubsequently by the positive effects of appreciating currencies, reinforced by lower oil prices. Consumer prices roseslowly in both the Federal Republic of Germany and Japanin 1984 and 1985 and recorded near zero or negative changesin 1986 (see table A.IIL3). Despite low inflation, steadygrowth in the United States and the rising profitability ofinvestment, the revival of investment in Western Europethat was expected by advocates of supply-side policies wasnot forthcoming. As a result, the growth of demand in these

Figure VII.2. Difference between interest rates' inthe Federal Republic of Germany, Japanand the United States, 1980-1987
(Percentage points)7,.---------------------------.,
1980 1981 1982 1983 19M 1985 1986 1987
o Difference between the United States and the Federal Republic of Germany
+ Difference between the United States and Japan
Source: IMF, International Financial Statistics, various issues.a Yield on long-term government bonds.
,countries lagged behind output until 1986 (see table VII.2)when, partly in response to falling oil and other commodityprices, its relative growth accelerated.
The most significant change between 1984 and 1986 wasnot in fiscal or monetary policies but in the dollar exchangerate (see table IV.6). Having risen to 259 yen and 3.32deutsche marks in February 1985, the dollar began alengthy, downward readjustment. The leading developedmarket economies-motivated partly by concern about rising protectionist pressures-later gave official support to thedownward shift in the Plaza Accord of September 1985. Itwas understood at the time that the depreciation would nothave any early effects on the current account deficit, thoughno one then foresaw how delayed and muted the responsewould be. The United States' external deficit continued togrow but, despite a depreciating dollar, it was matched overmost of the period by a continued and spontaneous inflow of
125
private capital. Indeed, it was because of this continued capital flow into the United States that the descent of the dollarwas comparatively slow and smooth.
In the realm of domestic policies, 1987 was notable as theyear in which long-debated shifts in demand managementpolicies began to be tentatively and partially translated intopractice. The largest change was in the United States fiscalbudget. Following adoption of the new rules for budgetarynegotiations laid down in the Gramm-Rudman-HollingsAct, the projected budget deficit for fiscal year 1988 wasreduced by $30 billion. At the same time, somewhat morestimulatory or less restrictive fiscal policies were adopted inthe Federal Republic of Germany and Japan. For the firsttime in several years, the growth of output in the UnitedStates outpaced that of domestic demand. In the surpluscountries, the pattern was the opposite; in Japan, domesticdemand rose strongly.

The realization of more co-ordinated demand management policies was one of the points of agreement expressedin the Louvre Accord of February 1987. The Accord also setout the official view that the major external imbalanceswould begin to yield to correction within a framework ofstable exchange rates. However, the confidence of financialmarkets in official policies ebbed when the will to make further adjustments in fiscal policies appeared weak and astrade imbalances continued to mount (despite some improvement in volume terms). To maintain stable exchangerates, large-scale intervention by central banks became necessary. Interest rates in the United States also crept up. Asthe rise in interest rates coincided with a speculative surge instock prices, the yields on stocks and bonds increasingly diverged. This, in turn, was a factor behind the October convulsion in stock markets. Immediately afterwards, there wasa breakdown of the exchange rate stability embodied in theLouvre Accord and a resumption of the adjustment process
through a further realignment of exchange rates. The earlymonths of 1988 saw some partial recovery and stabilizationof the dollar exchange rate as a result of central bank intervention and evidence of progress in managing the UnitedStates trade deficit, but these gains inthe value of the dollarproved to be temporary.
The result of these developments since early 1985, and.-particularly since early 1987, is that both the divergences in-fates of growth in domestic demand and the shifts in exchange rates that were the main causes of the external imbalances among developed market economies have been reversed. However, the pattern of imbalances has been affected to some degree by other factors, such as shifts in theoil market, 3 the export drive of several East Asian countriesand the debt crisis and its aftermath. In addition, there is thelarger question of whether the current and prospective policy measures and present exchange rate alignments will assure a sufficient contraction in external imbalances.
Box VII. I. The relationship between fiscal and external deficits
The gyrations of domestic and international financial markets in 1987 caused increased attention (and a large amountof responsibility) to be assi ..;ned to the United States federalbudget deficit. This continuing domestic deficit is widelyperceived to be a direct cause of the United States' deficit onthe current account of the balance of payments, itself thesource of many of the wide fluctuations in financial variables.
The chain of causality between fiscal deficits and currentaccount deficits is not as straightforward as is sometimesimplied. Most developed market economies have had fiscaldeficits more often than surpluses, but this has not manifested itself in a parallel series of trade deficits. Until 1985,for example, Japan tended to have a large fiscal deficit, butnevertheless managed to achieve consistent trade surpluses.
The missing link that explains this dichotomy is the levelof total domestic savings (comprising savings by households, firms and the Government") and its relationship to theprevailing levels of domestic investment and governmentexpenditure. If savings by households and firms exceed private investment, the surplus can be mobilized by the Government to finance any excess of its expenditure over itsreceipts. If, however, there is no surplus of private savingsover investment, a government deficit has to compete forresources, on either the home or the international market.
The result could be a decline in domestic investment, withno direct impact on the country's foreign transactions. Alternatively, domestic investment might remain unchanged and
the increase in the budget deficit could be financed by aninflow offoreign capital, reflected in a deficit on the currentaccount of the balance of payments. Neither theory nor empirical evidence provide a definitive answer as to which ofthese mechanisms has prevailed in practice in the UnitedStates in the 1980s: it would be reasonable to assume thatboth have been in operation to some degree.
A further complication is that some economists argue thatan increased government deficit (public dissaving) will induce a correspondingly larger amount of savings by the private sector, so that a deficit will not create a net additionaldrain on the resources available for investment and othercompeting uses; others dispute this view. The empirical evidence on the cause and effect relationship between budgetdeficits and private savings is ambiguous. In the UnitedStates in the early 1980s, private savings decreased while the "budget deficit increased, that is, the private sector did notincrease savings to offset the public sector's dissaving, butthis may have been attributable to any of a wide variety offactors other than the behaviour of the fiscal deficit.
The decline in private savings in the United States hasbeen one factor contributing to the change that has takenplace in the 1980s in the relationship between the savinginvestment balances in the Federal Republic of Germany,Japan and the United States. In all three countries, domesticinvestment as a share of gross national product has tended tobe lower than it was in the 1970s (see the table). The declinewas most marked in Japan, where the booming investmentactivity of the 1970s-stimulated partly by the oil shocks-
a Government savings arise when tax and other revenues exceed expenditures.
3 The fall in oil prices has benefited the Japanese trade balance, while the rise in dependence on imported oil supplies has worsened the UnitedStates balance.
126

has faded. Domestic saving rates have also slipped in allthree countries, but they have consistently been greater thandomestic investment rates in the Federal Republic of Germany and Japan. In the United States, in contrast, the savings rate exceeded the investment rate in the 1970s, but hasfallen below it in the 1980s.
One reason for the lower savings rate in the three countries between the 1970s and the 1980s has been a decline inthe proportion of income saved by households. For social,institutional and economic reasons, household savings havelong been relatively high in Japan. Contrary to the common
impression, however, it is in Japan that the rate appears tohave fallen most since the 1970s. In the United States, therehas been a long-term downward trend-going back to the1950s-in the proportion of income saved by households. b
Even the increase in interest rates in the early 1980s had littleeffect on household savings and over the past four years,there has been a sharp downward shift: personal savings wassome 7 per cent of personal disposable income in the firstquarter of 1984 but had fallen below 3 per cent by the lastquarter of 1987, aggravating the recent worsening of thesaving-investment balance.
Saving, investment and the current account balancein the Federal Republic of Germany, Japan and the
United States, 1974-1986
(Percentage of GNP')
GeneralGross Gross government Current
domestic domestic financial accountsavings investment balanceb balance
Federal Republic of Germany
1974-1979 22.6 20.8 -3.0 1.01980-1982 21.2 20.9 -3.3 0.91983-1986 21.6 20.1 -1.7 2.1
Japan
1974-1979 32.8 31.8 -3.3 0.31980-1982 30.8 29.3 -3.9 1.81983-1986 30.7 28.0 -1.9 3.2
United States
1974-1979 19.8 18.7 -1.2 0.01980-1982 17.6 18.1 -1.9 -1.51983-1986 16.6 18.0 -3.4 -2.6
Source: GECD, Historical Statistics 1960-1985 (Paris, 1987), tables 6.8 and 6.17 and GECD, Economic Outlook,vol. 42 (Paris, December 1987), tables R13 and R20.a Data are arithmetic averages of the annual ratios.b There is an element of double-counting in these figures, especially for the Federal Republic of Germany and Japan,
because the general government balance includes public investment. This does not, however, distort the change overtime in the overall relationship between savings arid investment for each country.
Notwithstanding these changes in private savings, a moreimportant reason for the weakening of total savings relativeto investment in the United States and the opposite in theFederal Republic of Germany and Japan lies in the behaviour of public saving. The dissaving of Government rosesharply in the United States from the 1970s to the 1980s, butit moved strongly the other way in the Federal Republic ofGermany and Japan. As noted above, in all three countries,the Governments that held power at the onset of the 1980sshared a common intent in wishing to reverse the upwardtrend in the share of public revenue and expenditure in national income. In the Federal Republic of Germany and Ja-
pan, this took the form of strenuous efforts to reduce thesizeable budget deficits that had been inherited from the1970s. In the United States, first priority was given to cuts intaxes rather than to the containment of expenditure.
Set on these divergent tracks, the saving-investment balances of the three countries have evolved in different ways.The Federal Republic of Germany and Japan have tended togenerate more savings than have been absorbed by domesticinvestment, and the United States has done the opposite. Thelatter generated a demand for savings which the former werewell placed to meet.
b See L. Summers and C. Carroll, "Why is US national savings so low?" Brookings Papers on Economic Activity, 1987.
127

Effects of the external imbalances on theinternational economic environment
Any assessment of the performance of developed marketeconomies during the 1980s has to give pride of place totheir success in moderating the pace of inflation within theirown countries. At the turn of the decade, rates of inflationthat were high by the standards of the previous three decadeswere impeding the growth of these economies, most notablybecause of the various negative effects they were having onfixed investment. To the extent that the imbalances withinand among the developed market economies are a result ofefforts to reduce inflation and to the extent that these effortsare considered to have had salutory effects, it can be saidthat the imbalances have contributed to the developmentprocess in those countries. It alsohas to be recognized thatthe development of the external imbalances has been accompanied by an exceptionally long and sustained period of expansion in these countries which, although slow by thestandards of the previous two decades, has been the mostimportant component of the growth of the world's marketeconomies for the past five years.
It is also difficult to demonstrate that an imbalance, in andof itself, has negative consequences for the developmentprocess in either developed or developing countries. Indeed,a fiscal deficit can be beneficial to growth within an economy, while an external deficit stimulates growth in the country's trading partners. Both of these effects have been apparent in the development ofthese two deficits in the UnitedStates.
Nevertheless, the combination of policies which won thegains achieved in the 1980s and which produced the imbalances was also instrumental in creating an internationaltrading and financial environment that has been damaging tothe economic performance of most developing countries.For these countries, the three consequences of these policiesthat have had the most immediate and general effects havebeen the weakness in world import demand (and thereforethe slower growth of the developing countries' export volumes), ,the decline in primary commodity prices and highinterest rates.
Other consequences can be traced directly to the imbalances themselves, but their precise impact is more difficult to specify. First and foremost among these repercussions are the large fluctuations in financial variables thathave been experienced, particularly in the second half of thedecade. Exchange rates have displayed the greatest volatilityin this period, but interest rates and the prices of financialassets have also fluctuated more than in previous years. Inpart, these developments can be attributed to the deregulation of international capital markets. The overall impact ofthe increased variability that has occurred is difficult to
quantify,4 but it seems clear that economic dynamism hasbeen stifled by the increased uncertainty that has developed.More tangibly, the hardening of protectionist attitudes canbe ascribed to the difficulties of some of the deficit countriesand, now that adjustment is beginning to take place, to someof the changes that will have to take place in the surpluscountries.
Effects on trade in primary commodities
Exports of primary commodities have been affected intwo main ways by the economic conditions that surround theexternal imbalances of the major developed market economies. The first effect has been on the prices of primary commodities and the volume demanded; the second has been onthe distribution of world demand for primary commoditiesamong regions. Exchange rate realignments and, to a lesserextent, high interest rates have also affected primary commodityexports.
The weakness of primary commodity prices has been asalient feature of the 1980s. Their downward trend since1980 has been interrupted only by a temporary recovery in1983-1984, a brief upturn in early 1986 and the signs of another possible recovery at the end of 1987 (see figures III. 1and 111.2). While the weakness in prices has several sources,a significant reason, especially affecting industrial raw materials, has been the slow growth of domestic demand in thedeveloped market economies as a group.5 The weakness inthe prices of industrial raw materials during the 1980s waslargely attributable to the fact that the industrial output of thedeveloped market economies as a whole persistently fellshort of potential. The industrial production of these countries rose at an annual rate of only 2.3 per cent between 1980and the third quarter of 1987; for the Western Europeancountries, the rate of increase was only 1.1 per cent annually.
Apart from the effect of the weakness in global demand onprices of primary commodities, it has been significant fordeveloping countries that the main sources of the demanddeficiency during most of the 1980s were Western Europeancountries and Japan. These countries are much more dependent than the United States on imported supplies and accountfor more than 80 per cent of the exports ofprimary commodities from the developing regions. The slow growth of Western Europe during the 1980s has had particularly adverseimplications for sub-Saharan Africa, because it is not onlyhighly dependent on exports of primary commodities butalso closely linked to Western European markets.
From the point of view of supply, efforts by debtor countries to increase export earnings in order to meet increased
4 For an examination of the effects of increased variability of exchange rates on international trade, see World Economic Survey 1986 (UnitedNations publication, Sales No. E.86.II.C.I), p. 99 and P. De Grauwe, "Exchange rate volatility and the slowdown in growth of internationaltrade", IMF Working Paper 87/38, 22 May 1987,
5 For a fuller analysis of the recent factors affecting primary commodity prices in recent years, see chapter III above and previous issues of theWorld Economic Survey, in particular World Economic Survey 1985 (United Nations publication, Sales No. E, 85 .II.C, I ), chap. III,
128
interest payments were often counter-productive. Since demand for primary commodities is usually inelastic with respect to price, increased production by several countries simultaneously added to the downward pressure on prices andresulted in lower revenues than initially envisaged.
Exporters of primary commodities have also been affected by the major currency realignments that have takenplace in the 1980s. The large shifts in exchange rates amongthe major currencies have provoked adjustments in demandand supply in individual commodity markets and havebrought losses or gains for individual countries according tothe different currencies in which their exports, imports andexternal liabilities are priced. Since prices of primary commodities are set mostly in dollar or sterling markets, achange in the exchange rates among the major currenciesalters the local currency price of primary commodities inthose countries whose currencies are not tied to the dollar orsterling. For developing countries whose exports are soldpredominantly in dollars but whose imports are drawnmainly from other countries, the appreciation of the dollar inthe first half of the 1980s meant an element of improvementin their terms of trade, partially offsetting any deteriorationresulting from a decline in the dollar price of the commodityitself. For these countries the subsequent depreciation of thedollar has amounted to a deterioration in their terms of tradeand has compounded the decline in the price of primarycommodities that continued until 1986.
The oil-exporting countries provide an example of theway in which exporters of primary commodities have beenaffected by the interactions between demand, price and theexchange rate. The price of oil is quoted in dollars. Oil became more expensive, and has subsequently becomecheaper, for importing countries whose currencies followedthe general pattern of first depreciating and then appreciating against the dollar as the 1980s progressed. The initialprice increase helped to curtail demand and the more recentlower price, if passed through to consumers, should stimulate consumption. 6 However, the depreciation of the dollarhas coincided with a decline in the dollar price of oil, addingto the severity of the contraction in export revenue whichthese countries have been experiencing since 1986. The decline in export earnings resulted in a commensurate cut inthe import demand of the energy-exporting countries. Thiswas a major reason why the stimulus to real domestic demand and output expected in the developed market economies during 1986 from the fall in oil prices failed to materialize.
These various effects on commodity prices are difficult totrace since they will vary from commodity to commoditydepending on their price elasticities, the market shares ofdifferent countries and the importance of imports and exports within countries. Moreover, substantial adjustments indemand and supply are likely to take place only if the currency realignment is expected to be relatively permanent.There is little empirical evidence to permit assessment of theeffects of recent changes in exchange rates on the revenuederived from primary commodity exports.
A final effect of the policies of the developed market economies on commodity markets was through interest rates.The higher interest rates of the early 1980s increased thecosts of inventories, held for either strategic or strictly economic reasons; this had a once-and-for-all effect of dampeningdemand.
Effects on trade in manufactures
The effects ofthe conditions giving rise to the huge external imbalances on exports of manufactures have been twofold. First, as with trade in primary commodities, the divergences among the developed market economies in the ratesof growth of their domestic demand have provided somedeveloping countries with more buoyant export marketsthan others. Secondly, trade has been threatened by a hardening ofprotectionist attitudes.
The strong upsurge of domestic demand in the UnitedStates between late 1982 and mid-1984· and its continued expansion thereafter presented a buoyant market for thosecountries which were exporters of manufactures, notably.those of Latin America and East Asia. Among the LatinAmerican countries, the need to generate large trade surpluses to meet debt service payments added urgency to theexpansion of exports, and successive real devaluations oftheir exchange rates against the dollar were employedthroughout the period to stimulate exports.
Among East Asian countries, the strong performance ofexports of manufactures was not reinforced by exchangerate depreciation until 1986; real effective exchange ratesfor these countries remained stable in most of the prioryears. The main reasons for the growth of their exports havebeen their relatively advanced and diversified industrialstructure, their ability to absorb new technologies and theirstrongly export-oriented policies. Of particular importancehave been the extensive links forged with corporations in theUnited States and elsewhere which have been eager to takeadvantage of these countries' capabilities as reliable andcheap sources of supply. These relationships have taken theform of affiliates established by transnational corporationsin the countries concerned and large-scale sub-contractingof the production of final products and their component partsto independent companies in those countries. The nature ofthese relationships means that the resulting trade has beenaffected relatively little by the modest changes in real exchange rates that have taken place between the dollar and thecurrencies of East Asian countries recently.
As a result of their export performance, the East Asiancountries have acquired large and growing surpluses in theirbalance of payments on current account (see table A.IIL6).These have become a significant component of the globalsurpluses which are the counterpart to the United States deficit. The recent accumulation of surpluses has enabled theRepublic of Korea-which was among the most heavily indebted developing countries in 1982-to begin repaying theprincipal on its outstanding debt. The largest surplus in thisgroup is that of Taiwan, Province of China, which has regis-
6 For a more complete analysis, see World Economic Survey 1987 (United Nations publication, Sales No. E.87.1LC.1 and corrigendum), box ILl.
129

tered a huge increase in its foreign exchange reserves; thesenow stand second only to Japan's in size.
For the exporters of manufactures as a group, the mostgeneral concern arising out of events in the 1980s has beenthe strengthening of protectionist sentiment in the developedmarket economies. Governments in these latter countrieshave resisted many of the demands for more protection, butthe list of protective measures has nevertheless grown (seechap. III above). Developing countries have usually lackedthe bargaining strength needed to defend themselves againstthreatened protectionist steps. Particularly vulnerable havebeen the marginal, new suppliers of the products-such astextiles-with which most countries begin their career as exporters of manufactures.
The reasons for the strength of protectionist sentiment inthe developed market economies in the 1980s are high levelsof unemployment in Western Europe, the socially painfulcontraction of "sunset" industries, the existence of excessindustrial capacity in the face of deficient demand, and thestruggle for technological leadership in new industries. Inthe United States, however, these tensions have been exacerbated by that country's growing external trade deficit. Thestagnation of the United States' export industries during thefirst half of the decade and the intensified foreign competition faced by its import-competing industries have given riseto pressures that are an important part of the political dialogue today.
Effects on the transfer of resources to developing countries
The circumstances that gave rise to the external imbalances among developed market economies profoundly altered the external financial environment for developingcountries, particularly those that are heavily indebted. Interest rates soared in the early 1980s and thereafter declinedonly slowly from their high level (see figure VII.3); at thesame time, the rate of growth ofexport earnings fell sharplyand generally recovered only weakly. It was this transformation of the external environment that largely triggered thedebt crisis.7
Despite some easing of these difficult external conditions,the debt problem remains unresolved. Moreover, it is clearthat the process of accumulating the imbalances and that ofunwinding them are not symmetrical. The costs that somecountries, particularly the indebted developing countries,incurred (and are continuing to incur) as a result of the circumstances surrounding the build-up of the imbalances willnot be offset by equivalent gains when the process is reversed. For example, the lower nominal interest rates thatnow prevail in world markets have reduced the present bur-
den of debt service. However, this cannot compensate forthe losses of income and output, or for the dramatic slowdown in investment, that were occasioned by the high levelofexternal payments made earlier in the decade. Nor does iteliminate the additional debt that was accumulated whensuch payments could not be made or the long-term negativeconsequences of the decline in investment.
During the 1970s, accelerating inflation virtually put anend to long-term loans at fixed rates of interest; in theirplace, the banks devised the instrument of revolving, medium-term, variable interest loans. This allowed the extensive re-lending of current account surpluses of the energyexporting countries to the energy-importing developingcountries. However, it also shifted onto the shoulders ofborrowers the whole of the risk arising from any change in monetary conditions .. When, in the early 1980s, the developedmarket economies adopted the control of inflation as theirfirst priority and rigorously tightened their monetary policies, the indebted developing countries were faced withsteeply increased nominal interest rates. At the same time,the global recession, induced by the anti-inflationary policies, sharply reduced their export earnings (see table III.l).Thereafter, nominal interest rates declined only slowly andthe recovery in export earnings was weak, with the resultthat the debt situation has shown little improvement.
There are several possible explanations for the high,though declining, nominal interest rates in the developedmarket economies over most years since 1980. For example,it has been argued that there was a "crowding-out" effect,that is, that, in competing with private investment for available private saving, the budget deficits in the developed market economies, particularly in the United States, were onecause of the upward pressure on interest rates. 8 As a demandcomponent, the rising budget deficits were an influentialfactor, but it seems apparent that monetary policy and theinflationary expectations oflenders played the leading role.When monetary policy was rigorously tightened at the turnof the decade to arrest inflation, interest rates rose to highlevels. The important role of monetary policy and expectations cannot, however, completely dismiss the role of thefiscal deficits in raising interest rates and thereby having animpact on indebted developing countries. Even if the deficitinduced component of the increase in interest rates has beensmall, it will have had a sizeable short-term impact on thedebt-servicing obligations of indebted countries9 and,through this, on their development process.
Recently, fear of a reactivation of inflation and inflationary expectations has dominated monetary policy. This fearhas been fed, among other things, by concern that the highlevels of public and private indebtedness might, at somepoint, cause central banks to increase the liquidity of the
7 In 1983, IMF reported that, "for the oil importing developing countries, the entire deterioratIon of their combined current account balance from1978 to 1981 can be ascribed to three adverse factors [reduced export volumes and prices, increased import prices and higher interest rates]".IMF stated that the "key consideration here is the generally unfavorable nature of the external economic and financial environment faced bythese countries in recent years and the importance of certain major adverse influences almost wholly beyond their own contro]" (IMF, AnnualReport (Washington, D.C., 1983), p. 34). See also World Economic Survey 1983 (United Nations publication, Sales No. E.83.II.C.1), chap.
8 Deepak Lal and Sweder van \i\fijnbergen, "Government deficits, the real interest rate and LDC debt", European Economic Review, vol. 29,No.2 (November 1985).
9 It is estimated that a 1 per cent rise in the interest rate on their debt costs the developing countries at least $5 billion annually in debt servicf;.
130

Figure VII. 3. International interest rates, 1980-1987(Percentage)
19.,--------------------------,
18
17
16
15
14-
13
12
11
10
9
8
7
6
1980 1981 1982 1983 1984 1985 1986 1987
o London Inter-bank Offered Rate (LIBOR) on six-month dollar deposits
+ Rate on special drawing rights. This is a weighted average of short-terminterest rates in France, the Federal Republic of Germany, Japan, theUnited Kingdom and the United States
Source: IMF, International Financial Statistics, various issues.
system. In addition, private investors have appeared unconvinced that the decline in the rate of inflation would last andhave adjusted their interest rate expectations only slowly.Conditioned by the experience of the late 1970s, any movement towards relaxation of monetary policy has been cautious. As a result, real interest rates have remained high.
The high nominal interest rates in the developed marketeconomies in the early 1980s were an integral part of theprocess that gave rise to the imbalances, but it is significantthat these rates have remained high in real terms (see tableVII.3). The declining trend in nominal rates has not beenmatched by falling real rates because nominal rates havelagged behind the declining rate of inflation. These high interest rates tend to discourage investment in physical capitalin both developed and developing countries, thereby slowing the development process around the world. Low levelsof investment reduce the current level of economic activity,
131
make the global adjustment process more difficult and impose a constraint on growth in the future.
Investment in developing countries has also been slowedby the lethargic nature of resource transfers to developingcountries. The macro-economic policies of the developedmarket economies have also had a direct and adverse effecton official flows to developing countries, because efforts toreduce the growth of fiscal outlays have influenced the volume of development assistance provided by some countries.In addition, the increase in interest rates gradually affectedbilateral official loans to developing countries, as well asthose ofthe multilateral financial institutions, so that the costof official borrowings increased along with that of commercial credit.
It was not until 1987 that there was a perceptible decline inthe ratio of interest payments to export earnings for the

Table VII.3. Long-term real interest rates" in theFederal Republic of Germany, Japan andthe United States, 1973-1987
(Percentage)
FederalRepublic United
of Germany Japan States
1973-1979 2.8 -0.7 -0.5
1980-1982 4.7 5.5 3.9
1983-1987 4.2 4.8 6.7
Source: DEeD, Historical Statistics, 1960-1985, GEeD, Main economic Indicators, January 1988; and IMF, International Financial Statistics, March 1988.
a Yield on long-term government bonds less percentage change in grossnational product deflator.
countries that are heavily indebted to private lenders (seechap. IV). 10 (It did not take place in sub-Saharan Africawhere debt is mostly official debt at fixed rates of interest.)However, other debt indicators-such as the ratio of outstanding debt to exports-have failed to improve and theimprovement in the servicing ratio has done little to relax thestrains imposed on the domestic economies of these countries by the inescapable need for tight import compression.
These developments partly explain the rapid reversal during the 1980s of the previous net transfer of resources fromdeveloped to developing countries. ll As indicated in table
IV.2, there was a transfer of some $40 billion annually fromthe developed to the developing countries at the beginning ofthe 1980s. In 1987, there was a net transfer of financial resources from the developing to the developed countries ofmore than $21 billion. Nor was this a temporary phenomenon: the reverse flow of resources has continued uninterrupted since it emerged in 1984 and, in the absence of afundamental breakthrough regarding developing countrydebt or some other major advance in international economicrelations, it will continue on a large scale until well into thenext decade. During the 1980s as a whole, the positive flowsof more than $90 billion during the early years will be substantially outweighed by the negative flows from 1984 to1990.
This period of negative net transfers to developing countries has coincided with the burgeoning capital inflows intothe United States that have been the counterpart of that country's trade deficit. The United States has, in effect, beendrawing on world savings, particularly those of the FederalRepublic of Germany and Japan. Such a situation-wherebyone of the more affluent countries absorbs a large volume ofresources for an extended period of time-not only contradicts economic logic and economic history, but would alsobe viewed by many as inequitable. Even if there has been nodirect "crowding-out" of financial flows to developingcountries by the budget deficits in the developed marketeconomies, the outcome has been similar: the fiscal deficitshave been financed, while net financial flows to developingcountries have been negative for the past four years.
The correction process
There has been some, albeit slow, progress towards reduction of the United States trade deficit since the dollarbegan to depreciate in February 1985. Despite the depreciating exchange rate, importers into the United States havebeen hesitant in raising their dollar prices, evidently preferring to reduce their profit margins and to cut costs than to seetheir share of the market contract. Similarly, exporters fromthe United States have not used the opportunity of the depreciation to increase their dollar prices, apparently preferringto reduce their prices in foreign markets in order to restoretheir sales position abroad. These reactions have accentuated the familiar lags in the adjustment of the amounts oftraded goods demanded and supplied to changes in local currency prices.
The effects of the depreciating dollar on trade balancesbegan to appear around the end of 1986. During 1986 as awhole, the volume of United States' exports was about 7 percent higher than in 1985, while the volume of its imports wassome 14 per cent higher. In 1987, however, export volumerose by more than 10 per cent, while imports increased by
less than 5 per cent. Export prices in dollars changed littleduring the year, but import prices increased by more than 6per cent. The value ofexports and imports accordingly grewat a roughly similar pace, but the trade balance widened to$161 billion (from $142 billion in 1986) because imports aremuch larger than exports.
In the area offiscal policy, the United States federal deficitfell from its record of $221 billion in fiscal year 1986 (whichended in September of that year) to $148 billion in fiscal year1987, bringing it down to 3.3 per cent of gross national product. This reduction was partly under the impetus of theGramm-Rudman-Hollings Act but it also owed a good dealto other, more transitory factors. 12 The cuts agreed upon forthe fiscal years 1988 and 1989 are much more modest. Leaving aside asset sales (whose receipts are not saving out ofcurrent income), the deficit in fiscal year 1988 is to be reduced by $30 billion (which is not much more than the mandatory minimum of $23 billion specified in the Gramm-Rudman-Hollings Act). In fiscal year 1989, the reduction will be$42 billion. These cuts will reduce the structural deficit of
10 Besides interest rates and export earnings, the ratio is also affected by depreciation of the dollar since interest payments are mostly in dollarswhile some export earnings are in currencies appreciating against the dollar.
11 A major reason for the reversal is the retrenchment in commercial bank lending to developing countries; the slow-down in net credit flows fromthe multilateral financial institutions has also contributed (see chap. IV above).
12 There were temporary gains in revenue occasioned by the transition to the new rules and rates applicable under the Tax Reform Act of 1986;there were sales of assets, a non-recurring source of revenue; and the economy grew more strongly than expected.
132

the Federal Government by only 0.4 per cent of gross national product over two years.
For its fiscal year 1987 (which ends in March 1988), Japanadopted a supplementary budget involving additional publicspending amounting to about 0.5 per cent of gross nationalproduct. It has also been stated that public enterprises,which are excluded from the general government budget,will be extensively utilized to stimulate domestic activity.For fiscal year 1988, policy is again expected to be expansionary. The guidelines issued to ministries for preparationof the budget indicated a shift away from a restrictive approach and a tax reform bill approved in September 1987contains cuts in direct taxes. The effects of the tax reformpackage are expected to raise gross national product in 1988by 1 to 1.5 per cent. 13
The Federal Republic of Germany has laid particularstress on the reduction of budget deficits during the 1980s.Fiscal policy, however, was mildly expansionary in 1987 asa consequence of tax cuts, and it is expected to be so again in1988. Nevertheless, the effect on total domestic demand todate has been small. Real domestic demand grew by about2.5 per cent in 1987 and real output by 1.5 per cent. Themain source of the weakness in real domestic demand hasbeen the low rate of growth in fixed investment, which roseby only 1per cent in 1987 and is not expected to increase bymore than 1.5 per cent in 1988. Investment is sluggish inlarge measure because of the stagnation of the export sector(which accounts for one third of gross national product).The fiscal stimulus (about 0.3 per cent of gross nationalproduct in 1987) was too small to offset the deflationaryeffect of currency appreciation. In 1988, the growth of demand is forecast to be somewhat lower. Further, on the basisof recent policy pronouncements, fiscal policy is expected tobe neutral in 1989. In view of the weak performance of theeconomy, many have argued for an advancement of the taxcuts scheduled to be introduced in 1990.
Trends and policies in the Federal Republic of Germanyare influential in setting limits to the policies which can bepursued in other countries ofWestern Europe. This is bothbecause of its importance as the largest trading nation withinWestern Europe and because its financial policies directlyaffect several other countries through their common links inthe European Monetary System. Experience has shown thatexpansionary policies in other countries are likely to encounter difficulties if they are inconsistent with the policystance of the Federal Republic of Germany. For the WesternEuropean countries as a group, fiscal policy was, on average, slightly contractionary in 1987 and is expected to remain broadly so in 1988. Both France and the United Kingdom, two of the other large economies in the region, havebeen experiencing increasing deficits on their current ac"counts; this would normally be expected to discourage a further expansion of fiscal policy.
Are further measures necessary?
Discussions about the sufficiency of the adjustments madeso far generally focus on exchange rates and the rates ofgrowth in demand relative to output in the leading developedmarket economies. The exchange rate and import policies ofEast Asian countries have also been questioned recently. Athird range of issues concerns the pattern of internationalcapital flows and the role of developing countries as recipients and as markets for United States exports._
Exchange rate realignment
Despite the evidence that there has been a reversal in thepast trends in United States' exports and imports, it is unclear whether-within the framework of current policies andexchange rates-the change has been sufficient to improvethe United States current account balance adequately withinan acceptable period of time. The question arises because ofthe scale and the speed of the improvement that is called for.Since imports were more than 60 per cent larger than exports in 1986, exports have to grow at a considerably fasterrate than imports if the deficit in the trade balance is to bereduced at any significant speed. The task is made more difficult by the fact that external indebtedness grows and debtservicing increases with each year of deficit. Consequently,the trade balance has to improve by more than the increase indebt service payments if there is to be a reduction in thecurrent account deficit. Ofgreater concern is the fact that, inthe absence of a speedy narrowing of the current accountdeficit, foreign investors could become increasingly reluctant to accumulate more dollar assets.
By the end of March 1988, the real effective exchange rateof the dollar had depreciated by more than a third from itspeak in February 1985 and was slightly below its level of1980. The official view expressed in the first four months of1988 was that the dollar had fallen far enough; the relativecompetitiveness of United States tradable goods was seen assufficient to restore reasonable balance in foreign trade.Some econometric exercises support this point of view butothers suggest that some further depreciation may be neededif balance is to be restored by the early 1990s. 14
A simple way of presenting the problem and of illustratingthe uncertainties that surround judgements about the exchange rate starts from the fact that the current account ofthe United States was more or less in balance in 1980. 15 Thiswas consistent at the time with a deficit in the trade balanceequivalent to about 1 per cent of gross national product(since net investment income sufficed to offset the trade deficit). However, if the current account is to be restored tobalance in the future, a surplus will have to be recorded inthe trade balance in order to cover net investment payments;it has been estimated that these could amount toO.5 per cent
13 IMF, World Economic Outlook (Washington, D.C., September 1987).14 See, for example, Stephen Marris, Deficits and the Dollar: The World Economy at Risk (Washington, D.C., Institute for International Eco
nomics, 1987); Martin Feldstein, '~t the mercy of investors: economic forecasts 1988", Financial Times, 4 January 1988; and R. Dornbusch,in a paper presented to a conference organized by Business International (see The Economist, 23 January 1988, p. 66).
15 See William Branson, "Discussion on Reaganomics", in Economic Policy: The Conservative Revolution: A Special Report (Cambridge, Cambridge University Press, 1987).
133

of gross national product. Thus, the real effective exchangerate would have to fall below its 1980 level sufficiently toimprove the tracle balance by about 1.5 per cent of grossnational product. One estimate shows that a 13.5 per centreal depreciation improves the trade balance by about 1 percent of gross national product,16 implying that a further depreciation of 15 to 20 per cent might be required before theearly 1990s in order to restore balance.
Several qualifications to this reasoning suggest that thisestimate of the required depreciation may be an understatement. Income in the United States has grown more than inother developed market economies, so that its relative income level has risen since 1980. Some economists alsomaintain that consumer preferences in the United States
. have shifted in ways that favour imported goods. On theproduction side, there is evidence of a secular decline in theUnited States trading position because other countries havebeen catching up technologically and relative productivitieshave changed. 17
On the other hand, the above line of reasoning, as well asmost econometric models, estimate the depreciation necessary to restore complete balance in the current account bythe early 1990s. However, the depreciation called for becomes more modest if only a narrowing of the deficit is required. The condition in this case is that foreign investorsremain willing, at the prevailing exchange rate, to purchasedollar assets so that the deficit continues to be financed.Whether this condition is likely to be fulfilled depends heavily on private investors' perception of risks.
Fiscal policies and the saving-investment balance
In addition to the adjustment of exchange rates, it is essential that the leading deficit and surplus countries adjust theirrates of increase in domestic demand relative to output. Thisis primarily a matter of adjustments in fiscal policies to alterdomestic saving relative to domestic investment. The shortterm effects on external balances of feasible changes in demand may be minor by comparison with changes in exchange rates. Simulations by OECD indicate that, over aperiod of one or two years, a 10 per cent devaluation of thedollar would have substantially larger effects on the tradebalance than any likely accompanying changes in demand. 18Nevertheless, failure to make the needed adjustments in demand will diminish the effectiveness of exchange ratechanges. If the United States economy is to release the output needed to increase net exports, a relative contraction indomestic demand has to occur, particularly since the economy is currently operating at comparatively high levels of
capacity utilization and employment. 19 Further, since theUnited States plays such a large part in world trade, the contraction in its external demand emanating from a depreciation of the dollar transmits a significant deflationary impulseto its trading partners. Offsetting action has to be taken bythe surplus countries if aggregate demand in the world economy is not to suffer.
The fiscal measures taken so far have gone some way towards meeting these short-term concerns. However, thecorrection of the external imbalances demands the progressive adjustment of saving-investment imbalances over thenext several years. Changes that can modify the saving behaviour of households are slow acting and necessarily haveto be regarded as long-term measures.
Other fiscal action can have a more immediate and predictable effect on total savings within an economy. Thereare, for example, several fiscal and institutional reformswhich could stimulate household expenditure in the FederalRepublic of Germany and Japan and some action has beentaken. 20 In the United States, however, attempts to modifythe savings behaviour of households have been more limited. For example, there were attempts during the discussions of tax reform legislation to raise the cost of housemortgages and other consumer borrowing to their marketrates by depriving interest payments of their tax deductiblestatus, but these efforts failed.
Capital flows
The key concern for the international community is howthe external deficit of the United States will be financed inthe future. As the amount of outstanding dollar-denominateddebt has grown, foreign investors have become increasinglyreluctant to accumulate more. The more doubtful they become about the prospects for elimination of the deficitwithin a few years, the greater the risk of a sudden loss ofconfidence in the dollar. This could precipitate an upheavalin financial markets that could breed global recession. This,in turn, could be a factor pushing more indebted developingcountries into default.
The scale and rapidity of the recent change in the externalassets and liabilities of the United States has been enormous.At the beginning ofthe 1980s, the United States' net externalassets were larger than those of any other country in theworld. Subsequent heavy net borrowing reversed the statusof the country from net creditor to net debtor: its net indebtedness to the rest of the world stood at roughly $400 billionby the end of 1987 (see table IV.5). Although the two figures
16 R. Dornbusch and J. A. Frankel, "Macroeconomics and protection" in US Trade Policies in a Changing World Economy, R. M. Stern, ed.,(Cambridge, MIT Press, 1987).
17 P. R. Krugman and R. E. Baldwin, "The persistence of the U.S. trade deficit", Brookings Papers on Economic Activity, 1 (1987). According toFeldstein, op. cit., "trends in American and foreign productivity and tastes require the real value of the dollar to fall at least 2 to 3 per cent ayear just to maintain a trade balance once it is established" .
18 OEeD, Economic Outlook, December 1987.19 If a relative contraction were to happen spontaneously-say, because of a slowing growth in consumer expenditure-the need for action would
be temporarily delayed, but only till recovery took place.20 A tax reform bill passed by the Diet in September 1987 virtually ended substantial tax privileges enjoyed by small savers on their interest in
come. In the Federal Republic of Germany, a 10 per cent withholding tax on interest income will be introduced in 1989.
134

are not directly comparable,21 this is roughly equivalent tothe total indebtedness of all the countries in Latin America.
The external imbalances ofthe United States and the otherleading developed market economies will not diminishquickly. The present current account deficit of the UnitedStates amounts to over 3 per cent of its gross national product (see table VII. 1), and a return close to equilibrium therefore implies large adjustments in both domestic expenditureand domestic production. The proportion of the gross national product spent on domestic consumption and/or investment has to contract by approximately 3 per cent and thedomestic resources engaged in the production of exports andsubstitutes for imports have to rise by about the same proportion. The experience of the heavily indebted countries inthe 1980s indicates that such a switch is manageable onlyover several years. Even in such a highly flexible economyas the United States, the process is likely to be a lengthy one.Moreover, a condition is that, in the interim, there will continue to be a net·inflow of capital to finance the current account deficit.
In the earlier years of the increasing current account deficit of the United States, some part of its financing came froma reduction in foreign lending by United States banks, butthe main source was the upsurge in private capital flows,particularly from Japan. Much of this capital was channelledinto purchases on the United States securities market, notably purchases of United States Federal Government securities.
The large-scale accumulation of dollar-denominated assets by foreign private investors was based on their expectation that the total return which they would obtain from theseassets would be greater than that which they could earn onequivalent assets at home. On short-term assets, this meantthat the difference in interest rates between the United Statesand the foreign investors' home country had to be more thansufficient to compensate for any expected depreciation ofthe dollar. In the period before March 1985, higher interestrates in the United States were reinforced by an appreciatingdollar (see figure ILl). Since March 1985, however, anyshort-term expectations of a stabilization or recovery of thedollar have not been realized most of the time, althoughlonger-term fixed interest securities (as well as shares) haveoffered the possibility of capital gains for investors who believed that interest rates in the United States would decline.From mid-1984, the United States bond market entered alengthy period of declining interest rates and rising capitalvalues and, though the spread between United States andforeign rates progressively declined, the total expected return on United States securities appeared to be more thansufficient to offset expectations of further depreciation of .the dollar. As a result, over half the United States currentaccount deficit during 1985 and 1986 was financed by long-
term capital flows. An important contributory factor was thelarge-scale participation of Japanese financial institutionsplacing surplus Japanese funds: these institutions were disposed to put a substantial proportion of their funds in longterm United States assets.
By early 1987, the downward trend in United States interest rates appeared to have bottomed out, while the LouvreAccord only temporarily allayed fears that the dollar wouldfall further. The inflow of private capital diminished, becoming negative in some months, and financed less than 60per cent of the United States current account deficit in thefirst six months of 1987." In order to maintain the dollar inline with the intentions expressed in the Louvre Accord,central banks had to intervene heavily on foreign exchangemarkets, with the result that a substantial proportion of theUnited States current account deficit in 1987 was financedby official capital transactions (see chap. IV above).
Despite the attempt in the Louvre Accord to stabilize theexchange rate, the dollar has fallen to lower levels. Interestrate differentials have not changed markedly and it remainsto be seen whether, at the new dollar exchange rate, foreigninvestors will resume the accumulation of dollar-denominated assets on a scale sufficient to finance the current account deficit. Some investors already have large stocks ofdollar-denominated assets in their portfolios and will facelosses on any further depreciation. To increase further theshare of dollar assets in their portfolios would be to enlarge
.their exposure to the risk of more depreciation. The sameholds true for the non-United States central banks whichhave already intervened heavily to stabilize exchange rates;their reluctance to acquire more dollar-denominated assets isbound to be greater now than it was in early 1987.
Another aspect of the present imbalances is the need for aredirection to developing countries of the capital outflowsfrom the surplus developed market economies that currentlyflow predominantly to the United States. As indicatedabove, the. present pattern of flows conforms neither witheconomic rationale nor with general perceptions of globalequity. Such a redirection of some part of the present surpluses among the developed market economies is not inconsistent with the need to address the United States' currentaccount deficit. An increase in the developing countries'capital inflows would allow them to increase their imports;some of these imports would come from the United Statesand contribute to a reduction in that country's trade deficit.Japan has recently been taking positive steps to redirect partof its surplus to the developing countries and actions takenby the international community to increase the flow of official multilateral funds will also assist. However, developingcountries that are indebted to private capital markets cannotexpect a recovery of private capital flows as long as theirdebt crisis remains unresolved.
21 These official figures underestimate the current value of external assets of the United States, primarily because foreign direct investment, thelargest single category of external asset, is based on the book value of assets, not market values. Book values are likely to be significant underestimates of the market value of foreign assets since many of the underlying investments were made many years ago. Gold holdings are also notvalued at current market prices.
22 GEeD, Economic Outlook, December 1987.
135

Narrowing ofthe imbalances: thepossibilities and their effects
It is inescapable that the prospective financing of theUnited States current account deficit will be resolved insome way. It is also clearly the wish of Governments to accomplish a managed resolution of the problem. If the UnitedStates' current account deficit is seen to be contracting, private investors may become convinced that the exchange ratefor the dollar will remain stable, at least in the short term.Under these circumstances, an inflow of capital sufficient tofinance the deficit may be achieved with only modestlyhigher interest rates in the United States.
If, however, international measures and domestic fiscaland monetary policies fail to reduce the United States' current account deficit with reasonable speed, the erosion ofconfidence could precipitate massive international capitalmovements and a further depreciation of the dollar. Exchange rate stability might be achieved only through a sharprise in interest rates in the United States, reinforced by theexpectation of domestic price increases ensuing from anydepreciation. However, interest rates themselves will impinge directly on the narrowing of the deficit through theireffect on the net outflow of service payments from theUnited States. As a result, both expectations regarding inflation and confidence in monetary policy will, because of theireffect on interest rates, play an important role in the way theimbalances are reduced.
A rise in interest rates could curtail domestic spending,particularly if falling bond prices spread to other assetprices. For the other leading developed market economies, arenewed depreciation of the dollar and reduced domesticspending in the United States would further hurt their exportsectors. Among developing countries, the consequencescould be particularly severe for the heavily indebted countries which would encounter higher interest rates and reduced export earnings.
There is also the possibility that the continuing Japanesetrade surplus, whatever its size, will not be matched by anoutflow of capital. In this case, further appreciation of theyen would ensue, reducing domestic output and income andthereby bringing domestic savings more into balance withdomestic investment. Clearly, a deflationary approach ofthis nature is undesirable from the point of view of both Japan and other countries.
The broad objectives of the exchange rate realignmentsand fiscal measures implemented since 1985 are to avoidsuch adverse outcomes and to reduce the imbalances bymeans of expenditure-switching, both among and withincountries. In the case of the United States, the objective hasto be to move domestic demand away from imported goodstowards domestically produced goods and towards the production of exports, and vice versa for the surplus countries.Particularly in the light of the major adjustments that are inprogress in many other countries, both developing and centrally planned, it is difficult to specify the precise impact ofsuch expenditure-switching on economies other than thosethat will be directly involved. The trickle-down and multi-
plier effects on other countries will depend on the linkagesof the expenditure-switching countries with the rest of theworld, in particular on the sectors of their economies thatare affected and on those sectors' dealings with the rest ofthe world.
The major concern has to be with the possible consequences of a slow-down in the external demand of theUnited States. Such a slow-down is likely to be broughtaboutin part by fiscal contraction designed to reduce thebudget deficit and in part by the decline in United States'imports that is likely to be produced by the depreciation of
• the dollar. The main sources of United States' imports areCanada, Japan, the South-East Asian economies, LatinAmerican countries (particularly Mexico) and, to a lesserextent, individual Western European countries. It is thesecountries that will be most affected by a reduction in theUnited States' external demand.
Canada usually suffers disproportionately from a deceleration in the United States, but the next instance may be theexception. Importantly, the Canadian dollar has not appreciated against the United States dollar to the same extent asmost of the other major currencies, so that price effects willbe less. Meanwhile, economic growth in Canada is currentlyrobust and may be sufficient to offset a negative externalshock. In addition, Canadian-United States trade should bestimulated by the gradual entry into force of the free tradeagreement that was agreed with the United States in December 1987. At the micro-economic level, the United Statesautomobile industry, which is an important beneficiary ofthe depreciation of the United States dollar, should continueto be a major market for Canadian exports.
Other exporters to the United States seem unlikely to fareas well. In the case of Japan and Western Europe, evidenceindicates that exchange rate realignments have already had adeleterious impact on the volume of exports to the UnitedStates. Sinc~exports account for a relatively large proportion of gross domestic product in these economies, the negative consequences of their decline are likely to be sizeableunless offset by an expansion of other components of demand.
Despite the heavy dependence of thelr exports on theUnited States market, the South-East Asian economies haveso far suffered little from United States' efforts to improveits trade balance because, until 1988, their currencies appreciated less than others against the dollar. To the contrary,they have experienced a depreciation vis-a-vis most of theother major currencies, particularly the yen. This has servedto stimulate their exports, both to the countries concernedand in third markets where they compete with exports fromJapan and Western European countries. As noted above,however, this advantageous position has enabled these exporters to generate huge current account surpluses and toaccumulate large foreign exchange reserves. Their successin export markets has now given rise to pressure for an upward valuation of their currencies and a liberalization of
136

their imports. The sensitivity of these economies to a general slow-down in the industrial countries has been documented elsewhere;23 the implementation of the proposedmeasures to reduce their current account surpluses wouldamplify this negative effect.
The Latin American countries are likely to be affectedmore adversely than those in Asia from any slow-down inimport demand from the United States. Earlier in the 1980s,the exports of many of these countries, particularly some ofthe major debtors, benefited from theUnited States' expansion. More recently, they have encountered some resistanceto the continued increase in their exports to the North American market, with the result that any further decline inUnited States' imports seems likely to have a disproportionately adverse effect on the countries in the region. Depressed export earnings would in turn aggravate these countries' debt-servicing difficulties and reinforce the negativeinfluence that these are having on their economies and ontheir imports fr9m the rest of the world.
The objective of the major developed market economies isto offset these negative consequences of a slow-down in theUnited States by a policy-induced acceleration in WesternEurope and Japan. Even if the stimulus in these countries,however measured, is equal to the contraction in the UnitedStates, the distribution of its effects is likely to differ. Anincrease in the demand for imports by Japan, for example,will be particularly beneficial to the countries of South-EastAsia and will offset the probable set-back to their exports tothe United ,States. These countries may also benefit, although to a lesser extent, from accelerated growth of domestic demand in Western Europe.
The major external beneficiaries of an expansionary fiscalpolicy in certain Western European economies are likely tobe other countries within that group, particularly with theefforts being made to introduce a single market within theEuropean Economic Community by 1992. Increased economic co-operation between Western Europe and the centrally planned economies would enable the latter to benefitfrom the expansion of the former. Successful implementation of the structural adjustment efforts now under way inAfrica should place those countries in a better position toexploit the increased export opportunities that would arisefrom a stimulation of the Western European economies.Latin America, on the other hand, does not have strong economic ties with Europe, so that the acceleration in WesternEurope is unlikely to offset the effects that the slow-down inthe United States would have on the region.
These general patterns will be modified· by the sectoralpattern of the expansion and contraction that takes place inthe expenditure-switching countries. Among the developedmarket economies, for example, there are mixed efforts toreform the widespread system of agricultural subsidies.Some movement in this area, albeit politically sensitive,could be an ingredient of some of the fiscal measures thathave to be implemented in the adjusting countries. The e1im-
ination or reduction of subsidies on agricultural productswould be one means of reducing the domestic budget deficitsof the developed market economies, but would also raise theworld price of agricultural products. This would be to thebenefit of those producers that would be viable at the higherbut unsubsidized price, but would impose a cost on importing countries. These include some of the centrally plannedeconomies, as well as many of the developing countries.
Other measures would have a similarly differentiated effect. For example, it is widely felt that a part of the responseby Japan to its present savings-investment imbalance shouldbe to increase investment in housing. Construction has a lowimport-intensity and the only sizeable international spillovereffect in such a case might be an increased demand for timber, domestic appliances and similar items. Similarly, a reduction in defence expenditure by the United States Government, while reducing the fiscal deficit, would have little direct effect on the trade balance or on the economies of therest of the world.
A revival of iy,ternational capital flows to the developingcountries has to form part of an orderly solution to the problem of reducing the prevailing imbalances among the devel-
. oped market economies. The channelling of surplus savingsfrom the large creditor countries to the developing countrieswould enable the latter to increase their imports and somepart of this increased import demand would be met by largerexports from the United States. The current account surpluses of the leading developed market economies would bemirrored less in the deficit of the United States and more inthe deficits financed by capital flows into developing countries. This would conform more closely with the reasonableexpectation-borne out by most historical experience-thatcapital should flow from the economically more matureeconomies to the more recently developing countries.
Having emerged as the fotemost capital exporters in theworld, the Federal Republic of Germany and Japan have anenhancedrole to play in the revival of capital flows to developing countries. The reversal of the net transfer ofresourcesto the developing countries has occurred largely because of,the collapse of commercial bank lending and the escalationof debt service payments. For the majority of developingcountries, a revival of commercial lending would not be anappropriate means of responding to their need for increasedfinancial resources. The quest must therefore be for increased flows of official development finance. Such flowshave not grown appreciably during the 1980s (see chap. IV).The countries that currently have large surpluses on theirbalance of payments can lead the way in reviving flows ofofficial development finance (as some of the energy-exporting countries did at the time of their large surpluses), but theresponsibility should not be theirs alone.
For its part, the Government of Japan has already indicated that the recycling of its external surplus is to be one ofthree key points of its future international economic co-operation. Another point is the promotion of comprehensive
23 Susan M. Schadler, "Effect of a slow-down in industrial economies on selected Asian countries", IMF StajfPapers, vol. 33, No.2 (June 1986),p.345.
137

co-operation that combines economic assistance and directinvestment to the developing countries with import expansion from them. The third point is not only to increase ODAbut also to improve its quality.
A Japanese plan for recycling a total of $30 billion into thedeveloping countries was introduced at the IMF-World Bankmeeting in December 1986. In May 1987, the Governmentof Japan announced specific measures to increase its economic co-operation with the developing countries. In thispackage, Japan proposed the recycling of an additional $20billion over the following three years. It also accelerated theprevious plan to double ODA by 1992 so that it will double in1990 (from $3.8 billion in 1986).
"The first plan to recycle $10 billion involved loans of SDR
3 billion to IMF, the establishment ofthe Japan Special Fund(JSF) at the World Bank, and a contribution to the InterAmerican Development Bank (lOB) and the African Development Bank (AtDB). The second plan (for recycling a further $20 billion) includes the setting up of a fund similar toJSF in both lOB and the Asian Development Bank (ADB),granting permission to the World Bank to raise private fundson the Tokyo market (about $8 billion), providing loansthrough the Overseas Economic Co-operation Fund (OECF)and undertaking co-financing with multilateral institutionssuch as the World Bank through OECF, the Export-ImportBank (EIB) and private banks (about $9 billion), and providing direct untied loans through EIB (about $3 billion). Thislatter $20 billion is intended to come from private investorsin Japan through the purchase of bond issues by the multilateral development agencies and through co-financing arrangements with these agencies.
Although most of the recycling of funds is to be donethrough the multilateral institutions, it is noteworthy that theJapanese Government is considering the introduction of untied loans. One of the main purposes of recycling funds is tohelp indebted developing countries promote export industries in order to reduce their foreign debt burden. The Ministry of International Trade and Industry (MIT!) has set upteams to discuss the kinds of industries that could be developed in Argentina, Brazil, Chile, Mexico and other indebted
countries. EIB has also established a group to study the recycling of funds to the developing countries. Under the presentExport-Import Bank Act, EIB untied loans are limited toGovernment and governmental institutions and it is prohibited from investing in joint-stock enterprises in foreigncountries. The study group has therefore proposed measuresthat will increase the scope of the functions of the EIB.These include permitting investment in foreign projects (inaddition to loans) and expanding the possibilities for untiedloans to private enterprises by allowing the Japanese Government to take part of the risk in the projects. As a firstproject in this recycling of funds, EIB agreed with lOB inDecember 1987 to provide co-financing of about'$18 millionin a project to develop a mine in co-operation with Venezuela's state bauxite corporation. Since the loans are untied, theprocurement of the equipment and material for the project isnot limited to Japan.
An enlargement of the activities of the multilateral development agencies to support growth-oriented adjustment isanother important means of restoring the flow of capital tothe developing countries. As indicated in chapter IV, severalnew initiatives by the multilateral financial institutions arebeing implemented and should lead to some increase inUnited States exports over the next few years.
In addition to new flows, a reduction in the existing debtoverhang might also make an important contribution towards a narrowing of the United States' trade deficit, eventhough the extent to which debt reduction measures, inthemselves, would reduce the deficit is unclear. A reductionin interest payments would enable the indebted countries toincrease their demand for exports from the United States(among other countries) and would reduce the United States'trade balance. At the same time, United States' income frominterest payments would also be reduced, so that the net benefit to the current account deficit is uncertain. If, however,the reduction of the debt burden were accompanied by enlarged capital flows from the surplus countries to the developing countries, the indebted countries would be able togrow faster and there could be a multiplier effect on theirimports from the United States, to the ultimate advantage ofthat country's trade and current account deficits.
Some conclusions
The consequences of the imbalances among the developedmarket economies for the developing countries were, inlarge part, a side-effect of the constellation of the similar,but independent, approaches to monetary policy that the developed market economies combined with disparate fiscalpolicies to combat inflation and to reinvigorate the privatesector of their economies. The sustained revival and growthof demand in the United States and its weakness elsewherejoined with high interest rates and the earlier liberalizationof international capital movements to produce huge capitalflows and wide swings in exchange rates among the developed market economies. These same circumstances alsocontributed to a weakening in the demand for exports fromdeveloping countries and a reduction in primary commodityprices, while simultaneously presenting indebted countries
138
with sharply increased debt service burdens. The result wasthat the balance-of-payments deficits of most developingcountries were narrowly confined; in particular, countries insub-Saharan Africa have experienced acute balance-of-payments constraints and the most heavily indebted countrieshave remained in the grip of severe debt-servicing difficulties. The huge imbalances among the developed marketeconomies are themselves not the direct cause of these tightpayments balances among developing countries, but the twoare closely linked in origin.
Some progress has been made in reducing the huge external and internal imbalances that confront the leading developed market economies. Considerably more adjustment willhave to take place over the next few years. Ideally, this ad-

justment would be undertaken in an environment of high,but sustainable, world economic growth, the benefits ofwhich would be distributed equitably among the world'spopulation. In reality, the heritage of the recent past seems toimply that the adjustment is going to have to take place in aworld of slow economic growth. As indicated in chapter IIabove, on the basis of present policies, economic growth inthe developed market economies is expected to be lower in1988 than in 1987 and to slip again in 1989. Fiscal policiesare, on balance, shifting to a more restrictive stance and reallong-term interest rates remain high. For developing countries, these are not conditions which promise either firmcommodity prices, bouyancy in export volume or an easingof the debt-servicing burden.
In a period when economic growth is weak and confidencein the future is fragile, the risks arising from the adjustmentprocess among the developed market economies are heightened. The issue is whether adjustment can be accomplishedwithout major disturbance to world economic activity arising either because of large destabilizing shifts in exchangerates or interest rates or because the deflationary effects ofthe necessary changes in trade balances are not adequatelycountered.
The risks of such damaging instability in international financial markets remain considerable. It is without historicalprecedent that the principal reserve currency of the worldshould belong to a country that has also become the world'slargest net debtor: in the past, reserve currencies have beenunderpinned by the trading strength of the reserve currencycountry and by its status as a large net creditor. The presentexceptional development, moreover, has taken place againstthe background of large-scale deregulation and integrationof international financial markets. Private markets havecome to dominate in the determination ofexchange rates at atime when the principal reserve currency is in a highly vulnerable state.
Central banks are the other principal actors influencingexchange rates. With their powerful capacity to intervene inforeign exchange and domestic financial markets, centralbanks have been active in smoothing out short-term and medium-term shifts in exchange rates, particularly by arrestingany incipient speculative lurches. They have been less successful in imposing on the market their views about thelonger-term equilibrium exchange rate. There is a diversityof informed opinion on that issue, and what happens in exchange markets is a contest in their credibility.
139
Currently, there is extensive discussion of possible guidelines for international co-operation to stabilize exchangerates, but it essentially involves the strengthening of co-operation among central banks to reduce short-term instability.Even such limited co-operation is not always easy to attain,and it is not enough for exchange rate stability in the longerterm. Recent experience has amply demonstrated that exchange rate movements are shaped by macro-economic policies as a whole and through their interaction both within andamong countries.
The present primary macro-economic concern has to bethat economic growth will be sustained. Fiscal policies havenot only to accommodate the decrease needed in the UnitedStates' trade deficit, but also to counter the deflationary effects of a contraction in net exports elsewhere. The mainconcerns are whether the United States will go further toreduce its budget deficit and whether the Federal Republicof Germany will assume a sufficiently expansionary stance.
In the former, action appears stalled in an election year,but the slowing growth in consumption expenditure maymake enough room for greater net exports in the short term.In the Federal Republic of Germany, vigorous efforts havebeen made to reduce fiscal deficits in the 1980s; both to combat inflation and to permit tax cuts. Moreover, the countrynow has a large excess of domestic savings over domesticinvestment and both inflation and economic growth are low.In these circumstances, the rationale for a fairly tight fiscaldiscipline appears weak. It is argued that the widespreadrigidities in the economy cause any fiscal expansion to bepartially dissipated in higher prices. However, it would alsoaugment real domestic demand and that would help to raisethe low rate of domestic investment which now depressesfuture growth potential. At the same time, it would enhancethe possibility for other Western European countries to accelerate their domestic growth.
Japan too has a special role to playas the world's largestcapital exporting country. Larger flows of public capital tothe developing countries and the restoration of flows of private capital are part of the solution to the internal imbalancesthat prevail among the developed market economies. It isencouraging that Japan and other developed market econo':mies have been taking steps to direct larger flows of publiccapital to these countries. It is equally important that flowsof private loan capital be restored. These would make possible a more sustainable distribution of current account surpluses and deficits among the different groups of countriesin the world.


Chapter VIII
GROWTH AND ADJUSTMENT IN SMALL AND MEDIUM-SIZED DEVELOPINGCOUNTRIES DURING THE 1980s
The average rate of growth of the developing economiesdeclined sharply during the 1980s. During the 1970s, thecombined gross domestic product of these economies hadbeen growing at an annual rate of 5.5 per cent; but it grew atonly 1.7 per cent during the period 1981-1987. 1 Per capitagross domestic product increased at about 3.2 per cent during the 1970s; in the latter period it actually declined.
However, the growth experience has been diverse. Somecountries continued to grow fast, a few even faster than before, many others slowed down and, in a considerable number of cases, fell back. The World Economic Survey 1987examined the economic growth of a small number of fast-
growing developing countries in the 1980s and analysed anumber of factors that might have accounted for the difference between their growth performance and that of otherdeveloping countries. The present chapter briefly examinesthe diversity of growth experience of a sample of developingcountries, within the context of their overall adjustment to alower growth path, and inquires why their growth rates differed. A sample of35 countries were chosen from small andmedium-sized countries. The reason for focusing on thatgroup was that such countries are generally more exposed toexternal shocks than larger countries. 2
Diversity around a declining trend
There has always been a large diversity of growth ratesamong the developing countries, and there is little evidence
Table VIII. 1. Dispersion of GDP growth rates
1971-1980 1981-1986
All developing countries (83 countries)
Mean annual growth rates 4.6 1.0Standard deviation 3.2 3.4
Net energy-importing countries (58 countries)
Mean annual growth rates 4.0 1.6Standard deviation 2.7 2.5
Net energy-exporting countries (25 countries)
Mean annual growth rates 6.2 -0.3Standard deviation 3.6 4.7
Africa (32 countries)
Mean annual growth rates 3.1 0.5Standard deviation 2.7 3.0
Western hemisphere (23 countries)
Mean annual growth rates 4.5 0.0Standard deviation 2.4 2.0
South and East Asia (14 countries)
Mean annual growth rates 5.9 4.4Standard deviation 2.3 1.8
Source: Department of International Economic and Social Affairsof the United Nations secretariat.Note: The number of countries in parentheses indicates the maximum number for which data were available.
that this diversity has increased. Ifanything, it has tended todecline during the 1980s for some major groups of developing countries (see table VIII. 1). This suggests the importance of external factors.
For the developing countries as a whole, the mean growthrate has declined considerably and there has been only amodest increase in the dispersion of growth rates around themean, as shown by the standard deviation. 3 For the group ofnet energy-importing countries, which comprise by far thelarger number ofcountries, the dispersion tended to decline,while the growth experience of the net energy-exporters hasbecome more diverse. One reason for the increased diversityamong the energy-exporters is the emergence of a number ofsmall producers who managed to increase the output andexport of oil when the major producers were contractingtheirs. In both the western hemisphere and South and SouthEast Asia the dispersion has declined, while in Africa it increased slightly.
The difficulty of individual developing countries in escaping the pull of the pervasive decline in growth performanceduring the 1980s is also evident from the shrinking numberof success stories. During the period 1971-1980, and in asample ofjust over 80 countries, 32 could be termed successstories; in the period 1981-1987, only about 11 could be sodescribed (using, somewhat arbitrarily, a cut-offpoint of 5.5per cent annual growth for the definition of success duringthe period 1971-1980. For 1980-1987, a lower figure of 4.5per cent was used, taking into consideration an environmentoflower growth rates).4 An interesting fact is the comparatively stable and high growth rates of large countries. The
1 These figures exclude China.2 The criterion for selection was that the population should range between I million and 50 million. In selecting countries, consideration was also
given to a balanced geographical distribution of the sample and the need to ensure a fair representation of structural diversity of the economiesselected from each region.
3 The differences in the standard deviation in the two periods are not statistically significant.4 See World Economic Survey 1987 (United Nations publication, Sales No. E.87.n.C.I and corrigendum).
141

mean growth rate for the five countries in table VIII. 1 whosepopulation in mid-decade was 100 million or more was 5.7
per cent during the period 1971-1980 and 4.4 per cent during1981-1987.
Growth of GDP in the sample countries
Table VIII.2 presents the growth rates of GDP in the 35countries or areas selected. The rates of growth of thesecountries declined, on the average, from 4.9 per cent duringthe 1970s to 2.7 during the period 1981-1987. The growthrate picked up somewhat during 1986-1987 but not enough tomake a difference to the average for the period. The numberof high-growth countries, by the criteria used above, declined from 17 to 9. The decline was widespread. Of the 35
countries in the table, 27 had a lower rate of GDP growth inthe 1980s than in the 1970s, and in many cases the fall hasbeen drastic. Another notable feature of the growth performance of the selected countries is its wide disparityamong regions. The growth rate of the African and LatinAmerican economies fell sharply during the 1980s. Asiancountries, on the other hand, experienced only a modest decline in growth rates.
Table VIII.2. Growth ofGDP
(Average annual percentage change)
1971-1980 1981-1987 1971-1980 1981-1987
Africa 4.3 2.3 Honduras 4.8 1.4
Cameroon 3.7 5.3 Jamaica -0.7 0.6
Congo 4.5 2.2Peru 3.8 1.7
Cote d'Ivoire 6.7 -0.1 Uruguay 3.3 -1.0
Egypt 6.9 2.8Ethiopia 2.6 2.0 Asia 6.6 5.5
Ghana 0.6 1.8 Burma 4.2 5.2Kenya 6.0 3.2 Hong Kong 9.8 7.4Morocco 5.5 2.2 Malaysia 8.0 4.0Senegal 1.3 2.0 Nepal 2.1 3.6Somalia 4.1 2.8 Oman 6.9 10.0Tunisia 7.0 2.9 Philippines 6.2 0.7Zambia 1.3 1.0 Republic of Korea 8.2 8.4
Singapore 9.1 5.8Latin America 4.2 0.6 Sri Lanka 4.7 4.5
Argentina 2.2 -0.8Thailand 6.9 5.2
Bolivia 4.5 -2.0Chile 2.5 1.4 Mediterranean 5.3 3.0
Colombia 5.5 3.1 Turkey 4.7 5.2Costa Rica 5.6 1.0 Yugoslavia 5.8 0.8Ecuador 8.9 1.5Guatemala 5.6 -0.5 Average of all countries' 4.9 2.7
Source: Department of International Economic and Social Affairsof the United Nations Secretariat.
a The averages, including those of the regions, are simple arithmeticmeans.
The diversity of growth experience during the 1980s
The fall in the rate of growth of a large majority of developing countries and the large diversity of growth experienceof the individual countries are both major features of theworld economic scene ofthe 1980s. The first attests to thedeterioration of the international setting; the second pointsto the differing ability of the individual countries to withstand the shocks as well as the difference in their initial reaction to external shocks.
The environment in which economic growth takes place isnever purely economic. As in any other phase of world history, non-economic issues have influenced the pace of economic development in the 1980s and, for many countries,these issues have assumed greater importance during thisperiod than before. More Wflrs have been fought during the
142
1980s than in any previous decade in history. Twenty-twowars, each accounting for a thousand deaths or more annually, were being waged in 1987. Seven of these were in thesample countries. Military expenditure as a proportion ofGNP increased from 4.5 per cent in 1980 to 5.4 per cent in1986 and was higher, on the average, in the 1980s than in the1960s and the 1970s. In 1984, military expenditure in anaverage developing country was higher than expenditure onhealth and education combined. Increased military expenditure has its counterpart in international trade in arms .Between 1980 and 1984, exports of arms from the developedcountries grew at a much faster rate than economic assistance to developing countries. The dollar value of worldarms exports increased by about 37 per cent between 1980

and 1984, while world trade in current dollars showed noincrease. 5
The international economic setting
The rate of growth of the developed market economies,which had already declined in the 1970s to about 3 per centfrom about 5 per cent in the 1960s, fell further, to barely 2per cent during the period 1980-1987. Accompanying thiswas a sharp reduction in the growth of world trade, fromabout 5 per cent in the 1970s to less than 3 per cent in the1980s. International trade and growth in the developedeconomies were thus weaker engines of growth for the developing countries than before.
Falling or stagnant demand depressed prices of primarycommodities to record low levels. Slow supply response tochanged demand conditions aggravated the fall in prices. Asprimary commodities, including oil, still account for about70 per cent of the exports of the developing countries, the
, decline in prices meant a large reduction in their exportearnings and real income. Falling commodity prices wereone of the two major external shocks for the developingeconomies during the 1980s.
The other major shock to the developing countries in the1980s was the sudden realization that the debt burden theyhad accumulated over the years had become too large. Asdescribed in detail in numerous reports, many developingcountries borrowed heavily in the international capital markets during the 1970s. Some of the borrowing by many energy-importing countries was "recycling" to support theirbalance of payments after a sharp increase in oil prices in theearly 1970s.
While debt accumulated and export earnings fell, the costof debt-servicing rose sharply. The real rate of interest, thatis, nominal rates corrected for inflation or change in exportprices, rose to high levels. The average debt-service/GNPratio for the sample countries increased from 2.4 per centduring the period 1971-1980 to 4.7 per cent during 19811986. For 32 of the 35 countries for which information isavailable for both periods, the debt-service/GNP ratio increased; for 20 countries it doubled. The sudden contractionof loans from commercial creditors and only a modest increase in official flows led to a major drop in net capitalinflows to virtually all these countries. As interest rates and,hence, interest payments remained high, for many of thesecountries net financial flows, as explained in chapter IV,became negative.
Factors underlying growth differentials
Though external shocks of the type briefly describedabove had a general impact, the growth performance ofsome countries was far better than in others. The importance
of quantifiable factors that might explain grvwth performance over a period of time varies from country to country,and some of these factors are intercorrelated, so that the effect of each is not easy to determine. There are also largeresiduals in the causes of economic growth, residuals forwhich a satisfactory explanation has not yet been found. 6
The following paragraphs represent a brief attempt to testsome hypotheses about the role of a number of factors reflecting both domestic economic structure and policies andthe impact of external economic shocks. The factors selected are: (a) growth of agricultural output, (b) domesticsavings ratio, (c) investment ratio, (d) government savingsratios, (e) rate of inflation, (f) growth of imports, (g) growthof exports, (h) the share of exports in GDP, (i) the impact ofterms oftrade and (j) the burden of debt-servicing, indicatedby (i) debt-servicing/GNP and (ii) debt- servicing/export ratios. A series of simple regression analyses were undertakento examine the importance of each of these factors as possible explanations of the difference in GDP growth ratesamong the sample countries. The results are given in tableVIII.3.?
Since a large proportion of the total domestic output consists of agricultural production in many developing countries, and because of the close link between growth in agriculture and development of other sectors of the economy,growth of agricultural output would be expected to explain apart of the difference in the growth of GDP among countries. The rate of growth of agricultural production duringthe 1980s was much higher in the fast-growing developingcountries than in the slow-growing countries. 8
For the present sample of countries, however, growth ofagricultural output appears unrelated to the growth of GDP.The main reason is that the importance of agriculture in thenational economy varies widely from country to country.Agriculture is unimportant in Hong Kong and Singapore,for example, while in Burma, Ethiopia and Ghana it accounts for over 40 per cent of the gross domestic product.The conclusion changes and the expected picture emergeswhen a cluster offive countries or areas are excluded, two ofwhich are Hong Kong and Singapore. For the reduced sample of 26 countries, there is a significant statistical relationship between the growth of agriculture and the growth ofGDP during the 1980s (see table VIII.3, equation 1).
The expected long-term relationship between domesticsavings and growth held strongly for the sample countriesduring the 1980s; countries that grew fast also had a higherrate of savings (see equations 2 and 3). The average ratio ofsavings to GDP for the sample countries remained practically unchanged, at the 1970s level of about 19 per cent. In anumber of countries, on the other hand, the ratio actuallyincreased and the long-term association between the savingsratio and the growth of GDP remained valid in the turmoil of
5 Ruth Leger Sivard, World Military and Social Expenditure 1987-88 (Washington, D. C., World Priorities Inc., 1987).6 Such residuals were once called, in a slightly different context, a "measure of our ignorance". See M. Abramovitz, "Resource and output
trends in the United States since 1870", American Economic Review, Papers and Proceedings, vol. XLVI (May 1956).7 Except for equation 12, only simple regression analyses were undertaken, mainly because many of the factors considered here are intercorre
lated (e.g., savings and investment).8 See World Economic Survey 1987 (United Nations publication, Sales No.E.87.I1.C.l and corrigendum), chap. VIII.
143

Table VIII.3. Factors underlying growth differentials: results of regression analysis
Eq. Dependent Number ofIndependent variable/regression co-efficients
No.' variable countries· Constant GAGR SAVR INVR GSVR RINFL GREX GRIM TTR SHEXP DSGNP DSX R'
I. GGDP 26' 0.07 0.81 0.34(0.12) (3.54)'
2. GGDP 25' 0.14 0.13 0.26(0.14) (2.81)'
3. GGDP 27 0.79 0.09 0.15(0.83) (2.10)'
4. GGDP 27 -0.67 0.14 0.25(-0.56) (2.89)'
5. GGDP 23 2.16 0.33 0.25(4.53)' (2.62)'
6. GGDP 27 1.97 -0.45 0.30(5.15)' ( -3.27)'
7. GGDP 31 2.72 0.19 0.26(6.67)' (3.17)'
8. GGDP 27 2.68 0.13 0.19(6.46)' (2.39)'
..... 9. GGDP 27 2.77 0.17 0.26
.j::>. (6.94)' (2.97)'
.j::>.
10. GGDP 27 3.16 0.48 0.25(6.11)' (2.91)'
11. GGDP 27 2.07 0.02 0.06(3.50)' (1.29)
12. GGDP 27 2.45 0.46 0.03 0.34(3.28)' (2.92)' (1.76)
13. GGDP 35 3.92 -0.27 0.10(4.88)' ( -1.94)'
14. GGDP 21 6.42 -0.65 0.77(13.17)' (-7.90)'
15. GGDP 11 3.05 -0.90 0.81(6.37)' (-6.26)d
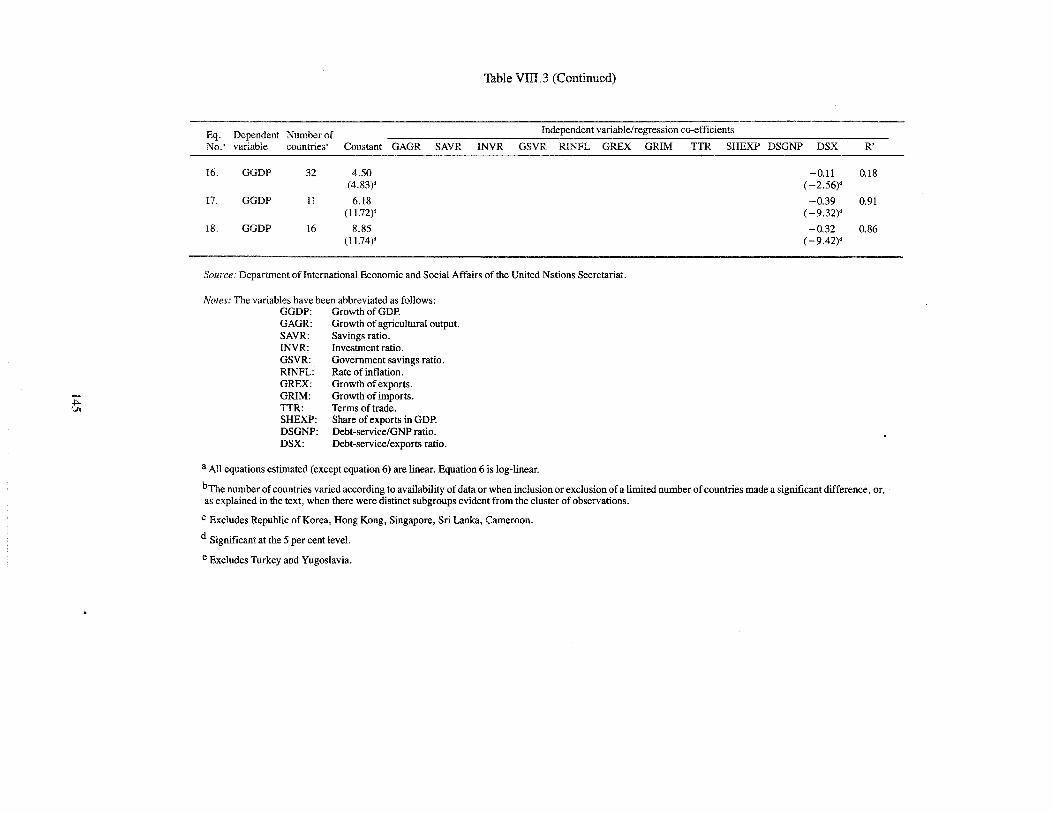
Table VIII.3 (Continued)
Eq. Dependent Number of Independent variable/regression co-efficients
No.' variable countriesb Constant GAGR SAVR INVR GSVR RINFL GREX GRIM TTR SHEXP DSGNP DSX R'
16. GGDP 32 4.50 -0.11 0.18(4.83)' (-2.56)'
17. GGDP 11 6.18 -0.39 0.91(11.72)' ( -9.32)'
18. GGDP 16 8.85 -0.32 0.86(11.74)' (-9.42)'
Source: Department of International Economic and Social Affairs of the United Nations Secretariat.
Notes: The variables have been abbreviated as follows:GGDP: GrowthofGDP.GAGR: Growth of agricultural output.SAVR: Savings ratio.INVR: Investment ratio.GSVR: Government savings ratio.RINFL: Rate of inflation.GREX: Growth of exports.GRIM: Growth of imports.TTR: Terms of trade.SHEXP: Share of exports in GDP.DSGNP: Debt-service/GNP ratio.DSX: Debt-service/exports ratio.
a All equations estimated (except equation 6) are linear. Equation 6 is log-linear.
bThe number ofcountries varied according to availability ofdata or when inclusion or exclusion ofa limited number of countries made a significant difference, or,as explained in the text, when there were distinct subgroups evident from the cluster of observations.
c Excludes Republic of Korea, Hong Kong, Singapore, Sri Lanka, Cameroon.
d Significant at the 5 per cent level.
e Excludes Turkey and Yugoslavia.

the 1980s. The association between the two variables wassignificant in both the 1.970s and the 1980s. 9
There is similarly a strong relationship between investment and the growth of GDP: countries with a high investment ratio also have a better growth performance (see equation 4). As with the savings ratio, the average investmentratio for the sample countries remained virtually the sameduring the period 1981-1986 as in the 1970s. But there werelarge changes in the ratio for a number of countries. Nevertheless, the relationship between the investment ratio andgrowth of income for the sample countries on the whole remained strong, even stronger than for savings. 10
An over-expansive fiscal policy has generally been considered harmful for growth in circumstances of capacityconstraints. Such policies can normally be expected to raiseprices rather than output. For the sample countries, a highrate of government savings, defined as the surplus ofcurrentgovernment revenue over current government expenditure,was found to be closely associated with the growth of GDP(see equation 5). This suggests that a large or growing fiscaldeficit can easily become a constraint to growth. Likewise, aprudent fiscal policy tends to be associated with a higher rateof growth of output.
One of the major differences between the fast-growingcountries and other countries in the 1980s was their rate ofinflation;" the former group had a much lower rate of inflation than the latter. For the present sample of countries, thereis a significant inverse relationship between growth and inflation. Countries growing faster tended to have a lower rateof inflation (see equation 6).
While the growth ofworld trade has slowed down, exportoriented policies and the structure of exports have played asignificant role in the growth performance of individualcountries. In an atmosphere of sluggish total export demand,some developing countries have none the less managed toincrease their exports. For the sample countries, there is asignificant positive relationship between growth of exportsand the growth of GDP during the 1980s (see equation 7).
This does not mean that in a period of slow growth ofworld trade, all developing countries could expand their exports substantially at the same time. The importance of export-oriented production structure and policies does, however, stand out as an explanation of differences in growthperformance among the small and medium-sized countries.
The causal relationship between the growth of GDP andthe growth of imports is complex. Successful import substitution could lead to faster overall growth. On the other hand,countries that are able to increase imports or maintain themat a high level, and thus meet their needs for investment
goods and intermediate inputs, generally grow faster thanother countries. Equation 9 shows some association betweenimport increases and overall growth. It is also significantthat, in a situation where the availability of external financeto the developing countries fell drastically, countries thatsucceeded in maintaining a high level of imports were generally also those that succeeded in expanding their exports. 12
Two aspects of the external shocks of the 1980s-terms oftrade and debt-servicing burden-were examined. Between1980 and 1987, the terms of trade of the developing countries deteriorated at an average annual rate of about 3 percent, giving a cumulative decline of more than 20 per centover the period. This represented a large loss of real incomefor the developing countries, the loss for the individualcountries depending on the importance of external trade inthe economy as well as the extent of deterioration in its termsof trade.
A terms-of-trade loss has several effects, not all of whichcan be easily compensated. It implies a decrease in aggregate demand which can be compensated by macro-economicpolicies. It also implies a decrease in real absorption whichcan be compensated with additional capital inflows. However, none of these policies is likely to function smoothlyenough to fully compensate for the effects of deterioratingterms of trade. Moreover, there is often a problem in thetransfer of resources from activities that have become unprofitable because of international price changes. Factormobility is usually low in developing countries. Thus, itshould be expected that changes in terms of trade-particularly when sustained-would influence the growth of grossdomestic product. For the sample countries, this was indeedthe case: there was a significant association betweenchanges in the terms of trade and growth of GDP during the1980s. Equation 10 in table VIII.3 shows that a 1 per centdeterioration in the terms of trade was associated with a 0.5per cent decline in real GDP. The relationship is strengthened when account is also taken of the importance of exportsin GDP: the larger the share of exports in GDP and thelarger the change in terms of trade, the greater the change inGDP (equation 12).'3
Debt-servicing essentially means a transfer of a part of thegross domestic product abroad. The larger the debt-servicepayment, the lower the domestic absorption is expected tobe, other things remaining the same. While theoretically adecrease in domestic absorption might affect only real consumption expenditures, in most cases real investment is alsoaffected, and hence the growth of gross domestic product inthe medium to long term.
For the full sample of countries examined here, there is nostatistically significant relationship between growth and
9 The coefficient of correlation between the savings ratio and growth ofGDP for the 21 countries for which data were available was 0.40 for theperiod 1971-1980 and 0.54 for 1981-1986. Both are statistically significant at the 5 per cent level.
10 The coefficient of correlation between the investment ratio and the growth of GDP for the 21 countries for which data were available was 0.73for the period 1971-1980 and 0.55 for 1981-1986.
11 See World Economic Survey 1987 (United Nations publication, SalesNo.E.87.II.C.1 and corrigendum), chap. VIII.12 The coefficient of correlation between the growth of exports and the growth of imports for the sample countries was a statistically significant
0.46.
13 The Rincreased from 0.19 to 0.28 when the variable of export as a proportion of GDP was added.
146
debt-service/GNP ratios. But an examination of the scatterdiagram suggests the existence of two distinct clusters ofcountries, calling for a breakdown of the sample into twosub-samples. As shown in table VIII.3 (equations 14 and15),14 for both sub-samples there is a highly significant inverse relationship between growth of GDP and the size ofdebt-service payments. By itself, the debt-servicing burden"explains" about 80 per cent of the difference in the growthrates among countries. The conclusion is sustained when therelationship between the debt-service/export ratio andgrowth is examined: the statistical association between thetwo is even more significant for both sub-samples of countries (see equations 17 and 18).15
There is also evidence that debt-servicing influencesgrowth through savings and investment. A significant inverse statistical relationship exists between the debt-service/export ratio and the savings and investment ratios in thesample countries. 16
This preliminary examination of the association of variousfactors with the growth rate does not permit any far-reaching
conclusions about the mechanisms at work, especially sincerapid output growth might itself be expected to promotehigher savings ratios, government revenues and investmentdemand and also relieve some inflationary pressures. Butthe results are so far consistent with the hypotheses that capital formation does indeed play an important role in fastgrowth, that fiscal prudence and price stability are conducive to better growth performance and that agriculturalgrowth deserves special attention in the many countrieswhere this sector is large.
It would be of special interest to compare the importanceof domestic and external factors, but this would require amore elaborate study. The findings are consistent with thehypothesis that both internal and external factors have astrong explanatory value. Two of the external factors considered-terms of trade and debt-servicing paymentsshowed stronger association with the growth rate than any ofthe internal ones considered in isolation. Yet, more complexspecifications are needed to assess the combined effects ofinternal and external factors.
Coping with the shocks of the 1980s: the adjustment efforts
The shocks of the 1980s, external or internal, have imposed severe problems of adjustment on many countries.Adjustment is now often suspected of retarding growth,though there is little evidence that usual adjustment programmes actually reduce growth rates, except in the veryshort run. 17 In practice, adjustment measures call for austerity in a situation in which shocks have already reducedgrowth, or even an absolute decline in income. They ofteninvolve substantial cuts in income and these cuts are notshared equally by the different classes of society. The vulnerable social groups tend to bear a disproportionate shareof the burden of adjustment. 18 Real wages have fallen by 20per cent or more in many countries during the 1980s. Socialexpenditures have often been the first to be slashed. In somecases the costs have turned out to be too high for the fragilepolitical structure of the country. In a number of countriesadjustment programmes have been abandoned or held inabeyance as adjustment fatigue has set in.
The nature and severity of the shocks have varied fromcountry to country. The responses have also been different,
in part because the assessment of the nature and magnitudeof the shocks has been different and in part because of ideological differences concerning the policy instruments to beused. They also depended on the political strength of thedecision makers and the availability of resources. Politicalwill also often determined whether policy decisions werefollowed through over a sufficiently long period of time.
Almost all external shocks require adjustment in the balance of payments. Reduction of current account deficits hasthus been a major objective of adjustment efforts during the1980s, and the adjustments undertaken have been verylarge. For the 35 sample countries, the trade deficit declinedfrom $35 billion in 1980 to $10 billion in 1986. If Egypt isexcluded, the deficit shrinks from $34 billion to $2 billion.In 23 of the 35 countries, the trade deficit was reduced orturned into a surplus. Balance-of-payments adjustmentswhich are neutral in their effect on growth involve increasesin exports accompanying a reduction in imports. This hashappened in only 10 countries; in 12 countries both importsand exports in current dollar terms declined. As one study
14 The two sub-samples are:(a) For equation 14: Burma, Cameroon, Chile, Colombia, Costa Rica, Cote d'Ivoire, Ecuador, Egypt, Honduras, Hong Kong, Jamaica, Kenya,Malaysia, Morocco, Peru, Singapore, Sri Lanka, Thailand, Tunisia, Turkey and Zambia (21 countries);
(b) For equation 15: Argentina, Bolivia, Ethiopia, Ghana, Guatemala, Nepal, Philippines, Senegal, Somalia, Uruguay and Yugoslavia (11countries).
15 The two sub-samples are:(a) For equation 17: Ethiopia, Ghana, Guatemala, Honduras, HongKong, Nepal, Philippines, Senegal, Singapore, Uruguay and Zambia (11countries) ;(b) For equation 18: Argentina, Bolivia, Cameroon, Chile, Colombia, Costa Rica, Cote d'Ivoire, Egypt, Jamaica, Kenya, Malaysia, Peru,Somalia, Sri Lanka, Thailand and Tunisia (16 countries).
16 For the four sub-samples of countries mentioned in notes 14 and 15, and countries for which all the data were available, the coefficient ofcorrelation between saving and debt-service/export ratio and between investment and debt ranged from 0.43 to 0.70, in all cases significant atthe 5 per cent level.
17 See IMF, Fund-Supported Adjustment Programs and Economic Growth (Washington, D.C., November 1985), p. 20.18 See, for example, Giovanni Cornia, Richard Jolly and Frances Stewart, eds., Adjustment with a Human Face, vol. I (Oxford, Clarendon Press,
1987).
147

points out, in the conteKt of adjustment and growth andwhile examining changes in imports and exports during theperiod 1980-1985, "a decline over five years of both exportsand imports is not an indicator of vigorous growth" . 19 In 10countries, both imports and exports increased. The samecountries also had growth rates that were generally higherthan the average for the sample countries.
A fact that emerges from the adjustment efforts of the developing countries during the 1980s is that attempts at maintaining domestic demand at an unsustainable level rarelysucceed and only aggravate the effects of the shocks. 20 In anumber of cases, attempts were made to sustain economicactivity through expansion of public consumption. In othercases, fiscal prudence was abandoned in favour of steppedup public investment in order to shore up demand. This onlyincreased fiscal deficits and fuelled inflation, making futureadjustment more difficult. The failure to prevent an increasein real wages has caused the collapse of adjustment programmes through increased imports, reduced exports andwidened trade deficit. On the other hand, there were cases oftimely demand restraint which obviated problems of adjustment later on. Sound fiscal management has played a majorrole not only in reducing current account payments imbalances but in facilitating the structural changes needed.The experience of a number of countries suggests that "cautious demand management is essential for the effective pursuit of structural adjustment" .21
An appropriate exchange rate policy is often a crucial element in an adjustment programme. Indeed, an overvaluedcurrency, by making exports uncompetitive, is frequently amajor factor giving rise to balance-of-payments problemsfor individual countries in the first place, even though in the1980s these considerations have been overshadowed by thefall in commodity prices and increased debt-service payments. Overvaluation has tended to retard industrial growthby discouraging exports and encouraging indiscriminate import-substitution and has made agricultural production forexport unremunerative. Import-led booms in some of thesample countries during the late 1970s and early 1980s,based on overvalued currencies, have been short-lived andhad to be followed by large devaluations. In a number ofcases devaluation, as a part of a well worked out adjustmentprogramme, has led to substantial increases in exports during the 1980s. However, devaluation has failed to achievethis result when, for example, inadequate attention wasgiven to the structure of production and export or when itseffects have been nullified by other measures. A frequentexperience has been that a large devaluation was followed by
gradual appreciation as inflation eroded the original changein the value of the currency.
For some countries, the tying of their exchange rate to amajor currency, though imparting some benefits, has exacerbated the problem of adjustment. For example, as theFrench franc appreciated against the dollar from the mid1980s, the African countries that are members of the CFAfranc zone found their currencies overvalued and their exports hurt, without the benefit of cheaper imports since mostof them came from France.
Another major element in most adjustment packages ismonetary policy. Although the structural nature of inflationin some countries sometimes makes the association ofmoney supply with inflation less obvious, a large expansionof money supply generally fuels inflation. On the otherhand, tight credit policies designed to raise the rate of interest in order to encourage savings, can discourage investment. 22 An IMF survey ofadjustment measures does suggestthat "tighter monetary and credit policies would result in afall in the growth rate in the first year after they were implemented" .23
Experience with the adjustment programmes in the 1980ssuggests that they rarely succeed without adequate andtimely availability of external resources. Most programmesthat could be called a success were accompanied by a largeinfusion of external resources. There were numerous instances where non-availability of finance, often because ofdisagreements between IMP and the country in need of adjustment, meant postponement of adjustment. Many times,available finance was too little or came too late.
While the adverse conditions of the 1980s came as a surprise to many countries, in retrospect, they appear in manyinstances at least partly the result of past policies. Indiscriminate import substitution in a large number of countriesstands out as a case in point. Past neglect of agriculturaldevelopment, through inappropriate pricing policies leadingto deterioration of the agricultural terms of trade vis-a-visthe rest of the economy, has aggravated the problems ofmany countries. In other instances, countries coped betterwith the difficulties of the 1980s because of the good performance of the agricultural sector. Similarly, the politicaldifficulty of reducing food subsidies was often aggravatedby the fact that they were kept in place for so long that thenecessary change appeared too large. The problem of external debt provides another important example. A failure ofpolicy in many countries saddled with a large debt burden inthe 1980s is their inadequate attention to the growth of the
19 See Paul Streeten, ed., Beyond Adjustment, the Asian Experience (Washington, D.C., IMF, 1988), p. 11.20 See, for example, Paul Streeten, op. cit. ; Lance Taylor, Varieties ofStabilization Experience: Toward Sensible Macro-economics in the Third
World, preparedjor the World Institutejor Development Economics Research (WIDER) (Helsinki, 1987); L. R. Jayawardena, A. Maasland andP. N. Radhakrishnan, Stabilization and Adjustment Programmes and Policies, Case Study on Sri Lanka, United Nations University/WorldInstitute for Development Economics Research, May 1986; economic surveys of the regional commissions; and World Bank and IMF researchdocuments. The discussion of adjustment programmes that follows in this chapter draws on these studies. Countries have not been namedbecause some developments reported relate to a particular period in the adjustment efforts of a country and not to other periods.
21 Bijan B. Aghevli, Insu Kim and Hubert Neiss, "Growth and adjustment: experiences of sele;;ted sub-continent countries" in Paul Streeten, op.cit., p. 52.
22 Jayawardena and others, op. cit.23 See IMF, Fund-Supported Adjustment Programs and Economic Growth (Washington, D.C., November 1985), p. 24.
148

export sector during the 1970s when their debt was growingrapidly.
Favourable circumstances often conceal the inception ofdifficult problems ofadjustment which should not have beenimpossible for the policy makers to detect. Adjustments tofavourable developments can be almost as important asthose needed to cope with adverse circumstances. Large inflows of capital have led to overvaluation of currencies in
149
some countries, brewing problems for the future. The commodity booms of the late 1970s had similar effects in a n~mber of countries. Temporary bonanzas from surgmgrevenues led short-sighted borrowers to extensive overborrowing, without objections from lenders who were equall~
short-sighted, and to careless investment in unviable proJects. In a few countries, loans were used more to foster consumption than to further investment.


Annex I
SELECTED INDICATORS OF THE SOCIO-ECONOMIC ATTAINMENT OF WOMEN
Quantification of the economic activities of women is animportant issue in the current discussion among economistsand social scientists regarding the contribution made by different agents to the development process. The work ofwomen is ignored in the accounts of the world economywhen it is done in the confines of the family rather than themarket-place. This invisible part of the world economy isslowly gaining recognition, although it is hard to assess because it does not have a market value.
Child-rearing is an undeniably essential activity in all societies, and it is a serious anomaly that the rearing of children is excluded from national accounts. Likewise, mealpreparation and caring for the elderly are excluded fromgross domestic product estimates. The activities of the informal sector, where women's work accounts for a considerable share, are often not reflected in statistical data. Indeed,the contribution of women-and for that matter also of children-to agricultural activities in developing countries islargely unrecorded or underrecorded, except when it materializes in sales of the household in a somewhat organizedmarket or when rewards for agricultural work are of a monetary nature.
The published data give the impression that in developingcountries the majority of women play no role in the economy. Part of the reason for the deficiencies in the data canperhaps be attributed to a lack ofunderstanding of the role ofwomen in economic activity-it being considered, for instance, that a woman tending to the family vegetable plot orcollecting firewood is simply engaged in "housework".Yet, an understanding of how an economy functions is essential for successful government policy, and without aknowledge of what and how much different members of society produce, and how they produce it, economic management is less than adequate. Moreover, the compilation ofgender-specific statistics and greater research into the economic role of women were proposed in the Nairobi Forward-looking Strategies for the Advancement of Women. a
Efforts have recently been made to improve the statisticalcoverage of the role of women in economic activity. Theeconomic crisis has set-back data gathering and compilationin a large number of developing countries. This has alsoaffected statistics reflecting the role of women. Nevertheless, there is still enough information to draw a realistic picture at the global and regional levels. Some of the more important indicators at the global and regional levels are presented below.
Table A.I.1 shows the contribution of women to the increase in employment during the past decade. Although onlya limited number of developing countries are represented inthe data, it can be seen that, during the past decade, about 40
per cent ofthe newly employed were women. In the industrialized countries, where data are available, women enteredthe labour force in even greater numbers. In Western Europe, the increase in the employment of women compensated for a fall in the employment of men and still allowedfor an overall increase in employment.
Table A.I.2 shows the economically active population bysector and gender. In 1980, 63 per cent of the world's economically active population were men, and 37 per cent werewomen; 31 per cent of the economically active populationwere men working in agriculture, and 20 per cent werewomen. In no group of countries, according to conventionaldefinitions, did womep constitute a majority of the total economically active population. However, in the Soviet Union,which is shown separately, women did constitute a majorityin 1970.
Table A.I.!. Contribution of females and males toincreases in employment(Mid-1970s to mid-1980s)
Percentage increase due tochange in employment of
Females Males
Developing countries'
Africa 37.9 62.1Asia 43.4 56.2Latin America 39.5 60.5
Developed market economies
North America 62.2 37.8Western Europe 151.1 -51.1
Centrally planned economies'
Eastern Europe 71.4 28.6USSR 46.7 53.3
Source: Department of International Economic and Social Affairs ofthe United Nations Secretariat, based on selected years and countries fromInternational Labour Office, Year Book of Labour Statistics; data files ofthe Economic Commission for Europe; and Statistical Yearbook of theCouncil for Mutual Economic Assistance, 1987.
a Weighted averages, based on a sample of countries.
b Socialized sector onIy.
In the developing countries, women constituted a smallershare ofthe recorded economically active population than inthe industrialized countries. However, this could be a reflection of the statistical deficiencies mentioned earlier. In subSaharan Africa, for instance, women in agriculture made up
a See Report ofthe World Conference to Review and Appraise the Achievements ofthe United Nations Decade for Women: Equality, Developmentand Peace, Nairobi, 15-26July 1985 (United Nations publication, Sales No. E.85.IV.1O), chap. I, sect. A, paras. 130 and 312.
151

33.5 per cent of the economically active population in 1980, paratively the greatest) requires that countries examine thecompared to 42.7 per cent for men. However, in North Af- role of women in agriculture so as to enhance their contribu-rica the comparable figures were 6 per cent and 41.5 per tion.cent. This does not appear to be a realistic picture of the
In Africa, men and women have separate roles in the pro-differences in the actual contribution of women to agricul-ture between the two parts of the continent. duction of household food and cash crops. They also have
different managerial and financial control over the produc-The reported figures do, however, show that women play tion, storage and sale of surplus food and crops. Women are
an essential role in agriculture, which is the largest sector primarily responsible for the cultivation of traditional foodthroughout the developing countries. The importance of this crops, providing specific nutrients for the diet. They alsosector to the successful performance of these countries (par- process food, especially for family consumption, but alsoticularly in sub-Saharan Africa, where women's role is com- for the market. Men usually work in the cash crop economy,
Table A.I.2. Composition of the economically active populationby gender and sector 1970 and 1980
(Percentage)
Females Males
Total Agric. Indus. Servo Total Agric. Indus. Serv .
World 1970 36.0 20.9 5.4 9.7 64.0 34.1 14.3 15.61980 36.9 19.5 6.1 11.3 63.1 31.3 14.9 17.0
Developing countries 1970 29.1 20.7 3.0 5.3 70.9 45.2 10.6 15.1or areas 1980 29.0 18.6 3.4 7.0 71.0 41.1 12.2 17.7
Asia 1970 28.2 21.0 3.2 3.9 71.8 47.3 9.6 14.91980 27.1 18.7 3.4 5.1 72.9 44.4 11.0 17.4
Western Asia 1970 27.2 23.3 1.3 2.6 72.9 39.9 13.0 20.01980 25.5 20.3 1.5 3.7 74.5 28.4 17.5 28.5
East and Middle 1970 28.2 20.8 3.4 4.0 71.8 47.8 9.4 14.6South Asia 1980 27.2 18.5 3.5 5.2 72.8 45.5 10.66 16.7
Africa 1970 36.1 30.8 1.3 4.0 63.9 46.0 7.2 10.71980 35.7 28.9 1.8 5.0 64.3 42.5 8.9 12.9
North Africa 1970 11.2 6.0 1.6 3.6 88.8 50.4 14.2 24.31980 13.4 6.0 2.8 4.7 86.6 41.5 18.0 27.1
Sub-Saharan 1970 41.0 35.6 1.3 4.1 59.0 45.2 5.8 8.0Africa 1980 40.1 33.5 1.6 5.1 59.9 42.7 7.1 10.1
Latin America 1970 21.7 3.9 4.3 13.5 78.3 36.7 18.9 22.7and Caribbean 1980 26.3 3.8 5.2 17.2 73.7 28.0 20.6 25.1
Hong Kong, Malaysia, 1970 31.9 17.6 6.8 7.6 68.1 26.4 15.6 26.1Republic of Korea, 1980 34.4 13.9 9.0 11.5 65.6 18.4 19.2 28.1Singapore
China 1970 41.7 34.6 3.1 4.0 58.3 43.7 7.0 7.61980 43.2 33.9 5.2 4.1 56.8 40.3 8.8 7.7
Developed market 1970 34.7 4.1 8.8 21.8 65.3 7.8 28.4 29.0economies 1980 38.1 2.6 8.5 27.0 61.9 5.1 26.2 30.7
North America 1970 36.1 0.8 7.4 27.9 63.9 3.8 24.8 35.21980 41.5 0.7 7.8 32.9 58.5 2.9 23.0 32.6
Europe 1970 32.4 3.6 9.7 19.2 67.6 9.3 32.6 25.71980 35.9 2.9 8.8 24.2 64.1 6.1 29.2 28.8
Australia, 1970 30.9 1.5 7.0 22.5 69.1 7.3 29.4 32.4New Zealand 1980 36.9 2.0 6.8 28.1 63.1 5.6 25.4 32.0
Japan 1970 39.0 10.3 10.2 18.5 61.0 9.3 24.3 27.41980 37.7 5.3 9.9 22.5 62.3 5.9 24.3 32.1
Eastern Europe 1970 44.2 17.0 12.7 14.5 55.8 15.6 26.4 13.81980 45.6 11.5 15.5 18.5 54.4 11.3 28.1 15.0
USSR 1970 50.6 13.3 15.8 21.4 49.4 12.3 21.8 15.21980 49.4 10.4 16.2 22.9 50.6 9.6 22.9 18.1
Source: Department of International Economic and Social Affairs of the United Nations Secretariat, based on datasupplied by the International Labour Office.
152
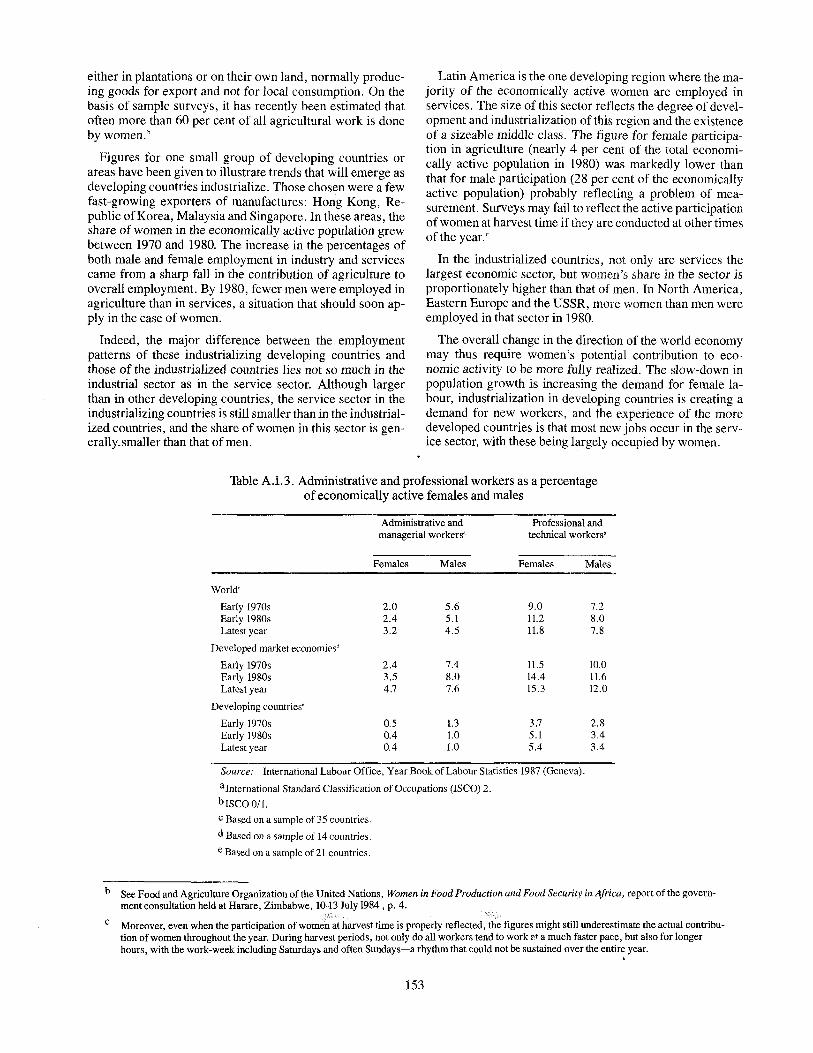
either in plantations or on their own land, normally producing goods for export and not for local consumption. On thebasis of sample surveys, it has recently been estimated thatoften more than 60 per cent of all agricultural work is doneby women. b
Figures for one small group of developing countries orareas have been given to illustrate trends that will emerge asdeveloping countries industrialize. Those chosen were a fewfast-growing exporters of manufactures: Hong Kong, Republic of Korea, Malaysia and Singapore. In these areas, theshare of women in the economically active population grewbetween 1970 and 1980. The increase in the percentages ofboth male and female employment in industry and servicescame from a sharp fall in the contribution of agriculture tooverall employment. By 1980, fewer men were employed inagriculture than in services, a situation that should soon apply in the case of women.
Indeed, the major difference between the employmentpatterns of these industrializing developing countries andthose of the industrialized countries lies not so much in theindustrial sector as in the service sector. Although largerthan in other developing countries, the service sector in theindustrializing countries is still smaller than in the industrialized countries, and the share of women in this sector is generally.smaller than that of men.
Latin America is the one developing region where the majority of the economically active women are employed inservices. The size of this sector reflects the degree of development and industrialization of this region and the existenceof a sizeable middle class. The figure for female participation in agriculture (nearly 4 per cent of the total economically active population in 1980) was markedly lower thanthat for male participation (28 per cent of the economicallyactive population) probably reflecting a problem of measurement. Surveys may fail to reflect the active participationof women at harvest time if they are conducted at other timesof the year.'
In the industrialized countries, not only are services thelargest economic sector, but women's share in the sector isproportionately higher than that of men. In North America,Eastern Europe and the USSR, more women than men wereemployed in that sector in 1980.
The overall change in the direction of the world economymay thus require women's potential contribution to economic activity to be more fully realized. The slow-down inpopulation growth is increasing the demand for female labour, industrialization in developing countries is creating ademand for new workers, and the experience of the moredeveloped countries is that most new jobs occur in the service sector, with these being largely occupied by women.
Table A.I. 3. Administrative and professional workers as a percentageof economically active females and males
Administrative and Professional andmanagerial workers' technical workersb
Females Males Females Males
World'
Early 1970s 2.0 5.6 9.0 7.2Early 1980s 2.4 5.1 11.2 8.0Latest year 3.2 4.5 11.8 7.8
Developed market economies'
Early 1970s 2.4 7.4 11.5 10.0Early 1980s 3.5 8.0 14.4 11.6Latest year 4.7 7.6 15.3 12.0
Developing countries'
Early 1970s 0.5 1.3 3.7 2.8Early 1980s 0.4 1.0 5.1 3.4Latest year 0.4 1.0 5.4 3.4
Source: International Labour Office, Year Book of Labour Statistics 1987 (Geneva).
aInternational Standard Classification of Occupations (ISCO) 2.
blSCO 0/1.
c Based on a sample of 35 countries.
d Based on a sample of 14 countries.
e Based on a sample of21 countries.
b See Food and Agriculture Organization of the United Nations, Women in Food Production and Food Security in Africa, report of the government consultation held at Harare, Zimbabwe, 10-13 July 1984 , p. 4.
c Moreover, even when the participation of women at harvest time is properly reflected, figures might still underestimate the actual contribu-tion of women throughout the year. During harvest periods, not only do all workers tend to work r.t a much faster pace, but also for longerhours, with the work-week including Saturdays and often Sundays-a rhythm that could not be sustained over the entire year.
153

Data on the occupations filled by women, and the salariesthey earn, show that, although the situation is changing inmany respects, there are significant differences vis-a-vismen. Table A.I.3 shows the percentage of the economicallyactive men and women in the occupational category thatcommands the highest salaries and that controls decisionmaking-administration and management. It can be seenthat a smaller percentage of the female economically activepopulation occupy these positions than is the case for men.The estimates are based on a limited number of countries;because of a lack of comparable data, they do not include thecentrally planned economies. Yet they do reveal that, whilethe differences have narrowed since the early 1970s, theshares of men and women are still significantly different.
When figures for professional and technical workers areexamined, they show that women occupy proportionallymore of these positions than do men: nearly 12 per cent ofeconomically active women are in this category at thepresent time, compared with 8 per cent of men. This reflectsin part the major role that women play in the services sector,which includes many of the occupations that they fill such asteacher or nurse. It also reflects the fact that the higher aperson's educational attainment, the more likely will be hisor her participation in the labour force. d As women are generally a smaller percentage of the economically active population than men, the average educational level of womenworkers is therefore likely to be higher than that of men.
Table A.I.4 gives the ratio between the wages of men andwomen in non-agricultural activities for a limited number ofcountries. It can be seen that, in every country, on averagewomen earned less than men. Data do not permit an assessment ofthe extent to which this is due to actual differences inresponsibilities. Often, within an occupational group,women tend to fill lower-paid jobs than men-teachers,rather than principals in schools, for instance. A comparisonbetween countries is not possible, and conclusions drawnfrom this limited sample must be tentative. However, thefigures, on the whole, show that the difference betweenmen's and women's earnings, as measured, has not narrowed appreciably during the past decade.
Another measure that partly indicates the role of womenin the economy comes from figures on the ownership ofland. Table A.I.5, which is based on a limited sample ofcountries, gives the share of men and women among therecorded holders of agricultural properties. Differences aresubstantial when the shares of men and women are compared. Such differences, however, do not necessarily reflectdifferences in individual property. To a large extent, the figures show household property that because of tradition orthe legal framework, is almost invariably registered in thename bf the husband or other adult male in the household.Regarding regional comparisons, the table, for the mostpart, shows no statistically significant differences.
Not only has there been a slowing down of populationgrowth rates in most countries, but, in addition, longevityhas risen sharply. In the developing countries, between
1970-1975 and 1980-1985 life expectancy for men increasedby 4.5 years, from 53.4 to 57.9; for women the increase waseven greater-5.6 years-from 54.7 to 60.3. The percentageof men and women aged 60 years or older and those aged 75years and older in the total population for the years 1970,1985 and, based on present projections, 2000 is shown intable A.I.6. For the developing countries as a whole the percentage is less than half of that of the industrialized countries. However, differences among regions at various stagesofdevelopment indicate that, with economic growth and im-
Table A.I.4. Male/female wage ratio in non-agriculturalactivities 1977, 1980, latest year
Latest1977 1980 year
Developing countries or areas
AfricaKenya 1.07 1.26 1.f7Swaziland 1.84 2.25 1.50United Republic of Tanzania 1.49 1.18
AsiaHong Kong 1.32Republic of Korea 2.27 2.25 2.04Singapore 1.59 1.45Sri Lanka 1.01 1.09 1.35
Industrialized countries
EuropeBelgium 1.42 1.44 1.34Czechoslovakia 1.46 1.46 1.46Denmark 1.17 1.18 1.22France 1.28 1.26 1.22Germany, Federal Republic of 1.38 1.38 1.37Iceland 1.25 1.17 1.12Luxembourg 1.54 1.55 1.57Netherlands 1.25 1.28 1.31Switzerland 1.50 1.48 1.48United Kingdom 1.39 1.43 1.44
Japan 1.79 1.86 1.92Australia 1.15 1.16 1.15New Zealand 1.30 1.30 1.27
Source: Department ofInternational Economic and Social Affairs of theUnited Nations Secretariat, based on International Labour Office, YearBook ofLabour Statistics 1987 (Geneva).
Table A.I.5. Persons holding title to agriculturalproperties in the mid-1980s
(Percentage)
Females Males
Africa 8.1 91.9
Latin America 13.6 86.4
Asia 12.1 87.9
Developed countries 13.8 86.2
Source: Based on Food and Agricultural Organization data.
a Based on a sample offour African countries, four Latin American countries. four Asian countries, three European countries and the United States.
d See The Economic Role ofWomen in the ECE Region (United Nations Sales publication, Sales No. E.85.II.E.20), p. 19.
154

provements in health delivery services, the developingcountries can be expected to approach the levels reached inthe developed countries. Indeed, in all regions, except Africa, which has a high fertility rate, the proportion of elderlypeople in the population is expected to continue to increase.Thus, most countries will be faced with the same challengeof providing an active life and adequate services for theiraging population, the majority of whom, particularly amongthose aged 75 or older, will be women.
The figures for the developed countries show not only thatthe elderly have increased as a percentage of the population,but also the difference between the numbers of elderly menand women has widened. In the Soviet Union, for example,it is currently estimated that in the age groups 60 and overand 75 and over, there are twice as many women as men.These demographic changes make it even more essential toaddress the issue of preparing women for full and long-termparticipation in economic activity.
Education of women is an area where there has been measurable progress during the past three decades. At the globallevel, illiteracy among adults has dropped from 32.9 percent in 1970 to 27.7 per cent in 1985, whereas during thesame period the world adult population rose from 2.3 billionto 3.2 billion. According to the estimates of the Office ofStatistics of the United Nations Educational, Scientific and
Cultural Organization, however, there were still about 890million illiterate persons aged 15 years and above, that is,129 million more than in 1970; 63 per cent of these werewomen.
Illiteracy remains a problem in the developing countries:the illiteracy rate is 54 per cent in Africa, 36.3 per cent inAsia and 17.3 per cent in Latin America and the Caribbean.The proportion of adult women who are illiterate in theseregions is 34.9 per cent, as compared with 20.5 per cent ofmen. The highest illiteracy rates are to be found among ruralpopulations and in the poorer suburbs oflarge cities.
Gaps in the education process are also found in the developed countries. In these countries, functional illiteracythat is, the level inadequate to cope with the complex andrapidly changing requirements of economic life-is not aseasily measured as absolute illiteracy but is perceived to bean obstacle to long-term growth in many countries. In thedeveloping countries, increases in enrolment rates are themselves measures of educational improvements for men andwomen. Though improvements have been made, much remains to be done to eliminate the considerable disparity inthe provision of education at all levels.
Table A.I.7 shows that, at the primary and secondary levels, there has been an overall but steady lessening of the
Table A.I.6. Percentages of the total population aged 60and over and 75 and over
Females Males
1970 1985 2000 1970 1985 2000
World 60 and over 4.7 4.9 5.4 3.7 3.9 4.575 and over 1.0 1.3 1.4 0.7 1.1 0.9
Developing 60 and over 3.2 3.4 4.0 2.8 3.1 3.7countries 75 and over 0.6 0.7 0.9 0.5 0.9 0.7
Africa 60 and over 2.7 2.6 2.6 2.3 2.2 2.275 and over 0.5 0.5 0.5 0.4 0.6 0.4
Latin America 60 and over 3.2 3.6 4.1 2.9 3.1 3.5and Caribbean 75 and over 0.6 0.8 1.0 0.5 1.0 0.8
South Asia 60 and over 2.8 3.1 3.8 2.9 3.0 3.575 and over 0.5 0.6 0.7 0.4 0.8 0.6
China 60 and over 3.8 4.4 5.4 3.1 3.8 5.175 and over 0.8 0.9 1.3 0.6 1.1 1.0
Industrialized 60 and over 8.5 9.6 10.6 5.8 6.2 7.7countries 75 and over 2.1 3.0 3.4 1.2 1.9 1.7
North America 60 and over 7.8 9.4 9.3 6.0 6.8 6.775 and over 2.2 2.9 3.4 1.4 2.2 1.9
Europe 60 and over 9.7 10.4 11.4 6.5 7.2 8.475 and over 2.5 3.5 3.7 1.4 2.1 2.0
Japan 60 and over 5.9 8.4 11.7 4.8 6.1 9.275 and over 1.3 2.2 3.4 0.9 2.1 2.0
Oceania 60 and over 5.9 6.8 7.2 4.8 5.5 5.875 and over 1.6 1.9 2.3 1.0 1.7 1.4
USSR 60 and over 8.1 9.0 10.6 3.9 4.1 6.975 and over 1.8 2.7 2.8 0.7 l.l 1.0
Source: Department ofInternational Economic and Social Affairs of the United Nations Secretariat. based on GlobalEstimates and Projections of Population by Sex and Age: the 1984 Assessment. (ST/ESA/SER.R/70).
155

Table A.I.7. Percentage offemales in total school enrolment
Primary. Secondary TertiaryRegions Year level level level
Industrialized 1970 49 50 41countries 1980 49 51 48
1985 48 51 49
Developing 1970 42 34 29countries 1980 44 39 35
1985 44 39 37
Europe' 1970 49 51 431980 49 52 471985 48 52 48
North America 1970 49 49 411980 49 50 511985 49 49 53
Oceania 1970 48 48 341980 48 49 441985 48 49 47
Africa 1970 39 30 221980 43 35 271985 44 35 28
Asia" 1970 41 35 271980 42 39 321985 43 39 32
Latin America and the 1970 49 48 35Caribbean 1980 49 50 43
1985 48 51 45
Source: United Nations Educational, Scientific and Cultural Organization, Statistical Yearbook, 1987 (Paris).
a Including the USSR.
b Including Japan.
traditional bias against women, as measured by their percentage of participation in total enrolment. A major changehas been the sharp increase in relative female participation atthe tertiary level in the developed countries--from 41 percent in 1970 to 49 percent in 1985.
In the developing countries, female enrolment at the primary level in 1985 was 44 per cent oftotal enrolment, at thesecondary level 39 per cent and at the tertiary level 37 percent compared with 42 per cent, 34 per cent and 29 per centin 1970, as shown in table A.I.7. This improvement suggeststhat in the future the literacy rate for women will be fairlyclose to that for men. In the developing countries the femaleenrolment rate declines with an increase in age, with thedecline being greatest from the primary to the secondarylevels.
During the 1980s, school enrolment of boys and girls between the ages 6 and 11 in the industrialized countries isalmost 100 per cent, and secondary education between theages 12 and 17 shows a high participation rate for girls (seetable A.I.8). As one goes higher up the ladder to advancededucation at the university level, the percentage rate for females increases significantly over time. These data indicatethat more females have been participating in advanced education, and equality at the university level has almost beenachieved in Europe. In North America, female participation
156
at the university level has gone beyond parity, surpassingmale enrolment ratios in 1985. In Oceania, female enrolment has risen substantially over the years, yet proportionately fewer younger women than men-19.1 per cent versus21. 8 per cent-between the ages 18 and 23 were studying in1985.
In Asia and Africa wide differences between the sexesappear at the first two educational levels. The provision ofeducation in the developing countries roughly matches income levels. Thus, in 1985, in Latin America, secondaryenrolment for males was 71.2 per cent and for females 69.6per cent, whereas in Africa the comparable figures were59.6 per cent for males and 41.8 per cent for females. InAsia, only 48.2 per cent of boys and 35.6 per cent of girlswere in secondary education. Although school enrolment indeveloping countries is low between the ages 18 and 23 forboth males and females, a comparatively higher number ofwomen, particularly in Africa and Asia, are affected by inadequate educational resources and opportunities.
In developing countries, young girls in rural and sometimes in urban areas drop out of school because of low family incomes and demanding households. Additional reasonsinclude early marriages and traditional attitudes inhibitingthem from acquiring or upgrading skills.

Region
Industrializedcountries
Developingcountries
Europe"
North America
Oceania
Africa
Asia'
Latin Americaand the Caribbean
Table A.L8. School enrolment by age group and sex(Percentage)
Female Male
Year 6-11 12-17 18-23 6-11 12-17 18-23
1970 91.8 74.8 23.2 91.6 77.8 30.01980 92.3 81.3 30.2 92.0 80.4 31.51985 91.6 85.8 33.2 91.5 85.2 34.3
1970 49.4 23.8 4.4 66.2 38.6 9.71980 60.8 33.8 8.5 76.3 46.6 14.61985 65.7 39.6 10.3 79.4 52.1 17.0
1970 89.6 68.9 20.6 89.3 72.1 25.21980 90.4 77.7 25.1 90.9 76.9 26.01985 89.9 81.1 27.8 89.7 80.4 28.0
1970 100.0 88.1 40.8 100.0 91.3 50.51980 100.0 87.0 50.5 100.0 86.0 47.51985 100.0 95.7 56.7 100.0 95.6 54.1
1970 88.7 66.0 8.3 91.1 70.7 15.71980 88.9 68.6 16.0 91.4 60.1 19.81985 87.4 70.2 19.1 89.5 70.4 21.8
1970 34.4 19.2 2.2 49.4 34.2 6.41980 53.2 34.1 5.3 68.0 50.9 12.01985 60.2 41.8 7.5 71.6 59.6 15.5
1970 51.5 24.2 4.3 71.1 40.1 10.91980 60.5 30.8 6.7 78.5 44.1 14.01985 65.1 35.6 8.5 81.5 48.2 16.4
1970 71.5 47.5 9.6 70.9 52.1 13.11980 81.6 62.1 16.6 82.5 64.3 24.81985 82.8 69.6 23.4 84.2 71.2 25.8
Source: United Nations Educational, Scientific and Cultural Organization, Statistical Yearbook, 1987 (Paris).
a Including the'USSR.
b Including Japan.
Education policies should aim at providing a level of education adequate for coping with the demands of a complexsociety. Failure to do so is frequently a cause of the marginalization of women, with negative effects for society as awhole. Yet, efforts should be made to go beyond the crea-
157
tion of literate-but also unemployed-females. New andmore intense educational efforts should try to ensure thatfull potential capabilities are developed, irrespective of gender, in every country.


Annex II
WERE THE EQUITY MARKETS OVERVALUED BEFORE 19 OCTOBER?
The leading explanations for the stock market crash, asdescribed in chapter IV, emphasize confidence factorswhich, if restored, might lead to general recovery in equitymarkets. On the other hand, a number of observers haveasserted that stock values were grossly overvalued beforethe crash. If so, the crash might be viewed as an unusuallyrapid correction of a speculative bubble.
Evaluating stock prices-or indexes of stock prices-isfraught with uncertainty, even more so than for many otherfinancial assets. Stock prices are driven primarily by expectations of variable dividend flows and attitudes towards risk.The current dividend is a small factor influencing the inves-
tor's return; indeed, most of the return that investors expectto receive depends on increases in the price ofthe stock up tothe time the stock is sold to another investor. Nevertheless,analysts of stock prices frequently look at the ratio of stockprices to current dividends-or earnings-as a quick indicator of market sentiment about an individual company'sshares. By the same token, if the average price/dividend ratio for all the stocks traded in a particular market rises, it istaken as an indication of rising market sentiment about holding stocks in general. If the average ratio becomes unusuallyhigh, it can raise questions about whether the market as awhole has become "overvalued".
Table A.II.t. Characteristics of stock prices of selecteddeveloped market economies, 1985-1987
(Percentage)
Canada France
FederalRepublic
ofGermany Italy Japan
UnitedKingdom
UnitedStates
A. Estimated risk premiums embodied in stock prices (u)'
1985 0.6 1.4 2.3 3.5 -0.1 1.9 1.61986 1.8 2.4 2.7 4.8 1.1 2.1 3.81987:
January 2.2 1.8 3.2 6.8 1.7 1.8 4.2February 1.9 1.7 3.5 7.0 2.0 1.8 3.8March 1.8 2.0 3.6 7.0 2.3 2.2 3.7April 1.0 1.9 3.7 6.7 2.6 2.4 3.1May 1.0 1.7 3.9 6.4 2.6 2.4 2.5June 1.1 1.5 3.5 6.1 2.0 2.2 2.6July 0.5 2.3 3.2 5.9 1.5 1.8 2.5August 0.3 1.8 2.9 5.4 1.3 1.3 2.0
B. Estimated degree of overvaluation of stock prices in 1987
Price/divi-dend ratiosin August
Actual 43.5 31.6 34.0 47.6 192.2 33.0 37.2Hypotheticalb 27.6 31.0 28.5 29.6 77.3 26.3 24.0
Percentageovervaluation 57.8 1.9 19.2 61.2 148.8 25.6 55.1
Decline ofprice/divi-dend ratios,August-De-cember 25.5 33.1 32.0 21.4 12.9 26.6 28.0
Sources: Department of International Economic and Social Affairs of the United Nations Secretariat, based onDECD, Financial Market Statistics (dividend yields) and IMF, International Financial Statistics (long-term government bond rates).
a Period averages. The risk premium is estimated as the dividend yield (dividends/share price) minus the longterm government bond rate plus the expected average growth rate of dividends. This last term is assumed to bethe country's average annual rate of growth of nominal GNP or GDP from 1983 through 1986.
b Price/dividend ratio implied by the model in part A, but with the "u" term assumed equal to the average value inthe first half of 1987.
159

Figure A.II.I. Price/dividend ratios in major stock markets44
42
40
36
36
34
32
30
V Canada28
26 X United Kingdom
24 0 United States
22
1963 1904 1905 1906 1987
200
190
100
170
160
150
.140
130
120
110
100
90
80 + Japan
70
60 • I' i' I i, I.1903 1904 1905 1906 1987·
00
70
GO
50
40{j. France
¢ Germany, Federal Republic of
20Italy
10
1983 1904 1905 1966 1967
Source: Based on data from OECD, Financial Market Statistics.
160

r+u-g
PID= __l__
Stock prices-or the stock/dividend ratios-would thus,in theory, rise if expectations (g) improved, and fall ifuncertainty or lack of confidence (u) about those expectations in-
r+u-g
The formula can also be expressed in terms of the price/dividends ratio, i.e.,
creased. Neither of these can be observed directly. However, there are reasonable ways of approximating g-a typical assumption is that it is equal to the recent growth of thecountry's nominal income-and that together with observations for P, D and r allow us to calculate implicit values of u.These values, in turn, can be tracked over time to seewhether stock price behaviour had become unusual.
In particular, one can ask if the implicit u's took on unusually low values just prior to the crash. If so, that would implythat stocks were considered less risky than usual and, ifchanges in the economic environment did not account for thechange, it would suggest that the shares had become overvalued relative to historical norms for prices, dividends andinterest rates. Some illustrative calculations for one assumedlevel of g (based on the growth of nominal output from 1983 .to 1986) for the seven major industrialized countries areshown in table A.II.l. In early 1987, estimated values of udid not seem out of line relative to values for all of 1986.However, a rather noticeable drop in estimated u values appeared after spring 1987.
The exercise can be extended by comparing the ratios ofstock prices to dividends just before the crash with the ratiosthat would have resulted if the stock prices were determinedby the model and if the value of u were equal to the averagevalue estimated for the first half of 1987. The pattern ofactual and hypothetical price/dividend ratios in late summer1987 varied widely among countries, reflecting factorsunique to each country in determining risk premiums. Butthe shares of each country except France seem to have beenovervalued. The degree of correction in the stock/dividendratios by year-end, however, did not closely follow the estimated amount of overvaluation. Even so, these calculationssuggest that, among a variety of explanations for the October crash, one should not rule out its having been a one-shotcorrection of temporarily overvalued stocks.
+....D (l+gF
(l+r+uF+D (1 +g)
(l+r+uF
D
D-----+l+r+u
P=
Mathematically, this is equivalent to
P=
As may be seen from figure A.II.1, questions of this sortcould understandably have been raised in mid-1987 about thestock markets of Canada, Japan, the United Kingdom andthe United States. Continental European markets alreadyseemed to be undergoing an adjustment. Were the otherssimply following in the second half of the year and, if so,why?
One way to approach these questions is to try to modelstock price behaviour. What an investor should be willing topay for a share of stock should, in principle, equal thepresent value ofthe expected flow of dividends in perpetuity.If P represents the stock price, D is the current year's dividend payment, r is the interest rate on risk-free governmentbonds, u is a risk premium required to compensate investorsfor the uncertainty about the future path of dividends, and gis the expected average growth rate of dividends (r, u and gexpressed as decimals), then the theoretical price can bewritten as an equation:
161


Table A. III. I. Developed market economies: annual rates of growthof real gross national product, 1983-1989
(Annual percentage change)
Country or country group 1983 1984 1985 1986 1987' 1988" 1989"
All developed market economies' 2.7 4.8 3.0 2.7 3.0 2.4 1.8Excluding United States 2.1 3.7 3.2 2.5 3.1 2.5 2.2
Major industrial countries' 3.0 5.0 3.1 2.8 3.1 2.6 1.8Canada 3.7 6.1 4.3 3.3 3.9 2.0 2.4France 0.7 1.4 1.7 2.1 2.1 1.4 1.5Germany, Federal Republic of 1.9 3.3 2.0 2.5 1.7 1.7 2.3Italy 0.5 3.5 2.8 2.8 3.1 1.7 1.8Japan 3.2 5.1 4.7 2.5 4.2 4.1 2.7United Kingdom 3.7 2.2 3.7 3.1 4.8 2.7 2.4United States 3.6 6.4 2.7 2.9 2.9 2.4 1.3
Smaller industrial countries' 1.3 3.6 2.9 2.2 2.3 2.0 1.9
Source: Department of International Economic and Social Affairs of the United Nations Secretariat.
a Preliminary estimates.
b Forecasts, based on Project LINK.
c For France, Italy, the United Kingdom and all the "smaller industrial countries", the measure used is grossdomestic product.
Table A.III.2. Developed market economies: unemployment rates,1980-1987
(Percentage of total labour force)
1980 1981 1982 1983 1984 1985 1986 1987
Australia 6.0 5.7 7.1 9.9 8.9 8.2 8.0 8.1Austria 1.9 2.5 3.5 4.1 3.8 3.6 3.1 3.9'Belgium 8.8 10.8 12.6 12.1 12.1 11.3 11.2 10.9Canada 7.4 7.5 10.9 11.8 11.2 10.4 9.5 8.8Denmark 6.5 10.3 11.0 11.4 8.5 7.3 6.3 8.5'
Finland 4.6 4.8 5.3 5.4 5.2 5.0 5.3 5.0France 6.3 7.4 8.1 8.3 9.7 10.2 10.4 10.8Germany, Federal Republic of 3.0 4.4 6.1 8.0 7.0 7.2 6.5 6.5Greece 3.9 4.0 5.8 7.9 8.1 7.8 7.4 8.7'Iceland 0.7 1.0 1.3 0.9 0.7 0.7'
Ireland 6.1 8.9 11.4 14.1 15.6 17.4 18.0 18.7'Italy 7.5 8.3 9.0 9.8 10.2 10.5 10.9 11.5'Japan 2.0 2.2 2.4 2.6 2.7 2.6 2.8 2.8Luxembourg 1.2 1.6 1.7 1.6 1.4 1.2'Netherlands 6.0 8.5 11.4 12.0 11.8 10.6 9.9 9.6
New Zealand 2.2 3.6 3.5 5.6 5.7 4.1 5.5 5.7'Norway 1.6 2.0 2.6 3.4 3.1 2.6 2.0 2.1Portugal 7.6 8.1 7.3 7.9 8.4 8.5 8.5 8.7'Spain 11.2 13.9 15.8 17.2 20.0 21.4 21.0 21.1Sweden 2.0 2.5 3.2 3.5 3.1 2.8 2.7 1.9
Switzerland 0.2 0.2 0.4 0.9 1.1 0.9 0.8 0.8'United Kingdom 6.4 9.8 11.3 12.5 11.7 11.2 11.2 10.3United States 7.0 7.5 9.5 9.5 7.4 7.1 6.9 6.1
Sources: GECD, Main Economic Indicators (Paris, March 1988), and GECD, Employment Outlook (Paris, Septem-ber 1987).
a Estimates by the Department of International Economic and Social Affairs of the United Nations Secretariat.
163

Table A.III.3. Developed market economies: rates of change ofGNP deflator and consumer prices, 1981-1987
(Annual percentage change)
Country or country group 1981 1982 1983 1984 1985 1986 1987"
GNP deflators
All developed market economiesb 8.8 7.2 5.3 4.6 4.4 3.8 3.6Major industrial countriesb 8.7 6.7 4.7 4.1 3.9 3.0 3.1
Canada 10.8 8.7 5.1 3.3 3.2 2.9 2.9France 11.2 11.2 9.8 7.4 5.7 4.8 3.0Germany, Federal Republic of 4.0 4.4 3.3 2.0 2.2 3.2 2.0Italy 16.3 16.6 14.2 10.0 8.3 8.1 6.1Japan 3.2 1.9 0.8 1.2 1.7 1.6 0.9United Kingdom 12.0 7.6 5.6 4.6 5.6 3.9 5.6United States 9.6 6.4 3.9 3.9 3.7 2.0 3.0
Other industrial countries" 9.5 10.2 8.2 7.4 7.1 7.9 6.0
North Americab 9.7 6.6 4.0 3.8 3.6 2.0 3.0Western Europeb 9.7 9.3 7.7 6.2 5.6 5.5 4.2Developed Asiab 4.3 3.4 2.1 2.2 2.7 3.2 2.5
Consumer prices
All developed market economiesb 10.4 7.9 5.7 5.4 4.9 3.2 3.6Major industrial countriesb 10.1 7.2 4.9 4.8 4.2 2.2 2.9
Canada 12.4 10.8 5.8 4.3 4.0 4.1 4.4France 13.4 1l.8 9.6 7.4 5.8 2.5 3.3Germany, Federal Republic of 6.3 5.3 3.3 2.4 2.2 -0.3 0.2Italy 19.5 16.5 14.6 10.8 9.2 6.0 4.6Japan 4.9 2.8 2.0 2.2 2.0 0.6 0.1United Kingdom 11.9 8.6 4.6 5.0 6.1 3.4 4.2United States 10.4 6.1 3.3 4.3 3.5 2.0 3.6
Other industrial countries" 11.5 11.0 9.4 8.4 8.0 7.3 6.3
North Americab 10.6 6.4 3.5 4.3 3.5 2.2 3.7Western Europeb 11.7 10.1 8.0 7.0 6.1 3.8 3.5Developed Asiab 6.2 4.8 3.8 3.2 4.1 3.7 3.4
Sources: IMF, International Financial Statistics; and OECD, Economic Outlook.
a GNP deflators for 1987 are estimates by the Department of International Economic and Social Affairs of theUnited Nations Secretariat, based on Project LINK and other official national and international sources.
b Rates of change in individual countries are aggregated by using value of output in 1980 in dollars as weights.
Table A.IlIA. Growth ofexports to the developed market economiesfrom the leading exporters of manufactures among
the developing economies
(Percentage change in current dollar values)
1985 1986 1987'
Argentina 1.2 -9.1 -3.0Brazil 0.6 -6.9 8.8Hong Kong -3.6 20.7 19.7India -4.1 3.9 19.7Malaysia -6.5 -1.5 17.5Philippines -11.0 -0.3 11.3Republic of Korea 6.4 30.6 40.0Singapore 0.4 6.7 30.8Thailand 3. 29.1 25.7Yugoslavia 7.8 27.0 19.1
Total -0.2 11.1 22.8
Source: Department of International Economic and Social Affairs of the UnitedNations Secretariat, based on IMF, Direction ofTrade Statistics.
a January-October.
164

Table A.II1.5. Balance of trade with developed market economiesof 10 leading exporters of manufactures among
the developing economies'
(Billions of dollars)
1980 1984 1985 1986 1987b
All developed market economies
Exports 76.9 99.1 98.9 109.8 105.9Imports 84.4 82.7 82.0 9.1 89.4
Balance -7.5 16.4 17.8 13.7 16.5
United States
Exports 23.4 42.4 42.8 45.9 46.3Imports 24.4 30.0 22.1 23.7 22.2
Balance -1.0 12.5 20.7 22.2 24.1
Europe
Exports 32.9 31.6 31.9 37.6 32.5Imports 29.6 24.7 26.0 33.8 28.5
Balance 3.3 6.9 5.9 3.8 4.0
Japan
Exports 14.6 17.3 16.7 18.2 18.8Imports 23.0 26.3 25.3 30.8 30.8
Balance -8.4 -9.0 -8.6 -12.6 -12.0
Source: Department of International Economic and Social Affairs of the UnitedNations Secretariat, based on IMF, Direction of Trade Statistics.
a Argentina, Brazil, Hong Kong, India, Malaysia, Philippines, Republic of Korea,Singapore, Thailand and Yugoslavia.
b January-October.
165

Table A.III.6. Current account balances ofthe developing countries
(Billions of dollars)
1980 1981 1982 1983 1984 1985 1986 1987'
Surplus energy exporters(8 economies)
Merchandise exports 216.9 199.3 153.3 120.1 109.8 94.6 59.7 75.5Merchandise imports (Lo.b.) -76.6 -91.4 -94.4 -86.3 -75.7 -59.5 -52.6 -50.7Balance of trade 140.3 108.0 58.9 33.8 34.0 35.0 7.0 . 24.8Net services and private trans-
fers -34.5 -43.2 -42.7 -39.3 -36.3 -27.0 -15.7 -19.2Current account 105.8 64.8 16.2 -5.5 -2.2 8.0 -8.6 5.6
Deficit energy exporters(19 economies)
Merchandise exports 140.9 139.9 125.9 121.4 132.5 125.5 89.7 103.0Merchandise imports (f.o.b.) -108.0 -128.9 -116.1 -97.1 -96.4 -91.9 -80.5 -82.5Balance of trade 33.0 11.0 9.9 24.2 36.2 33.7 9.3 20.5Net services and private trans-
fers -30.9 -38.3 -44.8 -34.9 -36.4 -37.2 -30.2 -30.5Current account 2.1 -27.3 -34.9 -10.6 -0.2 -3.5 -20.9 -10.0
Energy-importing countries(98 economies)
Merchandise exports 200.9 214.7 204.1 211.5 240.4 236.8 261.7 318.4Merchandise imports (f.o.b.) -258.3 271.0 -249.5 -240.3 -247.8 -241.6 -257.1 -309.3Balance of trade -57.3 -56.3 -45.3 -28.8 -7.3 -4.8 4.6 9.1Net services and private trans-
fers -11.5 -15.7 -19.4 -16.4 -22.5 -17.7 -13.5 -13.6Current account -68.8 -72.0 -64.7 -45.2 -29.9 -22.5 -8.9 -4.5
Surplus exporters of manufactures(3 economies)b
Merchandise exports 56.5 65.0 63.7 70.3 85.0 87.0 108.1 139.3Merchandise imports (f.o.b.) -61.5 -67.9 -64.3 -66.9 -74.3 -75.4 -87.1 -114.1Balance of trade -5.0 -2.9 -0.7 3.3 10.6 11.6 20.9 25.2Net services and private trans-
fers -2.4 -2.8 -1.0 -1.3 -3.5 -1.2 1.6 1.8Current account -7.4 -5.7 -1.6 2.1 7.1 10.4 22.5 27.0
Other energy importers(95 economies)
Merchandise exports 144.4 149.7 140.5 141.2 155.5 149.8 153.7 179.1Merchandise imports (f.o.b.) -196.8 -203.1 -185.1 -173.4 -173.5 -166.2 -170.0 -195.2Balance of trade -52.4 -53.4 -44.7 -32.2 -18.0 -16.4 -16.3 -16.1Net services and private trans-
fers -9.1 -12.9 -18.4 -15.1 -19.0 -16.5 -15.1 -15.4Current account -61.5 -66.3 -63.1 -47.3 -37.0 -32.9 -31.4 -31.5
All capital importers(117 economies)
Merchandise exports 341.9 354.6 330.1 332.9 373.0 362.4 351.5 421.4Merchandise imports (Lo.b.) -366.2 -399.9 -365.5 -337.5 -344.2 -333.5 -337.6 -391.8,Balance of trade -24.4 -45.3 -35.5 -4.6 28.8 28.9 13.9 29.6Net services and private trans-
fers -42.3 -53.9 -64.2 -51.2 -58.9 -54.9 -43.7 -44.1Current account -66.7 -99.2 -99.6 -55.8 -30.1 -26.0 -29.8 -14.5
ChinaMerchandise exports 18.5 22.0 21.1 20.7 23.9 25.1 25.8 39.5Merchandise imports (Lo.b.) -21.2 -20.3 -16.9 -18.7 -23.9 -38.2 -34.9 -43.2Balance of trade -2.8 1.7 4.2 2.0 0.0 -13.1 -9.1 -3.7Net services and private trans-
fers 0.3 0.3 1.6 2.4 2.4 1.6 2.0 3.3Current account -2.4 2.0 5.9 4.4 2.4 -11.5 -7.2 -0.4
166

All developing countries(126 economies)
Merchandise exports 577.3 576.0 504.4 473.7 506.7 482.1 436.9 536.4Merchandise imports (f.o.b.) -464.1 -511.6 -476.8 -442.5 -443.8 -431.3 -425.1 -485.7Balance of trade 113.2 64.4 27.7 31.2 62.9 50.8 11.8 50.7t>!et services and private trans-
fers -76.5 -96.9 -105.2 -88.1 -92.8 -80.3 -57.4 -60.0Current account 36.7 -32.5 -77.5 -56.9 -29.9 -29.5 -45.6 -9.3
Sources: Department ofInternational Economic and Social Affairs of the United Nations Secretariat, based on dataofIMF and official national and other sources.
a Preliminary estimates.
b Hong Kong, Republic of Korea and Taiwan, Province of China.
Table A.II!.7. Official reserves and ratios of reserves to current expendituresofthe capital-importing developing countries
1980 1981 1982 1983 1984 1985 1986 1987'
Billions ofdollars
Level of reservesb 108.6 98.1 80.3 81.8 93.9 103.0 98.6 112.2of which:
Energy exporters 44.5 39.8 28.8 31.3 36.4 38.9 33.0 42.5Energy importers 64.0 58.4 51.5 50.5 57.5 64.2 65.5 69.7Fifteen heavily-indebted coun-
tries' 50.0 41.7 26.3 27.5 39.6 40.9 32.7 39.8Sub-Saharan Africa' 3.9 3.4 2.8 3.0 3.1 4.1 5.1 5.5
Number ofmonths
Coverage of current expenditures' 2.7 2.2 1.8 2.1 2.4 2.7 2.7 2.8of which:
Energy exporters 3.2 2.4 1.9 2.4 2.7 3.0 2.9 3.6Energy importers 2.4 2.1 1.8 2.0 2.3 2.6 2.6 2.4Fifteen heavily-indebted coun-
tries' 3.1 2.3 1.6 2.1 3.0 3.2 2.8 3.1Sub-Saharan Africa' 1.1 1.0 0.9 1.1 1.1 1.5 1.7 1.7
Source: Department of International Economic and Social Affairs of !be United Nations Secretariat, based on dataofIMF and national and regional estimates.
a Partly estimated.
b Total reserves, end of period (with gold valued at SDR 35 per ounce).
c Argentina, Bolivia, Brazil, Chile, Colombia, Cote d'Ivoire, Ecuador, Mexico, Morocco, Nigeria, Peru, Philippines, Uruguay, Venezuela and Yugoslavia.
d Excluding Nigeria. .
e Expenditures on goods and services (including interest payments) for given year relative to total reserves at endof year, sample of 98 countries.
167

Table A.II1.8. Development finance commitments of Arab nationaland regional development institutions"
(Millions of dollars)
1982 1983 1984 1985 1986 1987'
Functional compositionProject finance
(loans or equity) 2085.8 1 410.2 1 158.2 999.6 1 163.1 615.8Technical assistance
(grants and loans) 52.9 24.2 20.9 42.1 37.1 51.8Import financing (grants, loans and
leasing) 436.4 506.0 768.3 603.9 658.6 380.1Balance of payments
(OPEC Fund loans) 83.5 25.5 3.7 5.8 11.4Other (grants)' 35.0 6.4 7.4 6.1 0.9 0.8
Total 2693.6 1972.3 1 958.5 1651.7 1 865.5 1059.8
Geographical distributionAfrica 1458.4 841.7 864.5 616.4 1008.5 564.4West Asia 425.6 424.1 544.0 485.8 378.1 157.3Other Asia and the Pacified 655.0 507.3 393.4 393.6 314.1 220.9Other' 154.6 199.2 156.6 156.0 164.8 117.3
Total 2693.6 1972.3 1958.5 1651.7 1865.5 1059.8
Source: Department ofInternational Economic and Social Affairs of the United Nations Secretariat, based on dataof the Co-ordination Secretariat of Arab National and Regional Development Institutions (Kuwait).
a Abu Dhabi Fund for Arab Economic Development, Arab Bank for Economic Development in Africa, ArabFund for Economic and Social Development, Iraqi Fund for External Development (1982), IslamicDevelopment Bank, Kuwait Fund for Arab Economic Development, OPEC Fund for InternationalDevelopment and Saudi Fund for Development. The funds included here account for roughly a third (1982) ofaDA commitments by developing countries as reported by OECD (i.e., data exclude contributions to mostmultilateral institutions and bilateral aDA outside the listed institutions and aDA by non-Arab donors).
b January-August.
c Including contributions to IFAD, subscriptions to the UNCTAD Common Fund on behalf oflow-incomecountries and research projects to be undertaken by various institutions.
d Including China.
e Including international agencies and organizations.
168

Table A.III.9. Net flow oflMF lending to the capital-importingdeveloping countries, 1980-1987
(Billions of dollars)'
1980 1981 1982 1983 1984 1985 1986 1987
Regular facilities 2.3 5.7 4.2 8.8 4.3 1.1 -0.6 -3.8Credit tranche drawings 1.5 3.3 1.9 4.0 1.2 1.1 0.3 -1.8Extended facility drawings 0.7 2.4 2.3 4.9 3.2 0.0 -0.9 -1.9
Special facilities 1.2 1.4 2.2 -0.2 -0.8 -2.1 -0.9Buffer stock financing 0.1 0.3 -0.2 -0.2 -0.1Compensatory financing 0.3 0.6 1.7 2.1 -0.4 -1.4 -0.7Oil facility -0.7 -0.7 -0.4 -0.1Trust Fund 1.6 0.1 -0.2 -0.3 -0.6 -0.6Structural adjustment facility 0.1 0.5
Total flows 3.4 5.7 5.7 11.1 4.2 0.3 -2.7 -4.6
Memorandum itemsSelected characteristics of higherconditionality lending agreements
Number initiated during year 28 31 19 33 20 26 31 25Average length (months) 20 23 14 18 14 16 22 26Total amount committed 7.5 24.4 2.6 15.7 4.0 3.4 4.0 4.4
Source: Department of International Economic and Social Affairs of the United Nations Secretariat, based on IMF,International Financial Statistics and IMF Survey, various issues.
a Net flows in SDRs converted to dollars at yearly average exchange rates.
Table A.m.1O. International capital flows of the Federal Republic of Germany,1980-1987
(Billions of dollars)'
1980 1981 1982 1983 1984 1985 1986 1987
Current accountb -13.8 -3.6 5.1 5.3 9.7 16.2 37.9 44.3
Long-term capital, net 3.2 3.7 -5.8 -2.7 -7.0 -4.6 16.4 -13.8
Investment abroad of the FederalRepublic of Germany -15.5 -11.9 -11.7 -14.3 -15.8 -21.0 -24.5 -34.4
Direct investment -4.0 -3.9 -2.5 -3.2 -4.4 -4.8 -9.0 -8.4Securities -4.2 -2.7 -4.7 -4.1 -5.5 -10.7 -9.5 -14.2Long-term credit transactions -6.1 -4.3 -3.6 -5.8 -5.0 -4.4 -4.7 -10.3Other -1.1 -1.1 -0.9 -1.3 -0.9 -1.0 -1.4 -1.6
Foreign investment in the FederalRepublic of Germany 18.7 15.6 5.8 11.6 8.9 16.4 41.0 20.7
Direct investment 0.4 0.3 0.8 1.8 0.7 0.7 1.4 1.1Securities 0.5 0.4 1.1 5.3 6.1 13.0 34.0 18.5Long-term credit transactions 17.9 14.8 3.9 4.5 2.0 2.6 5.6 1.1Other -0.1 -0.1 -0.1 -0.1
Short-term capital, net -3.4 -1.2 4.5 -4.5 -6.2 -14.2 -52.3 -10.6
Net bank flows -4.9 -4.5 3.3 0.7 -9.4 -27.1 -3.1Enterprises, individuals 1.2 2.6 1.3 -3.5 -5.7 -4.8 -24.8 -5.9Official 0.2 0.8 -0.1 -1.7 -0.6 -0.5 -1.6
Errors and omissions -1.3 -2.5 0.3 2.4 3.3 0.7 5.6
Reserve-related flows 15.3 1.0 -1.3 1.6 1.1 -0.6 -2.7 -25.5
Source: Statistical Supplement to the Monthly Report ofthe Deutsche Bundesbank, Series 3.
a A minus sign (-) indicates an outflow from the Federal Republic of Germany or an addition to reserves; dollarvalues are converted from deutsche mark at average annual exchange rates.
b Including official transfers.
169

Table A.I1I.11. International capital flows of Japan, 1980-1987
(Billions of dollars)"
1980 1981 1982 1983 1984 1985 1986 1987
Current account balanceb -10.7 4.8 6.9 20.8 35.0 49.2 85.8 86.7
Long-term capital, net 2.3 -9.7 -15.0 -17.7 -49.6 -64.5 -131.5 -137.1
Japanese capital -10.8 -22.8 -27.4 -32.5 -56.8 -81.8 -132.1 -133.4Direct investment -2.4 -4.9 -4.5 -3.6 -6.0 -6.5 -14.5 -19.5Trade credits -0.7 -2.7 -3.2 -2.6 -4.9 -2.8 -1.8 -0.6Loans -2.6 -5.1 -7.9 -8.4 -11.9 -10.4 -9.3 -16.7Securities -3.8 -8.8 -9.7 -16.0 -30.8 -59.8 -102.0 -87.8Other -1.4 -1.3 -2.0 -1.8 -3.2 -2.3 -4.5 -8.8
Foreign capital 13.1 13.1 12.4 14.8 7.1 17.3 0.6 -3.7Direct investment 0.3 0.2 0.4 0.4 0.6 0.2 1.2Securities' 13.1 13.2 11.9 14.1 7.2 16.7 0.5 -6.1Other" -0.3 -0.3 0.2 0.2 -0.1 -0.1 -0.1 1.2
Short-term capital, net 16.3 8.7 -1.5 -3.5 13.3 9.9 56.9 95:7Non-bank transactions 3.1 2.3 -1.6 -4.3 -0.9 -1.6 23.9Foreign exchange banks 13.1 6.4 -3.6 17.6 10.8 58.5 71.8
Errors and omissions -3.1 0.5 4.7 2.1 3.7 4.0 2.5 5.7
Reserve-related flows -4.7 -4.2 4.9 -1.6 -2.4 1.5 -13.7 -50.9
Sources: Bank of Japan, Balance ofPayments Monthly; and Japanese authorities.
a A minus sign (-) indicates an outflow of capital from Japan or an addition to reserves.
b Including official transfers.
c Excluding Gensaki transactions, which are included in short-term capital.
d Mainly loans.
Table A.III.l2. International capital flows of the United States, 1980-1987
(Billions of dollars)"
1980 1981 1982 1983 1984 1985 1986 1987
Current account balanceb 1.9 6.9 -8.7 -46.2 -107.0 -116.4 -141.4 -160.7
Net private capital flows -30.2 -22.6 -19.9 35.4 85.8 106.3 84.3 84.1
United States private capital -72.8 -100.7 -110.1 -43.6 -13.7 -24.7 -94.4 -74.2Direct investment -19.2 -9.6 2.4 -0.4 -2.8 -17.3 -28.0 -38.2Securities -3.6 -5.7 -8.0 -6.8 -4.8 -7.5 -3.3 -3.7Banking flows -46.8 -84.2 -111.1 -29.9 -11.1 -1.3 -59.0 -33.4Non-banking flows -3.2 -1.2 6.6 -6.5 5.0 1.4 -4.0 1.1
Foreign private capital 42.6 78.1 90.2 79.0 99.5 131.0 178.7 158.3
Direct investment 16.9 25.2 13.8 11.9 25.4 19.0 25.1 40.6Securities, of which 8.1 9.8 13.1 16.9 35.6 71.4 79.1 36.0
Equity shares 4.2 5.1 3.6 6.4 -1.3 4.3 17.0 15.4Banking flows 10.7 42.1 65.6 50.3 33.8 41.0 77.4 77.9Non-banking flows 6.9 0.9 -2.4 -0.1 4.7 -0.5 -2.8 3.8
Net official flows 2.1 -5.3 -7.5 -0.4 -5.6 -7.8 33.1 54.7
Foreign official capital 15.5 5.0 3.6 5.8 3.0 -1.1 34.7 44.3United States official reserves -8.2 -5.2 -5.0 -1.2 -3.1 -3.9 0.3 9.2Other United States Government
assets -5.2 -5.1 -6.1 -5.0 -5.5 -2.8 -1.9 1.2
Statistical discrepancy 25.0 19.9 36.1 11.2 26.8 17.9 23.9 21.9
Source: United States Department of Commerce, Survey ofCurrent Business.
a A minus sign (-) indicates an outflow of capital from the United States.
b Including official transfers.
170
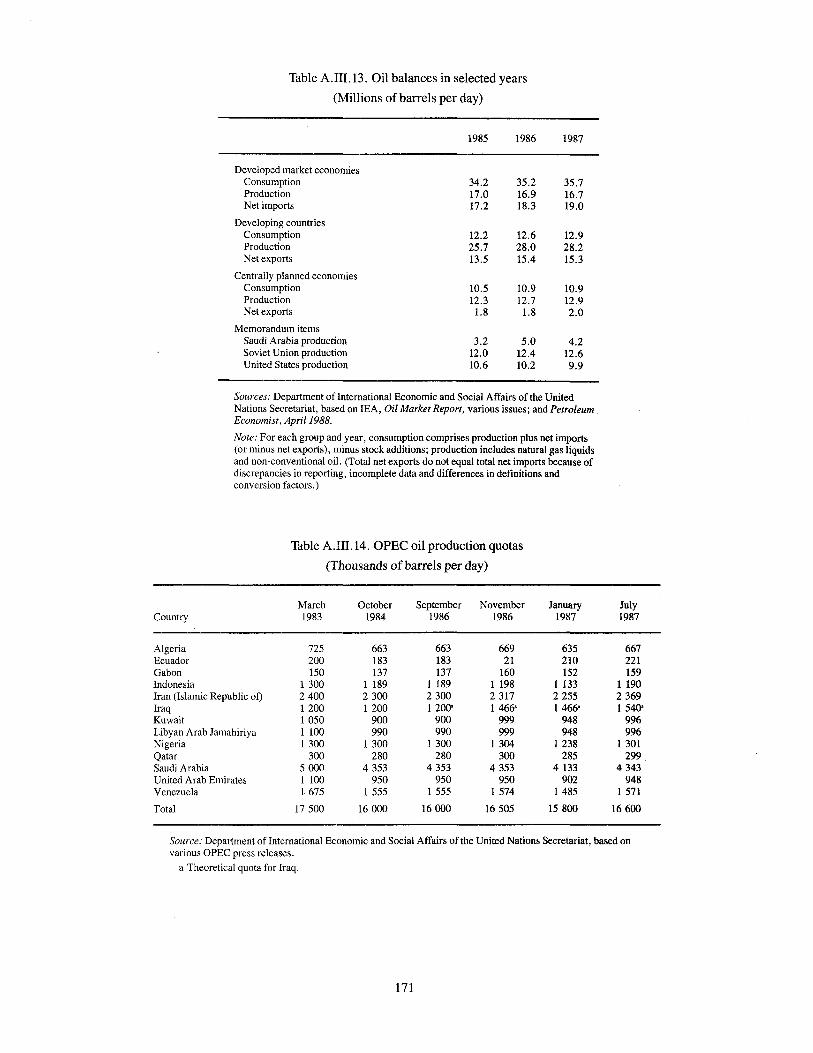
Table A.I1I.l3. Oil balances in selected years
(Millions of barrels per day)
1985 1986 1987
Developed market economiesConsumption 34.2 35.2 35.7Production 17.0 16.9 16.7Net imports 17.2 18.3 19.0
Developing countriesConsumption 12.2 12.6 12.9Production 25.7 28.0 28.2Net exports 13.5 15.4 15.3
Centrally planned economiesConsumption 10.5 10.9 10.9Production 12.3 12.7 12.9Net exports 1.8 1.8 2.0
Memorandum itemsSaudi Arabia production 3.2 5.0 4.2Soviet Union production 12.0 12.4 12.6United States production 10.6 10.2 9.9
Sources: Department of International Economic and Social Affairs of the UnitedNations Secretariat, based on lEA, Oil Market Report, various issues; and PetroleumEconomist, April 1988.
Note: For each group and year, consumption comprises production plus net imports(or minus net exports), minus stock additions; production includes natural gas liquidsand non-conventional oil. (Total net exports do not equal total net imports because ofdiscrepancies in reporting, incomplete data and differences in definitions andconversion factors.)
Table A.I1I.14. OPEC oil production quotas
(Thousands ofbarrels per day)
March October September November January JulyCountry 1983 1984 1986 1986 1987 1987
Algeria 725 663 663 669 635 667Ecuador 200 183 183 21 210 221Gabon 150 137 137 160 152 159Indonesia 1300 1 189 1 189 1 198 1 133 1 190Iran (Islamic Republic of) 2400 2300 2300 2317 2255 2369Iraq 1200 1200 1200' 1466' 1466' 1540'Kuwait 1050 900 900 999 948 996Libyan Arab Jamahiriya 1 100 990 990 999 948 996Nigeria 1 300 1300 1300 1 304 1238 1301Qatar 300 280 280 300 285 299Saudi Arabia 5000 4353 4353 4353 4133 4343United Arab Emirates 1 100 950 950 950 902 948Venezuela 1675 1 555 1555 1574 1485 1571
Total 17 500 16000 16000 16505 15800 16600
Source: Department of International Economic and Social Affairs of the United Nations Secretariat, based onvarious OPEC press releases.
a Theoretical quota for Iraq.
171

Table A.IIU5. Production of crude oil in developing countries
(Millions of barrels)
Country 1970 1980 1985 1986 1987
OPEC countries 8508.9 9781.8 5869.6 6590.5 6459.0
Non-OPEC developing countries 1021.0 2019.4 2883.3 2882.3 2982.5
Oil-exporting developing countries 748.7 1665.7 2223.9 2213.9 2332.3Angola 37.0 54.2 83.4 102.2 124.6Bahrain 27.9 17.6 14.8 16.1 15.8Bolivia 8.2 8.1 6.7 6.6 6.8Brunei Darussalam 48.8 91.3 6.7 60.7 48.8Cameroon 19.7 48.9 65.7 62.1Colombia 82.7 47.5 66.5 110.6 141.5Congo 0.1 24.0 2.6 42.0 43.1Egypt 119.7 214.6 323.5 296.5 328.2Malaysia 6.3 96.7 158.8 183.6 170.6Mexico 157.0 729.5 990.4 886.2 926.3Oman 121.1 102.4 180.4 197.4 206.2Peru 25.9 70.4 67.9 65.0 60.8Syrian Arab Republic 31.0 60.9 67.4 70.6 84.6Trinidad and Tobago 52.7 80.2 67.1 61.0 59.5Tunisia 30.3 41.1 39.5 39.2 38.1Yemen 2.6 3.7Zaire 7.5 9.3 7.9 11.6
Energy-deficient developing countries 272.3 353.7 659.4 668.4 650.2Argentina 146.2 184.6 172.5 156.8 153.0Bangladesh 0.2 0.2 0.2Barbados 0.3 0.7 0.6 0.5Benin 2.4 2.7 4.4Brazil 58.3 64.5 200.7 210.0 205.4Burma 5.8 11.4 12.0 11.0 8.8Chile 10.7 11.7 11.6 11.6 10.3Cote d'Ivoire 0.9 10.3 7.4 5.8Cuba' 1.2 2.0 6.3 6.9 7.3Ghana 0.6 0.7 0.2Guatemala 1.5 1.3 1.9 1.4India 49.7 68.6 218.0 227.9 222.2Jordan 0.1 1.5Morocco 0.3 0.1 0.1 0.2 0.1Pakistan 3.5 9.3 14.9 15.2Philippines 3.9 4.1 2.2 1.9Suriname 0.7 1.0 0.8Thailand 0.1 0.1 8.5 12.8 11.4
Total 9529.9 11 801.2 8752.9 9472.8 9441.5
Sources: Department ofInternaitonal Economic and Social Affairs ofthe United Nations Secretariat,based on Energy Statistics Yearbook, 1982 and 1985 (United Nations publications, Sales Nos.EF.84.XVII.4 and EF.86.XVII.13); Oil and Gas Journal. 22 and 29 December 1986 and28 December 1987.
172

Table A.III.16. Exploration expenditures of major oil companies,1982-1986
(Millions of dollars)
Company 1982 1983 1984 1985 1986
British Petroleum 1892 1433 1359 1415 1011
Exxon 1773 1408 1404 1495 920
Gulf Oil' 752 601
Mobil 847 618 619 702 580
Royal Dutch/Shell 1495 1322 1320 1462 1387
Chevron' 967 775 1032 1054 562
Texaco 1435 1 110 1309 802 465
Total 9161 7267 7043 6930 4925
Source: OPEC, Annual Statistical Bulletin, 1986 (Vienna), p. 135.
a Gulf Oil merged with Chevron in 1984.
Table A. III .17. Capital investments of major oil companies,in production, 1982-1986
(Millions of dollars)
Company 1982 1983 1984 1985 1986
British Petroleum 2657 2109 1991 1906 1315
Exxon 5557 4677 5619 6066 3680
Gulf Oil" 2100 1739
Mobil 2283 1938 1836 1106 1317
Royal Dutch/Shell 3992 3274 3986 5173 2899
Chevron" 1823 1315 2314 1748 1142
Texaco 1 185 1257 1223 1298 923
Total 19597 16309 16969 17 797 11276
Source: OPEC, Annual Statistical Bulletin, 1986 (Vienna), p. 135.
a Gulf Oil merged with Chevron in 1984.
173

Table A.Ill.18. Capital expenditure on petroleum by majority-owned foreignaffiliates of United States companies, 1982-1988
(Millions of dollars)
Actual expenditures Latest plans
1982 1983 1984 1985 1986 1987 1988
Developed market economies 11437 8939 8926 8733 6055 6039 6261Australia 678 538 436 327 534 536 505Canada 3380 2375 2547 2665 1488 1650 1922Western Europe 7252 7670 5822 5626 3829 3661 3654
Developing countries 8270 6468 4928 4620 3297 3252 3547Latin America 1915 996 822 950 720 619 628Africa 2350 1778 1368 1421 925 918 965Middle East 638 661 571 437 297 236 234Asia and the Pacific 3368 3032 2166 1813 1354 1479 1720
Total 20760 IS 915 14124 13 673 9606 9482 10010
Source: Department ofInternational Economic and Social Affairs of the United Nations Secretariat, based on EllenM. Herr, "Capital expenditures by majority-owned foreign affiliates of U.S. Companies, 1986 and 1987", and lac.cit., 1987 and 1988, Survey ofCurrent Business (Washington, D.C., United States Department of Commerce,October 1986 and September 1987).
Table A.Ill.19. Profit margins on crude oil and gas produciton'(Dollars per barrel of oil equivalent)
United States Outside United States
1985 1986 1985 1986
Revenue 19.99 11.56 25.00 14.50
Lifting cost 4.36 3.93 6.15 4.78
Government take 5.27 0.69 10.21 3.30
Other (0.04) 0.05 0.06 (0.48)
Exploration 2.35 1.61 1.96 1.66
Margin 8.05 5.28 6.62 5.24
Source: Paper prepar-ed by Robert B. Weaver for the International Herald Tribune andOil Daily Conference, London, 22 and 23 October 1987.
a Margins are on a cash basis before deduction of financing charges, overhead anddepreciation.
174

'i~\ r-")t\ "':"IJ~ j&. J..-aJ-1~:<,;.SJI .y~ ~I . ~WI .L..;i ~ ~ c:jrll JJ>J 0LS:11 .y ;~I r-"";1 0~~ J<. J~I ~
.~ ~ Ji !lJ.>-;...,; ~ ~I r-' . ;~I r--";I : J! ~I) l..,.. J-.L.::;.;JI
1m faJ !ltJ IfdHr~ til I'i& #J~~OOili~_~~~WA~~~~W~W~~.~Wo~~~~~~.~ffi~Bn.B~li~
~~OOt1lWmo
HOW TO OBTAIN UNITED NATIONS PUBLICATIONS
United Nations publications may be obtained from bookstores and distributors throughout theworld. Consult your bookstore or write to: United Nations, Sales Section, New York or Geneva.
COMMENT SE PROCURER LES PUBLICATIONS DES NATIONS UNIES
Les publications des Nations Unies sont en vente dans les librairies et les agences depositairesdu monde entier. lnformez-vous aupres de votre libraire ou adressez-vous a: Nations Unies,Section des ventes, New York ou Geneve.
KAK nOJIYY:MTb M3.llAHMH oprAHM3AUMI1 OIi'bE.llI1HEHHbIX HAUI1I1
M31laHII1I OpraHII3aUIIII 061>eIlIlHeHHbIX HaUIIH MOlKHO kynllTb B KHlllKHbIX Mara311HaxII areHTcTBax BO Bcex paHoHax Mllpa, HaBoilIITe cnpaBKII 06 H31laHIIlIX BBaweM KHlIlKHOMMara311HC IIJTII rrllWllTe no aJlpecy: OpraHll3aUlIlI 061>eJlIIHeHHblx HaUllH, CeKUllll nonpOllalKe 1131laHIIH, HbfO-HoPK llJJll )KeHeBa.
COMO CONSEGUIR PUBLICACIONES DE LAS NACIONES UNIDAS
Las publicaciones de las Naciones Unidas estarr en venta en librerfas y casas distribuidoras entodas partes del mundo. Consulte a su librero 0 dirfjase a: Naciones Unidas, Seccion de Ventas,Nueva York 0 Ginebra.
Litho in United Nations, New York40433-June 1988-6,850
03200ISBN 92-1-109114-4
United Nations publicationSales No. E.88.II.C.1
E/1988/50ST/ESA/205