The Journal of Physical Chemistry 1977 Volume.81 No.16
84
PHYSICAL C H E M IST R Y
-
Upload
khangminh22 -
Category
Documents
-
view
1 -
download
0
Transcript of The Journal of Physical Chemistry 1977 Volume.81 No.16

P H Y S I C A L
C H E M I S T R Y

THE JOURNAL OF
PHYSICAL CHEMISTRyT
BRYCE CRAWFORD, Jr., EditorSTEPHEN PRAGER, Associate EditorROBERT W. CARR, Jr., C. ALDEN MEAD, Assistant Editors
EDITORIAL BOARD: C. A. ANGELL 0973-1977), F. C. ANSON (1974--1978),V. A. BLOOMFIELD (1974--1978), J. R. BOLTON (1976-1980), L. M. DORFMAN (1974-1978),W. E FALCONER 0977-1978), H. L. FRIEDMAN (1975-1979), H. L. FRISCH (1976-1980),W. A. GODDARD (1976-1980), E. J. HART (1975-1979), W. J. KAUZMANN 0974-1978),R. L. KAY (1977-1981), D. W. McCLURE (1974--1978), K. MYSELS (19':'7-1981),R. M. NOYES (1973-1977), R. G. PARR (1977-1979), W. B. PERSON (1~76-1980),
J. C. POLANYI (1976-1980), S. A. RICE (1976-1980), F. S. ROWLAND 11973-1977),R. L. SCO'IT (1973-1977), W. A. STEELE (1976-1980), J. B. STOTHERS (1974--1978),F. A. VAN-CATLEDGE (1977-1981), B. WEINSTOCK (1977)
Published by theAMERICA'N CHEMICAL SOCIETY
BOOKS AND JOURNALS DIVISION
D. H. Michael Bowen, Director
Marjorie Laflin, Assistant to the Director
Editorial Departm=nt: Charies R. Bertsch,Head; Marianne C. Brogan, AssociateHead; Celia B. McFarland. Joseph E.Yurvati, Assist.ant Editors
Magazine and Production Department:Bacil Guiley. Head
Research and Development Department:Seldon W. Terrant, Head
Advertising Office: Centcom, Ltd .. 25 SylvanRoad South. Westport. Conn. 06880.
© Copyright, 1977, by the AmericanChemical Society. No part of this publicationmay be reproduced in any form withoutpermission in writing from the AmericanChemical Society.
Published biweekly by the AmericanChemical Society at 20th and NorthamptonSts., Easton, Pennsylvania 18042. Secondclass postage paid at Washington, D.C. andat additional mailin,:: offices.
Editorial Information
Instructions for authors are printed inthe first issue of each volume. Please conformto these instructions when submitting manuscripts.
Manuscripts for publication should hesubmitted to The Journal of PhysicalChemistry. Department of Chemistry, Uni·versity of Minnesota. Minneapolis, Minn..')5455. Correspondence regarding acceptedpapers and proofs should be directed to the
American Ciemical Society1155 16th Street, NW.Washinl(ton, D.C. 20036(202) 872-4600
Editorial Department at the ACS Eastonaddress.
Page charges of $60.00 per page may bepaid for papers published in this journal.Payment does not affect acceptance orscheduling of papers.
Bulk reprints or photocopies of indiovidual articles are available. For informationwrite to Business Operations, Books andJournals Division at the ACS Washingtonaddress.
Requests for permission to reprintshould be directed to Permis.~ions,Books and.Journals Division at the ACS Washingtonaddress. The American Chemical Society andits Editors assume no responsihility for thestatements and opinions advanced by contrihutors.
Subscription and Business Information
1977 Suhscription rates-including surfacepostal(e
Canada,U.S. PlJAS Foreign
Memher $24.00 $~~.OO $34.00Nonmember 96.00 1011.00 106.00Supplementary
material 15.00 19.00 20.00
Air mail and air freight rates are avail·able from Membership & Suhscription Services. at the ACS Columhus address.
New and renewal subscriptions shouldbe sent with payment to the Office of theController at the ACS Washington address.Changes of address must include both oldand new addresses with ZIP code and a recentmailing label. Send all address changes to theACS Columbus address. Please allow sixweeks for change to become effective. Claimsfor missing numbers will not be allowed ifloss was due to failure of notice of change ofaddress to be received in the time ~pecified:
Mel1' b(,r:~. ~:;"Jt's:;.,i;>tio.'l· £-er ~IC~SAmt';.-(·~,j;' Ch~i.lit.a; So.:ieiYP.O. Box 31)37 .C';o)umbu'!, ;Ohio 43210161·t) 4?.1?2'30
if claim is dated (al North America-morethan 90 days beyond issue date, (bl all otherforeign-more thar I year beyond isslE date;or if the reason given is "missing from files".Hard copy claims are handled at the ACSColumbus address.
Microfiche subscriptions are aV'iilableat the same rates but are mailed first c13ss toU.S. subscribers, air mail to the rest of theworld. Direct. all inquiries to Special IssuesSales, at the ACS Washington addres.'! or call(202) 872-45.54. Sillgle issues in hard copyand/or microfiche Ere available from SpecialIssues Sales at the ACS Washington address.Current year $4.7.5. Back issue rates aVl]ablefrom Special Issues Sales. Back volumes areavailable in hard ·'opy and/or microform.Write to Special hsues Sales at the ACSWashington address for further informat.ion.Microfilm editions of ACS periodical publications are availahle from volume 1 t:> thepresent. For further information, contactSpecial Issues Sale~ at the ACS Washir.gtonaddress. Supplem~ntary material mentioned in the journal appears in the mi<Tofi1medition. Single copie, may be ordered drectlyfrom Business Operations, Books and •.Tournals Division, at tl:e ACS Washingt.(.n address.
PUAS, CtherU.S. Canada Fcreign
Microfiche $2..50 $3.00 $3..50Phot.ocopy
1-7 pages 4.00 5..50 7008-20 pages 5.00 6.50 300
Orders over 20 pages are available only onmicrofiche, 4 X 6 in., 24X, negative, dverhalide. Orders must state photocopy cr microfiche if both are available. Full bibliographic citation inc.uding names of all au·thors and prepayment are required. Pricesare subject to chang3.
Editorial Dt-partmentAmerican Chemical Society20th and Nt·rthampton S18.Easton, Pennsylvania 18042(215) 258-911 I
Notice to Authors last printed in the issue of January 13, 1977
THE JOURNAL OF
PHYSICAL CHEMISTRY
Volume 81, Number 16 August -11; 1!J'l7JPCHAx 81(16) 1531-1606 (t977)
·ISSNOO22~
Ion Photodissociation in the Two-Photon Region. Spectroscopy and Collisional QuenChing.ofBromobenzene Cations. . . . . . . . . . . . . . . . . Robert C. Dunbar· and Emil W. Fu 1531
Rare Gas Sensitized Radiolysis of Hydrogen Sulfide in the Presence of Butadiene. . . Antoni J6wko, Iwona Szamrej, and Mieczyslaw Forys· 1537
Rate Constants for the Reaction of Hydrogen and Deuterium Atoms with Silane... D. Mihelcic, V. Schubert, R. N. Schindler, and P. Potzinger· 1M3
Rate Constants for the Reactions of Hydrogen Atoms with Methylgermanes... E. R. Austin and F. W. Lampe· 1546
Oscillatory Evolution of Carbon Monoxide in the Dehydration of Formic Acid byConcentrated Sulfuric Acid . . . . . . . . . . . . . . Peter G. Bowers· and Gulnar Rawji 1549
Cis-Trans Photoisomerization of I3-Styrylnaphthalene and 3-Styrylquinoline... G. Gennari, G. Cauzzo,· and G. Galiazzo 1551
Size and Shape of Globular Micelles Formed in Aqueous Solution by n-Alkyl Polyoxyethylene Ethers... Charles Tanford,· Yasuhiko Nozaki, and Michael F. Rohde 1555
Light Scattering Study of Local Structures in Solutions. Chloroform-eetyltrimethylammoniumChloride System . . . . . . . . . . . . . . . . . Tadashi Kato and Tsunetake Fujiyama· 1560
The Deconvolution of Photoluminescence DataA. E. McKinnon, A. G. Szabo, and D. R. Miller· 1564.
Absorption and Fluorescence Spectra of the Intramolecular Dimer in Polyvinylnaphthalene... Masahiro Irie,· Takao Kamijo, Masayuki Aikawa, Takeshi Takemura,
Koichiro Hayashi, and Hiroaki Baba 1571
Inorganic Ion Exchangers. 10. A Neutron Powder Diffraction Study of the Hydrogen BondGeometry in a-Zr(HP04h·H20. A Model for the Ion Exchange
... J. Albertsson,· A. Oskarsson, R. Tellgren, and J. O. Thomas 1574
Surface Tension and Internal Pressure. A Simple Model . . . . . . . . . . David R. Rosseinsky 1578
An Approximate Treatment of Long-Range Interactions in Proteins... Matthew R. Pincus and Harold A. Scheraga· 1579
Effect of Gallium Ions and of Preparation Methods on the Structural Properties ofCobalt-Molybdenum-Alumina Catalysts
... M. Lo Jacono, M. Schiavello,· V. H. J. De Beer, and G. Minelli 1583
Analysis of Torsional Spectra of Molecules with Two Internal C3v Rotors. 7. Far-Infrared andLow-Frequency Raman Spectra of the Gaseous Dimethylphosphine
... J. R. Durig,· M. G. Griffin, and W. J. Natter 1588
The Fluorescent Level Inversion of Dual Fluorescences and the Motional Relaxation of Excited StateMolecules in Solutions
... Satoshi Suzuki,· Tsuneo Fujii, Akihiro Imai, and Hideo Akahori 1592
A Method for Calculating CNDO-MO Bonding Parameters. 1. . . Sankar Prasad Bhattacharyya and Mihir Chowdhury· 1598
A Method for Calculating CNDQ-MO Bonding Parameters. 2. Preliminary ApplicationsSankar Prasad Bhattacharyya and Mihir Chowdhury· 1602

COMMUNICATIONS TO THE EDITOR
The PhotoJ*roxidation of Unsaturated Organic Molecules. 17. The ThermalRegeneration of Acceptor B. Stevens· and R. D. Small, Jr. 1605
• Supplementary and/or miniprint material for this paper is available separately (consult the masthead pagefor ordering information); it will also appear following the paper in the microfilm edition of this journal.
• In papers with more than one author, the asterisk indicates the name of the author to whom inquiries aboutthe paper should be addressed.
AUTHOR INDEX
Aikawa, M., 1571 Forys, M., 1537 Kato, T., 1560 Rawji, G., 15·HAkahori, H., 1592 Fu, E. W., 1531 Rohde, M. F., 1555Albertsson, J .. 1574 Fujii, T., 1592 Lampe, F. W., 1546 Rosseinsky, D. R., 1578Austin, E. R., 1546 Fujiyama, T., 1560 Lo Jacono, M., 1583
Scheraga, H. A., 1579
Baba, H., 1571 Galiazzo, G., 1551 McKinnon, A. E., 1564 Schiavello, M., 1583
Bhattacharyya, S. P., Gennari, G., 1551 Mihelcic, D., 1543 Schindler, R. X, 1543
1598, 1602 Griffin, M. G., 1588 Miller, D. R., 1564 Schubert, V., 1543
Bowers, P. G. 1549 Minelli, G., 1583 Small, R. D., ~lr., 1605
Hayashi, K., 1571 Stevens, B., 1605
Cauzzo, G., 1E51 Natter, W. J., 1588Suzuki, S., 15P2Szabo, A. G., 1564
Chowdhury, M., 1598, Imai, A., 1592 Nozaki, Y., 1555 Szamrej, I., 15371602 lrie, M., 1571
Oskarsson, A., 1574 Takemura, T., 1571De Beer, V. H. J., 1583 Jowko, A., 1537 Tanford, C., 1555Dunbar, R. C., 1531 Pincus, M. R., 1579 Tellgren, R., 1574Durig, J. R., 1588 Kamijo, T., 1571 Potzinger, P., 1543 Thomas, J. 0., 1574
ANNOUNCEMENT
On the last two pages of this issue you will find reproduced the table of contents of theJuly 1977 issue of the Journal of Chemical and Engineering Data.
The Journal of Physlcsl Chemistry, Vol. 81. No. 16. 1977

THE JOURNAL OF
PHYSICAL CHEMISTRYRegistered in U. S. Patent Office © Copyright, 1977, by the American Chemical Society
VOLUME 81, NUMBER 16 AUGUST 11, 1977
Ion Photodissociation in the Two-Photon Region. Spectroscopy and Collisional
Quenching of Bromobenzene Cations
Robert C. Dunbar· t and Emil W. Fu
Department of Chemistry, Case Western Reserve UnIvBrsIty, Cleveland, "Ohio 44106 (Received March 1, 1977)
Publication costs assisted by the Petroleum Research Fund and the Air Force Geophysical Laboratory
It has been suggested recently by Freiser and Beauchamp that benzene cations undergo a sequential two-photonphotodissociation process, In this study, the photodissociation spectroscopy of bromobenzene cations belowthe one-photon energetic threshold was undertaken fIrst to provide a more substantial theoretical foundationand second to assess critically the extent to which the Freiser-Beauchamp picture of this process can serveas a framework for an exact quantitative analysis of two-photon data. The detailed treatment by three differentmethods of the time-resolved photodissociation data for bromobenzene cations confIrmed the validity of thesequential two-photon mechanism; and also provided the methodology for reduction of two-photon data tocross sections which can be directly compared with the usual photodissociation cross section in the one-photonregion. Careful analysis of two-photon photodissociation data also yields a direct measurement oi the absoluterate of deactivation of the vibrationally excited ion. Deactivation occurs on nearly every collision of bromobenzenecations with bromobenzene neutrals. The values measured were as follows: 0'1 (fIrst photon absorption) =4.4X 10⁻¹⁸ cm2; 0'2 (second photon absorption) = 7.9 X 10⁻¹⁸ cm2; K 3 (collisional deactivation) = 1.1 X 10⁻⁹cm3/molecule s.
IntroductionIn a rather extensive body of work investigating the
photodissociation of gas-phase ions as a function ofwavelength,I-IO two principal kinds of information soughthave been optical absorption information ahout the ionsand thermochemical information about the dissociationprocess. An assumption underlying the thinking aboutthese questions had been that photodissociation would bepossible only at photon energies above the energy thresholdfor dissociation, so that a thermochemical dissociationthreshold might be conveniently determined fromthreshold photodissociation, while spectroscopic studieswould be automatically limited to wavelengths abovethreshold. In pointing out and demonstrating for benzeneion the possibility of two-photon dissociation in a sequential process at moderate light intensities, Freiser andBeauchampll overturned these simple arguments. Thenewly recognized possibility of rapid photodissociation far
t AHred P. Sloan Fellow, 1973-1975.
1531
below the one-photon energetic threshold liberates thespectroscopic applicability of photodissociation from theconstraints of thermochemical considerations, while itgreatly complicates the analysis needed to obtain thresholdthermochemical information from threshold photodissodation spectral line shapes.
The analysis of photodissociation curves in the transitionregion between one-photon and two-photon behavior hasextraordinary potential for obtaining accurate thermochemical data concerning the dissociation reaction, and willbe discussed and illustrated in a later publication. Thenew possibilities inherent in using two-photon photodissociation to investigate spectral properties have alreadybeen exploited in obtaining the photodissociatian spectrumof methylnaphthalene cations,12 and the obvious successin this case underscores the need for convincing quantitative understanding of the two-photon process and forreliable data reduction procedures. Neither Freiser andBeauchamp's treatment, nor our own earlier analysis,12SeH!\ to satisfy these needs fully, and the detailed

1532 R. C. D unbar and E. W . Fu
treatment of bromobenzene ion data given below was undertaken to provide a more substantial theoretical foundation, and to assess critically the extent to which the Freiser-Beauchamp picture of this process can serve as the framework for an exact quantitative analysis of two-photon data. The analysis presented here will be aimed first at providing a confirmation of the quantitative validity of the sequential two-photon mechanism, and second at clarifying and quantifying the methodology for reduction of two- photon data to cross sections which can be directly compared with the usual photodissociation cross sections in the one-photon region.
Following initial submission of this work, a paper appeared by Orlowski et al.'concerned with two-photon photodissociation of cyanobenzene cation,13 which covers some of the theoretical development presented here. We have decided to retain these aspects here because of our somewhat more complete and perhaps useful development of the theory, .and because it seems desirable to point out the erroneous nature of the treatment in ref 11 and to describe correct simple procedures for approximate data analysis.
Another aspect of the two-photon process which is of considerable interest is the dependence of the equations on the rate of collisional quenching of vibrationally excited ions, which leads to the possibility of direct measurement of this rate. Although extensive studies have been carried out to determine relative quenching efficiencies of various neutrals in ion-neutral collisions, there is little information about the absolute rate of quenching. As will be clear below, careful analysis of two-photon dissociation data yields a direct measurement of the rate of deactivation of the vibrationally excited ion. The present results point the way toward future quantitative collisional-quenching investigations, although in the present case the trivial possibility of resonant charge-transfer quenching makes the results less interesting in themselves.
Experimental SectionPhotodissociation was followed by monitoring the de
crease under illumination of the parent-ion signal in the ion cyclotron resonance (ICR) spectrometer. The UV portion of the photodissociation spectrum of Figure 1 was obtained by standard 3teady-state ICR photodissociation methods with a Hg-Xe light source and monochromator (132-Á fwhm), as in previously described work.7
The visible portion of this spectrum was also obtained using the Hg-Xe arc source, with appropriate filters used to isolate the strong Hg lines in the lamp spectrum. In the visible, the photon energy is clearly in the two-photon region, and also, with the low arc-lamp light intensity, the experiment is in the low-intensity limit. It has been shown appropriate under these conditions12 to reduce the observed photodissociation rate K0bsd by the expression a1 = (constant) J_1(PKobsd)1/2, where I is the light intensity and P the pressure, in order to obtain the relative cross section o\ for “effective” absorption of the first photon; a, is then precisely comparable to the usual cross section for photodissociation in the one-photon region. The curve shape of the visible-region peak in Figure 1 was obtained by this simple normalization procedure. The absolute cross section calibration of this region was obtained from the detailed analysis of the laser data at 5145 Á described below. The absolute cross section of the UV peak is referenced back to the value13 5 X 1018 cm2 for the toluene ion at 4000 Á.
The quantitative 5145-Á laser data were obtained using the “time-resolved” mode of operation, in which the decay of the parent ion signal in a trapped sample of ions is
WAVELENGTH ( NM)250 300 400 500 600 700
Figure 1. The photodissociation spectrum of bromobenzene cations in the visible and the UV spectral region. The cross section in the UV (one-photon) region was obtained by standard means, while the data in the visible (two-photon) region were treated as described in the text to provide cross section values (cr1) corresponding to absorption of a single photon.
followed directly in real time after turning on the irradiating source. This experiment has been described in detail,9 and has the important advantages of allowing easy accurate quantitative measurements, and of revealing clearly potential problems such as ion rearrangement or interfering ion-molecule chemistry. We believe that considerable confidence can be placed in rate constants derived from clean, simply exponential photodissociation decay curves obtained by this approach. The laser source was a Coherent Radiation CR-12 argon-ion laser. Total power in the beam was measured with a thermopile, while the area of the beam, which was spread to a diameter of several centimeters to give flux uniformity over the ICR cell, was measured directly at a point corresponding to the source region of the ICR cell where the ions are believed to be concentrated in the ion trap used. Allowance was made for window transmission and back-reflection in the cell.14 Pressure was read from the ion pump gauge: calibration of the gauge against an MKS Baratron at higher pressures has indicated that for numerous aromatic compounds the indicated ion-pump pressure fortuitously agrees within 10-20% with the true pressure in the cell region (assuming linearity of the ion pump gauge). Ionizing energy was within 1-2 eV of the appearance potential for bromobenzene parent ions, and no significant fragment peaks were present in the absence of light.
Results and DiscussionThe energetics of the bromobenzene photodissociation
reaction
C6HsBr+- — >• C6Hs+ + Br- (1)
are well known,15 with the threshold lying at 3.52 eV (3500 A). The next most facile reactionC6H5Br+- - C6H„Br+ + H- (2)
was not observed; it is probably more endothermic than(1) by about 1 eV, and would not be expected to compete significantly with reaction 1 at these ion excitation energies.
The observed photodissociation spectrum is shown in Figure 1. Not surprisingly, the spectrum is similar to that previously described for the bromotoluene cation.7’9 The UV peak can be plausibly assigned to either a t -* n or
The Journal o f Physical Chemistry, Vol. 81, No. 16, 1977

1533
where the correction term
(5)
(8)
(10)
(11)
(14)(intercept)
are obtained from the slope and intercept, respectively,of a plot of l/A+ vs. pressure. It is thus possible to determine only two of the three unknown quantities 0"10 0"2,
and Ka by this analysis.It may be noted that this result, specificallyeq 14, differs
from the result obtained by Freiser and Beauchamp11 forthe same limits, which gave 1/10"1 as the intercept. Theirsteady-state-intermediate treatment is in fact not applicable, as shown by its disagreement with the completesolution. This is not unexpected since the steady-stateapproximation is strictly valid only in the limit where 10"1
and 10"2 are vanishingly small, and should not therefore beexpected to yield expressions containing the correct dependence on 0"1 and 0"2'
Assuming that the intensity-pressure regime of thepresent study can be approximated by the high-pressure
d[P+]/dt = (-Ial - K1HP+] + (KJ>)[P+*]
d[P+*lIdt = (la.)[P+] + (-la2 - KJ> - K1)[P+*] (4)
so that
[P+] + [P+*] A-In [P+]off "" In L _ A+ - A+ t (12)
This linear form is convenient for plotting time-resolveddata, and yields directly the value of A+ for a given decaycurve. Under high-pressure/low-intensity conditions it isclear from (8) that the quantities
a = K3/12ala2 (slope) (13)
and
(3 = (al + a2)/la 1a2
The exact integration of these equations yields
[P+] + [P+*] = A_ e-A• t _ A+ e-A_t[P+]off A_ - A+ ~ - ~
where [P+]off is the P+ concentration in the absence of light(I =0), and A-. and A+ are given by12
A±= 1/ 2 {Ial + la2 + K 3P:t fUa l + la2 + K 3PV- 4[2ala2 ]1/2} (6)
An important special case is the high-pressure low-intensity limit, defined by I
lal/K3P ~ 1 and la 2/K3H ~ 1 (7)
Expansion of (6) in terms of the small quantity PO"I0"2/(/tTl
+ /0"2 + KaP)2 yields a result .
"' ~ Pala21\+ - of- .1
/al + /a 2 + K 3P
ra 2a 2.1 = I 2
(lal + la2 + K 3P)3
is included for future reference, but will be ignored in mostof the following. Finally, for times t long enough for theinitial transient behavior to have died out (t » 1/A-.), theion decay curve becomes a simple exponential
~[P+] + [P+*]~ L_"" e A+t
[P+]off l?ng A- - A+tune
(3)
1Kl 1Kl 1Kl
out out out
where I is the light intensity (photon/cm2 s), P is thedensity of neutral gas (molecules/em3), 0"1 and 0"2 are crosssections for photon-induced processes, K3 is a collisionaldeactivation rate constant, and K1 is a rate constant fordestruction of ions by processes other than photodissociation. The only significant loss of generality is the assumption that K1 is equal for P+ and P+· (we use P+ andP+· to denote CJlJlr+ and (CJlJlr+)*, respectively); thisassumption will not lead to significant errors even if it isincorrect, since K 1 is very slow.
The nature of the (CJIJlr+.)* intermediate in (3) is ofinterest. In order for the kinetic scheme to be appropriateand for the effect to have the observed intensity, theinternal energy of this species must be assumed to beretained until collisional deactivation (the K 3 process),implying a lifetime of the order of 1 s. Fluorescent excitedelectronic states are clearly excluded on this time scale,and the remaining possibilities are phosphorescent electronic states and excited vibrational states. Beauchampet al.11,13 have argued that the excitation is vibrational, withthe initially formed excited doublet electronic state undergoing rapid «<10-8 s) internal conversion to the vibrationally hot electronic ground state. Involvement ofa phosphorescent (probably quartet) electronic state isconceivable, but for such a state to be formed and subsequently absorb the second photon with such high efficiency for the variety of molecules shov-ing this behaviorseems extremely improbable, and it seems nearly certainthat the intermediate is in fact a hot ground state ion.
If fluorescence of the excited doublet electronic statecompetes with internal conversion, there will probably belittle effect on the observed results: an event in which aphoton is absorbed and then reradiated on a time scale of10-8 s is unobservable in this experiment (except for apossible small amount of vibrational energy left behind),and such processes may safely be omitted from the kineticscheme, and their cross sections omitted from 0"1 and 0"2,
which are properly the cross sections for "effective" photonabsorption.12
The relevant kinetic equations for this experiment, inwhich the spectrometer monitors abundance of ions at theCJIJlr+ mass, are
Ion Photodlssociation in the Two-Photon Region
a 'lr -. r* excitation, and this question will be consideredin detail in subsequent work. The visible peak correspondsvery clearly to an n -. 1r electron promotion process; itinvolves the same excited cation electronic state as isobserved in the photoelectron spectrum of bromobenzene,17and which is commonly accepted to involve removal of anelectron from the out-of-plane halogen lone-pair orbitalThe optical transition to this state of the cation is stronglyallowed.
The absolute cross sections of the photodissoCiationpeaks are comparable to those which have been measuredfor other allowed photodissociation transitions in aromaticions such as toluene. The "oscillator strengths" forphotodissociation are of the order of 0.03 for both thevisible peak and the UV peak, not unreasonable for allowedoptical processes.
Two-P1wton Photodissociation Kinetics. The sequentialtwo-photon photodissociation scheme which Freiser andBeauchamp proposed for benzene cation,l1 and which wewill apply to bromobenzene ion, may be written, forbromobenzene
The Joumsl of Physical Chemistry, Vol. 81, No. 16. 197'('
1534 R. C. D unbar and E. W . Fu
low-intensity lim it for the bromobenzene ion, it is of interest to examine two questions: first, in this limit, exactly how much information can be obtained about ax, <x2, and K3 from the data; and second, whether the range of experimental conditions reaches a regime where deviations from this lim it become observable and useful.
Manipulation of eq 13 and 14 reveals that <rx, <r2, and K3 are more constrained than suggested by the discussion above. Rearranging (13) and (14) yields the equations
_ °2 _ °l° l I$o2 - 1 ° 2 IpOx ~ 1
and_ IPK3 ± [(Ip)2K 32- 4I2ccK3] 1'2
It is seen that if the K s are to be positive and finite, no solution is possible unlessa, and o2 >1/1(3 (15)K 3> K 3min = 4I2<x/(ip)2
which are thus exact lower limits on the rate constants. Better limits can be written if an assumption is made about the relation of IKX and IK2. There seems no reason to suppose that the optical absorption cross section will be very different for P+ and P+", since P+* is assumed to be a vibrationally hot electronic ground state. As Freiser and Beauchamp11 have noted, the chief difference is likely to arise because of spatial inhomogeneity of the light, and a consequent difference in the effective intensity between the and <r2 processes. It seems most unlikely that this effect could make 7<t2 as much as three times larger than Iah and if we put the limits 1 < Io2/Iai 3, we obtain the rather narrow set of limits2^
IP
4_
IP
o 1
o 2
" 3 Ip
3(IP)
> K3 > 4I 2 a
(IP)2
(16)
(17)
(18)
Observable deviations from the limit represented by eq 7 can arise (see eq 5, 8, and 9) if one of the following conditions holds true:
(1) X_ becomes small enough that the decay curve (12) intercepts at a value observably different from zero at t = 0; the actual intercept is given by
In:X-
X_ - X,In
r2oxo2k 32p2
i +
i
I20¡O;
(19)
so that deviation will be observable when the last term is greater than the uncertainty in intercept value. (The curvature in this plot due to the initial transient (second term on the right in eq 5) will also become observable at short times under similar conditions.)
(2) A becomes large enough to introduce curvature in the 1/X+ vs. pressure plot. This may be checked by noting from (8) that to the next better approximation
aP + P -1__________
7(a i + a2) + K 3P(2 0 )
so that curvature or deviation will become important if the
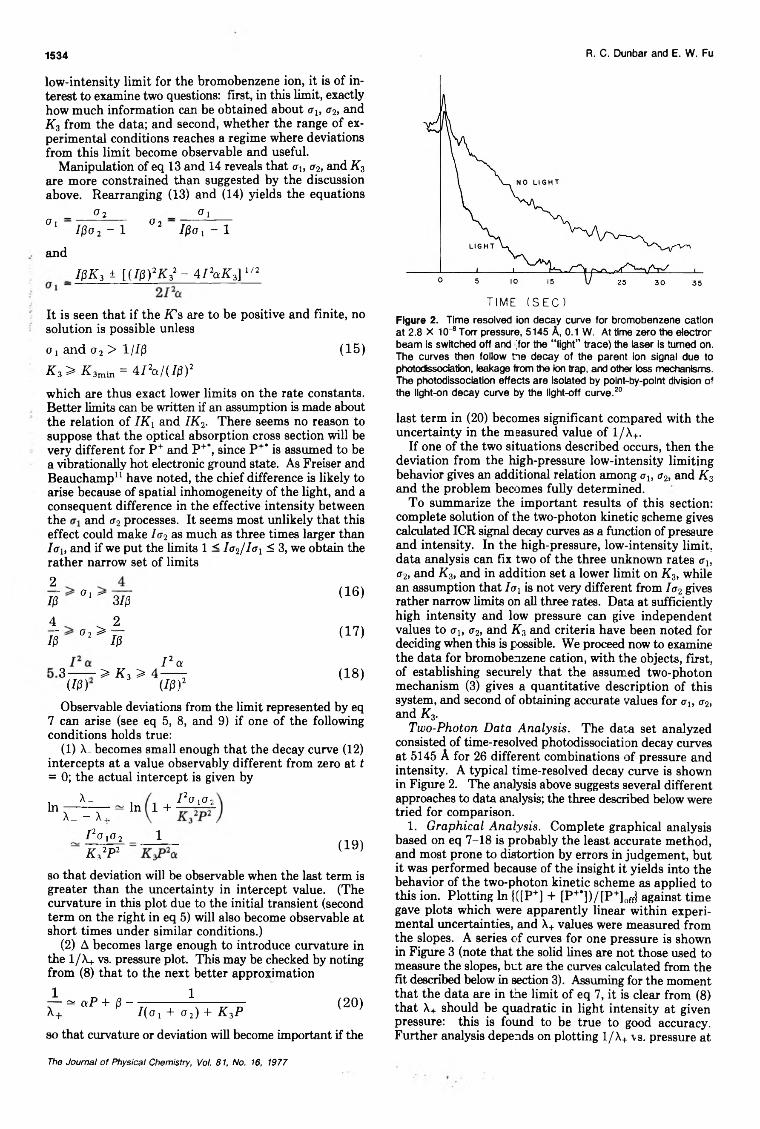
TIME (SEC)Figure 2. Time resolved ion decay curve for bromobenzene cation at 2.8 X 10~8 Torr pressure, 5145 A, 0.1 W . At time zero the electron beam is switched off and [for the “ light” trace) the laser is turned on. The curves then follow t ie decay of the parent ion signal due to photodissociation, leakage from the ion trap, and other loss mechanisms. The photodissociation effects are isolated by point-by-point division of the light-on decay curve by the light-off curve.20
last term in (20) becomes significant compared with the uncertainty in the measured value of 1/X+.
If one of the two situations described occurs, then the deviation from the high-pressure low-intensity limiting behavior gives an additional relation among <rx, o2, and K:i and the problem becomes fully determined.
To summarize the important results of this section: complete solution of the two-photon kinetic scheme gives calculated ICR signal decay curves as a function of pressure and intensity. In the high-pressure, low-intensity limit, data analysis can fix two of the three unknown rates <xh a2, and K3, and in addition set a lower lim it on K3, while an assumption that Ioi is not very different from Ia2 gives rather narrow limits on all three rates. Data at sufficiently high intensity and low pressure can give independent values to au a2, and Kz and criteria have been noted for deciding when this is possible. We proceed now to examine the data for bromobenzene cation, with the objects, first, of establishing securely that the assumed two-photon mechanism (3) gives a quantitative description of this system, and second of obtaining accurate values for <rlf a2, and K3.
Two-Photon Data Analysis. The data set analyzed consisted of time-resolved photodissociation decay curves at 5145 A for 26 different combinations of pressure and intensity. A typical time-resolved decay curve is shown in Figure 2. The analysis above suggests several different approaches to data analysis; the three described below were tried for comparison.
1. Graphical Analysis. Complete graphical analysis based on eq 7-18 is probably the least accurate method, and most prone to distortion by errors in judgement, but it was performed because of the insight it yields into the behavior of the two-photon kinetic scheme as applied to this ion. Plotting In j([P+] + [P+*])/[P+]off} against time gave plots which were apparently linear within experimental uncertainties, and X+ values were measured from the slopes. A series of curves for one pressure is shown in Figure 3 (note that the solid lines are not those used to measure the slopes, but are the curves calculated from the fit described below in section 3). Assuming for the moment that the data are in the limit of eq 7, it is clear from (8) that X+ should be quadratic in light intensity at given pressure: this is found to be true to good accuracy. Further analysis depends on plotting 1/X+ vs. pressure at
The Journal o f Physical Chemistry, Vol. 81, No. 16, 1977

Ion Photodissociation in the Two-Photon Region
Figure 3. The In j([P+] + [P+,])/[P+U values obtained from the time-resolved photodissociation decay curves at 5145 A were plotted against time. This figure shows the results obtained at 2.8 X 10"8 Torr with four light intensities: (a) 2.9 X 10¹⁶ photon cm2 s'1, (b) 5.8 X 10¹⁶ photon cm"2 s"1, (c) 8.7 X 10¹⁶ photon cm"2 s'1, (d) 1.16 X 10¹⁷ photon cm"2 s"1.
TABLE I: Parameter Values Obtained from Graphical Data Reduction
Intensity X 1017 cm '2 s '1
10 lsP a s ' 1 cm "1
molecule"11017//3cm"2
0.29 (0.05 W) 3.3 3.30 .58(0 .1 W) 3.9 3.00.87 (0.15 W) 2.6 4.41.16 (0.2 W) 3.5 3.81.7 (0.3 W) 3.5 4.1
each intensity. These plots are found to be linear, as illustrated for one intensity in Figure 4. Slopes and intercepts of these lines yield values of the “constants” Pa and 7/3, which are tabulated in Table I. It is seen that both P a and 70 are constant over the sixfold range of intensities (to within a degree of scatter which is reasonable in terms of the scatter in the data). The chief objections to this method are that the determination of K3 depends on the square of the rather inaccurate /? values, and that the measurement of these (3 values puts undue weight on the low-pressure points. The least-squares method of section 3 circumvents these problems.
The average values obtained from the above analysis are P a = 3.3 X 1025 s“1 cm'1 molecule"1 and 7/3 = 3.7 X 1017 cm"2. (Standard deviations of the mean are ±6% for a Pa, ±8% for 7/3. In the values given below, assumed uncertainties of ±20% in the pressure calibration constant and ±30% in the intensity calibration constant are combined with these.) The strict lim it on K3 obtained from (15) is then K3 > (1 ± 0.3) X 10'9 cm3/molecule s. The realistic values obtained by combining experimental uncertainties with the ranges given by (16-18) are
a, = (4.7 ± 2) X 1(T18 cm2
a2 = (8.8 ± 3) X 10-18 cm2 (21)K3 = (1.1 ± .3) X 10~9 cm3/molecule s
It is calculated that deviations from the high-pressure, low-intensity limit, as manifested by the effects described by either eq 19 or 20, are of the same order as the scatter in the data. Further refinement of the graphical analysis to correct for these effects can be made, but the im-
1535
Figure 4. The slopes and intercepts of the 1/A+ vs. pressure plots yield the values of a and /3. The results illustrated in this figure were obtained at a light intensity of 1.16 X 10¹⁷ photon cm"2 s"1.
provement is not large; in any case the more satisfactory methods described below are not high-pressure low-intensity approximations.
2. Computer Fit to Eq 5. In principle, generating simulated decay curves from eq 5 and direct comparison with the observed decay curves is the most satisfactory approach. This was done for a variety of choices of ch <r2, and K3. In practice, the agreement of these curves with the observed curves was reasonable for quite a wide range of parameter values, and there was considerable question about the most appropriate criterion to apply for deciding on the best fit. It was decided to require agreement between calculated and observed decay curves at 10 s for the greatest number of decay curves. Using this criterion, fits of essentially equal goodness were obtained for K3 values ranging from 1.0 X 10"9 to 4.5 X 10"9 cm3/molecule s, o-j values between 3.8 and 7.6 X 10"18 cm2, and a2 such that cri<T2/(<ri + ff2) — 2.7 X 10"18 cm2.
3. Least-Squares Fit to Eq 6. The slopes (at long t) of the decay curves of eq 12 could be measured with very good precision. The set of slope values was fitted to eq 6 using a non-linear least-squares routine18 which varied G\ and K3. (A s expected from the discussion above, the ratio a2/ai was not well defined by the data set, so calculations were made with a2 values from a2 = <Ji to tr2 = 3oi, with equally good fits in all cases, and this range of variation was included in the uncertainties in ax and tr2.) The fits obtained were excellent and closely constrained (average deviation between computed and observed values ~8%). The indication from the previous sections of excellent agreement of the results with the two-photon kinetic scheme was amply confirmed by the satisfactory fitting of all 26 slope values to the two-parameter model adopted. The fitted values of the parameters were =4.4 X 10"18, a2 = 7.9 X 10"18, and K3 = 1.05 X 10"9. (The fitting errors in these are insignificant compared with the other experimental uncertainties discussed above, and realistic uncertainties are as given in (21).)
The agreement in parameter values obtained by all three analyses is satisfactory, and all three approaches support the validity of the assumed kinetic model. In this set of data, the accuracy of the results was not limited by the precision of the data analysis; in opposite circumstances, the approach of section 3 appears to have clear advantages over the other two in reliability, and should be preferred except when the convenience of the graphical approach outweighs its lower reliability.
t The Journal o f Physical Chemistry, Vol. 81, No. 16, 1977,, <rs 1 * v* /
Inserting the calculated rate constants into (7) shows that the high-pressure low-intensity limit is not well obeyed for the conditions of these experiments, with Ic /KoJP being of the order of unity for some of the experimental points. In spite of this, the graphical treatment based on this limit gives results indistinguishable from the exact least-squares fit, indicating that if the lim it (7) is not too severely violated, the two-photon kinetics may be considered in the high-pressure low-intensity approximation without major error.
The value of 1.1 X 10~9 cm3/molecule s determined for collisional deactivation of the vibrationally excited bro- mobenzene ions represents very efficient quenching, and corresponds to quenching on nearly every orbiting collision. One should not attempt to interpret this as indicating rapid intermolecular energy transfer, however, since resonant charge transfer is also a highly effective process for quenching excited ions, and is likely to be as fast as or even faster than the rate of orbiting collisions. 1 1 Accordingly, we can only conclude that quenching is rapid, whether by means of energy transfer, charge transfer, or both. An important consequence of this observation is the fact that, in this system at least, the collisional quenching process must occur by a large transfer of excitation on most collisions; models in which the excited parent is quenched by a series of successive small energy-losing collisional events are entirely ruled out. It will be of considerable interest to see if this is still true in systems where symmetrical charge transfer is not a likely process.
Another very interesting question accessible to study through the two-photon process is the cooling by infrared radiation of the P+* excited parent ion. Calculations suggest19 that for ions of this size with vibrational excitation of the order of 2 eV the rate constant for radiative cooling is likely to be about 1 s“1, and it would be useful to test this prediction. Radiative cooling will appear in(3) as a pressure independent additive correction to the K3P term, and should be experimentally accessible in two-photon experiments done at pressures low enough that K^P < 1 s“1. The data reported here do in fact reach this
1536
condition at the lowest pressures, but there is no indication of a consistent effect on the results from radiative deexcitation. Nevertheless, careful low-pressure studies offer a useful approach to this difficult problem.
Acknowledgment. Acknowledgment is made to the donors of the Petroleum Research Fund, administered by the American Chemical Society, to the National Science Foundation, and to the Air Force Geophysical Laboratory for support of this research.
References and Notes(1) R. C. Dunbar, J. Am. Chem. Soc., 93, 4354 (1971).(2) R. C. Dunbar, J. Am . Chem. Soc., 95, 472 (1973).(3) R. C. Dunbar, J. Am . Chem. Soc., 95, 6191 (1973).(4) R. C. Dunbar and E. W. Fu, J. Am. Chem. Soc., 95, 2716 (1973).(5) R. C. Dunbar and J. M, Kramer, J. Chem. Phys., 58, 1266 (1973).(6) J. M. Kramer and R. C. Dunbar, J. Chem. Phys., 59, 3092 (1973).(7) P. P. Dymerski, E. W. Fu, and R. C. Dunbar, J. A m . Chem. Soc.,
96, 4109 (1974).(8) R. C. Dunbar in “ In:eractions between Ions and Molecules” , P.
Ausloos, Ed, Plenum Press, New York, N.Y., 1975.(9) E. W. Fu, P. P. Dymerski, and R. C. Dunbar, J. A m . Chem. Soc..
98, 337 (1976).(10) R. C. Dunbar, Anal. Chem., 48, 723 (1976).(11) B. S. Freiser and J. L. Beauchamp, Chem. Phys. Lett., 35, 35 (1975)(12) R. C. Dunbar and R. Klein, J. Am . Chem. Soc., 98, 7994 (1976).(13) T. E. Orlowskl, B. S. Freiser, and J. L. Beauchamp, Chem. Phys.,
18, 439 (1976).(14) M. T. Rlggin and R. C. Dunbar, Chem. Phys. Lett., 31, 539 (1975).(15) As pointed out by a referee, interchange of cr, and <r2 does not affect
this expression, so that a 1 and <r2 cannot be separately determined from any analysis of the data. However, the procedures described below can yield unique cr, and <x2 values subject only to the restriction that one does not know which is <r, and which is <r2. If. as discussed following eq 15, one makes the physically reasonable assumption u, t cr2, then the ambiguity is removed, and the determination is (in principle) unique.
(16) J. L. Franklin et at., Natl. Stand. Ref. Data Ser., Natl. Bur. Stands, No. 26 (1969).
(17) D. W. Turner et al. “ Molecular Photoelectron Spectroscopy” , Wiley-Interscience, New York, N.Y., 1970.
(18) P. R. Bevington, “Data Reduction and Error Analysis for the Physical Sciences” , McGraw-Hill, New York, N.Y., 1969.
(19) R. C. Dunbar, Spectrochim. A cta, Part A , 31, 797 (1975).(20) The decay curve of Figure 2 may be seen not to agree with that plotted
in Figure 3, and was taken for illustration from a different data set with different expansion of the laser beam: its quality is comparable to the curves analyzed in this paper.
R . C . D unbar and E. W . F u
The Journal o f Physical Chemistry, Vol. 81, No. 16, 1977

Radiolysis o f H2S in the Presence o f Butadiene 1537
Rare G as Sensitized R ad io iysis of Hydrogen Sulfide in the Presence of Butadiene
Antoni Jowko, Iwona SzamreJ, and Mieczyslaw Forys*Chemistry Department, University Teachers College, 08-110 Siedlce, Poland (Received November 7, 1975; Revised Manuscript Received December 15, 1976)
Hydrogen and sulfur yields have been measured from the argon, krypton, and xenon sensitized radiolysis of hydrogen sulfide in the presence of butadiene. A sharp decrease in the yield of elemental sulfur from 5-7 molecules/100 eV down to a very low value (ca. 0.1 atoms/100 eV) has been discovered even at the lowest added amounts of butadiene. Unlike the sulfur yields, the hydrogen yields diminished smoothly with [C4H6]/[H2S] ratio. A mechanism for the observed decrease in the sulfur and hydrogen yield has been discussed. It has been shown that elemental sulfur is produced via the HS+ ions and SH radicals and/or'S atoms as intermediate products, each of them being scavenged by butadiene. The change in G(H2) with the [C4H6]/[H2S] ratio was ascribed to a competition between butadiene and hydrogen sulfide in an excitation transfer from the rare gas metastables, and hydrogen atom scavenging. The rate constant ratio feH+H2s/ H+c4H6 has been calculated to be in the range of 0.22-0.28, 0.18-0.22, and 0.14-0.16 for Kr, Xe, and Ar, respectively. The observed increase in the rate constant ratio as compared to that for thermal H atoms (0.11) has been accounted for by a higher kinetic energy of hydrogen atoms produced in the system. The maximum values of GXe*, GKr,, and GAr. have been found from energetic calculations to be equal to 3.1, 2.5, and 2 .1 , respectively. These have been compared with experimental results found under the supposition that primary radiolysis can be neglected. The discrepancy has been observed which has been ascribed to the significant decomposition of hydrogen sulfide by electrons subexcited with respect to rare gas atoms. The hydrogen yield due to the last process has been estimated to be ca. 1.4 for Ar and Xe.
IntroductionThe effect of butadiene on G(H2) and G(S) in the y
radiolysis1 - 3 and rare gas sensitized radiolysis4 of hydrogen sulfide has been recently investigated. It has been stated that addition of butadiene causes a slow decrease in G(H2) and drastically reduces G(S) by G ==? 6 in the y radiolysis of hydrogen sulfide. The rate constant ratio h+Hzs/ h+CjHc was reported to be twice as great as that for thermal hydrogen atoms (0.26 in ref 2 and 0.20 in ref 3). However, the data for the rare gas sensitized radiolysis4 included only G(S) and were obtained mainly at high concentrations of hydrogen sulfide in mixtures (more than 2 0 mol %) thus involving a large part of the primary 7 -radiolysis effect.
In this contribution we present detailed results on the influence of butadiene on both hydrogen and sulfur yields at small concentrations (below 1 0 mol %) of hydrogen sulfide in argon, krypton, and xenon. We discuss as well how these results bear on the energetics and kinetics of charge and excitation transfer from a rare gas to hydrogen sulfide and butadiene.
Experimental SectionThe experimental procedure has been fully described
earlier. 3,5,6,8 In the present experiment irradiations were performed using a “ Co 7 source at a dose rate of 5.5 X 10¹⁵
eV g- 1 s- 1 in hydrogen sulfide, which was used as a dosimeter. The concentration of hydrogen in the mixture after radiolysis never exceeded 0.05 mol % to prevent the influence of the radiolysis products on the course of radioiysis. Hydrogen yields were measured as a function of hydrogen sulfide concentration in the mixture at several overall pressures and butadiene concentrations as noted in Figures 1-3.
Hydrogen was estimated gas chromatographically (Poropaq Q column) and sulfur was determined spec- trophotometrically after being extracted from ampoules and converted into a thiocyanate complex. 5
ResultsThe addition of butadiene to a mixture of hydrogen
sulfide and a rare gas has a very dramatic effect on the
sulfur yield: G(S) decreases in all the mixtures below the lim it of sensitivity of the analytical technique (ca. 0 . 2
atoms/100 eV). The experiment has been performed in which sulfur was extracted successively from several ampoules (of the same hydrogen sulfide and butadiene concentration) and the resulting extract was analyzed. The yield of sulfur of the order of 0.1 atoms/100 eV has been estimated in accordance with the expected G(S) from a primary radiolysis of hydrogen sulfide in the presence of butadiene. The latter is equal to 0.8 ± 0.3 from previous experiments2,5 which should result in a value of 0 . 1 at a stopping power fraction of hydrogen sulfide in the mixture of 0 . 1 (this corresponds to 1 0 , 17, and 25 mol % of H2S in Ar, Kr, and Xe, respectively).
There is some disagreement between this result and those of ref 4. These authors have measured G(S) for H2S-C4H6-Xe and H2S-C4H6-Ar mixtures and obtained G(S)Xe = 0.8 at 2 2 mol % and G(S)Ar = 1.3 at 2 mol % of hydrogen sulfide, the lowest concentration used (at butadiene concentrations of 1, 2 , and 3 mol %). However, they also obtained a very large G(S) ~ 2 0 in the mixture H 2S-Ar as compared with G(H2) = 7. 7,8 Meanwhile, the stoichiometry for hydrogen sulfide decomposition requires these two values to be equal. As yet, we can neither repeat their data, nor explain this discrepancy and thus we are forced to take into consideration only our results.
The dependence of GIH^ )4 on the [C4H6]/[H2S] ratio is shown in Figures 1-3 for mixtures of hydrogen sulfide with argon, krypton, and xenon, respectively. Here G(H2)‘ denotes the hydrogen yield calculated on the basis of energy absorbed by the mixture using stopping power ratios9 SAr/Sh2s = 0.96, SKr/SH2s = 1-74, and SXe/ShjS = 2.45. The hydrogen yields from mixtures of butadiene with krypton and xenon have also been measured at 0.5 mol % of butadiene in each mixture. Values of 0.3 and 0 . 2 have been found in krypton and xenon, respectively. The hydrogen yield decreases smoothly with the [C4H6]/[H2S] ratio from a plateau value for a corresponding rare gas- hydrogen sulfide mixture8 to the G(H2) for the mixture rare gas-butadiene. No effect of the overall pressure used on G(H2) was observed.
The Journal o f Physical Chemistry, Vol. 81, No. 16, 1977
A. Jów ko, I. Szam rej, and M. Forys1538
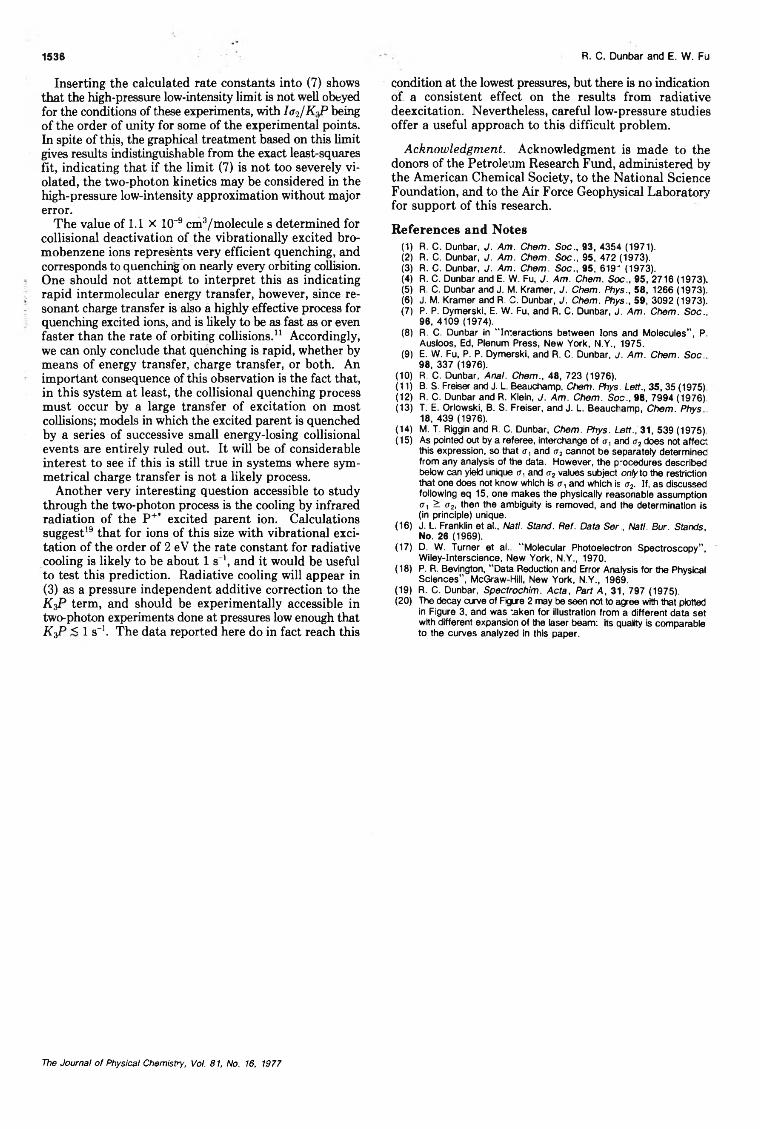
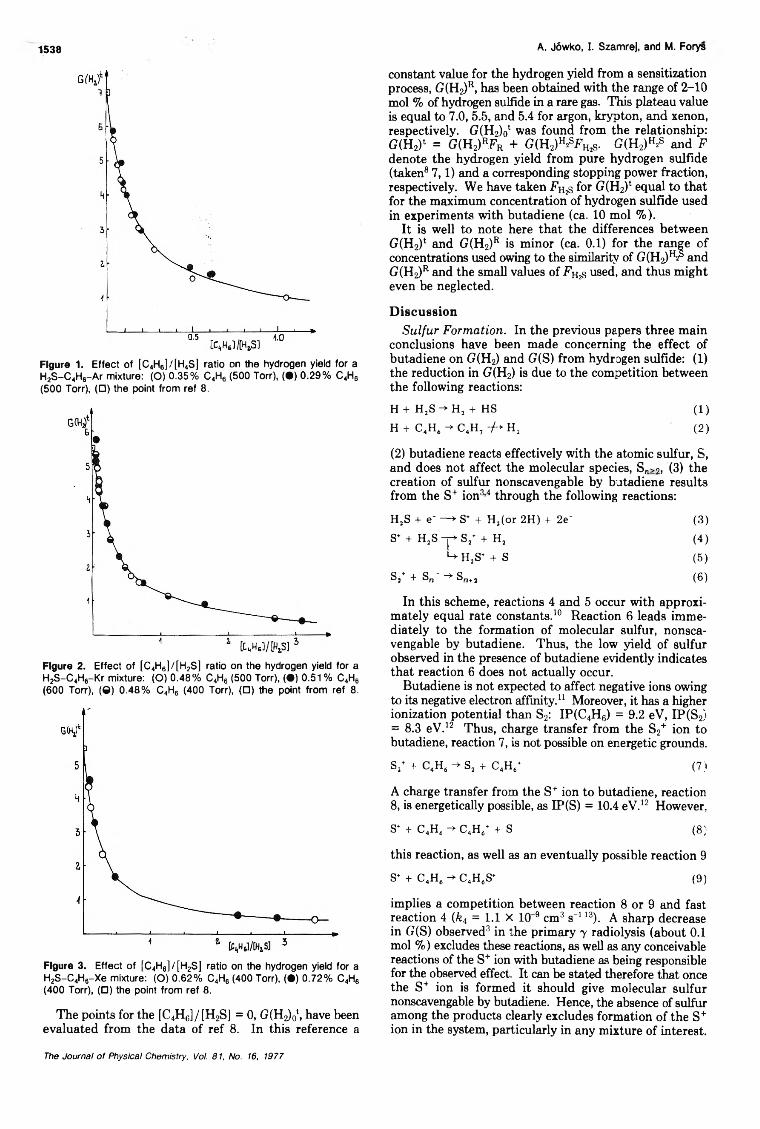
Figure 1. Effect of [C4H6] / [H 4S] ratio on the hydrogen yield for a H2S -C 4H6-A r mixture: (O) 0 .35% C 4H6 (500 Torr), ( • ) 0 .2 9% C 4H6 (500 Torr), (□ ) the point from ref 8.
Figure 2. Effect of [C 4H6] / [H 2S] ratio on the hydrogen yield for a H2S -C 4H6-K r mixture: (O ) 0 .4 8% C4H6 (500 Torr), ( • ) 0.51 % C4H6 (600 Torr), (0) 0 .4 8% C4H6 (400 Torr), (□ ) the point from ref 8.
Figure 3. Effect of [C4H6] / [ H 2S] ratio on the hydrogen yield for a H2S -C 4H6-X e mixture: (O ) 0 .6 2% C4H6 (400 Torr), ( • ) 0 .72% C4H6 (400 Torr), (□ ) the point from ref 8.
The points for the [C4H6]/[H2S] = 0 , G(H2)0t, have been evaluated from the data of ref 8 . In this reference a
constant value for the hydrogen yield from a sensitization process, G(H2)R, has been obtained with the range of 2-10 mol % of hydrogen sulfide in a rare gas. This plateau value is equal to 7.0, 5.5, and 5.4 for argon, krypton, and xenon, respectively. G(H2)0‘ was found from the relationship: G(H2)‘ = G(H2)«Fr + G(H2)H2SFH2s- G(H2)h2s and F denote the hydrogen yield from pure hydrogen sulfide (taken8 7,1) and a corresponding stopping power fraction, respectively. We have taken FH2s for G(H2)‘ equal to that for the maximum concentration of hydrogen sulfide used in experiments with butadiene (ca. 1 0 mol %).
It is well to note here that the differences between G(H2)t and G(H2)R is minor (ca. 0.1) for the range of concentrations used owing to the similarity of G(H2)h and G(H2)R and the small values of FHzs used, and thus might even be neglected.
DiscussionSulfur Formation. In the previous papers three main
conclusions have been made concerning the effect of butadiene on G(H2) and G(S) from hydrogen sulfide: (1) the reduction in G(H2) is due to the competition between the following reactions:
H + H2S -* H, + HS (1)H + C4H6 -» C4H7 -/-» H2 (2)
(2 ) butadiene reacts effectively with the atomic sulfur, S, and does not affect the molecular species, Sn>2, (3) the creation of sulfur nonscavengable by butadiene results from the S+ ion3 4 through the following reactions:
H2S + e- —» S+ + H2(or 2H) + 2e“ (3)S+ + H2S - y S2+ + H, (4)
U H,S+ + S (5)Sj* + S „ ' -*■ Sn+2 (6)
In this scheme, reactions 4 and 5 occur with approximately equal rate constants. 10 Reaction 6 leads immediately to the formation of molecular sulfur, nonscavengable by butadiene. Thus, the low yield of sulfur observed in the presence of butadiene evidently indicates that reaction 6 does not actually occur.
Butadiene is not expected to affect negative ions owing to its negative electron affinity. 11 Moreover, it has a higher ionization potential than S2: IP(C4H6) = 9.2 eV, IP(S2) = 8.3 eV. 12 Thus, charge transfer from the S2+ ion to butadiene, reaction 7, is not possible on energetic grounds.
S2+ + C4H6-> S2 + C4H6+ (7)
A charge transfer from the S+ ion to butadiene, reaction 8 , is energetically possible, as IP(S) = 10.4 eV. 12 However,
S+ + C4H6 -> C4H6+ + S (8)
this reaction, as well as an eventually possible reaction 9
S+ + C4H6 -* C4H6S+ (9)
implies a competition between reaction 8 or 9 and fast reaction 4 (ft4 = 1.1 X 10 9 cm3 s-113). A sharp decrease in G(S) observed3 in the primary y radiolysis (about 0 . 1
mol %) excludes these reactions, as well as any conceivable reactions of the S+ ion with butadiene as being responsible for the observed effect. It can be stated therefore that once the S+ ion is formed it should give molecular sulfur nonscavengable by butadiene. Hence, the absence of sulfur among the products clearly excludes formation of the S+ ion in the system, particularly in any mixture of interest.
The Journal o f Physical Chemistry, Vol. 81, No. 16, 1977
Rallolysls of H~ In the Presence of Butadiene
Recently, Laudenslager, Huntress, and Bowers14 haveshown that charge transfer processes from the rare gasatoms to small molecules are fast when the resonance existsbetween RE(R+) and the energy required for FranckCondon transition from the ground state molecule (AB)to the corresponding electronic state of the ion (AB+). Ithas been demonstrated in the preceding paper that thecharge transfer processes in the system R-H2S (R =Ar,Kr, and Xe) occur in accordance with this requirement.In particular, it follows from the analysis of the photoelectron spectra of hydrogen sulfide performed in ref 8 thatthere is a low probability for reaction 10 (R =Ar, Kr)followed by the predissociation, reaction 11.
1531
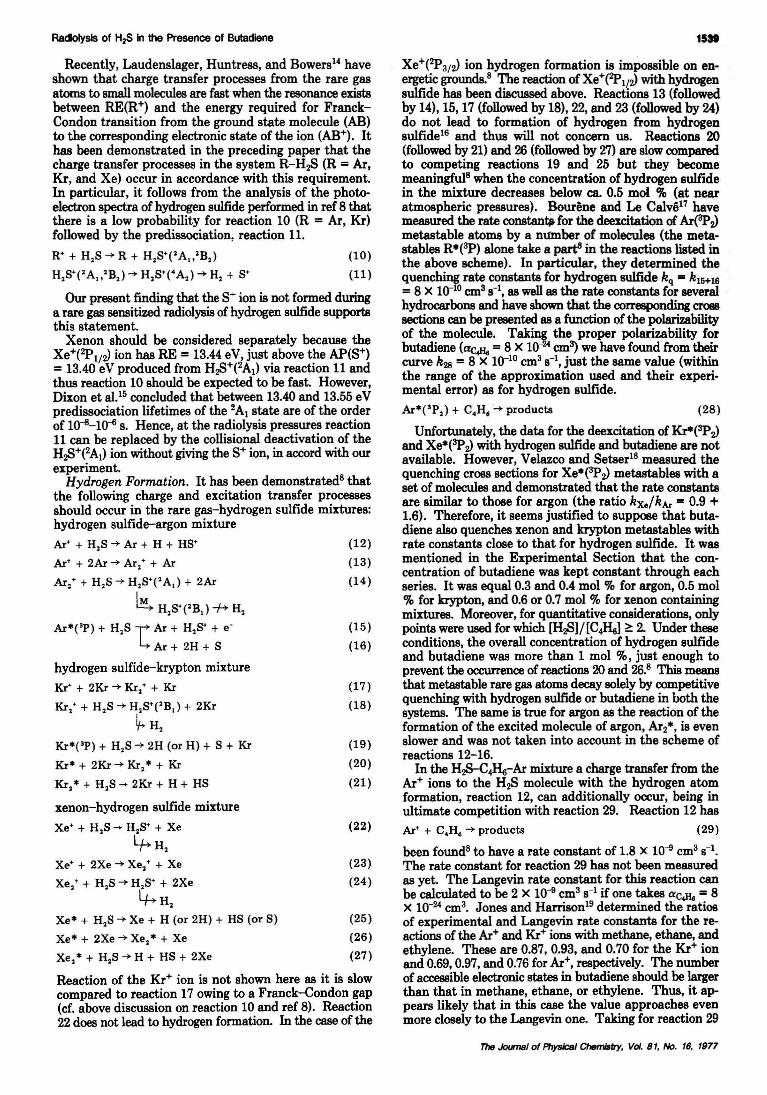
Xe+(2p3/0 ion hydrogen formation is impossible on energetic grounds.8 The reaction of Xe+(2I\/0 with hydrogensulfide has been discussed above. Reactions 13 (followedby 14),15,17 (followed by 18), 22, and 23 (followed by 24)do not lead to formation of hydrogen from hydrogensulfide16 and thus will not concern us. Reactions 20(followed by 21) and 26 (followed by 27) are slow comparedto competing reactions 19 and 25 but they becomemeaningful8 when the concentration of hydrogen sulfidein the mixture decreases below ca. 0.5 mol % (at nearatmospheric pressures). Bourene and Le Calve17 havemeasured the rate constan~for the deexcitation of Ar(3P0metastable atoms by a mrmber of molecules (the metastables R*(3p) alone take a part8 in the reactions listed inthe above scheme). In particular, they determined thequenching rate constants for hydrogen sulfide kq =k 15+16=8 X 10⁻¹⁰ cm3S-I, as well as the rate constants for severalhydrocarbons and have shown that the corresponding crosssections can be presented as a function of the polarizabilityof the molecule. Tak~ the proper polarizability forbutadiene (ac.He =8 x 10- cm3) we have found from theircurve k28 =8 X 10⁻¹⁰ cm3 s-1, just the same value (withinthe range of the approximation used and their experimental error) as for hydrogen sulfide.
A:c*(SP,) + C4H.-+ products (28)
Unfortunately, the data for the deexcitation of Kr*(3p0and Xe*(3p0 with hydrogen sulfide and butadiene are notavailable. However, Velazco and Setser18 measured thequenching cross sections for Xe*(3p0 metastables with aset of molecules and demonstrated that the rate constantsare similar to those for argon (the ratio kxe/kAr =0.9 +1.6). Therefore, it seems justified to suppose that butadiene also quenches xenon and krypton metastables withrate constants close to that for hydrogen sulfide. It wasmentioned in the Experimental Section that the concentration of butadiene was kept constant through eachseries. It was equal 0.3 and 0.4 mol % for argon, 0.5 mol% for krypton, and 0.6 or 0.7 mol % for xenon containingmixtures. Moreover, for quantitative considerations, onlypoints were used for which [H~1I[C4~1 ~ 2. Under theseconditions, the overall concentration of hydrogen sulfideand butadiene was more than 1 mol %, just enough toprevent the occurrence of reactions 20 and 26.8 This meansthat metastable rare gas atoms decay solely by competitivequenching with hydrogen sulfide or butadiene in both thesystems. The same is true for argon as the reaction of theformation of the excited molecule of argon, Ar2*, is evenslower and was not taken into account in the scheme ofreactions 12-16.
In the H~4~-Armixture a charge transfer from theAr+ ions to the H2S molecule with the hydrogen atomformation, reaction 12, can additionally occur, being inultimate competition with reaction 29. Reaction 12 has
A:c+ + C4H. """* products (29)
been foundS to have a rate constant of 1.8 X 10⁻⁹ cm3 8-1.The rate constant for reaction 29 has not been measuredas yet. The Langevin rate constant for this reaction canbe calculated to be 2 X 10~ cm3 S-1 if one takes aC.He = 8X 10-24 cm3• Jones and Harrison19 determined the ratiosof experimental and Langevin rate constants for the reactions of the Ar+ and Kr+ ions with methane, ethane, andethylene. These are 0.87,0.93, and 0.70 for the Kr+ ionand 0.69, 0.97, and 0.76 for Ar+, respectively. The numberof accessible electronic states in butadiene should be largerthan that in methane, ethane, or ethylene. Thus, it appears likely that in this case the value approaches evenmore closely to the Langevin one. Taking for reaction 29
(22)
(10)
(11)
(17)
(18)
(19)
(20)
(21)
(15)
(16)
(12)
(13)
(14)
hydrogen sulfide-krypton mixture
Kr+ + 2Kr"""* Kr,+ + Kr
Kr,+ + H,S"""* H,S+('B , ) + 2Kr
~ H,
Kr*(,P) + H,S"""* 2H (or H) + S + Kr
Kr* + 2Kr"""* Kr,* + Kr
Kr, * + H,S -+ 2Kr + H + HS
xenon-hydrogen sulfide mixture
Xe+ + H,S -+ H,S+ + Xe
LrH,Xe+ + 2Xe"""* Xe,+ + Xe (23)
Xe; + H,S -+ H,S+ + 2Xe (24)
~H,Xe* + H,S"""* Xe + H (or 2H) + HS (or S) (25)
Xe* + 2Xe"""* Xe,* + Xe (26)
Xe,* + H,S·~ H + HS + 2Xe (27)
Reaction of the Kr+ ion is not shown here as it is slowcompared to reaction 17 owing to a Franck-Condon gap(cf. above discussion on reaction 10 and ref 8). Reaction22 does not lead to hydrogen formation. In the case of the
Our present finding that the S- ion is not formed duringa rare gas sensitized radiolysis of hydrogen sulfide supportsthis statement.
Xenon should be considered separately because theXe+(2I\/0 ion has RE =13.44 eV, just above the AP(S+)=13.40eV produced from H~+(2Al) via reaction 11 andthus reaction 10 should be expected to be fast. However,Dixon et al. 15 concluded that between 13.40 and 13.55 eVpredissociation lifetimes of the ~Al state are of the orderof 10-a-l0~s. Hence, at the radiolysis pressures reaction11 can be replaced by the collisional deactivation of theH~+(2Al) ion without giving the S+ ion, in accord with ourexperiment.
Hydrogen Formation. It has been demonstrated8 thatthe following charge and excitation transfer processesshould occur in the rare gas-hydrogen rmlfide mixtures:hydrogen sulfide-argon mixture
A:c+ + H,S ~ Ar + H + HS+
A:c+ + 2A:c"""* Ar,+ + A:c
A:c; + H,S"""* H,S+('A,) + 2A:c
~ H,S+('B,) -f+ H,
A:c*('P) + H,S t A:c + H,S+ + e
A:c + 2H + S
R+ + H,S"""* R + H,S+('A"'B,)
H,S+('A,.'B,)~H,S+(4A,)-+H,+ S+
The Journal of PhysIcal Chemlslly. Vol. 81. No. 16, 1977

1540 A . Jôw ko, I . Szam rej, and M. Forys
the Langevin rate constant as calculated above, we find ki2/k 29 =* 1. This value will be used for calculations. To minimize possible error, only the points at [C4H6]/[H2S] < 0.2 were used for calculations in this system. Additionally, it may be noted that the hydrogen yield from charge transfer to hydrogen sulfide forms only about half of the total hydrogen yield. Under these circumstances the error involved appears to be negligibly small even at the lowest concentrations of hydrogen sulfide used.
In conclusion, it may be stated that (1) atomic hydrogen in both H 2S-C4H6-Xe and H 2S-C4H6-Kr mixtures is produced mainly by excitation transfer from a rare gas atom to the hydrogen sulfide molecule and to a minor extent by direct radiolysis of hydrogen sulfide (but on this problem see the last part of this paper), (2 ) excitation transfer to hydrogen sulfide is competing with that to butadiene. The experimental yield of hydrogen, G(H2)‘, results from this competition and from the competition between reactions 1 and 2 .
The following mechanism for the hydrogen formationmay, therefore, be proposed in the mixtures considered (R denotes Xe or Kr, respectively):
R + e" -*■ R* + e (30)HjS + e ' -* H + e" + products (31)R* + HjS -» R + 2H (or H) + S (or HS) (32)R* + C4H6 -* products -/-> H2 (33)H + HjS -> Hj + HS (1)H + c 4h 6 -+ c 4h 7 - b h 2 (2)
Here the reaction of hydrogen formation frc n charge or excitation transfer to butadiene has been omitted as giving a negligibly small hydrogen yield in the presence of at least a twofold excess of hydrogen sulfide used for calculations. G(H2) from these reactions is supposed to be below 0.1. Assuming that fe32 e- fe33 and that the hydrogen yields from the krypton and xenon sensitized radiolysis of butadiene alone are 0.2 and 0.3 as mentioned above, steady-state treatment of this mechanism leads to the following relationship:
__________ 1 __________G(H2 )‘ [1+ ([C4H 6 ]/[H2 S])]
= j _ l ,Gh° V ft, [H2 S] ) (I)
where GH° = GHRFR + GhH2SFH2s denotes the yield of hydrogen atoms from excitation transfer to hydrogen sulfide, reaction 32, in the absence of butadiene, as well as from direct radiolysis of hydrogen sulfide, reaction 31. The experimental data are plotted as suggested by eq I in Figures 4 and 5 (open circles). Clearly, neither the experimental points in krypton, nor in xenon obey eq I. On the other hand, it is seen from Figures 4 and 5 that good straight lines are obtained when the l/G(H2y ordinate is used instead of the one from eq I. Such a relationship, eq II, is evolved when a simplified mechanism neglecting
! ! /! fea[C4H6]\G(H2)‘ Gh° \ ft, [H2 S] J (II)
excitation transfer to butadiene, reaction 33, is assumed. In view of the foregoing discussion on the excitation transfer process to butadiene there is no reason to suspect that reaction 33 does not occur or does with a low rate constant not comparable with k32. Therefore, the possibility of another process leading to the formation of hy-
Figure 4. Experimental plots of eq I (right-hand ordinate, open circles) and eq I I I (left-hand ordinate, close circles) for an irradiated H2S - C4H6-X e mixture. The broken line corresponds to the rate constant ratio for thermal hydrogen atoms (k ,/fc 2 = 0 .1 1419).
Figure 5. Experimental plots of eq I (right-hand ordinate, open circles) and eq I I I (left-hand ordinate, close circles) for an irradiated H2S -C 4H6-Kr mixture. Broken line as in Figure 4.
drogen which compensates for a decrease in G(H2)‘ caused by butadiene in reaction 33 is suggested. Three processes come to mind to account for this effect, reaction 34-36:R* + C4H6 t * H2 + product + R (34a)
^ H (2H) + product + R (34b)R+ + C„H6 -t * Hj + (product)+ + R (35a)
H (2H) + (product)+ + R (35b)H + C4H6 ->■ H, + C4Hs (36)
The yield of molecular hydrogen from reactions 34a and 35a has been shown above to be negligibly small under the conditions of the experiment. There are no experimental data concerning the yield of atomic hydrogen from reaction 34b. Nevertheless, some conclusions can be drawn from the data on the photolysis of butadiene by xenon and krypton resonance radiation. 20 It follows from these data
The Journal o f Physical Chemistry, Vol. 81, No. 16, 1977
Radiolysis o f H2S in the P resence o f Butadiene 1541
that the dissociation of butadiene with formation of two hydrogen atoms occurs under photon impact with a relative yield equal to or 0.3 less (the quantum yield has not been measured). Thus, the relative yield of hydrogen atoms does not exceed 0.6. If this value is also accepted for energy transfer from rare gas atoms, then we obtain0 . 6 or less hydrogen atoms produced in one excitation transfer event compared to ca. 1.5 atoms from hydrogen sulfide.
Reaction 35b with formation of one hydrogen atom is energetically possible for all the three rare gas ions as AP(C4H5+) = 11.6 eV. 2 1 However, the C3H3+ ion is also produced at this energy (AP = 11.7 eV21) without formation of a hydrogen atom. Also, the parent butadiene ion, C4H6+, (IP(C4H6) = 9.2 eV21) has several bonding states in the range of 11-15 eV which can be expected to be partially deactivated without decomposition of the ion. So, reaction 35b cannot be fully excluded but it can be supposed that it is not a major path for charge transfer from argon, krypton, and xenon ions to butadiene. Therefore it contributes to formation of hydrogen atoms with a yield significantly lower than the yield of the corresponding rare gas ions. On the other hand, reaction 36 is known to occur to a small extent (kx/k2 = 0.02) even with thermal hydrogen atoms in the photolysis experiments. 22 Dzantiev et al. 23,24 have also shown that hot hydrogen atoms produced photolytically with a kinetic energy of ca. 1 eV abstract hydrogen atoms from ethylene and propylene with a rate constant equal to that of reaction1. Additionally, they demonstrated25 that argon is very inefficient in thermalizing hot hydrogen atoms. On this basis, it may be inferred that reaction 36 proceeds under the conditions of the present experiments with a rate constant similar to that of reaction 1. To support this supposition, it should be emphasized that evidence has been recently obtained in this laboratory6 that hot hydrogen atoms are produced in the xenon sensitized radiolysis of hydrogen sulfide which effectively abstract halogen atoms from CC14 and SF6 and an oxygen atom from N20 molecules at conditions similar to those in the present experiment.
Thus, none of the reactions 34-36 may be fully excluded. It is not possible to make a kinetic analysis including all these reactions simultaneously. Therefore two extreme, simplified cases have been considered: (i) Reactions 34b and 35b compensate fully for a decrease in GH from hydrogen sulfide caused by reaction 33, and reaction 36 does not occur. Then eq II is valid, and the ftx/ft2 ratio is equal to 0 . 2 2 and 0.18 for xenon and krypton, respectively, (ii) Reactions 34b and 35b can be neglected, and reaction 36 occurs with = ftx which compensates for a decrease in a hydrogen yield caused by reaction 33. Now we obtain eq III which has the same form as eq II. However, a sum
1 = J _ L fe2 + fe36[C4H6]\G(H2)‘ g h° V ft, [H2 S] J
(III)
ft2 + ft36 appears now instead of fe2 alone. The corresponding plots are shown in Figures 4 and 5 (closed circles). The intercept gives a value of GH° = 6 . 1 for both xenon and krypton. This agrees fairly well with our previous results obtained directly from the plateau of G(H^R in the radiolysis of binary rare gas-hydrogen sulfide mixtures. 8
These have been determined as 5.4 and 5.5 xenon and krypton, respectively.
From the slope and intercept of the lines the rate constant ratios ft2 + k36/kx = 4.6 (for Kr) and 5.6 (for Xe) were determined. Keeping in mind that kx = ft36 we obtain fei/ft2 = 0.28 for krypton and 0.22 for xenon. The actual
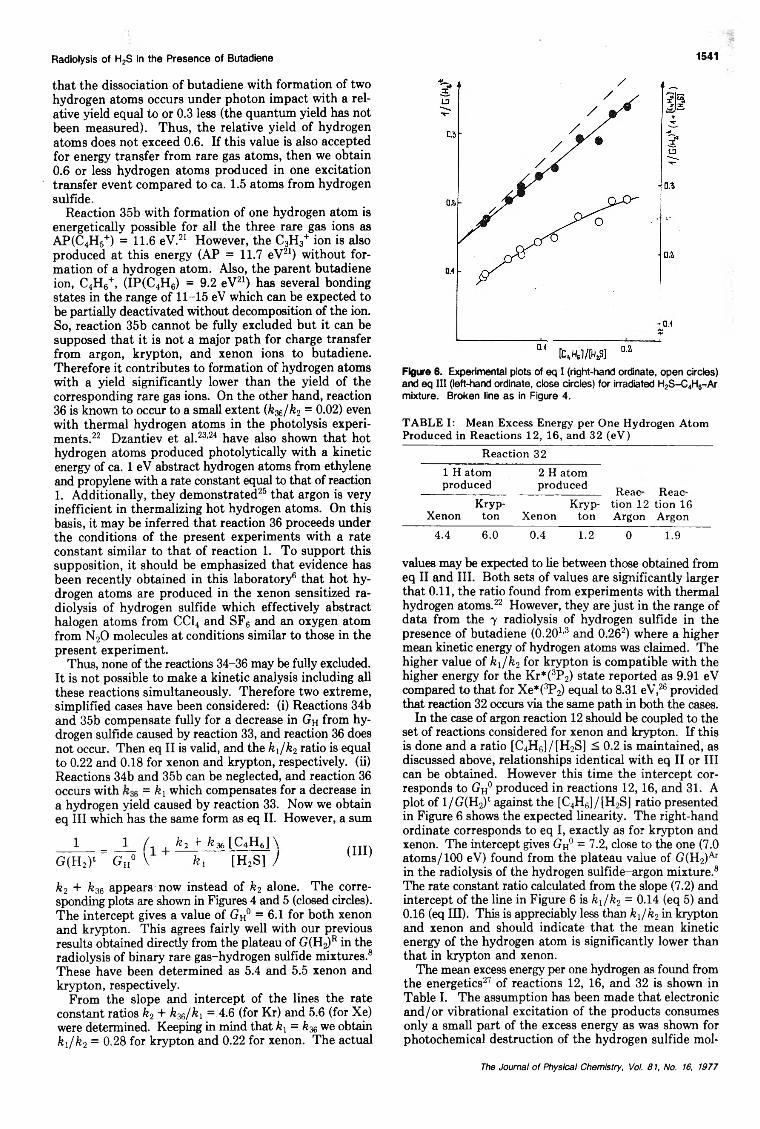
Figure 6. Experimental plots of eq I (right-hand ordinate, open circles) and eq III (left-hand ordinate, close circles) for irradiated H2S-C4H6 Ar mixture. Broken line as in Figure 4.
TABLE I: Mean Excess Energy per One Hydrogen Atom Produced in Reactions 12, 16, and 32 (eV)
Reaction 321 H atom 2 H atomproduced produced Reac Reac
Kryp- Kryp- tion 12 tion 16Xenon ton Xenon ton Argon Argon 4444 (L0 CU L 2 0 L9
values may be expected to lie between those obtained from eq II and III. Both sets of values are significantly larger that 0 .1 1 , the ratio found from experiments with thermal hydrogen atoms. 22 However, they are just in the range of data from the y radiolysis of hydrogen sulfide in the presence of butadiene (0 .2 0 1,3 and 0.262) where a higher mean kinetic energy of hydrogen atoms was claimed. The higher value of kx/k2 for krypton is compatible with the higher energy for the Kr*(3P2) state reported as 9.91 eV compared to that for Xe*(®P2) equal to 8.31 eV, 26 provided that reaction 32 occurs via the same path in both the cases.
In the case of argon reaction 12 should be coupled to the set of reactions considered for xenon and krypton. If this is done and a ratio [C4H 6]/[H2S] < 0 . 2 is maintained, as discussed above, relationships identical with eq II or III can be obtained. However this time the intercept corresponds to Gh° produced in reactions 12,16, and 31. A plot of l/G(H2)t against the [C4H6] / [H2S] ratio presented in Figure 6 shows the expected linearity. The right-hand ordinate corresponds to eq I, exactly as for krypton and xenon. The intercept gives GH° = 7.2, close to the one (7.0 atoms/100 eV) found from the plateau value of G(H2)Ar in the radiolysis of the hydrogen sulfide-argon mixture. 8
The rate constant ratio calculated from the slope (7.2) and intercept of the line in Figure 6 is ftx/ft2 = 0.14 (eq 5) and0.16 (eq HI). This is appreciably less than fex/ft2 in krypton and xenon and should indicate that the mean kinetic energy of the hydrogen atom is significantly lower than that in krypton and xenon.
The mean excess energy per one hydrogen as found from the energetics27 of reactions 12, 16, and 32 is shown in Table I. The assumption has been made that electronic and/or vibrational excitation of the products consumes only a small part of the excess energy as was shown for photochemical destruction of the hydrogen sulfide mol-
The Journal o f Physical Chemistry, Vol. 81, No. 16, 1977
1542 A. Jów ko, I. Szam re j, and M. Forys
ecule. 28 It is seen from Table I that for the mean energy of hydrogen atoms in krypton and xenon to be appreciably higher than that in argon the supposition should be made that reaction 32 occurs to a large part with production of one hydrogen atom. This is in accord with the conclusion of ref 6 , where the high kinetic energy of hydrogen atoms was assumed to explain the occurrence of halogen abstraction reactions from CC14 and SF6 and oxygen abstraction from N20 which effectively compete with reaction 1 in the xenon sensitized radiolysis of the corresponding mixtures.
On the other hand, it follows from ref 29 that the formation of the SH+ ion occurs via predissociation o f2A' state through the 4 A" state of the H 2S+ ion. If SH+ ion production in reaction 1 2 follows the same path, hydrogen atoms without an excess kinetic energy should be expected. It indicates that only reaction 16 actually leads to hot hydrogen atoms in argon.
Finally, it is well to note that an actual value of the coefficient before the H atom in reaction 32 ( 1 or 2 ) does not affect our kinetic equations. The only alteration appears in the value of GR*.
The foregoing discussion, as well as that in ref 8 , has been based on the widely accepted supposition that the decomposition of an admixture in the rare gas sensitized radiolysis occurs mainly via charge and excitation transfer from the rare gas to the admixture molecule. If this assumption is valid, our estimation gives 2.7 < GXe. < 5.4,2.8 < Grt* < 5.5, and = 3.5.8 The higher and the lower limits for krypton and xenon correspond to the production of one and two hydrogen atoms, respectively, in reactions 19 and 25. Recently, Nagra and Armstrong30 have measured G(H2) from a mixture of HBr (20 mol %) with Xe to equal 9.1. If we extract from this value the hydrogen yield from electron capture processes equal30 to G(e~)Xe =4.6, then we find GXe* - 4.5, a value which lies well within our range of GXe..
These values can be compared with those possible on the grounds energetic considerations. If we take26 GKr+ =4.2, GXe+ = 4.6, the ratio 2P 3 /2/2Pw2 = 2:1, and the ionization potentials of Kr+(2P3/2), Kr+(2P1/2), Xe+(2P3/2), and Xe+(2Pi/2) equal to 14.0,14.7,12.1, and 13.5 eV, respectively, then the energy required for ion formation should be at least 60 eV for Kr and 58 eV for Xe. Taking a mean excitation energy for the lowest four states of krypton and xenon equal to 10.3 and 9.0 eV, respectively, we find GXe*mai = 4.7 and = 4.0.
These calculations do not however take into account subexcitation electrons. Meanwhile the energy removed by subexcitation electrons may not be neglected. The mean energy of subexcitation electrons, S, can be estimated31 from
£ = £ °/(2 + §") <iv)where E0 is the threshold energy of electronic excitation and IP is the ionization potential of the molecule involved. Using S from eq IV and G(e) we obtain for the total energy (per 100 eV absorbed) removed by subexcitation electrons 16.3, 15.9, and 14.7 eV in Ar, Kr, and Xe, respectively. This value may be estimated to be somewhat lower if we use S = E0/3, as it was done by Willis and Boyd in a recent review. 32 Then we obtain 14.8,14.2, and 13.8 eV for Ar, Kr and Xe. Even if we use these lower values, we obtain the energy available for excitation Eexc = 100 - (IP + S)G(e) equal to 25, 26, and 28 eV for Ar, Kr, and Xe, respectively. Hence the corrected GR»max are equal to2.1, 2.5, and 3.1 for argon, krypton, and xenon. These
values are well below the one necessary to be compatible with our and Woodward’s results in argon, 8 are less than the lower lim it from our measurements for krypton, and are in our range of GXe. but well below the value evaluated above from the data of ref 28.
We believe that this discrepancy is not caused by experimental errors but rather that it demonstrates that in the binary systems the role of the electrons subexcited with respect to the main component should not be neglected because the energy of these electrons is deposited entirely in the second component. Thus, the low energy electrons should result in the primary decomposition of the low concentration component giving an additional significant yield of fragmentation. From the difference between the experimental estimation and the values calculated in the above discussion it seems to be ca. 1.4 for argon and xenon.
In ternary mixtures, a competition between hydrogen sulfide and butadiene for low energy electrons should be expected which leads to a similar effect as considered for excitation processes. Thus, the extreme case (i) discussed above actually includes not only reactions 33, 34b, and 35b but also (to a smaller extent) corresponding reactions with low energy electrons.
In spite of a large number of data on electron scattering by molecules, 33 there exist only few results on the dissociation of the molecules electronically excited by low energy electron impact. However, in a recent review Polak and Slovetsky34 calculated cross sections for some simple molecules and have shown that there is a sharp increase in <Tdlsa immediately above threshold, <rdlssmax reaching a value on the order of 10 lfi cm2. This leads us to believe that the observed difference between the calculated and experimental values of GR. is due to the additional fragmentation of molecules of the second component by electrons with energy below the excitation threshold of a rare gas. This demonstrates a sizable role of subexcitation electrons in the irradiation of mixtures with rare gas as a main component, which has heretofore not been quantitatively established.
References and Notes(1) M. Forys and E. Migdal, Khim. Vys. En., 5, 228 (1971).(2) D. W. Huyton and T. W. Woodward, J. Chem. Soc., Faraday Trans.
1, 69, 467 (1973).(3) I. Szamrej, A. Jówko, and M. Forys, Radiat. Effects, 25, 191 (1975).(4) D. W. Huyton and T. W. Woodward, J. Chem. Soc., Faraday Trans.
1, 68, 1857 (1972).(5) A. Jówko, I. Szamrej, and M. Forys, Radiochem. Radioanal. Lett.,
15, 353 (1973).(6) M. Forys, Radiat. Effects, 25, 111 (1975).(7) K. Jezierska and M. Forys, Nukleonika, 17, 23 (1972).(8) M. Forys, A. Jówko, and I. Szamrej, J. Rhys. Chem., 80, 1035 (1976).(9) D. W. Huyton and T. W. Woodward, Radiat. Res. Rev., 2, 205 (1969).
(10) W. T. Huntress, Jr., and R. F. Pinizzotto, Jr., J. Chem. Phys., 59, 4742 (1973).
(11) L. G. Chrlstophorou and R. P. Blaunstein, Chem. Phys. Lett., 12, 173 (1971).
(12) V. I. Vedeneyev, L. V. Gurvich, V. N. Kondraf yev, V. A. Medvedev, and Y. L. Frankevich, “ Bond Energies, Ionization Potentials and Electron Affinities” (in Russian), Academy of Sciences of the USSR, Moscow, 1962.
(13) W. E. W. Ruska and I. L. Franklin, Int. J. Mass Spectrom. Ion Phys., 3, 221 (1969).
(14) J. B. Laudenslager, W. T. Huntress, Jr., and M. T. Bowers, J. Chem. Phys., 61, 4600 (1974).
(15) R. N. Dixon, G. Duxbury, M. Horani, and J. Rostas, Mol. Phys., 22, 977 (1971).
(16) It has been shown before that hydrogen is not produced in the neutralization processes in hydrogen sulfide containing mixtures.3-5,6
(17) M. Bouréne and J. Le Calvé, J. Chem. Phys., 58, 1452 (1973).(18) J. E. Velazco and D. W. Setser, Chem. Phys. Lett., 25, 197 (1974).(19) E. G. Jones and A. G. Harrison, In t. J. Mass Spectrom. Ion Phys.,
6, 77 (1971).(20) R. D. Doepker, J. Phys. Chem., 72, 40 (1968).(21) “ Ionization Potentials, Appearance Potentials, and Heats of Formation
of Gaseous Positive Ions” , Natl. Stand. Ref. Data Ser., Natl. Bur Stand., No. 26 (1969).
The Journal o f Physical Chemistry, Vol. 81, No. 16, 1977
R eaction o f Hydrogen and D euterium A tom s w ith Silane 1543
(22) G. R. Wooley and R. J. Cvetanovic, J. Chem. Phys., 50, 4697 (1969).(23) B. G. Dzantiev, A. K. L'ubimova, and A. V. Shishkov, Khim. Vys.
En., 3, 478 (1969).(24) B. G. Dzantiev, A. V. Shishkov, and M. S. Unukovitsch, Khim. Vys.
En., 2, 571 (1968).(25) B. G. Dzantiev, O. S. Shimtschuk, and A. V. Shishkov, Khim. Vys.
En., 4, 363 (1970).(26) B. Brocklehurst, Radiai. Res. Rev., 1, 223 (1968).(27) The following data were used for calculations: Xe(3P2) 8.3 eV; Kr(3P2)
9.9 eV; A ifP 2) 11.6 eV; RE(Ar+) = 15.8 eV;26 D(H-SH) = 3.9 eV; D(S-H) = 3.6 eV;12 AP(SH+) = 14.2 eV.29
Rate Constants for the Reaction of Hydrogen
(28) L. E. Compton, J. L. Gole, and R. M. Martin, J. Phys. Chem., 73, 1158 (1969).
(29) F. Fiquet-Fayard and P. M. Guyon, Mol. Phys., 11, 17 (1966).(30) S. S. Nagra and D. A. Armstrong, Can. J. Chem., 53, 3305 (1975).(31) I. Santar and J. Bednar, Collect. Czech. Chem. Commun., 34, 1
(1969).(32) C. Willis and A. W. Boyd, In t. J. Radiai. Phys. Chem., 8, 71 (1976).(33) See, e.g., L. G. Christophorou, “ Atomic and Molecular Radiation
Physics” , Wiley-Interscience, New York, N.Y., 1971.(34) L. S. Polak and D. J. Slovetsky, In t. J. Radiai. Phys. Chem., 8, 257
(1976).
and Deuterium Atom s w ith S ilane
D. Mihelclc, V. Schubert, R. N. Schindler,Institut für Physikalische Chemie der Kernforschungsanlage Jülich GmbH, Jülich, West Germany
and P. Potzinger*Institut für Strahlenchemie im Max-Planck-Institut für Kohlenforschung, Mülheim a.d. Ruhr, West Germany (Received October 20, 1975; Revised Manuscript Received March 10, 1977)
Publicathn costs assisted by the Max-Pianck-Institut für Kohlenforschung
The rate constants for the reaction of hydrogen and deuterium atoms with silane have been measured in a pulse radiolytic experiment. The values found for the rate constants were fe(H + SiH4) = (4.6 ± 0.3) X 10~13 cm3
s" 1 and fe(D + SiH4) = (3.4 ± 0.3) X 1013 cm3 s'1.
IntroductionA number of papers has appeared in the last few years
concerning the rate of hydrogen abstraction from silane by hydrogen atoms. 1 " 8 Up to now, rate constants for hydrogen abstraction from SiH4 by H and D atoms and from SiD4 by H atoms have been reported.
The values of the measured or estimated rate constants for the reactionH + SiH„ ^ H, + SiH3 (1)
show a large scatter differing by more than a power of ten. N iki and Mains9 estimated from scavenger experiments a value for the rate constant comparable with or larger than that for the hydrogen atom addition to ethylene. On the other hand, Hong, 1 from the same laboratory, using steady state photolysis with Lyman a photometry reported a much lower value. Moortgat, 2 using a flow technique, obtained a value very similar to that of Hong. In preliminary flow experiments aimed at the determination of the rate constant for the reactionD + SiH4 -*■ HD + SiH3 (2)
we also observed a very fast disappearance of D atoms, however, without a corresponding formation of HD. 10 This led one of us to propose that a silane catalyzed D atom recombination was taking place involving the formation of the SiH4D species. 1 1 A more thorough investigation showed that at low values for the ratio SiH4/D0 an effective heterogeneous wall recombination process was responsible for the D atom removal, and only for values of this ratio >50 was the disappearance of the D atoms mainly due to a homogeneous gas-phase abstraction reaction. 4 Steady state photolysis was used by Strausz and co-workers3 and by one of us5 to determine the rate constant for reaction 2 relative to the rate constant for the addition of D atoms
Present address: Institut für Physikalische Chemie, Universität Kiel, D 2300 Kiel, West Germany.
to C2D4. If one uses the recently measured rate constant for fe(D + C2D4) 12 one can convert these rate constants into absolute values. The agreement between these two values and the values from the flow experiments4 6 can be considered satisfactory.
Steady state photolyses was also used in two experiments5 '8 to determine the rate constant for the reactionH + SiD„ -*• HD + SiD3 (3)
Recently Michael6 and Gaspar7 reported on the determination of an absolute rate constant for the reaction of hydrogen atoms with silane, using a flow system. In ref 6 , rate constants are also given for reaction 2 and for the reaction of H and D atoms with methylsilanes. The measured rate constants in ref 6 and 7 for H + SiH4 were very much larger than one would have anticipated from the results of the isotopic reactions discussed above. The experiments were reportedly hampered by heterogeneous processes. On the other hand, the rate constant for (2 ) given in ref 6 is in good agreement with the other values mentioned above. If one would accept both values to be truly homogeneous gas phase values, one is left with explaining an enormously large isotope effect.
It is felt that for these reasons a redetermination of the rate constants for processes 1 and 2 is justified using experimental conditions which exclude wall effects and suppress secondary reactions.
Experimental SectionOur experimental setup was similar to that of Bishop
and Dorfman13 with the exception that a 1-m Jarrel-Ash vacuum-ultraviolet monochromator with a dispersion of8.3 A/mm was used for the isolation of the resonance line instead of the unfiltered light from the discharge lamp (see Figure 1).
The following special features should be emphasized: (a) The analyzing light source was a windowless, differentially
The Journal o f Physical Chemistry, Voi. 81, No. 16, 1977
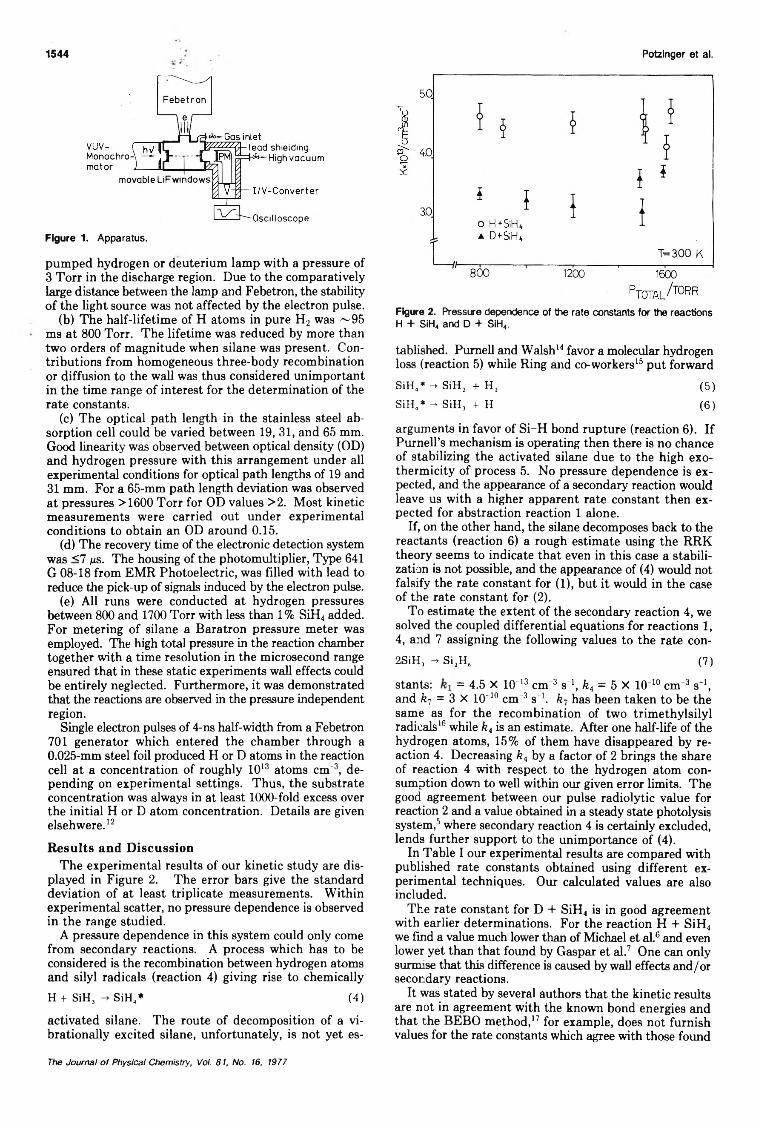
1544 Potzinger et al.
Figure 1. Apparatus.
pumped hydrogen or deuterium lamp with a pressure of 3 Torr in the discharge region. Due to the comparatively large distance between the lamp and Febetron, the stability of the light source was not affected by the electron pulse.
(b) The half-lifetime of H atoms in pure H 2 was ~95 ms at 800 Torr. The lifetime was reduced by more than two orders of magnitude when silane was present. Contributions from homogeneous three-body recombination or diffusion to the wall was thus considered unimportant in the time range of interest for the determination of the rate constants.
(c) The optical path length in the stainless steel absorption cell could be varied between 19, 31, and 65 mm. Good linearity was observed between optical density (OD) and hydrogen pressure with this arrangement under all experimental conditions for optical path lengths of 19 and 31 mm. For a 65-mm path length deviation was observed at pressures >1600 Torr for OD values >2. Most kinetic measurements were carried out under experimental conditions to obtain an OD around 0.15.
(d) The recovery time of the electronic detection system was <7 ms. The housing of the photomultiplier, Type 641 G 08-18 from EMR Photoelectric, was filled with lead to reduce the pick-up of signals induced by the electron pulse.
(e) A ll runs were conducted at hydrogen pressures between 800 and 1700 Torr with less than 1% SiH4 added. For metering of silane a Baratron pressure meter was employed. The high total pressure in the reaction chamber together with a time resolution in the microsecond range ensured that in these static experiments wall effects could be entirely neglected. Furthermore, it was demonstrated that the reactions are observed in the pressure independent region.
Single electron pulses of 4-ns half-width from a Febetron 701 generator which entered the chamber through a0.025-mm steel foil produced H or D atoms in the reaction cell at a concentration of roughly 1 0 13 atoms cm"3, depending on experimental settings. Thus, the substrate concentration was always in at least 1 0 0 0 -fold excess over the initial H or D atom concentration. Details are given elsehwere. 12
Results and DiscussionThe experimental results of our kinetic study are dis
played in Figure 2 . The error bars give the standard deviation of at least triplicate measurements. Within experimental scatter, no pressure dependence is observed in the range studied.
A pressure dependence in this system could only come from secondary reactions. A process which has to be considered is the recombination between hydrogen atoms and silyl radicals (reaction 4) giving rise to chemicallyH + SiH3 SiH„* (4)
activated silane. The route of decomposition of a vi- brationally excited silane, unfortunately, is not yet es-
Figure 2. Pressure dependence of the rate constants for the reactions H + SiH„ and D + SiH4.
tablished. Purnell and Walsh14 favor a molecular hydrogen loss (reaction 5) while Ring and co-workers15 put forwardSiH4* -+ SiH2 + H2 (5)SiH„* - SiH3 + H (6)
arguments in favor of Si-H bond rupture (reaction 6 ). If Purnell’s mechanism is operating then there is no chance of stabilizing the activated silane due to the high exo- thermicity of process 5. No pressure dependence is expected, and the appearance of a secondary reaction would leave us with a higher apparent rate constant then expected for abstraction reaction 1 alone.
If, on the other hand, the silane decomposes back to the reactants (reaction 6 ) a rough estimate using the RRK theory seems to indicate that even in this case a stabilization is not possible, and the appearance of (4) would not falsify the rate constant for (1 ), but it would in the case of the rate constant for (2 ).
To estimate the extent of the secondary reaction 4, we solved the coupled differential equations for reactions 1 , 4, and 7 assigning the following values to the rate con-2SiH3 - Si2H6 (7)
stants: = 4.5 X 10" 13 cm" 3 s"1, fe4 = 5 X 10“ 10 cm" 3 s"1,and k7 = 3 X 10" 10 cm" 3 s'1, k- has been taken to be the same as for the recombination of two trimethylsilyl radicals16 while k4 is an estimate. After one half-life of the hydrogen atoms, 15% of them have disappeared by reaction 4. Decreasing k4 by a factor of 2 brings the share of reaction 4 with respect to the hydrogen atom consumption down to well within our given error limits. The good agreement between our pulse radiolytic value for reaction 2 and a value obtained in a steady state photolysis system, 5 where secondary reaction 4 is certainly excluded, lends further support to the unimportance of (4).
In Table I our experimental results are compared with published rate constants obtained using different experimental techniques. Our calculated values are also included.
The rate constant for D + SiH4 is in good agreement with earlier determinations. For the reaction H + SiH4
we find a value much lower than of Michael et al. 6 and even lower yet than that found by Gaspar et al. 7 One can only surmise that this difference is caused by wall effects and/or secondary reactions.
It was stated by several authors that the kinetic results are not in agreement with the known bond energies and that the BEBO method, 17 for example, does not furnish values for the rate constants which agree with those found
The Journal o f Physical Chemistry, Vol. 81, No. 16, 1977

Reaction of Hydrogen and Deuterium Atoms with Silane
TABLE I
1545
1013 k, em' s-'
T,K Expt Calcd Remarks Ref
300 4.6 ± 0.3 5,4 Pulse radiolyses/Lyrnan Q This workRoom temp 2.5 ± 0.7 Steady state photolyses/Lyman Q 1Room temp >2.2 Flow reactor/mass spectrometer 2Room temp 26 Flow reactor/mass spectrometer 6300 85 ± 7 Flow reactor/Lyman Q 7
Room temp 3.4 ± 0.3 (3.5) Pulse radiolyses/Lyman Q This workRoom temp 3.0:1: 1 Flow reactor/EPR 4Room temp 3.0:1: 0.7 Flow reactor/mass spectrometer 6Room temp 4.5 ± 0.5 Flow reactor/mass spectl'ometer 6298 4.5 Steady state photolyses 3298 3.7 ± 0.3 Steady state photolyses .' 5
Reaction p,Torr [SiH.]o/[H]o
H + SiH. 800-1700 H, .;;; 10'
0.01.;;;5 He Excess reactant20 He < 150> 2
[SiH.]o/[D]o
D + SiH. 800-1600 D, ;;.10'4Ar ~200
.;;;5 He 0.03-0.0133 He 5.;;;100.;;;150
[SiD.]o/[H]o
H + SiD..;;;150.;;;1280 He
298 2.8Room temp <3.0
3.9Steady state photolysesSteady state photolyses
This work58
D + SiD. 2.6 This work
experimentally for hydrogen abstraction from silane andtrimethylsilane. Even changes representing the trends withmethylation are not correctly exhibited.6,1l,18 The experimental results were interpreted to indicate that hydrogen abstraction from silane and trimethylsilane proceedby different mechanisms, the silane proceeding by a SiH5intermediate as opposed to a direct mechanism in thetrimethylsilane. case.6,7,1l In the case of hydrogen abstraction by methyl radicals, no changes in the activationenergy were observed going from silane to trimethylsilaneand, in addition, the A factor for these two reactions isidentical if one takes reaction path degeneracy into account.I8-20 This rmding does not support the hypothesisthat there are two abstraction mechanisms operating.
From the data presented, it is concluded, that the apparent discrepancies between theory and experiment aredue partly to wrong input data, particularly bond dissociation energies, and partly due to wrong experimentalresults.
A recent mass spectrometric determination of bondenergies in silane and methylsilanes21 has shown that theSi-H bond energy is not as dependent on the degree ofmethylation, as earlier results suggested.22,23 Within ratherlarge error limits, we found for the Si-H bond dissociationenergy a value of D(Si-H) = 89 ± 4 kcal/mol, independentof the extent of methylation. From kinetic experiments,this value is confirmed for trimethylsilane (Me3SiH).24,25For the bond energy in silane, upper limits of 90 and 87kcal/mol are given.26,27 From the reaction of hot tritiumatoms with silanes, Hosaka and Rowland28 estimate thatthe bond energy changes only by 2-3 kcal/mol uponmethylation.
For our BEBO calculation, we used the same input dataas given earlierll except that for D.(H3Si-H) a value of 92kcal/mol was chosen. The Sato parameter was adjustedsuch that there exists agreement between the calculatedand now generally accepted experimental rate constant fork(D + SiH4). In this fashion we obtain the values for healed
given in Table I. Taking into account the new bonddissociation values of 89 kcal/mol independent of methylation the BEBO method furnishes values close to thoseobtained experimentally for the hydrogen abstraction bymethyl radicals as well as by hydrogen atoms. For thereaction of H or D atoms respectively with Me3SiH, we
calculate h(H + Me~iH) =3.2 X 10⁻¹³ cms S-I and k(D +MesSiH) =2.1 X lO-IS cm3S-I. These two values are alsoin good agreement with experiments.6,29
In conclusion one can say that silanes behave quite"normally" with respect to H abstraction and no esotericreaction model has to be assumed.
References and Notes(1) J.-H. Hong. Ph.D. Thesis. University of Detroit. 1972.(2) G. K. Moortgat, Ph.D. Thesis, University of Detroit. 1970.(3) K. Obi, H. S. San<l1u. H. E. GunnIng, and O. P. StraUSl, J. Phys.
Chern .• 78. 3911 (1972).(4) LJ.~. P. Potzi1ger, and R. N. Sc:t*der. Ber. 8Ins8ngBs. Phys.
Chern .• 78. 82 (1974).(5) P. Potzinger, L. C. Glasgow, and B. ReimaM. Z. Natllforsch A, 21.
493 (1974).(6) J. A. Cowfer. K. P. Lynch. and J. V. Michael. J. Phys. Chern., 78,
1139 (1975).(7) K. Y. Chao. P. P. Gaspar. and A. P. Wolf. J. Phys. Chem .• 78. 1752
(1975).(8) B. Reimann and P. Potzlnger, Ber. Bunsenges. Phys. Chem., 80,
565 (1976).(9) H. NI<I and G. J. Mains. J. Phys. Chem., 88, 304 (1964).
(10) D. Mihelcic. P. Potzinger, and R. N. SchildIer, unpu:>llshed r~.(11) L. C. Glasgow. G. Olbrich. and P. Potzinger. Chern. Phys. Lett.• 14,
466 (1972).(12) D. MheIclc, V. SchJbert, F. HOfler, and P. PotzInger. Ber. 8Ins8ngBs.
Phys. Chern., 78. 1230 (1975).(13) W. P. Bishop and L. M. Dorfman, J. Chern. Phys., 52. 3210 (1970).(14) J. H. PlmeI and R. Walsh, Proc. R. Soc. Lcndon. Ser. A, 543 (1966).(15) M. A. Ring, M. J. Puentes. and H. E. O·NeaI. J. Am. Chern. Soc.,
82.4845 (1970); C. H. Haas and M. A. RilQ. lnorg. Chern.• 14. 2253(1975).
(16) P. Cadman. G. M. Tilsley, and A. F. Trotrnan-Oickenson. J. Chern.Soc .• Faraday Trans. 1,88. 1849 (1972).
(17) H. S. Johnston. "Ga~se Reaction Rate Theory", Ronald Press,New York, N.Y.• pp 339 ft.
(18) E. R. MorrIs and J. C. J. Thyme. J. Phys. Chern .. 73. 3294 (1969).(19) O. P. Strausl. E. Jakubowski. H. S. Sandhu. and H. E. Gunning. J.
Chern. Phys .• 51. 552 (1969).(20) I. A. Kerr, D. H. Slater, and J. C. Young, J. Chern. Soc. A, 134
(1968).(21) P. Potzlnger. A. Ritter. and J. Krause. Z. Naturlorsch A. 30. 347
(1975).(22) P. Potzinger and F. W. Lampe. J. Phys. Chern., 73. 3912 (1969).(23) I. M. T. DaWlson and 1. L. Stephenson. J. Chem. Soc. A, 282 (1968).(24) I. M. T. Davidson and A. V. Howard. J. Chem. Soc.• Faraday Trans.
" 71, 69 (1975).(25) R. Walsh and I. M. Wells. J. Chern. Soc., Chem. Commun., 513
(1973).(26) K. J. Reed and J. 1. Brauman, J. Chern. Phys., 81. 4830 (1974).(27) W. H. Duewer and D. W. Setser. J. Chern. Phys .• 58. 2310 (1973).(28) A. Hosaka and F. S. Rowland. J. Phys. Chern.• 77. 705 (1973).(29) M. A. Contineanu,D.~. R. N. ScIW1dIer. and P. PotzInger. Ber.
Bunsenges. Phys. Chern., 75. 426 (1971).
The Journal of PhysIcal Chemistry, Vol. 81, No. 16, t977

1546 E. R. Austin and F. W . Lam pe
Rate Constants for the R eactions of Hydrogen Atom s w ith M ethylgerm anes1
E. R. Austin and F. W. Lampe*
Davey Laboratory, Department o f Chemistry, The Pennsylvania State University, University Park, Pennsylvania 16802 (Received December 30, 1976)
Publication costs assisted by the U.S. Energy Research and Development Administration
Absolute rate constants for the reaction of H atoms, formed by mercury photosensitization of H2-substrate mixtures at 32 °C, with (CH3)„GeH4_n for n = 1, 2, 3 have been determined in experiments involving the competitive reaction of H atoms with Si2H6. Arrhenius parameters and bond dissociation energies have been estimated for this series of methylgermanes.
IntroductionWhile considerable kinetic information pertaining to the
gas-phase reactions of radicals with various silanes and alkylsilanes has become available during the last 1 0
years, 2“ 33 very little kinetic data are available for radical reactions with germanes31,33 and no such information exists for methylgermanes containing Ge-H bonds. Recently we have developed a mass-spectrometric technique to measure rate constants for the reaction of hydrogen atoms with various silanes and mono- and digermane, 33 and it seemed worthwhile to apply this same technique to the methylgermanes.
We have conducted mass-spectrometric studies of the rates of hydrogen-atom induced decomposition of the methylgermanes relative to the rate of hydrogen-atom reaction with disilane at 32 °C. From these studies we have determined the specific reaction rates for hydro- gen-atom attack on the methylgermanes, and this paper is a report of our results.
Experimental SectionHydrogen atoms were generated by Hg(3P,) photo
sensitization of hydrogen-substrate mixtures which contained about 98% hydrogen. Under these conditions more than 95% of the Hg(3P1) atoms that are collisionally quenched react with hydrogen to yield hydrogen atoms. At the total pressures used in these experiments, namely 30-60 Torr, gas-phase recombination of hydrogen atoms and diffusion of hydrogen atoms to the walk are negligible when compared with the rates of reaction with substrate molecules2 1,33 (cf. Table I).
The reactions were carried out in a photolysis cell containing a pin-hole leak leading into the ionization region of a Bendix Model 14-101 time-of-flight mass spectrometer. The photolysis cell is connected via V 4-in. stainless steel and 6 -mm Pyrex tubing to large reservoirs (5-12 L) containing the reactants. Reactant gases thus flow continuously through the pin-hole leak into the mass spectrometer. The flow rates are such that during the course of a single experiment (typically 2-3 min) the pressure decrease in the reservoir is of the order of 0.5% or less. The apparatus has been previously described in detail. 24
The source of 2537-A radiation for generation of HgiT^) atoms was a General Electric 4-W G4T4/1 germicidal lamp. Measurements of the initial rate of formation of n-C4H 10 in H 2-C2H 4 mixtures indicate that in our experiments the lower limit for the rate of formation of hydrogen atoms was 6.7 X 10¹³ atom/cm3 s. 33 The temperature of the photolysis cell was measured using a chromel-alumel thermocouple and was found to be 32 ± 2 °C.
TABLE I: Rate Constants for H-Atom Induced Decomposition at 32 °C
Substrate m/e
No.of
runs k3(k t + k 5)fe,(cm3/s) X
1012CH3GeH3 74 i i 0.84 ± 0.08 3.1 ± 0.6(CH3)2GeH2 90 i i 0.90 ± 0.06 3.3 ± 0.6(CH3)3GeH 105 i i 1.22 ± 0.07 4.5 ± 0.7(CH3)4Si 88 i <0.01(CH3)4Ge <0.01(CH3)4Sn 165 2 <0.01
Hydrogen and nitric oxide were obtained from Matheson Gas Products. Methylgermane, dimethylgermane, and trimethylgermane were prepared by the reduction of trichloromethylgermane, dichlorodimethylgermane, and chlorotrimethylgermane, respectively, with lithium aluminum hydride. Disilane was prepared by the reduction of hexachlorodisilane with lithium aluminum hydride. Tetramethyltin was obtained from Alfa Inorganics.
Results and DiscussionConsider a gaseous system containing Si2H6, a me
thylgermane, Hg vapor, and an excess of H2. Assume that H 2 is in such great excess that electronically excited Hg(3P!) atoms are collisionally deactivated only by H2. Irradiation of this gaseous mixture by 2537-A radiation initiates the following reaction sequence:Hg( S0) + hv (2537 A) -*■ Hg(3P, ) (1)Hg(3P ,) + H2 -> Hg('S0) + 2H (2)H + Me„GeH4.„ Me„GeH,_„ + H2 (3)H + Si2H6 -» Si2H5 + H2 (4)H + Si2H6 -* SiHj + SiH4 (5)
The rates of reaction 3 and of reactions 4 + 5 can be determined from the time dependencies of the concentrations of MenGeH4_n and Si2H6 provided the free-radical products of these reactions are intercepted and thereby prevented from reacting with S Hg, MenGeH4_„, and each other. It has been demonstrated19,33,34 that nitric oxide is an efficient interceptor for silyl-type radicals. With NO present we must add to the above reaction sequence the following:
Me„GeH3. n + NO -* Me„H3„G eO N (6)
Si2H5 + NO -> Si2H5ON (7)
SiH3 + NO-* SiH3ON (8)
The rate constants of reactions 3-5 are so large that at the total pressures used H atoms will not react with NO to any
The Journal o f Physical Chemistry, Voi. 81, No. 16, 1977
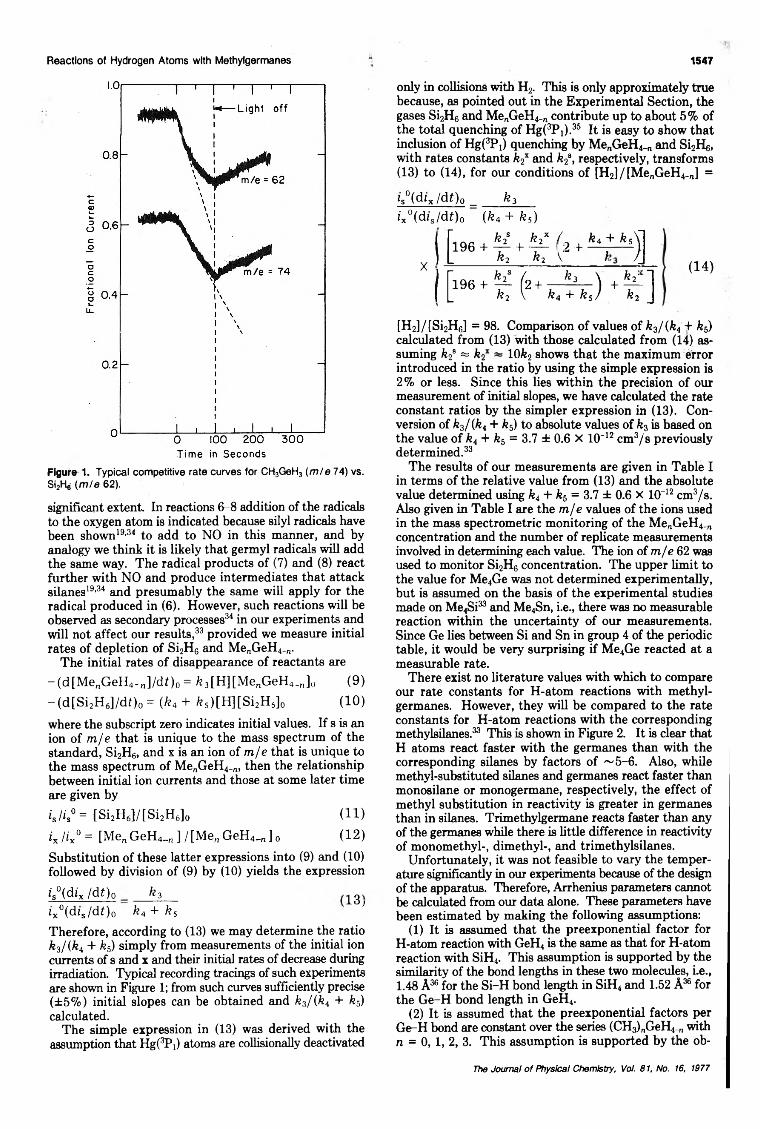
R eactions o f Hydrogen A tom s w ith M ethylgerm anes 1547
Figure 1. Typical competitive rate curves for CH3GeH3 ( m / e 74) vs. Si2Hg (m /e 62).
significant extent. In reactions 6-8 addition of the radicals to the oxygen atom is indicated because silyl radicals have been shown19'34 to add to NO in this manner, and by analogy we think it is likely that germyl radicals will add the same way. The radical products of (7) and (8) react further with NO and produce intermediates that attack silanes19,34 and presumably the same will apply for the radical produced in (6). However, such reactions will be observed as secondary processes34 in our experiments and will not affect our results,33 provided we measure initial rates of depletion of Si2H6 and MenGeH4_„.
The initial rates of disappearance of reactants are-(d[MenGeH4 -„]/di)o = /e3 [H][MenGeH4 _n ] 0 (9)
-(d[S i2H 6]/df)o = ( ^ 4 + fe5 )[H][Si2H 6] 0 (10)where the subscript zero indicates initial values. If s is an ion of m /e that is unique to the mass spectrum of the standard, Si2H6, and x is an ion of m /e that is unique to the mass spectrum of Me„GeH4_n, then the relationship between initial ion currents and those at some later time are given byi j i s° = [Si2 H6]/(Si2 H6] 0 (11)I’x/ix°= [Me„GeH4_„ ] /[Me„GeH4_„] 0 (12)Substitution of these latter expressions into (9) and (10) followed by division of (9) by (10) yields the expression
is°(dix /dt)o k 3 13
ix0 (dis/dt)o k4 + ks ’Therefore, according to (13) we may determine the ratio k3/( k 4 + k5) simply from measurements of the initial ion currents of s and x and their initial rates of decrease during irradiation. Typical recording tracings of such experiments are shown in Figure 1; from such curves sufficiently precise (±5% ) initial slopes can be obtained and k3/ ( k 4 + k5) calculated.
The simple expression in (13) was derived with the assumption that Hgi3]?!) atoms are collisionally deactivated
only in collisions with H2. This is only approximately true because, as pointed out in the Experimental Section, the gases Si2H6 and Me„GeH4„„ contribute up to about 5% of the total quenching of Hg^Px).35 It is easy to show that inclusion of H g ^ O quenching by Me„GeH4_„ and Si2He, with rates constants k2 and k2*, respectively, transforms (13) to (14), for our conditions of [H2]/ [Me„GeH4_J =
is°(dix/df)o k3ix°(dis/df) 0 (fe4 + ks)
Xr i9 6 + ^L k2
fe2x / k 4 + k S
+ t \ 2 + I )][196+ (2+ ) +l-] (14)
[H2]/[S i2H6] = 98. Comparison of values of k3/ ( k 4 + k5) calculated from (13) with those calculated from (14) assuming k2a = k2 ~ 10k2 shows that the maximum error introduced in the ratio by using the simple expression is 2% or less. Since this lies within the precision of our measurement of initial slopes, we have calculated the rate constant ratios by the simpler expression in (13). Conversion of k3/(k 4 + k5) to absolute values of fe3 is based on the value of k4 + fe5 = 3.7 ± 0.6 X 10~12 cm3/s previously determined.33
The results of our measurements are given in Table I in terms of the relative value from (13) and the absolute value determined using k4 + k5 = 3.7 ± 0.6 X 10“12 cm3/s . Also given in Table I are the m /e values of the ions used in the mass spectrometric monitoring of the Me^GeH^ concentration and the number of replicate measurements involved in determining each value. The ion of m /e 62 was used to monitor Si2H6 concentration. The upper limit to the value for Me4Ge was not determined experimentally, but is assumed on the basis of the experimental studies made on M e^i33 and Me4Sn, i.e., there was no measurable reaction within the uncertainty of our measurements. Since Ge lies between Si and Sn in group 4 of the periodic table, it would be very surprising if Me4Ge reacted at a measurable rate.
There exist no literature values with which to compare our rate constants for H-atom reactions with methylgermanes. However, they will be compared to the rate constants for H-atom reactions with the corresponding methylsilanes.33 This is shown in Figure 2. It is clear that H atoms react faster with the germanes than with the corresponding silanes by factors of ~ 5 -6 . Also, while methyl-substituted silanes and germanes react faster than monosilane or monogermane, respectively, the effect of methyl substitution in reactivity is greater in germanes than in silanes. Trimethylgermane reacts faster than any of the germanes while there is little difference in reactivity of monomethyl-, dimethyl-, and trimethylsilanes.
Unfortunately, it was not feasible to vary the temperature significantly in our experiments because of the design of the apparatus. Therefore, Arrhenius parameters cannot be calculated from our data alone. These parameters have been estimated by making the following assumptions:
(1) It is assumed that the preexponential factor for H-atom reaction with GeH4 is the same as that for H-atom reaction with SiH4. This assumption is supported by the similarity of the bond lengths in these two molecules, i.e., 1.48 A36 for the Si-H bond length in SiH4 and 1.52 A36 for the Ge-H bond length in GeH4.
(2) It is assumed that the preexponential factors per Ge-H bond are constant over the series (CH^nGeH^ with n = 0,1, 2, 3. This assumption is supported by the ob-
The Journal o f Physical Chemistry, Vol. 81, No. 16, 1977

1548 E. R. Austin and F. W . Lam pe
dissociation energies is the bond-energy-bond-order (BEBO) method.37 We have used this method employing the same value for the Sato parameter, i.e., 0.20, that we used in a similar calculation on the analogous silane series33
to calculate the bond dissociation energies of the Ge-H bond in the series (CH3)nGeH4. n. The results are shown in Table II. The estimated dissociation energy of the Ge-H bond in GeH4, 89 kcal/mol, is in good agreement with the values of Saalfeld and Svec38 (87.2 kcal/mol) and Reed and Brauman39 (<92.3 ± 4.6 kcal/mol) while being 11 kcal/mol higher than the estimated value of Kim, Setser, and Bogan40 (<78 kcal/mol). The magnitude and trend of these crudely estimated dissociation energies compare reasonably with the better known values for the silanes,4 1-4 3
with the exception of that for the (CH3)3Ge-H bond, which seems very low. If indeed it is not as small as indicated, some effect other than activation energy must operate to account for the very high reactivity toward H atoms.
Acknowledgment. This work was supported by the U.S. Energy Research and Development Administration under Contract No. EY-76-S-02-3416.
Figure 2. Comparison of the reactivity of alkylgermanes and alkyl- silanes33 expressed in terms of the number of G e-H or S i-H bonds: ( • ) H + (CH3)4_„GeH„; (■ ) H + (CH3)4_„SiH„. The value for GeH4 is from the previous paper.33
TABLE II: Arrhenius Parameters for H-Atom Induced Decomposition o f Germanes and Dissociation Energies o f Germanium-Hydrogen Bonds
E, D(=Ge-H),10" A, kcal/ kcal /
Molecule cm ! /s mol molGeH4° 2.7 1.6 89CHjGeHj(CH3)2GeH2
2.0 1.1 831.4 0.86 79
(CH3)3GeH 0.7 0.26 63a The values given for GeH„ are from ref 33.
servation that for the reaction of CH3 radicals with (CH3)„SiH4-„ with n = 0 , 1 , 2 , 3 the preexponential factors per Si-H bond are remarkably constant at 9 .0 ± 1 .1 X 10-13 cm3/s. 5,10 We expect the germanes to be analogous to the silanes.
The Arrhenius parameters A and E(k = Ae E!RT) that are obtained for the series of germanes by this admittedly crude approximation are given in Table II. It is to be noted from Table II that the activation energies fall off slowly as the Ge-H bonds in GeH4 are successively replaced by Ge-CH3 bonds.
The continuous lowering of the activation energy by successive replacement of the first three H atoms with alkyl groups is also observed in the silane series33 and paraffin series. For the reaction of H atoms with the molecules, R„CH4. „, where R is an alkyl radical, it is well known that the activation energy parallels smoothly the dissociation energy of the =C-H bond as n changes from 0 to 3. The same trend in activation energies for the reaction of H atoms with (CH3)„GeH4_„, seen in Table II, suggests that there should exist an analogous decrease in the dissociation energy of the Ge-H bond in the series (CH3)„GeH4_„ as n changes from 0 to 3. Confirmation of this suggestion by direct comparison with the literature is not possible because these bond dissociation energies have not been determined.
Because of this lack of thermochemical information in the literature, we have estimated the Ge-H bond dissociation energies for the series (CH3)„GeH4_„ for n = 0,1, 2, 3. The most successful semiempirical technique of relating activation energies for H-atom abstraction to bond
References and Notes(1) U.S. Energy Research and Development Administration Document
No. EY-76-S-02-3416-2.(2) J. A. Kerr, D. H. Slater, and J. C. Young, J. Chem. Soc. A , 104
(1966) .(3) j . A. Kerr, D. H. Slater, and J. C. Young, J. Chem. Soc. A , 134
(1967) .(4) J. A, Kerr, A. Stephens, and J. C. Young, In t J. Chem. Kinet., 1,
339, 371 (1969).(5) O. P. Strausz, E. Jakubowski, H. S. Sandhu, and H. E, Gunning, J.
Chem. Phys., 51, 552 (1969).(£) E. R. Morris and J. C. J. Thynne, J. Phys. Chem., 73, 3294 (1969).(7) A. U. Chaudhry and B. G. Gowenlock, J. Organometal. Chem., 16,
221 (1969).(8) T. N. Bell and A. E. Platt, J. Phys. Chem., 75, 603 (1971).(9) H. E. O'Neal, S. Pavlou, T. Lubin, M. A. Ring, and L. Batt, J . Phys.
Chem., 75, 3945 (1971).(10) R. E. Berkley, I. Safarik, H. E. Gunning, and O. P. Strausz, J. Phys.
Chem., 77, 1734 (1973).(11) R. E. Berkley, I. Safarik, O. P. Strausz, and H. E. Gunning, J. Phys.
Chem., 77, 1741 (1973).(12) T. N. Bell and B. B. Johnson, Aust. J. Chem., 20, 1545 (1967). <13» W. J. Cheng and M. Szwarc, J. Phys. Chem., 72, 494 (1968). (14» E. Jakubowski, H. S. Sandhu, H. E. Gunning, and O. P. Strausz, J.
Chem. Phys., 52, 4242 (1970).(15) T. N. Bell and U. F. Zucker, J. Phys. Chem., 74, 979 (1970).(16) T. N. Bell and U. F. Zucker, Can. J. Chem., 48, 1209 (1970). (17; E. R. Morris and J. C. J. Thynne, Trans. Faraday Soc., 66, 183 (1970).(18) J. A. Kerr and D. M. Timlin, In t. J. Chem. Kinet., 3, 1, 69 (1971).(19) M. A. Nay, G. N. C. Woodall, O. P. Strausz, and H. E. Gunning, J.
Am . Chem. Soc., 87, 179 (1965).(20) P. Cadman, G. M. Tilsley, and A. F. Trotman-Dickenson, J. Chem.
Soc., Faraday Trans. 1, 68, 1849 (1972).(21) T. L. Pollock, H. S. Sandhu, A. Jodhan, and O. P. Strausz, J. Am .
Chem. Soc., 95, 1017 (1973).(22) B. Reimann, R. Laupert, and P. Potzinger, Ber. Bunsenges. Phys.
Chem., 79, 1160 (1975).(23) E. R. Austin and F. W. Lampe, J. Photochem., 5, 155 (1976).(24) E. R. Austin and F. W. Lampe, J. Phys. Chem., 80, 2811 (1976).(25) I. M. T. Davidson, “Reaction Kinetics” , Vol. 1, Chemical Society
Special Periodical Report, London, 1975, pp 214 ff.(26) M. A. Contineanu, D. Mihelcic, R. N. Schindler, and P. Potzinger, Ber.
Bunsenges. Phys. Chem., 75, 426 (1971).(27) K. Obi, H. S. Sandhu, H. E. Gunning, and O. P. Strausz, J. Phys.
Chem., 76, 3911 (1972).(28) D. Mihelcic, P. Potzinger, and R. N. Schindler, Ber. Bunsenges. Phys.
Chem., 78, 82 (1974,.(29) P. Potzinger, L. C. Glasgow, and B. Reimann, Z . Naturforsch. A ,
29, 493 (1974).(30) J. A. Cowfer, K. P. Lynch, and J. V. Michael, J. Phys. Chem., 79,
1139 (1975).(31) K. Y. Choo, P. P. Gaspar, and A. P. Wolf, J. Phys. Chem., 79, 1752
(1975).(32) P. Potzinger, private communication, Dec 1975.(33) E. R. Austin and F. W. Lampe, J. Phys. Chem., 81, 1134 (1977).(34) E. Kamaratos and F. W. Lampe, J. Phys. Chem., 74, 2267 (1970).(35) J. G. Calvert and J. N. Pitts, Jr., “Photochemistry” , Wiley, New York,
N.Y., 1966, pp 72 ff.(36) E. A. V. Ebsworth, “Volatile Silicon Compounds” , Pergamon Press,
Oxford, 1963, p 16.
The Journal o f Physical Chemistry, Vol. 81, No. 16, 1977

CO Evolution in Form ic A cid Dehydration 1549
(37) H. S. Johnston, “Gas-Phase Reaction Rate Theory” , Ronald Press, New York, N.Y.
(38) F. E. Saalfeld and H. J. Svec, J. Phys. Chem., 70, 1753 (1966).(39) K. J. Reed and J. I. Brauman, J. Chem. Phys., 61, 4830 (1974).(40) K. C. Kim, D. W. Setser, and C. M. Bogan, J. Chem. Phys., 60, 1837
(1974).
(41) P. Potzinger, A. Ritter, and J. R. Krause, Z. Naturforsch. A , 30, 347(1975).
(42) R. Walsh and J. M. Wells, J. Chem. Soc., Chem. Commun., 513 (1973).
(43) I. M. T. Davidson and A. V. Howard, J. Chem. Soc., Faraday Trans. 1, 71, 69 (1975).
O scilla tory Evolution of Carbon M onoxide in the Dehydration of Form ic A cid by
Concentrated Su lfu ric A cid
Peter G. Bowers* and Gulnar RawJIDepartment o f Chemistry, Simmons College, Boston, Massachusetts 02115 (Received March 14, 1977)
Publication costs assisted by Simmons College
The periodic evolution of carbon monoxide from mixtures of formic acid and concentrated sulfuric acid has been studied. Oscillations are only observed under conditions favorable to good foaming. The composition of the foam differs from that of the liquid phase. A qualitative explanation of the oscillations is given in physical (rather than chemical) terms.
IntroductionThe periodic nature with which carbon monoxide is
evolved in the well-known reaction between formic acid and concentrated sulfuric acid was first reported over 50 years ago by Morgan. 1 Under rather specific conditions of mixture and temperature, Morgan observed that CO was released in gusts, which at their peak caused the whole mixture to rise and foam vigorously. The gusts were separated by quiescent periods with slow gas evolution, and little or no foam. Morgan was able to observe up to about 2 0 damped oscillations, with a time period of approximately 1 min.
At that time, the unusual kinetics were attributed to physical effects involving supersaturation, and indeed in later kinetic studies2 carried out under conditions designed to prevent supersaturation, the oscillatory nature of the reaction was ignored, if indeed it was observed at all.
Despite the upsurge of interest in oscillating reactions, 3
there are still only two well-documented examples of true chemical oscillators (excluding biochemical systems and electrode phenomena). These are the Belousov-Zhabo- tinski type and the Bray-Liebhafsky reaction (iodate- peroxide). They are both redox processes. For this reason we undertook to reexamine the Morgan reaction, which superficially at least, appears to involve no redox process, and to be stoichiometrically simple.
Experimental SectionChemicals were reagent grade and used without further
purification. Batches of concentrated sulfuric acid and 8 8 % formic acid from several different manufacturers gave substantially the same results.
The best oscillations were obtained by cooling the two acids separately in ice before mixing in a large test tube immersed in a thermostat bath at 38 °C ( 1 1 mL of H 2SO4 - 3 mL of HC02H). The acids were mixed vigorously for 30 s and subsequently agitated by gentle magnetic stirring. The test tube was connected to an adjustable capillary leak to the atmosphere, and to a U-tube manometer containing copper sulfate solution. By suitable adjustment of the capillary, periodic evolution of gas was reflected in oscillation of the levels of liquid in the manometer. A He-Ne laser beam was directed through the
length of Cu2+ solution in the open arm of the manometer, and the oscillatory transmittance recorded via a conventional photocell-recorder arrangement. In a similar way, with the capillary leak completely closed it was possible to follow stepwise build up in the pressure of evolved gas.
Analysis for formic acid was accomplished by measuring the absorbance (235 nm) of small samples which had been quenched with water, weighed, and appropriately diluted, after removal from the reacting mixture.
ResultsGeneral Course of the Reaction. A typical curve ob
tained by the differential method described above is shown in Figure 1. Steady oscillations begin after an initial period of vigorous gas evolution, and during the first few of them the mixture foams to an extent that no separate liquid phase is visible. At each maximum the foam ruptures quite suddenly, just after the maximum rate of gas evolution, and drains back to form an almost quiescent liquid, before gas evolution builds up again. The periodic behavior damps away gradually, with the time period of the oscillation going through a maxium (Figure 2). Slow gas evolution continues for several hours after the oscillatory phase. When the reaction appears to be over, vigorous agitation (or pumping) results in the removal of much dissolved CO.
Reproducibility. Appearance of oscillations in this system depend on a suitable choice of at least three critical variables—temperature, composition, and degree of agitation. Outside of fairly narrow limits for these, oscillations either do not occur at all, or are of low amplitude. Our composition and temperature are similar to that prescribed by Morgan. Mixtures too rich in either component react aperiodically, and without excessive foaming. Qualitatively, we observed oscillations in the temperature range 28-50 °C. At room temperature the mixture appears to be too viscous to foam well, while at high temperature gas evolution is too vigorous to permit the existence of a well-separated foam phase.
The sharpest oscillations occur when the reactants are gently agitated. With no agitation, other than that naturally inherent in gas evolution, the amplitude is less
The Journal o f Physical Chemistry, VoL 81, No. 16, 1977
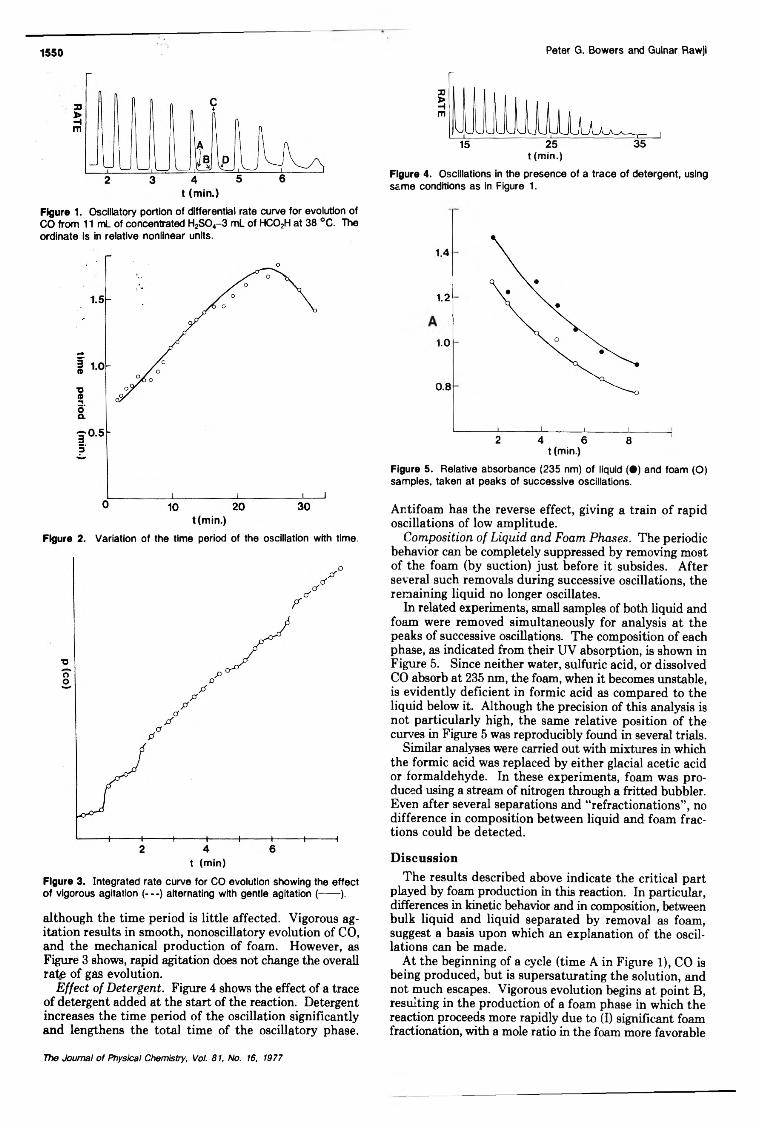
1550 Peter G. Bow ers and Guiñar Rawji
Figure 1. Oscillatory portion of differential rate curve for evolution of CO from 11 mL of concentrated H2S 0 4- 3 mL of H C 02H at 38 °C . The ordinate is in relative nonlinear units.
Figure 2. Variation of the time period of the oscillation with time.
t (m in)
Figure 3. Integrated rate curve for CO evolution showing the effect of vigorous agitation ( - - - ) alternating with gentle agitation (------- ).
although the time period is little affected. Vigorous agitation results in smooth, nonoscillatory evolution of CO, and the mechanical production of foam. However, as Figure 3 shows, rapid agitation does not change the overall rate of gas evolution.
Effect of Detergent. Figure 4 shows the effect of a trace of detergent added at the start of the reaction. Detergent increases the time period of the oscillation significantly and lengthens the total time of the oscillatory phase.
t(m in .)
Figure 4. Oscillations in the presence of a trace of detergent, using same conditions as in Figure 1.
1.4
1 . 2
1 . 0
0 . 8
J_____I____ L2 4 6
t (min.)
i8
Figure 5. Relative absorbance (235 nm) of liquid ( • ) and foam (O ) samples, taken at peaks of successive oscillations.
Antifoam has the reverse effect, giving a train of rapid oscillations of low amplitude.
Composition of Liquid and Foam Phases. The periodic behavior can be completely suppressed by removing most of the foam (by suction) just before it subsides. After several such removals during successive oscillations, the remaining liquid no longer oscillates.
In related experiments, small samples of both liquid and foam were removed simultaneously for analysis at the peaks of successive oscillations. The composition of each phase, as indicated from their UV absorption, is shown in Figure 5. Since neither water, sulfuric acid, or dissolved CO absorb at 235 nm, the foam, when it becomes unstable, is evidently deficient in formic acid as compared to the liquid below it. Although the precision of this analysis is not particularly high, the same relative position of the curves in Figure 5 was reproducibly found in several trials.
Similar analyses were carried out with mixtures in which the formic acid was replaced by either glacial acetic acid or formaldehyde. In these experiments, foam was produced using a stream of nitrogen through a fritted bubbler. Even after several separations and “refractionations”, no difference in composition between liquid and foam fractions could be detected.
DiscussionThe results described above indicate the critical part
played by foam production in this reaction. In particular, differences in kinetic behavior and in composition, between bulk liquid and liquid separated by removal as foam, suggest a basis upon which an explanation of the oscillations can be made.
At the beginning of a cycle (time A in Figure 1 ), CO is being produced, but is supersaturating the solution, and not much escapes. Vigorous evolution begins at point B, resulting in the production of a foam phase in which the reaction proceeds more rapidly due to (I) significant foam fractionation, with a mole ratio in the foam more favorable
The Journal o f Physical Chemistry, Voi. 81, No. 16, 1977
to reaction, and/or (II) inherent kinetic effects possibly involving more advantageous orientation and juxtaposition of the reactants at a surface than in bulk. At point C gas evolution ceases and almost simultaneously the foam ruptures. Factors influencing the rupture point might include (a) natural drainage of the foam, (b) instability of foam caused by composition changes due to reaction, (c) excessive CO pressure in the bubbles, and (d) depletion o f reactants in foam causing cessation of gas evolution.
In any case, at C, on the basis of our experiments, there is a composition difference between the foam and bulk liquid. Between points C and D the foam drainage liquid runs back into the bulk. The drainage liquid is probably not, at this stage, supersaturated with gas, because of its history as foam with a high surface area. Thus the newly re-formed bulk liquid is less than supersaturated, and the cycle begins again.
It is difficult to decide which of the factors I or II above is the more important in producing a composition difference between the two phases at maximum amplitude. The fact that foam is produced at all indicates a surface excess o f one o f the components, and intuitively we would expect this to be the organic acid. However the reverse is observed. This, together with the fact that little, if any, fractionation occurs on foaming similar but nonreacting mixtures, leads us to favor explanation II as the predominant cause of the composition difference. That is, the acids react more rapidly at an interface than in bulk, and this results in faster depletion o f formic acid in the foam.
Gentle agitation, by promoting good mixing between supersaturated bulk liquid, and the less saturated foam-drainage liquid, helps to produce sharp oscillations by making the slow stage more marked. Indeed, were it not for the composition and kinetic differences seen on separating the foam, a simple saturation-desaturation sequence could explain the periodicity, with the foam acting to “ catalyze” the desaturation. Vigorous agitation, on the other hand, prevents natural periodic separation o f the two phases; rapid mechanical interconversion of the mixture between foam and liquid, with an approximately constant amount of each, results in constant average rate.
Photoisomerization of Substituted Cyclic Compounds
Changes which are noted under different conditions (notably temperature, composition, and the presence of detergent or antifoam) are all explicable qualitatively in terms o f the adverse or favorable effect they have on the stability of the foam. The pertinent physical factors which determine this stability are viscosity (relating to the drainage rate) and surface tension (relating to rupture of the bubbles).4
The maximum exhibited by the time period of the oscillation (Figure 2) is also understandable in terms o f two opposing factors. As the reaction proceeds, the formic acid concentration decreases. This at first results in a decrease in the rate o f gas production and hence in the formation and rupture of foam, which therefore increases the time period for a cycle. Eventually, depletion o f the organic component adversly affects the stability of the foam for physical reasons, and the cycle speeds up before oscillations damp away entirely.
Concluding RemarksPerhaps the chief point we wish to make from this work
is that carbon monoxide evolution in the Morgan reaction is periodic in nature for reasons we believe to be physical in nature, and associated with the production of foam. The fact that it may not be a true chemical oscillator does not make it any the less interesting, and we are at present studying a number of other gas-evolution reactions which might, under the proper conditions, show periodicity for the same reasons.
Acknowledgment. One o f us (P.G.B.) wishes to thank Professors C. A. McDowell and G. B. Porter of the Chemistry Department, University o f British Columbia, where part of this research was carried out. The work was also supported in part by NSF Grant SMI76-03651.
References and Notes(1) J. S. Morgan, J. Chem. Soc. Trans., 109, 274 (1916).(2) G. A. Ropp, A. J. Weinberger, and O. K. Neville, J. Am. Chem. Soc.,
73, 5573 (1951), and references cited therein.(3) G. Nicolis and J. Portnow, Chem. Rev., 73, 4 (1973).(4) Varying the external pressure also changes the frequency of the
oscillations in a regular way (R. M. Noyes and K. Showalter, personal communication). This interesting effect constitutes a rapid and reversible method of “tuning” the frequency of gas evolution.
1551
Cis-Trans Photoisomerization of /3-Styrylnaphthalene and 3-Styrylquinoline
G. Gennari, G. Cauzzo,* and G. GailazzoInstitutes o f Physical Chemistry and Organic Chemistry, University o f Padova, 35100 Padova, Italy (Received January 21, 1977)
Publication costs assisted by the Consiglio Nazionale delle Ricerche (CNR)
The direct and anthraquinone-sensitized cis-trans photoisomerization of /S-styrylnaphthalene and 3-styrylquinoline has been investigated in benzene at 25 °C. The effect of azulene on the photostationary states is consistent with a triplet mechanism for direct photoisomerization. The influence of oxygen and of the substrate concentration on the reaction pathway is also discussed.
IntroductionWhereas the photosensitized cis-trans isomerization of
ethylenic compounds in solution was shown to proceed by a triplet mechanism,1 singlet or triplet pathways have been proposed for their isomerization induced by direct irradiation. For stilbene, quenching experiments of Saltiel and
co-workers2 led to the conclusion that the direct cis-trans photoisomerization occurs via a single route. Recently, the singlet mechanism of stilbene has been confirmed by both theoretical calculations3 and photophysical measurements.4 A theoretical state model for the singlet mechanism has been proposed5 where a S2 (!Ag*) excited singlet has a
The Journal o f Physical Chemistry, Voi. 81, No. 16, 1977

1552 G. Gennari, G. Cauzzo, and G. Galiazzo
TABLE I: Quantum Yields and Photostationary Statesfor the Anthraquinone-Sensitized Photoisomerization of 5 X 1 0 '2 M /3-StN and 3-StQ in Deaerated Benzene at 25 “C°
0 c 0 t ( [ t ] / t c ] )ss 0 c/0 t 0 c 0 t/3-StN 0.46 0.45 1.00 1.02 0.913-StQ 0.43 0.42 0.90 1.02 0.85
“ [Anthraquinone] = 5 X 1 0 '3 M.
minimum in the perpendicular configuration. A thermally activated radiationless transition thus occurs from Sj ('B,*) to the perpendicular S2, from which internal conversion to S0 is efficient because of the small S2-S 0 energy gap. This is the major process leading to cis isomerization at room temperature, whereas at low temperatures a triplet mechanism may predominate.6 On the other hand, in the photochemical trans — cis isomerization of nitrostilbene a triplet mechanism was proposed,7 and long-lived triplet intermediates have also been detected.8 The nature of the substituents at the double bond thus appears to play a fundamental role in determining the route of the photochemical isomerization and a “ mixed” singlet and triplet mechanism is probable in some cases. This was found, for instance, for some azastilbenes from the study o f the excitation wavelength effect on the photoreaction.9
In a previous work,10 we studied the effect of azulene on the direct and sensitized photoisomerization o f 3- styrylquinoline. In this paper we discuss the results of a more detailed investigation on the photoisomerization of3-styrylquinoline (3-StQ) and /3-styrylnaphthalene (/S-StN).
Experimental SectionBenzene (Uvasol Merck), thiophene free, was used as
solvent. Anthraquinone (RP Carlo Erba) and azulene (Fluka) were used without further purification. The synthesis o f 3-StQ was previously reported;10 /3-StN was obtained by decarboxylation of the corresponding phe- nylnaphthylacrilic acid, as described by Bortolus and Galiazzo.11
The irradiation procedure was the same as described elsewhere.10 In the direct isomerization, irradiations were performed at 313 nm with total absorption of the incident light. The extinction coefficients of the cis, ec, and trans, it, isomers were determined from measurements of their absorbance using the same light source as in the irradiation experiments. In the anthraquinone-sensitized photoisomerization, the solutions were irradiated with 400-nm light, which is absorbed exclusively by the sensitizer. The anthraquinone and azulene absorption spectra in their long wavelength region are unaffected by the presence of 3-StQ and /3-StN up to 5 X 1CT2 M.
The percentage of the two isomers in the irradiation solutions was determined by GLC O/g-in. column, 5% SE 30 on Chromosorb G). In the experiments at low (10-4 M) substrate concentration (see Results) the chromatographic analysis proved to be unsuitable owing to the overlap of the peaks of the cis isomer with the solvent tail; in this case spectrophotometric analysis was employed.
Photostationary compositions in the photosensitized process were determined starting with pure cis or trans isomers, whereas in direct photoisomerization, owing to the concomitant photocyclization of the cis isomer, cis-
Flgure 1. Effect of azulene on the anthraquinone-sensitized photoisomerization of /3-StN and 3-StQ in benzene at 25 °C : ( • ) deaerated; (O ) air saturated.
trans mixtures which bracketed the expected photo- stationary states were irradiated for short times. For the determination o f quantum yields the percentages of isomerization, which in any case did not exceed 15%, were corrected for the contribution of the back reaction by the formula o f Lamola and Hammond12 applied to the experimental photostationary compositions. The quantum yields were obtained as a mean of at least two series o f runs. The reproducibility was ±3% for sensitized, and ±5% for direct photoisomerization.
Fluorescence measurements were accomplished with a Perkin-Elmer MPF 44 spectrophotofluorimeter. For the determination of fluorescence quantum yields o f trans isomers, </>F, 2-(l-naphthyl)-5-phenyl-l,3,4-oxadiazole (a- NPD) in deaerated cyclohexane solution (</>F = 0.58)13 was used as standard, allowance being made for the refractive index difference with respect to benzene.
ResultsSensitized Photoisomerization. The quantum yields of
the anthraquinone-sensitized cis * trans, <j>c, and trans -*■ cis, <pt, photoisomerization are reported in Table I along with the photostationary compositions ([t] /[c ])89. The anthraquinone and substrate concentrations were 5 X 10 3 and 5 X 10“2 M, respectively. The data refer to deaerated benzene solutions. However, the same results were obtained in air-saturated solutions. At lower substrate concentrations (~10‘ 3 M) the presence o f oxygen lowers the values of both <j>c and <j>t, even if the photostationary composition remains unaffected. This effect can be reasonably ascribed to a quenching of the triplet sensitizer by oxygen. The data in Table I fit quite well the relation 4>c/<t>t = ([t]/[c])ss, which holds for high-energy sensitizers; the sum </>c = <f>t is near 0.9, the reported value for the singlet —*• triplet intersystem crossing of anthraquinone,12 and this fact indicates that the substrate concentration is high enough to intercept nearly all the triplets of the sensitizer.
The effect o f azulene on the photostationary states is shown in Figure 1; the intercepts, t, and the slope/intercept ratios, s/i, of the azulene plots are reported in Table III. As shown in Figure 1, the azulene effect is the same in
TABLE II: Quantum Yields and Photostationary States for the Direct Photoisomerization of 5 X 10 3 M /3-StN and 3-StQin Deaerated Benzene at 25 °C
0C 0t ( [t ] /[c ])s s ec/et 0 F 109tf , s 0 15l 0 15c/3-StN 0.30 0.22 0.61 043 0.45 7 ± 0.5 0.44 0 603-StQ 0.32 0.17 0.75 0.37 0.33s 1.8 0.32 0.67
The Journal of Physical Chemistry, Voi. 81, No. 16, 1977
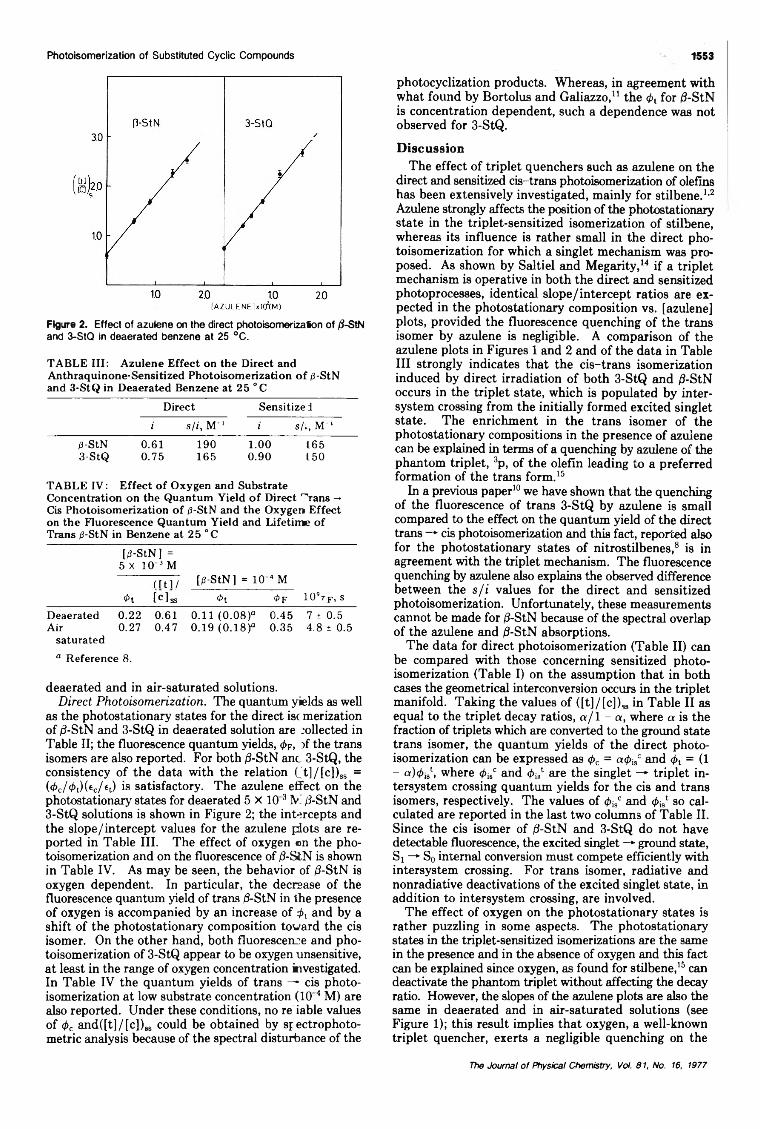
Photoisomerization of Substituted Cyclic Compounds 1553
Figure 2. Effect of azulene on the direct photoisomerizaSon of (J-StN and 3-StQ in deaerated benzene at 25 °C .
TABLE III: Azulene Effect on the Direct and Anthraquinone-Sensitized Photoisomerization of (3-StN and 3-StQ in Deaerated Benzene at 25 °C
Direct Sensitize 1i s/i, M~‘ i s/., JVT‘
(3-StN 0.61 190 1.00 3-StQ 0.75 165 0.90
L65150
TABLE IV: Effect of Oxygen and Substrate Concentration on the Quantum Yield of Direct TYans -> Cis Photoisomerization of (3-StN and the Oxygen Effect on the Fluorescence Quantum Yield and Lifetime of Trans (3-StN in Benzene at 25 "C
[(3-StN] =5 X 10⁻³M
f m / [(3-StN] = IO"4 M
01 [c] ss 01 0F 1 0 9t f , s
Deaerated 0.22 0.61 0.11 (0.08)“ 0.45 7 ± 0.5Air 0.27 0.47 0.19 (0.18)“ 0.35 4.8 ± 0.5
saturated“ Reference 8.
deaerated and in air-saturated solutions.Direct Photoisomerization. The quantum yields as well
as the photostationary states for the direct iscmerization o f (3-StN and 3-StQ in deaerated solution are collected in Table II; the fluorescence quantum yields, 0F, )f the trans isomers are also reported. For both (3-StN anc 3-StQ, the consistency o f the data with the relation C t]/[c ])ss = (0c/0 t)(ec/ f t) is satisfactory. The azulene effect on the photostationary states for deaerated 5 X 10 3IV (3-StN and3-StQ solutions is shown in Figure 2; the intercepts and the slope/intercept values for the azulene plots are reported in Table III. The effect of oxygen on the photoisomerization and on the fluorescence of (3-StN is shown in Table IV. As may be seen, the behavior of (3-StN is oxygen dependent. In particular, the decrease o f the fluorescence quantum yield of trans (3-StN in the presence o f oxygen is accompanied by an increase of i>t and by a shift o f the photostationary composition toward the cis isomer. On the other hand, both fluorescence and photoisomerization of 3-StQ appear to be oxygen unsensitive, at least in the range of oxygen concentration investigated. In Table IV the quantum yields of trans — cis photoisomerization at low substrate concentration (10 4 M) are also reported. Under these conditions, no reliable values o f 0C and([t]/[c])ss could be obtained by sp ectrophoto- metric analysis because of the spectral disturbance o f the
photocyclization products. Whereas, in agreement with what found by Bortolus and Galiazzo,11 the <pt for /3-StN is concentration dependent, such a dependence was not observed for 3-StQ.
DiscussionThe effect o f triplet quenchers such as azulene on the
direct and sensitized cis-trans photoisomerization of olefins has been extensively investigated, mainly for stilbene.1,2 Azulene strongly affects the position of the photostationary state in the triplet-sensitized isomerization o f stilbene, whereas its influence is rather small in the direct photoisomerization for which a singlet mechanism was proposed. As shown by Saltiel and Megarity,14 if a triplet mechanism is operative in both the direct and sensitized photoprocesses, identical slope/intercept ratios are expected in the photostationary composition vs. [azulene] plots, provided the fluorescence quenching o f the trans isomer by azulene is negligible. A comparison of the azulene plots in Figures 1 and 2 and o f the data in Table III strongly indicates that the cis-trans isomerization induced by direct irradiation o f both 3-StQ and (3-StN occurs in the triplet state, which is populated by inter- system crossing from the initially formed excited singlet state. The enrichment in the trans isomer o f the photostationary compositions in the presence o f azulene can be explained in terms of a quenching by azulene of the phantom triplet, 3p, o f the olefin leading to a preferred formation of the trans form.15
In a previous paper10 we have shown that the quenching o f the fluorescence o f trans 3-StQ by azulene is small compared to the effect on the quantum yield of the direct trans * cis photoisomerization and this fact, reported also for the photostationary states o f nitrostilbenes,8 is in agreement with the triplet mechanism. The fluorescence quenching by azulene also explains the observed difference between the s/i values for the direct and sensitized photoisomerization. Unfortunately, these measurements cannot be made for (3-StN because of the spectral overlap o f the azulene and (3-StN absorptions.
The data for direct photoisomerization (Table II) can be compared with those concerning sensitized photoisomerization (Table I) on the assumption that in both cases the geometrical interconversion occurs in the triplet manifold. Taking the values o f ([tj/tc]),« in Table II as equal to the triplet decay ratios, a /1 - a, where a is the fraction of triplets which are converted to the ground state trans isomer, the quantum yields of the direct photoisomerization can be expressed as 0C = o 0 isc and 0t = (1 - a)</>¡s1, where 0 i8c and <f>-J are the singlet — triplet intersystem crossing quantum yields for the cis and trans isomers, respectively. The values of <pisc and 0 is‘ so calculated are reported in the last two columns o f Table II. Since the cis isomer of (3-StN and 3-StQ do not have detectable fluorescence, the excited singlet —► ground state, S! —► S0 internal conversion must compete efficiently with intersystem crossing. For trans isomer, radiative and nonradiative deactivations of the excited singlet state, in addition to intersystem crossing, are involved.
The effect o f oxygen on the photostationary states is rather puzzling in some aspects. The photostationary states in the triplet-sensitized isomerizations are the same in the presence and in the absence of oxygen and this fact can be explained since oxygen, as found for stilbene,15 can deactivate the phantom triplet without affecting the decay ratio. However, the slopes o f the azulene plots are also the same in deaerated and in air-saturated solutions (see Figure 1); this result implies that oxygen, a well-known triplet quencher, exerts a negligible quenching on the
The Journal o f Physical Chemistry, Voi. 81, No. 16, 1977

RELA
TIVE
INT
ENSI
TY
1554
Figure 3. Fluorescence spectra of /3-StN and 3-StQ in deaerated benzene at 25 °C excited with 313-nm light.
triplet olefin compared to azulene. A possible explanation is as follows. Like stilbene triplets,2 almost all /8-StN and3-StQ triplets are probably in a 3p twisted configuration, which is converted by a radiationless deactivation to either ground state isomers. 3p states of /8-StN and 3-StQ may not be quenchable by oxygen because their energies are lower than the 22 kcal/’mol excitation energy of the 0 2 state. On the other hand, the excitation transfer to azulene, for which a larger energy gap is required, may occur via exciplexes or encounter complexes formation, as proposed by Saltiel and Thomas.15
As previously observed (see Results), oxygen has a noticeable influence on the fluorescence and on the direct photoisomerization of 8-StN, whereas such effects are not observed for 3-StQ. The different behavior of 8-StN and3-StQ with respect to oxygen can be related to the lifetimes of their lowest excited singlet, Sb states. Measurements of fluorescence lifetimes16 in deaerated benzene solution gave for trans 8-StN a value of about 7 ns, which drops to about 5 ns in air-saturated solution. On the other hand, the fluorescence lifetime of 3-StQ was found to be about 2 ns both in the presence and in the absence of oxygen. As shown in Table IV. the decrease of the fluorescence quantum yield of trans 8-StN in the presence of oxygen is accompanied by an increase of 4>t and by a shift of the photostationary composition toward the cis isomer. If a triplet mechanism is involved in direct photoisomerization, the above effect can be ascribed to an enhancement of singlet -*■ triplet intersystem crossing of trans /3-StN induced by oxygen.
As shown in Table IV, the quantum yield o f direct trans -*■ cis photoisomerization of /3-StN is concentration dependent. This fact was previously observed by Bortolus and Galiazzo,11 who related it with the possibility o f an excimer formation between the trans /3-StN in the excited Si state and ground state molecules. On the other hand, 4>t for the shorter living 3-StQ is the same in 10 4 and 5 X 10~3 M solutions; if the above interpretation is correct, such a concentration independence for 3-StQ can be ascribed to the absence of excimer formation in this compound because o f the shorter lifetime o f its Si state.
The presence of heterocyclic nitrogen in 3-StQ may suggest an involvement o f n,x* states in the deactivation process. The weak n,x* transition is not detectable in the absorption spectrum of 3-StQ; furthermore, the fluorescence of trans /3-StN is of a comparable intensity with that of 3-StQ and the band positions in the two spectra (Figure 3) are about the same, indicating a ir,x* nature o f the lowest emitting singlet state in both cases.
As shown in Table II, in 5 X 10 3 M solutions the in- tersystem crossing quantum yields of 3-StQ are not very different from those of the parent hydrocarbon. However, this comparison is unreliable because of the concentration effect on the <t>t o f /3-StN. In fact, at lower substrate concentration (10 4 M) the calculated J for 8-StN is considerably lower than the corresponding value for 3-StQ. If a triplet mechanism is still operative for direct photoisomerization under these conditions, the above findings can be interpreted in terms of an enhanced intersystem crossing in 3-StQ due to a n,x* and x,x* coupling.
Acknowledgment. This work was supported by the Consiglio Nazionale delle Ricerche (C.N.R.) through Contract No. CT 75.01.194.03, for which we are grateful.
References and Notes(1) G. S. Hammond et al., J. Am. Chem. S oc ., 86, 3197 (1964).(2) J. Saltiel et al., Org. Photochem., 3, 1-113 (1972), and references
therein.(3) G. Orlandi, private communication.(4) D. J. S. Birch and J. B. Birks, Chem. Phys. Lett., 38, 432 (1976).(5) G. Orlandi and W. Siebrand, Chem. Phys. Lett., 30, 352 (1975).(6) J. B. Birks, Chem. Phys. Lett., 38, 437 (1976).(7) D. V. Bent and D. Schulte-Frohlinde, J. Phys. Chem., 78, 451 (1974)(8) D. V. Bent and D. Schulte-Frohlinde, J. Phys. Chem., 78, 446 (1974)(9) U. Mazzucato, private communication.
(10) G. Gennari, G. Cauzzo, and G. Galiazzo, J. Photochem., 5, 409 (1976)(11) P. Bortolus and G. Galiazzo, J. Photochem., 2, 361 (1973-1974)(12) A. A. Lamola and G. S. Hammond, J. Chem. Phys., 43, 2129 (1965).(13) J. B. Birks, “Photophysics of Aromatic Molecules” , Wtey-Intersdence,
New York, N.Y., 1970, p 124.(14) J. Saltiel and E. D. Megarity, J. Am. Chem. Soc., 94, 2742 (1972).(15) J. Saltiel and B. Thomas, J. Am.Chem. S oc., 98, 5660 (1974).(16) F. Massetti, private communication.
G. Gennari, G. Cauzzo, and G. Galiazzo
The Journal o f Physical Chemisty, Vol. 81, No. 16, 1977
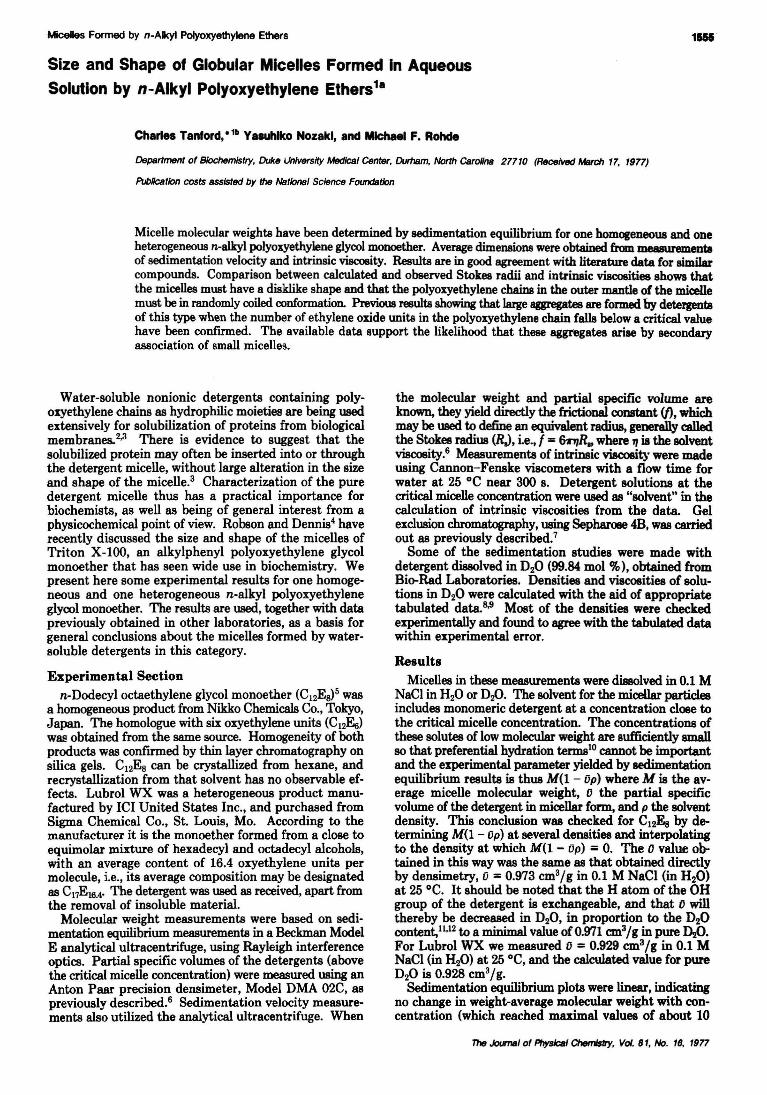
Micelles Formed by n-Alkyl PoIyoX}'ethylene Ethers
Size and Shape of Globular Micelles Formed In AqueousSolution by n-Alkyl Polyoxyethylene Ethers18
Chari.. Tanford, .1b YasuhIko Mozakl, and MIchael F. Rohde
Department of Biochemistry. Duke University Medical Center. DurlJam. North CeroHna 27710 (Received March 17. 1977)
Publlc8tlon costs assisted by the National Science Foundation
1111·
Micelle molecular weights have been determined by sedimentation equilibrium for one homogeneous and oneheterogeneous n-alkyl polyoxyethylene glycol monoether. Average dimensions were obtained from measurementllof sedimentation velocity and intrinsic viscosity. Results are in good agreement with literature data for similarcompounds. Comparison between calculated and observed Stokes radii and intrinsic viscosities shows thatthe micelles must have a disklike shape and that the polyoxyethylene chains in the outer mantle of the micellemust be in randomly coiled conformation. Previous results showing that large aggregates are formed by detergentsof this type when the number of ethylene oxide units in the polyoxyethylene chain falls below a critical valuehave been confirmed. The available data support the likelihood that these aggregates arise by secondaryassociation of small micelle3.
Water-soluble nonionic detergents containing polyoxyethylene chains as hydrophilic moieties are being usedextensively for solubilization of proteins from biologicalmembranes.2,3 There is evidence to suggest that thesolubilized protein may often be inserted into or throughthe detergent micelle, without large alteration in the sizeand shape of the micelle.3 Characterization of the puredetergent micelle thus has a practical importance forbiochemists, as well as being of general interest from aphysicochemical point of view. Robson and Dennis4 haverecently discussed the size and shape of the micelles ofTriton X-1oo, an alkylphenyl polyoxyethylene glycolmonoether that has seen wide use in biochemistry. Wepresent here some experimental results for one homogeneous and one heterogeneous n-alkyl polyoxyethyleneglycol monoether. The results are used, together with datapreviously obtained in other laboratories, as a basis forgeneral conclusions about the micelles formed by watersoluble detergents in this category.
Experimental Section
n-Dodecyl octaethylene glycol monoether (C12Es>5 wasa homogeneous product from Nikko Chemicals Co., Tokyo,Japan. The homologue with six oxyethylene units (C12~)
was obtained from the same source. Homogeneity of bothproducts was confirmed by thin layer chromatography onsilica gels. C12Es can be crystallized from hexane, andrecrystallization from that solvent has no observable effects. Lubrol WX was a heterogeneous product manufactured by ICI United States Inc., and purchased fromSigma Chemical Co., St. Louis, Mo. According to themanufacturer it is the monoether formed from a close toequimolar mixture of hexadecyl and octadecyl alcohols,with an average content of 16.4 oxyethylene units permolecule, i.e., its average composition may be designatedas C17E16.4' The detergent was used as received, apart fromthe removal of insoluble material.
Molecular weight measurements were based on sedimentation equilibrium measurements in a Beckman ModelE analytical ultracentrifuge, using Rayleigh interferenceoptics. Partial specmc volumes of the detergents (abovethe critical micelle concentration) were measured using anAnton Paar precision densimeter, Model DMA 02C, aspreviously described.6 Sedimentation velocity measurements also utilized the analytical ultracentrifuge. When
the molecular weight and partial specmc volume areknown, they yield directly the frictional constant (fJ, whichmay be used to define an equivalent radius, generally calledthe Stokes radius (RJ, i.e., f =&n,R.. where '7 is the solventviscosity.6 Measurements of intrinsic viscosity were madeusing Cannon-Fenske viscometers with a flow time forwater at 25°C near 300 s. Detergent solutions at thecritical micelle concentration were used as "solvent" in thecalculation of intrinsic viscosities from the data. Gelexclusion chromatography, using Sepharose 48, was carriedout as previously described.7
Some of the sedimentation studies were made withdetergent dissolved in D20 (99.84 mol %), obtained fromBio-Rad Laboratories. Densities and viscosities of solutions in D20 were calculated with the aid of appropriatetabulated data.8,9 Most of the densities were checkedexperimentally and found to agree with the tabulated datawithin experimental error.
Results
Micelles in these measurements were dissolved in 0.1 MNaCI in H20 or D20. The solvent for the micellar particlesincludes monomeric detergent at a concentration close tothe critical micelle concentration. The concentrations ofthese solutes of low molecular weight are sufficiently amallso that preferential hydration terms10 cannot be importantand the experimental parameter yielded by sedimentationequilibrium results is thus M(l- iJp) where M is the average micelle molecular weight, D the partial specmcvolume of the detergent in micellar form, and p the solventdensity. This conclusion was checked for Cl2Es by determining M(l- iJp) at several densities and interpolatingto the density at which M(l - Op) : O. The 0 value obtained in this way was the same as that obtained directlyby densimetry, 0 = 0.973 cm3jg in 0.1 M NaCI (in H20)at 25°C. It should be noted that the H atom of the OHgroup of the detergent is exchangeable, and that 0 willthereby be decreased in D20, in proportion to the D20content,11.12 to a minimal value of0.971 cm3j g in pure DzO.For Lubrol WX we measured 0 = 0.929 cm3jg in 0.1 MNaCI (in H20) at 25 °C, and the calculated value for pureD20 is 0.928 cm3jg.
Sedimentation equilibrium plots were linear, indicatingno change in weight-average molecular weight with concentration (which reached muimal values of about 10
The JocI'naI of PhysJcaJ ChemIs1ry, Vol. 81. No. 18. 1977
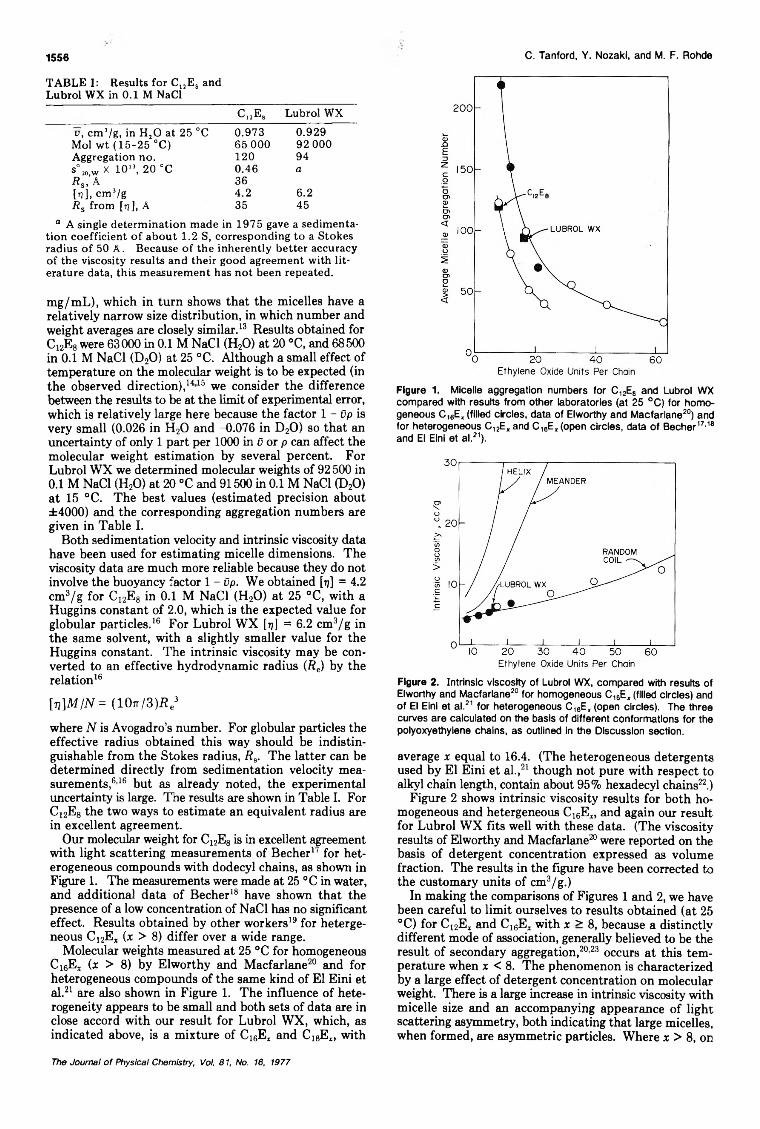
1556
TABLE I: Results for CnEs and Lubrol WX in 0.1 M NaCl
CnEs Lubrol WXv, cm 3/g, in H20 at 25 °C 0.973 0.929
Mol wt (15-25 °C) 65 000 92 000Aggregation no. 120 94s°20W X 10'\ 20 CC 0.46 ars: A 36fa], cm 3/g 4.2 6.2Rs from fa], A 35 45
0 A single determination made in 1975 gave a sedimentation coefficient o f about 1.2 S, corresponding to a Stokes radius o f 50 A. Because o f the inherently better accuracy o f the viscosity results and their good agreement with literature data, this measurement has not been repeated.
m g/m L), which in turn shows that the micelles have a relatively narrow size distribution, in which number and weight averages are closely similar.13 Results obtained for Ci2E8 were 63000 in 0.1 M NaCl (H20) at 20 °C, and 68500 in 0.1 M NaCl (D20 ) at 25 °C. Although a small effect of temperature on the molecular weight is to be expected (in the observed direction),1415 we consider the difference between the results to be at the limit of experimental error, which is relatively large here because the factor 1 - Op is very small (0.026 in H 20 and -0.076 in D20 ) so that an uncertainty of only 1 part per 1000 in 0 or p can affect the molecular weight estimation by several percent. For Lubrol W X we determined molecular weights of 92 500 in0.1 M NaCl (H20) at 20 °C and 91500 in 0.1 M NaCl (D20) at 15 °C. The best values (estimated precision about ±4000) and the corresponding aggregation numbers are given in Table I.
Both sedimentation velocity and intrinsic viscosity data have been used for estimating micelle dimensions. The viscosity data are much more reliable because they do not involve the buoyancy factor 1 - Dp. We obtained fa] = 4.2 cm3/g for Ci2E8 in 0.1 M NaCl (H20 ) at 25 °C, with a Huggins constant of 2.0, which is the expected value for globular particles.16 For Lubrol W X fa] = 6.2 cm3/g in the same solvent, with a slightly smaller value for the Huggins constant. The intrinsic viscosity may be converted to an effective hydrodynamic radius (Re) by the relation16
[r}]M/N = (107r/3)i?e3
where N is Avogadro’s number. For globular particles the effective radius obtained this way should be indistinguishable from the Stokes radius, Ra. The latter can be determined directly from sedimentation velocity measurements,6,16 but as already noted, the experimental uncertainty is large. The results are shown in Table I. For Ci2E8 the two ways to estimate an equivalent radius are in excellent agreement.
Our molecular weight for C12E8 is in excellent agreement with light scattering measurements of Becher17 for heterogeneous compounds with dodecyl chains, as shown in Figure 1. The measurements were made at 25 °C in water, and additional data of Becher18 have shown that the presence of a low concentration of NaCl has no significant effect. Results obtained by other workers19 for heterge- neous C 12Ex (x > 8) differ over a wide range.
Molecular weights measured at 25 °C for homogeneous C16Ex (x > 8) by Elworthy and Macfarlane20 and for heterogeneous compounds of the same kind of El Eini etal.21 are also shown in Figure 1. The influence o f heterogeneity appears to be small and both sets of data are in close accord with our result for Lubrol W X, which, as indicated above, is a mixture of C16EX and C18EI, with
C. Tanford, Y. Nozaki, and M. F. Rohde
Figure 1. Micelle aggregation numbers for C 12E8 and Lubrol W X compared with results from other laboratories (at 25 °C ) for homogeneous C 16E , (filled circles, data of Elworthy and Macfarlane20) and for heterogeneous C ,2Ex and C 16E,(open circles, data of Becher17,18 and El Eini et al.21).
Figure 2. Intrinsic viscosity of Lubrol WX, compared with results of Elworthy and Macfarlane20 for homogeneous C 18EX (filled circles) and of El Eini et a l.21 for heterogeneous C 16E , (open circles). The three curves are calculated on the basis of different conformations for the polyoxyethylene chains, as outlined in the Discussion section.
average x equal to 16.4. (The heterogeneous detergents used by El Eini et al.,21 though not pure with respect to alkyl chain length, contain about 95% hexadecyl chains22.)
Figure 2 shows intrinsic viscosity results for both homogeneous and hetergeneous C16EX, and again our result for Lubrol W X fits well with these data. (The viscosity results of Elworthy and Macfarlane20 were reported on the basis of detergent concentration expressed as volume fraction. The results in the figure have been corrected to the customary units of cm3/g .)
In making the comparisons of Figures 1 and 2, we have been careful to limit ourselves to results obtained (at 25 °C) for C12Ex and C16EX with x > 8, because a distinctly different mode of association, generally believed to be the result of secondary aggregation,20,23 occurs at this temperature when x < 8. The phenomenon is characterized by a large effect o f detergent concentration on molecular weight. There is a large increase in intrinsic viscosity with micelle size and an accompanying appearance o f light scattering asymmetry, both indicating that large micelles, when formed, are asymmetric particles. Where x > 8, on
The Journal o f Physical Chemistry, Voi. 81, No. 16, 1977
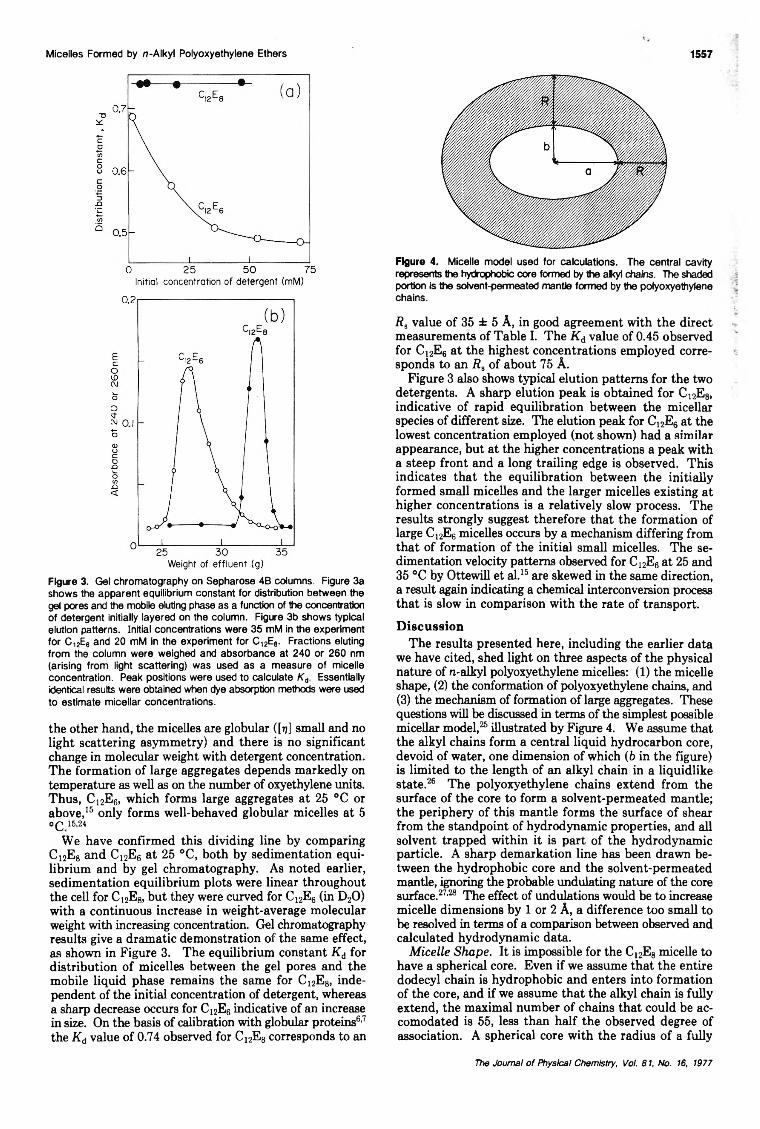
Micelles Formed by n-Alkyl Polyoxyethylene Ethers
Figure 3. Gel chromatography on Sepharose 4B columns. Figure 3a shows the apparent equilibrium constant for distribution between the gel pores and the mobile eluting phase as a function of the concentration of detergent initially layered on the column. Figure 3b shows typical elution patterns. Initial concentrations were 35 mM in the experiment for C ,2E6 and 20 mM in the experiment for C 12E6. Fractions eluting from the column were weighed and absorbance at 240 or 260 nm (arising from light scattering) was used as a measure of micelle concentration. Peak positions were used to calculate K d. Essentially identical results were obtained when dye absorption methods were used to estimate micellar concentrations.
the other hand, the micelles are globular ([77] small and no light scattering asymmetry) and there is no significant change in molecular weight with detergent concentration. The formation of large aggregates depends markedly on temperature as well as on the number of oxyethylene units. Thus, C12E6, which forms large aggregates at 25 °C or above,15 only forms well-behaved globular micelles at 50 £ 15,24
We have confirmed this dividing line by comparing C i2E8 and Ci2E6 at 25 °C, both by sedimentation equilibrium and by gel chromatography. As noted earlier, sedimentation equilibrium plots were linear throughout the cell for C i2E8, but they were curved for C12E6 (in D20 ) with a continuous increase in weight-average molecular weight with increasing concentration. Gel chromatography results give a dramatic demonstration of the same effect, as shown in Figure 3. The equilibrium constant Kd for distribution o f micelles between the gel pores and the mobile liquid phase remains the same for C i2E8, independent of the initial concentration of detergent, whereas a sharp decrease occurs for C12E6 indicative of an increase in size. On the basis of calibration with globular proteins6,7 the Kd value of 0.74 observed for Ci2E8 corresponds to an
1557
Figure 4. Micelle model used for calculations. The central cavity represents the hydrophobic core formed by the al<yl chains. The shaded portion is the solvent-permeated mantle formed by the polyoxyethylene chains.
f?a value of 35 ± 5 A, in good agreement with the direct measurements of Table I. The Kd value of 0.45 observed for Ci2E6 at the highest concentrations employed corresponds to an Ra o f about 75 A.
Figure 3 also shows typical elution patterns for the two detergents. A sharp elution peak is obtained for Ci2E8, indicative of rapid equilibration between the micellar species of different size. The elution peak for Ci2E6 at the lowest concentration employed (not shown) had a similar appearance, but at the higher concentrations a peak with a steep front and a long trailing edge is observed. This indicates that the equilibration between the initially formed small micelles and the larger micelles existing at higher concentrations is a relatively slow process. The results strongly suggest therefore that the formation of large C12E6 micelles occurs by a mechanism differing from that o f formation of the initial small micelles. The sedimentation velocity patterns observed for C12E6 at 25 and 35 °C by Ottewill et al.15 are skewed in the same direction, a result again indicating a chemical interconversion process that is slow in comparison with the rate of transport.
DiscussionThe results presented here, including the earlier data
we have cited, shed light on three aspects of the physical nature of n-alkyl polyoxyethylene micelles: (1) the micelle shape, (2) the conformation of polyoxyethylene chains, and(3) the mechanism of formation o f large aggregates. These questions will be discussed in terms of the simplest possible micellar model,25 illustrated by Figure 4. We assume that the alkyl chains form a central liquid hydrocarbon core, devoid of water, one dimension of which (b in the figure) is limited to the length of an alkyl chain in a liquidlike state.26 The polyoxyethylene chains extend from the surface of the core to form a solvent-permeated mantle; the periphery of this mantle forms the surface o f shear from the standpoint of hydrodynamic properties, and all solvent trapped within it is part o f the hydrodynamic particle. A sharp demarkation line has been drawn between the hydrophobic core and the solvent-permeated mantle, ignoring the probable undulating nature of the core surface.27,28 The effect of undulations would be to increase micelle dimensions by 1 or 2 A, a difference too small to be resolved in terms of a comparison between observed and calculated hydrodynamic data.
Micelle Shape. It is impossible for the C12E8 micelle to have a spherical core. Even if we assume that the entire dodecyl chain is hydrophobic and enters into formation of the core, and if we assume that the alkyl chain is fully extend, the maximal number o f chains that could be accomodated is 55, less than half the observed degree of association. A spherical core with the radius o f a fully
The Journal o f Physical Chemistry, Vol. 81, No. 16, 1977

1558 C. Tanford, Y. Nozaki, and M. F. Rohde
extended chain is in fact physically impossible because all chains would have to meet at the center of the sphere, and in any event thermodynamic considerations favor a flexible conformation for the chain. A realistic estimate for the maximal degree o f association of a physically possible spherical micelle is thus even smaller. The maximal degree o f association becomes 20 if we calculate the limiting dimension b as was done in a previous paper26 (to be discussed further below), and in that case even the smallest of the micelles in the C^E* series of Figure 1 (C ^E ^ could not have a spherical core. Similar considerations apply to the results for Lubrol W X and the C12EX series.
There are only two truly distinct ways to increase the volume of the micelle core beyond the spherical volume while maintaining the restriction of a limiting value for the dimension b o f Figure 4. One is to create a disklike shape,i.e., to keep only one dimension equal to b, allowing expansion along two perpendicular axes. The other is to create a rodlike shape, i.e., to keep two perpendicular dimensions equal to b and to allow extension along only one dimension, the rod axis. It is obvious that the asymmetry required to accommodate a given core volume must be greater for a rodlike than for a disklike shape, with a concomitantly greater increase in asymmetry-dependent parameters, such as the intrinsic viscosity. Rigorous equations relating shape to hydrodynamic properties exist for oblate and prolate ellipsoids of revolution and not for other possible detailed models that might fall within the general terms “ disklike” and “ rodlike” , and we are therefore forced to use ellipsoidal models to make the distinction. Because any rodlike particle of given volume is more asymmetric than any disklike particle of the same volume, it is likely that, conclusions based on an ellipsoidal model are valid regardless of the precise micelle shape. It may in fact be unrealistic to think of the micelle as having a precise shape such as a rigid body would have. The micelle is a small liquid droplet in a liquid solvent, subject to fluctuations in surface shape and extent. There may not be a more precise description than “ disklike” and “ rodlike” .
It is appropriate to mention in this connection the recent theoretical discussion of micelle shape by Israelachvili et al.29 They have pointed out that the micelle core is not simply a structureless continuum of hydrocarbon, but that it is a volume of space occupied by hydrocarbon chains that are geometrically constrained. Consideration of this factor leads to prediction of preferred shapes with more complex boundaries than those of ellipsoids of revolution. It is clear from the preceding paragraph that a comparison between calculated and experimental hydrodynamic properties cannot be sufficiently sensitive to permit an experimental test o f their proposed models, especially in view of the probability that fluctuations in shape would have to be taken into account in interpreting the average micellar properties measured by hydrodynamic experiments.
Conformation of Polyoxyethylene Chains. Polyoxy- ethylenes in aqueous solution are typical randomly coiled polymers,30’31 and one would thus expect the polyoxyethylene chains extending from the micelle core to be likewise randomly coiled, with the distance R o f Figure 3 approaching an approximately square-root dependence on the number o f polyoxyethylene units as that number becomes large. However, the parallel alignment o f the chains in the micelle mantle may affect the preferred conformation and three possible rigid conformations, with R directly proportional to the number of polyoxyethylene units, have been considered in the literature: the fully extended (zig-zig) conformation,32 with a length of 3.5 A
Figure 5. Length of polyoxyethylene segment as a function of ethylene oxide units per chain for several alternative conformations.
per monomer; the helical conformation seen in polyoxyethylene crystals,33’34 with a length o f 2.76 A per monomer; and the hypothetical “ meander” conformation,32 with a length of 1.8 to 2 A per monomer. Kalyanasundaram and Thomas35 have recently interpreted Raman spectral data as indicating the presence o f a helical structure in some micelles formed by detergents with long polyoxyethylene chains.
End-to-end distances of polyoxyethylene chains in the random coil conformation can be obtained from parameters calculated by the statistical mechanical methods of Flory.30 These calculations give results in agreement with experiment for the limiting behavior o f long-chain polymers, but also permit calculation o f the deviations from limiting behavior for short chains. The dimensions yielded by the calculations are “ unperturbed” dimensions and are directly applicable only when the polymer is dissolved in an ideal 9 solvent. Water or 0.1 M NaCl is a nonideal solvent in which the dimensions are somewhat larger than in a 9 solvent, but the effect for short chains should not be significant; the experimentally observed expansion falls rapidly with decreasing molecular weight and is only about 10% of the end-to-end distance (in water at 35 °C) for a degree o f polymerization of about 1000.31 Expected end-to-end distances for all models are plotted as a function o f the number of oxyethylene units in Figure 5. For the meander conformation the smallest possible value (1.8 A per monomer) has been used.
Theoretical hydrodynamic properties of the micelles depend only on the overall size and shape of the hydro- dynamic particle, and are thus under the influence of both the factors we have discussed. Calculations were made using standard equations for the frictional coefficient and intrinsic viscosity of oblate and prolate ellipsoids,16’36 with semiaxes a + R and b + R, values of R being based on the data of Figure 5. The results for C12E8 are shown in TableII.
The parameters a and b are determined as was done in a previous paper on this subject.26 The aggregation number and hydrocarbon density determine the core volume, b is estimated from the hydrocarbon chain length, and the value o f a then follows automatically from the equation for the volume of an ellipsoid. In the absence of direct information to the contrary it is reasonable to assume that the parameter b o f Figure 4 corresponds in length to a segment of a polymethylene chain with the same number of carbon atoms, and that it can be estimated from the statistical mechanical calculations of Flory.30 For a dodecyl chain this means that b is about 75% of the fully
The Journal o f Physical Chemistry, Voi. 81, No. 16, 1977

MIcelles Formed by n-Alkyl Polyoxyethylene Ethers
TABLE II: Theoretical HydrodynamicParameters" for CnE.
Polyoxyethylene chain conformation
Random coil Meander Helical
nc b/lmax R s [Til R s [Til R s [1)]
11b 0.75bOblate Ellipsoidal Core
37.0 5.0 39.8 6.2 45.9 9.511 0.85 36.4 4.8 39.2 5.9 45.4 9.212 0.73 36.2 4.7 39.0 5.9 45.2 9.112 0.85 35.6 4.4 38.4 5.6 44.5 8.6
Prolate Ellipsoidal Core11 0.75 43.3 8.5 46.3 10.3 52.6 14.911 0.85 40.2 6.6 43.0 8.0 49.3 12.012 0.73 42.0 7.8 45.0 9.4 51.3 13.812 0.85 38.5 5.7 41.3 7.1 47.5 10.7
a R s in A and [1)J in cm3/g. Experimental values aregiven in Table I. nc is the number of carbon atoms ofthe alkyl chain assumed to participate in formation of themicelle core; bllmax is the ratio of the assumed length tothe fully extended length of the alkyl chain, the smallervalue in each pair representing the most probable value fora randomly coiled segment of a polymethylene chain.
extended length (lmu).26 In the previous paper26 we alsoassumed that the CH2 group adjacent to the hydrophilicmoiety of the detergent molecule would not enter thehydrophobic core because it probably lies within thesolvation sphere of the polar groups, so that the numberof carbon atoms of the embedded alkyl chain (nc) is oneless than the formula number, Le., nc =11 for a dodecylchain. When this is done, 1.25 A is added to the dimensionR to accommodate the extra CH2 group in the micellemantle. In the present context it is important to demonstrate that these assumptions are not critical for theconclusions, and this has been done by making alterr ltecalculations with all 12 carbon atoms in the hydrophobiccore and with bllmu: closer to unity. This factor is seento have little influence, and the conclusion from thecalculations is clear: the micelles must be disklike and thepoJyoxyethylene chains must be randomly coiled to obtainreasonable agreement between theory and the experimental results of Table I. Actual ellipsoid dimensions arelisted in Table III.
The same result is obtained when similar calculationsan made for the other micelles for which data were givenabove. The incompatibility between a prolate ellipsoidmodel and the observed data is most evident when thepo1yoxyethylene chain is short and the micelle size is large,e.g., for Cu;~ (aggregation number 219), using nc =15 andb/!mu: = 0.67 and the random coil dimensions for R, wecaJculate [17] =4.7 cm3/g for an oblate shape and [17] =11.1cm3/g for a prolate shape. The experimental value is 4.85cm3/g.
The fact that the polyoxyethylene chains must berandomly coiled is shown even more forcibly by comparingobserved and calculated [17] values for micelles in the C1~%series with large x, where the dimension R becomesdominant and what is assumed about the shape of thehydrophobic core has less influence than it did in the caseof C12Es (Table II), especially since the micelles becomesmaller as x increases and the core correspondingly lessasymmetric. Calculated and experimental viscosity dataare compared in Figure 2, and ellipsoid dimensions forwhat we consider to be the optimal micelle model areshown in Table III.
The conclusion that the micelles considered in this studyhave a disklike rather then rodlike shape agrees withtheoretical prediction.26 A similar conclusion was reachedpreviously from experimental data for sodium dodecyl
1551
TABLE III: Calculated Dimensions for OblateEllipsoidal Micelles"
Dim~nsions defined byAggregation Figure 4, in A
no. baR
CnE. 120 11.6 28.3 14.413.1 26.6 14.412.2 28.7 13.214.2 26.6 13.2
CuEn 81 11.6 23.2 18.0C'2E" 51 11.6 18.4 22.2CU E'3 40 11.6 16.3 25.0
C,6 E. 219 13.7 40.5 15.5C,6Eu 152 13.7 33.8 18.0C'6E17 99 13.7 27.2 21.4C'6E'170 13.7 22.9 24.0C'6E32 56 13.7 20.5 29.5C,6E.. 39 13.7 17.1 35.0C'6Eu 25 13.7 13.7 41.2Lubrol WX 94 14.2 27.0 20.8
a The calculations are for single micelles with aggregation number equal to the observed average extent of aggre·gation. Lubrol WX has been treated as C17EI6" The fourentries for CuE. corresponds to the four slightly differentvalues of nc and b/lmax in the first four lines of Table II.All other entries were based on nc one less than the nominal alkyl chain length and b/lmax as given in ref 26 forrandomly coiled alkyl chains. Values of R include allowance for the presence of the CH, group excluded from thehydrophobic core.
sulfate micelles at moderate ionic strength and for C12~and C1~micelles at 5°C, where no secondary associationoccurs.26 Robson and Dennis4 have shown by similarmethods that an alkylphenyl polyoxyethylene micelle(Triton X-100) must have a disklike shape. They pointout that a spherical micellar shape would be palSible if onecould remove restriction on the parameter b of Figure 4by allowing oxyethylene units to become inCOl"porated inthe hydrophobic core, but this is a thermodynamicallyimprobable event. When the micelle size becomes verysmall, as for C1~' a spherical shape is predicted (a = bin Table III), and a spherical shape is possible for C1~32and C1~« if we allow the alkyl chains to be more nearlyfully extended, as El Eini et al.21 have already pointed out.There is however no possibility of fitting the large micellesformed by Cl~% with the smaller values of x by a sphericalmodel.
Micelle hydration numbers are frequently reported, buthave usually been based on an assumed spherical shape.They are readily calculated for the ellipsoidal model usedhere by subtracting the volume occupied by the detergentmolecules (using the measured jj values) from the totalellipsoid volume. For C12Es one obtains 0.87 to 0.71 g ofH~Ig of detergent, depending on which of the four modelsis used. This corresponds to 3.3 to 2.7 water molecules perethylene oxide group. For C1~ the hydration is 0.65 gig,corresponding to 2.6 water molecules per ethylene oxidegroup. Hydration increases with increasing polyoxyethylene chain length: in terms of water molecules perethylene oxide group it is 4.2 for Lubrol WX and 12.4 forC1~' The smallest values (about 2.5 water molecules perethylene oxide group) may be significant in relation to therequirements for preventing secondary association. Thelarger numbers for longer chains simply represent thetypical increase in the amount of solvent trapped by arandomly coiled polymer as the chain length is increased.
Formation of Large Aggregates. We have confirmed thephenomenon of concentration-dependent growth of particle size previously observed for n-alkyl polyoxyethylene
The JolmBI of Physical ChemIstry. Vol. 81. No. 18, 1977

1560 T. Kato and T. Fujiyama
micelles when the polyoxyethylene chain length falls below a critical level. Elworthy and Macfarlane20 and subsequently Attwood23 ascribed this phenomenon to a secondary aggregation of small micelles into larger particles, but more recently Mukerjee37 has shown that the data can be mathematically described in terms of a single continuous self-association process in which there is no distinction between the mode of growth (by addition of monomers) at the levels of small and large average micelle size. Out chromatographic data (Figure 3) provide very strong evidence that the growth to large size is in fact a different and slower process than the formation of small micelles from monomers, i.e., it supports the possibility of secondary association. Moreover, the strong dependence on temperature and on polyoxyethylene chain length suggest that hydrophobic forces are not the major factor in this phenomenon. Thus large particles might be formed from small micelles by association between polyoxyethylene groups, without alteration o f the hydrophobic portion of the constituent micelles.
References and Notes(1) (a) This work was supported by Grant No. PCM76-15240 from the
National Science Foundation, (b) Recipient of a Research Career Award from the National Institutes of Health, U.S. Public Health Service.
(2) A. Helenius and K. Simons, Biochim. Biophys. Acta, 415, 29 (1975).(3) C. Tanford and J. A. Reynolds, Biochim. Biophys. A cta, 457, 133
(1976).(4) R. J. Robson and E. A. Dennis, J. Phys. Chem., 81, 1075 (1977).(5) We have abbreviated C„H2„+1(OCH2CH2)xOH as C„E„.(6) C. Tanford, Y. Nozaki, J. A. Reynolds, and S. Makino, Biochemistry,
13, 2369 (1974).(7) Y. Nozaki, N. M. Schechter, J. A. Reynolds, and C. Tanford, Bio
chemistry, 15 , 3884 (1976).(8) Landolt-Bornstein Tabellen, Vol. II, 6th ed, Springer Verlag, Berlin,
1969-1971.
(9) G. Jones and H. J. Fornwalt, J. Chem. Phys., 4, 30 (1936).(10) E. F. Casassa and H. Eisenberg, Adv. Protein Chem., 19, 287 (1S64).(11) S. J. Edelstein and H. K. Schachman, J. Biol. Chem., 242, 306 (1967).(12) J. A. Reynolds and C. Tanford, Proc. Natl. Acad. Sei. U .S .A ., 73,
4467 (1976).(13) D. G. Hall arid B. A. Pethica in “Nonionic Surfactants” , M. J. Schick,
Ed., Marcel Dekker, New York, N.Y., 1967, Chapter 16.(14) M. Corti and V. Degiorgio, Opt. Commun., 14, 358 (1975).(15) R. H. Ottewill, C. C. Storer, and T. Walker, Trans. Faraday Soc.,
63, 2796 (1967).(16) C. Tanford, “Physical Chemistry of Macromolecules” , Wiley, New
York, N.Y., 1961, Chapter 6.(17) P. Becher, J. Colloid Sei., 16, 49 (1961).(18) P. Becher, J. Colloid Sei., 17, 325 (1962).(19) Cited by P. Becher in “Nonionic Surfactants” , M. J. Schick, Ed., Marcel
Dekker, New York, N.Y., 1967, Chapter 15.(20) P. H. Elworthy and C. B. Macfarlane, J. Chem. Soc., 907 (1963).(21) D. I. D. El Eini, B. W. Barry, and C. T. Rhodes, J. Colloid In terface
Sei., 54, 348 (1976).(22) B. W. Barry and D. I. D. El Eini, J. Colloid Interface Sei., 54, 339
(1976).(23) D. Attwood, J. Phys. Chem., 72, 339 (1968).(24) J. M. Corkill and T. Walker, J. Colloid Interface Sei., 39, 621 (1972).(25) C. Tanford, “The Hydrophobic Effect” , Wiley, New York, N.Y., 1973,
Chapter 6.(26) C. Tanford, J. Phys. Chem., 78, 2469 (1974).(27) C. Tanford, Proc. Natl. Acad. Sei. U .S .A ., 71, 1811 (1974)(28) D. Stigter and K. J. Mysels, J. Phys. Chem., 59, 45 (1955).(29) J. N. Israelachvili, D. J. Mitchell, and B. W. Ninham, J. Chem. Soc.,
Faraday Trans. 2 , 72, 1525 (1976).(30) P. J. Flory, “ Statistical Mechanics of Chain Molecules” , Wiley, New
York, N.Y., 1969, Chapter V.(31) F. E. Bailey, Jr., and J. V. Koleske in “ Nonionic Surfactants” , M. J.
Schick, Ed., Marcel Dekker, New York, N.Y., 1967, Chapter 23.(32) M. Rösch in “Nonionic Surfactants” , M. J. Schick, Ed., Marcel Dekker,
New York, N.Y., 1967, Chapter 22.(â3) H. Tadokoro, Y. Chatani, T. Yoshihara, S. Tahara, and S. Murahashi,
Makromol. Chem., 73, 109 (1964).(34) J. L. Koenig and A. C. Angood, J. Polym. Sei., A2, 8, 1787 (1970).(35) K. Kalyanasundaram and J. K. Thomas, J. Phys. Chem., 80, 1462
(1976).(36) H. L. Frisch and R. Simha in “Rheology” , Vol. 1, F. R. Eirich, Ed.,
Academic Press, New York, N.Y., 1956, Chapter 14.(37) P. Mukerjee, J. Phys. Chem., 76, 565 (1972).
Light Scattering Study of Local Structures in Solutions. Chloroform-Cetyltrimethylammonium Chloride System
Tadashi Kato and Tsunetake Fujiyama*
Department o f Chemistry, Faculty o f Science, Tokyo Metropolitan University. Setagaya-ku, Tokyo 158, Japan (Received March 16, 1S77)
Publication costs assisted by the Tokyo Metropolitan University
Light scattering spectra were observed for binary solutions of chloroform-cetyltrimethylammonium chloride (CTAC1) at various concentrations (0-0.04 mole fractions). The Rayleigh intensities were reduced to concentration fluctuations. The observed concentration dependencies of the concentration fluctuation were explained well if we considered the existence of an aggregate which was composed of a few CTAC1 and about 60 chloroform molecules. Using the infrared data, the detailed structure of the aggregate was clarified as follows: (1) a few CTAC1 molecule make up the core of the aggregate; (2) about 15 chloroform molecules make up the first shell by forming direct hydrogen bonds with the core molecules; and (3) about 45 chloroform molecules envelop the first shell and form the second shell. A comparison of the present method and the Debye plotting method for determining the molecular weight of the solute molecule is given in the Appendix.
IntroductionIn previous reports,1,2 quantitative analysis of the in
frared absorption intensities of some water soluble surfactants in chloroform solutions has been reported. It has been concluded in these reports that those surfactants dissolve in chloroform by forming hydrogen bonds with several solvent chloroform molecules. As the hydrogen
bonds are not of the 1:1 type, we thought it important to study the structure of these complexes in more detail.
Recently, we presented a method for determining which local structures exist in binary solutions by observing the concentration fluctuation at various concentrations.3“6 In the present study, we applied the light scattering method to determine the local structures expected in the above
The Journal o f Physical Chemistry, Vol. 81, No. 16, 1977
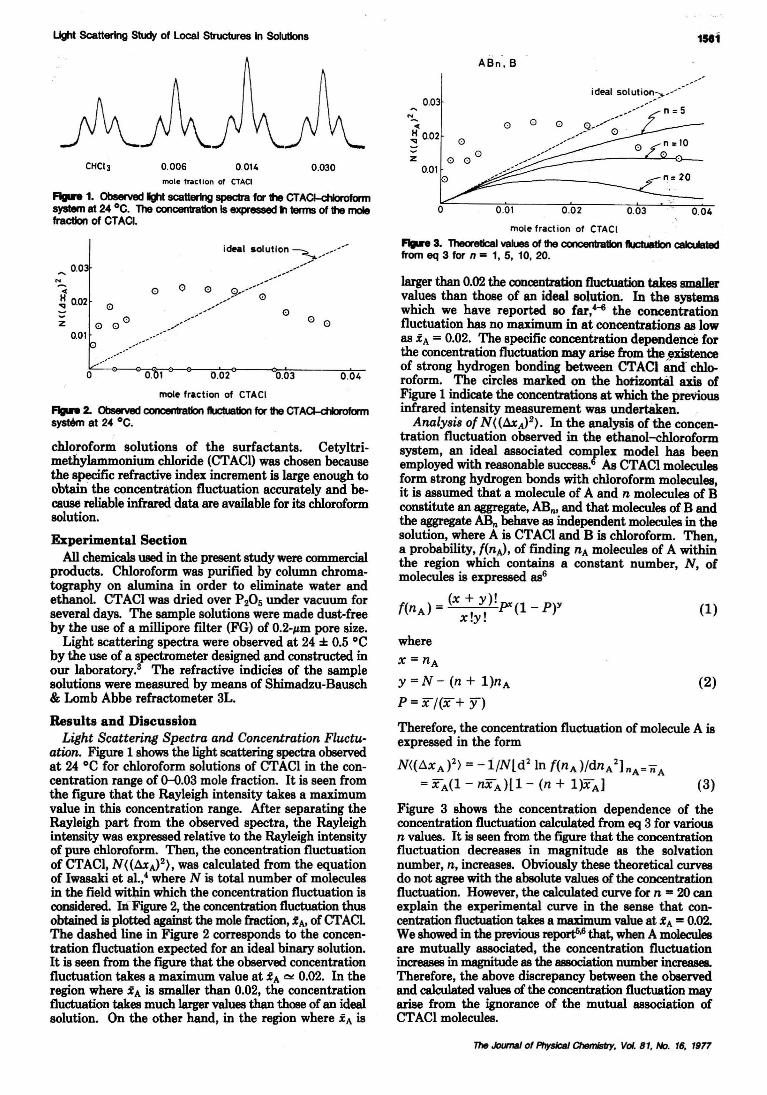
Ught Scattering Study of Local Strucil.-es In SolutIons 1511
FIgln 1. Observed II\tIt scattering spectra for !he CTACkhIoroformsystem at 24°C. The conoentratlon Is expressedtl terms of !he molefracllon of CTACI.
(1)
(2)
0.040.030.020,01
ooo 0
o
..~ 0.02
0.03
~
z0,01
f(n ) = (x + y)!P(1- P)YA x!y!
where
x = nA
y = N - (n + 1)nA
P=x/(x+ y)
ABn. B
Therefore, the concentration fluctuation of molecule A isexpressed in the form
N«f),.XA)2) = -1/N[d2 In f(nA)/dnA2]nA=nA
=xA(1 - nxA)[1- (n + 1)XA] (3)
mole fraction of CTACI
F9n 3. 1heoretIcaJ values of !he COllC8llbatlon fkIctui.tIon caJculatedfrom eq 3 for n = 1, 5, 10, 20.
larger than 0.02 the concentration fluctuation takes smallervalues than those of an ideal solution. In the systemswhich we have reported so far,H the concentrationfluctuation has no maximum in at concentrations as lowas fA =0.02. The specific concentration dependence forthe concentration fluctuation may arise from tbeexistenceof strong hydrogen bonding between CTACI and' chloroform. The circles marked on the horizout8l axis ofFigure 1 indicate the concentrations at which the previousinfrared intensity measurement was undertaken.
Analysis of N«AxA)2). In the analysis of the concentration fluctuation observed in the ethanol-chloroformsystem, an ideal associated complex model has beenemployed with reasonable success.6 As CTACI moleculesform strong hydrogen bonds with chloroform molecules,it is assumed that a molecule of A and n molecules of Bconstitute an aggregate, ABn, and that molecules of B andthe aggregate ABn behave as independent molecules in thesolution, where A is CTACI and B is chloroform. Then,a probability, f(nA>, of rmding nA molecules of A withinthe region which contains a constant number, N, ofmolecules is expressed as6
Figure 3 shows the concentration dependence of theconcentration fluctuation calculated from eq 3 for variousn values. It is seen from the figure that the concentrationfluctuation decreases in magnitude as the solvationnumber, n, increases. Obviously these theoretical curvesdo not agree with the absolute values of the concentrationfluctuation. However, the calculated curve for n =20 canexplain the experimental curve in the sense that concentration fluctuation takes a maximum value at fA =0.02.We showed in the previous report506 that, when A moleculesare mutually associated, the concentration fluctuationincreases in magnitude as the association number increases.Therefore, the above discrepancy between the observedand calculated values of the concentration fluctuation mayarise from the ignorance of the mutual association ofCTACI molecules.
0.04
0.030
0.03
0.014
0.02 .
mole fraction of CTACI
0.006
0.' 1
CHCI]
o
N~..~ 0.02
" 0.0
mole fraction of CTACI
FIgln 2. 0bseNed COllc8,,'ation tkJetuation for !he CTACk:hIoiofOlilisyst8m at 24°C. '.
chloroform solutions of the surfactants. Cetyltrimethylammonium chloride (CTACI) was chosen becausethe specific refractive index increment is large enough toobtain the concentration fluctuation accurately and because reliable infrared data are available for its chloroformsolution.
Experimental SectionAll chemicals used in the present study were commercial
products. Chloroform was purified by column chromatography on alumina in order to eliminate water andethanol. CTACI was dried over P20S under vacuum forseveral days. The sample solutions were made dust-freeby the use of a millipore filter (FG) of 0.2-lLm pore size.
Light scattering spectra were observed at 24 ± 0.5 °Cby the use of a spectrometer designed and constructed inour laboratory.3 The refractive indicies of the samplesolutions were measured by means of Shimadzu-Bausch& Lomb Abbe refractometer 3L.
Results and DiscussionLight Scattering Spectra and Concentration Fluctu
ation. Figure 1 shows the light scattering spectra observedat 24 °C for chloroform solutions of CTACI in the concentration range of 0-0.03 mole fraction. It is seen fromthe figure that the Rayleigh intensity takes a maximumvalue in this concentration range. After separating theRayleigh part from the observed spectra, the Rayleighintensity was expressed relative to the Rayleigh intensityof pure chloroform. Then, the concentration fluctuationof CTACI, N«AxA>2), was calculated from. the equationof Iwasaki et al.,· where N is total number of moleculesin the field within which the concentration fluctuation isconsidered. hfFigure 2, the concentration fluctuation thusobtained is plotted against the mole fraction, fA, ofCTACLThe dashed line in Figure 2 corresponds to the concentration fluctuation expected for an ideal binary solution.It is seen from the figure that the observed concentrationfluctuation takes a maximum value at fA C!!! 0.02. In theregion where fA is smaller than 0.02, the concentrationfluctuation takes much larger values than those of an idealsolution. On the other hand, in the region where fA is
The Journal of PhysIcsI ChemIstry, Vol. 81, No. 16, 1917

1562 T. Kato and T. Fujiyama
TABLE I: Results from Infrared Absorption Intensity Measurements for Various Cationic Surfactants“Surfactants n n [ I V ' 2 - r f 1' 2 ]
Dodecyldimethylamine oxide C12H25N+(CH3)20 - 5 160Dodecyltrimethylammonium chloride C10H21N+(CH3)3CP 4-4.5 130-150Cetyltrimethylammonium chloride c ,6h 33n +(Ch 3 )3cr 4-4.5 130-150Cetylpyridinium chloride C,H5N+C16H33Cr
(CH3)3N+0 -3-4 110-150
Trimethylamine oxide 2.5 100Tetraethylammonium chloride (C2H5)4N+Cr 2-2.5 110-140Tetra-n-butylammonium chloride (C4H9)4N+Cr 2 130n-Octylamine c 8h , ,n h 2 1 30Pyridine c 5h 5n 1 30Pyridine 1-oxide C5HsN+0 - 2 60
“ Reference 1.
Figure 4. Theoretical values of the concentration fluctuation calculated from eq 5 for n = 5 and / = 1, 2, 3.
Thus, it is assumed further that l AB„ molecules form an aggregate o f the type A;B!n and that AtBln type molecules and B molecules are mutually independent in solution. Then, the relation of x,y, and nA corresponding to eq 1 arex = nA/ly - N - (n + l ) n A (4)
and the expression for the concentration fluctuation of A is modified as
A / B / n , B
m o le f ra c t i o n o f CTACI
Figure 5. Theoretical values of the concentration fluctuation calculated from eq 5 for n = 20 and / = 1, 2, 3, 4.
A / B /n . B
N ((A x a )2) = x A [ l - (n + l ) x A] [l - {l(n + 1)- 1 } * A ] ( 5 )
The theoretical curves calculated from eq 5 are shown in Figure 4 (n = 5) and in Figure 5 (n = 20). The curve corresponding to n = 20 and l = 3-4 can explain the experimental results very well. The best fit between the calculated and observed concentration fluctuation was obtained by setting l = 3.4 and n = 18. The final result for the theoretical calculation is shown in Figure 6.
Local Structure in the Solutions. The present results may be summarized as follows. CTACI dissolves in chloroform by forming an aggregate which is made up of about three or four CTACI molecules and about 60 chloroform molecules. This conclusion is an apparent contrast to the conclusion drawn from the infrared absorption intensity analysis, that is, CTACI dissolves in chloroform by forming a complex which is made up of about four or five chloroform molecules and one CTACI molecule. The basic idea of the infrared intensity study was that the number ratio of free and bonded chloroform molecules can be determined from the intensities of the absorption bands corresponding to the free and bonded chloroform molecules. Therefore, the infrared result affords rigorous information about the number of chloroform molecules which are directly attached to a CTACI molecule
Figure 6. Final results of the theoretical calculation.
by forming hydrogen bonds. In the light scattering study, however, the molecular aggregate which behaves as a single molecule in solution is important, because the concentration fluctuation is determined by the spacial distribution o f component molecules in the solution.
Combining these two sets of results obtained from light scattering and infrared absorption studies, we may draw a picture for an aggregate formed in CTACl-chloroform solution. About four CTACI molecules make the core of the aggregate and the core is surrounded by about 60 chloroform molecules. Among the 60 chloroform molecules in one aggregate, about 15 chloroform molecules form hydrogen bonds directly with CTACI molecules and make the first shell. The remaining 45 chloroform molecules envelop the first shell by weak intermolecular interactions. In the above picture, we introduced implicitly the concept of two different types of chloroform molecules included in an aggregate. One is a chloroform molecule which forms a hydrogen bond with CTACI (chloroform A) and the other is with a chloroform (chloroform B). Since the chlorine atoms of the chloroform A molecule are more electronegative than those of usual chloroform molecules in the liquid phase, a weak hydrogen bond is expected between chloroform A and chloroform B molecules. The number o f chloroform B molecules is expected to be three times
The Journal o f Physical Chemistry, Voi. 81, No. 16, 1977
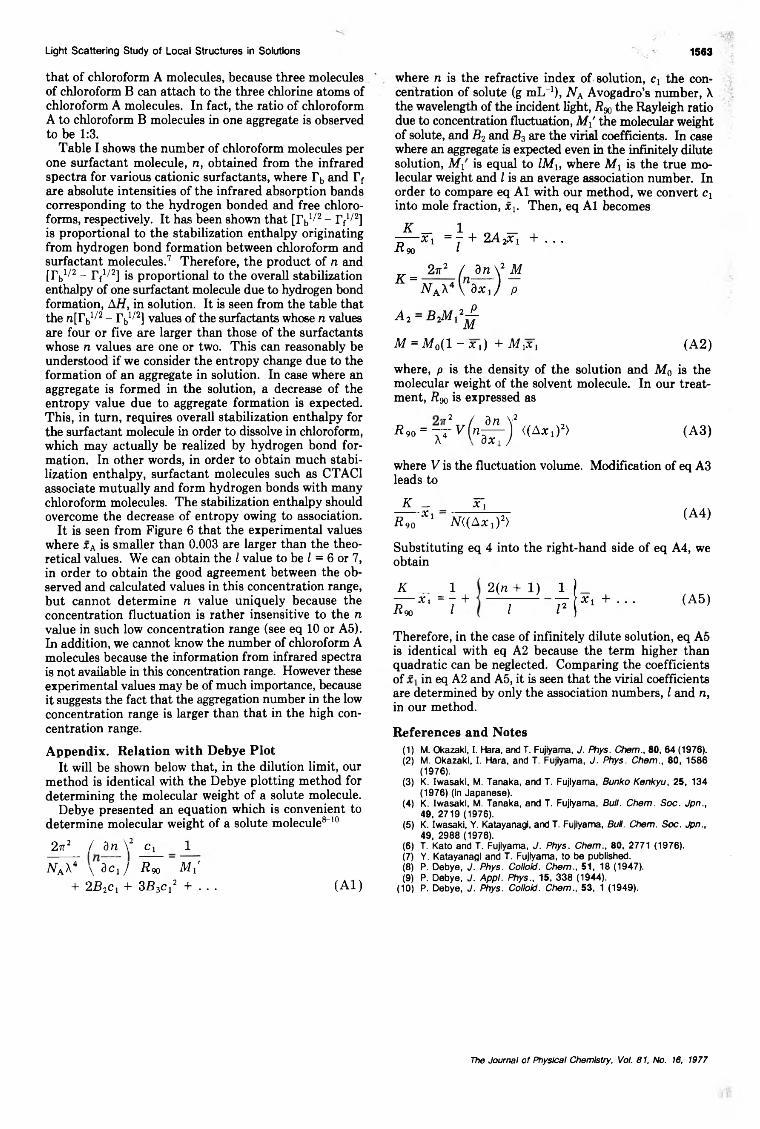
Light Scattering Study of Local Structures in Solutions 1563
that o f chloroform A molecules, because three molecules o f chloroform B can attach to the three chlorine atoms of chloroform A molecules. In fact, the ratio o f chloroform A to chloroform B molecules in one aggregate is observed to be 1:3.
Table I shows the number of chloroform molecules per one surfactant molecule, n, obtained from the infrared spectra for various cationic surfactants, where Tb and Tf are absolute intensities o f the infrared absorption bands corresponding to the hydrogen bonded and free chloroforms, respectively. It has been shown that [rb1/2 - rf1/2] is proportional to the stabilization enthalpy originating from hydrogen bond formation between chloroform and surfactant molecules.7 Therefore, the product o f n and [rb1/2 - rf1/2] is proportional to the overall stabilization enthalpy o f one surfactant molecule due to hydrogen bond formation, AH, in solution. It is seen from the table that the n[rb1/2 - rb1/2] values of the surfactants whose n values are four or five are larger than those o f the surfactants whose n values are one or two. This can reasonably be understood if we consider the entropy change due to the formation of an aggregate in solution. In case where an aggregate is formed in the solution, a decrease o f the entropy value due to aggregate formation is expected. This, in turn, requires overall stabilization enthalpy for the surfactant molecule in order to dissolve in chloroform, which may actually be realized by hydrogen bond formation. In other words, in order to obtain much stabilization enthalpy, surfactant molecules such as CTAC1 associate mutually and form hydrogen bonds with many chloroform molecules. The stabilization enthalpy should overcome the decrease o f entropy owing to association.
It is seen from Figure 6 that the experimental values where xA is smaller than 0.003 are larger than the theoretical values. We can obtain the l value to be l = 6 or 7, in order to obtain the good agreement between the observed and calculated values in this concentration range, but cannot determine n value uniquely because the concentration fluctuation is rather insensitive to the n value in such low concentration range (see eq 10 or A5). In addition, we cannot know the number of chloroform A molecules because the information from infrared spectra is not available in this concentration range. However these experimental values may be of much importance, because it suggests the fact that the aggregation number in the low concentration range is larger than that in the high concentration range.
where n is the refractive index o f solution, Cj the concentration o f solute (g mL“1), NA Avogadro’s number, X the wavelength o f the incident light, Rgo the Rayleigh ratio due to concentration fluctuation, M i the molecular weight o f solute, and B2 and B3 are the virial coefficients. In case where an aggregate is expected even in the infinitely dilute solution, Mi is equal to IMX, where Mx is the true molecular weight and l is an average association number. In order to compare eq A1 with our method, we convert cb into mole fraction, xx. Then, eq A1 becomes
M = M0(l - X i) + MyXi (A 2 )
where, p is the density of the solution and M 0 is the molecular weight o f the solvent molecule. In our treatment, Rgo is expressed as
R 90 = j ^ v ( n ^ - J ((AXi)2) (A 3 )
where V is the fluctuation volume. Modification of eq A3 leads to
K _ 3T,
R 90 Xl N((AXl)2) (A 4)
Substituting eq 4 into the right-hand side o f eq A4, we obtain
K _ 1----- x, = - +R90 l
2 (n + 1)
l(A 5 )
Therefore, in the case o f infinitely dilute solution, eq A5 is identical with eq A2 because the term higher than quadratic can be neglected. Comparing the coefficients of in eq A2 and A5, it is seen that the virial coefficients are determined by only the association numbers, l and n, in our method.
References and NotesAppendix. Relation with Debye Plot
It will be shown below that, in the dilution limit, our method is identical with the Debye plotting method for determining the molecular weight of a solute molecule.
Debye presented an equation which is convenient to determine molecular weight of a solute molecule8“10
2 n 2 / bn V Ci 1
Na\4 \ 0 c i / Rgo ~ M i+ 2B2cx + 3B3c i + . . . (A l )
(1) M. Okazaki, I. Hara, and T. Fujiyama, J. Phys. Chem., 80, 64 (1976).(2) M. Okazaki, I. Hara, and T, Fujiyama, J. Phys. Chem., 80, 1586
(1976).(3) K. Iwasaki, M. Tanaka, and T. Fujiyama, Bunko Kenkyu, 25, 134
(1976) (in Japanese).(4) K. Iwasaki, M. Tanaka, and T. Fujiyama, Bull. Chem. Soc. Jpn.,
49, 2719 (1976).(5) K. Iwasaki, Y. Katayanagi, and T. Fujiyama, Bull. Chem. Soc. Jpn.,
49, 2988 (1976).(6) T. Kato and T. Fujiyama, J. Phys. Chem., 80, 2771 (1976).(7) Y. Katayanagi and T. Fujiyama, to be published.(8) P. Debye, J. Phys. Colloid. Chem., 51, 18 (1947).(9) P. Debye, J. Appl. Phys., 15, 338 (1944).
(10) P. Debye, J. Phys. Colloid. Chem., 53, 1 (1949).
The Journal o f Physical Chemistry, Voi. 81, No. 16, 1977
1564 A. E. McKinnon, A. G. Szabo, and D. R. Miller
The Deconvolution of Photoluminescence Data t
A. E. McKinnon,Î A. G. Szabo, and D. R. Miller*
Division o i Biological Sciences, National Research Council o f Canada, Ottawa, Canada K1A OR6 (Received January 14, 1977)
Numerical techniques for deconvolution are many, and have rarely been compared for ease of use, accuracy of results, and resilience to noisy data. In this paper we report extensive computational tests using various artificial and real data sets and conclude that (i) several methods are satisfactory provided the structure of the observed data is simple, i.e., the lamp used has a sharp cutoff or the sample luminescence decay is accurately described by a single exponential process; (ii) if the decay is more complicated or the lamp has a long tail, a direct method of iterative convolution is more effective than any other; and (iii) artificial data may be generated which are indistinguishable from real observations. The problem of establishing confidence limits for the various parameters is discussed.
I. IntroductionLuminescence decay data produced by a short light
stimulus have been used extensively in investigations of the excited state properties o f many molecules,1-7 particularly aromatic and biological molecules.8-10 The object is to interpret the luminescence data in terms of meaningful models of the physical processes which occur in the excited states. In most cases an exponential model for the luminescence decay is appropriate but others are sometimes used.11
Deconvolution problems are important in a number of fields, and discussions have been presented in many places. Problems of this sort are important in communication theory12 and in the general area of system identification.13 Recently, the deconvolution problem has also been studied in connection with measurement problems in the physical sciences,14,15 medicine,16,17 and applied optics.18-22
All these problems share the feature that, if the stimulus may be regarded as instantaneous, the time course of the response (in our case luminescence) can be followed directly. Often, however, one wishes to study a response which occurs in a time comparable to that of the energy input itself; then, instead o f observing the response directly, one can only observe the convolution integral of the response and the input. It is the problem of recapturing the “ true” response that concerns us here.
In the specific case of fluorescence lifetime determinations using the single photon counting method10 or the sampling oscilloscope method23 a repetitive lamp flash of nanosecond duration excites the sample and its fluorescence decay profile is measured. This decay profile is a convolution of the lamp intensity profile and the true fluorescence decay of the sample. The data may not indicate which of a variety o f possible models and sets of parameter values is correct. In the more difficult situation where the width of the lamp pulse is comparable to the decay time of the sample emission, the problem o f interpretation is aggravated by the need for a numerical deconvolution.11
In theory, deconvolution is a mathematically well-defined problem. However, in fluorescence decay measurements the data are neither complete nor error-free, and in fact the functions are known only through an inherently noisy process o f discrete observations over a finite time. Thus significant numerical difficulties exist, and a variety
J Issued as N.R.C.C. No. 16095.Í Present address: Christchurch Clinical School, Christchurch
Hospital, Christchurch, New Zealand.
of techniques have been developed to overcome them.These techniques have not been subjected to exhaustive
tests of comparative performance, especially tests distinguishing types of noise, distortions produced by the instrument itself, lamp characteristics, the differences between real and simulated data, and other factors. In this paper we report the results of such a study and recommend the use of iterative convolution as the technique o f choice.
2. Problem FormulationWhen excited by an energy input o f a light flash that
is not instantaneous, a sample fluoresces with a time distribution given by the convolution o f the true excited state decay rate, say g(t), and the lamp intensity function, say f(t). The actual time-dependent emission thus has the form
h (f ) = / o g ( f - T ) f ( T ) d T (1 )
The problem is simply to determine g(f) when f(£) and h(t) are known, where h(t) is the measured time intensity profile of the emission and f(t) is that o f the lamp. The difficulties are largely involved with the facts that, first, the functions h(t) and f(t) are known only at a limited number o f discrete points and then with a certain numerical error; second, that regardless o f the numerical difficulties the functions are measured by actual devices and are not directly observable.
The second point is often not really appreciated with the result that instrumental artifacts are often neglected. The functions f(t) and h(f) represent the “ true” or undistorted response functions but what are actually observed or measured are the functions F(i) and H(t) which are functions that result from the former by convolutions with often unknown instrumental functions. However, if these latter convolutions are the same for both F(t) and H(t) then one can equally well use them to determine g(£) in eq 1. Unfortunately this is not the case, for the lamp intensity profile, F(£), must be measured at the wavelength of excitation of the sample since it is known that f(£) varies with wavelength.24
One of the important instrumental functions that is convolved in F(£) and H(t) is the time response o f the detection photomultiplier. It is known that the time response of the photomultiplier varies with wavelength and recently it has been demonstrated that this variation, unless accounted for by a proper correction technique, will lead to inaccurate results in the deconvolution computations and a concomitant loss of confidence in the physical model chosen to represent the fluorescence decay.25 In
The Journal o f Physical Chemistry, Vol. 81, No. 16, 1977

The Deconvolution of Photoluminescence Data 1565
TABLE I
Deconvolution method0Function for the
representation o f g(t)Reference to basic method
Treatment o f difficultiesSensitivity to
Effect o f truncation o f h(f) measurement error1. Moments Sum o f decaying
exponentialsIsenberg and
Dyson26Exponential weighting
and iterative extrapolation6
Not explicitly treated
2. Modulating functions
Sum o f decaying exponentials
Valeur and Moirez27
Not a theoretical limitation0
Not explicitly treated
3. Iterative Representation o f Grinvald and Not a theoretical Dealt with by theconvolution (weighted nonlinear least squares)
g(t) is not restricted Steinberg28 limitation0 least-squaresprocess
4. Laplacetransforms
Representation o f g(f) is not restricted
Gafni et al.29 Iterative extrapolation Not explicitly treated
5. Exponential series
Series o f decaying exponentials with fixed time constants
Ware et al.10 Not a theoretical limitation0
Dealt with by least-squares estimation o f exponential coefficients
6. Fouriertransforms with high frequency filtering
Fourier series Jones30 Exponential weighting6 Cosine bell filtering6
7. Fouriertransforms with filtering to minimize second differences of g (0
Fourier series Hunt14 Exponential weighting Filtering to minimize second differencesin g(0
0 Methods 1-4 are intended for use when g(t) is assumed to be the solution o f a specific physical model for the luminescence decay. O f these methods, 1 and 2 may be used when the physical model includes only first-order kinetics (single exponential). Methods 5-7 are intended for use when it is desired to obtain a functional representation o f the decay curve g(f) without making assumptions as to the physical processes which may be occurring. 6 These represent additions or modifications to the published methods. c Although not a theoretical limitation in these methods, in practice, truncation o f the measurement causes a loss o f information because the data contain error.
what follows we assume that the functions which we deconvolve have been corrected for this effect and thus use f(t) and h(i) to represent correct observed data.
The solution o f (1) for g(£) is highly sensitive to numerical errors, and our task at this point is to minimize their effects. To do this many methods have been proposed and used, and one should examine the principal ones.
Generally, each method depends on the assumption that g(t) can be represented as the sum of a (hopefully finite) number o f functions o f some specified family, so that the integral in (1) may be converted to a finite set of algebraic equations which may then be solved.
The functions chosen are generally either a mathematically complete set, infinite in number, which can represent a more-or-less general function but which have no physical or chemical basis, or else a very limited set chosen to correspond to the behavior expected for the system on physical or chemical grounds. Naturally, the latter allow more definite conclusions to be made, since the assumption of a certain process amounts to increased information. However, a priori physical models may be a hindrance if they are incorrect and, even if they are not, care must be taken when interpreting the results since other models might produce equally good results; one must not conclude that the presumed model is preferred simply because the fit is satisfactory. Although some authors have reported difficulty in fitting the leading edge of the decay curves, we know of no theoretical reason for this to be so. We have made no special allowances for such a phenomenon.
We have chosen seven deconvolution methods as being representative of what is done in the literature. These are
described in Table I, in which we also note the original references and give some indication about the characteristics of each. We assume the reader is familiar with the general nature of the methods, and refer to the supplementary material (see note at end of paper) for a precise description not only of the mathematical foundation of each approach, but also o f the implementation in the present study.
3. Methods of ComparisonInitially one might plan to compare the various methods
not only on the basis of their numerical features, specifically their ability to obtain correct answers in spite of noisy or limited data, but also for ease of programming and cost of the actual computation.
These latter points turn out, however, to be quite difficult to assess. Programming is in theory not a serious problem, since each of the methods discussed has been programmed by someone, and the program need only be adapted to a specified system. Concerning cost, both in terms of processing time and total storage requirements, we must observe that this is highly dependent on technique. As an example, the authors found that the first version of what is referred to here as the iterative convolution method, using a library Marquardt-type optimization program, occupied 118K bytes and was executed in 5.0 s of computer time. A second version programmed specifically for small storage requirements fitted into 11K bytes and was executed in 64.0 s. Such a range of values is typical when a selection of efficient library packages is available; while we have not verified it for each o f the methods considered here, we surmise that each could be fitted into comparable storage.
The Journal o f Physical Chemistry, Vol. 81, No. 16, 1977

1566
corresponds to 0.12 ns, peak width at half-height ~ 1 ns. (b) Simulated fluorescence decay with a , / a 2 = 0.1, f t = 0.08 channel-1, f t = 0.02 channel-1 convolved with simulated lamp intensity profile in (a) (case L in Table II).
We are left with consideration of the ability of the various methods to produce numerically good answers, and we see at once that several distinct difficulties may arise, and response to each needs to be investigated.
To begin with, determination of a decay curve (photoluminescence function) consisting of a single exponential term, the time constant of which is much larger than that o f the lamp, ought not to present any difficulty, and it is reasonable to predict that any well-considered approach should work. However, the accuracy of a given method will decrease if (i) the signal-to-noise ratio is low (we have few counts per channel); (ii) the decay consists o f more than one term, particularly if the constants involved are either very different or nearly identical; or (iii) the decay o f the lamp is not particularly faster than that o f the sample.
In practical terms, (i) may be thought of as an exact problem contaminated by various noise levels, (ii) is to be an experimentally investigated discriminatory ability, while(iii) amounts to very serious difficulty in analysis. Different methods may well be expected to react differently to each.
3.1. Nature of Test Data. In order to compare methods under controlled conditions, we prepared several artificial data sets. To begin with, we produced a “ simulated lamp” by using a simple curve with the same general shape as a low-tail lamp (Figure 1). The actual function was
F (i) = 5 .80 2 f2 e x p (-0 .4 f )
(In all the expressions to follow, t represents time, but is in units of channels o f the multichannel analyzer which is used in single photon counting instrumentation. Since channel width is adjustable, time scales are not to be expected to be uniform.) Artificial sample data sets were obtained by convolving this function with
g (i) = c*! exp ( - f t f) + a2 e x p ( - f t f )
for various values of a„ ft. Random error was added from a Poisson distribution, and relative error levels were made more severe by scaling down the data, adding noise, and renormalizing (Figure 1).
The details o f these first test data sets are shown in Table II. Data sets A to D were designed to test the sensitivity of each method to measurement error. With
A. E. McKinnon, A. G. Szabo, and D. R. Miller
TABLE I I : Parameter Values for Test Data Sets
Data set° a j a 2ft
channel *ft
channel 1A 10.0 0.080 0.020B 10.0 0.080 0.020C 10.0 0.080 0.020D 10.0 0.080 0.020E 10.0 0.080 0.030F 10.0 0.080 0.050G 10.0 0.080 0.070H 1.0 0.080 0.020I 1.0 0.080 0.030J 1.0 0.080 0.050K 1.0 0.080 0.070L 0.1 0.080 0.020M 0.1 0.080 0.030N 0.1 0.080 0.050O 0.1 0.080 0.070P 0.01 0.080 0.020Q 0.01 0.080 0.030R 0.01 0.080 0.050S 0.01 0.080 0.070T 1.25
a Peak counts in h(t) equal to 10 000 in all cases except 1500 in A, 3000 in B, and 6000 in C.
a typical channel width of 0.12 ns the lamp specified above would have a half-peak width of about 1 ns, and exponents0.08 and 0.02 would correspond to components with lifetimes of 1.5 and 6 ns, respectively. We set 0 < t < 159 channels to give a realistic amount o f data truncation for h(i), so that h(159)/hmai = 0.008. All methods were tested on data sets A to D.
Data sets E to S, all with 10 000 counts in the peak of h(t), were used to test the ability o f methods to discriminate between two exponentials with various ratios of lifetimes and coefficients. Only those methods (i.e., moments, modulating functions, Laplace transforms, and iterative convolution) intended for finding the parameters of decaying exponential functions were tested on these data sets. The final set, T, was designed to see how well each method could find the parameters of a very fast single component decay (lifetime of about 0.1 ns for the channel width o f 0.12 ns).
All the above data sets represent cases where the simulated lamp decayed to a low value (short tail) over the time scale considered. This is not always the case in practice, since one must use narrow channels to observe a very rapid fluorescence decay or the very rapid com ponent of a multiexponential decay process and equipment configuration limitations mean that the total time observed is short.
To test responses to these conditions further data sets were simulated using a real lamp decay profile which has a much slower decay (long tail) (Figure 2a). The various methods, now reduced to four in number because of earlier failures of the rest, were then tested for their ability to deconvolve this lamp in conjunction with (i) a simulated single-exponential decay profile (no noise), (ii) a simulated double-exponential decay profile (no noise) (Figure 2b),(iii) a simulated double-exponential decay profile with various levels o f added noise (Figure 2c), and (iv) a real experimentally measured decay profile known to have double-exponential behavior (Figure 2d).
4. ResultsThe results are described in three ways: briefly in the
paragraphs to follow, in somewhat more detail in Table III, and in full numerical detail in Tables IV-VI.
Essentially, the first four of the methods tested all work well for the simple case of a double-exponential decay
The Journal o f Physical Chemistry, Vol. 81, No. 16, 1977
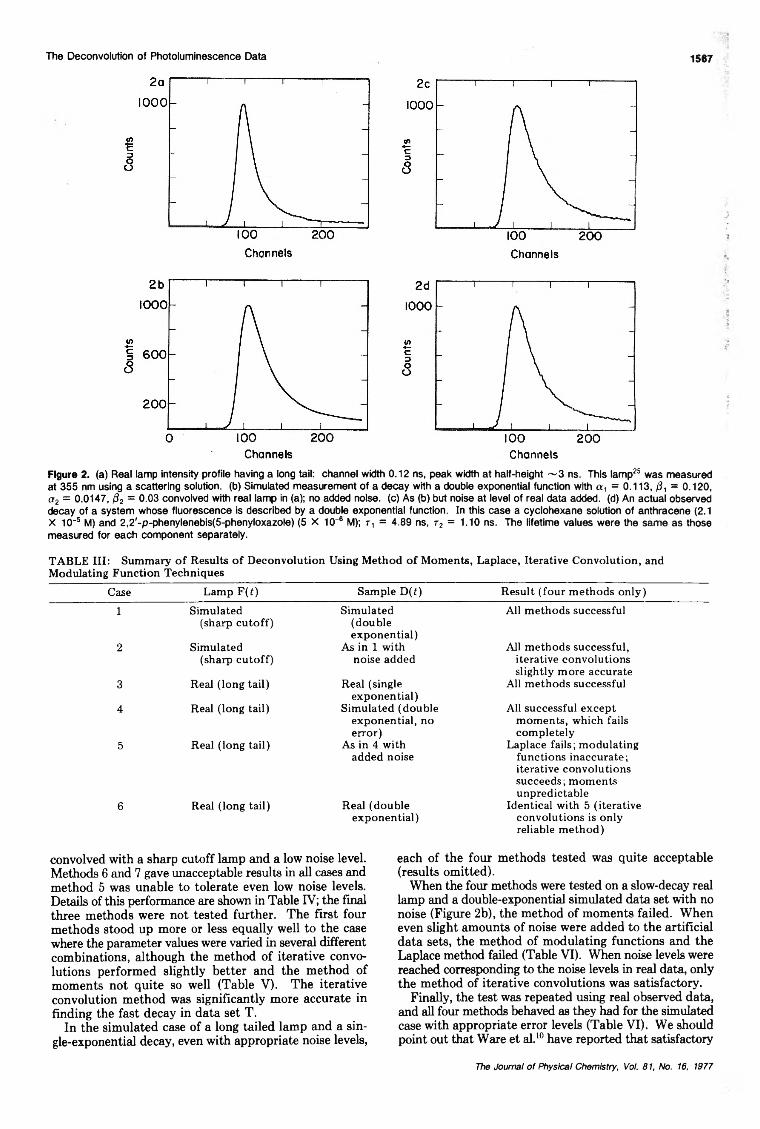
The Deconvolution of Photoluminescence Data 1567
Figure 2. (a) Real lamp intensity profile having a long tail: channel width 0.12 ns, peak width at half-height ~ 3 ns. This lamp25 was measured at 355 nm using a scattering solution, (b) Simulated measurement of a decay with a double exponential function with a , = 0.113, /?, = 0.120, a2 = 0.0147, f i2 = 0.03 convolved with real lamp in (a); no added noise, (c) As (b) but noise at level of real data added, (d) An actual observed decay of a system whose fluorescence is described by a double exponential function. In this case a cyclohexane solution of anthracene (2.1 X 10~5 M) and 2,2'-p-phenylenebis(5-phenyloxazole) (5 X 10~6 M); t 1 = 4.89 ns, r2 = 1.10 ns. The lifetime values were the same as those measured for each component separately.
TABLE III: Summary o f Results o f Deconvolution Using Method o f Moments, Laplace, Iterative Convolution, and Modulating Function Techniques
Case Lamp F(f) Sample D(f) Result (four methods only)1 Simulated
(sharp cutoff)
2 Simulated (sharp cutoff)
3 Real (long tail)
4 Real (long tail)
5 Real (long tail)
6 Real (long tail)
Simulated(doubleexponential)
As in 1 with noise added
Real (single exponential)
Simulated (double exponential, no error)
As in 4 with added noise
Real (double exponential)
All methods successful
All methods successful, iterative convolutions slightly more accurate
All methods successful
All successful except moments, which fails completely
Laplace fails ; modulating functions inaccurate; iterative convolutions succeeds; moments unpredictable
Identical with 5 (iterative convolutions is only reliable method)
convolved with a sharp cutoff lamp and a low noise level. Methods 6 and 7 gave unacceptable results in all cases and method 5 was unable to tolerate even low noise levels. Details of this performance are shown in Table IV; the final three methods were not tested further. The first four methods stood up more or less equally well to the case where the parameter values were varied in several different combinations, although the method o f iterative convolutions performed slightly better and the method of moments not quite so well (Table V). The iterative convolution method was significantly more accurate in finding the fast decay in data set T.
In the simulated case of a long tailed lamp and a single-exponential decay, even with appropriate noise levels,
each of the four methods tested was quite acceptable (results omitted).
When the four methods were tested on a slow-decay real lamp and a double-exponential simulated data set with no noise (Figure 2b), the method o f moments failed. When even slight amounts o f noise were added to the artificial data sets, the method of modulating functions and the Laplace method failed (Table VI). When noise levels were reached corresponding to the noise levels in real data, only the method of iterative convolutions was satisfactory.
Finally, the test was repeated using real observed data, and all four methods behaved as they had for the simulated case with appropriate error levels (Table VI). We should point out that Ware et al.10 have reported that satisfactory
The Journal o f Physical Chemistry, Voi. 81, No. 16, 1977

1568 A. E. McKinnon, A. G. Szabo, and D. R. Miller
TABLE IV : Results o f Tests on Data Sets A to D% errors in parameters Mean sum o f squares
fit to g(t) X 107Method Data set “ i / “ i 0 .
Moments A 15.0 -3 .9 -4 .5 3.4B 11.0 -3 .1 -4 .0 1.2C -14 .0 3.0 8.5 1.2D -19 .0 3.5 11.0 0.6
Modulating functions A 16.0 -1 .3 -7 .5 0.4B -5 .0 1.4 2.0 0.9C -12 .0 3.5 6.0 1.9D 5.0 -1 .5 -2 .5 0.4
Iterative convolution A -13 .0 -3 .0 -4 .5 2.7B -7 .0 0.1 3.5 0.2C 2.0 0.3 0.0 0.3D -2 .0 0.6 1.0 0.2
Laplace transform A 16.0 -3 .9 -4 .5 3.5B -8 .0 -0 .1 4.0 0.4C 0.0 0.9 0.5 0.7D -4 .0 1.4 1.5 0.2
Exponential series0 A 70.0 -8 .0 -23 .0 11.1B 70.0 -7 .8 -25 .0 12.4C -1 .0 0.8 1.0 0.8D -1 .0 0.6 0.5 0.7
Fourier transforms with A -50 .0 3.7 45.0 20.6high-frequency filtering0 B -33 .0 0.1 25.5 51.7
C -36 .7 2.9 28.5 23.5D -2 .0 0.9 0.5 12.7
Fourier transforms with A 964.0 -24 .0 -100.0 41.0filtering to minimize second B 304.0 -17 .4 -63 .0 217.0differences o f g(f)° C 154.0 -4 .9 -100.0 1721.0
D 129.0 -11 .4 -40 .0 186.0° For these methods the parameters a ,, a 2, ßt, and were determined by fitting a sum o f two exponentials to the g(f)
resulting from the deconvolution using the nonlinear least-squares program o f Marquardt.33 With the Fourier methods the first two and any negative points were eliminated before fitting.
TABLE V : Results o f Tests o f Four Methods on Data Sets E-T
No. o f parameterswith greater than „
given error0 % erfrorfm . .____________________ exponent estimatedMethod 2% 5% 10% 15% for data set T
Moments 20 17 14 7 3.6Modulating
functions13 10 6 6 22.0
Iterativeconvolution
11 7 6 5 0.3
Laplacetransform
16 9 6 5 4.0
° Only results from data sets E, F, H, I, J, L, and M were included in these figures because none o f the methods could separate the two exponentials in data sets G, K, and N-S.
parameters were obtained by the exponential series method provided that a poor fit to the beginning or the end of the decay curve was ignored. We feel that making such allowances significantly reduces the confidence one has in the parameter values obtained and, for that matter, the accompanying physical model.
Several other observations are important. For example, a series of attempts were made to eliminate noise by some kind o f Fourier smoothing process on either real data or artificial data to which Poisson noise had been added. In each case all methods responded to the smoothed data exactly as they had to the raw data.
An analysis of the form of the noise on real data was also made, and it was found that it was not o f Poisson type, but had an added constant component. For comparability o f results reported here to those generally reported,
however, noise added to simulated data was always Poisson. The analysis of noise characteristics will be reported elsewhere.
5. Discussion and ConclusionsFrom these observations we can determine which of the
several deconvolution methods will provide values o f kinetic parameters such that one can have a high degree of confidence both in their accuracy and in the validity o f the associated physical model. First, the two Fourier series methods considered should not be recommended, as they provide substantial error even for “ good” data sets. The method of exponential series, invariably at a disadvantage because of its preassigned discrete decay rates, fares somewhat better but is not competitive with the four methods which are specifically intended for finding the parameters of decaying exponentials.
Of the remaining four methods, the iterative convolution technique was marginally better in its sensitivity to noise and its ability to resolve exponentials when tested on the simulated data with a rapidly decaying lamp. This alone would be insufficient evidence on which to base a firm recommendation for its exclusive use; however, the tests using a long tailed lamp clearly demonstrate the superiority of this method.
Modulating functions is next best. Particularly for truncated data, this is mathematically reasonable since the moments method gives additional weight to points at large t values, and the Laplace transform method requires an artificial extrapolation which may be expected to be accurate only when truncation is insignificant.
In general, the method of modulating functions is restricted to the case where only simple exponential decays are expected, so that the iterative convolution procedure
The Journal o f Physical Chemistry, Vol. 81, No. 16, 1977
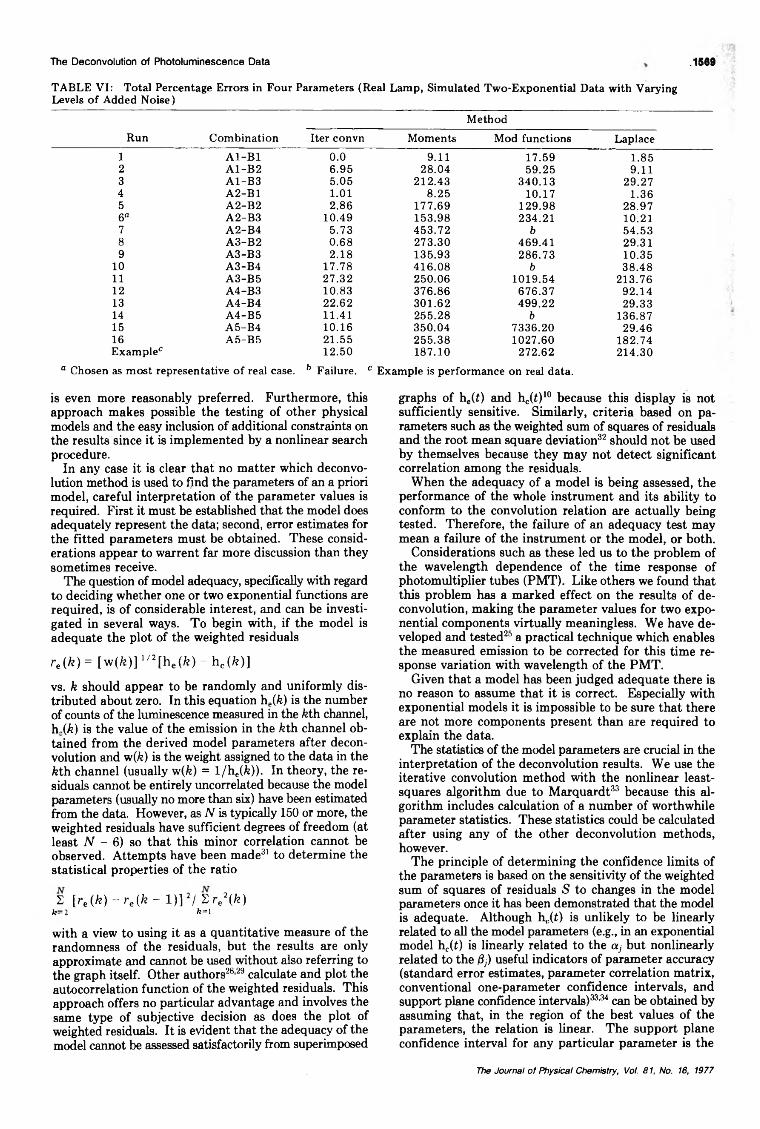
The Deconvolution of Photoluminescence Data .1569
TABLE VI: Total Percentage Errors in Four Parameters (Real Lamp, Simulated Two-Exponential Data with Varying Levels o f Added Noise)
Run CombinationMethod
Iter convn Moments Mod functions Laplace1 A l-B l 0.0 9.11 17.59 1.852 A1-B2 6.95 28.04 59.25 9.113 A1-B3 5.05 212.43 340.13 29.274 A2-B1 1.01 8.25 10.17 1.365 A2-B2 2.86 177.69 129.98 28.976a A2-B3 10.49 153.98 234.21 10.217 A2-B4 5.73 453.72 b 54.538 A3-B2 0.68 273.30 469.41 29.319 A3-B3 2.18 135.93 286.73 10.35
10 A3-B4 17.78 416.08 b 38.4811 A3-B5 27.32 250.06 1019.54 213.7612 A4-B3 10.83 376.86 676.37 92.1413 A4-B4 22.62 301.62 499.22 29.3314 A4-B5 11.41 255.28 b 136.8715 A5-B4 10.16 350.04 7336.20 29.4616 A5-B5 21.55 255.38 1027.60 182.74Example0 12.50 187.10 272.62 214.30
a Chosen as most representative o f real case. b Failure. 0 Example is performance on real data.
is even more reasonably preferred. Furthermore, this approach makes possible the testing of other physical models and the easy inclusion of additional constraints on the results since it is implemented by a nonlinear search procedure.
In any case it is clear that no matter which deconvolution method is used to find the parameters of an a priori model, careful interpretation of the parameter values is required. First it must be established that the model does adequately represent the data; second, error estimates for the fitted parameters must be obtained. These considerations appear to warrent far more discussion than they sometimes receive.
The question of model adequacy, specifically with regard to deciding whether one or two exponential functions are required, is o f considerable interest, and can be investigated in several ways. T o begin with, if the model is adequate the plot o f the weighted residuals
re(k )= [w ( fe ) ]1/2[he(fe) —hc (fe)]
vs. k should appear to be randomly and uniformly distributed about zero. In this equation he(fe) is the number of counts of the luminescence measured in the fcth channel, h„(fc) is the value of the emission in the feth channel obtained from the derived model parameters after deconvolution and w(&) is the weight assigned to the data in the kth channel (usually w(fe) = l /h e(fe)). In theory, the residuals cannot be entirely uncorrelated because the model parameters (usually no more than six) have been estimated from the data. However, as N is typically 150 or more, the weighted residuals have sufficient degrees of freedom (at least N - 6) so that this minor correlation cannot be observed. Attempts have been made31 to determine the statistical properties of the ratio
2 [re(k) - re(fe - 1 )]2/ 2re2(fe)k — 2 ft=l
with a view to using it as a quantitative measure o f the randomness of the residuals, but the results are only approximate and cannot be used without also referring to the graph itself. Other authors28,29 calculate and plot the autocorrelation function of the weighted residuals. This approach offers no particular advantage and involves the same type of subjective decision as does the plot of weighted residuals. It is evident that the adequacy o f the model cannot be assessed satisfactorily from superimposed
graphs of he(£) and hc(i)10 because this display is not sufficiently sensitive. Similarly, criteria based on parameters such as the weighted sum of squares of residuals and the root mean square deviation32 should not be used by themselves because they may not detect significant correlation among the residuals.
When the adequacy o f a model is being assessed, the performance o f the whole instrument and its ability to conform to the convolution relation are actually being tested. Therefore, the failure o f an adequacy test may mean a failure o f the instrument or the model, or both.
Considerations such as these led us to the problem of the wavelength dependence o f the time response o f photomultiplier tubes (PMT). Like others we found that this problem has a marked effect on the results of de- convolution, making the parameter values for two exponential components virtually meaningless. We have developed and tested25 a practical technique which enables the measured emission to be corrected for this time response variation with wavelength of the PM T.
Given that a model has been judged adequate there is no reason to assume that it is correct. Especially with exponential models it is impossible to be sure that there are not more components present than are required to explain the data.
The statistics o f the model parameters are crucial in the interpretation of the deconvolution results. We use the iterative convolution method with the nonlinear least- squares algorithm due to Marquardt33 because this algorithm includes calculation of a number of worthwhile parameter statistics. These statistics could be calculated after using any o f the other deconvolution methods, however.
The principle of determining the confidence limits of the parameters is based on the sensitivity o f the weighted sum of squares o f residuals S to changes in the model parameters once it has been demonstrated that the model is adequate. Although h<,(£) is unlikely to be linearly related to all the model parameters (e.g., in an exponential model hc(£) is linearly related to the aj but nonlinearly related to the fij) useful indicators of parameter accuracy (standard error estimates, parameter correlation matrix, conventional one-parameter confidence intervals, and support plane confidence intervals)33,34 can be obtained by assuming that, in the region o f the best values o f the parameters, the relation is linear. The support plane confidence interval for any particular parameter is the
The Journal of Physical Chemistry, Voi. 81, No. 16, 1977

1570 A. E. McKinnon, A, G. Szabo, and D. R. Miller
maximum range of that parameter within which S is less than or equal to a value Sc which is usually a 95 or 99% confidence value. The other parameters are allowed to adjust to maximize this range. For the value Sc the parameters lie on an ellipsoid of m dimensions (in parameters) if hc(t) is linearly related to the parameters, but the shape o f this surface is not known for a nonlinear model. Marquardt33 suggests a method for determining a nonlinear confidence interval for each parameter, given that the other parameters remain at their best values, by incrementally increasing (or decreasing) the parameter value until S just exceeds Sc. However, the restriction placed on the other parameters means that the confidence interval obtained may be misleadingly narrow particularly if the parameters are highly correlated. At the expense of a great deal o f computational effort the nonlinear support plane confidence interval for a particular parameter may be obtained by incremently increasing (or decreasing) the parameter value and at each step minimizing S with respect to all the other parameters. When finally S just exceeds Sc one limit of the confidence interval for that parameter has been obtained.28 Although undoubtedly the most rigorous approach, the extensive computations involved may not be worthwhile. As a compromise, we use the support plane confidence interval obtained using the linearity assumption, but at each parameter limit thus obtained we calculate S and compare it with Sc to get an indication of the extent to which the linearity assumption is valid.
The present work is not sufficient to answer all questions about optimization of the settings for various experimental parameters (such as channel width, effect of total counts, and minimum number of channels) for luminescence decay measurements. Neither have we answers to the important question as to what is the ultimate capability o f the apparatus and under what conditions. Rather we have shown that the iterative convolution method is the most successful and reliable o f the deconvolution methods tested and that it would be unwise to use the Fourier transform, moments, and exponential series methods. We have also pointed out that general use of the Laplace and modulating function techniques are limited and care must be taken in interpreting the results when using these methods. The question of the ultimate capability of the apparatus would require a much more extensive set of simulations than reported here.
Acknowledgment. The studies reported here required very substantial assistance in computer programming, equipment operation, and consulting on statistical
questions. The authors thank Lise Bramall, Dr. David Rayner, Mr. Peter Tolg, Dr. Peter Hackett, and Dr. M ichael Zuker for help in these areas.
Supplementary Material Available: A precise description of the mathematical foundation o f each de- convolution method studied (16 pages). Ordering information is available on any current masthead page.
References and Notes(1) V. W. F. Burns, Arch. Biochem. Biophys., 133, 420 (1969).(2) C. Yang and D. Sol, Proc. Nat. Acad. Sci. U .S .A ., 71, 2838 (1974).(3) Y. Kubota, Chem. Lett., 299 (1973).(4) B. Donzel, P. Gaudochon, and Ph. Wahl, J. A m . Chem. Soc., 96,
801 (1974).(5) Ph. Wahl, J. C. Auchet, A. J. W. G. Visser, and F. Miller, FEBS Lett.,
44, 67 (1974).(6) M. R. Loken, J. W. Hayes, J. R. Gohlke, and L Brand, Biochemistry,
11, 4779 (1972).(7) A. A. Thaer and M. Sernetz, Ed., “ Fluorescence Techniques in Cell
Biology” , Springer-Verlag, New York, N.Y., 1973.(8) K. Salisbury in “SpedaSst Periodical Reports” , Vo. 5, D. Bryce-Smith,
Ed., The Chemical Society, London, 1974, pp 119-198.(9) M. H. Hui, P. De Mayo, R. Suau, and W. R. Ware, Chem. Phys. Lett.,
31, 257 (1975).(10) W. R. Ware, L. J. Doemeny, and T. L. Nemzek, J. Phys. Chem.,
77, 2038 (1973).(11) W. R. Ware In “ Creation and Detection of the Excited State” , Vol.
I , Part A, A. A. Lamola, Ed., Marcel Dekker, New York, N.Y., 1971, p 213.
(12) D. Sleplan and T. T. Kadota, S IA M J. Appl. Math., 17, 1102 (1968).(13) A. P. Sage and J. L. Melsa, “System Identification” , Academic Press,
New York, N.Y., 1971.(14) B. R. Hunt, Math. Biosci., 10, 215 (1971).(15) A. F. Jones and D. L. Misell, Brit. J. Appl. Phys., 18, 1479 (1967).(16) G. R. Neufeld, J. Appi. Physiol., 31, 148 (1971).(17) J. Szymendera, R. P. Heaney, and P. D. Savllle, J. Lab. Clin. Med.,
79, 570 (1972).(18) C. W. Barnes, J. Opt. Soc. Am ., 56, 575 (1966).(19) G. Kunetz and J. M. Fourman, Geophysics, 33, 412 (1968).(20) P. A. Jansson, J. Opt. Soc. A m ., 60, 184 (1970).(21) W. C. Sauder, J. Appi. Phys., 37, 1495 (1966).(22) M. J. McDonnell and R. H. T. Bates, Comput. Graphics Image
Process., 4, 25 (1975).(23) L. Hundley, T. Coburn, E. Garwin, and L. Stryer, Rev. Sci. Instrum.,
38, 488 (1967).(24) Ph. Wahl, J. C. Auchet, and B. Donzel, Rev. Sci. Instrum ., 45, 28
(1974).(25) D. M. Rayner, A. E. McKinnon, A. G. Szabo, and P. A. Hackett, Can.
J. Chem., 54, 3246 (1976).(26) I. Isenberg and R. D. Dyson, Biophys. J., 9, 1337 (1969).(27) B. Valeur and J. Moirez, J. Chim. Phys., 70, 500 (1973).(28) A. Grinvald and I. Z. Steinberg, Anal. Biochem , 59, 583 (1974).(29) A. Gatni, R. L. Modlin, and L. Brand, Biophys. J., 15, 263 (1975).(30) R. E. Jones, Ph.D. Thesis, Stanford University (University Microfilms,
Ann Arbor, Mich. 1976).(31) J. Durbin and G. S. Watson, Biometrics, 58, 1 (1971).(32) E. Haas, M. Wilchek, E. Katchalskikatzir, and I. Z Steinberg, Proc.
Nat. Acad. Sci. U .S .A ., 72, 1807 (1975).(33) D. W. Marquardt, S IA M J., 11, 431 (1963).(34) N. R. Draper and H. Smith, “Applied Regression Analysis” , Wiley,
New York, N.Y., 1966, p 265.
The Journal o f Physical Chemistry, Vol. 81, No. 16, 1977

Intramolecular Dimer in Polyvinylnaphthalene 1571
Absorption and Fluorescence Spectra of the Intramolecular Dimer in Polyvinylnaphthalene
Masahiro Irle,* Takao Kamljo, Masayukl Alkawa,1 Takeshi Takemura,1 Kolchlro Hayashl, and Hlroakl Baba1The Institute o f Scientific and Industrial Research, Osaka University, Suita, Osaka, Japan (Received April 5, 1976)
Solvent effects on the absorption and emission spectra of polyvinylnaphthalenes were studied. In poor solvents, such as cyclohexane, new absorption and fluorescence spectra which are attributable to the dimer formed between naphthyl side groups of the polymer were observed in addition to normal spectra, though they are scarcely detected in good solvents. The dependence of the band intensity on solvent as well as on temperature indicates that dimer formation depends on the conformation of the polymer chain.
IntroductionEmission spectra of polymers with aromatic side groups
have been studied extensively and it is now well established that the polymer emits fluorescence not only from the monomer but also from the excimer produced by intramolecular interaction between two chromophores.2 Excimer formation in polystyrene3-5 and polyvinylnaphthalene5’6 is attributed to the interaction of adjacent chromophores, while in polyacenaphthylene7'8 or poly- IV-vinylcarbazole9 chain coiling is considered to play a role in producing geometries favorable to excimer formation between nonadjacent chromophores. In the case of poly-iV-vinylcarbazole, the low temperature emission is composed of excimer and dimer fluorescence, and the dimer, which results from strong exciton coupling of neighboring chromophores, has a conformation different from that o f the excimer.10
Although such emission characteristics are sensitive probes of the conformation of polymer, no extensive study on polymer emission spectra has been carried out as yet from this point o f view. During the study of the photochemical reaction of polyvinylnaphthalene,11 we found that both its emission and absorption spectra were remarkably dependent on the solvent. In poor solvents new absorption and emission bands were observed in addition to the normal spectra. The purpose o f this study is to identify these new bands and discuss the correlation of the bands to the conformation of the polymer in solution. The results are expected to contribute to the understanding of the primary process of the photochemical reaction of the long chain polymer.
Experimental Section1-Vinylnaphthalene and 2-vinylnaphthalene were
synthesized from the corresponding naphthaldehydes. The crude products were purified by column chromatography on silica gel with n-hexane as a solvent. They were polymerized in dilute benzene or cyclohexane solution (■~10-1 m ol/L) by the use of azobis(isobutylonitrile) as an initiator at 60 °C under degassed condition. The polymer yield was kept less than 5%. In order to eliminate the effect o f double bonds at the polymer ends, they were saturated in tetrahydrofuran by palladium black in an atmosphere o f hydrogen. The polymers were purified by repeated reprecipitation from methylene chloride solution with methanol and the soluble part of the product polymer in cyclohexane was used. The molecular weight distribution of the polymer used is shown in Figure 1. It was measured with a Toyosoda gel permeation chromatograph spectrometer (HLC-801). The viscosity average molecular weight is about 3000. The sample has no low molecular
weight impurity such as monomer or dimer.Absorption and emission spectra were recorded by
means of a Shimadzu UV-200 spectrometer and a Hitachi MPF-2A spectrofluorometer, respectively. The temperature o f the sample was controlled by passing hot water around the sample holder and was monitored via thermocouples attached to the sample. A cell with a light pass o f 10 cm was used for measurement o f the temperature dependence o f the absorption spectrum. All sample solutions were degassed by freeze-thaw cycles under a reduced pressure of less than 10-5 mmHg.
Results(I) Absorption Spectra. Figure 2 shows the absorption
spectra of poly-1-vinylnaphthalene at room temperature in methylene chloride as well as in cyclohexane. The position and shape o f the ’La <- 1A band around 285 nm of the polymer in methylene chloride are similar to those of the model compound, 1,3-di-a-naphthylpropane, in solution at room temperature, though the vibrational structure in the polymer spectrum is not as clear as in the spectrum of the model compound. The shoulder observed at 315 nm in the polymer spectrum in methylene chloride can be assigned to the xLb * - ’A band o f the naphthalene nucleus. The spectrum o f the polymer in methylene chloride (a good solvent) is thus attributed to a monomeric naphthyl side group, which will hereafter be called a monomer. The polymer spectrum in methylene chloride agrees with the spectrum obtained by Vala et al.5
The absorption spectrum of poly-l-vinylnaphthalene in cyclohexane is, however, clearly different from that in methylene chloride and also from the corresponding spectrum of the model compound, especially in the region to the red of 330 nm. It has new bands at 339 and 331 nm, though the polymer in methylene chloride shows only an absorption tail at wavelengths longer than 330 nm. In addition to these longer wavelength absorption bands, new peaks appear at 253 and 243 nm. The bands around 340 and 250 nm are considered to result from a red shift or splitting o f the ’Lb ■*- lk band at 315 nm and of the ’Bb •*- *A band at wavelengths shorter than 240 nm, respectively. On the contrary, the ]La <— ’A band around 285 nm shows a small blue shift in cyclohexane.
The new bands were observed not only in cyclohexane but also in other poor solvents such as n-hexane and tetrachloromethane. The absorption intensity, however, depends on the solvent used, the highest intensity being obtained in cyclohexane. By the addition of a good solvent to a cyclohexane solution, the intensity of the new band decreases. Figure 3 shows the dependence o f the ratio of the intensity of the new band to that of the monomer band
The Journal o f Physical Chemistry, Vol. 81, No. 16, 1977

1572 Irie, et al.
Figure 1. Gel permeation chromatograph of poly-1-vinylnaphthalene.
Figure 2. Absorption spectra of poly-1-vinylnaphthalene in methylene chloride (— ) and in cyclohexane ( - - - ) at room temperature. The concentration of the polymer is the same in both samples and is 1.3 X 10 4 mol/L in monomer base unit. A cell with a light pass of 1 cm was used.
Figure 3. Solvent effect on the ratio of intensity of dimer absorption (340 nm) to that of monomer absorption (315 nm) for poly-1-vinyl- naphthalene in mixed solvents of cyclohexane and tetrahydrofuran at room temperature.
on the content of tetrahydrofuran in the mixed solvent of cyclohexane and tetrahydrofuran. The intensity ratio decreases by the addition of tetrahydrofuran. The solvent effect suggests that the appearance of the new band is due to a conformational change of the polymer in a poor solvent, and the new spectrum is ascribed to a dimer formed by association of two naphthyl side groups; hereafter, this type of dimer will simply be called a dimer. The decrease in the interaction between polymer and solvent must cause a specific interaction between the naphthyl side groups to give the associated dimer conformation.
In a mixed solvent containing cyclohexane and tetrahydrofuran the intensity of the new band was found to depend on the temperature. The intensity of the new band decreased by raising the temperature, as shown in Figure4. At 70 °C the shoulder due to the new band completely disappeared. When the sample was recooled to room
W a v e l e n g t h , n m
Figure 4. Temperature dependence of the absorption spectrum of poly-1-vinylnaphthalene in a mixed solvent of cyclohexane and tetrahydrofuran (volume ratio of 98:2). A cell with a light pass of 10 cm was used.
Figure 5. Temperature dependence of the ratio of the intensity of monomer absorption (315 nm) to that of dimer absorption (340 nm) for poly-1-vinylnaphthalene in a mixed solvent of cyclohexane and tetrahydrofuran (volume ratio of 98:2).
temperature, the shoulder reappeared, though it was not as clear as that in the initial sample. The ratio between the intensities at 315 and 340 nm indicates the recovery of about 50% of the initial content.
The dependence of the ratio between the intensities at 315 and 340 nm on the temperature is shown in Figure 5. The ratio increased remarkably in the region 40-65 °C, while no change was observed below 40 °C and above 65 °C even when the sample was allowed to stand for 30 h. The S-shape o f the curve in Figure 5 suggests that the conversion from a rigid conformation to a normal one is a kind o f phase transition. The transition occurs in a narrow temperature region between 40 and 60 °C. Above 65 °C, the mobility of the chain presumably becomes more important than the interaction between aromatic side groups o f the polymer chain.
The specific conformation in poor solvents at lower temperatures is considered to be produced as a result of the decrease of the interaction between the polymer chain and solvent and the increase of the interaction between aromatic side groups of the polymer chain. It is expected that within the distribution o f conformations there are geometries favorable to the formation of an associated dimer of the naphthyl side groups, which gives rise to a new absorption.
The Journal o f Physical Chemistry, Voi. 81, No. 16, 1977
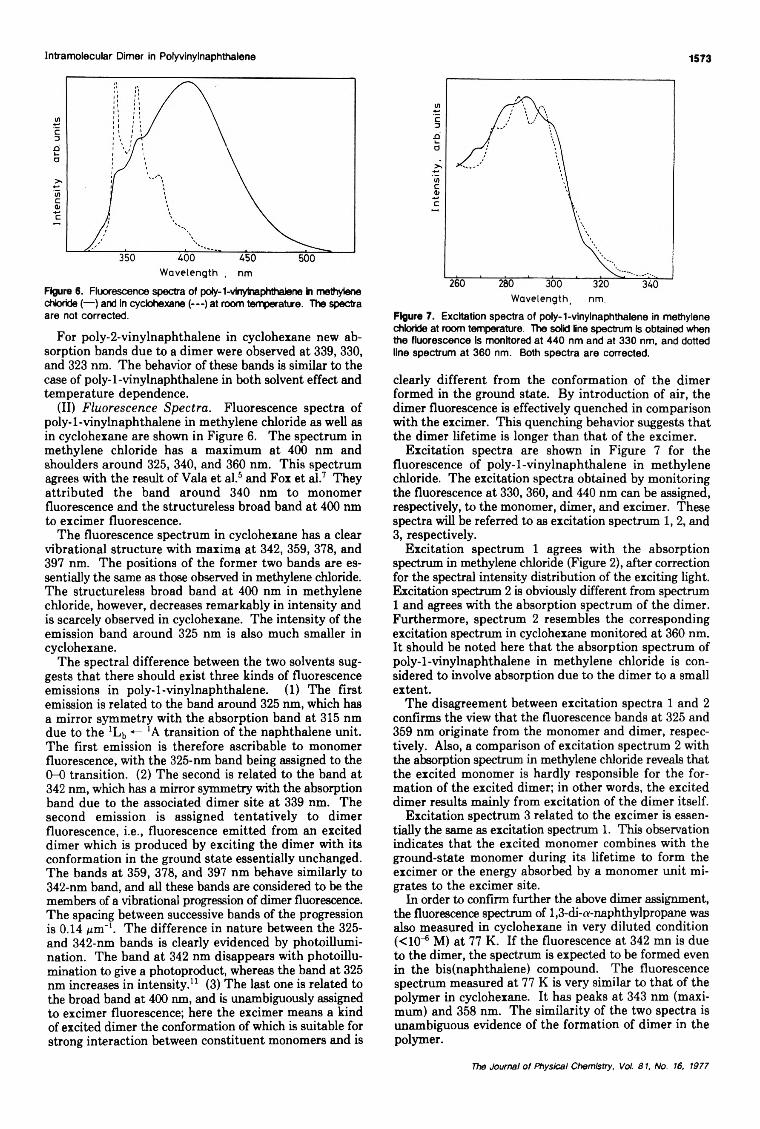
Intramolecular Dimer In Polyvinylnaphthalene 1573
Figure 6. Fluorescence spectra of poly-1-vinytnaphthalene in methylene chloride (— ) and in cyclohexane ( - - - ) at room temperature. The spectra are not corrected.
For poly-2-vinylnaphthalene in cyclohexane new absorption bands due to a dimer were observed at 339, 330, and 323 nm. The behavior of these bands is similar to the case of poly-1-vinylnaphthalene in both solvent effect and temperature dependence.
(II) Fluorescence Spectra. Fluorescence spectra of poly-1-vinylnaphthalene in methylene chloride as well as in cyclohexane are shown in Figure 6. The spectrum in methylene chloride has a maximum at 400 nm and shoulders around 325, 340, and 360 nm. This spectrum agrees with the result of Vala et al.5 and Fox et al.7 They attributed the band around 340 nm to monomer fluorescence and the structureless broad band at 400 nm to excimer fluorescence.
The fluorescence spectrum in cyclohexane has a clear vibrational structure with maxima at 342, 359, 378, and 397 nm. The positions o f the former two bands are essentially the same as those observed in methylene chloride. The structureless broad band at 400 nm in methylene chloride, however, decreases remarkably in intensity and is scarcely observed in cyclohexane. The intensity of the emission band around 325 nm is also much smaller in cyclohexane.
The spectral difference between the two solvents suggests that there should exist three kinds of fluorescence emissions in poly-1-vinylnaphthalene. (1) The first emission is related to the band around 325 nm, which has a mirror symmetry with the absorption band at 315 nm due to the 7Lb * - 'A transition o f the naphthalene unit. The first emission is therefore ascribable to monomer fluorescence, with the 325-nm band being assigned to the0-0 transition. (2) The second is related to the band at 342 nm, which has a mirror symmetry with the absorption band due to the associated dimer site at 339 nm. The second emission is assigned tentatively to dimer fluorescence, i.e., fluorescence emitted from an excited dimer which is produced by exciting the dimer with its conformation in the ground state essentially unchanged. The bands at 359, 378, and 397 nm behave similarly to 342-nm band, and all these bands are considered to be the members of a vibrational progression of dimer fluorescence. The spacing between successive bands of the progression is 0.14 ¿tnT1. The difference in nature between the 325- and 342-nm bands is clearly evidenced by photoillumination. The band at 342 nm disappears with photoillumination to give a photoproduct, whereas the band at 325 nm increases in intensity.11 (3) The last one is related to the broad band at 400 nm, and is unambiguously assigned to excimer fluorescence; here the excimer means a kind of excited dimer the conformation of which is suitable for strong interaction between constituent monomers and is
Figure 7. Excitation spectra of poly-1-vlnylnaphthalene in methylene chloride at room temperature. The solid line spectrum Is obtained when the fluorescence Is monitored at 440 nm and at 330 nm, and dotted line spectrum at 360 nm. Both spectra are corrected.
clearly different from the conformation of the dimer formed in the ground state. By introduction o f air, the dimer fluorescence is effectively quenched in comparison with the excimer. This quenching behavior suggests that the dimer lifetime is longer than that o f the excimer.
Excitation spectra are shown in Figure 7 for the fluorescence of poly-1-vinylnaphthalene in methylene chloride. The excitation spectra obtained by monitoring the fluorescence at 330, 360, and 440 nm can be assigned, respectively, to the monomer, dimer, and excimer. These spectra will be referred to as excitation spectrum 1, 2, and 3, respectively.
Excitation spectrum 1 agrees with the absorption spectrum in methylene chloride (Figure 2), after correction for the spectral intensity distribution of the exciting light. Excitation spectrum 2 is obviously different from spectrum 1 and agrees with the absorption spectrum of the dimer. Furthermore, spectrum 2 resembles the corresponding excitation spectrum in cyclohexane monitored at 360 nm. It should be noted here that the absorption spectrum of poly-1-vinylnaphthalene in methylene chloride is considered to involve absorption due to the dimer to a small extent.
The disagreement between excitation spectra 1 and 2 confirms the view that the fluorescence bands at 325 and 359 nm originate from the monomer and dimer, respectively. Also, a comparison o f excitation spectrum 2 with the absorption spectrum in methylene chloride reveals that the excited monomer is hardly responsible for the formation of the excited dimer; in other words, the excited dimer results mainly from excitation of the dimer itself.
Excitation spectrum 3 related to the excimer is essentially the same as excitation spectrum 1. This observation indicates that the excited monomer combines with the ground-state monomer during its lifetime to form the excimer or the energy absorbed by a monomer unit migrates to the excimer site.
In order to confirm further the above dimer assignment, the fluorescence spectrum of 1,3-di-a-naphthylpropane was also measured in cyclohexane in very diluted condition (<10-6 M) at 77 K. If the fluorescence at 342 mn is due to the dimer, the spectrum is expected to be formed even in the bis(naphthalene) compound. The fluorescence spectrum measured at 77 K is very similar to that o f the polymer in cyclohexane. It has peaks at 343 nm (maximum) and 358 nm. The similarity of the two spectra is unambiguous evidence o f the formation of dimer in the polymer.
The Journal o f Physical Chemistry, Vol. 81, No. 16, 1977
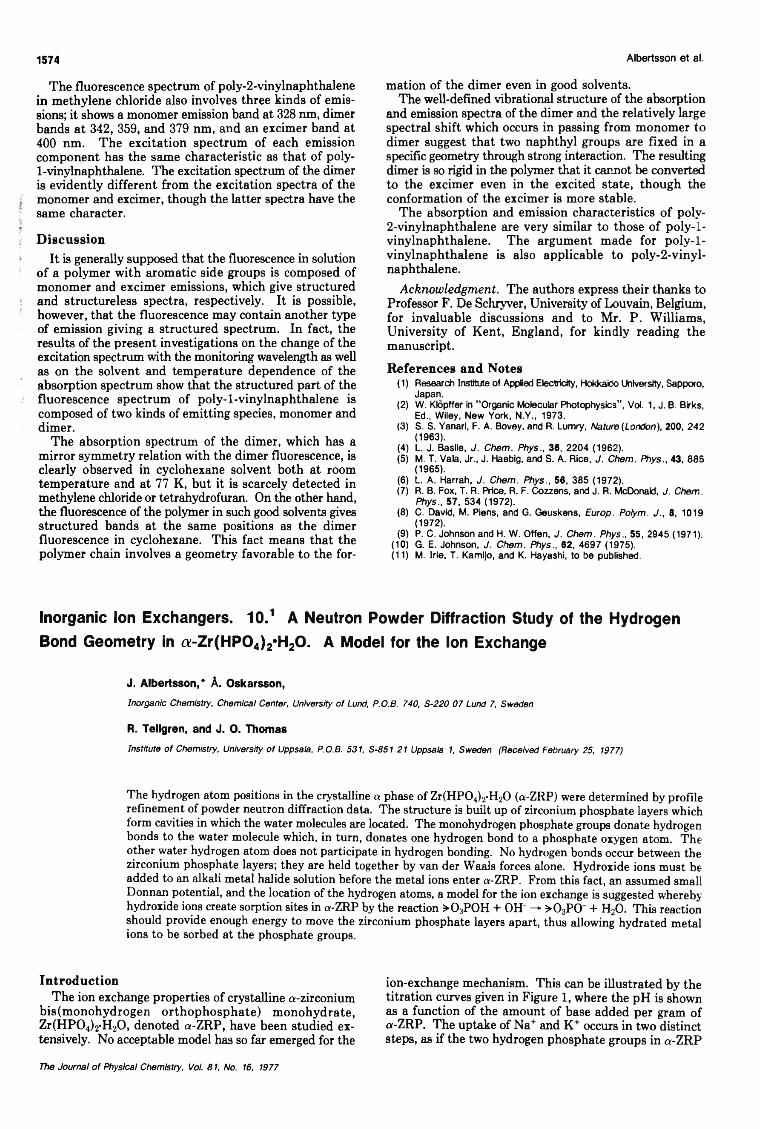
1574 Albertsson et al.
The fluorescence spectrum of poly-2-vinylnaphthalene in methylene chloride also involves three kinds of emissions; it shows a monomer emission band at 328 nm, dimer bands at 342, 359, and 379 nm, and an excimer band at 400 nm. The excitation spectrum of each emission component has the same characteristic as that o f poly-1-vinylnaphthalene. The excitation spectrum of the dimer is evidently different from the excitation spectra o f the monomer and excimer, though the latter spectra have the same character.
DiscussionIt is generally supposed that the fluorescence in solution
o f a polymer with aromatic side groups is composed of monomer and excimer emissions, which give structured and structureless spectra, respectively. It is possible, however, that the fluorescence may contain another type o f emission giving a structured spectrum. In fact, the results of the present investigations on the change of the excitation spectrum with the monitoring wavelength as well as on the solvent and temperature dependence of the absorption spectrum show that the structured part o f the fluorescence spectrum of poly-1-vinylnaphthalene is composed of two kinds of emitting species, monomer and dimer.
The absorption spectrum of the dimer, which has a mirror symmetry relation with the dimer fluorescence, is clearly observed in cyclohexane solvent both at room temperature and at 77 K, but it is scarcely detected in methylene chloride or tetrahydrofuran. On the other hand, the fluorescence of the polymer in such good solvents gives structured bands at the same positions as the dimer fluorescence in cyclohexane. This fact means that the polymer chain involves a geometry favorable to the for
mation o f the dimer even in good solvents.The well-defined vibrational structure of the absorption
and emission spectra of the dimer and the relatively large spectral shift which occurs in passing from monomer to dimer suggest that two naphthyl groups are fixed in a specific geometry through strong interaction. The resulting dimer is so rigid in the polymer that it cannot be converted to the excimer even in the excited state, though the conformation of the excimer is more stable.
The absorption and emission characteristics o f poly-2-vinylnaphthalene are very similar to those o f poly-1- vinylnaphthalene. The argument made for poly-1- vinylnaphthalene is also applicable to poly-2-vinyl- naphthalene.
Acknowledgment. The authors express their thanks to Professor F. De Schryver, University of Louvain, Belgium, for invaluable discussions and to Mr. P. Williams, University o f Kent, England, for kindly reading the manuscript.
References and Notes(1) Research Institute of Applied Electricity, Hokkakio University, Sapporo,
Japan.(2) W. Kldpffer In “Organic Molecular Photophysics” , Vol. 1, J. B. Birks,
Ed., Wiley, New York, N.Y., 1973.(3) S. S. Yanarl, F. A. Bovey, and R. Lumry, Nature (London), 200, 242
(1963).(4) L. J. Basile, J. Chem. Phys., 36, 2204 (1962).(5) M. T. Vala, Jr., J. Haebig, and S. A. Rice, J. Chem. Phys., 43, 888
(1965).(6) L. A. Harrah, J. Chem. Phys., 56, 385 (1972).(7) R. B. Fox, T. R. Price, R. F. Cozzens, and J. R. McDonald, J. Chem.
Phys., 5 7 , 5 34 (1972).(8) C. David, M. Piens, and G. Geuskens, Europ Polym. J ., 8, 1019
(1972).(9) P. C. Johnson and H. W. Often, J. Chem. Phys., 55, 2945 (1971).
(10) G. E. Johnson, J. Chem. Phys., 62, 4697 (1975).(11) M. Irie, T. Kamijo, and K. Hayashl, to be published.
Inorganic Ion Exchangers. 10.1 A Neutron Powder Diffraction Study of the Hydrogen Bond Geometry in a-Zr(HP04)2*H20 . A Model for the Ion Exchange
J. Albertsson,* A. Oskarsson,Inorganic Chemistry, Chemical Center, University o f Lund, P.O.B. 740, S-220 07 Lund 7, Sweden
R. Tellgren, and J. O. ThomasInstitute o f Chemistry, University o f Uppsala, P.O.B. 531, S-851 21 Uppsala 1, Sweden (Received February 25, 1977)
The hydrogen atom positions in the crystalline a phase of Zr(HP04)2-H20 (a-ZRP) were determined by profile refinement of powder neutron diffraction data. The structure is built up of zirconium phosphate layers which form cavities in which the water molecules are located. The monohydrogen phosphate groups donate hydrogen bonds to the water molecule which, in turn, donates one hydrogen bond to a phosphate oxygen atom. The other water hydrogen atom does not participate in hydrogen bonding. No hydrogen bonds occur between the zirconium phosphate layers; they are held together by van der Waals forces alone. Hydroxide ions must be added to an alkali metal halide solution before the metal ions enter a-ZRP. From this fact, an assumed small Donnan potential, and the location of the hydrogen atoms, a model for the ion exchange is suggested whereby hydroxide ions create sorption sites in a-ZRP by the reaction > 0 3POH + OH" — > 0 3PO + H20. This reaction should provide enough energy to move the zirconium phosphate layers apart, thus allowing hydrated metal ions to be sorbed at the phosphate groups.
IntroductionThe ion exchange properties of crystalline a-zirconium
bis(m onohydrogen orthophosphate) monohydrate, Zr(H P04)2-H20 , denoted a-ZRP, have been studied extensively. No acceptable model has so far emerged for the
ion-exchange mechanism. This can be illustrated by the titration curves given in Figure 1, where the pH is shown as a function o f the amount of base added per gram of a-ZRP. The uptake of Na+ and K + occurs in two distinct steps, as if the two hydrogen phosphate groups in a-ZRP
The Journal o f Physical Chemistry, Vol. 81, No. 16, 1977

Inorganic Ion Exchangers 1575
Figure 1. Potentiometric titration curves: pH vs. amount of base added per gram of a-ZRP for alkali metal and ammonium ions. Data are taken from ref 2 -8 .
TABLE I: Crystal Data for a-ZRPZr(HP04)j-H20 , mol wt 301.2 Monoclinic; space group P 2J c a = 9.0610(10), b = 5.2873(7), c = 16.2481(31) A (3= 111.41(1)°; V = 724.7 A 3 Z = 4 ; D X = 2 .7 6 g e m '3
have different acidities.2-5 In contrast, only one step is found for NH4+ while the Li+ curve has three.6,7 The Rb+ and Cs+ curves have anomalous shapes, but they may indicate only one step in the titration.2® 8
In order to explain these and similar results, we must know the location of the sorption sites in solid a-ZRP, and the possibilities for various ions to reach these sites from the solution. The structure of the non-hydrogen atoms has been determined from x-ray intensity data by Clearfield and Smith.9 The crystal data are given in Table I. The structure comprises zirconium phosphate layers of pseudo-hexagonal symmetry (Figure 2). Any two adjacent layers are displaced relative to one another by x = 1/3, y = 2/ 3 (and by 7.54 A in the z direction), so that cavities are formed between the layers. Each cavity contains one water molecule. Clearfield and co-workers4 have shown that if the phosphate oxygen atoms have a van der Waals radius o f 1.4 A, a spherical ion with a radius o f less than1.3 A can enter the cavities along directions parallel to the zirconium phosphate layers. To enter the cavities in a perpendicular direction, the ion must have a radius less than 1.2 A. Of the alkali metal ions only non-hydrated Li+, Na+, and K + could possibly move through the a-ZRP structure, but not Rb+ and Cs+. The model of the M +/H + exchange mechanism proposed in ref 4 requires a diffusion o f unhydrated metal ions into the cavities through the small openings. This model is in conflict with the titration curves given in Figure 1.
A better understanding of the metal-ion sorption on a-ZRP would be possible if the positions o f the hydrogen atoms were also known. The hydrogen-bond geometry
Figure 2. Idealized layer in the a-ZRP structure. Open circles represent oxygen, shaded zirconium, and black phosphorus. The axes ah, b„ of this pseudo-hexagonal layer are related to the axes am and bm of the monoclinic unit cell by a h = (am - bm)/2 and bh = bm.
determines the energy required to expand the entrances to the cavities. Since all attempts to make large single crystals o f a-ZRP have failed, we turned to the powder neutron diffraction method (profile refinement) to locate the hydrogen atoms.
Experimental SectionA well-crystallized sample o f a-ZRP was obtained by
refluxing an amorphous preparation in 12 mol L 1 H3P 0 4 for 300 h.3 The unit cell dimensions given in Table I were determined at 295(1) K with a Guinier-Hagg focusing camera as described previously.3 The neutron powder data were collected at about 295 K at the R2 reactor, Studsvik, Sweden. The instrument used was a four-circle diffractometer modified for powder work. The neutron beam was taken from a radial reactor channel and passed through a double monochromator system.10 The (200) planes in two copper crystals were used to give a wavelength of 1.56 A and a neutron flux at the specimen o f 106 cm-2 s-1. The powder was packed lightly into a 12-mm diameter vanadium tube of length 40 mm. The range 10° <26 < 108° was scanned in steps of 0.08°, and with a measuring time per step of about 8 min. Only the section 15-63° was used in the refinement. The data between 10 and 15° were omitted because of an electrical irregularity in the detector system, which was not discovered until after the measurements were completed. The profile above 63° was essentially featureless, so that this region too was omitted from the refinements. It was found experimentally that absorption could be neglected.
Structure RefinementThe programs used for data processing and structure
refinement are local modifications11 o f the original Rietveld powder profile preparation and refinement programs.12 The preparation program assigns to each point in the profile a set of contributing reflexions. They are calculated using the wavelength, cell dimensions, and a rough knowledge of the assumed Gaussian peak form. The refinement then proceeds to minimize the quantity J^w(y0 - k~lyc)2, where y0 is the number o f counts at 26 after subtraction of the background contribution B; k is a scale factor, and w = (y0 + B)-1 the weighting function.
From the model of the heavy-atom structure (Table II) four possible hydrogen bond schemes could be proposed (Table III).9 A preliminary refinement of all four models immediately eliminated models 1 and 2. Noting model 3 to be an ordered form o f model 4, a refinement o f the hydrogen atom occupancies in model 4 clearly indicated that the correct structure was that defined by the ordered model 3 but with a significant shift applied to the suggested starting position for H(4). Further refinement of this latter model produced final R values Ri = 0.061, Rproffle
The Journal o f Physical Chemistry, Vol. 81, No. 16, 1977

1576 Albertsson et ai.
Figure 3. The neutron powder profile fit for a-ZRP. The points are the observed number of counts y B at 26 and the line is the calculated profile. The difference profile is on the same scale.
Figure 4. The structure of a-ZR P viewed along b .
TABLE II: The Heavy-Atom Positions (Fractional Coordinates) Used in the Refinement“
Atom X y z B, A 2Zr 0.7606(2) 0.250(2) 0.5144(1) 0.67(2)P (D 6 0.0008(6) 0.752(5) 0.6129(4) 1.13(8)P(2) 0.4711(6) 0.245(5) 0.6044(4) 0.98(8)0 (1 ) 0.105(2) 0.806(5) 0.560(1) 1.7(3)0 (2 ) -0 .0 6 6 (3 ) 0.486(6) 0.601(2) 2.6(4)0 (3 ) -0 .1 3 1 (2 ) 0.941(5) 0.589(4) 1.6(4)0 (4 ) 0.104(2) 0.760(9) 0.716(1) 2.2(3)0 (5 ) 0.344(3) 0.443(5) 0.562(1) 2.0(4)0 (6 ) 0.418(2) -0 .0 1 4 (5 ) 0.569(1) 1.6(3)0 (7 ) 0.625(2) 0.314(5) 0.590(1) 1.9(4)0 (8 ) 0.512(2) 0.243(9) 0.705(1) 2.3(3)0 (9 ) 0.254(2) 0.235(8) 0.759(1) 3.1(4)
0 The data are taken from ref 9. b P(2)-P(3) in ref 9are changed to P (l)-P (2), 0 (4 ) -0 (9 ) to 0 ( l ) -0 (6 ) , 0 (1 0 ) to 0 (8 ), 0 (1 1 ) to 0 (7 ), and 0 (12 ) to 0 (9 ). The coordinates o f P(2), 0 (2 ), 0 (3 ), and 0 (5 ) -0 (9 ) are transformed compared to ref 9.
= 0.162, and i2„profüe = 0.134. These R values are defined by R\ = E|f0 ~ k~l l c\/T.h1 ^profile = E | yo-fe -1y J /E W , and fiw,profile = {Eta(y0 - k ' yc)2/T,w-yc2\1/2, respectively. I denotes the integrated intensity o f a reflexion. At no stage were the original heavy-atom positions refined.
The final hydrogen atom positions are given in TableIV. The scattering lengths used in the refinements were0.71,0.51,0.580, and -0.374 X 10 14 m for Zr, P, 0 , and H, respectively.13 The final profile fit is shown in Figure 3,
TABLE III: Four Possible Sets of Hydrogen-Atom Positions Suggested by the Heavy-Atom Structure of a-ZRP
X y z Occupancy
H (l) 0.17Model 1
0.92 0.73 1.0H(2) 0.51 0.40 0.74 0.5
0.51 0.09 0.74 0.5H(3) 0.35 0.26 0.74 1.0H(4) 0.18 0.40 0.74 1.0
H(1 ) 0.17Model 2
0.92 0.73 0.50.17 0.60 0.73 0.5
H(2) 0.51 0.40 0.74 0.50.51 0.09 0.74 0.5
H(3) 0.35 0.26 0.74 1.0H(4) 0.18 0.40 0.74 0.5
0.18 0.08 0.74 0.5
H (l) 0.17Model 3
0.92 0.73 1.0H(2) 0.42 0.26 0.73 1.0H(3) 0.18 0.40 0.74 1.0H(4) 0.24 0.19 0.82 1.0
H (l) 0.17Model 4
0.92 0.73 0.50.17 0.60 0.73 0.5
H(2) 0.42 0.26 0.73 1.0H(3) 0.18 0.40 0.74 0.5
0.18 0.08 0.74 0.5H(4) 0.24 0.19 0.82 0.5
0.26 0.25 0.82 0.5
The Journal o f Physical Chemistry, Vol. 81, No. 16, 1977

Inorganic Ion Exchangers 1577
TABLE IV : Final Positions o f the Hydrogen Atoms in a-ZRP“
Atom X y z
H (l) 0.154(7) 0.908(11) 0.737(5)H(2) 0.428(6) 0.275(12) 0.734(4)H(3) 0.189(8) 0.375(9) 0.734(6)H(4) 0.286(7) 0.273(12) 0.818(3)
a The overall isotropic temperature factors B refined for Zr, P, O, and H were 0.8(3), 2.5(3), 1.9(2), and 6.9(8) A 2, respectively.
a list of which can be obtained (from J.O.T.) on request.
Structure DescriptionThe unit cell content of a-ZRP is shown in Figure 4. Six
phosphate oxygen atoms form a slightly distorted octahedron around each zirconium ion. There are two independent phosphate groups in the structure: P ( l )0 4(l-4 ) and P (2 )04(5-8). Each group is coordinated to three different zirconium ions forming layers of linked coordination polyhedra (Figure 2). The layers are parallel to the ab plane. In each layer the zirconium atoms are nearly coplanar with the phosphate groups located above and below this plane. Figure 5 shows the cavity formed by the relative displacement of adjacent layers. 24 phosphate oxygen atoms form the bounds of the cavity where the water molecule is located. The water molecule accepts the two hydrogen bonds 0 (4 )-H (l)-0 (9 ) and 0(8)-H (2)—0(9) but donates only one bond, 0 (9)-H (3)—0(4). The second water hydrogen atom, H(4), points toward the top of the cavity, completing the approximately tetrahedral environment of the water molecule. Via the hydrogen bonds the water molecule participates in two ten-membered rings within the zirconium phosphate layer. There are no hydrogen bonds between the layers; they are held together
by van der Waals forces only. Table V gives a detailed description o f the geometry o f the water molecule, the hydrogen bonds, and the P -O -H angles.
DiscussionThe hydrogen bond geometry in a-ZRP shows no in
dication o f disorder. This means that the hydrolysis reaction->O3P0H- • -OH, ^ 0 3P0 • • H O H/ (1)
within the cavities has a small equilibrium constant. The electrolytic conductivity in a-ZRP is about 9 X 10"5 ohm'1 cm V 4 which is a fairly large value but still compatible with a weak acidity of the monohydrogen phosphate groups. On the other hand, the bonding o f each phosphate group to three zirconium(IV) atoms should greatly enhance the acidity compared to the acidity of H P042 in water solution (pKa = 12.32). As the number o f charged particles are small within solid a-ZRP, there should only be a small Donnan potential preventing negative ions from diffusing into the solid phase when a-ZRP is in contact with an electrolytic solution. Only negligible sorption o f metal ions occurs when a-ZRP is brought to equilibrium with an alkali metal halide solution. Hydroxide ions have to be added before the metal ions enter the solid phase. On the basis of this fact, the presumably small Donnan potential, and the location of the acid hydrogen atoms in a-ZRP, we suggest the following stoichiometric mechanism for the sorption of an alkali metal ion.
Hydroxide ions accompanied by metal ions diffuse into the solid phase. In the following step a sorption site is created by the reaction-5»03POH + OH' ^>03P0 + H20 (2)
As can be seen in Figures 4 and 5, it is not necessary for
TABLE V: The Geometry o f the Water Molecule and the Hydrogen Bonds“0 (9 )-H (3 ) 0.94(7) A 0 (4 )-H (l) . 0.91(7) A0 (9 ) -H(4) 0.92(5) A H (l) • • ■ 0 (9 ') 1.92(7) AH (3)-0 (9 )-H (4) 101(8)° 0 (4 ) -H (l ) • • ■ 0 (9 )
P (l) -0 (4 )-H (l )169(7)°116(5)°
0 (9 )-H (3 ) 0.94(7) A 0 (8 )-H (2 ) 1.05(6) AH (3 )• • • 0 (4 ) 2.16(7) A H (2 )• • • 0 (9 ) 1.78(6) A0 (9 )-H (3 ) ■ • • 0 (4 ) 160(7)° 0 (8 ) -H(2) ■ • • 0 (9 )
P (2 )-0(8)-H (2)159(6)°123(4)°
a The superscript i denotes the equivalent site x, y + 1, z in the structure.
The Journal o f Physical Chemistry, VoL 81, No. 16, 1977

the hydroxide ion to enter the cavity before being close enough to a monohydrogen phosphate group to pick up its hydrogen atom.
If we divide the reaction in eq 2 into two steps^ 0 3P0H - -> 0 3P0- + H+ (3)
H+ + OH“ - H20 (4)
we can estimate the entalpy change AH2 in eq 2. AH for the dissociation H P 0 42' — H+ + P 0 43 is about 15 kJ m ol'1.15 As the acidity o f the monohydrogen phosphate group is larger in a-ZRP than in a “ free” state, this is a maximum estimate of AH3. AH4 is about -56 kJ m ol'1 and we findAif, = AH , + A H , < -4 1 kJ mol"1
As the number o f particles in eq 2 is unchanged, a rough estimate of TAS2 is zero resulting in AG2 < -41 kJ m o l 1. The neutralization of the monohydrogen phosphate groups involves also the breaking and formation o f hydrogen bonds inside the cavity. If we assume that the energy terms arising from these processes cancel each other, the energy AG2 is available to move the zirconium phosphate layers apart. There is one 0 (7 )—0(9) and one 0 (8 )—0(8) van der Waals contact per cavity and two monohydrogen phosphate groups. Neutralization o f only one of these should provide sufficient energy to move the layers apart, thus creating a transition state where hydrated alkali metal ions can reach the > 0 3P 0 “ groups formed. The hydroxide ion acts as a wedge for the alkali metal ion. In the final steps o f the sorption the zirconium phosphate layers, the alkali metal ions, and the water molecules inside a-ZRP rearrange themselves to obtain the energetically most favorable configuration.
Kinetic studies5 on the sorption of potassium ions are
1578 David R. Rosseinsky
in general agreement with the model we propose. When a-ZRP is brought in contact with a potassium hydroxide solution, its layers move apart as shown by a broad reflexion at low angle in the x-ray powder pattern.5 This reflexion was not present after the system had reached “equilibrium” (15 days). The neutralization and accompanying expansion of the cavities (the sorption of the hydrated metal ions) are thus fast processes, while the rearrangement to the less hydrated equilibrium phase is slow, since it involves diffusion of water molecules in the solid, metal-ion-loaded ZRP.
Acknowledgment. The Swedish Natural Science Research Council provided the financial support, which is hereby gratefully acknowledged.
References and Notes(1) For No. 9 in this series, see J. Inorg. N ud . Cham., 36, 2377 (1974).(2) (a) J. Albertsson, Acta Cham . Scand., 20, 1689 (1966); (b) A.
Clearfield and J. A. Stynes, J. Inorg. N u d . Cham., 26, 117 (1964).(3) A. Clearfield, L. Kullberg, and A. Oskarsson, J. Phys. C ham ., 78,
1150 (1974).(4) A. Clearfield, W. L Daux, A. S. MecSna, G. D. Smith, and J. R. Thomas,
J . Phys. Cham ., 73, 3424 (1969).(5) A. Clearfield, W. L. Duax, J. M. Garces, and A. S. Medina, J. Inorg.
N u d . C ham ., 34, 329 (1972).(6) A. Clearfield and R. Hunter, J. Inorg. N ud . Cham., 38, 1085 (1976).(7) A. Clearfield and D. Tuhtar, J . Phys. C ham ., 80, 1296 (1976).(8) G. Alberti, U. Costantino, S. Allulli, and M. A. Massucci, J. Inorg.
N u d . Cham ., 37, 1779 (1975).(9) A. Clearfield and D. Smith, Inorg. C ham ., 8, 431 (1969).
(10) R. Stedman, L. Almqvist, G. Raunio, and G. Nilsson, Rev. S d . Instrum., 40, 249 (1969).
(11) J. O. Thomas, Institute of Chemistry, University of Uppsala, Sweden, Publication No. UUIC-B13-9 (1976).
(12) H. M. Rietveld, J. Appl. Crystallogr., 2, 65 (1969).(13) G. E. Bacon, Acta O ystaiiogr., S ect. A , 28, 357 (1972).(14) G. Alberti and U. Costantino, J . Chromatogr., 102, 5 (1974).(15) National Bureau of Standard Technical Note 270-3, Washington, D.C.
1968.
Surface Tension and Internal Pressure. A Simple Model
David R. RosseinskyDepartment o f Chemistry, The University, Exeter, England (Received March 2, 1977)
A sphere in continuum model, with an internal surface, is used to relate surface tension and internal pressure. The results support the previous use of this model for polar interactions. The agreement of theory and experiment is close to that obtained with a recent lattice model.
The surface tension y has been related1 by means of a simple lattice model to the internal pressure {dU/dV)TN and molecular number density n by
8n 1/3 V a v / T jV (1)
For liquids with an r '6 pair potential the main approximation would introduce an inherent 11% error. The Onsager model2 (polar molecules each assigned spherical volumes in continua having bulk-liquid permittivities) explains the perhaps surprising accord1 o f ether, among several nonpolar liquids; for ethers the dipole-dielectric interaction is demonstrably3 almost negligible, giving an observed vapor pressure close to that of the isostructural hydrocarbon, as predicted.3 The Onsager model implies a surface between sphere and surrounding dielectric, and it is of interest to examine whether explicitly defining this surface incurs any hitherto latent and unresolved complications.
TABLE I: Surface Tension Parameters o f Several Liquids(dU/dA)rpfj (dU(dA)'p f
(eq 2b ), (expte),’Substance T, K° 3.22a dyn cm "1 dyn cm-1
Lattice model1 8Benzene 333 9.1 58.1 66.1«-Heptane 303 8.0 47.6 47.9Diethyl ether 286 7.8 45.2 43.0Argon 87 8.8 20.0 34.3Nitrogen 84 11.8 15.4 27.0Oxygen 80 8.2 23.2 40.1Methane 105 9.2 22.5 42.5Carbon 315 8.4 53.5 63.3
tetrachloride“ Median value.1 b From n and (3 [7/3 V )TN as in ref 1.
c From1 J. J. Jasper, J. Phys. Chem. Ref. Data, 1, 841 (1972).
Changes in V implied in {dU/dV)TtN are assumed to occur essentially in the regions between molecules, each,
The Journal o f Physical Chemistry, Voi. 81, No. 16, 1977
Long-Range Interactions in Proteins 1570
considered singly, filling a spherical volume 1 /n. Con-, comitant changes are imputed to the surface area A of the enclosing spherical cavity similarly envisaged. Then
(where the factor 2/ a refers to a compressible sphere of radius a. Now 7 is d G /d A , which is closely equal to d U /d A - T (dS /dA ), both derivatives here being assumed constant with T, and deemed approximately equal to the partial derivatives. It is convenient to write the approximations as
Oi / 'fijy
0 U \ _ / dA\/dU\ _ 2 /dU\
d V ) Tjj \9 V/ \ dA ) t,n u \9A ) x,n
where 1 /a representing 1 - T(dS/dA)(dA/dU)TyN is calculable from experimental values o f 7 and T. Hence with a expressed in terms of the molecular volume 1/n = Aira3/3
2a \4irn/
= ------ -------- (3 .22 a « 1/3 \
V ö WdU_\dV/
T , N
T ,N( 3 )
Values of 3.22a, from 7 (T) for several liquids,1 are compared in Table I with the lattice value 8, eq 1. The average of the Table I values is 8.9, and the individual deviations are tolerable. Correction o f the lattice value by the 11% referred to introductorily would give yet closer agreement.
The inclusion of a on the right-hand side of eq 3 merely facilitates comparison and involves no circularity of argument. It could be omitted and (a ITJa.A) TtN from eq 2 compared directly with that for the experimental 7 (T). The accord shown in the table is, as for 7 itself with the lattice value,1 to within 18% o f absolute values. Discrepancies here are clearly associated with small size, but the larger molecules conform relatively well. For such sizes no major error in the theory o f vapor pressures3 should thus ensue directly from the surface tension o f the molecular scale cavities implied in the Onsager model employed in that theory.3 The approximate agreement of the lattice and the sphere/continuum models, in providing similar phenomenological relations for 7 , is a further satisfactory result.
References and Notes(1) H. T. Davis and L. E. Scriven, J. Phys. Chem., 80, 2805 (1976).(2) L. Onsager, J. Am . Chem. Soc., 58, 1486 (1936).(3) D. R. Rosseinsky, Nature (London), 227, 944 (1970); J. G. Kirkwood,
J. Chem. Phys., 2, 354 (1934).
An Approximate Treatment of Long-Range Interactions in Proteins1
Matthew R. Plncus2a and Harold A. Scheraga*2bDepartment o f Chemistry, Cornell University, Ithaca, New York 14853 (Received December 28, 1976)
An approximate method, valid beyond a critical distance, is presented for evaluating the long-range interaction energies between the residues of a protein. This approximation results in large reductions in the computer time required to evaluate the energies, compared to the usual procedure of summing the interactions over all pairs of atoms in the interacting residues. Beyond a critical distance between convenient reference atoms in each residue, the long-range nonbonded (attractive) energy may be approximated by -B y / (B y ) 6, where By is the distance between the above-mentioned reference atoms, and the long-range electrostatic energy may be evaluated as the Coulombic interaction energy between the centers of positive and negative charge on each residue. In this approximate procedure, the interactions between residues are computed in terms of properties of the residues instead of those of the individual atoms of each residue.
IntroductionShort3- and medium4-range interactions dominate in
determining protein structure, and empirical algorithms (which neglect long-range interactions) provide a fairly good description of the approximate ranges of the backbone dihedral angles.5 However, in order to obtain a molecule with the proper size and shape, it is necessary to take the long-range interactions into account0^ to obtain a more accurate specification of the backbone dihedral angles.
Because of the large amount of computer time required to compute all pairwise interatomic interactions (including the long-range ones) in a protein, generally only a portion of the long-range interactions are computed. In particular, those beyond some arbitrary cutoff distance from any given atom are neglected.10 While the long-range interactions beyond the cutoff distance are, individually, very small, there are many o f them in a protein molecule, and their sum need not be insignificant. Further, since the long- range nonbonded interactions beyond the cutoff distance are attractive, they could serve to compact the structure
of a globular protein; i.e., their neglect might lead to a more expanded computed structure than actually exists (unless, as in the refinement of X-ray data on proteins,10 the molecule is constrained to fit the X-ray coordinates as closely as possible). The long-range electrostatic interactions could be attractive or repulsive, depending on the configurations of the charges.
The purpose of this paper is to introduce a rapid, approximate procedure for computing these hitherto-neglected long-range interactions. Beyond a critical distance of separation, two interacting residues are treated as spheres of given radii, instead of as individual atoms,11 for calculating the long-range nonbonded interactions. By considering such interactions between two spheres, instead of between all pairs of atoms, a considerable saving of computer time can be effected. Similarly, beyond a critical distance of separation, the charge distributions o f two interacting residues11 may be replaced by two interacting dipoles for calculating the long-range electrostatic interactions. The interaction energy between two dipoles (represented in terms of monopoles) can be calculated
The Journal o f Physical Chemistry, Voi. 81, No. 16, 1977

1580 M. R. Pincus and H. A. Scheraga
more rapidly than that between all pairs o f point charges on the individual atoms of the whole residues. It will be shown that these approximations provide an accurate representation of the long-range interactions beyond a critical distance, in the sense that this approximate procedure leads to energies that are similar to those computed from all pairwise interactions.11 At separations less than the critical distance, all pairwise interactions11 are computed without introducing this approximation. From a practical point o f view, no discontinuities are encountered at the critical distance during minimization procedures.
MethodsUsing the current IUPAC-IUB convention,12 a residue
is taken as the following unit:-HN-CH(R )-CO -
where R is the side chain of the particular residue (R = H for glycine). In the full-atom pairwise-interaction algorithm in use in this laboratory,11 the net charge on this unit is zero, except for residues whose side chains are charged; in this paper, ionizable side chains are taken in their neutral form.
A. Nonbonded Attractive Interactions. To obtain nonbonded attractive energies between residues, the following procedure was used. Two identical residues were generated with the N atom at the origin,11 so that the N -Ca bond of each coincided with the x axis and the N -H bond o f each lay in the second quadrant o f the x -y plane.11 Normally, the fully extended conformation (both backbone and side chain) was used for each residue except for proline (for which <p = -75°, ip = 150°). The extended conformation was usually chosen because, in this conformation, a residue sweeps out the greatest volume when rotated in space. The choice of conformation, though, is not of much importance, as will be shown in section A of the Results section. The residues were treated as rigid bodies, with no internal rotation about single bonds. A reference atom for each residue was then chosen to be the origin for that residue, i.e., the coordinates o f each residue were translated such that the reference atom was at the point (0,0,0). One o f the two residues was then translated along the x axis to a desired distance away from the other residue, called the reference residue. The distance of separation between two residues is defined to be the distance between the reference atoms of each residue.
The reference atom for any given residue was chosen to be the atom judged to be closest to the “ center of mass” o f the residue. The “ radius” of the residue was then defined as the sum of bond lengths between the reference atom and the atom most distant from it plus the van der Waals radius of that most distant atom. The distance between two residues was always equal to or greater than the sum o f the residue radii. The distance that is equal to the sum of the residue radii is called the critical distance. Table I lists the reference atoms and critical distances for the 20 naturally occurring amino acid residues.
The average energy for each distance of separation was obtained in the following manner. At a given distance of separation between residues, a large number of different orientations of the two residues was generated. For each o f 27 different rotational positions for the reference residues, i.e., all combinations of three rotations each about the x, y , and z axes, 27 different rotational positions for the second residue were generated, resulting in a total of 729 orientations in the system. For each o f the 729 orientations, generated at a given distance of separation between the two residues, the sum of the total nonbonded
The Journal o f Physical Chemistry, Vol. 81, No. 16, 1977
TABLE I: Values o f Bä for Attractive NonbondedInteractions and Critical Distances between Identical Pairs o f Amino Acid Residues
Residue
Referenceatom
BU X 10 s, kcal A 6
Criticaldistance“(Cu), A
Alanine C“ 0.330 8.74Arginine C? 1.577 16.64Asparagine C0 0.734 11.82Aspartic acid d 3 0.678 11.82Cystine ca 0.370 10.98Glutamine d 3 1.007 13.74Glutamic acid c0 0.920 14.06Glycine ca 0.180 8.74Histidine C0 1.174 12.72Isoleucine c0 1.111 11.82Leucine c0 1.156 11.82Lysine c'y 1.451 13.80Methionine C0 0.906 14.56Phenylalanine c0 1.868 12.72Proline C“ 0.847 9.46Serine C“ 0.391 10.98Threonine C“ 0.635 10.98Tryptophan C'l' 2.387 15.44Tyrosine c'y 1.654 14.90Valine c01 0.815 10.56
“ Defined as the distance between the reference atoms o f two residues that is equal to the sum o f the residue radii (see text).
and hydrogen bonding energies between the residues was calculated.11 In this calculation, all CH, CH2, and CH3 groups were treated as united atoms.13
The 729 (closely spaced) energies were then averaged arithmetically, and the standard deviation from the average was calculated. The average energy, !/„, at each distance of separation, R , between identical residues i was assumed to obey the relationUti = B U(R U)-6 (1)where Bn is the attractive coefficient for the nonbonded interaction energy between the two residues. This coefficient was computed by a weighted least-squares best fit o f U\\ to (Rjj)~6.
The coefficient for the nonbonded interaction between nonidentical residue pairs, By, is obtained from the relation13
( ¿ W /2 (2)and the critical distance between nonidentical residues i and j is equal to the sum of the radii o f residues i and j.
If N{ and Nj are the numbers o f atoms in the two residues, there are N fl, pairwise nonbonded interactions in the full-atom treatment, but only one in the approximate procedure. For and A/j each of the order o f ~10, this effects a considerable saving in computer time.
B. Electrostatic Interactions. When the separation of two residues is large enough, the electrostatic energy between the point atomic charges of one residue and those of the other may be represented by a dipole-dipole interaction energy.14 In this case, the dipole in each residue may be treated as two point charges, one o f which represents the center of positive charge and the other the center of negative charge. The vector C+ from the origin of the residue coordinate system to the center o f positive charge is defined asC+ = ( l IQ +) X qiW (3)
where q-,+ is the positive charge on the ith atom at a position r 4 in the given residue, and Q+ is the sum of all positive charges in the residue, and is equal to the absolute
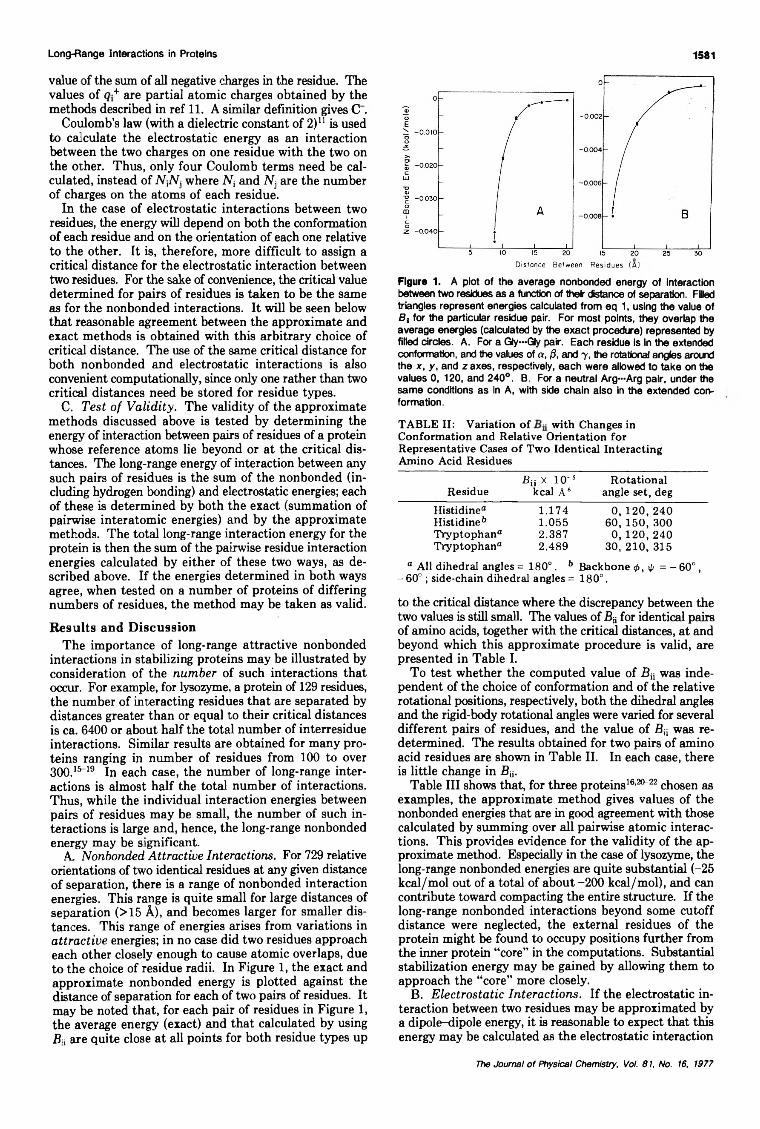
Long-Range Interactions in Proteins 1581
value of the sum of all negative charges in the residue. The values o f q + are partial atomic charges obtained by the methods described in ref 11. A similar definition gives C .
Coulomb’s law (with a dielectric constant o f 2)11 is used to calculate the electrostatic energy as an interaction between the two charges on one residue with the two on the other. Thus, only four Coulomb terms need be calculated, instead of N,Nj where N{ and Nj are the number o f charges on the atoms of each residue.
In the case of electrostatic interactions between two residues, the energy will depend on both the conformation o f each residue and on the orientation o f each one relative to the other. It is, therefore, more difficult to assign a critical distance for the electrostatic interaction between two residues. For the sake of convenience, the critical value determined for pairs o f residues is taken to be the same as for the nonbonded interactions. It will be seen below that reasonable agreement between the approximate and exact methods is obtained with this arbitrary choice of critical distance. The use of the same critical distance for both nonbonded and electrostatic interactions is also convenient computationally, since only one rather than two critical distances need be stored for residue types.
C. Test of Validity. The validity of the approximate methods discussed above is tested by determining the energy o f interaction between pairs of residues of a protein whose reference atoms lie beyond or at the critical distances. The long-range energy of interaction between any such pairs of residues is the sum o f the nonbonded (including hydrogen bonding) and electrostatic energies; each o f these is determined by both the exact (summation of pairwise interatomic energies) and by the approximate methods. The total long-range interaction energy for the protein is then the sum of the pairwise residue interaction energies calculated by either o f these two ways, as described above. If the energies determined in both ways agree, when tested on a number o f proteins o f differing numbers of residues, the method may be taken as valid.
Results and DiscussionThe importance of long-range attractive nonbonded
interactions in stabilizing proteins may be illustrated by consideration of the number o f such interactions that occur. For example, for lysozyme, a protein of 129 residues, the number o f interacting residues that are separated by distances greater than or equal to their critical distances is ca. 6400 or about half the total number of interresidue interactions. Similar results are obtained for many proteins ranging in number of residues from 100 to over 300.15“19 In each case, the number of long-range interactions is almost half the total number of interactions. Thus, while the individual interaction energies between pairs of residues may be small, the number of such interactions is large and, hence, the long-range nonbonded energy may be significant.
A. Nonbonded Attractive Interactions. For 729 relative orientations of two identical residues at any given distance o f separation, there is a range of nonbonded interaction energies. This range is quite small for large distances of separation (>15 A), and becomes larger for smaller distances. This range o f energies arises from variations in attractive energies; in no case did two residues approach each other closely enough to cause atomic overlaps, due to the choice of residue radii. In Figure 1, the exact and approximate nonbonded energy is plotted against the distance of separation for each of two pairs of residues. It may be noted that, for each pair of residues in Figure 1, the average energy (exact) and that calculated by using B;i are quite close at all points for both residue types up
Distance Between Residues (A)
Figure 1. A plot of the average nonbonded energy of Interaction between two residues as a function of their distance of separation. Filled triangles represent energies calculated from eq 1, using the value of SB for the particular residue pair. For most points, they overlap the average energies (calculated by the exact procedure) represented by filled circles. A. For a Gly—Gly pair. Each residue is in the extended conformation, and the values of a , 18 , and y , the rotational angles around the x , y , and z axes, respectively, each were allowed to take on the values 0, 120, and 240°. B. For a neutral Arg—Arg pair, under the same conditions as in A, with side chain also in the extended conformation.
TABLE II: Variation of with Changes in Conformation and Relative Orientation for Representative Cases of Two Identical Interacting Amino Acid Residues
ResidueRii X 10“s
kcal Ä6Rotational
angle set, degHistidine0 1.174 0, 120, 240Histidine0 1.055 60, 150, 300Tryptophan“ 2.387 0, 120, 240Tryptophan“ 2.489 30, 210, 315
“ All dihedral angles = 180°. b Backbone <j>, \p = — 60°,-60 ° ; side-chain dihedral angles = 180°.
to the critical distance where the discrepancy between the two values is still small. The values of B2 for identical pairs of amino acids, together with the critical distances, at and beyond which this approximate procedure is valid, are presented in Table I.
To test whether the computed value of Bi; was independent of the choice of conformation and o f the relative rotational positions, respectively, both the dihedral angles and the rigid-body rotational angles were varied for several different pairs o f residues, and the value o f Bi; was redetermined. The results obtained for two pairs o f amino acid residues are shown in Table II. In each case, there is little change in Bu.
Table III shows that, for three proteins16,20“22 chosen as examples, the approximate method gives values o f the nonbonded energies that are in good agreement with those calculated by summing over all pairwise atomic interactions. This provides evidence for the validity of the approximate method. Especially in the case of lysozyme, the long-range nonbonded energies are quite substantial (-25 kcal/mol out of a total of about -200 kcal/mol), and can contribute toward compacting the entire structure. If the long-range nonbonded interactions beyond some cutoff distance were neglected, the external residues of the protein might be found to occupy positions further from the inner protein “ core” in the computations. Substantial stabilization energy may be gained by allowing them to approach the “ core” more closely.
B. Electrostatic Interactions. If the electrostatic interaction between two residues may be approximated by a dipole-dipole energy, it is reasonable to expect that this energy may be calculated as the electrostatic interaction
The Journal o f Physical Chemistry, Vol. 81, No. 16, 1977

1582 M. R. Pincus and H. A. Scheraga
TABLE III: Comparison o f the Approximation Method with the Pairwise-Atom Summation Method in Evaluating Long-Range Energies in Proteins“
ProteinNo. o f
residues
Totallong-rangenonbonded
energy(atom-pairwise)
Total long-range nonbonded
energy (using J3U)
Totallong-range
electrostaticenergy
(atom-pairwise)
Totallong-range
electrostaticenergy(dipole)
Bovine pancreatic trypsin inhibitor6 58 -5 .6 -5 .5 -0 .8 -0 .5
Lysozyme“ 129 -2 4 .8 -2 5 .4 -1 .2 -1 .8Chymotrypsin B chaind 131 -1 4 .3 -1 4 .7 -0 .2 -0 .3Chymotrypsin C chaind 97 -7 .9 -7 .8 -1 .6 -1 .1
“ All energies are in units o f kcal/mol. b Reference 20. “ Reference 16. d Structure generated with refined backbone dihedral angles (ref 21) and X-ray side-chain dihedral angles (ref 22).
Figure 2. A plot of the electrostatic energy of interaction between two residues as a function of their distance of separation. The solid curve connecting the filled circles represents the electrostatic energy computed by the (exact) pairwise method.” The broken curve connecting the filled triangles represents the electrostatic energy calculated by the dipole method. The values of a , ¡3, and y were all taken as 0 ° in this example. A. For an He—lie pair. 4> = -1 5 3 ° , ip = 144°, or = 180°, x 1 = -1 6 3 ° , X 2’1 = 167°. B. For a neutral Asp—Asp pair. <f> = - 8 0 ° , \p = 9 5 °, to = 180°, x 1 = -6 5 ° , x2 = 9 1 ° , x3,2 = 180°.
energy between the centers of positive and negative charge of the two residues. In this case, it is necessary to evaluate only four distances between point charges rather than N{ X Nj where the latter two quantities are the number of atoms in residues i and j, respectively.
The validity of the approximate method for calculating the electrostatic energy was tested in two ways, first by comparing the results of the approximate method with that obtained by summing over all partial charges11 for particular pairs o f residues as a function of both the distance o f separation between the residues and their relative orientations, and second by comparing the electrostatic energies of various proteins computed by both procedures. Two sets of residue pairs were examined, a nonpolar- nonpolar one, and a polar—polar one. Figure 2 shows the results for two pairs of amino acid residues lie—lie and uncharged Asp—Asp. In Figure 2, the pairs of residues were maintained in only one conformation and relative orientation; only the distance between the residues for each pair was varied. At each distance the electrostatic energy was calculated by both the full point charge method11 and by the dipole method. The agreement between the two methods indicates that the approximate method is valid at and beyond the critical distance.
Rotational Angle Around Z Axis (Deg)
Figure 3. Comparison between the approximate method (filled triangles) and that involving summation over all pairwise interactions (exact) between atomic charges (filled circles). Two Interacting residues are held at a fixed separation of their reference atoms which, in this case, was the critical distance. One residue was rotated In 3 0 ° increments around the zaxis, i.e., the angle y was varied in 3 0 ° increments, and the electrostatic energy was computed by both methods for each relative orientation. The values of a and /3 were taken as 0 ° in this example. A. For an He—He pair conformation as in Figure 2A. B. For an Asp—Asp pair conformation as in Figure 2B.
To examine further the validity o f the approximate procedure at the critical distance, for the same pairs of residues, one of the residues of each pair was rotated around the z axis, and the electrostatic energy was computed by both methods as a function of rotational angle. The results, shown in Figure 3 for each residue pair, demonstrate a close correlation between exact and approximate energies at the critical distance.
A second test involved the computation o f the electrostatic energies of several proteins by both procedures. The results, shown in Table III, indicate good agreement between both methods. In contrast to the long-range nonbonded energy, the long-range electrostatic energy is quite smaU. The probable reason for this is that, in the case o f globular proteins, each residue is surrounded by a distribution o f dipoles with essentiaUy random orientations which, on the average, practically cancel leaving small residual energies. It must be noted that these sample calculations were performed on proteins whose structure is the final one, i.e., that of the already folded protein. It may happen that, in the folding o f a protein, the positioning of regular structures of significant dipole moment
The Journal o f Physical Chemistry, Vol. 81, No. 16, 1S77
Structural Properties of Co-Mo-Alumina Catalysts 1583
may in fact determine the conformations of particular residues through significant dipole-dipole interactions. The purpose of presenting the results of Table HI here is merely to demonstrate that the approximate method is a valid one. Evaluation of the actual role played by long- range electrostatic effects in such processes as protein folding remains to be performed.
The computational time savings using the dipole method for the long-range interactions in a protein the size of pancreatic trypsin inhibitor is about 2.5. Thus, it also results in substantial reductions in computational times.
Acknowledgment. We are indebted to Drs. L. G. Dunfield and G. Nemethy for helpful comments on this manuscript.
References and Notes(1) This work was supported by research grants from the National Science
Foundation (PCM75-08691) and from the National Institute of General Medical Sciences, National Institutes of Health, U.S. Public Health Service (GM-14312).
(2) (a) NIH Postdoctoral Fellow, 1975-1976. (b) To whom requests for reprints should be addressed.
(3) H. A. Scheraga, Pure Appl. Chem., 36, 1 (1973).(4) P. K. Ponnuswamy, P. K. Warme, and H. A. Scheraga, Proc. Natl.
Acad. Sci., U .S .A ., 70, 830 (1973).
(5) For a recent discussion of empirical algorithms, see F. R. Maxfield and H. A. Scheraga, B iochem istry, 15, 5138 (1976).
(6) A. W. Burgess and H. A. Scheraga, P roc. Natl. A cad. S d ., U .S .A ., 72, 1221 (1975).
(7) S. Tanaka and H. A. Scheraga, P roc . Natl. A ca d . S ci., U .S .A ., 72, 3802 (1975).
(8) M. Levitt and A. Warshel, Nature (London), 253, 694 (1975).(9) M. Levitt, J. Mol. Biol., 104, 59 (1976).
(10) P. K. Warme and H. A. Scheraga, Biochem istry, 13, 757 (1974).(11) F. A. Momany, R. F. McGuire, A. W. Burgess, and H. A. Scheraga,
J. Phys. C hem ., 79, 2361 (1975).(12) IUPAC-IUB Commission on Biochemical Nomenclature. Biochemistry,
9, 3471 (1970).(13) (a) P. K. Warme and H. A. Scheraga, J. Comput. Phys., 12, 49 (1973);
(b) L. G. Dunfield, A. W. Burgess, and H. A. Scheraga, manuscript in preparation.
(14) J. A. Barker, P roc. R . S o c . London, S er . A , 219, 367 (1953).(15) P. C. Moews and R. H. Kretsinger, J. Mol. Biol., 91, 201 (1975).(16) C. C. F. Blake, L. N. Johnson, G. A. Mair, A. C. T. North, D. C. Phillips,
and V. R. Sarma, P roc. R. S o c . London, S er . B, 167, 378 (1967).(17) J. C. Kendrew, H. C. Watson, B. E. Strandberg, R. E. Dickerson, D.
C. Phillips, and V. C. Shore, Nature (London), 190, 666 (1961).(18) R. A. Alden, C. S. Wright, and J. Kraut, Phil. Trans. R . S o c . London,
S er. B , 257, 119 (1970).(19) W. N. Lipscomb, G. N. Reeke, Jr., J. A. Hartsuck, F. A. Quiocho,
and P. H. Bethge, Phil. Trans. R . S o c . London, S er . B , 257, 177 (1970).
(20) R. Huber, personal communication.(21) K. E. B. Platzer, F. A. Momany, and H. A. Scheraga, Inti. J. Peptide
Protein R es ., 4, 201 (1972).(22) J. J. Birktoft and D. M. Blow, J. M ol. Biol., 68, 187 (1972).
E ffect of Gallium Ions and of Preparation M ethods on the S tructural P roperties of
Cobalt-M olybdenum -A lum ina Cata lysts
M. Lo Jacono, M. Schiavello,*t V. H. J. De Beer,t and G. MlnelllCentro di Studio su “ Struttura ed attività catalitica di sistemi di ossidi” del CNR, c /o Istituto di Chimica Generale, Università di Roma and Istituto di Chimica Generale, Università di Roma, Roma, Ita ly and the Department o f Inorganic Chemistry and Catalysis, University o f Technology, Eindhoven, The Netherlands (Received December 30, 1976)
Publication costs assisted by Consiglio Nazionale delle Ricerche, Roma
Small amounts of gallium ions were added to y-alumina and their influence on the structural properties of the system Co-(Mo)/y-A120 3 was studied. It is shown that, due to the presence of Ga3+ ions, a “surface” spinel CoA120 4 is formed with a larger amount of Co2+ in tetrahedral sites as compared to the spinel formed on gallium-free alumina. A decrease of the segregated Co30 4 is also observed. A possible effect of gallium ions on molybdenum is discussed. It is also reported that different preparation methods (single or double impregnation) lead to the formation of different surface species. Cobalt alumínate, molybdate monolayer, and Co30 4, depending on the Co content, are formed on doubly impregnated specimens. Cobalt alumínate and cobalt molybdate are the main species formed on singly impregnated specimens. Finally brief consideration is given to how the Co and Mo species, present in the oxide form, change in the sulfided form.
1. IntroductionIn previous studies of supported oxide systems on
alumina, it was shown that a “surface spinel” (MnAl20 4,1 CoA120 4,2 NiAl20 4,3 CuAl20 44a,b) was formed, either alone or in addition to an oxide phase. Additions of trace amounts of Zn2+, Ga3+, and Ge4+ ions5 modify the surface properties of alumina, thus affecting the structural features of supported transition metal ions. The presence of these ions, all having a preference for the tetrahedral site, favors a normal cation distribution in the surface spinel NiAl20 4.5 Since the type of symmetry adopted by supported cobalt and molybdenum directly influences their reactivity, it was of interest to investigate the influence of Ga3+ ions in the
j Università di Roma, Rome, Italy. _+ University of Technology, Eindhoven, The Netherlands.
hydrodesulfurization (HDS) of Co-Mo-alumina catalysts. Within this framework we have also examined how the order of addition of transition metal ion promoters affects the structural properties of the Co-M o/Ga20 3-y-A l20 3 system in the oxide form, and how the Co and Mo surface species present in the oxide forms are related to those developed in the sulfided catalysts.
2. Experimental Section2.1. Catalyst Preparation. The gallium-containing
y-alumina support (AyGa) was prepared by impregnating y-Al20 3 6 with gallium nitrate. The soaked mass, dried at 120 °C, was heated at 500 °C for 15 h. Two nominal Ga contents (atoms per 100 A1 atoms) were prepared; 0.6 and 4 (designated as AyGa0.6 and AyGa4).
Different portions of the AyGa0.6 and AyGa4 supports were impregnated with a solution of cobalt nitrate of
The Journal o f Physical Chemistry, Voi. 81, No. 16, 1977
1584 Schiavello et al.
TABLE I: Gallium-Containing Specimens and Their PropertiesCurie constant,
Co content,“ C, erg G~2 Magnetic WeissSamples wt % m o l'1 K moment, ¿ig temp -0 , K Co2+tet, %
A 7GaC o(0.6:l) 1.12 3.11 4.99 20 42A7GaCo(0.6:2) 2.29 2.95 4.86 28 59A7GaCo(0.6:3) 3.15 2.96 4.87 35 58A7GaCo(0.6:4) 4.32 2.96 4.87 38 58A7GaCo(0.6:5) 5.29 2.95 4.86 46 (59)b .?A-A7G aM oC o(0 .6 :5 :l) 1.42 3.60 5.35 30 0A-A7GaMoCo( 0.6 :5 :2 ) 2.11 2.97 4.90 25 57A-A7 GaMoCo( 0.6 :5 :3 ) 3.31 2.97 4.90 30 57A-A7GaM oCo(0.6:5:4) 4.19 3.05 4.94 30 48A-A7GaM oCo(0.6:5:5) 4.96 3.05 4.94 36 (48)bB-A7 GaMoCo( 0.6:5:1 ) 1.17 2.86 4.80 22 68B-A7GaM oCo(0.6:5:2) 2.30 3.00 4.90 25 54B-A7 GaMoCo( 0.6 :5 :3 ) 3.07 3.28 5.12 23 24B-A7GaM oCo(0.6:5:4) 4.21 3.20 5.08 25 32B-A7 GaM oCo(0.6:5:5) 4.80 3.28 5.12 23 24
“ Analytical, see text. b Due to the presence o f Co30 4 the value is less accurate.
TABLE II: Gallium-Containing Specimens and Their PropertiesCurie constant,
Co content,“ C, erg G“2 Magnetic WeissSamples wt % m o l1 K moment, ¿ig temp -6 , K C °2+tet> %
A7G aC o(4:l) 1.10A7GaCo(4:2) 2.10 3.08 4.99 22 45A7GaCo(4:3) 3.05 3.06 4.95 35 47A7GaCo(4:4) 4.12 3.03 4.93 40 49A7GaCo(4:5) 5.20 2.95 4.86 43 (59)bA-A7GaMoCo(4:5 :1) 0.95 3.39 5.21 22 12A-A7GaM oCo(4:5:2) 1.91 3.14 5.01 24 39A-A7GaM oCo(4:5:3) 3.12 2.98 4.89 28 (57 )bA-A7GaMoCo(4:5 :4 ) 4.44 2.48 4.48 30 cA-A7GaM oCo(4:5:5) 5.00 2.54 4.53 30 cB-A7 GaMoCo( 4 :5 :1 ) 0.97 2.95 4.88 10 59B-A7 GaMoCo( 4 :5 :2 ) 1.72 3.21 5.07 25 31B-A7GaM oCo(4:5:3) 2.77 3.20 5.07 26 32B-A7 GaMoCo( 4 :5 :4 ) 3.52 3.26 5.13 36 26B-A7 GaMoCo( 4 :5 :5 ) 4.50 3.20 5.08 31 32CoMo0 4 (green) 26.8 3.53 5.32 11 0CoMo0 4 (violet) 26.8 3.42 5.24 13 8
“ Analytical, see text. b Due to the presence o f Co30 4 the value is less accurate. e Value not calculated due to thelarge amount o f Co30 4 present.
known concentration. The material was then dried at 120 °C, ground, and fired at 600 °C for 24 h in air. Cobalt- and gallium-containing catalysts are designated as AYGaCo(0.6:x) and AYGaCo(4:x) with x (nominal Co content in atoms per 100 A1 atoms) equal to 1, 2, 3, 4, or5.
The Co-Mo-Ga-containing catalysts were prepared by two different methods.
M ethod A. The supports AyGaO.6 and A7Ga4 were impregnated with an ammonium heptamolybdate solution to obtain a Mo content of 5 atom % with respect to 100 A1 atoms. The paste was dried at 120 °C, ground, and fired at 500 °C for 5 h. The catalysts so obtained are designated as A7GaMo(0.6:5) and A7GaMo(4:5).
Cobalt was subsequently added to different portions of A7GaMo(0.6:5) and A7GaMo(4:5) by impregnation with a cobalt nitrate solution followed by drying at 120 °C, grinding, and firing in air at 600 °C for 24 h. The catalysts are designated as A-A7GaMoCo(0.6:5:x) and A- AYGaMoCo(4:5:x) with x = 1, 2, 3,4, or 5 atoms of Co per 100 A1 atoms.
M ethod B. The supports AYGa0.6 and AYGa4 were impregnated with an ammonium heptamolybdate solution in the same amount as in method A followed only by drying at 120 °C. Different portions of this material were again impregnated with a solution of cobalt nitrate. The mass was then dried at 120 °C, ground, and fired at 600
°C for 24 h in air. The catalysts so obtained are designated as B-A7GaMoCo(0.6:5:x) and B-A7GaMoCo(4:5:x) where x has the same values as before.
Sulfurization. Portions of AYGaCo(0.6:x), A- AYGaMoCo(0.6:5:x), and B-A7GaMoCo(0.6:5:x) catalysts were sulfided in a silica reactor at 400 °C, for 2 h, in a flow of H2 (90 cm3/min) and H2S (10 cm3/min).
2.2. Physical Characterization and Chemical Analysis. Optical reflectance spectra were recorded on a Beckman DK 1 instrument, in the range 2500-210 nm at room temperature, using 7-Al20 3 as a reference. To check the influence of grain size on the reflectance spectra, some specimens were ground for 5 and 20 h in a mechanical mortar. The same spectrum was obtained in both cases. Therefore all spectra were recorded for samples ground for 5 h.
Magnetic susceptibility measurements were carried out by the Gouy method7 in the temperature range 100-295K. The specimens were contained in a sealed silica tube.
X-ray analysis was carried out with Co radiation, nsinp a Debye-Scherrer camera (114 nm diameter) or a diffractometer (Philips).
Chemical analysis for cobalt was performed by atomic absorption techniques (Varian Techtron AA5); concentrated H2S 04 was used to dissolve the specimens.3 The catalysts and some of their properties are listed in Tables I and II.
The Journal o f Physical Chemistry, Vol. 81, No. 16, 1977

Structura l P roperties o f C o -M o -A lu m in a Catalysts 1585
F ig u re 1. Reflectance spectra of A7GaCo(0.6:x ) specimens with x = 0 -5 .
with x = 0 -5 .
3. Experimental Results3.1. Reflectance Spectra. Reflectance spectra were
recorded for all samples. As the pattern of their spectra is essentially the same only representative series are reported. Figures 1 and 2 show the reflectance spectra of the A7 GaCo(0 .6 :x) and A-A7 GaMoCo(0 .6 :5 :x) series, respectively. Detailed analysis of the reflectance spectra of Co2+ in different environments and of the assignment of optical transitions was discussed elsewhere. 2 Inspection of Figures 1 and 2 leads to the following conclusions:
(a) The spectra of the A7 GaCo and A7 GaMoCo specimens are dominated by bands due to Co2+ ions in tetrahedral symmetry2 and their general pattern is qualitatively similar to that of the spinel CoxMg1_IAl20 4 and of Co2+/ 7 -Al20 3. 2
(b) With increasing cobalt content the intensity of the absorption band at 578 nm is lower in the series A7 C0 X (with x < 3 atom % since Co30 4 is present at higher x 2) than in the A7 GaCo(0 .6 :x) series, Figure 3, as well as for the A7 GaCo(4 :x) series.
Recalling that the band at 578 nm is the most intense band for Co2+tet> one is led to the conclusion that the
cu | ______________ 1_____________I____________ J _____________ I_______________I______________I 2 3 4 5
Co content (atomic percent}Figure 3. Intensity of the absorption band at 578 nm vs. cobalt content (atom percent): (A) A7 C0X; (O) A7 GaCo(0.6 :x); ( • ) B-A7 GaMoCo(0.6:5 :x); (□) A7 GaCo(4 :x); (C ) A-A7 GaMoCo(0 .6 :5 :x).
Figure 4. Intensity of the shoulder at 720 nm (C03O4) vs. cobalt content (atom percent): (A ) A7C0X; (O ) A7GaCo(0.6:x); (A ) A7MoCo(5:x); (C ) A-A7GaMoCo(0.6:5:x); ( • ) B-A7GaMoCo(0.6:5:x).
amount of Co2+tet is higher in Ga-containing specimens.(c) Moreover, inspection of Figure 3 shows that the
intensity of the band at 578 nm increases linearly with the Co content for A7 GaCo(0 .6 :x) as well as for A7 -GaCo(4 :x) and A-A7 GaMoCo(0 .6 :5 :x), while this is not the case for B-A7 GaMoCo, for which the curves become concave toward the abscissa at high Co content. This can be attributed to the presence of a new type of Co2+ with different symmetry. Since the extinction coefficient for octahedral Co2+ ions is smaller than for tetrahedral ions, the new type of Co2+ absorption can be attributed to ions in octahedral symmetry, probably in a new phase (the x-ray section clarifies this point).
(d) It is now useful to analyze the intensity of the shoulder at 720 nm, due to Co30 4 2 for different series of specimens. Figure 4 shows the change in intensity, reported as the height of the shoulder in cm, with increasing cobalt content for the series AyGaCoIO.frx) and A- and B-A7 GaMoCo(0 .6 :5 :x); the figure also includes data for A7 C0X and A7MoCo(5:x).2
The gallium-free A7 C0X and A7 MoCo(5 :x) have a larger amount of Co30 4, as compared to the gallium-containing
The Journal o f Physical Chemistry, Vol. 81, No. 16, 1977
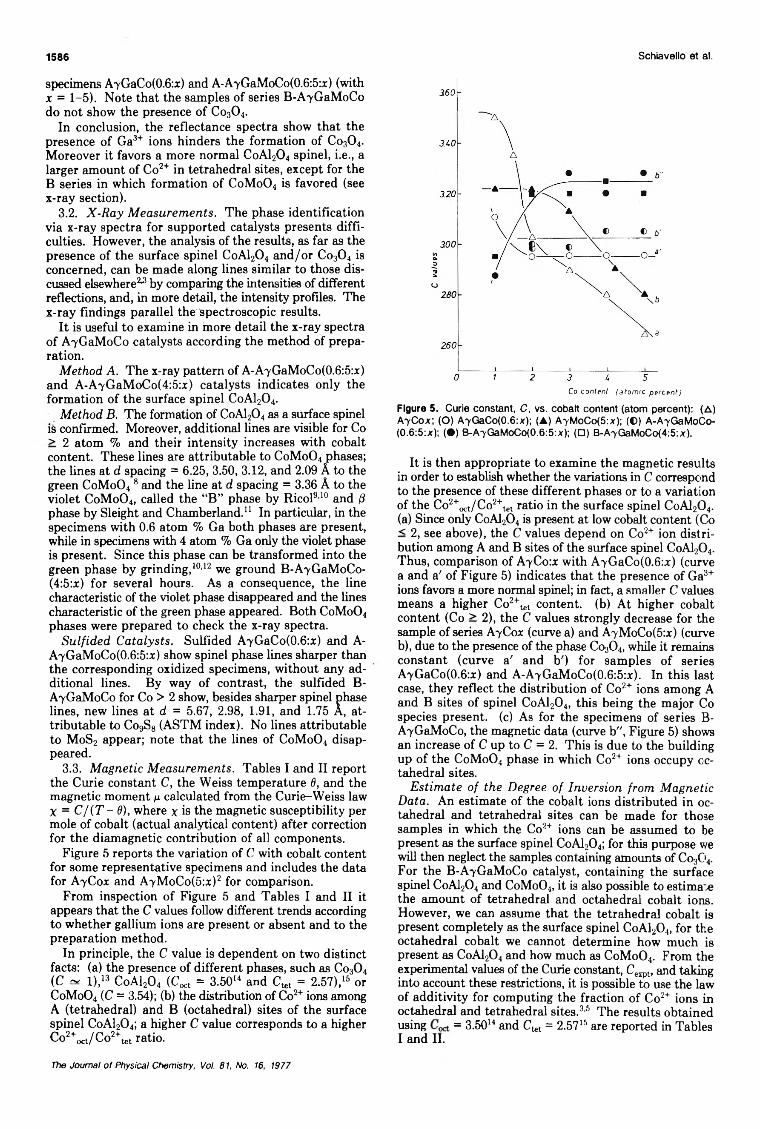
1586 Schiavello et al.
specimens AyGaCo(0.6:x) and A-AyGaMoCo(0.6:5:x) (with x = 1-5). Note that the samples of series B-AyGaMoCo do not show the presence o f Co30 4.
In conclusion, the reflectance spectra show that the presence o f Ga3+ ions hinders the formation of Co30 4. Moreover it favors a more normal CoA120 4 spinel, i.e., a larger amount of Co2+ in tetrahedral sites, except for the B series in which formation of C oM o04 is favored (see x-ray section).
3.2. X-Ray Measurements. The phase identification via x-ray spectra for supported catalysts presents difficulties. However, the analysis of the results, as far as the presence of the surface spinel CoA120 4 and/or Co30 4 is concerned, can be made along lines similar to those discussed elsewhere2,3 by comparing the intensities of different reflections, and, in more detail, the intensity profiles. The x-ray findings parallel the spectroscopic results.
It is useful to examine in more detail the x-ray spectra o f AYGaMoCo catalysts according the method of preparation.
Method A. The x-ray pattern of A-AyGaMoCo(0.6:5:x) and A-AyGaMoCo(4:5:x) catalysts indicates only the formation o f the surface spinel CoA120 4.
Method B. The formation of CoA120 4 as a surface spinel is confirmed. Moreover, additional lines are visible for Co > 2 atom % and their intensity increases with cobalt content. These lines are attributable to C oM o04 phases; the lines at d spacing = 6.25, 3.50, 3.12, and 2.09 A to the green C oM o04 8 and the line at d spacing = 3.36 A to the violet C oM o04, called the “ B” phase by Ricol9,10 and ft phase by Sleight and Chamberland.11 In particular, in the specimens with 0 .6 atom % Ga both phases are present, while in specimens with 4 atom % Ga only the violet phase is present. Since this phase can be transformed into the green phase by grinding,10,12 we ground B-AyGaMoCo- (4:5:x) for several hours. As a consequence, the line characteristic of the violet phase disappeared and the lines characteristic of the green phase appeared. Both CoM o04
phases were prepared to check the x-ray spectra.Sulfided Catalysts. Sulfided AyGaCo(0.6:x) and A-
AyGaMoCo(0.6:5:x) show spinel phase lines sharper than the corresponding oxidized specimens, without any additional lines. By way of contrast, the sulfided B- AYGaMoCo for Co > 2 show, besides sharper spinel phase lines, new lines at d = 5.67, 2.98, 1.91, and 1.75 A, attributable to Co9S8 (ASTM index). No lines attributable to M oS2 appear; note that the lines of C oM o04 disappeared.
3.3. Magnetic Measurements. Tables I and II report the Curie constant C, the Weiss temperature 6, and the magnetic moment n calculated from the Curie-Weiss law X = C / ( T - 6), where x is the magnetic susceptibility per mole of cobalt (actual analytical content) after correction for the diamagnetic contribution of all components.
Figure 5 reports the variation of C with cobalt content for some representative specimens and includes the data for AyCox and AyMoCo(5:x)2 for comparison.
From inspection o f Figure 5 and Tables I and II it appears that the C values follow different trends according to whether gallium ions are present or absent and to the preparation method.
In principle, the C value is dependent on two distinct facts: (a) the presence of different phases, such as Co30 4
(C ~ l),13 CoA1204 (CMt = 3.5014 and Ctet = 2.57),15 or CoMo04 (C = 3.54); (b) the distribution of Co2+ ions among A (tetrahedral) and B (octahedral) sites of the surface spinel CoA1204; a higher C value corresponds to a higher Co2+oct/C o2+tet ratio.
260-
Co content (atomic percent)Figure 5. Curie constant, C , vs. cobalt content (atom percent): (A ) A yC ox; (O ) AyGaCo(0.6:x); (A ) AyM oCo(5:x); (€ ) A -A yG aM oC o- (0.6:5:x); ( • ) B-AyGaMoCo(0.6:5:x); (□ ) B-AyGaMoCo(4:5:x).
It is then appropriate to examine the magnetic results in order to establish whether the variations in C correspond to the presence of these different phases or to a variation of the Co2+oct/C o 2+tet ratio in the surface spinel CoA1204.(a) Since only CoA1204 is present at low cobalt content (Co < 2 , see above), the C values depend on Co2+ ion distribution among A and B sites of the surface spinel CoA1204. Thus, comparison of AyCo:x with AyGaCo(0 .6 :x) (curve a and a! o f Figure 5) indicates that the presence of Ga3+ ions favors a more normal spinel; in fact, a smaller C values means a higher Co2+tet content, (b) At higher cobalt content (Co > 2 ), the C values strongly decrease for the sample of series AyCox (curve a) and AyMoCo(5:x) (curve b), due to the presence of the phase Coa0 4, while it remains constant (curve a' and b ') for samples o f series AyGaCo(0.6:x) and A-AyGaMoCo(0.6:5:x). In this last case, they reflect the distribution of Co2+ ions among A and B sites of spinel CoA1204, this being the major Co species present, (c) As for the specimens of series B- AyGaMoCo, the magnetic data (curve b", Figure 5) shows an increase of C up to C = 2. This is due to the building up o f the CoMo04 phase in which Co2+ ions occupy octahedral sites.
Estimate of the Degree of Inversion from Magnetic Data. An estimate of the cobalt ions distributed in octahedral and tetrahedral sites can be made for those samples in which the Co2+ ions can be assumed to be present as the surface spinel CoA1204; for this purpose we will then neglect the samples containing amounts of Co30 4. For the B-AyGaMoCo catalyst, containing the surface spinel CoA1204 and CoM o04, it is also possible to estimate the amount o f tetrahedral and octahedral cobalt ions. However, we can assume that the tetrahedral cobalt is present completely as the surface spinel CoA1204, for the octahedral cobalt we cannot determine how much is present as CoA1204 and how much as C oM o04. From the experimental values of the Curie constant, Ceipt, and taking into account these restrictions, it is possible to use the law of additivity for computing the fraction o f Co2+ ions in octahedral and tetrahedral sites.3,5 The results obtained using = 3.5014 and Ctet = 2.5715 are reported in Tables I and II.
The Journal o f Physical Chemistry, Vol. 81, No. 16, 1977

Structural Properties of Co-Mo-Alumina Catalysts 1587
It is necessary to emphasize that the percent values given for Co2+tet are only estimates, because o f the choice of Crxt and Ctet, but the relative effect should be real.
DiscussionThe presence and amounts of Co30 4, C0 M 0 O4, and
CoA120 4 are not determined solely by the chemical composition but also by the method of preparation, namely, A and B. Furthermore, the results show that the surface spinel CoAl20 4 is always present and its cation distribution is affected by the presence of foreign ions (i.e., in this case, Ga3+ ions). Moreover, segregation of the C03O4
phase depends on several factors, such as the cobalt content, the method o f preparation, and the presence of Ga3+ ions.
We discuss in order the following topics: (1) the effect o f gallium ions on the cobalt and molybdenum; (2 ) the state of the surface according the method of preparation;(3) the sulfided specimens.
Influence of Gallium Ions on Cobalt and Molybdenum. In principle, in a spinel the M2+ ions can occupy tetrahedral (A) and/or octahedral (B) sites and the relative M 2+oct/M 2+tet ratio depends on several parameters. 16 In addition, recent studies5 on the structural and magnetic properties o f Ni2+ ions supported on alumina showed that a small addition of Zn2+, Ga3+, or Ge4+, all having a preference for tetrahedral sites, shifts the cation distribution in the surface spinel NiAl20 4 toward a more normal one.
The observed behavior was explained by invoking the polarization o f anions toward tetrahedral sites. With this in mind, one would expect that the addition of cobalt ions to gallium-containing alumina, AyGaCo specimens, leads to a more normal CoA120 4 spinel. The experimental observation matches this picture fully.
Especially in the specimens with high cobalt content, the experimental data (Figure 4) show that Co30 4 segregation is strongly decreased in the Ga-containing specimens (AyGaCo as compared to AyCox). In order to rationalize this point, we recall that segregation of oxides in supported systems is mainly affected by two factors:4®(a) the stability of ions in the 2 + oxidation state; and (b) the diffusion pathways in the alumina lattice. It has been shown17 that for cations at tetrahedral sites the possible pathways in a spinel lattice always include a saddle position of octahedral symmetry. Now, if the crystal field around the octahedral sites is decreased when Ga3+ ions are added,5 one would expect a higher rate of diffusion of Co2+ ions. As a consequence, a greater amount of spinel is formed while the segregation o f Co30 4 decreases.
The presence of Ga3+ may also influence the attachment o f molybdate ions on the alumina surface. Molybdate monolayer formation has been extensively discussed by several authors.2,18-21 In our case it may be recalled that OH groups bonded to aluminum ions are about 100 times more basic than those bonded to gallium ions.22 Consequently, one would expect that molybdenum acid would react preferentially with aluminum octahedral OH giving molybdate ions attached to the surface. For a topotactic process, the molybdenum ions would occupy tetrahedral sites by extending the spinel structure immediately above the plane.20,21 As compared to AyMo, the AyGaMo specimens will have a somewhat larger amount o f Mo6+ in tetrahedral sites and this fact may be relevant for catalytic reactions.
Influence of the Method of Preparation. Method A. T his method consists of three successive impregnations and three calcinations according to the sequence Ga, Mo, and Co.
The first addition of Ga modifies the properties o f the alumina surface.5 The second impregnation and calcination allows the M o to react with the modified surface of the alumina giving a monolayer o f molybdate ions attached to the alumina surface, in registry with the structure.2,18-21 In our case no separate phase of M0O3 can be identified since the molybdenum content is fairly low. The cobalt, added with the third impregnation, now finds the structure of the external layers o f alumina altered by the presence o f Ga3+ and molybdate ions.
It may be noted that the presence of Ga3+ ions still allows the cobalt ions to react with alumina and favors a more normal spinel.
Finally, it should be emphasized that there is not a tendency to form the compound C0 M 0 O4, since all the molybdenum has already reacted with the alumina surface.
Method B. Since B-AyGaMoCo catalysts were prepared by three impregnations but only two calcinations, the cobalt and molybdenum, react simultaneously (not in succession, as described for method A) with the alumina surface, and with each other. In fact, three reactions at 600 °C are able to occur simultaneously: (1 ) the reaction between Co- and Ga-containing alumina will give the cobalt alumínate, CoA120 4, and Co30 4 at high Co content;(2 ) the reaction between molybdenum and alumina will form molybdate ions attached to the alumina surface; (3) the reaction between molybdenum and cobalt12 forms the C0M 0O4 phase.
The first reaction is dependent on the diffusion of cobalt ions into the external layers of alumina. The large surface area of alumina assists the process, by increasing the contact area between reagents.
The second reaction, considered as an acid-base reaction, should be dependent on the strength o f the relative acids and bases involved and on the dispersion o f molybdenum.
As far as the third reaction, the results obtained by Haber and Ziolkowski12 for the system Co30 4 -M o 0 3 at 500 °C clearly indicate that the C0M0O4 formation is rapid and dependent on the diffusion of molybdenum ions into C03O4
grains. Thus, the species expected to arise as a function of Co content when the three reactions occur simultaneously can be accounted for as follows.
At low cobalt content, only the first and the second reactions occur. Apparently, the third process (C0M 0 O4
formation) is also very rapid at 600 °C 12 although the strong interaction between cobalt and alumina tends to decompose the C0M 0 O4 when this compound is heated with pure alumina.23
Only at higher cobalt content does the formation of cobalt molybdate also occur, as a process taking place on the Co-rich external layers in competition with the diffusion o f cobalt into the alumina. The experimental results match this picture fully. The x-ray data have shown that the formation of the C0M 0O4 phase starts to occur for a cobalt content S 2 and its amount increases with increasing cobalt content. The reflectance spectra and magnetic measurements parallel the x-ray data showing that the cobalt ions, at higher cobalt content, go into octahedral sites as expected if C0 M 0O4 is formed.
Sulfided Catalysts. As already reported, the effect of sulfiding is confined to the surface layers.2 The process can be pictured as an exchange of surface OH- to SH- with a concomitant reduction o f M o6+ to lower oxidation states.2,24-27
To throw light on the Co and M o species which can be formed during the sulfurization, one has to take into account the species present in the oxide state.
The Journal o f Physical Chemistry, Vol. 81, No. 16, 1977

1588 J. R. Durig, M. G. Griffin, and W. J. Natter
According to literature data2,21,25,28 and to our results, the CoA1204 cannot be sulfided, but only their surface OH“ can be transformed into SH“. However, if cobalt is present as separate phases (Co304 or CoMo04) it will undergo the Co9S8 transformation. 2 ’21,2 8 Concerning molybdenum, it is currently reported that the sulfiding process of the Mo monolayer leads to an “oxysulfo” species rather than to a sulfided one. 2,24,25 This conclusion is based on the lack of observation of MoS2. However, it must be pointed out that the sulfiding of B-A7 GaMoCo specimens, in which CoMo04 is present, produces only Co9S8, the conditions being suitable for the formation of Co9S8 and MoS2. Indeed the sulfiding of pure and silica supported (Co- Mo/Si02) CoM o04 leads to the formation of cobalt and molybdenum sulfides. 29 Therefore, it can be argued that the growth of MoS2 crystallites on alumina supported specimens probably occurs in two dimensions, failing x-ray detection. Another possibility could be that the crystallites are three-dimensional, but very small. Indeed, XPS studies show that MoS2 is probably present. 27,30
Acknowledgment. The authors thank Professor A. Cimino for suggestions and for critically reading the manuscript.
References and Notes(1) M. Lo Jacono, M. Schiavello, D. Cordischi, and G. Mercati, Gazz.
Chim. Ita l., 105, 1165 (1975).(2) M. Lo Jacono, A. Cimino, and G. C. A. Schuit, Gazz. Chim. Ita l.,
103, 1281 (1973).(3) M. Lo Jacono, M. Schiavello, and A. Cimino, J. Phys. Chem., 75,
1044 (1971).(4) (a) M. Lo Jacono and M. Schiavello, “ Preparation of Catalysts” , B.
Delmon, P. A. Jacobs, and G. Poncelet, Ed., Elsevier, Amsterdam, 1976, p 473. (b) Unpublished results from this laboratory.
(5) A. Cimino, M. Lo Jacono, and M. Schiavello, J. Phys. Chem., 79, 243 (1975).
(6) D. S. Mc Iver, H. K Tobin, and R. T. Barth, J. Catal., 2, 485 (1963).(7) A. Cimino, M. Lo „acono, P. Porta, and M. Valigl, Z . Phys. Chem.
(Frankfurt am Mam), 51, 301 (1966).(8) G. W. Smith, Acta Crystallogr., 15, 1054 (1962).(9) P. Rlcol, Compt. Rend., 256, 3125 (1963).
(10) J. M. G. Lipsch and G. C. A. Schuit, J. Catal., 15, 163 (1969).(11) B. A. Sleight and B. L. Chambertand, Inorg. Chem., 7 ,1 6 7 2 (1968).(12) J. Haber and J. Ziolkowski, React. Solids, P roc. In t. Sym p., 7th,
1972, 782 (1972). ■(13) J. R. Tomlinson, R. O. Keeling, G. T. Rymer, and J. M. Bridges, Actes
Congr. In t. C a ta l, 2nd, 1960, 1831 (1961).(14) A. Cimino, M. Lo Jacono, P. Porta, and M. Vallgi, Z. Phys. Chem.
(Frankfurt am Main), 70, 166 (1970).(15) F. Pepe, M. Schiavello, and G. Ferraris, J. Solid State Chem., 12,
63 (1975).(16) G. Blasse, Philips Res. Rep., Suppl., No. 3 (1964).(17) F. S. Stone and R. J. D. Tilley, React. Solids, Proc. Int. Symp., 7th,
1972, 262 (1972).(18) J. Sonnemans and P. Mars, J. Catal., 31, 209 (1973).(19) T. Franzen, O. Van der Meer, and P. Mars, J. Catal., 42, 79 (1976).(20) W. K. Hall and M. Lo Jacono, “The 6th International Congress on
Catalysis” , London, 1976, paper A.16.(21) G. C. A. Schuit and B. C. Gates, A IC h E J ., 19, 417 (1973).(22) A. Martell and L. G. Sillèn, Chem. Soc., Spec. Publ., No. 17 (1964);
No. 25 (1971).(23) J. M. G. Lipsch, Thesis, Technological University, Eindhoven, The
Netherlands, 1968.(24) P. C. H. Mitchell and F. Trifiro, J. Catal., 33, 350 (1974).(25) F. E. Massoth, J. Catal., 36, 164 (1975).(26) A. Cimino and B. A. De Angells, J. Catal., 36, 11 (1975).(27) T. A. Patterson, J. C. Carver, P. E. Leyden, and D. L. Hercules, J.
Phys. Chem., 80, 1700 (1976).(28) J. T. Richardson, Ind. Eng. Chem., Fundam., 3, 154 (1964).(29) V. H. J. De Beer, M. J. M. Van der Aalst, C. J. Machiels, and G. C.
A. Schuit, J. Catai., 43, 78 (1976).(30) R. M. Friedman, R. I. Declerck-Grimee, and J. J. Fripiat, J. Electron
Spectrosc. Relat. Phenom., 5, 437 (1974).
A nalysis of Torsional Spectra of M olecu les w ith Tw o Internal C 3v Rotors. 7.
Far-Infrared and Low -Frequency Ram an Spectra of the Gaseous D im ethylphosphine
J. R. Durig,* M. G. Griffin, and W. J. NattertDepartment o f Chemistry, University o f South Carolina, Columbia, South Carolina 29208 (Received March 14, 1977)
Publication costs assisted by the University o f South Carolina
The Raman spectrum of gaseous dimethylphosphine at a resolution of 1 cm“' has been recorded between 100 and 400 cm“1. The far-infrared spectrum has been recorded over the same frequency range with a resolution of 0.5 cm“1. Considerable torsional data are reported and used to characterize the torsional potential function based on a semirigid model. The average effective V3 was found to be 701 ± 3 cm“ 1 (2.01 keal/mol). The cosine-cosine coupling term, V33, was found to be 240 ± 8 cm“1 (0.68 keal/mol) and the sine-sine term, V'33, has a value o f -55 ± 2 cm“1 (-0.16 keal/mol). These data are compared to the corresponding quantities obtained from microwave data. Comparisons are also given to similar quantities obtained for other molecules.
IntroductionThe vibrational spectrum o f dimethylphosphine has
been previously reported . 1,2 Beachell and Katlafsky1
reported the infrared spectrum of the gas and the Raman spectrum of the liquid and tentatively assigned the Raman lines at 236 and 318 cm “ 1 as the torsional motions. However, neither of these lines appeared in either the infrared or Raman spectra reported by Durig and
1 Taken in part from the thesis of W. J. Natter to be submitted to the Department of Chemistry in partial fulfillment of the Ph.D. degree.
Saunders2 and these authors concluded that these two bands arose from impurities in the earlier sample. Durig and Saunders2 reported bands in the far-infrared spectra of solid (CH3)2PH and (CD3)2PH at 180 and 140 cm“1, respectively, and assigned these bands to the CH3 and CD3
torsional modes. It was assumed that the frequencies for both torsional modes were essentially degenerate for both molecules and the threefold periodic barriers were calculated to be 2.14 and 2.30 keal/mol for the CH3 and CD3
rotors, respectively. The barrier calculation was necessarily simplified because a proper characterization of the potential function for two interacting threefold rotors requires considerable experimental data.3“6 The availability o f a
The Journal o f Physical Chemistry, Vol. 81, No. 16, 1977

Spectra of Gaseous Dimethylphosphine 1589
Figure 1. The Raman spectra of dimethylphosphine vapor. Spectral slit-width below 220 cm -1 was 1 c m '1 and above 330 c m '1 it was 4 cm '1.
2 0 0 1 5 0 1 0 0
W A V E N U M B E R (C M -1)Figure 2. Far-infrared spectra of dimethylphosphine vapor with an effective resolution of 0 .5 c m '1. The spectrum shown is retraced eliminating absorption bands due to water.
computer-controlled Fourier transform far-infrared spectrometer, where repeated interferograms may be averaged rapidly to improve the signal-to-noise ratio and where spectral interferences may be readily subtracted, has made it possible to obtain high-quality far-infrared data for this molecule. Therefore extensive torsional data have been obtained for dimethylphosphine and are reported herein. These data have been used to characterize the torsional potential function for this molecule.
Experimental SectionThe sample of (CH3)2PH was purified by cold column
fractionation techniques and handled under vacuum using Teflon greaseless stopcocks. The purified sample was stored at dry ice temperature and passed over LiAlH 4 just prior to its use to remove any water. The Raman spectra were recorded utilizing a Cary Model 82 spectrophotometer equipped with a Spectra Physics Model 171 argon ion laser operating on the 5145-A line. Power at the sample was typically 2 W. The samples were contained at their room temperature vapor pressure of about 1 atm in a quartz cell. The laser light was multipassed using the standard Cary accessory. Frequencies reported for sharp Raman lines in the region of 400-100 cm' 1 are expected to be accurate to ± 1 cm"1.
The infrared spectra were obtained using a Digilab FTS-15B Fourier transform spectrometer. Spectra of the gas at 1 atm were recorded in the far-infrared region 450-80 cm" 1 using a 6.25-|un mylar beam splitter and a 1 2 -cm cell with polyethylene windows. Interferograms obtained after 3000 scans of the sample and empty cell were transformed using a box car apodization function giving 0.5-cm“ 1 resolution. Interfering water vapor bands were subtracted from the final spectrum.
ResultsIn the Raman spectrum (see Figure 1 ) there are four
well-defined lines at 177, 182,188, and 190 cm"1. In the earlier Raman study2 a single line was reported at 190 cm"1, but the instrumental conditions were such that additional transitions would not have been observed. These and other observed transitions in the overtone region near 400 cm" 1
are summarized in Table I. Polarization measurements were attempted but results were scarce and are not tabulated. Clearly the sharp line observed at 190 cm" 1 was polarized, but the others in the series were of undeterminable polarization.
The far-infrared spectrum (see Figure 2) was complicated with water vapor. Numerous drying methods were employed, but the sample or the cell still contained traces
The Journal o f Physical Chemistry, Vol. 81, No. 16, 1977
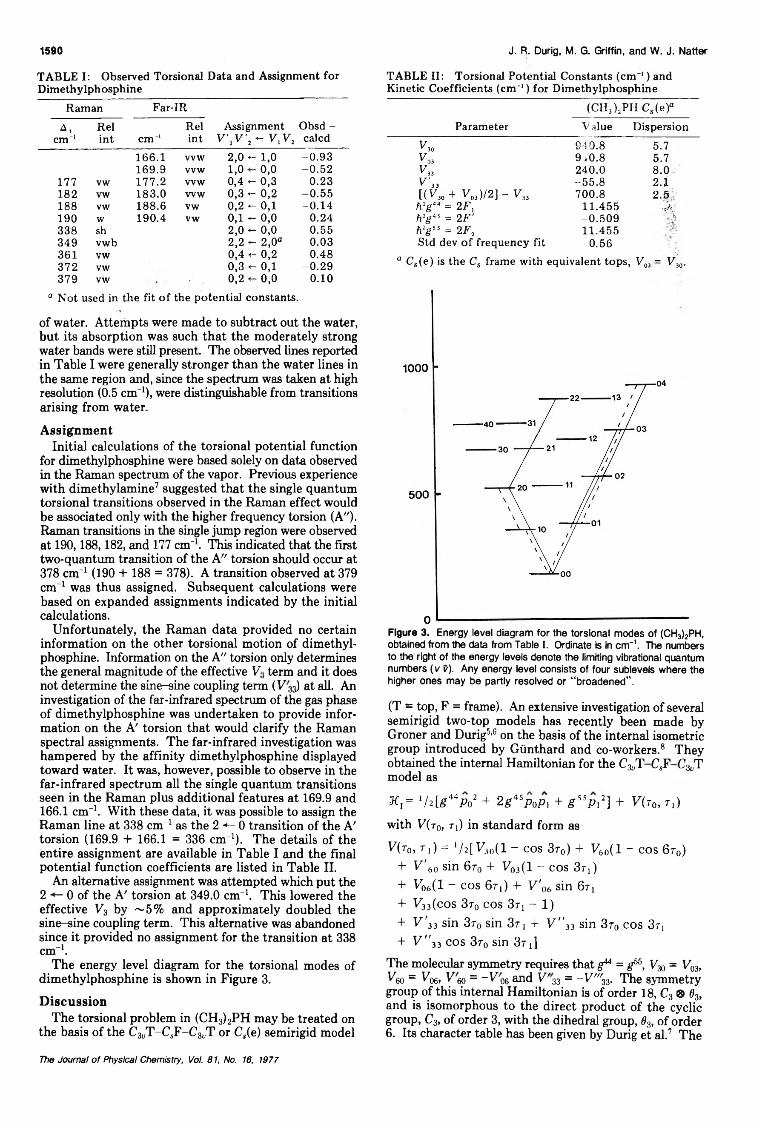
TABLE I: Observed Torsional Data and Assignment for Dimethylphosphine
Raman Far-IR
1590
A , Rei Rei Assignment Obsd -cm“1 int cm“1 int V ' l V '2 * - V lV 1 caled
166.1 vvw 2,0 «- 1,0 -0 .93169.9 vvw 1 ,0 0,0 -0 .52
177 vw 177.2 vvw 0,4 <- 0,3 0.23182 vw 183.0 ww 0,3 *- 0,2 -0 .55188 vw 188.6 vw 0,2 «- 0,1 -0 .14190 w 190.4 vw 0,1 <- 0,0 0.24338 sh 2,0 - 0,0 0.55349 vwb 2,2 - 2,0a 0.03361 vw 0,4 <- 0,2 0.48372 vw 0,3 <- 0,1 -0 .29379 vw 0,2 0,0 0.10
0 Not used in the fit o f the potential constants.
of water. Attempts were made to subtract out the water,but its absorption was such that the moderately strong water bands were still present. The observed lines reported in Table I were generally stronger than the water lines in the same region and, since the spectrum was taken at high resolution (0.5 cm“1), were distinguishable from transitions arising from water.
AssignmentInitial calculations of the torsional potential function
for dimethylphosphine were based solely on data observed in the Raman spectrum of the vapor. Previous experience with dimethylamine7 suggested that the single quantum torsional transitions observed in the Raman effect would be associated only with the higher frequency torsion (A"). Raman transitions in the single jump region were observed at 190,188,182, and 177 cm“1. This indicated that the first two-quantum transition of the A" torsion should occur at 378 cm“ 1 (190 + 188 = 378). A transition observed at 379 cm“ 1 was thus assigned. Subsequent calculations were based on expanded assignments indicated by the initial calculations.
Unfortunately, the Raman data provided no certain information on the other torsional motion of dimethylphosphine. Information on the A" torsion only determines the general magnitude of the effective V't term and it does not determine the sine-sine coupling term (V 33) at all. An investigation of the far-infrared spectrum of the gas phase of dimethylphosphine was undertaken to provide information on the A' torsion that would clarify the Raman spectral assignments. The far-infrared investigation was hampered by the affinity dimethylphosphine displayed toward water. It was, however, possible to observe in the far-infrared spectrum all the single quantum transitions seen in the Raman plus additional features at 169.9 and166.1 cm“1. With these data, it was possible to assign the Raman line at 338 cm“ 1 as the 2 *- 0 transition of the A' torsion (169.9 + 166.1 = 336 cm“1). The details of the entire assignment are available in Table I and the final potential function coefficients are listed in Table II.
An alternative assignment was attempted which put the 2 0 of the A' torsion at 349.0 cm“1. This lowered theeffective V3 by ~5% and approximately doubled the sine-sine coupling term. This alternative was abandoned since it provided no assignment for the transition at 338 cm“1.
The energy level diagram for the torsional modes of dimethylphosphine is shown in Figure 3.
DiscussionThe torsional problem in (CH3)2PH may be treated on
the basis of the C3ljT-CsF-C3„T or Cs(e) semirigid model
J. R. Durig, M. G, Griffin, and W. J. Natter
TABLE II: Torsional Potential Constants (cm 1 ) and Kinetic Coefficients (cm-1 ) for Dimethylphosphine
Parameter(CH3)2PH Cs(e)°
Value Dispersion
Fso 940.8 5.703 9 ±0.8 5.733 240.0 8.0
V „ -55 .8 2.1[(V * + V„,)/2] - V33 700.8 2.5ft2g44 = 2F, 11.455 ■hh2g 4 s = 2 F ’ -0 .509 ““•is,h2gSS = 2F2 11.455Std dev o f frequency fit 0.56
a Cs(e) is the Cs frame with equivalent tops, V03 - V M.
Figure 3. Energy level diagram for the torsional modes of (CH3)2PH, obtained from the data from Table I. Ordinate is in cm“1. The numbers to the right of the energy levels denote the limiting vibrational quantum numbers (v v). Any energy level consists of four sublevels where the higher ones may be partly resolved or “ broadened” .
(T = top, F = frame). An extensive investigation of several semirigid two-top models has recently been made by Groner and Durig5,6 on the basis of the internal isometric group introduced by Günthard and co-workers. 8 They obtained the internal Hamiltonian for the g&t g,f G^T model as
K t = l h [ g 44p 02 + 2 g 4sp 0p i + g S5p ! 2] + V ( t0, Ti )
with V {t0, t 1) in standard form as
V ( t0, rj) = l/2[V30(l - cos 3r0) + V60( l - cos 6r0)+ V 6o sin 6r0 + Vo3( l - cos 3ri)+ V06( l ~ cos 6rj) + V'06 sin 6tí + V33(cos 3r0 cos 3t] - 1 )+ V'33 sin 3r0 sin 3rj + V ''33 sin 3t0 cos 37t + V "33 cos 3t0 sin 3r 1 ]
The molecular symmetry requires that g u = g55, V?fi = V03, V30 = V*. Veo = -V 06 and V"33 = -V"'33. The symmetry group of this internal Hamiltonian is of order 18, C3 ® 03, and is isomorphous to the direct product of the cyclic group, Cs, of order 3, with the dihedral group, 03, of order6 . Its character table has been given by Durig et al. 7 The
The Journal o f Physical Chemistry, Voi 81, No. 16, 1977
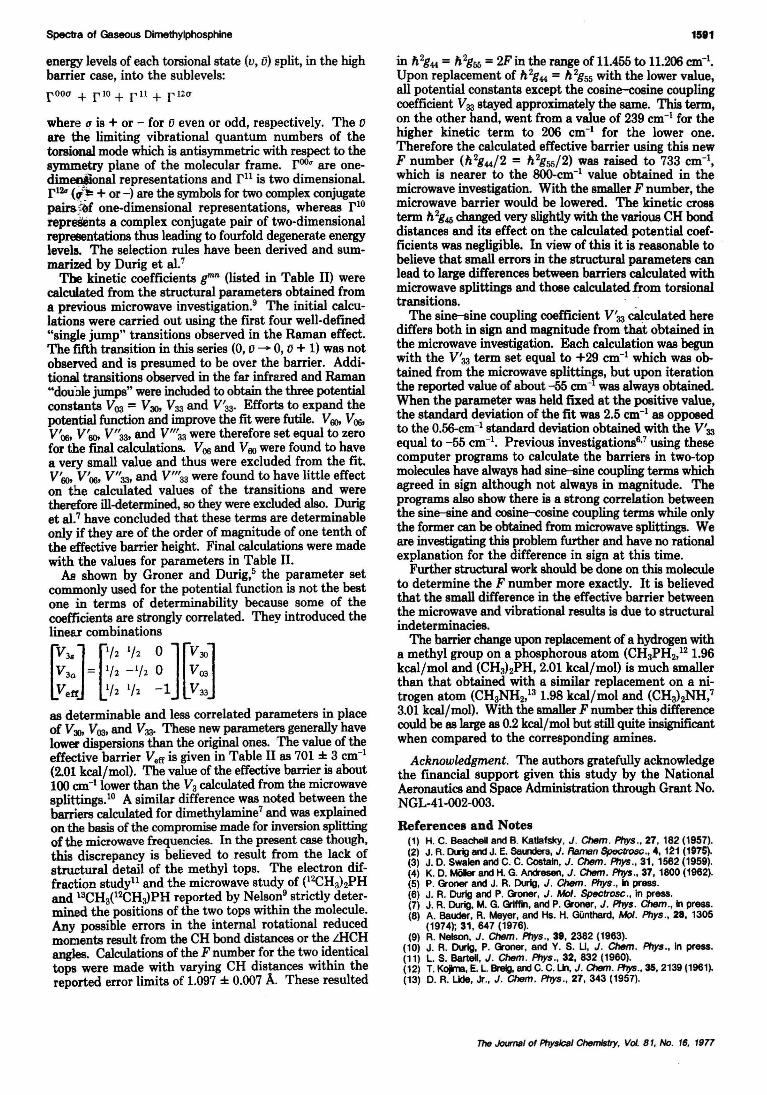
Spectra of Gaseous Dlmethylphosphine
energy levels of each torsional state (v, 0) split, in the highbarrier case, into the sublevels:
r OOQ + rio + r ll + r l2Q
where (f is + or - for 0 even or odd, respectively. The 0are the limiting vibrational quantum numbers of thetorsional mode which is antisymmetric with respect to thesymmetry plane of the molecular frame. roo" are onedim~nal representations and I'll is two dimensionalr l2a (If): + or -) are the symbols for two complex conjugatepairsfof one-dimensional representations, whereas 1'10represents a complex conjugate pair of two-dimensionalrepreeentations thus leading to fourfold degenerate energylevelS. The selection rules have been derived and summarized by Durig et al.7
The kinetic coefficients gmn (listed in Table II) werecalculated from the structural parameters obtained from8 previous microwave investigation.9 The initial calculations were carried out using the first four well-dermed"single jump" transitions observed in the Raman effect.The fifth transition in this series (0, 0 -. 0, 0 + 1) was notobserved and is presumed to be over the barrier. Additional transitions observed in the far infrared and Raman"douole jumps" were included to obtain the three potentialconstants V03 = V3O> V33 and V'33' Efforts to expand theJXltential function and improve the fit were futile. V00. V00,
V~, V'6Qt V"33, and V"'aa were therefore set equal to zerofor the final calculations. V00 and V60 were found to havea very small value and thus were excluded from the fit.Voo. V'oo, V"33, and V"'33 were found to have little effecton the calculated values of the transitions and weretherefore ill-determined, so they were excluded also. Duriget al.7 have concluded that these terms are determinableonly if they are of the order of magnitude of one tenth ofthe effective barrier height. Final calculations were madewith the values for parameters in Table II.
AB shown by Groner and Durig,5 the parameter setcommonly used for the potential function is not the bestone in terms of determinability because some of thecoefficients are strongly correlated. They introduced thelinear combinations
r~::]= [:~: ~:12 ~ ][~:]L~eff liz 1/2 -1 V 33
as determinable and less correlated parameters in placeof V00> V03, and V33' These new parameters generally havelowel' dispersions than the original ones. The value of theeffective barrier Veff is given in Table II as 701 :I:: 3 cm-1
(2.01 kcal/mol). The value of the effective barrier is about100 em-I lower than the Va calculated from the microwavesplittings.1o A similar difference was noted between thebarriers calculated for dimethylamine7and was explainedon the basis of the compromise made for inversion splittingof the microwave frequencies. In the present case though,this discrepancy is believed to result from the lack ofstructural detail of the methyl tops. The electron diffraction studyll and the microwave study of (lZCHahPHand laCHa(12CH;JPH reported by Nelson9 strictly determined the positions of the two tops within the molecule.Any possible errors in the internal rotational reducedmoments result from the CH bond distances or the LHCHangles. Calculations of the F number for the two identicaltops were made with varying CH distances within thereported error limits of 1.097 :I:: 0.007 A. These resulted
1511
in h 2g44 =h 2g55 =2F in the range of 11.455 to 11.206 em-I.Upon replacement of h 2g44 = h 2g55 with the lower valueall potential constants except the cosine-c08ine couplin~coefficient V33 stayed approximately the same. This term,on the other hand, went from a value of 239 cm-1for thehigher kinetic term to 206 cm-1 for the lower one.Therefore the calculated effective barrier using this newF number (h 2g44/2 = h 2g55/2) was raised to 733 cm-1which is nearer to the 8O()..cm-1 value obtained in th~microwave investigation. With the smaller F number themicrowave barrier would be lowered. The kinetic ~r088term h 2g45 changed very slightly with the various CH bonddistances and its effect on the calculated potential coefficients was negligible. In view of this it is reasonable tobelieve that small errors in the structural parameters canlead to large differences between barriers calculated withmicrowave splittings and those calculatedfrom torsionaltransitions. .
The sine--sine coupling coefficient V'33 c8J.culated herediffers both in sign and magnitude from that obtained inthe microwave investigation. Each calculation was begunwith the V'33 term set equal to +29 cm-1 which was obtained from the microwave splittings, but upon iterationthe reported value of about -55 em-I was always obtained.When the parameter was held fixed at the positive valuethe standard deviation of the fit was 2.5 em-I as opposedto the 0.56-cm-1standard deviation obtained with the V'33equal to -55 em-I. Previous investigations6,7 using thesecomputer programs to calculate the barriers in two-topmolecules have always had sine--sine coupling terms whichagreed in sign although not always in magnitude. Theprograms also show there is a strong correlation betweenthe sine--sine and cosine-cosine coupling terms while onlythe former can be obtained from microwave splittings. Weare investigating this problem further and have no rationalexplanation for the difference in sign at this time.
Further structural work should be done on this moleculeto determine the F number more exactly. It is believedthat the small difference in the effective barrier betweenthe microwave and vibrational results is due to structuralindeterminacies.
The barrier change upon replacement of a hydrogen witha methyl group on a phosphorous atom (CHaPH2,12 1.96kcal/mol and (CHa)zPH, 2.01 kcal/mol) is much smallerthan that obtained with a similar replacement on a nitrogen atom (CHa~H2,la1.98 kcal/mol and (CHa)zNH,73.01 kcal/mol). With the smaller F number this differencecould be as!arge as 0.2 kcal/mol but still quite insignificantwhen compared to the corresponding amines.
Acknowledgment. The authors gratefully acknowledgethe financial support given this study by the NationalAeronautics and Space Administration through Grant No.NGL-41-oo2-003.
References and Notes(1) H. C. Beachelland B. Katlafsky. J. Chern. Phys .• 27, 182 (1957).(2) J. R.lMIg lIIld J. E. Sa~, J. Raman Spactrosc.• 4. 121 (1975),(3) J. D. Swalen and C. C. Costaln. J. ChBm. Phys., 31. 1562 (1959).(4) K. D. MOler lIIld H. G. Andresen. J. ChBm. Phys., 37, 1800 (1962).(5) P. Groner and J. R. DurIg, J. ChBm. Phys., in press.(6) J. R. Durlg and P. Groner, J. Mol. Spectrosc., in press.(7) J. R. Duig. M. G. Q1ffil, and P. Groner, J. Phys. Chern., In press.(8) A. Bauder. R. Meyer. and lis. H. GOnthard, Mol. Phys., 28. 1305
(1974); 31, 647 (1976).(9) R. Nelson, J. Chern. Phys., 31, 2382 (1963).
(10) J. R. Duig, P. Groner, and Y. S. U, J. ChBm. Phys., In press.(11) L. S. Bartel, J. ChBm. Phys., 32, 832 (1960).(12) T. Kojrma, E. L Br8Ig,lIIld C. C.li\, J. 0Iem. Phys., 35, 2139 (1961).(13) D. R. LIde, Jr., J. Chern. Phys., 27, 343 (1957).
The Journal of Physlcsl Chemistry, Vol. 81, No. 16, 1977

1592 Suzuki et ai.
The F luorescen t Leve l Inversion of Dual F luorescences and the M otional
Relaxation of Excited S tate M olecu les in Solutions
Satoshi Suzuki,* Tsuneo Fuji!, Aklhlro Imai,1 and Hldeo Akahorl2
Department o f Industrial Chemistry, Faculty o f Engineering, Shinshu University, Wakasato, Nagano, Japan (Received February 1, 1977)
The temperature dependence of the fluorescence of 1-naphthol, indole, 1-naphthonitrile, and 1-naphthylamine in propylene glycol over the temperature range 320-170 K and of 1-naphthol and indole in glycerin over the temperature range 350-200 K has been studied. These compounds all emit a broad structureless fluorescence spectrum at room temperature. Lowering the temperature blue shifts the fluorescence and structures it except for 1-naphthylamine. These observed spectral changes have been interpreted using fluorescence polarization spectra as being due to the fluorescent level inversion of dual fluorescences. From the temperature dependence of the degree of polarization, the motional relaxation of excited state molecules in solutions has been estimated. It is concluded that fluorescent level inversion may occur at temperature ranges where the solute molecules cannot translate or rotate to any appreciable extent in solution.
IntroductionThe dual fluorescences caused by environmental per
turbations have been reported for other compounds, since Lippert et al.3,4 observed dual fluorescences in p-di- methylaminobenzonitrile and p-diethylaminobenzonitrile. Indole,5-8 1-naphthylamine,9 and 1-naphthol10 exhibit dual fluorescences in a series of dilute solutions in which the solvent polarity varies, however, doubts have been raised on the dual fluorescences of p-dimethylaminobenzo- nitrile,11-13 indole,14 and 1-naphthylamine.15 Suzuki et al.16 have observed fluorescent level inversion of dual fluorescences in alcoholic solutions of 1-naphthol by a change in temperature only.
These results can be interpreted in the following way. These molecules have two electronic states, 'L b and 'La, in the region of their lowest absorption band. The 'La state lies above 'Lb in free molecules, but these states do lie close to each other. In fluid soltions at room temperature, the solvent molecules around the excited solute molecule will generally have time to reorient themselves before light emission occurs and hence they relax to their preferred equilibrium configuration which is of lower energy. In nonpolar solvents, the 'La states of these molecules still lie above 'Lb even in the preferred equilibrium configuration and hence fluorescence occurs from the 'Lb state. In polar solvents, the interaction between dipole moments of such excited molecules and solvent molecules lowers the energy of the 'L a state below that of 'L b in their equilibrium configuration, and hence fluorescence occurs from the 'L a state.
At sufficiently low temperatures and high viscosities, the relaxation processes which lead to an equilibrium configuration will not occur to any appreciable extent during the lifetime of the excited state, and therefore emission will take place from an unrelaxed configuration. Such a dynamic equilibrium among various solute-solvent configurations depends on the motional relaxation during the fluorescence lifetime, and it is modified by a change in temperature and/or viscosity. It has been observed that1-naphthol in propylene glycol emits a broad structureless fluorescence spectrum at room temperature, while it emits a structured one at low temperatures.16 These results have been satisfactorily interpreted as being due to fluorescent level inversion of dual fluorescences on the basis of the method of photoselection.17-20
Favro21 derived the diffusion equation for anisotropic rotational Brownian motion. Chuang and Eisenthal have
solved the equation and have obtained general expressions for time-dependent fluorescence polarization.22 Labhart and Pantke23’24 applied these general expressions to molecules of such symmetry in which the principal axes of the diffusion tensor coincide with the possible directions of the transition moments and to a steady state experiment. From the temperature dependence of the degree of fluorescence polarization upon exciting the molecules into two perpendicularly polarized transitions, Labhart and Pantke evaluated the principal values of the rotational diffusion tensor of perylene and 9,10-dimethylanthracene in their excited states.
This paper will report on the study of fluorescent level inversion of dual fluorescences for 1-naphthol, indole,1-naphthonitrile, and 1-naphthylamine in alcoholic solvents by varing temperature and/or viscosity and w ill discuss the motion of excited state molecules in solutions during the process of the fluorescent level inversion.
Experimental SectionIndole, 1-naphthol, 1-naphthonitrile, and 1-naphthyl-
amine were purified by repeated recrystallization and then sublimed in vacuo. Propylene glycol and glycerin were stored over molecular sieves 3A and further purified by passage through silica gel. It was confirmed that no fluorescent impurity was detectable under present experimental conditions. The absorption spectra were recorded on a Hitachi EPS-3 recording spectrophotometer. The fluorescence and excitation spectra were obtained by means of Hitachi MPF-2A fluorescence spectrophotometer. The temperature was controlled by using a metal cryostat (Torisha Laboratory, Ltd.). The degree of polarization, P, was measured by the method of photoselection.17-20 The fluorescence lifetime of 1-naphthonitrile was measured by the pulse-sampling method.25
ResultsIn Figure 1, the temperature dependence of the
fluorescence for 1-naphthol in propylene glycol, and the fluorescence polarization spectra at various temperatures are shown. The absorption spectra of 1-naphthol at various temperatures are shown in Figure 2, together with the fluorescence excitation polarization spectra excited at 325 and 356 nm.
In the region of the lowest absorption band, 1-naphthol has two closely situated absorption bands:26-29 a 'L b band with a fine structure and a broad 'La band at higher
The Journal o f Ffiysical Chemistry, Vol. 81, No. 16, 1977

Motional Relaxation of Excited State Molecules in Solutions 1593
Figure 1. The temperature dependence of the fluorescence (lower) and the fluorescence polarization (upper) spectra of 1-naphthol in propylene glycol. The excitation wavelength was 297 nm: (1) 301 K; (2) 237 K; (3) 214 K; (4) 172 K; (5) 271 K; (6) 243 K; (7) 192 K.
Figure 2. The fluorescence excitation polarization spectra (upper) of 1-naphthol In propylene glycol at 200 K monitored at 325 nm (---) and 356 nm (—). The absorption spectra (tower) of 1-naphthol In propylene glycol at various temperatures: (1) 293.5 K; (2) 210 K; (3) 111 K.
frequencies. The absorption spectrum shows no substantial dependence of the spectral shape on temperature. At room temperature, 1-naphthol in propylene glycol shows a broad fluorescence. When the temperature of the solution is lowered, the fluorescence blue shifts and becomes structured. These emissions differ from that of the na- phtholate anion;30,31 proton dissociation is ruled out as the origin of this spectral change. There is a mirror-symmetry relation between the positions of the peaks of the structured emission with those of the peaks of the absorption spectrum. These findings indicate that the emitting state changes from a broad 'L,, to a structured b-
The fluorescence polarization spectrum at 271 K with an excitation wavelength of 297 nm, which corresponds to the region of xLa, is structureless and has slightly positive P values. As the temperature of the solution is lowered, the value of P increases and minima appear at positions corresponding to the peaks of the structured emission. This implies that the structured component increases with decreasing temperature and it has a transition moment nearly perpendicular to the xLa transition. In other words, the fluorescent level of 1-naphthol in propylene glycol changes from 'La at room temperature to xLb at low temperatures. The fluorescence excitation polarization spectra also support fluorescent level inversion of 1- naphthol. The fluorescence excitation polarization spectrum monitored at 356 nm, which corresponds to the maximum of broad fluorescence, has minima at wavelengths corresponding to the peaks of the band, while
Figure 3. The temperature dependence of Pfor 1-naphthol monitored at 340 nm: (— ) 297-nm excitation in propylene glycol; (---) 240-nm excitation in propylene glycol; (-----) 297-nm excitation in glycerin.
Figure 4. The temperature dependence of the fluorescence (lower) and the fluorescence polarization (upper) spectra of indole in propylene glycol. The excitation wavelength was 270 nm: (1) 301 K; (2) 190 K; (3) 170 K; (4) 112 K; (5) 251 K; (6) 170 K.
the spectrum monitored at 325 nm, which corresponds to the peak of the structured fluorescence, has slightly negative P values in the region of the JLa absorption band. This indicates that the structured fluorescence has a transition moment nearly perpendicular to the xLa transition.
Figure 3 shows the temperature dependence of P for1-naphthol in propylene glycol observed at 340 nm when excited at 297 and 240 nm. P increases with a decrease in temperature due to the depletion of rotational depolarization when excited at 297 nm. After P reaches its maximum at about 230 K, it decreases and then becomes constant below 200 K. The decrease of P near 220 K is attributed to fluorescent level inversion, since the fluorescence spectra change markedly in the temperature range 230-210 K (see Figure 1). Once P reaches a constant at about 230 K, it then again increases to a second constant below 200 K when excited at 240 nm.
In glycerin, the fluorescence spectra of 1-naphthol show an analogous temperature dependence, except that the spectral change occurs at higher temperatures in glycerin than in propylene glycol. The temperature dependence of P for 1-naphthol in glycerin shown in Figure 3 is analogous to that in propylene glycol, but the curve is shifted toward higher temperature. This shift may be explained by the difference in viscosity between propylene glycol and glycerin (see below).
The analogous experimental results for indole in propylene glycol are shown in Figures 4-6. Indole also has two closely situated excited states in the region of its lowest absorption band.8,32,33 Lowering the temperature shifts the
The Journal o f Physical Chemistry, Vol. 81, No. 16, 1977

1594 Suzuki et al.
Figure 5. The fluorescence excitation polarization spectra (upper) of indole in propylene glycol at 195 K monitored at 310 nm. The absorption spectra (lower) of indole in propylene glycol at room temperature.
Figure 6. The temperature dependence of the degree of fluorescence polarization of indole in propylene glycol (—) and glycerin (-•-•)- The excitation wavelength was 270 nm; the wavelength monitored was 310 nm.
Figure 7. The temperature dependence of the fluorescence (lower) and the fluorescence polarization (upper) spectra of 1-naphthonitrile in propylene glycol. The excitation wavelength was 295 nm: (1) 291 K; (2) 226 K; (3) 132 K; (4) 263 K; (5) 208 K; (6) 208 K, 323-nm excitation.
fluorescence spectra of indole to higher frequencies. The absorption polarization spectrum monitored at 310 nm has minima at wavelengths corresponding to the peaks of the structured absorption band. The temperature dependence of P in propylene glycol and glycerin shown in Figure 6 is quite analogous to that of 1-naphthol. These findings support the fluorescent level inversion of dual fluorescences in indole as well as in 1-naphthol.
The temperature dependence of the fluorescence for1-naphthonitrile in propylene glycol is shown in Figure 7. The fluorescence of 1-naphthonitrile is broad and structureless at 291 K. Lowering the temperature blue shifts the fluorescence and it becomes structureless. The temperature dependence of the fluorescence for 1-
The Journal o f Physical Chemistry, Vol. 81, No. 16, 1977
Figure 8. The fluorescence excitation polarization spectra (upper) of 1-naphthonitrile in propylene glycol at 208 K: (1) 323-nm excitation; (2) 344-nm excitation. The absorption spectra (lower) of 1-naphthonitrile in propylene glycol at room temperature.
Figure 9. The temperature dependence of the fluorescence spectra (lower) of 1-naphthylamine in propylene glycol. The excitation wavelength was 310 nm: (1) 252 K; (2) 219 K; (3) 191 K; (4) 77 K. The fluorescence polarization spectra (upper) of 1-naphthylamine in propylene glycol: (5) 213 K, 255-nm excitation; (6) 130 K, 320-nm excitation.
naphthonitrile is quite analogous to that of 1-naphthol. In the fluorescence polarization spectrum at 208 K, minima appear at wavelengths corresponding to the peaks of the structured fluorescence. MO calculation shows that 1- naphthonitrile has xLb and xLa states in the region of the lowest absorption band.34 This predicts the occurrence of fluorescent level inversion in 1-naphthonitrile as well as in 1-naphthol. The fluorescence and fluorescence excitation polarization spectra are shown in Figure 8, together with the absorption spectrum at room temperature. Figure 8, as well, shows that the two states participating in dual fluorescence have transition moments nearly parallel with each other.
The temperature dependence of the fluorescence of 1-naphthylamine is shown in Figure 9. The fluorescence of 1-naphthylamine also shows a large blue shift, but no fine structured fluorescence appears with a decrease in temperature. The fluorescence excitation polarization spectra are shown in Figure 10, together with the absorption spectrum at room temperature. The fluorescence excitation polarization spectrum monitored at 420 nm, which corresponds to the peak of the room-temperature component of the fluorescence, has a minimum near the shoulder at 30 000 cm'1. This shoulder has been assigned to 'Li,;26 this indicates that the fluorescent state is indeed the !La state at room temperature. Figure 11 shows the temperature dependence of P at 255- and 350-nm excitation. P reaches its maximum and then decreases to a constant on lowering the temperature. This behavior is quite analogous to that of 1-naphthol. These findings
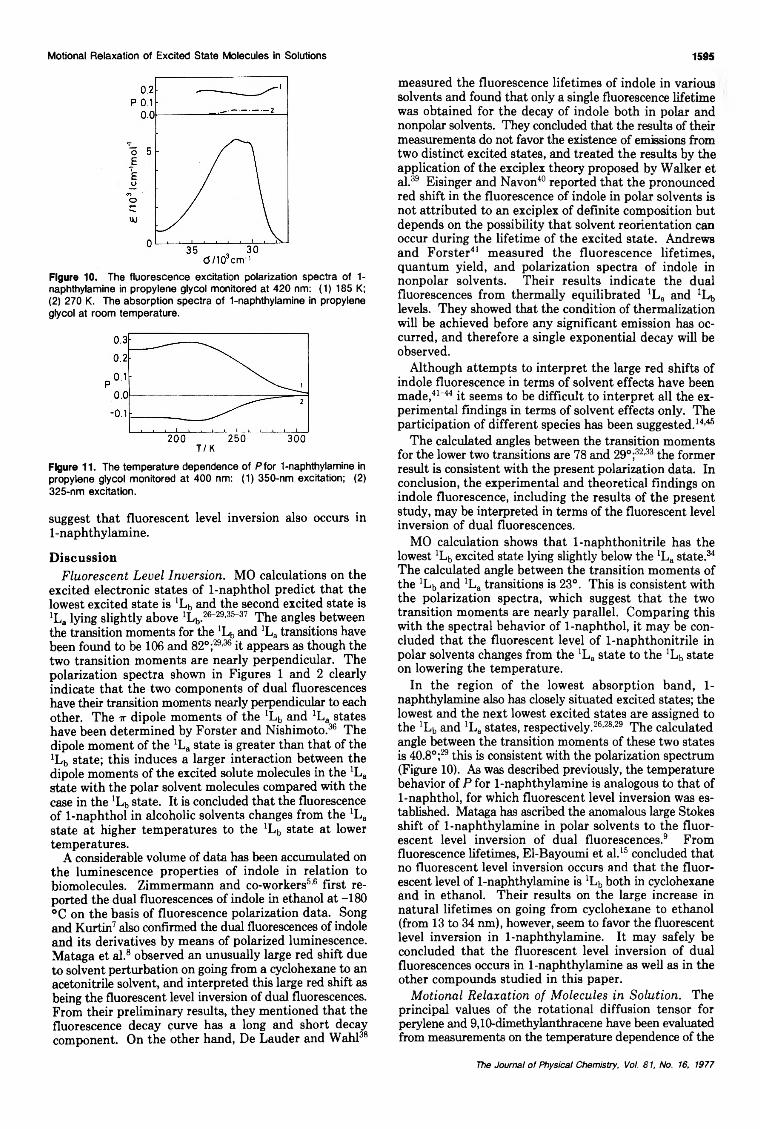
Motional Relaxation of Excited State Molecules in Solutions 1595
Figure 10. The fluorescence excitation polarization spectra of 1- naphthylamine in propylene glycol monitored at 420 nm: (1) 185 K; (2) 270 K. The absorption spectra of 1-naphthylamlne in propylene glycol at room temperature.
Figure 11. The temperature dependence of Pfor 1-naphthylamine in propylene glycol monitored at 400 nm: (1) 350-nm excitation: (2) 325-nm excitation.
suggest that fluorescent level inversion also occurs in 1-naphthylamine.
DiscussionFluorescent Level Inversion. MO calculations on the
excited electronic states of 1-naphthol predict that the lowest excited state is xLb and the second excited state is xLa lying slightly above t,.26-29,35-37 The angles between the transition moments for the xLb and xLa transitions have been found to be 106 and 82° j29,36 it appears as though the two transition moments are nearly perpendicular. The polarization spectra shown in Figures 1 and 2 clearly indicate that the two components of dual fluorescences have their transition moments nearly perpendicular to each other. The ir dipole moments of the xLb and xLa states have been determined by Forster and Nishimoto.36 The dipole moment of the xLa state is greater than that of the xLb state; this induces a larger interaction between the dipole moments of the excited solute molecules in the xLa state with the polar solvent molecules compared with the case in the xLb state. It is concluded that the fluorescence of 1-naphthol in alcoholic solvents changes from the xLa state at higher temperatures to the xLb state at lower temperatures.
A considerable volume of data has been accumulated on the luminescence properties of indole in relation to biomolecules. Zimmermann and co-workers5,6 first reported the dual fluorescences of indole in ethanol at -180 °C on the basis of fluorescence polarization data. Song and Kurtin7 also confirmed the dual fluorescences of indole and its derivatives by means of polarized luminescence. Mataga et al.8 observed an unusually large red shift due to solvent perturbation on going from a cyclohexane to an acetonitrile solvent, and interpreted this large red shift as being the fluorescent level inversion of dual fluorescences. From their preliminary results, they mentioned that the fluorescence decay curve has a long and short decay component. On the other hand, De Lauder and Wahl38
measured the fluorescence lifetimes of indole in various solvents and found that only a single fluorescence lifetime was obtained for the decay of indole both in polar and nonpolar solvents. They concluded that the results of their measurements do not favor the existence of emissions from two distinct excited states, and treated the results by the application of the exciplex theory proposed by Walker et al.39 Eisinger and Navon40 reported that the pronounced red shift in the fluorescence of indole in polar solvents is not attributed to an exciplex of definite composition but depends on the possibility that solvent reorientation can occur during the lifetime of the excited state. Andrews and Forster41 measured the fluorescence lifetimes, quantum yield, and polarization spectra of indole in nonpolar solvents. Their results indicate the dual fluorescences from thermally equilibrated xLa and xLb levels. They showed that the condition of thermalization will be achieved before any significant emission has occurred, and therefore a single exponential decay will be observed.
Although attempts to interpret the large red shifts of indole fluorescence in terms of solvent effects have been made,41'44 it seems to be difficult to interpret all the experimental findings in terms of solvent effects only. The participation of different species has been suggested.14'45
The calculated angles between the transition moments for the lower two transitions are 78 and 29°;32,33 the former result is consistent with the present polarization data. In conclusion, the experimental and theoretical findings on indole fluorescence, including the results of the present study, may be interpreted in terms of the fluorescent level inversion of dual fluorescences.
MO calculation shows that 1-naphthonitrile has the lowest xLb excited state lying slightly below the xLa state.34 The calculated angle between the transition moments of the xLb and xLa transitions is 23°. This is consistent with the polarization spectra, which suggest that the two transition moments are nearly parallel. Comparing this with the spectral behavior of 1-naphthol, it may be concluded that the fluorescent level of 1-naphthonitrile in polar solvents changes from the xLa state to the xLb state on lowering the temperature.
In the region of the lowest absorption band, 1- naphthylamine also has closely situated excited states; the lowest and the next lowest excited states are assigned to the xLb and xLa states, respectively.26,28,29 The calculated angle between the transition moments of these two states is 40.8° s29 this is consistent with the polarization spectrum (Figure 10). As was described previously, the temperature behavior of P for 1-naphthylamine is analogous to that of 1-naphthol, for which fluorescent level inversion was established. Mataga has ascribed the anomalous large Stokes shift of 1-naphthylamine in polar solvents to the fluorescent level inversion of dual fluorescences.9 From fluorescence lifetimes, El-Bayoumi et al.15 concluded that no fluorescent level inversion occurs and that the fluorescent level of 1-naphthylamine is xLb both in cyclohexane and in ethanol. Their results on the large increase in natural lifetimes on going from cyclohexane to ethanol (from 13 to 34 nm), however, seem to favor the fluorescent level inversion in 1-naphthylamine. It may safely be concluded that the fluorescent level inversion of dual fluorescences occurs in 1-naphthylamine as well as in the other compounds studied in this paper.
Motional Relaxation of Molecules in Solution. The principal values of the rotational diffusion tensor for perylene and 9,10-dimethylanthracene have been evaluated from measurements on the temperature dependence of the
The Journal o f Physical Chemistry, Vol. 81, No. 16, 1977

1596 Suzuki et al.
Figure 12. The log (77jj) plots against log (1/ T) for propylene glycol (1), glycerin, and deuterated glycerin (2). The dashed curve indicates the estimated curve by extrapolation.
degree of fluorescence polarization.23 Perylene and9,10-dimethylanthracene have the principal axes of the diffusion tensor coinciding with the possible directions of the transition moments. The transition moments for the
and lha transitions of the molecules studied in this paper do not always lie perpendicular to each other, and further the directions of these moments do not necessarily coincide with the principal axes of the diffusion tensor. It is therefore difficult to determine the three principal values for the rotational diffusion tensor of these molecules.
In the case of isotropic diffusion corresponding to spherical molecules, rotation along any axis has the same diffusion constant, D, and only one constant characterizes the rotational diffusion. Chuang and Eisenthal22 obtained the following expression for isotropic diffusion:P '1- 1 /3 = (Po“1- >/3)(l+ 6Dr) (1)
P0-1 - V3 = 10/3(cos2 X - l) '1 (2)where r is the lifetime and X is the angle between the absorption and emission dipoles. P0 corresponds to the limiting value of P in the absence of rotational diffusion, and hence P0 can be obtained experimentally as the maximum value of P at lower temperatures. Equation 1 can be put in the form:D = (P0 - P)/5Dr (3)From the observed value of P at any temperature and P0, one may obtain D for each temperature, provided the lifetime r is known. The fluorescence lifetimes in ethanol46 are as follows: r(l-naphthol) = 7.5 ns, T(indole) = 4.6 ns, and r(l-naphthylamine) = 6.0 ns, and the recently measured fluorescence lifetime of 1-naphthonitrile is r(l- naphthonitrile) = 6.5 ns.
It has been found that rotational diffusion constants are proportional to T/ ij over a considerable range of viscosity tj.24,47.4« Thus one may assume that
D = d(T/ri) (4)where the proportionality constant d does not depend on temperature. The rotational diffusion parameters for each temperature may be evaluated from the observed D. The viscosity data are taken from the literature.49'50 As for the region where no observed viscosity data are available, the viscosity is estimated by the extrapolation of the observed data down to lower temperatures (see Figure 12).
The resulting rotational diffusion parameters d for 1-naphthol, indole, 1-naphthonitrile, and 1-naphthylamine in propylene glycol are listed in Table I. The rotational diffusion parameter for 1-naphthol is constant over the range of about 320-240 K. Below 240 K, the error in d will increase, because P approaches P0. Indole and 1- naphthonitrile also have almost constant d values independent of temperature, while d for 1-naphthylamine increases with the decrease in temperature. The increase
TABLE I: The Rotational Diffusion Parameters o f 1-Naphthol, Indole, 1-Naphthonitrile, and 1-Naphthylamine in Propylene Glycol
Rotational diffusion parameter dj 10s P s '1 K '1
1-Naph- T, K thol
1-Naph- thoni-
Indole trile
1-Naphthyl-
amine323 4.56 313 4.56
11.07.46
303 4.56 4.33 11.9293 4.56 3.08 4.97 6.55283 4.56 2.93 3.07 8.57273 4.56 4.04 2.80 6.68263 4.56 4.93 2.65 7.55253 4.56 5.02 2.92 10.3243 4.55 3.25 4.66 26.9233 4.65 2.90 6.70 104
TABLE II: The Rotational Diffusion Parameters of 1-Naphthol and Indole in Glycerin
Rotational diffusion parameter d /1 0 5 P s - ‘ K-
T, K 1-Naphthol Indole353 2.16 7.66343 2.11 7.19333 2.29 6.68323 2.74 6,92313 3.75 8.12303 4.81 8.48293 4.80 7.10
in d of 1-naphthylamine with decreasing temperature indicates that 1-naphthylamine can rotare more easily at lower temperatures. The origin of this anomaly is not known; perhaps it is related to the amino group which has two hydrogen.
The rotational diffusion parameters for perylene and9,10-dimethylanthracene in ethanol obtained by Labhart and Pantke are 9.0 X 10⁵ and 18 X 1G5 P s 1 K 1, respectively.23 Although the indole and naphthalene derivatives that have been studied in the present paper are smaller in molecular size than perylene and 9,10-dimethylanthracene, they have smaller d values compared with those of perylene and 9,10-dimethylanthracence. This suggests that propylene glycol molecules solvate to these solute molecules and then the solvated spheres rotate as a whole. Propylene glycol solvent can self-associate through hydrogen bonding into large hydrogen-bonded networks. This prevents the rotational diffusion of solvated spheres and decreases d.
The rotational diffusion parameters obtained in glycerin are also given for 1-naphthol and indole in Table II. The d is almost constant as in propylene glycol. The d of 1-naphthol in glycerin is less than that in propylene glycol by a factor of 2, while the d of indole in glycerin is greater than that in propylene glycol. This suggests that indole and 1-naphthol differ slightly in the interaction with the solvent.
In the case of isotropic diffusion, the mean square angle(02), determined by a molecular direction at the beginning and end of a time interval t , is given by the following expression:51
<02>=4 Dt (5)
the mean square displacement {x2} is alsc obtained from the mean square angle
Oc2 > = 3 / 2 r2<02> (6)where r is the radius of the molecule assumed to be spherical. From the observed D values, the root mean
The Journal o f Physical Chemistry, Vol. 81, No. 16, 1977
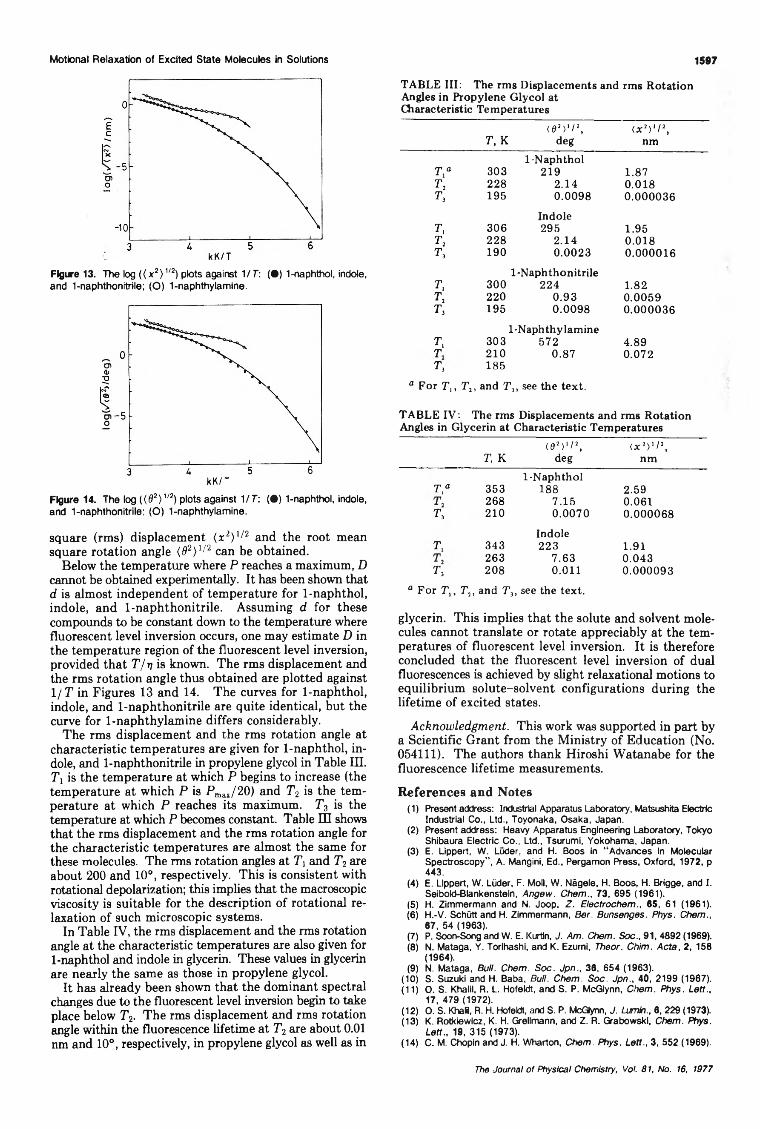
Motional Relaxation of Excited State Molecules in Solutions
Figure 13. The log ( ( x 2) 1'2) plots against 1 IT : ( • ) 1-naphthol, indole, and 1-naphthonitrile; (O ) 1-naphthylamlne.
Figure 14. The log ((0 2) 1/2) plots against 1 /T : ( • ) 1-naphthol, Indole, and 1-naphthonltrile; (O ) 1-naphthylamine.
square (rms) displacement {x2)1/2 and the root mean square rotation angle (92)l/2 can be obtained.
Below the temperature where P reaches a maximum, D cannot be obtained experimentally. It has been shown that d is almost independent of temperature for 1-naphthol, indole, and 1-naphthonitrile. Assuming d for these compounds to be constant down to the temperature where fluorescent level inversion occurs, one may estimate D in the temperature region of the fluorescent level inversion, provided that T /t) is known. The rms displacement and the rms rotation angle thus obtained are plotted against 1/T in Figures 13 and 14. The curves for 1-naphthol, indole, and 1-naphthonitrile are quite identical, but the curve for 1-naphthylamine differs considerably.
The rms displacement and the rms rotation angle at characteristic temperatures are given for 1-naphthol, indole, and 1-naphthonitrile in propylene glycol in Table III. Tl is the temperature at which P begins to increase (the temperature at which P is PmiX/20) and T2 is the temperature at which P reaches its maximum. T3 is the temperature at which P becomes constant. Table III shows that the rms displacement and the rms rotation angle for the characteristic temperatures are almost the same for these molecules. The rms rotation angles at T and T2 are about 200 and 10°, respectively. This is consistent with rotational depolarization; this implies that the macroscopic viscosity is suitable for the description of rotational relaxation of such microscopic systems.
In Table IV, the rms displacement and the rms rotation angle at the characteristic temperatures are also given for 1-naphthol and indole in glycerin. These values in glycerin are nearly the same as those in propylene glycol.
It has already been shown that the dominant spectral changes due to the fluorescent level inversion begin to take place below T2. The rms displacement and rms rotation angle within the fluorescence lifetime at T2 are about 0.01 nm and 10°, respectively, in propylene glycol as well as in
1597
TABLE III: The rms Displacements and rms Rotation Angles in Propylene Glycol at Characteristic Temperatures
T, K(02)1/2,
degU 2)1/ 2,
nm1-NaphtholT o 303 219 1.87
P, 228 2.14 0.018T 195 0.0098 0.000036
IndoleT 306 295 1,95t2 228 2.14 0.018t3 190 0.0023 0.000016
1-NaphthonitrileT, 300 224 1.82Tt 220 0.93 0.0059t3 195 0.0098 0.000036
1-NaphthylamineT, 303 572 4.89T 210 0.87 0.072t3 185
° For T„ Tt , and T3, see the text.
TABLE IV: The rms Displacements and rms RotationAngles in Glycerin at Characteristic Temperatures
(02)1/2, u 2>'/2,T, K deg nm
1-NaphtholT,a 353 188 2.59
268 7.15 0.061t3 210 0.0070 0.000068
IndoleT, 343 223 1.91
263 7.63 0.043t3 208 0.011 0.000093
° For T,, T: , and Tit see the text.
glycerin. This implies that the solute and solvent molecules cannot translate or rotate appreciably at the temperatures of fluorescent level inversion. It is therefore concluded that the fluorescent level inversion of dual fluorescences is achieved by slight relaxational motions to equilibrium solute-solvent configurations during the lifetime of excited states.
Acknowledgment. This work was supported in part by a Scientific Grant from the Ministry of Education (No. 054111). The authors thank Hiroshi Watanabe for the fluorescence lifetime measurements.
References and Notes(1) Present address: Industrial Apparatus Laboratory, Matsushita Electric
Industrial Co., Ltd., Toyonaka, Osaka, Japan.(2) Present address: Heavy Apparatus Engineering Laboratory, Tokyo
Shibaura Electric Co., Ltd., Tsurumi, Yokohama, Japan.(3) E. Llppert, W. Luder, and H. Boos in “ Advances In Molecular
Spectroscopy” , A. Mangini, Ed., Pergamon Press, Oxford, 1972, p 443.
(4) E. Llppert, W. Liider, F. Moll, W. Nägele, H. Boos, H. Brigge, and I. Selbold-Blankensteln, Angew. Chem., 73, 695 (1961).
(5) H. Zimmermann and N. Joop, Z. Electrochem., 65, 61 (1961).(6) H.-V. Schütt and H. Zimmermann, Ber. Bunsenges. Phys. Chem.,
67, 54 (1963).(7) P. Soon-Song and W. E. Kurtin, J. Am. Chem. Soc., 91, 4892 (1969).(8) N. Malaga, Y. Torihashi, and K. Ezurni, Theor. Chim. A cta, 2, 158
(1964).(9) N. Mataga, Bull. Chem. Soc. Jpn., 36, 654 (1963).
(10) S. Suzuki and H. Baba, Bull. Chem. Soc. Jpn., 40, 2199 (1967).(11) O. S. Khalil, R. L. Hofeldt, and S. P. McGIynn, Chem. Phys. Lett.,
17, 479 (1972).(12) O. S. Khalil, R. H. Hofeldt, and S. P. McGIynn, J. Lumin., 6, 229 (1973).(13) K. Rotkiewicz, K. H. Grellmann, and Z. R. Grabowski, Chem. Phys.
Lett., 19, 315 (1973).(14) C. M. Chopin and J. H. Wharton, Chem. Phys. Lett., 3, 552 (1969).
The Journal o l Physical Chemistry, Vol. 81, No. 16, 1977
1598 S. P. Bhattacharyya and M. Chowdhury
(15) M. A. El-Bayoumi, J.-P. Dalle, and M. F. O ’Dwyer, J. Lumin., 1-2, 716 (1970),
(16) S. Suzuki, T. Fuji!, and K. Sato, Bull. Chem. Soc. Jpn., 45, 1937 (1972).
(17) A. C. Albrecht, J. Mol. Spectrosc., 6, 84 (1961).(18) A. K. Kalantarand A. C. Albrecht, Ber. Bunsenges. Phys. Chem.,
68, 361 (1964).(19) F. Dörr, Angew. Chem., 78, 457 (1966).(20) F. Dörr in “Creation and Detection of the Excited State”, Vol. 1, Part
A, A. A. Lamola, Ed., Marcel Dekker, New York, N.Y., 1971, Chapter2.
(21) L. D. Favro, Phys. Rev., 119, 53 (1960).(22) T. J. Chuang and K. B. Elsenthal, J. Chem. Phys., 57, 5094 (1972).(23) H. Labhart and E. R. Pantke, Chem. Phys. Lett., 23, 482 (1973).(24) E. R. Pantke and H. Labhart, Chem. Phys. Lett., 23, 476 (1973).(25) W. R. Ware, ref 20, Chapter 5.(26) H. Baba and S. Suzuki, Bull. Chem. Soc. Jpn., 34, 82 (1961).(27) H. Baba and S. Suzuki, J. Chem. Phys., 35, 1118 (1961).(28) S. Suzuki and H. Baba, Bull. Chem. Soc. Jpn., 37, 519 (1964).(29) S. Suzuki, T. Fujii, and H. Baba, J. Mol. Spectrosc., 47, 243 (1973).(30) D. M. Hercules and L. B. Rogers, Spectrochim. Acta, 15, 393 (1959).(31) D. M. Hercules and L. B. Rogers, J. Phys. Chem., 64, 397 (I960).(32) F. Momicchioli and A. Rastelli, J. Mol. Spectrosc., 22, 310 (1967).(33) E. M. Evleth, Theor. Chim. A cta , 16, 22 (1970).(34) S. Suzuki, T. Fujii, and T. Ishkawa, J. Mol. Spectrosc., 57, 490 (1975).(35) K. Nishimoto, J. Phys. Chem., 67, 1443 (1963).
(36) L. S. Forsterand K. Nishimoto, J. Am. Chem. Soc., 87, 1459 (1965).(37) Y. Tanizaki and S. Kubodera, J. Mol. Spectrosc., 24, 1 (1967).(38) W. B. De Lauder and Ph. Wahl, Biochim. Biophys. A c ta , 243, 153
(1971).(39) M. S. Walker, T. W. Bednar, and R. Lumry, J. Chem. Phys., 45, 3455
(1966); 47, 1020 (1967).(40) J. Eisinger and G. Navon, J. Chem. Phys., 50, 2069 (1969).(41) L. J. Andrews and L. S. Forster, Photochem. Photobiol., 19, 357
(1974).(42) A. Kawski and J. Czajko, Z. Naturforsch. A , 29, 84 (1974).(43) A. Kawski and J. Sepiol, Bull. Acad. Pol. Sei., Ser. S ei. Math.,
Astron. Phys., 20, 707 (1972).(44) C. Cazeau-Dubroca, F. Dupuy, and M. Martinaud, Chem . Phys. Lett.,
23, 397 (1973).(45) E. P. Kirby and R. F. Steiner, J. Phys. Chem., 74, 448b (1970).(46) I. B. Berlman, “Handbook of Fluorescence Spectra of Aromatic
Molecules” , 2nd ed, Academic Press, New York, N.Y., 1971.(47) L. I. Antsiferova, N. N. Korst, V. B. Stryukov, A. N. Ivanova, N. S.
Nazemets, and N. V. Rabin’kina, Mol. Phys., 25, 909 (1973).(48) R. E. D. McClung and D. Kivelson, J. Chem. Phys., 49, 3380 (1968).(49) J. A. Riddick and W. B. Bunger, “Organic Solvents” , 3rd ed, Wi-
ley-Interscience, New York, N.Y., 1970.(50) Landolt-Börnstein Zahlenwerte und Funktionen, II. Band, 5. Teil,
Bandteil a, Transportphänomene I, Springer-Verlag, Berlin, 1969.(51) G. Weber in “Fluorescence and Phosphorescence Analysis” , D. M.
Hercules, Ed., Wiley, New York, N.Y., 1966, Chapter 8.
A M ethod for C alcu lating CND O -M O Bonding Param eters. 1
Sankar Prasad Bhattacharyya
Department o f Chemistry, Presidency College, Calcutta-700073, India
and Mihir Chowdhury*
Department o f Physical Chemistry, Indian Association for the Cultivation o f Science, Jadavpur, Calcutta-700032, India (Received November 10, 1976)
An analysis of the imbalance in the off-diagonal Fock matrix element in the CNDO-MO theory is made. A semitheoretical method for the estimation of the CNDO bonding parameter is developed. The use of a scheme with a nonorthogonalized and an orthogonalized basis set is discussed.
1. Introduction
It is well known that in the CNDO-MO theory, the diagonal elements of the Fock matrix (F CND0) can be easily calculated1*5 by more or less standardized techniques (CNDO/1, CNDO/2, etc.) without adopting any adhoc parametrization. Admitting that the approximations involved are of drastic nature, the numerical effect is, nevertheless, not so severe in the diagonal terms as to cause a collapse of the theory.6 The reasons are not difficult to understand. The F-matrix elements reflect the delicate balance between two sets of terms: the //-matrix elements representing an overall attractive potential and the G- matrix elements offering the counterbalancing repulsive potential. Since similar degrees of approximation are made in both the H and G matrix elements constituting the diagonal element of the F(CNDO) matrix, it is not strained too much, or if strained, all the diagonal terms are affected more or less equally. However, unfortunately, the same is not true for the off-diagonal F,/B(CNDO) term (i j, A B). In the standard CNDO-MO method one writes
F,7AB(CNDO) = Hu( CNDO) + Gl7AB(CNDO) (1) =//,7AB(CNDO) - VzP.^ab0
Thus, while terms containing bicentric overlaps (x,Ax;B) are retained in the H matrix, they are completely removed from the G matrix by enforcing the “ZDO” principle consistently. Thus, the balance, so essential for a correct representation of the effective potential seen by the overlap charge (x AxB), is seriously disturbed. Automatically, therefore, if one attempts to estimate the //,JAB(CNDO) terms, the computed values of the Ft;AB(CNDO) terms would be too negative to represent the effective potential even in an approximately correct way. This is the reason why the FyAB(CNDO) term has to be parameterized, the standard treatment for which is the following:
f;7ab(c n d o ) = i/,7AB(CNDO) - ‘ /2/>,.£ab0
= pA*SijAB- 1hPijgAB= ‘/2(/3A° + (8B°)Si7AB- Vz^. AB0
(2)
/?a° and dB° are the bonding parameters of atoms A and B, respectively, and are estimated by comparing results of ab-initio LCAO-SCF calculations on the relevant diatomic species with the results obtained by making CNDO-MO calculations. The method is surely not un
The Journal o f Physical Chemistry, Voi. 81, No. 16, 1977
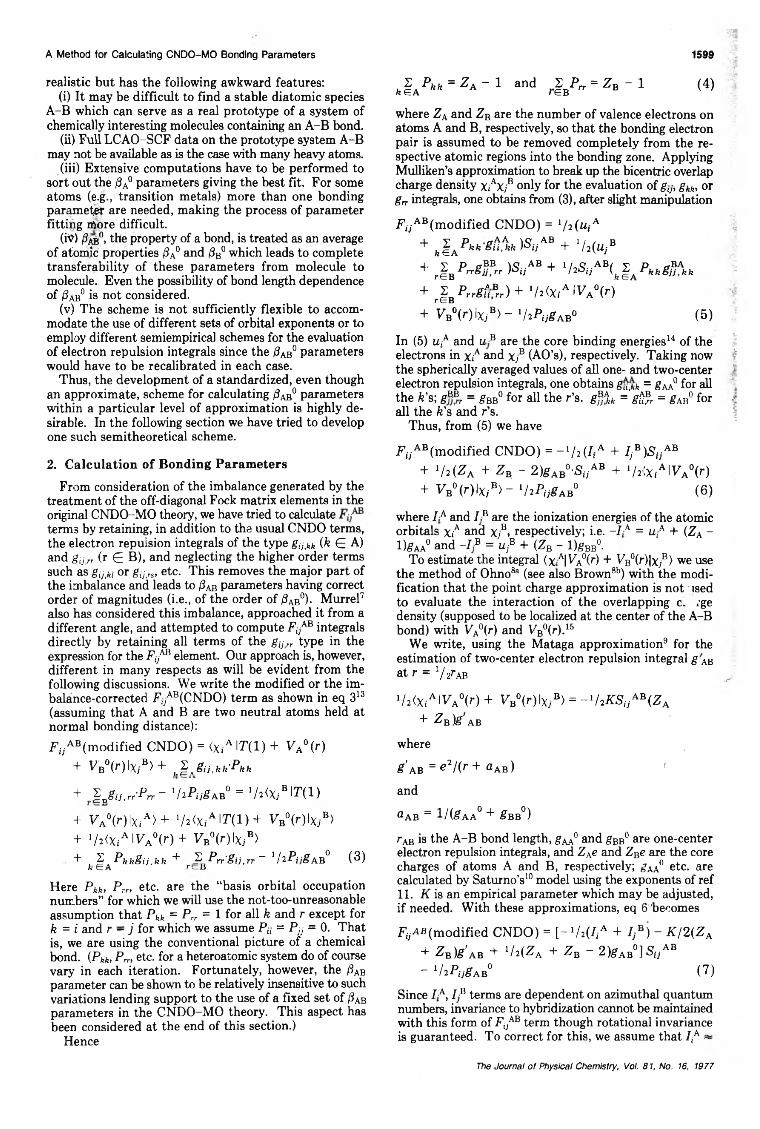
A Method for Calculating CNDO-MO Bonding Parameters 1599
realistic but has the following awkward features:(i) It may be difficult to find a stable diatomic species
A-B which can serve as a real prototype of a system of chemically interesting molecules containing an A-B bond.
(ii) Full LCAO-SCF data on the prototype system A-B may not be available as is the case with many heavy atoms.
(iii) Extensive computations have to be performed to sort out the /SA° parameters giving the best fit. For some atoms (e.g., transition metals) more than one bonding parameter are needed, making the process of parameter fitting iftore difficult.
(iy) ft®0, the property of a bond, is treated as an average of atomic properties /3A° and /3B° which leads to complete transferability of these parameters from molecule to molecule. Even the possibility of bond length dependence of /Sab0 is not considered.
(v) The scheme is not sufficiently flexible to accommodate the use of different sets of orbital exponents or to employ different semiempirical schemes for the evaluation of electron repulsion integrals since the /SAB° parameters would have to be recalibrated in each case.
Thus, the development of a standardized, even though an approximate, scheme for calculating /Sab0 parameters within a particular level of approximation is highly desirable. In the following section we have tried to develop one such semitheoretical scheme.
2. Calculation of Bonding Parameters
From consideration of the imbalance generated by the treatment of the off-diagonal Fock matrix elements in the original CNDO-MO theory, we have tried to calculate terms by retaining, in addition to the usual CNDO terms, the electron repulsion integrals of the type gijtkk (k G A) and gij>rr (r G B), and neglecting the higher order terms such as gij'ki or gi7rs, etc. This removes the major part of the imbalance and leads to /Sab parameters having correct order of magnitudes (i.e., of the order of /3Ab0)- Murrel7 also has considered this imbalance, approached it from a different angle, and attempted to compute Ft;AB integrals directly by retaining all terms of the gy>r type in the expression for the F,/8 element. Our approach is, however, different in many respects as will be evident from the following discussions. We write the modified or the imbalance-corrected FyAB(CNDO) term as shown in eq 313 (assuming that A and B are two neutral atoms held at normal bonding distance):FaAB(modified CNDO) = <x,A IT(1) + VA°(r)
+ VbV )Ix,b> + Jjij.kk-Pkk
+ Ijij^-Prr - 1 hPijgAB° = 1h<XjB\T(l)
+ ^ aV ) I x ,-a >+ 7 *<XiA i r ( i ) + v bV ) I x; b>+ 1h(XiA\VA°{r)+ VB°(r) lXiB>+ X P kkgij,kk + VPrr-gii.rr- 1 hPijg AB° (3)k GA rtB
Here Pkk, Prr, etc. are the “basis orbital occupation numbers” for which we will use the not-too-unreasonable assumption that Pkk = Prr = 1 for all k and r except for k = i and r — j for which we assume Pu = Pjj = 0. That is, we are using the conventional picture of a chemical bond. {Pkk, Pm etc. for a heteroatomic system do of course vary in each iteration. Fortunately, however, the /3Ab parameter can be shown to be relatively insensitive to such variations lending support to the use of a fixed set of /3ab parameters in the CNDO-MO theory. This aspect has been considered at the end of this section.)
Hence
2 Pkk = ZK ~ 1 and 2 P„ = ZB - 1 (4)feGA R reb “ v '
where ZA and ZB are the number of valence electrons on atoms A and B, respectively, so that the bonding electron pair is assumed to be removed completely from the respective atomic regions into the bonding zone. Applying Mulliken’s approximation to break up the bicentric overlap charge density XiAX;B only for the evaluation of glJt gkk, or gn integrals, one obtains from (3), after slight manipulation
F,7AB (modified CNDO) = »/2 (u,A+ kl APkkgfl%k )SijAB + 7 2(Uj*
+ ri BPrrg$Brr )StjAB + 7 ^ AB( J a P fefe Afefe
+ 2 P r r g f i Br r ) + 7 ^ IVA°(r)r G B
+ ^ BV)IX;'B> - 1 h P , j g a b ° (5)
In (5) UjA and u B are the core binding energies14 of the electrons in XiA and x;B (AO’s), respectively. Taking now the spherically averaged values of all one- and two-center electron repulsion integrals, one obtains guM = 8aa° for all the k’s; gBBr = gBB° for all the r’s. gfAkk = g$r = gAB° for all the k's and r’s.
Thus, from (5) we have
F l7AB(modified CNDO) = -7 2(/,A + /¿B)S,7AB + 7 2 {Za + Zb - 2)gAB°-SiiAB + 7r:xiAlVA°(r) + V ji r V x ^ - ' /iP i jg ^ 0 (6)
where I A and I B are the ionization energies of the atomic orbitals XiA and x;B, respectively; i.e. - I A = u;A + (ZA -l)gAA° and -7B = uyB + (ZB - l)gBB°-
To estimate the integral (xA|FA°(r) + VB°(r)|xjB) we use the method of Ohno8a (see also Brown8b) with the modification that the point charge approximation is not ised to evaluate the interaction of the overlapping cl rge density (supposed to be localized at the center of the A-B bond) with VA°{r) and yB°(r).15
We write, using the Mataga approximation9 for the estimation of two-center electron repulsion integral g ab at r = 7 2rAB
72<x«a I a°(7 + VB0{r)\XjB) = -7 iKSuab(Za + & B )g a b
where
g'AB = e 2/ ( r + aAB) '
and
a A B = l / ( g A A ° + g B B ° )
Tab is the A-B bond length, £aa0 and gBB° are one-center electron repulsion integrals, and ZAe and ZBe are the core charges of atoms A and B, respectively; gAA° etc. are calculated by Saturno’s10 model using the exponents of ref11. if is an empirical parameter which may be adjusted, if needed. With these approximations, eq 6'beoomes
F ^ b(modified CNDO) = [~7a(/|A + /;B) - K/2{ZA + ZB)g'AB + 72{Za + ZB - 2)gAB°] S,7ab - 7 2 P Ug A B ° ( 7 )
Since I A, I B terms are dependent on azimuthal quantum numbers, invariance to hybridization cannot be maintained with this form of F,7AB term though rotational invariance is guaranteed. To correct for this, we assume that /¿A ~
The Journal o f Physical Chemistry, Vol. 81, No. 16, 1977
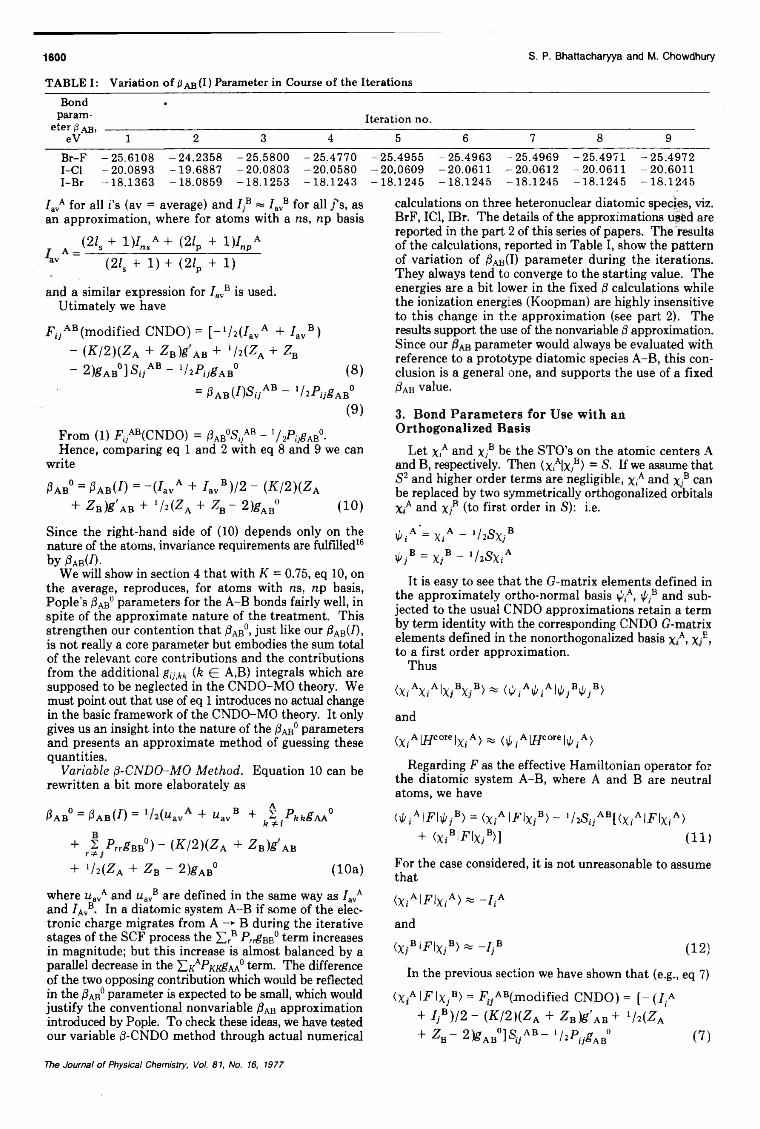
1600 S. P. Bhattacharyya and M. Chowdhury
TABLE I: Variation o f 0a b (I) Parameter in Course o f the IterationsBond
param- Iteration no.eter AB, __—.---------------------------------------------------------------------------------------------
e V l 2 3 4 5 6 7 8 9Br-F -25.6108 -24.2358 -25.5800 -25.4770 -25.4955 -25.4963 -25.4969 -25.4971 -25.4972I-Cl -20.0893 -19.6887 -20.0803 -20.0580 -20.0609 -20.0611 -20.0612 -20.0611 -20.6011I-Br -18.1363 -18.0859 -18.1253 -18.1243 -18.1245 -18.1245 -18.1245 -18.1245 -18.1245
7avA for all i’s (av = average) and 7B ~ 7avB for all ;’s, as an approximation, where for atoms with a ns, np basis
A ( 2 / s + l ) / nsA + ( 2 / p + ! ) / „ /
av (2ZS + 1) + (2/p + 1)
and a similar expression for 7avB is used.Utimately we have
T?i7ab (modified CNDO) = [-1/2(7av A + 7avB)- (K/2)(Za + Z B)g ab + l h ( Z A + Z B
- 2)gAB° ] S iJAB - ViPi^AB0 (8)
= Pab(I)SuAB ~ l/2P,jgAB°(9)
From (1) ZV^CNDO) = /3Ab% ab - '/.2Pij8aeq.Hence, comparing eq 1 and 2 with eq 8 and 9 we can
write
0AB° = Pab(I) = -(4vA + 4vB)/2 - (K!2){Za+ Z B)g'AB + lh ( Z A + Z B - 2 )gAB° ( 1 0 )
Since the right-hand side of (10) depends only on the nature of the atoms, invariance requirements are fulfilled16 by /?ab(7).
We will show in section 4 that with K = 0.75, eq 10, on the average, reproduces, for atoms with ns, np basis, Pople’s (3ab° parameters for the A-B bonds fairly well, in spite of the approximate nature of the treatment. This strengthen our contention that /?ab°> just like our fiAB(I), is not really a core parameter but embodies the sum total of the relevant core contributions and the contributions from the additional gy k (k £ A,B) integrals which are supposed to be neglected in the CNDO-MO theory. We must point out that use of eq 1 introduces no actual change in the basic framework of the CNDO-MO theory. It only gives us an insight into the nature of the /3ab° parameters and presents an approximate method of guessing these quantities.
Variable g-CNDO-MO Method. Equation 10 can be rewritten a bit more elaborately as
Pab° = Pab(I)= + uavB + j t PkkgAA°k i=i
+ r^.PrrgBB°) ~ (^ /2 )(Z A + ZB)g Ab
+ >/2(ZA + ZB - 2)gAB° (10a)
where uavA and uavB are defined in the same way as 7avA and 7avB In a diatomic system A-B if some of the electronic charge migrates from A -»• B during the iterative stages of the SCF process the £ rB PrrgB b ° term increases in magnitude; but this increase is almost balanced by a parallel decrease in the Y.kaPkkSaa° term. The difference of the two opposing contribution which would be reflected in the /3ab° parameter is expected to be small, which would justify the conventional nonvariable $ab approximation introduced by Pople. To check these ideas, we have tested our variable /3-CNDO method through actual numerical
calculations on three heteronuclear diatomic species, viz. BrF, IC1, IBr. The details of the approximations usfed are reported in the part 2 of this series of papers. The results of the calculations, reported in Table I, show the pattern of variation of /8ab(I) parameter during the iterations. They always tend to converge to the starting value. The energies are a bit lower in the fixed g calculations while the ionization energies (Koopman) are highly insensitive to this change in the approximation (see part 2). The results support the use of the nonvariable ¡3 approximation. Since our parameter would always be evaluated with reference to a prototype diatomic species A-B, this conclusion is a general one, and supports the use of a fixed (8ab value.
3. Bond Parameters for Use with an Orthogonalized Basis
Let x;A and x;B be the STO’s on the atomic centers A and B, respectively. Then <XiA|XyB) =8. If we assume that S2 and higher order terms are negligible, x;A and x B can be replaced by two symmetrically orthogonalized orbitals X A and X;B (to first order in S): i.e.
* , A '= XiA - 'ItSxj*
*PjB = XjB - 1/2SXiA
It is easy to see that the G-matrix elements defined in the approximately ortho-normal basis A, 1pf’ and subjected to the usual CNDO approximations retain a term by term identity with the corresponding CNDO G-matrix elements defined in the nonorthogonalized basis xA, xB, to a first order approximation.
Thus
<XiAX,AIX;BX;B> ~ ( t i At i A \'PjB'PjB>
and
<XiAl77corelx,A> * <0iAl77coreli//,A>
Regarding F as the effective Hamiltonian operator for the diatomic system A-B, where A and B are neutral atoms, we have
<*,a IFI^b> = <X,A IflX;8) - 1/2SlVAB[(xiAl i ’lx,A>+ <X,Blii’ IXyB>] ( I D
For the case considered, it is not unreasonable to assume that
<X,-A!F’lx1-A>^-7iA
and
<X; Bm XjB> ~ - 7 ; B (12)
In the previous section we have shown that (e.g., eq 7)
<X A IT IX;8) = F C ^m odified CNDO) = [ - (7,A + IjB)/2 - (K/2)(Za + ZB)g'AB + 1h(ZA + ZB~ 2)£ab0] V B- V ^ -A b0 (7)
The Journal o f Physical Chemistry, Vol. 81, No. 16, 1977
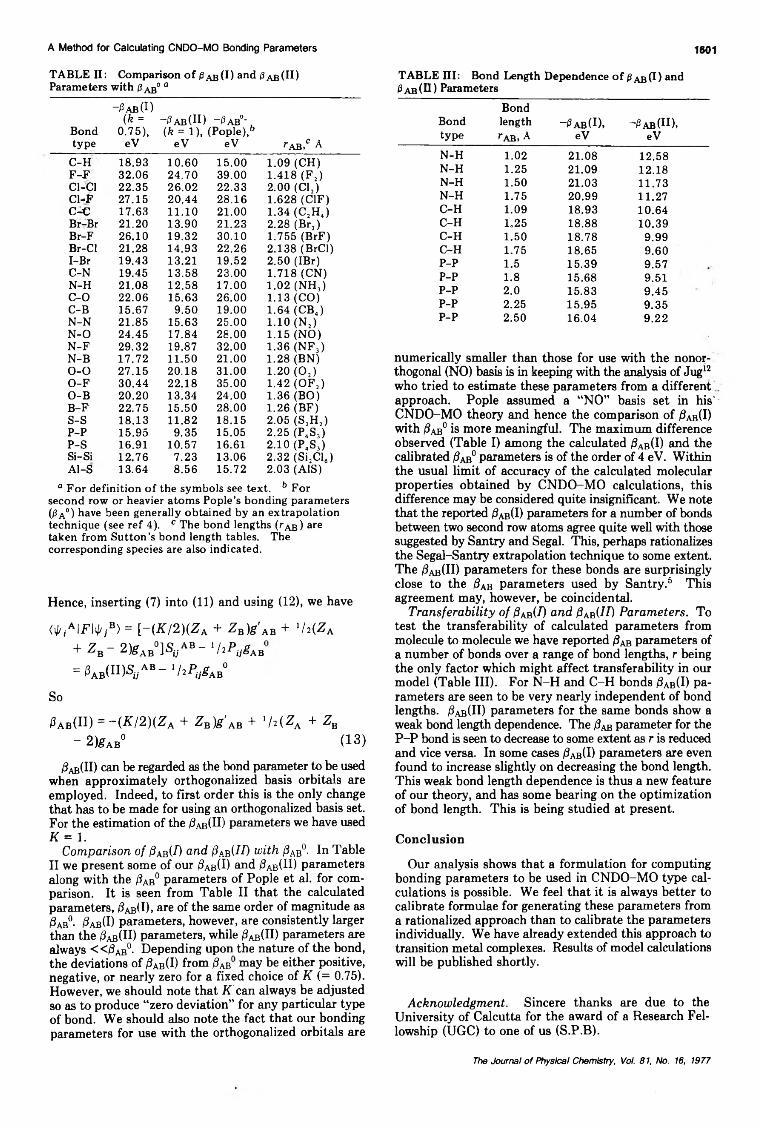
A Method for Calculating CNDO-MO Bonding Parameters 1601
TABLE II: Comparison o f /3a b (I) and 0a b (H)Parameters with 8ab') a
Bondtype
-0 a b (U( * -
0.75),eV
-0AB®) ~0AB°- ( k = 1), (Pople),5
eV eV tab ,0 AC-H 18.93 10.60 15.00 1.09 (CH)F-F 32.06 24.70 39.00 1.418 (F 2)Cl-Cl 22.35 26.02 22.33 2.00 (Cl2)Cl-F 27.15 20.44 28.16 1.628 (C1F)C-C 17.63 11.10 21.00 1.34 (C2H4)Br-Br 21.20 13.90 21.23 2.28 (Br2)Br-F 26.10 19.32 30.10 1.755 (BrF)Br-Cl 21.28 14.93 22.26 2.138 (BrCl)I-Br 19.43 13.21 19.52 2.50 (IBr)C-N 19.45 13.58 23.00 1.718 (CN)N-H 21.08 12.58 17.00 1.02 (NH3)C -0 22.06 15.63 26.00 1.13 (CO)C-B 15.67 9.50 19.00 1.64 (CBJN-N 21.85 15.63 25.00 1.10 (N2)N -0 24.45 17.84 28.00 1.15 (NO)N-F 29.32 19.87 32.00 1.36 (NF3)N-B 17.72 11.50 21.00 1.28 (BN)0 - 0 27.15 20.18 31.00 1.20 ( 0 2)O-F 30.44 22.18 35.00 1.42 (OF2)O-B 20.20 13.34 24.00 1.36 (BO)B-F 22.75 15.50 28.00 1.26 (BF)S-S 18.13 11.82 18.15 2.05 (S2H2)P-P 15.95 9.35 15.05 2.25 (P4S3)P-S 16.91 10.57 16.61 2.10 (P4S3)Si-Si 12.76 7.23 13.06 2,32 (Si2Cl6)Al-S 13.64 8.56 15.72 2.03 (A1S)
a For definition o f the symbols see text. 5 For second row or heavier atoms Pople’s bonding parameters (PA°) have been generally obtained by an extrapolation technique (see ref 4). c The bond lengths (r^s) are taken from Sutton’s bond length tables. The corresponding species are also indicated.
Hence, inserting (7) into (11) and using (12), we have
WSlFli/'j*) = [~(K/2)(Za + Z B)g'AB + >/a(ZA + Z s ~ 2)gAB°]SijAB- l hPugAB
= 0ab(“ )StjAB- lhPijgAB°
So
0ab(H) = - ( K / 2 ) { Z a + Z B)g'AB + lh ( Z A + ZB
~ 2) ab° (13)
/?ab(II) can be regarded as the bond parameter to be used when approximately orthogonalized basis orbitals are employed. Indeed, to first order this is the only change that has to be made for using an orthogonalized basis set. For the estimation of the /3ab(H) parameters we have used K = 1.
Comparison of (Jab® and I3AB(II) with /3AB°- In Table II we present some of our (Jab® and (Jab® ) parameters along with the /Sab0 parameters of Pople et al. for comparison. It is seen from Table II that the calculated parameters, (Jab®> are of the same order of magnitude as /3ab°. (Jab® parameters, however, are consistently larger than the (JAb®) parameters, while (Jab®) parameters are always <<(JAb°- Depending upon the nature of the bond, the deviations of /3Ab® from dm may be either positive, negative, or nearly zero for a fixed choice of K (= 0.75). However, we should note that i f can always be adjusted so as to produce “zero deviation” for any particular type of bond. We should also note the fact that our bonding parameters for use with the orthogonalized orbitals are
TABLE HI: Bond Length Dependence o f /3a b (U and ^a b (H) Parameters
BondBondlength -0AB®> -Pab®),
type rAB, A eV eVN-H 1.02 21.08 12.58N-H 1.25 21.09 12.18N-H 1.50 21.03 11.73N-H 1.75 20.99 11.27C-H 1.09 18.93 10.64C-H 1.25 18.88 10.39C-H 1.50 18.78 9.99C-H 1.75 18.65 9.60P-P 1.5 15.39 9.57P-P 1.8 15.68 9.51P-P 2.0 15.83 9.45P-P 2.25 15.95 9.35P-P 2.50 16.04 9.22
numerically smaller than those for use with the nonor- thogonal (NO) basis is in keeping with the analysis of Jug12 who tried to estimate these parameters from a different approach. Pople assumed a “NO” basis set in his’ CNDO-MO theory and hence the comparison of (Jab® with ab0 is more meaningful. The maximum difference observed (Table I) among the calculated (Sab® and the calibrated (Sab0 parameters is of the order of 4 eV. Within the usual lim it of accuracy of the calculated molecular properties obtained by CNDO-MO calculations, this difference may be considered quite insignificant. We note that the reported (3ab® parameters for a number of bonds between two second row atoms agree quite well with those suggested by Santry and Segal. This, perhaps rationalizes the Segal-Santry extrapolation technique to some extent. The /3ab(H) parameters for these bonds are surprisingly close to the /Sab parameters used by Santry.5 This agreement may, however, be coincidental.
Transferability of /Sab® and dm(//) Parameters. To test the transferability of calculated parameters from molecule to molecule we have reported dm parameters of a number of bonds over a range of bond lengths, r being the only factor which might affect transferability in our model (Table III). For N-H and C-H bonds /Jab® parameters are seen to be very nearly independent of bond lengths. (Jab®) parameters for the same bonds show a weak bond length dependence. The dm parameter for the P-P bond is seen to decrease to some extent as r is reduced and vice versa. In some cases /Jab® parameters are even found to increase slightly on decreasing the bond length. This weak bond length dependence is thus a new feature of our theory, and has some bearing on the optimization of bond length. This is being studied at present.
Conclusion
Our analysis shows that a formulation for computing bonding parameters to be used in CNDO-MO type calculations is possible. We feel that it is always better to calibrate formulae for generating these parameters from a rationalized approach than to calibrate the parameters individually. We have already extended this approach to transition metal complexes. Results of model calculations will be published shortly.
Acknowledgment. Sincere thanks are due to the University of Calcutta for the award of a Research Fellowship (UGC) to one of us (S.P.B).
The Journal o f Physical Chemistry, Vol. 81, No. 16, 1977

1602 S. P. Bhattacharyya and M. Chowdhury
References and Notes(1) J. A. Pople, D. P. Santry, and J. Chem. Phys., 43, S129 (1965).(2) J. A. Pople and G. A. Segal, J. Chem. Phys., 43, S136 (1965).(3) J. A. Pople and G. A. Segal, J. Chem. Phys., 44, 3289 (1966).(4) D. P. Santry and G. A. Segal, J . Chem. Phys., 47, 158 (1967).(5) D. P. Santry, J. A m . Chem. Soc., 90, 3309 (1968).(6) B. J. Nicholson, Advan. Chem. Phys., 18, 249.(7) J. N. Murrel and A. H. Harget, “ Semi-Empirical Self-Consistent Field
Molecular Orbital Theory of Molecules” , Wiley-Interscience, New York, N.Y., 1971, Chapter 6, pp 145-156.
(8) (a) K. Ohno, Theor. Chim. A cta, 2, 219 (1964); (b) R. D. Brown and K. R. Roby, ibid., 16, 175, 299 (1970).
(9) N. Mataga and K. Nishlmoto, Z. Phys. Chem., 12, 335 (1957).(10) A. F. Saturno, Theor. CNm. A cta , 11, 365 (1968).(11) (a) E. Clementi and D. L Raimondi, J. Chem. Phys., 38, 2686 (1967).
(b) E. Clementi, D. L. Ftaimondi, and W. P. Reinhardt, J. Chem. Phys., 47, 1300 (1967).
(12) K. Jug, Theor. Chim. A cta , 16, 95 (1970).
(13) <X iA l T ( l ) + V V ( r ) + V B°(r )b r ;B > = <X;B i r ( l )
+ VA°(r)lXiA> + (x^IVyWlX;11)Also
<x , A IT (1 ) + V A“( r ) + V B° ( r ) lXyB > = <x,A IT (1 )
+ V B° ( r ) lX iB> + <XiA IV A°(r)lx ,-B>
Averaging leads to eq 3.
(14) T (l) + V A0( r ) lx ,A > = u ,A lx ,A >
T(l) + VB°(r)lx,B> = UjBlX;B>(15) Estimation of this integral by direct quadrature is possible, as discussed
by Murrel,7 but to keep the spirit of semiempiricism intact, we have adopted an approximate technique. However, a semiemplrical constant has to be introduced.
(16) In the discussion given by Murrel this aspect has not been considered.
A M ethod for C alcu lating CND O -M O Bonding Param eters. 2. Prelim inary A pp lications
Sankar Prasad Bhattacharyya
Department o f Chemistry, Presidency College, Calcutta-700073, India
and Mihir Chowdhury*
Department o f Physical Chemistry, Indian Association for the Cultivation o f Science, Jadavpur, Calcutta-700032, India (Received November 10, 1976)
A semitheoretical parametrization technique developed in part 1 is tested by performing some actual CNDO-MO calculations. The results obtained are satisfactory so far as molecular ionization potentials, nuclear quadrupole coupling constants, etc. are concerned.
1. Introduction
Recently, we have developed a semitheoretical model1 for estimating the bonding parameters (/3Ab) needed for performing CNDO-MO calculations. In the present paper we discuss some of the results of a preliminary application of this model. In the reported calculations, we have adopted the following schemes for obtaining our CNDO-MO parameters.
(a) One-center (A) electron repulsion integrals (gAA°) are calculated by adopting Saturno’s2 model; i.e., with (r12)-1 = (7*1 + r2y l.
(b) Two-center (A, B) electron repulsion integrals (gAB°) are calculated by using the Mataga3 approximation; i.e., with ri2_1 = (rj + r2 + ft)-1.
(c) Bond parameters /3ab(I) suitable for use with a nonorthogonal nS, nP basis are calculated by using eq 1,
iW D = -(4vA + /avB)/2- [(ZA + ZB)/2]K'g’AB + (ZA + ZB- 2)gAB° (1)
while bond parameters /3AB(H) suitable for use with an orthogonalized basis are calculated by eq 2. ft' and ft"
0ab(II) = [(^a + ZB)/2]g ae+ (ZA + Z B-2)g_AB° (2)
are adjustable parameters of the theory. We have shown that ft ' = 0.75 reproduces, on the average, Pople’s /Sab0 parameters (within ±4 eV); ft" has been taken to be equal
to unity in all the applications reported. There is a further possibility of varying ft'and ft" with the specific nature of the bond (a, it, etc.). We, however, have used a single value of ft' and ft" for all bonds in the present work. The possibility of using a variable /Sab CNDO-MO method as discussed in part 1 of this series of papers has also been tested on a few heterodiatomics and compared with fixed / ? a b CNDO-MO results.
The results of calculations are reported for two series of compounds: (i) the diatomic halogens and interhalogens (F2, Cl2, Br2,12, IC1, IBr, BrCl, BrF, C1F); (ii) a few small hydride molecules (NH3, PH3, AsH3, NH4+, PH4+, CH4, SiH4, GeH4).
2. Details of the Approximations Used
(A) Halogen and Interhalogens. Calculations were performed in two sets (I and II) each having a few distinctive features.
Set I: (a) CNDO/2 parameterization was adopted for the diagonal terms of the Fock matrix, (b) STO’s with Clementi and Raimondi’s4 optimized exponents were used. Since yt £„p, we used |av = V4(|„s + 3£np) for the calculations of the gAA° and overlap integrals, (c) For basis orbitals with n > 3, the gAA° integrals were arbitrarily increased by +1 eV, as Saturno’s model seemed to underestimate these integrals for orbitals with high n values. It seems that the angular correlation forces are diminished in these orbitals, (d) For the off-diagonal core matrix elements, we used
The Journal o f Physical Chemistry, Vol. 81, No. 16, 1977
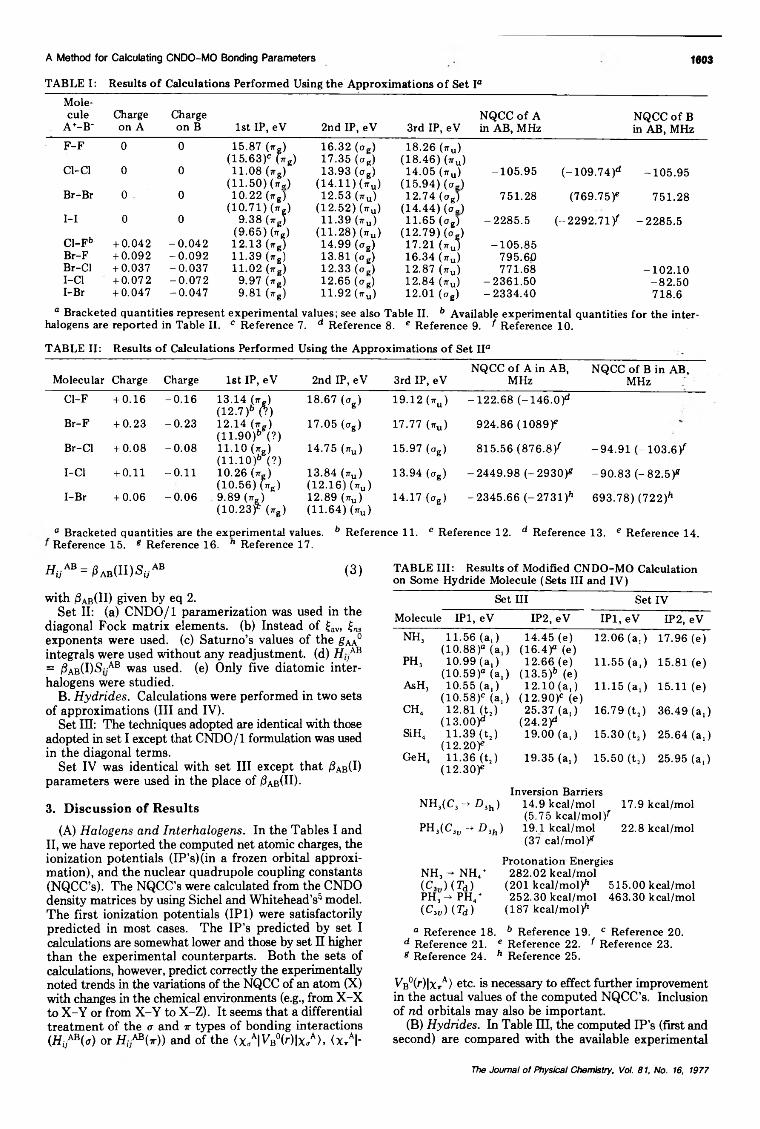
TABLE I: Results o f Calculations Performed Using the'Approximations o f Set Ia
A Method for Calculating CNDO-MO Bonding Parameters 1603
Molecule
A +-B"Charge on A
Charge on B 1st EP, eV 2nd IP, eV 3rd IP, eV
NQCC o f A in AB, MHz
NQCC o f B in AB, MHz
F-F 0 0 15.87 ( 7 T g ) 16.32 (<jg) 18.26 ( t tu )(1 5 .6 3 / (Vg) 17.35 (og) (18.46) ( t t u )
Cl-Cl 0 0 11.08 (ttg) 13.93 (<jg) 14.05 (jru) -105 .95 (-109 .74 )d -105 .95(11.50) fir.) (14.11) ( 7 T U ) (15.94) (a -)
Br-Br 0 0 1 0 . 2 2 ( 7T g ) 12.53 ( j t u ) 12.74 (eg) 751.28 (7 6 9 .7 5 / 751.28(10.71) (n-g) (12.52) ( t t u ) (14.44) ( o . )
I-I 0 0 9.38 ( 7 T g ) 11.39 (wu) 11.65 ( < 7 g ) -2 2 8 5 .5 ( -2 2 9 2 .7 1 / -22 8 5 .5
Cl-Fb(9.65) frg) (11.28) ( t t J (12.79) (a .)
+ 0.042 -0 .0 4 2 12.13 (rrg) 14.99 ( < T g ) 17.21 ( O -1 0 5 .8 5Br-F + 0.092 -0 .0 9 2 11.39 ( 7Tg) 13.81 (og) 16.34 ( î t u ) 795.60Br-Cl + 0.037 -0 .0 3 7 1 1 . 0 2 ( t t g ) 12.33 (og) 12.87 (*u) 771.68 - 1 0 2 . 1 0I-Cl + 0.072 -0 .0 7 2 9.97 ( 7 T g ) 12.65 ( c g) 12.84 (*„) -2361 .50 -8 2 .5 0I-Br + 0.047 -0 .0 4 7 9.81 (rrg) 11.92 ( t tu ) 1 2 . 0 1 (og) -2334 .40 718.6
a Bracketed quantities represent experimental values; see also Table II. 6 Available experimental quantities for the interhalogens are reported in Table II. c Reference 7. d Reference 8. e Reference 9. f Reference 10.
TABLE II: Results o f Calculations Performed Using the Approximations o f Set IIa
Molecular Charge Charge 1st IP, eV 2nd IP, eV 3rd IP, eVNQCC o f A in AB,
MHzNQCC o f B in AB,
MHzCl-F + 0.16 -0 .1 6 13.14 (jrg)
(1 2 .7 / (?)18.67 (og) 19.12 (nu ) -12 2 .6 8 ( - 1 4 6 .0 /
Br-F + 0.23 -0 .2 3 12.14 (îtg ) (1 1 .9 0 / (?)
17.05 (og) 17.77 (ttu) 924.86 (1 0 8 9 /
Br-Cl + 0.08 -0 .0 8 11.10 (jTg) (1 1 .1 0 / (?)
14.75 firu ) 15.97 ( tjg) 815.56 (8 7 6 .8 / -9 4 .9 1 ( - 1 0 3 .6 /
I-Cl + 0.11 -0 .1 1 10.26 (7Tg)(10.56) Grg)
13.84 (ttu)(12.16) (7TU)
13.94 (og) -24 4 9 .9 8 ( - 2 9 3 0 / -9 0 .8 3 ( - 8 2 .5 /
I-Br + 0.06 -0 .0 6 9.89 (TTg) (1 0 .2 3 / firg)
12.89 (ttu) (11.64) K )
14.17 (og) -2345 .66 ( - 2 7 3 1 / 693.78) ( 7 2 2 /
0 Bracketed quantities are the experimental values. b Reference 11. c Reference 12. d Reference 13. e Reference 14. Reference 15. g Reference 16. " Reference 17.
V ^ abOI )StfAB (3)
with 3 a b ( H ) given by eq 2.Set II: (a) CNDO/1 paramerization was used in the
diagonal Fock matrix elements, (b) Instead of £av, £ns exponents were used, (c) Saturno’s values of the £aa° integrals were used without any readjustment, (d) fiyAB = /3AB(I)S,AB was used, (e) Only five diatomic interhalogens were studied.
B. Hydrides. Calculations were performed in two sets of approximations (III and IV).
Set III: The techniques adopted are identical with those adopted in set I except that CNDO/1 formulation was used in the diagonal terms.
Set IV was identical with set III except that /SAB(I) parameters were used in the place of /3ab(H)-
3. Discussion of Results
(A) Halogens and Interhalogens. In the Tables I and II, we have reported the computed net atomic charges, the ionization potentials (IP’s) (in a frozen orbital approximation), and the nuclear quadrupole coupling constants (NQCC’s). The NQCC’s were calculated from the CNDO density matrices by using Sichel and Whitehead’s5 model. The first ionization potentials (IP1) were satisfactorily predicted in most cases. The IP’s predicted by set I calculations are somewhat lower and those by set II higher than the experimental counterparts. Both the sets of calculations, however, predict correctly the experimentally noted trends in the variations of the NQCC of an atom (X) with changes in the chemical environments (e.g., from X-X to X-Y or from X-Y to X-Z). It seems that a differential treatment of the a and ir types of bonding interactions (Hij^tr) or Hl;AB(7r)) and of the <x/l Vb0M|x<tA>> (C I
TABLE III: Results o f Modified CNDO-MO Calculation on Some Hydride Molecule (Sets III and IV)
Set HI Set IVMolecule IP1, eV IP2, eV IP1, eV IP2, eV
n h 3 11.56 (a,) (1 0 .8 8 / (a .)
14.45 (e) (1 6 .4 / (e)
12.06 (a ,) 17.96 (e)
PH3 10.99 (a,) (1 0 .5 9 / (a.)
12.66 (e) ( 1 3 .5 / (e)
11.55 (a,) 15.81 (e)
AsH3 10.55 (a ,) (1 0 .5 8 / (a,)
12.10 (a ,) (1 2 .9 0 / (e)
11.15 (a ,) 15.11 (e)
c h 4 12.81 (t2) (1 3 .0 0 /
25.37 (a,) (2 4 .2 /
16.79 (t2) 36.49 (a ,)
SiH4 11.39 (t2) (1 2 .2 0 /
19.00 (a,) 15.30 (t2) 25.64 (a,)
GeH4 11.36 ( t j (1 2 .3 0 /
19.35 (a,) 15.50 (t2) 25.95 (a,)
Inversion BarriersNH3(C3 -> D 3h) 14.9 kcal/mol 17.9 kcal/mol
(5.75 k ca l/m ol/PH3(C3ll -* D 3h) 19.1 kcal/mol 22.8 kcal/mol
(37 ca l/m o l/
Protonation Energies NH3-»N H 4+ 282.02 kcal/mol(C3 ) (Td ) (201 k ca l/m o l/ 515.00 kcal/molPH3^ P H 4+ 252.30 kcal/mol 463.30 kcal/mol (C3„ ) (T d ) (187 k ca l/m ol/
“ Reference 18. b Reference 19. c Reference 20. d Reference 21. e Reference 22. Reference 23. e Reference 24. h Reference 25.
VB°(r)|x/> ^ is necessary to effect further improvement in the actual values of the computed NQCC’s. Inclusion of nd orbitals may also be important.
(B) Hydrides. In Table HI, the computed IP’s (first and second) are compared with the available experimental
The Journal o f Physical Chemistry, Vol. 81, No. 16, 1977
1604 S. P. Bhattacharyya and M. Chowdhury
TABLE IV : Comparison o f Fixed (3- and Variable /3-CNDO-MO Results on Some Model SystemsVariable /3-CNDO-MO results
Total electronicMolecule energy at 1st IP, 2nd IP,
AB conveyance, eV eV eV
Fixed /3-CNDO-MO resultsTotal electronic 1st IP, 2nd IP,
energy, eV eV eVBr-F -99 9 .2 9 7 11.6211 15.1673 -99 9 .3 6 5 11.6251 15.1707I-Cl -7 6 1 .4 6 4 10.1524 14.4912 -76 1 .4 8 6 10.1504 14.4934I-Br -6 5 9 .3 6 6 10.0276 12.9486 -659 .373 10.0268 12.9495
quantities, it is seen that calculations of set III generally lead to ionization potentials which are smaller than the experimental values. This effect is more prominent in the second ionization potentials. Set IV, however, gives ionization potentials that are somewhat larger than the experimental quantities. However at the CNDO level of accuracy the agreement seems to be fair.
We have also reported computed inversion barriers (C3l) -* D3h) of NH3 and PH3 and their protonation energies in Table II. It is seen that the computed values of the protonation energies improve significantly on incorporating a two-center nonorthogonality correction in the off-diagonal core matrix elements in our model. The inversion barriers predicted are rather unsatisfactory and this is known to be a weak feature of the CNDO-MO theory. We are at present studying the effects of varying orbital exponents and two-electron (one- and two-center) integrals on the computed barrier heights. The results obtained so far indicates a strong dependence of the computed barrier heights on these factors.
(C) Comparison of Variable and Fixed 0^ CNDO-MO Results. We pointed out in paper 1 that /3AB parameters might vary in course of iterations. However such variations were shown to be small, as expected. In this paper, we have compared the electronic energies and ionization potentials (frozen orbital approximation) of BrF, IC1, and IBr, computed by these two methods. One-center electron repulsion integrals were calculated by Saturno’s method for all cases reported in this section. The valence shell ionization energies needed for the estimation of the diagonal core matrix elements were slightly different from those used in set I and II (e.g., 72sF = 38.01 eV and 72pF =17.6 eV) £av was used. In short, the same types of approximations were adopted in both methods for estimating all the parameters except /?ab- These results are reported in Table IV. They indicate that the electronic energies are slightly lower in the fixed /Jab-CNDO approximation while the computed ionization potentials are highly insensitive to the type of approximation used. This gives further support for using the fixed /3ab approximations introduced by Pople.
Conclusion
The scheme of parametrization studied in this paper seems to be a fairly good one for obtaining molecular properties such as IP’s, NQCC’s, protonation energies, etc.
The performance of this method in the computation of bond lengths, bond angles, bond energies, etc. is being studied at present with special emphasis on transition metal complexes. Obviously the extension of this scheme to transition metal complexes require some modifications. The details of these studies will be reported shortly.
Acknowledgment. S.P.B. wishes to acknowledge his sincere thanks to the University of Calcutta for the award of a Research Fellowship (UGC) and both the authors express their indebtedness to the University Computer Centre for providing computation facilities.
References and Notes(1) S. P. Bhattacharyya and M. Chowdhury, J. Phys. Chem., preceding
article in this issue.(2) A. F. Saturno, Theor. Chim. A c ta , 11, 365 (1968).(3) N. Mataga and K. Nishimoto, Z . Phys. Chim., 12, 335 (1957).(4) (a) E. Clementi and D. L. Raimondi, J. Chem. Phys., 38, 2686 (1963);
(b) E. Clementi, D. L. Raimondi, and W. P. Reinhardt, ibid., 47, 1300 (1967).
(5) J. M. Sichel and M. A. Whitehead, Theor. Chim. Acta, 11, 263 (1968).(6) J. M. Sichel and M. A. Whitehead, Theor. Chim Acta, 11, 220 (1968).(7) D. C. Frost, C. A. Mcdowell, and D. A. Vroom, J. Chem. Phys., 46,
4255 (1967).(8) R. Livingston, J. Chem. Phys., 19, 1434 (1951).(9) H. G. Dehmelt, J. Chem. Phys., 19, 1434 (1951).
(10) See the NQCC’s referred to by Sichel and Whitehead in ref 5.(11) A. P. Irsa and L. Friedman, J. Inorg. Nuci. Chem., 6, 77 (1958).(12) D. C. Frost and C. A. Mcdowell, Can. J . Chem., 38, 407 (I960).(13) D. A. Gilbert, H. Roberts, and P. A. Garishold, Phys. Rev., 76, 1723
(1944); 77, 742 (1950).(14) D. F. Smith, M. Tidwell, and D. V. P. Williams, Phys. Rev., 77, 420
(1950).(15) D. F. Smith, M. Tidwell, and D. V. P. Williams, Phys. Rev., 79, 1007
(1950).(16) C. H. Towness, F. R. Merritt, and B, D. Wright, Phys. Rev., 73, 1334
(1948).(17) T. S. Jaseja, J. Moi. Spectrosc., 5, 445 (1960).(18) R. Moccia, J. Chem. Phys., 40, 2176, 2186 (1964). The first ionization
potential of NH3 as given by A. Joubury and Turner {J. Chem. Soc., 4434 (1964)) is 10.88 eV.
(19) The value reported is an average of three independent determination by UV photoelectron spectroscopy, (a) G. R. Branton, D. C. Frost,C. A. Mcdowell, and I. A. Stenhouse, Chem. Phys. Lett., 5, 1 (1970); (b) A. W. Potts and W. C, Price, Proc. R. Soc. London, Ser. A , 326, 181 (1972); (c) J. P. Maier and D. W. Turner, J. Chem. Soc., Faraday Trans. 2 , 68, 711 (1972).
(20) W. R. Cullers and D. C. Frost, Can. J. Chem., 40, 390 (1962).(21) M. Krauss, J. Chem. Phys., 38, 54 (1963).(22) H. Neuert and H. Clasen, Z . Naturforsch. A , 7, 410 (1952).(23) J. D. Swaken and J. A. Ebers, J. Chem. Phys., 36, 1914 (1962).(24) J. M. Lehn and Munsch, Chem. Commun., 1327 (1969). This is an
ab-intio result and not an experimental result.(25) C. V. Hodges and J. L. Beaucham, J. Inorg. Chem., 14, 2887 (1975),
see Table I I I of this reference.
The Journal o f Physical Chemistry, Voi. 81, No. 16, 1977

1805
COMMUNICATIONS TO THE EDITOR
The Photoperoxidation of Unsaturated Organic Molecules. 17. The Thermal Regeneration of AcceptorPublication costs assisted by the University o f South Florida
Sir: Following previous reports1 to the effect that en- doperoxides of certain substituted polyacenes thermally regenerate molecular oxygen and the parent hydrocarbon, Wasserman and co-workers have demonstrated that in the case of 9,10-diphenylanthracene peroxide,2 rubrene peroxide,2 and 1,4,5-trimethylnaphthalene peroxide,3 the thermally generated oxygen is in the singlet (021Ag) state.
Insofar as the thermal regeneration process 2 is the reverse of 021Ag acceptor addition (process 1) interest
M + 0 ,'A g 4 MO, (1,2)
attaches to the activation energy E2 given by eq I where
E2* = Ex* ++ AHf°(0 2 Ae) - A tff°(M02) (I)
AH° refers to the standard formation enthalpy of the parenthesized species given in Table I for 9,10-di- phenylanthracene (DPA) and rubrene. These provide lower limits of E2* > E* + 40 kcal/mol for the peroxides of both compounds which, in the case of DPA, exceed the value of 28.6 ± 0.2 kcal/mol estimated2 for 021Ag regeneration. In view of this discrepancy and the apparent lack of data for rubrene peroxide we have investigated the thermal regeneration of parent hydrocarbon from DPA and rubrene peroxides in several solvents.
Solutions of the peroxides were prepared by the self- sensitized photoperoxidation of the hydrocarbon at known concentration (typically 10-4 M) by selective excitation in the long wave absorption band. These were placed in a cell designed to permit withdrawal of 2-mL aliquots while minimizing solvent evaporation losses and the cell placed in a constant temperature bath (Messgerate-Werk Landa) preheated to the appropriate temperature. The aliquots withdrawn at time intervals of a few minutes were cooled by dilution and refrigeration and thermal regeneration of the parent hydrocarbon followed spectrophotometrically. In all cases regeneration was first order and the rate constants were estimated from eq II where OD0 and OD„
J OD», ~ ODp [n ) ODot - OD( (
k2t (II)
denote initial and final optical densities monitored in the long wave acceptor absorption band. The percentage regeneration was estimated from OD„ and the optical density of the original acceptor solution at the same wave length prior to photoperoxidation.
Table II summarizes the temperature dépendance of rate constants k2 obtained in terms of Arrhenius parameters A2 and E2. As shown in Figure 1 the data for DPA in toluene and decalin are in good agreement with those reported by Wasserman et al.2 from 021Ag regeneration in toluene, benzene, and methylene chloride. The percentage regeneration of DPA and of rubrene also correspond well
TABLE I: Standard Formation EnthalpiesA i/{° , kcal/mol
9.10- Diphenylanthracene 73.8 ± 0.8°9.10- Diphenylanthracene peroxide 49.0 ± 5.0bRubrene 148.0 ± 5.0CRubrene peroxide 123.0 ± 5.0C
° A. Magnus and F. Becker, Z. Phys. Chem., 196, 378 (1951). b G. R. Somayajulu and B. J. Zwolinski, personal communication. c J. D. Cox and G. Pilcher, “ Thermochemistry o f Organic and Organometallic Compounds” , Academic Press, New York, N.Y., 1970, p 250.
TABLE II: Rate Data for Thermal Decomposition o f Peroxides
% regeneration of
E * , Ac- o / -Peroxide Solvent kcal/mol log A ceptor AgRubrene Decalin 32.6 ± 1.2 14.1 ± 0.6 30 ± 5
o-C6H4C12Benzene0
33.0 ± 1.2 14.1 ± 0.6 30 ± 536
DPA Decalin 30.6 ± 1.1 13.9 ± 0.7 95 ± 5Toluene 31.1 ± 3.0 14.3 ± 1.4 95 ± 5Toluene0 27.8 ± 0.2 12.1 ± 0.1 99
0 Reference 2.
Figure 1. Temperature dependence of rate constant k2 (s~1) for thermal dissociation of 9,10-diphenylanthracene in decalin (•), toluene (O, this work and X, ref 2), benzene (▲, ref 2), and methylene chloride (A, ref 2). Data line represents least-squares fit for data in decalin.
with the percentage regeneration of 021Ag from the corresponding peroxides.
The data indicate that either the tabulated heats of formation are attended by greater limits of uncertainty than those quoted,4 that the heats of solution of the hydrocarbon exceed those of the corresponding peroxide by some 10 kcal/mol, or that thermal regeneration of acceptor and 021Ag is not the reverse of 021Ag acceptor addition.
In view of the findings that (a) the activation energies for 02lAg regeneration (Table II) are close to those reported for primary peroxide bond fission in anthracene peroxide6 (29.8 kcal/mol) and ascaridole7 (31.4 kcal/mol), (b) the thermal regeneration of DPA from the endoperoxide is reduced to 35% in alcoholic solvents, and (c) the 30% regeneration of rubrene from rubrene peroxide is essen-
The Journal o f Physical Chemistry, Voi. 81, No. 16, 1977
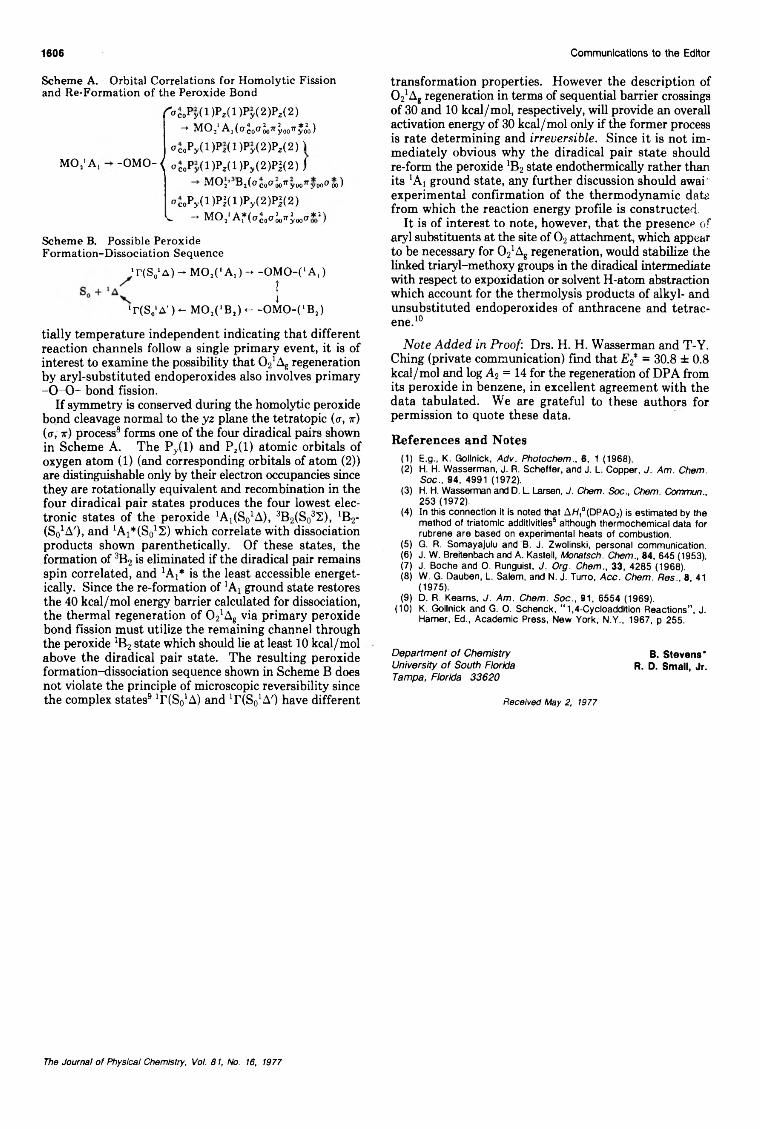
1606 Communications to the Editor
Scheme A. Orbital Correlations for Homolytic Fission and Re-Formation o f the Peroxide Bond
M O /A ,
f coPy(l)Pz(l)Py(2)Pz(2)-* MO A aJoa w oTT o)
CTcoPy(l)Pz(l)Py(2)P«(2) 1 -OMO“ < CTc0Py(l)Pz(l)Py(2)P|(2) j
M 02- B2((7C0C7{)07r yoo TyoO oo )°coPy(l)Pl(l)Py(2)P|(2)v -*■ MO/AfiCT a Jr CT*2)
Scheme B. Possible Peroxide Formation-Dissociation Sequence
‘ r(S„* A ) - M 0 2(* A, ) - * -O M O -C A, )Ilr (S 0‘ A’ ) - M 0 2( 'B 2) <- -O M O -( ‘ B2)
tially temperature independent indicating that different reaction channels follow a single primary event, it is of interest to examine the possibility that (VAg regeneration by aryl-substituted endoperoxides also involves primary -O-O- bond fission.
If symmetry is conserved during the homolytic peroxide bond cleavage normal to the yz plane the tetratopic (cr, it) (a, ir) process8 forms one of the four diradical pairs shown in Scheme A. The Py(l) and Pz(l) atomic orbitals of oxygen atom (1) (and corresponding orbitals of atom (2)) are distinguishable only by their electron occupancies since they are rotationally equivalent and recombination in the four diradical pair states produces the four lowest electronic states of the peroxide 1A1(S01A), 3B2(S032), 1B2- (S01AO, and 1A1*(S01S) which correlate with dissociation products shown parenthetically. Of these states, the formation of 3B2 is eliminated if the diradical pair remains spin correlated, and 1AI* is the least accessible energetically. Since the re-formation of !At ground state restores the 40 kcal/mol energy barrier calculated for dissociation, the thermal regeneration of 021Ag via primary peroxide bond fission must utilize the remaining channel through the peroxide *B2 state which should lie at least 10 kcal/mol above the diradical pair state. The resulting peroxide formation-dissociation sequence shown in Scheme B does not violate the principle of microscopic reversibility since the complex states91r(S01A) and 1r(S01 A') have different
transformation properties. However the description of 021Ag regeneration in terms of sequential barrier crossings of 30 and 10 kcal/mol, respectively, will provide an overall activation energy of 30 kcal/mol only if the former process is rate determining and irreversible. Since it is not immediately obvious why the diradical pair state should re-form the peroxide :B2 state endothermically rather than its xAt ground state, any further discussion should await experimental confirmation of the thermodynamic data from which the reaction energy profile is constructed.
It is of interest to note, however, that the presence of aryl substituents at the site of 02 attachment, which appear to be necessary for 021Ag regeneration, would stabilize the linked triaryl-methoxy groups in the diradical intermediate with respect to expoxidation or solvent H-atom abstraction which account for the thermolysis products of alkyl- and unsubstituted endoperoxides of anthracene and tetrac- ene.10
Note Added in Proof: Drs. H. H. Wasserman and T-Y. Ching (private communication) find that E2 = 30.8 ± 0.8 kcal/mol and log A2 = 14 for the regeneration of DP A from its peroxide in benzene, in excellent agreement with the data tabulated. We are grateful to these authors for permission to quote these data.
References and Notes(1) E.g., K. Gollnick, Adv. Photochem., 6, 1 (1968).(2) H. H. Wasserman, J. R. Scheffer, and J. L. Copper, J. Am. Chem.
Soc., 94, 4991 (1972).(3) H. H. Wasserman and D. L. Larsen, J. Chem. Soc., Chem. Commun.,
253 (1972).(4) In this connection it is noted that AH,°(DPA02) is estimated by the
method of triatomic additivities5 although thermochemical data for rubrene are based on experimental heats of combustion.
(5) G. R. Somayajulu and B. J. Zwolinski, personal communication.(6) J. W. Breitenbach and A. Kastell, Monatsch. Chem., 84, 645 (1953).(7) J. Boche and O. Runguist, J. Org. Chem., 33, 4285 (1968).(8) W. G. Dauben, L. Salem, and N. J. Turro, A cc . Chem. Res., 8, 41
(1975).(9) D. R. Kearns, J. Am . Chem. Soc., 91, 6554 (1969).
(10) K. Gollnick and G. O. Schenck, “ 1,4-Cycloadditlon Reactions” , J. Hamer, Ed., Academic Press, New York, N.Y., 1967, p 255.
D e p a rtm e n t o f Chem istry B. Stevens*University o f South Florida R. D. Small, Jr.Tam pa, Florida 3 3 6 2 0
Received May 2, 1977
The Journal o f Physical Chemistry, Voi. 81, No. 16, 1977

J o u r n a l o f C h e m ic a l a n d E n g in e e r in g D a ta
JU L Y 1 9 7 7 , V o i. 2 2 , N o . 3
TABLE OF CONTENTS
The Vapor Pressure of Tetrakis(2,2,6,6-tetram ethylheptane-3,5-dionato)uranium. . .Ray G. Bedford* and Ethan B. Huss 239
The P - V - T Behavior of Acetone in the Dense Gaseous Region. . .Ralph M. Keller, Jr., and Leonard I. Stiel* 241
Dissociation Constants of p-Am ino- and p-Guanidino-Substituted Phenylalanines. . . Christopher W. Owens,* Els ten-Krooden, and Andrew K. Grzybowski 244
Isobaric Vapor-Liquid Equilibrium Data for the System n-Hexane-2-Propanol. . .John M. Rotter and Harold N. Knickle* 246
Thermodynamic Properties of Ternary Mixtures. 2. The Excess Volum es of Mixing of Ternary Mixtures of Cyclohexane, Arom atics, and Halom ethanes
. . R. P. Rastogi,* Jagan Nath, and Shiva Saran Das 249
Vapor-Liquid Equilibria in the Ternary Systems W ater-Fo rm ic A c id -A cetic Acid and W ater-A ceticAcid-Propionic A c i d ..................................................... Jaime Wisniak* and Abraham Tamir 253
A Crude O il-N atural Gas System Vapor-Liquid Equilibrium Ratios (Data at 250 °F and SystemContaining 2 0 % C7+) .....................C. Floyd Wiesepape, H. T. Kennedy, and Paul B. Crawford* 260
Refractive indices and Molar Refractions of Liquid Mixtures. . . Major S. Dhillon* and Harinder S. Chugh 262
Vapor-Liquid Equilibria of the Binary and Ternary Systems Containing n-Hexane (1 )-B enzene(2)-fe /t-B u tyl Alcohol (3) at 760 mmHg Pressure
. . . S. Govindaswamy, AN. Andlappan,* and SM. Lakshmanan 264
A Fluorescence Method for the M easurem ent of the Partition Coefficients of Naphthalene, 1-Methylnaphthalene, and 1-Ethylnaphthalene in W ater
. . .Frederick P. Schwarz* and Stanley P. Wasik 270
Determination of Tem perature Dependence of Solubilities of Polycyclic Arom atic Hydrocarbons inAqueous Solutions by a Fluorescence M e th o d .....................................................Frederick P. Schwarz 273
Solubilities of Gases in Aqueous Solutions of Amine. . . Eizo Sada,* Hidehlro Kumazawa, and M. A. Butt 277
Viscosity of N itrobenzene-n-Pentane and Nitrobenzene-n-Heptane Systems. . .Eizo Sada,* Katsuroku Takahashl, and Mitsuhiro Hamada 279
The Equilibrium Phase Properties of the N itrogen-Isopentane System. . Thamra R. Krishnan, Harish Kalra, and Donald B. Robinson* 282
Vapor-Liquid Equilibrium of Petroleum Fractions Single Fraction and Binary Systems. . . Hamed H. Hamza* and Paul G. Mikolaj 285
Thermodynamic Properties of A lcohol-A m ine Mixtures: Excess Enthalpies of M ethanol-Triethylamine and E th an o l-T rie th y lam in e .....................................Abhai Chand and David V. Fenby* 289
Excess Enthalpies and Volum es for Mixtures of o-Dichlorobenzene with Som e AromaticHydrocarbons at 2 9 8 .1 5 K ..........................................................Reiji Tanaka and George C. Benson* 291
Vapor-Liquid Equilibria of the Ternary System Methyl Borate-M ethyl A lcohol-Carbon Tetrachloride. . . Larry E. Schindler, Charles A. Plank,* Phoebus M. Christopher,
and Walden L. S. Laukhuf 294
Enthalpies of Solution of Selected Electrolytes in Sulfolane and in Acetonitrile. . . Young-Sang Choi and Cecil M. Criss* 297
The Journal o f Physical Chemistry, Voi. 81, No. 16, 1977 3A

The Diffusion Cofficient of Ferricyanide Ions in Aqueous Potassium Chloride Solutions with andwithout Polyethylene Oxide A d d it io n .....................................Bruin Roffel* and Jan J. van de Graaf
Experimental Measurem ents of Phase Equilibrium Properties for Systems Containing n-Heptane, Benzene, /V-Methy Ipyrrol ¡done, and Monoethanolamine. Representation by the NRTL Equation
. . Jean-François Fabries. Jean-Louis Gustin, and Henri Renon*
Ionic Equilibria in Mixed Solvents: Formation of Calcium Lactate. . .Buddhadev Sen* and James J. Gibbons
Elevation of the Boiling Point of W ater by Salts and Saturation: Data and Correlation. . . David Meranda and William F. Furter*
Solubility o f Hydrogen Sulfide and Carbon Dioxide in a Sulfinol Solution. . . Ezra E. Isaacs, Frederick D. Otto, and Alan E. Mather*
Vapor-L iquid Equilibria at 25 °C for Nine Alcohol-Hydrocarbon Binary Systems. . .Shuen-Cheng Hwang and Robert L. Robinson, Jr.*
Solubility of Nitrogen, Argon, Methane, and Ethane in Ethylene O x i d e .......................... James D. Olson
Densities of the Molten Salt System Cesium Brom ide-Cuprous Bromide . . . . Gert J. Lamprecht
Vapor-Liquid Equilibria of the Cylohexane-C yclohexanone System at 323 .15 and 3 4 8 .1 5 K. . Tomas Boublik and Benjamin C.-Y. Lu*
Som e Physicochemical Properties of the Binary Mixtures Heptane-Propanone and Heptane-Ethyl A c e t a t e ......................................................................................... F. Vanden Kerchove* and M. De Vijlder
Isopiestic Determination of the Activity Coefficients of Som e Aqueous Rare Earth Electrolyte Solutions at 25 °C . 3. The Rare Earth Nitrates
. . .Joseph A. Rard, Loren E. Shiers, David J. Heiser, and FrankH. Spedding*
Activity Coefficients and Henry’s Constants by the Pseudocritical M e t h o d ..................... . Joseph Joffe
N EW C O M PO U N D S EC TIO N
Synthesis of Som e New Exocyclic Olefins via Phosphonium Ylides. . . Ram S. Tewari,* Komal C. Gupta, and Purshottam S. Kendurkar
Thiazo Compounds. Derivatives of 4,5-D ihydro-7,8-dim ethoxybenzothiazepin-3-one 1,1-Dioxides. . . Panayotis Catsoulacos* and Charalabos Camoutsis
Preparation and Spectral Properties of Benzylidene D iacetates. . .Fillmore Freeman* and Elaine Marie Karchefski
Synthesis of Potential Specific Inhibitors of Certain Amino Acid Decarboxylases. . . Zafar H. Israili* and Edward E. Smissman
Chem ical Shift Nonequivalence of Prochiral Groups in the 1H Nuclear Magnetic Resonance Spectra of Som e 3-Alkyl Derivatives of Phthalic Anhydride and Tetrachlorophthalic Anhydride
. . .Norman F. Bray,* Reuben L. Baumgarten,* and Edward Edelson
Synthesis and Properties of Substituted a-Phenylcinnam onitrilesulfonam ides. . .James T. Stewart,* Richard D. Dowling, and Otis J. Bouwsma
Fluorometrlc and Mass Spectral Data for 2-(9-Acridinyl)ethyl N-Substituted Carbamates and Their 1 0 -N -O x id e s ............................... James T. Stewart,* Richard E. Gammans, and Otis J. Bouwsma
There is no supplementary material for this issue.
* In papers with more than one author, the asterisk indicates the name of the author to whom inquiries about the should be addressed.
303
309
315
317
319
326
329
331
333
337
348
351
353
355
357
359
362
364
paper
300
4A The Journal o f Physical Chemistry, Voi.81.No. 16, 1977

Special Centennial Tapes4 Historic Symposia! 24 Speakers!
□ Milestones in Physical Chemistry
8 Speakers — 315 Figures Length: 5 Cassettes — 8 Hours PRICE: $45 (postpaid)
The Speakers:G. T. Seaborg — 40 Years of Transuranium
ElementsD. Hodgkin — Structure of Molecules in
CrystalsG. Porter — Chemistry in MicrotimeP. J. Rory — Thermodynamics of Polymer
SolutionsW. O. Baker — Chemistry of the Solid StateL. C. Pauling — Perspectives in Chemical
Bonding & StructureH. Eyring — Reaction Rate TheoryJ. H. Van Vleck — Evolution of Theoretical
Chemistry in America
s____________________________________ J
S \
□ Evolution of Kinetics
8 Speakers — 140 FiguresLength: 4 Cassettes — 6 HoursPRICE: $35 (postpaid)
The Speakers:B. S. Rabinovitch — Perspectives on
Vibration Energy Relaxation in Unimolecular Reactions
W. A. Noyes, Jr. — Photochemical KineticsR. A. Marcus — Trends in Theoretical
Chemical KineticsK. F. Freed — Radiationless Processes in
Polyatomic MoleculesG. B. Kistiakowski — Early Years of Gas
Phase Chemical KineticsJ. C. Polanyi — Recent Studies of Infrared
Chemiluminescence & FluorescenceS. Claesson — Diffusion Rates & Chemical
Reaction KineticsJ. Jortner — Intramolecular Dynamics in
Excited Molecular States
V____________________________________ 1
Custom Packaging! Special Prices!
□ Structure and Quantum Chemistry+
Evolution of Magnetic Resonance
8 Speakers — 210 Figures Length: 4 Cassettes — 6 Hours PRICE: $35 (postpaid)
The Speakers:J. A. Pople — Orbital Studies of Molecular
Structure & StabilityH. G. Drickamer — Pressure & Electronic
StructureF. H. Stillinger — Quantum Chemistry &
Eccentric Behavior of Liquid Water R. Zwanzig — Molecular HydrodynamicsH. S. Gutowsky — 30 Years of RelaxationJ. S. Waugh — Alchemy of Nuclear SpinsH. M. McConnell — Spin LabelsF. A. Bovey — NMR of Macromolecules
V___________________________________________ z
— SPECIAL PRICE —□ BUY ALL THREE SETS —
ONLY $ 8 5 (postpaid)
SAVE $3 0 !V __________________________________ >
r--------------------------------------------------------------- ^i iI ORDER FROM:| American Chemical Societyl 1155 Sixteenth St., N.W. |1 Washington, D C. 20036 |j ATTN: DEPT. APi ii |I Ii I| N a m e______________________________________________________________________lI Address1 ~ ~ | | C ity S ta te Z ip _ |
I(a llow 4 to 6 w e e k s fo r d e liv ery )
i IV _________________________________ J

New Pulsed Nanosecond Fluorom eter SystemsT h e PU LSED N AN O SECO N D FLU O RO M ETER SY STE M S a re ideal for u se in s in g le p h o to n co u n t in g , f lu o r e s c e n c e s tu d ies , tra ce an a lysis , flu o re s ce n t labellin g and d e te c t io n and in any o th er a p p lica t io n s w h ere low level lu m in e s c e n c e d ic ta tes h igh sensitiv ity and se lectiv ity o f e m iss io n m ea su rem en ts .
E x ce llen t s ign a l to n o is e ratio, low level o f stray light an d e ffic ie n t o p t ics perm its e x a m in a tion o f s u b s ta n c e s with low f lu o r e s c e n c e qu a n tu m yield .
T h e m ea su rem en ts are n ot restricted to ex p o n e n tia l d e c a y s and tim e reso lu tion is not lim ited by the rise tim e o f the PMT. but by a statistical tim e d is p e rs io n o f a b ou t 0 .3n s. L ifetim es as sh ort as .5ns ca n b e readily d e te c te d .
T h e SY STE M S are ava ilab le w ith v a r iou s e le c t r o n ic s p a c k a g e s . PMT s, m o n o ch ro m a to r , sa m p le ch a m b er , ex c ita tio n s o u r c e and p o w e r su p p lie s . T h e m od u la r c o n s tru c tio n len d s itself t o n u m erou s o p t io n s w h ich ca n b e a d d e d a s n e e d e d . C o m p u te r so ftw a re p rogra m fo r d e co n v o lu t io n is a ls o availab le.
PRA o f fe r s c o m p le te s e rv ice with th e se sy stem s, insta llation , o n -s ite testin g a n d training in u se o f th e instrum ent. PRA. with its ex p e rtise g a in e d th rou g h five years o f resea rch in d es ig n in g th e se sy stem s, will b e h ap py to c o n su lt with y ou as to you r rsq u irem en ts .
T h ese S Y ST E M S ca n b e se e n at the A C S E xhibit in C h ic a g o from Au gust 2 9 -S e p te m b e r 2 at B oo th 107.
For further information, please contact.
Jk Photochemical L J i Mw\ Research
AssociatesInc. (519) 679-6181
U niversity o f W estern O ntario C h em istry Building L o n d o n , O ntario. C a n ad a N6A 5B 7 T elex 064 7597
REPRINTSREPRINTSREPRINTSto aid you in
your work.
□ 1973(ChemTech)Visual Aids for Technical PresentationsGarret R. Hyde..................$2.00
□ 1973(Chemical Reviews)
Intramolecular Hydrogen Transfer in Mass Spectra.I. Rearrangements in Aliphatic Hydrocarbons and Aromatic Compounds Joan T. Bursey. Maurice M. Bursey, David G. I. Kingston $5.00
□ 1973(Chemical Reviews)
Lanthanide Shift Reagents for Nuclear Magnetic Resonance SpectroscopyAnthony F. Cockerill, Geoffrey L O. Davies, Raymond C.Harden. David M. Rackham
1□ 1973-1975
(ChemTech)Enzyme EngineeringW. R. Vieth,K. VenkatasubramanianPart I through IV ............. $5.00Combined I through IV .. $6.50 Part V alone..................... $2.00
□ ’975(Accounts of Chemical Research)
Special Issueon the Chemistry of VisionEdited by Eva L. Menger—($1.50 each on ten or more) ...........................................$3.00
□ 1973(Accounts of Chemical Research)
The Chemical Composition of the Lunar SurfaceAnthony L. Turkevich........ $2.00
□ 1975(Analytical Chemistry)
Pharmaceuticals and Related DrugsRichard E. Huettemann, Mary L Cotter and Charles J. Shaw ...........................................$3.50
□ 1969 (Journal ofAgricultural & Food Chemistry)
Symposium on Natural Food Toxicants19 papers from the Atlantic City Symposium in 1968. 128 pages. Paper................................ S3.00
□ 1971 (Journal ofAgricultural & Food Chemistry)
Symposium on Characterization of Proteins18 papers from the Chicago meeting in 1970. 125 pages. Paper................................ $3.50
Prepayment is required. Make check or mone\ order payable to the American Chemical Society Send to: Business Operations, Books and Journals Division, ACS
1 1 5 5 1 6th Street. N.W., Washington. D C. 20036
N am e
A d dress
City State Zip
-4.1*1 F