
The Journal of Physical Chemistry 1974 Volume.78 No.3
116
VOLUME 78 JANUARY 3 1, 1974 / NUMBER 3 JPCHAx THE JOURNAL OF PHYSICAL CHEMISTRY
-
Upload
khangminh22 -
Category
Documents
-
view
0 -
download
0
Transcript of The Journal of Physical Chemistry 1974 Volume.78 No.3

V O L U M E 7 8 J A N U A R Y 3 1, 1 9 7 4 / N U M B E R 3
JP C H A x
T HE J O U R N A L OF
PHYSICAL CHEMISTRY
T H E J O U R N A L O F
PHYSICAL CHEMISTRYVolume 78, Number 3 January 31, 1974
JPCHAx 78(3) 203-310 (1974) ISSN 0022-3654
Photolysis of Hydrogen Sulfide in the Presence of DimethylsilaneA. G. Alexander, R. W. Fair, and O. P. Strausz*
On Extending the Use of the O + NO2 NO + O2 Reaction for Measuring Low Oxygen Atom Concentrations
Irene R. Slagle, Jolene A. Samlaska, Frank J. Pruss, Jr., and D. Gutman*Curium-244 a Radiolysis of Nitric Acid. Oxygen Production from Direct Radiolysis of Nitrate Ions
Ned E. BiblerElectrically Conducting Metal Dithiolate-Perylene Complexes
Luis Alcacer and August H. Maki*Electron Spin Resonance Study of the Formation of Anion Radicals over Titanium Exchanged
Y-Zeolite Yoshio Ono,* Kenji Suzuki, and Tominaga KeiiElectron Paramagnetic Resonance and Electron-Nuclear Double Resonance Line Shape Studies
of Trapped Electrons in 7 -Irradiated Deuterium-Substituted 10 M Sodium Hydroxide Alkaline Ice Glass Barney L. Bales, John Helbert, and Larry Kevan*
Kinetic Studies of Photobleaching of Trapped Electrons in Protiated and Deuterated Methanol and Ethanol Glasses at 77°K Tadamasa Shida* and Masashi Imamura
Bursting of Soap Films. VI. The Effect of Surfactant PurityAlexander T. Florence and Karol J. Mysels*
A Reinvestigation of the Symmetric Stretching Mode of Matrix-Isolated A120Denis A. Lynch, Jr., Michael J. Zehe, and K. Douglas Carlson*
Infrared Optical Constants of Aqueous Solutions of Electrolytes. The Alkali Halides. Paul Rhine, Dudley Williams,* G. Michael Hale, and Marvin R. Querry
A High-Pressure Laser Raman Spectroscopic Investigation of Aqueous Magnesium SulfateSolutions.............................................R. M. Chatterjee,* W. A. Adams, and A. R. Davis
Studies of the Self-Association and Solvent-Association of Cholestrol and Other 3/3-Hydroxysteroids in Nonpolar Media
. Joseph J. Feher, Lemuel D. Wright, and Donald B. McCormick*High-Resolution and Pulsed Nuclear Magnetic Resonance Studies of Microemulsions
J. R. HansenUltrasonic Relaxation cf Aqueous Yttrium Nitrate Hsien-chang Wang and Paul Hemmes*High-Temperature Vaporization of Ternary Systems. I. Mass Spectrometry of Oxygen-Rich
Vanadium-Tungsten-Oxvgen SpeciesStephen L. Bennett, Sin-Shong Lin, and Paul W. Gilles*
Identification and Dissociation Energy of Gaseous Hafnium MononitrideFred J. Kohl* and Carl A. Stearns
Vapor Pressure Measurements of 4 ,4 -Dimethoxyazoxybenzene J. F. Solsky and Eli Grushka*Heat Capacities and Fusion Entropies of the Tetrahydrates of Calcium Nitrate, Cadmium Nitrate,
and Magnesium Acetate. Concordance of Calorimetric and Relaxational “ Ideal” Glass Transition Temperatures.................................................... C. A. Angeli* and J. C. Tucker
203
208
211
215
218
221
232
234
236
238
246
250
256
261
266
273
275
278
1A
Formation of Positive Ions in the Reaction of Disulfides with Hydroxyl Radicals in AqueousS olution ........................................................ H. Mockel, M. Bonifacic, and K.-D. Asmus* 282
Solvent Participation in Electron Transfer Reactions...................... O. I. Micic and B. Cercek* 285
Simultaneous Electrochemical-Electron Spin Resonance Measurements. II. KineticMeasurements Using Constant Current Pulse . . . Ira B. Goldberg* and Allen J. Bard 290 ■
Simultaneous Electrochemical-Electron Spin Resonance Measurements. III. Determination of Rate Constants for Second-Order Radical Anion Dimerization
. Ira B. Goldberg,* Duane Boyd, Ryo Hirasawa, and Allen J. Bard 295
The Laser Raman Spectra of Species Adsorbed on Oxide Surfaces. IIP. J. Hendra,* I. D. M. Turner, E. J. Loader, and M. Stacey 300
Mathematical Approach for Stopped-Flow Kinetics of Fast Second-Order Reactions InvolvingInhomogeneity in the Reaction C e l l ...................... Chin-tung Lin and D. B. Rorabacher* 305
Electron Spin Resonance Study of Synthetic Cellulose Fiber and FilmPaul H. Kasai* and D. McLeod, Jr. 308
COMMUNICATIONS TO THE EDITORComment on “Triplet Formation in Ion Recombination in Spurs” by J. L. Magee and
J-T. J. H u an g............................................................B. Brocklehurst* and T. Higashimura 309Reply to the Comment by B. Brocklehurst and T. Higashimura on “ Triplet Formation in Ion
Recombination in S p u r s " .................................................J. L. Magee* and J-T. J. Huang 310
■ Supplementary material for this paper is available separately, in photocopy or microfiche form. Ordering information is given in the paper.
* In papers with more than one author, the asterisk indicates the name of the author to whom inquiries about the paper should be addressed.
AUTHORINDEXFeher, J.J., 250Adams, W. A.. 246
Alcacer, L., 215 Alexander, A. G., 203 Angell, C.A., 278 Asmus, K.-D., 282
Bales, B. L., 221 Bard, A. J., 290, 295 Bennett, S. L., 266 Bibler, N. E., 211 Bonifacic, M„ 282 Boyd, D., 295 Brocklehurst, B., 309
Carlson, K. D.. 236 Cercek, B., 285 Chatterjee, R. M., 246
Davis, A. R., 246
Fair, R. W., 203
Florence, A. T., 234
Gilles, P. W„ 266 Goldberg, I. B., 290, 295 Grushka, E., 275 Gutman, D., 208
Hale, G.M ., 238 Hansen, J. R., 256 Helbert, J., 221 Hemmes, P., 261 Hendra, P. J., 300 Higashimura, T., 309 Hirasawa, R., 295 Huang, J-T. J., 310
Imamura. M., 232
Kasai. P. H., 308 Keii, T., 218 Kevan, L., 221
Kohl, F. J.. 273
Lin, C., 305 Lin, S.-S., 266 Loader, E. J., 300 Lynch, D. A., Jr., 236
Magee, J. L., 310 Maki, A. H., 215 McCormick, D. B., 250 McLeod, D., Jr., 308 Micic, O. L, 285 Mockel, H„ 282 Mysels, K. J., 234
Ono, Y„ 218
Pruss, F. J., Jr., 208
Querry, M. R., 238
Rhine, P., 238 Rorabacher, D. B., 305
Samlaska, J. A., 208 Shida, T., 232 Slagle, I. R„ 208 Solsky, J. F., 275 Stacey, M., 300 Stearns, C. A., 273 Strausz, O. P., 203 Suzuki, K., 218
Tucker, J. C., 278 Turner, I. D. M., 300
Wang, H., 261 Williams, D., 238 Wright, L. D., 250
Zehe, M. J., 236
ANNOUNCEMENTOn the last two pages of this issue you will find reproduced the table of contents of the
January 1973 issue of the Journal of Chemical and Engineering Data.
2A
T H E J O U R N A L OF
P H Y S I C A L CHER egistered in U. S. P a ten t O ffice © Copyright, 1974. by th e A m erican Chem ical S ociety
M I S T R YVOLUME 78, NUMBER 3 JANUARY 31, 1974
Photolysis of Hydrogen Sulfide in the Presence of Dimethyisilane
A. G. Alexander, R. W. Fair, and O. P. Strausz*
Department of Chemistry, University of Alberta, Edmonton, Alberta, Canada {Received July 30, 1973) Publication costs assisied by the National Research Council of Canada
The photolysis of H2S in the presence of (CH3 )2SiD2 leads to the formation of large yields of D2. The apparent exchange reaction is due to a photochain sequence involving (CH3)2SiDSH and (CH3 )2 SiDS- as reactive intermediates. The transient presence of the silylthiol was indeed confirmed by flash photolysis experiments using kinetic mass spectrometry and kinetic absorption spectroscopy. Abstraction of hydrogen from the methyl groups by H atoms and the direct exchange reaction, H + (CH3 )2SiD2 —*• (CH3)2SiDH + D, are unimportant at room temperature when the H atom possesses translational energy in the 0 to 35 kcal/mol int erval.
Several studies have been reported in recent years on the reactions of alkyl radicals and hydrogen atoms with silicon hydrides. 1 - 5 For the gas-phase reactions of H and D atoms, absolute rate constants have been measured with SiH„, Si2 H6, CH3SiH3, (CH3 )2SiH2, and (CH3)3SiH as substrates. In the case of the latter molecule the Arrhenius parameters have also been determined. Owing to the lower activation energy requirements of the reactions, these rate constants are generally higher than those of the reactions of the corresponding hydrocarbon molecules, even in cases where the H atoms contain substantial excess translational energy. Apart from the disilane reaction the only important step occurring in these systems is selective hydrogen atom abstraction from the silicon moiety. With disilane, parallel to abstraction, a displacement type reaction, H + Si2 H6 —*■ SÍH4 + SiH3, also takes place at a rate comparable to abstraction.
The present study was undertaken in order to elucidate two outstanding questions related to the H atoms + silicon hydride systems. Specifically these were (ai the nature and extent of the exchange reaction, H + D-SiR3 —»■ D + H-SiR3, as a function of excess translational energy in the H atoms, and (b) the role and nature of long-lived, non-stoichiometric complexes in the overall reactions.
Experimental SectionAll studies were carried out under static conditions
using standard high-vacuum techniques. The apparatus was free of stopcock grease for all runs except those done with CH20. A cylindrical quartz reaction cell, 36 mm in
diameter and 150 mm in length with a cold finger, was used. Its volume was 166 cc.
The cadmium lamp used was Gates M 12-S and the medium-pressure mercury lamp was Hanovia Type 30620. Pyrex, Vycor 791, Corex D, as well as 3130-A interference filters were used at various stages.
(CH3 )2SiH2 (Peninsular) and (CH3 )2SiD2 (Merck) were purified prior to each run by low-temperature distillation at —130° (n-pentane slush). The extent of deuteration of (CH3 )2 SiD2 on the silicon atom was determined to be at least 98% by 100-MHz nmr using the appearance of 13C satellite peaks as reference. (CH3)3SiD (Merck) was found to be at least 98% deuterated on the silicon atom by the same method. H2S (Matheson) and D2S (Merck) were distilled prior to each run. Paraformaldehyde (Shawinig- an) was heated to form CH20 vapor by a hand torch.
The reaction produce, noncondensable at -196°, was removed by a Toepler pump and analyzed by a thermal conductivity gas chromatograph on a molecular sieve 13X column or by mass spectrometry. The condensable fraction was analyzed on a silicon oil DC 200 column by a flame ionization gas chromatograph.
Isotopic analysis of the hydrogen product was achieved in an MS 10 mass spectrometer and that of the condensable fraction in an MS 1 2 instrument coupled to a gas chromatograph.
The flash photolysis apparatus using kinetic optical spectroscopy6 and kinetic mass spectrometry7 has been described before.
The uv spectra were recorded on a Cary 14 spectrometer.
203
204 A. G. Alexander, R. W. Fair, and O. P. Strausz
Results
The source of H (D) atoms used in the present study was the photolysis of H2S (D2S) and CH20.
Hydrogen sulfide exhibits a continuum in the ultraviolet region8 extending from 2700 to 1850 A with maximum absorption at about 2000 À. The HS-H bond strength is approximately 90 ± 2 kcal/mol9 and at the 2288-À cadmium resonance line the excess energy, carried mainly by the H atom, would be about 35 kcal/mol.10 The extinction coefficient is small, 170 M _1 cm“ 1 at 2288 A, but since simple silicon hydrides do not absorb at this wavelength,11 this was not considered a handicap.
The primary step in the photolysis of H2S is the free-radical mode of decomposition12
E,S + hv — ► H* + HS (1)
where the asterisk signifies translational excitation. This is followed by the sequence
H* + H,S — H, + SH (2)
H* + H,S — *- H + HL,S (3)
2SH — ► H, + S2 (4)
2SH — * H2S + SC!P) (5)2SH + M — *• H,S2 + M (H)
with the predominant step removing SH being reaction 5.13 The S and S2 species disappear by subsequent polymerization.
Previous studies have shown that hydrogen abstraction from methylsilanes occurs selectively from the silicon moiety.14 In order to examine the effect of excess translational energy in the H atoms on the competition of Si-H us. C-H abstraction, D2S was photolyzed in the presence of (CH3)2SiD2.
1. T he D 2S - (C H 3)2S iD 2 S ystem . In the photolysis of pure hydrogen sulfide the sulfur formed in reactions 4 and 5 was deposited in the form of a white film of elemental sulfur on the walls of the reaction cell. Addition of the silane to the system prevented the deposition of sulfur. Therefore, it would appear that the DS radical is removed by combination with the dimethylsilyl radical
(CH:,)2SiD- + DS — > (CH:1),SiDSD (7)
It should be noted that the alternative abstraction reaction
(CH„)2SiD2 + DS — *■ (CH3)2SiD- + D2S (8)
is endothermic and cannot compete with steps 4-7.The retrievable products of the reaction were hydrogen,
tetramethyldisilane, and tetramethyldisiloxane. Hydrogen was measured quantitatively and analyzed for isotopic distribution. The results obtained using the 2288-A Cd resonance line are presented in Table I. Evidently the D2S used contained a substantial amount of isotopic impurity as indicated by the high yield of HD. Upon addition of (CH3)2SiD2 the HD showed a small increase. One may be tempted to assign this to the contribution of C-H bond abstraction
D + (CH3)2SiD2 — *■ HD + CH2SiD2CH3 (9)
and the large yields of D2 to the simultaneous, competing reaction
D + (CH3),SiD2 — *- D2 + (CH3)2SiD- (10)
This, however, is not the case as it will be shown below.
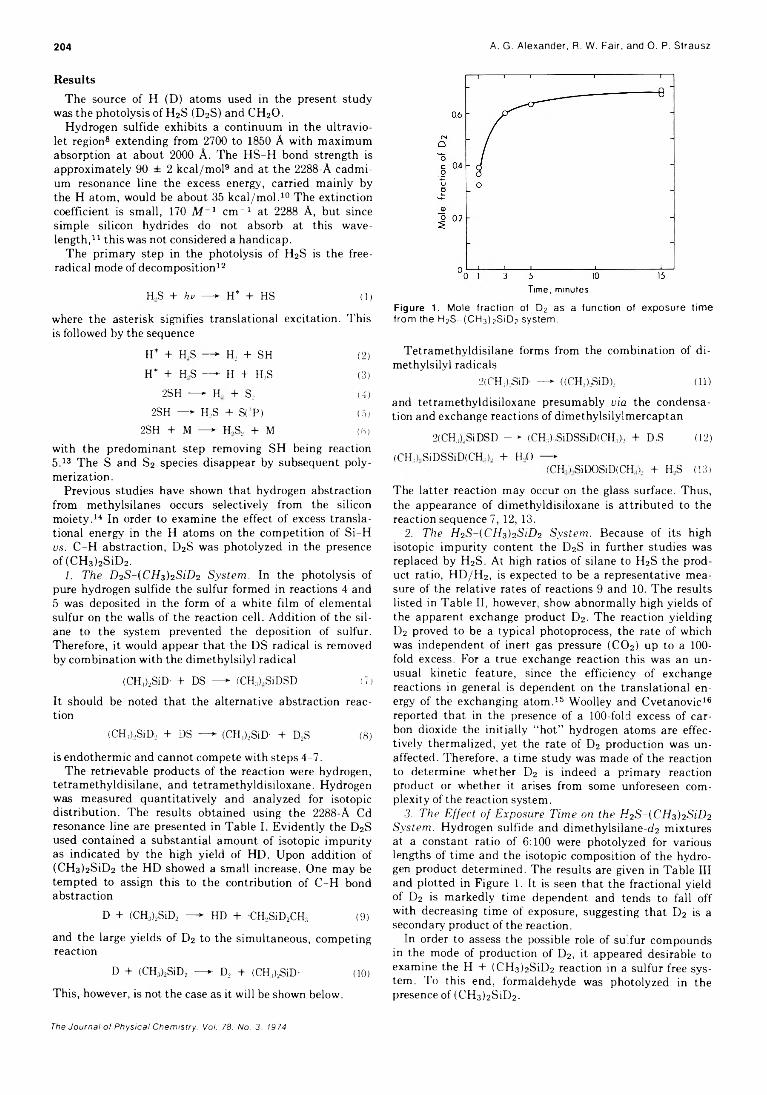
F ig u re 1 . M o le f r a c t io n o f D 2 a s a fu n c t io n o f e x p o s u re t im e f ro m th e H 2S - ( C H 3 ) 2S iD 2 s y s te m .
Tetramethyldisilane forms from the combination of dimethylsilyl radicals
1 2(CH„)2SiD- —-» ((CH3)2SiD)2 (11)
and tetramethyldisiloxane presumably via the condensation and exchange reactions of dimethylsilylmercaptan
2(CH:,)>SiDSD — - (CH:i)2SiDSSiD(CH3)2 + D2S (12)
(CH,),SiDSSiD(CHt), + H 0 ►(CH 1 SiDOSiD(CH > + H,S (13)
The latter reaction may occur on the glass surface. Thus, the appearance of dimethyldisiloxane is attributed to the reaction sequence 7, 12, 13.
2. T he H 2S ~ {C H 3)2S iD 2 S ystem . Because of its high isotopic impurity content the D2 S in further studies was replaced by H2S. At high ratios of silane to H2S the product ratio, HD/H2 , is expected to be a representative measure of the relative rates of reactions 9 and 10. The results listed in Table II, however, show abnormally high yields of the apparent exchange product D2 . The reaction yielding D2 proved to be a typical photoprocess, the rate of which was independent of inert gas pressure (C02) up to a 100- fold excess. For a true exchange reaction this was an unusual kinetic feature, since the efficiency of exchange reactions in general is dependent on the translational energy of the exchanging atom.15 Woolley and Cvetanovic16 reported that in the presence of a 100-fold excess of carbon dioxide the initially “ hot” hydrogen atoms are effectively thermalized, yet the rate of D2 production was unaffected. Therefore, a time study was made of the reaction to determine whether D2 is indeed a primary reaction product or whether it arises from some unforeseen complexity of the reaction system.
3. T he E ffec t o f E xp osu re T im e on th e H 2S - (C H 3)2S iD 2 S ystem . Hydrogen sulfide and dimethylsilane-d2 mixtures at a constant ratio of 6:100 were photolyzed for various lengths of time and the isotopic composition of the hydrogen product determined. The results are given in Table III and plotted in Figure 1. It is seen that the fractional yield of D2 is markedly time dependent and tends to fall off with decreasing time of exposure, suggesting that D2 is a secondary product of the reaction.
In order to assess the possible role of su.fur compounds in the mode of production of D2, it appeared desirable to examine the H + (CH3 )2SiD2 reaction in a sulfur free system. To this end, formaldehyde was photolyzed in the presence of (CH3)2 SiD2 .
The Journal of Physical Chemistry. Vol. 78. No. 3. 1974
Photolysis of H2S in the Presence of D methyl silane 205
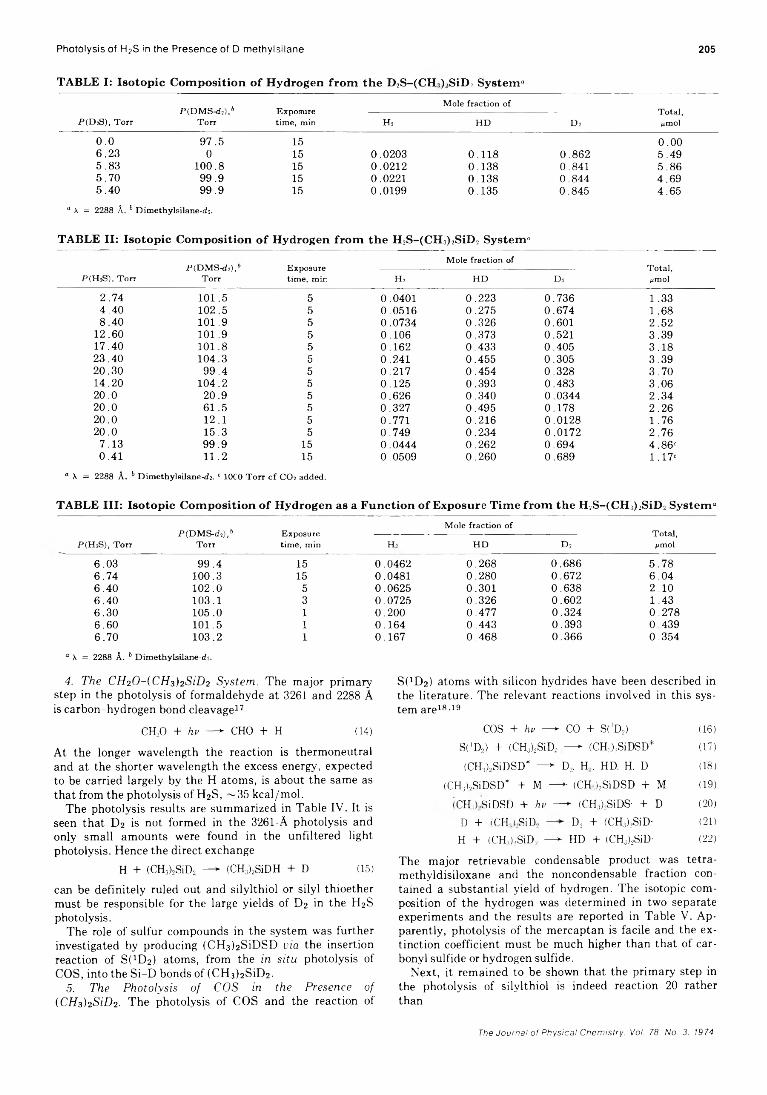
TABLE I: Isotopic Composition o f Hydrogen from the D2S-(CH)>SiD> System“
P(D&), T orrP (D M S -d î ) ,6
T orrE xposure tim e, m in
M ole fra ction o fT ota l, H m olH 2 H D D 2
0.0 9 7 . 5 15 0 . 0 06.23 0 15 0.0203 0.118 0.862 5 . 4 95.83 1 0 0 . 8 15 0.0212 0.138 0.841 5 . 8 6
5.70 9 9 . 9 15 0.0221 0.138 0.844 4.695.40 9 9 . 9 15 0.0199 0.135 0.845 4.65
“ X = 2288 Â. b D im ethylsilane-d î.
TABLE II: Isotopic Composition o f Hydrogen from the H2S-(CH3)2SiD2 System“
M o le fra ction o fPIDMSkÎ!),' E xposure T ota l,
P (H aS), T orr T orr tim e, m in Hj H D Do ¿tmol
2.74 1 0 1 . 5 5 0.0401 0.223 0.736 1 . 3 3
4.40 1 0 2 . 5 5 0.0516 0.275 0.674 1 . 6 88.40 1 0 1 . 9 5 0.0734 0.326 0.601 2.52
12.60 1 0 1 . 9 5 0.106 0.373 0.521 3.3917.40 1 0 1 . 8 5 0.162 0.433 0.405 3.1823.40 104.3 5 0.241 0.455 0.305 3.3920.30 99.4 5 0.217 0.454 0.328 3.7014.20 104.2 5 0.125 0.393 0.483 3.0620.0 20.9 5 0.626 0.340 0.0344 2.3420.0 61.5 5 0.327 0.495 0.178 2.2620.0 12.1 5 0.771 0.216 0.0128 1.7620.0 15.3 5 0.749 0.234 0.0172 2.76
7.13 99.9 15 0.0444 0.262 0.694 4.86“0.41 11.2 15 0.0509 0.260 0.689 1.17“
a X = 2288 Â . b D im ethylsilane-d2. c 1000 T o rr o f C O 2 added.
TABLE III: Isotopic Composition of Hydrogen as a Function of Exposure Time from the H2S-(CH3)2SiD2 System“
M ole fra ction o fP C D M S -d j),6 E xposure T ota l,
P (H jS ) , T orr T orr tim e, m in H . H D D 2 ¿tmol
6.03 9 9 . 4 15 0.0462 0.268 0.686 5.786.74 1 0 0 . 3 15 0.0481 0.280 0.672 6.046.40 1 0 2 . 0 5 0.0625 0.301 0.638 2.106.40 103.1 3 0.0725 0.326 0.602 1.436.30 105.0 1 0.200 0.477 0.324 0.2786.60 101.5 1 0.164 0.443 0.393 0.4396.70 103.2 1 0.167 0.468 0.366 0.354
“ X = 2288 Â . b D im ethylsilane-ds.
4. T he C H 2 0 -{C H z)2 S iD 2 S ystem . The major primary step in the photolysis of formaldehyde at 3261 and 2288 A is carbon-hydrogen bond cleavage17
CH,0 + hv — *■ CHO + H (14)
At the longer wavelength the reaction is thermoneutral and at the shorter wavelength the excess energy, expected to be carried largely by the H atoms, is about the same as that from the photolysis of H2S, ~35 kcal/mol.
The photolysis results are summarized in Table IV. It is seen that D2 is not formed in the 3261-A photolysis and only small amounts were found in the unfiltered light photolysis. Hence the direct exchange
H + (CH3)2SiD2 — ► (CH3)2SiDH + D (15)
can be definitely ruled out and silylthiol or silyl thioether must be responsible for the large yields of D2 in the H2 S photolysis.
The role of sulfur compounds in the system was further investigated by producing (CHs^SiDSD via the insertion reaction of S(1D2 > atoms, from the in situ photolysis of COS, into the Si-D bonds of (CH:3)2SiD2 .
5. T he P h oto lysis o f C O S in th e P resen ce o f (C H 3)2S iD 2 ■ The photolysis of COS and the reaction of
S(!D2) atoms with silicon hydrides have been described in the literature. The relevant reactions involved in this system are18’19
COS + hv — ► CO + S('D2) (16)S(‘D2) + (CH3)2SiD, — ► (CH3)2SiDSD* (17)
(CH3),SiDSD* — ► D* H,. HD, H, D (18)
(CHjbSiDSD* + M — *- (CH.)2SiDSD + M (19)
CH SiDSI) + hv — * (CH3)2SiDS- + D (20)D + ¡('ll ; SiD. — D2 + (CH3)2SiD- (21)H + (CH3)2SiD2 — *■ HD + (CH3)2SiD- (22)
The major retrievable condensable product was tetra- methyldisiloxane and the noncondensable fraction contained a substantial yield of hydrogen. The isotopic composition of the hydrogen was determined in two separate experiments and the results are reported in Table V. Apparently, photolysis of the mercaptan is facile and the extinction coefficient must be much higher than that of carbonyl sulfide or hydrogen sulfide.
Next, it remained to be shown that the primary step in the photolysis of silylthiol is indeed reaction 20 rather than
The Journal of Physical Chemistry. Vol. 78. No. 3. 1974
206 A. G. Alexander, R. W. Fair, and O. P. Strausz
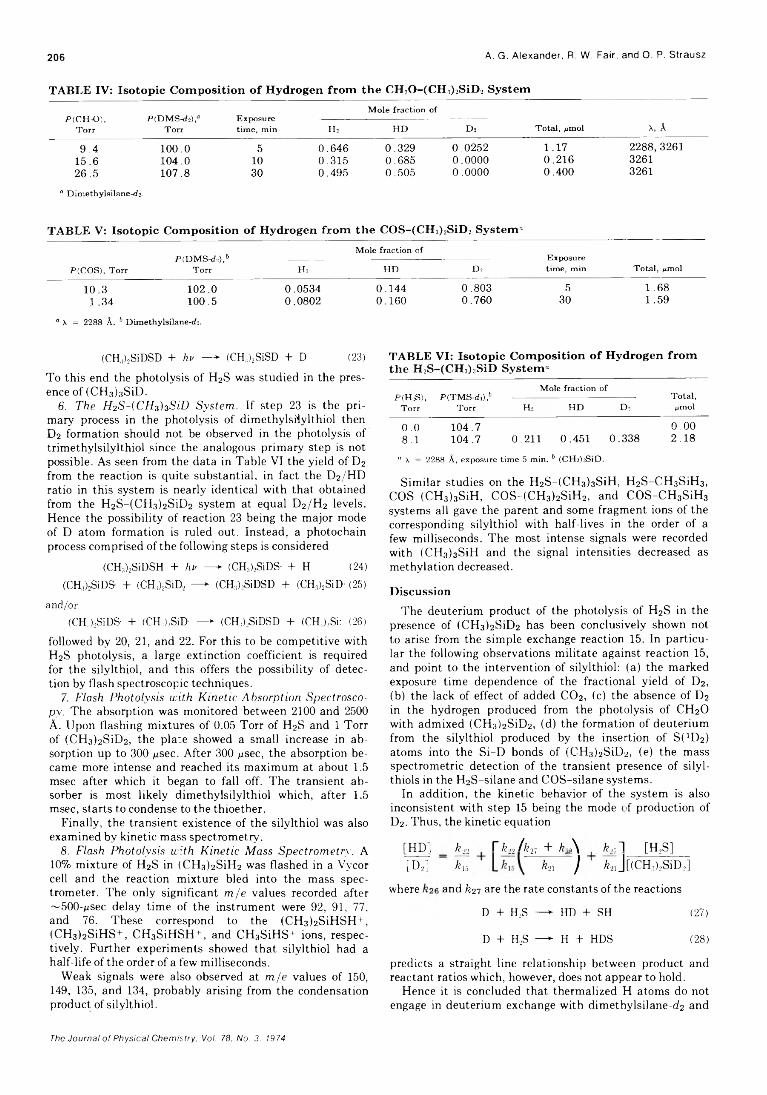
TABLE IV: Isotopic Com position o f Hydrogen from the C H 20-(C H 3)2SiD2 System
P ( C H 20 ) , T o rr
P (D M S -d 2),aT orr
E xposure tim e, m in
M o le fra ction o f
T o ta l, /xmol X, Àh 2 H D D 2
9 .4 100.0 5 0.646 0.329 0.0252 1.17 2288, 326115.6 104.0 10 0.315 0.685 0.0000 0.216 326126.5 107.8 30 0.495 0.505 0.0000 0.400 3261
a D im ethylsilane-rf2.
TABLE V: Isotopic Com position o f Hydrogen from the C O S-(C H 3)2SiD2 System “
M ole fra ction o ff T D M S -A ) ,6 E xposure
P (C O S ), T orr T orr h 2 H D d 2 tim e, m in T o ta l, nmol
10.3 102.0 0.0534 0.144 0.803 5 1.681.34 100.5 0.0802 0.160 0.760 30 1.59
“ X = 2288 Â . b D im ethylsilane-di.
(CH3)2SiDSD + hr — + (CH3)2SiSD + D (23)
To this end the photolysis of H2S was studied in the presence of (CH3)3SiD.
6. T he H 2 S -(C H s ) 3 S iD S ystem . If step 23 is the primary process in the photolysis of dimethylsilylthiol then D2 formation should not be observed in the photolysis of trimethylsilylthiol since the analogous primary step is not possible. As seen from the data in Table VI the yield of D2 from the reaction is quite substantial, in fact the D2 /HD ratio in this system is nearly identical with that obtained from the H2S-(CH3 )2SiD2 system at equal D2 /H2 levels. Hence the possibility of reaction 23 being the major mode of D atom formation is ruled out. Instead, a photochain process comprised of the following steps is considered
(CH3)2SiDSH + hv — *■ (CH3)2SiDS- + H (24)(CH3)2SiD& + (CH3)2SiD2 — (CH3)2SiDSD + (CH3)2SiD- (25)
and/or(CH3)2SiDS + (CH;)2SiD- — - (CH.J.SiDSD + (CH,)2Si: (26)
followed by 20, 21, and 22. For this to be competitive with H2S photolysis, a large extinction coefficient is required for the silylthiol, and this offers the possibility of detection by flash spectroscopic techniques.
7. Flash P h oto lysis w ith K in e tic A b sorp tion S p e c tr o sc o py . The absorption was monitored between 2100 and 2500 À. Upon flashing mixtures of 0.05 Torr of H2S and 1 Torr of (CH3 )2SiD2 , the plate showed a small increase in absorption up to 300 f i s e c . After 300 n sec, the absorption became more intense and reached its maximum at about 1.5 msec after which it began to fall off. The transient absorber is most likely dimethylsilylthiol which, after 1.5 msec, starts to condense to the thioether.
Finally, the transient existence of the silylthiol was also examined by kinetic mass spectrometry.
8. Flash P h oto lysis w ith K in e tic M a ss S p ectrom etry . A 10% mixture of H2 S in (CH3 )2SiH2 was flashed in a Vycor cell and the reaction mixture bled into the mass spectrometer. The only significant m /e values recorded after ~500-/isec delay time of the instrument were 92, 91, 77, and 76. These correspond to the (CH3 )2SiHSH+, (CH3 )2SiHS+, CH3 SiHSH+, and CH3SiHS+ ions, respectively. Further experiments showed that silylthiol had a half-life of the order of a few milliseconds.
Weak signals were also observed at m /e values of 150, 149, 135, and 134, probably arising from the condensation product of silylthiol.
TABLE VI: Isotopic Com position o f Hydrogen from the H 2S -(C H 3)3SiD System “
M ole fraction o fP (H .S ) , P (T M S -d i ) / ---------------------------------------------------- T o ta l,
T o r r T o rr H» H D D 3 am ol
0 .0 104.7 0 .008.1 104.7 0.211 0.451 0.338 2 .18
n X — 2288 A, exposure tim e 5 m in. b (CH3)3SiD.
Similar studies on the H2 S-(CH3)3SiH, H2 S-CH3SiH3 , COS-(CH3)3SiH, COS-(CH3)2SiH2, and COS-CH3SiH3 systems all gave the parent and some fragment ions of the corresponding silylthiol with half-lives in the order of a few milliseconds. The most intense signals were recorded with (CHsHSiH and the signal intensities decreased as méthylation decreased.
Discussion
The deuterium product of the photolysis of H2S in the presence of (CH3)2 SiD2 has been conclusively shown not to arise from the simple exchange reaction 15. In particular the following observations militate against reaction 15, and point to the intervention of silylthiol: (a) the marked exposure time dependence of the fractional yield of D2, (b) the lack of effect of added C 02, (c) the absence of D2 in the hydrogen produced from the photolysis of CH20 with admixed (CH3 )2SiD2, (d) the formation of deuterium from the silylthiol produced by the insertion of S(1D2) atoms into the Si-D bonds of (CH3)2SiD2, (e) the mass spectrometric detection of the transient presence of silyl- thiols in the H2S-silane and COS-silane systems.
In addition, the kinetic behavior of the system is also inconsistent with step 15 being the mode of production of D2. Thus, the kinetic equation
[h d ] k 22 r k22/ ky + feA k 21i [h 2s ][D2] *15 k2l ) £2IJ[{CH3)2SiD2]
where and fe2 7 are the rate constants of the reactions
D + H2S — *• HD + SH (27)
D + H2S — *■ H + HDS (28)
predicts a straight line relationship between product and reactant ratios which, however, does not appear to hold.
Hence it is concluded that thermalized H atoms do not engage in deuterium exchange with dimethylsilane-d2 and
The Journal of Physical Chemistry. Vol. 78. No. 3. 1974
Photolysis of H2S in the Presence of Dimethylsilane 207
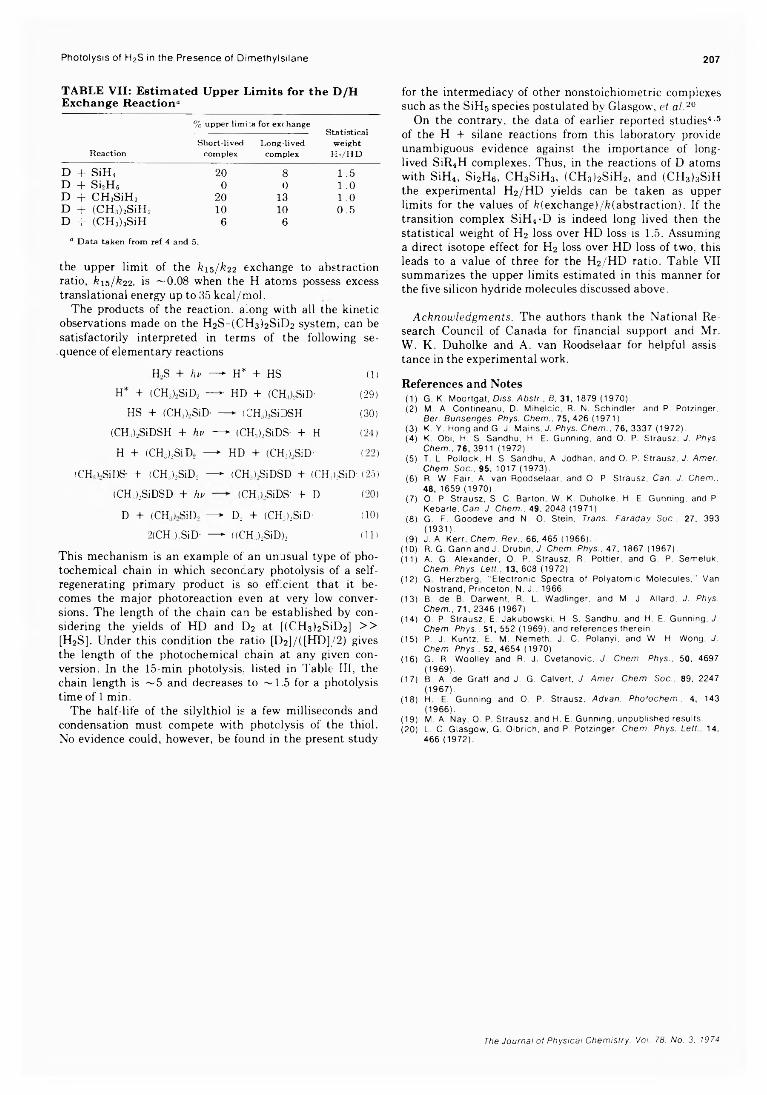
TABLE VII: Estimated Upper Limits for the D/H Exchange Reaction“
R ea ction
% u pper lim i-» for exchangeStatistical
w eightK 2/ H D
S hort-lived L on g -lived com plex com plex
D + SiH, 2 0 8 1.5D + Si2H6 0 0 1.0D + CH3SÌH3 2 0 13 1.0D + (CH3)2SiH2 1 0 1 0 0.5D 4- (CH3)3SiH 6 6
a D ata taken from re f 4 and 5.
the upper limit of the k ls /k2 2 exchange to abstractionratio, k is/ k 2 2 , is ~0.08 when the H atoms possess excess translational energy up to 35 kcal/mol.
The products of the reaction, along with all the kinetic observations made on the H2S-(CH3)2SiD2 system, can besatisfactorily interpreted in terms of the following sequence of elementary reactions
H,S + hv — ► H* + HS (1)
H* + (CH3)2SiD2 — *- HD + (CH3)2SiD- (29)
HS + (CH3)2SiD- — » (CH3),SiDSH (30)
(CH3)2SiDSH + hv — > (CH3)2SiDS- + H (24)
H + (CH3)2SiD2 — *■ HD + (CH3),SiD- (22)
iCH ) SilXS + (CH3)2SiD2 — ► (CH3)oSiDSD + (CH3i_,SiD- (25)
(CH3)2SiDSD + hv (CH3)..SiDS- + D (20)
D + (CH ) Sil) — *■ D2 + (CH3)2SiD- (10)
2(CH:i)3SiD- — ■ ((CH,)2SiD)2 (11)
This mechanism is an example of an unusual type of photochemical chain in which seconcary photolysis of a selfregenerating primary product is so efficient that it becomes the major photoreaction even at very low conversions. The length of the chain can be established by considering the yields of HD and D2 at [(CH3)2 SiD2 ] >> [H2S]. Under this condition the ratio [D2]/([HD]/2) gives the length of the photochemical chain at any given conversion. In the 15-min photolysis, listed in Table III, the chain length is ~5 and decreases to ~1.5 for a photolysis time of 1 min.
The half-life of the silylthiol is a few milliseconds and condensation must compete with photolysis of the thiol. No evidence could, however, be found in the present study
for the intermediacy of other nonstoichiometric complexes such as the SiHs species postulated by Glasgow, et a l.20
On the contrary, the data of earlier reported studies4,5 of the H + silane reactions from this laboratory provide unambiguous evidence against the importance of long- lived SiR4H complexes. Thus, in the reactions of D atoms with SiH4, Si2H6, CH3SiH3, (CH3)2SiH2, and (CH3)3SiH the experimental H2/HD yields can be taken as upper limits for the values of Mexchange)/k(abstraction). If the transition complex SiH4-D is indeed long lived then the statistical weight of H2 loss over HD loss is 1.5. Assuming a direct isotope effect for H2 loss over HD loss of two, this leads to a value of three for the H2/HD ratio. Table VII summarizes the upper limits estimated in this manner for the five silicon hydride molecules discussed above.
A ck n ow led g m en ts . The authors thank the National Research Council of Canada for financial support and Mr. W. K. Duholke and A. van Roodselaar for helpful assistance in the experimental work.
References and Notes(1) G. K. Moortgat, Diss. Abstr., B, 31, 1879 (1970).(2) M. A. Contineanu, D. Mihelcic, R. N. Schindler, and P. Potzinger,
Ber. Bunsenges. Phys. Chem., 75, 426 (1971).(3) K. Y. Hong and G. J. Mains, J. Phys. Chem.. 76, 3337 (1972).(4) K. Obi, H. S. Sandhu, H. E. Gunning, and O. P. Strausz, J. Phys.
Chem.. 76, 3911 (1972).(5) T. L. Pollock, H. S. Sandhu, A. Jodhan, and O. P. Strausz, J. Amer.
Chem. Soc.. 95, 1017 (1973).(6) R. W. Fair, A. van Roodselaar, and O. P. Strausz, Can. J. Chem..
48, 1659 (1970).(7) 0 . P. Strausz, S. C. Barton. W. K. Duholke, H. E. Gunning, and P.
Kebarle. Can. J. Chem., 49, 2048 (1971).(8) G. F. Goodeve and N. O. Stein, Trans. Faradav Soc., 27, 393
(1931).(9) J. A. Kerr, Chem. Rev., 66, 465 (1966).
(10) R. G. Gann and J. Drubin, J. Chem. Phys., 47, 1867 (1967).(11) A. G. Alexander, O. P. Strausz, R. Pother, and G. P. Semeluk,
Chem. Phys. Lett., 13, 608 (1972).(12) G. Herzberg, “ Electronic Spectra of Polyatomic Molecules,” Van
Nostrand, Princeton, N. J., 1966.(13) B. de B. Darwent, R. L. Wadlinger, and M. J. Allard, J. Phys.
Chem., 71, 2346 (1967).(14) O. P. Strausz, E. Jakubowski, H. S. Sandhu, and H. E. Gunning, J.
Chem. Phys., 51, 552 (1969), and references therein.(15) P. J. Kuntz, E. M. Nemeth, J. C. Polanyi, and W. H. Wong, J.
Chem. Phys.. 52, 4654 (1970).(16) G. R. Woolley and R. J. Cvetanovic, J. Chem. Phys.. 50, 4697
(1969).(17) B. A. de Graff and J. G. Calvert, J. Amer. Chem. Soc.. 89, 2247
(1967).(18) H. E. Gunning and O. P. Strausz, Advan. Pho'.ochem.. 4, 143
(1966).(19) M. A. Nay, O. P. Strausz, and H. E. Gunning, unpublished results.(20) L. C. Glasgow, G. Olbrich, and P. Potzinger, Chem. Phys. Lett.. 14,
466 (1972).
The Journal of Physical Chemistry. Voi. 78. No. 3. 19 74
208 I. R. Slagle, J. A. Samlaska, F. J. Pruss, and D. Gutman
On Extending the Use of the O + N 0 2 - > N 0 + 0 2 Reaction fo r Measuring Low Oxygen Atom Concentrations
Irene R. Slagle, Jolene A. Samlaska, Frank J. Pruss, Jr., and D. Gutm an*
Department of Chemistry, Illinois Institute of Technology, Chicago, Illinois 60616 {Received September 17, 1973) Publication costs assisted by the Petroleum Research Fund and the National Science Foundation
The measurement of low oxygen atom concentrations in flow reactors (down to 1011 atoms c m 3) may be accomplished with a modified titration procedure using the O + NO2 —*■ NO + O2 reaction. Overtitration of the flowing gas with NO2 is necessary as is removal of water vapor from the gases entering the discharge which produces the O atoms. Also, NO produced in the discharge must be distinguished from NO produced by the titration reaction. The modified procedure is discussed, and the magnitudes of the inaccuracies which would be caused by using an unmodified version of the titration are presented.
IntroductionReactions of oxygen atoms have been extensively stud
ied in flow reactors because of the ease with which these atoms may be generated and quantitatively transported, because of the variety of analytical tools which may be coupled to such a device, and because of the highly quantitative procedures which have been developed for measuring the 0 atom concentration in the flowing gas.1 The most widely used procedure for measurement of 0 atom concentrations involved the titration of the atoms with NO2 . 2 The reaction
0 + NO, —*■ NO + 02 (1)
is very fast and proceeds stoichiometrically.2-3 It is customary to add NO2 to the flowing gas containing O atoms in increasing amounts until the stoichiometric amount is added. This “ end point” is indicated either visually (by the disappearance of the O + NO afterglow),3'4 spectro- photometrically (by the disappearance of O atom resonance absorption4 or 0 atom esr absorption3), or mass spectrometrically (by the first appearance of excess NO2 ) . 5 Once the end point is reached, the NO2 flow is measured and equated to the O atom flow. The accuracy of this procedure has been tested down to an O atom concentration of 8 X 10¹⁴ atoms cm 3.3
At lower O atom levels the rate of reaction 1 becomes so slow that a stoichiometric titration is not generally possible during typical flow times through a flow reactor (~ 10 -2 sec). Special titration procedures have been developed which do not require the attainment of such an end point.6 8 They all require, however, the continuous monitoring of some property of the system related to the extent of the titration (usually the intensity of the air afterglow emission produced by the reaction between 0 and NO) during the partial titration. Concentrations of O atoms down to about 4 X 10¹³ atoms cm-3 may be accurately measured by such procedures.
In order to study very fast reactions of 0 atoms, it is necessary to generate and measure O atom concentrations which are much lower, down to about 1011 atoms cm-3. We have found that reaction 1 may be the basis for quantitative measurements of such low O atom concentrations, provided certain precautions are taken and a modified procedure followed. The results of this finding are presented here.
Titration ProcedureThere are three basic modifications needed to apply the
NO2 titration procedure to the measurement of very low 0 atom concentrations. The first is to drive reaction 1 to completion ( i .e ., consume all the O atoms), the second is to eliminate the interference in the titration caused by H atoms, and the third is to compensate for NO produced from sources other than reaction 1. The need for all three changes and the modifications themselves are detailed in this section.
O vertitra tion w ith N 0 2. It is desirable to essentially completely consume the O atoms within a few cm downstream from the titration inlet. In order to achieve this at low O atom concentrations, a substantial excess of NO2
must be added to the flow, enough to produce an NO2
concentration near 1014 molecules cm 3. For low O atom concentrations (1041-1013 atoms cm-3) the excess NO2 in only slightly depleted, and therefore this depletion cannot be used to accurately measure the 0 atom concentration. However, the NO produced can be accurately determined with a mass spectrometer detector, and this measurement is the basis of the modified titration procedure. Our flow system, which is described in detail elsewhere,9 is coupled to a photoionization mass spectrometer. The NO produced is determined by its peak height. The relationship between the NO peak height and its concentration is determined by monitoring the NO peak when known amounts of NO are metered into the flow.
R em ova l o f W ater Vapor. Oxygen atoms are most often generated by passing a carrier gas (usually He or Ar) containing O2 through a microwave discharge. Water (as well as other impurities) has a catalytic effect of enhancing the conversion of O2 to O in the discharge,1'10 and its presence is actually necessary to obtain the relatively high 0 atom concentrations (1014-1015 atoms cm "3) needed for most flow-reactor studies of O atom reactions. It is not necessary to add H20, as the residual water in tank gases and from the outgassing of gas-handling equipment is sufficient to obtain the desired effect. Thus, there is usually no attempt made to remove water from the flow.
The water vapor passing through the discharge is partially decomposed, producing both H and O atoms which persist in the flow.11 When large O atom concentrations are produced, the concentration of H atoms produced by the decomposition of water is small by comparison (see
The Journal ot Physical Chemistry. Voi. 78. No. 3. 1974
Measurement of Low Oxygen Atom Concentrations in Flow Reactors 209
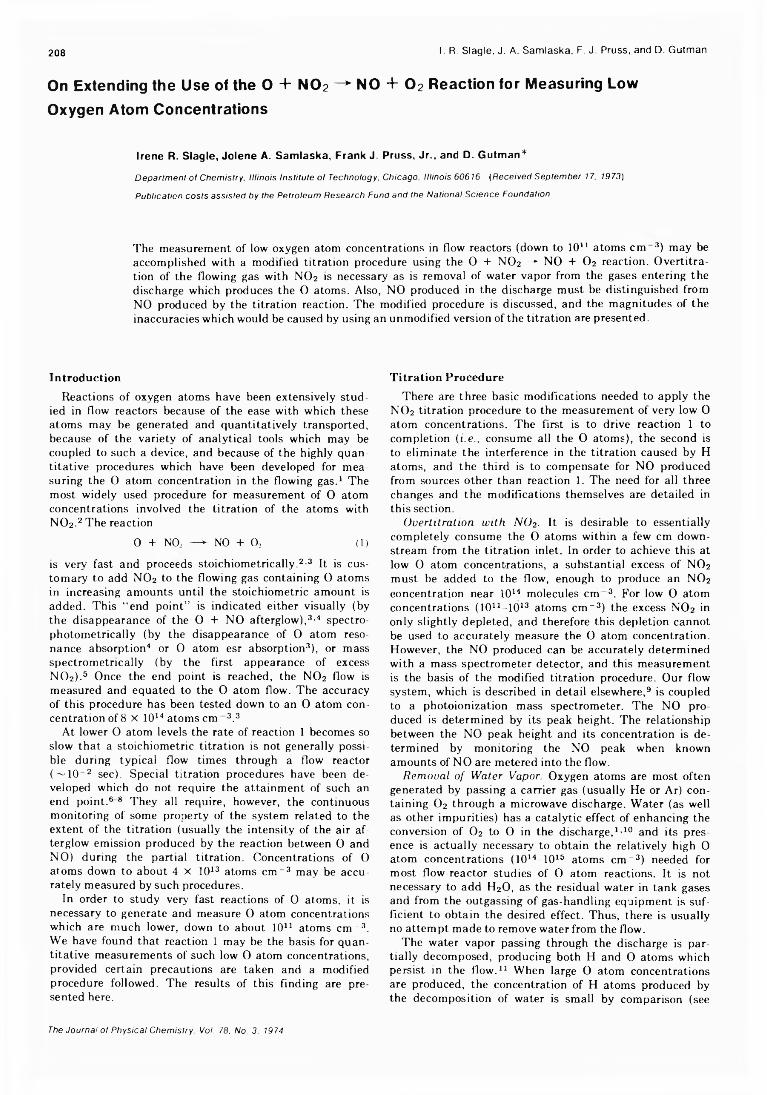
Figure 1. P lo t o f m e a s u r e d H a n d O a to m c o n c e n tr a t io n s in a f lo w r e a c to r . O a to m c o n c e n tr a t io n s w e r e c h a n g e d by v a ry in g th e a m o u n t o f O 2 p a s s e d th ro u g h th e m ic ro w a v e d is c h a rg e : t r i a n g le s , w a te r v a p o r n o t re m o v e d f ro m g a s e s ; s q u a re s , w a te r v a p o r re m o v e d b e fo r e g a s e s e n te r e d d is c h a r g e . E r ro r b a rs o n th e H a to m v a lu e r e f le c t o n e s ta n d a rd d e v ia t io n in th e n e t H a to m io n s ig n a l. T h e s ta n d a rd d e v ia t io n in th e 0 a to m c o n c e n t ra t io n is le s s th a n th e w id th o f th e s y m b o l u s e d to p lo t th e p o in t.
below) and its presence often does not interfere with the study of the O atom reaction. Or.e famous exception is the 0 + O3 reaction. 12
For the generation of low O atom concentrations, the presence of water vapor has two undesirable effects. The first is that extremely low O atom concentrations cannot be reached due to the constant production of O from H20 in the discharge. More serious, however, is the problem of H atoms also being titrated by N02, yielding NO by the fast reaction
H + NO, — - NO + OH (2)The extra NO produced by reaction 2 in the O atom titration, if interpreted as originating from reaction 1 , would result in an erroneous 0 atom determination.
To obtain an estimate of the magnitude of this error and to test a means for removing it, two sets of measurements were made of the H and O atom concentrations in our flow reactor. 13 In the first, helium (ultrahigh pure grade) and various amounts of 1 .0 % 0 2 in high-purity helium were flowed into our clean and dry (but unbaked) gas-handling equipment and through the microwave discharge on the flow system. The flow velocity was 15.7 m sec- 1 and the total pressure 1.4 Torr. In the second, the same gases passed through a liquid nitrogen cooled trap placed just before the discharge. The results of these measurements are shown in Figure 1.
For all the low 0 atom concentrations of interest in our kinetic studies ( ~ 1 0 1 1 - 1 0 13 atoms cm-3), the H atom concentration is either higher or nearly the sa m e as the 0
atom concentration when the cold trap is absent. When the water vapor is trapped from the gases entering the discharge, there is no statistically significant signal from H atoms (one standard deviation in the net H atom signal corresponds to ±3 X 101 1 atoms cm ' 3).
The results of these experiments indicate that a liquid N2 cooled trap just before the microwave discharge essentially eliminates the H atoms produced by the decomposition by H20 (and other H atom containing impurities). Failure to remove the water may result in very large errors in 0 atom concentration determinations based on NO formation by reaction 1. At the lowest 0 atom concentration generated without the cold trap ([0] = 9.8 x 101 1 atoms cc-1; this was with no added 0 2 through the discharge),
TABLE I: Oxygen Atom Concentrations Calculated from Measurements of Nitric OxideProduced in a Flow Reactor
[O ] u n corrected for N O [O] corrected for N Op rodu ced in discharge, p rodu ced in discharge, E rror in uncorrected
atom s c c -1 X 10 _12 atom c c -1 X 10 ~12 value, %
0 . 1 4 0 . 0 7 6 8 8 .80 . 2 8 0 . 1 6 6 9 .30 . 4 6 0 . 2 9 5 8 . 91 . 0 7 0 . 8 3 2 9 . 22 . 3 8 1 . 9 9 1 9 . 74 . 5 6 3 . 8 4 1 8 . 8
7 8 7 " 7 8 4 0 . 4
a T h is experim ent was perform ed w ith pure O i flow ing through th e m icro- w ave discharge w ith ou t prior rem oval o f w ater va p or. O th er entries are for vary in g am ounts o f 1 % O 2 in helium flow ing through the discharge a fter rem oval o f H ?0 by a liqu id n itrogen co ld trap .
the error in the 0 atom determination caused by reaction 2 would be over a factor of 3. Up to [O] = 6 X 10¹² atoms cm-3, the error is over a factor of 2 .
We have passed pure 0 2 through the discharge and flow systems at 15.7 m sec- 1 and 1.4 Torr without prior removal of water in order to generate O atom concentrations of 101 4-10ls atoms cm-3. Under these conditions, the H atom concentration is about 1 % that of the O atoms. Thus, in those studies which require high O atom concentrations and in which H20 cannot be removed, the titration error due to the presence of H atoms in negligible.
C orrection fo r N O from the D ischarge. We have found that small amounts of NO are generated when the gas mixtures mentioned above are passed through the micro- wave discharge. 14 The nitrogen in the NO probably comes from the very small amounts of N2 in the flowing gases. The gas-handling system has no apparent leaks, so N2
must come from small impurities in the cylinder gases and outgassing of the regulators and gas-handling system. The problem is not removed by the addition of the cold trap. If, during an N02 titration for O atoms, the NO produced by the discharge is interpreted as originating from reaction 1 , another error will arise in the determination of the O atom concentration.
Since we are unable to eliminate this problem, we compensate for it by measuring the NO signal when the discharge is on both before the N 0 2 is added and after. The signal before addition of N02 is subtracted from that after to obtain the ion signal for NO produced by reaction 1 . (We also measure the NO signal with the N02 added and the discharge off to obtain a correction for the NO impurity in the N02.)
The correction for NO generated by the discharge can be large when titrating very low 0 atom concentrations. The magnitude of the correction was measured at several low 0 atom concentrations, and the results are listed in Table I. The percentage error to the calculated O atom concentrations caused by the NO produced in the discharge being attributed to reaction 1 varies from 89% at[0] = 7.6 x 10¹⁰ atoms cm “ 3 to 19% at [0] = 3.8 x 10¹²
atoms cm-3. When pure 0 2 is used to generate large O atom concentrations, the correction for NO from the discharge is only 0.4%.
Accuracy of the ProcedureTwo sets of experiments were performed at 298°K to
test the accuracy of the modified N 0 2 titration procedure. In the first, two 0 atom concentrations were measured by both the titration procedure and by a kinetic method and found to agree. In the second experiment the proportiona-
The Journal of Physical Chemistry. Vol. 78. No. 3. 1974
210 I. R. Slagle, J. A. Samlaska, F. J. Pruss, and D. Gutman
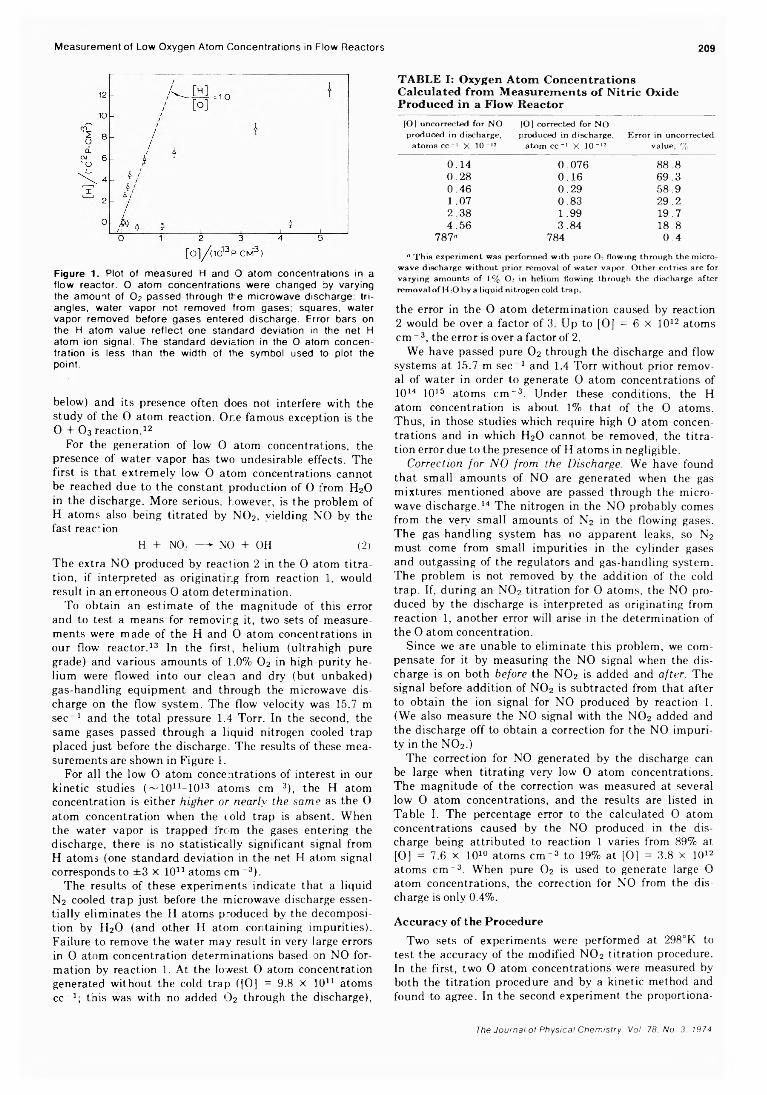
Figure 2. Plot of 0 atom concentration in the flow reactor determ ined by the modified titration procedure vs. the 0 atom peak height measured in the gas beam emerging from the reactor. Height and w idth of rectangles used to plot points are the standard deviations in the titrated 0 atom concentrations and net 0 + ion signals, respectively.
lity of the 0 atom concentration measured by the titration procedure and monitored by the mass spectrometer was established over a wide range of 0 atom concentration assuring that the titration procedure is accurate not only where a direct test of its accuracy was made.
The alternate determination of the 0 atom concentration was done with a kinetic experiment. For each of two low 0 atom concentrations, tetramethylethylene (TME) was added down the center tube of flow reactor in such small amounts (the TME initial concentration was 6.01 x 10¹⁰ molecule cm-3) that the O atoms were negligibly depleted. The first-order decay of TME was monitored down the flow tube by monitoring the TME+ peak height as a function of position of the center inlet tube. The half-life, r, for such a decay is15
r = 0.693/[0]£
where k is the rate constant for the O + TME reaction. While such a relationship is usually used to obtain an unknown k when [0] is known, we have used r and the known value for k to obtain [O].16 For both experiments P was 1.4 Torr and the flow velocity was 11.5 m/sec. The two 0 atom concentrations used as determined by the kinetic experiments were 1.10 X 10¹² and 2.03 X 10¹² atoms cm-3. The corresponding titrated values [O] were 1.28 X 10¹² and 2.21 x 10¹² atoms c m '3. The two independent methods for measuring [O] agree within 16 and 9%, respectively, for the two determinations. We consider the results from the two types of determinations to be in complete agreement. Considering the cumulative small uncertainties inherent in the two studies of the O + TME reaction used to make the comparison and in the titration procedure itself, closer agreement would be fortuitous.
The results of the proportionality test are presented in Figure 2. Over the range of O atom concentrations studied (7.6 x 10¹⁰ to 3.8 x 10¹² atoms c m '3), there is an accurate proportional relationship between the two measurements. Since this proportionality does not exist if H atoms are in the flow or if NO from the discharge is not taken into account, sucn an experiment actually becomes a useful test of the modified titration procedure for low O atom concentrations.
Summary and Conclusions
This study reports on the magnitude and origin of problems interfering with the use of the O + NO2 —* NO + O2
reaction to measure low 0 atom concentrations. Although the numbers reported here apply only to our experimental apparatus and flow conditions, the magnitudes of the interferences with the titration technique should be similar elsewhere, and the corrective steps taken should produce comparable results.
The results of this study indicate that 0 atoms in the concentration range 10n -1014 atoms c m '3 may be generated essentially free from hydrogen atoms by passing helium and small amounts of O2 through a liquid N2 cooled trap prior to passage through a microwave discharge. The 0 atom concentrations may be titrated by measuring the NO formed by reaction 1 after an excess of NO2 is added to the gases subsequent to their passage through the discharge. Due accounting must be made for the NO produced by the discharge and the NO impurity in the NO2 .
There is indirect evidence that there may still be H atoms in the flow after passage through the discharge at concentrations possibly as high as 2 X 10¹⁰ atoms cm “ 3. Thus, the procedure outlined here should not be extended to lower 0 atom concentrations without further testing. For 0 atom concentrations between 1014 and 1015 atoms c m '3, it is easier to base a titration on NO2 depletion following the addition of a twofold excess of NO2 .
A ck n ow led g m en t. We are grateful to the Donors of the Petroleum Research Fund, administered by the American Chemical Society, and to the National Science Foundation for support of this research. Two of us (J. A. S. andF. J. P.) thank the NSF Undergraduate Research Participation Program for summer support.
References and Notes(1) (a) F. Kaufman, “ Progress in Reaction Kinetics,” Vol. 1, G. Porter,
Ed., Pergamon Press. Oxford, 1961. Chapter 1; (b) H. I. Schiff, Can. J. Chem.. 4 7 , 1903 (1969).
(2) M. L. Spealman and W. H. Rodebush, J. Amer. Chem. Soc.. 57, 1474 (1935).
(3) A. A. Westenberg and N. de Haas, J. Chem. Phys., 40, 3087 (1964).
(4) F. A. Morse and F. Kaufman, J. Chem. Phys., 42 , 1785 (1965).(5) (a) J. T. Herron and H. I. Schiff, Can. J. Chem., 36, 1159 (1958);
(b) L. F. Phillips and H. I. Schiff, J. Chem. Phys., 3 6 , 1509 (1962).(6) R. R. Reeves, G. Manella. and P. Harteck, J. Chem. Phys., 32, 632
(1960).(7) F. Kaufman and K. R. Kelso, Paper presented at Symposium on
Chemiluminescence, Duke University, 1965.(8) F. Kaufman, Department of Chemistry, University of Pittsburgh, has
drawn to our attention the fact that several groups do routine N 0 2 titrations by plotting //[N02]added vs. [N 0 2]a<jded which gives a linear plot whose extrapolated intercept is the desired [N 0 2] = [O ]0.I is the intensity of the air afterglow emission.
(9) I. R. Slagle, F. J. Pruss, Jr., and D. Gutman, Ir t. J. Chem. Kinet., in press.
(10) (a) F. Kaufman and J. R. Kelso, J. Chem. Phys., 32, 301 (1960); (b) Symp. (In i.) Combust.. [Proc.], 8th, 1959. 230 (1960); (c) F. Kaufman, Advan. Chem. Ser.. No. 80 , (1969).
(11) OH radicals are lost through the rapid reactions OH + O - 0 2 + H and OH + OH — H20 + O.
(12) J. L. McCrumb and F. Kaufman, J. Chem. Phys., 57, 1270 (1972), and references therein.
(13) Mass spectrometer sensitivity to H atoms was determined by flowing 0.4% H2 in helium through a cold trap and into the discharge. The extent of the depletion of H2 by the discharge was taken as a measure of the H atoms produced, and the ion signal from H was used to determine the absolute detection sensitivity. The O atom peak heights were calibrated using the modified titration procedure described herein.
(14) Similar observation has been reported by F. Kaufman and J. R. Kelso (ref 10a) and by M. A. A. Clyne, D. J. McKenney, and B. A. Thrush, Trans. Faraday Soc., 61, 2701 (1965).
(15) A. A. Frost and R. G. Pearson, "K inetics and Mechanism," Wiley, New York, N .Y ., 1961, p 41.
(16) The value k = 7.92 X 10“ 11 cm 3 m o le c u le '1 s e c '1 was used. It is an average of four determinations at 298°K obtained using a flash photolysis resonance fluorescence technique (D. D. Davis, R.E. Huie, and J. T. Herron, J. Chem. Phys., 59, 628 (1973)).
The Journal of Physical Chemistry. Vol. 78. No. 3. 1974
244Cm a Radiolysis of HNO3 211Curium-244 a Radiolysis of N itric Acid. Oxygen Production from D irect Radiolyis of Nitrate Ions1
Ned E. Bibler
Savannah River Laboratory, E. I du Pont de Nemours & Co.. Aiken, South Carolina 29801 {Received July 25, 1973) Publication costs assisted by E. i. du Pont de Nemour & Co.
Dissolved 244Cm was used as an a-particle source to study radiolytic evolution of oxygen and hydrogen at atmospheric pressure from aerated nitric acid or NaNC>3- 0 . 4 M H2SO4 solutions. Dose rates were ~10 18
eV/(ml min), and evolution rates were linear up to a maximum dose of ~1021 eV/ml. G values were dependent on nitrate ion concentration, and results were identical in either nitric acid or NaNO3- 0 . 4 M H2SO4 solutions. As nitrate ion concentration increased, G(H2 ) decreased and G(C>2 ) increased. These results agree with published results using 210Po as an a source, but contradict those with 239Pu as an a source. Above 2 M NO3 - , G(0 2 > increased linearly with the electron fraction of nitrate ion, and it is concluded that this increase is due to oxygen produced by direct radiolysis of nitrate ions. The 100-eV yield from this effect is estimated to be 2.2 in agreement with that obtained from 7 radiolysis. Studies of gas evolution from solutions containing both 244Cm and Pu(IV) showed that Pu(IV) does not affect G(0 2 ).
IntroductionMany studies of the 7 radiolysis of neutral2- 5 and aci
dic6-1 0 aqueous nitrate solutions have been published. In all cases, the only products are nitrite ion, hydrogen peroxide, hydrogen, and oxygen. Among these various investigations there is complete agreement on two points: first, nitrate ions scavenge the precursors of hydrogen and suppress G(H2 >; and second, above 1 M NO3 - concentrations, oxygen and nitrite ions are produced as a result of direct energy absorption by nitrate ions. This latter point has been proven by using 1 8 0 -enriched water and measuring the isotopic content in the evolved oxygen. 2 b ’ 4 Also, the increase in G(N0 2 ~) with nitrate ion is equal to twice that for G(C>2 ),2a substantiating the stoichiometry indicated by reaction 1 .
N03“ -v**- NOT + !40, (1)
Further analysis of the increase of G(02) as a function of electron fraction of nitrate ions suggests that G(O2 ) and G(NC>2 - ) from this direct effect are 2 and 4, respective-l y 2 a ,6
The a radiolysis of nitrate solutions has been studied, 1 1 1 5
but not extensively. Again, the products are nitrite ions, hydrogen peroxide, hydrogen, and oxygen. As with 7
radiolysis studies, all the investigations substantiate that the presence of nitrate ions decreases GfFh). However, results concerning oxygen evolution from nitric acid solutions are contradictory. When dissolved 210Po was the a source, G(0 2 > increased with increasing nitric acid concentrations in the range 0.1-6 M . 13 With dissolved 239Pu as the o' source, G(0 2 ) decreased continuously with increasing nitric acid concentration up to 10 M . 1 4 1 5 Since this problem is fundamental to the radiation chemistry of systems containing nitrate ions, and because there is no apparent reason for the contradiction, we have reinvestigated the radiolytic evolution of gases from acidic nitrate solutions with dissolved 244Cm as the a source.
Dissolved 244Cm is well suited as an a particle source for radiolysis experiments. The a emission accounts for greater than 99.99% of the radioactive decay; the specific activity of 244Cm is high enough so that low concentra
tions give appreciable dose rates (—10® rads/hr in a 0.004 M 244Cm solution); and finally, the only oxidation state observed in aqueous solution is +3 . 1 6 Considering the low concentrations of 244Cm used, and the high stability of the +3 oxidation state in aqueous solution, 1 6 it is highly unlikely that in the presence of solutes such as HsO4, NO3”, or NO2- , curium can effectively compete for eaq ~, H, or OH radicals and affect the radiation induced chemistry.
Experimental SectionCurium-244 was produced by successive neutron cap
ture by 239Pu1 7 an{j was purified by pressurized cation exchange chromatography. 18 The results of a mass spectro- metric analysis of the final product are listed in Table I.
Solutions were prepared with triply distilled water and re crystallized reagent grade sodium nitrate. All other chemicals were reagent grade and were used without further purification.
Immediately before an experiment, the 244Cm was precipitated with sodium hydroxide to remove radiolytically formed hydrogen peroxide. The precipitate was thoroughly washed and then dissolved in 5 ml of previously prepared nitrate solution of the desired acidity. This solution was quickly transferred to a carefully cleaned 5-ml volumetric flask containing a magnetic stirrer, and then the flask was attached to the gas collection apparatus.
The gas collection apparatus was a 1-ml buret (minimum division 0 . 0 1 ml) attached to a leveling bulb filled with mercury. When the 5-ml flask was attached, the time and initial reading on the buret were recorded with the mercury levels equal. Constant agitation of the solution to facilitate gas removal was provided by the magnetic stirrer. After several minutes, the solution was agitated vigorously and the bulb was lowered until the height of mercury in the buret was again equal to that in the bulb. The increase in volume indicated by the buret was then a measure of the volume of gas produced at the pressure and temperature of the glove box. This procedure was repeated several times, and volume vs. time plots were constructed. At the end of the experiment, an aliquot of gas
The Journal of Physical Chemistry. Voi. 78. No. 3. 1974
212 Ned E. Bibler
T A B L E I
Isotop e A tom % T1 years
!“ Cm 83 18»Cm 14 4711248Cm 1 38 X 105
2 «Cm! 245Cmj
1.6 X 10’8.2 X 10s
Dy — 1 Stable
was removed for gas chromatographic analysis. The solution was sampled for absolute a counting to determine the exact amount of 244Cm present.
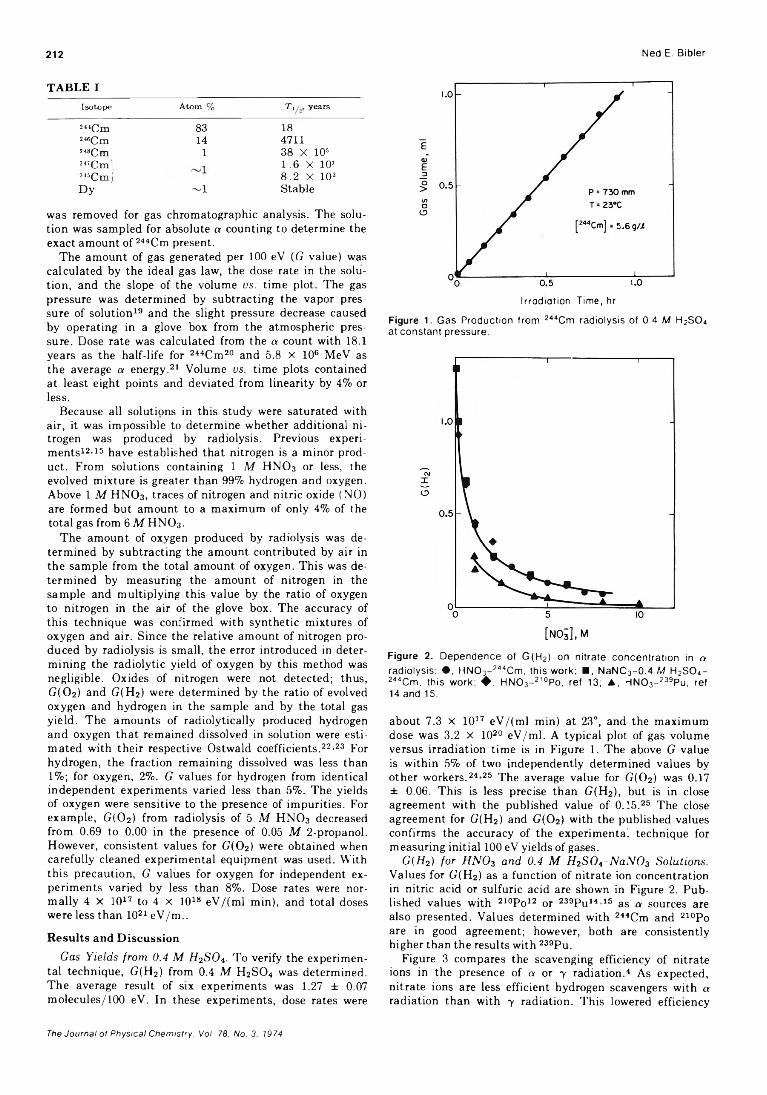
The amount of gas generated per 100 eV (G value) was calculated by the ideal gas law, the dose rate in the solution, and the slope of the volume vs. time plot. The gas pressure was determined by subtracting the vapor pressure of solution1 9 and the slight pressure decrease caused by operating in a glove box from the atmospheric pressure. Dose rate was calculated from the a count with 18.1 years as the half-life for 2 4 4Cm20 and 5.8 x 10⁶ MeV as the average a energy. 21 Volume vs. time plots contained at least eight points and deviated from linearity by 4% or less.
Because all solutions in this study were saturated with air, it was impossible to determine whether additional nitrogen was produced by radiolysis. Previous experiments1 2 ' 1 5 have established that nitrogen is a minor product. From solutions containing 1 M HN03 or less, the evolved mixture is greater than 99% hydrogen and oxygen. Above 1 M HN03, traces of nitrogen and nitric oxide (NO) are formed but amount to a maximum of only 4% of the total gas from 6 M HNO3 .
The amount of oxygen produced by radiolysis was determined by subtracting the amount contributed by air in the sample from the total amount of oxygen. This was determined by measuring the amount of nitrogen in the sample and multiplying this value by the ratio of oxygen to nitrogen in the air of the glove box. The accuracy of this technique was confirmed with synthetic mixtures of oxygen and air. Since the relative amount of nitrogen produced by radiolysis is small, the error introduced in determining the radiolytic yield of oxygen by this method was negligible. Oxides of nitrogen were not detected; thus, G(02) and G(H2) were determined by the ratio of evolved oxygen and hydrogen in the sample and by the total gas yield. The amounts of radiolytically produced hydrogen and oxygen that remained dissolved in solution were estimated with their respective Ostwald coefficients. 2 2 ' 23 For hydrogen, the fraction remaining dissolved was less than 1 %; for oxygen, 2 %. G values for hydrogen from identical independent experiments varied less than 5%. The yields of oxygen were sensitive to the presence of impurities. For example, G(02) from radiolysis of 5 M HNO3 decreased from 0.69 to 0.00 in the presence of 0.05 M 2-propanol. However, consistent values for G(02) were obtained when carefully cleaned experimental equipment was used. With this precaution, G values for oxygen for independent experiments varied by less than 8 %. Dose rates were normally 4 x 101 7 to 4 x 10¹⁸ eV/(ml min), and total doses were less than 102 1 eV/ml.
Results and DiscussionGas Y ields from 0.4 M H 2 S O 4 . To verify the experimen
tal technique, G(H2) from 0.4 M H2 SO.j was determined. The average result of six experiments was 1.27 ± 0.07 molecules/100 eV. In these experiments, dose rates were
Irradiation Time, hr
Figure 1. Gas Production from 244Cm radiolysis of 0.4 M H2S 0 4 at constant pressure.
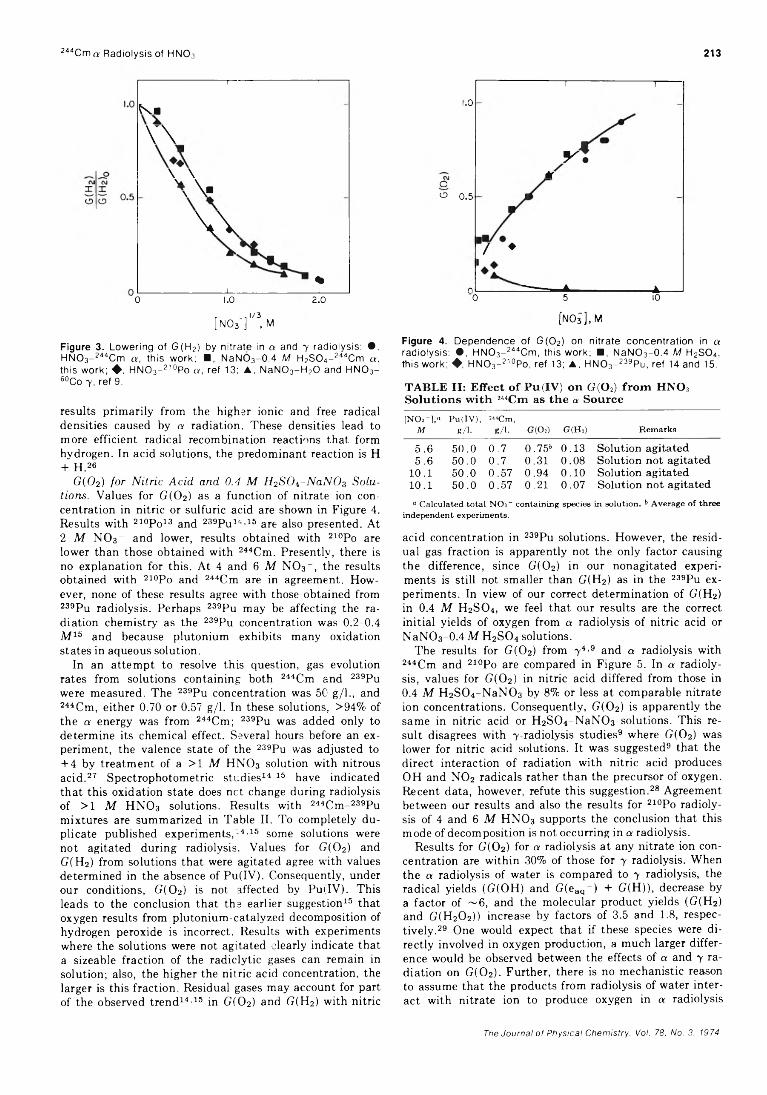
Figure 2. Dependence of G (H 2) on nitrate concentration in a radiolysis: • , H N 0 3- 244Cm, this work; ■ . NaNC3-0 .4 M H2S O „- 244Cm, this work; ♦ , HNO3- 210Po, ref 13; A , H N 0 3- 239Pu, ref 14 and 15.
about 7.3 x 101 7 eV/(ml min) at 23°, and the maximum dose was 3.2 X 10²⁰ eV/ml. A typical plot of gas volume versus irradiation time is in Figure 1. The above G value is within 5% of two independently determined values by other workers. 24 25 The average value for G(02) was 0.17 ± 0.06. This is less precise than G(H2), but is in close agreement with the published value of 0.15.25 The close agreement for G(H2) and G(02) with the published values confirms the accuracy of the experimental technique for measuring initial 100 eV yields of gases.
G(H2) fo r HN0 3 and 0.4 M H2S0i~NaN03 S olutions. Values for G(H2) as a function of nitrate ion concentration in nitric acid or sulfuric acid are shown in Figure 2. Published values with 2 iop0 i 2 or 239pui4,i5 as a sources are also presented. Values determined with 244Cm and 210Po are in good agreement; however, both are consistently higher than the results with 239Pu.
Figure 3 compares the scavenging efficiency of nitrate ions in the presence of a or y radiation. 4 As expected, nitrate ions are less efficient hydrogen scavengers with a radiation than with 7 radiation. This lowered efficiency
The Journal of Physical Chemistry. Vol. 78. No. 3. 1974
244Cm a Radiolysis of H N 0 3 213
1--------------------- 1
1.0
i---------------------1—
Nji
V \y •
\ \ ÉfV \ o\ \H C5 0.5
\ \/ ♦
%______________1_ ________ 1____ n — ■ *------------------- A-----0 l.o 2 . 0
r -Tl/3[N 0 3 ] ,M
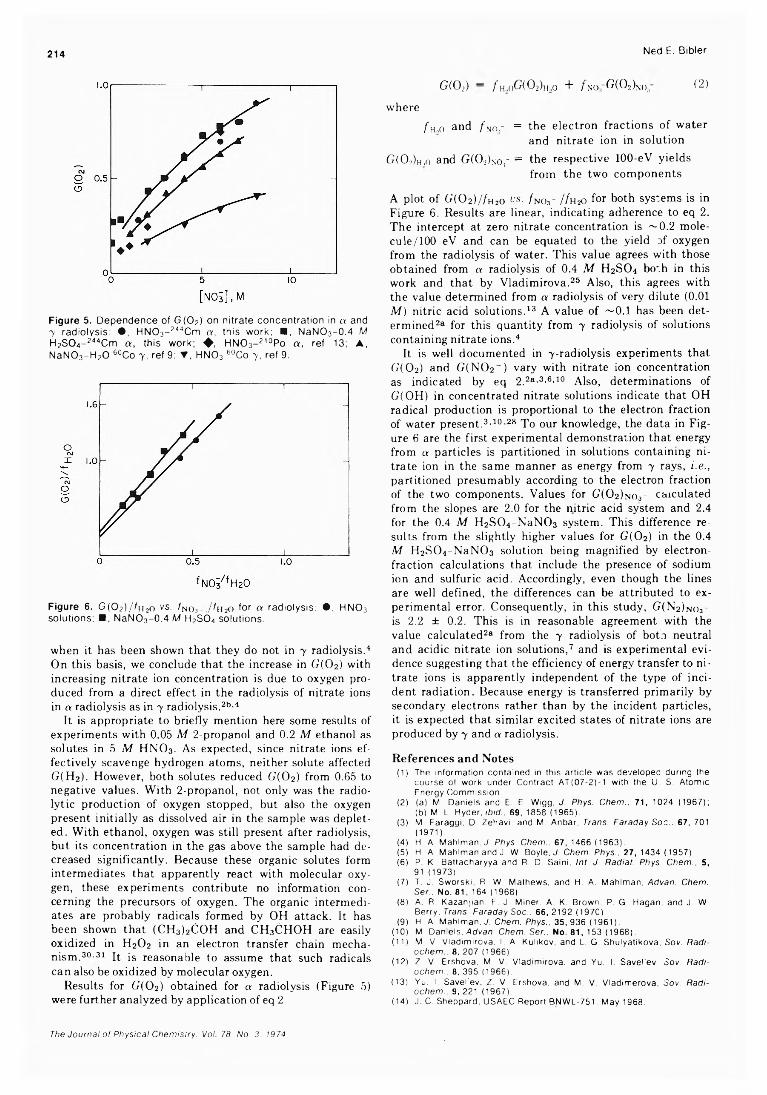
Figure 3. Lowering of G (H 2) by n itrate in a and 7 radiolysis: • , H N 0 3- 244Cm a , this work; ■ , NaNO3-0 .4 M H2S 0 4- 244Cm a , this work; ♦ , HNO3- 210Po a , ref 13; ▲, N aN 0 3- H 20 and H N 0 3- 60Co 7 , ref 9.
results primarily from the higher ionic and free radical densities caused by a radiation. These densities lead to more efficient radical recombination reactions that form hydrogen. In acid solutions, the predominant reaction is H + H . 26
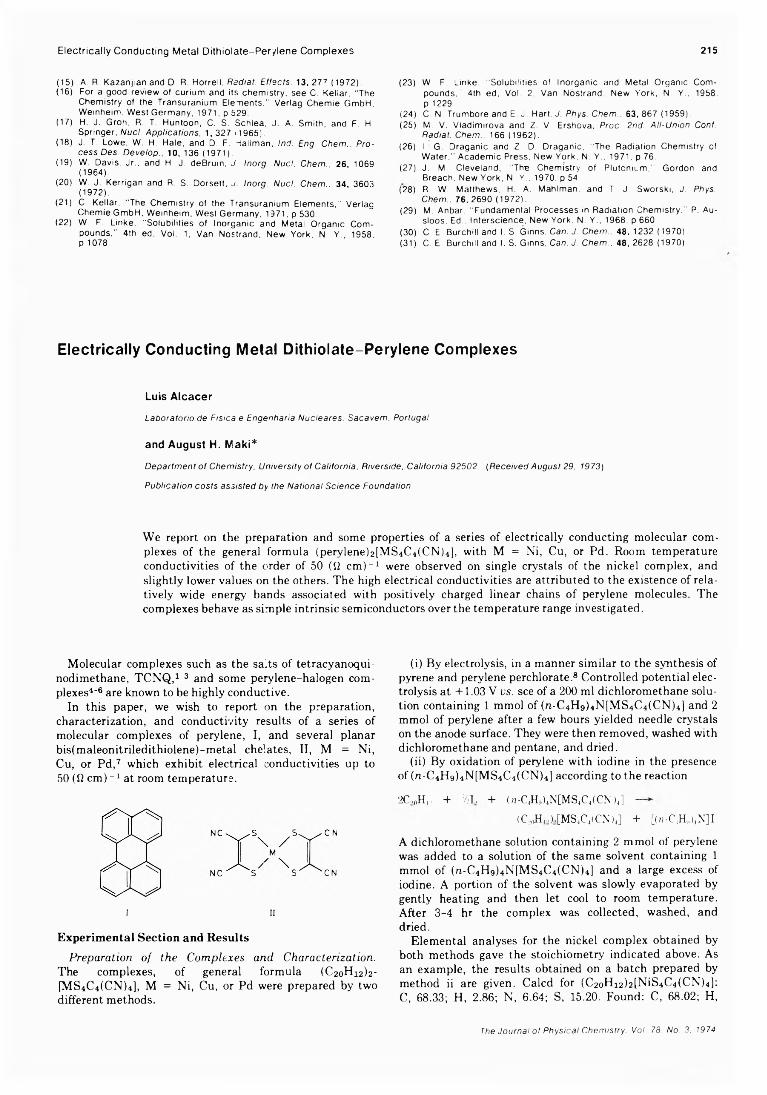
G(02) fo r N itric A c id and 0.4 M H 2 S O i -N a N O s S olu tions. Values for G(02) as a function of nitrate ion concentration in nitric or sulfuric acid are shown in Figure 4. Results with 2 1 0Po1 3 and 239Pu1 4 ' 1 5 are also presented. At 2 M N 03- and lower, results obtained with 210Po are lower than those obtained with 2 4 4Cm. Presently, there is no explanation for this. At 4 and 6 M N 03_, the results obtained with 210Po and 244Cm are in agreement. However, none of these results agree with those obtained from 239Pu radiolysis. Perhaps 239Pu may be affecting the radiation chemistry as the 239Pu concentration was 0.2-0.4 M 1 5 and because plutonium exhibits many oxidation states in aqueous solution.
In an attempt to resolve this question, gas evolution rates from solutions containing both 244Cm and 239Pu were measured. The 239Pu concentration was 50 g/1., and 2 4 4 Cm, either 0.70 or 0.57 g/1. In these solutions, >94% of the a energy was from 2 4 4Cm; 239Pu was added only to determine its chemical effect. Several hours before an experiment, the valence state of the 239Pu was adjusted to + 4 by treatment of a >1 M HNO3 solution with nitrous acid. 27 Spectrophotometric studies1 4 1 5 have indicated that this oxidation state does net change during radiolysis of >1 M HNO3 solutions. Results with 2 4 4Cm-239Pu mixtures are summarized in Table II. To completely duplicate published experiments, - 4 ' 1 5 some solutions were not agitated during radiolysis. Values for G(02) and G(H2) from solutions that were agitated agree with values determined in the absence of Pu(IV). Consequently, under our conditions, G(02) is not affected by Pu(IV). This leads to the conclusion that the earlier suggestion1 5 that oxygen results from plutonium-catalyzed decomposition of hydrogen peroxide is incorrect. Results with experiments where the solutions were not agitated clearly indicate that a sizeable fraction of the radiclytic gases can remain in solution; also, the higher the nitric acid concentration, the larger is this fraction. Residual gases may account for part of the observed trend1 4 ' 1 5 in G(02) and G(H2) with nitric
0 5 10
[N03'],M
Figure 4. Dependence of G (0 2) on n itrate concentration in a radiolysis: • , H N 0 3- 244Cm, this work; ■ . NaNO3-0 .4 M H2S 0 4, this work; ♦ , HNO3- 210Po, ref 13; ▲, H N 0 3- 239Pu, ref H a n d 15.
TABLE II: E ffect o f Pu(IV) on G (0 2) fro m HNOs Solutions w ith M,C m as the a Source[N O ,r ] ,°
M
P u (IV ),g/1.
244Cm,g/1. G (0 ,) G (H 2) R em arks
5.6 50.0 0.7 0.75 6 0.13 Solution agitated5.6 50.0 0.7 0.31 0.08 Solution not agitated
1 0 . 1 50.0 0.57 0.94 0 . 1 0 Solution agitated1 0 . 1 50.0 0.57 0 . 2 1 0.07 Solution not agitated° C alcu lated to ta l N O 3- contain in g species in solu tion . b A verage o f three
independent experim ents.
acid concentration in 239Pu solutions. However, the residual gas fraction is apparently not the only factor causing the difference, since G(02) in our nonagitated experiments is still not smaller than G(H2) as in the 239Pu experiments. In view of our correct determination of G(H2) in 0.4 M H2S0 4, we feel that our results are the correct initial yields of oxygen from a radiolysis of nitric acid or NaNO3-0.4 M H2S0 4 solutions.
The results for G(02) from 7 4 ' 9 and a radiolysis with 244Cm and 210Po are compared in Figure 5. In a radiolysis, values for G(02) in nitric acid differed from those in 0.4 M H2S0 4-N aN 0 3 by 8 % or less at comparable nitrate ion concentrations. Consequently, G(02) is apparently the same in nitric acid or H2S0 4 -NaN 0 3 solutions. This result disagrees with 7 -radiolysis studies9 where G(02) was lower for nitric acid solutions. It was suggested9 that the direct interaction of radiation with nitric acid produces OH and N02 radicals rather than the precursor of oxygen. Recent data, however, refute this suggestion. 28 Agreement between our results and also the results for 210Po radiolysis of 4 and 6 M HN03 supports the conclusion that this mode of decomposition is not occurring in a radiolysis.
Results for G(02) for a radiolysis at any nitrate ion concentration are within 30% of those for 7 radiolysis. When the a radiolysis of water is compared to 7 radiolysis, the radical yields (G(OH) and G(eaq_) + G(H)), decrease by a factor of ~ 6 , and the molecular product yields (G(H2) and G(H2 0 2)) increase by factors of 3.5 and 1.8, respectively . 29 One would expect that if these species were directly involved in oxygen production, a much larger difference would be observed between the effects of a and 7 radiation on G(02). Further, there is no mechanistic reason to assume that the products from radiolysis of water interact with nitrate ion to produce oxygen in a radiolysis
The Journal of Physical Chemistry. Vol. 78. No. 3. 1974
214 Ned E. Bibler
Figure 5. Dependence of G(C>2) on n itrate concentration in a and 7 radiolysis: • , HNC>3- 244Cm a , this work; ■ , NaNC>3- 0.4 M H2S0 4- 244Cm a , this work; ♦ , HNO3- 210Po a , ref 13; ▲, N aN 0 3- H 20 60Co y , ref 9; T , H N 0 3 60Co 7 , ref 9.
Figure 6 . G ( 0 2) / / h2o vs. fno3- .A h2o for a radiolysis: •, H N 0 3 solutions; ■ , NaNO3-0 .4 M H2S 0 4 solutions.
when it has been shown that they do not in 7 radiolysis . 4
On this basis, we conclude that the increase in G (0 2) with increasing nitrate ion concentration is due to oxygen produced from a direct effect in the radiolysis of nitrate ions in a radiolysis as in 7 radiolysis . 2 b - 4
It is appropriate to briefly mention here some results of experiments with 0.05 M 2-propanol and 0.2 M ethanol as solutes in 5 M HNO 3 . As expected, since nitrate ions effectively scavenge hydrogen atoms, neither solute affected G(H 2). However, both solutes reduced G (0 2) from 0.65 to negative values. With 2-propanol, not only was the radio- lytic production of oxygen stopped, but also the oxygen present initially as dissolved air in the sample was depleted. With ethanol, oxygen was still present after radiolysis, but its concentration in the gas above the sample had decreased significantly. Because these organic solutes form intermediates that apparently react with molecular oxygen, these experiments contribute no information concerning the precursors of oxygen. The organic intermediates are probably radicals formed by O H attack. It has been shown that ( C H 3 ) 2 C O H and C H 3 C H O H are easily oxidized in H 2 0 2 in an electron transfer chain mechanism . 3 0 3 1 It is reasonable to assume that such radicals can also be oxidized by molecular oxygen.
Results for G (0 2) obtained for a radiolysis (Figure 5) were further analyzed by application of eq 2
G(0 2) — / » , ( ) « 0 2)„,,0 + f m G(0 2)NO;i (2)
wheref h„o and ( Nor = the electron fractions of water
and nitrate ion in solution
G(02)h.,o and G(02)NO,- = the respective 1 0 0 -eV yields from the two components
A plot of G(02 )//h2o v s . /no3- //H20 for both systems is in Figure 6 . Results are linear, indicating adherence to eq 2. The intercept at zero nitrate concentration is ~-0.2 mole- cule/100 eV and can be equated to the yield of oxygen from the radiolysis of water. This value agrees with those obtained from a radiolysis of 0.4 M H2S0 4 both in this work and that by Vladimirova. 25 Also, this agrees with the value determined from a radiolysis of very dilute (0 . 0 1
M ) nitric acid solutions. 1 3 A value of ~0.1 has been determined2® for this quantity from 7 radiolysis of solutions containing nitrate ions. 4
It is well documented in 7 -radiolysis experiments that G(02) and G(N02~) vary with nitrate ion concentration as indicated by eq 2. 2®’ 3 ’ 6 ' 10 Also, determinations of G(OH) in concentrated nitrate solutions indicate that OH radical production is proportional to the electron fraction of water present. 3 ’ 10 28 To our knowledge, the data in Figure 6 are the first experimental demonstration that energy from a particles is partitioned in solutions containing nitrate ion in the same manner as energy from 7 rays, i.e., partitioned presumably according to the electron fraction of the two components. Values for G(02)NO3- calculated from the slopes are 2.0 for the nitric acid system and 2.4 for the 0.4 M H2S 0 4-NaN0 3 system. This difference results from the slightly higher values for G(02) in the 0.4 M H2S 0 4-NaN 0 3 solution being magnified by electron- fraction calculations that include the presence of sodium ion and sulfuric acid. Accordingly, even though the lines are well defined, the differences can be attributed to experimental error. Consequently, in this study, G(N2)n03- is 2.2 ± 0.2. This is in reasonable agreement with the value calculated2® from the 7 radiolysis of botn neutral and acidic nitrate ion solutions, 7 and is experimental evidence suggesting that the efficiency of energy transfer to nitrate ions is apparently independent of the type of incident radiation. Because energy is transferred primarily by secondary electrons rather than by the incident particles, it is expected that similar excited states of nitrate ions are produced by 7 and a radiolysis.
References and Notes(1) The information contained in this artic le was developed during the
course of work under Contract AT(07-2)-1 with the U. S. Atomic Energy Commission.
(2) (a) M. Daniels and E. E. Wigg, J. Phys. Chem.. 71, 1024 (1967); (b) M. L. Hyder, ibid.. 69, 1658 (1965).
(3) M. Faraggi, D. Zehavi, and M. Anbar, Trans. Faraday Soc.. 67, 701 (1971).
(4) H. A. Mahlman. J. Phys. Chem.. 67, 1466 (1963).(5) H. A. Mahlman and J. W. Boyle, J. Chem. Phys.. 27, 1434 (1957).(6) P. K. Battacharyya and R. D. Saini, Int. J. Radiat. Phys. Chem.. 5,
91 (1973).(7) T. J. Sworski, R. W. Mathews, and H. A. Mahlman. Advan. Chem.
Ser.. No. 81, 164 (1968).(8) A. R. Kazanjian. F. J. Miner, A. K. Brown. P. G. Hagan, and J. W.
Berry, Trans. Faraday Soc.. 66,2192 (1970).(9) H. A. Mahlman, J. Chem. Phys.. 35, 936 (1961).
(10) M. Daniels, Advan. Chem. Ser., No. 81, 153 (1968).(11) M. V. Vladimirova. I. A. Kulikov, and L. G. Shulyatikova, Sov. Radi-
ochem.. 8, 207 (1966).(12) Z. V. Ershova, M. V. Vladimirova, and Yu. I. Savel’ev. Sov. Radi-
ochem.. 8, 395 (1966).(13) Yu. I. Savel'ev, Z. V. Ershova, and M. V. Vladimerova, Sov. Radi- ochem.. 9, 221 (1967).(14) J. C. Sheppard, USAEC Report BNWL-751, May 1968.
The Journal of Physical Chemistry. Vol. 78. No. 3. 1974
Electrically Conducting Metal Dithlolate-Perylene Complexes
(15) A. R. Kazanjian and D. R. Horrell, Radiat. Eftscts. 13, 277 (1972).(16) For a good review of curium and Its chemistry, see C. Kellar, "The
Chemistry of the Transuranium Elements," Verlag Chemie GmbH. Weinheim, West Germany, 1971, p 529.
(17) H. J. Groh, R. T. Huntoon, C. S. Schlea, J. A. Smith, and F. H. Springer, Nucl. Applications, 1 ,327 11965).
(18) J. T. Lowe, W. H. Hale, and D. F. Hallman, ind. Eng. Chem., Process Des. Develop., 10, 136 (1971).
(19) W. Davis, Jr., and H. J. deBruin, J. Inorg. Nucl. Chem., 26, 1069 (1964).
(20) W. J. Kerrigan and R. S. Dorsett, j . Inorg. Nucl. Chem.. 34, 3603 (1972).
(21) C. Kellar, “ The Chemistry of the Transuranium Elements," Verlag Chemie GmbH, Weinheim, West Germany, 1371, p 530.
(22) W. F. Linke, "Solubilities of Inorganic and Metal Organic Compounds,” 4th ed, Vol. 1, Van Nostrand, New York, N. Y., 1958, p 1078.
215
(23) W. F. Linke. "Solubilities of Inorganic and Metal Organic Compounds," 4th ed, Vol. 2, Van Nostrand, New York, N. Y.. 1958, p 1229.
(24) C. N. Trumbore and E. J. Hart, J. Phys. Chem.. 63, 867 (1959).(25) M. V, Vladimirova and Z. V. Ershova, Proc. 2nd. All-Union Coni.
Radiat. Chem.. 166 (1962).(26) I. G. Draganlc and Z. D. Draganlc, "The Radiation Chemistry of
W ater,” Academic Press, New York, N. Y., 1971, p 76.(27) J. M. Cleveland, "The Chemistry of Plutonium," Gordon and
Breach, New York, N. Y., 1970, p 54.(28) R. W. Matthews, H. A. Mahlman. and T. J. Sworski, J. Phys.
Chem.. 76, 2690 (1972).(29) M. Anbar. "Fundamental Processes in Radiation Chemistry." P. Au-
sloos, Ed.. Interscience, New York, N. Y., 1968. p 660.(30) C. E. Burchill and I. S. Ginns, Can. J. Chem.. 48. 1232 (1970).(31) C. E. Burchill and I. S. Ginns, Can. J. Chem., 48, 2628 (1970).
E le c t r ic a l ly C o n d u c t in g M e ta l D i t h i o la t e - P e r y le n e C o m p le x e s
Luis Alcacer
Laboratorio de Fisica e Engenharia Nucleares. Sacavem. Portugal
and August H. Maki*
Department of Chemistry, University of California, Riverside, California 92502 (Received August 29. 1973) Publication costs assisted by the National Science Foundation
W e report on the preparation and som e properties of a series o f electrically conducting m olecular co m plexes of the general form ula (perylene)2[M S 4C 4(C N ) 4], with M = N i, Cu, or P d . R oom tem perature conductivities of the order of 50 (12 c m ) ' 1 were observed on single crystals of the nickel com plex, and slightly lower values on the others. T h e high electrical conductivities are attributed to the existence of relatively wide energy bands associated with positively charged linear chains o f perylene m olecules. The com plexes behave as sim ple intrinsic sem iconductors over the tem perature range investigated.
M olecular com plexes such as the salts of tetracyanoqui- nodim ethane, T C N Q ,1-3 and som e perylene-halogen com plexes4-6 are known to be highly conductive.
In this paper, we wish to report on the preparation, characterization, and conductivity results of a series of m olecular com plexes of perylene, I, and several planar bis(m aleonitriledithiolene)-m etal chelates, II, M = N i, C u, or P d ,7 which exhibit electrical conductivities up to 50 (12 c m ) - 1 at room tem perature.
i II
Experimental Section and ResultsPreparation of the Complexes and Characterization.
T h e com plexes, of general form ula (C 2oH i2)2- [M S 4C 4(C N ) 4], M = N i, Cu, or Pd were prepared by two different m ethods.
(i) B y electrolysis, in a m anner sim ilar to the synthesis of pyrene and perylene perchlorate .8 Controlled potential electrolysis at + 1 .0 3 V vs. see o f a 200 m l dichlorom ethane solution containing 1 m m ol of (n -C 4H 9)4N [M S 4C 4(C N ) 4] and 2
m m ol of perylene after a few hours yielded needle crystals on the anode surface. T hey were then rem oved, washed with dichlorom ethane and pentane, and dried.
(ii) B y oxidation of perylene with iodine in the presence of (m-C 4H 9)4N [M S 4C 4(C N )4] according to the reaction
2C,0H,._, + !4L + (a-C4H,)4N[MS4C4(CN)4] —(C2T hT [M S4C4(CN)4] + [(n-C4Ha)4N]I
A dichlorom ethane solution containing 2 m m ol of perylene was added to a solution of the sam e solvent containing 1
m m ol of (rc-C4H 9)4N [M S 4C 4(C N ) 4] and a large excess of iodine. A portion of the solvent was slow ly evaporated by gently heating and then let cool to room tem perature. After 3 -4 hr the com plex was collected, washed, and dried.
E lem ental analyses for the nickel com plex obtained by both m ethods gave the stoichiom etry indicated above. A s an exam ple, the results obtained on a batch prepared by m ethod ii are given. Calcd for (C 2oH 12)2[N iS 4C 4(C N )4]: C , 68 .33 ; H , 2 .86 ; N , 6 .64 ; S , 15.20. Found: C , 68 .02 ; H ,
The Journal of Physical Chemistry. Vol. 78. No. 3. 1974
216 Luis Alcacer and August H. Maki
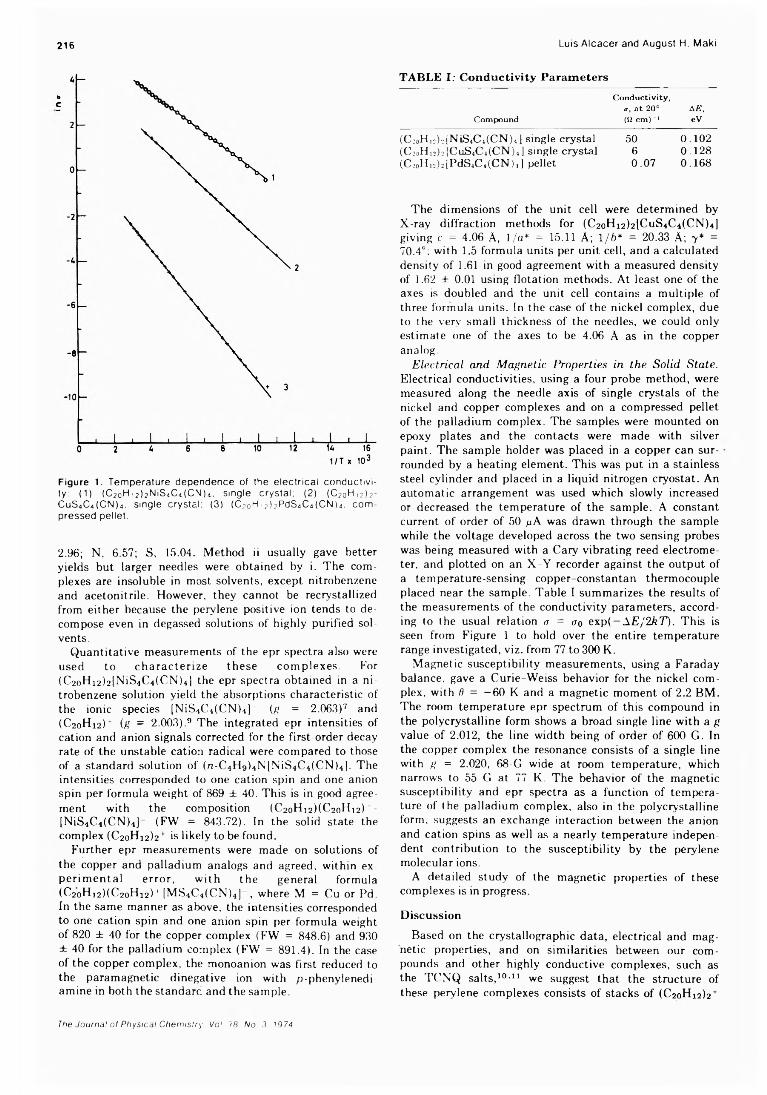
Figure 1. T e m pe ra tu re dependence of the e le c tr ic a l c o n d u c tiv ity: (1) (C 20H i 2) 2th S 4C4 (C N )4 i s ing le c rys ta l; (2) (020^ 12) 2- C uS 4C4(C N )4. s ing le c rys ta l: (3) (C 2o H ,2) 2PdS4C4(C N )4. c o m pressed pe lle t.
2 .96 ; N , 6 .57 ; S , 15.04. M ethod ii usually gave better yields but larger needles were obtained by i. T h e com plexes are insoluble in m ost solvents, except nitrobenzene and acetonitrile. However, they cannot be recrystallized from either because the perylene positive ion tends to decom pose even in degassed solutions of highly purified solvents.
Q uantitative m easurem ents of the epr spectra also were u sed to c h a ra c te r ize th e se c o m p le x e s . For (C 2oH 12)2[N iS 4C 4(C N ) 4l the epr spectra obtained in a n itrobenzene solution yield the absorptions characteristic of the ionic species |NiS4C 4(C N ) 4] (g = 2 .06 3 )7 and (C 2oH i 2) + (g = 2 .0 0 3 ).9 T h e integrated epr intensities of cation and anion signals corrected for the first-order decay rate of the unstable cation radical were com pared to those of a standard solution of (n -C 4H 9)4N [N iS 4C 4(C N ) 4 l. T h e intensities corresponded to one cation spin and one anion spin per form ula weight of 869 ± 40. T h is is in good agreem ent with the com position (C 2oH i 2) (C 2oH i 2) + - [N iS 4C 4(C N )4] - (F W = 843 .7 2). In the solid state the com plex (C 2oH i 2) 2 + is likely to be found.
Further epr m easurem ents were m ade on solutions of the copper and palladium analogs and agreed, within exp e r im e n ta l error, w ith th e general formula (C 2oH i 2) (C 2oH i 2) + [M S 4C 4(C N )4] , where M = Cu or Pd. In the sam e m anner as above, the intensities corresponded to one cation spin and one anion spin per form ula weight of 820 ± 40 for the copper com plex (F W = 848 .6) and 930 ± 40 for the palladium com plex (F W = 8 91 .4 ). In the case of the copper com plex, the m onoanion was first reduced to the param agnetic dinegative ion with p -phenylenedi- am ine in both the standarc and the sam ple.
TABLE I; Conductivity ParametersC on d u ctiv ity ,
a, a t 20° AE,C om pou n d (ii c m ) -1 eV
(Cc0Hic):[NiS4C i(C N )4] single crystal 50 0.102(C2oH,2 ); [CuS4C.i(CN)4] single crystal 6 0.128(C 2 oH,2)2lPdS4 C1(C N )1] pellet 0.07 0.168
T h e dim ensions of the unit cell were determ ined by X -ra y diffraction m ethods for (C 2oH i 2)2[C u S 4C 4(C N ) 4] giving c = 4 .06 A, 1 /a * = 15.11 A; 1 /5 * = 20.33 A; 7* = 7 0 .4 °: with 1.5 form ula units per unit cell, and a calculated density of 1.61 in good agreement with a m easured density of 1.62 ± 0.01 using flotation m ethods. A t least one of the axes is doubled and the unit cell contains a m ultiple of three form ula units. In the case of the nickel com plex, due to the very sm all thickness of the needles, we could only estim ate one of the axes to be 4 .06 A as in the copper analog.
Electrical and Magnetic Properties in the Solid State. Electrical conductivities, using a four probe m ethod, were measured along the needle axis of single crystals of the nickel and copper com plexes and on a com pressed pellet of the palladium com plex. T h e sam ples were m ounted on epoxy plates and the contacts were m ade with silver paint. T h e sam ple holder was placed in a copper can surrounded by a heating elem ent. T h is was put in a stainless steel cylinder and placed in a liquid nitrogen cryostat. A n autom atic arrangem ent was used which slowly increased or decreased the tem perature o f the sam ple . A constant current o f order of 50 gA was drawn through the sam ple while the voltage developed across the two sensing probes was being m easured with a Cary vibrating reed electrom eter, and plotted on an X - Y recorder against the output of a tem perature-sensing copper-constantan therm ocouple placed near the sam ple . T ab le I sum m arizes the results of the m easurem ents of the conductivity param eters, according to the usual relation <r = a0 exp ( — A E /2kT r). T h is is seen from Figure 1 to hold over the entire tem perature range investigated, viz. from 77 to 300 K .
M agnetic susceptibility m easurem ents, using a Faraday balance, gave a C u rie-W eiss behavior for the nickel co m plex. with t) = - 6 0 K and a m agnetic m om en t of 2 .2 B M . T h e room tem perature epr spectrum o f this com pound in the polycrystalline form shows a broad single line w ith a g value of 2 .012, the line w idth being of order o f 600 G . In the copper com plex the resonance consists o f a single line with g = 2 .020, 6 8 -G wide at room tem perature, which narrows to 55 G at 77 K . T h e behavior of the m agnetic susceptibility and epr spectra as a function of tem perature of the palladium com plex, also in the polycrystalline form , suggests an exchange interaction between the anion and cation spins as well as a nearly tem perature independent contribution to the susceptibility by the perylene m olecular ions.
A detailed study of the m agnetic properties of these com plexes is in progress.
DiscussionBased on the crystallographic data , electrical and m ag
netic properties, and on sim ilarities between our com pounds and other highly conductive com plexes, such as the T C N Q salts , 10-11 we suggest that the structure of these perylene com plexes consists o f stacks o f (C 2oH i 2)2 +
The Journal of Physical Chemistry. Vol. f 8. No. 3. 1974
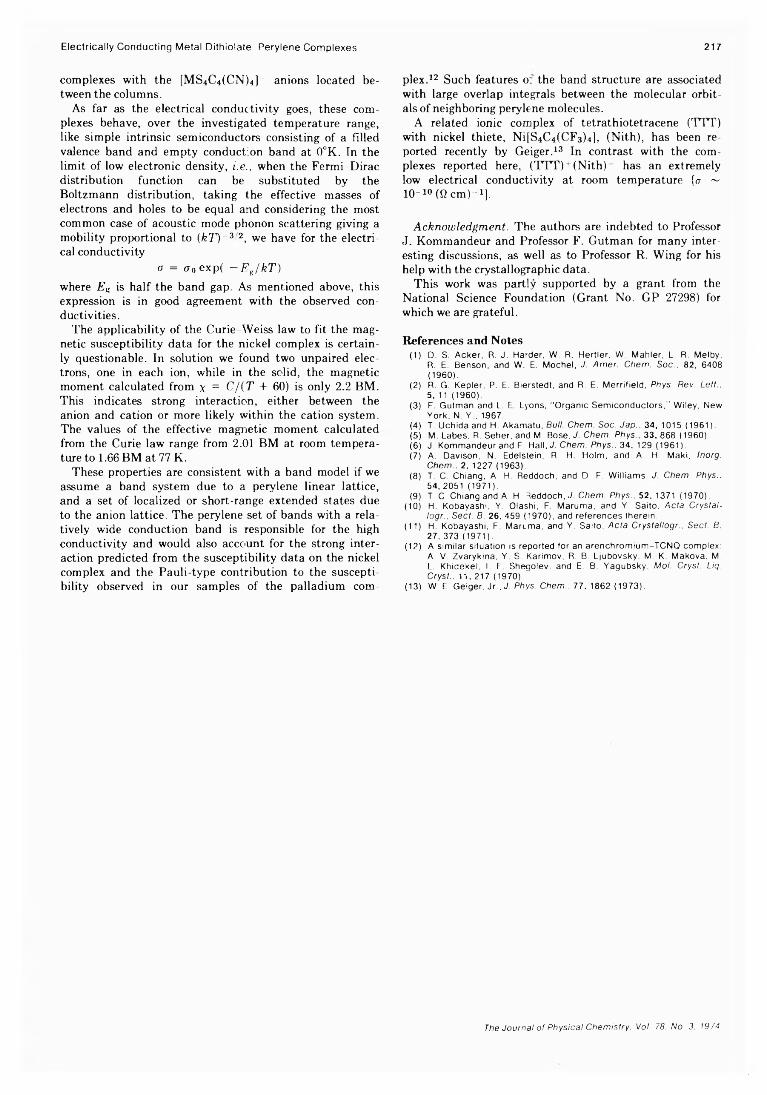
com plexes with the [M S 4C 4(C N ) 4]~ anions located b e tween the colum ns.
A s far as the electrical conductivity goes, these com plexes behave, over the investigated tem perature range, like sim ple intrinsic sem iconductors consisting of a filled valence band and em p ty conduction band at 0 °K . In the lim it o f low electronic density, i.e., when the F erm i-D irac distribution function can be substituted by the B oltzm ann distribution, taking the effective m asses of electrons and holes to be equal and considering the m ost com m on case of acoustic m ode phonon scattering giving a m obility proportional to (kT)~z 2, we have for the electrical conductivity
a = ao exp ( —E JkT )where Eg is half the band gap. A s m entioned above, this expression is in good agreem ent with the observed conductivities.
T h e applicability o f the C u rie -W eiss law to fit the m agnetic susceptibility data for the nickel com plex is certainly questionable. In solution we found two unpaired electrons, one in each ion, while in the solid, the m agnetic m om ent calculated from x = C/(T + 60) is only 2 .2 B M . T h is indicates strong interaction, either between the anion and cation or more likely within the cation system . T h e values of the effective m agnetic m om en t calculated from the Curie law range from 2.01 B M at room tem perature to 1.66 B M at 77 K .
These properties are consistent with a band m odel if we assum e a band system due to a perylene linear lattice, and a set of localized or short-range extended states due to the anion lattice. T h e perylene set o f bands with a relatively wide conduction band is responsible for the high conductivity and would also account for the strong interaction predicted from the susceptibility data on the nickel com plex and the P au li-type contribution to the susceptibility observed in our sam ples o f the palladium com
Electrically Conducting Metal Dithiolate-Perylene Complexes 217
plex. 1 2 Such features o: the band structure are associated with large overlap integrals between the molecular orbitals of neighboring perylene molecules.
A related ionic complex of tetrathiotetracene (TTT) with nickel thiete, Ni[S4C4 (CF3 )4 ], (Nith), has been reported recently by Geiger.1 3 In contrast with the complexes reported here, (TTT)+ (Nith)- has an extremely low electrical conductivity at room temperature [a ~ 1 0 ~ 10 (Q cm) _1],
A ck n ow led g m en t. The authors are indebted to ProfessorJ. Kommandeur and Professor F. Gutman for many interesting discussions, as well as to Professor R. Wing for his help with the crystallographic data.
This work was partly supported by a grant from the National Science Foundation (Grant No. GP 27298) for which we are grateful.
References and Notes(1) D. S. Acker, R. J. Harder, W. R. Hertler, W. Mahler, L. R. Melby,
R. E. Benson, and W. E. Mochel, J. Amer. Chem. Soc., 82, 6408 (1960).
(2) R. G. Kepler, P. E. Bierstedt, and R. E. Merrlfield, Phys. Rev. Lett., 5, 11 (1960).
(3) F. Gutman and L. E. Lyons, “ Organic Semiconductors," Wiley, New York, N. Y., 1967.
(4) T. Uchida and H. Akamatu, Bull. Chem. Soc. Jap.. 34, 1015 (1961).(5) M. Labes. R. Seher, and M. Bose, J. Chem. Phys., 33, 868 (1960).(6) J. Kommandeur and F. Hall, J. Chem. Phys.. 34, 129 (1961).(7) A. Davison, N. Edelstein, R. H. Holm, and A. H. Maki, Inorg.
Chem.. 2, 1227 (1963).(8) T. C. Chiang, A. H. Reddoch, and D. F. W illiams J. Chem. Phys..
54, 2051 (1971).(9) T. C. Chiang and A. H. Reddoch, J. Chem. Phys.. 52, 1371 (1970).
(10) H. Kobayashi, Y. Olashi, F. Maruma, and Y. Saito, Acta Crystal- logr.. Sect B. 26, 459 (1970), and references therein.
(11) H. Kobayashi, F. Mamma, and Y. Saito, Acta Crystallogr.. Sect. B. 27, 373 (1971).
(12) A similar situation is reported for an arenchromium-TCNQ complex: A. V. Zvaryklna, Y. S. Karimov, R. B. Ljubovsky, M. K. Makova, M. L. Khidekel, I. F. Shegolev, and E. B. Yagubsky, Mol. Cryst. Liq. Cryst.. n , 217 (1970).
(13) W. E. Geiger, J r „ J. Phys. Chem.. 77, 1862 (1973).
The Journal of Physical Chemistry. Vol. 78. No. 3. 1974
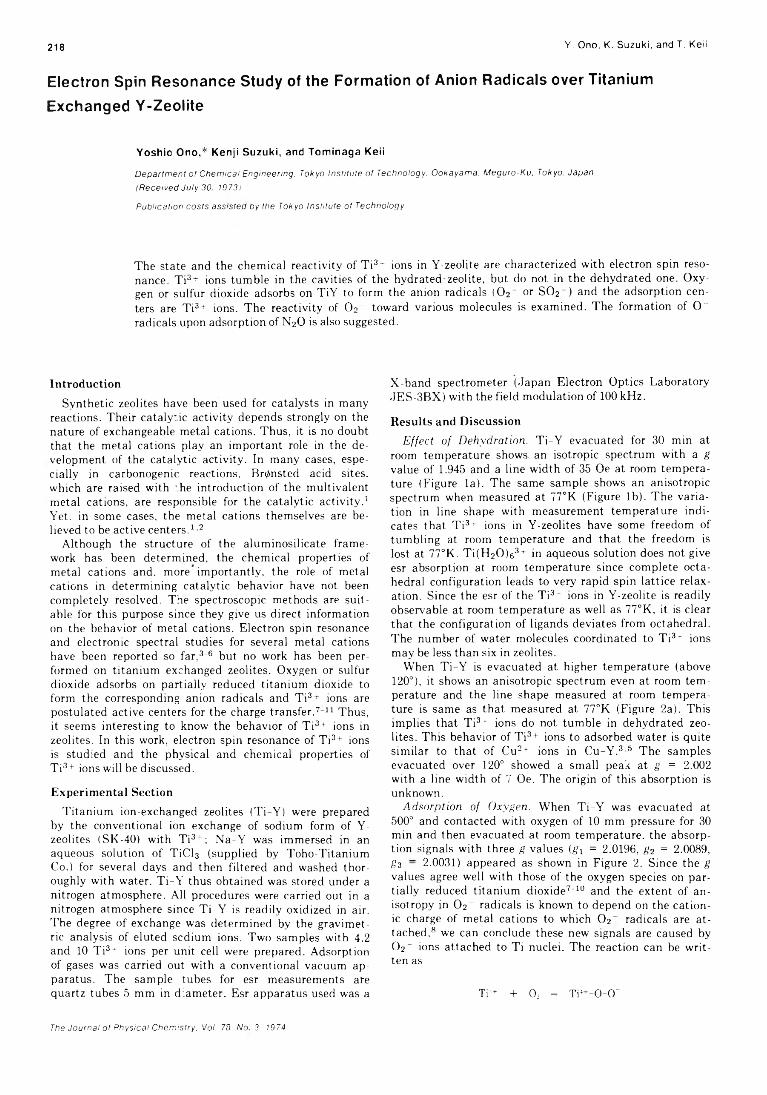
218 Y. Ono, K. Suzuki, and T. Keii
E le c t r o n S p in R e s o n a n c e S t u d y o f t h e F o r m a t io n o f A n io n R a d i c a ls o v e r T ita n iu m
E x c h a n g e d Y - Z e o l i t e
Yoshio Ono,* Kenji Suzuki, and Tominaga Keii
Department of Chemical Engineering. Tokyo Institute of Technology. Ookayama. Meguro-Ku, Tokyo. Japan (Received July 30. 1973)Publication costs assisted by the Tokyo Institute of Technology
The state and the chemical reactivity of Ti3* ions in Y-zeolite are characterized with electron spin resonance. Ti3 + ions tumble in the cavities of the hydrated zeolite, but do not in the dehydrated one. Oxygen or sulfur dioxide adsorbs on TiY to form the anion radicals (02~ or S02') and the adsorption centers are Ti3+ ions. The reactivity of 0 2- toward various molecules is examined. The formation of O" radicals upon adsorption of N20 is also suggested.
IntroductionSynthetic zeolites have been used for catalysts in many
reactions. Their catalytic activity depends strongly on the nature of exchangeable metal cations. Thus, it is no doubt that the metal cations play an important role in the development of the catalytic activity. In many cases, especially in carbonogenic reactions. Brdnsted acid sites, which are raised with the introduction of the multivalent metal cations, are responsible for the catalytic activity. 1
Yet, in some cases, the metal cations themselves are believed to be active centers. 1 -2
Although the structure of the aluminosilicate framework has been determined, the chemical properties of metal cations and, more importantly, the role of metal cations in determining catalytic behavior have not been completely resolved. The spectroscopic methods are suitable for this purpose since they give us direct information on the behavior of metal cations. Electron spin resonance and electronic spectral studies for several metal cations have been reported so far, 3-6 but no work has been performed on titanium exchanged zeolites. Oxygen or sulfur dioxide adsorbs on partially reduced titanium dioxide to form the corresponding anion radicals and Ti3+ ions are postulated active centers for the charge transfer. 7 1 1 Thus, it seems interesting to know the behavior of Ti3+ ions in zeolites. In this work, electron spin resonance of Ti3+ ions is studied and the physical and chemical properties of Ti3+ ions will be discussed.
Experimental SectionTitanium ion-exchanged zeolites (Ti-Y) were prepared
by the conventional ion exchange of sodium form of Y- zeolites (SK-40) with Ti3j_; Na-Y was immersed in an aqueous solution of TiCU (supplied by Toho-Titanium Co.) for several days and then filtered and washed thoroughly with water. Ti-Y thus obtained was stored under a nitrogen atmosphere. All procedures were carried out in a nitrogen atmosphere since Ti-Y is readily oxidized in air. The degree of exchange was determined by the gravimetric analysis of eluted scdium ions. Two samples with 4.2 and 10 Ti3* ions per unit cell were prepared. Adsorption of gases was carried out with a conventional vacuum apparatus. The sample tubes for esr measurements ate quartz tubes 5 mm in diameter. Esr apparatus used was a
X-band spectrometer (Japan Electron Optics Laboratory JES-3BX) with the field modulation of 100 kHz.
Results and DiscussionE ffec t o f D eh yd ration . T i-Y evacuated for 30 min at
room temperature shows an isotropic spectrum with a g value of 1.945 and a line width of 35 Oe at room temperature (Figure la). The same sample shows an anisotropic spectrum when measured at 77°K (Figure lb). The variation in line shape with measurement temperature indicates that T i3* ions in Y-zeolites have some freedom of tumbling at room temperature and that the freedom is lost at 77°K. Ti(H2 0)63+ in aqueous solution does not give esr absorption at room temperature since complete octahedral configuration leads to very rapid spin lattice relaxation. Since the esr of the Ti3 ions in Y-zeolite is readily observable at room temperature as well as 77°K, it is clear that the configuration of ligands deviates from octahedral. The number of water molecules coordinated to Ti3 ions may be less than six in zeolites.
When Ti-Y is evacuated at higher temperature (above 1 2 0 °), it shows an anisotropic spectrum even at room temperature and the line shape measured at room temperature is same as that measured at 77°K (Figure 2a). This implies that Ti3+ ions do not tumble in dehydrated zeolites. This behavior of Ti3+ ions to adsorbed water is quite similar to that of Cu2+ ions in Cu-Y . 3 5 The samples evacuated over 1 2 0 ° showed a small peak at g = 2 . 0 0 2
with a line width of 7 Oe. The origin of this absorption is unknown.
A d sorp tion o f O xygen . When Ti-Y was evacuated at 500° and contacted with oxygen of 10 mm pressure for 30 min and then evacuated at room temperature, the absorption signals with three g values (gi = 2.0196, g2 = 2.0089, gz — 2.0031) appeared as shown in Figure 2 . Since the g values agree well with those of the oxygen species on partially reduced titanium dioxide7 - 1 0 and the extent of anisotropy in 0 2~ radicals is known to depend on the cationic charge of metal cations to which 0 2 radicals are attached, 8 we can conclude these new signals are caused by 0 2~ ions attached to Ti nuclei. The reaction can be written as
Ti:,+ + 02 = Ti4+-0-CT
The Journal of Physical Chemistry. Voi. 78. No. 3. 1974
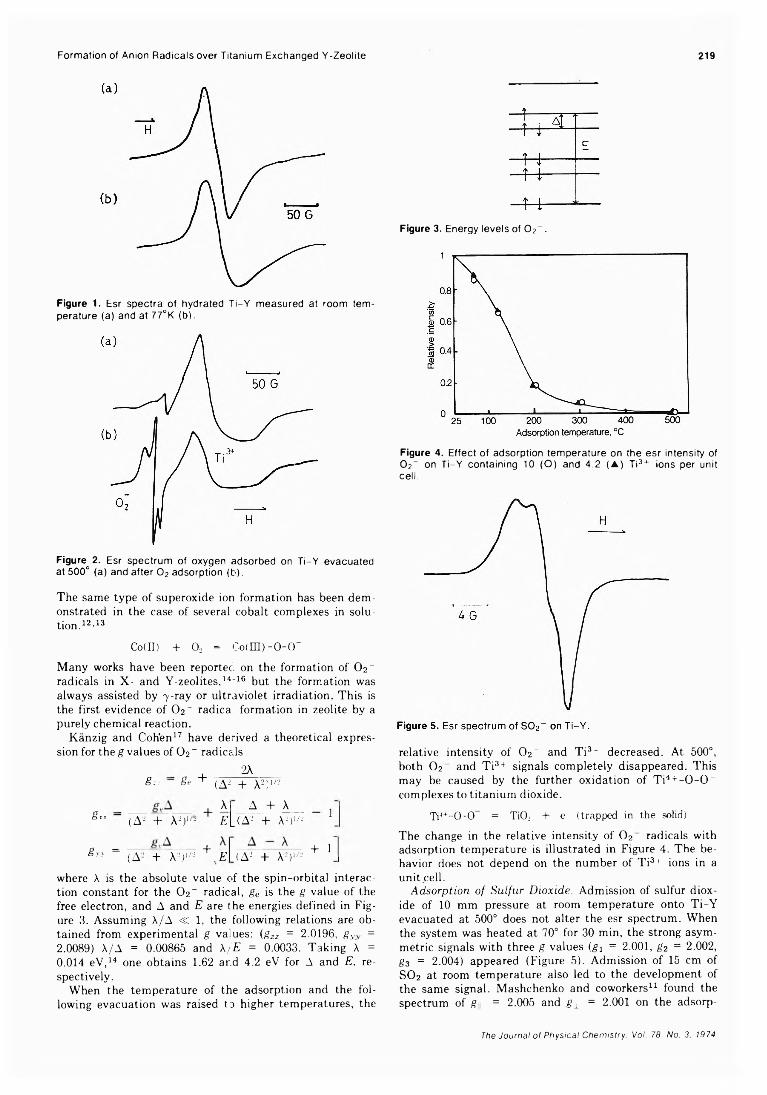
Formation of Anion Radicals over Titanium Exchanged Y-Zeolite 219
Figure 1. E s r s p e c tra o f h y d ra te d T i- Y m e a s u re d a t ro o m te m p e ra tu re (a ) a n d a t 7 7 °K (b ).
Figure 2 . E sr s p e c tru m o f o x y g e n a d s o rb e d o n T i- Y e v a c u a te d a t 5 0 0 ° (a ) a n d a f te r 0 2 a d s o rp t io n (b ).
The same type of superoxide ion formation has been demonstrated in the case of several cobalt complexes in solution. 1 2 ' 13
Cot id + o2 = C o<m )-o -o_
Many works have been reportec on the formation of O2 - radicals in X- and Y-zeolites, 1 4 - 1 6 but the formation was always assisted by y-ray or ultraviolet irradiation. This is the first evidence of O2 “ radical, formation in zeolite by a purely chemical reaction.
Kanzig and Coh'en1 7 have derived a theoretical expression for the g values of O2 “ radicals
, 2A8 :: - ge + ( A 2 + X2;1'2
§ x x (A2 + X2)122X A + X E|_(A2 + X2)122 1
g = ------ -------------- 1- —8y> (A - + X2 )122 E (A2 + X2)122 + 1
where X is the absolute value of the spin-orbital interaction constant for the 0 2 ~ radical, g e is the g value of the free electron, and A and E are the energies defined in Figure 3. Assuming X/A <S 1, the following relations are obtained from experimental g values: (g22 = 2.0196, g yv = 2.0089) X/A = 0.00865 and \/E = 0.0033. Taking X = 0.014 eV , 14 one obtains 1.62 ar.d 4.2 eV for A and E, respectively.
When the temperature of the adsorption and the following evacuation was raised to higher temperatures, the
Figure 3. E n e rg y le v e ls o f 0 2^ .
Figure 4. E ffe c t o f a d s o rp t io n te m p e ra tu re o n th e e s r in te n s ity o f 0 2_ o n T i- Y c o n ta in in g 10 ( O ) a n d 4 .2 (A) T l3+ Ion s p e r u n it c e ll.
relative intensity of O2 - and Ti3+ decreased. At 500°, both 0 2 and Ti3+ signals completely disappeared. This may be caused by the further oxidation of Ti4 + -0-0~ complexes to titanium dioxide.
Tj4+_0-0_ = Ti02 + e (trapped in the solid)
The change in the relative intensity of 0 2 radicals with adsorption temperature is illustrated in Figure 4. The behavior does not depend on the number of Ti3+ ions in a unit cell.
A d sorp tion o f Sulfur D ioxide. Admission of sulfur dioxide of 10 mm pressure at room temperature onto Ti-Y evacuated at 500° does not alter the esr spectrum. When the system was heated at 70° for 30 min, the strong asymmetric signals with three g values (g 1 = 2 .0 0 1 , g2 = 2 .0 0 2 , g 3 = 2.004) appeared (Figure 5). Admission of 15 cm of SO2 at room temperature also led to the development of the same signal. Mashchenko and coworkers1 1 found the spectrum of g|| = 2.005 and g ± = 2.001 on the adsorp
The Journal of Physical Chemistry, Voi. 78, No. 3. 1974
220 Y. Ono, K. Suzuki, and T. Keii
tion of sulfur dioxide on titanium dioxide and attributed it to SO2 radicals. Since the g values of our system are very close to those of S0 2-T i0 2 system, we conclude that sulfur dioxide adsorbs on Ti-Y to form S02~ radicals.
Ti3+ + SO, = T i5+-SOT
When the system was heated to higher temperature, additional peaks appeared; for example, at 300°, seven peaks appeared at g = 2.001, 2.003, 2.005, 2.007, 2.011, 2.016, and 2.022. These peaks may be caused by S02~ radicals which are located at several different sites. The formation of S02- radicals are observed also when sulfur dioxide adsorbed on decationated Y-zeolites at 300°. The g values in this case were 2.007, 2.003, and 2.001.
R ea ctiv ity o f 0 2~ . 0 2~ radicals were generated by the introduction of oxygen at room temperature to Ti-Y and the system was evacuated for 15 min. Then, ethylene, acetylene, 1 -butene, or carbon monoxide was admitted to the system at room temperature and the change in the intensity of 0 2~ signal was monitored with time. In each case, 0 2~ intensity decreased with time without showing the development of new radical species. For acetylene, 60% of 0 2~ radicals disappeared in 30 min and 30% of 0 2~ radicals disappeared in 30 min on addition of ethylene or carbon monoxide. 0 2 showed much less reactivity toward 1 -butene.
R ea ction o f S 0 2~ w ith O xygen . When sulfur dioxide was admitted to the dehydrated Ti-Y zeolites and evacuated at room temperature for 15 min, the system showed the characteristic spectrum of S02~. When oxygen of 20 mm pressure was admitted to the system, the signal ofS0 2- disappeared and signals due to 0 2_ appeared. When the system was evacuated, the intensity of 0 2- remained almost unchanged, but the signal of S02_ reappeared though the intensity was about % of the original.
R ea ction o f N itrous O xide. T i-Y zeolite was evacuated at 500°, contacted with nitrous oxide for 30 min, and then evacuated at various temperatures. No appreciable change was observed in the esr spectrum below 120°. At 200°, however, the intensity of Ti3+ decreased to one-third of the original and, at the same time, the signal with g values of 2.017 and 2.001 developed. The origin of the radical is not yet clear. One possibility is O radicals formed
by the following reaction
T i3+ + N,0 = T i4+-0~ + N2
The similar reaction of N20 to form O ” is postulated for the decomposition of N20 over V2 0s18 and MgO . 1 9 -20
Shvets and Kazanskii2 1 reported the formation of strong signals with g values of g n = 2 . 0 1 1 and g x = 2 . 0 0 2 on the adsorption of nitrous oxide and subsequent irradiation of silica-supported titanium dioxide.
Summary
The formation of 0 2~ and S02~ radicals is clearly demonstrated in Ti-Y and the g values of esr signals of these anions are very close to those of the same anion radicals on titanium dioxide. This strongly supports the idea that the adsorption centers of titanium dioxide for these gases are trivalent titanium ions. The formation of 0 “ ions is also suggested.
References and Notes(1) J. A. Rabo and M. L. Poustma, Advan. Chem. Ser., No. 10 2 , 284
(1971).(2) K. Hatada, Y. Ono, and T. Keii, Advan. Chem. Ser., No. 1 2 1 , 501
(1973).(3) A. Nicula, D. Stamires. and J. Turkevich, J. Chem. Phys.. 42 . 3634
(1965).(4) J. Turkevich, Y. Ono, and J. Soria, J. Catal.. 2 5 , 4Z- (1972).(5) I. D. Mikheikin, V. A. Shvets, and V. B. Kazanskii, Kinet. Katal.,
11, 747 (1970).(6) V. Y. Lygin, Advan. Chem. Ser., No. 102, 86 (1971).(7) A. I. Mashchenko, V. B. Kazanskii, G. B. Pariskii, and V. M. Shara
pov. Kinet. Katal., 8, 853 (1967).(8) I. D. Mikheikin, A. I. Mashchenko, and V. B. Kazanskii, Kinet.
Katal.. 8, 1363 (1967).(9) M. Che, C. Naccache, and B. Imelik, J. Chim. Phys.. 65, 1301
(1968).(10) C. Naccache, P. Mariaudeu, and M. Che, Trans. Faraday Soc., 67,
506 (1971).(11) A. Mashchenko, G. B. Pariskii, and V. B. Kazanskii, Kinet. Katal.,
9 , 151 (1968).(12) B. Hoffman, D. L. Diemente, and F. Basolo, J. Amer. Chem. Soc.,
92 , 61 (1970).(13) N. Yang and G. Oster, J. Amer. Chem. Soc., 9 2 , 5265 (1970).(14) P. H. Kasai, J. Chem. Phys., 43 , 3322 (1965).(15) K. M. Wang and J. H. Lunsford, J. Phys. Chem.. 74, 1512 (1970).(16) K. M. Wang and J. H. Lunsford, J. Phys. Chem.. 75, 1165 (1971 ).(17) W. Kanzig and M. H. Cohen, Phys. Rev. Lett.. 3, 509 (1959).(18) V. A. Shvets, V. M. Vorotyntsev. and V. 8. Kazanskii. Kinet.
Katal.. 10 , 356 (1969).(19) N. Wong and J. H. Lunsford, J. Chem. Phys., 55, 3007 (1971).(20) A. J. Tench and T. Lawson, Chem. Phys. Lett.. 7, 459 (1970).(21) V. A. Shvets and V. B. Kazanskii, J. Catal.. 25, 123 (1972).
The Journal of Physical Chemistry. Vol. 78. No. 3. 1974
Epr and Endor Line Shape Studies of Trapped Electrons 221
E le c t r o n P a r a m a g n e t i c R e s o n a n c e a n d E l e c t r o n - N u c le a r D o u b le R e s o n a n c e
L in e S h a p e S t u d i e s o f T r a p p e d E le c t r o n s in 7 - l r r a d ia t e d D e u t e r iu m - S u b s t it u t e d 1 0 M
S o d iu m H y d r o x id e A lk a l in e I c e G l a s s
Barney L. Bales,
Department of Physics and Ast'onomy. California State University, Northridge, California 91324John Helbert, and Larry Kevan*
Department of Chemis‘ry, Wayne State University, Detroit, Michigan 48202 (Received August 27, 1973)
T h e epr and endor line widths and line shapes for the trapped electron produced by 7 -irradiation in a lkaline ice glasses at 77 K have been studied both theoretically and experim entally as a function of m a trix deuteration. T h e theoretical m odel is based on the trapped electron (et ) interacting equivalently with n nearest neighbor protons and deuterons. T h e interactions considered include (a) dipolar contributions between et ~ and other radicals, (b) dipolar contributions between et ~ and alkali m etal nuclei, (c) dipolar interactions between et ~ and nonnearest neighbor protons and deuterons, (d) dipolar interactions betw een et _ and nearest neighbor protons and deuterons, and (e) Fermi contact interactions with nearest neighbor protons and deuterons. T h e com parison of experim ental and theoretical results allow us to set bounds on n and the Ferm i contact coupling a, although unique values of a and n cannot be determ ined. It is also shown that the dipolar hyperfine coupling m ust be appreciable. Both theory and experim ent show that the deviation of the line shape from Gaussian is a m axim um near 8 0% deuteration. T h e experim ental results also show that the line widths are dependent on sam ple preparation m ethods and that this dependence appears to be associated with the freezing rate at which the m atrix is form ed. A sim ple theoretical m odel suggests that at slower freezing rates there is a preference for O H over O D bond orientation toward et _ .
I. IntroductionT h e w ell-studied electron param agnetic resonance (epr)
line of the trapped electron (et _ ) in 7 -irradiated alkaline ice glasses (10 M N a O H ) at 77 K consists of a single, structureless, G aussian lin e .1 '2 The width of the line between points of m axim u m slope (A Hpp'j narrows by a factor of 2 -3 upon substitution of deuterium for hydrogen in the m atrix, while substitution of various alkali m etal ions gives sm aller effects .3 From these results, it has been concluded that water m olecules com prise the first solvation shell of the trapped electron. T h e experim ental data are consistent with a cavity m odel for the trapping site, such th at oriented water dipoles provide part of the trapping potential. It is im portant to determ ine the geom etry of the trapping site and m uch experim ental1-4 and theoretica l5-12 work has been directed to this end.
It would be m ost useful to determ ine the value of the isotropic Ferm i contact hyperfine coupling (a) of et - to the nearest neighbor protons as well as the num ber (n) of these protons. Several approaches have been used including epr in partially deuterated system s , 3 '4 resolution enhancem ent of epr , 13 e lectron-nuclear double resonance (endor) 14 and electron-electron double resonance (eldor) . 15
In the present work, we have sought inform ation on a and n by epr line w idths, m om en ts, and line shapes as w ell as the m atrix endor line w idth as a function of
X = [ D ] /( [H ] + [D ]) ft)
where [D] and [H] are the num ber of deuterium and hydrogen atom s, respectively, in the sam ple. T h e results,
w hich are som ew hat dependent upon the sam ple preparation m ethod, m ay be interpreted reasonably well in term s of a sim ple m odel in which the trapped electron interacts equivalently with n nearest neighbor protons. W e are able to set bounds on a and n which m ay serve as guides to further research.
W e note that a similar, but less com plete, study has been carried out by Ershov, et a/.,4 on et - in 10 M K O H aqueous glasses. Their results are different from ours on 10 M N a O H glasses and do not fit a sim ple quantitative m odel.
II. TheoryA. Description of the Model. T h e epr spectrum of et ~ in
7 -irradiated 10 M N a O H glass is assum ed to be due to an unresolved hyperfine m ultiplet due to n equivalent protons. Even though we are dealing with a disordered solid, we feel justified in assum ing n equivalent protons in the hyperfine interaction because the electron presum ably orients the m olecular dipoles around it to produce a sy m m etrical m olecular dipole arrangem ent in the first solvation sh ell.10 T h e approxim ate spin H am iltonian
n
3C = g/3H 0S , + S ^ a j l j , (2)7=1
is assum ed where g is taken to be isotropic and the rest of the sym bols bear their usual m eaning. T h e assum ptions im plicit in the spin H am iltonian and their validity are discussed in a later section. T h e sum extends over the n nearest neighbor proton positions and these neighbors are assum ed to be equivalent. A ll of the rem aining term s in
The Journal of Physical Chemistry. Vol. 78. No. 3. 1974
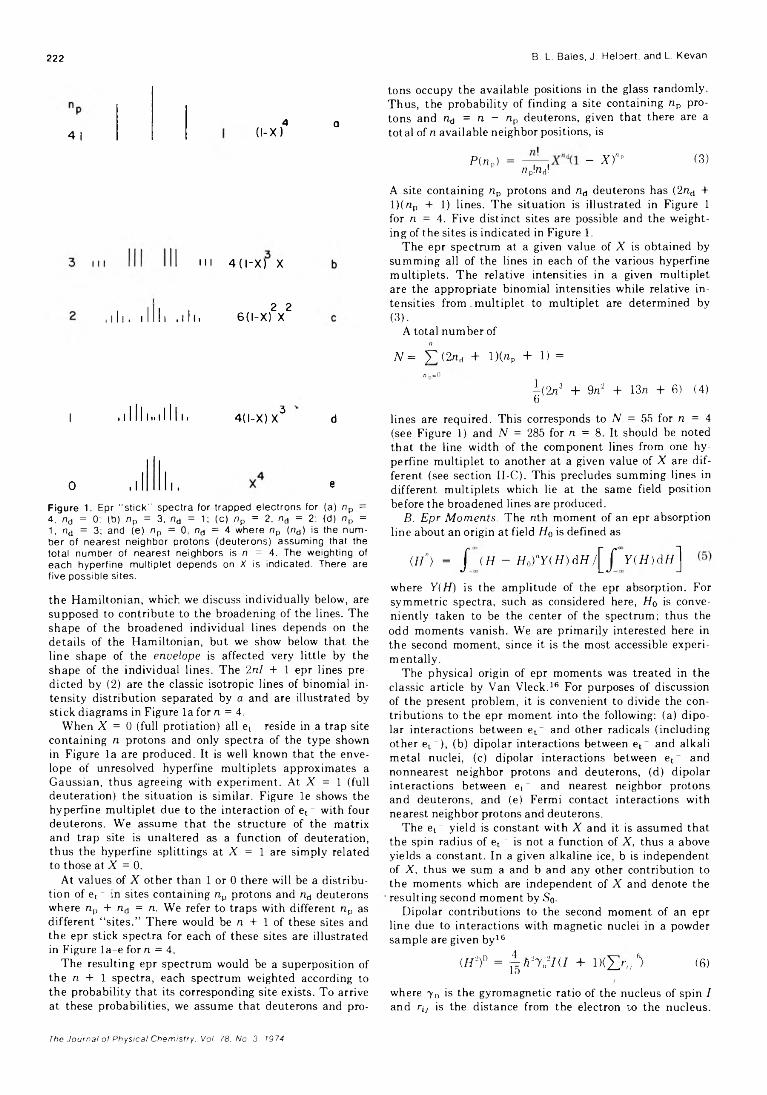
222 B. L. Bales, J. Hebert, and L. Kevan
4 I4
(l-X)a
Ml 4 ( l-X) X
1111 . i 1111 111 h2 2
6 ( l-X) X
I 4(I-X)X3 d
0 e
Figure 1. Epr “ s t ic k " spe c tra fo r trapped e le c tro n s fo r (a) n p - 4, n d = 0; (b) n p = 3, n d = 1; (c ) n p = 2. n d = 2; (d) n p = 1 , n d = 3; and (e) n p = 0, nd = 4 w here n p ( n d ) is the n u m be r of nea res t n e ig hbo r p ro tons (deu te rons) assum ing tha t the to ta l nu m be r of neares t ne ighbo rs is n = 4. The w e igh ting of each hyp e rfln e m u ltip le t depends on X Is Ind ica ted . There are five po ss ib le s ites.
the H am ilton ian , which we discuss individually below, are supposed to contribute to the broadening of the lines. The shape of the broadened individual lines depends on the details of the H am iltonian , but we show below that the line shape of the envelope is affected very little by the shape of the individual lines. T h e 2 nl + 1 epr lines predicted by (2 ) are the classic isotropic lines o f binom ial in tensity distribution separated by a and are illustrated by stick diagram s in Figure la for n = 4.
W h en X = 0 (full protiation) all et - reside in a trap site containing n protons and only spectra of the type shown in Figure la are produced. It is well known that the envelope of unresolved hyperfine m ultiplets approxim ates a G aussian , thus agreeing with experim ent. A t X = 1 (full deuteration) the situation is sim ilar. Figure le shows the hyperfine m ultip let due to the interaction of et ~ with four deuterons. W e assum e that the structure of the m atrix and trap site is unaltered as a function of deuteration, th u s the hyperfine splittings at X = 1 are sim ply related to those at X = 0.
A t values of X other than 1 or 0 there will be a distribution of et ~ in sites containing n p protons and nd deuterons where np + nd = n. W e refer to traps with different np as different “ s ite s .” There would be n + 1 of these sites and the epr stick spectra for each of these sites are illustrated in Figure la -e for n = 4.
T h e resulting epr spectrum would be a superposition of the n + 1 spectra, each spectrum weighted according to the probability that its corresponding site exists. T o arrive at these probabilities, we assum e that deuterons and pro
tons occupy the available positions in the glass random ly. T h u s, the probability of finding a site containing np protons and nd = n - np deuterons, given that there are a total of n available neighbor positions, is
P (n „) = - X T ’ (3)nt,\nA\
A site containing np protons and nd deuterons has (2nd +l ) ( n p + 1 ) lines. T h e situation is illustrated in Figure 1 for n = 4. Five distinct sites are possible and the w eighting of the sites is indicated in Figure 1.
T h e epr spectrum at a given value of X is obtained by su m m in g all of the lines in each of the various hyperfine m ultip lets. T h e relative intensities in a given m ultiplet are the appropriate binom ial intensities while relative in tensities from .m u ltip let to m ultip let are determ ined by(3 ).
A total num ber ofn
N = ] T ( 2 rtd + 1 )(«P + 1 ) =
" p - ° 1± ( 2 n3 + 9 n2 + 13n + 6 ) (4) b
lines are required. This corresponds to N = 55 for n = 4 (see Figure 1) and N = 285 for n = 8 . It should be noted th a t the line width of the com ponent lines from one h yperfine m ultip let to another at a given value of X are d ifferent (see section II -C ). This precludes sum m ing lines in different m ultiplets which lie at the sam e field position before the broadened lines are produced.
B. Epr Moments. The nth m om ent of an epr absorption line about an origin at field H0 is defined as
(Hn) = j ( H — H0)nY (H )d H / [f_ Y ( f f ) d f f ]
where Y(H) is the am plitude of the epr absorption. For sym m etric spectra, such as considered here, H0 is conveniently taken to be the center of the spectrum ; thus the odd m om ents vanish. W e are prim arily interested here in the second m om ent, since it is the m ost accessible experim en tally .
The physical origin of epr m om ents was treated in the classic article by V an V leck . 16 For purposes o f discussion of the present problem , it is convenient to divide the contributions to the epr m om en t into the following; (a) d ipolar interactions between et _ and other radicals (including other et - ), (b) dipolar interactions between et ~ and alkali m etal nuclei, (c) dipolar interactions between et _ and nonnearest neighbor protons and deuterons, (d) dipolar interactions betw een et _ and nearest neighbor protons and deuterons, and (e) Fermi contact interactions with nearest neighbor protons and deuterons.
T h e et _ yield is constant with X and it is assum ed that the spin radius of et ~ is not a function of X, thus a above yields a constant. In a given alkaline ice, b is independent of X, thus we sum a and b and any other contribution to the m om ents which are independent of X and denote the resulting second m om en t by S o -
D ipolar contributions to the second m om ent of an epr line due to interactions with m agnetic nuclei in a powder sam ple are given b y 16
(H2)D = ^ n h r j m + lK X /,/6) (6 )J
where y„ is the gyrom agnetic ratio of the nucleus of spin I and rij is the distance from the electron to the nucleus.
The Journal of Physical Chemistry. Vol. 78. No. 3. 1974
Epr and Endor Line Shape Studies of Trapped Electrons 223
The brackets enclosing the sum indicate that an average is to be taken over the spatial part of the wave function of the unpaired electron. The value of <H 2)D depends on the distribution of magnetic nuclei. Consider a given distribution. If (H 2)PD denotes the value of (6 ) if protons are the interacting nuclei and (H 2) ^ denotes the value of (6 ) if all protons are replaced by deuterons then
( H ' V = a ( H \ D (7)
The second moment of the component lines in the hy- perfine multiplets is given by
S '(X ,n p) = S (X ,n p) - ^-(np + a n d) (18)
where we have subtracted the explicit contribution to the second moment due to Fermi contact interactions. The total second moment due to the superposition of the n + 1
sites at a given X is
where
a7 d2/d(Zd + 1)
7 p 2 / p ( / p + 1 )0.0628 (8 )
For nonnearest neighbor protons, we approximate (6 ) by
( / Z V - £ 27 p2 / p ( / p + 1 ) J4 7T r2P„
dr (9)
where p p is the volume density of protons and a0 is radius at which the nonnearest neighbor protons are considered to begin. Assuming a uniform density pp = pod ~ X) where po is the proton density at X = 0, (9) integrates to give
( f f V - S p j l - X ) (1 0 )where
S ( X ) = E P (n P)S (X ,n v) (19)f p=0
Equation 19 can easily be shown to vary linearly with X .C. E p r L ine S h apes and L in e W idths. The part of the
second moment that “ broadens” the component lines in each site is given by (18). The line sh a p e depends on the nature of the broadening mechanism. For simplicity, we assume a normalized first derivative Gaussian line for the component lines for most of our spectral simulations which is given by
Y '( H ) =2 ( H - h 0\ ;; j H - H 0 X\
(7re)1/2(A / Z PPc)2\ A H p Pc / 6 X P ^ \ A Z Z PPC / /(2 0 )
S Pnr.
167rP0
45ad3'^27p"/p(/p + 1 ) (1 1 )
is the second moment due to nonnearest neighbor protons at X = 0. Similarly pd = poX is the density of deuterons using the assumptions of random replacement and unaltered glass structure mentioned above. Thus
( H r = <ZZ2)PD + =S Pn„(l - X) + a S PmX (12)
where (7) has been employed. Expression 12 encompases the second moment due to c above.
We use the results of Vincow and Johnson1 7 to handle contributions d and e from nearest neighbor protons.
( H % p = np[a2/4 + ( b j + byy~ + b j ) / 1 2 ] (13)
where bxx, by y , and bzz are the principal values of the dipolar hyperfine coupling tensor b in the dipolar spin Hamiltonian
H = X > M , (14)y=i
An expression similar to (13) holds for nearest neighbor deuterons, and summing nearest neighbor proton and deuteron contributions to the second moment gives
( H % = (H2) / + ( H % à =(n p + a n d)(a 2/4 + b 2/4) (15)
where
b2 = \ ( b x x 2 + 6 , , 2 + b j ) (16)
Summing the contributions to the seccnd moment due to a-e above, we get
S (X ,n p\ = (np + cmd)(a2/4 + b 2/4) +SPnn[l - ( 1 - a ) X ] + S 0 (17)
where S (X ,n p ) denotes the second moment of the epr line due to et~ in a site with np nearest neighbor protons and n - np nearest neighbor deuterons at fractional deutération X given by (1).
where H is the field position, H 0 is the resonant field of the particular component line, and AH ppc is the width between points of maximum slope of the component line. 18 The expression (20) which gives the derivative of a Gaussian line is normalized such that the doubly integrated Y '(H ) (the integrated intensity of the Gaussian) is unity.
To test the sensitivity of the final results to the chosen component line shape, we also used another line shape, the cut-off Lorentzian, given by
Y '( H ) =8(3) 1/2 /
7t(AHppc)2 V(2 1 )
for |H - H 0\ < c, and Y '(H ) = 0 elsewhere. The component line width is then related to the component second moment by the following
A//p, = 2 (s'(X ,n p)) Gaussian(2 2 )
A H P0C =(3)1/2c
S '(X ,n p) cut-off Lorentzian
D. S im u la tion E p r S pectra . Simulation of the epr spectrum at a given value of X requires generation of N lines where N is given by (4), each centered at the appropriate resonant field and each having an amplitude determined both by (3) and its appropriately normalized binomial coefficient. The spectra were summed by computer and the envelope was plotted directly on an x-y recorder using a teledata coupler constructed in this laboratory.
III. Experimental SectionA. S am ple P rep a ra tion and Irradiation. Reagent grade
NaOH and triply distilled water where used to prepare 10.5 M NaOH solutions. NaOD in D20 was obtained from Stohler Isotope Co. The concentration, determined by volumetric analysis using a standardized HC1 solution, was found to be 14.1 M, and 10.5 M solutions were prepared with 99.8 D atom % D20 (Stohler). Deuteration in the
The Journal of Physical Chemistry. Voi. 78. No. 3. 1974
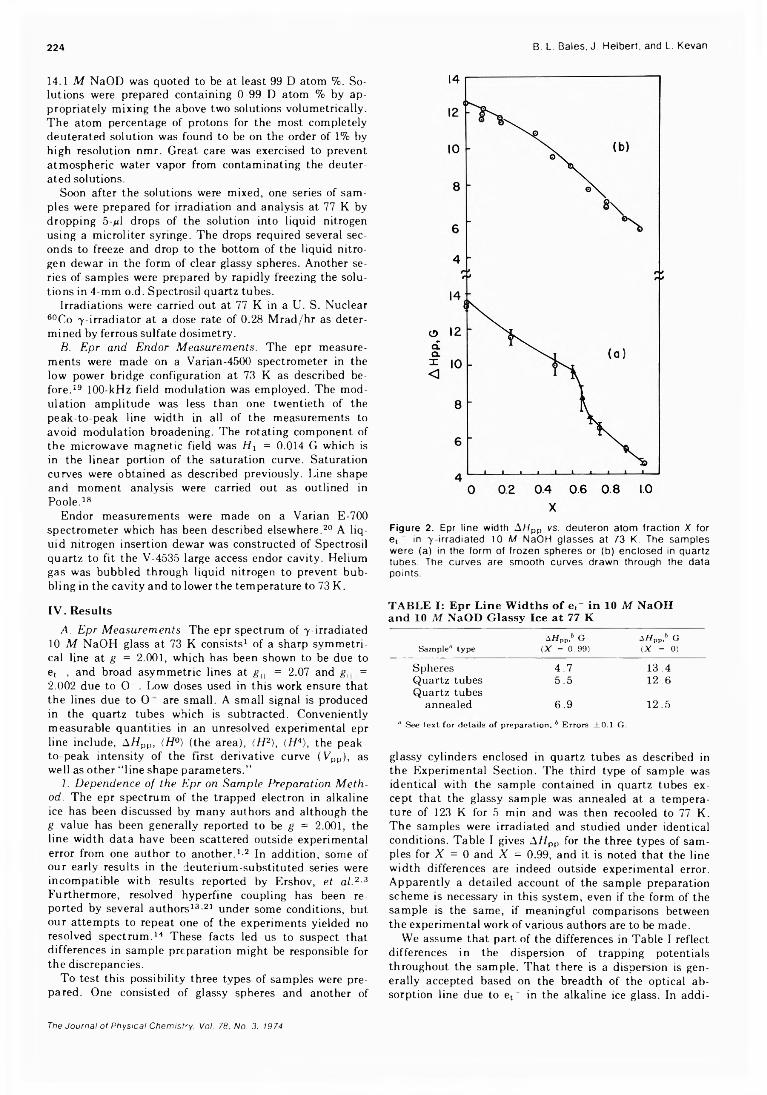
224 B. L. Bales, J. Helbert, and L. Kevan
14.1 M NaOD was quoted to be at least 99 D atom %. Solutions were prepared containing 0-99 D atom % by appropriately mixing the above two solutions volumetrically. The atom percentage of protons for the most completely deuterated solution was found to be on the order of 1 % by high resolution nmr. Great care was exercised to prevent atmospheric water vapor from contaminating the deuterated solutions.
Soon after the solutions were mixed, one series of samples were prepared for irradiation and analysis at 77 K by dropping 5-/d drops of the solution into liquid nitrogen using a microliter syringe. The drops required several seconds to freeze and drop to the bottom of the liquid nitrogen dewar in the form of clear glassy spheres. Another series of samples were prepared by rapidly freezing the solutions in 4-mm o.d. Spectrosil quartz tubes.
Irradiations were carried out at 77 K in a U. S. Nuclear 60Co 7 -irradiator at a dose rate of 0.28 Mrad/hr as determined by ferrous sulfate dosimetry.
B. E p r and E n d or M ea su rem en ts . The epr measurements were made on a Varian-4500 spectrometer in the low power bridge configuration at 73 K as described before. 19 100-kHz field modulation was employed. The modulation amplitude was less than one twentieth of the peak-to-peak line width in all of the measurements to avoid modulation broadening. The rotating component of the microwave magnetic field was H i = 0.014 G which is in the linear portion of the saturation curve. Saturation curves were obtained as described previously. Line shape and moment analysis were carried out as outlined in Poole. 18
Endor measurements were made on a Varian E-700 spectrometer which has been described elsewhere. 20 A liquid nitrogen insertion dewar was constructed of Spectrosil quartz to fit the V-4535 large access endor cavity. Helium gas was bubbled through liquid nitrogen to prevent bubbling in the cavity and to lower the temperature to 73 K.
IV. Results
A . E pr M ea su rem en ts . The epr spectrum of 7 -irradiated 10 M NaOH glass at 73 K consists1 of a sharp symmetrical line at g = 2 .0 0 1 , which has been shown to be due to et ~, and broad asymmetric lines at g M = 2.07 and g, =2.002 due to 0~. Low doses used in this work ensure that the lines due to O are small. A small signal is produced in the quartz tubes which is subtracted. Conveniently measurable quantities in an unresolved experimental epr line include, A//pp, (H °) (the area), (H 2), <//4}, the peak- to-peak intensity of the first derivative curve (Vpp), as well as other “ line shape parameters.”
7. D ep en d en ce o f th e E p r on S a m p le P repara tion M e th od . The epr spectrum of the trapped electron in alkaline ice has been discussed by many authors and although the g value has been generally reported to be g = 2 .0 0 1 , the line width data have been scattered outside experimental error from one author to another. 1 -2 In addition, some of our early results in the deuterium-substituted series were incompatible with results reported by Ershov, e t a l . 2 -3 Furthermore, resolved hyperfine coupling has been reported by several authors1 3 -21 under some conditions, but our attempts to repeat one of the experiments yielded no resolved spectrum. 14 These facts led us to suspect that differences in sample preparation might be responsible for the discrepancies.
To test this possibility three types of samples were prepared. One consisted of glassy spheres and another of
Figure 2. Epr line width A H PP vs. deuteron atom fraction X for et ~ in 7 -irrad iated 10 M NaOH glasses at 73 K. The samples were (a) in the form of frozen spheres or (b) enclosed in quartz tubes. The curves are smooth curves drawn through the data points.
TABLE I: Epr Line Widths of et" in 10 M NaOHand 10 M NaOD Glassy Ice at 77 K
±Hpp,b G &HpV,b GSam ple” type (AT = 0 .9 9 ) ( X = 0)
Spheres 4.7 13.4Quartz tubes 5.5 1 2 . 6
Quartz tubesannealed 6.9 12.5
° See tex t fo r details o f preparation . b E rrors ± 0 .1 G .
glassy cylinders enclosed in quartz tubes as described in the Experimental Section. The third type of sample was identical with the sample contained in quartz tubes except that the glassy sample was annealed at a temperature of 123 K for 5 min and was then recooled to 77 K. The samples were irradiated and studied under identical conditions. Table I gives AH pp for the three types of samples for X = 0 and X = 0.99, and it is noted that the line width differences are indeed outside experimental error. Apparently a detailed account of the sample preparation scheme is necessary in this system, even if the form of the sample is the same, if meaningful comparisons between the experimental work of various authors are to be made.
We assume that part of the differences in Table I reflect differences in the dispersion of trapping potentials throughout the sample. That there is a dispersion is generally accepted based on the breadth of the optical absorption line due to et " in the alkaline ice glass. In addi-
The Journal of Physical Chemistry, Vol. 78, No. 3. 1974
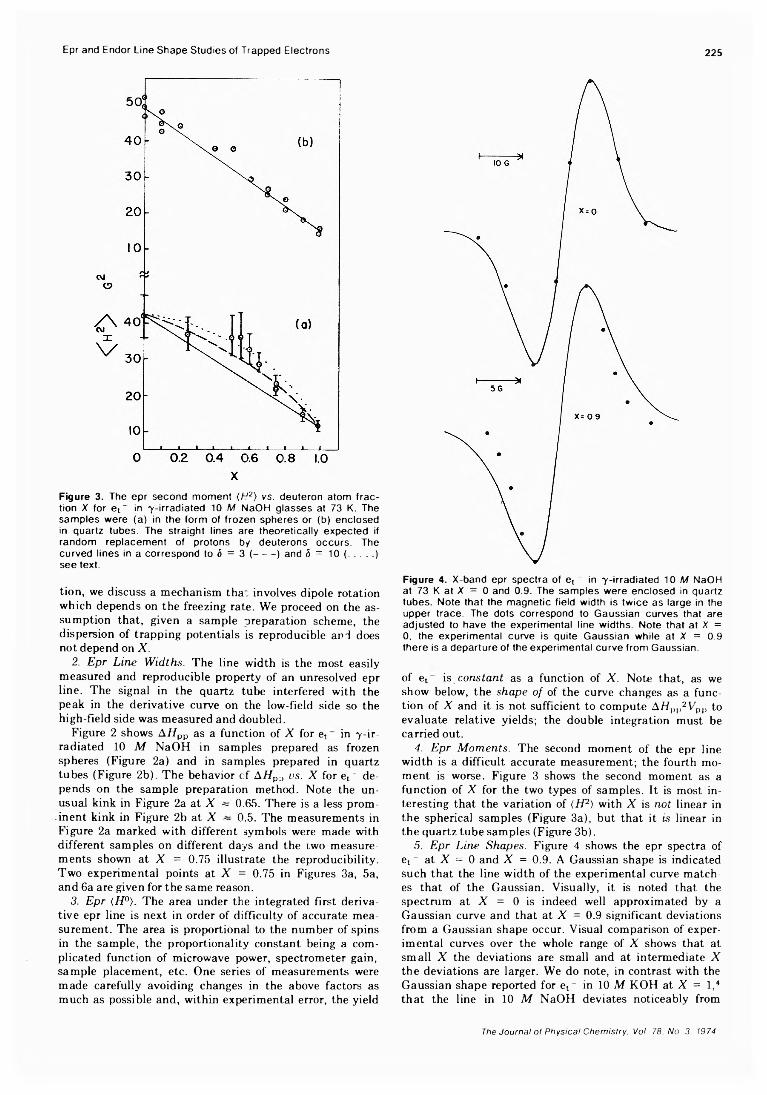
Epr and Endor Line Shape Studies of Trapped Electrons 225
Figure 3. The epr second mom ent ( H 2) v s . deuteron atom fra c tion X for et ~ in 7 -irrad iated 10 M NaOH glasses at 73 K. The samples were (a) in the form of frozen spheres or (b) enclosed in quartz tubes. The straight lines are theoretica lly expected if random replacem ent of protons by deuterons occurs. Thecurved lines in a correspond to 6 = 3 (-------) and 5 = 10 (..........)see text.
tion, we discuss a mechanism that involves dipole rotation which depends on the freezing rate. We proceed on the assumption that, given a sample preparation scheme, the dispersion of trapping potentials is reproducible and does not depend on X .
2. E p r L in e W idths. The line width is the most easily measured and reproducible property of an unresolved epr line. The signal in the quartz tube interfered with the peak in the derivative curve on the low-field side so the high-field side was measured and doubled.
Figure 2 shows AH pp as a function of X for et in 7 -irradiated 10 M NaOH in samples prepared as frozen spheres (Figure 2a) and in samples prepared in quartz tubes (Figure 2b). The behavior cf A/ipp vs. X for et ” depends on the sample preparation method. Note the unusual kink in Figure 2a at X ~ 0.65. There is a less prominent kink in Figure 2b at X ~ 0.5. The measurements in Figure 2a marked with different symbols were made with different samples on different days and the two measurements shown at X = 0.75 illustrate the reproducibility. Two experimental points at X = 0.75 in Figures 3a, 5a, and 6 a are given for the same reason.
3. E p r (H °). The area under the integrated first derivative epr line is next in order of difficulty of accurate measurement. The area is proportional to the number of spins in the sample, the proportionality constant being a complicated function of microwave power, spectrometer gain, sample placement, etc. One series of measurements were made carefully avoiding changes in the above factors as much as possible and, within experimental error, the yield
Figure 4. X-band epr spectra of et _ in 7 -irrad iated 10 M NaOH at 73 K at X = 0 and 0.9. The samples were enclosed in quartz tubes. Note that the magnetic field width is tw ice as large in the upper trace. The dots correspond to Gaussian curves that are adjusted to have the experimental line w idths. Note that at X = 0, the experim ental curve is quite Gaussian while a t X = 0.9 there is a departure of the experimental curve from Gaussian.
of et is con sta n t as a function of X . Note that, as we show below, the sh a p e o f of the curve changes as a function of X and it is not sufficient to compute A H [n,2 Vvv to evaluate relative yields; the double integration must be carried out.
4. E p r M om en ts . The second moment of the epr line width is a difficult accurate measurement; the fourth moment is worse. Figure 3 shows the second moment as a function of X for the two types of samples. It is most interesting that the variation of (H 2) with X is not linear in the spherical samples (Figure 3a), but that it is linear in the quartz tube samples (Figure 3b).
5. E p r L in e S hapes. Figure 4 shows the epr spectra of et - at X = 0 and X = 0.9. A Gaussian shape is indicated such that the line width of the experimental curve matches that of the Gaussian. Visually, it is noted that the spectrum at X = 0 is indeed well approximated by a Gaussian curve and that at X = 0.9 significant deviations from a Gaussian shape occur. Visual comparison of experimental curves over the whole range of X shows that at small X the deviations are small and at intermediate X the deviations are larger. We do note, in contrast with the Gaussian shape reported for et _ in 10 M KOH at X = l , 4
that the line in 10 M NaOH deviates noticeably from
The Journal of Physical Chemistry. Vol. 78. No. 3. 1974
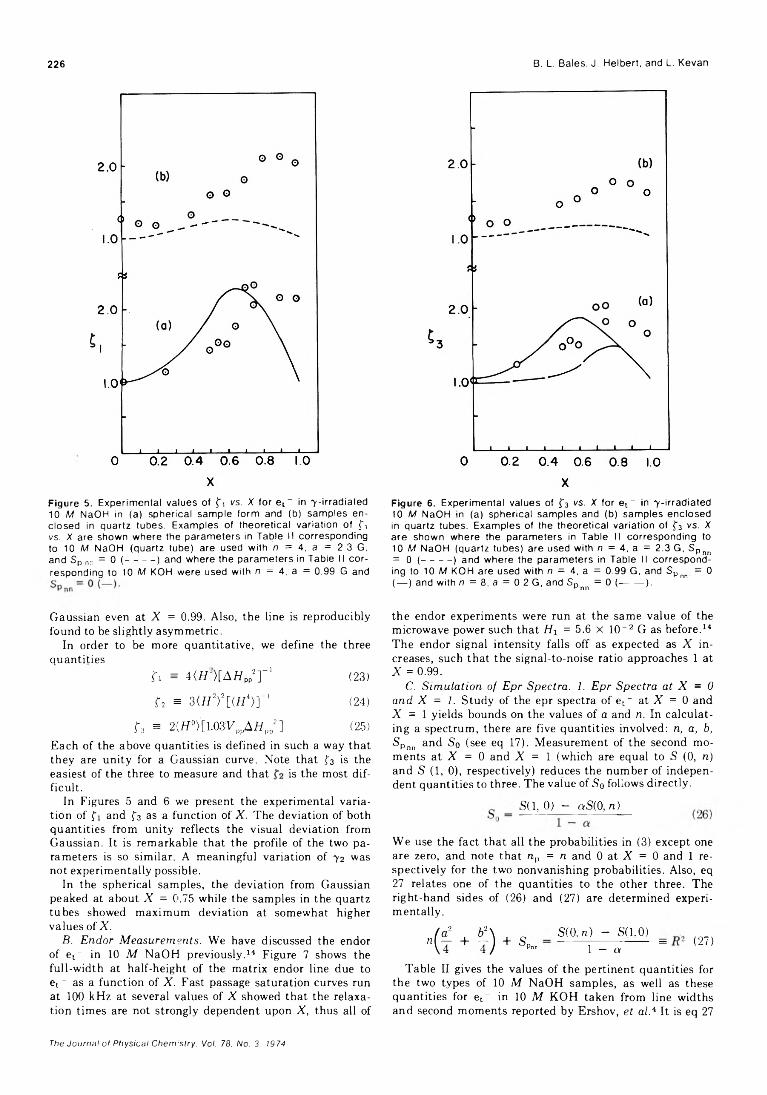
226 B. L. Bales, J. Helbert, and L. Kevan
Figure 5. Experimental values of f i vs . X fo r et _ in 7 -irradiated 10 M NaOH in (a) spherical sample form and (b) samples enclosed in quartz tubes. Examples of theoretica l variation of 0 vs. X are shown where the param eters in Table II corresponding to 10 M NaOH (quartz tube) are used with n = 4, a = 2.3 G, and Sp nn = 0 (----------) and where the param eters in Table 11 corresponding to 10 M KOH were used with n = 4, a = 0.99 G and
Figure 6 . Experimental values of f 3 vs. X for et _ in 7 -irradiated 10 M NaOH in (a) spherical samples and (b) samples enclosed in quartz tubes. Examples of the theoretica l variation of f 3 vs. X are shown where the param eters in Table II corresponding to 10 M NaOH (quartz tubes) are used with n = 4, a = 2.3 G, SPnn = 0 (----------) and where the param eters in Table II corresponding to 10 M KOH are used with n = 4, a = 0.99 G, and SPnn = 0 (— ) and with n = 8 , a = 0.2 G, and SPnn = 0 (-------- ).
Gaussian even at X = 0.99. Also, the line is reproducibly found to be slightly asymmetric.
In order to be more quantitative, we define the three quantities
f i = 4Ur>[A//PPT ’ (23)
r 2 s 3(h 2>2 [<h 4) ] - 1 (24)
f 3 - 2{H°) [1.03 V ppA /ipp2 ] (25)Each of the above quantities is defined in such a way that they are unity for a Gaussian curve. Note that f 3 is the easiest of the three to measure and that is the most difficult.
In Figures 5 and 6 we present the experimental variation of fj and f 3 as a function of X. The deviation of both quantities from unity reflects the visual deviation from Gaussian. It is remarkable that the profile of the two parameters is so similar. A meaningful variation of 7 2 was not experimentally possible.
In the spherical samples, the deviation from Gaussian peaked at about X = 0.75 while the samples in the quartz tubes showed maximum deviation at somewhat higher values of X .
B. E n d or M ea su rem en ts . We have discussed the endor of et ~ in 10 M NaOH previously. 14 Figure 7 shows the full-width at half-height of the matrix endor line due to et - as a function of X . Fast passage saturation curves run at 100 kHz at several values of X showed that the relaxation times are not strongly dependent upon X , thus all of
the endor experiments were run at the same value of the microwave power such that H 1 = 5.6 x 10- 2 G as before. 14
The endor signal intensity falls off as expected as X increases, such that the signal-to-noise ratio approaches 1 at X = 0.99.
C. S im u la tion o f E p r S pectra . 1. E p r S p ectra at X = 0 and X = 1. Study of the epr spectra of et _ at X = 0 and X = 1 yields bounds on the values of a and n. In calculating a spectrum, there are five quantities involved: n, a, b, S Pnn and So (see eq 17). Measurement of the second moments at X = 0 and X = 1 (which are equal to S (0, n) and S (1 , 0 ), respectively) reduces the number of independent quantities to three. The value of S0 follows directly.
S(l, 0 ) - aS(0, n)
We use the fact that all the probabilities in (3) except one are zero, and note that n p = n and 0 at X = 0 and 1 respectively for the two nonvanishing probabilities. Also, eq 27 relates one of the quantities to the other three. The right-hand sides of (26) and (27) are determined experimentally.
m a ! - SaQ ) = (27)1 — a
Table II gives the values of the pertinent quantities for the two types of 10 M NaOH samples, as well as these quantities for et ~ in 10 M KOH taken from line widths and second moments reported by Ershov, e t a l.4 It is eq 27
The Journal of Physical Chem;stry. Vol. 78. No. 3. 1974
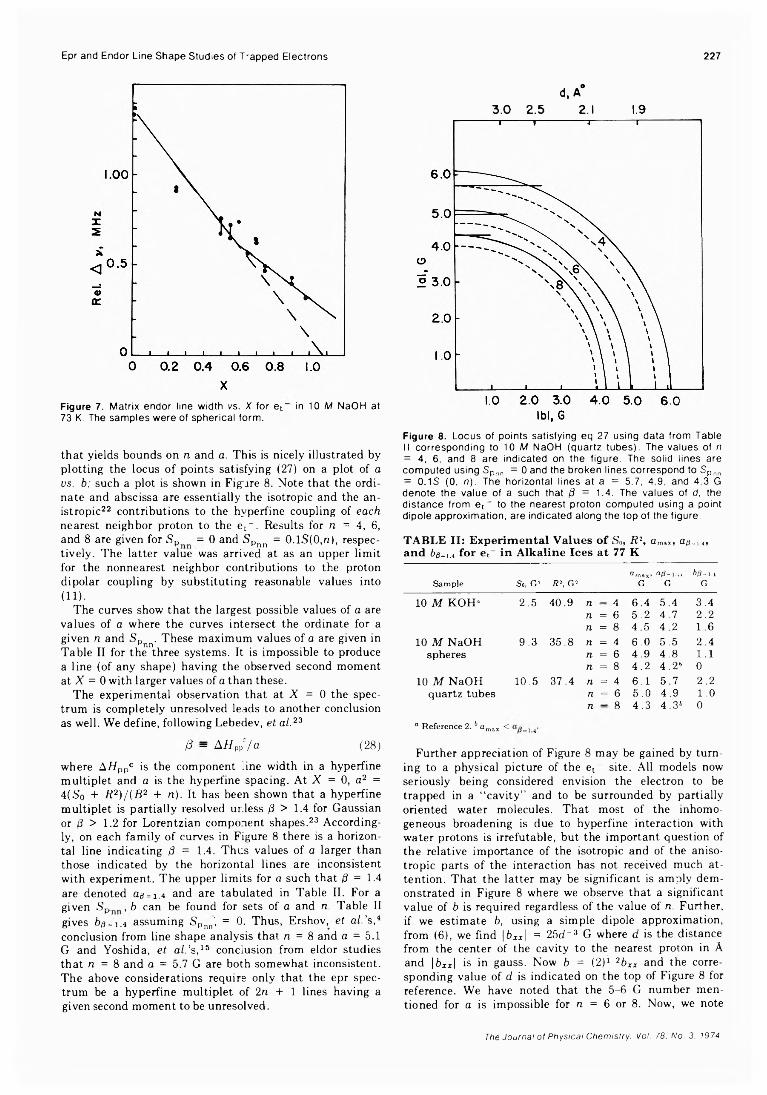
Epr and Endor Line Shape Studies of T'apped Electrons 227
Figure 7. Matrix endor line width vs. X for et in 10 M NaOH at 73 K. The samples were of spherical form .
that yields bounds on n and a. This is nicely illustrated by plotting the locus of points satisfying (27) on a plot of a vs. b; such a plot is shown in Figure 8 . Note that the ordinate and abscissa are essentially the isotropic and the an- istropic22 contributions to the hyperfine coupling of ea ch nearest neighbor proton to the et~. Results for n = 4, 6 , and 8 are given for S p = 0 and SPnn = 0.lS(0,n), respectively. The latter value was arrived at as an upper limit for the nonnearest neighbor contributions to the proton dipolar coupling by substituting reasonable values into (1 1 ).
The curves show that the largest possible values of a are values of a where the curves intersect the ordinate for a given n and S Pnn. These maximum values of a are given in Table II for the three systems. It is impossible to produce a line (of any shape) having the observed second moment at X = 0 with larger values of a than these.
The experimental observation that at X = 0 the spectrum is completely unresolved leads to another conclusion as well. We define, following Lebedev, e t a l . 23
(3 = Ai/ppV a (28)
where AH ppc is the component line width in a hyperfine multiplet and a is the hyperfine spacing. At X = 0, a2 = 4(So + R 2 )/ {B 2 + n ). It has been shown that a hyperfine multiplet is partially resolved unless (3 > 1.4 for Gaussian or (3 > 1.2 for Lorentzian component shapes. 23 Accordingly, on each family of curves in Figure 8 there is a horizontal line indicating 0 = 1.4. Thus values of a larger than those indicated by the horizontal lines are inconsistent with experiment. The upper limits for a such that /3 = 1.4 are denoted 0 3 = 1 . 4 and are tabulated in Table II. For a given Sp. , b can be found for sets of a and n. Table II gives hg = i .4 assuming SPnn) = 0. Thus, Ershov, e t a l.’s, 4
conclusion from line shape analysis that n = 8 and a = 5.1 G and Yoshida, e t a l.’s, 1 5 conclusion from eldor studies that n = 8 and a = 5.7 G are both somewhat inconsistent. The above considerations require only that the epr spectrum be a hyperfine multiplet of 2 n + 1 lines having a given second moment to be unresolved.
d,A°3.0 2.5 2.1 1.9
Figure 8. Locus of points satisfying eq 27 using data from Table II corresponding to 10 M NaOH (quartz tubes). The values of n = 4, 6, and 8 are indicated on the figure. The solid lines are computed using Spnn = 0 and the broken lines correspond to SPnn = 0.1S (0, n ) . The horizontal lines at a = 5.7, 4.9, and 4.3 G denote the value of a such that d = 1.4. The values of d, the distance from e t " to the nearest proton computed using a point dipole approxim ation, are indicated along the top of the figure.
TABLE II: Experimental Values o f So, R 2, flmax) Ct/3., 1.4» and 6 3 .,., for et_ in Alkaline Ices at 77 K
Sample So, G2 R \ G2amax*
Ga/S-i.4,
G6/3-1.4
G
10 M KOH- 2.5 40.9 n — 4 6.4 5.4 3.4n = 6 5.2 4.7 2 . 2
n = 8 4.5 4.2 1 . 6
10 M NaOH 9.3 35.8 n = 4 6 . 0 5.5 2.4spheres n = 6 4.9 4.8 1 . 1
n = 8 4.2 4 , 2 b 0
10 M NaOH 10.5 37.4 n = 4 6 . 1 5.7 2 . 2
quartz tubes n = 6 5.0 4.9 1 . 0
n — 8 4.3 4 , 3 b 0
° R eference 2. b a max < f.
Further appreciation of Figure 8 may be gained by turning to a physical picture of the et_ site. All models now seriously being considered envision the electron to be trapped in a “ cavity” and to be surrounded by partially oriented water molecules. That most of the inhomogeneous broadening is due to hyperfine interaction with water protons is irrefutable, but the important question of the relative importance of the isotropic and of the anisotropic parts of the interaction has not received much attention. That the latter may be significant is amply demonstrated in Figure 8 where we observe that a significant value of b is required regardless of the value of n. Further, if we estimate b, using a simple dipole approximation, from (6 ), we find |6 XX| = 25d ~ 3 G where d is the distance from the center of the cavity to the nearest proton in A and \bXx\ is in gauss. Now b = (2) 1 2 bXx and the corresponding value of d is indicated on the top of Figure 8 for reference. We have noted that the 5-6 G number mentioned for a is impossible for n = 6 or 8 . Now, we note
The Journal of Physical Chemistry. Voi. 78. No. 3. 1974
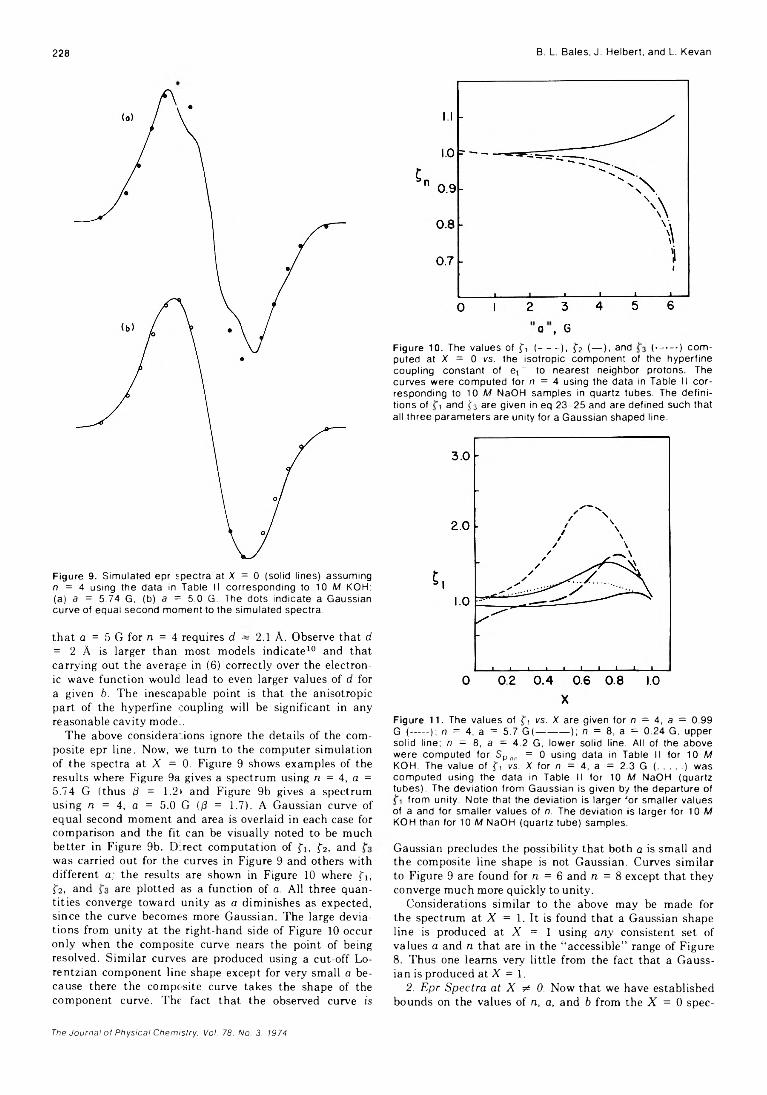
228 B. L. Bales, J. Helbert, and L. Kevan
Figure 9. Simulated epr spectra at X = 0 (solid lines) assuming n = A using the data In Table II corresponding to 10 M KOH: (a) a = 5.74 G, (b) a = 5.0 G. The dots indicate a Gaussian curve of equal second m oment to the simulated spectra.
that a = 5 G for n = 4 requires d ~ 2 . 1 A. Observe that d = 2 A is larger than most models indicate10 and that carrying out the average in (6 ) correctly over the electronic wave function would lead to even larger values of d for a given b. The inescapable point is that the anisotropic part of the hyperfine coupling will be significant in any reasonable cavity model.
The above considerations ignore the details of the composite epr line. Now, we turn to the computer simulation of the spectra at X = 0. Figure 9 shows examples of the results where Figure 9a gives a spectrum using n = 4, a = 5.74 G (thus /3 = 1.21 and Figure 9b gives a spectrum using n = 4, a = 5.0 G (0 = 1.7). A Gaussian curve of equal second moment and area is overlaid in each case for comparison and the fit can be visually noted to be much better in Figure 9b. Direct computation of fi, $2 , and was carried out for the curves in Figure 9 and others with different a; the results are shown in Figure 10 where G, f 2 , and are plotted as a function of a. All three quantities converge toward unity as a diminishes as expected, since the curve becomes more Gaussian. The large deviations from unity at the right-hand side of Figure 10 occur only when the composite curve nears the point of being resolved. Similar curves are produced using a cut-off Lo- rentzian component line shape except for very small a because there the composite curve takes the shape of the component curve. The fact that the observed curve is
a , G
Figure 10. The values of G (-------), f 2 (— ), and (------- ) com puted at X = 0 vs. the isotropic component of the hyperfine coupling constant of et ^ to nearest neighbor protons. The curves were computed for n = 4 using the data in Table II co rresponding to 10 M NaOH samples in quartz tubes. The de fin itions of and £3 are given in eq 23-25 and are defined such that all three param eters are unity for a Gaussian shaped line.
Figure 11. The values of f i vs. X are given for n = 4, a = 0.99G (------); n = 4, a = 5.7 G (----------- ); n = 8 , a = 0.24 G, uppersolid line; n = 8 , a = 4.2 G, lower solid line All of the above were computed for S Pnn = 0 using data in Table II fo r 10 MKOH. The value of f i vs. X for n = 4, a = 2.3 G ( ......... ) wascomputed using the data in Table II for 10 M NaOH (quartz tubes). The deviation from Gaussian is given by the departure of
from unity. Note that the deviation is larger 'o r sm aller values of a and for sm aller values of n. The deviation is larger for 10 M KOH than for 10 M NaOH (quartz tube) samples.
Gaussian precludes the possibility that both a is small and the composite line shape is not Gaussian. Curves similar to Figure 9 are found for n = 6 and n = 8 except that they converge much more quickly to unity.
Considerations similar to the above may be made for the spectrum at X = 1. It is found that a Gaussian shape line is produced at X = 1 using any consistent set of values a and n that are in the “ accessible” range of Figure8 . Thus one learns very little from the fact that a Gaussian is produced at X = 1.
2. E pr S p ectra at X ^ 0. Now that we have established bounds on the values of n, a, and b from the X = 0 spec-
The Journal of Physical Chemistry. Vol. 78. No. 3. 1974
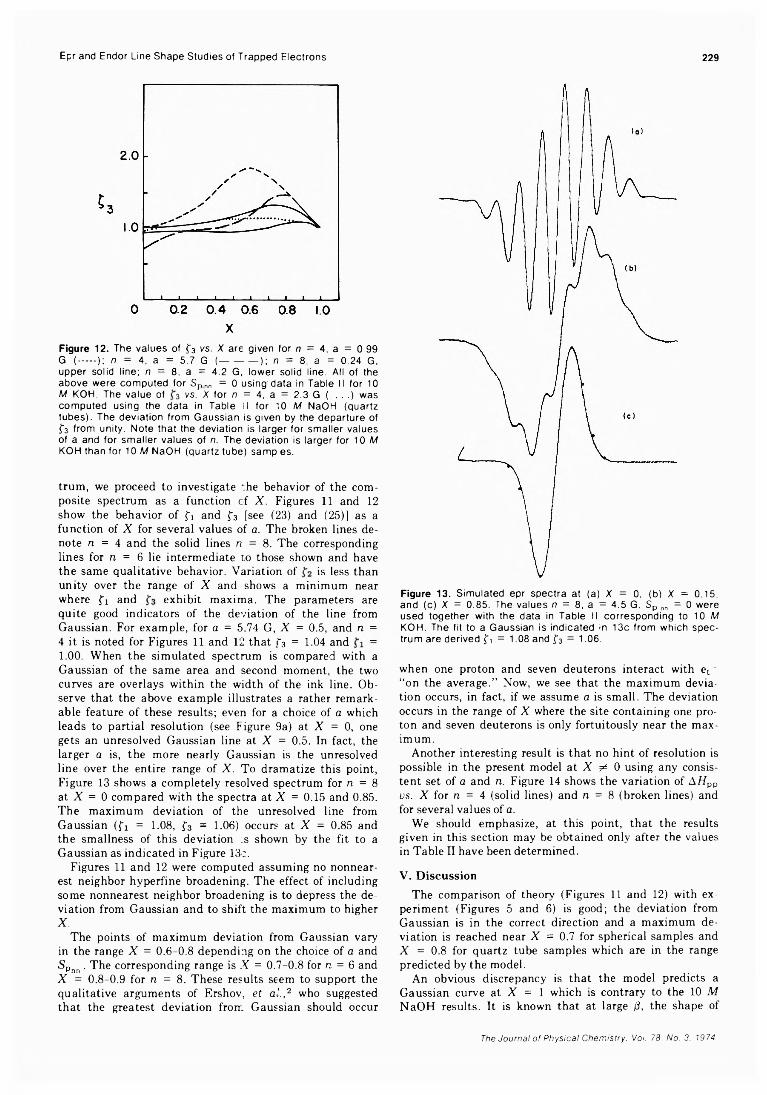
Epr and Endor Line Shape Studies of Trapped Electrons 229
Figure 12. The values of f 3 v s . X are given for n = 4, a = 0.99G (------); n = 4, a = 5.7 G (------------- ); n = 8, a = 0.24 G,upper solid line; n = 8, a = 4.2 G, lower solid line. All of the above were computed for Spnn = 0 using data in Table II fo r 10 M KOH. The value of vs. X for n = 4, a = 2.3 G ( . . .) was computed using the data in Table II fo r 10 M NaOH (quartz tubes). The deviation from Gaussian is given by the departure of f 3 from unity. Note that the deviation is larger for sm aller values of a and for sm aller values of n. The deviation is larger for 10 M KOH than for 10 M NaOH (quartz tube) samp es.
trum, we proceed to investigate The behavior of the composite spectrum as a function of X . Figures 1 1 and 12 show the behavior of fi and f 3 [see (23) and (25)] as a function of X for several values of a. The broken lines denote n = 4 and the solid lines n = 8 . The corresponding lines for n = 6 lie intermediate to those shown and have the same qualitative behavior. Variation of is less than unity over the range of X and shows a minimum near where f i and exhibit maxima. The parameters are quite good indicators of the deviation of the line from Gaussian. For example, for a = 5.74 G, X = 0.5, and n = 4 it is noted for Figures 11 and 12 that i'3 = 1.04 and = 1.00. When the simulated spectrum is compared with a Gaussian of the same area and second moment, the two curves are overlays within the width of the ink line. Observe that the above example illustrates a rather remarkable feature of these results; even for a choice of a which leads to partial resolution (see Figure 9a) at X = 0, one gets an unresolved Gaussian line at X = 0.5. In fact, the larger a is, the more nearly Gaussian is the unresolved line over the entire range of X . To dramatize this point, Figure 13 shows a completely resolved spectrum for n = 8
at X = 0 compared with the spectra at X = 0.15 and 0.85. The maximum deviation of the unresolved line from Gaussian (fi = 1.08, f 3 = 1.06) occurs at X = 0.85 and the smallness of this deviation ;s shown by the fit to a Gaussian as indicated in Figure 13c.
Figures 11 and 12 were computed assuming no nonnear- est neighbor hyperfine broadening. The effect of including some nonnearest neighbor broadening is to depress the deviation from Gaussian and to shift the maximum to higherX.
The points of maximum deviation from Gaussian vary in the range X = 0.6-0.8 depending on the choice of a and SPnn . The corresponding range is X = 0.7-0. 8 for n = 6 and X = 0.8-0.9 for n = 8 . These results seem to support the qualitative arguments of Ershov, e t a l . , 2 who suggested that the greatest deviation from Gaussian should occur
Figure 13. Simulated epr spectra at (a) X = 0, (b) X = 0.15, and (c) X = 0.85. The values n = 8, a = 4.5 G. Sp nn = 0 were used together with the data in Table II corresponding to 10 At KOH. The fit to a Gaussian is indicated in 13c from which spectrum are derived f , = 1.08 and f 3 = 1.06.
when one proton and seven deuterons interact with et~ “on the average.” Now, we see that the maximum deviation occurs, in fact, if we assume a is small. The deviation occurs in the range of X where the site containing one proton and seven deuterons is only fortuitously near the maximum.
Another interesting result is that no hint of resolution is possible in the present model at X ^ 0 using any consistent set of a and n. Figure 14 shows the variation of AH pf> vs. X for n = 4 (solid lines) and n = 8 (broken lines) and for several values of a.
We should emphasize, at this point, that the results given in this section may be obtained only after the values in Table II have been determined.
V. Discussion
The comparison of theory (Figures 1 1 and 1 2 ) with experiment (Figures 5 and 6 ) is good; the deviation from Gaussian is in the correct direction and a maximum deviation is reached near X = 0.7 for spherical samples and X = 0.8 for quartz tube samples which are in the range predicted by the model.
An obvious discrepancy is that the model predicts a Gaussian curve at X = 1 which is contrary to the 10 M NaOH results. It is known that at large /3, the shape of
The Journal of Physical Chemistry. Voi. 78. No. 3. 7974
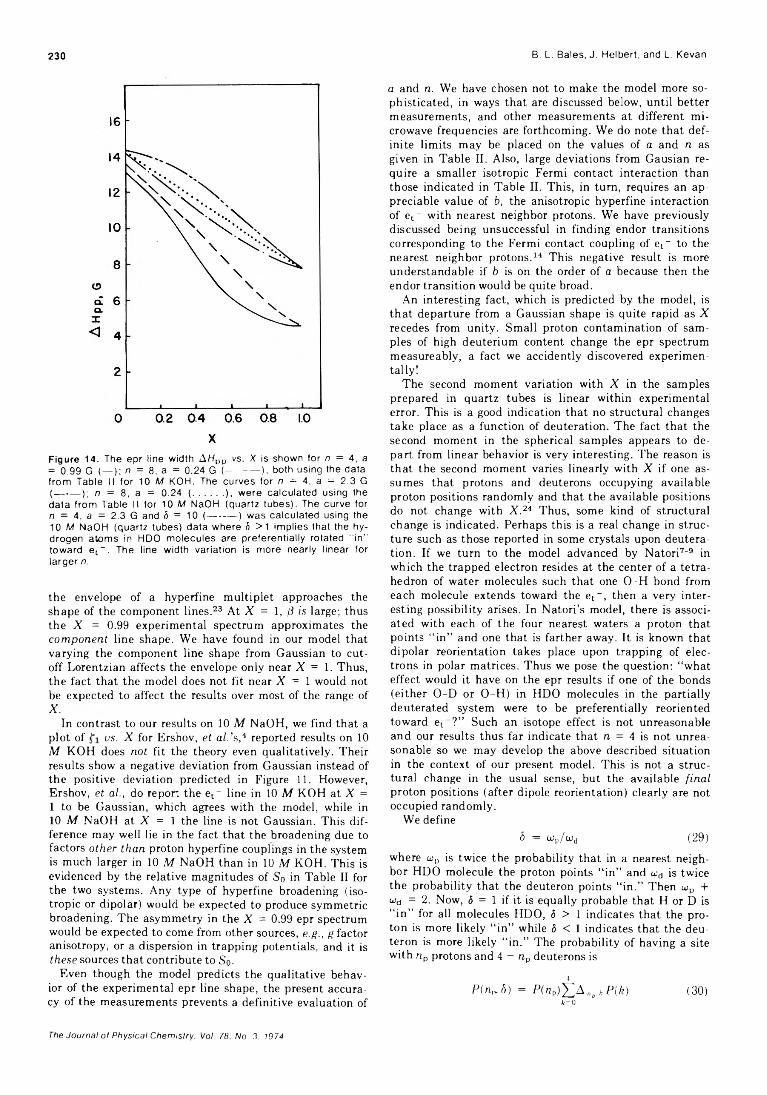
230 B. L. Bales, J. Helbert, and L. Kevan
Figure 14. The epr line width AHPP vs. X is shown for n = 4, a= 0.99 G (— ); n = 8, a = 0.24 G (----------- ), both using the datafrom Table II fo r 10 M KOH. The curves for n = 4, a = 2.3 G(----- ); n = 8, a = 0.24 ( ............ ), were calculated using thedata from Table II for 10 M NaOH (quartz tubes). The curve forn = 4, a = 2.3 G and 5 = 10 (----------) was calculated using the10 M NaOH (quartz tubes) data where 5 >1 im plies that the hydrogen atoms In HDO molecules are preferentia lly rotated “ In" toward et _ . The line width variation is more nearly linear for larger n.
the envelope of a hyperfine multiplet approaches the shape of the component lines. 23 At X = 1, /J is large; thus the X = 0.99 experimental spectrum approximates the co m p o n en t line shape. We have found in our model that varying the component line shape from Gaussian to cutoff Lorentzian affects the envelope only near X = 1 . Thus, the fact that the model does not fit near X = 1 would not be expected to affect the results over most of the range ofX .
In contrast to our results on 10 M NaOH, we find that a plot of us. X for Ershov, e t a l.’s , 4 reported results on 10 M KOH does not fit the theory even qualitatively. Their results show a negative deviation from Gaussian instead of the positive deviation predicted in Figure 11. However, Ershov, et al., do report the et~ line in 10 M KOH at X = 1 to be Gaussian, which agrees with the model, while in 10 M NaOH at X = 1 the line is not Gaussian. This difference may well lie in the fact that the broadening due to factors o th er than proton hyperfine couplings in the system is much larger in 10 M NaOH than in 10 M KOH. This is evidenced by the relative magnitudes of So in Table II for the two systems. Any type of hyperfine broadening (isotropic or dipolar) would be expected to produce symmetric broadening. The asymmetry in the X = 0.99 epr spectrum would be expected to come from other sources, e.g ., g factor anisotropy, or a dispersion in trapping potentials, and it is th ese sources that contribute to So-
Even though the model predicts the qualitative behavior of the experimental epr line shape, the present accuracy of the measurements prevents a definitive evaluation of
a and n. We have chosen not to make the model more sophisticated, in ways that are discussed below, until better measurements, and other measurements at different microwave frequencies are forthcoming. We do note that definite limits may be placed on the values of a and n as given in Table II. Also, large deviations from Gausian require a smaller isotropic Fermi contact interaction than those indicated in Table II. This, in turn, requires an appreciable value of b, the anisotropic hyperfine interaction of et~ with nearest neighbor protons. We have previously discussed being unsuccessful in finding endor transitions corresponding to the Fermi contact coupling of et _ to the nearest neighbor protons. 14 This negative result is more understandable if b is on the order of a because then the endor transition would be quite broad.
An interesting fact, which is predicted by the model, is that departure from a Gaussian shape is quite rapid as X recedes from unity. Small proton contamination of samples of high deuterium content change the epr spectrum measureably, a fact we accidently discovered experimentally!
The second moment variation with X in the samples prepared in quartz tubes is linear within experimental error. This is a good indication that no structural changes take place as a function of deuteration. The fact that the second moment in the spherical samples appears to depart from linear behavior is very interesting. The reason is that the second moment varies linearly with X if one assumes that protons and deuterons occupying available proton positions randomly and that the available positions do not change with X . 24 Thus, some kind of structural change is indicated. Perhaps this is a real change in structure such as those reported in some crystals upon deuteration. If we turn to the model advanced by Natori7“ 9 in which the trapped electron resides at the center of a tetrahedron of water molecules such that one O-H bond from each molecule extends toward the et~, then a very interesting possibility arises. In Natori’s model, there is associated with each of the four nearest waters a proton that points “ in” and one that is farther away. It is known that dipolar reorientation takes place upon trapping of electrons in polar matrices. Thus we pose the question: “ what effect would it have on the epr results if one of the bonds (either O-D or O-H) in HDO molecules in the partially deuterated system were to be preferentially reoriented toward et_?” Such an isotope effect is not unreasonable and our results thus far indicate that n = 4 is not unreasonable so we may develop the above described situation in the context of our present model. This is not a structural change in the usual sense, but the available final proton positions (after dipole reorientation) clearly are not occupied randomly.
We define5 = o)p/wd (29)
where cop is twice the probability that in a nearest neighbor HDO molecule the proton points “ in” and o;d is twice the probability that the deuteron points “ in.” Then u>p + a)d = 2. Now, 5 = 1 if it is equally probable that H or D is “ in” for all molecules HDO, 5 > 1 indicates that the proton is more likely “ in” while 5 < 1 indicates that the deuteron is more likely “ in.” The probability of having a site with np protons and 4 — n p deuterons is
4P(n,,.<5) = P (n p) J 2 ^ „ p.kP(k) (30)
k = 0
The Journal of Physical Chemistry. Vol. 78. No. 3. 1974
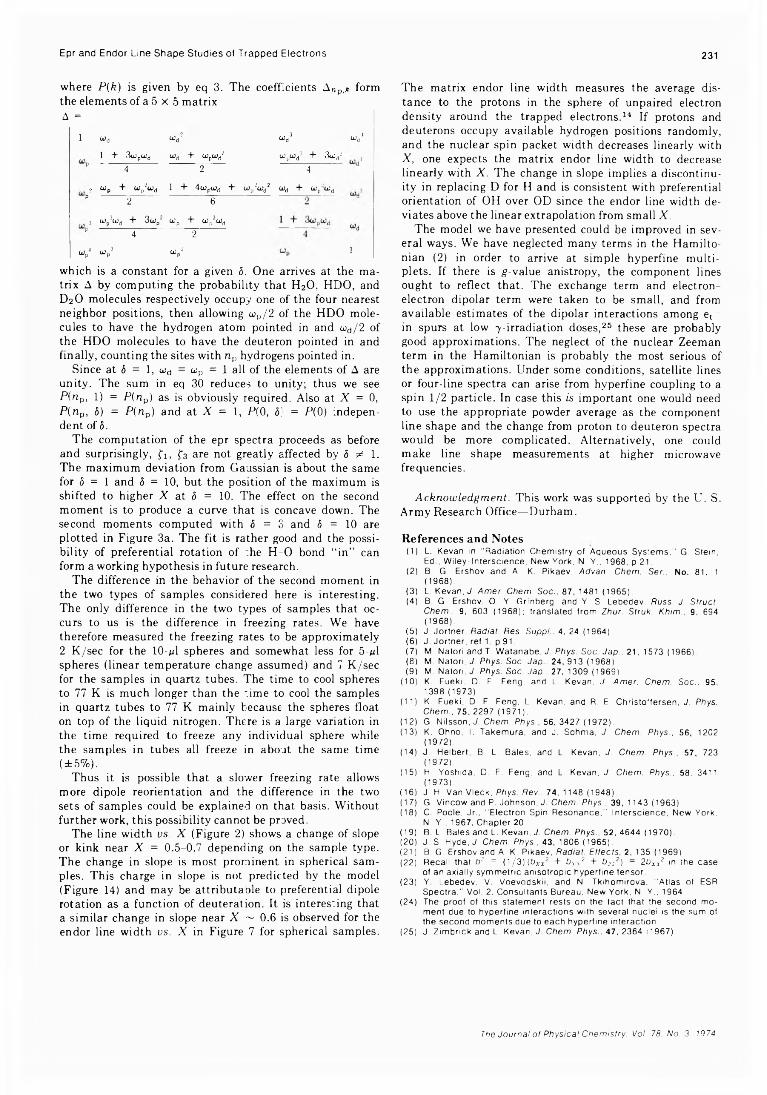
Epr and Endor Line Shape Studies of Trapped Electrons 231
where P (k ) is given by eq 3. The coefficients Anp,A> form the elements of a 5 x 5 matrix A =
1 wd a'd" a3dJ ujd4
1 + 3upa:d wd + u)pwd2 o)pud3 + 3u;d2 3P 4 2 5 “
2 Wp + u!p2o)d 1 + 4wpojd + o)p2ajd2 ud + up’wd ,r -----------5 -------------------------------- 6--------------------------------------------------"
3 <*>p3<*>d + 3up2 U)p + 0)p2UdP 4 2
< V “ p3 “ p!
which is a constant for a given 8 . One arrives at the matrix A by computing the probability that H2O, HDO, and D2 O molecules respectively occupy one of the four nearest neighbor positions, then allowing aip/2 of the HDO molecules to have the hydrogen atom pointed in and o)d / 2 of the HDO molecules to have the deuteron pointed in and finally, counting the sites with n v hydrogens pointed in.
Since at 8 = 1, u>d = o>p = 1 all of the elements of A are unity. The sum in eq 30 reduces to unity; thus we see P in p, 1) = P {n p) as is obviously required. Also at X = 0, P (n p, 8 ) = P (n p ) and at X = 1 , P(0, 8 ] = P (0) independent of 8 .
The computation of the epr spectra proceeds as before and surprisingly, 0 , £3 are not greatly affected by 5 ^ 1. The maximum deviation from Gaussian is about the same for h = 1 and 8 = 10, but the position of the maximum is shifted to higher X at 5 = 10. The effect on the second moment is to produce a curve that is concave down. The second moments computed with 5 = 3 and 8 = 10 are plotted in Figure 3a. The fit is rather good and the possibility of preferential rotation of :he H-0 bond “ in” can form a working hypothesis in future research.
The difference in the behavior of the second moment in the two types of samples considered here is interesting. The only difference in the two types of samples that occurs to us is the difference in freezing rates. We have therefore measured the freezing rates to be approximately 2 K/sec for the 10- 1 spheres and somewhat less for 5- 1 spheres (linear temperature change assumed) and 7 K/sec for the samples in quartz tubes. The time to cool spheres to 7 7 K is much longer than the rime to cool the samples in quartz tubes to 7 7 K mainly because the spheres float on top of the liquid nitrogen. There is a large variation in the time required to freeze any individual sphere while the samples in tubes all freeze in about the same time (±5%).
Thus it is possible that a slower freezing rate allows more dipole reorientation and the difference in the two sets of samples could be explained on that basis. Without further work, this possibility cannot be proved.
The line width us. X (Figure 2) shows a change of slope or kink near X = 0.5-0.7 depending on the sample type. The change in slope is most prominent in spherical samples. This charge in slope is not predicted by the model (Figure 14) and may be attributable to preferential dipole rotation as a function of deuteration. It is interesting that a similar change in slope near X ~ 0.6 is observed for the endor line width vs. X in Figure 7 for spherical samples.
1
The matrix endor line width measures the average distance to the protons in the sphere of unpaired electron density around the trapped electrons. 14 If protons and deuterons occupy available hydrogen positions randomly, and the nuclear spin packet width decreases linearly with X, one expects the matrix endor line width to decrease linearly with X. The change in slope implies a discontinuity in replacing D for H and is consistent with preferential orientation of OH over OD since the endor line width deviates above the linear extrapolation from small X.
The model we have presented could be improved in several ways. We have neglected many terms in the Hamiltonian (2 ) in order to arrive at simple hyperfine multi- plets. If there is g-value anistropy, the component lines ought to reflect that. The exchange term and electron- electron dipolar term were taken to be small, and from available estimates of the dipolar interactions among et~ in spurs at low 7 -irradiation doses, 2 5 these are probably good approximations. The neglect of the nuclear Zeeman term in the Hamiltonian is probably the most serious of the approximations. Under some conditions, satellite lines or four-line spectra can arise from hyperfine coupling to a spin 1/2 particle. In case this is important one would need to use the appropriate powder average as the component line shape and the change from proton to deuteron spectra would be more complicated. Alternatively, one could make line shape measurements at higher microwave frequencies.
A ck n ow led g m en t. This work was supported by the U. S. Army Research Office— Durham.
References and Notes(1) L. Kevan in “ Radiation Chemistry of Aqueous Systems,” G. Stein,
Ed., W iley-lnterscience, New York, N. Y., 1968, p 21.(2) B. G. Ershov and A. K. Pikaev, Advan. Chem. Ser., No. 81, 1
(1968).(3) L. Kevan, J. Amer. Chem. Soc., 87, 1481 (1965).(4) B. G. Ershov, O. Y. Grinberg, and Y. S. Lebedev, Russ. J. Struct.
Chem., 9, 603 (1968); translated from Zhur. Struk. Khim., 9, 694 (1968).
(5) J. Jortner, Radiai. Res. Suppl.. 4, 24 (1964).(6) J. Jortner, ref 1, p 91.(7) M. Natori and T. Watanabe, J. Phys. Soc. Jap., 21, 1573 (1966).(8) M. Natori, J. Phys. Soc. Jap.. 24, 913 (1968).(9) M. Natori, J. Phys. Soc. Jap., 27. 1309 (1969).
(10) K. Fueki, D. F. Feng, and L. Kevan, J. Amer. Chem. Soc., 95, 1398 (1973).
(11) K. Fueki, D. F. Feng, L. Kevan, and R. E. Christo*'fersen, J. Phys. Chem., 75, 2297 (1971).
(12) G. Nilsson, J. Chem. Phys., 56, 3427 (1972).(13) K. Ohno, I. Takemura, and J. Sohma, J. Chem. Phys., 56, 1202
(1972).(14) J. Helbert, B. L. Bales, and L. Kevan, J. Chem. Phys., 57, 723
(1972) .(15) H. Yoshida, D. F. Feng, and L. Kevan, J. Chem. Phys., 58, 3411
(1973) .(16) J. H. Van Vleck, Phys. Rev.. 74, 1148 (1948).(17) G. Vincow and P. Johnson, J. Chem. Phys., 39, 1143 (1963).(18) C. Poole, Jr., “ Electron Spin Resonance,” Interscience, New York,
N. Y., 1967, Chapter 20.(19) B. L. Bales and L. Kevan, J. Chem. Phys., 52, 4644 (1970).(20) J. S. Hyde, J. Chem. Phys., 43, 1806 (1965).(21) B. G. Ershov and A. K. Pikaev, Radiat. Effects, 2, 135 (1969).(22) Recall that b2 = (1 /3 ) (bxx2 + byy2 + bzz2) = 2bxx2 in the case
of an axially symmetric anisotropic hyperfine tensor.(23) Y. Lebedev. V. Voevodskii, and N. Tkihomirova, “ Atlas of ESR
Spectra,” Vol. 2, Consultants Bureau, New York, N. Y., 1964.(24) The proof of this statement rests on the fact that the second mo
ment due to hyperfine interactions with several nuclei is the sum of the second moments due to each hyperfine interaction.
(25) J. Zim brick and L. Kevan, J. Chem. Phys., 47, 2364 (1967).
The Journal of Physical Chemistry. Vol. 78. No. 3. 1974
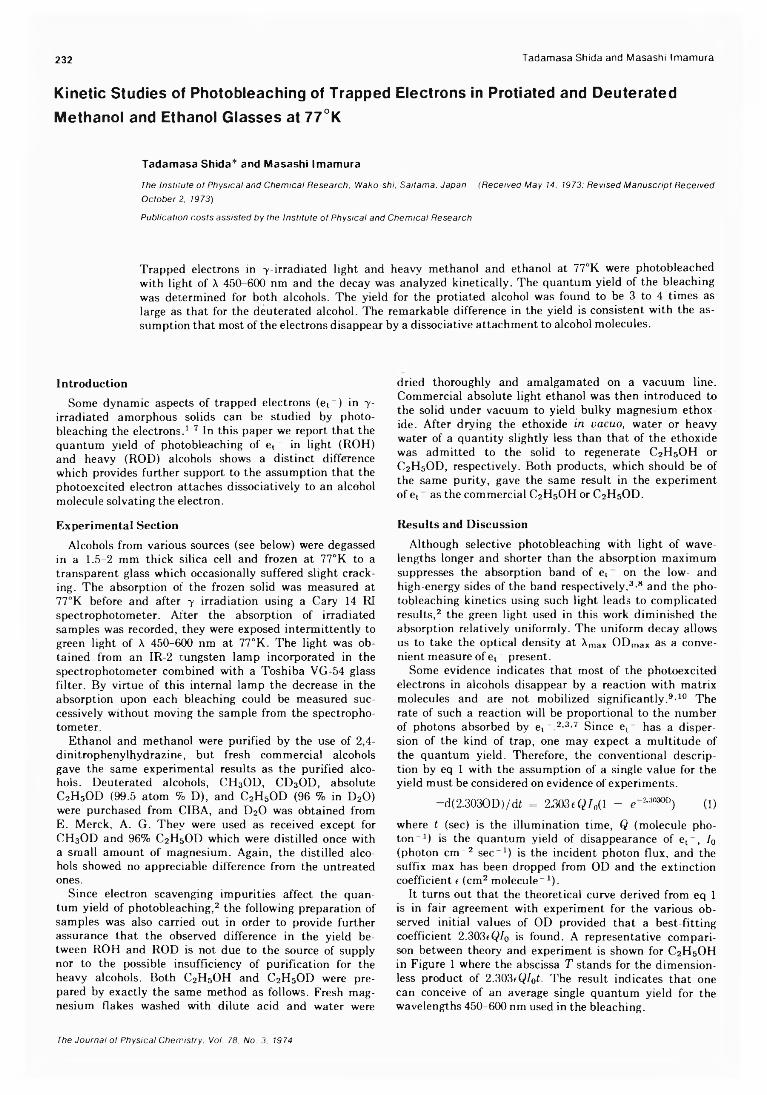
232 Tadamasa Shida and Masashi Imamura
K in e t ic S t u d i e s o f P h o t o b le a c h in g o f T r a p p e d E le c t r o n s in P r o t ia te d a n d D e u t e r a t e d
M e t h a n o l a n d E th a n o l G l a s s e s a t 7 7 ° K
Tadamasa Shida* and Masashi Imamura
The Institute of Physical and Chemical Research, Wako-shi, Saitama. Japan (Received May 74, 1973; Revised Manuscript Received October 2, 1973)Publication costs assisted by the Institute of Physical and Chemical Research
Trapped electrons in 7 -irradiated light and heavy methanol and ethanol at 77°K were photobleached with light of X 450-600 nm and the decay was analyzed kinetically. The quantum yield of the bleaching was determined for both alcohols. The yield for the protiated alcohol was found to be 3 to 4 times as large as that for the deuterated alcohol. The remarkable difference in the yield is consistent with the assumption that most of the electrons disappear by a dissociative attachment to alcohol molecules.
IntroductionSome dynamic aspects of trapped electrons (et_) in 7 -
irradiated amorphous solids can be studied by photo- bleaching the electrons. 1 - 7 In this paper we report that the quantum yield of photobleaching of et - in light (ROH) and heavy (ROD) alcohols shows a distinct difference which provides further support to the assumption that the photoexcited electron attaches dissociatively to an alcohol molecule solvating the electron.
Experimental SectionAlcohols from various sources (see below) were degassed
in a 1.5-2 mm thick silica cell and frozen at 77°K to a transparent glass which occasionally suffered slight cracking. The absorption of the frozen solid was measured at 77°K before and after 7 irradiation using a Cary 14 RI spectrophotometer. After the absorption of irradiated samples was recorded, they were exposed intermittently to green light of X 450-600 nm at 77°K. The light was obtained from an IR-2 tungsten lamp incorporated in the spectrophotometer combined with a Toshiba VG-54 glass filter. By virtue of this internal lamp the decrease in the absorption upon each bleaching could be measured successively without moving the sample from the spectrophotometer.
Ethanol and methanol were purified by the use of 2,4- dinitrophenylhydrazine, but fresh commercial alcohols gave the same experimental results as the purified alcohols. Deuterated alcohols, CH3OD, CD3OD, absolute C2 H5 OD (99.5 atom % D), and C2 H5 OD (96 % in D20) were purchased from CIBA, and D20 was obtained fromE. Merck, A. G. They were used as received except for CH3 OD and 96% C2 H5OD which were distilled once with a small amount of magnesium. Again, the distilled alcohols showed no appreciable difference from the untreated ones.
Since electron scavenging impurities affect the quantum yield of photobleaching, 2 the following preparation of samples was also carried out in order to provide further assurance that the observed difference in the yield between ROH and ROD is not due to the source of supply nor to the possible insufficiency of purification for the heavy alcohols. Both C2 H5OH and C2 H5OD were prepared by exactly the same method as follows. Fresh magnesium flakes washed with dilute acid and water were
dried thoroughly and amalgamated on a vacuum line. Commercial absolute light ethanol was then introduced to the solid under vacuum to yield bulky magnesium ethox- ide. After drying the ethoxide in vacuo, water or heavy water of a quantity slightly less than that of the ethoxide was admitted to the solid to regenerate C2 H5 0H or C2H5 OD, respectively. Both products, which should be of the same purity, gave the same result in the experiment of et as the commercial C2H5 0H or C2H5OD.
Results and DiscussionAlthough selective photobleaching with light of wave
lengths longer and shorter than the absorption maximum suppresses the absorption band of et on the low- and high-energy sides of the band respectively, 3 -8 and the photobleaching kinetics using such light leads to complicated results, 2 the green light used in this work diminished the absorption relatively uniformly. The uniform decay allows us to take the optical density at Xmax ODmax as a convenient measure of et - present.
Some evidence indicates that most of the photoexcited electrons in alcohols disappear by a reaction with matrix molecules and are not mobilized significantly. 9 -10 The rate of such a reaction will be proportional to the number of photons absorbed by et - . 2 -3 , 7 Since et- has a dispersion of the kind of trap, one may expect a multitude of the quantum yield. Therefore, the conventional description by eq 1 with the assumption of a single value for the yield must be considered on evidence of experiments.
—d(2.303OD)/d£ = 2.303eQJ„(l - e " L:mMxy) (1 )
where t (sec) is the illumination time, Q (molecule photon-1) is the quantum yield of disappearance of et~, I0 (photon cm - 2 sec-1) is the incident photon flux, and the suffix max has been dropped from OD and the extinction coefficient c (cm2 molecule-1).
It turns out that the theoretical curve derived from eq 1 is in fair agreement with experiment for the various observed initial values of OD provided that a best-fitting coefficient 2.303fQI0 is found. A representative comparison between theory and experiment is shown for C2 H5OH in Figure 1 where the abscissa T stands for the dimensionless product of 2.303eQ/ot. The result indicates that one can conceive of an average single quantum yield for the wavelengths 450-600 nm used in the bleaching.
The Journal ot Physical Chemistry. Vol. 78. No. 3. 1974
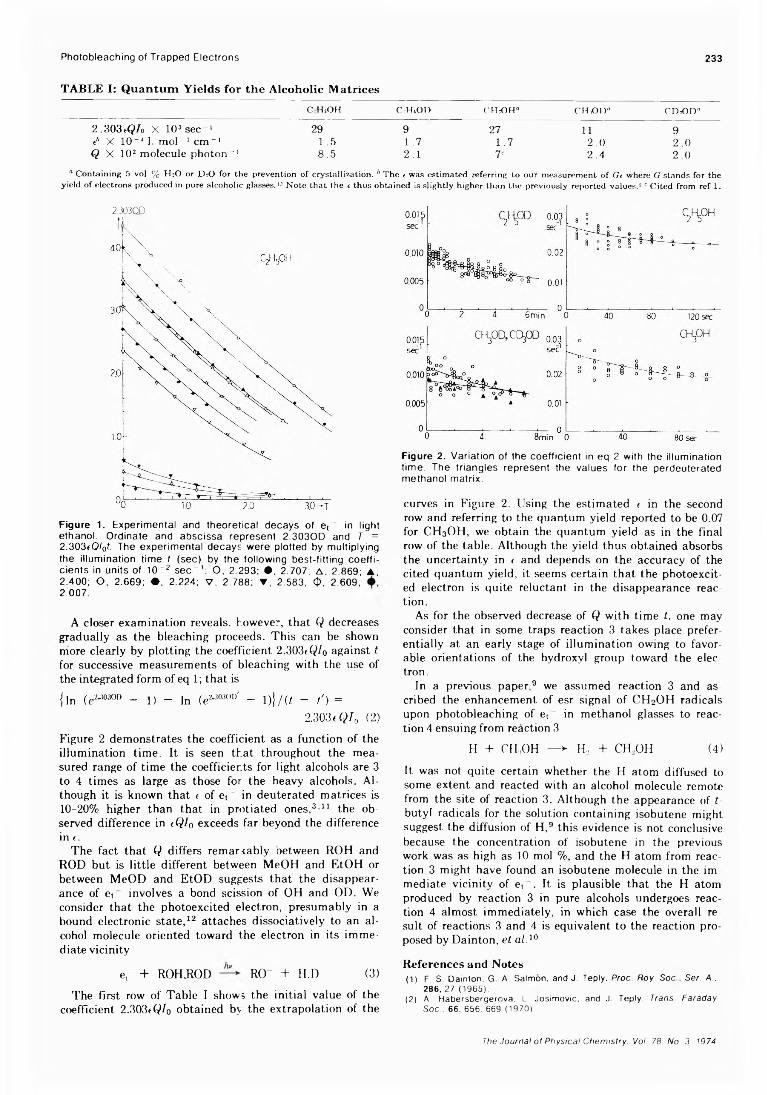
Photobleaching of Trapped Electrons 233
TABLE I: Quantum Yields for the Alcoholic Matrices
C H sO H C :H sO D CH sO H « C H sO I)« C D sO D «
2 ,303eQ /o X 1 0 3 s e c ” 1 29 9 27 i i 9eb X 1 0 ” 4 1. m o l ” 1 c m “ 1 1 .5 1 .7 1 .7 2 .0 2 .0Q X 1 0 2 m o le c u le p h o to n ” 1 8 .5 2 .1 T 2 .4 2 .0
° C onta in ing 5 vo l % H iO or DsO for the prevention o f crysta llization . 6 T h e < w as estim ated referring to ou r m easurem ent o f Oe w here G stands for the y ield o f electrons produced in pure a lcoh olic glasses.13 N o te that the e thus obta in ed is slightly higher than the previously reported values.2 c C ited from ref 1.
2 .3 0 3 0 Qt¡
F ig u re 1. E xpe rim en ta l and th e o re tica l decays o f e t in ligh t e th a n o l. O rd ina te and ab sc issa re p re se n t 2 .303O D and T = 2 .303cQ /0t The e xp e rim e n ta l decays w e re p lo tted by m u ltip ly ing the illu m in a tio n tim e t (sec) by the fo llo w in g b e s t-fitt in g c o e ff ic ie n ts in un its o f 1 0 ” 2 sec-” 1: O , 2 .293; • , 2 .707; A , 2 .869; ▲, 2 .400 ; O , 2 .669; ♦ , 2 .224; V , 2 .788 ; ▼, 2 .583; 0, 2.609; 2 .007.
A closer examination reveals, however, that Q decreases gradually as the bleaching proceeds. This can be shown more clearly by plotting the coefficient 2.303cQ/o against t for successive measurements of bleaching with the use of the integrated form of eq 1 ; that is
{in (e2-“ 30" - 1 ) - In (¿U03(,D' - l)}/(i - t ') =
2.303< Q I 0 (2)
Figure 2 demonstrates the coefficient as a function of the illumination time. It is seen that throughout the measured range of time the coefficients for light alcohols are 3 to 4 times as large as those for the heavy alcohols. Although it is known that t of et in deuterated matrices is 1 0 - 2 0 % higher than that in protiated ones, 3 1 1 the observed difference in tQ I 0 exceeds far beyond the difference in (.
The fact that Q differs remarkably between ROH and ROD but is little different between MeOH and EtOH or between MeOD and EtOD suggests that the disappearance of et involves a bond scission of OH and OD. We consider that the photoexcited electron, presumably in a bound electronic state, 1 2 attaches dissociatively to an alcohol molecule oriented toward the electron in its immediate vicinity
et + ROHJIOD RCT + H.D (3)
The first row of Table I shows the initial value of the coefficient 2.303eQ/o obtained by the extrapolation of the
F ig u re 2. V a ria tio n o f the co e ffic ie n t in eq 2 w ith the illum ina tion tim e . The tria n g le s re p rese n t the va lues fo r the pe rdeu te ra ted m e thano l m a trix .
curves in Figure 2. Using the estimated t in the second row and referring to the quantum yield reported to be 0.07 for C H 3 O H , we obtain the quantum yield as in the final row of the table. Although the yield thus obtained absorbs the uncertainty in < and depends on the accuracy of the cited quantum yield, it seems certain that the photoexcited electron is quite reluctant in the disappearance reaction.
As for the observed decrease of Q with time f, one may consider that in some traps reaction 3 takes place preferentially at an early stage of illumination owing to favorable orientations of the hydroxyl group toward the electron.
In a previous paper, 9 we assumed reaction 3 and ascribed the enhancement of esr signal of CH2OH radicals upon photobleaching of et in methanol glasses to reaction 4 ensuing from reaction 3
H + CM;,OH — ► H, + CH,OH (4)
It was not quite certain whether the H atom diffused to some extent and reacted with an alcohol molecule remote from the site of reaction 3. Although the appearance of t- butyl radicals for the solution containing isobutene might suggest the diffusion of H, 9 this evidence is not conclusive because the concentration of isobutene in the previous work was as high as 10 mol %, and the H atom from reaction 3 might have found an isobutene molecule in the immediate vicinity of et . It is plausible that the H atom produced by reaction 3 in pure alcohols undergoes reaction 4 almost immediately, in which case the overall result of reactions 3 and 4 is equivalent to the reaction proposed by Dainton, e t a l . 1 0
References and Notes(1) F. S. Dainton, G A. Salmon, and J. Teply. Proc. Roy. Soc , Ser. A..
286,27 (1965).(2 ) A. Habersbergerova, L. Josimovic, and J. Teply. Trans. Faraday
Soc.. 66, 656. 669 (1970).
The Journal of Physical Chemistry. Vol. 78. No. 3. 1974
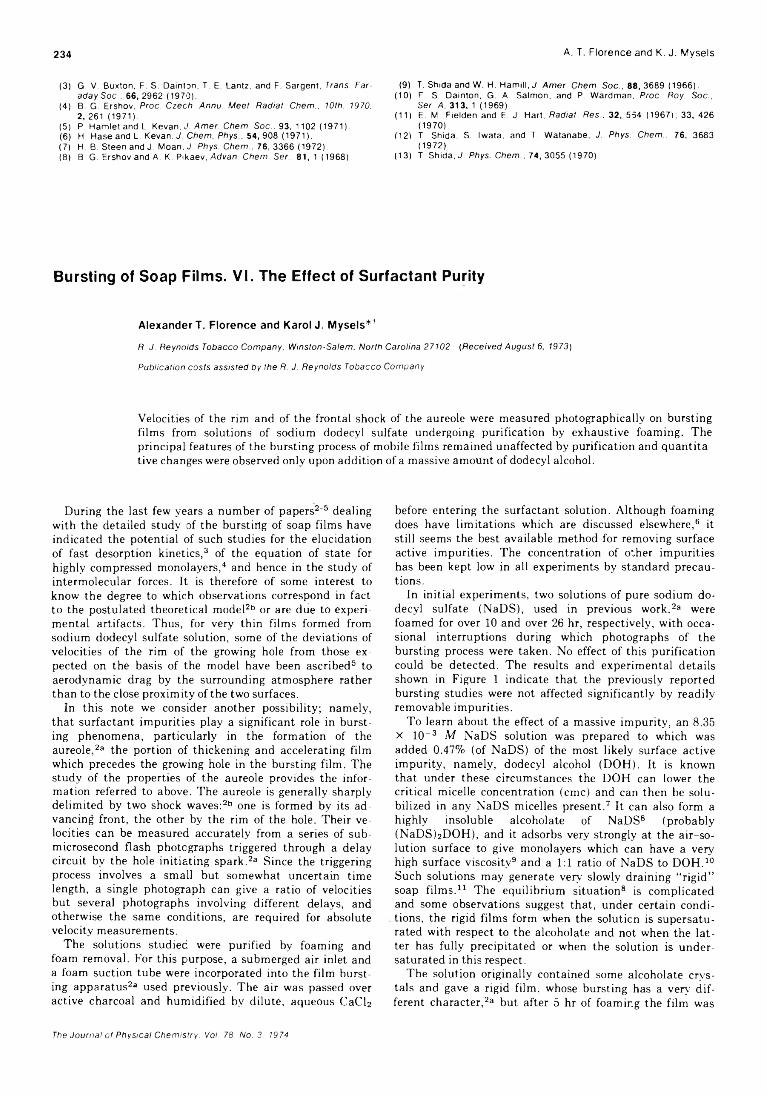
234 A. T. Florence and K. J. Mysels
(3) G. V. Buxton, F. S. Dainton, T. E. Lantz, and F. Sargent, Trans. Faraday Soc.. 66, 2962 (1970).
(4) B. G. Ershov, Proc. Czech. Annu. Meet. Radiat. Chem.. 10th. 1970. 2, 261 (1971).
(5) P. Hamlet and L. Kevan.d. Amer. Chem. Soc.. 93, 1102 (1971).(6) H. Hase and L. Kevan. J. Chem. Phys.. 54,908 (1971).(7) H. B. Steen and J. Moan. J. Phys. Chem.. 76, 3366 (1972).(8) B. G. Ershov and A. K. Pikaev, Advan. Chem. Ser.. 81, 1 (1968).
(9) T. Shida and W. H. Hamill, J. Amer. Chem. Soc., 88, 3689 (1966).(10) F. S. Dainton, G. A. Salmon, and P. Wardman, Proc. Roy. Soc.,
Ser. A. 313, 1 (1969).(11) E. M. Fielden and E. J. Hart, Radiat. Res.. 32, 564 (1967); 33, 426
(1970).(12) T. Shida, S. Iwata, and T. Watanabe, J. Phys. Chem.. 76, 3683
(1972).(13) T. Shida, J. Phys. Chem.. 74, 3055 (1970).
B u r s t in g o f S o a p F ilm s . V I . T h e E f f e c t o f S u r f a c t a n t P u r ity
Alexander T. Florence and Karol J. Mysels*1
R. J. Reynolds Tobacco Company. Winston-Salem. North Carolina 27102 (Received August 6, 1973) Publication costs assisted by the R. J. Reynolds Tobacco Company
Velocities of the rim and of the frontal shock of the aureole were measured photographically on bursting films from solutions of sodium dodecyl sulfate undergoing purification by exhaustive foaming. The principal features of the bursting process of mobile films remained unaffected by purification and quantitative changes were observed only upon addition of a massive amount of dodecyl alcohol.
During the last few years a number of papers2 - 5 dealing with the detailed study of the bursting of soap films have indicated the potential of such studies for the elucidation of fast desorption kinetics, 3 of the equation of state for highly compressed monolayers, 4 and hence in the study of intermolecular forces. It is therefore of some interest to know the degree to which observations correspond in fact to the postulated theoretical model2b or are due to experimental artifacts. Thus, for very thin films formed from sodium dodecyl sulfate solution, some of the deviations of velocities of the rim of the growing hole from those expected on the basis of the model have been ascribed5 to aerodynamic drag by the surrounding atmosphere rather than to the close proximity of the two surfaces.
In this note we consider another possibility; namely, that surfactant impurities play a significant role in bursting phenomena, particularly in the formation of the aureole,2® the portion of thickening and accelerating film which precedes the growing hole in the bursting film. The study of the properties of the aureole provides the information referred to above. The aureole is generally sharply delimited by two shock waves: 25 one is formed by its advancing front, the other by the rim of the hole. Their velocities can be measured accurately from a series of sub- microsecond flash photographs triggered through a delay circuit by the hole-initiating spark.2® Since the triggering process involves a small but somewhat uncertain time length, a single photograph can give a ratio of velocities but several photographs involving different delays, and otherwise the same conditions, are required for absolute velocity measurements.
The solutions studied were purified by foaming and foam removal. For this purpose, a submerged air inlet and a foam suction tube were incorporated into the film bursting apparatus2® used previously. The air was passed over active charcoal and humidified by dilute, aqueous CaCl2
before entering the surfactant solution. Although foaming does have limitations which are discussed elsewhere, 6 it still seems the best available method for removing surface active impurities. The concentration of other impurities has been kept low in all experiments by standard precautions.
In initial experiments, two solutions of pure sodium dodecyl sulfate (NaDS), used in previous work,2® were foamed for over 1 0 and over 26 hr, respectively, with occasional interruptions during which photographs of the bursting process were taken. No effect of this purification could be detected. The results and experimental details shown in Figure 1 indicate that the previously reported bursting studies were not affected significantly by readily removable impurities.
To learn about the effect of a massive impurity, an 8.35 x 1 0 - 3 M NaDS solution was prepared to which was added 0.47% (of NaDS) of the most likely surface active impurity, namely, dodecyl alcohol (DOH). It is known that under these circumstances the DOH can lower the critical micelle concentration (cmc) and can then be solubilized in any NaDS micelles present. 7 It can also form a highly insoluble alcohólate of NaDS8 (probably (NaDS)2DOH), and it adsorbs very strongly at the air-solution surface to give monolayers which can have a very high surface viscosity9 and a 1:1 ratio of NaDS to DOH . 10
Such solutions may generate very slowly draining “rigid” soap films. 1 1 The equilibrium situation8 is complicated and some observations suggest that, under certain conditions, the rigid films form when the solution is supersaturated with respect to the alcohólate and not when the latter has fully precipitated or when the solution is undersaturated in this respect.
The solution originally contained some alcohólate crystals and gave a rigid film, whose bursting has a very different character,2® but after 5 hr of foaming the film was
The Journal of Physical Chemistry. Vol. 78. No. 3. 1974
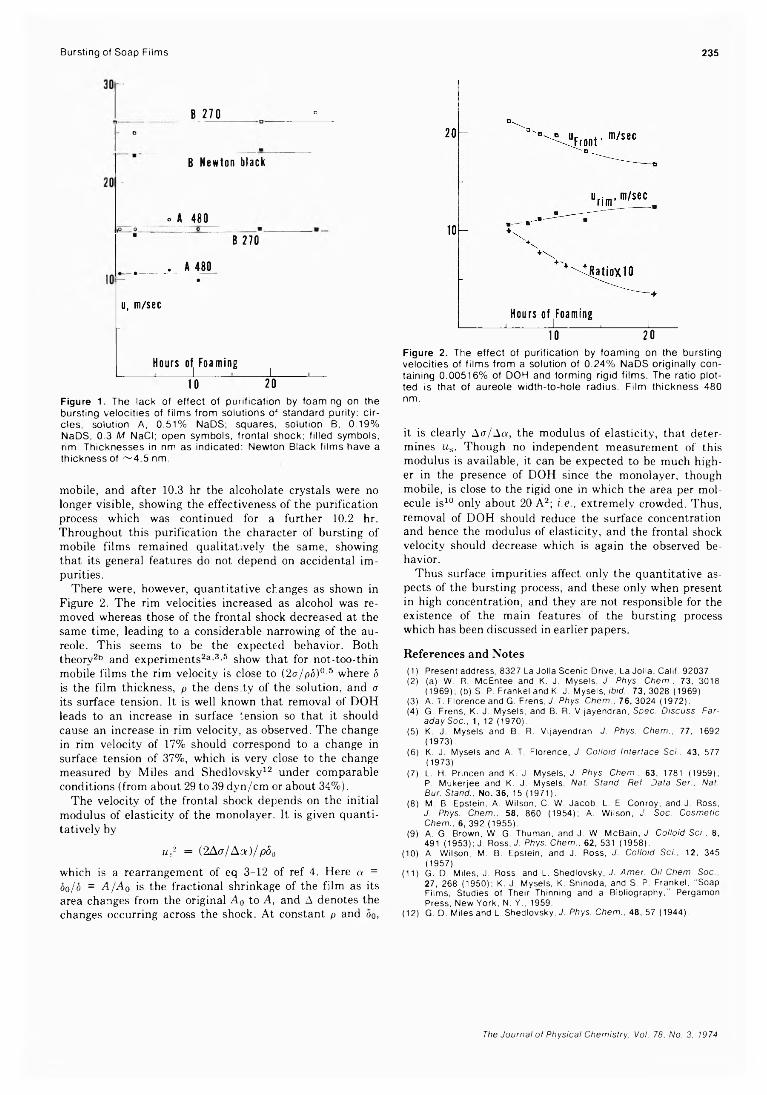
Bursting of Soap Films 235
-
B 270 D
D
B Newton black
-
° A 480
c B 270
. A 480 *----------- •
u, m/sec
Hours of Foaming__1----J______ °_____ L
1 0 2 0
Figure 1. The lack of e ffect of purification by foam ng on the bursting ve locities of film s from solutions o ' standard purity: c ir cles, solution A, 0.51% NaDS; squares, solution B, 0.19% NaDS, 0.3 M NaCI; open symbols, frontal shock; filled symbols, rim. Thicknesses in nm as indicated: Newton Black film s have a th ickness of ~ 4 .5 nm.
mobile, and after 10.3 hr the alcoholate crystals were no longer visible, showing the effectiveness of the purification process which was continued for a further 1 0 . 2 hr. Throughout this purification the character of bursting of mobile films remained qualitatively the same, showing that its general features do not depend on accidental impurities.
There were, however, quantitative changes as shown in Figure 2. The rim velocities increased as alcohol was removed whereas those of the frontal shock decreased at the same time, leading to a considerable narrowing of the aureole. This seems to be the expected behavior. Both theory2b and experiments2®-3 ' 5 show that for not-too-thin mobile films the rim velocity is close to (2 o/p8 ) 0 -5 where 5 is the film thickness, p the density of the solution, and <r its surface tension. It is well known that removal of DOH leads to an increase in surface tension so that it should cause an increase in rim velocity, as observed. The change in rim velocity of 17% should correspond to a change in surface tension of 37%, which is very close to the change measured by Miles and Shedlovsky12 under comparable conditions (from about 29 to 39 dvn/cm or about 34%).
The velocity of the frontal shock depends on the initial modulus of elasticity of the monolayer. It is given quantitatively by
ms2 = (2A<r/A.a)/p<50
which is a rearrangement of eq 3-12 of ref 4. Here cv = 5o/5 = A / A 0 is the fractional shrinkage of the film as its area changes from the original A 0 to A , and A denotes the changes occurring across the shock. At constant p and t>o,
Hours of Foaming_____ 1______1______I______I___
1 0 2 0
Figure 2. The effect of purification by foaming on the bursting velocities of film s from a solution of 0.24% NaDS originally containing 0.00516% of DOH and form ing rigid film s. The ratio p lotted is that of aureole w idth-to-hole radius. Film th ickness 480 nm.
it is clearly Arr/Aa, the modulus of elasticity, that determines us. Though no independent measurement of this modulus is available, it can be expected to be much higher in the presence of DOH since the monolayer, though mobile, is close to the rigid one in which the area per molecule is10 only about 20 A2; i.e., extremely crowded. Thus, removal of DOH should reduce the surface concentration and hence the modulus of elasticity, and the frontal shock velocity should decrease which is again the observed behavior.
Thus surface impurities affect only the quantitative aspects of the bursting process, and these only when present in high concentration, and they are not responsible for the existence of the main features of the bursting process which has been discussed in earlier papers.
References and Notes(1) Present address, 8327 La Jolla Scenic Drive, La Jolla, Calif. 92037.(2) (a) W. R. McEntee and K. J. Mysels, J. Phys. Chem.. 73, 3018
(1969); (b) S. P. Frankel and K. J. Mysels, ibid., 73, 3028 (1969).(3) A. T. Florence and G. Frens, J. Phys. Chem.. 76, 3024 (1972).(4) G. Frens, K. J. Mysels, and B. R. Vijayendran, Spec. Discuss. Far
aday Soc.. 1, 12 (1970).(5) K. J. Mysels and B. R. Vijayendran, J. Phys. Chem., 77, 1692
(1973).(6) K. J. Mysels and A. T. Florence, J. Colloid Interface Sc/.. 43, 577
(1973).(7) L. H. Princen and K. J. Mysels, J. Phys. Chem.. 63, 1781 (1959);
P. Mukerjee and K. J. Mysels. Nat. Stand. Ref. Data Ser., Nat. Bur. Stand.. No. 36, 15 (1971).
(8) M. B. Epstein, A. Wilson, C. W. Jacob, L. E. Conroy, and J. Ross, J. Phys. Chem.. 58, 860 (1954); A. Wilson, J. Soc. Cosmetic Chem.. 6, 392 (1955).
(9) A. G. Brown, W. G. Thuman, and J. W. McBain, J. Colloid Sci.. 8, 491 (1953); J. Ross, J. Phys. Chem., 62, 531 (1958).
(10) A. Wilson. M. B. Epstein, and J. Ross, J. Colloid Sci., 12, 345 (1957).
(11) G. D. Miles, J. Ross, and L. Shedlovsky, J. Amer. Oil Chem. Soc., 27, 268 (1950); K. J. Mysels, K. Shlnoda, and S. P. Frankel, “ Soap Films, Studies of Their Thinning and a Bibliography,” Pergamon Press, New York, N. Y., 1959.
(12) G. D. Miles and L. Shedlovsky, J. Phys. Chem., 48, 57 (1944).
The Journal of Physical Chemistry, Vol. 78. No. 3. 1974
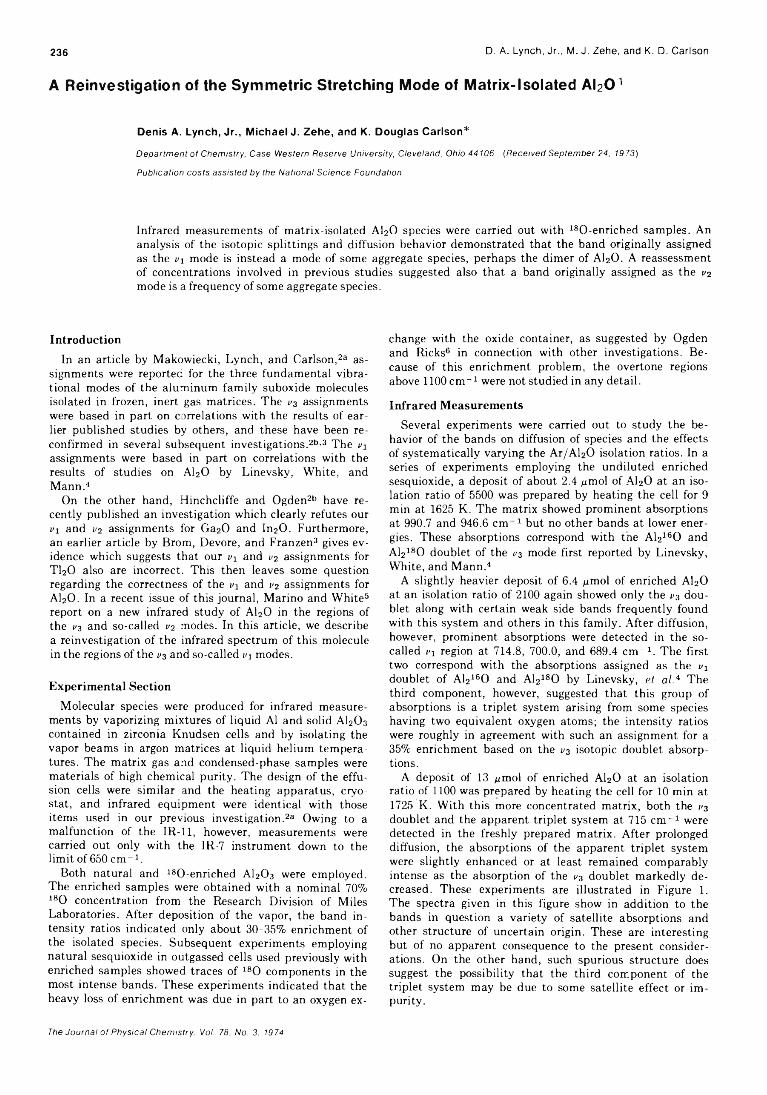
236 D. A. Lynch, Jr., M. J. Zehe, and K. D. Carlson
A R e in v e s t ig a t io n o f t h e S y m m e t r ic S t r e t c h in g M o d e o f M a t r ix - I s o la t e d A I2 O 1
Denis A. Lynch, Jr., Michael J. Zehe, and K. Douglas Carlson*
Department of Chemistry, Case Western Reserve University, Cleveland, Ohio 44106 {Received September 24, 1973) Publication costs assisted by the National Science Foundation
Infrared measurements of matrix-isolated A120 species were carried out with 1 8 0-enriched samples. An analysis of the isotopic splittings and diffusion behavior demonstrated that the band originally assigned as the v\ mode is instead a mode of some aggregate species, perhaps the dimer of AI2 O. A reassessment of concentrations involved in previous studies suggested also that a band originally assigned as the 1/2
mode is a frequency of some aggregate species.
IntroductionIn an article by Makowiecki, Lynch, and Carlson,2® as
signments were reported for the three fundamental vibrational modes of the aluminum family suboxide molecules isolated in frozen, inert gas matrices. The i/3 assignments were based in part on correlations with the results of earlier published studies by others, and these have been reconfirmed in several subsequent investigations. 2 6 ' 3 The iq assignments were based in part on correlations with the results of studies on A120 by Linevsky, White, and Mann. 4
On the other hand, Hinchcliffe and Ogden26 have recently published an investigation which clearly refutes our jq and V2 assignments for Ga20 and ln2 0. Furthermore, an earlier article by Brom, Devore, and Franzen3 gives evidence which suggests that our v 1 and r2 assignments for T120 also are incorrect. This then leaves some question regarding the correctness of the v 1 and ¡'2 assignments for A120. In a recent issue of this journal, Marino and White5
report on a new infrared study of A120 in the regions of the vz and so-called V2 modes. In this article, we describe a reinvestigation of the infrared spectrum of this molecule in the regions of the 113 and so-called ¡q modes.
Experimental SectionMolecular species were produced for infrared measure
ments by vaporizing mixtures of liquid A1 and solid Al2 0 3
contained in zirconia Knudsen cells and by isolating the vapor beams in argon matrices at liquid helium temperatures. The matrix gas and condensed-phase samples were materials of high chemical purity. The design of the effusion cells were similar and the heating apparatus, cryostat, and infrared equipment were identical with those items used in our previous investigation.2® Owing to a malfunction of the IR-11, however, measurements were carried out only with the IR-7 instrument down to the limit of 650 cm -1.
Both natural and 1 8 0-enriched Al2 0 3 were employed. The enriched samples were obtained with a nominal 70% 180 concentration from the Research Division of Miles Laboratories. After deposition of the vapor, the band intensity ratios indicated only about 30-35% enrichment of the isolated species. Subsequent experiments employing natural sesquioxide in outgassed cells used previously with enriched samples showed traces of 1 8 0 components in the most intense bands. These experiments indicated that the heavy loss of enrichment was due in part to an oxygen ex
change with the oxide container, as suggested by Ogden and Ricks6 in connection with other investigations. Because of this enrichment problem, the overtone regions above 1 1 0 0 cm - 1 were not studied in any detail.
Infrared MeasurementsSeveral experiments were carried out to study the be
havior of the bands on diffusion of species and the effects of systematically varying the Ar/Al20 isolation ratios. In a series of experiments employing the undiluted enriched sesquioxide, a deposit of about 2.4 /rmol of A120 at an isolation ratio of 5500 was prepared by heating the cell for 9 min at 1625 K. The matrix showed prominent absorptions at 990.7 and 946.6 cm 1 but no other bands at lower energies. These absorptions correspond with the A12160 and A12180 doublet of the ¡q mode first reported by Linevsky, White, and Mann.4
A slightly heavier deposit of 6.4 ¿¿mol of enriched A120 at an isolation ratio of 2 1 0 0 again showed only the ¡q doublet along with certain weak side bands frequently found with this system and others in this family. After diffusion, however, prominent absorptions were detected in the so- called jq region at 714.8, 700.0, and 689.4 cm -1. The first two correspond with the absorptions assigned as the iq doublet of A12160 and A12180 by Linevsky, e t a l . 4 The third component, however, suggested that this group of absorptions is a triplet system arising from some species having two equivalent oxygen atoms; the intensity ratios were roughly in agreement with such an assignment for a 35% enrichment based on the i>3 isotopic doublet absorptions.
A deposit of 13 /rmol of enriched A120 at an isolation ratio of 1 1 0 0 was prepared by heating the cell for 1 0 min at 1725 K. With this more concentrated matrix, both the iq doublet and the apparent triplet system at 715 cm - 1 were detected in the freshly prepared matrix. After prolonged diffusion, the absorptions of the apparent triplet system were slightly enhanced or at least remained comparably intense as the absorption of the iq doublet markedly decreased. These experiments are illustrated in Figure 1. The spectra given in this figure show in addition to the bands in question a variety of satellite absorptions and other structure of uncertain origin. These are interesting but of no apparent consequence to the present considerations. On the other hand, such spurious structure does suggest the possibility that the third component of the triplet system may be due to some satellite effect or impurity.
The Journal of Physical Chemistry. Vol. 78. No. 3. 1974
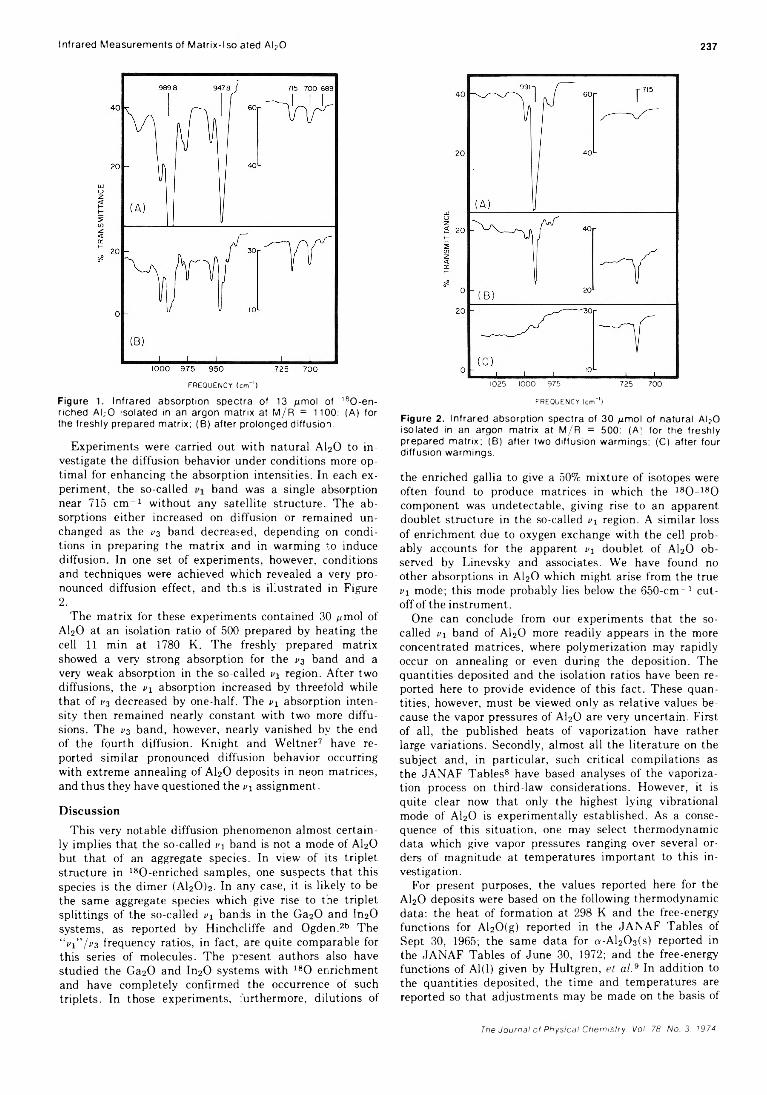
Infrared Measurements of Matrix-Iso ated Al20 237
F R E Q U E N C Y ( c m '1)
Figure 1. Infrared absorption spectra of 13 /¿mol of 180 -en - riched A l20 isolated in an argon m atrix at M /R = 1100: (A) for the freshly prepared matrix; (B) after prolonged diffusion.
Experiments were carried out with natural A120 to investigate the diffusion behavior under conditions more optimal for enhancing the absorption intensities. In each experiment, the so-called band was a single absorption near 715 c m 1 without any satellite structure. The absorptions either increased on diffusion or remained unchanged as the r>3 band decreased, depending on conditions in preparing the matrix and in warming to induce diffusion. In one set of experiments, however, conditions and techniques were achieved which revealed a very pronounced diffusion effect, and this is illustrated in Figure 2 .
The matrix for these experiments contained 30 ¿imol of A120 at an isolation ratio of 500 prepared by heating the cell 11 min at 1780 K. The freshly prepared matrix showed a very strong absorption for the V3 band and a very weak absorption in the so-called vj region. After two diffusions, the ¡/i absorption increased by threefold while that of i>3 decreased by one-half. The v\ absorption intensity then remained nearly constant with two more diffusions. The vz band, however, nearly vanished by the end of the fourth diffusion. Knight and Weltner7 have reported similar pronounced diffusion behavior occurring with extreme annealing of A120 deposits in neon matrices, and thus they have questioned the ri assignment.
DiscussionThis very notable diffusion phenomenon almost certain
ly implies that the so-called v\ band is not a mode of A120 but that of an aggregate species. In view of its triplet structure in 1 8 0 -enriched samples, one suspects that this species is the dimer (A12 0)2. In any case, it is likely to be the same aggregate species which give rise to tne triplet splittings of the so-called v\ bands in the Ga20 and ln20 systems, as reported by Hinchcliffe and Ogden.2b The “ v\” ¡V3 frequency ratios, in fact, are quite comparable for this series of molecules. The present authors also have studied the Ga20 and ln20 systems with 180 enrichment and have completely confirmed the occurrence of such triplets. In those experiments, furthermore, dilutions of
1025 1000 975 725 700
F R E Q U E N C Y (cm "1)
Figure 2. Infrared absorption spectra of 30 /¿mol of natural A l20 isolated in an argon matrix at M /R = 500: (A) for the freshly prepared m atrix; (B) after two diffusion warm ings; (C) after four diffusion warmings.
the enriched gallia to give a 50% mixture of isotopes were often found to produce matrices in which the 1 8 0 - 1 8 0
component was undetectable, giving rise to an apparent doublet structure in the so-called vi region. A similar loss of enrichment due to oxygen exchange with the cell probably accounts for the apparent v\ doublet of A120 observed by Linevsky and associates. We have found no other absorptions in A120 which might arise from the true ¡>i mode; this mode probably lies below the 650-cm"1 cutoff of the instrument.
One can conclude from our experiments that the so- called v\ band of A120 more readily appears in the more concentrated matrices, where polymerization may rapidly occur on annealing or even during the deposition. The quantities deposited and the isolation ratios have been reported here to provide evidence of this fact. These quantities, however, must be viewed only as relative values because the vapor pressures of A120 are very uncertain. First of all, the published heats of vaporization have rather large variations. Secondly, almost all the literature on the subject and, in particular, such critical compilations as the JANAF Tables8 have based analyses of the vaporization process on third-law considerations. However, it is quite clear now that only the highest lying vibrational mode of A120 is experimentally established. As a consequence of this situation, one may select thermodynamic data which give vapor pressures ranging over several orders of magnitude at temperatures important to this investigation.
For present purposes, the values reported here for the A120 deposits were based on the following thermodynamic data: the heat of formation at 298 K and the free-energy functions for Al2 0(g) reported in the JANAF Tables of Sept 30, 1965; the same data for a-Al2 C>3 (s) reported in the JANAF Tables of June 30, 1972; and the free-energy functions of Al(l) given by Hultgren, e t a l . 9 In addition to the quantities deposited, the time and temperatures are reported so that adjustments may be made on the basis of
The Journal of Physical Chemistry. Vol. 78. No. 3. 1974
238 Rhine, Williams, Hale, and Querry
any other selected set of thermodynamic values. It should be noted that the A1 pressures are even higher than those of AI2 O (on the basis of the data cited above). Thus, the matrices are much more concentrated in terms of the total material deposited.
For experiments reported in our previous publication, 23
isolation data were based on pressures of AI2 O reported by Brewer and Searcy. 10 As a point in their favor, these pressures are independent of third-law analyses, but they are probably too low by one or two orders of magnitude. Thus the matrices were much more concentrated than reported. In this case, the apparent absence of an increase in the so- called l'i absorption on diffusion may have resulted because aggregation had proceeded too far during the preparation of the matrix. On similar grounds, one must conclude that the so-called v2 mode of A I 2 O at 503 c m 1 is observed only in very concentrated matrices, of the order of 40 ¿¿mol, based on the present method of calculation, at an isolation ratio of 380. This band therefore is also likely to be due to an aggregate species, possibly the dimer, perhaps A I 3 O . The “ v2 ” / f3 ratio is quite similar to those for the other suboxides.2b We can neither confirm nor deny
that this 503-cm-1 band is the same absorption studied by Marino and White. 5
A ck n ow led g m en t. The authors are pleased to acknowledge the assistance of Mr. M. Haynesworth of the Lighting Research Laboratory, General Electric Lamp Division, in preparing the figures.References and Notes
(1) Research supported in part by a grant from the National Science Foundation.
(2) (a) D. M. Makowiecki, D. A. Lynch, Jr., and K. D. Carlson, J. Phys. Chem.. 75, 1963 (1971); (b) A. J. Hinchcliffe and J. S. Ogden, ibid.. 75, 3908 (1971).
(3) J. M. Brom, Jr., T. Devore, and H. F. Franzen, J. Chem. Phys., 54, 2742 (1971).
(4) M. J. Linevsky, D. White, and D. E. Mann, J. Chem. Phys., 41, 542 (1964).
(5) C. P. Marino and D. White, J. Phys. Chem., 77, 2929 (1973).(6) J. S. Ogden and M. J. Ricks, J. Chem. Phys., 56, 1658 (1972).(7) L. B. Knight. Jr., and W. Weltner, Jr.. J. Chem. Phys.. 55, 5066
(1971).(8) “JANAF Thermochemical Tables,” The Dow Chemical Company,
Midland, Mich.; revised editions on dates cited in text.(9) R. Hultgren, R. L. Orr, P. D. Anderson, and K. K. Kelly, ‘ ‘Selected
Values of Thermodynamic Properties of Metals and Alloys,” Wiley, New York, N. Y „ 1963.
(10) L. Brewer and A. W. Searcy, J. Amer. Chem. Soc., 73, 5308 (1951).
I n fr a r e d O p t ic a l C o n s t a n t s o f A q u e o u s S o lu t io n s o f E le c t r o ly t e s . T h e A lk a li H a lid e s
Paul Rhine, Dudley Williams,*
Department of Physics. Kansas State University, Manhattan, Kansas 66506G. Michael Hale, and Marvin R. Querry
Department of Physics, University of Missouri, Kansas City, Missouri 641W (Received July 5. 1973)
The normal-incidence spectral reflectance of aqueous solutions of alkali halides has been measured in the spectral range 350-5000 cm-1 . From the measured values of reflectance we have used Kramers-Kronig phase-shift analysis to provide values of the real and imaginary parts of the complex refractive indices N = n + ik of the solutions. The plots of k (v ) vs. v give quantitative measures of absorption band intensities as well as positions; we find that the negative ions produce greater changes in the absorption spectrum of the solvent than do the positive ions. Similarly, we find that the negative ions have greater influence on n{v) in the near infrared; all the halide ions increase n (v) to values above that of water but, at a common concentration, the iodide ion has the greatest effect. The primary influence of the ions on n (v ) in the near infrared can be attributed to electronic bands in the ultraviolet. The influence of the ions on the characteristic water bands is related to the influence of the ions on the intermolecular structure of water.
IntroductionAlthough the infrared spectrum of water has been the
subject of numerous investigations dating from the early days of infrared spectroscopy, a critical survey by Irvine and Pollack1 revealed many inconsistencies in published results and emphasized the importance of further quantitative studies of transmission and reflection for the purpose of obtaining more precise values of the real and imaginary parts of the refractive index TV = n + ik in the infrared. Several such quantitative studies of water have recently been reported.2- 8 These studies have revealed that the values of the optical constants n and k obtained
in much of the infrared by Kramers-Kronig (KK) analysis6 of near-normal-incidence-reflectance measurements were in much of the infrared in essential agreement with values based on reflectance measurements at two angles of incidence and with values based on a combination of reflection and absorption measurements.® The KK analysis of reflectance measurements provides reliable values of n in most of the range covered by the reflectance measurements and good values of k in the vicinity of strong bands; the fractional uncertainties in k increase as k decreases.
The KK theorem for phase-shift analysis of reflectance R (v ) data asserts that if the modulus p{v) = [R {v ) ] 1 / 2 of
The Journal of Physical Chemis'ry. Voi 78. No. 3. 1974
I nfrared Optical Constants of Aqueous Solutions of A lkali Halides 239
the complex reflectivity p (v )e i<?'-,,] is known for all frequencies v, then the phase 4>(vo) at any frequency vo is given by
4>\v 0) = — P rj£Jo vJlnp(p)
dp (1 )
where p(v) and <p(v) must satisfy conditions that allow contour integration in the complex plane. Although the value of 4>(vo) in eq 1 is most strongly influenced by values of p(v) in the vicinity of vo, values of p{v) for all frequencies must be known if the KK theorem is to apply with rigor. Our earlier experience with water6 has shown that 4>(vo) in the range 300-5000 cm-1, in which we had actually measured R (v) is relatively insensitive to the type of extrapolation of R (v ) to higher frequencies provided the extrapolation joins smoothly to the measured reflectance curve; values based on extrapolation to lower frequencies have increasingly greater uncertainties as v0 in eq 1 approaches the lower limit covered by experiment. In making the extrapolation of R (v) to low frequencies, we found it desirable to make use of approximate values based on the experimental work of others. 4 3
In the present study, we report the results of measurements of the near-normal incidence spectral reflectance R (v ) of aqueous solutions of alkali halides in the range 350-5000 cm - 1 and present the values of n and k provided by KK phase-shift analysis of the measured values of R. In addition to providing some insight into the influence of dissolved monatomic ions on the intermolecular lattice structure of liquid water, the study provides results that are of practical importance to meteorological studies of the transmission of infrared radiation through aerosols encountered in fog and cloud formation near the surface of the sea.
Experimental Section
The general experimental techniques have been described in detail in earlier papers. We determined the spectral reflectance of a sample by comparing the radiant flux reflected from the free liquid surface with the flux reflected by a reference mirror, tne absolute reflectivity of which was determined in an auxiliary experiment. In the comparison of the sample with the reference mirror we used a calibrated optical attenuator consisting of a rapidly rotating sector wheel, which was placed in front of the spectrometer slit when flux from the mirror was being measured; by use of the attenuator we avoided the necessity of changing amplifier gain settings. In spectral regions where the spectral reflectance of water had been well established, we made direct comparison of sample reflectance with the reflectance of water.
At least four independent measurements of reflectance were made for each solution studied. We believe that the averaged values of R presented in the figures have an experimental uncertainty of ± 1 % of the plotted values; the uncertainties may have been slightly .arger in spectral regions where R is changing rapidly with frequency and also at the lowest frequency range covered 450-350 cm-1 .
The computer program used to determine <j>(vo) from eq 1 employed a basic wave number interval of 1 0 cm - 1 for numerical integration except in the vicinity of the singularity at v = vo, where the wave number interval was reduced to approximately 1 cm "1. In providing values of R for use in eq 1 outside the 350-5000-cm'1 range covered by actual measurement, we made use of the values of the optical constants of water tabulated by Zolatarev, e t a l . ; 4
the computed values of water reflectance were raised to match and join smoothly with our R curves at 5000 and at 350 cm-1 . Since the gross features of the reflectance curves for the solutions are similar to those for water, the adjustment of the Zolatarev data probably gives a satisfactory approximation of solution reflectance outside our range of measurement. We further assumed that the reflectance of a solution was constant for v > 1 0 , 0 0 0 cm- 1
and equal to the reflectance at 1 0 , 0 0 0 cm-1 ; this eliminated remote ultraviolet reflection bands from the integral. Similarly, we assumed that solution reflectance at extremely low frequencies was constant and equal to its reflectance at 0.37 c m '1, thereby eliminating the effects of bands at lower radio frequencies.
On the basis of our earlier work on water together with considerations of uncertainties in our present work, we estimate that the uncertainty in <j>(vo) in eq 1 is ±0.003 rad. This indicates that uncertainties in n amount to ±1% of the values shown in our graphs over most of the frequency range indicated but may increase to ± 2 % at the lowest frequencies. The numerical uncertainty Sk amounts to approximately ±0.03 over most of the range; thus, our uncertainties amount to ± 1 0 % at the maximum of the strong band near 3400 c m '1, ±25% at the maximum of the weaker band near 1640 cm-1, and ±7.5% at the maximum of the strong band near 500 cm-1 . These uncertainties are large but are smaller than those involved in values based on transmission measurements unless extreme care is taken in the preparation of the absorption cell. 7 For values of k < 0.10, values of k based on transmission measurements are usually to be preferred provided suitable cell windows of high optical quality are available.
Reagent grade materials were employed. Reflectance was measured for solutions at ambient laboratory temperature, which was approximately 27°.
Results
The results of our study are summarized in the figures. The top panel in each figure gives measured reflectance R as a function of frequency. The center panel of each figure gives a corresponding plot of n, and the bottom panel gives k as a function of frequency. In each panel a light continuous curve gives the corresponding parameter for pure water at 27° for purposes of comparison.
A . T he 5000 -2500-cm R egion . Figures 1-4 gives plotsfor the spectral region 5000-2500 c m '1, which is dominated by the intense absorption band near 3400 cm- 1 in water; this band, which occurs in a region where molecules containing OH groups have characteristic absorption, is usually attributed primarily to the vy and ¡<3 fundamentals of the H2 O molecule but includes some contribution from 2 v2 of the molecule.
Figure 1 gives the results obtained with 4 M solutions of three alkali bromides in the 5000-2500-cm“ 1 region. The general contours of the reflectance feature are changed somewhat and the reflectances of the solutions are generally higher than those of water. The values of n for the solutions in the 5000-4000-cm ' 1 region are practically indistinguishable from one another; this indicates that the difference between n of the solutions from that of water in this region is due primarily to the common halide ion Br~ and the alkali ions have relatively little effect on n. Similar results were obtained in studies of L i', Na+, and K + in the presence of the halide ions C l ' and I~; related but less clear-cut results were obtained with alkali fluorides.
The Journal of Physical Chemistry. Vol. 78. No. 3. 1974
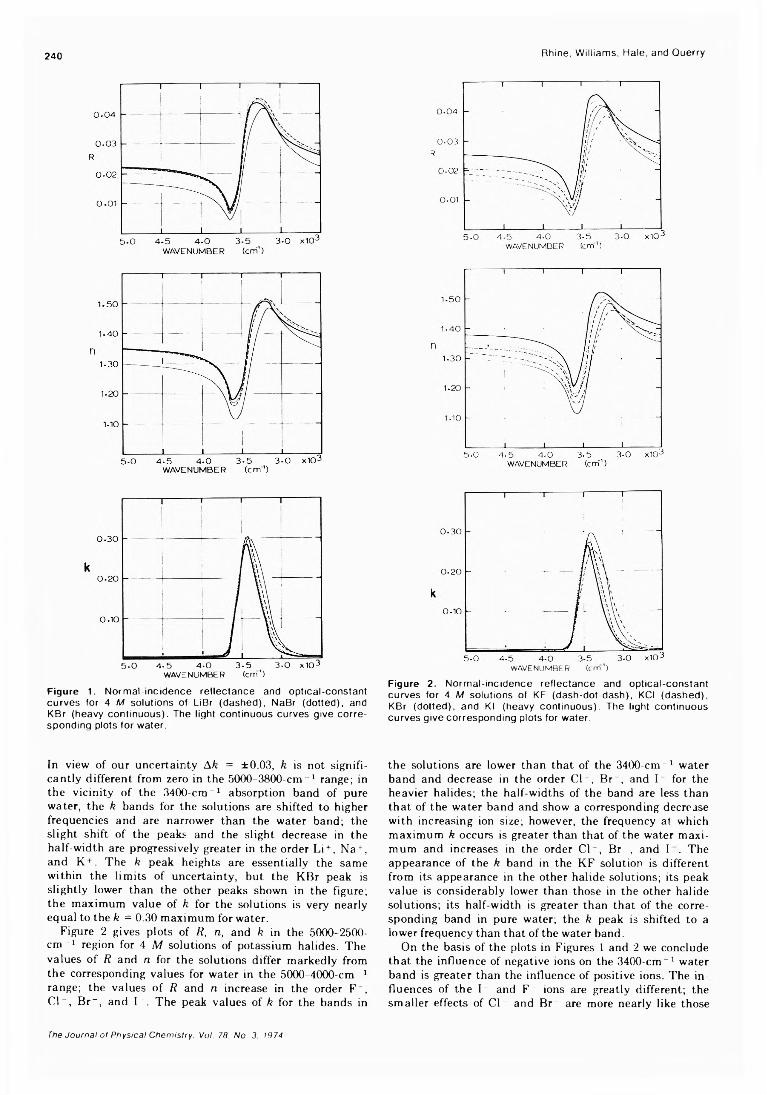
240 Rhine, Williams, Hale, and Querry
5 . 0 4 - 5 4 - 0 3 - 5 3 - 0 x 1 0 3
W A V E N U M B E R ( c m ’ )
F ig u re 1. N o rm a l- in c id e n c e re fle c ta n ce and o p tica l-co n s ta n t cu rv e s fo r 4 M so lu tio ns o f L iB r (d ashed ), N aB r (d o tte d ), and K B r (heavy c o n tin u o u s ). The ligh t con tin u o u s cu rves g ive c o r re sp o nd ing p lo ts fo r w a te r.
In view of our uncertainty Ak = ±0.03, k is not significantly different from zero in the 5000-3800-cm- 1 range; in the vicinity of the 3400-cm-1 absorption band of pure water, the k bands for the solutions are shifted to higher frequencies and are narrower than the water band; the slight shift of the peaks and the slight decrease in the half-width are progressively greater in the order Li + , Na + , and K+. The k peak heights are essentially the same within the limits of uncertainty, but the KBr peak is slightly lower than the other peaks shown in the figure; the maximum value of k for the solutions is very nearly equal to the k = 0.30 maximum for water.
Figure 2 gives plots of R, n, and k in the 5000-2500- cm - 1 region for 4 M solutions of potassium halides. The values of R and n for the solutions differ markedly from the corresponding values for water in the 5000-4000-cm - 1
range; the values of R and n increase in the order F , C l- , Br- , and I - . The peak values of k for the bands in
W A V E N U M B E R ( c m ' l
F ig u re 2 . N o rm a l- in c id e n c e re fle c ta n c e and o p tic a l-c o n s ta n t cu rves fo r 4 M so lu tio ns of KF (d a sh -d o t-d a sh ), KCI (d a sh e d ), K B r (d o tte d ), and Kl (heavy c o n tin u o u s ). The ligh t con tin u o u s c u rve s g ive co rre sp o n d in g p lo ts fo r w ate r.
the solutions are lower than that of the 3400-cm-1 water band and decrease in the order C l- , Br- , and I - for the heavier halides; the half-widths of the band are less than that of the water band and show a corresponding decrease with increasing ion size; however, the frequency at which maximum k occurs is greater than that of the water maximum and increases in the order C l- , B r- , and I . The appearance of the k band in the KF solution is different from its appearance in the other halide solutions; its peak value is considerably lower than those in the other halide solutions; its half-width is greater than that of the corresponding band in pure water; the k peak is shifted to a lower frequency than that of the water band.
On the basis of the plots in Figures 1 and 2 we conclude that the influence of negative ions on the 3400-cm-1 water band is greater than the influence of positive ions. The influences of the I- and F - ions are greatly different; the smaller effects of C l- and Br- are more nearly like those
The Journal of Physical Chemistry. Voi. 78. No. 3. 1974
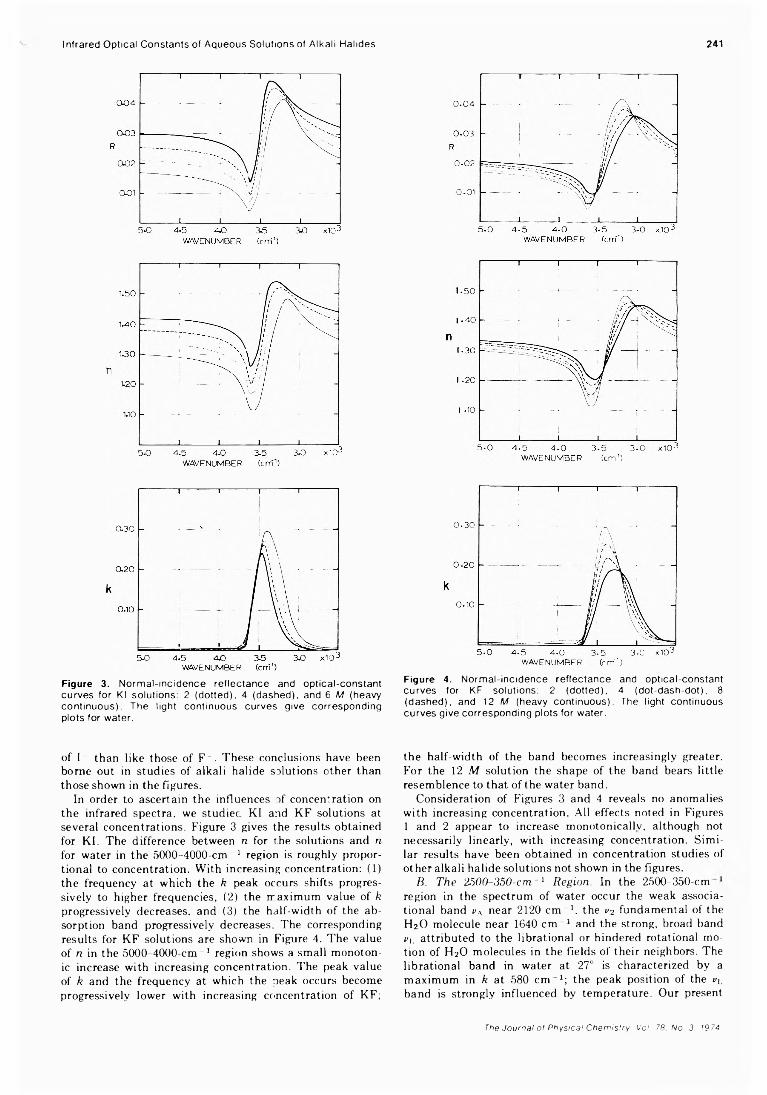
Infrared Optical Constants of Aqueous Solutions of Alkali Halides
F ig u re 3. N o rm a l- in c id e n c e re fle c ta n c e and o p tica l-co n s ta n t cu rve s fo r K l so lu tio n s : 2 (d o tte d ), 4 (d ashed ), and 6 M (heavy c o n tin u o u s ). T h e ligh t co n tinuou s cu rves g ive co rre sp o n d in g p lo ts fo r w a te r.
of I- than like those of F - . These conclusions have been borne out in studies of alkali halide solutions other than those shown in the figures.
In order to ascertain the influences of concentration on the infrared spectra, we studied KI and KF solutions at several concentrations. Figure 3 gives the results obtained for KI. The difference between n for the solutions and n for water in the 5000-4000-cm ~ 1 region is roughly proportional to concentration. With increasing concentration: (1) the frequency at which the k peak occurs shifts progressively to higher frequencies, (2 ) the maximum value of k progressively decreases, and (3) the half-width of the absorption band progressively decreases. The corresponding results for KF solutions are shown in Figure 4. The value of n in the 5000-4000-cm-1 region shows a small monotonic increase with increasing concentration. The peak value of k and the frequency at which the peak occurs become progressively lower with increasing concentration of KF;
241
F ig u re 4. N o rm a l- in c id e n ce re fle c ta n c e and o p tica l-co n s ta n t cu rve s fo r KF so lu tio ns : 2 (d o tte d ), 4 (d o t-d a sh -d o t), 8 (d a sh e d ), and 12 M (heavy c o n tin u o u s ). The ligh t con tinuous cu rves g ive co rre sp o n d in g p lo ts fo r w ate r.
the half-width of the band becomes increasingly greater. For the 12 M solution the shape of the band bears little resemblence to that of the water band.
Consideration of Figures 3 and 4 reveals no anomalies with increasing concentration. All effects noted in Figures 1 and 2 appear to increase monotonicallv, although not necessarily linearly, with increasing concentration. Similar results have been obtained in concentration studies of other alkali halide solutions not shown in the figures.
B. T he 2500-350-em ~ 1 R egion . In the 2500-350-cm region in the spectrum of water occur the weak associa- tional band vA near 2 1 2 0 cm-1, the e2 fundamental of the H20 molecule near 1640 cm - 1 and the strong, broad band vi. attributed to the librational or hindered rotational motion of H20 molecules in the fields of their neighbors. The librational band in water at 27° is characterized by a maximum in k at 580 c m '1; the peak position of the iq, band is strongly influenced by temperature. Our present
The Journal of Physical Chemistry. Vol 78. No. 3. 1974
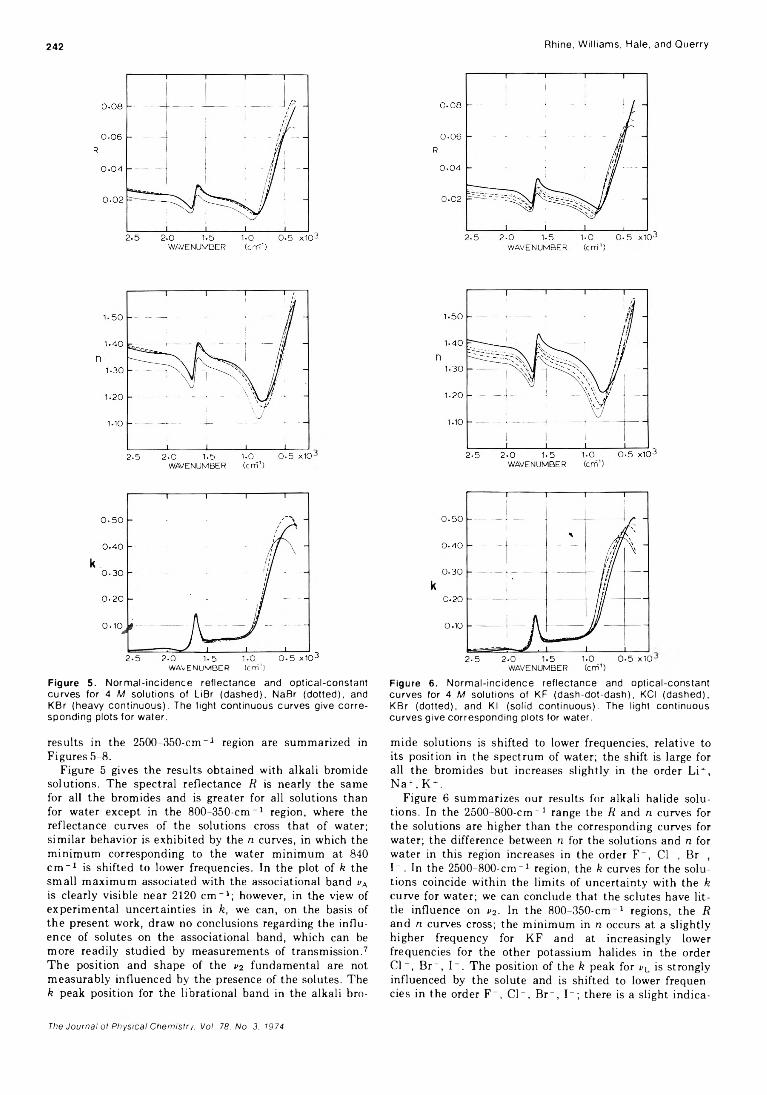
242 Rhine, Williams, Hale, and Querry
W A V E N U M B E R (cm ")
F ig u re 5. N o rm a l- in c id e n c e re fle c ta n ce and o p tica l-co n s ta n t cu rve s fo r 4 M so lu tio ns of L iB r (d ashed ), N aB r (d o tte d ), and K B r (heavy c o n tin u o u s ). The ligh t con tinuou s cu rves g ive c o r re spo nd ing p lo ts fo r w a te r.
results in the 2500-350-cm-1 region are summarized in Figures 5-8.
Figure 5 gives the results obtained with alkali bromide solutions. The spectral reflectance R is nearly the same for all the bromides and is greater for all solutions than for water except in the 800-350-cm-1 region, where the reflectance curves of the solutions cross that of water; similar behavior is exhibited by the n curves, in which the minimum corresponding to the water minimum at 840 cm - 1 is shifted to lower frequencies. In the plot of k the small maximum associated with the associational band vA is clearly visible near 2 1 2 0 cm-1 ; however, in the view of experimental uncertainties in k, we can, on the basis of the present work, draw no conclusions regarding the influence of solutes on the associational band, which can be more readily studied by measurements of transmission. 7
The position and shape of the V2 fundamental are not measurably influenced by the presence of the solutes. The k peak position for the librational band in the alkali bro-
F igu re 6. N o rm a l- in c id e n c e re fle c ta n ce and o p tic a l-c o n s ta n t cu rve s fo r 4 M so lu tio ns of KF (d a sh -d o t-d a sh ), KCI (d ashed ), K B r (d o tte d ), and Kl (so lid co n tin u o u s ). The ligh t co n tinuou s c u rve s g ive co rre sp o n d in g p lo ts for w ate r.
mide solutions is shifted to lower frequencies, relative to its position in the spectrum of water; the shift is large for all the bromides but increases slightly in the order Li+,Na+,K~.
Figure 6 summarizes our results for alkali halide solutions. In the 2500-800-cm - 1 range the R and n curves for the solutions are higher than the corresponding curves for water; the difference between n for the solutions and n for water in this region increases in the order F - , C l- , Br- , I - . In the 2500-800-cm-1 region, the k curves for the solutions coincide within the limits of uncertainty with the k curve for water; we can conclude that the solutes have little influence on V2 . In the 800-350-cm-1 regions, the R and n curves cross; the minimum in n occurs at a slightly higher frequency for KF and at increasingly lower frequencies for the other potassium halides in the order C l- , B r- , I- . The position of the k peak for iq is strongly influenced by the solute and is shifted to lower frequencies in the order F - , C l- , Br- , I- ; there is a slight indica
t e Jour/ia/of Pftysica/Cftem/sf/y. Vol. 78. No. 3, 1974
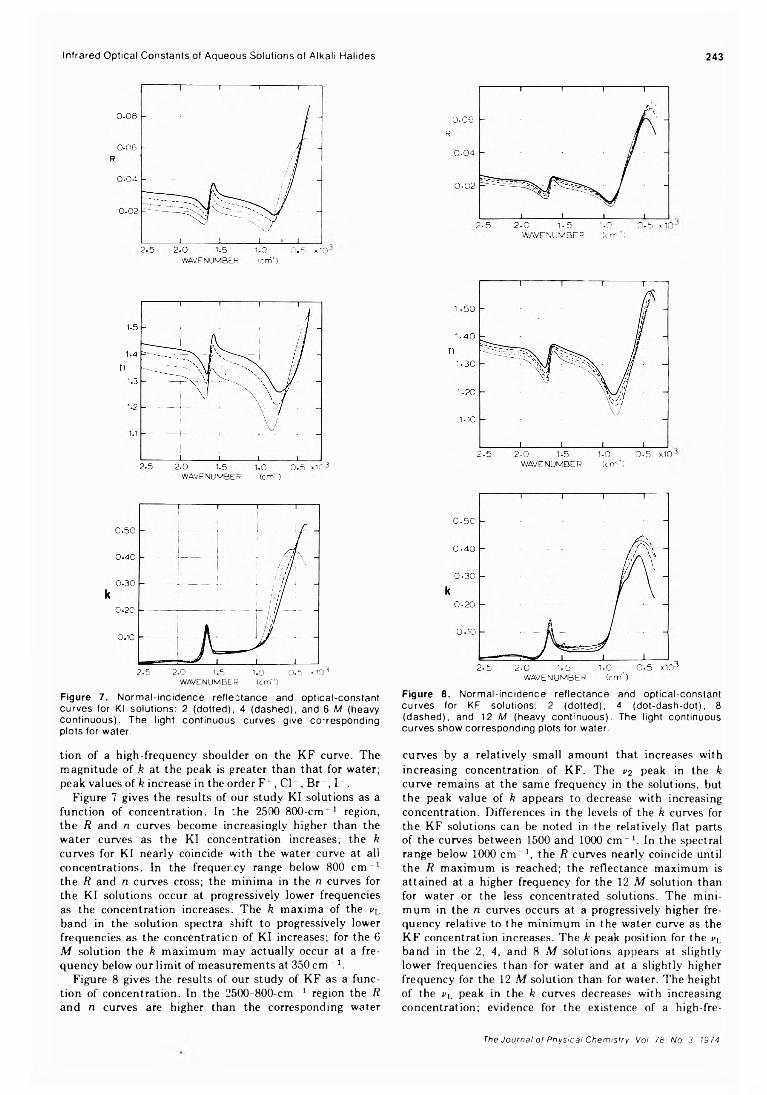
Infrared Optical Constants of Aqueous Solutions of Alkali Halides 243
2 .5 2 .0 1.5 1.0 0 .5 >U03W A V E N U M B E R ( c m '1)
Figure 7. N orm al-incidence reflectance and optical-constant curves for Kl solutions: 2 (dotted), 4 (dashed), and 6 M (heavy continuous). The light continuous curves give co-responding plots for water.
tion of a high-frequency shoulder on the KF curve. The magnitude of k at the peak is greater than that for water; peak values of k increase in the order F “ , Cl “ , Br ~, I_.
Figure 7 gives the results of our study KI solutions as a function of concentration. In :he 2500-800-cm 1 region, the R and n curves become increasingly higher than the water curves as the KI concentration increases; the k curves for KI nearly coincide with the water curve at all concentrations. In the frequency range below 800 cm “ 1
the R and n curves cross; the minima in the n curves for the KI solutions occur at progressively lower frequencies as the concentration increases. The k maxima of the vL band in the solution spectra shift to progressively lower frequencies as the concentration of KI increases; for the 6
M solution the k maximum may actually occur at a frequency below our limit of measurements at 350 cm“ 1.
Figure 8 gives the results of our study of KF as a function of concentration. In the 2500-800-cm“ 1 region the R and n curves are higher than the corresponding water
Figure 8. Norm al-Incidence reflectance and optical-constant curves for KF solutions: 2 (dotted), 4 (dot-dash-dot), 8 (dashed), and 12 M (heavy continuous). The light continuous curves show corresponding plots for water.
curves by a relatively small amount that increases with increasing concentration of KF. The 1/2 peak in the k curve remains at the same frequency in the solutions, but the peak value of k appears to decrease with increasing concentration. Differences in the levels of the k curves for the KF solutions can be noted in the relatively flat parts of the curves between 1500 and 1000 cm-1. In the spectral range below 1000 cm-1, the R curves nearly coincide until the R maximum is reached; the reflectance maximum is attained at a higher frequency for the 12 M solution than for water or the less concentrated solutions. The minimum in the n curves occurs at a progressively higher frequency relative to the minimum in the water curve as the KF concentration increases. The k peak position for the rL band in the 2, 4, and 8 M solutions appears at slightly lower frequencies than for water and at a slightly higher frequency for the 12 M solution than for water. The height of the jq, peak in the k curves decreases with increasing concentration; evidence for the existence of a high-fre-
The Journal of Physical Chemistry. Vol. 78. No. 3. 1974
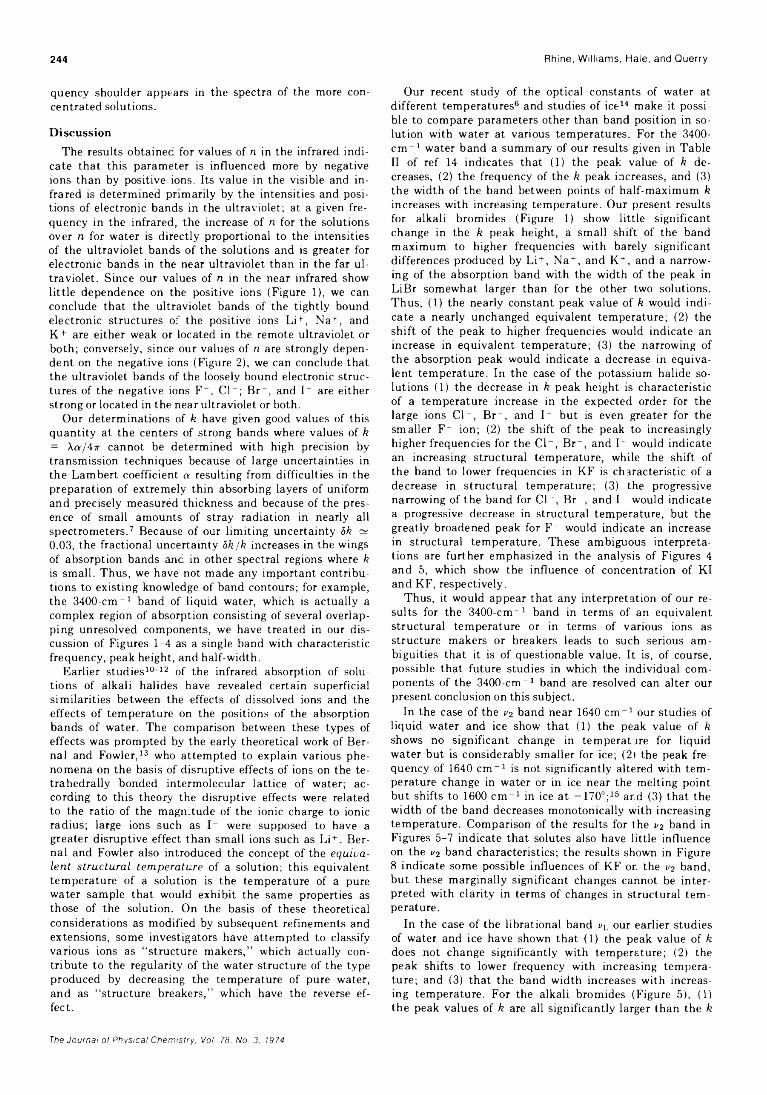
244 Rhine, Williams, Hale, and Querry
quency shoulder appears in the spectra of the more concentrated solutions.
DiscussionThe results obtained for values of n in the infrared indi
cate that this parameter is influenced more by negative ions than by positive ions. Its value in the visible and infrared is determined primarily by the intensities and positions of electronic bands in the ultraviolet; at a given frequency in the infrared, the increase of n for the solutions over n for water is directly proportional to the intensities of the ultraviolet bands of the solutions and is greater for electronic bands in the near ultraviolet than in the far ultraviolet. Since our values of n in the near infrared show little dependence on the positive ions (Figure 1), we can conclude that the ultraviolet bands of the tightly bound electronic structures of the positive ions Li + , Na+, and K + are either weak or located in the remote ultraviolet or both; conversely, since our values of n are strongly dependent on the negative ions (Figure 2), we can conclude that the ultraviolet bands of the loosely bound electronic structures of the negative ions F” , Cl” ; Br” , and I” are either strong or located in the near ultraviolet or both.
Our determinations of k have given good values of this quantity at the centers of strong bands where values of k = \a/4ir cannot be determined with high precision by transmission techniques because of large uncertainties in the Lambert coefficient a resulting from difficulties in the preparation of extremely thin absorbing layers of uniform and precisely measured thickness and because of the presence of small amounts of stray radiation in nearly all spectrometers.7 Because of our limiting uncertainty bk s 0.03, the fractional uncertainty bk/k increases in the wings of absorption bands and in other spectral regions where k is small. Thus, we have not made any important contributions to existing knowledge of band contours; for example, the 3400-cm” 1 band of liquid water, which is actually a complex region of absorption consisting of several overlapping unresolved components, we have treated in our discussion of Figures 1-4 as a single band with characteristic frequency, peak height, and half-width.
Earlier studies10 12 of the infrared absorption of solutions of alkali halides have revealed certain superficial similarities between the effects of dissolved ions and the effects of temperature on the positions of the absorption bands of water. The comparison between these types of effects was prompted by the early theoretical work of Bernal and Fowler,13 who attempted to explain various phenomena on the basis of disruptive effects of ions on the te- trahedrally bonded intermolecular lattice of water; according to this theory the disruptive effects were related to the ratio of the magnitude of the ionic charge to ionic radius; large ions such as I” were supposed to have a greater disruptive effect than small ions such as Li+. Bernal and Fowler also introduced the concept of the equivalent structural temperature of a solution; this equivalent temperature of a solution is the temperature of a pure water sample that would exhibit the same properties as those of the solution. On the basis of these theoretical considerations as modified by subsequent refinements and extensions, some investigators have attempted to classify various ions as “ structure makers,” which actually contribute to the regularity of the water structure of the type produced by decreasing the temperature of pure water, and as “ structure breakers,” which have the reverse effect.
Our recent study of the optical constants of water at different temperatures6 and studies of ice14 make it possible to compare parameters other than band position in solution with water at various temperatures. For the 3400- cm 1 water band a summary of our results given in Table II of ref 14 indicates that (1) the peak value of k decreases, (2) the frequency of the k peak increases, and (3) the width of the band between points of half-maximum k increases with increasing temperature. Our present results for alkali bromides (Figure 1) show little significant change in the k peak height, a small shift of the band maximum to higher frequencies with barely significant differences produced by Li+, Na+, and K+, and a narrowing of the absorption band with the width of the peak in LiBr somewhat larger than for the other two solutions. Thus, (1) the nearly constant peak value of k would indicate a nearly unchanged equivalent temperature; (2) the shift of the peak to higher frequencies would indicate an increase in equivalent temperature; (3) the narrowing of the absorption peak would indicate a decrease in equivalent temperature. In the case of the potassium halide solutions (1) the decrease in k peak height is characteristic of a temperature increase in the expected order for the large ions Cl” , Br” , and I ” but is even greater for the smaller F” ion; (2) the shift of the peak to increasingly higher frequencies for the Cl” , Br” , and I” would indicate an increasing structural temperature, while the shift of the band to lower frequencies in KF is characteristic of a decrease in structural temperature; (3) the progressive narrowing of the band for Cl” , Br” , and I” would indicate a progressive decrease in structural temperature, but the greatly broadened peak for F” would indicate an increase in structural temperature. These ambiguous interpretations are further emphasized in the analysis of Figures 4 and 5, which show the influence of concentration of KI and KF, respectively.
Thus, it would appear that any interpretation of our results for the 3400-cm” 1 band in terms of an equivalent structural temperature or in terms of various ions as structure makers or breakers leads to such serious ambiguities that it is of questionable value. It is, of course, possible that future studies in which the individual components of the 3400-cm-1 band are resolved can alter our present conclusion on this subject.
In the case of the v2 band near 1640 cm -1 our studies of liquid water and ice show that (1) the peak value of k shows no significant change in temperature for liquid water but is considerably smaller for ice; (2) the peak frequency of 1640 cm -1 is not significantly altered with temperature change in water or in ice near the melting point but shifts to 1600 cm -1 in ice at —170°;15 and (3) that the width of the band decreases monotonically with increasing temperature. Comparison of the results for the i/2 band in Figures 5-7 indicate that solutes also have little influence on the V2 band characteristics; the results shown in Figure 8 indicate some possible influences of KF or. the i/2 band, but these marginally significant changes cannot be interpreted with clarity in terms of changes in structural temperature.
In the case of the librational band vL our earlier studies of water and ice have shown that (1) the peak value of k does not change significantly with temperature; (2) the peak shifts to lower frequency with increasing temperature; and (3) that the band width increases with increasing temperature. For the alkali bromides (Figure 5), (1) the peak values of k are all significantly larger than the k
The Journal of Physical Chemistry, Voi. 78. No. 3. 1974
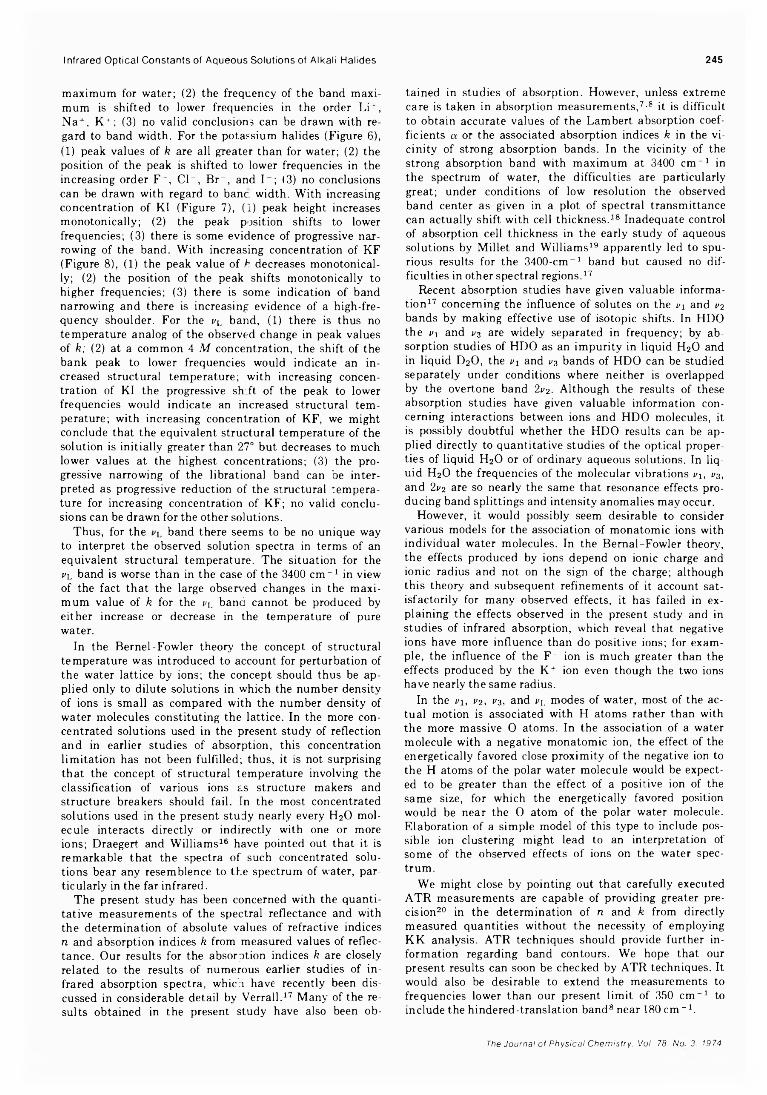
maximum for water; (2) the frequency of the band maximum is shifted to lower frequencies in the order Li+, Na+, K + ; (3) no valid conclusions can be drawn with regard to band width. For the potassium halides (Figure 6),(1) peak values of k are all greater than for water; (2) the position of the peak is shifted to lower frequencies in the increasing order F- , Cl- , Br- , and I - ; (3) no conclusions can be drawn with regard to banc width. With increasing concentration of KI (Figure 7), (1) peak height increases monotonically; (2) the peak position shifts to lower frequencies; (3) there is some evidence of progressive narrowing of the band. With increasing concentration of KF (Figure 8), (1) the peak value of k decreases monotonically; (2) the position of the peak shifts monotonically to higher frequencies; (3) there is some indication of band narrowing and there is increasing evidence of a high-frequency shoulder. For the vL band, (1) there is thus no temperature analog of the observed change in peak values of k; (2) at a common 4 M concentration, the shift of the bank peak to lower frequencies would indicate an increased structural temperature; with increasing concentration of KI the progressive shift of the peak to lower frequencies would indicate an increased structural temperature; with increasing concentration of KF, we might conclude that the equivalent structural temperature of the solution is initially greater than 27° but decreases to much lower values at the highest concentrations; (3) the progressive narrowing of the librational band can be interpreted as progressive reduction of the structural temperature for increasing concentration of KF; no valid conclusions can be drawn for the other solutions.
Thus, for the band there seems to be no unique way to interpret the observed solution spectra in terms of an equivalent structural temperature. The situation for the vL band is worse than in the case of the 3400 cm - 1 in view of the fact that the large observed changes in the maximum value of k for the rL band cannot be produced by either increase or decrease in the temperature of pure water.
In the Bernel -Fowler theory the concept of structural temperature was introduced to account for perturbation of the water lattice by ions; the concept should thus be applied only to dilute solutions in which the number density of ions is small as compared with the number density of water molecules constituting the lattice. In the more concentrated solutions used in the present study of reflection and in earlier studies of absorption, this concentration limitation has not been fulfilled; thus, it is not surprising that the concept of structural temperature involving the classification of various ions as structure makers and structure breakers should fail. In the most concentrated solutions used in the present study nearly every H2O molecule interacts directly or indirectly with one or more ions; Draegert and Williams16 have pointed out that it is remarkable that the spectra of such concentrated solutions bear any resemblence to the spectrum of water, particularly in the far infrared.
The present study has been concerned with the quantitative measurements of the spectral reflectance and with the determination of absolute values of refractive indices n and absorption indices k from measured values of reflectance. Our results for the absorption indices k are closely related to the results of numerous earlier studies of infrared absorption spectra, whicn have recently been discussed in considerable detail by Verrall.17 Many of the results obtained in the present study have also been ob
Infrared Optical Constants of Aqueous Solutions of Alkali Halides
tained in studies of absorption. However, unless extreme care is taken in absorption measurements,7-8 it is difficult to obtain accurate values of the Lambert absorption coefficients a or the associated absorption indices k in the vicinity of strong absorption bands. In the vicinity of the strong absorption band with maximum at 3400 cm-1 in the spectrum of water, the difficulties are particularly great; under conditions of low resolution the observed band center as given in a plot of spectral transmittance can actually shift with cell thickness.18 Inadequate control of absorption cell thickness in the early study of aqueous solutions by Millet and Williams19 apparently led to spurious results for the 3400-cm-1 band but caused no difficulties in other spectral regions.17
Recent absorption studies have given valuable information17 concerning the influence of solutes on the u 1 and i>2 bands by making effective use of isotopic shifts. In HDO the vi and v$ are widely separated in frequency; by absorption studies of HDO as an impurity in liquid H2O and in liquid D2O, the v\ and v3 bands of HDO can be studied separately under conditions where neither is overlapped by the overtone band 2v2. Although the results of these absorption studies have given valuable information concerning interactions between ions and HDO molecules, it is possibly doubtful whether the HDO results can be applied directly to quantitative studies of the optical properties of liquid H20 or of ordinary aqueous solutions. In liquid H2O the frequencies of the molecular vibrations v\, 1/3, and 2v2 are so nearly the same that resonance effects producing band splittings and intensity anomalies may occur.
However, it would possibly seem desirable to consider various models for the association of monatomic ions with individual water molecules. In the Bemal-Fowler theory, the effects produced by ions depend on ionic charge and ionic radius and not on the sign of the charge; although this theory and subsequent refinements of it account satisfactorily for many observed effects, it has failed in explaining the effects observed in the present study and in studies of infrared absorption, which reveal that negative ions have more influence than do positive ions; for example, the influence of the F- ion is much greater than the effects produced by the K + ion even though the two ions have nearly the same radius.
In the 1/1, V2 , V3, and vL modes of water, most of the actual motion is associated with H atoms rather than with the more massive O atoms. In the association of a water molecule with a negative monatomic ion, the effect of the energetically favored close proximity of the negative ion to the H atoms of the polar water molecule would be expected to be greater than the effect of a positive ion of the same size, for which the energetically favored position would be near the 0 atom of the polar water molecule. Elaboration of a simple model of this type to include possible ion clustering might lead to an interpretation of some of the observed effects of ions on the water spectrum.
We might close by pointing out that carefully executed ATR measurements are capable of providing greater precision20 in the determination of n and k from directly measured quantities without the necessity of employing KK analysis. ATR techniques should provide further information regarding band contours. We hope that our present results can soon be checked by ATR techniques. It would also be desirable to extend the measurements to frequencies lower than our present limit of 350 cm -1 to include the hindered-translation band8 near 180 cm -1 .
245
The Journal of Physical Chemistry. Voi. 78. No. 3. 1974
246 R. M. Chatterjee, W. A. Adams, and A. R. Davis
Acknowledgments. We wish to express our appreciation to the Office of Naval Research for support of the work at Kansas State University and to the National Science Foundation for support at the University of Missouri— Kansas City.
References and Notes( 1 ) W . M . I r v i n e a n d J. B. P o l l a c k . I c a ru s . 8, 3 2 4 ( 1 9 6 8 ) .( 2 ) L. P o n t l e r a n d C . D e c h a m b e n o y , A n n . G e o p h y s . , 21 , 4 6 2 ( 1 9 6 5 ) ;
22 , 6 3 3 ( 1 9 6 6 ) .( 3 ) M . R. Q u e r r y , B . C u r n u t t e , a n d D . W i l l i a m s , J . O p t. S o c . A m e r . . 5 9 ,
1 2 9 9 ( 1 9 6 9 ) .( 4 ) V . M. Z o l a t a r e v , B. A . M i k h a i l o v , L. I. A p e r o v l c h , a n d S . I. P o p o v ,
O p t. S p e c t r o s k . . 27, 7 9 3 ( 1 9 6 9 ) . [ T r a n s l a t i o n , O p t. S p e c t r o s c . . 27, 4 3 0 ( 1 9 6 9 ) ] .
( 5 ) A . N . R u s k , D . W i l l i a m s , a n d M . R. Q u e r r y , J. O p t. S o c . A m e r . . 6 1 , 8 9 5 ( 1 9 7 1 ) .
(6) G. M. Hale, M. R. Querry, A. N. Rusk, and D. Williams, J. O pt. S o c . A m e r.. 62, 1103 (1972).
(7) C. W. Robertson and D. Williams. J. O p t. S oc . A m e r.. 6 1 , 1316 (1971).
(8) C. W. Robertson, B. Curnutte, and D. Williams, M o l. P hys.. 26, 183 (1973).
(9) P. S. Ray, A p p i. O p t., 11, 1836 (1972).(10) D. Williams and W. Millett, P hys. R ev.. 66, 6 (1944).(11) G. R. Choppin and K. Buijs, J. C hem . P hys., 39, 2042 (1963).(12) H. Yamatera, B. Fitzpatrick, and G. Gordon, J. M o l. S p e c tro s c ., 4,
268 (1964).(13) J. D. Bernai and R. H. Fowler, J. C he m . P hys., 1. 515 (1933).(14) J .W . Schaaf and D. Williams, J. Opt. S oc . A m e r., 63, 726 (1973).(15) J. E. Bertie, J. J. Labbé, and E. Whalley, J. C hem . P hys.. 50, 4501
(1969).(16) D. A. Draegert and D. Williams, J. C hem . P hys.. 48, 401 (1968).(17) R. E. V erra it “ Water; A Comprehensive Treatise,” Vol. 3, F.
Franks, Ed.. Plenum Press, New York, N. Y., 1973, Chapter 5, pp 211-264.
(18) E. K. Plyler andC. J. Craven, J. C he m . P hys.. 2, 303 (1934).(19) D. Williams and W. Millet, P hys. R ev.. 66, 6 (1944).(20) B. L. Crawford, private communication.
A H ig h -P r e s s u r e L a s e r R a m a n S p e c t r o s c o p i c I n v e s t ig a t io n o f A q u e o u s M a g n e s iu m
S u lfa t e S o lu t io n s
R. M. Chatterjee,* W. A. Adams, and A. R. Davis
W a te r S c ie n c e S u b d iv is io n . I n la n d W a te rs D i r e c to r a te . D e p a r tm e n t o t th e E n v ir o n m e n t . O tta w a . O n ta r io . C a n a d a
( R e c e iv e d F e b r u a r y 2 1 . 1 9 7 3 : R e v is e d M a n u s c r ip t R e c e iv e d N o v e m b e r 12. 19731
P u b lic a t io n c o s ts a s s is te d b y E n v ir o n m e n t C a n a d a
The laser Raman spectra of aqueous MgS04 solutions have been recorded at pressures up to 1 kbar for temperatures between 7.0 and 25.0°. The results are used to calculate the volume changes of dissociation of MgS04° contact ion pairs (average AV = —20.3 ± 1.4 cm3 m o l 1 between 7.0 and 25.0°). The absence of temperature dependence of AV and the different values of AV obtained by other techniques are discussed in terms of a multistate ion pair equilibrium process.
Introduction
The study of interactions in aqueous electrolyte solutions1-2 and especially the effects of pressure on chemical equilibria3-6 has been the subject of several recent papers. This attention arises mainly from the investigations associated with natural waters.7-16 From the variation of the equilibrium constant with pressure it is possible to calculate the volume changes associated with the ionic processes. These volume changes are useful in the estimation of the concentration of different ionic species present at various depths in lake and sea water.17 Raman spectroscopy is especially applicable to mixed electrolytes such as sea water since a given electrolyte equilibrium can be studied in the presence of many other species but it is restricted to moderately concentrated solutions. To establish the actual concentrations of different species involved in an interaction between Mg2+ and SO42” ions in aqueous solution, Davis and Oliver18 of this laboratory used Raman spectroscopy and found a good agreement between the concentrations of contact ion paired MgS04° calculated from their Raman data and those calculated from ultrasonic results of Atkinson and Petrucci.2 The present
study was undertaken to extend the Raman work at atmospheric pressure18 up to 1 kbar. This represents the range of pressures found in the oceans of the world but the present study is limited to solute concentrations of 2 M. The variation in the Raman spectra of aqueous solutions with pressure can be used to calculate the change in the partial molal volume associated with an ionic equilibrium if the variation of the activity coefficient ratio with pressure is neglected. The true thermodynamic equilibrium constant cannot be calculated from the available Raman data. However, the concentration quotient calculated from the Raman intensities can be used in place of the equilibrium constant, Kp, in the following equation
/d In K d\ —RTV w ) r , " “ R T 0 (1)
where T and P are temperature and pressure, R is the gas constant, )3 is the isothermal compressibility of water, and AV is the volume change associated with an ionic equilibrium. The arguments for using the concentration quotient in eq 1 have been discussed by Adams and Davis.19 The term RT/3 requires concentrations to be given in moles per liter.
The Journal of Physical Chemistry. Voi. 78. No. 3. 1974
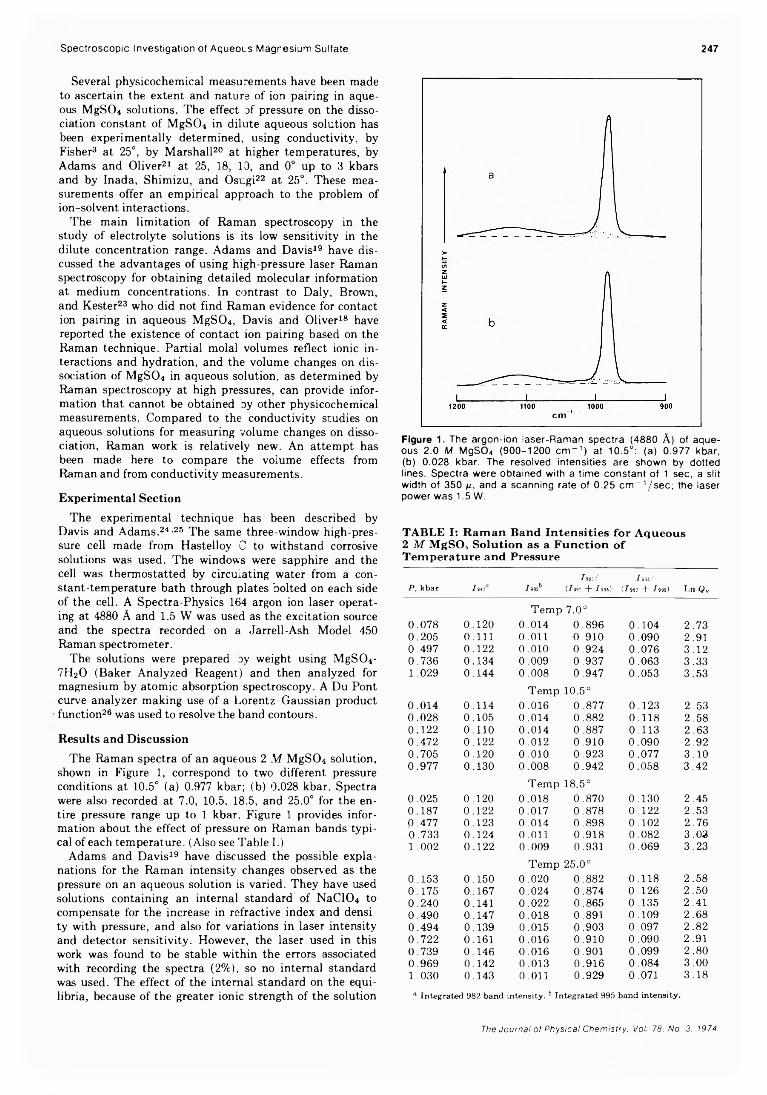
Several physicochemical measurements have been made to ascertain the extent and nature of ion pairing in aqueous M gS04 solutions. The effect of pressure on the dissociation constant of M gS04 in dilute aqueous solution has been experimentally determined, using conductivity, by Fisher3 at 25°, by Marshall20 at higher temperatures, by Adams and Oliver21 at 25, 18, 10, and 0° up to 3 kbars and by Inada, Shimizu, and Osugi22 at 25°. These measurements offer an empirical approach to the problem of ion-solvent interactions.
The main limitation of Raman spectroscopy in the study of electrolyte solutions is its low sensitivity in the dilute concentration range. Adams and Davis19 have discussed the advantages of using high-pressure laser Raman spectroscopy for obtaining detailed molecular information at medium concentrations. In contrast to Daly, Brown, and Kester23 who did not find Raman evidence for contact ion pairing in aqueous M gS04, Davis and Oliver18 have reported the existence of contact ion pairing based on the Raman technique. Partial molal volumes reflect ionic interactions and hydration, and the volume changes on dissociation of M gS04 in aqueous solution, as determined by Raman spectroscopy at high pressures, can provide information that cannot be obtained oy other physicochemical measurements. Compared to the conductivity studies on aqueous solutions for measuring volume changes on dissociation, Raman work is relatively new. An attempt has been made here to compare the volume effects from Raman and from conductivity measurements.
Experimental Section
The experimental technique has been described by Davis and Adams.24’25 The same three-window high-pressure cell made from Hastelloy C to withstand corrosive solutions was used. The windows were sapphire and the cell was thermostatted by circulating water from a constant-temperature bath through plates bolted on each side of the cell. A Spectra-Physics 164 argon ion laser operating at 4880 A and 1.5 W was used as the excitation source and the spectra recorded on a Jarrell-Ash Model 450 Raman spectrometer.
The solutions were prepared by weight using M gS04- 7H2O (Baker Analyzed Reagent) and then analyzed for magnesium by atomic absorption spectroscopy. A Du Pont curve analyzer making use of a Lorentz-Gaussian product function26 was used to resolve the band contours.
Results and Discussion
The Raman spectra of an aqueous 2 M M gS04 solution, shown in Figure 1, correspond to two different pressure conditions at 10.5° (a) 0.977 kbar; (b) 0.028 kbar. Spectra were also recorded at 7.0, 10.5, 18.5, and 25.0° for the entire pressure range up to 1 kbar. Figure 1 provides information about the effect of pressure on Raman bands typical of each temperature. (Also see Table I.)
Adams and Davis19 have discussed the possible explanations for the Raman intensity changes observed as the pressure on an aqueous solution is varied. They have used solutions containing an internal standard of NaC104 to compensate for the increase in refractive index and density with pressure, and also for variations in laser intensity and detector sensitivity. However, the laser used in this work was found to be stable within the errors associated with recording the spectra (2%), so no internal standard was used. The effect of the internal standard on the equilibria, because of the greater ionic strength of the solution
Spectroscopic Investigation of Aqueous Magresium Sulfate 247
to
c m
Figure 1. The a rg on -ion lase r-R am an sp e c tra (4880 A ) o f aq ue ous 2 .0 M M g S 0 4 (9 0 0 -1 2 0 0 c m “ 1) a t 10 .5°: (a) 0 .977 kbar, (b) 0 .028 kbar. The reso lved in te n s itie s a re show n by do tted lines. S pe c tra w e re ob ta ined w ith a tim e co n s ta n t o f 1 sec, a s lit w id th o f 350 n , and a scann ing ra te o f 0 .25 c m _ 1 /s e c ; the laser po w e r w as 1.5 W.
TABLE I: Raman Band Intensities for Aqueous 2 M MgS04 Solution as a Function of Temperature and Pressure
Imi/ 1995/P, kbar Im ° Is n b (1982 + 199$) (/9S2 + / 995) Ln Qv
0.078 0.120Temp 7.0°
0.014 0.896 0.104 2 . 7 3
0.205 0.111 0.011 0.910 0.090 2.910.497 0.122 0.010 0.924 0.076 3.120.736 0.134 0.009 0.937 0.063 3.331.029 0.144 0.008 0.947 0.053 3.53
0.014 0.114Temp
0.01610.5°
0.877 0.123 2.530.028 0.105 0.014 0.882 0.118 2.580.122 0.110 0.014 0.887 0.113 2.630.472 0.122 0.012 0.910 0.090 2.920.705 0.120 0.010 0.923 0.077 3.100.977 0.130 0.008 0.942 0.058 3.42
0.025 0.120Temp
0.01818.5°
0.870 0.130 2.450.187 0.122 0.017 0.878 0.122 2.530.477 0.123 0.014 0.898 0.102 2.760.733 0.124 0.011 0.918 0.082 3.031.002 0.122 0.009 0.931 0.069 3.23
0.153 0.150Temp
0.02025.0°
0.882 0.118 2.580.175 0.167 0.024 0.874 0.126 2.500.240 0.141 0.022 0.865 0.135 2.410.490 0.147 0.018 0.891 0.109 2.680.494 0.139 0.015 0.903 0.097 2.820.722 0.161 0.016 0.910 0.090 2.910.739 0.146 0.016 0.901 0.099 2.800.969 0.142 0.013 0.916 0.084 3 .0 01.030 0.143 0.011 0.929 0.071 3.18
a Integrated 982 ban d intensity. b In tegrated 995 ban d intensity.
The Journal of Physical Chemistry. Vol. 78. No. 3. 1974
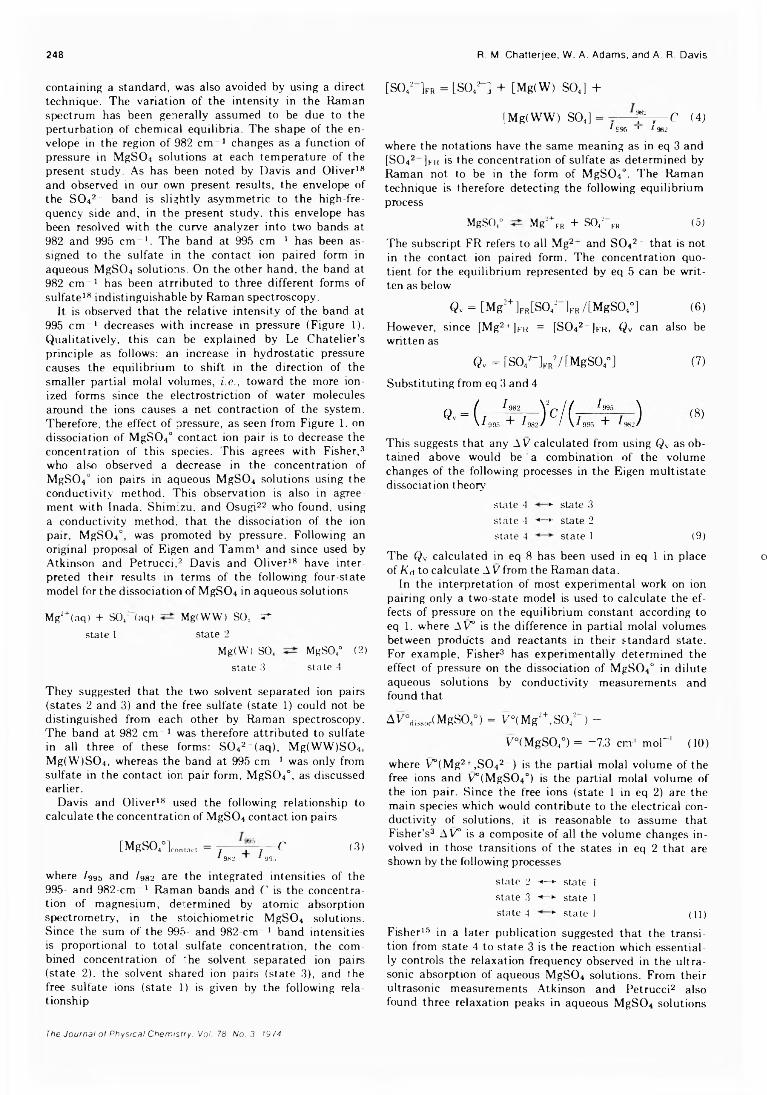
248 R. M. Chatterjee, W. A. Adams, and A. R. Davis
containing a standard, was also avoided by using a direct technique. The variation of the intensity in the Raman spectrum has been generally assumed to be due to the perturbation of chemical equilibria. The shape of the envelope in the region of 982 cm 1 changes as a function of pressure in M gS04 solutions at each temperature of the present study. As has been noted by Davis and Oliver18 and observed in our own present results, the envelope of the S 0 42~ band is slightly asymmetric to the high-frequency side and, in the present study, this envelope has been resolved with the curve analyzer into two bands at 982 and 995 cm 1. The band at 995 cm 1 has been assigned to the sulfate in the contact ion paired form in aqueous MgS04 solutions. On the other hand, the band at 982 cm 1 has been atrributed to three different forms of sulfate18 indistinguishable by Raman spectroscopy.
It is observed that the relative intensity of the band at 995 cm 1 decreases with increase in pressure (Figure 1). Qualitatively, this can be explained by Le Chatelier’s principle as follows: an increase in hydrostatic pressure causes the equilibrium to shift in the direction of the smaller partial molal volumes, i.e., toward the more ionized forms since the électrostriction of water molecules around the ions causes a net contraction of the system. Therefore, the effect of pressure, as seen from Figure 1, on dissociation of M gS04° contact ion pair is to decrease the concentration of this species. This agrees with Fisher,3 who also observed a decrease in the concentration of MgS04° ion pairs in aqueous M gS04 solutions using the conductivity method. This observation is also in agreement with Inada, Shimizu, and Osugi22 who found, using a conductivity method, that the dissociation of the ion pair, M gS04°, was promoted by pressure. Following an original proposal of Eigen and Tamm1 and since used by Atkinson and Pétrucci,2 Davis and Oliver18 have interpreted their results in terms of the following four-state model for the dissociation of MgS04 in aqueous solut ions
Mg2+(aq) + SO/ (aq) Mg(WW) SO, 5 state 1 state 2
Mg(W) SO, MgSO,° (2)state 3 state 4
They suggested that the two solvent separated ion pairs (states 2 and 3) and the free sulfate (state 1) could not be distinguished from each other by Raman spectroscopy. The band at 982 cm-1 was therefore attributed to sulfate in all three of these forms: S 0 42_(aq), Mg(WW)S04, M g(W )S04, whereas the band at 995 cm 1 was only from sulfate in the contact ion pair form, MgS()4°, as discussed earlier.
Davis and Oliver18 used the following relationship to calculate the concentration of M gS04 contact ion pairs
[MgS04°]cnnIact = j — ~4 T~j C (3)*■ 982 ' * 99f>
where /995 and /982 are the integrated intensities of the 995- and 982-cm 1 Raman bands and C is the concentration of magnesium, determined by atomic absorption spectrometry, in the stoichiometric M gS04 solutions. Since the sum of the 995- and 982-cm 1 band intensities is proportional to total sulfate concentration, the combined concentration of the solvent separated ion pairs (state 2). the solvent shared ion pairs (state 3), and the free sulfate ions (state 1) is given by the following relationship
[S O /-]FR = [SO,2- ] + [Mg<W) S04] +
LMg(WW) S04] = T r C (4)f s 9 5 ' 1 982
where the notations have the same meaning as in eq 3 and [S042 ]kk is the concentration of sulfate as determined by Raman not to be in the form of M gS04°. The Raman technique is therefore detecting the following equilibriumprocess
MgSO,° Mg2+FR + SO/-FR (5)
The subscript FR refers to all Mg2+ and S 042~ that is not in the contact ion paired form. The concentration quotient for the equilibrium represented by eq 5 can be written as below
Q: = [Mg2+]FR[S042- ] FR/[MgS0,°] (6)Flowever, since [Mg21 ]m = [S042~]Fr, Qv can also be written as
Qv = [S 0 42- ] FR2/[M gS04°] (7)Substituting from eq 3 and 4
This suggests that any A V calculated from using Qv as obtained above would be a combination of the volume changes of the following processes in the Eigen multistate dissociation theory'
state 4 ► state 3state 4 ■*—*- state 2state 4 state 1 (9)
The Qv calculated in eq 8 has been used in eq 1 in placeof Ka to calculate A V from the Raman data.
In the interpretation of most experimental work on ion pairing only a two-state model is used to calculate the effects of pressure on the equilibrium constant according to eq 1, where AV° is the difference in partial molal volumes between products and reactants in their standard state. For example, Fisher3 has experimentally determined the effect of pressure on the dissociation of MgS04° in dilute aqueous solutions by conductivity measurements and found that
AV°dissoc(MgS04°) = y°(M g2+,s o 42- ) -
F°(MgS04°) = -7.3 cm:1 m oF1 (10)
where V°(Mg2 + ,S 042 ) is the partial molal volume of the free ions and V°(MgS04°) is the partial molal volume of the ion pair. Since the free ions (state 1 in eq 2) are the main species which would contribute to the electrical conductivity of solutions, it is reasonable to assume that Fisher’s3 AV° is a composite of all the volume changes involved in those transitions of the states in eq 2 that are shown by the following processes
state 2 •«—»- state 1 state 3 ■*-*■ state 1state 4 1- state 1 (l l)
Fisher15 in a later publication suggested that the transition from state 4 to state 3 is the reaction which essentially controls the relaxation frequency observed in the ultrasonic absorption of aqueous MgS04 solutions. From their ultrasonic measurements Atkinson and Petrucci2 also found three relaxation peaks in aqueous MgS04 solutions
The Journal of Physical Chemistry. Vol. 78. No. 3. 1974
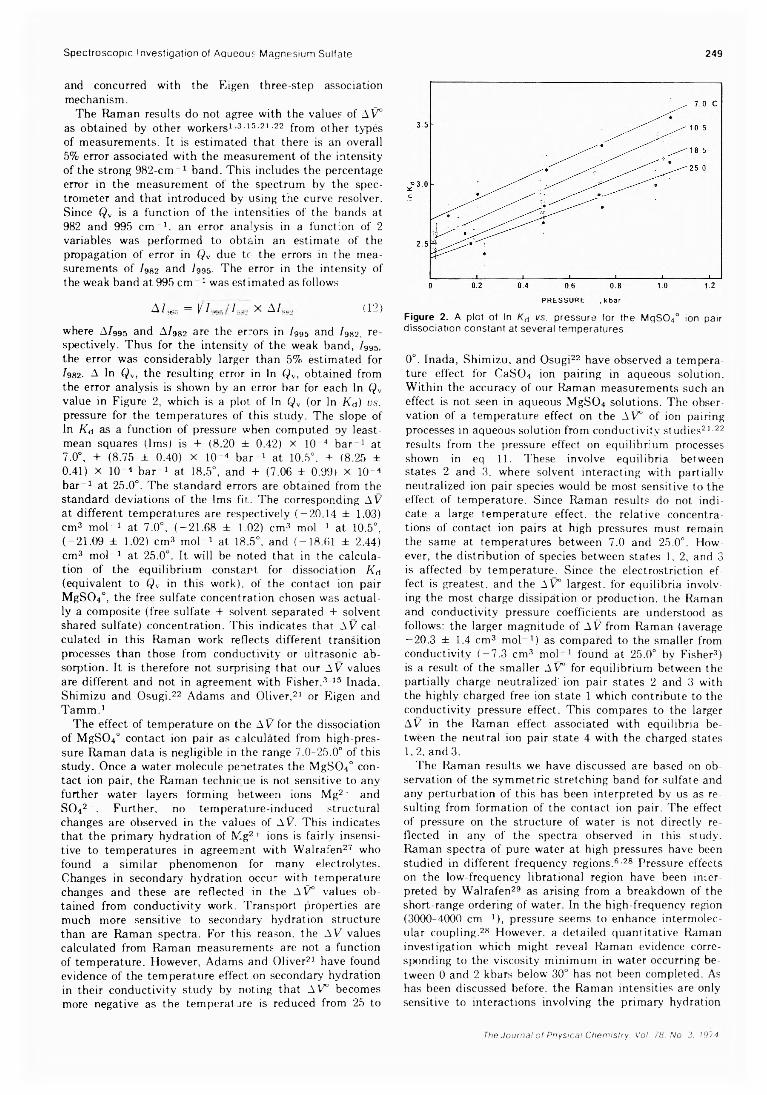
and concurred with the Eigen three-step association mechanism.
The Raman results do not agree with the values of AV° as obtained by other workers1 3-15-21-22 from other typés of measurements. It is estimated that there is an overall 5% error associated with the measurement of the intensity of the strong 982-cm“ 1 band. This includes the percentage error in the measurement of the spectrum by the spectrometer and that introduced by using the curve resolver. Since Qv is a function of the intensities of the bands at 982 and 995 cm “ 1, an error analysis in a function of 2 variables was performed to obtain an estimate of the propagation of error in Qv due tc the errors in the measurements of Igg2 and 7995. The error in the intensity of the weak band at 995 cm 1 was estimated as follows
A /„,. ^ M .. . '/... X A /.„ (12)
where A/995 and A/982 are the errors in / 995 and Ig82, respectively. Thus for the intensity of the weak band, Igg5, the error was considerably larger than 5% estimated for Ig82. A In Qv, the resulting error in In Qv, obtained from the error analysis is shown by an error bar for each In Qv value in Figure 2, which is a plot of In Qv (or In Ka) vs. pressure for the temperatures of this study. The slope of In Ka as a function of pressure when computed by least- mean squares (1ms) is + (8.20 ± 0.42) X 10 4 bar 1 at 7.0°, + (8.75 ± 0.40) x 10 4 bar 1 at 10.5°, + (8.25 ± 0.41) x lO“ 4 bar“ 1 at 18.5°, and + (7.06 ± 0.99) x IO- 4 bar 1 at 25.0°. The standard errors are obtained from the standard deviations of the 1ms fit. The corresponding AV at different temperatures are respectively (-20.14 ± 1.03) cm3 mol- 1 at 7.0°, (-21.68 ± 1.02) cm3 mol 1 at 10.5°, (-21.09 ± 1.02) cm3 m o b 1 at 18.5°, and (-18.61 ± 2.44) cm3 m oE1 at 25.0°. It will be noted that in the calculation of the equilibrium constant for dissociation Ka (equivalent to Qv in this work), of the contact ion pair MgS04°, the free sulfate concentration chosen was actually a composite (free sulfate + solvent separated + solvent shared sulfate) concentration. This indicates that AV calculated in this Raman work reflects different transition processes than those from conductivity or ultrasonic absorption. It is therefore not surprising that our AV values are different and not in agreement with Fisher,3 ls Inada, Shimizu and Osugi,22 Adams and Oliver,21 or Eigen and Tamm.1
The effect of temperature on the AV for the dissociation of MgSOV contact ion pair as calculated from high-pressure Raman data is negligible in the range 7.0-25.0° of this study. Once a water molecule penetrates the MgSOV contact ion pair, the Raman technic ue is not sensitive to any further water layers forming between ions Mg2+ and SO42- . Further, no temperature-induced structural changes are observed in the values of AV. This indicates that the primary hydration of Mg2 1 ions is fairly insensitive to temperatures in agreement with Walrafen27 who found a similar phenomenon for many electrolytes. Changes in secondary hydration occur with temperature changes and these are reflected in the AV° values obtained from conductivity work. Transport properties are much more sensitive to secondary hydration structure than are Raman spectra. For this reason, the AV values calculated from Raman measurements are not a function of temperature. However, Adams and Oliver21 have found evidence of the temperature effect on secondary hydration in their conductivity study by noting that AV” becomes more negative as the temperature is reduced from 25 to
Spectroscopic Investigation of Aqueous Magnesium Sulfate 249
Figure 2. A plot of In Kd vs. pressure for the MgSCV ion pair dissociation constant at several temperatures.
0°. Inada, Shimizu, and Osugi22 have observed a temperature effect for CaS04 ion pairing in aqueous solution. Within the accuracy of our Raman measurements such an effect is not seen in aqueous MgS04 solutions. The observation of a temperature effect on the AV° of ion pairing processes in aqueous solution from conductivity studies21-22 results from the pressure effect on equilibrium processes shown in eq 11. These involve equilibria between states 2 and 3, where solvent interacting with partially neutralized ion pair species would be most sensitive to the effect of temperature. Since Raman results do not indicate a large temperature effect, the relative concentrations of contact ion pairs at high pressures must remain the same at temperatures between 7.0 and 25.0°. However, the distribution of species between states 1, 2, and 3 is affected by temperature. Since the électrostriction effect is greatest, and the AV° largest, for equilibria involving the most charge dissipation or production, the Raman and conductivity pressure coefficients are understood as follows: the larger magnitude of AV from Raman (average — 20.3 ± 1.4 cm3 m o l 1) as compared to the smaller from conductivity (-7 .3 cm3 mol 1 found at 25.0° by Fisher3) is a result of the smaller AV° for equilibrium between the partially charge neutralized' ion pair states 2 and 3 with the highly charged free ion state 1 which contribute to the conductivity pressure effect. This compares to the larger AV in the Raman effect associated with equilibria between the neutral ion pair state 4 with the charged states 1, 2, and 3.
The Raman results we have discussed are based on observation of the symmetric stretching band for sulfate and any perturbation of this has been interpreted by us as resulting from formation of the contact ion pair. The effect of pressure on the structure of water is not directly reflected in anv of the spectra observed in this study. Raman spectra of pure water at high pressures have been studied in different frequency regions.6-28 Pressure effects on the low-frequency librational region have been interpreted by Walrafen29 as arising from a breakdown of the short-range ordering of water. In the high-frequency region (3000-4000 cm x), pressure seems to enhance intermolec- ular coupling.28 However, a detailed quantitative Raman investigation which might reveal Raman evidence corresponding to the viscosity minimum in water occurring between 0 and 2 kbars below 30° has not been completed. As has been discussed before, the Raman intensities are only sensitive to interactions involving the primary hydration
The Journal of Physical Chemistry. Vol. 78. No. 3. 19/4
250 J. J. Feher. L. D. Wright, anc D. B. McCormick
of the contact ion pair and therefore the effect of pressure on the structure of water, as related to solvent separated ion pairs has no effect on the interpretation of our AT results. The -20.3 ± 1.4 cm3 mol 1 value is consistent with the AV estimates from the partial molal ionic volumes in more concentrated MgSC>4 solutions as estimated by Mill- ero and Masterton.30 The concentration effect on the AV as determined by Raman spectroscopy is presently being studied in our laboratory using various concentrations of bisulfate solutions.
The enthalpy change at ambient pressure was calculated from the values of In Kp extrapolated to zero pressure using the 1ms equations fitted at each of the temperatures. These intercepts are (2.70 ± 0.03) at 7.0°, (2.52 ± 0.02) at 10.5°, (2.40 ± 0.03) at 18.5°, and (2.37 ± 0.07) at 25.0°. The equation which was used for the enthalpy change is given below
A value of -2 .9 ± 1.0 kcal mol' 1 was obtained by 1ms which compares with -4.84 kcal mol 1 by Helgeson,31 and —4.01 kcal mol-1 by Marshall.20 In view of the precision of the data the agreement is satisfactory.
Acknowledgments. The authors would like to express their thanks to Ms. M. -J. McGuire for competent technical help.
References and Notes(1) M. Eigen and K. Tamm. Z. Eiektrochem.. 66, 107 (1962).(2) G. Atkinson and S. Pétrucci. J. Phys. Chem.. 70 , 3122 (1966).(3) F. H. Fisher. J. Phys. Chem.. 66, 1607 (1962).(4) F. FI. Fisher, J. Acousl. Soc. Amer.. 38,805 (1965).(5) F. FI. Fisher and D. F. Davis. J. Phys. Chem.. 71 , 819 (1967).(6) W. A. Adams and A. R. Davis, Proceedings of the Electrochemical
Society. Miami Beach, Fla., Oct 1972, Symposium on Marine Electrochemistry, p 53.
(7) R. M. Garrels and M. E. Thompson, Amer. J. Sei., 2 6 0 , 57 (1962).(8) F. H. Fisher, Science. 1 5 7 , 823 (1967).(9) D. R. Kester and R. M. Pytkowicz, Limnol. Ocearogr.. 13, 670
(1968) .(10) D. R. Kester and R. M. Pytkowicz, Limnol. Ocearogr.. 1 4 , 686
(1969) .(11) F. J. Millero. Limnol. Oceanogr.. 14 . 376 (1969).(12) D. R. Kester and R. M. Pytkowicz. Geochim. Cosmochim. Acta, 34,
1039 (1970).(13) F. J. Millero. Chem. Rev., 71, 147 (1971).(14) F. J. Millero. Geochim. Cosmochim. Acta. 35, 1039 (1971).(15) F. H. Fisher. Geochim. Cosmochim. Acta. 36, 99 (1972).(16) R. M. Pytkowicz. Geochim. Cosmochim. Acta. 36. 631 (1972).(17) J. L. Kavanau, "W ater and Solute-Water Interactions." Flolden-Day,
San Francisco, Calif., 1964.(18) A. R. Davis and B. G. Oliver. J. Phys. Chem., 77, 1315 (1973).(19) W. A. Adams and A. R. Davis, J. Solution Chem., in press.(20) W. L. Marshall, J. Phys. Chem., 71,3584 (1967).(21) W. A. Adamsand B. G. Oliver, J. Phys. Chem., in press.(22) E. Inada. K. Shimizu, and J. Osugi. Nippon Kagaku Zasshi, 92
(12), 1096 (1971).(23) F. P. Daly. C. W. Brown, and D. R. Kester, J. Phys. Chem.. 76,
3664 (1972).(24) A. R. Davis and W. A. Adams, Spectrochim Acta, Part A, 2 7 , 2401
(1971).(25) A. R. Davis, and W. A. Adams, J. Chem. Phys.. in oress.(26) D. E. Irish and A. R. Davis. Can. J. Chem.. 4 6 , 942 (1968).(27) G. E. Walraten, J. Chem. Phys.. 44 , 1546 (1966).(28) G. E. W alrafen.J. Chem. Phys., 55,768 (1971).(29) G. E. Walrafen in “ Flydrogen-Bonded Solvent Systems." A. K.
Covington and P. Jones. Ed., Taylor and Francis, London. 1968.(30) F. J. Millero and W. L. Masterton. private communication, 1973.(31) H. C. Helgeson, J. Phys. Chem., 71, 3121 (1967).
S t u d ie s o f t h e S e l f - A s s o c i a t i o n a n d S o l v e n t - A s s o c i a t i o n o f C h o le s t e r o l a n d O th e r 3 /3 -H y d r o x y s t e r o id s in N o n p o la r M e d i a 1
Joseph J. Feher,2 Lemuel D. Wright,3 and Donald B. McCorm ick*
Graduate School ot Nutrition and Section of Biochemistry. Molecular and Cell Biology. Cornell University, Ithaca, New York 14850 {Received May 29. 1973)Publication costs assisted by the National Institutes ot Health
The concentration and temperature dependence of the hydroxyl proton chemical shift of cholesterol in C D C I 3 are interpreted in terms of equilibria among three species: cholesterol monomer, cholesterol dimer, and cholesterol monomer associated with solvent. Equations are derived, which allow the determination of equilibrium constants and, therefore, thermodynamic properties of various species. These equations require the chemical shift extrapolated to zero concentration and the limiting slope, both obtained at various temperatures, as experimentally determined parameters. The enthalpy change upon solvent complexation of the monomer is -0 .9 keal/mol and the enthalpy change of dimerization is -2 .6 kcal/mol. Equal slopes in the plot of chemical shift us. concentration are shown to indicate equal equilibrium constants.
IntroductionThe hydrogen bonding of monohvdric alcohols4 9 and
water10 in nonpolar solvents has received considerable attention in recent years. Since the self-association of cho
lesterol and other 3(3-sterols in nonpolar media is expected to occur via hydrogen-bond formation, the determination of the nature (size, cyclic or acyclic) and thermodynamic properties of the various self-associated species is of im
The Journal ot Physical Chemistry. Voi. 78. No. 3. 1974
Studies ot the Self-Association and Solvent-Association o- Cholesterol 251
portance to the general theory of the self-association of hydroxylic compounds. In addition, the self-association may be involved in the pathogenesis of certain conditions, such as atherosclerosis and cholelithiasis. Previous work using infrared spectroscopy has resulted in the value of — 1.8 kcal/mol for the enthalpy of dimerization of cholesterol in carbon tetrachloride and an estimated value of -3 .6 kcal/mol for enthalpy of association of larger aggregates of undetermined size.11 The value of —1.8 kcal/mol for the enthalpy of dimerization was obtained by assuming the dimer is acyclic. The more recent determination of - 1.8 kcal/mol for the enthalpy cnange of dimerization of water in chloroform solution10 is surprising when compared to theoretical calculations12-13 and the thermodynamic data for cholesterol.11 Further, the determination of the enthalpy change of dimerization of water in chloroform did not account for the association of water with the solvent, even though such complexation was mentioned. It is of interest, therefore, to determine the thermodynamic properties of cholesterol self-association and cholesterol association with chloroform.
In the present study, infrared and proton magnetic resonance spectroscopy were used to investigate the hydrogen bonding of 3/3-sterols in nonpolar solvents. Both of these techniques have a history of application to hydrogen- bonded systems, and assessments of their use in this regard are available.14-15 Data from pmr spectroscopy form the bulk of the information presented here, since temperature variation was performed in conjunction with pmr only. The infrared spectra are used as a source of qualitative information to supplement the pmr results.
Experimental SectionMaterials. Cholesterol was purchased from Sigma
Chemical Co. and was purified via the dibromide according to Fieser.16 Lanosterol [8,24i5a)-cholestadien-4,4,14a- trimethyl-3/3-ol] was obtained from Steraloids, Inc., and was recrystallized twice from anhydrous methanol. Stig- masterol [24/3-ethyl-5,22-cholestadien-3/3-ol] was purchased from Aldrich Chemical Co. anc was recrystallized from hot ethanol. Purified cholesterol, lanosterol, and stigmasterol were dried in vacuo over P2O5 for 3 hr at 90°. Absence of solvent impurities was confirmed by pmr spectroscopy. Cholestanol was purchased from Matheson Coleman and Bell and was used without further purification. Pregnenolone [5-pregnen-3/3-ol-20-one], 5a-pregnan-3/3-ol- 20-one, and 5«-pregnan-3/3-ol were obtained from Steraloids, Inc., and also were used without further purification. Spectrograde CC14, CHC13, and CH2C12 were purchased from Matheson Coleman and Bell and were dried immediately prior to use by distillation from P20 5. CDCI3, with 1% TMS, CH3OD, and 20% DC1 in D20 were purchased from Diaprep, Inc. The CDCI3 was stored at 5°, kept tightly sealed, and shielded from light, but was used without further precaution.
The hydroxyl proton resonance signal was identified by the temperature and concentration dependence of its chemical shift and also by the removal of the resonance signal from the spectra by deuterium exchange and acetylation. Acetylation was accomplished by treating 1 g of sterol with 5 ml of acetic anhydride (freshly prepared by distillation from P20 5) and 4 ml of anhydrous pyridine (obtained by vacuum distillation from KOH) and heating the mixture to 100-110° for 2 hr. The acetate derivative was precipitated by the addition of 60 ml of deionized water, collected, and recrystallized twice from hot 4:1 ace
tone:methanol. The acetylated sterols were dried in vacuo over P2C>5 for 3 hr at 90°. Deuterium exchange was achieved by refluxing 400 mg of dried sterol with 3 ml of CDCI3 and 1 ml of CH3OD for 2 hr and then distilling off the solvents. The deuterated sterols were dried as usual.
Methods. All the pmr spectra were recorded with a Var- ian A60A nmr spectrometer equipped with a variable temperature control, Model V-4343. Sample temperature was determined by obtaining the pmr spectrum of neat methanol before and after recording the sample pmr spectrum and converting the separation of the two resonance signals of methanol to the absolute temperature by using standard curves. Temperatures determined in this way did not vary more than ± 1° for different samples at the same variable temperature control setting. Sample solutions and methanol were allowed to equilibrate 10-15 min prior to the recording of their pmr spectra. Chemical shifts were measured with respect to tetramethylsilane (TMS) as an internal reference by interpolation on precalibrated paper. The estimated accuracy of reported chemical shifts is ±0.2 Hz.
Infrared spectra were obtained with a Perkin-Elmer Model 337 spectrophotometer using 0.5-mm liquid absorption cells. The ir spectrum of polystyrene was used as a frequency scale calibration.
Samples for ir and pmr spectroscopy were prepared by accurately weighing various amounts of the designated compound to 1-, 2-, 4-, or 5-ml volumetric flasks and then dissolving the compound to volume by the addition of the appropriate dried solvent. Solutions for pmr spectroscopy were transferred to 5-mm nmr tubes, which were then sealed. Solutions for ir spectroscopy were kept tightly stoppered and sealed until transfer to the liquid absorption cells. Spectra were obtained using freshly prepared solutions in all cases.
Results and DiscussionThe 3-/i region of the ir spectra of solutions of cholester
ol, cholestanol, and lanosterol in CCI4 is shown in Figure 1. It is in this region that the fundamental hydroxyl stretching frequencies occur. The general spectral characteristics observed for solutions of various concentrations of cholesterol in CCI4 agree well with those of previous work with cholesterol11 and with other monohydric alcohols, such as terf-butyl alcohol.17 The absorption maxima at 3610, 3465, and 3330 cm -1 are assigned to the monomer, dimer, and “ polymer” species, respectively. It is evident from Figure 1 that the ir spectra of cholestanol are virtually indistinguishable from those of cholesterol. The conclusion, which may be made from this observation, is that the A5 function of cholesterol influences neither the position of the absorption maxima nor the distribution of solute among the various self-associated species; that is, it does not affect the equilibrium constants. The ir spectra of lanosterol clearly show a marked reduction in the formation of the larger self-associated species. It is not possible to say that self-association of lanosterol is limited to dimers, since the shoulder on the low-frequency side of the dimer absorption may be due to the formation of small amounts of higher-order complexes. It seems clear, however, that the 4,4-geminal dimethyl of lanosterol steri- cally hinders self-association, but the hindrance may not be so large as to preclude higher aggregate formation altogether.
The ir spectra of solutions of cholesterol, cholestanol, lanosterol, and pregnenolone are shown in Figure 2. In
The Journal of Physical Chemistry. Vol. 78. No. 3. 1974
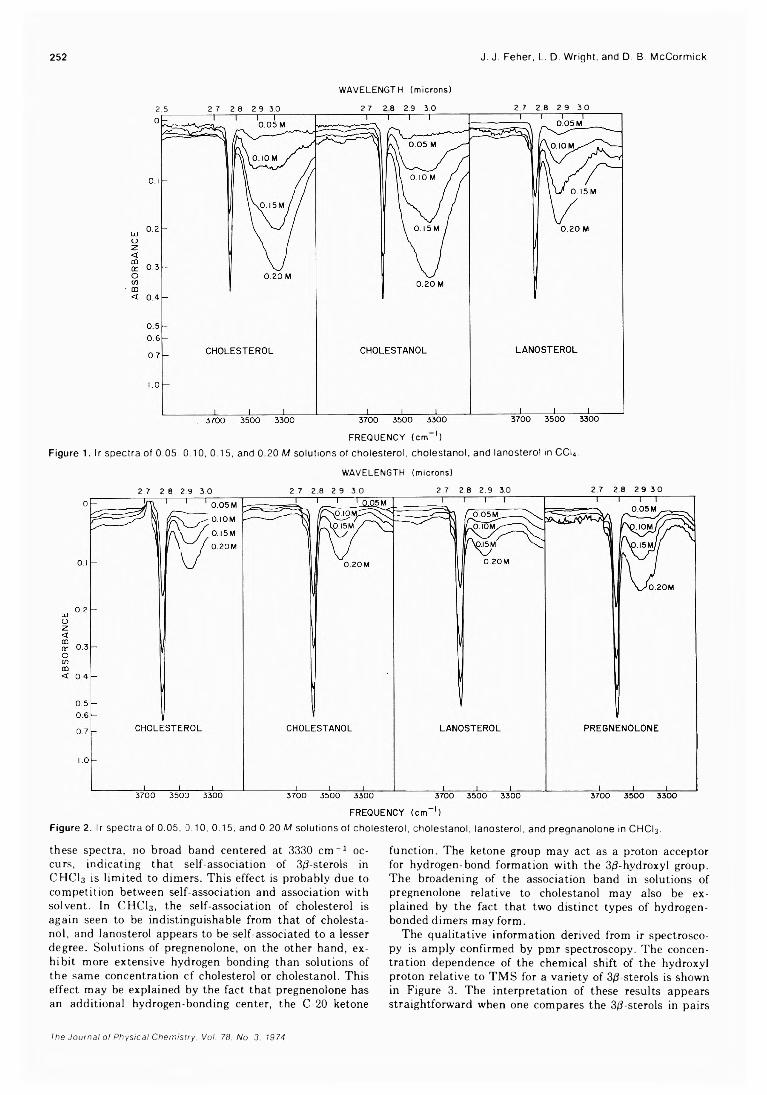
252 J. J. Feher, L. D. Wright, and D. B. McCormick
WAVELENGTH (microns)
2 ,5 2 .7 2 .8 2 .9 3.0 2 .7 2 .8 2 .9 3 .0 2 .7 2 .8 2 .9 3 .0
FREQUENCY (cm ')
F igu re 1. Ir spe c tra o f 0.05. 0.10, 0.15, and 0.20 M so lu tio ns of cho le s te ro l, cho le s ta no l, and lanoste ro l in CCI4.
WAVELENGTH (microns)
2 .7 2 .8 2 .9 3 .0 2 .7 2 8 2 .9 3 .0 2 .7 2 .8 2 .9 3 .0 2 .7 2 .8 2 .9 3 .0
F igu re 2. Ir sp e c tra of 0.05, 0.10, 0.15, and 0 .20 M so lu tions of cho le s te ro l, cho le s ta no l, la nos te ro l, and p regnano lone in CH C I3.
these spectra, no broad band centered at 3330 cm -1 occurs, indicating that self-association of 3/3-sterols in CHCI3 is limited to dimers. This effect is probably due to competition between self-association and association with solvent. In CHCI3, the self-association of cholesterol is again seen to be indistinguishable from that of cholestanol, and lanosterol appears to be self-associated to a lesser degree. Solutions of pregnenolone, on the other hand, exhibit more extensive hydrogen bonding than solutions of the same concentration cf cholesterol or cholestanol. This effect may be explained by the fact that pregnenolone has an additional hydrogen-bonding center, the C-20 ketone
function. The ketone group may act as a proton acceptor for hydrogen-bond formation with the 3/3-hvdroxyl group. The broadening of the association band in solutions of pregnenolone relative to cholestanol may also be explained by the fact that two distinct types of hydrogen- bonded dimers may form.
The qualitative information derived from ir spectroscopy is amply confirmed by pmr spectroscopy. The concentration dependence of the chemical shift of the hydroxyl proton relative to TMS for a variety of 3/3-sterols is shown in Figure 3. The interpretation of these results appears straightforward when one compares the 3/3-sterols in pairs
The Journal of Physical Chemistry. Vol. 78. No. 3. 1974
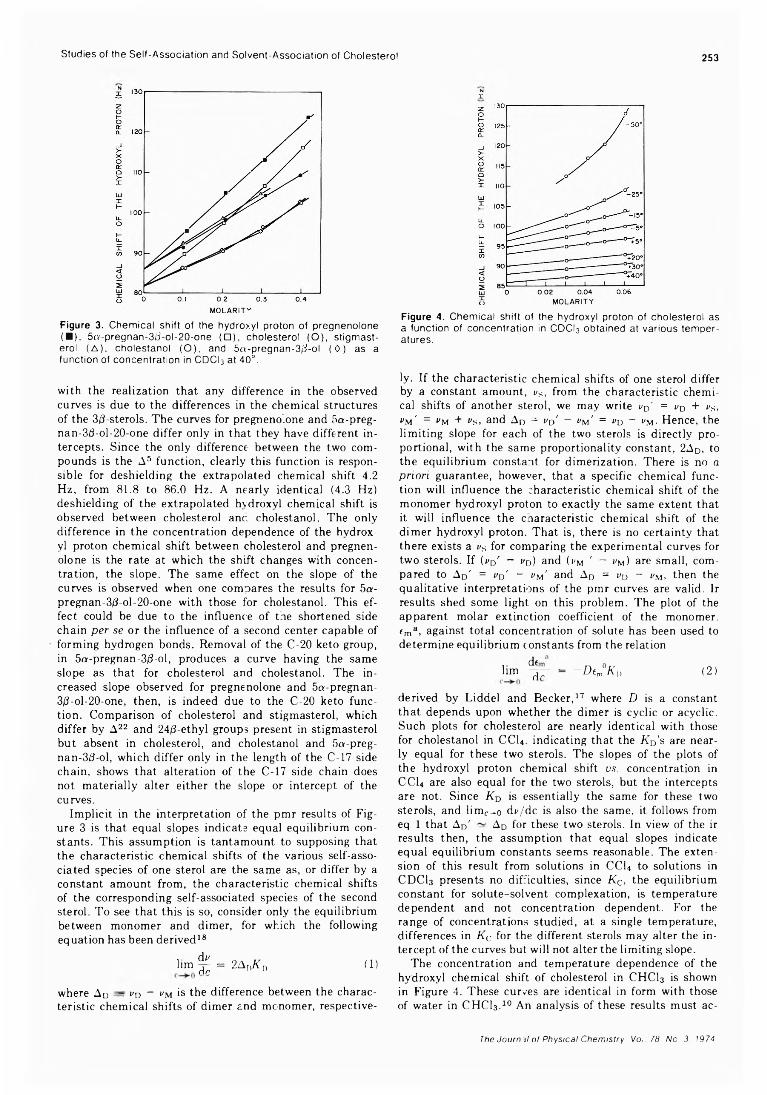
Studies of the Self-Association and Solvent-Association of Cholesterol 253
Figure 3. C h em ica l sh ift o f the hyd roxy l p ro ton o f p regneno lone ( ■ ) , 5 a -p re gna n -3 /3 -o l-2 0 -o ne ( □ ) , cho le s te ro l (O ) , s tigm a s t- ero l ( A ) , cho le s ta no l (O ) , and 5cv-pregnan-3/3-o l ( 0 ) as a fu n c tio n of co n ce n tra tio n in C D C I3 at 40°.
with the realization that any difference in the observed curves is due to the differences in the chemical structures of the 3/3-sterols. The curves for pregnenolone and 5a-preg- nan-3d-ol-20-one differ only in that they have different intercepts. Since the only difference between the two compounds is the A5 function, clearly this function is responsible for deshielding the extrapolated chemical shift 4.2 Hz, from 81.8 to 86.0 Hz. A nearly identical (4.3 Hz) deshielding of the extrapolated hydroxyl chemical shift is observed between cholesterol anc. cholestanol. The only difference in the concentration dependence of the hydroxyl proton chemical shift between cholesterol and pregnenolone is the rate at which the shift changes with concentration, the slope. The same effect on the slope of the curves is observed when one compares the results for 5a- pregnan-3/J-ol-20-one with those for cholestanol. This effect could be due to the influence of the shortened side chain per se or the influence of a second center capable of forming hydrogen bonds. Removal of the C-20 keto group, in 5a-pregnan-3/3-ol, produces a curve having the same slope as that for cholesterol and cholestanol. The increased slope observed for pregnenolone and 5a-pregnan- 3d-ol-20-one, then, is indeed due to the C-20 keto function. Comparison of cholesterol and stigmasterol, which differ by A22 and 240-ethyl groups present in stigmasterol but absent in cholesterol, and cholestanol and 5a-preg- nan-30-ol, which differ only in the length of the C-17 side chain, shows that alteration of the C-17 side chain does not materially alter either the slope or intercept of the curves.
Implicit in the interpretation of the pmr results of Figure 3 is that equal slopes indicate equal equilibrium constants. This assumption is tantamount to supposing that the characteristic chemical shifts of the various self-associated species of one sterol are the same as, or differ by a constant amount from, the characteristic chemical shifts of the corresponding self-associated species of the second sterol. To see that this is so, consider only the equilibrium between monomer and dimer, for which the following equation has been derived18
l im ^ = 2Ar D (1)
where AD = vD — v.m is the difference between the characteristic chemical shifts of dimer and monomer, respective
NX
Figure 4. C h em ica l sh ift o f the hyd roxy l p ro ton o f cho le s te ro l as a fun c tion of c o n ce n tra tio n in C D C I3 ob ta ined at va riou s te m p e ra tu res.
ly. If the characteristic chemical shifts of one sterol differ by a constant amount, vs, from the characteristic chemical shifts of another sterol, we may write vD' = pD + i/s, vm' = vm + i>s, and AD = I'd' — "m' = rD - rM. Hence, the limiting slope for each of the two sterols is directly proportional, with the same proportionality constant, 2 A d , to the equilibrium constant for dimerization. There is no a priori guarantee, however, that a specific chemical function will influence the characteristic chemical shift of the monomer hydroxyl proton to exactly the same extent that it will influence the cnaracteristic chemical shift of the dimer hydroxyl proton. That is, there is no certainty that there exists a vs for comparing the experimental curves for two sterols. If (vDr - vD) and (i/M ' — vM) are small, compared to Ad' = rD' — I'm' and AD = rD - vM, then the qualitative interpretations of the pmr curves are valid. Ir results shed some light on this problem. The plot of the apparent molar extinction coefficient of the monomer. fma, against total concentration of solute has been used to determine equilibrium constants from the relation
lim ^ 7- = -D t m°Kn (2 )
derived by Liddel and Becker,17 where D is a constant that depends upon whether the dimer is cyclic or acyclic. Such plots for cholesterol are nearly identical with those for cholestanol in CCI4, indicating that the KD's are nearly equal for these two sterols. The slopes of the plots of the hydroxyl proton chemical shift vs. concentration in CCI4 are also equal for the two sterols, but the intercepts are not. Since KD is essentially the same for these two sterols, and limc^0 dv/dc is also the same, it follows from eq 1 that A d ' — A d for these two sterols. In view of the ir results then, the assumption that equal slopes indicate equal equilibrium constants seems reasonable. The extension of this result from solutions in CC14 to solutions in CDCI3 presents no difficulties, since Kc, the equilibrium constant for solute-solvent complexation, is temperature dependent and not concentration dependent. For the range of concentrations studied, at a single temperature, differences in Kc for the different sterols may alter the intercept of the curves but will not alter the limiting slope.
The concentration and temperature dependence of the hydroxyl chemical shift of cholesterol in CHCI3 is shown in Figure 4. These curves are identical in form with those of water in CHCI3.10 An analysis of these results must ac-
The Journal of Physical Chemistry. Voi. 78. No. 3. 1974
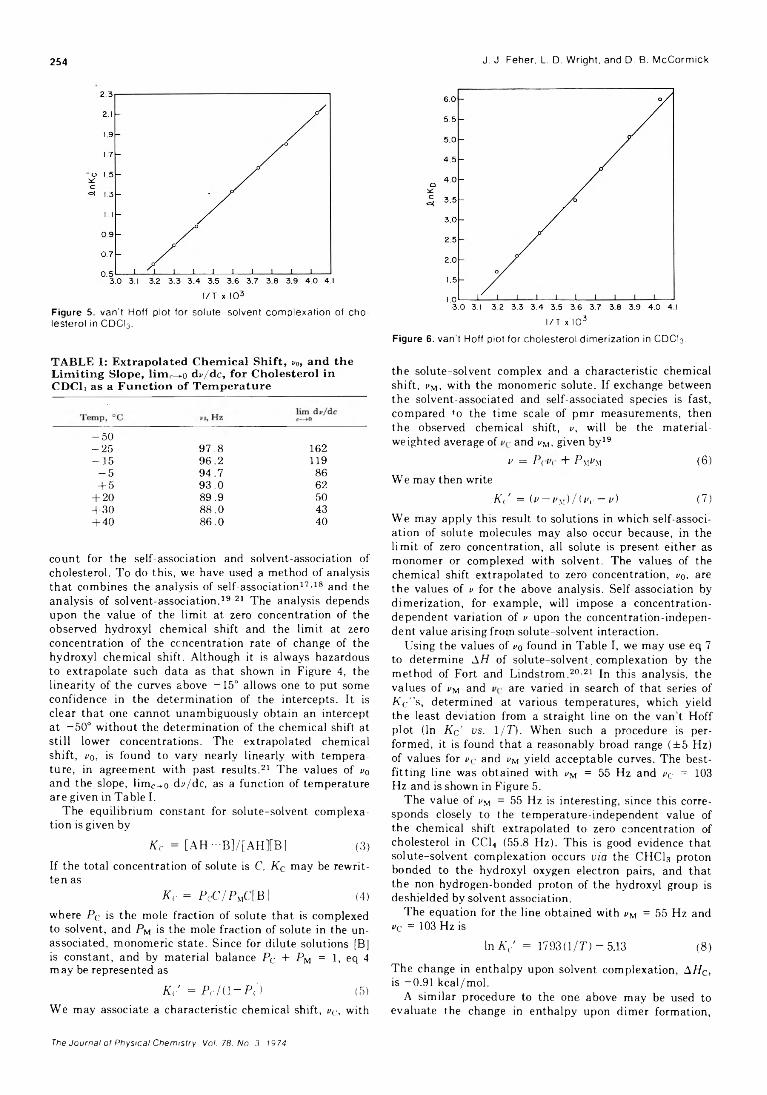
254 J. J. Feher, L. D. Wright, and D. B. McCormick
Figure 5. v a n 't H o ff p lo t fo r so lu te -s o lv e n t com p le xa tio n of ch o les té ro l in CD C I3.
TABLE I: Extrapolated Chemical Shift, ¡/0, and the Limiting Slope, limr—0 d v /d c , for Cholesterol in CDCL as a Function of Temperature
-5 0-2 5 97.8 162-1 5 96.2 119- 5 94.7 86+5 93.0 62
+ 20 89.9 50+ 30 88.0 43+ 40 86.0 40
count for the self-association and solvent-association of cholesterol. To do this, we have used a method of analysis that combines the analysis of self-association17'18 and the analysis of solvent-association.19-21 The analysis depends upon the value of the limit at zero concentration of the observed hydroxyl chemical shift and the limit at zero concentration of the concentration rate of change of the hydroxyl chemical shift. Although it is always hazardous to extrapolate such data as that shown in Figure 4, the linearity of the curves above -15° allows one to put some confidence in the determination of the intercepts. It is clear that one cannot unambiguously obtain an intercept at -50° without the determination of the chemical shift at still lower concentrations. The extrapolated chemical shift, r0, is found to vary nearly linearly with temperature, in agreement with past results.21 The values of v0 and the slope, limc-.0 dy/dc, as a function of temperature are given in Table I.
The equilibrium constant for solute-solvent complexa- tion is given by
Kc = [AH ■••B]/[AH][B] (3)If the total concentration of solute is C, Kq may be rewritten as
K c = PcC /P mCIBJ (4)where Pc is the mole fraction of solute that is complexed to solvent, and PM is the mole fraction of solute in the unassociated, monomeric state. Since for dilute solutions [B] is constant, and by material balance Pc + PM = 1, eq 4 may be represented as
K c ' - P c H l - P j (5)We may associate a characteristic chemical shift, yc, with
l / T x I0 3
Figure 6 . va n 't H off p lo t fo r cho le s te ro l d im e riza tio n in CDCI3 .
the solute-solvent complex and a characteristic chemical shift, i<M, with the monomeric solute. If exchange between the solvent-associated and self-associated species is fast, compared to the time scale of pmr measurements, then the observed chemical shift, v, will be the material- weighted average of and rM, given bv19
v = P (i>( + P mcm ( 6 )
We may then writeAV = (v — I'm) / (/'(■ — v) (7)
We may apply this result to solutions in which self-association of solute molecules may also occur because, in the limit of zero concentration, all solute is present either as monomer or complexed with solvent. The values of the chemical shift extrapolated to zero concentration, vo, are the values of u for the above analysis. Self-association by dimerization, for example, will impose a concentration- dependent variation of v upon the concentration-independent value arising froip solute-solvent interaction.
Using the values of vo found in Table I, we may use eq 7 to determine AH of solute-solvent. complexation by the method of Fort and Lindstrom.20-21 In this analysis, the values of vM and are varied in search of that series of K c ’ ’s, determined at various temperatures, which yield the least deviation from a straight line on the van’t Hoff plot (In Kc ’ us. l/T). When such a procedure is performed, it is found that a reasonably broad range (±5 Hz) of values for vc and uM yield acceptable curves. The bestfitting line was obtained with vM = 55 Hz and vc = 103 Hz and is shown in Figure 5.
The value of i/M = 55 Hz is interesting, since this corresponds closely to the temperature-independent value of the chemical shift extrapolated to zero concentration of cholesterol in CC14 (55.8 Hz). This is good evidence that solute-solvent complexation occurs via the CHCI3 proton bonded to the hydroxyl oxygen electron pairs, and that the non-hydrogen-bonded proton of the hydroxyl group is deshielded by solvent association.
The equation for the line obtained with i/M = 55 Hz and vc = 103 Hz is
In Kc' = 1793(1/7") — 5.13 (8)
The change in enthalpy upon solvent complexation, AHC, is —0.91 kcal/mol.
A similar procedure to the one above may be used to evaluate the change in enthalpy upon dimer formation,
The Journal of Physical Chemistry. Vol. 78. No. 3. 1974
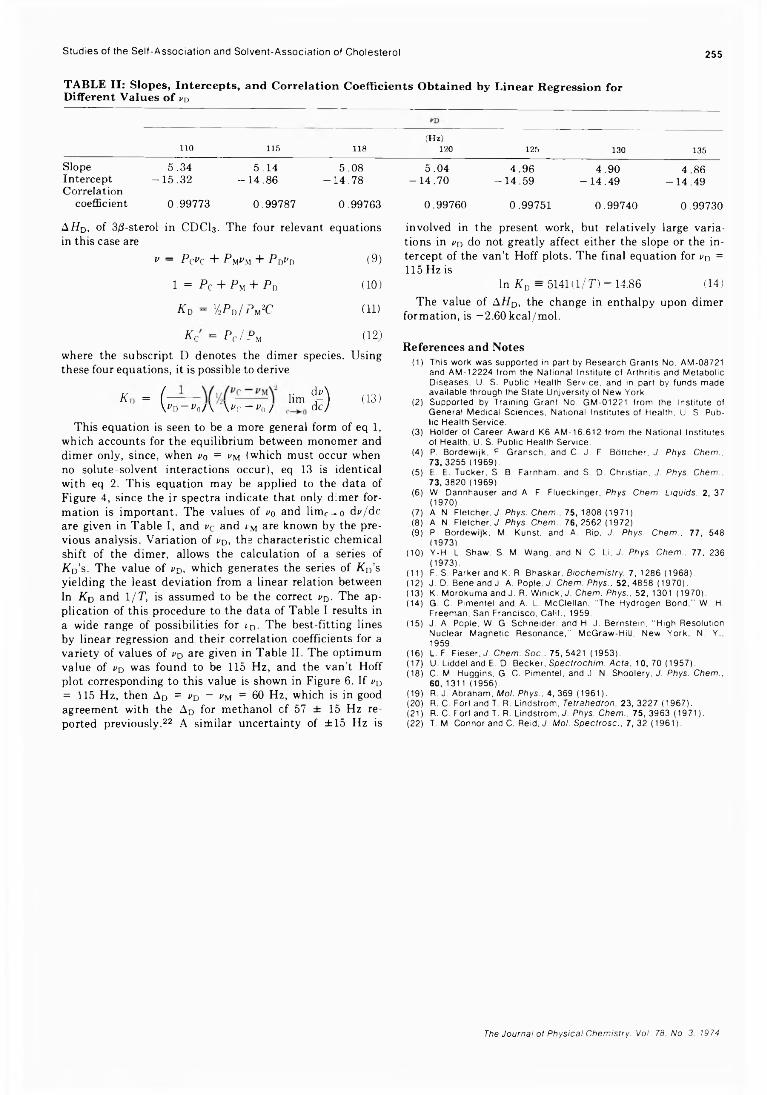
Studies of the Self-Association and Solvent-Association of Cholesterol 255
TABLE II: Slopes, Intercepts, and Correlation Coefficients Obtained by Linear Regression for Different Values of i>D
110 115 1 18
Slope 5.34 5.14 5.08InterceptCorrelation
-15 .32 -14 .86 -14 .78
coefficient 0.99773 0.99787 0.99763
AHd, of 3/3-sterol in CDCI3. The four relevant equations in this case are
v = Pcvc + P MvM + P DnD (9)
1 = Pc + P m + P b (10)
K v = KPo/PtfC (ID
Kc = P J -% (12)where the subscript D denotes the dimer species. Using these four equations, it is possible to derive
K , = ( — l im % ) (13)Vt'D-f'o/V \»C-V0/ dc/This equation is seen to be a more general form of eq 1,
which accounts for the equilibrium between monomer and dimer only, since, when no = nM (which must occur when no solute-solvent interactions occur), eq 13 is identical with eq 2. This equation may be applied to the data of Figure 4, since the ir spectra indicate that only dimer formation is important. The values of no and limc^o dv/dc are given in Table I, and nc and nM are known by the previous analysis. Variation of t/D, the characteristic chemical shift of the dimer, allows the calculation of a series of Kd’s. The value of nD, which generates the series of KD’s yielding the least deviation from a linear relation between In Kd and 1/T, is assumed to be the correct vd- The application of this procedure to the data of Table I results in a wide range of possibilities for rD. The best-fitting lines by linear regression and their correlation coefficients for a variety of values of rD are given in Table II. The optimum value of nD was found to be 115 Hz, and the van’t Hoff plot corresponding to this value is shown in Figure 6. If nD = 115 Hz, then AD = nD - nM = 60 Hz, which is in good agreement with the AD for methanol of 57 ± 15 Hz reported previously.22 A similar uncertainty of ±15 Hz is
(Hz)120 125 130 135
5.04 4.96 4.90 4 . 8 6
-1 4 .7 0 -1 4 .5 9 -1 4 .4 9 -1 4 .4 9
0.99760 0.99751 0.99740 0.99730
involved in the present work, but relatively large variations in no do not greatly affect either the slope or the intercept of the van’t Hoff plots. The final equation for nD = 115 Hz is
In K d = 5141(1/T) — 14.86 (14)The value of AHD, the change in enthalpy upon dimer
formation, is —2.60 kcal/mol.
References and Notes(1) This work was supported in part by Research Grants No. AM-08721
and AM-12224 from the National Institute of Arthritis and Metabolic Diseases, U. S. Public Health Service, and in part by funds made available through the State Unjversity of New York.
(2) Supported by Training Grant No. GM-01221 from the Institute of General Medical Sciences, National Institutes of Health, U. S. Public Health Service.
(3) Holder of Career Award K6 AM-16,612 from the National Institutes of Health, U. S. Public Health Service.
(4) P. Bordewijk, F. Gransch, and C. J. F. Böttcher, J. Phys. Chem.. 73, 3255 (1969).
(5) E. E. Tucker, S. B. Farnham. and S. D. Christian, J. Phys. Chem.. 73, 3820 (1969).
(6) W. Dannhauser and A. F. Flueckinger, Phys. Chem. Liquids. 2, 37 (1970).
(7) A. N. Fletcher, J. Phys. Chem., 75, 1808 (1971).(8) A. N. Fletcher, J. Phys. Chem.. 76, 2562 (1972).(9) P. Bordewijk, M. Kunst, and A. Rip, J. Phys. Chem.. 77, 548
(1973).(10) Y-H. L. Shaw. S. M. Wang, and N. C. Li, J. Phys Chem.. 77, 236
(1973).(11) F. S. Parker and K. R. Bhaskar, Biochemistry. 7, 1286 (1968).(12) J. D, Bene and J. A. Pople, J. Chem. Phys.. 52, 4858 (1970).(13) K. Morokuma and J. R. Winick, J. Chem. Phys.. 52, 1301 (1970).(14) G. C. Pimentel and A. L. McClellan, “ The Hydrogen Bond," W. H.
Freeman, San Francisco, Calif.. 1959.(15) J. A. Pople, W. G. Schneider, and H. J. Bernstein, "High Resolution
Nuclear Magnetic Resonance," McGraw-HiU, New York, N. Y., 1959.
(16) L. F. Fieser, J. Chem. Soc.. 75,5421 (1953).(17) U. Liddel and E. D. Becker, Spectrochim. Acta. 10, 70 (1957).(18) C. M. Huggins, G. C. Pimentel, and J. N. Shoolery, J. Phys. Chem..
60,1311 (1956).(19) R. J. Abraham, Mol. Phys., 4, 369 (1961).(20) R. C. Fort and T. R. Lindstrom, Tetrahedron. 23, 3227 (1967).(21) R. C. Fort and T. R. Lindstrom, J. Phys. Chem., 75, 3963 (1971).(22) T. M. Connor and C. Reid, J. Mol. Spectrosc., 7, 32 (1961).
The Journal of Physical Chemistry. Vol 78. No 3. 1974
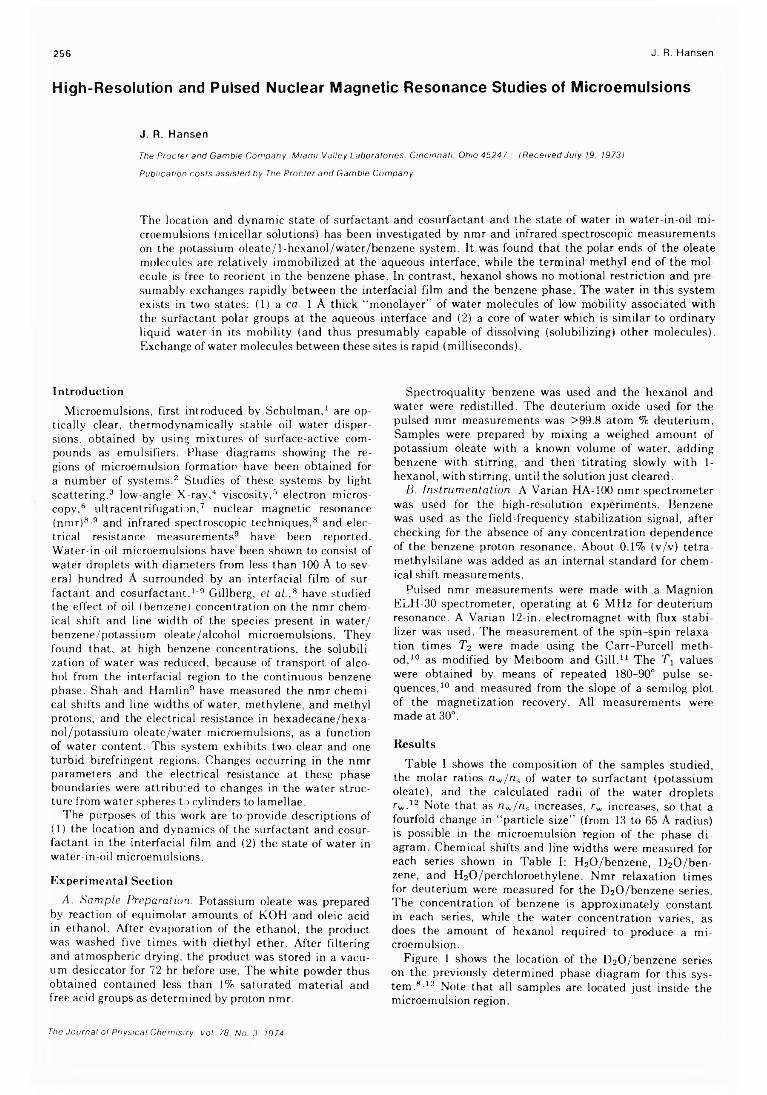
256 J. R. Hansen
H ig h -R e s o iu t io n a n d P u ls e d N u c le a r M a g n e t i c R e s o n a n c e S t u d ie s o f M i c r o e m u ls i o n s
J. R. Hansen
The Procter and Gamble Company. Miami Valley Laboratories. Cincinnati. Ohio 4524 7 (Received July 19. 1973) Publication costs assisted by The Procter and Gamble Company
The location and dynamic state of surfactant and cosurfactant and the state of water in water-in-oil microemulsions (micellar solutions) has been investigated by nmr and infrared spectroscopic measurements on the potassium oleate/l-hexanol/water/benzene system. It was found that the polar ends of the oleate molecules are relatively immobilized at the aqueous interface, while the terminal methyl end of the molecule is free to reorient in the benzene phase. In contrast, hexanol shows no motional restriction and presumably exchanges rapidly between the interfacial film and the benzene phase. The water in this system exists in two states: (1) a fa. 1 À thick “ monolayer” of water molecules of low mobility associated with the surfactant polar groups at the aqueous interface and (2) a core of water which is similar to ordinary liquid water in its mobility (and thus presumably capable of dissolving (solubilizing) other molecules). Exchange of water molecules between these sites is rapid (milliseconds).
Introduction
Microemulsions, first introduced by Schulman,1 are optically clear, thermodynamically stable oil-water dispersions, obtained by using mixtures of surface-active compounds as emulsifiers. Phase diagrams showing the regions of microemulsion formation have been obtained for a number of systems.2 Studies of these systems by light scattering,3 low-angle X-rav,4 viscosity,5 electron microscopy,6 ultracentrifugation,7 nuclear magnetic resonance (nmr)8-9 and infrared spectroscopic techniques,8 and electrical resistance measurements9 have been reported. Water-in-oil microemulsions have been shown to consist of water droplets with diameters from less than 100 A to several hundred A surrounded by an interfacial film of surfactant and cosurfactant.1-9 Gillberg, et al.,s have studied the effect of oil (benzene) concentration on the nmr chemical shift and line width of the species present in water/ benzene/potassium oleate/alcohol microemulsions. They found that, at high benzene concentrations, the solubilization of water was reduced, because of transport of alcohol from the interfacial region to the continuous benzene phase. Shah and Hamlin9 have measured the nmr chemical shifts and line widths of water, methylene, and methyl protons, and the electrical resistance in hexadecane/hexa- nol/potassium oleate/water microemulsions, as a function of water content. This system exhibits two clear and one turbid birefringent regions. Changes occurring in the nmr parameters and the electrical resistance at these phase boundaries were attributed to changes in the water structure from water spheres to cylinders to lamellae.
The purposes of this work are to provide descriptions of (1) the location and dynamics of the surfactant and cosurfactant in the interfacial film and (2) the state of water in water-in-oil microemulsions.
Experimental Section
A. Sample Preparation. Potassium oleate was prepared by reaction of equimolar amounts of KOH and oleic acid in ethanol. After evaporation of the ethanol, the product was washed five times with diethyl ether. After filtering and atmospheric drying, the product was stored in a vacuum desiccator for 72 hr before use. The white powder thus obtained contained less than 1% saturated material and free acid groups as determined by proton nmr.
Spectroquality benzene was used and the hexanol and water were redistilled. The deuterium oxide used for the pulsed nmr measurements was >99.8 atom % deuterium. Samples were prepared by mixing a weighed amount of potassium oleate with a known volume of water, adding benzene with stirring, and then titrating slowly with 1- hexanol, with stirring, until the solution just cleared.
B. Instrumentation. A Varian HA-100 nmr spectrometer was used for the high-resolution experiments. Benzene was used as the field-frequency stabilization signal, after checking for the absence of any concentration dependence of the benzene proton resonance. About 0.1% (v/v) tetra- methylsilane was added as an internal standard for chemical shift measurements.
Pulsed nmr measurements were made with a Magnion ELH-30 spectrometer, operating at 6 MHz for deuterium resonance. A Varian 12-in. electromagnet with flux stabilizer was used. The measurement of the spin-spin relaxation times T2 were made using the Carr-Purcell method,10 as modified by Meiboom and Gill.11 The T1 values were obtained by means of repeated 180-90° pulse sequences,10 and measured from the slope of a semilog plot of the magnetization recovery. All measurements were made at 30°.
Results
Table I shows the composition of the samples studied, the molar ratios nw/rcs of water to surfactant (potassium oleate), and the calculated radii of the water droplets rw.12 Note that as nw/ns increases, rw increases, so that a fourfold change in “ particle size” (from 13 to 65 A radius) is possible in the microemulsion region of the phase diagram. Chemical shifts and line widths were measured for each series shown in Table I: H20/benzene, D20/ben- zene, and H20/perchloroethylene. Nmr relaxation times for deuterium were measured for the D20/benzene series. The concentration of benzene is approximately constant in each series, while the water concentration varies, as does the amount of hexanol required to produce a microemulsion.
Figure 1 shows the location of the D20/benzene series on the previously determined phase diagram for this system.8-12 Note that all samples are located just inside the microemulsion region.
The Journal of Physical Chemistry. Vol. 78. No. 3. 1974
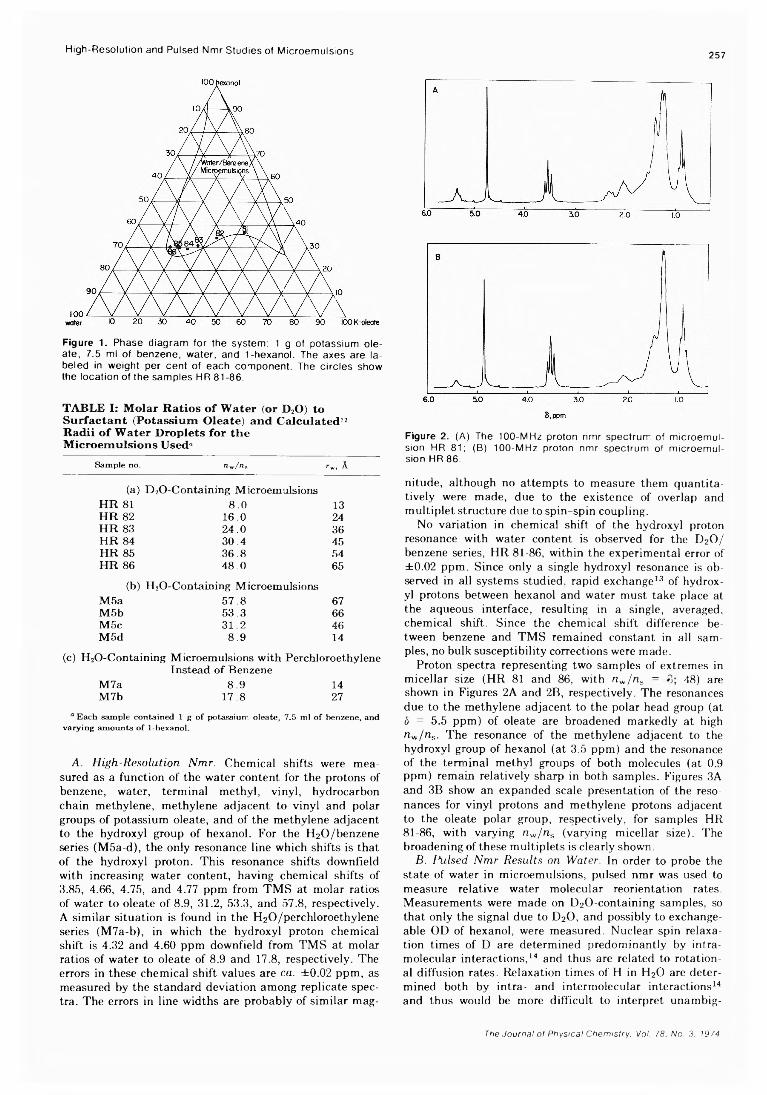
High-Resolution and Pulsed Nmr Studies of Microemulsions
Figure 1. P h a s e d ia g ra m fo r th e s y s te m : 1 g o f p o ta s s iu m o le - a t e , 7 .5 m l o f b e n z e n e , w a t e r , a n d 1 -h e x a n o l. T h e a x e s a re la b e le d in w e ig h t p e r c e n t o f e a c h c o m p o n e n t . T h e c ir c le s s h o w th e lo c a t io n o f th e s a m p le s H R 8 1 - 8 6 .
TABLE I: Molar Ratios of Water (or D20) to Surfactant (Potassium Oleate) and Calculated12 Radii of Water Droplets for the Microemulsions Used"
Sam ple no. "w/rcs r„ A
(a) D20-Containing MicroemulsionsHR 81 8.0 13HR 82 16.0 24HR 83 24.0 36HR 84 30.4 45HR 85 36.8 54HR 86 48.0 65
(b) H20-Containing MicroemulsionsM5a 57.8 67M5b 53.3 66M5c 31.2 46M5d 8.9 14
(c) H20-Containing Microemulsions with PerchloroethyleneInstead of Benzene
M7a 8.9 14M7b 17.8 27
° E a ch sam ple con ta in ed 1 g o f potassium oleate, 7.5 m l o f benzene, and vary in g am ounts o f 1-hexanol.
A. High-Resolution Nmr. Chemical shifts were measured as a function of the water content for the protons of benzene, water, terminal methyl, vinyl, hydrocarbon chain methylene, methylene adjacent to vinyl and polar groups of potassium oleate, and of the methylene adjacent to the hydroxyl group of hexanol. For the H20/benzene series (M5a-d), the only resonance line which shifts is that of the hydroxyl proton. This resonance shifts downfield with increasing water content, having chemical shifts of 3.85, 4.66, 4.75, and 4.77 ppm from TMS at molar ratios of water to oleate of 8.9, 31.2, 53.3, and 57.8, respectively. A similar situation is found in the H20/perchloroethylene series (M7a-b), in which the hydroxyl proton chemical shift is 4.32 and 4.60 ppm downfield from TMS at molar ratios of water to oleate of 8.9 and 17.8, respectively. The errors in these chemical shift values are ca. ± 0.02 ppm, as measured by the standard deviation among replicate spectra. The errors in line widths are probably of similar mag-
257
Figure 2 . (A ) T h e 1 0 0 - M H z p ro to n n m r s p e c tru m o f m ic r o e m u ls io n H R 8 1 ; (B ) 1 0 0 - M H z p ro to n n m r s p e c tru m o f m ic r o e m u ls io n H R 8 6 .
nitude, although no attempts to measure them quantitatively were made, due to the existence of overlap and multiplet structure due to spin-spin coupling.
No variation in chemical shift of the hydroxyl proton resonance with water content is observed for the D20 / benzene series, HR 81-86, within the experimental error of ±0.02 ppm. Since only a single hydroxyl resonance is observed in all systems studied, rapid exchange13 of hydroxyl protons between hexanol and water must take place at the aqueous interface, resulting in a single, averaged, chemical shift. Since the chemical shift difference between benzene and TMS remained constant in all samples, no bulk susceptibility corrections were made.
Proton spectra representing two samples of extremes in micellar size (HR 81 and 86, with nw/ns = 48) areshown in Figures 2A and 2B, respectively. The resonances due to the methylene adjacent to the polar head group (at 5 = 5.5 ppm) of oleate are broadened markedly at high nw/ns. The resonance of the methylene adjacent to the hydroxyl group of hexanol (at 3.5 ppm) and the resonance of the terminal methyl groups of both molecules (at 0.9 ppm) remain relatively sharp in both samples. Figures 3A and 3B show an expanded scale presentation of the resonances for vinyl protons and methylene protons adjacent to the oleate polar group, respectively, for samples HR 81-86, with varying n„/ns (varying micellar size). The broadening of these multiplets is clearly shown.
B. Ihilsed Nmr Results on Water. In order to probe the state of water in microemulsions, pulsed nmr was used to measure relative water molecular reorientation rates. Measurements were made on D20-containing samples, so that only the signal due to D20 , and possibly to exchangeable OD of hexanol, were measured. Nuclear spin relaxation times of D are determined predominantly by intramolecular interactions,14 and thus are related to rotational diffusion rates. Relaxation times of H in H20 are determined both by intra- and intermolecular interactions14 and thus would be more difficult to interpret unambig-
The Journal of Physical Chemistry. Vol. 78. No 3. 1974
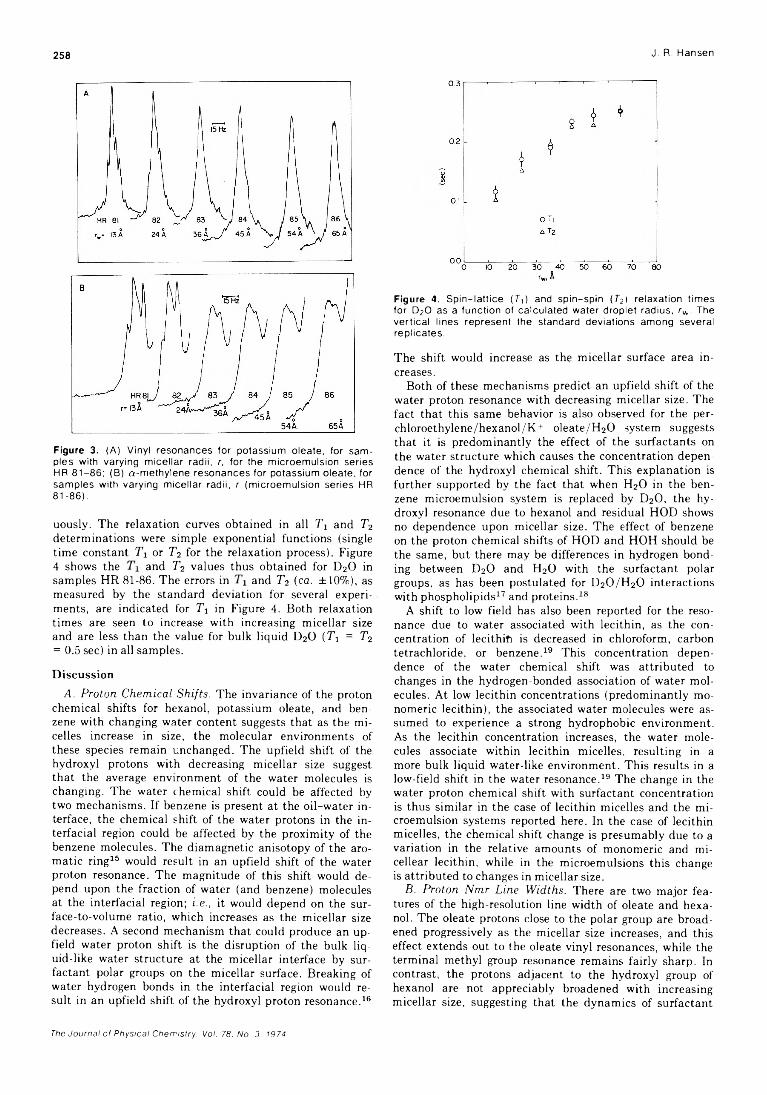
258 J. R. Hansen
Figure 3 . (A ) V in y l r e s o n a n c e s fo r p o ta s s iu m o le a te , fo r s a m p le s w ith v a ry in g m ic e l la r ra d ii, r , fo r th e m ic ro e m u ls io n s e r ie s H R 8 1 - 8 6 ; (B ) a - m e t h y le n e r e s o n a n c e s fo r p o ta s s iu m o le a te , fo r s a m p le s w ith v a ry in g m ic e l la r ra d ii, r (m ic ro e m u ls io n s e r ie s H R 8 1 - 8 6 ) .
uously. The relaxation curves obtained in all T1 and T2 determinations were simple exponential functions (single time constant Ti or T2 for the relaxation process). Figure 4 shows the and T2 values thus obtained for D2O in samples HR 81-86. The errors in and T2 (ca. ±10%), as measured by the standard deviation for several experiments, are indicated for T-l in Figure 4. Both relaxation times are seen to increase with increasing micellar size and are less than the value for bulk liquid D2O (Ta = T2 = 0.5 sec) in all samples.
Discussion
A. Proton Chemical Shifts. The invariance of the proton chemical shifts for hexanol, potassium oleate, and benzene with changing water content suggests that as the micelles increase in size, the molecular environments of these species remain unchanged. The upfield shift of the hydroxyl protons with decreasing micellar size suggest that the average environment of the water molecules is changing. The water chemical shift could be affected by two mechanisms. If benzene is present at the oil-water interface, the chemical shift of the water protons in the interfacial region could be affected by the proximity of the benzene molecules. The diamagnetic anisotopy of the aromatic ring15 would result in an upfield shift of the water proton resonance. The magnitude of this shift would depend upon the fraction of water (and benzene) molecules at the interfacial region; i.e., it would depend on the sur- face-to-volume ratio, which increases as the micellar size decreases. A second mechanism that could produce an upfield water proton shift is the disruption of the bulk liquid-like water structure at the micellar interface by surfactant polar groups on the micellar surface. Breaking of water hydrogen bonds in the interfacial region would result in an upfield shift of the hydroxyl proton resonance.16
Figure 4. S p in - la t t ic e ( F , ) a n d s p in -s p in (F 2 | r e la x a t io n t im e s fo r D 20 a s a fu n c t io n o f c a lc u la te d w a te r d ro p le t ra d iu s , rw . T h e v e r t ic a l lin e s r e p re s e n t th e s ta n d a rd d e v ia t io n s a m o n g s e v e ra l r e p l ic a te s .
The shift would increase as the micellar surface area increases.
Both of these mechanisms predict an upfield shift of the water proton resonance with decreasing micellar size. The fact that this same behavior is also observed for the per- chloroethylene/hexanol/K+ oleate/H20 system suggests that it is predominantly the effect of the surfactants on the water structure which causes the concentration dependence of the hydroxyl chemical shift. This explanation is further supported by the fact that when H2O in the benzene microemulsion system is replaced by D2O, the hydroxyl resonance due to hexanol and residual HOD shows no dependence upon micellar size. The effect of benzene on the proton chemical shifts of HOD and HOH should be the same, but there may be differences in hydrogen bonding between D2O and H2O with the surfactant polar groups, as has been postulated for D2O /H 2O interactions with phospholipids17 and proteins.18
A shift to low field has also been reported for the resonance due to water associated with lecithin, as the concentration of lecithifi is decreased in chloroform, carbon tetrachloride, or benzene.19 This concentration dependence of the water chemical shift was attributed to changes in the hydrogen-bonded association of water molecules. At low lecithin concentrations (predominantly monomeric lecithin), the associated water molecules were assumed to experience a strong hydrophobic environment. As the lecithin concentration increases, the water molecules associate within lecithin micelles, resulting in a more bulk liquid water-like environment. This results in a low-field shift in the water resonance.19 The change in the water proton chemical shift with surfactant concentration is thus similar in the case of lecithin micelles and the microemulsion systems reported here. In the case of lecithin micelles, the chemical shift change is presumably due to a variation in the relative amounts of monomeric and mi- cellear lecithin, while in the microemulsions this change is attributed to changes in micellar size.
B. Proton Nmr Line Widths. There are two major features of the high-resolution line width of oleate and hexanol. The oleate protons close to the polar group are broadened progressively as the micellar size increases, and this effect extends out to the oleate vinyl resonances, while the terminal methyl group resonance remains fairly sharp. In contrast, the protons adjacent to the hydroxyl group of hexanol are not appreciably broadened with increasing micellar size, suggesting that the dynamics of surfactant
The Journal of Physical Chemistry. Vol. 78. No. 3. 1974
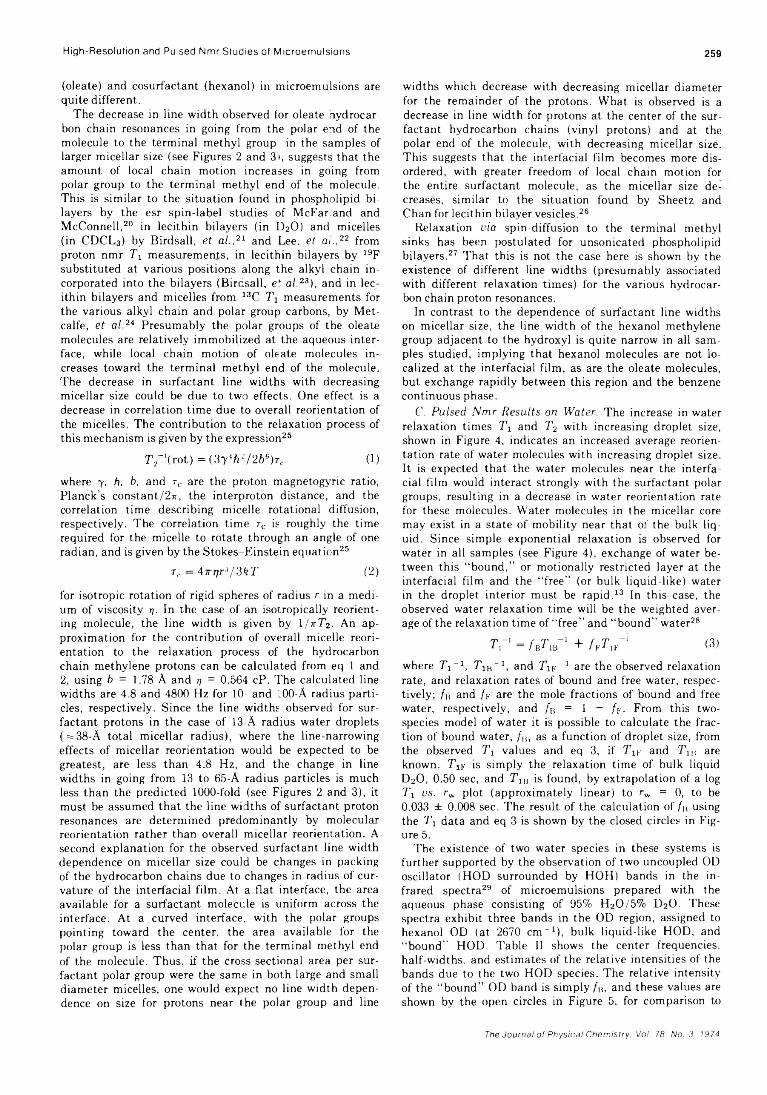
High-Resolution and Pulsed Nmr Studies of Microemulsions 259
(oleate) and cosurfactant (hexanol) in microemulsions are quite different.
The decrease in line width observed for oleate hydrocarbon chain resonances in going from the polar end of the molecule to the terminal methyl group, in the samples of larger micellar size (see Figures 2 and 3), suggests that the amount of local chain motion increases in going from polar group to the terminal methyl end of the molecule. This is similar to the situation found in phospholipid bilayers by the esr spin-label studies of McFarland and McConnell,20 in lecithin bilayers (in D20) and micelles (in CDCL3) by Birdsall, et a l ,,21 and Lee. et a i . , 2 2 from proton nmr 7\ measurements, in lecithin bilayers by 19F substituted at various positions along the alkyl chain incorporated into the bilayers (Birdsall, et al.23), and in lecithin bilayers and micelles from 13C Tj measurements for the various alkyl chain and polar group carbons, by Metcalfe, et al.2* Presumably the polar groups of the oleate molecules are relatively immobilized at the aqueous interface, while local chain motion of oleate molecules increases toward the terminal methyl end of the molecule. The decrease in surfactant line widths with decreasing micellar size could be due to two effects. One effect is a decrease in correlation time due to overall reorientation of the micelles. The contribution to the relaxation process of this mechanism is given by the expression25
T 2- l (rot) = (3 y 4h 2/2b6)Tc (1)
where 7, h, b, and rc are the proton magnetogyric ratio, Planck’s constant/2jr, the interproton distance, and the correlation time describing micelle rotational diffusion, respectively. The correlation time rc is roughly the time required for the micelle to rotate through an angle of one radian, and is given by the Stokes-Einstein equation25
tc = Ainjr3 / 3kT (2)
for isotropic rotation of rigid spheres of radius r in a medium of viscosity t]. In the case of an isotropically reorienting molecule, the line width is given by l/irT2. An approximation for the contribution of overall micelle reorientation to the relaxation process of the hydrocarbon chain methylene protons can be calculated from eq 1 and 2, using b = 1.78 A and 77 = 0.564 cP. The calculated line widths are 4.8 and 4800 Hz for 10- and 100-A radius particles, respectively. Since the line widths observed for surfactant protons in the case of 13-A radius water droplets («38-A total micellar radius), where the line-narrowing effects of micellar reorientation would be expected to be greatest, are less than 4.8 Hz, and the change in line widths in going from 13 to 65-A radius particles is much less than the predicted 1000-fold (see Figures 2 and 3), it must be assumed that the line widths of surfactant proton resonances are determined predominantly by molecular reorientation rather than overall micellar reorientation. A second explanation for the observed surfactant line width dependence on micellar size could be changes in packing of the hydrocarbon chains due to changes in radius of curvature of the interfacial film. At a flat interface, the area available for a surfactant molecule is uniform across the interface. At a curved interface, with the polar groups pointing toward the center, the area available for the polar group is less than that for the terminal methyl end of the molecule. Thus, if the cross-sectional area per surfactant polar group were the same in both large and small diameter micelles, one would expect no line width dependence on size for protons near the polar group and line
widths which decrease with decreasing micellar diameter for the remainder of the protons. What is observed is a decrease in line width for protons at the center of the surfactant hydrocarbon chains (vinyl protons) and at the polar end of the molecule, with decreasing micellar size. This suggests that the interfacial film becomes more disordered, with greater freedom of local chain motion for the entire surfactant molecule, as the micellar size decreases, similar to the situation found by Sheetz and Chan for lecithin bilayer vesicles.26
Relaxation via spin-diffusion to the terminal methyl sinks has been postulated for unsonicated phospholipid bilayers.27 That this is not the case here is shown by the existence of different line widths (presumably associated with different relaxation times) for the various hydrocarbon chain proton resonances.
In contrast to the dependence of surfactant line widths on micellar size, the line width of the hexanol methylene group adjacent to the hydroxyl is quite narrow in all samples studied, implying that hexanol molecules are not localized at the interfacial film, as are the oleate molecules, but exchange rapidly between this region and the benzene continuous phase.
C. Pulsed Nmr Results on Water. The increase in water relaxation times Tj and T2 with increasing droplet size, shown in Figure 4, indicates an increased average reorientation rate of water molecules with increasing droplet size. It is expected that the water molecules near the interfacial film would interact strongly with the surfactant polar groups, resulting in a decrease in water reorientation rate for these molecules. Water molecules in the micellar core may exist in a state of mobility near that of the bulk liquid. Since simple exponential relaxation is observed for water in all samples (see Figure 4), exchange of water between this “ bound,” or motionally restricted layer at the interfacial film and the “ free” (or bulk liquid-like) water in the droplet interior must be rapid.13 In this case, the observed water relaxation time will be the weighted average of the relaxation time of “ free” and “ bound” water28
r r = f BT IB- 1 + /V7V1 (3)where Ti “ 1, Tib - 1, and 7 iF_1 are the observed relaxation rate, and relaxation rates of bound and free water, respectively; / b and fv are the mole fractions of bound and free water, respectively, and / b = 1 - /». From this two- species model of water it is possible to calculate the fraction of bound water, / b, as a function of droplet size, from the observed Tj values and eq 3, if '¡\ F and T1H are known. T1K is simply the relaxation time of bulk liquid D20, 0.50 sec, and T1B is found, by extrapolation of a log 7\ vs. rw plot (approximately linear) to rw = 0, to be 0.033 ± 0.008 sec. The result of the calculation o f /» using the T1 data and eq 3 is shown by the closed circles in Figure 5.
The existence of two water species in these systems is further supported by the observation of two uncoupled OD oscillator (HOD surrounded by HOH) bands in the infrared spectra29 of microemulsions prepared with the aqueous phase consisting of 95% H20/5% D20. These spectra exhibit three bands in the OD region, assigned to hexanol OD (at 2670 cm -1), bulk liquid-like HOD, and “ bound” HOD. Table II shows the center frequencies, half-widths, and estimates of the relative intensities of the bands due to the two HOD species. The relative intensity of the “ bound” OD band is simply /» , and these values are shown by the open circles in Figure 5, for comparison to
The Journal of Physical Chemistry. Vol. 78. No. 3. 1974
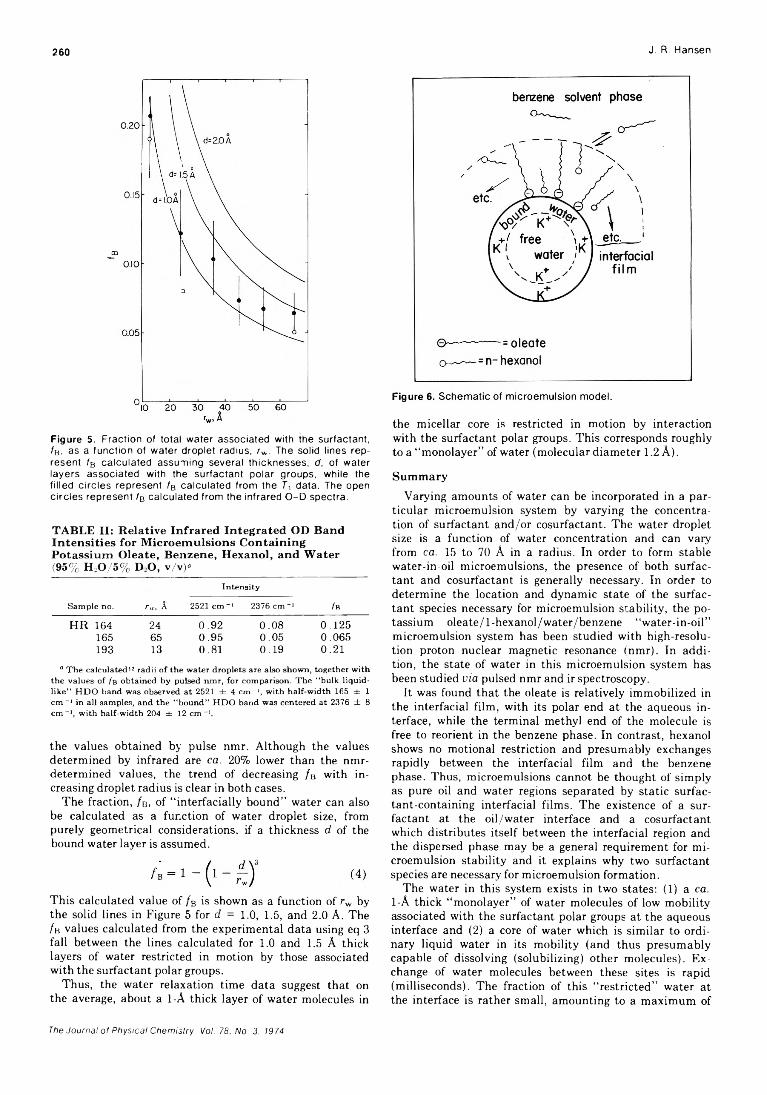
260 J. R. Hansen
F ig u r e 5 . F r a c t io n o f to ta l w a te r a s s o c ia te d w ith th e s u r fa c ta n t , fa , a s a fu n c t io n o f w a te r d ro p le t ra d iu s , rw . T h e so lid lin e s r e p r e s e n t f B c a lc u la te d a s s u m in g s e v e ra l th ic k n e s s e s , d , o f w a te r la y e rs a s s o c ia te d w ith th e s u r fa c ta n t p o la r g ro u p s , w h ile th e f i l le d c ir c le s re p re s e n t l B c a lc u la te d fro m th e T 1 d a ta . T h e o p e n c ir c le s r e p r e s e n t t B c a lc u la te d fro m th e in fra re d O - D s p e c tra .
TABLE II: Relative Infrared Integrated OD Band Intensities for Microemulsions Containing Potassium Oleate, Benzene, Hexanol, and Water(95% H20/5% D.O, v / v )«
In ten sity
Sam ple no. r w, A 2521 c m “ 1 2376 c m “ 1 / b
HR 164 24 0.92 0.08 0.125165 65 0.95 0.05 0.065193 13 0.81 0.19 0.21
a T h e ca lcu la ted12 radii o f the w ater droplets are also show n, together w ith th e values o f / b ob ta in ed b y pulsed nm r, for com parison . T h e “ bulk liqu id - lik e ” H D O ban d w as observed a t 2521 ± 4 c m -1, w ith h alf-w id th 165 ± 1 c m -1 in all sam ples, and th e “ b ou n d ” H D O ban d was cen tered a t 2376 ± 8 c m -1 , w ith h alf-w id th 204 ± 12 c m “ 1.
the values obtained by pulse nmr. Although the values determined by infrared are ca. 20% lower than the nmr- determined values, the trend of decreasing fB with increasing droplet radius is clear in both cases.
The fraction, fB, of “ interfacially bound” water can also be calculated as a function of water droplet size, from purely geometrical considerations, if a thickness d of the bound water layer is assumed.
This calculated value of fB is shown as a function of rw by the solid lines in Figure 5 for d = 1.0, 1.5, and 2.0 A. The fb values calculated from the experimental data using eq 3 fall between the lines calculated for 1.0 and 1.5 A thick layers of water restricted in motion by those associated with the surfactant polar groups.
Thus, the water relaxation time data suggest that on the average, about a 1-A thick layer of water molecules in
the micellar core is restricted in motion by interaction with the surfactant polar groups. This corresponds roughly to a “ monolayer” of water (molecular diameter 1.2 A).
SummaryVarying amounts of water can be incorporated in a par
ticular microemulsion system by varying the concentration of surfactant and/or cosurfactant. The water droplet size is a function of water concentration and can vary from ca. 15 to 70 A in a radius. In order to form stable water-in-oil microemulsions, the presence of both surfactant and cosurfactant is generally necessary. In order to determine the location and dynamic state of the surfactant species necessary for microemulsion stability, the potassium oleate/l-hexanol/water/benzene “ water-in-oil” microemulsion system has been studied with high-resolu- tion proton nuclear magnetic resonance (nmr). In addition, the state of water in this microemulsion system has been studied via pulsed nmr and ir spectroscopy.
It was found that the oleate is relatively immobilized in the interfacial film, with its polar end at the aqueous interface, while the terminal methyl end of the molecule is free to reorient in the benzene phase. In contrast, hexanol shows no motional restriction and presumably exchanges rapidly between the interfacial film and the benzene phase. Thus, microemulsions cannot be thought of simply as pure oil and water regions separated by static surfactant-containing interfacial films. The existence of a surfactant at the oil/water interface and a cosurfactant which distributes itself between the interfacial region and the dispersed phase may be a general requirement for microemulsion stability and it explains why two surfactant species are necessary for microemulsion formation.
The water in this system exists in two states: (1) a ca. 1-A thick “ monolayer” of water molecules of low mobility associated with the surfactant polar groups at the aqueous interface and (2) a core of water which is similar to ordinary liquid water in its mobility (and thus presumably capable of dissolving (solubilizing) other molecules). Exchange of water molecules between these sites is rapid (milliseconds). The fraction of this “ restricted” water at the interface is rather small, amounting to a maximum of
T h e J o u r n a l o f P h y s i c a l C h e m is t r y . V o l. 7 8 . N o . 3 . 1 9 7 4
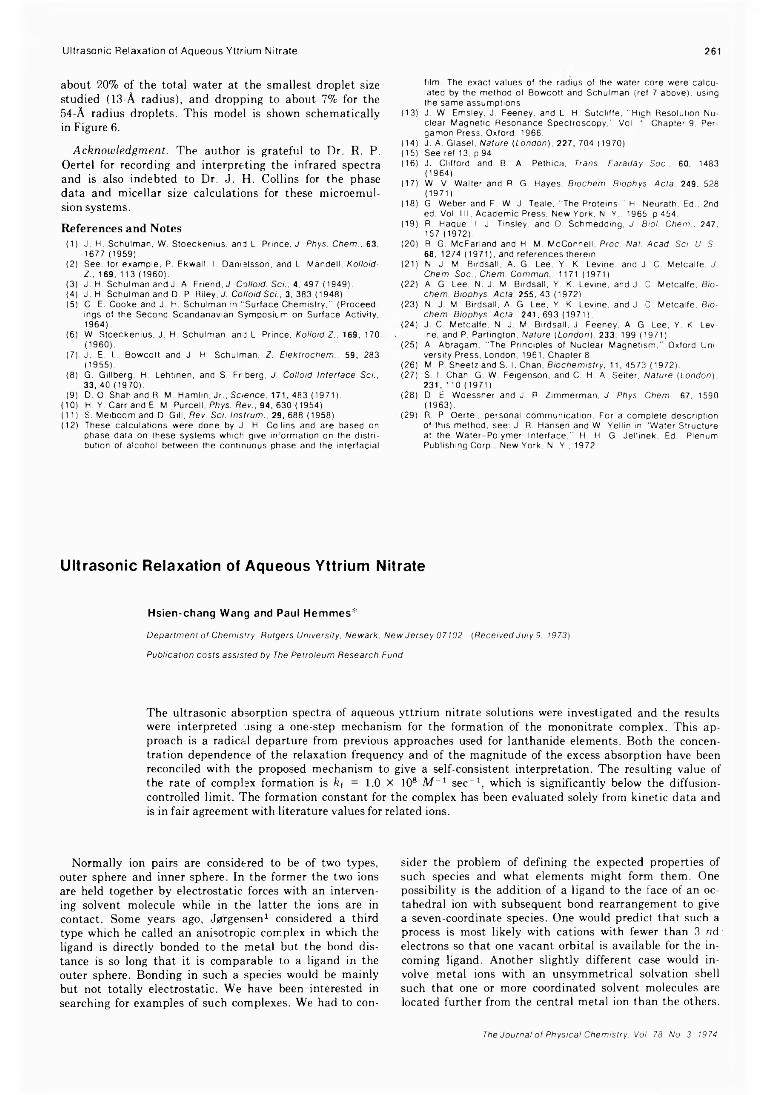
Ultrasonic Relaxation of Aqueous Y ttrium Nitrate 261
about 20% of the total water at the smallest droplet size studied (13-A radius), and dropping to about 7% for the 54-A radius droplets. This model is shown schematically in Figure 6.
Acknowledgment. The author is grateful to Dr. R. P. Oertel for recording and interpreting the infrared spectra and is also indebted to Dr. J. H. Collins for the phase data and micellar size calculations for these microemulsion systems.
References and Notes(1) J. H. Schulman, W. Stoeckenius, and L. Prince, J. Phys. Chem., 63,
1677 (1959).(2) See, for example, P. Ekwall. I. Danielsson, and L. Mandell, Kolloid-
Z , 1 6 9 , 113 (1960).(3) J. H. Schulman and J. A. Friend, J. Colloid. Sci., 4, 497 (1949).(4) J. H. Schulman and D. P. Riley, J. Colloid Sci., 3, 383 (1948).(5) C. E. Cooke and J. H. Schulman in “ Surface Chemistry,” (Proceed
ings of the Second Scandanavian Symposium on Surface Activity, 1964).
(6 ) W. Stoeckenius, J. H. Schulman, and L. Prince, Kolloid Z., 1 6 9 , 170 (1960).
(7) J. E. L. Bowcott and J. H. Schulman, Z. Elektrochem., 59, 283 (1955).
(8) G. Gillberg, H. Lehtinen, and S. Fr berg, J. Colloid Interface Sci., 33, 40 (1970).
(9) D. O. Shah and R. M. Hamlin, Jr., Science, 1 7 1 , 483 (1971).(10) H. Y. Carr and E. M. Purcell, Phys. Rev., 9 4 , 630 (1954).(11) S. Meiboom and D. Gill, Rev. Sci. Instrum., 29 , 688 (1958).(12) These calculations were done by J. H. C olins and are based on
phase data on these systems which give irrormation on the distribution of alcohol between the continuous phase and the interfacial
film. The exact values of the radius of the water core were calculated by the method of Bowcott and Schulman (ref 7 above), using the same assumptions.
(13) J. W. Emsley, J. Feeney, and L. H. Sutcliffe, “ Hich Resolution Nuclear Magnetic Resonance Spectroscopy,” Vol. 1, Chapter 9, Per- gamon Press, Oxford, 1966.
(14) J. A. Glasel, Nature (London), 2 2 7 , 704 (1970).(15) See ref 13, p 94.(16) J. Clifford and B. A. Pethica, Trans. Faraday Soc., 60, 1483
(1964).(17) W. V. Walter and R. G. Hayes. Biochem. Biophys. Acta. 2 4 9 , 528
(1971).(18) G. Weber and F. W. J. Teale, “ The Proteins,” H. Neurath, Ed.. 2nd
ed, Vol. I ll, Academic Press, New York, N. Y., 1965. p 454.(19) R. Haque, I. J. Tinsley, and D. Schmedding, J. Biol. Chem., 247.
157 (1972).(20) B. G. McFarland and H. M. McConnell, Proc. Nat. Acad. Sci. U. S..
68, 1274 (1971), and references therein.(21) N. J. M. Birdsall, A. G. Lee, Y. K. Levine, and J. C. Metcalfe, J.
Chem. Soc., Chem. Commun.. 1171 (1971).(22) A. G. Lee, N. J. M. Birdsall, Y. K. Levine, and J. C. Metcalfe, Bio
chem. Biophys. Acta, 2 5 5 , 43 (1972).(23) N. J. M. Birdsall, A. G. Lee, Y. K. Levine, and J. C. Metcalfe, Bio
chem. Biophys. Acta.. 2 4 1 ,693 (1971).(24) J. C. Metcalfe, N. J. M. Birdsall, J. Feeney, A. G. Lee, Y. K. Lev
ine, and P. Partington, Nature (London), 233, 199 (1971).(25) A. Abragam, “ The Principles of Nuclear Magnetism,” Oxford Uni
versity Press, London, 1961, Chapter 8.(26) M. P. Sheetz and S. I. Chan, Biochemistry, 11,4573 (1972).(27) S. I. Chan, G. W. Feigenson, and C. H. A. Seiter, Nature (London),
231, 110 (1971).(28) D. E. Woessner and J. R. Zimmerman, J. Phys. Chem., 67, 1590
(1963).(29) R. P. Oertel, personal communication. For a complete description
of this method, see: J. R. Hansen and W. Yellin in ‘Water Structure at the W ater-Polymer Interface,” H. H. G. Jellinek, Ed., Plenum Publishing Corp., New York, N. Y., 1972.
U lt r a s o n ic R e la x a t io n o f A q u e o u s Y ttr iu m N itra te
Hsien-chang Wang and Paul Hem m es*
Department of Chemistry, Rutgers University, Newark, New Jersey 07102 [Received July 9. 1973) Publication costs assisted by The Petroleum Research Fund
The ultrasonic absorption spectra of aqueous yttrium nitrate solutions were investigated and the results were interpreted using a one-step mechanism for the formation of the mononitrate complex. This approach is a radical departure from previous approaches used for lanthanide elements. Both the concentration dependence of the relaxation frequency and of the magnitude of the excess absorption have been reconciled with the proposed mechanism to give a self-consistent interpretation. The resulting value of the rate of complex formation is kt = 1.0 X 10⁸ M - 1 sec-1, which is significantly below the diffusion- controlled limit. The formation constant for the complex has been evaluated solely from kinetic data and is in fair agreement with literature values for related ions.
Normally ion pairs are considered to be of two types, outer sphere and inner sphere. In the former the two ions are held together by electrostatic forces with an intervening solvent molecule while in the latter the ions are in contact. Some years ago, Jprgensen1 considered a third type which he called an anisotropic complex in which the ligand is directly bonded to the metal but the bond distance is so long that it is comparable to a ligand in the outer sphere. Bonding in such a species would be mainly but not totally electrostatic. We have been interested in searching for examples of such complexes. We had to con
sider the problem of defining the expected properties of such species and what elements might form them. One possibility is the addition of a ligand to the face of an octahedral ion with subsequent bond rearrangement to give a seven-coordinate species. One would predict that such a process is most likely with cations with fewer than 3 nd' electrons so that one vacant orbital is available for the incoming ligand. Another slightly different case would involve metal ions with an unsymmetrical solvation shell such that one or more coordinated solvent molecules are located further from the central metal ion than the others.
The Journal of Physical Chemistry. Vol. 78. No. 3. 1974
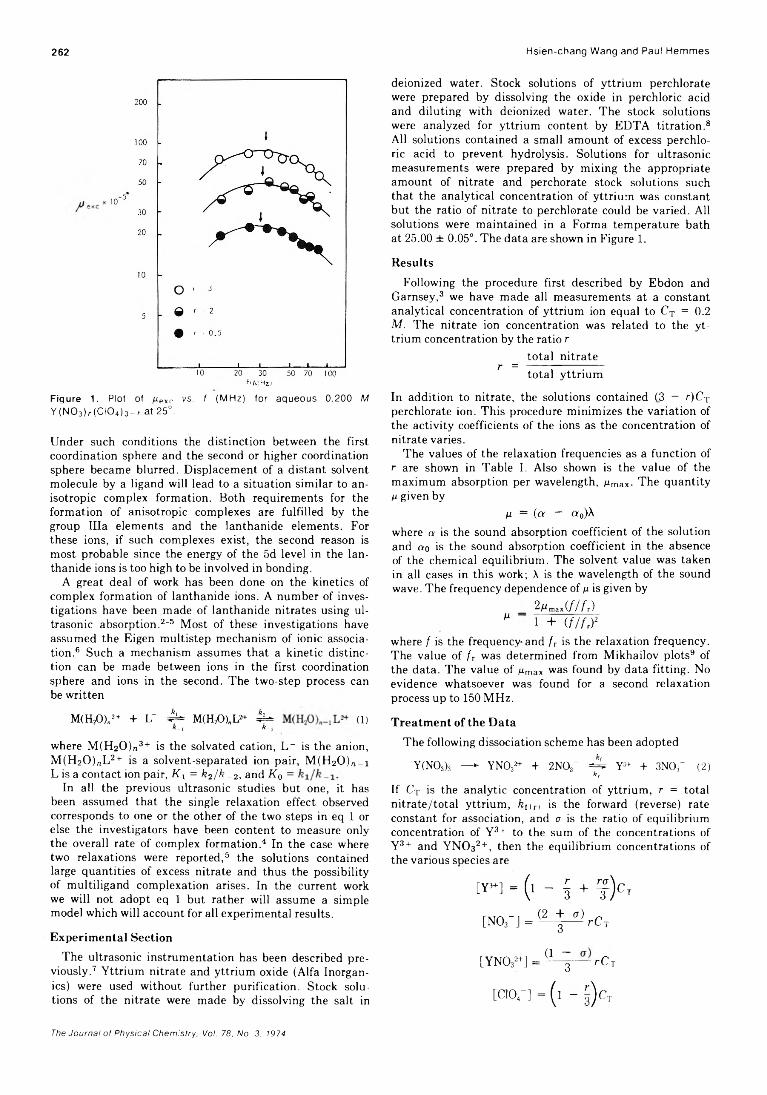
262 Hsien-chang Wang and Paul Hemmes
Fiqure 1. Plot of u exc vs. I (M H z) fo r aqueous 0 .200 M Y ( N 0 3) r ( C I0 4) 3 - r at 25°.
Under such conditions the distinction between the first coordination sphere and the second or higher coordination sphere became blurred. Displacement of a distant solvent molecule by a ligand will lead to a situation similar to anisotropic complex formation. Both requirements for the formation of anisotropic complexes are fulfilled by the group Ilia elements and the lanthanide elements. For these ions, if such complexes exist, the second reason is most probable since the energy of the 5d level in the lanthanide ions is too high to be involved in bonding.
A great deal of work has been done on the kinetics of complex formation of lanthanide ions. A number of investigations have been made of lanthanide nitrates using ultrasonic absorption.2-5 Most of these investigations have assumed the Eigen multistep mechanism of ionic association.6 Such a mechanism assumes that a kinetic distinction can be made between ions in the first coordination sphere and ions in the second. The two-step process can be written
M(H20)„3+ + LT ^ M(H20)„D* 4^ (1)A_i k - 2
where M(H20 )n3+ is the solvated cation, L - is the anion, M(H20 )„L 2+ is a solvent-separated ion pair, M(H20 )ra_i L is a contact ion pair, K 1 = k2/k _2, and K 0 =
In all the previous ultrasonic studies but one, it has been assumed that the single relaxation effect observed corresponds to one or the other of the two steps in eq 1 or else the investigators have been content to measure only the overall rate of complex formation.4 In the case where two relaxations were reported,5 the solutions contained large quantities of excess nitrate and thus the possibility of multiligand complexation arises. In the current work we will not adopt eq 1 but rather will assume a simple model which will account for all experimental results.
Experimental SectionThe ultrasonic instrumentation has been described pre
viously.7 Yttrium nitrate and yttrium oxide (Alfa Inorganics) were used without further purification. Stock solutions of the nitrate were made by dissolving the salt in
deionized water. Stock solutions of yttrium perchlorate were prepared by dissolving the oxide in perchloric acid and diluting with deionized water. The stock solutions were analyzed for yttrium content by EDTA titration.8 All solutions contained a small amount of excess perchloric acid to prevent hydrolysis. Solutions for ultrasonic measurements were prepared by mixing the appropriate amount of nitrate and perchorate stock solutions such that the analytical concentration of yttrium was constant but the ratio of nitrate to perchlorate could be varied. All solutions were maintained in a Forma temperature bath at 25.00 ± 0.05°. The data are shown in Figure 1.
ResultsFollowing the procedure first described by Ebdon and
Garnsey,3 we have made all measurements at a constant analytical concentration of yttrium ion equal to CT = 0.2 M. The nitrate ion concentration was related to the yttrium concentration by the ratio r
total nitrater = ------ ;------- :-----total yttrium
In addition to nitrate, the solutions contained (3 — r)CT perchlorate ion. This procedure minimizes the variation of the activity coefficients of the ions as the concentration of nitrate varies.
The values of the relaxation frequencies as a function of r are shown in Table I. Also shown is the value of the maximum absorption per wavelength, /imax. The quantity /u given by
H = {a ~ a 0)\where a is the sound absorption coefficient of the solution and ao is the sound absorption coefficient in the absence of the chemical equilibrium. The solvent value was taken in all cases in this work; X is the wavelength of the sound wave. The frequency dependence of fx is given by
_ 2 H ^ jf/ fr)M 1 + (f/ fTf
where f is the frequency-and fr is the relaxation frequency. The value of / r was determined from Mikhailov plots9 of the data. The value of /¿max was found by data fitting. No evidence whatsoever was found for a second relaxation process up to 150 MHz.
Treatment of the DataThe following dissociation scheme has been adopted
Y(N03)3 —*■ YNCV+ + 2NQT 4 * Y3+ -I- 3NOs“ (2)k r
If CT is the analytic concentration of yttrium, r = total nitrate/total yttrium, X1(r> is the forward (reverse) rate constant for association, and a is the ratio of equilibrium concentration of Y3+ to the sum of the concentrations of Y3+ and YNC>32+, then the equilibrium concentrations of the various species are
[Y - ] - ( l - § + f ) c T
rxr/-v ~i (2 + a)[N03 ] = -— g— - rC j
[Y W + ] = (1 ~3 ~ rCr
[C104- ] = ( l - 0 c T
The Journal of Physical Chemistry, Vol. 78, No. 3. 1974
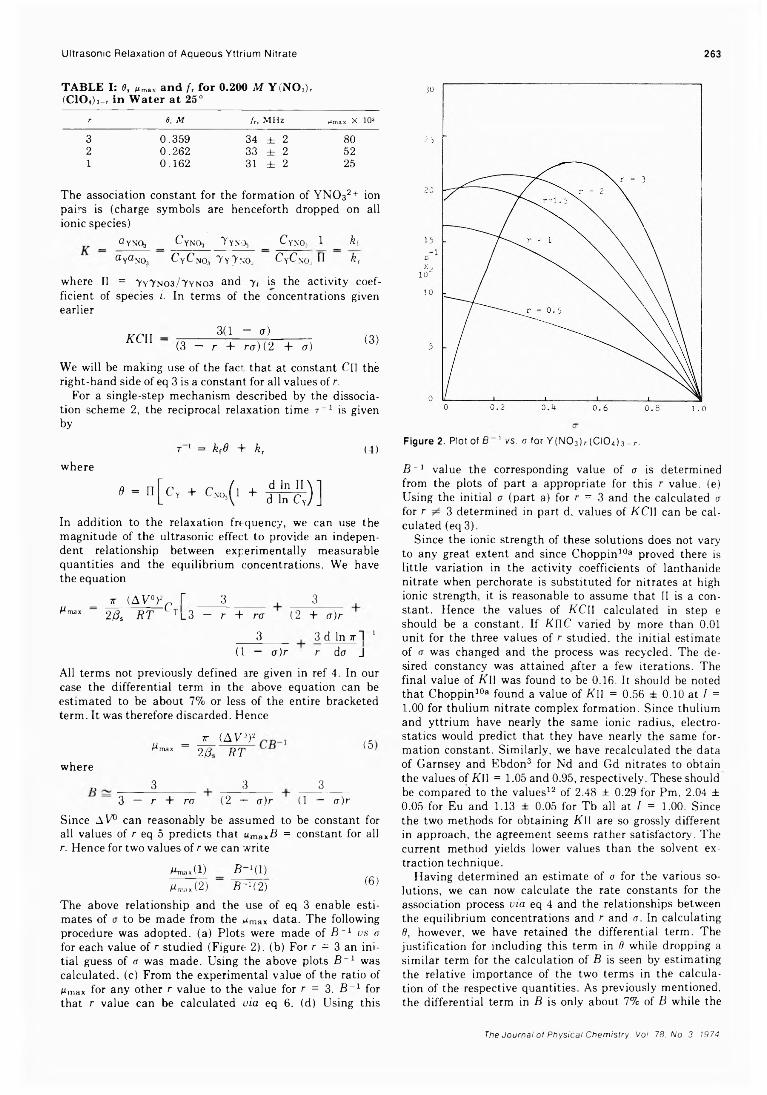
Ultrasonic Relaxation of Aqueous Yttrium Nitrate 263
TABLE I: efC104) 3—r in
t Mmax and fTWater at 25
for 0.200 M Y (N 03)rO
r 9 , M fr, MHz Mmax X 105
3 0.359 34 ± 2 802 0.262 33 ± 2 521 0.162 31 ± 2 25
The association constant for the formation of YNC>32+ ion pairs is (charge symbols are henceforth dropped on all ionic species)
_ a YNOii _ CyNOj Y y.NOj _ C yn'Oj 1 _ kf
a Ya NO? CyCsO, 7 y 7 n0 3 CyC\;Oj II kr
where II = 7y7no3/ 7yno3 and 7, is the activity coefficient of species i. In terms of the concentrations given earlier
k c n _______3(1 — a)_______(3 — r + ra)( 2 + a) (3)
We will be making use of the fact that at constant Cn thé right-hand side of eq 3 is a constant for all values of r.
For a single-step mechanism described by the dissociation scheme 2, the reciprocal relaxation time r _1 is given by
t 1 = k f d + k , (4 )
where
» - n [ c , + c „ o ,( i + £ £ £ ) ]
In addition to the relaxation frequency, we can use the magnitude of the ultrasonic effect to provide an independent relationship between experimentally measurable quantities and the equilibrium concentrations. We have the equation
= 7r (AW>Fr r 3 3Mmax 2/?s RT L t l 3 - r + ra (2 + a)r
3 3 d In ttV 1(1 — cr)r r dcr J
All terms not previously defined are given in ref 4. In our case the differential term in the above equation can be estimated to be about 7% or less of the entire bracketed term. It was therefore discarded. Hence
= ^ ( A V ^ (5r* max 2(3 RT
where„ 3 , 3 , 3
3 - r + ra (2 - a)r (1 - a)rSince AV° can reasonably be assumed to be constant for all values of r eq 5 predicts that umaxB = constant for all r. Hence for two values of r we can write
Mmaxd) B - 'd )Mmox(2) B-H 2) {6)
The above relationship and the use of eq 3 enable estimates of a to be made from the Mmax data. The following procedure was adopted, (a) Plots were made of B _1 us a for each value of r studied (Figure 2). (b) For r = 3 an initial guess of a was made. Using the above plots B ' 1 was calculated, (c) From the experimental value of the ratio of Mmax for any other r value to the value for r = 3, B 1 for that r value can be calculated via eq 6. (d) Using this
Figure 2. P lo t o f B 1 vs. a fo r Y ( N 0 3 ) r ( C I 0 4 ) 3 _ r .
B~J value the corresponding value of a is determined from the plots of part a appropriate for this r value, (e) Using the initial a (part a) for r = 3 and the calculated a for r 3 determined in part d, values of KC\\ can be calculated (eq 3).
Since the ionic strength of these solutions does not vary to any great extent and since Choppin10a proved there is little variation in the activity coefficients of lanthanide nitrate when perchorate is substituted for nitrates at high ionic strength, it is reasonable to assume that II is a constant. Hence the values of KCl\ calculated in step e should be a constant. If KnC varied by more than 0.01 unit for the three values of r studied, the initial estimate of a was changed and the process was recycled. The desired constancy was attained after a few iterations. The final value of K\\ was found to be 0.16. It should be noted that Choppin10a found a value of K\\ = 0.56 ± 0.10 at I =1.00 for thulium nitrate complex formation. Since thulium and yttrium have nearly the same ionic radius, electrostatics would predict that they have nearly the same formation constant. Similarly, we have recalculated the data of Garnsey and Ebdon3 for Nd and Gd nitrates to obtain the values of K4I = 1.05 and 0.95, respectively. These should be compared to the values12 of 2.48 ± 0.29 for Pm. 2.04 ± 0.05 for Eu and 1.13 ± 0.05 for Tb all at I = 1.00. Since the two methods for obtaining KlI are so grossly different in approach, the agreement seems rather satisfactory. The current method yields lower values than the solvent extraction technique.
Having determined an estimate of a for the various solutions, we can now calculate the rate constants for the association process via eq 4 and the relationships between the equilibrium concentrations and r and a. In calculating 6, however, we have retained the differential term. The justification for including this term in 0 while dropping a similar term for the calculation of B is seen by estimating the relative importance of the two terms in the calculation of the respective quantities. As previously mentioned, the differential term in B is only about 7% of B while the
The Journal of Physical Chemistry. Vo1. 78. No. 3. 1974
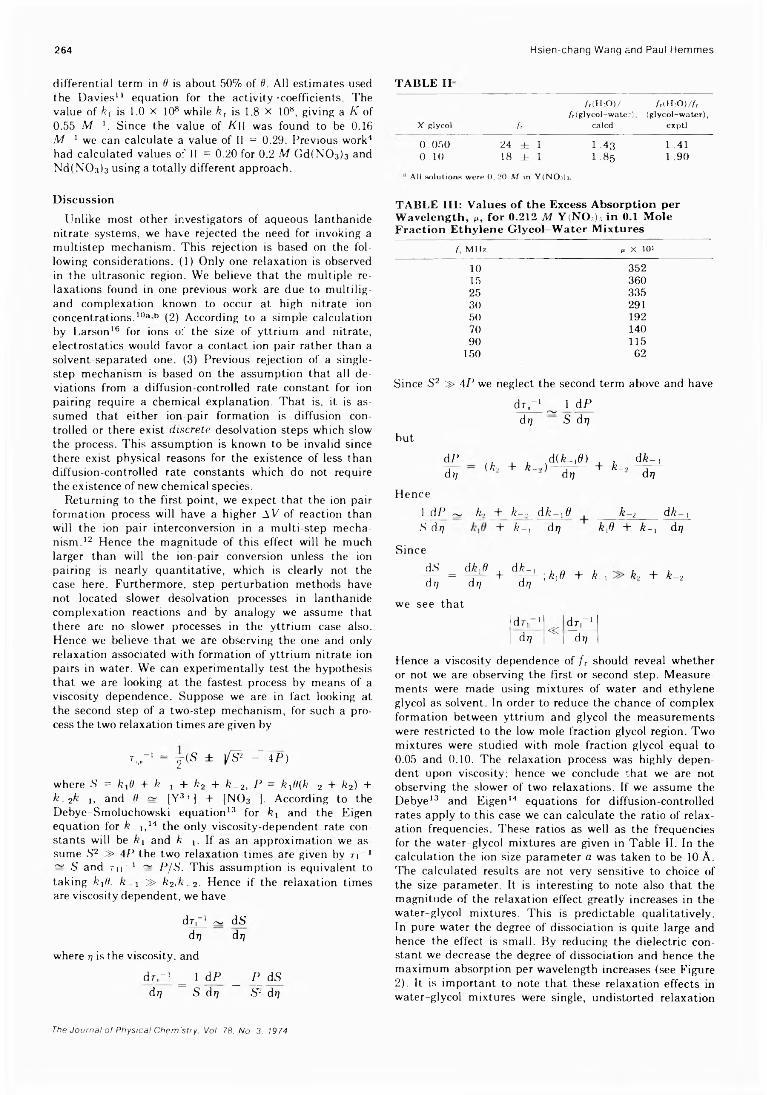
264 Hsien-chang Wang and Paul Hemmes
differential term in 6 is about 50% of f). All estimates used the Davies11 equation for the activity ■coefficients. The value of kf is 1.0 x 10⁸ while kr is 1.8 X 10⁸, giving a K of 0.55 M l. Since the value of K\\ was found to be 0.16 M ~x we can calculate a value of II = 0.29. Previous work4 had calculated values of II = 0.20 for 0.2 M Gd(N0 3)3 and Nd(NC>3)3 using a totally different approach.
TABLE II-/ r( H Æ » / f r ( H i O ) / f r
/r (glycol—water), (glycol—water), X glycol /r calcd exptl0.050 24 ± 1 1.43 1.410.10 18 ± 1 1.85 1.90
All solutions w ere 0 .2 0 M in Y(N Os)3.
DiscussionUnlike most other investigators of aqueous lanthanide
nitrate systems, we have rejected the need for invoking a multistep mechanism. This rejection is based on the following considerations. (1) Only one relaxation is observed in the ultrasonic region. We believe that the multiple relaxations found in one previous work are due to multiligand complexation known to occur at high nitrate ion concentrations.10ab (2) According to a simple calculation by Larson16 for ions of the size of yttrium and nitrate, electrostatics would favor a contact ion pair rather than a solvent-separated one. (3) Previous rejection of a single- step mechanism is based on the assumption that all deviations from a diffusion-controlled rate constant for ion pairing require a chemical explanation. That is, it is assumed that either ion-pair formation is diffusion controlled or there exist discrete desolvation steps which slow the process. This assumption is known to be invalid since there exist physical reasons for the existence of less than diffusion-controlled rate constants which do not require the existence of new chemical species.
Returning to the first point, we expect that the ion-pair formation process will have a higher SV of reaction than will the ion pair interconversion in a multi-step mechanism.12 Hence the magnitude of this effect will he much larger than will the ion-pair conversion unless the ion pairing is nearly quantitative, which is clearly not the case here. Furthermore, step perturbation methods have not located slower desolvation processes in lanthanide complexation reactions and by analogy we assume that there are no slower processes in the yttrium case also. Hence we believe that we are observing the one and only relaxation associated with formation of yttrium nitrate ion pairs in water. We can experimentally test the hypothesis that we are looking at the fastest process by means of a viscosity dependence. Suppose we are in fact looking at the second step of a two-step mechanism, for such a process the two relaxation times are given by
r,,,,-1 = j ( S ± /S * -~ 4 P )
where .S' = kxt> + k j + k2 + k 2, P = k\0(k 2 + k2) + k _ 2k !, and H ~ [Y3+] + [N03 ]. According to the Debye-Smoluchowski equation13 for kx and the Eigen equation for A_i,14 the only viscosity-dependent rate constants will be /?! and A: .1. If as an approximation we assume S2 3> 4P the two relaxation times are given by n 1 ~ S and Tii-1 ~ P/S. This assumption is equivalent to taking kjII, k j » k2,k . 2- Hence if the relaxation times are viscosity dependent, we have
d rr1 ~ dSdr; d 7 7
where 7; is the viscosity, and
dr,-1 = l cLP _ P_ dSdr; S dr] S2 dr;
TABLE III: Values of the Excess Absorption per Wavelength, m, for 0.212 M Y(NOj).i in 0.1 Mole Fraction Ethylene Glycol Water Mixtures
f, MHz n X 10510 35215 36025 33530 29150 19270 14090 115
150 62
Since S2 » 4P we neglect the second term above and have
d r,r ‘ ^ 1 dP dr; ~~ S dr]
butdPdr, (k-, + k->)
d(A_,0)dr; + A-,
dk~ ] dr;
Hence1 dP ~ k, + k—> dk-^tì k-2 dk - 1,S dr; + A-, dr; kfl + A-, dr;
SincedS dk,8 d A-, „ , , ,y— = , + - ,— ; ktd + k-i k2 + k- 2dr; dr] dr;
we see thatldr„ 1 d r r 11 àrj « —7—1 dr;
Hence a viscosity dependence of / r should reveal whether or not we are observing the first or second step. Measurements were made using mixtures of water and ethylene glycol as solvent. In order to reduce the chance of complex formation between yttrium and glycol the measurements were restricted to the low mole fraction glycol region. Two mixtures were studied with mole fraction glycol equal to 0.05 and 0.10. The relaxation process was highly dependent upon viscosity; hence we conclude rhat we are not observing the slower of two relaxations. If we assume the Debye13 and Eigen14 equations for diffusion-controlled rates apply to this case we can calculate the ratio of relaxation frequencies. These ratios as well as the frequencies for the water-glycol mixtures are given in Table II. In the calculation the ion size parameter a was taken to be 10 A. The calculated results are not very sensitive to choice of the size parameter. It is interesting to note also that the magnitude of the relaxation effect greatly increases in the water-glycol mixtures. This is predictable qualitatively. In pure water the degree of dissociation is quite large and hence the effect is small. By reducing the dielectric constant we decrease the degree of dissociation and hence the maximum absorption per wavelength increases (see Figure2). It is important to note that these relaxation effects in water-glycol mixtures were single, undistorted relaxation
The Journal of Physical Chemistry. Voi. 78. No. 3. 1974
Ultrasonic Relaxation of Aqueous Yttrium Nitrate 265
processes out to greater than ait = 7. In our calculation the limiting value of a/f2 was taken to be the solvent values, taken or interpolated from values in the literature.15 Actual data for a glycol experiment are given in Table III.
As further confirmation of the fact that we are observing the fastest step, we measured the temperature dependence of / r. When aqueous 0.20 M solutions of Y(NC>3)3 are heated to 35° and the ultrasonic absorption spectrum measured, it is found that the relaxation frequency is within 1 MHz of its value at 2£°. Such a small temperature dependence is in agreement with the predicted temperature dependence of a diffusion-controlled process. Desolvation processes will have much greater temperature dependences.15
Most of the above arguments have invoked the Debye and Eigen equations for diffusion-controlled rates. Yet k( and kr are both at least one order of magnitude lower than these equations predict. Indeed kt is at least two orders of magnitude lower than the Debye equation predicts. From the preceding experiments it seems as if the functional form of these equations is correct but the magnitude is less than calculated. Such behavior has been shown by Schmitz and Shurr1718 to occur whenever there are orientational constraints on the association process. Such steric effect can reduce the experimental rate constant by many orders of magnitude, which is far more than was previously expected. It is evident that steric effects should be found for nitrate ion which cannot react if it approaches the metal along the threefold axis. Not so evident is the possible steric limitations for yttrium. The structure of solid Nd(Br03)3-9H20 has been determined.19 The bond distance between Nd and H20 is not the same and hence if this ion exists as such in solution the rates of H20 exchange may be different for the different positions, the more distant presumably exchanging faster. Unlike the case of copper(II), this faster exchanging site cannot simply interconvert to a site with shorter bond distance. Hence this ion may have prefered sites for substitution. Hydrated yttrium ion is expected to be similar in structure or, if different, it is expected to have a smaller hydration number and perhaps a less symmetrical structure. Hence yttrium ion may show steric constraints on substitution reactions. Thus the observed magnitude of kf and kr may well be due to the steric effects.
In summary, we have shown that measuring the relaxation frequency as a function of nitrate ion concentration and combining this with the magnitude of the excess absorptions leads to values of K II in good agreement with
independent results for similar lanthanide systems. We have assumed that there is only one step in the association process. The only problem with this approach is that the resulting rate constants are much lower than the diffusion-controlled limit. Steric effects may account for this discrepancy.20 With regard to this point, it is useful to note that, when treated as single-step processes, the forward rates of formation of lanthanide complexes of oxalate, mu- rexide, and anthranilate give still lower values of kf (in the range 1-8 X 10⁸ M 1 sec-1).4
Acknowledgments. This work is part of the thesis of Hsien-chang Wang tc be submitted to the faculty of Rutgers University in partial fulfillment of the requirements of doctor of philosopny in chemistry. Acknowledgment is made to the donors of the Petroleum Research Fund, administered by the American Chemical Society, for the support of this research. The authors also wish to thank the research council of Rutgers University for a grant which provided funds for part of the instrumentation used. H. Wang gratefully acknowledges the support of a Biomedical Fellowship from Rutgers University.
References and Notes(1) C. K. Jorgensen, Proc. Symp. Coord. Chem.. (1965).(2) D. P. Fay, D. Litchinsky, and N. Purdie. J. Phys. Chem.. 73, 544
(1969) .(3) R. Garnsey and D. W. Ebdon, J. Amer. Chem. Soc.. 91, 50 (1969).(4) G. S. Darbari, F. Fittipaldi, S. Pétrucci, and P. Hemmes, Acustica.
25, 125 (1971).(5) H. B. Silver, N. Sche nin, G. Atkinson, and J. J. Grecsek, J. Chem.
Soc., Faraday Trans. 2. 68, 1200 (1972).(6) M. Eigen and L DeMaeyer in "Investigation of Rates and Mecha
nism of Reaction," Vol. 8, Part II, A. Weissberger Ed.. Wiley. New York, N. Y „ 1963.
(7) H. C. Wang and P. Hemmes, submitted for publication.(8) A. S. Fritz. R. T. Oliver, and D. J. Pietrzyk, Anal. Chem.. 30, 1111
(1958).(9) I. G. Mikhailov, Dokl. Akad. Nauk U.S.S.R.. 89, 991 (1953).
(10) (a) G. R. Choppin and W. F. Stazik, Inorg. Chem.. 4, 1250 (1965); (b) J. Knoeck 15th Annual Report on Research of Petroleum Research Fund, American Chemical Society. Washington. D. C., 1970.
(11) C. W. Davies, “ Ionic Association," Butterworths. London. 1962.(12) P. Hemmes, J. Phys. Chem.. 76, 895 (1972).(13) P. Debye, Trans. Elecrrochem. Soc., 82, 265 (1942).(14) M. Eigen, Z. Phys. Chem. (Frankfurt am Main), 1, 176 (1954).(15) F. Fittipaldi, P. Hemmes, and S. Pétrucci, Acustica, 23, 322
(1970) .(16) J. W. Larson, J. Phys. Chem., 74, 3392 (1970).(17) K. S. Schmitz and J. M. Schurr, J. Phys. Chem., 76. 534 (1972).(18) J. M. Schurr, Blophys. J., 10, 717 (1970).(19) L. Helmhotz, J. Amer. Chem. Soc., 61, 1544 (1939).(20) Note Added in Proof. Recent statistical mechanical calculations
for ion association processes indicate that the Debye equation may overestimate the forward rate constant. S. Pétrucci, private communication.
The Journal of Physical Chemistry. Voi. 78. No. 3. 1974
266 S. L. Bennett, S.-S. Lin, and P. W. Gilles
H ig h -T e m p e r a t u r e V a p o r iz a t io n o f T e r n a r y S y s t e m s . I. M a s s S p e c t r o m e t r y o f O x y g e n - R i c h V a n a d i u m - T u n g s t e n - O x y g e n S p e c i e s
Stephen L. Bennett, Sin-Shong Lin, and Paul W. Gilles*
Department of Chemistry, University of Kansas, Lawrence, Kansas 66044 (Received July 25, 1973) Publication costs assisted by the U. S. Atomic Energy Commission
Mass analysis of the gases produced by the high-temperature vaporization of mixtures of V2O5 and WO3 revealed the production in the electron impact source of more than 60 ions, many previously undiscovered. From measurements of relative ion intensities, appearance potentials, and apparent temperature coefficients, and from the assignment of 15 metastable decomposition reactions, 17 neutral species, O2, V0 2, V4O10, V60 15, VW20 8, VW3O11, VW4O14, V2W2O10, V2W 30i4, V3WO10, V3W20 13, V4W20 16, W 206, W3O9, W4O12, W5O15, and W 6Oi8 have been identified, nine of them including W 60 18 for the first time. All but V2W 2Oio are fully oxidized; V2W3O14 and V4W2O16 may be considered as compounds of V20 5 and WO3, the others of V0 2, V20 5, and W 0 3. The fully oxidized samples were chosen to enhance the concentration of ternary species. Vaporization in the temperature range 1255- 1465°K caused rapid loss of oxygen with attendant reduction of the sample and thus rendered thermodynamic measurements impossible. High molecular weight vanadium-rich species quickly disappeared. Most of the data were obtained from thè somewhat reduced VO2-WO2 solid solution region of the ternary system. Metastable decomposition reactions of doubly charged ions appear to be the first observed in high-temperature studies.
IntroductionDuring mass spectrometric studies of the vaporization
behavior of the ternary titanium-vanadium-oxygen system, Lin1 observed a wide variety of ternary species. They arose not only from the samples themselves but also from reactions with the tungsten crucible. They were especially abundant over the most oxygen-rich sample.
The purpose of the present work was to clarify the chemistry of the complex ternary gaseous species by studying a chemically simpler system. We here report the results of some vaporization studies of the ternary vanadium-tungsten-oxygen system. Because the ternary species are abundant in the environment of high oxygen potential, we studied the vaporization of samples that were initially mixtures of V2O5 and WO3. Parent and fragment ions have been identified from relative ion intensities, appearance potentials, temperature coefficients, and metastable decomposition reactions.
Berkowitz, Chupka, and Inghram2 observed the presence of complex gaseous molecules over V2O5 solid contained in a molybdenum crucible with a platinum liner. The ionic species V 6 O i 4 + , V 6 O i 2 + , V 4 O i o + , V 4 O 9 N
V 40 8 + , V 30 6 + , V 2 0 4 + , V 2 0 3 + , and shutterable 0 2 + were detected. They concluded that the vapor contained V 60 i 4 ( g ) , V 60 1 2 ( g ) , V 4 O i o ( g ) , V 4 0 8 ( g ) , and V 20 4 ( g ) . The ions V409+ , V3O6+, and V203+ were considered to be fragments. Initially (temperature unspecified) the predominant gaseous species appeared to be V 4 O 1 0 and V 40 8 , but as the run proceeded the ion currents corresponding to the molecules V 6 O 1 4 , V 6 O i 2 , and V 2 O 4 rose in intensity but quickly disappeared relative to V 4 O 1 0 and V408. Even these latter two ion intensities, however, decreased with time. They were unable to obtain thermodynamic data due to the rapid change in solid composition and vapor pressure with time. No V 20 5 " was ever observed, indicating that electron impact fragmentation does not favor this configuration. Presumably, the V4O10 molecule has the
same stable, highly symmetrical structure as the P4O10 molecule and considerable energy would be required to break sufficient bonds to produce V2O5*. An oxygen atom, however, could be easily removed from such a structure to produce the V409+ fragment.
Farber, Uy, and Srivastava3 have found the same general behavior. Because the ion intensities of V40io+ and V40 8+ were observed to be stable only during the initial minutes of heating, several experiments were performed with new samples of V2O5, at different initial temperature (1003- 1205°K) in order to obtain the heats of reaction for 2 V 20 5( s ) = V4O10(g) and 2V20 5(s) = V408(g) + 0 2(g). The appearance potentials of V40io+ and V40 8+ were found to be 12 ± 1 and 13 ± 1 eV, respectively.
Frantseva and Seminov4 and Farber, e t a l.,3 found that the dioxide decomposed rapidly to V2C>3(s), with the evolution of V0 2(g) and 0 2(g). Only the ions V+, VO+ and V0 2+ were detected. From the vaporization of V203(s), Frantseva and Semenov and Farber, e t a l., have reported the heats of formation and dissociation energies of VO(g) and V0 2(g).
Ackermann and Rauh5 have studied the vaporization behavior of initially stoichiometric tungsten trioxide over the temperature range 1320- 1480°K by mass effusion and mass spectrometric techniques. They established that W 02.96(s) is the congruently vaporizing composition up to 1480°K under the vacuum conditions (10-6 to 10 7 Torr) employed.
The ions WO+, W 0 2, W 0 3+, W 20 5+, W20 6+, W 30 8+, W3O9+, W 4On+, W4O12"1, and WsOi5+ were observed at electron energies greater than 40 eV. Below 30 eV, the ions WO+ , W 0 2+, and W 03+ disappeared and were undoubtedly dissociation fragments, while the ions W 20 5+ , W4OU+, and W5O15+ were detectable, but were several orders of magnitude less intense than W20 6 + , W 308+, W3O9N and W40i2+ . While a portion of the W 206+ and W30 8+ ion currents could have resulted from the dissocia
The Journal of Physical Chemistry. Voi. 78. No. 3. 1974
High-Temperature Vaporization of Ternary Systems 267
tive fragmentation of the major species WaOgjg), the principal species above all tungsten oxides appeared to be W2O6, W3O8, W3O9, and W4O12.
On heating W 03.ooo(s) at constant temperature below 1480°K they found the ion currents, as measured with a Bendix time-of-flight mass spectrometer, to vary until the composition of the solid had reached W02.96(s). Indeed, the W3O9"*" intensity decreased by almost a factor of 3, while the W30 8+ intensity increased slightly, as the composition approached WO2.96. Such behavior demonstrated that a large fraction of the W30s+ current results from the primary ionization of W30 8(g); that is, all the W30 8! is not a dissociation fragment of WsOglg), for otherwise the W30 8+ and W309+ should have shown parallel behavior. Moreover, the congruency of evaporation of WC>2.96(s) demands the existence of a species having an oxygen-to- tungsten ratio of less than 2.96. At temperatures greater than approximately 1550°K the evaporation of the composition WO2.96 produced lower oxides and ultimately tungsten metal.
Kazenas and Tsvetkov6 have essentially repeated, and are in agreement with, the work of Ackermann and Rauh on the thermodynamic properties of the gaseous species in equilibrium with the congruentlv vaporizing phase. From electron diffraction studies, Hargittai, et al. , 7 have proposed a six-membered ring structure for gaseous W3O9.
Experimental SectionInstruments. The 12-in., 60° Nuclide mass spectrome
ter, its ion detection equipment, and crucible heating arrangement have been described by Edwards, Franzen, and Gilles.8 Slit widths were: source, 0.010 and collector, 0.012 in. Resolving power was about 600. The ion accelerating voltage was maintained constant at about 4750 V except for minor variations during ion focusing and except when ions of mass greater than 715 amu were being investigated. The potentials on the repeller plates were near zero, and the potentials on the ion focusing plates were adjusted to produce maximum ion intensity. The potentials on the plates below the ionization chamber, which include the suppressor and the plate carrying the trap, were kept at the same potential as that of the ionization chamber except during investigation of the effect of these voltages on ion signals.
Four filaments and four radiation shields were used. Temperatures were measured with a Leeds and Northrup Model 8622C disappearing filament optical pyrometer (no.2) by viewing a blackbody hole (l/r = 8) in the bottom of the tungsten crucible through a glass window (A) in the vacuum chamber. Window corrections were made in the usual manner. The multiplier gain was constant during all experiments and was typically 2.0 X 10⁵ as determined on W30 9+ (m /e = 696) at 4000 V multiplier voltage.
Samples. The samples were composed of a mixture of WO3 and V2O5 in a 2:1 molar ratio. The W 03 was prepared by heating tungstic acid H2WO4 (Baker Analyzed Reagent Grade, Lot. No. 32574) In a porcelain crucible for 4 days at 700° in a muffle furnace. The V2O5 was prepared by thermal decomposition of finely ground ammonium m-vanadate, NH4V 0 3 (Fisher Reagent Grade, Lot No. 743299), in a porcelain crucible in a muffle furnace for 4 days at 650°. Debye-Scherrer powder photographs confirmed the desired products.
Crucible and Liners. The samples were contained in platinum liners in an outgassed (2400°K, 3 hr, 10-6 Torr) tungsten crucible (no. 109), about 0.75 X 1.25 in. In order
to increase the amount of information that could be obtained during any one experiment, long channels for the liners were fabricated from platinum rod in order to reduce the transmission probability, and larger quantities of sample were introduced into the liners by first compressing the mixed oxides into pellets and then breaking them into small pieces.
Separate liners were made for each experiment and were fabricated from 0.005-in. platinum sheet. Channels were made by heating and gently swaging a platinum rod about % x V8 in. to the top of the liner, and then drilling with a 0.025-in. diameter drill. After the introduction of the sample, the bottom, also shaped from 0.005-in. platinum, was spot-welded to the walls of the liner. The resulting liner, sealed except through the channel, was then inserted into the %-in. i.d. tungsten crucible having an Vs-in. orifice in its lid, so that the platinum channel extended into the tungsten orifice but terminated at least %6 in. below the top surface of the crucible lid. Channel areas were measured with a projection microscope. The channel lengths were obtained with a micrometer.
Procedure. Samples were gradually heated, and positive ions were mass analyzed. Shutter profiles, mass scans, ionization efficiency curves, relative ion intensities, and temperature coefficients of ion intensities were all measured.
For the identification of ions, the counting of mass peaks was employed for masses less than 300 amu, and for higher masses, the mass was calculated from a knowledge of the magnetic field. A moveable shutter situated between the crucible and the ion source enabled background species to be distinguished from those originating from the platinum liner. Shutter profiles were obtained on all species in order to ascertain whether the signals were originating from molecules leaving the channel, or from the tungsten crucible, or from the tantalum shield cans. Isotope distributions as well as masses were used to identify the ions uniquely. The effects of the suppressor, trap voltage, emission current, and electron voltage were checked on all ion signals.
Ionization efficiency curves were determined for species originating in the platinum liner and for Hg+. Appearance potentials were determined relative to Hg~ (10.4 eV) by the vanishing current method. By varying the temperature or by selecting the appropriate Hg+ isotope the intensity of the subject ion was made equal to the intensity of Hg+ at 70 eV. Further, all appearance potentials were obtained at the same emission current (0.12 mA) and under the same focusing conditions. For masses greater than 715 amu, a lower ion acceleration voltage was employed, and appearance potentials were determined relative to Hg+ under these same conditions. All measurements were made in duplicate, and at least one appearance potential was repeated with each new sample.
Metastable ions resulting from fragmentation of the type
A"' —>- + C q' - q* (l)where <71 and (72 are the charges, were distinguished by their diffuse appearance and by the fact that they appear at nonintegral m/e values. If the fragmentation occurs after acceleration is complete but before the parent ion enters the magnetic field, then the m/e value, m*, at which the metastable ion appears in the mass spectrum is given by
m* = (mB2/m A)(q ,/g 22) (2)
The Journal of Physical Chemistry. Voi. 78, No. 3. 1974
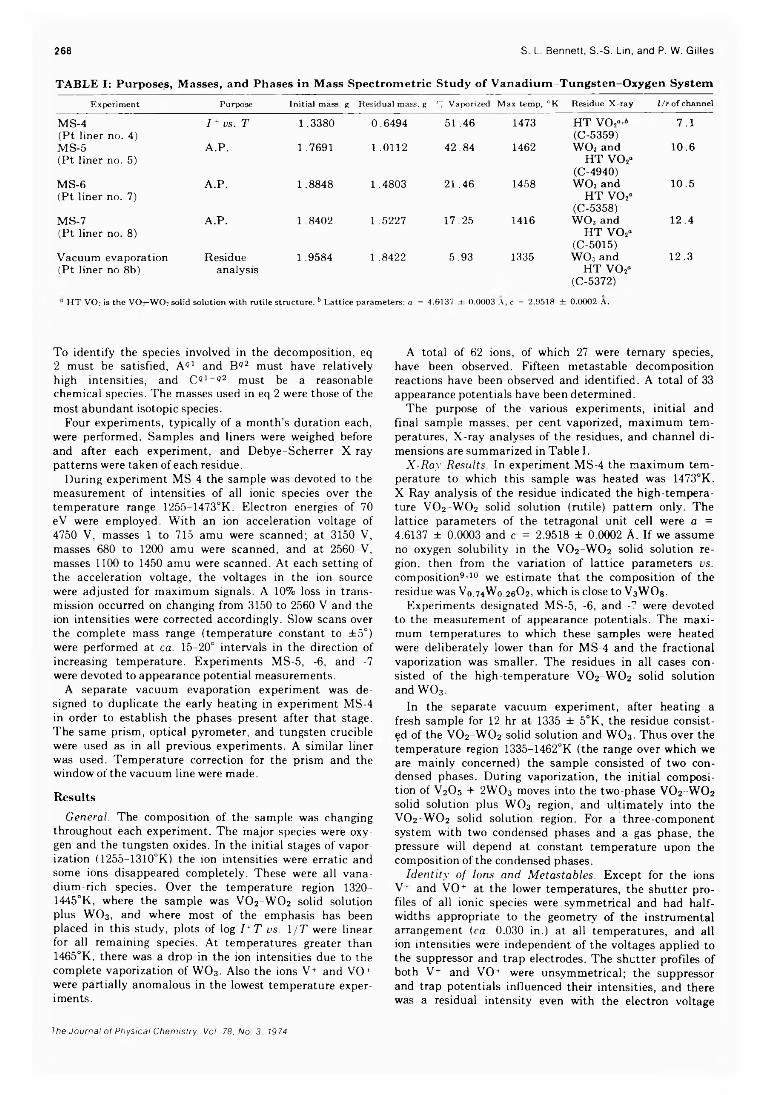
268 S. L. Bennett, S.-S. Lin, and P. W. Gilles
T A B L E I : Purposes, Masses, and Phases in Mass S p e c tro m é trie S tu d y o f V a n a d iu m -T u n g s te n -O x y g e n System
E xperim ent Purpose Initia l mass, g R esidua l m ass, g % V aporized M ax tem p, 0K R esidue X -ra y l/r o f channel
MS-4(Pt liner no. 4)
I + v s . T 1.3380 0.6494 51.46 1473 HT VCX“ 6 (C-5359)
7.1
MS-5(Pt liner no. 5)
A.P. 1.7691 1.0112 42.84 1462 WO, and HT V 02°
(C-4940)
10.6
MS-6(Pt liner no. 7)
A.P. 1.8848 1.4803 21.46 1458 WO3 and HT V02“
(C-5358)
10.5
MS-7(Pt liner no. 8)
A.P. 1.8402 1.5227 17.25 1416 WO, and HT V02“
(C-5015)
12.4
Vacuum evaporation (Pt liner no 8b)
Residueanalysis
1.9584 1.8422 5.93 1335 WO3 and HT VO2«
(C-5372)
12.3
H T V O ; is the V O —-W O ; solid solution w ith rutile structure. f' L attice param eters: a = 4.&137 -i 0 .0003 A , c = 2.9518 ± 0.0002 A.
To identify the species involved in the decomposition, eq 2 must be satisfied, A«1 and B«2 must have relatively high intensities, and Cg l ~ Q2 must be a reasonable chemical species. The masses used in eq 2 were those of the most abundant isotopic species.
Four experiments, typically of a month’s duration each, were performed. Samples and liners were weighed before and after each experiment, and Debye-Scherrer X-ray patterns were taken of each residue.
During experiment MS-4 the sample was devoted to the measurement of intensities of all ionic species over the temperature range 1255-1473°K. Electron energies of 70 eV were employed. With an ion acceleration voltage of 4750 V, masses 1 to 715 amu were scanned; at 3150 V, masses 680 to 1200 amu were scanned, and at 2560 V, masses 1100 to 1450 amu were scanned. At each setting of the acceleration voltage, the voltages in the ion source were adjusted for maximum signals. A 10% loss in transmission occurred on changing from 3150 to 2560 V and the ion intensities were corrected accordingly. Slow scans over the complete mass range (temperature constant to ±5°) were performed at ca. 15-20° intervals in the direction of increasing temperature. Experiments MS-5, -6, and -7 were devoted to appearance potential measurements.
A separate vacuum evaporation experiment was designed to duplicate the early heating in experiment MS-4 in order to establish the phases present after that stage. The same prism, optical pyrometer, and tungsten crucible were used as in all previous experiments. A similar liner was used. Temperature correction for the prism and the window of the vacuum line were made.
ResultsGeneral. The composition of the sample was changing
throughout each experiment. The major species were oxygen and the tungsten oxides. In the initial stages of vaporization (1255-1310°K) the ion intensities were erratic and some ions disappeared completely. These were all vanadium-rich species. Over the temperature region 1320- 1445°K, where the sample was VO2-W O2 solid solution plus WO3, and where most of the emphasis has been placed in this study, plots of log I+T vs. 1/T were linear for all remaining species. At temperatures greater than 1465°K, there was a drop in the ion intensities due to the complete vaporization of W 03. Also the ions V+ and VO+ were partially anomalous in the lowest temperature experiments.
A total of 62 ions, of which 27 were ternary species, have been observed. Fifteen metastable decomposition reactions have been observed and identified. A total of 33 appearance potentials have been determined.
The purpose of the various experiments, initial and final sample masses, per cent vaporized, maximum temperatures, X-ray analyses of the residues, and channel dimensions are summarized in Table I.
X-Ray Results. In experiment MS-4 the maximum temperature to which this sample was heated was 1473°K. X-Ray analysis of the residue indicated the high-temperature V 02-W 0 2 solid solution (rutile) pattern only. The lattice parameters of the tetragonal unit cell were a = 4.6137 ± 0.0003 and c = 2.9518 ± 0.0002 A. If we assume no oxygen solubility in the VO2-W O2 solid solution region, then from the variation of lattice parameters vs. composition910 we estimate that the composition of the residue was V0.74W0.26O2, which is close to V3WO8.
Experiments designated MS-5, -6, and -7 were devoted to the measurement of appearance potentials. The maximum temperatures to which these samples were heated were deliberately lower than for MS-4 and the fractional vaporization was smaller. The residues in all cases consisted of the high-temperature VO2-W O2 solid solution and WO3.
In the separate vacuum experiment, after heating a fresh sample for 12 hr at 1335 ± 5°K, the residue consisted of the VO2-W O2 solid solution and WO3. Thus over the temperature region 1335-1462°K (the range over which we are mainly concerned) the sample consisted of two condensed phases. During vaporization, the initial composition of V2O5 + 2WO3 moves into the two-phase VO2-WO2 solid solution plus W 03 region, and ultimately into the VO2-W O2 solid solution region. For a three-component system with two condensed phases and a gas phase, the pressure will depend at constant temperature upon the composition of the condensed phases.
Identity of Ions and Metastables. Except for the ions V ' and VO+ at the lower temperatures, the shutter profiles of all ionic species were symmetrical and had halfwidths appropriate to the geometry of the instrumental arrangement (ca. 0.030 in.) at all temperatures, and all ion intensities were independent of the voltages applied to the suppressor and trap electrodes. The shutter profiles of both V+ and VCD were unsymmetrical; the suppressor and trap potentials influenced their intensities, and there was a residual intensity even wdth the electron voltage
The Journal of Physical Chemistry. Vol. 78. No. 3. 1974
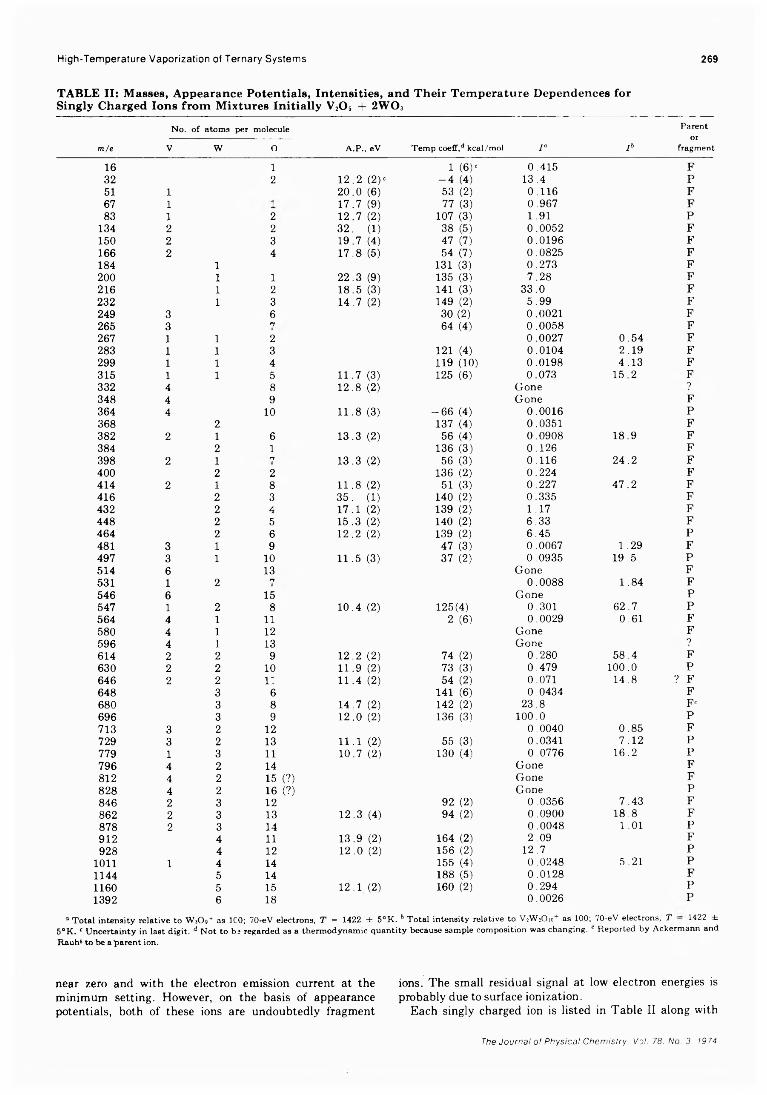
High-Temperature Vaporization of Ternary Systems 269
TABLE II: Masses, Appearance Potentials, Intensities, and Their Temperature Dependences for Singly Charged Ions from Mixtures Initially V20 5 + 2W03
m/eNo.
Vof atoms
Wper molecule
O A.P., eV Temp coeff,d kcal/mol IQ Ib
Parentor
fragment16 l 1 (6) ' 0.415 F32 2 12.2 (2)c - 4 (4) 13.4 P51 1 20.0 (6) 53 (2) 0.116 F67 1 17.7 (9) 77 (3) 0.967 F83 1 2 12.7 (2) 107 (3) 1.91 P
134 2 2 32. (1) 38 (5) 0.0052 F150 2 3 19.7 (4) 47 (7) 0.0196 F166 2 4 17.8 (5) 54 (7) 0.0825 F184 l 131 (3) 0.273 F200 l 1 22.3 (9) 135 (3) 7.28 F216 l 2 18.5 (3) 141 (3) 33.0 F232 l 3 14.7 (2) 149 (2) 5.99 F249 3 6 30 (2) 0.0021 F265 3 1 64 (4) 0.0058 F267 1 l 2 0.0027 0.54 F283 1 l 3 121 (4) 0.0104 2.19 F299 1 l 4 119 (10) 0.0198 4.13 F315 1 l 5 11.7 (3) 125 (6) 0.073 15.2 F332 4 8 12.8 (2) Gone ?348 4 9 Gone F364 4 10 11.8 (3) -6 6 (4) 0.0016 P368 2 137 (4) 0.0351 F382 2 1 6 13.3 (2) 56 (4) 0.0908 18.9 F384 2 1 136 (3) 0.126 F398 2 1 n 13.3 (2) 56 (3) 0.116 24.2 F400 2 2 136 (2) 0.224 F414 2 1 8 11.8 (2) 51 (3) 0.227 47.2 F416 2 3 35. (1) 140 (2) 0.335 F432 2 4 17.1 (2) 139 (2) 1.17 F448 2 5 15.3 (2) 140 (2) 6.33 F464 2 6 12.2 (2) 139 (2) 6.45 P481 3 1 9 47 (3) 0.0067 1.29 F497 3 1 10 11.5 (3) 37 (2) 0.0935 19.5 P514 6 13 Gone F531 1 2 n 0.0088 1.84 F546 6 15 Gone P547 1 2 8 10.4 (2) 125(4) 0.301 62.7 P564 4 1 11 2 (6) 0.0029 0.61 F580 4 1 12 Gone F596 4 1 13 Gone ?614 2 2 9 12.2 (2) 74 (2) 0.280 58.4 F630 2 2 10 11.9 (2) 73 (3) 0.479 100.0 P646 2 2 11 11.4 (2) 54 (2) 0.071 14.8 ? F648 3 6 141 (6) 0.0434 F680 3 8 14.7 (2) 142 (2) 23.8 pe696 3 9 12.0 (2) 136 (3) 100.0 P713 3 2 12 0.0040 0.85 F729 3 2 13 11.1 (2) 55 (3) 0.0341 7.12 P779 1 3 11 10.7 (2) 130 (4) 0.0776 16.2 P796 4 2 14 Gone F812 4 2 15 (?) Gone F828 4 2 16 (?) Gone P846 2 3 12 92 (2) 0.0356 7.43 F862 2 3 13 12.3 (4) 94 (2) 0.0900 18.8 F878 2 3 14 0.0048 1.01 P912 4 11 13.9 (2) 164 (2) 2.09 F928 4 12 12.0 (2) 156 (2) 12.7 P
1011 1 4 14 155 (4) 0.0248 5.21 P1144 5 14 188 (5) 0.0128 F1160 5 15 12.1 (2) 160 (2) 0.294 P1392 6 18 0.0026 P
° T o ta l in tensity relative to WsOg + as ICO; 70-eV electrons, T = 1422 ± 5 °K . T o ta l intensity relative to VsWgOio as 100; 70-eV electrons, T 1422 ifc 5 °K . c U n certa in ty in last d ig it. d N o t to b s regarded as a th erm odyn am ic q u a n tity because sam ple com p osition was changing. e R ep orted b y A ckerm ann and R a u h 5 to he a 'parent ion.
near zero and with the electron emission current at the minimum setting. However, on the basis of appearance potentials, both of these ions are undoubtedly fragment
ions. The small residual signal at low electron energies is probably due to surface ionization.
Each singly charged ion is listed in Table II along with
The Journal of Physical Chemistry. Vol. 78. No. 3. 1974
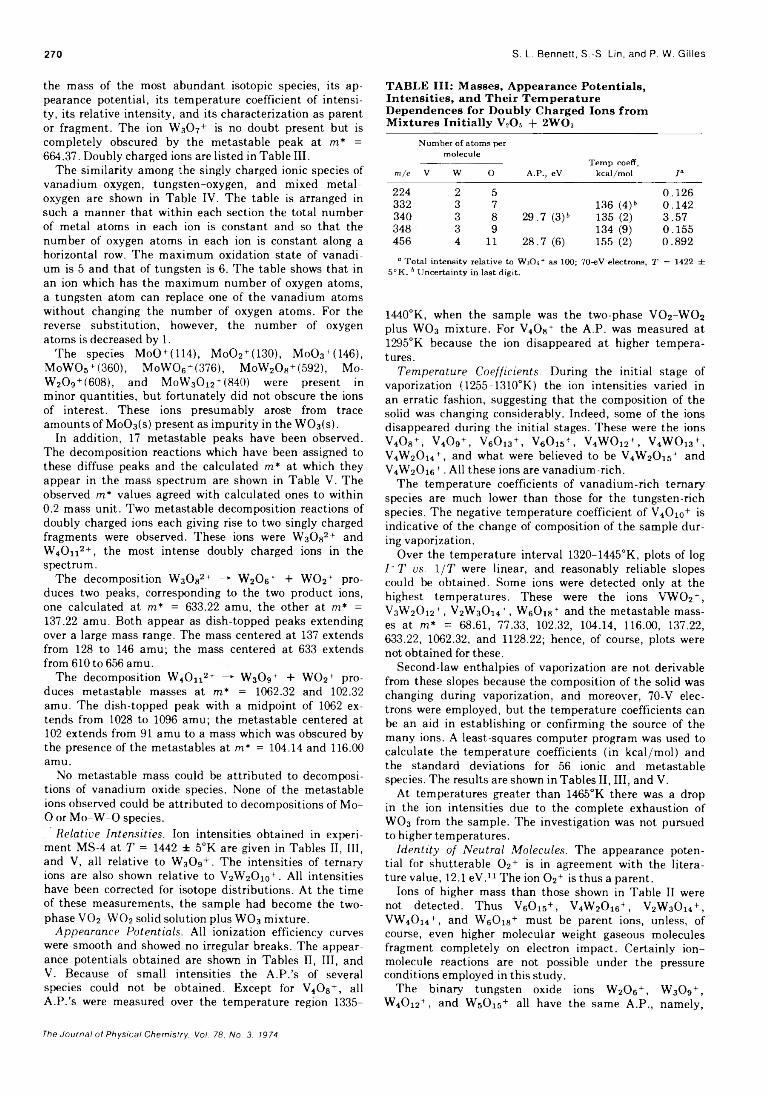
270 S. L. Bennett, S.-S. Lin, and P. W. Gilles
the mass of the most abundant isotopic species, its appearance potential, its temperature coefficient of intensity, its relative intensity, and its characterization as parent or fragment. The ion W3O74 is no doubt present but is completely obscured by the metastable peak at m* = 664.37. Doubly charged ions are listed in Table III.
The similarity among the singly charged ionic species of vanadium-oxygen, tungsten-oxygen, and mixed metal- oxygen are shown in Table IV. The table is arranged in such a manner that within each section the total number of metal atoms in each ion is constant and so that the number of oxygen atoms in each ion is constant along a horizontal row. The maximum oxidation state of vanadium is 5 and that of tungsten is 6. The table shows that in an ion which has the maximum number of oxygen atoms, a tungsten atom can replace one of the vanadium atoms without changing the number of oxygen atoms. For the reverse substitution, however, the number of oxygen atoms is decreased by 1.
The species MoO+(114), MoO2+(130), MoC>3+(146), MoWO5+(360), MoW06+(376), MoW208+(592), Mo-W2O9+(608), and MoW3Oi2 + (840) were present in minor quantities, but fortunately did not obscure the ions of interest. These ions presumably arosfe from trace amounts of MoOs(s) present as impurity in the WC>3(s).
In addition, 17 metastable peaks have been observed. The decomposition reactions which have been assigned to these diffuse peaks and the calculated m* at which they appear in the mass spectrum are shown in Table V. The observed m* values agreed with calculated ones to within 0.2 mass unit. Two metastable decomposition reactions of doubly charged ions each giving rise to two singly charged fragments were observed. These ions were Wa082+ and W4Oh 2+, the most intense doubly charged ions in the spectrum.
The decomposition W30gz+ —► W20 6 4 + W 02' produces two peaks, corresponding to the two product ions, one calculated at m* = 633.22 amu, the other at m* = 137.22 amu. Both appear as dish-topped peaks extending over a large mass range. The mass centered at 137 extends from 128 to 146 amu; the mass centered at 633 extends from 610 to 656 amu.
The decomposition W40 n 2+ ► W30g+ + W 02+ produces metastable masses at m* = 1062.32 and 102.32 amu. The dish-topped peak with a midpoint of 1062 extends from 1028 to 1096 amu; the metastable centered at 102 extends from 91 amu to a mass which was obscured by the presence of the metastables at m* = 104.14 and 116.00 amu.
No metastable mass could be attributed to decompositions of vanadium oxide species. None of the metastable ions observed could be attributed to decompositions of Mo- O or M o-W -0 species.
Relative Intensities. Ion intensities obtained in experiment MS-4 at T = 1442 ± 5°K are given in Tables II, III, and V, all relative to W3O9 ' . The intensities of ternary ions are also shown relative to V2W2Oi0+. All intensities have been corrected for isotope distributions. At the time of these measurements, the sample had become the two- phase V0 2-WC>2 solid solution plus WO3 mixture.
Appearance Potentials. All ionization efficiency curves were smooth and showed no irregular breaks. The appearance potentials obtained are shown in Tables II, III, andV. Because of small intensities the A.P.’s of several species could not be obtained. Except for V40 8+, allA.P.’s were measured over the temperature region 1335-
TABLE III: Masses, Appearance Potentials, Intensities, and Their Temperature Dependences for Doubly Charged Ions from Mixtures Initially V2Os + 2WOs
N um ber o f atom s per m olecu le
---------------------------------- T em p coeff,m/e V w o A .P ., eV k ca l/m o l / °224 2 5 0.126332 3 7 136 (4) * 0.142340 3 8 29.7 (3)b 135 (2) 3.57348 3 9 134 (9) 0.155456 4 11 28.7 (6) 155 (2) 0.892a T o ta l intensity relative to W a09+ as 100; 70-eV electrons, T = 1422 ±
5 ° K . b U ncerta inty in last digit.
1440°K, when the sample was the two-phase VO2-W O2 plus WO3 mixture. For V40 8+ the A.P. was measured at 1295°K because the ion disappeared at higher temperatures.
Temperature Coefficients. During the initial stage of vaporization (1255-1310°K) the ion intensities varied in an erratic fashion, suggesting that the composition of the solid was changing considerably. Indeed, some of the ions disappeared during the initial stages. These were the ions V40 8+, V40 9+, V60 13+, V «015+, V4W 012+, V4W 0 13+, V4W2Oi4+, and what were believed to be V4W2Oi5+ and V4W20i6+ . All these ions are vanadium-rich.
The temperature coefficients of vanadium-rich ternary species are much lower than those for the tungsten-rich species. The negative temperature coefficient of V4Oio+ is indicative of the change of composition of the sample during vaporization.
Over the temperature interval 1320-1445°K, plots of log I+T vs. 1/T were linear, and reasonably reliable slopes could be obtained. Some ions were detected only at the highest temperatures. These were the ions VW 02+, V3W20 i2+, V2W30 14+, W60 i8 f and the metastable masses at m* = 68.61, 77.33, 102.32, 104.14, 116.00, 137.22,633.22, 1062.32, and 1128.22; hence, of course, plots were not obtained for these.
Second-law enthalpies of vaporization are not derivable from these slopes because the composition of the solid was changing during vaporization, and moreover, 70-V electrons were employed, but the temperature coefficients can be an aid in establishing or confirming the source of the many ions. A least-squares computer program was used to calculate the temperature coefficients (in kcal/mol) and the standard deviations for 56 ionic and metastable species. The results are shown in Tables II, III, and V.
At temperatures greater than 1465°K there was a drop in the ion intensities due to the complete exhaustion of WO3 from the sample. The investigation was not pursued to higher temperatures.
Identity of Neutral Molecules. The appearance potential for shutterable 0 2+ is in agreement with the literature value, 12.1 eV.11 The ion 0 2+ is thus a parent.
Ions of higher mass than those shown in Table II were not detected. Thus V6Oi5+, V4W20 i 6+, V2W3Oi4+, VW4Oi4 + , and W 60i8+ must be parent ions, unless, of course, even higher molecular weight gaseous molecules fragment completely on electron impact. Certainly ion- molecule reactions are not possible under the pressure conditions employed in this study.
The binary tungsten oxide ions W206+, W30 9+, W4Oi2+, and WsOiS+ all have the same A.P., namely,
The Journal of Physical Chemistry. Vol. 78, No. 3. 1974
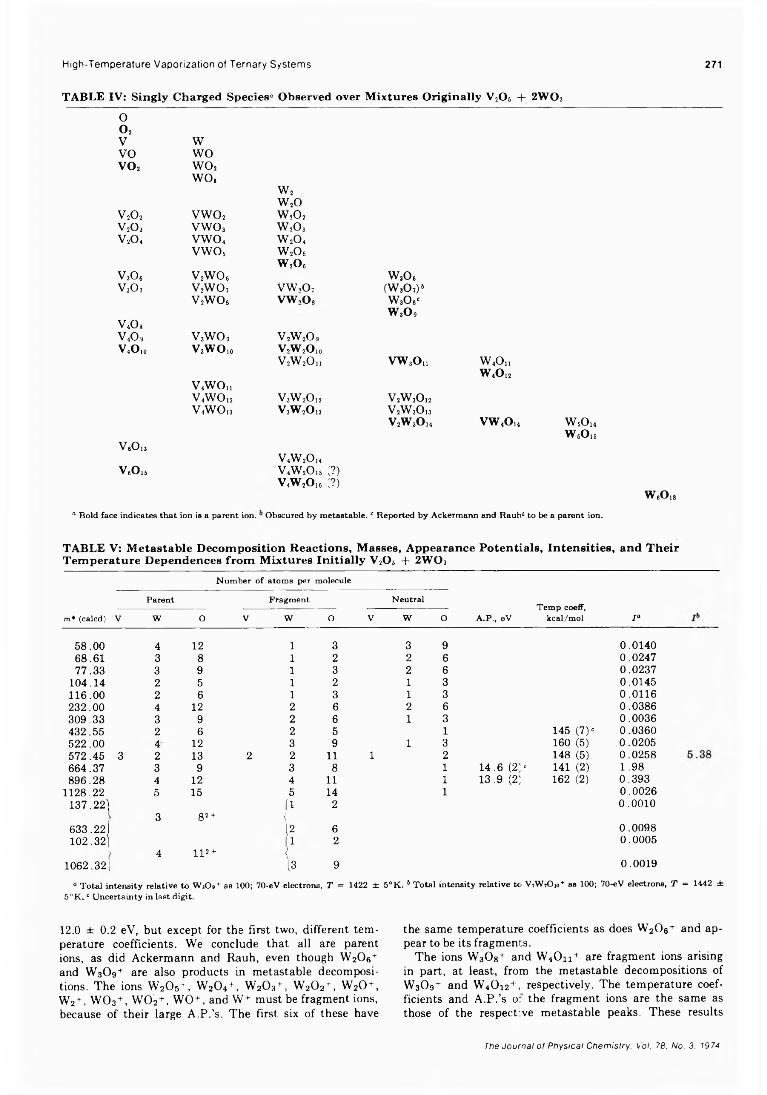
High-Temperature Vaporization ot Ternary Systems 271
TABLE IV: Singly Charged Species“ Observed over Mixtures Originally V2Os + 2W03
oo2V wVO wovo2 W 02
WOaw2W 20
v2o2 vwo2 W20 2v2o3 vwo3 w2o3v2o4 vwo4 w2o4
vwo5 W 20 6W2Oe
v3o6 v2wo6v3o, v2wo, VW.O,
V2WOs VW.O,
v4o8v4o9 v3wo9 v2w2o9v4o,„ V3WO,o V2W2O10
v2w2o„V4W O„V4WOi2 v3w2o12v4wo13 v3w2o13
VeO,3v4w2oI4
v6o15 v4w2o15 ;?)v4w2o16 ;?)
W30 6(W,0,)>W30 8‘w3o9
VW3Ou W4O11w4o12
V2W30 12v2w3oI3v2w3o„ vw4o14 w6o14
W 5015
0 B o ld face indicates th at ion is a parent ion . O bscured b y m etastable. c R ep orted b y A ckerm ann and R a u h 5 to be a parent ion.
w6o18
TABLE V: Metastable Decomposition Reactions, Masses, Appearance Potentials, Intensities, and Their Temperature Dependences from Mixtures Initially V20 5 -f 2W03
N u m ber o f a tom s per m olecule
m* (calcd)Parent Fragment Neutral
A .P ., eVTemp coeff,
kcal/mol / “V W o V W o V w o
58.00 4 12 l 3 3 9 0.014068.61 3 8 1 2 2 6 0.024777.33 3 9 1 3 2 6 0.0237
104.14 2 5 1 2 1 3 0.0145116.00 2 6 1 3 1 3 0.0116232.00 4 12 2 6 2 6 0.0386309.33 3 9 2 6 1 3 0.0036432.55 2 6 2 5 1 145 (7)' 0.0360522.00 4 12 3 9 1 3 160 (5) 0.0205572.45 3 2 13 2 2 11 1 2 148 (5) 0.0258664.37 3 9 3 8 1 14.6 (21c 141 (2) 1.98896.28 4 12 4 11 1 13.9 (21 162 (2) 0.393
1128.22 5 15 5 14 1 0.0026137.22] il 2 0.0010
3 g2 + {633.22] !2 6 0.0098102.32] 1 2 0.0005
4 112 + ]1062.32 1 13 9 0.0019
“ T o ta l in tensity relative to W aO i+ as 100; 70-eV electrons, T = 1422 ± 5 °K . 6 T o ta l intensity relative to V 2W iOio + as 100; 70-eV electrons, T = 1442 ± 5 °K . c U ncerta inty in last digit.
12.0 ± 0.2 eV, but except for the first two, different temperature coefficients. We conclude that all are parent ions, as did Ackermann and Rauh, even though W2C>6+ and W309+ are also products in metastable decompositions. The ions W20s+, W204+, W2C>3+, W202+, W20+, W2+, W03+, W 02+, W 0 +, and W+ must be fragment ions, because of their large A.P.’s. The first six of these have
the same temperature coefficients as does W206+ and appear to be its fragments.
The ions W30g+ and W40n + are fragment ions arising in part, at least, from the metastable decompositions of W3Û9+ and W40i2+, respectively. The temperature coefficients and A.P.’s o: the fragment ions are the same as those of the respective metastable peaks. These results
The Journal of Physical Chemistry. Voi. 78. No. 3. 1974
272 S. L. Bennett, S.-S. Lin, and P. W. Gilles
confirm the assignment of the metastable decomposition reactions and also suggest that little or no kinetic energy is released in these decomposition processes.
Of the binary vanadium oxide ions, V4Oio+ has the lowest A.P. and is undoubtedly a parent ion. The ion V 02+ is probably a parent, with perhaps some contribution to the ion signal due to fragmentation of V40io+. During the initial stages of vaporization VgOis1 must also be a parent ion as previously deduced. Our evidence is inconclusive on the characterization of the ion V4Or ‘ , but both Berkowitz, Chupka, and Inghram and Farber, et ai, describe it as a parent ion. In our experiments it disappeared rapidly from the mass spectrum. The A.P.’s of V4Oio+ and V4Og+ are in agreement with those of Farber, et al. The ions V6Oi4+ and V6Oi2+ were characterized by Berkowitz, Chupka, and Inghram as being parent ions, but we did not find them. All remaining vanadium oxide ions must be fragments.
Turn now to the ternary ions. The low A.P. and high intensity of VW20 8+ suggest that it is a parent ion. The ion V2W2Oio+ is the most intense ternary ion, has a reasonably low A.P., has a temperature coefficient not matched by another ion, and is taken to be a parent ion. The lowA.P.’s and unique temperature coefficients of VW30n + , V3WO10 ‘ , and V3W20 i3~ suggest that they are probably parent ions. The last of these is the parent in one proposed metastable decomposition and could not have been a fragment from a larger one except by loss of the unlikely neutral VO3.
The ion V2W20 n + is shown to be a fragment in the proposed metastable decomposition reaction from VsW20 i3+ with which it has the same temperature coefficient. Also V2W 08+, V2W 07+, and V2W 06+ have the same temperature coefficients and are fragments from VsW20 i3+ or V2W20 „ + . The low A.P. of V2W20 n + suggests that it is a parent ion; hence some uncertainty exists on this point.
The ion V2W209+ is indicated by its high appearance potential to be a fragment, and the agreement of its temperature coefficient with that of V2W2Oio+ indicates the latter to be its parent. The ions V2W30 i34 and V2W30 i2+ have the same temperature coefficient, and are probably both fragments of the ion V2W30 14 +.
No ion containing five vanadium atoms was observed, but their absence cannot be certain because V5WO13+ would overlap the ion V2W20 n + in the spectrum; the ion V5WOM r would be completely masked by the metastable ion at m* = 664.37; and V5WOi5+ would be masked by W30 8+. These ions are vanadium-rich and probably, if present, would have disappeared during the early stages of the vaporization.
The ions, VWOs4, VW 04+, VW 03+ have the same temperature coefficients as VW20 8+ and they, and presumably VW 02+, are its fragments. No isomolecular exchange reactions involving unambiguously deduced gaseous molecules could be written and hence no thermodynamic results could be obtained.
DiscussionThe present mass spectrometric studies indicate the ex
istence of many previously unknown high molecular weight ternary ions and several metastable decomposition reactions arising in this very complicated chemical system. From their masses and isotopic distributions, the many ions have been identified; and from relative ion in
tensities, appearance potential measurements, and the assignment of metastable decomposition reactions, the parent and fragment ions have been deduced. The 17 neutral species found in this system are shown in Table IV in bold-faced type. The hexamer of W 03 has been observed for the first time. Eight ternary molecules all of low abundance are believed to exist. To our knowledge the metastable decomposition reactions of the doubly charged tungsten oxide ions are the first to be observed in a high- temperature system.
High molecular weight vanadium-rich species are present during the initial stages of vaporization of mixtures of V 20 5 and W 0 3 , but quickly disappear as the composition moves into the two-phase V 0 2 - W 0 2 solid solution plus W O 3 region. The partial pressures of all remaining species, except V 4 O i o + , V 4W O u + , 0 2 + , and 0 + , increase with increasing temperature until the residue enters the V 0 2 - W 0 2 solid solution region. At this point, corresponding to loss of W 0 3 from the sample, there is a reduction in all ion intensities. Thermodynamic data have not been obtained; indeed, only the salient features of this system have been established.
The neutral molecules are nearly all fully oxidized, V2W2Oio being the only one potentially capable of accepting an additional oxygen atom. Of course, the chemical system was deliberately chosen to be oxygen-rich so as to enhance the presence of the ternary molecules. Two of the ternary molecules V4W20 46 and V2W30 i4 may be considered as compounds of V20 5 and WO3; the others as compounds of V 02, V20 5, and W 03.
The principal unresolved problems within the scope of the present work relate to the identities of the neutral molecules giving rise to V40 8+, V4W O n+, V4WOi2+, and V4WOi3+ and to the temperature coefficient of one metastable decomposition.
Other techniques that could be employed to establish the neutral precursors of the above ions as well as to confirm identities are: (a) use of different V -W -0 compositions; (b) use of a monoenergetic electron beam to examine ionization onset curves; (c) measurement of ion excess kinetic energies; and (d) use of time-of-flighting to determine the velocity distribution and hence the molecular weight of the neutrals prior to their being ionized. This last technique is attractive for those systems where the appearance potential of an ion from direct ionization of a parent and from fragmentation of a larger molecule are similar, as is often the case when a material vaporizes to give polymeric species.
The temperature coefficient of the metastable at m* =572.5 amu (148 ± 5 kcal/mol) does not agree with the temperature coefficient of the fragment or parent ion (both 55 ± 3 kcal/mol). Possibly a doubly charged ion with the formula W5Oi 52+ (m/e = 572), whose temperature coefficient is expected to be co. 160 kcal/mol, may also be contributing, but discrete peaks could not be discerned from the diffuse metastable peak. This metastable peak does not arise from the decomposition of M o-0 or M o-W -0 species.
Outside the scope of the present work but related to it are studies of the thermodynamic properties of the neutral molecules, the thermodynamic properties of the condensed phases, the structures of the complicated molecules, the degrees of fragmentation of the molecules, especially the tungsten oxides, the energies and rates of the several metastable decompositions, and the chemistry over the less oxygen-rich regions of the system.
The Journal of Physical Chemistry. Vol. 78, No. 3. 1974
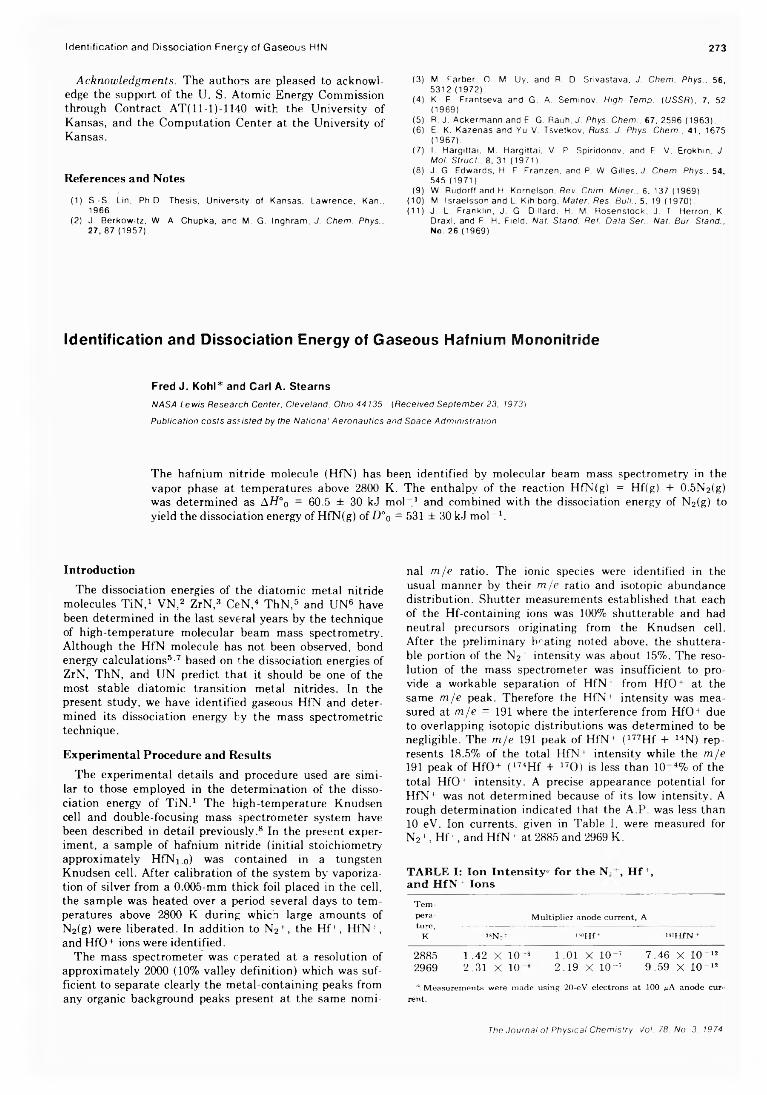
Identification and Dissociation Enerçy of Gaseous HfN 273
Acknowledgments. The authors are pleased to acknowledge the support of the U. S. Atomic Energy Commission through Contract AT( 11-1)-1140 with the University of Kansas, and the Computation Center at the University of Kansas.
References and Notes(1) S.-S. Lin, Ph.D. Thesis, University of Kansas, Lawrence, Kan.,
1966.(2) J. Berkowitz, W. A. Chupka, and M. G. Inghram, J. Chem. Phys.,
27, 87 (1957).
(3) M. Farber, O. M. Uy, and R. D. Srivastava, J. Chem. Phys.. 56, 5312(1972).
(4) K. E. Frantseva and G. A. Seminov. High Temp. (USSR), 7, 52 (1969).
(5) R. J. Ackermann and E. G. Rauh, J. Phys. Chem., 67, 2596 (1963).(6) E. K. Kazenas and Yu V. Tsvetkov, Russ. J. Phys. Chem., 41, 1675
(1967).(7) I. Hargittai, M. Hargittai. V. P. Spiridonov, and E. V. Erokhin, J.
Mol. Struct., 8, 31 (1971).(8) J. G. Edwards, H. F. Franzen. and P. W. Gilles, J. Chem. Phys., 54,
545(1971).(9) W. Rudorff and H. Kornelson, Rev. Chim. Miner.. 6, 137 (1969).
(10) M. Israelsson and L. Kihlborg, Mater. Res. Bull.. 5, 19 (1970).(11) J. L. Franklin, J. G. Dillard, H. M. Rosenstock, J. T. Herron, K.
Draxl, and F. H. Field, Nat. Stand. Ref. Data Ser., Nat. Bur. Stand., No. 26 (1969).
I d e n t i f i c a t io n a n d D i s s o c ia t i o n E n e r g y o f G a s e o u s H a fn iu m M o n o n it r id e
Fred J. Kohl* and Carl A. StearnsNASA Lewis Research Center, Cleveland, Ohio 44135 (Received September 23, 1973) Publication costs assisted by the Nationa' Aeronautics and Space Administration
The hafnium nitride molecule (HfN) has been identified by molecular beam mass spectrometry in the vapor phase at temperatures above 2800 K. The enthalpy of the reaction HfN(g) = Hf(g) + 0.5N2(g) was determined as AH° 0 = 60.5 ± 30 k j mol 1 and combined with the dissociation energy of N2(g) to yield the dissociation energy ofHfN(g) ofD ° 0 = 531 ± 30 kJ m o l 1.
IntroductionThe dissociation energies of the diatomic metal nitride
molecules TiN,1 VN,2 ZrN,3 CeN,4 ThN,5 and UN6 have been determined in the last several years by the technique of high-temperature molecular beam mass spectrometry. Although the HfN molecule has not been observed, bond energy calculations5-7 based on the dissociation energies of ZrN, ThN, and UN predict that it should be one of the most stable diatomic transition metal nitrides. In the present study, we have identified gaseous HfN and determined its dissociation energy by the mass spectrometric technique.
Experimental Procedure and ResultsThe experimental details and procedure used are simi
lar to those employed in the determination of the dissociation energy of TiN.1 The high-temperature Knudsen cell and double-focusing mass spectrometer system have been described in detail previously.8 In the present experiment, a sample of hafnium nitride (initial stoichiometry approximately HfNi.o) was contained in a tungsten Knudsen cell. After calibration of the system by vaporization of silver from a 0.005-mm thick foil placed in the cell, the sample was heated over a period several days to temperatures above 2800 K during which large amounts of N2(g) were liberated. In addition to N2 + , the Hf+, HfN+, and HfO+ ions were identified.
The mass spectrometer was operated at a resolution of approximately 2000 (10% valley definition) which was sufficient to separate clearly the metal-containing peaks from any organic background peaks present at the same nomi
nal m/e ratio. The ionic species were identified in the usual manner by their m /e ratio and isotopic abundance distribution. Shutter measurements established that each of the Hf-containing ions was 100% shutterable and had neutral precursors originating from the Knudsen cell. After the preliminary boating noted above, the shutterable portion of the N2 ! intensity was about 15%. The resolution of the mass spectrometer was insufficient to provide a workable separation of HfN4 from HfO+ at the same m/e peak. Therefore the HfN4 intensity was measured at m/e = 191 where the interference from HfO+ due to overlapping isotopic distributions was determined to be negligible. The m/e 191 peak of HfN+ (177Hf -I- 14N) represents 18.5% of the total HfN4 intensity while the m/e 191 peak of HfO+ ( 174Hf + 170 ) is less than 10 4% of the total HfO4 intensity. A precise appearance potential for HfN4 was not determined because of its low intensity. A rough determination indicated that the A.P. was less than 10 eV. Ion currents, given in Table I, were measured for N2+, Hf+, and HfN4 at 2885 and 2969 K.
TABLE I: Ion Intensity" for the N, 1, Hf +, and HfN 4 Ions
T em -Pera~ M ultip lier anode current, Ature, ----------------------------------------------------------------------------------------------------------K 2sN2+ "Wf+ 19IHfN +
2885 1.42 X 10 41 1.01 X 10~7 7.46 X 10“ 122969 2.31 X 10 8 2.19 X 10~7 9.59 X 10“ 12" M easurem ents w ere m ade using 20-eV electrons at 100 a A anode cur
rent.
The Journal of Physical Chemistry. Jot. 78. No. 3. 1974
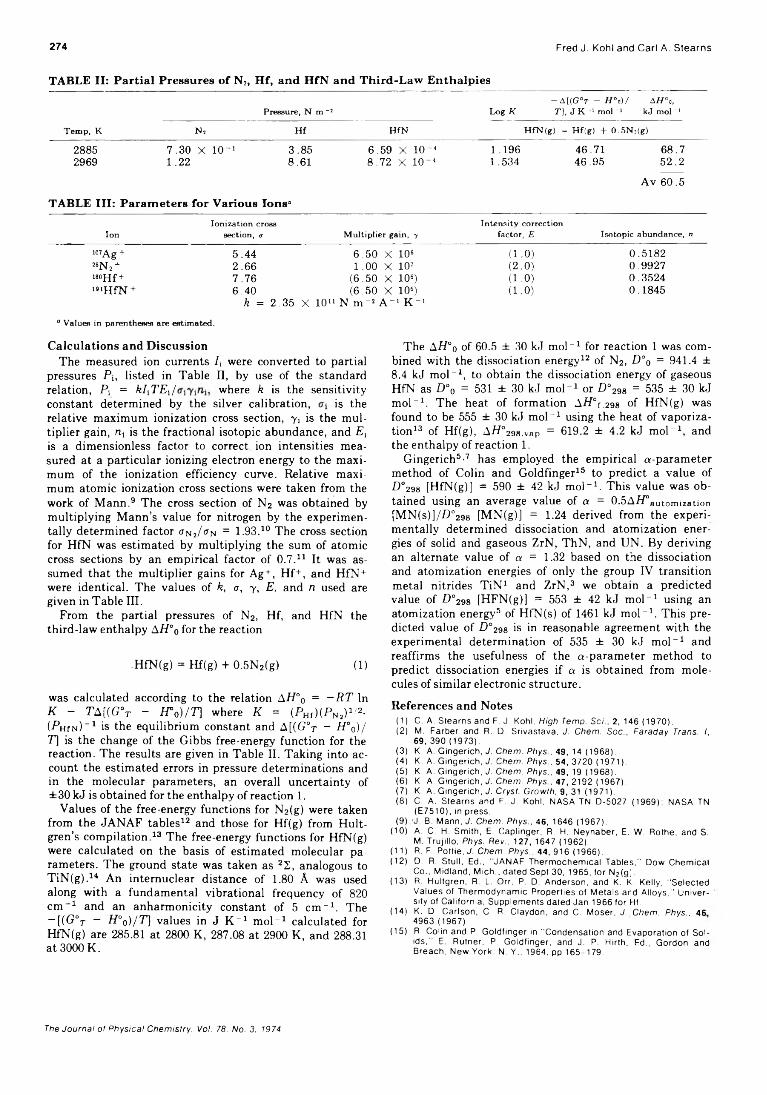
274 Fred J. Kohl and Carl A. Stearns
TABLE II: Partial Pressures of N2, Hf, and HfN and Third-Law Enthalpies
Pressure, N m -2- A [(G °r “ H °o)/ i f f ” .,
L o g K T], J K - ' m o l - ' k j m o l“ '
T em p , K N r H f H fN H fN (g ) = H f(g ) + 0 . 5N r(g)
2885 7.30 X 10"1 3.85 6.59 X 10~4 1.196 46.71 68.72969 1.22 8.61 8.72 X 10"4 1.534 46.95 52.2
Av 60.5
TABLE III: Parameters for Various Ions“
IonIon iza tion cross
section , <r M ultip lier gain, yIn ten sity correction
factor, E Isotop ic abu ndance , n
107 A g + 5.44 6.50 X 10s (1.0) 0.518228N2 + 2.66 1.00 X 10⁷ (2.0) 0.9927180JJf + 7.76 (6.50 X 10⁶) (1.0) 0.3524mHfN + 6.40 (6.50 X 10s) (1.0) 0.1845
k = 2.35 X 10” N m "2 A " 1 K " 1a Values in parentheses are estim ated.
Calculations and DiscussionThe measured ion currents /, were converted to partial
pressures Pi, listed in Table II, by use of the standard relation, Pi = kl^TE^ / w h e r e k is the sensitivity constant determined by the silver calibration, is the relative maximum ionization cross section, 71 is the multiplier gain, rc-i is the fractional isotopic abundance, and E, is a dimensionless factor to correct ion intensities measured at a particular ionizing electron energy to the maximum of the ionization efficiency curve. Relative maximum atomic ionization cross sections were taken from the work of Mann.9 The cross section of N2 was obtained by multiplying Mann’s value for nitrogen by the experimentally determined factor aN2/<rN = 1.93.10 The cross section for HfN was estimated by multiplying the sum of atomic cross sections by an empirical factor of 0.7.11 It was assumed that the multiplier gains for Ag+, Hf+, and HfN+ were identical. The values of k, a, 7, E, and n used are given in Table III.
From the partial pressures of N2, Hf, and HfN the third-law enthalpy Ai/°o for the reaction
HfN(g) = Hf(g) + 0.5N2(g) (1)
was calculated according to the relation AH° 0 = - RT In K - TA[(G°t - H°o)/T] where K = (PHf)(PN2)1/2- (PhifN) - 1 is the equilibrium constant and A[(G°t - H°o)/ T\ is the change of the Gibbs free-energy function for the reaction. The results are given in Table II. Taking into account the estimated errors in pressure determinations and in the molecular parameters, an overall uncertainty of ±30 kJ is obtained for the enthalpy of reaction 1.
Values of the free-energy functions for N2(g) were taken from the JANAF tables12 and those for Hf(g) from Hult- gren’s compilation.13 The free-energy functions for HfN(g) were calculated on the basis of estimated molecular parameters. The ground state was taken as 22, analogous to TiN(g).14 An internuclear distance of 1.80 A was used along with a fundamental vibrational frequency of 820 cm -1 and an anharmonicity constant of 5 cm "1. The — [(G°t — H°0)/T] values in J K “ 1 mol-1 calculated for HfN(g) are 285.81 at 2800 K, 287.08 at 2900 K, and 288.31 at 3000 K.
The AH°o of 60.5 ± 30 k j mol" 1 for reaction 1 was combined with the dissociation energy12 of N2, D°0 = 941.4 ±8.4 kJ m ol"1, to obtain the dissociation energy of gaseous HfN as D°o = 531 ± 30 kJ m ol"1 or D ° 298 = 535 ± 30 kJ m ol"1. The heat of formation A //°r,298 of HfN(g) was found to be 555 ± 30 kJ m ol"1 using the heat of vaporization13 of Hf(g), AH°298,vap = 619.2 ± 4.2 kJ m ol"1, and the enthalpy of reaction 1.
Gingerich5'7 has employed the empirical a-parameter method of Colin and Goldfinger15 to predict a value of P °298 [HfN(g)] = 590 ± 42 k j m ol"1. This value was obtained using an average value of a = 0.5A/Pautomizauon [MN(s)]/D °298 [MN(g)] = 1.24 derived from the experimentally determined dissociation and atomization energies of solid and gaseous ZrN, ThN, and UN. By deriving an alternate value of a = 1.32 based on the dissociation and atomization energies of only the group IV transition metal nitrides TiN1 and ZrN,3 we obtain a predicted value of D°298 [HFN(g)] = 553 ± 42 kJ mol“ 1 using an atomization energy5 of HfN(s) of 1461 kJ m ol"1. This predicted value of D°298 is in reasonable agreement with the experimental determination of 535 ± 30 k j m ol"1 and reaffirms the usefulness of the a-parameter method to predict dissociation energies if a is obtained from molecules of similar electronic structure.
References and Notes(1 ) C. A. Stearns and F. J. Kohl, High Temp. Sei., 2, 146 (1970).(2) M. Färber and R. D. Srivastava, J. Chem. Soc., Faraday Trans. I,
69 , 390 (1973).(3) K. A. Gingerich, J. Chem. Phys.. 49 , 14 (1968).(4) K. A. Gingerich, J. Chem. Phys.. 5 4 , 3720 (1971).(5) K. A. Gingerich, J. Chem. Phys., 49 , 19 (1968).(6) K. A. Gingerich, J. Chem. Phys., 47 , 2192 (1967).(7) K. A. Gingerich, J. Cryst. Growth, 9, 31 (1971).(8) C. A. Stearns and F. J. Kohl, NASA TN D-5027 (1969); NASA TN
(E7510), in press.(9) J. B. Mann, J. Chem. Phys., 46, 1646 (1967).
(10) A. C. hi. Smith, E. Caplinger, R. H. Neynaber, E. W. Rothe, and S. M. Trujillo, Phys. Rev., 127, 1647 (1962).
(11) R. F. Pottie, J. Chem. Phys.. 44 , 916 (1966).(12) D. R. Stull, Ed., "JANAF Thermochemical Tables," Dow Chemical
Co., Midland, Mich., dated Sept 30, 1965, for N2(g ).(13) R. Hultgren, R. L. Orr, P. D. Anderson, and K. K. Kelly, "Selected
Values of Thermodynamic Properties of Metals ard Alloys," University of California, Supplements dated Jan 1966 for Hf.
(14) K. D. Carlson, C. R. Claydon, and C. Moser, J. Chem. Phys., 46 4963 (1967).
(15) R. Colin and P. Goldfinger in "Condensation and Evaporation of Solids," E. Rutner, P. Goldfinger, and J. P. Hirth, Ed., Gordon and Breach, New York, N. Y., 1964, pp 165-179.
The Journal of Physical Chemistry. Voi. 78. No. 3. 1974
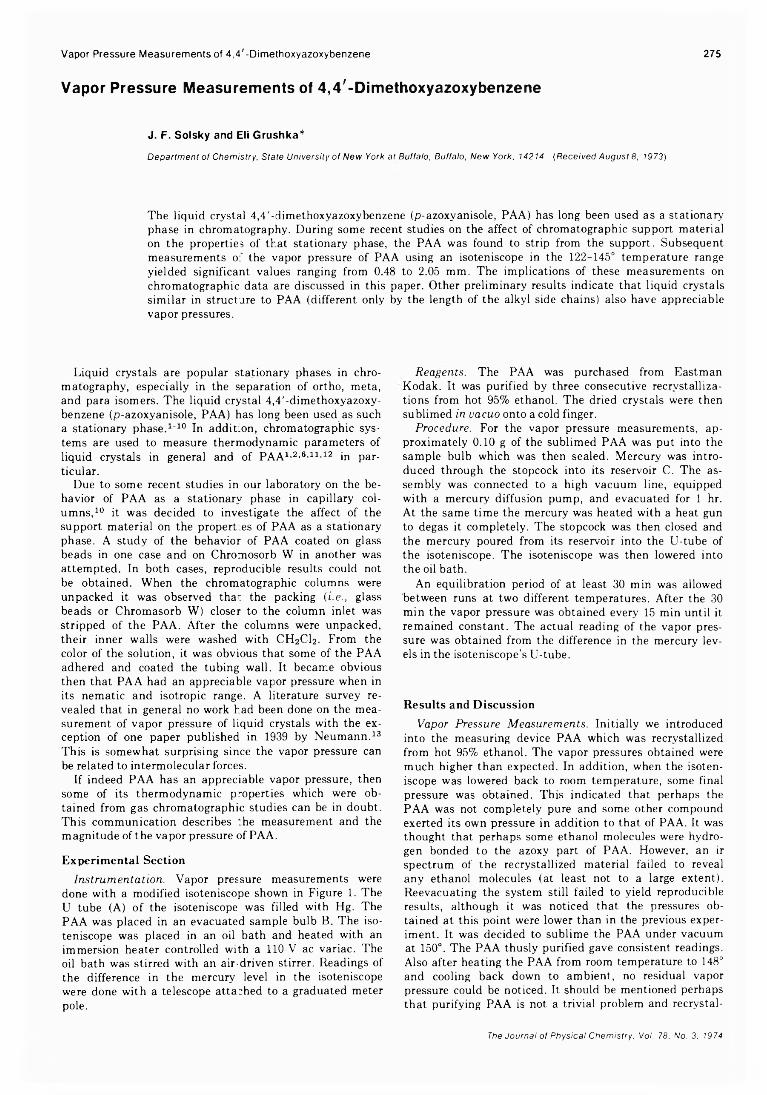
Vapor Pressure Measurements of 4,4'-Dimethoxyazoxybenzene 275
V a p o r P r e s s u r e M e a s u r e m e n t s o f 4 , 4 / - D im e t h o x y a z o x y b e n z e n e
J. F. Solsky and Eli Grushka*Department of Chemistry, State University of New York at Buffalo, Buffalo, New York, 14214 (Received August 8, 1973)
The liquid crystal 4,4'-dimethoxyazoxybenzene (p-azoxyanisole, PAA) has long been used as a stationary phase in chromatography. During some recent studies on the affect of chromatographic support material on the properties of that stationary phase, the PAA was found to strip from the support. Subsequent measurements of the vapor pressure of PAA using an isoteniscope in the 122-145° temperature range yielded significant values ranging from 0.48 to 2.05 mm. The implications of these measurements on chromatographic data are discussed in this paper. Other preliminary results indicate that liquid crystals similar in structure to PAA (different only by the length of the alkyl side chains) also have appreciable vapor pressures.
Liquid crystals are popular stationary phases in chromatography, especially in the separation of ortho, meta, and para isomers. The liquid crystal 4,4'-dimethoxyazoxy- benzene (p-azoxyanisole, PAA) has long been used as such a stationary phase.1-10 In addition, chromatographic systems are used to measure thermodynamic parameters of liquid crystals in general and of PAA1'2’6'11'12 in particular.
Due to some recent studies in our laboratory on the behavior of PAA as a stationary phase in capillary columns,10 it was decided to investigate the affect of the support material on the properties of PAA as a stationary phase. A study of the behavior of PAA coated on glass beads in one case and on Chromosorb W in another was attempted. In both cases, reproducible results could not be obtained. When the chromatographic columns were unpacked it was observed that the packing (i.e., glass beads or Chromasorb W) closer to the column inlet was stripped of the PAA. After the columns were unpacked, their inner walls were washed with CH2CI2. From the color of the solution, it was obvious that some of the PAA adhered and coated the tubing wall. It became obvious then that PAA had an appreciable vapor pressure when in its nematic and isotropic range. A literature survey revealed that in general no work had been done on the measurement of vapor pressure of liquid crystals with the exception of one paper published in 1939 by Neumann.13 This is somewhat surprising since the vapor pressure can be related to intermolecular forces.
If indeed PAA has an appreciable vapor pressure, then some of its thermodynamic properties which were obtained from gas chromatographic studies can be in doubt. This communication describes the measurement and the magnitude of the vapor pressure of PAA.
Experimental SectionInstrumentation. Vapor pressure measurements were
done with a modified isoteniscope shown in Figure 1. The U tube (A) of the isoteniscope was filled with Hg. The PAA was placed in an evacuated sample bulb B. The isoteniscope was placed in an oil bath and heated with an immersion heater controlled with a 110-V ac variac. The oil bath was stirred with an air-driven stirrer. Readings of the difference in the mercury level in the isoteniscope were done with a telescope attached to a graduated meter pole.
Reagents. The PAA was purchased from Eastman Kodak. It was purified by three consecutive recrvstalliza- tions from hot 95% ethanol. The dried crystals were then sublimed in vacuo onto a cold finger.
Procedure. For the vapor pressure measurements, approximately 0.10 g of the sublimed PAA was put into the sample bulb which was then sealed. Mercury was introduced through the stopcock into its reservoir C. The assembly was connected to a high vacuum line, equipped with a mercury diffusion pump, and evacuated for 1 hr. At the same time the mercury was heated with a heat gun to degas it completely. The stopcock was then closed and the mercury poured from its reservoir into the U-tube of the isoteniscope. The isoteniscope was then lowered into the oil bath.
An equilibration period of at least 30 min was allowed between runs at two different temperatures. After the 30 min the vapor pressure was obtained every 15 min until it remained constant. The actual reading of the vapor pressure was obtained from the difference in the mercury levels in the isoteniscope’s U-tube.
Results and DiscussionVapor Pressure Measurements. Initially we introduced
into the measuring device PAA which was recrvstallized from hot 95% ethanol. The vapor pressures obtained were much higher than expected. In addition, when the isoteniscope was lowered back to room temperature, some final pressure was obtained. This indicated that perhaps the PAA was not completely pure and some other compound exerted its own pressure in addition to that of PAA. It was thought that perhaps some ethanol molecules were hydrogen bonded to the azoxy part of PAA. However, an ir spectrum of the recrystallized material failed to reveal any ethanol molecules (at least not to a large extent). Reevacuating the system still failed to yield reproducible results, although it was noticed that the pressures obtained at this point were lower than in the previous experiment. It was decided to sublime the PAA under vacuum at 150°. The PAA thusly purified gave consistent readings. Also after heating the PAA from room temperature to 148° and cooling back down to ambient, no residual vapor pressure could be noticed. It should be mentioned perhaps that purifying PAA is not a trivial problem and recrystal-
The Journal of Physical Chemistry, Vol. 78, No. 3. 1974
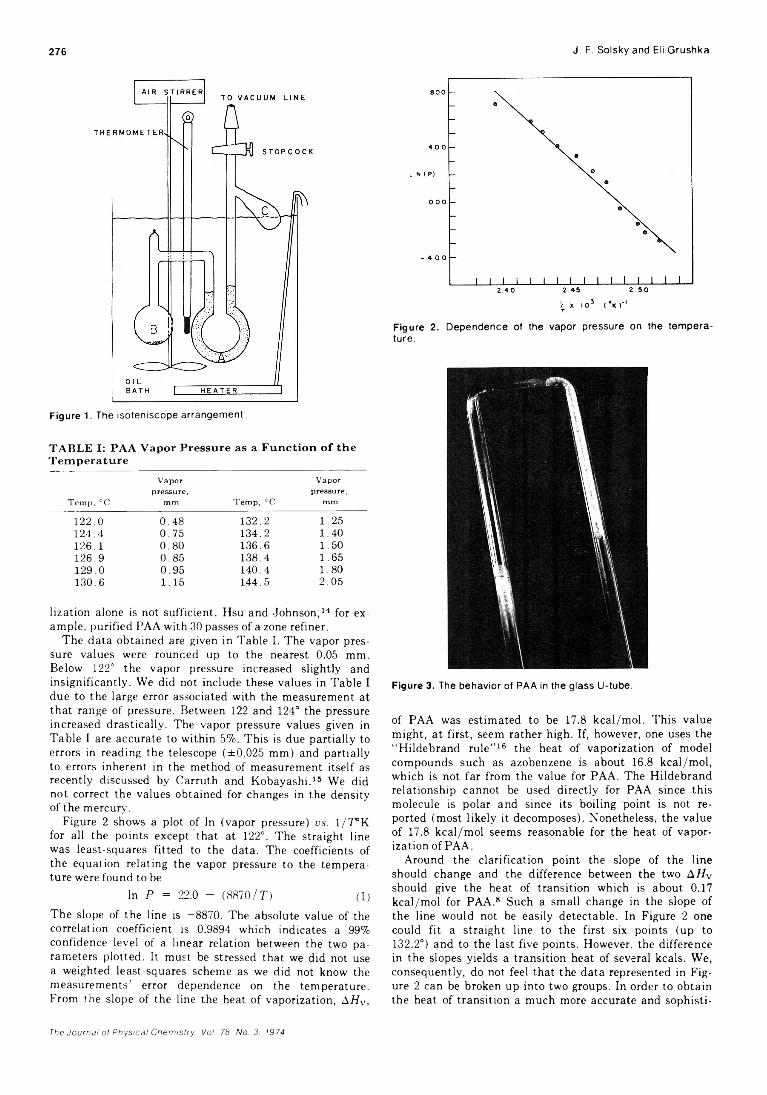
276 J. F. Solsky and Eli Grushka
Figure 1. The isoteniscope arrangement.
TABLE I: PAA Vapor Pressure as a Function of theTem perature
Vapor Vaporpressure, pressure,
Temp, °C mm Temp, °C mm122.0 0.48 132.2 1.25124.4 0.75 134.2 1.40126.1 0.80 136.6 1.50126.9 0.85 138.4 1.65129.0 0.95 140.4 1.80130.6 1.15 144.5 2.05
lization alone is not sufficient. Hsu and -Johnson,14 for example, purified PAA with 30 passes of a zone refiner.
The data obtained are given in Table I. The vapor pressure values were rounded up to the nearest 0.05 mm. Below 122° the vapor pressure increased slightly and insignificantly. We did not include these values in Table I due to the large error associated with the measurement at that range of pressure. Between 122 and 124° the pressure increased drastically. The vapor pressure values given in Table I are accurate to within 5%. This is due partially to errors in reading the telescope (±0.025 mm) and partially to errors inherent in the method of measurement itself as recently discussed by Carruth and Kobayashi.15 We did not correct the values obtained for changes in the density of the mercury.
Figure 2 shows a plot of In (vapor pressure) vs. 1/T”K for all the points except that at 122°. The straight line was least-squares fitted to the data. The coefficients of the equation relating the vapor pressure to the temperature were found to be
In P = 22.0 - (8870/T) (1)The slope of the line is -8870. The absolute value of the correlation coefficient is 0.9894 which indicates a 99% confidence level of a linear relation between the two parameters plotted. It must be stressed that we did not use a weighted least-squares scheme as we did not know the measurements’ error dependence on the temperature. From the slope of the line the heat of vaporization, &HV,
i X IO! ( ‘k )■'TFigure 2. Dependence of the vapor pressure on the temperature.
Figure 3. The behavior of PAA in the glass U-tube.
of PAA was estimated to be 17.8 kcal/mol. This value might, at first, seem rather high. If, however, one uses the “ Hildebrand rule” 16 the heat of vaporization of model compounds such as azobenzene is about 16.8 kcal/mol, which is not far from the value for PAA. The Hildebrand relationship cannot be used directly for PAA since this molecule is polar and since its boiling point is not reported (most likely it decomposes). Nonetheless, the value of 17.8 kcal/mol seems reasonable for the heat of vaporization of PAA.
Around the clarification point the slope of the line should change and the difference between the two AHv should give the heat of transition which is about 0.17 kcal/mol for PAA.8 Such a small change in the slope of the line would not be easily detectable. In Figure 2 one could fit a straight line to the first six points (up to 132.2°) and to the last five points. However, the difference in the slopes yields a transition heat of several kcals. We, consequently, do not feel that the data represented in Figure 2 can be broken up into two groups. In order to obtain the heat of transition a much more accurate and sophisti
The Journal of Physical Chemistry. Voi. 78. No. 3. 1974
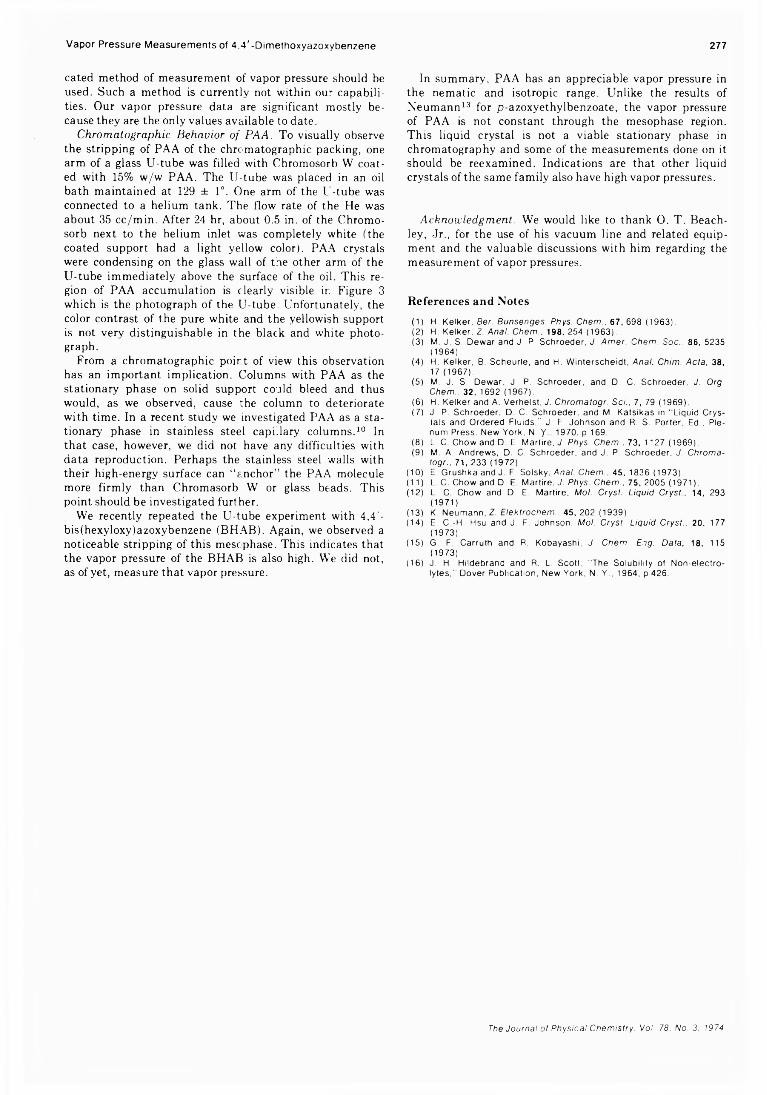
cated method of measurement of vapor pressure should be used. Such a method is currently not within our capabilities. Our vapor pressure data are significant mostly because they are the only values available to date.
Chromatographic Behavior of PA A. To visually observe the stripping of PAA of the chromatographic packing, one arm of a glass U-tube was filled with Chromosorb W coated with 15% w/w PAA. The U-tube was placed in an oil bath maintained at 129 ± 1°. One arm of the U-tube was connected to a helium tank. The flow rate of the He was about 35 cc/min. After 24 hr, about 0.5 in. of the Chromosorb next to the helium inlet was completely white (the coated support had a light yellow color). PAA crystals were condensing on the glass wall of the other arm of the U-tube immediately above the surface of the oil. This region of PAA accumulation is clearly visible in Figure 3 which is the photograph of the U-tube. Unfortunately, the color contrast of the pure white and the yellowish support is not very distinguishable in the black and white photograph.
From a chromatographic point of view this observation has an important implication. Columns with PAA as the stationary phase on solid support could bleed and thus would, as we observed, cause the column to deteriorate with time. In a recent study we investigated PAA as a stationary' phase in stainless steel capillary columns.10 In that case, however, we did not have any difficulties with data reproduction. Perhaps the stainless steel walls with their high-energy surface can “ anchor” the PAA molecule more firmly than Chromasorb W or glass beads. This point should be investigated further.
We recently repeated the U-tube experiment with 4,4'- bis(hexyloxy)azoxybenzene (BHAB). Again, we observed a noticeable stripping of this mescphase. This indicates that the vapor pressure of the BHAB is also high. We did not, as of yet, measure that vapor pressure.
Vapor Pressure Measurements of 4,4 '-D im ethoxyazoxybenzene 277
In summary, PAA has an appreciable vapor pressure in the nematic and isotropic range. Unlike the results of Neumann13 for p-azoxyethylbenzoate, the vapor pressure of PAA is not constant through the mesophase region. This liquid crystal is not a viable stationary phase in chromatography and some of the measurements done on it should be reexamined. Indications are that other liquid crystals of the same family also have high vapor pressures.
Acknowledgment. We would like to thank 0 . T. Beach- ley, Jr., for the use of his vacuum line and related equipment and the valuable discussions with him regarding the measurement of vapor pressures.
References and Notes
(1) H. Kelker. Ber. Bunsenges. Phys. Chem.. 67, 698 (1963).(2) H. Kelker. Z. Anal. Chem.. 198. 254 (1963).(3) M. J. S. D ew ar and J. P. Schroeder, J. Amer. Chem. Soc.. 86, 5235
(1964).(4) H. Kelker, B. Scheurle , and H. W in te rsche id t. Anal. Chim. Acta. 38,
17 (1967).(5) M. J. S. D ewar, J. P. Schroeder, and D. C. Schroeder, J. Org.
Chem.. 32. 1692 (1967).(6) H. K elker and A. V erhelst, J. Chromatogr. Scl.. 7, 79 (1969).(7) J. P. Schroeder, D. C. Schroeder. and M. Katslkas in "L iqu id C rys
ta ls and Ordered F lu ids," J. F. Johnson and R. S. Porter, Ed.. Plenum Press. New York, N. y ., 1970, p 169.
(8) L. C. Chow and D. E. M artire, J. Phys. Chem.. 73, 1127 (1969).(9) M. A. Andrews, D. C. Schroeder, and J. P. Schroeder. J. Chroma
togr.. 71, 233 (1972).(10) E. G rushka and J. F. Solsky, Anal. Chem., 45, 1836 (1973).(11) L. C. Chow and D. E. M artire . J. Phys. Chem., 75, 2005 (1971).(12) L. C. Chow and D. E. M artire, Mol. Cryst. Liquid Cryst., 14, 293
(1971).(13) K. Neum ann, Z. Elektrochem.. 45, 202 (1939).(14) E. C .-H. Hsu and J. F. Johnson, Mol. Cryst. Liquid Cryst., 20, 177
(1973).(15) G. F. Carruth and R. Kobayashi, J. Chem. Eng. Data, 18, 115
(1973).(16) J. H. H ildebrand and R. L. Scott, "The So lub ility o f N on-e lectro
ly te s ," D over P ublication, New York, N. Y., 1964, p 426.
The Journal of Physical Chemistry. Vol. 78. No. 3. 1974
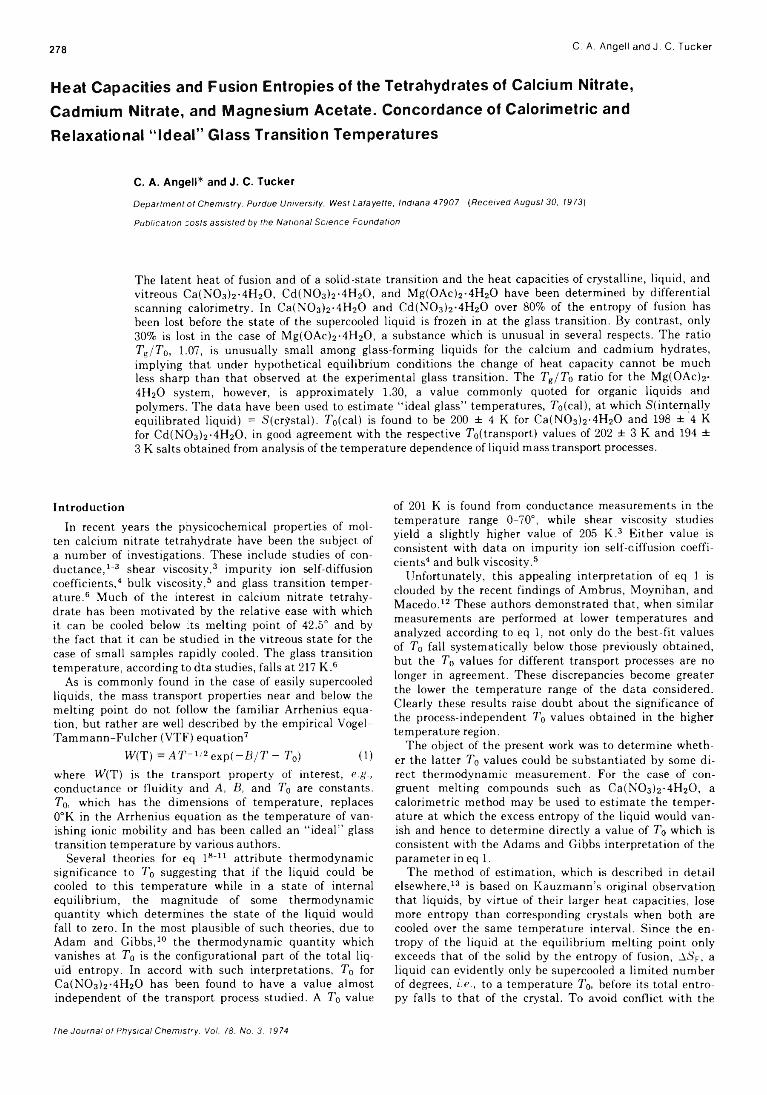
278 C. A. Angell and J. C. Tucker
Heat Capacities and Fusion Entropies of the Tetrahydrates of Calcium Nitrate, Cadmium Nitrate, and Magnesium Acetate. Concordance of Calorimetric and Reiaxational “Ideal” Glass Transition Temperatures
C. A. Angell* and J. C. TuckerDepartment of Chemistry. Purdue University. West Lafayette, Indiana 479 0 7 (Received August 30, 1973)
Publication costs assisted by the National Science Foundation
The latent heat of fusion and of a solid-state transition and the heat capacities of crystalline, liquid, and vitreous Ca(N03)2-4H20, Cd(N03)2-4H20, and M g(0Ac)2-4H20 have been determined by differential scanning calorimetry. In Ca(N03)2-4H20 and Cd(N03)2-4H20 over 80% of the entropy of fusion has been lost before the state of the supercooled liquid is frozen in at the glass transition. By contrast, only 30% is lost in the case of M g(0Ac)2-4H20, a substance which is unusual in several respects. The ratio Tg/T 0, 1.07, is unusually small among glass-forming liquids for the calcium and cadmium hydrates, implying that under hypothetical equilibrium conditions the change of heat capacity cannot be much less sharp than that observed at the experimental glass transition. The Tg/To ratio for the Mg(OAc)2- 4H20 system, however, is approximately 1.30, a value commonly quoted for organic liquids and polymers. The data have been used to estimate “ ideal glass” temperatures, T0(cal), at which S(internally equilibrated liquid) = S(crystal). T0(cal) is found to be 200 ± 4 K for Ca(N03)2-4H20 and 198 ± 4 K for Cd(N03)2-4H20, in good agreement with the respective T0(transport) values of 202 ± 3 K and 194 ± 3 K salts obtained from analysis of the temperature dependence of liquid mass transport processes.
Introduction
In recent years the physicochemical properties of molten calcium nitrate tetrahydrate have been the subject of a number of investigations. These include studies of conductance,1' 3 shear viscosity,3 impurity ion self-diffusion coefficients,4 bulk viscosity,5 and glass transition temperature.6 Much of the interest in calcium nitrate tetrahydrate has been motivated by the relative ease with which it can be cooled below its melting point of 42.5° and by the fact that it can be studied in the vitreous state for the case of small samples rapidly cooled. The glass transition temperature, according to dta studies, falls at 217 K.6
As is commonly found in the case of easily supercooled liquids, the mass transport properties near and below the melting point do not follow the familiar Arrhenius equation, but rather are well described by the empirical Vogel- Tammann-Fulcher (VTF) equation7
W(T) - A T ~ 1/2 exp (-B /T - T0) (1)where W(T) is the transport property of interest, e.g., conductance or fluidity and A, B, and T0 are constants. T0, which has the dimensions of temperature, replaces 0°K in the Arrhenius equation as the temperature of vanishing ionic mobility and has been called an “ ideal” glass transition temperature by various authors.
Several theories for eq l 8-11 attribute thermodynamic significance to T0 suggesting that if the liquid could be cooled to this temperature while in a state of internal equilibrium, the magnitude of some thermodynamic quantity which determines the state of the liquid would fall to zero. In the most plausible of such theories, due to Adam and Gibbs,10 the thermodynamic quantity which vanishes at T0 is the configurational part of the total liquid entropy. In accord with such interpretations, T0 for Ca(N03)2-4H20 has been found to have a value almost independent of the transport process studied. A T0 value
of 201 K is found from conductance measurements in the temperature range 0-70°, while shear viscosity studies yield a slightly higher value of 205 K.3 Either value is consistent with data on impurity ion self-diffusion coefficients4 and bulk viscosity.5
Unfortunately, this appealing interpretation of eq 1 is clouded by the recent findings of Ambrus, Moynihan, and Macedo.12 These authors demonstrated that, when similar measurements are performed at lower temperatures and analyzed according to eq 1, not only do the best-fit values of T0 fall systematically below those previously obtained, but the T0 values for different transport processes are no longer in agreement. These discrepancies become greater the lower the temperature range of the data considered. Clearly these results raise doubt about the significance of the process-independent T0 values obtained in the higher temperature region.
The object of the present work was to determine whether the latter T0 values could be substantiated by some direct thermodynamic measurement. For the case of congruent melting compounds such as Ca(N03)2-4H20, a calorimetric method may be used to estimate the temperature at which the excess entropy of the liquid would vanish and hence to determine directly a value of T0 which is consistent with the Adams and Gibbs interpretation of the parameter in eq 1.
The method of estimation, which is described in detail elsewhere,13 is based on Kauzmann’s original observation that liquids, by virtue of their larger heat capacities, lose more entropy than corresponding crystals when both are cooled over the same temperature interval. Since the entropy of the liquid at the equilibrium melting point only exceeds that of the solid by the entropy of fusion, ASf , a liquid can evidently only be supercooled a limited number of degrees, i.e., to a temperature T0, before its total entropy falls to that of the crystal. To avoid conflict with the
The Journal of Physical Chemistry. Vol. 78. No. 3. 1974
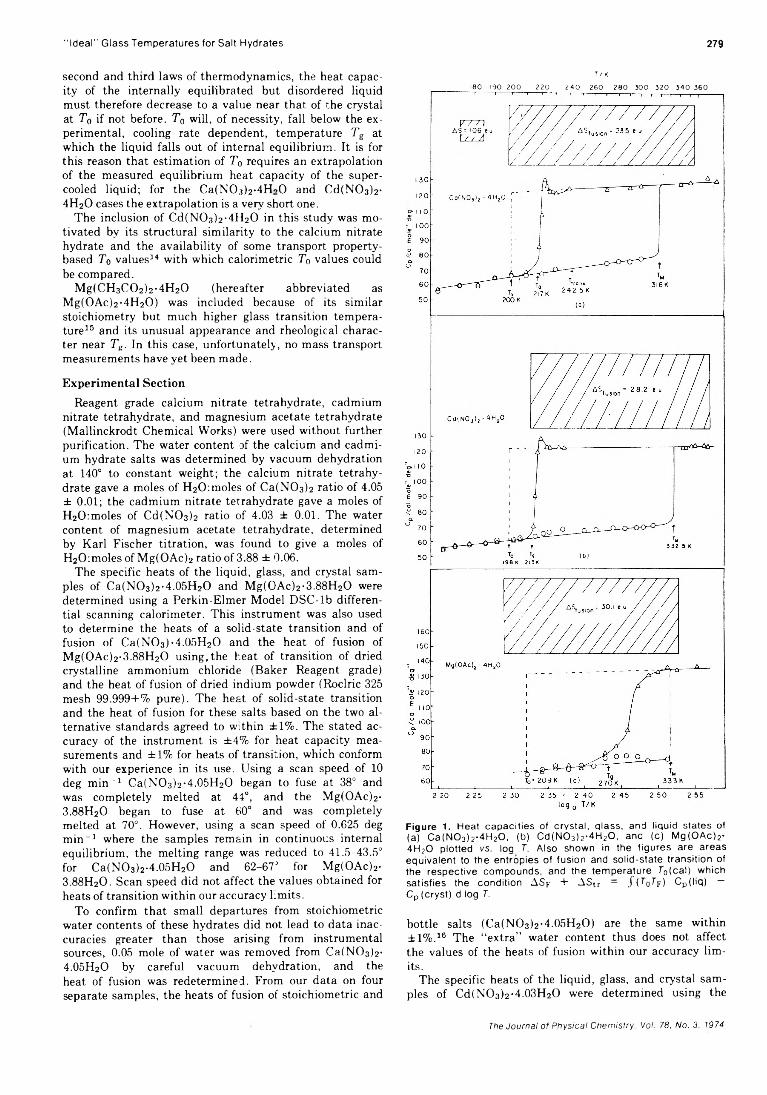
“ Ideal” Glass Tem peratures tor Salt Hydrates 279
second and third laws of thermodynamics, the heat capacity of the internally equilibrated but disordered liquid must therefore decrease to a value near that of the crystal at T0 if not before. T0 will, of necessity, fall below the experimental, cooling rate dependent, temperature Tg at which the liquid falls out of internal equilibrium. It is for this reason that estimation of T0 requires an extrapolation of the measured equilibrium heat capacity of the supercooled liquid; for the Ca(N03)2-4Ho0 and Cd(NC>3)2- 4H2O cases the extrapolation is a very short one.
The inclusion of Cd(N03)2-4H20 in this study was motivated by its structural similarity to the calcium nitrate hydrate and the availability of some transport property- based To values14 with which calorimetric T0 values could be compared.
Mg(CHsC02)2-4H20 (hereafter abbreviated as Mg(0 Ac)2-4H20) was included because of its similar stoichiometry but much higher glass transition temperature15 and its unusual appearance and rheological character near Tg. In this case, unfortunately, no mass transport measurements have yet been made.
Experimental SectionReagent grade calcium nitrate tetrahydrate, cadmium
nitrate tetrahydrate, and magnesium acetate tetrahydrate (Mallinckrodt Chemical Works) were used without further purification. The water content of the calcium and cadmium hydrate salts was determined by vacuum dehydration at 140° to constant weight; the calcium nitrate tetrahydrate gave a moles of H^Oimoles of Ca(NC>3)2 ratio of 4.05 ± 0.01; the cadmium nitrate tetrahydrate gave a moles of H20:moles of Cd(NC>3)2 ratio of 4.03 ± 0.01. The water content of magnesium acetate tetrahydrate, determined by Karl Fischer titration, was found to give a moles of H20:moles of Mg(OAc)2 ratio of 3.88 ± 0.06.
The specific heats of the liquid, glass, and crystal samples of Ca(NO3)2-4.05H2O and Mg(0 Ac)2-3.88H20 were determined using a Perkin-Elmer Model DSC-lb differential scanning calorimeter. This instrument was also used to determine the heats of a solid-state transition and of fusion of Ca(NO3)-4.05H2O and the heat of fusion of Mg(0 Ac)2-3.88H20 using, the heat of transition of dried crystalline ammonium chloride (Baker Reagent grade) and the heat of fusion of dried indium powder (Roclric 325 mesh 99.999+% pure). The heat of solid-state transition and the heat of fusion for these salts based on the two alternative standards agreed to within ±1%. The stated accuracy of the instrument is ±4% for heat capacity measurements and ± 1% for heats of transition, which conform with our experience in its use. Using a scan speed of 10 deg min' 1 Ca(NO3)2-4.05H2O began to fuse at 38° and was completely melted at 44°, and the Mg(OAc)2- 3.88H2O began to fuse at 60° and was completely melted at 70°. However, using a scan speed of 0.625 deg min-1 where the samples remain in continuous internal equilibrium, the melting range was reduced to 41.5-43.5° for Ca(NO3)2-4.05H2O and 62-67° for Mg(OAc)2- 3.88H2O. Scan speed did not affect the values obtained for heats of transition within our accuracy limits.
To confirm that small departures from stoichiometric water contents of these hydrates did not lead to data inaccuracies greater than those arising from instrumental sources, 0.05 mole of water was removed from CaiNCUU- 4.O5H2O by careful vacuum dehydration, and the heat of fusion was redetermined. From our data on four separate samples, the heats of fusion of stoichiometric and
t / k
10 0 19 0 2 0 0 2 2 0 2 4 0 2 6 0 2 8 0 3 0 0 3 2 0 3 4 0 3 6 0
Figure 1. Heat capacities of crystal, qlass, and liquid states of (a) Ca(N03)2-4H20, (b) Cd(N03)2-4H20, and (c) Mg(OAc)2- 4H20 plotted ys. log T. Also shown In the figures are areas equivalent to the entropies of fusion and solid-state transition of the respective compounds, and the temperature T0(cal) which satisfies the condition ASF + AStr = j (T 0T¥) Cp(llq) — Cp (cryst) d log T.
bottle salts (Ca(NO3)2'4.05H2O) are the same within ±1%.16 The “ extra” water content thus does not affect the values of the heats of fusion within our accuracy limits.
The specific heats of the liquid, glass, and crystal samples of Cd(NO3)2-4.03H2O were determined using the
The Journal of Physical Chemistry, Vol. 78. No. 3. 1974
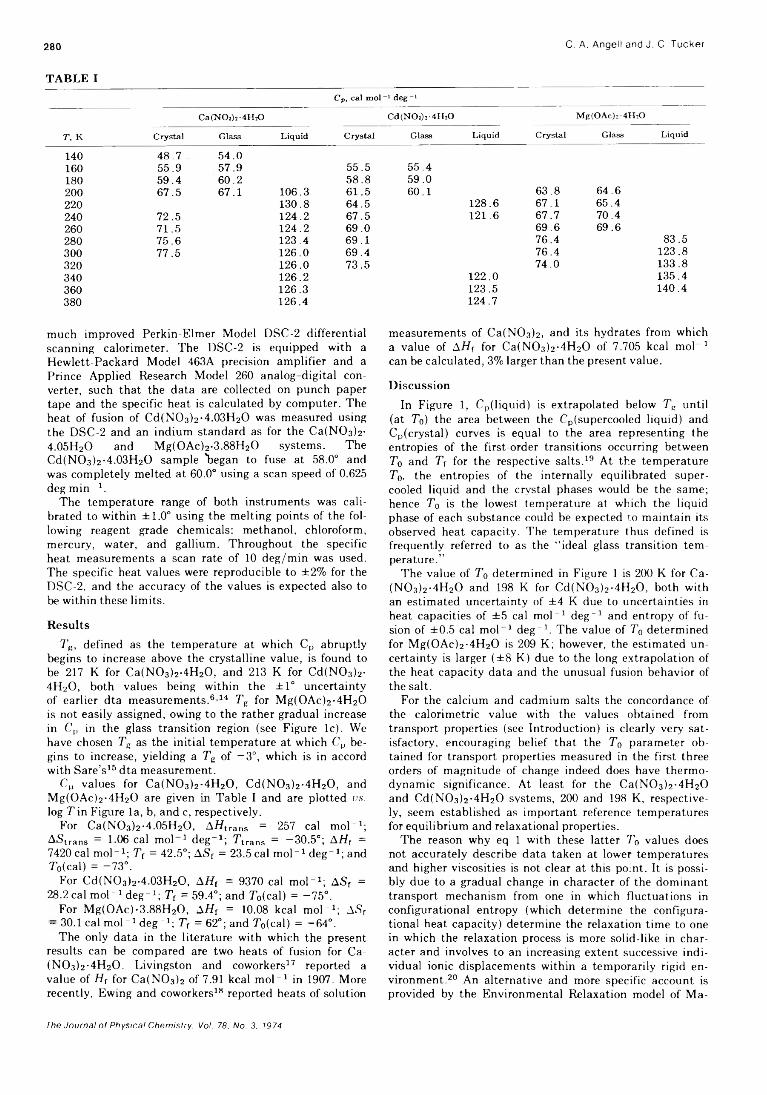
280 C. A. Angelí and J. C. Tucker
TABLE ICp, cal mol-1 deg -1
CaCN03)2-4Hj0 0d(N0j)i-4H,0 Mg(0Ac)-4H20T, K Crystal Glass Liquid Crystal Glass Liquid Crystal Glass Liquid
140 48.7 54.0160 55.9 57.9 55.5180 59.4 60.2 58.8200 67.5 67.1 106.3 61.5220 130.8 64.5240 72.5 124.2 67.5260 71.5 124.2 69.0280 75.6 123.4 69.1300 77.5 126.0 69.4320 126.0 73.5340 126.2360 126.3380 126.4
much improved Perkin-Elmer Model DSC-2 differential scanning calorimeter. The DSC-2 is equipped with a Hewlett-Packard Model 463A precision amplifier and a Prince Applied Research Model 260 analog-digital converter, such that the data are collected on punch paper tape and the specific heat is calculated by computer. The heat of fusion of Cd(NO3)2-4.03H2O was measured using the DSC-2 and an indium standard as for the Ca(N03)2- 4.05H2O and M g(0Ac)2-3.88H20 systems. The Cd(NO3)2-4.03H2O sample 'began to fuse at 58.0° and was completely melted at 60.0° using a scan speed of 0.625 deg min -1 .
The temperature range of both instruments was calibrated to within ± 1.0° using the melting points of the following reagent grade chemicals: methanol, chloroform, mercury, water, and gallium. Throughout the specific heat measurements a scan rate of 10 deg/min was used. The specific heat values were reproducible to ±2% for the DSC-2. and the accuracy of the values is expected also to be within these limits.
Results7',,, defined as the temperature at which Cp abruptly
begins to increase above the crystalline value, is found to be 217 K for Ca(N03)2-4H20, and 213 K for Cd(N03)2- 4H20, both values being within the ±1° uncertainty of earlier dta measurements.614 Tg for M g(0Ac)2-4H20 is not easily assigned, owing to the rather gradual increase in Cp in the glass transition region (see Figure lc). We have chosen Tg as the initial temperature at which Cp begins to increase, yielding a Tg of -3°, which is in accord with Sare’s15 dta measurement.
Cp values for Ca(N03)2-4H20 , Cd(N03)2-4H20, and M g(0Ac)2-4H20 are given in Table I and are plotted us. log Tin Figure la, b, and c, respectively.
For Ca(NO3)2-4.05H2O, AHtrans = 257 cal mol-1; AStrans = 106 cal mol 1 deg-1 ; Ttrans = -30.5°; AH, = 7420 cal mol-1 ; T, = 42.5°; AS, = 23.5 cal mol-1 deg-1 ; and Tp(cal) = -73°.
For Cd(NO3)2-4.03H2O, AH, = 9370 cal mol-1 ; AS, =28.2 cal mol-1 deg-1 ; T, = 59.4°; and T0(cal) = -75°.
For Mg(0Ac)-3.88H20 , AH, = 10.08 kcal mol-1 ; ASf — 30.1 cal mol-1 deg-1 ; T, = 62°; and T0(cal) = —64°.
The only data in the literature with which the present results can be compared are two heats of fusion for Ca- (N 03)2-4H20 . Livingston and coworkers17 reported a value of H, for Ca(N03)2 of 7.91 kcal mol-1 in 1907. More recently, Ewing and coworkers18 reported heats of solution
55.459.060.1 63.8 64.6
128.6 67.1 65.4121.6 67.7 70.4
69.6 69.676.4 83.576.4 123.874.0 133.8
122.0 135.4123.5 140.4124.7
measurements of Ca(N03)2, and its hydrates from whicha value of AH, for Ca(N03)2-4H20 of 7.705 kcal mol 1can be calculated, 3% larger than the present value.
DiscussionIn Figure 1, Cp(liquid) is extrapolated below Tg until
(at T0) the area between the Cp(supercooled liquid) and Cp(crystal) curves is equal to the area representing the entropies of the first-order transitions occurring between T0 and T, for the respective salts.19 At the temperature T0, the entropies of the internally equilibrated supercooled liquid and the crystal phases would be the same; hence T0 is the lowest temperature at which the liquid phase of each substance could be expected zo maintain its observed heat capacity. The temperature thus defined is frequently referred to as the “ ideal glass transition temperature.”
The value of T0 determined in Figure 1 is 200 K for Ca- (N 03)2-4H20 and 198 K for Cd(N03)2-4H20 , both with an estimated uncertainty of ±4 K due to uncertainties in heat capacities of ±5 cal mol-1 deg-1 and entropy of fusion of ±0.5 cal mol 1 deg-1. The value of T0 determined for M g(0Ac)2-4H20 is 209 K; however, the estimated uncertainty is larger (±8 K) due to the long extrapolation of the heat capacity data and the unusual fusion behavior of the salt.
For the calcium and cadmium salts the concordance of the calorimetric value with the values obtained from transport properties (see Introduction) is clearly very satisfactory, encouraging belief that the T0 parameter obtained for transport properties measured in the first three orders of magnitude of change indeed does have thermodynamic significance. At least for the Ca(N03)2-4H20 and Cd(N03)2-4H20 systems, 200 and 198 K, respectively, seem established as important reference temperatures for equilibrium and relaxational properties.
The reason why eq 1 with these latter T0 values does not accurately describe data taken at lower temperatures and higher viscosities is not clear at this point. It is possibly due to a gradual change in character of the dominant transport mechanism from one in which fluctuations in configurational entropy (which determine the configurational heat capacity) determine the relaxation time to one in which the relaxation process is more solid-like in character and involves to an increasing extent successive individual ionic displacements within a temporarily rigid environment.20 An alternative and more specific account is provided by the Environmental Relaxation model of Ma-
The Journal of Physical Chemistry. Vol. 78. No. 3. 1974
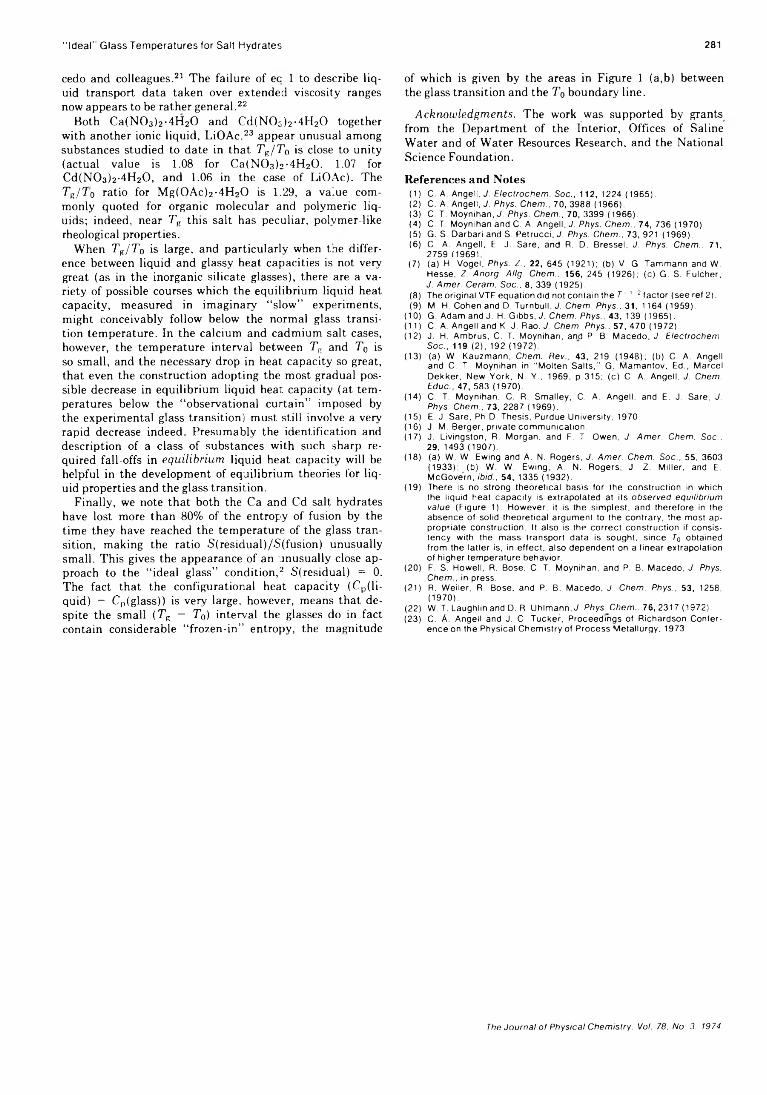
"Ideal” Glass Temperatures for Salt Hydrates 281
cedo and colleagues.21 The failure of ec 1 to describe liquid transport data taken over extended viscosity ranges now appears to be rather general.22
Both Ca(N03)2-4H20 and Cd(N0 s)2-4H20 together with another ionic liquid, LiOAc,23 appear unusual among substances studied to date in that Tg/T 0 is close to unity (actual value is 1.08 for Ca(N03)2-4H20. 1.07 forCd(N03)2-4H20 , and 1.06 in the case of LiOAc). The Tg/To ratio for Mg(0 Ac)2-4H20 is 1.29, a value commonly quoted for organic molecular and polymeric liquids; indeed, near Tg this salt has peculiar, polvmer-like rheological properties.
When Tg/To is large, and particularly when the difference between liquid and glassy heat capacities is not very great (as in the inorganic silicate glasses), there are a variety of possible courses which the equilibrium liquid heat capacity, measured in imaginary “ slow” experiments, might conceivably follow below the normal glass transition temperature. In the calcium and cadmium salt cases, however, the temperature interval between Tg and T0 is so small, and the necessary drop in heat capacity so great, that even the construction adopting the most gradual possible decrease in equilibrium liquid heat capacity (at temperatures below the “ observational curtain” imposed by the experimental glass transition) must still involve a very rapid decrease indeed. Presumably the identification and description of a class of substances with such sharp required fall-offs in equilibrium liquid heat capacity will be helpful in the development of equilibrium theories for liquid properties and the glass transition.
Finally, we note that both the Ca and Cd salt hydrates have lost more than 80% of the entropy of fusion by the time they have reached the temperature of the glass transition, making the ratio S(residual)/S(fusion) unusually small. This gives the appearance of an unusually close approach to the “ ideal glass” condition,2 S(residual) = 0. The fact that the configurational heat capacity (Cp (liquid) - Cp(glass)) is very large, however, means that despite the small (TR - T0) interval the glasses do in fact contain considerable “ frozen-in” entropy, the magnitude
of which is given by the areas in Figure 1 (a,b) between the glass transition and the T0 boundary line.
Acknowledgments. The work was supported by grants from the Department of the Interior, Offices of Saline Water and of Water Resources Research, and the National Science Foundation.
References and Notes(1) C. A. Angell, J. Electrochem. Soc., 112, 1224 (1965).(2) C. A. Angell, J. Phys. Chem., 70, 3988 (1966).(3) C. T. M oynihan, J. Phys. Chem.. 70, 3399 (1966).(4) C. T. M oynihan and C. A. Angell, J. Phys. Chem., 74, 736 (1970).(5) G. S. D arbari and S. P étrucc i, J. Phys. Chem.. 73, 921 (1969).¡6) C. A. Angell, E. J. Sare, and R. D. Bressel, J. Phys. Chem.. 71,
2759 119691(7) (a) H. Vogel, Phys. Z.. 22, 645 (1921); (b) V. G. Tam m ann and W.
Hesse, Z. Anorg. Allg. Chem.. 156, 245 (1926); (c) G. S. Fu lcher, J. Amer. Ceram. Soc.. 8, 339 (1925).
(8) The o rig ina l VTF equation d id not conta in the 7 “'<2 fa c to r (see ref 2).(9) M. H. Cohen and D. Turnbull, J. Chem. Phys.. 31, 1164 (1959).
(10) G. Adam and J. H. G ibbs, J. Chem. Phys., 43. 139 (1965).(11) C. A. Angell and K. J. Rao, J. Chem. Phys.. 57, 470 (1972).(12) J. H. Am brus, C. T. M oynihan, and P. B. M acedo, J. Electrochem.
Soc., 119 (2), 192 (1972).(13) (a) W. Kauzm ann, Chem. Rev.. 43, 219 (1948); (b) C. A. Angell
and C. T. M oynihan in "M o lten S a lts ," G. M am antov, Ed., M arcel D ekker, New Y ork, N. Y., 1969, p 315; (c) C. A. Angell, J. Chem. Educ., AT, 583 (1970).
(14) C. T. M oynihan, C. R. Sm alley, C. A. Angell, and E. J. Sare, J. Phys. Chem., 73, 2287 (1969).
(15) E. J. Sare, Ph.D. Thesis, Purdue U niversity, 1970.(16) J. M. Berger, p riva te com m un ica tion .(17) J. L iv ingston, R. M organ, and F. T. Owen, J. Amer. Chem. Soc..
29, 1493 (1907).(18) (a) W. W. Ewing and A. N. Rogers, J. Amer. Chem. Soc., 55, 3603
(1933); (b) W. W. Ewing, A. N. Rogers, J. Z. M iller, and E. M cGovern, ibid., 54, 1335 (1932).
(19) There is no strong theore tica l basis fo r the construc tion in which the liquid heat capac ity is extrapola ted at Its observed equilibrium value (F igure 1). H owever, it is the s im plest, and there fore In the absence o f solid theore tica l argum ent to the contra ry , the most ap p ropria te construc tion . It also is the c o rre c t construc tion if cons is tency w ith the m ass transport data is sought, s ince 70 obtained from the la tte r is, in e ffe c t, a lso dependent on a linear extrapolation of h igher tem pera ture behavior.
(20) F. S. H owell, R. Bose, C. T. Moynihan, and P. B. M acedo, J. Phys. Chem., in press.
(21) R. W eiler, R. Bose, and P. B. M acedo, J. Chem. Phys., 53, 1258, (1970).
(22) W. T. Laughlin and D. R. U hlm ann, J. Phys. Chem.. 76, 2317 (1972).(23) C. A. Angell and J. C. Tucker, P roceedings of R ichardson C onfer
ence on the Physical C hem istry o f P rocess M eta llu rgy, 1973.
The Journal of Physical Chemistry. Vol. 78. No. 3. 1974
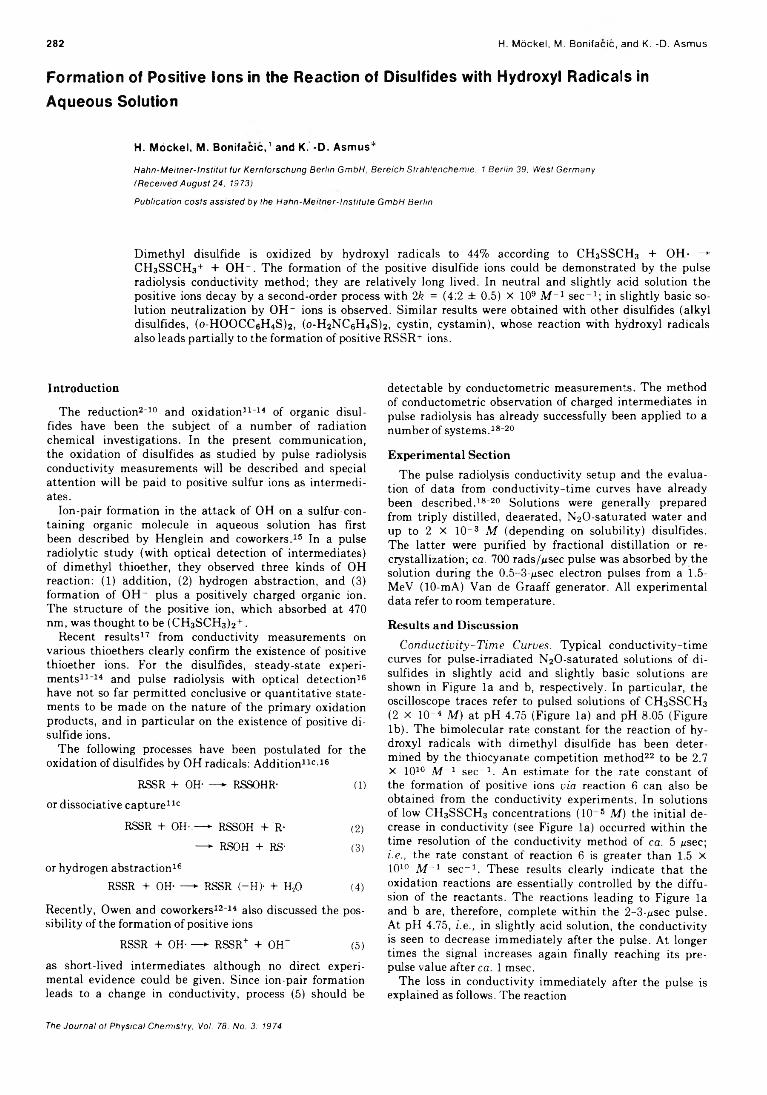
282 H. Möckel, M. Bonifacic, and K. -D. Asmus
Formation of Positive ions in the Reaction of Disulfides with Hydroxyl Radicals in Aqueous Solution
H. Möckel, M. Bonifacic,1 and K. -D. Asmus*
Hahn-Meitner-Institut für Kernforschung Berlin GmbH, Bereich Strahlenchemie, 1 Berlin 39, West Germany (Received August 24, 1973)
Publication costs assisted by the Hahn-Meitner-lnstitute GmbH Berlin
Dimethyl disulfide is oxidized by hydroxyl radicals to 44% according to CH3 SSCH3 + OH- —*■ CH3 SSCH3+ + OH” . The formation of the positive disulfide ions could be demonstrated by the pulse radiolysis conductivity method; they are relatively long lived. In neutral and slightly acid solution the positive ions decay by a second-order process with 2k = (4:2 ± 0.5) x 109 M " 1 sec-1 ; in slightly basic solution neutralization by OH” ions is observed. Similar results were obtained with other disulfides (alkyl disulfides, (o-HOOCC6 H 4 S)2, (o-H2 NCeH4 S)2, cystin, cystamin), whose reaction with hydroxyl radicals also leads partially to the formation of positive RSSR+ ions.
Introduction
The reduction2-10 and oxidation11-14 of organic disulfides have been the subject of a number of radiation chemical investigations. In the present communication, the oxidation of disulfides as studied by pulse radiolysis conductivity measurements will be described and special attention will be paid to positive sulfur ions as intermediates.
Ion-pair formation in the attack of OH on a sulfur-containing organic molecule in aqueous solution has first been described by Henglein and coworkers.15 In a pulse radiolytic study (with optical detection of intermediates) of dimethyl thioether, they observed three kinds of OH reaction: (1) addition, (2) hydrogen abstraction, and (3) formation of OH” plus a positively charged organic ion. The structure of the positive ion, which absorbed at 470 nm, was thought to be (CH3SCH3)2+ .
Recent results17 from conductivity measurements on various thioethers clearly confirm the existence of positive thioether ions. For the disulfides, steady-state experiments11-14 and pulse radiolysis with optical detection16 have not so far permitted conclusive or quantitative statements to be made on the nature of the primary oxidation products, and in particular on the existence of positive disulfide ions.
The following processes have been postulated for the oxidation of disulfides by OH radicals: Addition110-16
RSSR + OH-- —* RSSOHR- (1)or dissociative capture110
RSSR + OH-.—* RSSOH + R- (2)— RSOH + RS- (3)
or hydrogen abstraction16RSSR + OH----- * RSSR (—H> + H20 (4)
Recently, Owen and coworkers12-14 also discussed the possibility of the formation of positive ions
RSSR + OH- —► RSSR+ + OH“ (5)as short-lived intermediates although no direct experimental evidence could be given. Since ion-pair formation leads to a change in conductivity, process (5) should be
detectable by conductometric measurements. The method of conductometric observation of charged intermediates in pulse radiolysis has already successfully been applied to a number of systems.18-20
Experimental Section
The pulse radiolysis conductivity setup and the evaluation of data from conductivity-time curves have already been described.18-20 Solutions were generally prepared from triply distilled, deaerated, N20-saturated water and up to 2 x 10" 3 M (depending on solubility) disulfides. The latter were purified by fractional distillation or recrystallization; ca. 700 rads//¿sec pulse was absorbed by the solution during the 0.5- 3-/isec electron pulses from a 1.5- MeV (10-mA) Van de Graaff generator. All experimental data refer to room temperature.
Results and Discussion
Conductivity-Time Curves. Typical conductivity-time curves for pulse-irradiated N20-saturated solutions of disulfides in slightly acid and slightly basic solutions are shown in Figure la and b, respectively. In particular, the oscilloscope traces refer to pulsed solutions of CH3SSCH3 (2 x 10" 4 M) at pH 4.75 (Figure la) and pH 8.05 (Figure lb ) . The bimolecular rate constant for the reaction of hydroxyl radicals with dimethyl disulfide has been determined by the thiocyanate competition method22 to be 2.7 X 10¹⁰ M ” 1 sec-1 . An estimate for the rate constant of the formation of positive ions via reaction 6 can also be obtained from the conductivity experiments. In solutions of low CH3SSCH3 concentrations (10 5 M) the initial decrease in conductivity (see Figure la) occurred within the time resolution of the conductivity method of ca. 5 /¿sec; i.e., the rate constant of reaction 6 is greater than 1.5 X 10¹⁰ M " 1 sec-1 . These results clearly indicate that the oxidation reactions are essentially controlled by the diffusion of the reactants. The reactions leading to Figure la and b are, therefore, complete within the 2-3-^sec pulse. At pH 4.75, i.e., in slightly acid solution, the conductivity is seen to decrease immediately after the pulse. At longer times the signal increases again finally reaching its prepulse value after ca. 1 msec.
The loss in conductivity immediately after the pulse is explained as follows. The reaction
The Journal of Physical Chemistry, Vol. 78. No. 3. 1974
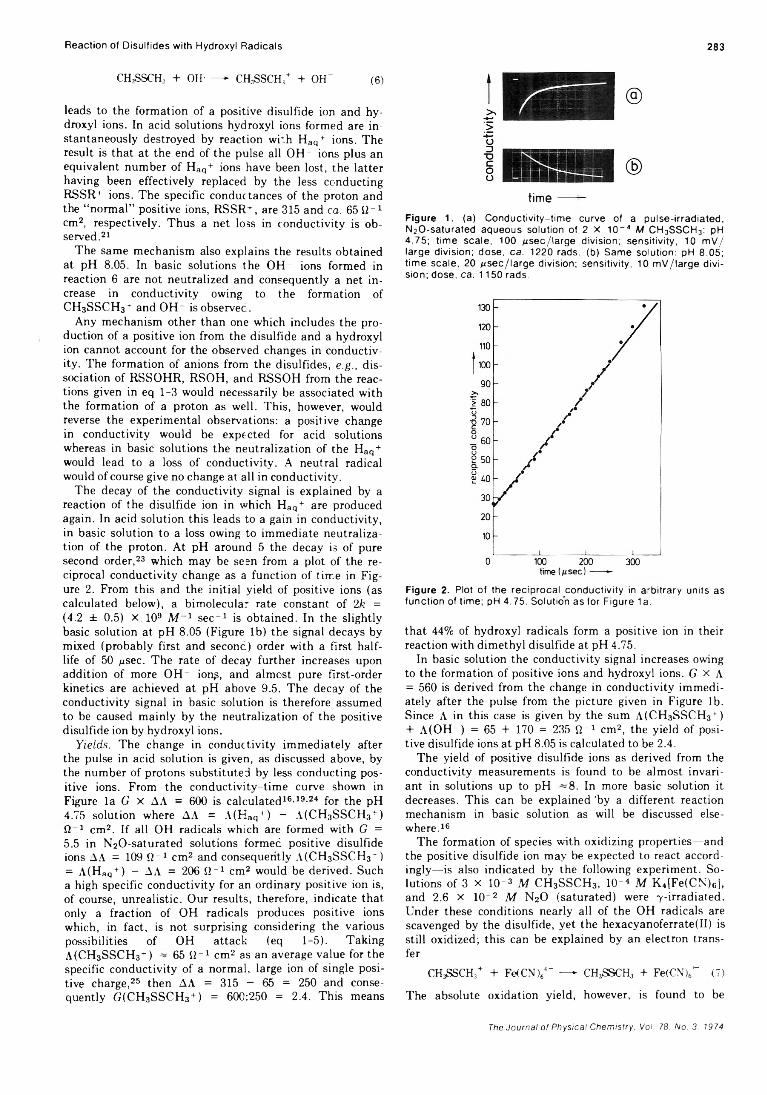
Reaction of Disulfides with Hydroxyl Radicals 283
CH3SSCH3 + OH- — CH3SSCH,+ + OH” (6)
leads to the formation of a positive disulfide ion and hydroxyl ions. In acid solutions hydroxyl ions formed are instantaneously destroyed by reaction with Haq+ ions. The result is that at the end of the pulse all OH" ions plus an equivalent number of Haq+ ions have been lost, the latter having been effectively replaced by the less conducting RSSR+ ions. The specific conductances of the proton and the “ normal” positive ions, RSSR+, are 315 and ca. 65 S2" 1 cm2, respectively. Thus a net loss in conductivity is observed.21
The same mechanism also explains the results obtained at pH 8.05. In basic solutions the OH" ions formed in reaction 6 are not neutralized and consequently a net increase in conductivity owing to the formation of CH3SSCH31- and OH- is observec.
Any mechanism other than one which includes the production of a positive ion from the disulfide and a hydroxyl ion cannot account for the observed changes in conductivity. The formation of anions from the disulfides, e.g., dissociation of RSSOHR, RSOH, and RSSOH from the reactions given in eq 1-3 would necessarily be associated with the formation of a proton as well. This, however, would reverse the experimental observations: a positive change in conductivity would be expected for acid solutions whereas in basic solutions the neutralization of the Haq+ would lead to a loss of conductivity. A neutral radical would of course give no change at all in conductivity.
The decay of the conductivity signal is explained by a reaction of the disulfide ion in which Haq+ are produced again. In acid solution this leads to a gain in conductivity, in basic solution to a loss owing to immediate neutralization of the proton. At pH around 5 the decay is of pure second order,23 which may be seen from a plot of the reciprocal conductivity change as a function of time in Figure 2. From this and the initial yield of positive ions (as calculated below), a bimolecular rate constant of 2k = (4.2 ± 0.5) x 109 M 1 sec-1 is obtained. In the slightly basic solution at pH 8.05 (Figure lb) the signal decays by mixed (probably first and seconc) order with a First half- life of 50 ¿¿sec. The rate of decay further increases upon addition of more OH" ionp, and almost pure first-order kinetics are achieved at pH above 9.5. The decay of the conductivity signal in basic solution is therefore assumed to be caused mainly by the neutralization of the positive disulfide ion by hydroxyl ions.
Yields. The change in conductivity immediately after the pulse in acid solution is given, as discussed above, by the number of protons substituted by less conducting positive ions. From the conductivity-time curve shown in Figure la G x AA = 600 is calculated16-19-24 for the pH 4.75 solution where AA = A(Haq+) - A(CH3SSCH3+) S I1 cm2. If all OH radicals which are formed with G =5.5 in N20-saturated solutions formed positive disulfide ions AA = 109 SI" 1 cm2 and consequently A(CHsSSCH3+) = A(Haq + ) — AA = 206 SI-1 cm2 would be derived. Such a high specific conductivity for an ordinary positive ion is, of course, unrealistic. Our results, therefore, indicate that only a fraction of OH radicals produces positive ions which, in fact, is not surprising considering the various possibilities of OH attack (eq 1-5). Taking A(CH3SSCH3+) ~ 65 SI" 1 cm2 as an average value for the specific conductivity of a normal, large ion of single positive charge,25 then AA = 315 — 65 = 250 and consequently G(CH3SSCH3+) = 600:250 = 2.4. This means
timeF igu re 1. (a) Conductivity-time curve of a pulse-irradiated, NsO-saturated aqueous solution of 2 X 10” 4 M C H 3S S C H 3 : pH 4.75; time scale, 100 jisec/large division; sensitivity, 10 m V / large division; dose, ca. 1220 rads, (b) Same solution: pH 8.05; time scale, 20 ^sec/large division; sensitivity, 10 m V/large division; dose, ca. 1150 rads.
F igure 2. Plot of the reciprocal conductivity in arbitrary units as function of time; pH 4.75. Solution as for Figure 1a.
that 44% of hydroxyl radicals form a positive ion in their reaction with dimethyl disulfide at pH 4.75.
In basic solution the conductivity signal increases owing to the formation of positive ions and hydroxyl ions. G X A = 560 is derived from the change in conductivity immediately after the pulse from the picture given in Figure lb. Since A in this case is given by the sum A(CH3SSCH3+) + A(OH~) = 65 + 170 = 235 fl-1 cm2, the yield of positive disulfide ions at pH 8.05 is calculated to be 2.4.
The yield of positive disulfide ions as derived from the conductivity measurements is found to be almost invariant in solutions up to pH ~ 8. In more basic solution it decreases. This can be explained 'by a different reaction mechanism in basic solution as will be discussed elsewhere.16
The formation of species with oxidizing properties—and the positive disulfide ion may be expected to react accordingly—is also indicated by the following experiment. Solutions of 3 x 10"3 M CH3SSCH3, 10"4 M K4[Fe(CN)6], and 2.6 X 10" 2 M N2O (saturated) were 7-irradiated. Under these conditions nearly all of the OH radicals are scavenged by the disulfide, yet the hexacyanoferrate(II) is still oxidized; this can be explained by an electron transfer
CH3SSCH3+ + Fe(CN )64- — CH3SSCH3 + FeiCN)/- (7)
The absolute oxidation yield, however, is found to be
The Journal of Physical Chemistry. Vol. 78. No. 3. 1974
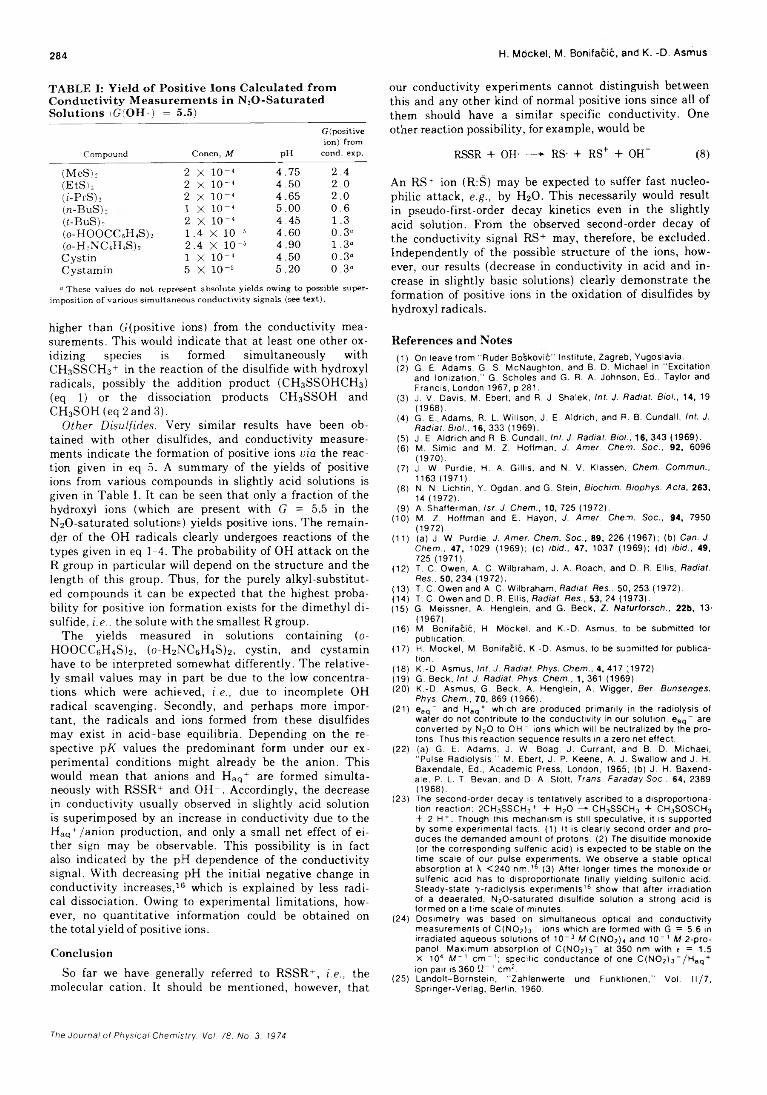
284 H. MOckel, M. Bonifacic, and K. -D. Asmus
TABLE I: Yield o f Positive Ions Calculated from Conductivity M easurem ents in N aO-SaturatedSolutions (G(OH ) = 5.5)
Compound Concn, M pH
G (positive ion) from cond. exp.
(MeS); 2 X 10⁻⁴ 4.75 2 . 4(EtS), 2 X 1 0 -4 4.50 2 . 0(¿-PrS) 3 2 X 10⁻⁴ 4.65 2 . 0(re-BuS)» X X 10-4 5.00 0 . 6(i-BuS) 3 2 X 10⁻⁴ 4.45 1 . 3(o-HOOCC6H 4S) 2 1 .4 X 10-5 4.60 0 .3 “(o-H 2N C 6H 4S) 2 2 .4 X 10-5 4.90 1 .3 “Cystin 1 X 10⁻⁴ 4.50 0 .3 “Cystamin 5 X 10⁻⁵ 5.20 0 .3 “
a These values do not represent absolute yields owing to possible superimposition of various simultaneous conductivity signals (see text).
higher than G (positive ions) from the conductivity measurements. This would indicate that at least one other oxidizing species is formed simultaneously with CH3SSCH3+ in the reaction of the disulfide with hydroxyl radicals, possibly the addition product (CH3SSOHCH3) (eq 1) or the dissociation products CH3SSOH and CH3SOH (eq 2 and 3).
Other Disulfides. Very similar results have been obtained with other disulfides, and conductivity measurements indicate the formation of positive ions via the reaction given in eq 5. A summary of the yields of positive ions from various compounds in slightly acid solutions is given in Table I. It can be seen that only a fraction of the hydroxyl ions (which are present with G = 5.5 in the N2O-saturated solutions) yields positive ions. The remainder of the OH radicals clearly undergoes reactions of the types given in eq 1-4. The probability of OH attack on the R group in particular will depend on the structure and the length of this group. Thus, for the purely alkyl-substituted compounds it can be expected that the highest probability for positive ion formation exists for the dimethyl disulfide, i.e.. the solute with the smallest R group.
The yields measured in solutions containing (0- HOOCCeH4S)2, (o-H2NCeH4S)2, cystin, and cystamin have to be interpreted somewhat differently. The relatively small values may in part be due to the low concentrations which were achieved, i.e., due to incomplete OH radical scavenging. Secondly, and perhaps more important, the radicals and ions formed from these disulfides may exist in acid-base equilibria. Depending on the respective pK values the predominant form under our experimental conditions might already be the anion. This would mean that anions and Haq+ are formed simultaneously with RSSR+ and OH- . Accordingly, the decrease in conductivity usually observed in slightly acid solution is superimposed by an increase in conductivity due to the Haq+/anion production, and only a small net effect of either sign may be observable. This possibility is in fact also indicated by the pH dependence of the conductivity signal. With decreasing pH the initial negative change in conductivity increases,16 which is explained by less radical dissociation. Owing to experimental limitations, however, no quantitative information could be obtained on the total yield of positive ions.
ConclusionSo far we have generally referred to RSSR+, i.e., the
molecular cation. It should be mentioned, however, that
our conductivity experiments cannot distinguish between this and any other kind of normal positive ions since all of them should have a similar specific conductivity. One other reaction possibility, for example, would be
RSSR + OH- —* RS- + RS* + OH' (8)
An RS+ ion (R:S) may be expected to suffer fast nucleophilic attack, e.g., by H20 . This necessarily would result in pseudo-first-order decay kinetics even in the slightly acid solution. From the observed second-order decay of the conductivity signal RS+ may, therefore, be excluded. Independently of the possible structure of the ions, however, our results (decrease in conductivity in acid and increase in slightly basic solutions) clearly demonstrate the formation of positive ions in the oxidation of disulfides by hydroxyl radicals.
References and Notes(1) On leave from "R uder B o skov lc" Institu te , Zagreb, Yugoslavia.(2) G. E. Adam s, G. S. M cN aughton, and B. D. M ichael In “ Excitation
and Io n iza tion ," G. Scholes and G. R. A. Johnson, Ed., Taylor and Francis, London 1967, p 281.
(3) J. V. Davis, M. Ebert, and R. J. Shalek, Int. J. Radiat. Biol., 14, 19 (1968).
(4) G. E.. Adam s, R. L. W illson, J. E. A ld rich , and P. B. Cundall, Int. J. Radiat. Biol., 16, 333 (1969).
(5) J. E. A ldrich and R. B. Cundall, Int. J. Radiat. Biol., 16, 343 (1969).(6) M. S im lc and M. Z. H offm an, J. Amer. Chem. Soc., 92, 6096
(1970).(7) J. W. Purdle, H. A. G illls , and N. V. Klassen, Chem. Commun.,
1163 (1971).(8) N. N. L lchtin , Y. Ogdan. and G. Stein, Biochim. Biophys. Acta, 263,
14 (1972).(9) A. Shaffe rm an, Isr. J. Chem., 10, 725 (1972).
(10) M. Z. H offm an and E. Hayon, J. Amer. Chem. Soc., 94, 7950 (1972).
(11) (a) J. W. Purdle, J. Amer. Chem. Soc., 89, 226 (1967); (b) Can. J. Chem., 47, 1029 (1969); (c) ibid., 47, 1037 (1969); (d) ibid., 49, 725 (1971).
(12) T. C. Owen, A. C. W llbraham , J. A. Roach, and D. R. Ellis, Radiat. Res.. 50, 234 (1972).
(13) T. C. Owen and A. C. W llbraham , Radiat. Res.. 50, 253 (1972).(14) T. C. Owen and D. R. E llis, Radiat. Res., 53, 24 (1973).(15) G. M eissner, A. H engleln, and G. Beck, Z. Naturforsch., 22b, 13-
(1 96 7 ) .(16) M. B on ifac ic , H. M ocke l, and K .-D . Asm us, to be subm itted fo r
pub lication .(17) H. M ockel, M. B on ifac ic , K .-D . Asm us, to be suom itted fo r pub lica
tion.(18) K .-D . Asm us, Int. J. Radiat. Phys. Chem., 4, 417 (1972).(19) G. Beck, Int. J. Radiat. Phys. Chem., 1, 361 (1969).(20) K.-D . Asm us, G. Beck, A. H engleln, A. W lgger, Ber. Bunsenges.
Phys. Chem., 70, 869 (1966).(21) ea q - and Haq+ w hich are produced p rim a rily In the rad io lys is of
w ater do not contribu te to the conductiv ity In our solution. eaq- are converted by N20 to O H - Ions w hich w ill be neutralized by the protons. Thus th is reaction sequence results in a zero net e ffect.
(22) (a) G. E. Adam s, J. W. Boag, J. C urrant, and B. D. M ichael, “ Pulse R ad io lys is ," M. Ebert, J. P. Keene, A. J, S w allow and J. H. Baxendale, Ed., A cadem ic Press, London, 1965; (b) J. H. Baxend- a le, P. L. T. Bevan, and D. A. Stott, Trans. Faraday Soc.. 64, 2389(1 96 8 ) .
(23) The second-o rder decay is ten ta tive ly ascribed to a d isp roportiona tion reaction : 2CH3SSCH3+ + H20 — C H 3SSCH3 + CH 3SOSCH3 + 2 H + . Though th is m echan ism Is still specu la tive, it is supported by som e experim enta l facts . (1) It Is c lea rly second o rde r and produces the dem anded am ount o f p rotons. (2) The d isu lfide m onoxide (or the corresponding su lfen ic acid) is expected to be stab le on the tim e scale of our pu lse experim ents. We observe a s tab le optica l absorption at X < 2 4 0 n m .16 (3) A fte r longer tim es the m onoxide or su lfen ic ac id has to d isproportionate fin a lly yie ld ing su lfon ic acid . S teady-sta te y -ra d lo lys is e xpe rim en ts16 show tha t a fte r irrad ia tion of a deaerated, N20 -sa tu ra ted d isu lfide so lu tion a strong ac id Is fo rm ed on a tim e sca le of m inutes.
(24) D osim etry was based on s im ultaneous optica l and co nductiv ity m easurem ents o f C (N 0 2) 3- ions w hich are fo rm ed w ith G = 5.6 in Irrad ia ted aqueous so lutions o f 10 -3 M C (N 0 2)4 and 10“ 1 M 2 -pro - panol. M axim um absorption of C (N 0 2) 3~ at 350 nm w ith t = 1.5 X 10⁴ M~' c m - 1 ; spec ific conductance of one C (N 0 2) 3“ /H aq+ Ion pa ir Is 360 S C 1 cm 2.
(25) L ando lt-B orns te in , “ Zah lenw erte und Funktlonen ," Vol. I I /7 , S prlnger-V erlag, Berlin, 1960.
The Journal of Physical Chemistry. Vol. 78. No. 3. 1974
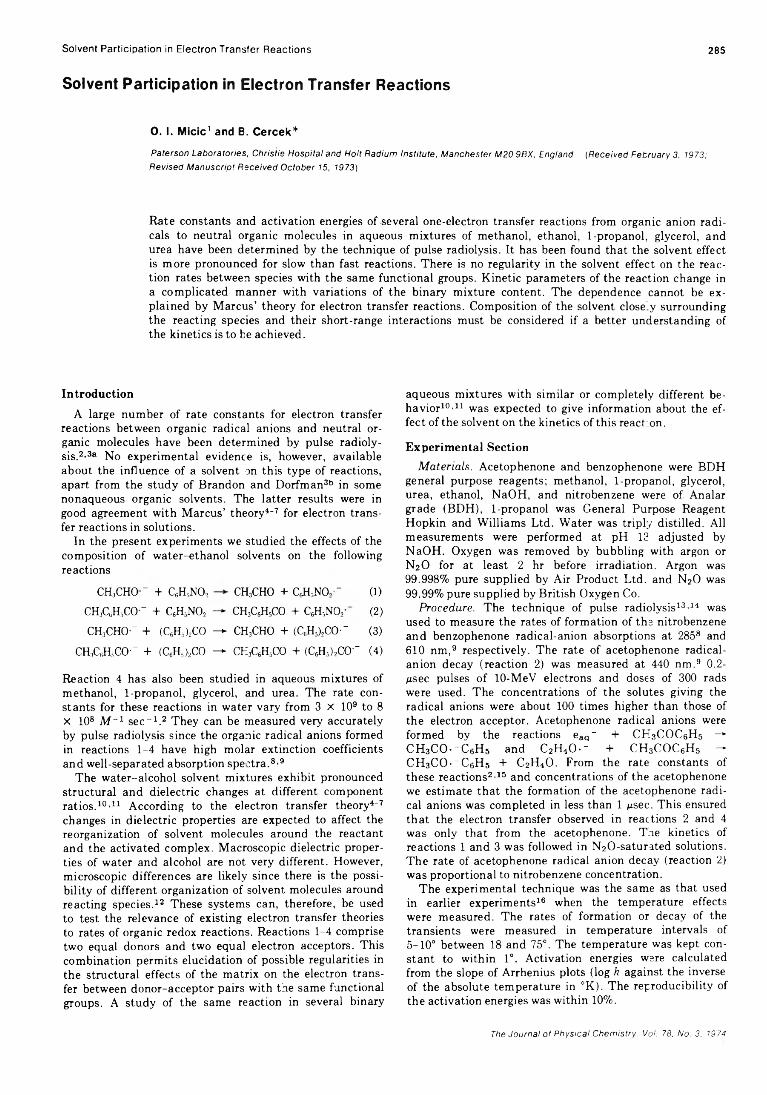
Solvent Participation in Electron Transfer Reactions 285
Solvent Participation in Electron Transfer Reactions
O. I. Micic1 and B. Cercek*
Paterson Laboratories, Christie Hospital and Holt Radium Institute, Manchester M20 9BX, England (Received February 3. 1973; Revised Manuscript Received October 15, 1973)
Rate constants and activation energies of several one-electron transfer reactions from organic anion radicals to neutral organic molecules in aqueous mixtures of methanol, ethanol, 1-propanol, glycerol, and urea have been determined by the technique of pulse radiolysis. It has been found that the solvent effect is more pronounced for slow than fast reactions. There is no regularity in the solvent effect on the reaction rates between species with the same functional groups. Kinetic parameters of the reaction change in a complicated manner with variations of the binary mixture content. The dependence cannot be explained by Marcus’ theory for electron transfer reactions. Composition of the solvent closely surrounding the reacting species and their short-range interactions must be considered if a better understanding of the kinetics is to be achieved.
Introduction
A large number of rate constants for electron transfer reactions between organic radical anions and neutral organic molecules have been determined by pulse radioly- sis.2'3a No experimental evidence is, however, available about the influence of a solvent on this type of reactions, apart from the study of Brandon and Dorfman3b in some nonaqueous organic solvents. The latter results were in good agreement with Marcus’ theory4' 7 for electron transfer reactions in solutions.
In the present experiments we studied the effects of the composition of water-ethanol solvents on the following reactions
CH3CHO “ + C6H,NOv CH3CHO + C6H„NO, “ (1)CH3C6H5CO ~ + C6H5NO, - * CH3C6H5CO + C6H5NO, " (2)CH3CHO“ + (CgH5)2CO - » CH3CHO + (C6H5)2CO-~ (3)
CRAHsCO“ + (C6H6)2CO — CEjAHsCO + (C6H5)2CCT (4)
Reaction 4 has also been studied in aqueous mixtures of methanol, 1-propanol, glycerol, and urea. The rate constants for these reactions in water vary from 3 X 10⁹ to 8 X 10⁸ M ~ 1 sec-1 .2 They can be measured very accurately by pulse radiolysis since the organic radical anions formed in reactions 1-4 have high molar extinction coefficients and well-separated absorption spectra.8’9
The water-alcohol solvent mixtures exhibit pronounced structural and dielectric changes at different component ratios.10-11 According to the electron transfer theory4-7 changes in dielectric properties are expected to affect the reorganization of solvent molecules around the reactant and the activated complex. Macroscopic dielectric properties of water and alcohol are not very different. However, microscopic differences are likely since there is the possibility of different organization of solvent molecules around reacting species.12 These systems can, therefore, be used to test the relevance of existing electron transfer theories to rates of organic redox reactions. Reactions 1-4 comprise two equal donors and two equal electron acceptors. This combination permits elucidation of possible regularities in the structural effects of the matrix on the electron transfer between donor-acceptor pairs with the same functional groups. A study of the same reaction in several binary
aqueous mixtures with similar or completely different behavior10-11 was expected to give information about the effect of the solvent on the kinetics of this reaction.
Experimental Section
Materials. Acetophenone and benzophenone were BDH general purpose reagents; methanol, 1-propanol, glycerol, urea, ethanol, NaOH, and nitrobenzene were of Analar grade (BDH), 1-propanol was General Purpose Reagent Hopkin and Williams Ltd. Water was triply distilled. All measurements were performed at pH 13 adjusted by NaOH. Oxygen was removed by bubbling with argon or N2O for at least 2 hr before irradiation. Argon was 99.998% pure supplied by Air Product Ltd. and N2O was 99.99% pure supplied by British Oxygen Co.
Procedure. The technique of pulse radiolysis13’14 was used to measure the rates of formation of the nitrobenzene and benzophenone radical-anion absorptions at 2858 and 610 nm,9 respectively. The rate of acetophenone radical- anion decay (reaction 2) was measured at 440 nm.9 0.2- p s e c pulses of 10-MeV electrons and doses of 300 rads were used. The concentrations of the solutes giving the radical anions were about 100 times higher than those of the electron acceptor. Acetophenone radical anions were formed by the reactions eaq- + CPI3COC6H5 —► CHsCO.-CeHs and C2H40 - - + CH3COC6H5 —CH3CO-_CeH5 + C2H4O. From the rate constants of these reactions2’15 and concentrations of the acetophenone we estimate that the formation of the acetophenone radical anions was completed in less than 1 p s e c . This ensured that the electron transfer observed in reactions 2 and 4 was only that from the acetophenone. The kinetics of reactions 1 and 3 was followed in NïO-saturated solutions. The rate of acetophenone radical anion decay (reaction 2) was proportional to nitrobenzene concentration.
The experimental technique was the same as that used in earlier experiments16 when the temperature effects were measured. The rates of formation or decay of the transients were measured in temperature intervals of5-10° between 18 and 75°. The temperature was kept constant to within 1°. Activation energies were calculated from the slope of Arrhenius plots (log k against the inverse of the absolute temperature in °K). The reproducibility of the activation energies was within 10%.
The Journal of Physical Chemistry. Vol. 78. No. 3. 1974
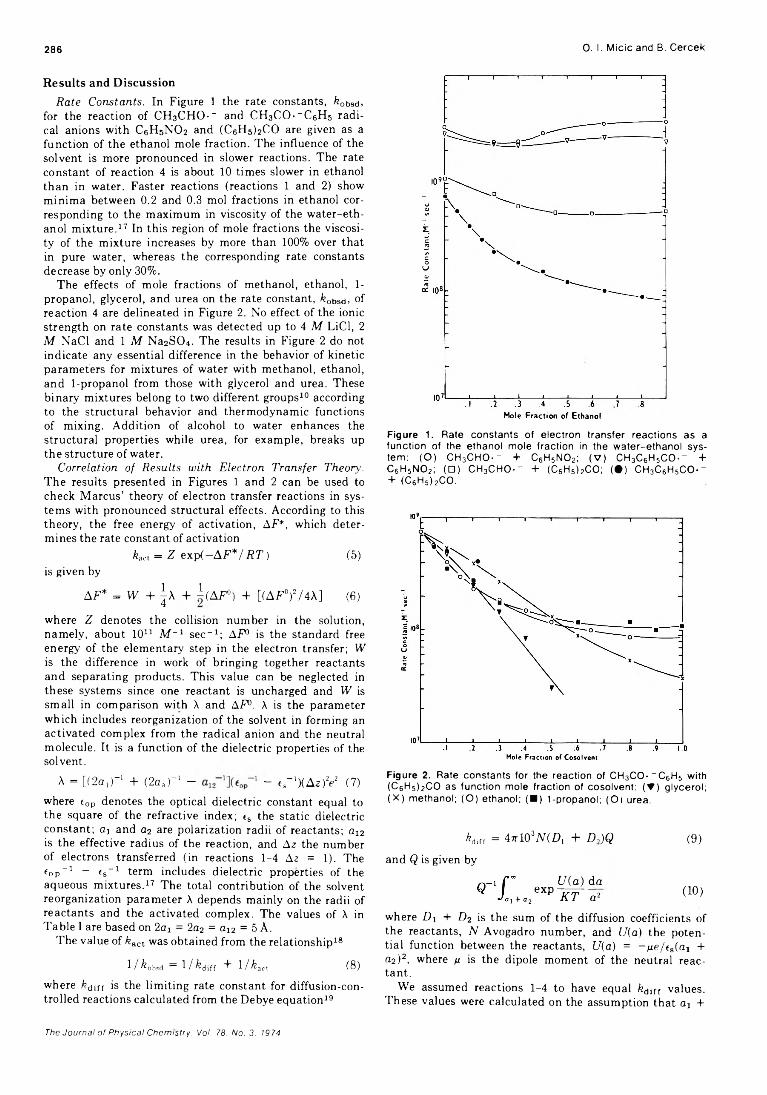
286 0. I. Micic and B. Cercek
Results and DiscussionRate Constants. In Figure 1 the rate constants, ¿ 0bsd,
for the reaction of CHaCHO-- and CHaCO-- C6H5 radical anions with C6H5N02 and (C6H5)2C0 are given as a function of the ethanol mole fraction. The influence of the solvent is more pronounced in slower reactions. The rate constant of reaction 4 is about 10 times slower in ethanol than in water. Faster reactions (reactions 1 and 2) show minima between 0.2 and 0.3 mol fractions in ethanol corresponding to the maximum in viscosity of the water-ethanol mixture.17 In this region of mole fractions the viscosity of the mixture increases by more than 100% over that in pure water, whereas the corresponding rate constants decrease by only 30%.
The effects of mole fractions of methanol, ethanol, 1- propanol, glycerol, and urea on the rate constant, ¿ obSd, of reaction 4 are delineated in Figure 2. No effect of the ionic strength on rate constants was detected up to 4 M LiCl, 2 M NaCl and 1 M Na2SC)4. The results in Figure 2 do not indicate any essential difference in the behavior of kinetic parameters for mixtures of water with methanol, ethanol, and 1-propanol from those with glycerol and urea. These binary mixtures belong to two different groups10 according to the structural behavior and thermodynamic functions of mixing. Addition of alcohol to water enhances the structural properties while urea, for example, breaks up the structure of water.
Correlation of Results with Electron Transfer Theory. The results presented in Figures 1 and 2 can be used to check Marcus’ theory of electron transfer reactions in systems with pronounced structural effects. According to this theory, the free energy of activation, AF*, which determines the rate constant of activation
¿ac, = Z exp(—AF *f RT) (5)is given by
A F* = W + ^\ + i(A F °) + [(AF°)2/4A] (6)
where Z denotes the collision number in the solution, namely, about 1011 M -1 sec-1 ; AF° is the standard free energy of the elementary step in the electron transfer; W is the difference in work of bringing together reactants and separating products. This value can be neglected in these systems since one reactant is uncharged and W is small in comparison with A and AF°. A is the parameter which includes reorganization of the solvent in forming an activated complex from the radical anion and the neutral molecule. It is a function of the dielectric properties of the solvent.
A = [(2a,)“ 1 + (2aa)_I - - i .- 'X A z jV (7)where cop denotes the optical dielectric constant equal to the square of the refractive index; ts the static dielectric constant; aj and a2 are polarization radii of reactants; ai2 is the effective radius of the reaction, and Az the number of electrons transferred (in reactions 1-4 Az = 1). The fop“ 1 — fs_1 term includes dielectric properties of the aqueous mixtures.17 The total contribution of the solvent reorganization parameter A depends mainly on the radii of reactants and the activated complex. The values of A in Table I are based on 2 ax = 2a2 = a12 = 5 A.
The value of ¿ act was obtained from the relationship18
1 / ^ o b s d = 1 / ^ d i f f + 1 / ¿act ( 8 )
where kaift is the limiting rate constant for diffusion-controlled reactions calculated from the Debye equation19
F igu re 1. Rate co n s ta n ts o f e le c tro n tra n s fe r re a c tio n s as a fu n c tio n of the e thano l m o le fra c tio n In the w a te r-e th a n o l system : (O ) C H 3C H O -- + C6H5N 0 2; ( V ) C H 3C6H 5C O -- + C6H5N 0 2; ( □ ) C H 3C H O -- + (C6H5) 2CO; ( • ) C H 3C 6H 5C O - - + (C 6H5) 2CO.
F igu re 2. Rate con s ta n ts fo r the rea c tion of C H 3C O *- C6H 5 w ith (C 6H5) 2CO as fu n c tio n m ole fra c tio n o f coso lve n t: (▼ ) g lyce ro l; ( X ) m e tha no l; (O ) e th ano l; ( ■ ) 1 -p ropano l; ( O i urea.
¿„Sr, = 4tt10 3N(D, + D,)Q (9)and Q is given by
exp U(a) da K T Tt (10)
where D i + f) 2 is the sum of the diffusion coefficients of the reactants, N Avogadro number, and U(a) the potential function between the reactants, U(a) = -¿ ie /is(ai + a2)2, where /r is the dipole moment of the neutral reactant.
We assumed reactions 1-4 to have equal ¿dlff values. These values were calculated on the assumption that a3 +
The Journal of Physical Chemistry. Vol. 78. No. 3. 1974
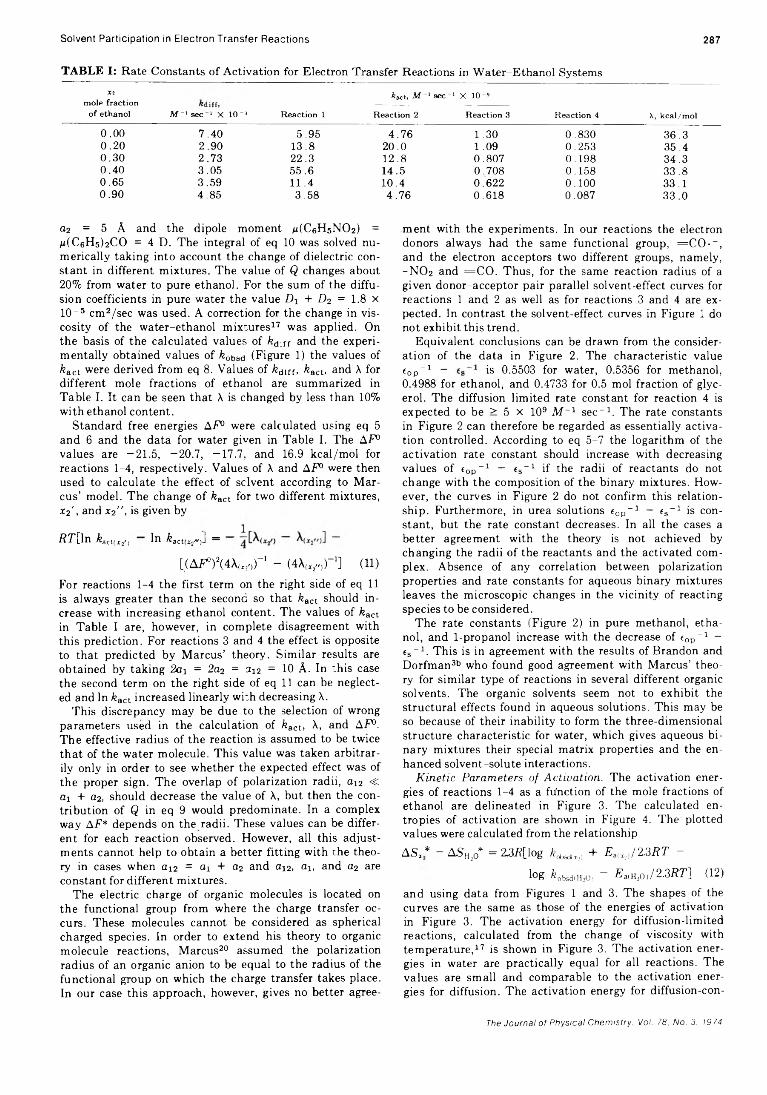
Solvent Participation in Electron Transfer Reactions 287
TABLE I: Rate Constants of Activation for Electron Transfer Reactions in Water-Ethanol Systems
Xl kKt, M-' sec-' X IO-»mole fraction -------------------------------of ethanol M~l sec-1 X 10⁻³ Reaction 1 Reaction 2 Reaction 3 Reaction 4 X, kcal/mol
0.00 7.40 5.95 4.76 1.30 0.830 36.30.20 2.90 13.8 20.0 1.09 0.253 35.40.30 2.73 22.3 12.8 0.807 0.198 34.30.40 3.05 55.6 14.5 0.708 0.158 33.80.65 3.59 11.4 10.4 0.622 0.100 33.10.90 4.85 3.58 4.76 0.618 0.087 33.0
02 = 5 A and the dipole moment /¿(C6H5NO2) = m(C6H5)2CO = 4 D. The integral of eq 10 was solved numerically taking into account the change of dielectric constant in different mixtures. The value of Q changes about 20% from water to pure ethanol. For the sum of the diffusion coefficients in pure water the value Dj + D2 = 1.8 x 10⁻⁵ cm2/sec was used. A correction for the change in viscosity of the water-ethanol mixtures17 was applied. On the basis of the calculated values of kd_n and the experimentally obtained values of kobad (Figure 1) the values of feact were derived from eq 8. Values of kdiii, kact, and X for different mole fractions of ethanol are summarized in Table I. It can be seen that X is changed by less than 10% with ethanol content.
Standard free energies AF° were calculated using eq 5 and 6 and the data for water given in Table I. The AF° values are -21.5, -20.7, -17.7, and 16.9 kcal/mol for reactions 1-4, respectively. Values of X and AF° were then used to calculate the effect of solvent according to Marcus’ model. The change of kact for two different mixtures, *2', and X2” , is given by
RT[h\ kachx,/; llT act(x2")-l =
[(A^)2(4Xu, )r 1 - (4X(X2//))-1] (11)
For reactions 1-4 the first term on the right side of eq 11 is always greater than the second so that kact should increase with increasing ethanol content. The values of kact in Table I are, however, in complete disagreement with this prediction. For reactions 3 and 4 the effect is opposite to that predicted by Marcus’ theory. Similar results are obtained by taking 2ai = 2 a2 = 312 = 10 A. In :,his case the second term on the right side of eq 11 can be neglected and In kact increased linearly with decreasing X.
This discrepancy may be due to the selection of wrong parameters used in the calculation of kact, X, and AF°. The effective radius of the reaction is assumed to be twice that of the water molecule. This value was taken arbitrarily only in order to see whether the expected effect was of the proper sign. The overlap of polarization radii, a12 « Oi + U2, should decrease the value of X, but then the contribution of Q in eq 9 would predominate. In a complex way AF* depends on the radii. These values can be different for each reaction observed. However, all this adjustments cannot help to obtain a better fitting with the theory in cases when a12 = 01 + 02 and 012, a1: and a2 are constant for different mixtures.
The electric charge of organic molecules is located on the functional group from where the charge transfer occurs. These molecules cannot be considered as spherical charged species. In order to extend his theory to organic molecule reactions, Marcus20 assumed the polarization radius of an organic anion to be equal to the radius of the functional group on which the charge transfer takes place. In our case this approach, however, gives no better agree
ment with the experiments. In our reactions the electron donors always had the same functional group, = C O -_ , and the electron acceptors two different groups, namely, -N O 2 and =C O . Thus, for the same reaction radius of a given donor-acceptor pair parallel solvent-effect curves for reactions 1 and 2 as well as for reactions 3 and 4 are expected. In contrast the solvent-effect curves in Figure 1 do not exhibit this trend.
Equivalent conclusions can be drawn from the consideration of the data in Figure 2. The characteristic value eop-1 - is 0.5503 for water, 0.5356 for methanol, 0.4988 for ethanol, and 0.4733 for 0.5 mol fraction of glycerol. The diffusion limited rate constant for reaction 4 is expected to be > 5 x 10⁹ M -1 sec-1 . The rate constants in Figure 2 can therefore be regarded as essentially activation controlled. According to eq 5-7 the logarithm of the activation rate constant should increase with decreasing values of eop-1 — ís-1 if the radii of reactants do not change with the composition of the binary mixtures. However, the curves in Figure 2 do not confirm this relationship. Furthermore, in urea solutions eop-1 — fs-1 is constant, but the rate constant decreases. In all the cases a better agreement with the theory is not achieved by changing the radii of the reactants and the activated complex. Absence of any correlation between polarization properties and rate constants for aqueous binary mixtures leaves the microscopic changes in the vicinity of reacting species to be considered.
The rate constants (Figure 2) in pure methanol, ethanol, and 1-propanol increase with the decrease of cop-1 - fs-1 . This is in agreement with the results of Brandon and Dorfman3b who found good agreement with Marcus’ theory for similar type of reactions in several different organic solvents. The organic solvents seem not to exhibit the structural effects found in aqueous solutions. This may be so because of their inability to form the three-dimensional structure characteristic for water, which gives aqueous binary mixtures their special matrix properties and the enhanced solvent-solute interactions.
Kinetic Parameters of Activation. The activation energies of reactions 1-4 as a fu'nction of the mole fractions of ethanol are delineated in Figure 3. The calculated entropies of activation are shown in Figure 4. The plotted values were calculated from the relationshipAS, * - ASh/ = 2.3A[log k ^ X!> + Et(Xt)/23RT ~
log feobsd(H,0, “ £ a«H2o,/2.3BT] (12)and using data from Figures 1 and 3. The shapes of the curves are the same as those of the energies of activation in Figure 3. The activation energy for diffusion-limited reactions, calculated from the change of viscosity with temperature,17 is shown in Figure 3. The activation energies in water are practically equal for all reactions. The values are small and comparable to the activation energies for diffusion. The activation energy for diffusion-con-
The Journal of Physical Chemistry, Voi. 78, No. 3. 1974
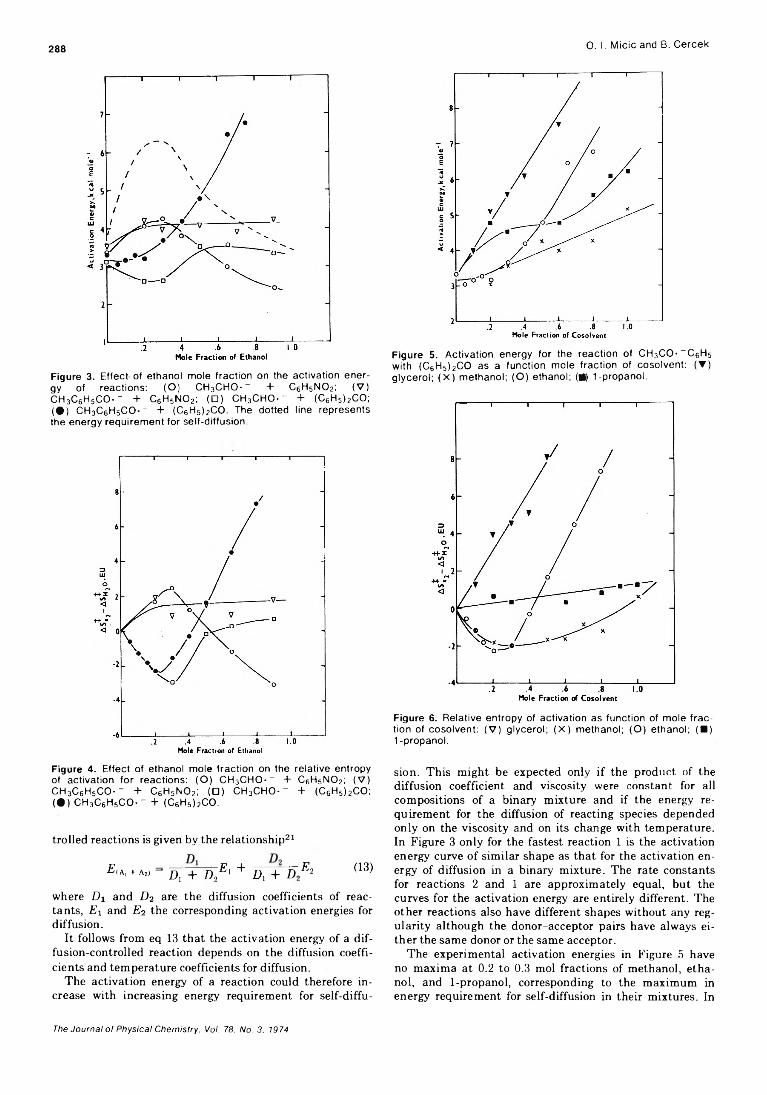
288 0. I. Micic and B. Cercek
Figure 3. Effect of ethanol mole fraction on the activation energy of reactions: (O) CH3CHO-_ + C6H5N 02; (V )CH3C6H5C O -- + C6H5N 02; (□ ) CH3CHO-~ + (C6H5)2CO; ( • ) CH3C6H5C O -” + (C6H5)2CO. The dotted line represents the energy requirement for self-diffusion.
Figure 4. Effect of ethanol mole fraction on the relative entropy of activation for reactions: (O) CH3C H 0 -_ + C6H5N 02; (V ) CH3C6H5C O -- + C6H5N 02; (□ ) CH3C H 0 -- + (C6H5)2CO;( • ) c h 3c 6h 5c o - - + (C6H5)2CO.
trolled reactions is given by the relationship21
E(A, + A*> = D, + I ) , E ' + D, + D E l (13)
where Dx and D2 are the diffusion coefficients of reactants, Ex and E2 the corresponding activation energies for diffusion.
It follows from eq 13 that the activation energy of a diffusion-controlled reaction depends on the diffusion coefficients and temperature coefficients for diffusion.
The activation energy of a reaction could therefore increase with increasing energy requirement for self-diffu
Figure 5. Activation energy for the reaction of CH3CO -_ C6H5 with (C6H5)2CO as a function mole fraction of cosolvent: (▼) glycerol; (X ) methanol; (O) ethanol; M 1-propanol.
Figure 6. Relative entropy of activation as function of mole fraction of cosolvent: (V ) glycerol; (X ) methanol; (O) ethanol; (■ )1-propanol.
sion. This might be expected only if the product of the diffusion coefficient and viscosity were constant for all compositions of a binary mixture and if the energy requirement for the diffusion of reacting species depended only on the viscosity and on its change with temperature. In Figure 3 only for the fastest reaction 1 is the activation energy curve of similar shape as that for the activation energy of diffusion in a binary mixture. The rate constants for reactions 2 and 1 are approximately equal, but the curves for the activation energy are entirely different. The other reactions also have different shapes without any regularity although the donor-acceptor pairs have always either the same donor or the same acceptor.
The experimental activation energies in Figure 5 have no maxima at 0.2 to 0.3 mol fractions of methanol, ethanol, and 1-propanol, corresponding to the maximum in energy requirement for self-diffusion in their mixtures. In
The Journal of Physical Chemistry. Vol. 78. No. 3. 1974
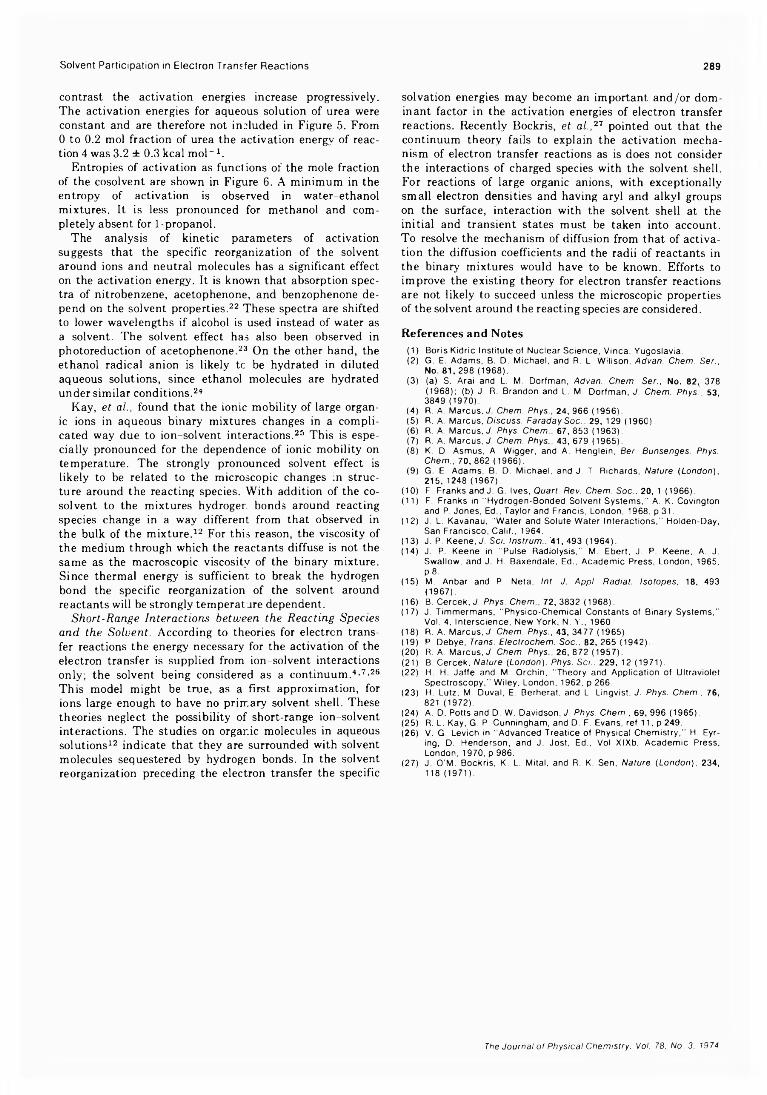
Solvent Participation in Electron Transfer Reactions 289
contrast the activation energies increase progressively. The activation energies for aqueous solution of urea were constant and are therefore not included in Figure 5. From 0 to 0.2 mol fraction of urea the activation energy of reaction 4 was 3.2 ± 0.3 kcal mol-1 .
Entropies of activation as functions of the mole fraction of the cosolvent are shown in Figure 6. A minimum in the entropy of activation is observed in water-ethanol mixtures. It is less pronounced for methanol and completely absent for 1-propanol.
The analysis of kinetic parameters of activation suggests that the specific reorganization of the solvent around ions and neutral molecules has a significant effect on the activation energy. It is known that absorption spectra of nitrobenzene, acetophenone, and benzophenone depend on the solvent properties.22 These spectra are shifted to lower wavelengths if alcohol is used instead of water as a solvent. The solvent effect has also been observed in photoreduction of acetophenone.23 On the other hand, the ethanol radical anion is likely tc be hydrated in diluted aqueous solutions, since ethanol molecules are hydrated under similar conditions.24
Kay, et al., found that the ionic mobility of large organic ions in aqueous binary mixtures changes in a complicated way due to ion-solvent interactions.25 This is especially pronounced for the dependence of ionic mobility on temperature. The strongly pronounced solvent effect is likely to be related to the microscopic changes in structure around the reacting species. With addition of the cosolvent to the mixtures hydrogen bonds around reacting species change in a way different from that observed in the bulk of the mixture.12 For this reason, the viscosity of the medium through which the reactants diffuse is not the same as the macroscopic viscosity of the binary mixture. Since thermal energy is sufficient to break the hydrogen bond the specific reorganization of the solvent around reactants will be strongly temperature dependent.
Short-Range Interactions between the Reacting Species and the Solvent. According to theories for electron transfer reactions the energy necessary for the activation of the electron transfer is supplied from ion-solvent interactions only; the solvent being considered as a continuum.4’7’26 This model might be true, as a first approximation, for ions large enough to have no primary solvent shell. These theories neglect the possibility of short-range ion-solvent interactions. The studies on organic molecules in aqueous solutions12 indicate that they are surrounded with solvent molecules sequestered by hydrogen bonds. In the solvent reorganization preceding the electron transfer the specific
solvation energies may become an important and/or dominant factor in the activation energies of electron transfer reactions. Recently Bockris, et al. , 27 pointed out that the continuum theory fails to explain the activation mechanism of electron transfer reactions as is does not consider the interactions of charged species with the solvent shell. For reactions of large organic anions, with exceptionally small electron densities and having aryl and alkyl groups on the surface, interaction with the solvent shell at the initial and transient states must be taken into account. To resolve the mechanism of diffusion from that of activation the diffusion coefficients and the radii of reactants in the binary mixtures would have to be known. Efforts to improve the existing theory for electron transfer reactions are not likely to succeed unless the microscopic properties of the solvent around the reacting species are considered.
References and Notes(1) Boris K id ric Institu te ot Nuclear Science, V inca, Yugoslavia.(2) G. E. Adam s, B. D. M ichael, and R. L, W illson, Advan. Chem. Ser..
No. 81, 298 (1968).(3) (a) S. A ra i and L. M. Dorfm an, Advan. Chem. Ser., No. 82, 378
(1968); (b) J. R. Brandon and L. M. D orfm an , J. Chem. Phys., 53, 3849 (1970).
(4) R. A. M arcus, J. Chem. Phys., 24, 966 (1956).(5) R. A, M arcus, Discuss. Faraday Soc.. 29, 129 (1960).(6) R. A. M arcus, J. Phys. Chem.. 67, 853 (1963).(7) R. A. M arcus, J. Chem. Phys., 43, 679 (1965).(8) K. D. Asm us, A. W igger, and A. Henglein , Ber. Bunsenges. Phys. Chem., 70, 862 (1966).(9) G. E. Adam s, B. D. M ichae l, and J. T. R ichards, Nature (London),
215, 1248 (1967).(10) F. F ranks and J. G. Ives, Quart. Rev. Chem. Soc.. 20, 1 (1966).(11) F. Franks in "H ydrogen-B onded Solvent S ys tem s,” A. K. Covington
and P. Jones, Ed., Taylor and Francis, London, 1968, p 31.(12) J. L. Kavanau, “ W ater and Solute W ater In te ra c tio n s ," Holden-Day,
San F rancisco , C alif., 1964.(13) J. P. Keene,-/. Sci. Instrum.. '41,4 9 3 (1964).(14) J. P. Keene in “ Pulse R ad io lysis," M. Ebert, J. P. Keene, A. J.
Sw allow , and J. H. Baxendale. Ed., A cadem ic Press, London, 1965, P 8.
(15) M. Anbar and P. Neta, Int. J. Appl. Radiat. Isotopes, 18, 493 (1967).
(16) B. C ercek, J. Phys. Chem., 72, 3832 (1968).(17) J. T im m erm ans, “ P hysico-C hem ica l C onstants o f B inary System s,"
Vol. 4, In te rsc ience , New York, N. Y ., 1960.(18) R. A. M arcus, J. Chem. Phys., 43, 3477 (1965).(19) P. Debye, Trans. Electrochem. Soc., 82, 265 (1942).(20) R. A. M arcus, J. Chem. Phys., 26, 872 (1957).(21) B. C ercek, Nature (London). Phys. Sci.. 229, 12 (1971).(22) H. H. Ja ffe and M. O rch in, “ Theory and App lica tion of U ltravio le t
S pec troscopy ," W iley, London, 1962, p 266.(23) H. Lutz, M. Duval, E. Berherat. and L. Lingvist, J. Phys. Chem., 76,
821 (1972).(24) A. D. Potts and D. W. Davidson, J. Phys. Chem., 69, 996 (1965).(25) R. L. Kay, G. P. C unningham , and D. F. Evans, re f 11, p 249.(26) V. G. Levlch in “ Advanced Treatice of Physical C he m is try ," H. Eyr-
ing, D. H enderson, and J. Jost, Ed., Vol X lXb, A cadem ic Press, London, 1970, p 986.
(27) J. O 'M . B ockris , K. L. M ita l, and R. K. Sen, Nature (London), 234, 118 (1971).
The Journal ot Physical Chemistry. Vol. 78. No. 3. 1974
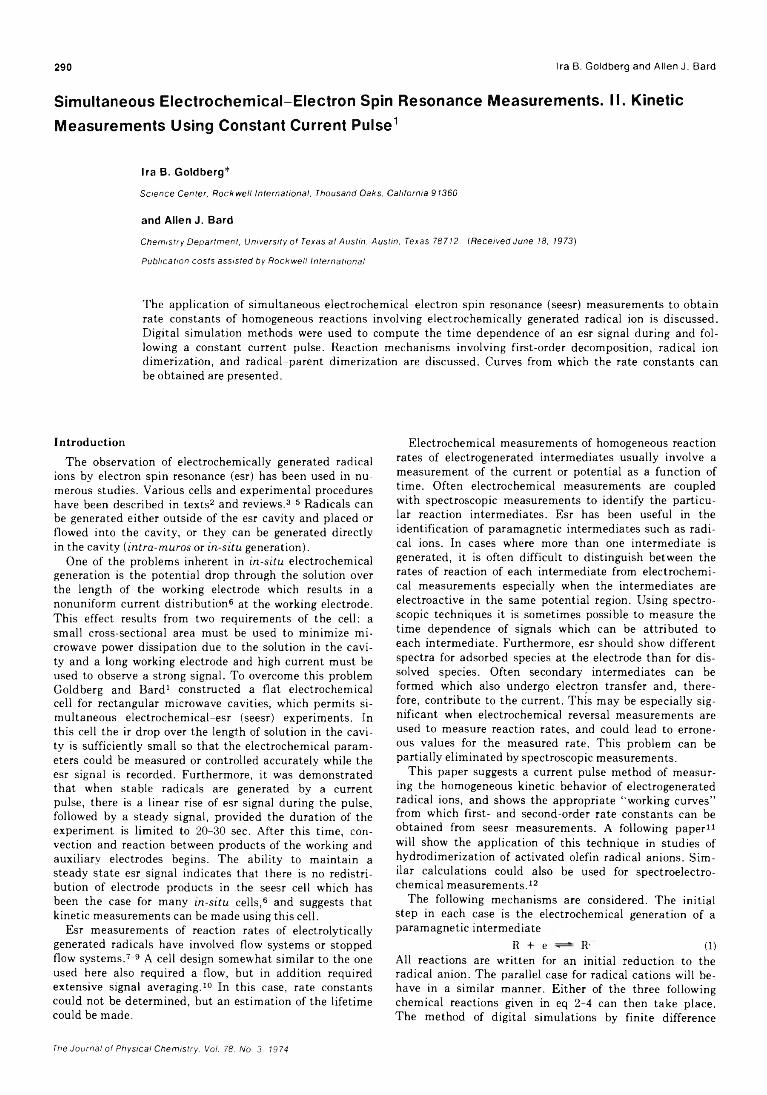
290 Ira B. Goldberg and Allen J. Bard
Simultaneous Electrochemical-Electron Spin Resonance Measurements. II. Kinetic Measurements Using Constant Current Pulse1
Ira B. Goldberg*
Science Center, Rockwell International, Thousand Oaks. California 91360 and Allen J. Bard
Chemistry Department, University of Texas at Austin, Austin, Texas 78712 (Received June 18, 1973)Publication costs assisted by Rockwell International
The application of simultaneous electrochemical-electron spin resonance (seesr) measurements to obtain rate constants of homogeneous reactions involving electrochemically generated radical ion is discussed. Digital simulation methods were used to compute the time dependence of an esr signal during and following a constant current pulse. Reaction mechanisms involving first-order decomposition, radical ion dimerization, and radical-parent dimerization are discussed. Curves from which the rate constants can be obtained are presented.
Introduction
The observation of electrochemically generated radical ions by electron spin resonance (esr) has been used in numerous studies. Various cells and experimental procedures have been described in texts2 and reviews.3-5 Radicals can be generated either outside of the esr cavity and placed or flowed into the cavity, or they can be generated directly in the cavity (intra-muros or in-situ generation).
One of the problems inherent in in-situ electrochemical generation is the potential drop through the solution over the length of the working electrode which results in a nonuniform current distribution6 at the working electrode. This effect results from two requirements of the cell: a small cross-sectional area must be used to minimize microwave power dissipation due to the solution in the cavity and a long working electrode and high current must be used to observe a strong signal. To overcome this problem Goldberg and Bard1 constructed a flat electrochemical cell for rectangular microwave cavities, which permits simultaneous electrochemical-esr (seesr) experiments. In this cell the ir drop over the length of solution in the cavity is sufficiently small so that the electrochemical parameters could be measured or controlled accurately while the esr signal is recorded. Furthermore, it was demonstrated that when stable radicals are generated by a current pulse, there is a linear rise of esr signal during the pulse, followed by a steady signal, provided the duration of the experiment is limited to 20-30 sec. After this time, convection and reaction between products of the working and auxiliary electrodes begins. The ability to maintain a steady state esr signal indicates that there is no redistribution of electrode products in the seesr cell which has been the case for many in-situ cells,6 and suggests that kinetic measurements can be made using this cell.
Esr measurements of reaction rates of electrolytically generated radicals have involved flow systems or stopped flow systems.7-9 A cell design somewhat similar to the one used here also required a flow, but in addition required extensive signal averaging.10 In this case, rate constants could not be determined, but an estimation of the lifetime could be made.
Electrochemical measurements of homogeneous reaction rates of electrogenerated intermediates usually involve a measurement of the current or potential as a function of time. Often electrochemical measurements are coupled with spectroscopic measurements to identify the particular reaction intermediates. Esr has been useful in the identification of paramagnetic intermediates such as radical ions. In cases where more than one intermediate is generated, it is often difficult to distinguish between the rates of reaction of each intermediate from electrochemical measurements especially when the intermediates are electroactive in the same potential region. Using spectroscopic techniques it is sometimes possible to measure the time dependence of signals which can be attributed to each intermediate. Furthermore, esr should show different spectra for adsorbed species at the electrode than for dissolved species. Often secondary intermediates can be formed which also undergo electron transfer and, therefore, contribute to the current. This may be especially significant when electrochemical reversal measurements are used to measure reaction rates, and could lead to erroneous values for the measured rate. This problem can be partially eliminated by spectroscopic measurements.
This paper suggests a current pulse method of measuring the homogeneous kinetic behavior of electrogenerated radical ions, and shows the appropriate “ working curves” from which first- and second-order rate constants can be obtained from seesr measurements. A following paper11 will show the application of this technique in studies of hydrodimerization of activated olefin radical anions. Similar calculations could also be used for spectroelectro- chemical measurements.12
The following mechanisms are considered. The initial step in each case is the electrochemical generation of a paramagnetic intermediate
R + e R~ (1)All reactions are written for an initial reduction to the radical anion. The parallel case for radical cations will behave in a similar manner. Either of the three following chemical reactions given in eq 2-4 can then take place. The method of digital simulations by finite difference
The Journal ol Physical Chemistry. Vol. 78. No. 3. 1974
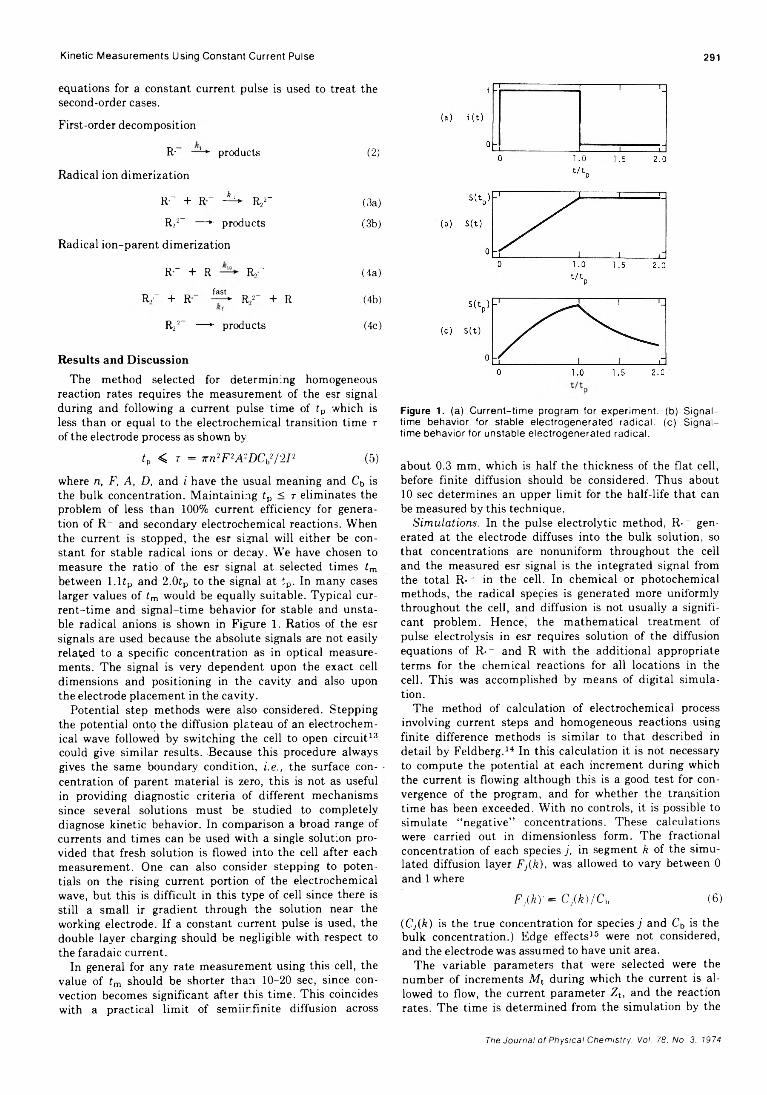
Kinetic Measurements Using Constant Current Pulse 291
equations for a constant current pulse is used to treat the second-order cases.
First-order decomposition
R- — products (2)
Radical ion dimerization
r .- + R - -A - ^ 2- (3a).R22_ — *■ products (3b)
Radical ion-parent dimerization
R~ + R RT (4a)_ _ fastR>- + R“ — ► R r + R (4b)
R22_ — *■ products (4c)
Results and Discussion
The method selected for determining homogeneous reaction rates requires the measurement of the esr signal during and following a current pulse time of tp which is less than or equal to the electrochemical transition time r of the electrode process as shown by-
ip < r = 7Tn2F 2AzDCb2/2P (5)
where n, F, A, D, and i have the usual meaning and Cb is the bulk concentration. Maintaining ip < r eliminates the problem of less than 100% current efficiency for generation of R_ and secondary electrochemical reactions. When the current is stopped, the esr signal will either be constant for stable radical ions or decay. We have chosen to measure the ratio of the esr signal at selected times tm between l .l tp and 2.0tp to the signal at tp. In many cases larger values of tm would be equally suitable. Typical current-time and signal-time behavior for stable and unstable radical anions is shown in Figure 1. Ratios of the esr signals are used because the absolute signals are not easily related to a specific concentration as in optical measurements. The signal is very dependent upon the exact cell dimensions and positioning in the cavity and also upon the electrode placement in the cavity.
Potential step methods were also considered. Stepping the potential onto the diffusion plateau of an electrochemical wave followed by switching the cell to open circuit13 could give similar results. Because this procedure always gives the same boundary condition, i.e., the surface concentration of parent material is zero, this is not as useful in providing diagnostic criteria of different mechanisms since several solutions must be studied to completely diagnose kinetic behavior. In comparison a broad range of currents and times can be used with a single solution provided that fresh solution is flowed into the cell after each measurement. One can also consider stepping to potentials on the rising current portion of the electrochemical wave, but this is difficult in this type of cell since there is still a small ir gradient through the solution near the working electrode. If a constant current pulse is used, the double layer charging should be negligible with respect to the faradaic current.
In general for any rate measurement using this cell, the value of tm should be shorter than 10-20 sec, since convection becomes significant after this time. This coincides with a practical limit of semiir.finite diffusion across
Figure 1. (a) Current-time program for experiment, (b) Signaltime behavior for stable electrogenerated radical, (c) Signaltime behavior for unstable electrogenerated radical.
about 0.3 mm, which is half the thickness of the flat cell, before finite diffusion should be considered. Thus about 10 sec determines an upper limit for the half-life that can be measured by this technique.
Simulations. In the pulse electrolytic method, R-_ generated at the electrode diffuses into the bulk solution, so that concentrations are nonuniform throughout the cell and the measured esr signal is the integrated signal from the total R-~ in the cell. In chemical or photochemical methods, the radical species is generated more uniformly throughout the cell, and diffusion is not usually a significant problem. Hence, the mathematical treatment of pulse electrolysis in esr requires solution of the diffusion equations of R ._ and R with the additional appropriate terms for the chemical reactions for all locations in the cell. This was accomplished by means of digital simulation.
The method of calculation of electrochemical process involving current steps and homogeneous reactions using finite difference methods is similar to that described in detail by Feldberg.14 In this calculation it is not necessary to compute the potential at each increment during which the current is flowing although this is a good test for convergence of the program, and for whether the transition time has been exceeded. With no controls, it is possible to simulate “ negative” concentrations. These calculations were carried out in dimensionless form. The fractional concentration of each species j, in segment k of the simulated diffusion layer Fj(k), was allowed to vary between 0 and 1 where
F j ( k ) ' = Cj(k)/Cb (6)
(Cj(k) is the true concentration for species j and Cb is the bulk concentration.) Edge effects15 were not considered, and the electrode was assumed to have unit area.
The variable parameters that were selected were the number of increments Mt during which the current is allowed to flow, the current parameter Zt, and the reaction rates. The time is determined from the simulation by the
The Journal of Physical Chemistry. Voi. 78. No. 3. 1974
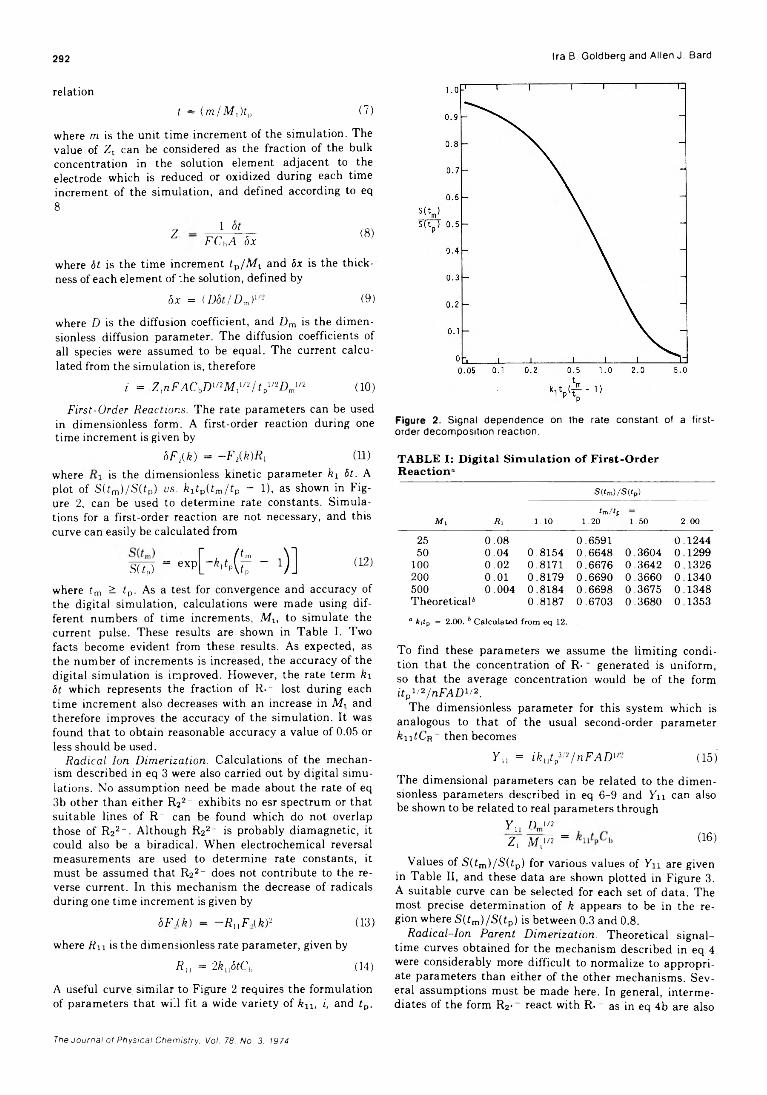
292 Ira B. Goldberg and Allen J. Bard
relationt = (m/M,)tp (7)
where m is the unit time increment of the simulation. The value of Zt can be considered as the fraction of the bulk concentration in the solution element adjacent to the electrode which is reduced or oxidized during each time increment of the simulation, and defined according to eq 8
Z 1 òtFC hA òx (8)
where 6t is the time increment £P/M t and 8x is the thickness of each element of the solution, defined by
&.x = (D5t/DJv- (9)
where D is the diffusion coefficient, and Dm is the dimensionless diffusion parameter. The diffusion coefficients of all species were assumed to be equal. The current calculated from the simulation is, therefore
i = Z,nF A C ^ ^ M ^ ' 2 / tpU2D mU2 (10)
First-Order Reactions. The rate parameters can be used in dimensionless form. A first-order reaction during one time increment is given by
8 F 2{k) = —F 2(k)Rl (11)where is the dimensionless kinetic parameter k\ 5t. A plot of S(tm)/S(£p) vs. £itp(tm/ip - 1), as shown in Figure 2, can be used to determine rate constants. Simulations for a first-order reaction are not necessary, and this curve can easily be calculated from
W = exp [ -M p G f - l ) ] (12)
where fm > ip. As a test for convergence and accuracy of the digital simulation, calculations were made using different numbers of time increments, Mt, to simulate the current pulse. These results are shown in Table I. Two facts become evident from these results. As expected, as the number of increments is increased, the accuracy of the digital simulation is improved. However, the rate term ki 5t which represents the fraction of R-~ lost during each time increment also decreases with an increase in Mt and therefore improves the accuracy of the simulation. It was found that to obtain reasonable accuracy a value of 0.05 or less should be used.
Radical Ion Dimerization. Calculations of the mechanism described in eq 3 were also carried out by digital simulations. No assumption need be made about the rate of eq 3b other than either R22- exhibits no esr spectrum or that suitable lines of R~ can be found which do not overlap those of R22~. Although R22_ is probably diamagnetic, it could also be a biradical. When electrochemical reversal measurements are used to determine rate constants, it must be assumed that R22_ does not contribute to the reverse current. In this mechanism the decrease of radicals during one time increment is given by
bF,(k) = - R nF,(kY (13)where Ru is the dimensionless rate parameter, given by
Rn = 2kn8tCh (14)
A useful curve similar to Figure 2 requires the formulation of parameters that will fit a wide variety of k11: i, and £p.
Figure 2. S ig n a l d e p e n d e n c e on th e ra te c o n s ta n t of a f irs t - o rd e r d e c o m p o s it io n re a c t io n .
TABLE I: Digital Simulation of First-Order Reaction»
S((»)/S(ip)
Mt äi 1.10¿m/ p
1.20 1.50 2.00
25 0.08 0.6591 0.124450 0.04 0.8154 0.6648 0.3604 0.1299
100 0.02 0.8171 0.6676 0.3642 0.1326200 0.01 0.8179 0.6690 0.3660 0.1340500 0.004 0.8184 0.6698 0.3675 0.1348Theoretical6 0.8187 0.6703 0.3680 0.1353» Aiip = 2.00. 6 Calculated from eq 12.
To find these parameters we assume the limiting condition that the concentration of R- ~ generated is uniform, so that the average concentration would be of the form itp1/2/nFAD1/2.
The dimensionless parameter for this system which is analogous to that of the usual second-order parameter kiitCfi ~ then becomes
Y u = ikutp3l2/nFADu- (15)
The dimensional parameters can be related to the dimensionless parameters described in eq 6-9 and Yu can also be shown to be related to real parameters through
Y D 1/2 1 11z t M ,1/2 = (16)
Values of S(£m)/S(£p) for various values of Yu are given in Table II, and these data are shown plotted in Figure 3. A suitable curve can be selected for each set of data. The most precise determination of k appears to be in the region where S(tm)/S(tp) is between 0.3 and 0.8.
Radical-Ion Parent Dimerization. Theoretical signaltime curves obtained for the mechanism described in eq 4 were considerably more difficult to normalize to appropriate parameters than either of the other mechanisms. Several assumptions must be made here. In general, intermediates of the form R2-_ react with R. - as in eq 4b are also
The Journal of Physical Chemistry. Voi. 78. No. 3. 1974
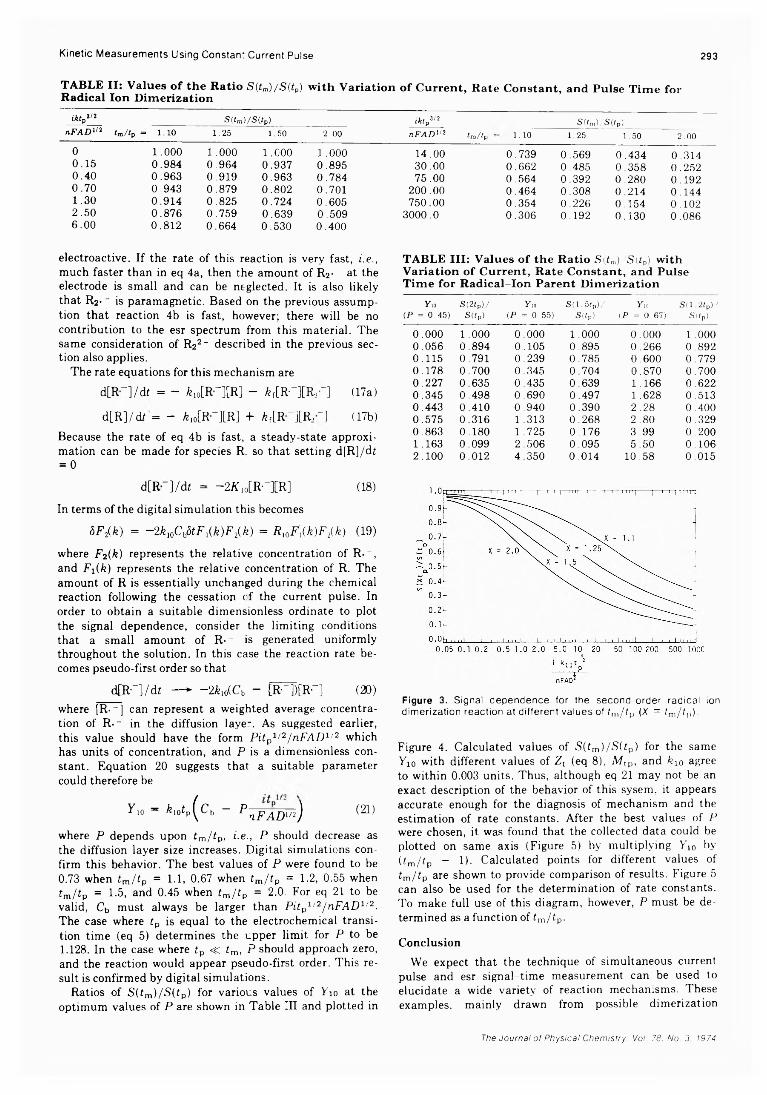
Kinetic Measurements Using Constant Current Pulse 293
T A B L E I I : V a lu e s o f t h e R a t io S ( tm) /S ( t„ ) w i t h V a r ia t io n o f C u r r e n t , R a te C o n s ta n t , a n d P u ls e T im e f o rR a d ic a l I o n D im e r iz a t io n
iktpS'2 S(tm)/S(tp)nFAD112 tm/tp = 1.10 1.25 1.50 2.00
0 1.000 1 .0 0 0 1 .0 0 0 1 .0 0 00.15 0.984 0.964 0.937 0.8950.40 0.963 0.919 0.963 0.7840.70 0.943 0.879 0.802 0.7011.30 0.914 0.825 0.724 0.6052.50 0.876 0.759 0.639 0.5096.00 0.812 0.664 0.530 0.400
iktp312 S(írr.)/S(ip)nFAD1,2 tm/tp — 1.10 1.25 1.50 2.00
14.00 0.739 0.569 0.434 0.31430.00 0.662 0.485 0.358 0.25275.00 0.564 0.392 0.280 0.192
200.00 0.464 0.308 0.214 0.144750.00 0.354 0.226 0.154 0.102
3000.0 0.306 0.192 0.130 0.086
electroactive. If the rate of this reaction is very fast, i.e., much faster than in eq 4a, then the amount of R2-~ at the electrode is small and can be neglected. It is also likely that R2-~ is paramagnetic. Based on the previous assumption that reaction 4b is fast, however; there will be no contribution to the esr spectrum from this material. The same consideration of R22~ described in the previous section also applies.
The rate equations for this mechanism ared[R“ ]/d t = - ¿ 10[R~][R] - ¿ f[R 'l[R ,~ ] (17a)
d [R ]/d i = - ¿io[R~][R] + ¿ f[R “ ][R ,“ ] (17b)Because the rate of eq 4b is fast, a steady-state approximation can be made for species R. so that setting d[R]/df = 0
d[R~]/di = —2 K 10[R'~][R] (18)
In terms of the digital simulation this becomes
5F2(k) = - 2 k10CbôtF1(k)F2(k) = R w F M Fjlk) (19)
where F2(k) represents the relative concentration of R-_ , and F-i(k) represents the relative concentration of R. The amount of R is essentially unchanged during the chemical reaction following the cessation cf the current pulse. In order to obtain a suitable dimensionless ordinate to plot the signal dependence, consider the limiting conditions that a small amount of R -- is generated uniformly throughout the solution. In this case the reaction rate becomes pseudo-first order so that
d ô n / d i — > - 2M C b - C Ï O D n ( 20 )
where [R- — ] can represent a weighted average concentration of R-~ in the diffusion layer. As suggested earlier, this value should have the form Pitp1/2/nFAD1/2 which has units of concentration, and P is a dimensionless constant. Equation 20 suggests that a suitable parameter could therefore be
y io = ^îoip^Cb — P np A D U2) (21)
where P depends upon tm/tp, i.e., P should decrease as the diffusion layer size increases. Digital simulations confirm this behavior. The best values of P were found to be 0.73 when tm/tp = 1.1, 0.67 when tm/tp = 1.2, 0.55 when tm/tp = 1-5, and 0.45 when tm/tp = 2.0. For eq 21 to be valid, Cb must always be larger than P i tp1/2/ n F A D 1/2. The case where tp is equal to the electrochemical transition time (eq 5) determines the upper limit for P to be1.128. In the case where tp <s tm, P should approach zero, and the reaction would appear pseudo-first order. This result is confirmed by digital simulations.
Ratios of S(tm)/S(tp) for various values of Yio at the optimum values of P are shown in Table III and plotted in
TABLE III: Values of the Ratio S(tm)/S(tp) with Variation of Current, Rate Constant, and Pulse Time for Radical-Ion Parent Dimerization
Yio S(2ip)/ Yio S(1.5ip)/ Yio S(1.2ip)/(P = 0.45) S(ip) (P = 0.55) S(ip) (P = 0.67) S(tp)
0 .000 1 .000 0 .000 1 .000 0 .000 1 .0000 .056 0 .894 0 .105 0 .895 0 .266 0 .8920 .115 0 .791 0 .239 0 .785 0 .600 0 .7790 .178 0 .700 0 .345 0 .704 0 .870 0 .7000 .227 0 .635 0 .435 0 .639 1 .166 0 .6220 .345 0 .498 0 .690 0 .497 1 .628 0 .5130 .443 0 .410 0 .940 0 .390 2 .28 0 .4000 .575 0 .316 1 .313 0 .268 2 .80 0 .3290 .863 0 .180 1 .725 0 .176 3 .99 0 .2001 .163 0 .099 2 .506 0 .095 5 .50 0 .1062 .100 0 .012 4 .350 0 .014 10 .58 0 .015
Figure 3. Signal dependence for the second-order radical ion dimerization reaction at d ifferent values of tm/tp (X = tm/tv ).
Figure 4. Calculated values of S ( tm)/S (tp) for the same Yio with different values of Z t (eq 8), Mtp, and k 10 agree to within 0.003 units. Thus, although eq 21 may not be an exact description of the behavior of this sysem, it appears accurate enough for the diagnosis of mechanism and the estimation of rate constants. After the best values of P were chosen, it was found that the collected data could be plotted on same axis (Figure 5) by multiplying Yi0 by (tm/tp _ D- Calculated points for different values of tm/tp are shown to provide comparison of results. Figure 5 can also be used for the determination of rate constants. To make full use of this diagram, however, P must be determined as a function of tm/tp.
ConclusionWe expect that the technique of simultaneous current
pulse and esr signal-time measurement can be used to elucidate a wide variety of reaction mechanisms. These examples, mainly drawn from possible dimerization
The Journal of Physical Chemistry. Vol. 78. No. 3. 1974
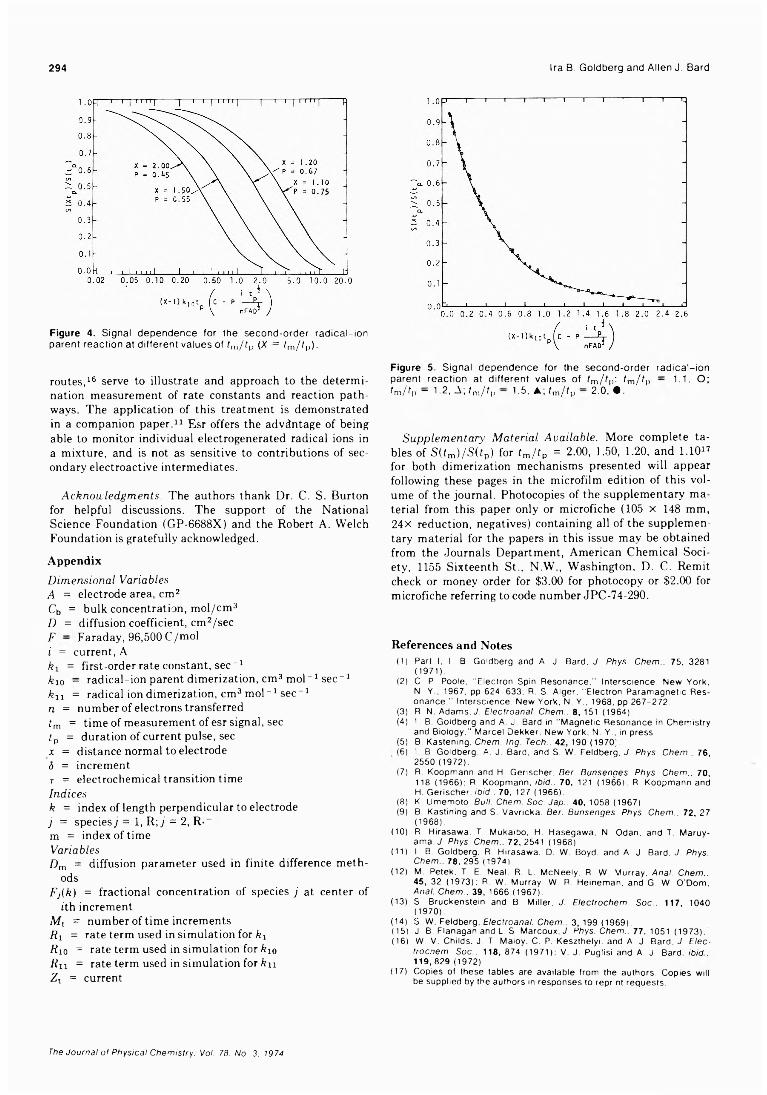
294 Ira B. Goldberg and Allen J. Bard
Figure 4. Signal dependence for the second-order radical-ion parent reaction at different values of tm/tp (X = fm/ f p).
routes,16 serve to illustrate and approach to the determination measurement of rate constants and reaction pathways. The application of this treatment is demonstrated in a companion paper.11 Esr offers the advantage of being able to monitor individual electrogenerated radical ions in a mixture, and is not as sensitive to contributions of secondary electroactive intermediates.
Acknowledgments. The authors thank Dr. C. S. Burton for helpful discussions. The support of the National Science Foundation (GP-6688X) and the Robert A. Welch Foundation is gratefully acknowledged.
AppendixDimensional Variables A = electrode area, cm2 Cb = bulk concentration, mol/cm3 D = diffusion coefficient, cm2/sec F - Faraday, 96,500 C/mol i = current, Afei = first-order rate constant, sec-1k-io — radical-ion parent dimerization, cm3 mol" 1 sec-1fcn = radical ion dimerization, cm3 mol-1 sec-1n = number of electrons transferredtm = time of measurement of esr signal, sectp = duration of current pulse, secx = distance normal to electrode5 = incrementt = electrochemical transition time Indicesk = index of length perpendicular to electrode j = species j = 1, R; j = 2, R- m = index of time VariablesDm = diffusion parameter used in finite difference meth
odsFj(k) = fractional concentration of species j at center of
ith incrementMt = number of time increments R1 = rate term used in simulation for k\Rio = rate term used in simulation for ki0 fin = rate term used in simulation for ku Zt = current
Figure 5. Signal dependence for the second-order radical-ion parent reaction at different values of tm/tv: fm/ f p — 1.1, O; fm /fp — 1-2, A, fm /fp — 1-5, A ; fm /fp — 2.0, 9 .
Supplementary Material Available. More complete tables of S(fm)/S (fp) for f m / f p = 2.00, 1.50, 1.20, and l.lO17 for both dimerization mechanisms presented will appear following these pages in the microfilm edition of this volume of the journal. Photocopies of the supplementary material from this paper only or microfiche (105 x 148 mm, 24x reduction, negatives) containing all of the supplementary material for the papers in this issue may be obtained from the Journals Department, American Chemical Society, 1155 Sixteenth St., N.W., Washington, D. C. Remit check or money order for $3.00 for photocopy or $2.00 for microfiche referring to code number JPC-74-290.
References and Notes< 1 ) Part I, I. B. G oldberg and A. J. Bard, J. Phys. Chem.. 75, 3281
(1971).(2) C. P. Poole, "E lec tron Spin R esonance," In te rsc ience . New York,
N. Y., 1967, pp 6 24 -6 3 3 ; R. S. A lger, "E lec tron P aram agnetic Reso nance ," In te rsc ience . New York, N. Y., 1968, pp 267 -272 .
(3) R. N, Adam s, J. Electroanal. Chem.. 8, 151 (1964).(4) I. B. G oldberg and A. J. Bard In "M agne tic R esonance in C hem istry
and B io logy ," M arcel D ekker, New York, N. Y ., in press.(5) B. Kastening, Chem. Ing. Tech.. 42, 190 (1970).(6) I. B. G oldberg. A. J. Bard, and S. W. Feldberg, J. Phys. Chem.. 76,
2 5 5 0 (1 9 7 2 ).(7) R. Koopm ann and H. G erischer, Ber. Bunsenges. Phys. Chem.. 70,
118 (1966); R. Koopm ann, ibid.. 70, 121 (1966): R. K oopm ann and H. G erischer. ibid.. 70, 127 (1966).
(8) K. Um em oto. Bull. Chem. Soc. Jap.. 40, 1058 (1967).(9) B. Kastin ing and S. V avricka , Ber. Bunsenges. Phys. Chem.. 72, 27
(1968).(10) R. H irasawa. T. M ukaibo, H. Hasegawa, N. Odan, and T. M aruy-
am a, J. Phys. Chem.. 72 ,2541 (1968).(11) I. B. G oldberg, R. H irasawa. D. W. Boyd, and A. J. Bard, J. Phys. Chem.. 7 8 ,2 9 5 (1 9 7 4 ) .(12) M. Petek. T. E. Neal. R. L. M cN eely. R. W. M urray, Anal. Chem..
45, 32 (1973): R. W. M urray. W. R. H einem an, and G. W. O ’D om , Anal. Chem.. 39, 1666 (1967).(13) S. B ruckenste in and B. M iller, J. Electrochem. Soc.. 117, 1040
(1970).(14) S. W. Feldberg, Electroanal. Chem.. 3, 199 (1969).(15) J. B. F lanagan and L. S. M arcoux, J. Phys. Chem.. 77, 1051 (1973).(16) W. V. Childs. J. T. M aloy, C. P. Keszthe lyi. and A. J. Bard, J. Elec- trocnem. Soc.. 118, 874 (1971): V. J. Puglisl and A. J. Bard ibid .
119,829 (1972).(17) Copies of these tab les are availab le from the authors. Copies w ill
be supplied by the authors in responses to repr nt requests.
The Journal of Physical Chemistry. Vol. 78. No. 3. 7974
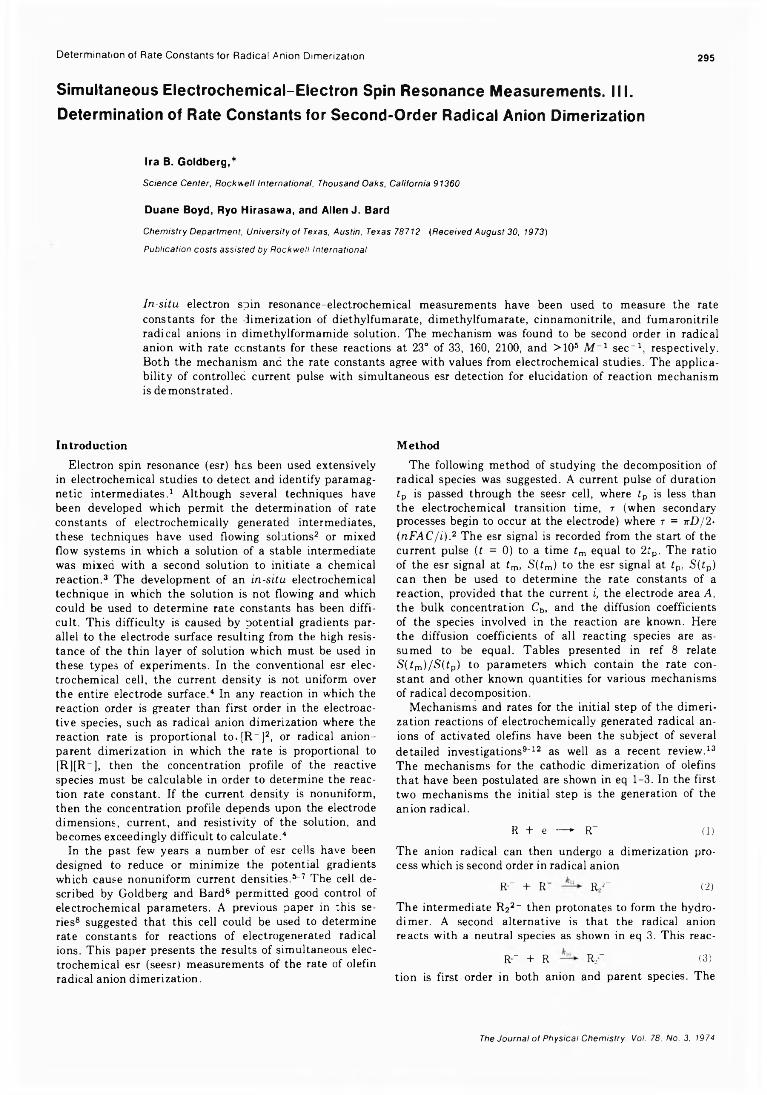
Determination of Rate Constants for Radical Anion Dimerization 295
Simultaneous Electrochemical-Electron Spin Resonance Measurements. III. Determination of Rate Constants for Second-Order Radical Anion Dimerization
Ira B. Goldberg,*
Science Center, Rockwell International, Thousand Oaks, California 91360 Duane Boyd, Ryo Hirasawa, and Allen J. Bard
Chemistry Department, University of Texas, Austin, Texas 78712 (Received August 30, 1973)Publication costs assisted by Rockwell International
In-situ electron spin resonance-electrochemical measurements have been used to measure the rate constants for the dimerization of diethylfumarate, dimethylfumarate, cinnamonitrile, and fumaronitrile radical anions in dimethylformamide solution. The mechanism was found to be second order in radical anion with rate constants for these reactions at 23° of 33, 160, 2100, and >105 M _1 sec-1, respectively. Both the mechanism and the rate constants agree with values from electrochemical studies. The applicability of controlled current pulse with simultaneous esr detection for elucidation of reaction mechanism is de monstrated.
Introduction
Electron spin resonance (esr) has been used extensively in electrochemical studies to detect and identify paramagnetic intermediates.1 Although several techniques have been developed which permit the determination of rate constants of electrochemically generated intermediates, these techniques have used flowing solutions2 or mixed flow systems in which a solution of a stable intermediate was mixed with a second solution to initiate a chemical reaction.3 The development of an in-situ electrochemical technique in which the solution is not flowing and which could be used to determine rate constants has been difficult. This difficulty is caused by potential gradients parallel to the electrode surface resulting from the high resistance of the thin layer of solution which must be used in these types of experiments. In the conventional esr electrochemical cell, the current density is not uniform over the entire electrode surface.4 In any reaction in which the reaction order is greater than first order in the electroactive species, such as radical anion dimerization where the reaction rate is proportional to .[R - ]2, or radical anion- parent dimerization in which the rate is proportional to [R][R_], then the concentration profile of the reactive species must be calculable in order to determine the reaction rate constant. If the current density is nonuniform, then the concentration profile depends upon the electrode dimensions, current, and resistivity of the solution, and becomes exceedingly difficult to calculate.4
In the past few years a number of esr cells have been designed to reduce or minimize the potential gradients which cause nonuniform current densities.5-7 The cell described by Goldberg and Bard® permitted good control of electrochemical parameters. A previous paper in this series8 suggested that this cell could be used to determine rate constants for reactions of electrogenerated radical ions. This paper presents the results of simultaneous electrochemical esr (seesr) measurements of the rate of olefin radical anion dimerization.
Method
The following method of studying the decomposition of radical species was suggested. A current pulse of duration ip is passed through the seesr cell, where tp is less than the electrochemical transition time, r (when secondary processes begin to occur at the electrode) where r = irD/2 - (nFAC/i).2 The esr signal is recorded from the start of the current pulse ( t = 0) to a time tm equal to 2ip. The ratio of the esr signal at t m , S (tm) to the esr signal at tp, S (tp) can then be used to determine the rate constants of a reaction, provided that the current i, the electrode area A, the bulk concentration Cb, and the diffusion coefficients of the species involved in the reaction are known. Here the diffusion coefficients of all reacting species are assumed to be equal. Tables presented in ref 8 relate S ( t m ) / S { t p ) to parameters which contain the rate constant and other known quantities for various mechanisms of radical decomposition.
Mechanisms and rates for the initial step of the dimerization reactions of electrochemically generated radical anions of activated olefins have been the subject of several detailed investigations9-12 as well as a recent review.13 The mechanisms for the cathodic dimerization of olefins that have been postulated are shown in eq 1-3. In the first two mechanisms the initial step is the generation of the anion radical.
R + e — ► R" (1)
The anion radical can then undergo a dimerization process which is second order in radical anion
R " + R~ R,2“ (2)
The intermediate R22- then protonates to form the hydrodimer. A second alternative is that the radical anion reacts with a neutral species as shown in eq 3. This reac-
R " + R R ," (3)tion is first order in both anion and parent species. The
The Journal of Physical Chemistry. Voi. 78. No. 3. 1974
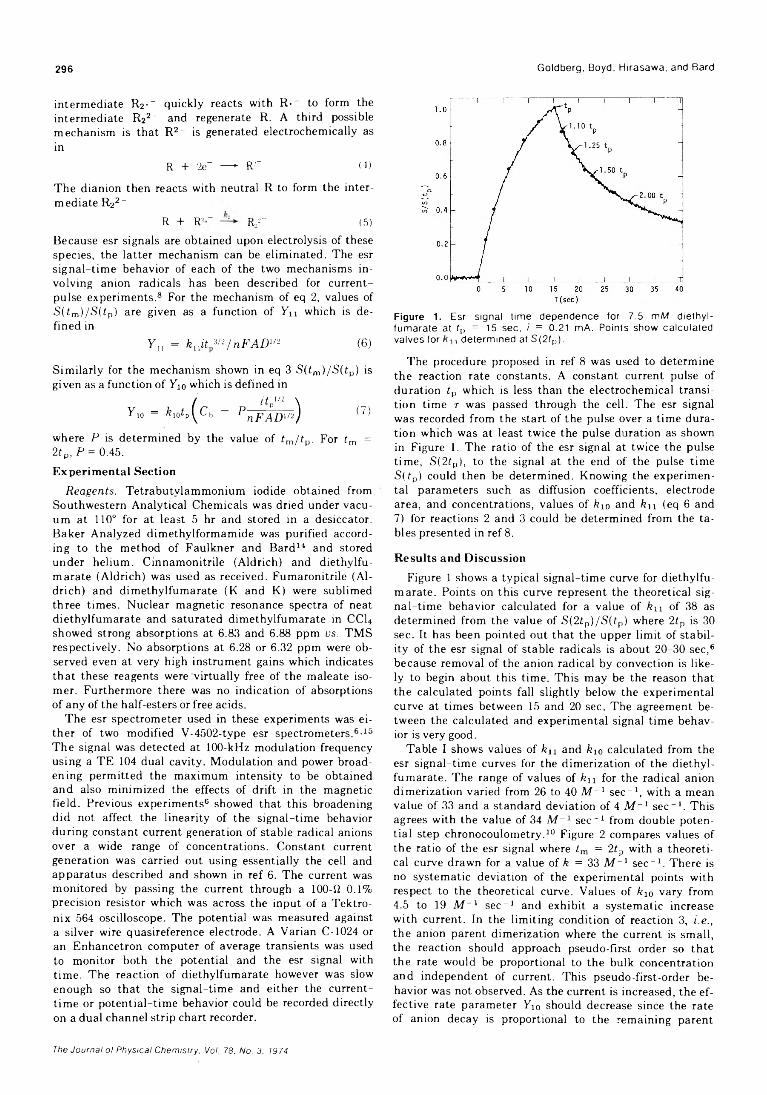
296 Goldberg, Boyd, Hirasawa, and Bard
intermediate R2-- quickly reacts with R- to form the intermediate R22- and regenerate R. A third possible mechanism is that R2- is generated electrochemically as in
R + 2e" — - RJ_ (-1)
The dianion then reacts with neutral R to form the intermediate R22 -
R + R2“ R,2- (5)
Because esr signals are obtained upon electrolysis of these species, the latter mechanism can be eliminated. The esr signal-time behavior of each of the two mechanisms involving anion radicals has been described for current- pulse experiments.8 For the mechanism of eq 2, values of S(tm)/S(tp) are given as a function of Vu which is defined in
Y „ = knitV 2/nFADm (6)
Similarly for the mechanism shown in eq 3 S(tm) /S(tp) is given as a function of Y10 which is defined in
j HpU2 \Y 10 = M P( C b — P nFADm) ^
where P is determined by the value of tm/tp. For fm = 2fp, P = 0.45.Experimental Section
Reagents. Tetrabutvlammonium iodide obtained from Southwestern Analytical Chemicals was dried under vacuum at 110° for at least 5 hr and stored in a desiccator. Baker Analyzed dimethylformamide was purified according to the method of Faulkner and Bard14 and stored under helium. Cinnamonitrile (Aldrich) and diethylfu- marate (Aldrich) was used as received. Fumaronitrile (Aldrich) and dimethylfumarate (K and K) were sublimed three times. Nuclear magnetic resonance spectra of neat diethylfumarate and saturated dimethylfumarate in CC14 showed strong absorptions at 6.83 and 6.88 ppm vs. TMS respectively. No absorptions at 6.28 or 6.32 ppm were observed even at very high instrument gains which indicates that these reagents were virtually free of the maleate isomer. Furthermore there was no indication of absorptions of any of the half-esters or free acids.
The esr spectrometer used in these experiments was either of two modified V-4502-type esr spectrometers.6’15 The signal was detected at 100-kHz modulation frequency using a TE 104 dual cavity. Modulation and power broadening permitted the maximum intensity to be obtained and also minimized the effects of drift in the magnetic field. Previous experiments6 showed that this broadening did not affect the linearity of the signal-time behavior during constant current generation of stable radical anions over a wide range of concentrations. Constant current generation was carried out using essentially the cell and apparatus described and shown in ref 6. The current was monitored by passing the current through a 100-Í2 0.1% precision resistor which was across the input of a Tektronix 564 oscilloscope. The potential was measured against a silver wire quasireference electrode. A Varian C-1024 or an Enhancetron computer of average transients was used to monitor both the potential and the esr signal with time. The reaction of diethylfumarate however was slow enough so that the signal-time and either the currenttime or potential-time behavior could be recorded directly on a dual channel strip chart recorder.
Figure 1. Esr signal time dependence tor 7.5 mM diethylfumarate at i,, = 15 sec, / = 0.21 mA. Points show calculated valves for , determined at S(2fp).
The procedure proposed in ref 8 was used to determine the reaction rate constants. A constant current pulse of duration ip which is less than the electrochemical transition time r was passed through the cell. The esr signal was recorded from the start of the pulse over a time duration which was at least twice the pulse duration as shown in Figure 1. The ratio of the esr signal at twice the pulse time, S(2fp), to the signal at the end of the pulse time S (fp) could then be determined. Knowing the experimental parameters such as diffusion coefficients, electrode area, and concentrations, values of k10 and f e n (eq 6 and 7) for reactions 2 and 3 could be determined from the tables presented in ref 8.
Results and Discussion
Figure 1 shows a typical signal-time curve for diethylfumarate. Points on this curve represent the theoretical signal-time behavior calculated for a value of f e n of 38 as determined from the value of S(2tp)/S (fp) where 2tp is 30 sec. It has been pointed out that the upper limit of stability of the esr signal of stable radicals is about 20-30 sec,6 because removal of the anion radical by convection is likely to begin about this time. This may be the reason that the calculated points fall slightly below the experimental curve at times between 15 and 20 sec. The agreement between the calculated and experimental signal time behavior is very good.
Table I shows values of f e n and k10 calculated from the esr signal-time curves for the dimerization of the diethylfumarate. The range of values of f e n for the radical anion dimerization varied from 26 to 40 Ai-1 sec-1 , with a mean value of 33 and a standard deviation of 4 M -1 sec-1 . This agrees with the value of 34 M -1 sec-1 from double potential step chronocoulometry.10 Figure 2 compares values of the ratio of the esr signal where fm = 2ip with a theoretical curve drawn for a value of fe =33 M -1 sec-1 . There is no systematic deviation of the experimental points with respect to the theoretical curve. Values of feio vary from4.5 to 19 M -1 sec-1 and exhibit a systematic increase with current. In the limiting condition of reaction 3, i.e., the anion parent dimerization where the current is small, the reaction should approach pseudo-first order so that the rate would be proportional to the bulk concentration and independent of current. This pseudo-first-order behavior was not observed. As the current is increased, the effective rate parameter Yi0 should decrease since the rate of anion decay is proportional to the remaining parent
The Journal of Physical Chemistry. Vol. 78. No. 3. 1974
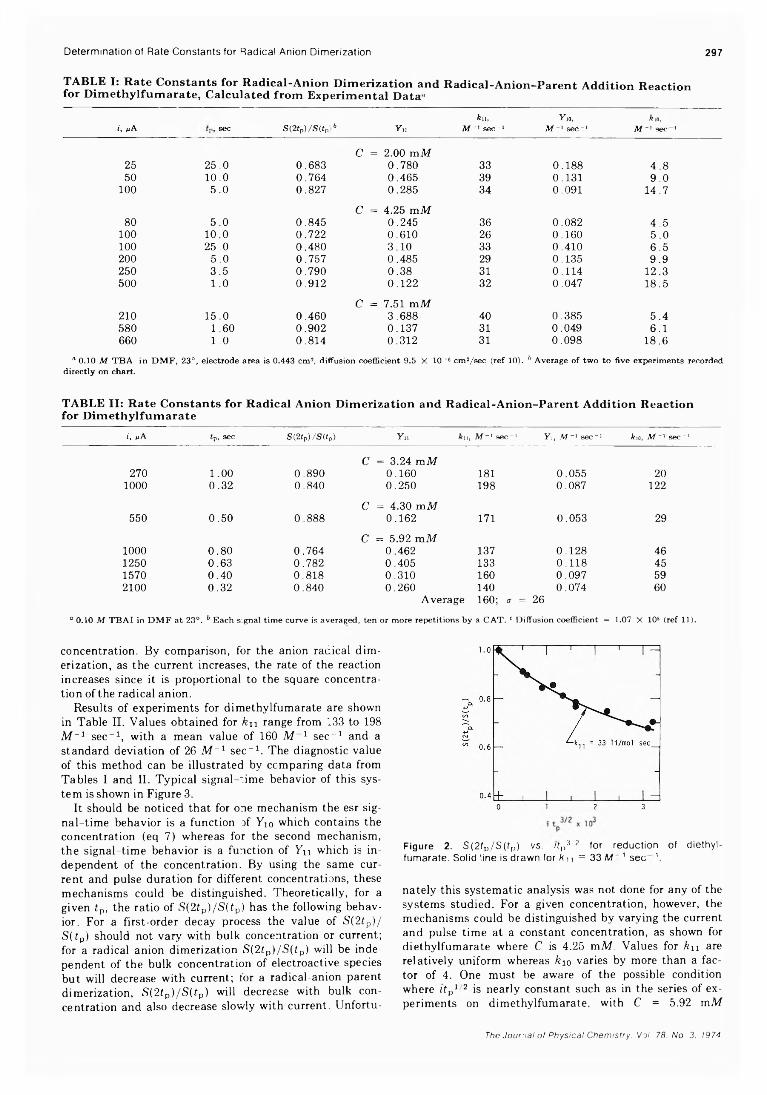
Determination of Rate Constants for Radical Anion Dimerization 297
TABLE I: Rate Constants for Radical-Anion Dimerization and Radical-Anion-Parent Addition Reaction for Dimethylfumarate, Calculated from Experimental Data'
in, Yin, Aio,i, nA sec S(2(p)/S(ipiò Yu M -1 sec-1 M~l sec-1 M ~1 sec1
C = 2.00 mM25 25.0 0.683 0.780 33 0.188 4.850 10.0 0.764 0.465 39 0.131 9.0
100 5.0 0.827 0.285 34 0.091 14.7C = 4.25 mM
80 5.0 0.845 0.245 36 0.082 4.5100 10.0 0.722 0.610 26 0.160 5.0100 25.0 0.480 3.10 33 0.410 6.5200 5.0 0.757 0.485 29 0.135 9.9250 3.5 0.790 0.38 31 0.114 12.3500 1.0 0.912 0.122 32 0.047 18.5
C = 7.51 m M210 15.0 0.460 3.688 40 0.385 5.4580 1.60 0.902 0.137 31 0.049 6.1660 1.0 0.814 0.312 31 0.098 18.6
a 0.10 M TBA in DMF, 23°, electrode area is 0.443 cm2, diffusion coefficient 9.5 X 10~6 cm2/sec (ref 10). b Average of two to five experiments recordeddirectly on chart.
TABLE II: Rate Constants for Radical Anion Dimerization and Radical-Anion-Parent Addition Reactionfor Dimethylfumarate
i, fiA fp, sec S(2ip)/S(ip) Yu k\\, M~l sec-1 Yi, M-1 sec-1 Aio, M_1 sec-1
C = 3.24 mM270 1.00 0.890 0.160 181 0.055 20
1000 0.32 0.840 0.250 198 0.087 122C = 4.30 mM
550 0.50 0.888 0.162 171 0.053 29C = 5.92 mM
1000 0.80 0.764 0.462 137 0.128 461250 0.63 0.782 0.405 133 0.118 451570 0.40 0.818 0.310 160 0.097 592100 0.32 0.840 0.260 140 0.074 60
Average 160; u = 26a 0.10 M TBAI in DMF at 23°. & Each signal time curve is averaged, ten or more repetitions by a CAT. c Diffusion coefficient = 1.07 X 10⁵ (ref 11).
concentration. By comparison, for the anion radical dimerization, as the current increases, the rate of the reaction increases since it is proportional to the square concentration of the radical anion.
Results of experiments for dimethylfumarate are shown in Table II. Values obtained for ku range from 133 to 198 M -1 sec-1 , with a mean value of 160 M 1 sec-1 and a standard deviation of 26 M -1 sec-1 . The diagnostic value of this method can be illustrated by comparing data from Tables I and II. Typical signal-rime behavior of this system is shown in Figure 3.
It should be noticed that for one mechanism the esr signal-time behavior is a function of Yio which contains the concentration (eq 7) whereas for the second mechanism, the signal-time behavior is a function of Yu which is independent of the concentration. By using the same current and pulse duration for different concentrations, these mechanisms could be distinguished. Theoretically, for a given tp, the ratio of S(2fp)/S (tp) has the following behavior. For a first-order decay process the value of S(2fp)/ S(tp) should not vary with bulk concentration or current; for a radical anion dimerization S(2tp)/S (tp) will be independent of the bulk concentration of electroactive species but will decrease with current; for a radical-anion parent dimerization, S(2tp)/S (fp) will decrease with bulk concentration and also decrease slowly with current. Unfortu-
Figure 2. S(2fp/S ( f„ ) vs. /fp3,2 for reduction of dlethyl- fumarate. Solid line is drawn for * n = 3 3 M - 1 sec 1.
nately this systematic analysis was not done for any of the systems studied. For a given concentration, however, the mechanisms could be distinguished by varying the current and pulse time at a constant concentration, as shown for diethylfumarate where C is 4.25 mill. Values for ku are relatively uniform whereas k10 varies by more than a factor of 4. One must be aware of the possible condition where t i p 1 2 is nearly constant such as in the series of experiments on dimethylfumarate, with C = 5.92 mM
The Journal of Physical Chemistry. Voi. 78. No. 3. 1974
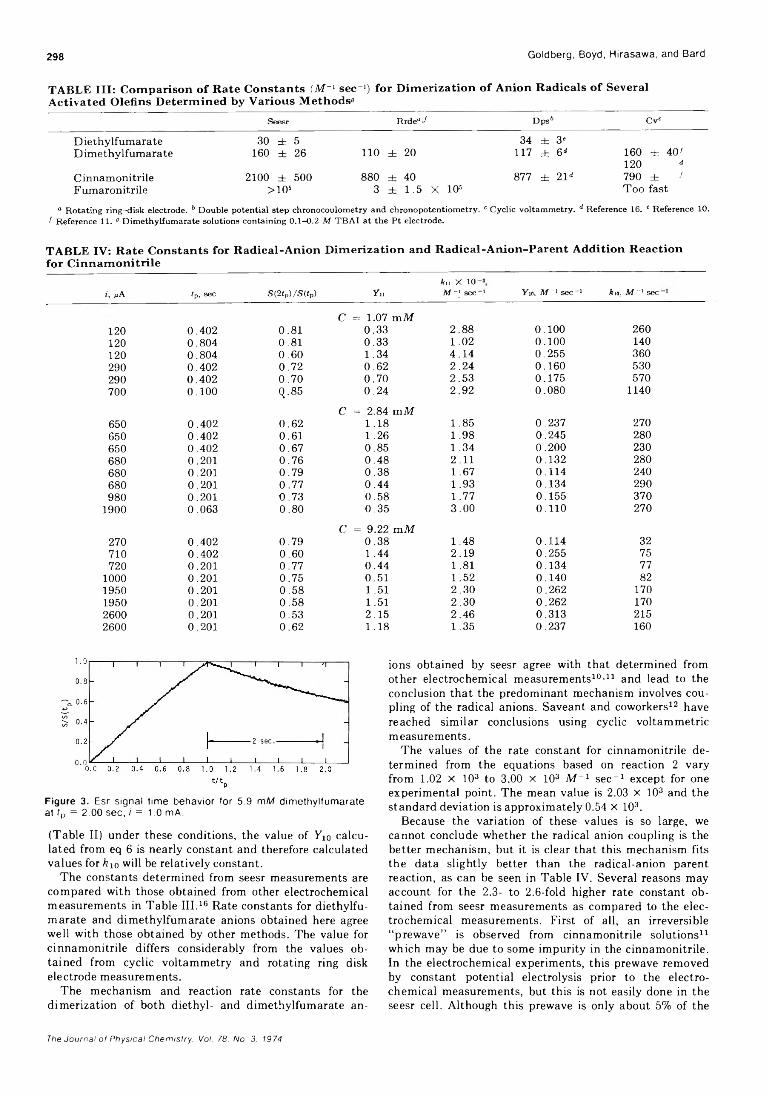
298 Goldberg, Boyd, Hirasawa, and Bard
TABLE III: Com parison o f Rate Constants (M _I sec“1) for Dim erization o f Anion Radicals o f Several Activated Olefins Determ ined by Various Methods»
Seesr Rrdeo/ Dps6 Cvc
D iethy lfumarate D imethylfumarate
CinnamonitrileFumaronitrile
30 ± 5160 ± 26 1 1 0 ± 2 0
2100 ± 500 > 105
880 ± 403 ± 1 .5 X 105
34 ± 3»117 ± 6 d 160 ± 40/
120 3 877 ± 2 1 d 790 ± >
Too fast
a Rotating ring-disk electrode. 6 Double potential step chronocoulometry and chronopotentiometry. c Cyclic voltammetry. d Reference 16. e Reference 10. / Reference 11. » Dimethylfumarate solutions containing 0.1-0.2 M TBAI at the Pt electrode.
TABLE IV: Rate Constants for Radical-Anion Dim erization and Radical-Anion-Parent Addition Reaction for Cinnam onitrile
An X 10i, /aA ip, sec S(2fp)/S(tp) Yu M ~ l sec-1 Yio, M ~ l sec-1 k\Q. M ~ x sec
1 2 0 0.402 0.81C = 1.07 m M
0.33 2 . 8 8 0 . 1 0 0 2601 2 0 0.804 0.81 0.33 1 . 0 2 0 . 1 0 0 1401 2 0 0.804 0.60 1.34 4.14 0.255 360290 0.402 0.72 0.62 2.24 0.160 530290 0.402 0.70 0.70 2.53 0.175 570700 0 . 1 0 0 Q.85 0.24 2.92 0.080 1140
650 0.402 0.62C = 2.84 mM
1.18 1.85 0.237 270650 0.402 0.61 1.26 1.98 0.245 280650 0.402 0.67 0.85 1.34 0 . 2 0 0 230680 0 . 2 0 1 0.76 0.48 2 . 1 1 0.132 280680 0 . 2 0 1 0.79 0.38 1.67 0.114 240680 0 . 2 0 1 0.77 0.44 1.93 0.134 290980 0 . 2 0 1 0.73 0.58 1.77 0.155 370
1900 0.063 0.80 0.35 3.00 0 . 1 1 0 270
270 0.402 0.79C = 9.22 m M
0.38 1.48 0.114 32710 0.402 0.60 1.44 2.19 0.255 75720 0 . 2 0 1 0.77 0.44 1.81 0.134 77
1 0 0 0 0 . 2 0 1 0.75 0.51 1.52 0.140 821950 0 . 2 0 1 0.58 1.51 2.30 0.262 1701950 0 . 2 0 1 0.58 1.51 2.30 0.262 1702600 0 . 2 0 1 0.53 2.15 2.46 0.313 2152600 0 . 2 0 1 0.62 1.18 1.35 0.237 160
Figure 3. Esr signal time behavior for 5.9 mM dimethylfumarate at tp = 2.00 sec, i = 1.0 mA.
(Table II) under these conditions, the value of y10 calculated from eq 6 is nearly constant and therefore calculated values for fc10 will be relatively constant.
The constants determined from seesr measurements are compared with those obtained from other electrochemical measurements in Table III.16 Rate constants for diethylfu- marate and dimethylfumarate anions obtained here agree well with those obtained by other methods. The value for cinnamonitrile differs considerably from the values obtained from cyclic voltammetry and rotating ring disk electrode measurements.
The mechanism and reaction rate constants for the dimerization of both diethyl- and dimethylfumarate an
ions obtained by seesr agree with that determined from other electrochemical measurements10'11 and lead to the conclusion that the predominant mechanism involves coupling of the radical anions. Saveant and coworkers12 have reached similar conclusions using cyclic voltammetric measurements.
The values of the rate constant for cinnamonitrile determined from the equations based on reaction 2 vary from 1.02 x 10³ to 3.00 X 10³ M _1 sec-1 except for one experimental point. The mean value is 2.03 x 10³ and the standard deviation is approximately 0.54 X 10³.
Because the variation of these values is so large, we cannot conclude whether the radical anion coupling is the better mechanism, but it is clear that this mechanism fits the data slightly better than the radical-anion parent reaction, as can be seen in Table IV. Several reasons may account for the 2.3- to 2.6-fold higher rate constant obtained from seesr measurements as compared to the electrochemical measurements. First of all, an irreversible “ prewave” is observed from cinnamonitrile solutions11 which may be due to some impurity in the cinnamonitrile. In the electrochemical experiments, this prewave removed by constant potential electrolysis prior to the electrochemical measurements, but this is not easily done in the seesr cell. Although this prewave is only about 5% of the
The Journal of Physical Chemistry. Vol. 78. No. 3. 1974
limiting current, it could be of significance when low currents or short times are used. Constant potential experiments would probably remove this effect. No significant trend with current or time is observed. It is also possible that at high currents, the current density at the working electrode is not uniform because of small ir gradients through the solution between the center and the edge of the electrode and the center of the electrode can be as high as 0.2 V .4-6 The result of a nonuniformity of the current in this cell would be a concentration gradient of R - along a line normal to the edge of the electrode and parallel to the surface.
For slow reactions longer times are involved and this concentration gradient will have sufficient time to become uniform by diffusion.4 For fast reactions, however, the apparent rate of reaction will become faster than the expected value, since the reaction rate is proportional to the square of the concentration. Finally the deviation between the rate constants determined by esr and electrochemical measurements arises from the possibility that intermediates of the form R22- are sufficiently stable to contribute to the current in the reversal experiments. For example, it could contribute to the ring current in ring-disk experiments or to the oxidation current in cyclic voltammetry. In the analysis of electrochemical data, R22- would be treated as if it were unreacted R - and therefore give low values for rate constants.
The reaction of fumaronitrile anion was too fast to give good signal-time behavior. The esr signal quickly levels off at a near steady-state value which appears to be independent of the bulk concentration of fumaronitrile and depends on the current. These results indicate either a first-order decay or radical ion dimerization reaction. From the limited data available, and if a radical anion dimerization is assumed, then the rate constant can be estimated to be in the order of 3 X 10⁵ M 1 sec-1 . This agreement is within a factor of 2 of the rate constant determined from ring-disk electrode experiments.
This work demonstrates that in situ esr-electrochemical experiments using a nonflowing electrolyte can be used to determine reaction mechanisms involving second-order chemical reactions and also be used tc determine the rate constant of the reaction. When the current pulse method described here is used, one must be certain that impurities are not causing the current efficiency to be less than 100% and that the current is evenly distributed over the electrode surface. An alternative method using a potential
Determ ination of Rate Constants for Radical Anion D imerization 299
step to the limiting current region of the electrochemical reaction; this technique should be considered for future work in order to avoid problems involving less than 100% current efficiency, although current pulse method appears to be satisfactory in many cases. The advantage of the current pulse method is that one concentration of the material can be used to determine the rate constant and mechanism. On the other hand, potential step experiments can only be easily used at the limiting current region. Several different concentrations must therefore be studied in order to determine the mechanism of the reaction. The potential step however offers the maximum rate of generation of radical anions, avoids problems associated with having less than 100% current efficiency, and will often lead to more uniform current densities across the electrode surface.
Acknowledgments. The authors thank Drs. E. P. Parry and C. S. Burton for helpful discussions of this work. The support of the National Science Foundation (GP-6688X) and the Robert A. Welch Foundation is gratefully acknowledged.
References and Notes(1) I. B. Goldberg and A. J. Bard In "M ag n e tic Resonance in Chem istry
and B io logy," J. H erak, Ed., M arcel D ekker, New York, N. Y., in press; B. Kastening, Chem. Ing. Tech.. 42, 190 (1970).
(2) R. Koopm an and H. G erischer, Ber. Bunsenges. Phys. Chem., 70, 118 (1966); R. Koopm ann, ibid., 70, 121 (1966); R. Koopm ann and H. G erischer, ibid.. 70, 127 (1966).
(3) B. Kastening and S. V avricka , Ber. Bunsenges. Phys. Chem.. 72, 27 (1968); K. U m em oto , Bull. Chem. Soc. Jap.. 40, 1058 (1967).
(4) I. B. Goldberg, A. J. Bard, and S. W. Feldberg. J. Phys. Chem.. 76, 2550 (1972).
(5) R. H irasawa, T. M ukaibo, H. Hasegawa. N. Odan, and T. M aruy- am a, J. Phys. Chem., 72, 2541 (1968).
(6) I. B. G oldberg and A. J. Bard. J. Phys. Chem.. 75, 3281 (1971).(7) B. Kastening, 23rd ISE M eeting, S tockho lm , Sweden, Aug 1972,
Extended A bstracts, p 290.(8) I. B. Goldberg and A. J. Bard, J. Phys. Chem.. 78, 290 (1974).(9) J. P. Petrovich, M. M. Baizer, and M. R. Ort, J. Electrochem. Soc..
116, 743, 749 (1969).(10) W. V. Childs, J. T. M aloy, C. P. K eszthe ly i, and A. J. Bard, J. Electrochem. Soc.. 118, 874 (1971).(11 ) V. J. Puglisi and A. J. Bard, J. Electrochem. Soc., 119, 829 (1972).(12) E. Lamy, L. Nadjo, and J. M. Saveant, J. Electroanal. Chem.. 42,
189 (1973).(13) F. Beck, Angew. Chem., Int. Ed. Engl., 11, 760 (1972).(14) L R. Faulkner and A. J. Bard, J. Amer. Chem. Soc., 90, 6284
(1968).(15) I. B. Goldberg and W. F. G oeppinger, Inorg. Chem., 11, 3129
(1973).(16) M. Hazelrigg and A. J. Bard, m anuscrip t in p repara tion ; M. Hazel-
rigg, Ph.D. D isserta tion, U nivers ity of Texas, 1973.
The Journal of Physical Chemistry. Vol. 78. No. 3. 19 74
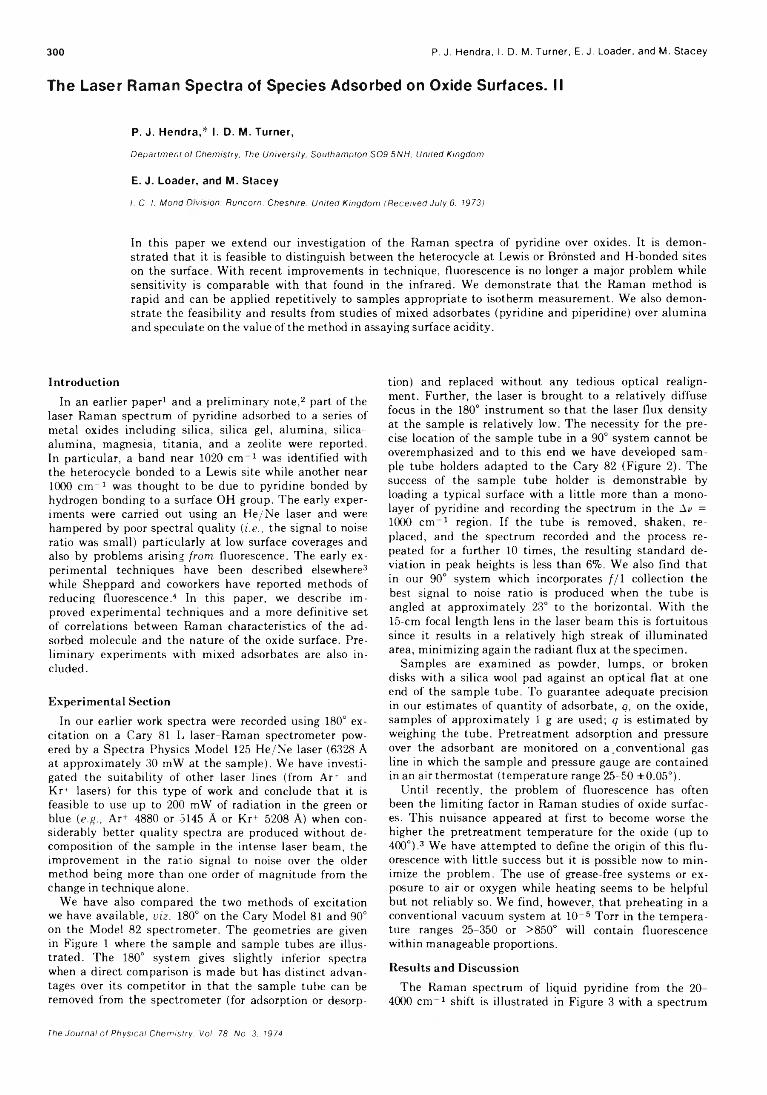
300 P. J. Hendra, I. D. M. Turner, E. J. Loader, and M. Stacey
The Laser Raman Spectra of Species Adsorbed on Oxide Surfaces. II
P. J. Hendra,* I. D. M. Turner,
Department of Chemistry, The University, Southampton S09 5NH, United KingdomE. J. Loader, and M. Stacey
/. C. I. Mond Division, Runcorn. Cheshire. United Kingdom (Received July 6. 1973)
In this paper we extend our investigation of the Raman spectra of pyridine over oxides. It is demonstrated that it is feasible to distinguish between the heterocycle at Lewis or Brònsted and H-bonded sites on the surface. With recent improvements in technique, fluorescence is no longer a major problem while sensitivity is comparable with that found in the infrared. We demonstrate that the Raman method is rapid and can be applied repetitively to samples appropriate to isotherm measurement. We also demonstrate the feasibility and results from studies of mixed adsorbates (pyridine and piperidine) over alumina and speculate on the value of the method in assaying surface acidity.
Introduction
In an earlier paper1 and a preliminary note,2 part of the laser Raman spectrum of pyridine adsorbed to a series of metal oxides including silica, silica gel, alumina, silica- alumina, magnesia, titania, and a zeolite were reported. In particular, a band near 1020 cm 1 was identified with the heterocycle bonded to a Lewis site while another near 1000 cm^1 was thought to be due to pyridine bonded by hydrogen bonding to a surface OH group. The early experiments were carried out using an He/Ne laser and were hampered by poor spectral quality (i.e., the signal to noise ratio was small) particularly at low surface coverages and also by problems arising from fluorescence. The early experimental techniques have been described elsewhere3 while Sheppard and coworkers have reported methods of reducing fluorescence.4 In this paper, we describe improved experimental techniques and a more definitive set of correlations between Raman characteristics of the adsorbed molecule and the nature of the oxide surface. Preliminary experiments with mixed adsorbates are also included.
Experimental SectionIn our earlier work spectra were recorded using 180° ex
citation on a Cary 81 L laser-Raman spectrometer powered by a Spectra Physics Model 125 He/Ne laser (6328 A at approximately 30 mW at the sample). We have investigated the suitability of other laser lines (from ArT and Kr+ lasers) for this type of work and conclude that it is feasible to use up to 200 mW of radiation in the green or blue (e.g., Ar+ 4880 or 5145 A or Kr+ 5208 A) when considerably better quality spectra are produced without decomposition of the sample in the intense laser beam, the improvement in the ratio signal to noise over the older method being more than one order of magnitude from the change in technique alone.
We have also compared the two methods of excitation we have available, viz. 180° on the Cary Model 81 and 90° on the Model 82 spectrometer. The geometries are given in Figure 1 where the sample and sample tubes are illustrated. The 180° system gives slightly inferior spectra when a direct comparison is made but has distinct advantages over its competitor in that the sample tube can be removed from the spectrometer (for adsorption or desorp
tion) and replaced without any tedious optical realignment. Further, the laser is brought to a relatively diffuse focus in the 180° instrument so that the laser flux density at the sample is relatively low. The necessity for the precise location of the sample tube in a 90° system cannot be overemphasized and to this end we have developed sample tube holders adapted to the Cary 82 (Figure 2). The success of the sample tube holder is demonstrable by loading a typical surface with a little more than a mono- layer of pyridine and recording the spectrum in the \v = 1000 cm 1 region. If the tube is removed, shaken, replaced, and the spectrum recorded and the process repeated for a further 10 times, the resulting standard deviation in peak heights is less than 6%. We also find that in our 90° system which incorporates / / I collection the best signal to noise ratio is produced when the tube is angled at approximately 23° to the horizontal. With the 15-cm focal length lens in the laser beam this is fortuitous since it results in a relatively high streak of illuminated area, minimizing again the radiant flux at the specimen.
Samples are examined as powder, lumps, or broken disks with a silica wool pad against an optical flat at one end of the sample tube. To guarantee adequate precision in our estimates of quantity of adsorbate, q, on the oxide, samples of approximately 1 g are used; q is estimated by weighing the tube. Pretreatment adsorption and pressure over the adsorbant are monitored on a conventional gas line in which the sample and pressure gauge are contained in an air thermostat (temperature range 25-50 ±0.05°).
Until recently, the problem of fluorescence has often been the limiting factor in Raman studies of oxide surfaces. This nuisance appeared at first to become worse the higher the pretreatment temperature for the oxide (up to 400°).3 We have attempted to define the origin of this fluorescence with little success but it is possible now to minimize the problem. The use of grease-free systems or exposure to air or oxygen while heating seems to be helpful but not reliably so. We find, however, that preheating in a conventional vacuum system at 1CU5 Torr in the temperature ranges 25-350 or >850° will contain fluorescence within manageable proportions.
Results and Discussion
The Raman spectrum of liquid pyridine from the 20- 4000 c m 1 shift is illustrated in Figure 3 with a spectrum
The Journal of Physical Chemistry. Voi. 78. No. 3. 1974
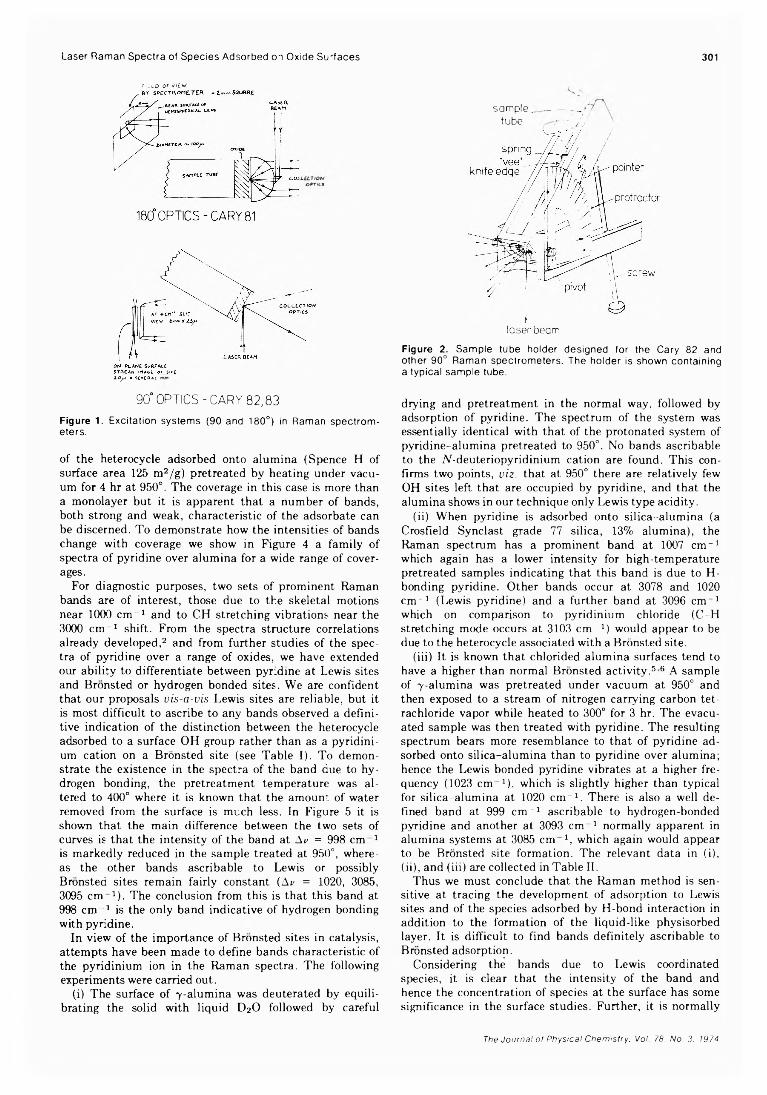
Laser Raman Spectra of Species Adsorbed on Oxide Surfaces 301
n:i_D of view
lOfL X SCVCRAi.
sample,tube 2 '
laser beam
Figure 2. Sample tube holder designed for the Cary 82 and other 90° Raman spectrometers. The holder is shown containing a typical sample tube.
90° OPTICS - CARY 82,83Figure 1. Excitation systems (90 and 180°) in Raman spectrometers.
of the heterocycle adsorbed onto alumina (Spence H of surface area 125 m2/g) pretreated by heating under vacuum for 4 hr at 950°. The coverage in this case is more than a monolayer but it is apparent that a number of bands, both strong and weak, characteristic of the adsorbate can be discerned. To demonstrate how the intensities of bands change with coverage we show in Figure 4 a family of spectra of pyridine over alumina for a wide range of coverages.
For diagnostic purposes, two sets of prominent Raman bands are of interest, those due to the skeletal motions near 1000 cm “ 1 and to CH stretching vibrations near the 3000 cm -1 shift. From the spectra structure correlations already developed,2 and from further studies of the spectra of pyridine over a range of oxides, we have extended our ability to differentiate between pyridine at Lewis sites and Bronsted or hydrogen bonded sites. We are confident that our proposals vis-a-vis Lewis sites are reliable, but it is most difficult to ascribe to any bands observed a definitive indication of the distinction between the heterocycle adsorbed to a surface OH group rather than as a pyridini- um cation on a Bronsted site (see Table I). To demonstrate the existence in the spectra of the band due to hydrogen bonding, the pretreatment temperature was altered to 400° where it is known that the amount of water removed from the surface is much less. In Figure 5 it is shown that the main difference between the two sets of curves is that the intensity of the band at \v = 998 cm 1 is markedly reduced in the sample treated at 950°, whereas the other bands ascribable to Lewis or possibly Bronsted sites remain fairly constant (Av = 1020, 3085, 3095 cm -1). The conclusion from this is that this band at 998 cm ^1 is the only band indicative of hydrogen bonding with pyridine.
In view of the importance of Bronsted sites in catalysis, attempts have been made to define bands characteristic of the pyridinium ion in the Raman spectra. The following experiments were carried out.
(i) The surface of 7 -alumina was deuterated by equilibrating the solid with liquid D2O followed by careful
drying and pretreatment in the normal way, followed by adsorption of pyridine. The spectrum of the system was essentially identical with that of the protonated system of pyridine-alumina pretreated to 950°. No bands ascribable to the ALdeuteriopyridinium cation are found. This confirms two points, viz. that at 950° there are relatively few OH sites left that are occupied by pyridine, and that the alumina shows in our technique only Lewis type acidity.
(ii) When pyridine is adsorbed onto silica-alumina (a Crosfield Synclast grade 77 silica, 13% alumina), the Raman spectrum has a prominent band at 1007 cm-1 which again has a lower intensity for high-temperature pretreated samples indicating that this band is due to H- bonding pyridine. Other bands occur at 3078 and 1020 cm-1 (Lewis pyridine) and a further band at 3096 cm 1 which on comparison to pyridinium chloride (C-H stretching mode occurs at 3103 cm _1) would appear to be due to the heterocycle associated with a Bronsted site.
(iii) It is known that chlorided alumina surfaces tend to have a higher than normal Bronsted activity.5 6 A sample of 7 -alumina was pretreated under vacuum at 950° and then exposed to a stream of nitrogen carrying carbon tetrachloride vapor while heated to 300° for 3 hr. The evacuated sample was then treated with pyridine. The resulting spectrum bears more resemblance to that of pyridine adsorbed onto silica-alumina than to pyridine over alumina; hence the Lewis bonded pyridine vibrates at a higher frequency (1023 c m 1), which is slightly higher than typical for silica-alumina at 1020 cm -1. There is also a well defined band at 999 cm - 1 ascribable to hydrogen-bonded pyridine and another at 3093 c m 1 normally apparent in alumina systems at 3085 c m 1, which again would appear to be Bronsted site formation. The relevant data in (i), (ii), and (iii) are collected in Table II.
Thus we must conclude that the Raman method is sensitive at tracing the development of adsorption to Lewis sites and of the species adsorbed by H-bond interaction in addition to the formation of the liquid-like physisorbed layer. It is difficult to find bands definitely ascribable to Bronsted adsorption.
Considering the bands due to Lewis coordinated species, it is clear that the intensity of the band and hence the concentration of species at the surface has some significance in the surface studies. Further, it is normally
The Journal of Physical Chemistry. Vol. 78. No. 3. 1974
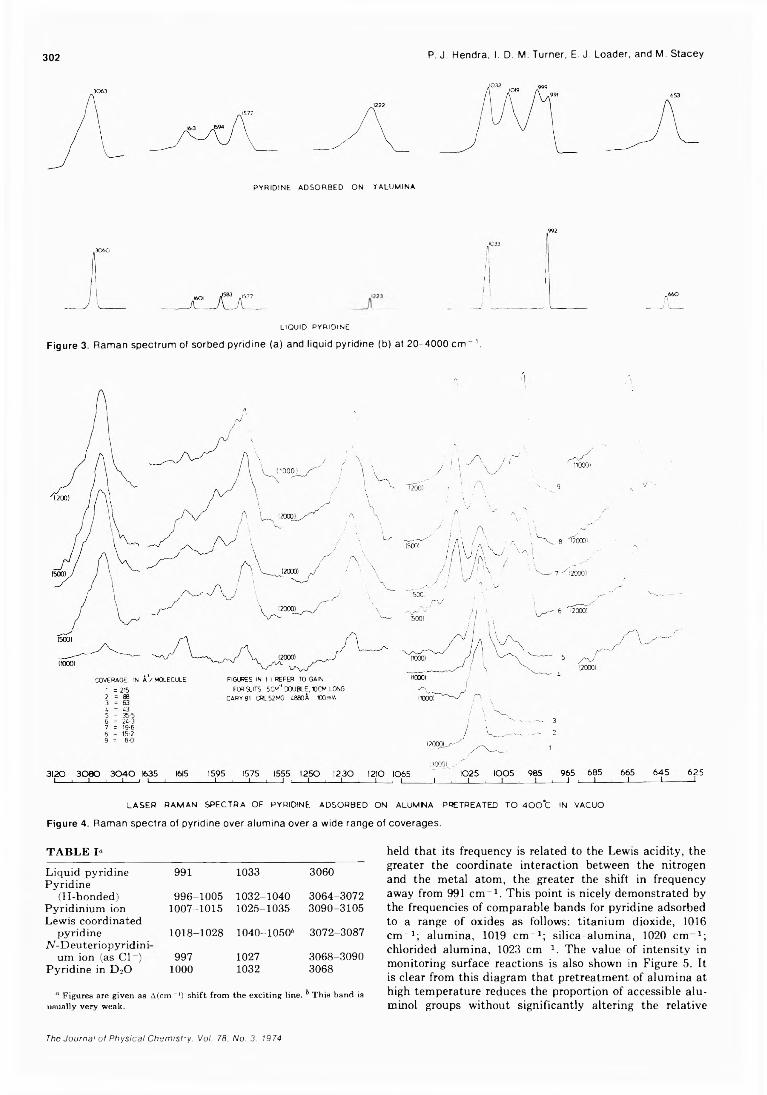
302 P. J. Hendra, I. D. M. Turner, E. J. Loader, and M. Stacey
PYRIDINE A D S O R B E D O N Y A L U M I N A
LIQUID PYRIDINE
Figure 3. Raman spectrum of sorbed pyridine (a) and liquid pyridine (b) at 20-4000 c r r r 1.
LASER RAMAN SPECTRA OF PYRIDINE ADSORBED ON ALUMMA PRETREATED TO 4 0 0 *C IN VACUO
Figure 4. Raman spectra of pyridine over alumina over a wide range of coverages.
TABLE 1«
Liquid pyridine Pyridine
991 1033 3060
(H-bonded) 996-1005 1032-1040 3064-3072Pyridinium ion Lewis coordinated
1007-1015 1025-1035 3090-3105
pyridine 1018-1028 1040-10506 3072-3087TV- D euteriopyridini
um ion (as C l- ) 997 1027 3068-3090Pyridine in D 20 100 0 1032 3068
n Figures are given as A ( c m -1) shift f r o m the exciting line. b This b a n d isusually very weak.
held that its frequency is related to the Lewis acidity, the greater the coordinate interaction between the nitrogen and the metal atom, the greater the shift in frequency away from 991 cm -1 . This point is nicely demonstrated by the frequencies of comparable bands for pyridine adsorbed to a range of oxides as follows: titanium dioxide, 1016 c m '1; alumina, 1019 cm -1 ; silica-alumina, 1020 c m 1; chlorided alumina, 1023 cm-1 . The value of intensity in monitoring surface reactions is also shown in Figure 5. It is clear from this diagram that pretreatment of alumina at high temperature reduces the proportion of accessible alu- minol groups without significantly altering the relative
The Journal of Physical Chemistry. Voi. 78. No. 3. 1974
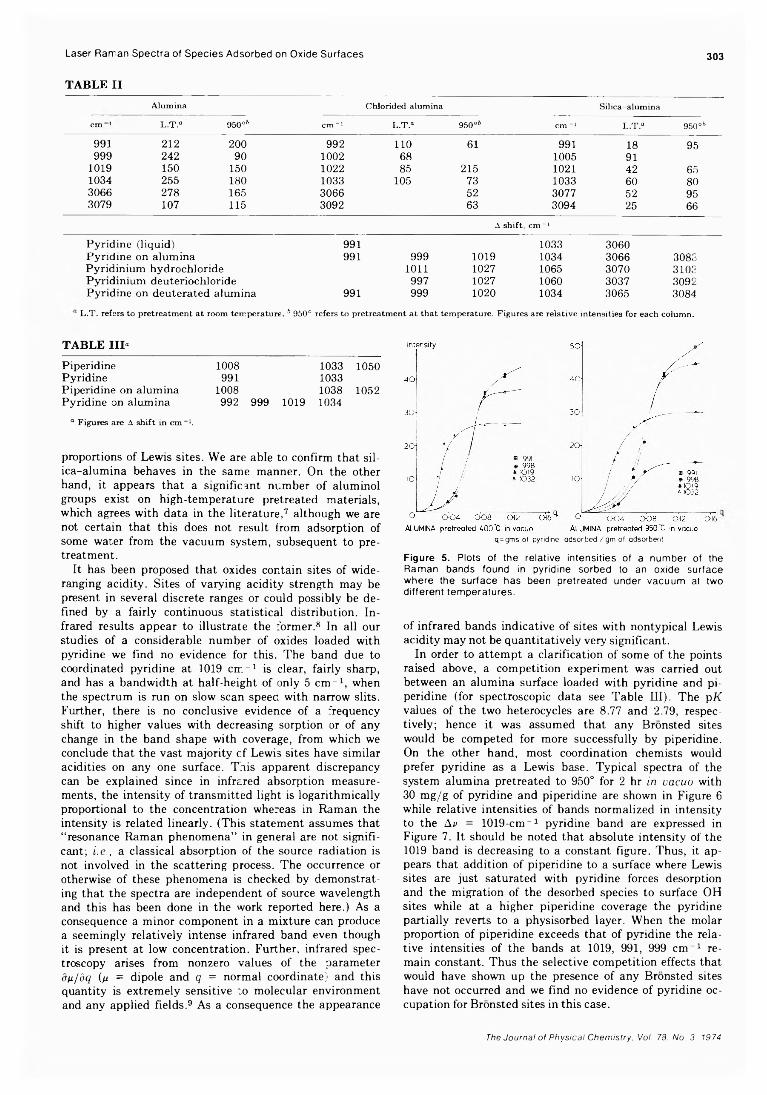
Laser Raman Spectra of Species Adsorbed on Oxide Surfaces 303
TABLE II
Alumina Chlorided alumina Silica-aluminacm 1 L.T.° 950oh cm -1 L.T.a 950o& cm-1 L.T.° 950 ok991 212 2 0 0 992 n o 61 991 18 95999 242 90 100 2 68 1005 91
1019 150 150 102 2 85 215 1021 42 651034 255 180 1033 105 73 1033 60 803066 278 165 3066 52 3077 52 953079 107 115 3092 63 3094 25 66
A shift, cm-1Pyridine (liquid) 991 1033 3060Pyridine on alumina 991 999 1019 1034 3066 3083Pyridinium hydrochloride 1011 1027 1065 3070 3103Pyridinium deuteriochloride 997 1027 1060 3037 3092Pyridine on deuterated alumina 991 999 1 0 2 0 1034 3065 3084
L.T. refers to pretreatment at room temperature. b 950° refers to pretreatment at that temperature. Figures are relative intensities for each column.
TABLE III»
Piperidine 1008 1033 1050Pyridine 991 1033Piperidine on alumina 1008 1038 1052Pyridine on alumina 992 999 1019 1034
» Figures are A shift in c m -1.
proportions of Lewis sites. We are able to confirm that silica-alumina behaves in the same manner. On the other hand, it appears that a significant number of aluminol groups exist on high-temperature pretreated materials, which agrees with data in the literature,7 although we are not certain that this does not result from adsorption of some water from the vacuum system, subsequent to pretreatment.
It has been proposed that oxides contain sites of wide- ranging acidity. Sites of varying acidity strength may be present in several discrete ranges or could possibly be defined by a fairly continuous statistical distribution. Infrared results appear to illustrate the former.8 In all our studies of a considerable number of oxides loaded with pyridine we find no evidence for this. The band due to coordinated pyridine at 1019 cm -1 is clear, fairly sharp, and has a bandwidth at half-height of only 5 cm -1, when the spectrum is run on slow scan speed with narrow slits. Further, there is no conclusive evidence of a frequency shift to higher values with decreasing sorption or of any change in the band shape with coverage, from which we conclude that the vast majority cf Lewis sites have similar acidities on any one surface. Tnis apparent discrepancy can be explained since in infrared absorption measurements, the intensity of transmitted light is logarithmically proportional to the concentration whereas in Raman the intensity is related linearly. (This statement assumes that “ resonance Raman phenomena” in general are not significant; i.e., a classical absorption of the source radiation is not involved in the scattering process. The occurrence or otherwise of these phenomena is checked by demonstrating that the spectra are independent of source wavelength and this has been done in the work reported here.) As a consequence a minor component in a mixture can produce a seemingly relatively intense infrared band even though it is present at low concentration. Further, infrared spectroscopy arises from nonzero values of the parameter dfi/dq (n = dipole and q = normal coordinate) and this quantity is extremely sensitive to molecular environment and any applied fields.9 As a consequence the appearance
q=gms of pyridine adsorbed /gm of adsorbent
Figure 5. Plots of the relative Intensities of a number of the Raman bands found in pyridine sorbed to an oxide surface where the surface has been pretreated under vacuum at two different temperatures.
of infrared bands indicative of sites with nontypical Lewis acidity may not be quantitatively very significant.
In order to attempt a clarification of some of the points raised above, a competition experiment was carried out between an alumina surface loaded with pyridine and piperidine (for spectroscopic data see Table III). The pK values of the two heterocycles are 8.77 and 2.79, respectively; hence it was assumed that any Bronsted sites would be competed for more successfully by piperidine. On the other hand, most coordination chemists would prefer pyridine as a Lewis base. Typical spectra of the system alumina pretreated to 950° for 2 hr in vacuo with 30 mg/g of pyridine and piperidine are shown in Figure 6 while relative intensities of bands normalized in intensity to the Ap = 1019-cm-1 pyridine band are expressed in Figure 7. It should be noted that absolute intensity of the 1019 band is decreasing to a constant figure. Thus, it appears that addition of piperidine to a surface where Lewis sites are just saturated with pyridine forces desorption and the migration of the desorbed species to surface OH sites while at a higher piperidine coverage the pyridine partially reverts to a physisorbed layer. When the molar proportion of piperidine exceeds that of pyridine the relative intensities of the bands at 1019, 991, 999 cm 1 remain constant. Thus the selective competition effects that would have shown up the presence of any Bronsted sites have not occurred and we find no evidence of pyridine occupation for Bronsted sites in this case.
The Journal of Physical Chemistry. Vol. 78. No. 3. 1974
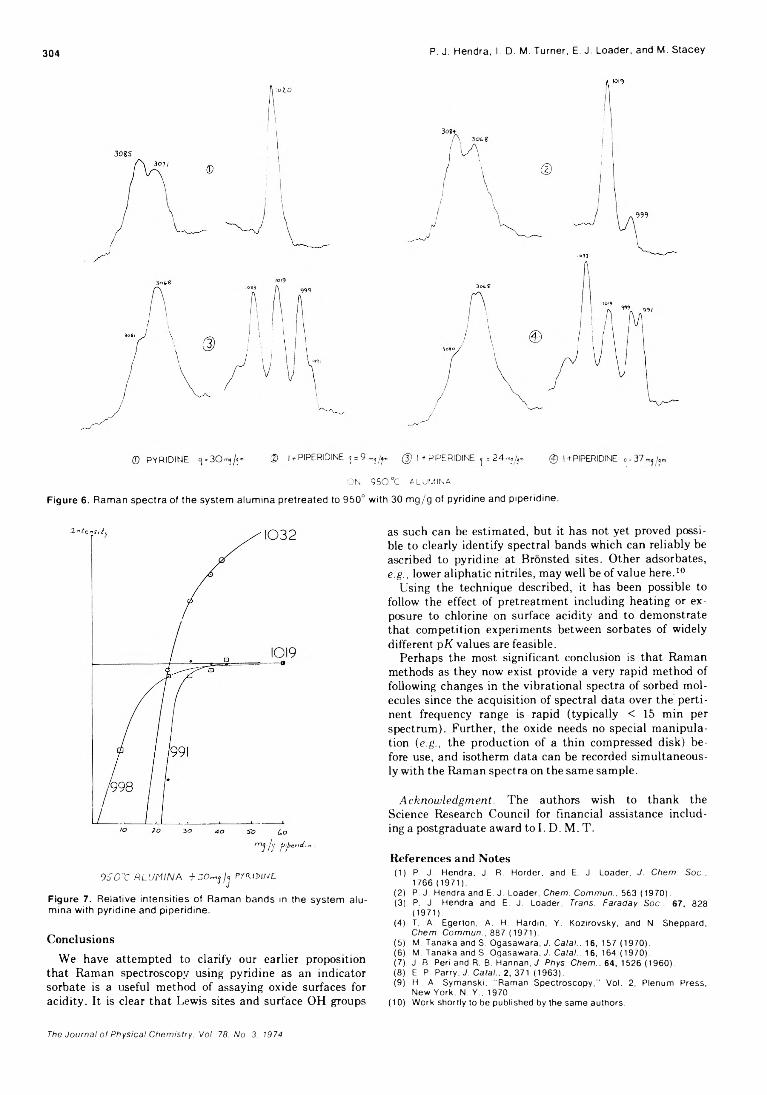
304 P. J. Hendra, I. D. M. Turner, E. J. Loader, and M. Stacey
ON 9 5 0 °C ALUMINA
Figure 6. Raman spectra of the system alumina pretreated to 950° with 30 mg/g of pyridine and piperidine.
9SOX ALUMINA + zo~j / j rmiDiNE
Figure 7. Relative intensities of Raman bands in the system alumina with pyridine and piperidine.
ConclusionsWe have attempted to clarify our earlier proposition
that Raman spectroscopy using pyridine as an indicator sorbate is a useful method of assaying oxide surfaces for acidity. It is clear that Lewis sites and surface OH groups
as such can be estimated, but it has not yet proved possible to clearly identify spectral bands which can reliably be ascribed to pyridine at Bronsted sites. Other adsorbates, e.g., lower aliphatic nitriles, may well be of value here.10
Using the technique described, it has been possible to follow the effect of pretreatment including heating or exposure to chlorine on surface acidity and to demonstrate that competition experiments between sorbates of widely different pK values are feasible.
Perhaps the most significant conclusion is that Raman methods as they now exist provide a very rapid method of following changes in the vibrational spectra of sorbed molecules since the acquisition of spectral data over the pertinent frequency range is rapid (typically < 15 min per spectrum). Further, the oxide needs no special manipulation (e.g., the production of a thin compressed disk) before use, and isotherm data can be recorded simultaneously with the Raman spectra on the same sample.
Acknowledgment. The authors wish to thank the Science Research Council for financial assistance including a postgraduate award to I. D. M. T.
References and Notes(1) P. J. Hendra, J. R. Horder, and E. J. Loader, J. Chem. Soc..
1766 (1971).(2) P. J. Hendra and E .J . Loader, Chem. Commun., 563 (1970).(3) P. J. H endra and E. J. Loader, Trans. Faraday Soc.. 67, 828
(1971).(4) T. A. Egerton, A. H. Hardin, Y. Kozirovsky, and N. Sheppard, Chem. Commun., 887 (1971).(5) M. Tanaka and S. Ogasawara, J. Catal.. 16, 157 (1970).(6) M. Tanaka and S. Ogasawara, J. Catal.. 16, 164 (1970).(7) J. B. Peri and R. B. Hannan, J. Phys. Chem.. 64, 1526 ( I9 6 0 ).(8) E. P. Parry, J. Catal.. 2, 371 (1963).(9) H. A. Sym anski. "Ram an S pectroscopy,” Vol. 2, P lenum Press,
New York, N. Y., 1970.(10) W ork shortly to be published by the sam e authors.
The Journal of Physical Chemistry. Vol. 78. No. 3. 1974
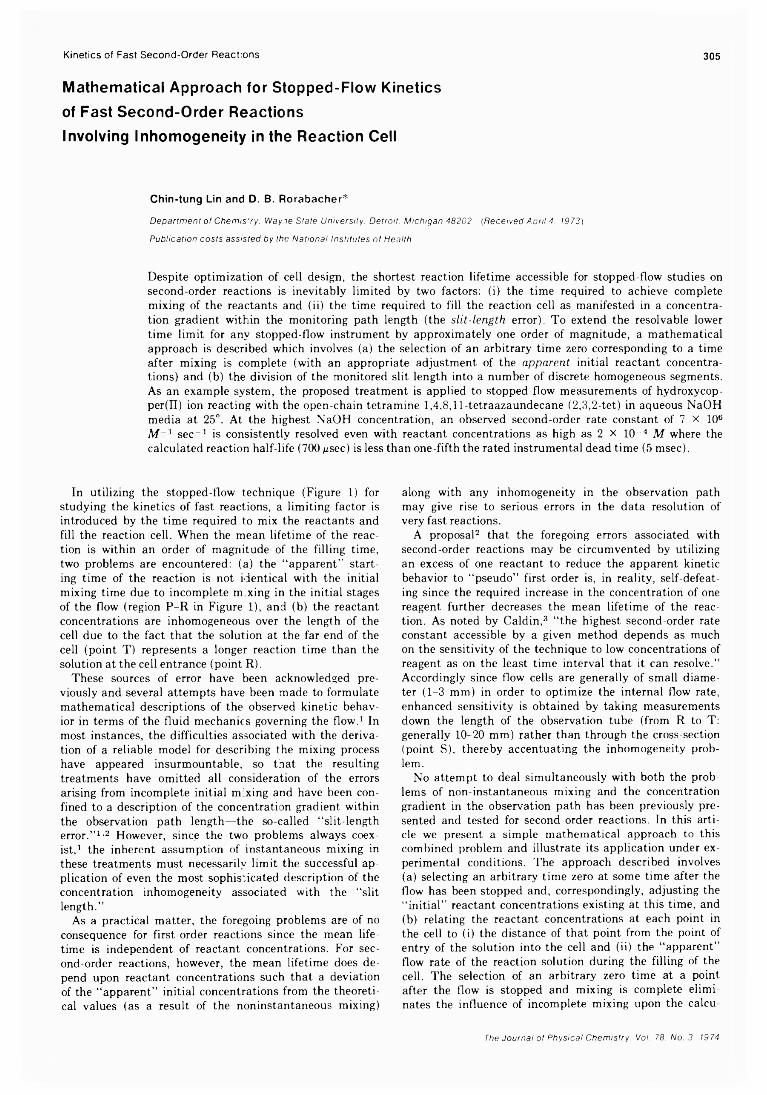
Kinetics of Fast Second-Order Reactions 305
Mathematical Approach for Stopped-Flow Kineticsof Fast Second-Order ReactionsInvolving Inhomogeneity in the Reaction Cell
C hin-tung Lin and D. B. R orabacher*
Department of Chemis'ry. Wayne State University. Detroit. Michigan 48202 (Received April 4. 1973) Publication costs assisted by the National Institutes of Health
Despite optimization of cell design, the shortest reaction lifetime accessible for stopped-flow studies on second-order reactions is inevitably limited by two factors: (i) the time required to achieve complete mixing of the reactants and (ii) the time required to fill the reaction cell as manifested in a concentration gradient within the monitoring path length (the slit-length error). To extend the resolvable lower time limit for any stopped-flow instrument by approximately one order of magnitude, a mathematical approach is described which involves (a) the selection of an arbitrary time zero corresponding to a time after mixing is complete (with an appropriate adjustment of the apparent initial reactant concentrations) and (b) the division of the monitored slit length into a number of discrete homogeneous segments. As an example system, the proposed treatment is applied to stopped-flow measurements of hydroxycop- per(II) ion reacting with the open-chain tetramine 1,4,8,11-tetraazaundecane (2,3,2-tet) in aqueous NaOH media at 25°. At the highest NaOH concentration, an observed second-order rate constant of 7 X 10⁶ M 1 sec-1 is consistently resolved even with reactant concentrations as high as 2 X 10" 4 M where the calculated reaction half-life (700 /¿sec) is less than one-fifth the rated instrumental dead time (5 msec).
In utilizing the stopped-flow technique (Figure 1) for studying the kinetics of fast reactions, a limiting factor is introduced by the time required to mix the reactants and fill the reaction cell. When the mean lifetime of the reaction is within an order of magnitude of the filling time, two problems are encountered: (a) the “ apparent” starting time of the reaction is not identical with the initial mixing time due to incomplete mixing in the initial stages of the flow (region P-R in Figure 1), and (b) the reactant concentrations are inhomogeneous over the length of the cell due to the fact that the solution at the far end of the cell (point T) represents a longer reaction time than the solution at the cell entrance (point R).
These sources of error have been acknowledged previously and several attempts have been made to formulate mathematical descriptions of the observed kinetic behavior in terms of the fluid mechanics governing the flow.1 In most instances, the difficulties associated with the derivation of a reliable model for describing the mixing process have appeared insurmountable, so that the resulting treatments have omitted all consideration of the errors arising from incomplete initial mixing and have been confined to a description of the concentration gradient within the observation path length—the so-called “ slit-length error.” 1’2 However, since the two problems always coexist,1 the inherent assumption of instantaneous mixing in these treatments must necessarily limit the successful application of even the most sophisticated description of the concentration inhomogeneity associated with the “ slit length.”
As a practical matter, the foregoing problems are of no consequence for first-order reactions since the mean lifetime is independent of reactant concentrations. For second-order reactions, however, the mean lifetime does depend upon reactant concentrations such that a deviation of the “ apparent” initial concentrations from the theoretical values (as a result of the noninstantaneous mixing)
along with any inhomogeneity in the observation path may give rise to serious errors in the data resolution of very fast reactions.
A proposal2 that the foregoing errors associated with second-order reactions may be circumvented by utilizing an excess of one reactant to reduce the apparent kinetic behavior to “ pseudo” first order is, in reality, self-defeating since the required increase in the concentration of one reagent further decreases the mean lifetime of the reaction. As noted by Caldin,3 “ the highest second-order rate constant accessible by a given method depends as much on the sensitivity of the technique to low concentrations of reagent as on the least time interval that it can resolve.” Accordingly since flow cells are generally of small diameter (1-3 mm) in order to optimize the internal flow rate, enhanced sensitivity is obtained by taking measurements down the length of the observation tube (from R to T: generally 10-20 mm) rather than through the cross-section (point S), thereby accentuating the inhomogeneity problem.
No attempt to deal simultaneously with both the problems of non instantaneous mixing and the concentration gradient in the observation path has been previously presented and tested for second-order reactions. In this article we present a simple mathematical approach to this combined problem and illustrate its application under experimental conditions. The approach described involves(a) selecting an arbitrary time zero at some time after the flow has been stopped and, correspondingly, adjusting the “ initial” reactant concentrations existing at this time, and(b) relating the reactant concentrations at each point in the cell to (i) the distance of that point from the point of entry of the solution into the cell and (ii) the “ apparent” flow rate of the reaction solution during the filling of the cell. The selection of an arbitrary zero time at a point after the flow is stopped and mixing is complete eliminates the influence of incomplete mixing upon the ealeu-
The Journal of Physical Chemistry. Vol. 78. No. 3. 1974
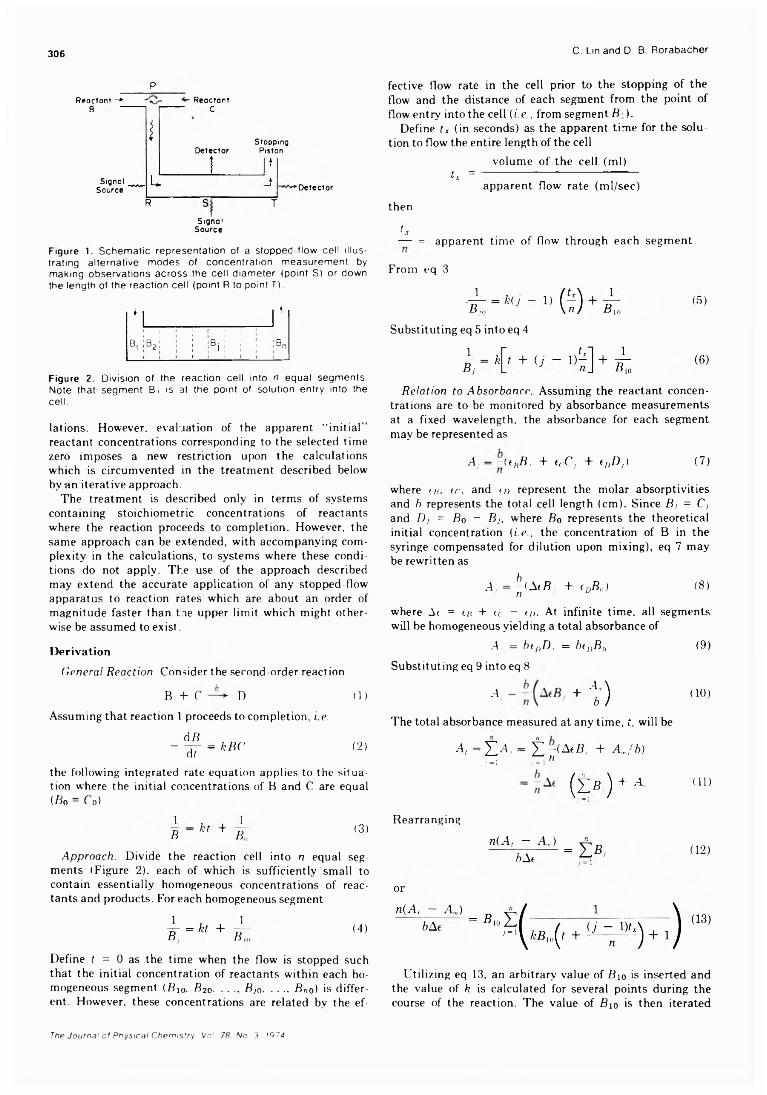
306 C. Lin and D. B. Rorabacher
PReactant ->
B
SignalSource
R
ReactantC
Detector
Í
sSignal
Source
StoppingPiston
Detector
T
t
J
Figure 1. Schematic representation of a stopped-flow cell illustrating alternative modes of concentration measurement by making observations across the cell diameter (point S) or down the length of the reaction cell (point R to point T ).
*1 rBi ;bz
i i i i h i ! 1 1 1 1 : iBn
Figure 2. Division of the reaction cell Into n equal segments. Note that segment B, is at the point of solution entry into the cell.
lations. However, evaluation of the apparent “ initial” reactant concentrations corresponding to the selected time zero imposes a new restriction upon the calculations which is circumvented in the treatment described below by-an iterative approach.
The treatment is described only in terms of systems containing stoichiometric concentrations of reactants where the reaction proceeds to completion. However, the same approach can be extended, with accompanying complexity in the calculations, to systems where these conditions do not apply. The use of the approach described may extend the accurate application of any stopped-flow apparatus to reaction rates which are about an order of magnitude faster than the upper limit which might otherwise be assumed to exist.
DerivationGeneral Reaction. Consider the second-order reaction
B + C D ( 1)
Assuming that reaction 1 proceeds to completion, i.e. d R
- dT - kBC(2)
the following integrated rate equation applies to the situation where the initial concentrations of B and C are equal ( f í o — C o 1
1 , , 1R - ht + B (3)
Approach. Divide the reaction cell into n equal segments (Figure 2). each of which is sufficiently small to contain essentially homogeneous concentrations of reactants and products. For each homogeneous segment
+Jfí,
(4)
Define t = 0 as the time when the flow is stopped such that the initial concentration of reactants within each homogeneous segment (R10, B2o........B]0..........Bno) is different. However, these concentrations are related by the ef
fective flow rate in the cell prior to the stopping of the flow and the distance of each segment from the point of flow entry into the cell (i.e., from segment B-J.
Define tx (in seconds) as the apparent time for the solution to flow the entire lengt h of the cell
volume of the cell (ml)tx = ------------------------------------------
apparent flow rate (ml/sec)then
U— = apparent time of flow through each segment
From eq 3
Substituting eq 5 into eq 4
Relation to Absorbance. Assuming the reactant concentrations are to be monitored by absorbance measurements at a fixed wavelength, the absorbance for each segment may be represented as
A j = -<*„£, + t c C j + t B D j ) ( 7 )
where <n. ir, and to represent the molar absorptivities and b represents the total cell length (cm). Since Bj = Cj and Bj = Bo - Bj, where Bo represents the theoretical initial concentration (i.e., the concentration of B in the syringe compensated for dilution upon mixing), eq 7 may be rewritten as
.4. = J (A tfl, + toB») (8 )
where A< = tn + tc ~ u>- At infinite time, all segmentswill be homogeneous yielding a total absorbance of
,4, = bt„D, = bfDB0 (9)Substituting eq 9 into eq 8
•4 - + t) (10)The total absorbance measured at any time, t, will be
-4, = X > , = ¿ - ( A (Bj + A J b )7 = 1 j = 1 n
( ¿ b ) - 1- ' 4- , m
Rearranging
Utilizing eq 13, an arbitrary value of Bio is inserted and the value of k is calculated for several points during the course of the reaction. The value of B io is then iterated
The Journal of Physical Chemistry. Vo!. 78. No 3. 1974
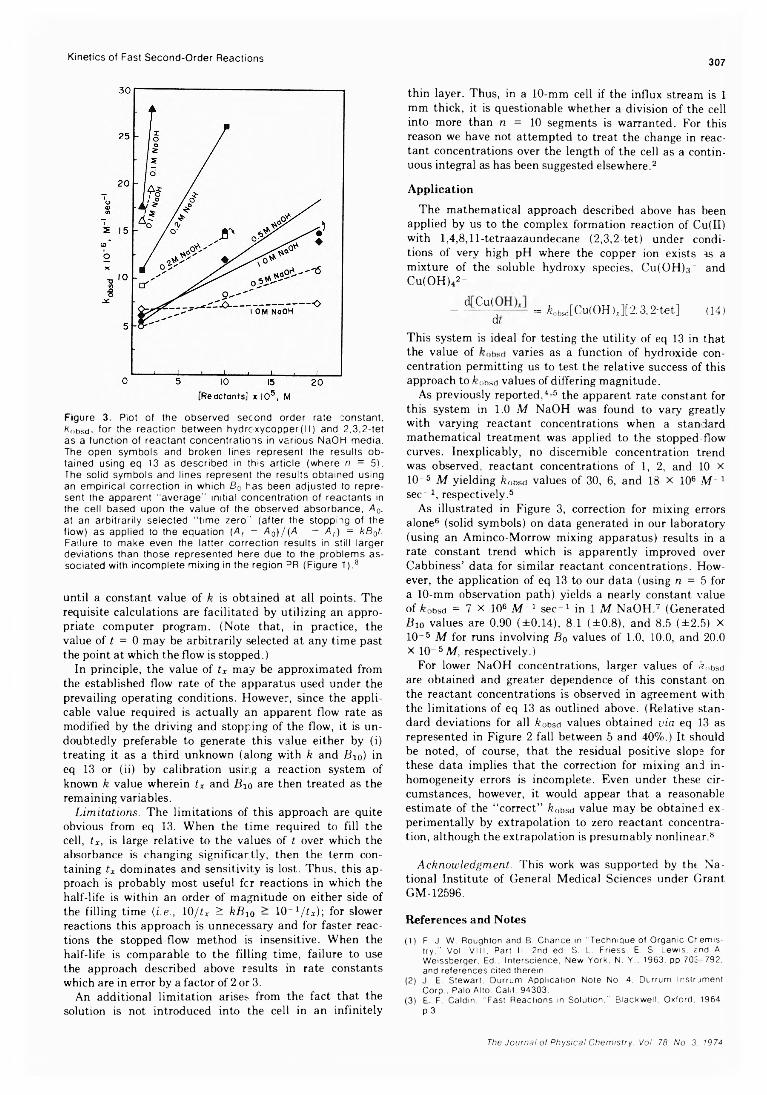
Kinetics of Fast Second-Order Reactions 307
Figure 3. Plot of the observed second order rate constant, kobsd, for the reaction between hydroxycopper(lI) and 2,3,2-tet as a function of reactant concentrations in various NaOH media. The open symbols and broken lines represent the results obtained using eq 13 as described in this article (where n = 5). The solid symbols and lines represent the results obtained using an empirical correction in which B0 has been adjusted to represent the apparent “ average” initial concentration of reactants in the cell based upon the value of the observed absorbance, A 0. at an arbitrarily selected “ time zero” (after the stopping of the flow) as applied to the equation (A , - A Q) / ( A - A, ) = kB0t. Failure to make even the latter correction results in still larger deviations than those represented here due to the problems associated with incomplete mixing in the region 3R (Figure 1).8
until a constant value of k is obtained at all points. The requisite calculations are facilitated by utilizing an appropriate computer program. (Note that, in practice, the value of i = 0 may be arbitrarily selected at any time past the point at which the flow is stopped.)
In principle, the value of tx may be approximated from the established flow rate of the apparatus used under the prevailing operating conditions. However, since the applicable value required is actually an apparent flow rate as modified by the driving and stopping of the flow, it is undoubtedly preferable to generate this value either by (i) treating it as a third unknown (along with k and Bio) in eq 13 or (ii) by calibration using a reaction system of known k value wherein tx and Bio are then treated as the remaining variables.
Limitations. The limitations of this approach are quite obvious from eq 13. When the time required to fill the cell, tx, is large relative to the values of t over which the absorbance is changing significantly, then the term containing tx dominates and sensitivity is lost. Thus, this approach is probably most useful fcr reactions in which the half-life is within an order of magnitude on either side of the filling time (i.e., 10¡ tx ^ kBi0 — lO ^ /G ); for slower reactions this approach is unnecessary and for faster reactions the stopped-flow method is insensitive. When the half-life is comparable to the filling time, failure to use the approach described above results in rate constants which are in error by a factor of 2 or 3.
An additional limitation arises from the fact that the solution is not introduced into the cell in an infinitely
thin layer. Thus, in a 10-mm cell if the influx stream is 1 mm thick, it is questionable whether a division of the cell into more than n = 10 segments is warranted. For this reason we have not attempted to treat the change in reactant concentrations over the length of the cell as a continuous integral as has been suggested elsewhere.2
Application
The mathematical approach described above has been applied by us to the complex formation reaction of Cu(II) with 1,4,8,11-tetraazaundecane (2,3,2-tet) under conditions of very high pH where the copper ion exists as a mixture of the soluble hydroxy species, Cu(OH)3_ and Cu(OH)42-
- d-Cu(J~ — = £„bsd[Cu(OH).r][2.3,2-tet] (14)dr
This system is ideal for testing the utility of eq 13 in that the value of varies as a function of hydroxide concentration permitting us to test the relative success of this approach to feobsd values of differing magnitude.
As previously reported,4 5 the apparent rate constant for this system in 1.0 M NaOH was found to vary greatly with varying reactant concentrations when a standard mathematical treatment was applied to the stopped-flow curves. Inexplicably, no discernible concentration trend was observed, reactant concentrations of 1, 2, and 10 x 10- 5 M yielding ftobsd values of 30, 6, and 18 X 106 M _1 sec-1 , respectively.5
As illustrated in Figure 3, correction for mixing errors alone6 (solid symbols) on data generated in our laboratory (using an Aminco-Morrow mixing apparatus) results in a rate constant trend which is apparently improved over Cabbiness’ data for similar reactant concentrations. However, the application of eq 13 to our data (using n = 5 for a 10-mm observation path) yields a nearly constant value of kobsd = 7 X 10⁶ M _1 sec-1 in 1 M NaOH.7 (Generated Bio values are 0.90 (±0.14), 8.1 (±0.8), and 8.5 (±2.5) X 10~5 M for runs involving Bo values of 1.0, 10.0, and 20.0 X 10 5 M, respectively.)
For lower NaOH concentrations, larger values of ¿„bsd are obtained and greater dependence of this constant on the reactant concentrations is observed in agreement with the limitations of eq 13 as outlined above. (Relative standard deviations for all ftobsd values obtained via eq 13 as represented in Figure 2 fall between 5 and 40%.) It should be noted, of course, that the residual positive slope for these data implies that the correction for mixing and inhomogeneity errors is incomplete. Even under these circumstances, however, it would appear that a reasonable estimate of the “ correct” feobsd value may be obtained experimentally by extrapolation to zero reactant concentration, although the extrapolation is presumably nonlinear.8
Acknowledgment. This work was supported by the National Institute of General Medical Sciences under Grant GM-12596.
References and Notes
(1) F. J. W. Roughton and B. Chance in “ Technique of O rganic C hem istry , '' Vol. V II I . Part II. 2nd ed. S. L. Friess. E. S. Lewis, and A.W eissberger. Ed.. In te rsc ience , New Y ork, N. Y., 1963, pp 702-792.and re fe rences cited therein.
(2) J. E. S tewart, Durrum A pp lica tion Note No. 4. DLrrum Instrum entC orp.. Palo A lto. Calif. 94303.
(3) E F. Caldin. “ Fast Reactions in S o lu tion ." B lackw ell, Oxford. 1964.P 3.
The Journal of Physical Chemistry. Vol. 78. No. 3. 1974
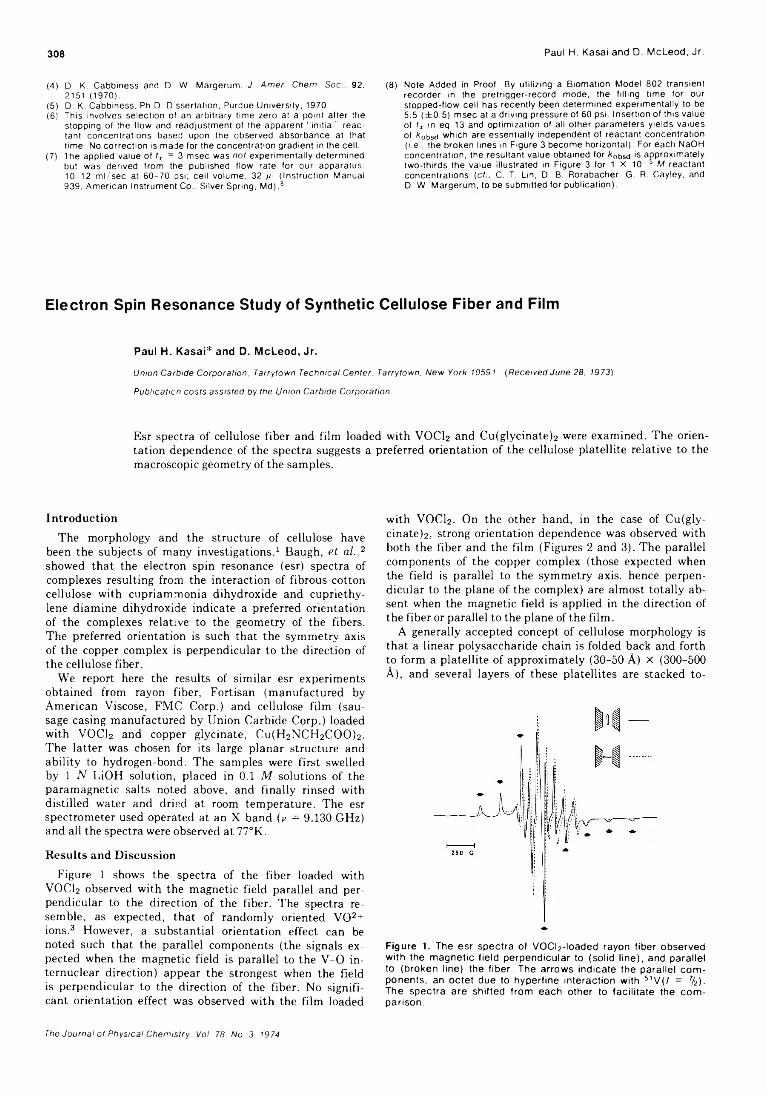
308 Paul H. Kasai and D. McLeod, Jr.
(4) D. K. C abbiness and D. W. M argerum . J. Amer. Chem. Soc.. 92, 2151 (1970).
(5) D. K. Cabbiness, Ph.D. D sserta tion, Purdue U nivers ity , 1970.(6) This involves se lection of an a rb itra ry tim e zero at a poin t a fte r the
stopping of the flow and read jus tm ent of the apparent " In it ia l” reactant concen tra tions based upon the observed absorbance at that tim e. No co rrec tio n is m ade fo r the concen tra tion g rad ient In the cell.
(7) The applied va lue of tx = 3 m sec was not experim enta lly determ ined but was derived from the published flow rate fo r our apparatus: 10 -1 2 m l/s e c at 6 0 -7 0 psi; ce ll vo lum e, 32 ti\ (Ins truc tion Manual 939, A m erican Instrum ent Co., S ilver Spring, M d ).8
(8) Note Added in Proof. By u tiliz ing a B iom ation Model 802 transien t recorde r in the p re trigge r-reco rd m ode, the filling tim e fo r our stopped-flow ce ll has recen tly been determ ined experim enta lly to be5.5 (± 0 .5 ) m sec at a driv ing pressure of 60 psi. Inse rtion of th is va lue of tz in eq 13 and optim iza tion of all o the r param ete rs y ie lds va lues of 80bsd w hich are essentia lly independent o f reac tan t concen tra tion (/.e .. the broken lines in F igure 3 becom e horizon ta l). For each NaOH concen tra tion , the resu ltan t value obtained fo r k obsd is approx im ate ly tw o -th irds the va lue illustra ted in F igure 3 fo r 1 X 10“ 8 M reactant concen tra tions (c f C. T. Lin, D. B. Rorabacher G. R. Cayley, and D. W. M argerum , to be subm itted fo r pub lica tion ).
Electron Spin Resonance Study of Synthetic Cellulose Fiber and Film
Paul H. Kasai* and D. McLeod, Jr.
Union Carbide Corporation, Tarrytown Technical Center, Tarrytown, New York 10591 (Received June 28, 1973)
Publication costs assisted by the Union Carbide Corporation
Esr spectra of cellulose fiber and film loaded with VOCI2 and Cu(glycinate)2 were examined. The orientation dependence of the spectra suggests a preferred orientation of the cellulose platellite relative to the macroscopic geometry of the samples.
Introduction
The morphology and the structure of cellulose have been the subjects of many investigations.1 Baugh, et al. , 2 showed that the electron spin resonance (esr) spectra of complexes resulting from the interaction of fibrous cotton cellulose with cupriammonia dihydroxide and cupriethy- lene diamine dihydroxide indicate a preferred orientation of the complexes relative to the geometry of the fibers. The preferred orientation is such that the symmetry axis of the copper complex is perpendicular to the direction of the cellulose fiber.
We report here the results of similar esr experiments obtained from rayon fiber, Fortisan (manufactured by American Viscose, FMC Corp.) and cellulose film (sausage casing manufactured by Union Carbide Corp.) loaded with VOCI2 and copper glycinate, CufFUNCFUCOOU- The latter was chosen for its large planar structure and ability to hydrogen-bond. The samples were first swelled by 1 N LiOH solution, placed in 0.1 M solutions of the paramagnetic salts noted above, and finally rinsed with distilled water and dried at room temperature. The esr spectrometer used operated at an X band (v = 9.130 GHz) and all the spectra were observed at 77°K.
Results and Discussion
Figure 1 shows the spectra of the fiber loaded with VOCI2 observed with the magnetic field parallel and perpendicular to the direction of the fiber. The spectra resemble, as expected, that of randomly oriented V 0 2+ ions.3 However, a substantial orientation effect can be noted such that the parallel components (the signals expected when the magnetic field is parallel to the V -0 in- ternuclear direction) appear the strongest when the field is perpendicular to the direction of the fiber. No significant orientation effect was observed with the film loaded
with VOCI2. On the other hand, in the case of Cu(gly- cinate>2, strong orientation dependence was observed with both the fiber and the film (Figures 2 and 3). The parallel components of the copper complex (those expected when the field is parallel to the symmetry axis, hence perpendicular to the plane of the complex) are almost totally absent when the magnetic field is applied in the direction of the fiber or parallel to the plane of the film.
A generally accepted concept of cellulose morphology is that a linear polysaccharide chain is folded back and forth to form a platellite of approximately (30-50 À) X (300-500 A), and several layers of these platellites are stacked to-
Figure 1. The esr spectra ot VOCb-loaded rayon fiber observed w ith the m agnetic fie ld perpendicular to (solid line), and parallel to (broken line) the fiber. The arrows indicate the parallel com ponents, an octe t due to hyperfine interaction with 51V (/ = 1/2). The spectra are shifted from each other to fac ilita te the com parison.
The Journal of Physical Chemistry. Vol. 78. No. 3. 1974
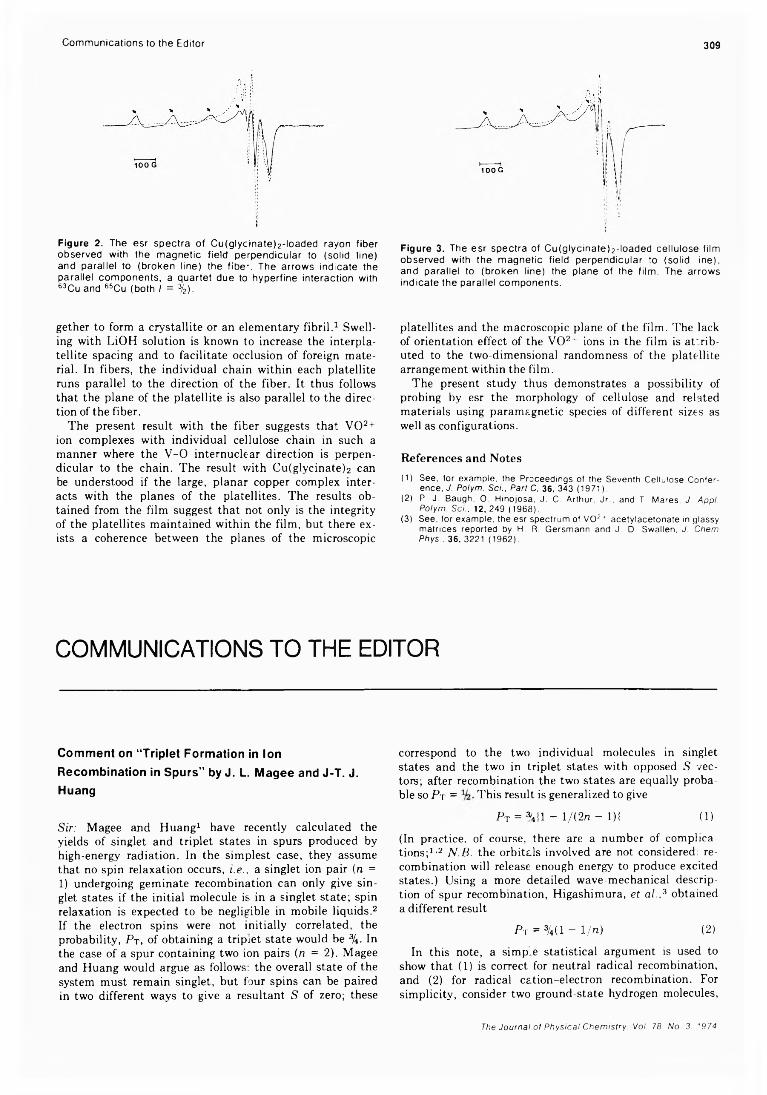
Communications to the Editor 309
Figure 2. The esr spectra of C u(g lyc lnate)2-loaded rayon fiber observed with the magnetic field perpendicular to (solid line) and parallel to (broken line) the fib e '. The arrows indicate the parallel components, a quartet due to hyperfine interaction with 63Cu and 65Cu (both / = 3/2).
Figure 3. The esr spectra of C u(g lyc inate )2-loaded cellulose film observed with the magnetic field perpendicular to (solid ine), and parallel to (broken line) the plane of the film . The arrows indicate the parallel components.
gether to form a crystallite or an elementary fibril.1 Swelling with LiOH solution is known to increase the interpla- tellite spacing and to facilitate occlusion of foreign material. In fibers, the individual chain within each platellite runs parallel to the direction of the fiber. It thus follows that the plane of the platellite is also parallel to the direction of the fiber.
The present result with the fiber suggests that V 0 2+ ion complexes with individual cellulose chain in such a manner where the V -0 internuclear direction is perpendicular to the chain. The result with Cu(glycinate)2 can be understood if the large, planar copper complex interacts with the planes of the platellites. The results obtained from the film suggest that not only is the integrity of the platellites maintained within the film, but there exists a coherence between the planes of the microscopic
platellites and the macroscopic plane of the film. The lack of orientation effect of the V 02+ ions in the film is at:rib- uted to the two-dimensional randomness of the platellite arrangement within the film.
The present study thus demonstrates a possibility of probing by esr the morphology of cellulose and related materials using paramagnetic species of different sizes as well as configurations.
References and Notes
(1) See, fo r exam ple, the Proceedings of the Seventh C ellulose C onference, J. Polym. Sci., Pari C, 36, 343 (1971).
(2) P. J. Baugh. 0 . H ino josa, J. C. A rthur, J r., and T. Mares, J. Appl. Polym. Sci., 12, 249 (1968).
(3) See, fo r exam ple, the esr spectrum of V 0 2+ acety lace tona te in glassy m a trices reported by H. R. G ersm ann and J. 6 . Swallen, J. Chem Phys.. 36, 3221 (1962).
C O M M U N I C A T I O N S T O T H E E D IT O R
Comment on “ Triplet Formation in Ion Recombination in Spurs” by J. L. Magee and J-T. J. Huang
Sir: Magee and Huang1 have recently calculated the yields of singlet and triplet states in spurs produced by high-energy radiation. In the simplest case, they assume that no spin relaxation occurs, i.e., a singlet ion pair (n = 1) undergoing geminate recombination can only give singlet states if the initial molecule is in a singlet state; spin relaxation is expected to be negligible in mobile liquids.2 If the electron spins were not initially correlated, the probability, PT, of obtaining a tripiet state would be %. In the case of a spur containing two ion pairs (n = 2). Magee and Huang would argue as follows: the overall state of the system must remain singlet, but four spins can be paired in two different ways to give a resultant S of zero; these
correspond to the two individual molecules in singlet states and the two in triplet states with opposed S vectors; after recombination the two states are equally probable so P t = This result is generalized to give
PT = 3'4| l - l / ( 2n - l ) | (1)
(In practice, of course, there are a number of complications;1,2 N.B. the orbitals involved are not considered: recombination will release enough energy to produce excited states.) Using a more detailed wave-mechanical description of spur recombination, Higashimura, et al. , 3 obtained a different result
P t = 3/4( l - 1 /n) (2 )
In this note, a simp.e statistical argument is used to show that (1) is correct for neutral radical recombination, and (2) for radical cation-electron recombination. For simplicity, consider two ground-state hydrogen molecules,
The Journal of Physical Chemistry. Voi. 78. No. 3. 1974
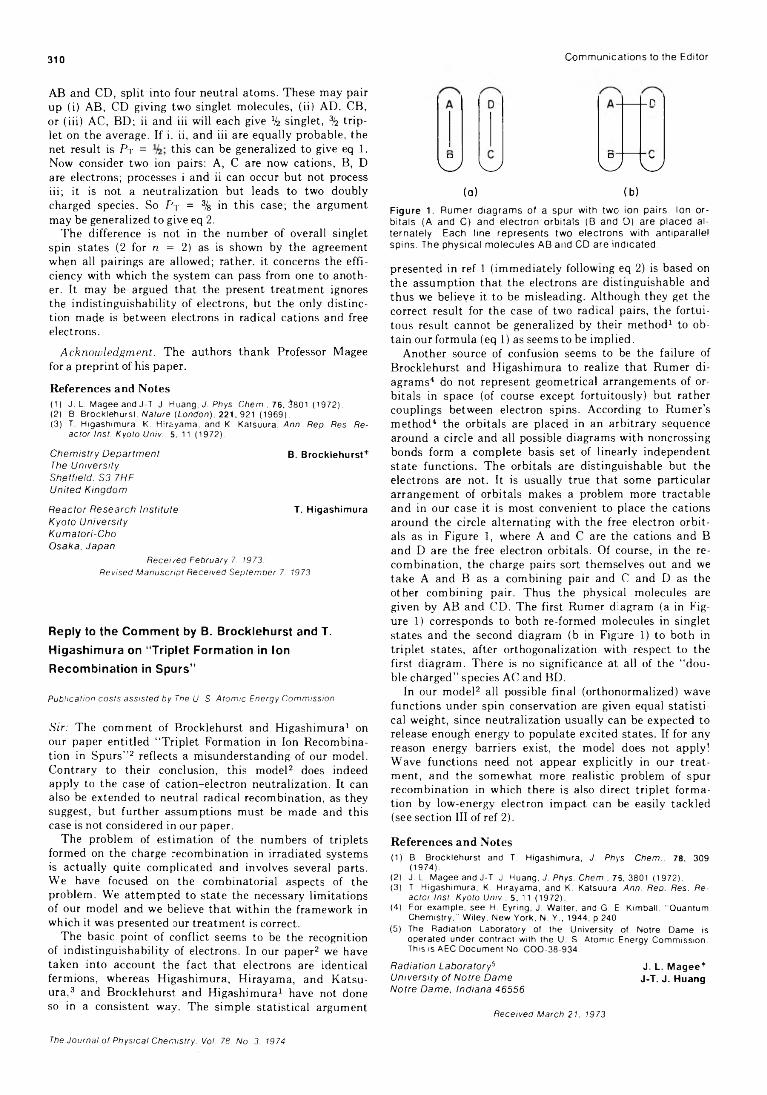
310 Com munications to the Editor
AB and CD, split into four neutral atoms. These may pair up (i) AB, CD giving two singlet molecules, (ii) AD, CB, or (iii) AC, BD; ii and iii will each give % singlet, % triplet on the average. If i. ii, and iii are equally probable, the net result is Pt = this can be generalized to give eq 1. Now consider two ion pairs: A, C are now cations, B, D are electrons; processes i and ii can occur but not process iii; it is not a neutralization but leads to two doubly charged species. So PT = % in this case; the argument may be generalized to give eq 2.
The difference is not in the number of overall singlet spin states (2 for n = 2) as is shown by the agreement when all pairings are allowed; rather, it concerns the efficiency with which the system can pass from one to another. It may be argued that the present treatment ignores the indistinguishability of electrons, but the only distinction made is between electrons in radical cations and free electrons.
Acknowledgment. The authors thank Professor Magee for a preprint of his paper.
References and Notes(1) J. L. Magee and J-T. J. Huang, J. Phys. Chem.. 76, 3801 (1972).(2) B. B rock lehurs t. Nature {London), 221, 921 (1969).(3) T. H igash im ura . K. H irayam a, and K. Katsuura. Ann. Rep. Res. Reactor Inst. Kyoto Univ.. 5. 11 (1972).
Chemistry Department B. Brocklehurst*The University Sheffield. S3 7HF United Kingdom
Reactor Research Institute T. HigashimuraKyoto University Kumatori-Cho Osaka. Japan
Receired February 7. 1973:Revised Manuscript Received September 7. 1973
Reply to the Comment by B. Brocklehurst and T. Higashimura on “Triplet Formation in Ion Recombination in Spurs”
Publication costs assisted by The U. S. Atomic Energy Commission
Sir: The comment of Brocklehurst and Higashimura1 on our paper entitled “ Triplet Formation in Ion Recombination in Spurs” 2 reflects a misunderstanding of our model. Contrary to their conclusion, this model2 does indeed apply to the case of cation-electron neutralization. It can also be extended to neutral radical recombination, as they suggest, but further assumptions must be made and this case is not considered in our paper.
The problem of estimation of the numbers of triplets formed on the charge recombination in irradiated systems is actually quite complicated and involves several parts. We have focused on the combinatorial aspects of the problem. We attempted to state the necessary limitations of our model and we believe that within the framework in which it was presented our treatment is correct.
The basic point of conflict seems to be the recognition of indistinguishability of electrons. In our paper2 we have taken into account the fact that electrons are identical fermions, whereas Higashimura, Hirayama, and Katsuura,3 and Brocklehurst and Higashimura1 have not done so in a consistent way. The simple statistical argument
n
D
W W□
k j kU
(a) (b)
Figure 1. Rumer diagrams of a spur with two ion pairs. Ion o rbita ls (A and C) and electron orbitals (B and D) are placed a lternately. Each line represents two electrons with antiparallel spins. The physical molecules AB and CD are indicated.
presented in ref 1 (immediately following eq 2) is based on the assumption that the electrons are distinguishable and thus we believe it to be misleading. Although they get the correct result for the case of two radical pairs, the fortuitous result cannot be generalized by their method1 to obtain our formula (eq 1) as seems to be implied.
Another source of confusion seems to be the failure of Brocklehurst and Higashimura to realize that Rumer diagrams4 do not represent geometrical arrangements of orbitals in space (of course except fortuitously) but rather couplings between electron spins. According to Rumer’s method4 the orbitals are placed in an arbitrary sequence around a circle and all possible diagrams with noncrossing bonds form a complete basis set of linearly independent state functions. The orbitals are distinguishable but the electrons are not. It is usually true that some particular arrangement of orbitals makes a problem more tractable and in our case it is most convenient to place the cations around the circle alternating with the free electron orbitals as in Figure 1, where A and C are the cations and B and D are the free electron orbitals. Of course, in the recombination, the charge pairs sort themselves out and we take A and B as a combining pair and C and D as the other combining pair. Thus the physical molecules are given by AB and CD. The first Rumer diagram (a in Figure 1) corresponds to both re-formed molecules in singlet states and the second diagram (b in Figure 1) to both in triplet states, after orthogonalization with respect to the first diagram. There is no significance at all of the “ double charged” species AC and BD.
In our model2 all possible final (orthonormalized) wave functions under spin conservation are given equal statistical weight, since neutralization usually can be expected to release enough energy to populate excited states. If for any reason energy barriers exist, the model does not apply! Wave functions need not appear explicitly in our treatment, and the somewhat more realistic problem of spur recombination in which there is also direct triplet formation by low-energy electron impact can be easily tackled (see section III of ref 2).
References and Notes(1) B. B rock lehurst and T. H igashim ura, J. Phys. Chem.. 78, 309
(1974).(2) J. L. Magee and J-T. J. Huang, J. Phys. Chem.. 75, 3801 (1972).(3) T. H igash im ura , K. H irayam a, and K. Katsuura. Ann. Rep. Res. Reactor Inst. Kyoto Univ.. 5, 11 (1972).(4) For exam ple, see H. Eyring, J. W alter, and G. E. K im ball. "Q uantum
C hem is try ," W iley, New York, N. Y., 1944, p 240.(5) The Radiation Labora tory o f the U nivers ity o f Notre Dam e is
operated under co n tra c t w ith the U. S. A tom ic Energy C om m ission. This is AEC D ocum ent No. COO-38-934.
Radiation Laboratory5 J. L. Magee*University of Notre Dame J-T. J. HuangNotre Dame, Indiana 46556
Received March 21. 1973The Journal of Physical Chemistry. Vol. 78. No. 3. 1974
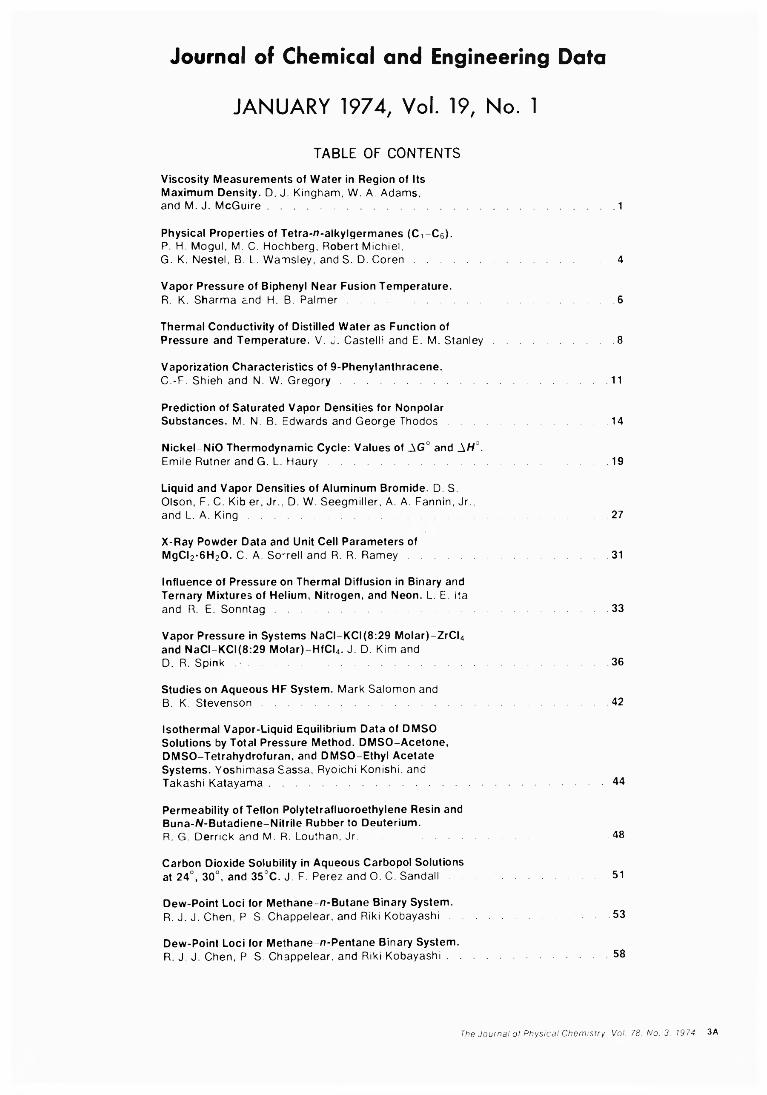
J o u r n a l o f C h e m i c a l a n d E n g i n e e r i n g D a t a
JANUARY 1974, Vol. 19, No. 1TABLE OF CONTENTS
Viscosity Measurements of Water in Region of Its Maximum Density. D. J. Kingham, W. A. Adams,and M. J. McGuire...............................................................................................................1
Physical Properties of Tetra-n-alkylgermanes (C1 -C 6).P. H. Mogul, M. C. Hochberg, Robert Michiel,G. K. Nestel, B. L. Wamsley, and S. D. C o re n ............................................................. 4
Vapor Pressure of Biphenyl Near Fusion Temperature.R. K. Sharma and H. B. P a lm er..................................................................................... 6
Thermal Conductivity of Distilled Water as Function ofPressure and Temperature. V. J. Castelli and E. M. S tanley...................................... 8
Vaporization Characteristics of 9-Phenylanthracene.C. -F. Shieh and N. W. G regory................................................................................. 11
Prediction of Saturated Vapor Densities for NonpolarSubstances. M. N. B. Edwards and George Thodos...................................................14
Nickel-NiO Thermodynamic Cycle: Values of AG° and AH°.Emile Rutner and G. L. H a u ry .......................................................................................... 19
Liquid and Vapor Densities of Aluminum Bromide. D. S.Olson, F. C. Kib er, Jr., D. W. Seegmiller, A. A. Fannin, Jr.,and L. A. K in g ....................................................................................................................27
X-Ray Powder Data and Unit Cell Parameters ofMgCl2-6H20. C. A. So'rell and R. R. R am ey ................................................................31
Influence of Pressure on Thermal Diffusion in Binary and Ternary Mixtures of Helium, Nitrogen, and Neon. L. E. Itaand R. E. Sonntag........................................................................................................... 33
Vapor Pressure in Systems NaCI-KCI(8:29 Molar)-ZrCI4 and NaCI-KCI(8:29 Molar)-HfCI4. J. D. Kim andD. R. Spink .........................................................................................................................36
Studies on Aqueous HF System. Mark Salomon andB. K. Stevenson..............................................................................................................42
Isothermal Vapor-Liquid Equilibrium Data of DMSO Solutions by Total Pressure Method. DMSO-Acetone,DMSO-Tetrahydrofuran, and DMSO-Ethyl Acetate Systems. Yoshimasa Sassa, Ryoichi Konishi, andTakashi Katayama..............................................................................................................44
Permeability of Teflon Polytetrafluoroethylene Resin and Buna-A/-Butadiene-Nitrile Rubber to Deuterium.R. G. Derrick and M. R. Louthan, Jr................................................................................ 48
Carbon Dioxide Solubility in Aqueous Carbopol Solutionsat 24°, 30°, and 35°C. J. F. Perez and O. C. Sandall...................................................... 51
Dew-Point Loci for Methane-n-Butane Binary System.R. J.J.Chen, P S. Chappelear, and Riki Kobayashi.................................................. 53
Dew-Point Loci for Methane-n-Pentane Binary System.R. J. J. Chen, P S. Chappelear, and Riki Kobayashi...................................................58
The Journal ol Physical Chemistry. Voi. 78. No. 3. 1974 3A
Vapor-Liquid Equilibria in Three Binary and Ternary Systems Composed of n-Butane, Butene-1, andButadiene-1,3. D. R. Laurance and G. W. S w i f t ........................................................... 61
Low-Temperature K Data for Methane-n-Butane.L. C. K a h r e ......................................................................................................................67
Vapor-Liquid Equilibrium of Methane-n-Butane System at Low Temperatures and High Pressures. D. G. Elliot,R. J. J. Chen, P. S. Chappelear, and Riki K o b a y a s h i...................................................71
Experimental Heat Capacities of Nitrogen-Hydrogen Sulfide Mixtures at Elevated Pressures. G. P. H am alluk,P. R. Bisnnol. and D. B. R o b in s o n .................................................................................78
Influence of pH and Ionic Strength upon Solubility of NOin Aqueous Solution. J. N. A r m o r ................................................................................. 82
Excess Enthalpies at 45°C for Ternary System Acetonitrile-Benzene-Carbon Tetrachloride. T. R. Lienand R. W. M is s e n ........................................................................................................... 84
Vapor-Liquid Equilibria of Acetone-Cyclohexane and Acetone-lsopropanol Systems at 25°C. P. S. Purl,J lri Polak, and J. A. R u e th e r ......................................................................................... 87
Solubility of Nitrous Oxide in Sodium Carbonate-Sodium Bicarbonate Solutions at 25°C and 1 Atm. Haruo H ikita,Satoru Asal, Haruo Ish lkaw a, and Naoki E s a k a ....................................................... 89
Phase-Equilibria Behavior of System Carbon Dioxide-n-Decane at Low Temperatures. A. A. Kulkarn l,B. Y. Zarah, K. D. Luks, and J. P. K u h n ................................................................................92
Stability of First Dissociable Proton of Uric Acid.B lrcw ell F lnlayson and A rthur S m i t h ..............................................................................94
Dissociation Constants and Conductivities of HCI and DCI in A/,/V-Dimethylformamide at 25°C. L. F. S ilvester andP. A. R o c k ........................................................................................................................ 98
ORGANIC SECTION
Preparation and Properties of 1-Benzyloxy-3-arylureas,1-Benzyloxy-3-aikylureas, and 1,5-Diphenyl-3- benzyloxybiuret. J. H. Cooley, P. T. Jacobs, J. R. F ischer,and Stanley J e p p e s o n ..................................................................................................... 100
Synthesis of Fluorogenic Phosphodiesterase Substrates.Preparation of Di(coumarin-7-yl)phosphate andDi(4-methylcoumarin-7-yl)phosphate. R. C. B o g u s la s k l............................................103
New Data Compilations...............................................................................................104
This issue conta ins no papers for w hich there is supp lem entary m ateria l in m icro form .
4A The Journal of Physica' Chemistry. Vol. 78. No. 3. 1974
onthe very frontiers
of chemical engineering understanding
l&EC FUNDAMENTALS
Exploring through original scientific papers those aspects of physical and chemical phenomena which are determined to be the most promising in leading to tighter design, more precise mathematical description of complex events and more profitable future engineering.Only papers that contain conclusions of some general significance (as opposed to recording data solely) and that are considered to nave lasting value are published in I & E C FUNDAMENTALS.Join in the excitement of exploring the frontiers of chemical engineering and expand your own horizons by sending in your order today.
. . . another ACS service
l&EC Fundamentals American Chemical Society1155 Sixteenth Street, N.W.
Washington, D.C. 20036
1974
Yes, I would like to receive l&EC FUNDAMENTALS at the one-year rate checked
below: Latin OtherU.S. Canada** America** Nations’ *
ACS Member One-Year Rate* □ $ 7.00 □ $10.00 □ $10.00 □ $10.50
Ncnmember □ $21.00 □ $24.00 □ $24.00 □ $24.50
Bill me □ Bill company n Payment enclosed □Air freight rates available on request.Name
Home □Street________________________________________________________ Business □
City_____________________________________ State_____________________Zip__________
’ NOTE: Subscriptions at ACS member rates are for personal use only. ’ ’ Payment must be made in U.S. currency, by international money order, UNESCO coupons, U.S. bank draft, or order through your book dealer.

The most important book ever published by the
American Chemical Society . . .
C H E M I S T R Y
I N T H E
E C O N O M Y
American Chemical Society Stud supported in part by ttie
National Science inundation Washington, D.C.
1973
This book not only belongs in every chemist's lib-ary, but among the books of the intelligent layman as well.
It's a brill ant, in-depth study of all facets of chemistry and gives you the what . . . the who . . . and the why of today's chemical products, processes, and problems.
You'll find everything from the original manufacturing process for nylon 6 6 to the latest company comments on PH.D.'S. From margarine to employment projections, this amazing study covers all the contributions of chemistry to the ways in which we work and live.
SPECIAL ISSUES SALESAmerican Chemical Society 1 155 Sixteenth Street, N.W . W ashington, D.C. 20036
Please send me cop ies o f CHEMISTRYIN THE ECONOMY. I am enc lo s ing th e c o rre c t a m o u n t fo r the cop ies o rd e re d .
CHEMISTRY IN THE ECONOMY is the result of an intensive study started in 1 9 6 6 by the ACS Committee on Chemistry and Public Affairs. Every chapter teems with information contributed by experts in industry, education, and government.
It's really a "tour de force". . . and makes plain fascinating reading.
Name
Street
C ity State Zip Code
M o ney must accompany order. CIE
Its 6 0 0 pages are paper- bound and so the price is only $6 . 5 0 per copy.
Just fill out the form below and mail it back to us today. We'll see that CHEMISTRY IN THE ECONOMY will soon be in your hands.