The Journal of Business and Retail Management Research
189
-
Upload
khangminh22 -
Category
Documents
-
view
1 -
download
0
Transcript of The Journal of Business and Retail Management Research

Th
e J
ou
rna
l of B
usin
ess a
nd
Re
tail M
an
ag
em
en
t Re
sea
rch
Vo
lum
e 1
0 Issu
e 3
Ju
ly 2
01
6
JBRMR Vol 10 No 3 COVERS.qxp_Layout 1 14/07/2016 13:01 Page 1

JBRMR Vol 10 No 3 COVERS.qxp_Layout 1 14/07/2016 13:01 Page 2

Journal of Business and Retail Management Research (JBRMR) Vol. 10 Issue 3 July 2016
www.jbrmr.com A Journal of the Academy of Business and Retail Management (ABRM) i
The Journal of Business and
Retail Management Research
Volume 10 Issue 3 July 2016
The Journal is approved for listing in EBSCO, ProQuest, SCOPUS and CABELL’S DIRECTORY of Refereed Publications
www.jbrmr.com

Journal of Business and Retail Management Research (JBRMR) Vol. 10 Issue 3 July 2016
www.jbrmr.com A Journal of the Academy of Business and Retail Management (ABRM) ii
Mission Statement Academy of Business and Retail Management (ABRM)
The Academy of Business and Retail Management (ABRM) seeks to contribute to progress and prosperity through research and managerial excellence. It publishes prominent academic journals each year, as well as organizing international academic conferences and delivering high impact training. ABRM is committed to advancing research, education, theory and practice in the field of management. Its various journals provide a respected vehicle for theoretical insights and developments in the field of business, management and economic development. Articles published in these journals empirically examine theory-based knowledge. Its conferences are truly international and aspire to nurture young aspiring academics and well as to ensure interaction with some of the finest minds from academia. ABRM is committed to working to uphold the highest standards of probity and academic rigor in all that its endeavours.
Mission Statement Journal of Business and Retail Management (JBRMR)
ISSN: 1751-8202 (Print) ISSN: 2056-6271 (Online)
The mission of this journal is to publish empirical research that tests, extends or builds business management theory and contributes to retail management practice. All empirical methods including qualitative, quantitative, field, laboratory and combination methods are welcome. In order to be published in JBRMR, a manuscript must make strong experiential and theoretical contributions and highlight the significance of those contributions to the management field. Thus, preference is given to submissions that test, extend or build strong theoretical frameworks while critically examining issues with high importance for business management theory and practice. The JBRMR is not tied to any particular discipline, level of analysis or national context.
The Journal of Business & Retail Management Research (JBRMR), the Editors, the Editorial Board is not responsible for authors’ expressed opinions, views, and the contents of the published manuscripts in the JBRMR. The originality, proofreading of manuscripts and errors are the sole responsibility of the individual authors. All manuscripts submitted for review and publication in the JBRMR go under double-blind reviews for authenticity, ethical issues, and useful contributions. Decisions of the reviewers are the only tool for publication in the JBRMR. Final decision, is, however, taken by the editorial team at JBRMR.
JBRMR reserve the rights to add, amend, modify, or delete its rules, policies, and procedures affecting its relationship with contributors as deemed necessary by the administration. Any such amendment, modification, addition, or deletion shall not be Reconsidered a violation of the relationship between ABRM and contributors.

Journal of Business and Retail Management Research (JBRMR) Vol. 10 Issue 3 July 2016
www.jbrmr.com A Journal of the Academy of Business and Retail Management (ABRM) iii
Journal of Business & Retail Management Research (JBRMR)
Editors and Editorial Board
Editor –in-Chief Dr P. R. Datta
Academy of Business & Retail Management, UK Associate Editors Mark T Jones
Director, Centre for Innovative Leadership Navigation (CILN), UK Prof. Gairik Das
IISWBM, Kolkata, India
Editorial Board Members Prof. Lothar Auchter
University of Applied Science, Kaiserslautern, Germany.
Justin Henley Beneke
University of Winchester, UK
Prof.Teemu Kokko
Haaga-Helia University of Applied Sciences, Finland
Prof. A.C.Pandey
H.N.B Garhwal Central University, Srinagar, India.
Dr. B.R. Chakraborty
Academy of Business and Retail Management, UK Professor R. M Peters
University of the Western Cape, South Africa Dr Yongmei Bentley
University of Bedfordshire Professor Shehu Osman Hassan
Ahmadu Bello University, Nigeria Dr. Michael Wernerheim
Momorial University of Newfoundland, Canada Professor Cengiz Kahraman
Istanbul technical University, Turkey Prof. Ong Fon Sim
The University of Nottingham Business School, Malaysia. Professor Atchara Sriphan
Naresuan University, Thailand Dr. Sudaporn Sawmong
Eastern Asian University, Thailand
Professor Issac Butswat
National Open University of Nigeria, Nigeria Dr. Nripendra Singh
Jaypee Business School, India. Professor Evelyn Germinah Chilone-Tsoka
University of South Africa, South Africa Professor Visvanathan Naicker
University of the Western Cape, South Africa Professor Bong Hwan Kim
Seol National University, South Korea Professor Michael Ba-Banutu Gomez
Rowan University, USA Rudi Meijer
VU University, Amsterdam, Netherland Dr Srini R Srinivasan
Jamnalal Bajaj Institute of Management
Studies(JBIMS)University of Mumbai
Dr. Sandeep Goel
Accounting and Finance at Management Development Institute, Gurgaon (INDIA)
Dr Imbarine Bujang
Universiti Teknologi MARA, Malaysia Dr. Goldi Puri
Maharishi Dayanand University, India
Professor David Borker
Manhattanville College, New York , USA Dr. Adhi Baskara
University of Indonesia, Indonesia Professor Derek van der Merwe
University of Johannesburg, South Africa Professor Eman Mohamed Abd-El-Salam
Arab Academy for Science and Technology and Maritime Transport, Egypt

Journal of Business and Retail Management Research (JBRMR) Vol. 10 Issue 3 July 2016
www.jbrmr.com A Journal of the Academy of Business and Retail Management (ABRM) iv
Volume 10 Issue 3 July 2016
ISSN: 1751-8202
Statement of Editorial Policy The JBRMR is a scholarly and refereed journal that provides an authoritative source of information for scholars, academicians, and professionals in the fields of business and retail management. The journal promotes the advancement, understanding, and practice of business & retail management. Manuscripts offering theoretical, conceptual, and practical contributions are encouraged.
Objectives The objectives of the JBRMR are to attract and publish theoretical, conceptual, and empirical manuscripts from academics and professionals from all disciplines regarding a wide range of contemporary issues in business and retail management. The aims of the journal are to disseminate knowledge; provide a learned reference in the field; and facilitate communication between academic and research experts, and executives.
Readership The readership for this journal includes academics, researchers, professionals, and executives engaged in business and retailing.
A statement about open access JBRMR is an open access journal which means that all content is freely available without charge to the user or his/her institution. Users are allowed to read, download, copy, distribute, print, search, or link to the full texts of the articles in this journal without asking prior permission from the publisher or the author. JBRMR is committed to publish all full text articles online for immediate open access to readers and there is no charge to download articles and editorial comments for their own scholarly use.

Journal of Business and Retail Management Research (JBRMR) Vol. 10 Issue 3 July 2016
www.jbrmr.com A Journal of the Academy of Business and Retail Management (ABRM) v
Journal of Business and Retail Management Research (JBRMR) Volume 10 Issue 3 July 2016
Editorial Comments This edition of the Journal of Business & Retail Management Research (JBRMR) contains fourteen scholarly articles conforming to the principal objective of the journal, namely the dissemination of both applied and theoretical knowledge. These papers take the reader on a journey to various parts of the world and provide a thought provoking insight into a range of issues. The findings of a number of these papers are significant not only for academicians, but also for professionals, policy makers and those responsible for local, regional and national economic strategy.
Recent events, including the UK's referendum vote to leave the EU remind us all of the fact that internal and external factors affect change. We all need to be alive to this fact and be prepared to embrace change and make the best of the opportunities that can arise out of uncertainty. Some of us maybe take a degree of pleasure seeing pundits and forecasters frequently get things completely wrong.
It is especially heartening to see a marked increase in papers from outside Europe and North America being submitted for consideration for publication. This in itself provides fresh challenges, both for authors and the reviewers alike. The UN's demographic indicators certainly point to a marked diminution in the influence of Europe as a whole and thus many of the thought leaders and innovators are likely to come from parts of the world which for too long have been neglected and overlooked. This perhaps raises the question as to why so many business schools fail to examine case studies from Central and South America, Africa and other regions.
The Editorial Board of JBRMR is grateful to the contributors for making this journal the platform by which they have chosen to put their research into the public arena, and trust that they will use their good offices to ensure that others do the same.
The opening paper of this issue is entitled: European Union and the utilisation of GSP from importer's perspective with special reference to lesser developed economies by Rachel A. English. This paper certainly challenges some of the preconceptions and misconceptions about the European Union in regards to the preferential tariffs that can be available on the majority of goods imported from lesser developed countries. There is a general belief that the EU erects barriers that punish less developed countries, yet this research would appear to demonstrate that in point of fact this is untrue. In principle, most goods, except the likes of armaments are eligible for exemptions from higher tariffs, providing of course they meet certain key criteria. It is the criteria, the awareness of them and then the very process of applying for the said exemptions where the problem appears to lie, clearly the Devil is in the detail. Systems and processes that involve diverse players are by their very nature liable to get lost in translation and as a consequence both exporters and importers are deterred from making full use of Generalised System of Preferences. The issues raised in this paper in regards to Rules of Origin (RoO) are significant, as are those appertaining to the maintenance of quality. To small business, whether they be importers or exporters, the EU can appear a distant and forbidding structure, one that is highly complex and bureaucratic. The findings contained within this paper would appear to confirm some of the concerns raised about smaller companies not being able to be heard or even to access the decision making process. That line; "All six companies stated they feel remote from the EU policy making process." speaks volumes. Whilst some larger entities can afford to expend time, money and staff on lobbying, this is simply not an option of the vast majority of companies. Is it any wonder that small and medium companies have felt at a disadvantage? It is

Journal of Business and Retail Management Research (JBRMR) Vol. 10 Issue 3 July 2016
www.jbrmr.com A Journal of the Academy of Business and Retail Management (ABRM) vi
worth noting that in the UK 99% of businesses are classified as small or medium sized according to Briefing Paper 06152 (Rhodes, 2015), if this is so for a highly complex economy, what about those that might in some economic respects be deemed less advanced.
If the European importers find the situation challenging, what are things like for exporting countries? For many the barriers appear insurmountable. As things stand rules that in theory are designed to assist nations at various stages of development are in point of fact discouraging trade. This should be a matter of concern for all. This research also highlights the challenges in regards to quality, an issue that requires greater effort from producer and exporter countries.
The world of statistics and statisticians is a veritable closed book to many. This area of study has yet to shake off the negativity associated with the following quotation, often attributed to the British Prime Minister, Benjamin Disraeli (1804-1881) "There are three kinds of lies: Lies, damned lies and statistics". The fact that we may be wary of statistics should not result in us dismissing them out of hand, in point of fact some of the world's finest minds are employed in gathering, collating and interpreting statistics. Anyone familiar with the work of the UK's Office for National Statistics (www.ons.gov.uk) or the Indian Statistical Institute (www.isical.ac.in) will appreciate the talent deployed to gather reliable and usable data.
The next paper is entitled: World edible oil prices prediction: Evidence from mix effect of ever difference on Box- Jenkins approach by Karia, Hakim and Bujang. George Box (1919-2013) and Gwilym Jenkins (1932-1982) were eminent statisticians interested in the auto regressive moving average. In essence their model comprised of the following: 1) model identification/model selection 2) Parameter estimation 3) Model checking. In exploring Time Series Averages this paper comes down firmly in favour of the Autoregressive Integrated Moving Average (ARIMA) by virtue of its apparent accuracy and utility. The edible oil market is a burgeoning one, with a plethora of oils being traded from mustard complex and soya oil to palm oil to sunflower oil and others in between. Many readers might well be amazed to hear that the global vegetable oil production amounted to over 179 million metric tons in 2015/2016 (www.statista.com).
The next paper is entitled: Local Industrial Development in Algeria by Ratiba and Djamila. This paper reminds us of the underlying challenges of endeavouring to direct, oversee and stimulate regional economic development. In common with many countries Algeria initially undertook a centrally directed approach to regional development. This top down approach is familiar to many, and is replete with all the usual problems associated in regards to the fact that key stakeholders have little or no input. The creation in Algeria's case of programs of local industry (PIL) in the 1970's coincided with the rule of President Houari Boumediene whose approach was to a oversee state-controlled socialist economy. His successor President Chadli Benjedid permitted some economic reforms and what we discover here is that by the 1980s the approach had gradually moved from a sectoral to a regional approach. With the hydrocarbon sector dominating the Algerian economy successive administrations have been slow to harness the potential of the regions.
We learn from this study that the relatively recent creation of integrated industrial development zones (ZIDI) has proved to be a step in the right direction as these clusters have aimed to harness infrastructure, industrial specialisms and importantly educational centres in the form of universities. That said, it is clear that the presence of all of these also tends to reflect and underscore the regional imbalance, which is not just a reflection of Algeria, but is true of nearly every country. The legislative mindset is such that there remains very little regional autonomy and this undermines the effectiveness of the ZIDI. Whilst progress is limited to some

Journal of Business and Retail Management Research (JBRMR) Vol. 10 Issue 3 July 2016
www.jbrmr.com A Journal of the Academy of Business and Retail Management (ABRM) vii
extent, it is heartening to see the authors acknowledge some examples of success, such as the creation of the industrial park of Sidi Khettab (2012).
Understanding the local context is of paramount importance when endeavouring to discover the factors that are causing inertia or resistance amongst those in national roles. Algeria has had a troubled history, and continues to labour under the legacy of an educational system and elite that is dominated by a peculiarly French way of thinking. This in itself is worthy of a research paper. That said, we are reminded that there is no quick fix when it comes to meaningful and self-sustaining regional development.
Confidence and trust are the bedrock of all financial transactions, and thus even the merest suspicion that financial reports are being in any way manipulated should be a matter of concern. The next paper is entitled: The impact of firm characteristics on earnings management: an empirical study on the listed firms in Egypt by Bassiouny. This paper highlights the fact that financial scandals have begun to shift attitudes both locally and internationally. Whilst in some respects the prevailing attitude was one of detachment, increasingly there is an awareness that legislation and the financial mechanism require attention if fraud and malpractice are to be reduced. Note the use of the word 'reduced', the chances of total eradication are nil. Bassiouny acknowledges that Egypt has endeavoured to address the problem by introducing a whole raft of legislation, and yet still there are question marks around the subject of earning management. A paper of this nature reminds us that just because some are engaged in dishonest activity, we must not tar all individuals and organisations with the same brush.
Central to the issue of trust is the role played by auditing, the more frequent and robust the auditing processing the more likely it is to discover anomalies. Herein lies the challenge, are auditors sufficiently well trained and equipped to engage in the task that they are charged with? Internationally, we are already seeing the growth in forensic accounting, and this is a trend that is likely to continue. In the Egyptian context there are other factors that also greatly influence the business dynamic, chief of these being the military's wide ranging business and economic interests. The author's comment about the future scope to take note of Egyptian cultural drivers using the Geert Hofstede's insights and models seems eminently sensible, not least because it will help provide a greater understanding of societal norms, attitudes and tolerances.
Discussion of societal norms and attitudes, particularly in an Arab context leads use nicely to the next paper entitled: The application of technology acceptance models in the Arab
business setting by Dajani and Yaseen. The seemingly exponential growth in new technology raises questions as to why in some parts of the word there is greater reticence to adopt technology than in others. This paper explores various models that seek to explain this, the Technology Acceptance Model (TAM) being a preferred model used by many. TAM centres upon perceived usefulness coupled with perceived ease of use. The utilitarian nature of technology is clearly of paramount importance, but equally it is important not to ignore cost. We all would do well to ask wherein lies a reticence to adopt and embrace new technology. Sociological factors are an aspect that is all too frequently overlooked. What about the centrality of human relationships? This is particularly true in Arab societies.
For some there is a natural ambivalence about technology, an attitude that has partly been the result of centuries of self-reliance. An absence of appropriate infrastructure has impeded adoption, as has mistrust, especially in regards to what are viewed as personal transactions which technology appears to put into a public sphere. The point made in this paper about the role played by social media in the so-called Arab Spring is a significant one, this causes those in authority to be wary and users to be anxious about how activity may or may not

Journal of Business and Retail Management Research (JBRMR) Vol. 10 Issue 3 July 2016
www.jbrmr.com A Journal of the Academy of Business and Retail Management (ABRM) viii
be viewed. The law of unintended consequences comes to mind. Additionally the paucity of research in regards to gender and age is important, not least because this is true well beyond the Arab World. In his seminal work Diffusion of Innovations (1962) Everett Rogers highlighted the centrality of human capital. There are times when those designing and marketing technology seem to take a one size fits all approach, and thus as a result seem to want us the consumer to fit the product rather than the other way around. The adoption and usage of technology is not uniform and this paper reminds us to take far greater cognizance of difference.
The human dynamic is something that is often spoken of in rather abstract terms in many business schools. By so doing there is a very real danger that those in leadership and management roles lose sight of the intrinsic worth of employees and thus treat them as little more than automata. HRM is central to operational effectiveness, yet all too often is viewed either as an optional extra or an organisational encumbrance. The next paper: Linking
expectations and culture at Links of London by Sherman and Tae manages to highlight some extremely important HR issues and provides the reader with a rather interesting case study. Most businesses whether they be large or small have an element of the pressure cooker about them, is it any wonder then that some are quite blunt in their assessment, they merely state; "if you can't stand the heat, get out of the kitchen". Such an attitude whilst understandable hardly helps matters and in some respects HRM is there to help temper that heat and ensure that the energy and circumstances that generate it is directed in such a manner so as to optimise individual talents for the betterment of the organisation and those that work within it. Brand, expectations and day to day operational effectiveness are all vitally important. The impact of change and the way in which change is communicated and handled demands much of those in key roles. Mention is made in this paper of office layout, yet in recent years certain organisations have witnessed the emergence of hot seating, a phenomenon that has in many cases caused tension, insecurity and disharmony, and all this in the name of so-called efficiency and progress.
Sherman and Tae are quite right to highlight the centrality of culture. We are all familiar with pro-active and reactive cultures. Issues such a workplace bullying is an issue that is receiving more and more attention - in this regard the following is well worth perusing: www.bullying.co.uk/bullying-at-work/ Recognition and an appreciation of different circumstances can help with organisational harmony. Whether a person is a 'best fit' is extremely subjective. In addition this paper highlights something of the role of those on high whose edicts are expected to be carried out promptly and efficiently.
Links of London makes for an interesting case study. There are some who might dispute the statement that the company is the; "English equivalent of New York's Tiffany and Co". After all Tiffany and Co was founded in the same year that Queen Victoria was crowned (1837) co-incidentally the same year that Martin van Buren became the 8th President of the United States of America. An overseas brand trying to find its feet and become an established brand in the US is worthy of a study in itself. The reader is presented here with some of the day to day situations and through a specific case study and given a timely reminder of the veritable quagmire that is the field of employee relationships. From the use of LinkedIn as a recruitment tool to the bruised egos of individuals we are taken on a veritable roller coaster, which in all honesty often feels all too familiar. We certainly need to reflect more and work rather harder to gain a holistic view of the human dynamic of which we are both part of the problem, yet also one of the keys to the solution.
From the stresses and strains of employee interactions we move swiftly on to a paper that wrestles with the Holy Grail of Retailing, namely discovering what lies behind irrational purchase behaviour. A meta-analysis of consumer irrational purchase behaviour based on

Journal of Business and Retail Management Research (JBRMR) Vol. 10 Issue 3 July 2016
www.jbrmr.com A Journal of the Academy of Business and Retail Management (ABRM) ix
Howard-Sheth mode by Xinhui and Han makes clear that opinion still remains divided when it comes to an agreed definition of exactly what constitutes irrational behaviour by customers. The precise cause of such behaviour remains elusive and thus is the cause of considerable discussion and research. Recent technological developments and the growing interest in data mining and the use of algorithms has embolden retail analysts and other interested parties in their belief that someday soon the answer will be found. Of course we all would do well to exercise some caution, not least because both individual and group psychology is clearly a part of the conundrum. We can at least take comfort from the fact that all the theorising and the models that result are certain to generate new solutions and ideas and have more than a few surprises for all concerned along the way. With profit margins in the retail market being so tight, anything that helps give a business a better understanding of why customers behave the way that they do has to be useful. For those interested in dealing more effectively with people who behave irrationally, the following is well worth reading: http://theoverwhelmedbrain.com/irrational-people/
The next paper tackles an issue that is a growing concern across the world, namely that of the; "underlying discrepancy between the process and the output of the entrepreneurship programs" as the author of the following paper puts it. The making of an entrepreneur:
aligning institutional paradigm to the industry needs by Velasco. The choice of the word 'aligning' is extremely important, because it gets to heart of the problem of much of the education provided in higher educational establishments across the globe. To what extent is the education being provided actually fit for purpose? Are educators equipping students with the skills needed for the world of work? Equally, we could well ask, do those formulating courses have a desire to meet the needs of the wider world. Herein lies not only an issue in regards to national capacity building, but also some fundamental questions about education itself. Are we helping the young to question, to innovate, to problem solve and to create? How relevant is education? Has learning become stifled by its own habits and conventions?
This research happens to have been undertaken in the Philippines, yet reading this I feel that it would resonate with people across the globe. What role does education have in entrepreneurship? Clearly it does have a major role and yet still many of us are risk averse. The gap between theory and practice stated by Velasco is a perennial problem. It is important that this paper also makes mention of unemployment and underemployment. There are clear concerns about the quality and practical business experience of those delivering programmes, just as there is about meaningful engagement with the wider world. The picture is a challenging one, especially as higher education appears to be churning out students who clasp pieces of paper that in certain cases are of little relevance to the world in which they have to operate.
This research elucidates something of the fundamental problem that continue to challenge all who lead, manage and deliver higher education. It also provides food for thought about societal attitudes towards enterprise and the taking of risks. Another interesting dimension might well have been that in relation to the case studies being used in the curriculum, as well as the way in which gender impacts in the landscape of entrepreneurial education. There is clearly no room for complacency. We all would do well to reflect upon the issues raised by this paper.
At the root of so many challenges and problems one invariably finds failures in leadership. Sometimes organisation have the right people, but in the wrong roles, whilst in others incompetent individuals have been promoted upwards with dire results. Whilst there is a general consensus as to what makes an effective leader, there is a tendency to draw upon a limited repertoire of leadership types, many of whom pay scant regard to genuine

Journal of Business and Retail Management Research (JBRMR) Vol. 10 Issue 3 July 2016
www.jbrmr.com A Journal of the Academy of Business and Retail Management (ABRM) x
accountability. The next paper is entitled: Effect of Transformational Leadership and High Performance Work Systems on Job Motivation and Task Performance: Empirical Evidence from Business Schools of Thailand Universities by Pongpearchan. Anyone who explores Transformational Leadership (TL) may well be surprised that this form of leadership is not viewed as standard, and yet in many organisations and institutions it is relatively rare. Charisma is often viewed with suspicion by those who sit on appointment boards, what is more, those that visibly demonstrate empathy and concern for personnel, especially those in junior or lower status role are at times seen as weak or indeed suspect. Business schools in Thailand as elsewhere are invariably macho environments that are results driven and take no prisoners when it comes to performance. In common with many over higher education institutions job insecurity and job inequality are all too commonplace and as a direct result the atmosphere for employees is one that can appear intimidating, personally less rewarding and an environment in which workplace bullying has the potential to thrive.
The HE sector is an increasingly competitive environment, one where programme leaders have to be prepared to fight their corner. Departments and faculties find that if results are not on an upward trajectory they find themselves under intense scrutiny and possibly subject to cuts in budgets staffing or even in peril of seeing courses axed or the department wound up. Transformational Leaders offers a potential life line not least because potentially it can help forge a unity of purpose that helps individuals fulfil their promise. This Thai research also appears to confirm the value of having High Performance Work Systems (HPWS) as a means of delivering overall effectiveness.
Our attitudes to money are very telling and thus we can learn much from examining the way in which money is accessed, saved and deployed in the world in former times, currently and how things may be in the future. The next paper is entitled: A study of customer satisfaction on select service dimensions with reference to ATMs and CDMs services in Oman by Jamil and Khan. For many readers these devices are an integral part of life and yet as this study reveals they are a relatively recent phenomenon. In some parts of the world technology has already skipped a generation out of necessity and places such as Somaliland have already embraced mobile to mobile money transfer with enthusiasm. Following Mobile
Money in Somaliland (Iazzolino, 2015) is somewhat of a revelation. Essentially, where money is wanting to be accessed in Oman or elsewhere the key elements are ease of access and security. As in any new development trust is important as is convenience. Businesses need to be mindful of the old adage; 'Time is money', this is as true for the customer as it is for the business itself. In this research one of the most telling lines is the following; "It is imperative to meet and match the expectations of the customers in terms of the service being delivered by banks.", sometimes of course the banks themselves are not entirely certain as to what these "expectations" are, hence the importance of eliciting feedback and having clear channels of communication with a view to finding out customers' needs and endeavouring to meet them. Actually, when we come to think of it, all service providers should surely want to exceed expectations, for therein lies that important factor that can give a provider the edge over rivals.
Technology is undergoing various evolutionary stages and businesses need to be aware of new developments as well as invest in the technology and training that ensures smooth and seemingly seamless operations. The era of digital banking has already brought about both foreseen and unforeseen consequences. Many of us have probably not seen or written a cheque for months. The issue of fraud is a massive issue, one the banking sector is reluctant to talk about with candour. Money matters are invariably sensitive and this paper makes clear that businesses need to win their customers over and ensure that they are part of the development

Journal of Business and Retail Management Research (JBRMR) Vol. 10 Issue 3 July 2016
www.jbrmr.com A Journal of the Academy of Business and Retail Management (ABRM) xi
process. What may well work in one part of the world, may not suit or be embraced elsewhere. Yet one thing is for certain, and that is money in some form or another looks likely to be around for some time and thus it is beholden on banks to be alive to new possibilities than can help meet customer needs.
The world of retail is fascinated by what drives consumers to make seemingly compulsive purchases. A considerable body of know has accrued in recent decades that has endeavoured to elucidate this topic further. Egypt makes for an interesting country study, not least because it is one of Africa's most populous countries, but also because since local market liberalisation post- 2004 the retail market has undergone a rapid expansion in many respects. Investigating the effect of the "big five" personality dimensions on compulsive buying behaviour of Egyptian consumers by Fayez and Labib uses quantitative research. The research undertaken for this paper by its very nature is somewhat restrictive, not least because as the paper acknowledges itself; "banks, multinational companies and universities" were the places where the questionnaires were distributed. There is every likelihood that some of the elite universities in Alexandria could somewhat skew the results as they are certainly not representative of the Egyptian population as a whole. Herein lies the challenge for researchers, how does one go about accessing the bulk of the population? This is all the more relevant in the light of the fact the recent research has shown that alarmingly in Egypt illiteracy is actually rising. As recently as 2013 according to the Central Agency for Public Mobilization and Statistics (CAPMAS) literacy rates in Egypt were as follows; 18.5% of males and 33.6% of females. This is germane for several reasons, one being the ability to access a representative sample of the population as a whole and two the fact that there is a tendency in academia to distribute research in areas and environments that are familiar to us and in which we feel most comfortable. This is an issue that to some extent dogs most research and warrants far greater attention, acknowledgement and discussion than it currently receives.
The twelfth paper of this issue is entitled: Engagement in integrated reporting: evidence
from the International Integrating Reporting Council adoption framework by Boonlua and Prankasen. The issue of corporate governance has been very much in the spotlight, especially in the period immediately after the financial crisis of 2007/2008, a fact that became all the more pressing because of a whole series of major corporate scandals. As the authors rightly point out a key element is that of "improving corporate communication", something which is easier said than done. Whilst the aims and objectives of the IIRC are laudable, ensuring compliance is far from easy, especially when legislation has not always caught up with recent developments and where sanctions in respect of breaches of certain codes are insufficient or take an inordinate amount of time to take effect.
This paper is well structured and in many ways provides a useful model of how such research should be undertaken. Taking Thailand as its focus, there are some questions that need to be asked about cultural attitudes, especially in regards to the cultural acceptance of questioning and also the culture, legislation and safeguards in respect to whistle blowing. The issues raised here underscore the problems that companies are faced with across the globe. Transparency is an issue that warrants even greater attention, yet all too often there are plenty of positive words and intentions, yet the real situation is one of obfuscation and the opaque. The issue of taxation is always a thorny one. The old adage states that; ‘There are two things in life that cannot be avoided: death and taxes’ remains as true as ever. The penultimate paper of this issue is entitled: Does goods and services tax stimulate economic growth? International evidence by Hakim, Karia and Bujang. We would do well to dwell for a moment on the purpose and role of taxation, whilst it is perfectly understandable that both people and

Journal of Business and Retail Management Research (JBRMR) Vol. 10 Issue 3 July 2016
www.jbrmr.com A Journal of the Academy of Business and Retail Management (ABRM) xii
organisations resent taxation, it certainly has a significant function in modern society. We only have to think of the ability to be able to access free education until the age of eighteen, free or subsidised healthcare and of course transport infrastructure to begin to appreciate that taxation is a corner stone of the social contract. By examining the effectiveness of VAT the authors of this paper have been able to make international comparisons and have found that there would appear to be a compelling case for the reduction of VAT on certain products, as the present flat rate system used in most countries disproportionately burdens those on middle and lower incomes. The introduction of sliding scales that are product specific certainly sounds perfectly reasonable, until one reflects on the political implications of such an action. One thing is for certain, and that is the lobbying of administrations would go into overdrive as various vested interests would wish to ensure that their products were placed in a lower band. Some industries might well strike a decidedly disputatious tone and thus the only ones likely to win would be the lawyers. Cause and effect is a part of life, and governments the world over are wrestling with the complexities of revenue collection and the need to find the optimal point at which taxation is most effective and efficient. It is worth noting that the authors have made a case for reducing personal taxation, a measure that I imagine few readers would disagree with.
The final paper is entitled: A study of factors influencing customers’ purchasing
behaviours of gold ornaments by Chaisuriyathavikum and Punnakitikashem. Taking Thailand as it focus, this paper reminds the reader that there are differing attitudes towards the desirability of high quality gold. It is noteworthy that in Europe and North America there is a general willingness to accept lower carat gold, whilst in Asia customers expect a far higher grade of gold. It is worth remember that depending on the gold content the colour of the gold itself varies. The 24 carat gold available in Thai gold shops is mined locally with some 3000 kilos of gold produced in 2012 (United States Geological Survey (USGS) Minerals Resources Program) Creating an environment that it is both congenial and conducive to sales is of paramount importance, hence the emphasis placed in this research on various hedonic elements. The nature of gold is such that the key drivers behind gold sales are investment and its use as a personal adornment. Retails need to have a keen understanding of what motivates customers to make specific purchase at certain times and thus must attune their marketing and pricing structures so as to capitalise on every available sales opportunity.
The nature of the retail space is undergoing an extraordinary transformation, primarily because of changing technology and the ability to engage with customers as never before. Data mining has become essential as has the ability of those in leadership and management roles to be proactive rather than reactive. In larger enterprises the finance mechanisms have become so complex and Byzantine in nature that there are legitimate concerns about the ethical nature of some businesses and their ability to respond to consumers’ needs. This issue presents some significant research that should embolden us to look beyond the familiar and maybe use some case studies from parts of the world that are all too often overlooked. Reflecting on the subject of the final paper, all of us would do well to note those words from William Shakespeare’s play, The Merchant of Venice: “All that glisters is not gold;”
Dr P.R.Datta Editor-in-Chief

Journal of Business and Retail Management Research (JBRMR) Vol. 10 Issue 3 July 2016
www.jbrmr.com A Journal of the Academy of Business and Retail Management (ABRM) xiii
Journal of Business and Retail Management Research (JBRMR) Volume 10 Issue 3 July 2016
Contents Editorial comments Articles
European Union and the utilization of GSP from importer’s perspective with special reference to lesser developed economies Rachel A. English
1
World edible oil prices prediction: Evidence from mix effect of ever difference on Box-Jenkins approach Abdul Aziz Karia; Taufik Abd Hakim; Imbarine Bujang
11
Local industrial development in Algeria Herizi Ratiba; Belkacem Djamila
24
The impact of firm characteristics on earnings management: an empirical study on the listed firms in Egypt Sara W Bassiouny
34
The applicability of technology acceptance models in the Arab business setting Dima Dajani; Saad G. Yaseen
46
Linking” expectations and culture at links of London Herbert Sherman; Tina Tae
57
A meta-analysis of consumer irrational purchase behavior based on Howard-Sheth mode Chen Xinhui; Duan Han
69
The making of an entrepreneur: aligning institutional paradigm to the industry needs Rodrigo M. Velasco
81
Effect of Transformational Leadership and High Performance Work System on Job Motivation and Task Performance: Empirical Evidence from Business Schools of Thailand Universities Purit Pongpearchan
93
A study of customer satisfaction on select service dimensions with reference to ATMs and CDMs services in Oman Syed Ahsan Jamil; Khaliquzzaman Khan
106
Investigating the effect of the “big five” personality dimensions on compulsive buying behavior of Egyptian consumers Monika Fayez; Ashraf Labib
114
Engagement in integrated reporting: evidence from the international integrating reporting council adoption framework Sutana Boonlua; Sirin Phankasem
126
Does goods and services tax stimulate economic growth? International evidence Taufik Abd Hakim; Abdul Aziz Karia; Imbarine Bujang
138
A study of factors influencing customers’ purchasing behaviours of gold ornaments Navarwan Chaisuriyathavikun; Prattana Punnakitikashem
148

Journal of Business and Retail Management Research (JBRMR) Vol. 10 Issue 3 July 2016
www.jbrmr.com A Journal of the Academy of Business and Retail Management (ABRM) 1
European Union and the utilization of GSP from importer’s perspective with special reference to lesser developed economies
Rachel A. English De Montfort University, UK
Keywords Generalised System of Preference, European Union, Preferential Trade Agreement.
Abstract International trade had over recent years become more efficient and importers have looked for
ways to keep costs down while maintaining quality. The European Union provides incentives to importers to trade internationally with lesser developed countries by reducing the entrance tariff to the EU. It provides a preferential trade agreement in the form of generalised system of preferences. However, there are many imports into the EU that qualify for the preference but importers are not registering these goods for preference so that there is under-utilization of the preferences available.
While there are many studies of the generalised system of preference and the benefits that the preference provides to the exporter, along with its effects on the exporter’s economy, there are few studies of the effect on importers and how they apply the preferences.
This paper explores the issues that importers face when wanting to import from Lesser Developed economies. It establishes why importers are not using preferences to the full potential. Senior management in ten European Companies were interviewed to understand the problems they face when importing from non-EU countries.
1. Introduction The European Union has encouraged trade with developing countries since 1971,
(Brenton and Machin, 2002). The main mechanism used to facilitate trade is to lower importation tariffs at the point of entry into the EU. The discount system is called the Generalised System of Preferences (GSP). Its application makes goods supplied by lesser developed countries (LDCs), cheaper and hence more attractive to EU importers.
GSP was first implemented by the EU in 1971. It is a nonreciprocal trade programme. It is reviewed and renewed every ten years, (McQueen, 2007) The EU has the ability of withdrawing preferences when the recipient’s exports have increased, (Őzden and Reinhardt, 2005).
Benton and Manchin (2002) highlighted that in 1999 only one third of EU imports eligible for GSP actually entered the EU with reduced tariffs. At the time 99per cent of imports from LDC were eligible for preferences. A comparable US GSP scheme achieved 76 per cent in 1998, (Benton and Machin, 2002). Candau, Fontagne and Jean (2004) argue further that the EU is the contributor to world trade which has the most trade agreements, however, they highlight the utilisation rate as low. Brenton (2003) found that as much as 50 percent of recorded exports eligible for zero duty access to the EU from non-ACP LDCs are not applying for the preferential duty rate.
There can be many factors why importers do not utilise the GSP. Administration costs can have an effect on the preferential trade program. In particular compliance with the rules of origin can be costly. (Hoekman, et al. 2008). Brenton (2003) recognised that costs of complying with the Rule of Origin (RoO) is an area of concern. Manchin (2006) highlighted that production costs, quality of products, competitiveness gains and the benefit from the preferences obtained, all had to be taken into account to determine whether a preference should be required.

Journal of Business and Retail Management Research (JBRMR) Vol. 10 Issue 3 July 2016
www.jbrmr.com A Journal of the Academy of Business and Retail Management (ABRM) 2
The European Commission during 2005 claimed that the EU received a higher volume of imports under GSP than equivalent systems used by Canada, Japan and US combined, (Townsend, 2008). With this level of GSP activity the EU are forgoing income from the reduced duty arising from the preference. GSP is a growing area of trade within the EU market.
Imports into the EU under the standard GSP scheme were over €57 billion in 2007, an increase by 12% from 2006 (€51 billon) and an increase of 10% between 2005 and 2006. The duty foregone was €1.5 billion to the EU, (Townsend, 2008). Therefore GSP has a substantial financial impact not only on individual businesses, but also it has a cost penalty to the EU through lost duty.
With the globalisation of trade there is more opportunity for EU importers to expand their supply chain across the globe. The availability of the GSP scheme should in principle enhance this trade further. A number of manufacturers have factories overseas and import completed components to the EU for further processing or for the retail market. Brenton (2003), found that the greater fragmentations of the supply chain has made it more difficult to comply with ‘rules of origin’. This constrains LDCs manufactured from engaging in the global production networks.
This paper investigates the utilisation of GSP from the importer’s perspective. Highlighting the issues facing importers when complying with the GSP scheme and the emphasis placed on importers that it is their responsibility to ensure compliance with the various regulations when undertaking the GSP scheme. This paper presents a preliminary study of the importers perspective. Senior management of ten companies were interviewed. The results provide an assessment of issues important to importers when using Generalised System of Preference.
The next section of this paper provides a literature review of previous research on preference trade. The third section describes the method of the research. The forth section analyse the results and discusses the findings. The fifth section concludes research and the sixth section summarises the implications of the findings.
2 Literature Review The literature review covers three main areas, the first being:- Utilization of preference
within the EU, looking at the value of the payment of the full import tariff and the payment of the preferential tariff are compared to the total imports from the qualifying preference country, provides a utilization percentage. The second considers the graduation of preference from a country reaching a level of development and is able to compete in the global market. The third element investigates as to why there may be issues in relation to the operation of GSP, considering the administration and the complex Country of Origin rules.
2.1 Utilization of Preference Preferences are a set of import duty reductions used to encourage trade between the EU
and LDC. The GSP utilization rate is the proportion of goods eligible for GSP that actually apply for GSP. According to the commission of European communities (2004), GSP utilisation rates have fluctuated. Over the period 1994 to 2002, it was at its highest at 57.5% in 1996 and a low of to 42.6% in 1999/2002, increasing to 52.5% in 2002.
There is an argument that the Rules of Origin (RoO) have a direct impact on the utilization of GSP. Rather than helping LDC’s to increase the RoO imposes costs on the beneficiaries. Rather than helping developing counties they instead suppress trade, especially

Journal of Business and Retail Management Research (JBRMR) Vol. 10 Issue 3 July 2016
www.jbrmr.com A Journal of the Academy of Business and Retail Management (ABRM) 3
where fractionalization of production is a major part of the country’s economy, in particular AFTA countries, (Cadot, et al. 2006).
Not only is there a cost to the LDC, but there is also an effect on the EU importer. The proposed 2017 EU Generalised System of Preferences reforms place the responsibility on the EU importer to make contractual agreements between the importer and exporter, the importer is penalised for non-compliance. If country of origin is found to be an issue then the importation duties can still be levied against the EU importer up to three years after importation. Penalties can be issued if false origin claims are made and if the importer has any doubt then they should not claim preference, (Naumann, 2012).
The Country of Origin rule could be deemed to be a trade barrier as the under-utilisation of preference will have a direct impact on exports from the LDCs, Brenton, (2003). Brenton and Machin (2002) and Candau, Fontagne and Jean (2004) find evidence that the Country of Origin Rules set by the EU have resulted in tariffs still being paid on a large proportion of tariff-free GSP imports. Benton and Machin (2002) appear to suggest there is that the Country of Origin status could be an issue, due to the emphasis on the importer to ensure that all rules have been complied with when importing preference goods.
2.2 Graduation If an LDC economy grows and the GSP provides an unfair advantage then the GSP can
be taken away gradually over a period of time, so the LDC trades on the global market without the advantage of GSP. (Hoekman and Ozden, 2006).Once a country has reached a level of development and is able to compete in the global market, the GSP can be withdrawn. The preference is withdrawn in stages. The EU’s view on graduation from a GSP scheme is that graduation ensures that GSP is provided to countries most in need of help and the GSP has been successful in its function. (Townsend, 2008). Ozden and Reinhardt (2005) suggested that as GSP is not included within the GATT legal system, preferences can be modified or even cancelled at any time. The GSP committee alter the GSP allocation. The GATT membership approved GSP with an “enabling clause”. This prevents normal legal constraints applying to GSP implementation. Countries can provide and adjust their schemes “as they see fit” (Hudec, 1987; Jackson, 1997). The EU GSP scheme has safeguards against any threat or serious difficulty to an EU producer by allowing the preference to be suspended or graduated. However, the United Nations Conference on Trade and Development (UNCTAD), have raised this as an issue and the argument that this type of graduation protects producers in the importing countries. (Irish, 2007).
2.3 Administration of GSP and Country of Origin To be able to apply for GSP status the shipments from the LDC have to comply with the
EU Country of Origin rule. The supplier has to have changed the goods when imported from another country by a large percentage to be allowed to have the country of origin of the new product to be originating from the country of manufacture. This can be a complex rule especially as compliance lies with the importer. Brenton and Machin, (2002) questioned why importers are not utilising fully the incentives of GSP. They highlight the difficulties of adhering to the rules of origin. Augier, Gasiorek, and Lai-Tong, (2005), highlighted that the final goods producers may not change their sources of supply and if they do not meet with the origin requirement they will still continue to pay tariffs on exports to the EU and hence reducing the utilisation of the preference. Brenton and Machin (2002) suggested that the burden of administrative costs on companies proving origin is an issue, mainly due to the cost in relation to proving the origin and to maintain the administrative systems to ensure consistency.

Journal of Business and Retail Management Research (JBRMR) Vol. 10 Issue 3 July 2016
www.jbrmr.com A Journal of the Academy of Business and Retail Management (ABRM) 4
3 Methodology A preliminary study was carried out to identify issues affecting the under-utilisation of GSP upon importation.
Primary data was collected through interviews with senior managers from ten companies. Six of the ten are registered Plc’s. The sample covers small, medium and large organisations. The turnover of the companies ranged from £12 million to £10 billion. Three of the ten companies do not currently use preference. Reasons provided by the three companies are:-
i) one had only recently started trading and were still sourcing parts, ii) another produced goods that where exempt from duty iii) The third had become aware of GSP and were undertaking consultation to claim GSP. There are two automotive companies that are combined as they share the same preference
department. They have been treated as a single entity within the study. There were four companies with a turnover of over £2 billion. The sample was made up of nine British companies and one German company. Of the entities using GSP; two were automotive manufacturers; two were within fashion and retail, one manufactured packaging and one manufactured agricultural machinery.
4 Findings/ discussion The results were tabulated. Questions are shown in full on Appendix 1. Appendix 2
Table 1 shows the results of all the companies interviewed. Three companies were found not to be compatible see section 3. Discussion and analysis undertaken in relation to the remaining six companies shown in Table 1, ( the Automotive company shown in column four combines two related companies together). Similar questions are grouped together to provide an analysis of similar issues and how these issues relate to the companies questioned. The findings of each section are analysed in Appendix 3.
4.1 Discussion. Analysing the overall results has provided some interesting patterns between the
companies taking part in the sample. The two automotive companies show the same results, (see Table 1), despite manufacturing within different fields. When comparing the business and their different sectors, the similarity of the answers between the two automotive companies, the retail and the agricultural companies provide gravitas to the overall results as it highlights that companies are processing the preference in similar ways and they are adhering to the same legislation.
4.2 Quality against Cost Quality against Cost was questioned and four of the companies stated that they had
issues with gaining supply from a LDC and the main factor is quality of parts, the remaining two companies suggested that they are able to manage the quality of production due to they either have a more hands on approach with their suppliers or they rely on the competition of the market place to ensure the quality is high. There is a suggestion that all the companies take into consideration quality of the goods and the cost is just an advantage element. This is interesting as it has not really been addressed as a main issue within the academic argument as to why there is under-utilisation of GSP. However, Manchin (2006) highlighted that consideration to production costs, quality of products and competitiveness gained and the benefit from the preferences made available by the EU to ascertain the need to request for a preference.

Journal of Business and Retail Management Research (JBRMR) Vol. 10 Issue 3 July 2016
www.jbrmr.com A Journal of the Academy of Business and Retail Management (ABRM) 5
4.3 Country of Origin Rule The application of the country of origin role has been cited many times in academic
journals as one of the determinants of under-utilisation of GSP. Hoekman, et al. (2008) suggested that administration costs can have an impact on the preferential trade program, particularly compliance with the rules of origin. Brenton (2003) highlights costs of complying the Rule of Origin as an area of concern. Three companies had issues with adhering to the country of origin rule. There were strong correlation between the question of country of origin rule and finding the overall administration cumbersome, and the companies not having the confidence to include the preference within their main business strategy. This highlights that there is an issue for importers. Interestingly all six companies found that the administration was very cumbersome. However, no companies experienced delays in shipment due to the lack of the country of origin certificate.
4.4 Graduation of Generalised System of Preference Three of the interviewees stated that they had been affected by the withdrawal of GSP at
some time. The same three companies would consider lobbying the EU GSP committee if their company was going to be affected by a withdrawal of GSP. Two of the three companies stated that they treat the GSP refunds as a bonus while one stated that they include the GSP as part of their overall business strategy. This is mainly due to this company having a dedicated department to oversee importation. These companies are large and have the resources to be able to consider lobbying. English (2013) stated that this is a way companies try and govern the risk by not placing too much reliance on the duty saved. However, this could be a concern for smaller and medium size companies who are more reliant on cash flow and are unable to mitigate the risk of the removal of GSP. (English, 2013). Another aspect of the graduation process is that if preference is removed from a LDC then there is no governance from the EU to stop the larger companies moving their supply of goods to another LDC whose preference has not been removed
4.5 Other Issues Companies feel remote from the EU GSP commission decision making process when it
determines whether the GSP is to be withdrawn or reduced. All six companies stated they feel remote from the EU policy making process. This could be an issue when companies are trying to build a reliable supply chain, as the withdrawal of preference can be very costly.
The larger companies in the sample feel more able to utilize the preference. Smaller and medium size companies, with less than 250 employees make 99 % of the total EU company base. One may question if the preferences provided to LDC’s effective as they could be, (Morsing and Perrini, 2009)?
Conclusion This preliminary research identified some of the issues importers are faced with when
applying for the Generalised System of Preference. 6/6 companies interviewed found administration to be cumbersome and a cost to their business.
The graduation of the GSP also has an influence how companies utilize the preference, for example to use it within their decision making process or provide for it as a bonus. It appears that 3/6 companies are prepared to lobby the EU commission to ensure that GSP is secured. However, this is a costly process and is not affordable for all companies. There is an issue of the lack of governance from the EU with regards to the larger companies’ simply moving supplier to another LDC which still has preference when graduation is undertaken. This may question as to if the preference is achieving the policy of increasing trade for the LDC’s

Journal of Business and Retail Management Research (JBRMR) Vol. 10 Issue 3 July 2016
www.jbrmr.com A Journal of the Academy of Business and Retail Management (ABRM) 6
to merely take the trade away again if the LDC is not compliant or has achieved economic growth. The trade enjoyed while having the preference could contract and leave the LDC with an even poorer economy.
The quality of goods produced in LDC’s, was a concern with 4/6 interviewees. All six company’s stated that quality is the main factor they considered, even before cost. This implies investment is required by the LDC’s suppliers to ensure that goods are of a sufficient standard for importers to want to trade with them.
Implications The preliminary study has highlighted a number of issues relating to importers who are
currently using the GSP system. The main areas being:-
Administration and Compliance RoO highlighted by Brenton (2003) and Hoekman, et al. (2008), as a possible area of
concern. The importers have an issue with complying with RoO and all of those questioned that the administration is very cumbersome, this could lead to many companies not wanting to utilize GSP as they would feed that it is too costly to implement and easier to pay the duty in full on entry into the EU.
Graduation The use of the graduation system and the ability to withdraw the GSP scheme by the EU
GSP committee has shown that GSP is successful in its overall function. (Townsend, 2008). However, the importers have stated that they feel remote from the overall process and for some they do not incorporate the GSP within their overall business strategy. Therefore it could be said that GSP is treated as bonus and therefore utilization of the scheme is not the main priory.
If GSP is graduated from a LDC the importers will simply move to another to another GSP country. The findings however, have found that it is quality that is the main priority of the business strategy, with the cost factor as the second factor of concern and therefore companies do not in the first instance move countries because of the GSP being withdrawn
Other Issues Other issues highlighted by the importers interviewed that there are many companies,
large, medium and small will not apply resources to implement GSP and therefore they are losing out on vital income stream. The implication of this is that many larger companies are able to allocate financial resources to ensure the maximum benefit is achieved from the GSP. It is these companies that will have the capability of lobbying the EU GSP committee and this in turn may have an impact on the political decision making process.
Underutilization
The underutilization of preference when trading to LDC’s is an area of concern, as it has many implications affecting the LDC’s economic growth. Also there are many importers who are failing to benefit from the preference scheme and losing out on vital income. However, there is an argument that although the GSP system is not being fully utilized the importation into the EU using GSP is increasing and the EU is forgoing considerable income because of this. There is an implication that if more importers became aware of the preferences available and utilized it more on the current importation trade the EU would lose further revenue and this in turn could have an impact on the EU economy. The findings showed that 6/6 companies felt remote from the decision making process and accessing the GSP is administratively cumbersome.

Journal of Business and Retail Management Research (JBRMR) Vol. 10 Issue 3 July 2016
www.jbrmr.com A Journal of the Academy of Business and Retail Management (ABRM) 7
Further Research The preliminary research undertaken has highlighted many areas which require further
research some of which are listed as follows:- • Investigate the communication between EU GSP policy makers and the importers. • Establish how much trade imported into the EU eligible for GSP, is not applied for. • Establish if the lesser developed counties economies actually improve with GSP or
without. • Investigate the impact of a LDC losing GSP status.
As stated at the beginning of the paper there have been many academic arguments made as to why the GSP system is underutilised, but, little research has been undertaken from the importers angle and how they see the system of GSP. This is an area where further research could be undertaken to establish the effect of trade preferences.
Reference Augier, P., Gasiorek, M. and Lai-Tong, C. (2005), the Impact of Rules of Origin on Trade Flows, Economic
Policy, 20, (43), 567 – 624 Brenton, P., (2003), Integrating the Least Developed Countries into the World Trading System, The Current
Impact of EU Preferences under Everything but Arms, Policy Research Working Paper 3018. Brenton, P. and Manchin, M. (2002), Making EU Trade Agreements Work The Role of Rules of Origin,
CEPS Working Document No 183. Cadot, O., De Melo J., and Portugal-P‘erez, A., (2006), Rules of Origin for preferential Trading
Arrangements, Implications for the ASEAN Free Trade Area of EU and U.S. Experience, Working Bank Policy Research Working Paper 4016.
Candau, F., Fontagne, L., and Jean, S., (2004), the utilisation rate of preferences in the EU. In: 7th Global Economic Analysis Conference, Washington, D.C. 17 – 19.
Commission of The European Communities, (2004), Developing counties, international trade and sustainable development: the function of the Community’s generalised system of preferences (GSP) for the ten-year period from 2006 to 2015, Communication from the commission to the council, the European parliament and the European Economic and Social Committee, Brussels 7.7.2004 COM (2004)
461 final. English R., (2013), The Element of Risk In Relation To Importing from Lesser Developed Countries Using
Preferential Tariffs, In: Crowther, D., Aras G., (Eds). (2013), Developments in Corporate Governance and Responsibility, the Governance of Risk, Volume 5, Bingley, West Yorkshire: Emerald Group Publishing Limited.
Hoekman, B., Martin, W. J. and Primo Braga, C. A., (2008), Quantifying the Value of Preferences and Potential Erosion Losses, World Bank.
Hoekman, B., and Ozden, C., (eds) (2006), Trade Preferences and Differential Treatment of Developing Countries, Critical Perspectives on the Global Trading System and the WTO, Vol. 11., Cheltenham: Edward Elgar Publishing Limited.
Hudec, R.E., (1987), Developing Countries in the GATT Legal System, Guildford, Hampshire: Gower
Publishing Company Ltd. Irish, M., (2007), GSP Tariffs and Conditionality: A Comment on EC-Preferences, Journal of World Trade;
(41), (4), 683-698. Jackson, J.H., (1997), the World Trading System: Law and Policy of International Economic Relations, 2nd ed.,
Cambridge, MA: MIT Press Ltd. Manchin, M., (2006), Preference Utilisation and Tariff Reduction in EU Imports from ACP Countries, the
World Economy. McQueen, M., (2007), Are EU Non-Reciprocal Trade Preferences Pass`e?, Intereconomics, (4), 205-218. Morsing, M., and Perrini, F., (2009), CSR in SMEs: do SMEs matter for the CSR agenda? Business Ethics: A
European Review, (18) (1).

Journal of Business and Retail Management Research (JBRMR) Vol. 10 Issue 3 July 2016
www.jbrmr.com A Journal of the Academy of Business and Retail Management (ABRM) 8
Naumann, E., (2012), The EU Generalised System of Preferences: An overview of proposed reforms, tralac trade law centre, working paper No. D12WP06/2012.
Ozden, C. and Reinhardt, E., (2005), Political Economy, The Perversity of preferences: GSP and developing country trade policies, 1976/2000. In: Hoekman, B., and Ozden, C., (eds.) (2006), Trade Preferences and Differential Treatment of Developing Countries, Critical Perspectives on the Global Trading System and the WTO, Vol. 11., Cheltenham: Edward Elgar Publishing Limited.
Townsend, I., 2008, EU trade preferences for developing countries: the GSP and Everything but Arms’, House of Commons Library, SN/EP/3369, Section Economic Policy & Statistics.
Appendix 1 Questions asked at the interview.
Key Q1 Are preferential tariffs used?
Q2 Do you import? (supplied by RE) Q3 If no preferential tariffs are currently being applied for, what is the reason for this?
Q4 If the receipt of imported goods from Non-EU countries increase, would you consider applying for preference?
Q5 Are there any problems in importing in principle from a LDC? i.e. in relation to quality/logistics
Q6 Would quality of parts be the main consideration and cost saving an advantage?
Q7 Do preference tariffs influence your choice of suppliers?
Administration of Generalised System of Preference
Q8 Are preferences cumbersome regarding the administration?
Q9 Do you feel remote from the GSP decision making process?
Q10 Do you treat GSP duty reductions as a bonus?
Q11 Do suppliers have issues with complying with the Country of origin rules/GSP certificates?
Q12 Do you treat GSP duty reductions as part of the business?
Q13 Are preferential tariffs applied for retrospectively?
Q14 Are shipments delayed due to the raising the Country of Origin certificates.
Graduation of Generalised System of Preference
Q15 Has the withdrawal of GSP status affected you?
Q16 Would you lobby the EU to stop the withdrawal of GSP?
Other preferential reliefs
Q17 Are any other reliefs used? i.e. IPR and OPR.
Q18 If so do the benefits cover Import/export. Q19 Are these reliefs easy to administer?

Journal of Business and Retail Management Research (JBRMR), Vol. 10 Issue 3 July 2016
www.jbrmr.com A Journal of the Academy of Business and Retail Management (ABRM) 9
Appendix 2 Table 1:- Results of Questions
Column1 Automobile
Aerospace
Hygiene Clothing
2 x Automobile Companies Automobile
Fashion Warehouse
Retail Clothing
Packaging
Agricultural Machinery
Q1 Q B M B B B B L B
Q2 Y B U B B B B Y B
Q3 N N Y N N Y Y Y Y
Q4 B B Y Y Y N Y B Y
Q5 B B B N N N N N N
Q6 B B B Y Y Y N Y N
Q7 B N N Y Y Y B B N
Q8 N N N Y Y Y Y Y Y
Q9 N U Y Y Y Y Y Y Y
Q10 B B Y Y Y Y N N Y
Q11 Y Y N Y Y Y D N Y
Q12 Y B Y Y Y Y N Y N
Q13 B B M Y Y Y N Y N
Q14 B B B Y Y L N Y N
Q15 B B M N N N Y N Y
Q16 B B B Y Y N Y N N
Q17 Y B N Y Y N Y D N
Q18 B Y Y Y Y Y N Y Y
Q19 B Y N Y Y Y N Y Y
Key:- Question Answers
N
No
Y
Yes
B
Not applicable
D
Depends
Q
Quality of parts
L
Lack of knowledge
M
Not monitored
U
Non GSP
Appendix 3 Written analysis of the findings Clarification of use of GSP Are preferential tariffs used? Do you import from outside the EU These two questions are providing the same results as all the main companies have stated Yes to both these questions. This is what is expected as companies need to import to be able to use preferential tariffs. If no preferential tariffs are currently being applied for, what is the reason for this? If the receipt of imported goods from Non-EU countries increase, would you consider applying for preference? Both of these questions were answered as not applicable blank with the exception of the packing company which answered Lack of Knowledge and Yes. This is valid as the company only has finished goods under GSP and is looking to expand the preference to its raw materials. Therefore the lack of knowledge is due to the company currently looking into the new area of raw materials and the Yes relates to the fact that the raw material purchases is increasing and therefore they are considering applying for preference on this section of the business. Supply of Goods Are there any problems in importing in principle from a LDC? i.e. in relation to quality/logistics Would quality of parts be the main consideration and cost saving an advantage? The first three companies and the sixth company provided said yes to both questions, the retail company stated No and Depends and the packing company stated no to both. Therefore we can assume that this is good correlation between both answers. Leading on from this the retail and packing companies that stated no, both considered quality but felt that they are able to manage the supplier to ensure that the quality would not be an issue. Do preference tariffs influence your choice of suppliers?

Journal of Business and Retail Management Research (JBRMR), Vol. 10 Issue 3 July 2016
www.jbrmr.com A Journal of the Academy of Business and Retail Management (ABRM) 10
The result was the first two companies stated No and the remaining four provided the answer of Yes. The four Yes’s appear to be more cost conscious, however, the automotive manufacturers stated Yes in relation to the quality of the parts being the main consideration. Therefore, rather than cost driven they appear to be quality driven. The answers to this question do not appear to correlate to answers provided by other questions. Except that there are overall two Yes’s and four No’s. Administration of Generalised System of Preference Are preferences cumbersome regarding the administration? Do you feel remote from the GSP decision making process? Do you treat GSP duty reductions as a bonus? There was a 100% correlation between these three questions. The first three and fifth companies stated Yes’s and the retail and agricultural companies stated No. This suggests the companies that are finding the administration an issue feel that they are remote from the GSP decision making process and because of this they do not have the confidence to include the preference saving as part of their main business strategy and treat the reductions in tariff as a bonus. However, the retail and agricultural company are able to cope with the overall administration of claiming preference. Overall however there are 4 Yes’s and 2 No’s. Do suppliers have issues with complying with the Country of origin rules/GSP certificates? The first, second and fifth companies stated Yes and the fourth and sixth companies stated No, the third company provided an answer of Lack of Knowledge, as they rely on the suppliers providing the country of origin certificates and are unaware of any issues. With the exception of the third company’s answer the overall combination of answers correlate to the previous three questions. Do you treat GSP duty reductions as part of the business? The first three companies along with the fifth company stated No and the fourth and sixth company stated yes. This is directly opposite to the previous questions and therefore is the reverse in correlation to the previous three questions. The fourth and sixth companies answered the previous question that they do not have an issue with the administration of applying for preference and this is highlighted again here as they are confident with the preference process that they choose to include it as part of their business strategy. Are preferential tariffs applied for retrospectively? The first, second, fourth and sixth company stated yes with the third stating No and the fifth stating not applicable. To apply retrospectively the administration is more involved and the companies have up to three years to claim. The third company felt that the cost of applying for the duty refund outweighed the overall benefit and the fifth company always claimed duty at point of entry. Are shipments delayed due to the raising the Country of Origin certificates. All companies stated No to this question. Therefore shipping delays is not an issue when utilising the preference. Graduation of Generalised System of Preference
Has the withdrawal of GSP status affected you?
Would you lobby the EU to stop the withdrawal of GSP? First, second and fourth companies stated Yes andthe third and sixth companies stated No to both with the fifth company stating No to the first question and Depends to the second question, the answer is dependent on the amount of money involved. Overall there is a strong correlation between the two questions. Other Reliefs Are any other reliefs used? i.e. Inward Processing Relief and Outward Processing Relief. If so do the benefits cover Import/export. The first three, fifth and sixth company stated Yes’s and the Retail Company stated No. This is due to the retail company is not moving goods out of the EC or sending goods to their suppliers for further manufacture. Are these reliefs easy to administer? IPR and OPR Companies first, second and third all stated Yes and companies fourth fifth felt it was not applicable and the sixth company stated No. There is some correlation to the three questions as only two companies put not applicable. However, the first three companies did not find issues in administering these reliefs as they are more automated within their accounting systems but did find the GSP administration cumbersome due to the lack of automation. The sixth company also found the reverse, it is easier for them to administer GSP due to the automation of their system but difficult with regards to IPR and OPR in locating the level of detail required.

Journal of Business and Retail Management Research (JBRMR), Vol. 10 Issue 3 July 2016
www.jbrmr.com A Journal of the Academy of Business and Retail Management (ABRM) 11
World edible oil prices prediction: Evidence from mix effect of ever difference on Box-Jenkins approach
Abdul Aziz Karia Taufik Abd Hakim
Imbarine Bujang Faculty of Business Management
Universiti Teknologi MARA (UiTM) Sabah, Malaysia
Keywords First order difference; fractionally difference; overdifference; stationary; forecast
Abstract The Box-Jenkins model assumed that the time series is stationary. Generally, researchers will conduct
the first order difference as a necessary procedure of stationarity data. The first or second order difference seems to be a good solution towards nonstationarity counterparts, but this effort might lead into the possible over difference. Thus, alternative procedure of fractionally difference can be considered as a
solution towards the over difference, since it permits the non-integer value of d . However, the fractionally difference has been proved by several researchers to produced poor out-sample forecast as compared to its rival models. Therefore, we investigate the over difference’s effect on five of the selected world edible oil prices that observed to have long memory behavior. Besides, we compare the performance of two difference models which are the autoregressive integrated moving average (ARIMA) and autoregressive fractionally integrated moving average (ARFIMA) models using the time series data that observed with the over difference and long memory behavior. The forecasting show mixed results and the addressed over difference seems not to give a significant effect neither ARIMA nor ARFIMA models. We also found that the ARFIMA model does not demonstrate poor out-sample forecasting.
1. Introduction Detecting the existence of long memory in time series data has been an issue for the attention
of econometricians, statisticians and researchers. Likewise, if there exists of long memory, the
will be the tendency of over difference. Suppose that 1t t tY Y e , the value of
1 indicates the time series data tY is stationary. At this point, researchers will implement
the simple autoregressive moving average model (ARMA)
of 2 21 2 1 21 ... 1 ...p q
p t q tL L L Y L L L . If 1 , the time series of tY is
considered nonstationary. The issue arises when Box-Jenkins model assumed that the tY must
be stationary. In order to meet this assumption, the necessary procedure of differencing
1t t tY Y Y is performed, generally the first order difference towards achieving the
stationary of tY .In this case, researchers will adopt the autoregressive integrated moving average
model (ARIMA). The necessary procedure of differencing seems to be very good solutions toward the
nonstationary counterpart. However, it might lead to a tendency to over difference (Erfani & Samimi, 2009). Based from the study conducted byKaria, Bujang, and Ahmad (2013), the time series suffers from over difference if the reported result from the analysis of unit root test indicate large value statistics of Augmented Dickey Fuller (ADF), Phillips Perrons (PP) and Dickey Fuller using Generalized Least Squares (DF GLS), while small value statistic for

Journal of Business and Retail Management Research (JBRMR), Vol. 10 Issue 3 July 2016
www.jbrmr.com A Journal of the Academy of Business and Retail Management (ABRM) 12
Kwiatkowski, Phillips Schmidt and Shin (KPSS). Besides, the previous studies also indicate the
tendency of over difference toward tY if the plots of autocorrelation function (ACF) decays at a
very hyperbolic rate or sluggish, (Arouri, Hammoudeh, Lahiani, & Nguyen, 2012; Diebold &Inoue, 2001; Karia et al., 2013; Kwan, Li, & Li, 2012; Perron & Qu, 2007; Tan, Galagedera, & Maharaj, 2012; Xiu & Jin, 2007).Hurvich and Ray (1995) found that the time series that suffer from over difference could be biased for long memory prediction since it ineffective in parameters estimation.
Meanwhile, an alternative necessary procedure of fractional difference is one of the most popular approaches in dealing with long memory time series analysis. The ARFIMA is outperformed compared to its rival models in predicting varieties of time series area (Baillie & Chung, 2002; Reisen & Lopes, 1999). Moreover the ARFIMA is good in predicting out-sample time series prediction (Bhardwaj & Swanson, 2006; Chortareas, Jiang, & Nankervis, 2011; Chu, 2008; Koopman, Jungbacker, & Hol, 2005). On the other hand, Xiu and Jin (2007) and Ellis and Wilson (2004) found that the ARFIMA produced poor out-sample forecast for their time series data.
Considering the analysis from the literature, we have several concerns about the subsequent vital issues, which are: (1) whether the possible over difference could degrades the performance of ARIMA model? (2) Is the necessary procedure of fractionally integrated produces poor in-sample and out-samples forecasting? In order to examine the existence of the possible over difference, this study decided to select five world edible oils which are crude palm oil (CPO), soybean, rapeseed, sunflower and linseed.
2. Data and Methodology In regard to the addressed issues such the existence of the over difference in relation to the
performance of ARIMA model and the poor performance of ARFIMA model, this study utilized the world edible oil pricesthat we observe shows the long memory behaviour. This study obtained CPO, soybean, rapeseed, sunflower and linseed prices from Datasteam. The data was in daily basis from first of January 2008 to end of December 2013 at Free-on-Board (FOB) Malaysian Ringgit (RM) to US dollar ($) per tonne. Every five of these data consisting of1566 observations.
2.1 Autoregressive Integrated Moving Average Model The autoregressive moving average model is the combination between the autoregressive
(AR) and moving average (MA) model. If the 1t t tY Y e shows the value of 1 , it
gives an impression that the intended time series data is stationary. The model will be implemented if the intended time series is said to be stationary around the mean. The basic
ARMA ,p q model can be derived as:
t tL Y L (1)
However if 1t t tY Y e and 1 ,the time series of tY is considered nonstationary. In
order to meet the stationarity assumption of the Box and Jenkins (1976) model, the necessary
procedure of differencing *1t t tY Y Y need to be done, generally integer value of
1d and 2d . With the implementation of the necessary procedure of differencing, the time
series will be at detrended value of*
tY . It is also known as autoregressive integrated moving
average model, ARIMA , ,p d q .

Journal of Business and Retail Management Research (JBRMR), Vol. 10 Issue 3 July 2016
www.jbrmr.com A Journal of the Academy of Business and Retail Management (ABRM) 13
2.2 Autoregressive Fractionally Integrated Moving Average Model The ARFIMA model can be considered as a very useful for time series data that has a
strong persistency level towards nonstationary (Mostafaei & Sakhabakhsh, 2011). It is important to give a special attention toward the ARFIMA package introduced by Doornik and Ooms (2004) which has the capability to adopt the Maximum Likelihood Estimation (MLE) to the long memory time series data. Various literature has noted the main weakness of adopting the MLE towards the ARFIMA estimation procedure and the problem has essentially been solved by Hosking (1981) and Sowell (1987). However, Ooms and Doornik (1999) list the reasons why some problems remained unsolved. There will be problems in variance matrix into account which is totally inappropriate for extensions with regression parameters. Therefore, the study conducted by Doornik and Ooms (2004)was proposed in order to tackle the problems in variance matrix that can be expose as follow:
Assuming either 20,t NID , or 0tE and 2 2tE
Therefore, the basic ARMA ,p q model can be derived as:
t tL Y L (2)
Whereby, L and t are the lag operator and a white noise of a series respectively. For the
nonstationary solution, the fractionally difference d or the ARFIMA , ,p d q can be derived as:
1 d
t tL L Y L (3)
Where p and q are integers while the d is real. The main player in the ARFIMA model is
1 dL which is the fractionally difference operator and defined as the binomial equation as
follows:
0 0
1 d jj
j
j j
dL L L
j
(4)
With this, the stationary auto covariance function with is written as follow:
i t t iE Y Y (5)
Therefore, Doornik and Ooms (2004) provide the solutions towards the variance matrix of the
joint distribution of 1,..., tY Y Y which is presented as follows:
0 1 1
1 0
1
1 1 0
T
T
V y
(6)
The Toeplitz matrix presented by 0 1,..., T under the normality assumption of:
,TY N (7)
The variance matrix of joint distribution as shown in 4.46 combined with Toeplitz matrix, shows as the log-likelihood equation as follows:
12 1 1log , , , , log 2 log
2 2 2T
L d z z
(8)
Therefore, the ARFIMA model proposed by Doornik and Ooms (2004) is a very powerful model to predict the time series data that has a strong persistency towards the nonstationary.

Journal of Business and Retail Management Research (JBRMR), Vol. 10 Issue 3 July 2016
www.jbrmr.com A Journal of the Academy of Business and Retail Management (ABRM) 14
Besides, the proposed ARFIMA model also solved two issues in implementing the MLE compared to the existing ARFIMA model. Moreover, the ARFIMA model which consists of the
elements of for the ranging between 0.0 0.5d is good in capturing the time series data
that are persistence towards the nonstationary and has been considered by a number of literatures in many fields of time series study1.
2.3 Forecasting evaluation criterions This study utilized the root mean squared error (RMSE) to evaluate the performance of
the ARIMA and ARFIMA models in predicting in-sample and out-sample for five of the selected edible oil prices. This statistical evaluation criterion can be derived as follows:
2n
t
t
e
RMSEn
(9)
However this study also improvised the use of RMSE to % RMSE by means to identify whether the performance of the ARIMA and ARFIMA models degrades as it move from in-
sample to out-sample forecasting. The positive sign of % RMSE indicates that the model
perform poor out-sample forecasting. Meanwhile, negative sign of % RMSE reveals that the out-sample forecasting is outperform. Their expressions are given by
2 2
1 0
2
0
% 100%
n n
t t
t t
n
t
t
e e
n nRMSE
e
n
(10)
Figure 1: The overall research flow
1 Refer Doornik and Ooms (2004) for complete explanation on improvise model of ARFIMA.
No Yes
Selected world edible
oil prices
CPO
Soybean
Rapeseed
Sunflower
Linseed
Natural logarithm
t
Y
Stationarity check
Stationary Forecasting using ARMA
No evidence of overdifference
Nonstationary
Necessary procedure
First or second order difference
Fractionally difference
ACF and PACF
inspection
The unit root and
stationarity tests
ARIMA and ARFIMA
forecasting Stationary?
Forecasting evaluations
Does a possible
overdifference degrade the performance of ARIMA?
Does ARFIMA
model produce poor in-sample and
out-sample forecasting?
The unit root and stationarity tests

Journal of Business and Retail Management Research (JBRMR), Vol. 10 Issue 3 July 2016
www.jbrmr.com A Journal of the Academy of Business and Retail Management (ABRM) 15
3. Results and discussions
Table 1showsthe descriptive statistics of the original series tX and transformed into
natural logarithm tY of five world edible oil prices. Figure 2 shows the plots of original daily
prices of selected edible oils tX in Malaysia. This figure indicates that five of the selected oils
prices show a decreasing trend from half year 2008 to early of 2009. This figure also proved that five of the selected oil prices show similar movement as increase in one price will lead to increase in another prices and vice versa.
Table 1: Descriptive statistics of the original series t
X and logt t
Y X for five of the selected
world edible oil prices (from 1 January 2008 to 31 December 2013)
Descriptive
Statistics
CPO Soybean Rapeseed Sunflower Linseed
Series
tX
Series
tY
Series
tX
Series
tY
Series tX Series
tY
Series tX Series
tY
Series tX Series
tY
Mean 867.370 6.736 479.936 6.160 1145.245 7.023 1090.024 6.965 1000.270 6.886
Median 805.000 6.691 490.000 6.194 1178.665 7.072 1100.000 7.003 1040.000 6.947
Max 1350.000 7.208 683.000 6.526 1639.440 7.402 1915.000 7.557 1420.000 7.258
Min 390.000 5.966 196.000 5.278 704.760 6.558 612.000 6.417 570.000 6.346
Std. Dev. 203.5712 0.249 76.554 0.166 225.164 0.201 267.204 0.243 203.686 0.213
N 1566 1566 1566 1566 1566 1566 1566 1566 1566 1566
Figure 2: Daily Prices of selected world edible oil in free-on-board MYR/US$ per metric ton from 31 January 2008 to 31 December 2013
Examining the time series using the autocorrelation function (ACF) and partial autocorrelation function (PACF) are important since, (1) it helps to identify the order of p and
q for ARMA model (Ibrahim et al., 2015), (2) identifying the stationarity of time series data
(Zhang, Pang, Cui, Stallones, & Xiang, 2015) and indicating the tendency of over difference (Karia et al., 2013).Figure 2 shows the ACF and PACF inspection on five of the selected edible
oils prices that have been transformed into natural logarithm tY . This figure reveals that all of
the data show a covariance stationary of the CPO, soybean, rapeseed, sunflower and linseed exhibits statistically significant dependence between the observations. We also found that five of the selected edible oils prices ACF’s demonstrated decays at a hyperbolic rate than short memory time series data. Besides we detect several spikes on PACF that are ranging of 0 2p . The illustrations from the ACF and PACF proved that five of the selected edible oils
are nonstationary and need for the necessary procedure of differencing. Other than that, an illustration from the ACF also showed that it decays at a hyperbolic rate whereby it gives an indication of possible of over difference(Arouri et al., 2012; Diebold & Inoue, 2001; Kwan et al., 2012; Maqsood & Burney, 2014; Perron & Qu, 2007; Tan et al., 2012; Xiu & Jin, 2007).

Journal of Business and Retail Management Research (JBRMR), Vol. 10 Issue 3 July 2016
www.jbrmr.com A Journal of the Academy of Business and Retail Management (ABRM) 16
In order to meet stationarity assumption, this study utilized the necessary procedure as conducted by Karia et al. (2013)that uses first or second order difference and fractionally
difference. The first or second order difference will be estimated using integer of d that are
1d or 2d , generally. The fractionally difference will be estimated using non-integer of
d with 0 0.5d will be considered as stationarity series (Doornik & Ooms, 2004). Table 2 illustrates the perspective of fractionally difference parameter values based from the study of Coleman and Sirichand (2012) and Tkacz (2001). Table 2: Perspective in determining the fractionally difference parameter values
d Variance Shock duration Stationarity
0d Finite Short-lived Stationary 0 0.5d Finite Long-lived Stationary 0.5 1d Infinite Long-lived Nonstationary
1d Infinite Infinite Nonstationary 1d Infinite Infinite Nonstationary
Source: Coleman and Sirichand (2012) and Tkacz (2001) Detecting the stationarity is important since the autoregressive moving average model (ARIMA) and autoregressive fractionally integrated model (ARFIMA) assume stationarity time series data. Relying to the Figure 3, the ACF and PACF inspection reveals that five of the selected edible oil prices show tendency of over difference and nonstationarity. Therefore, this study utilized the unit root and stationarity tests for five of the time series data. Since there is no predetermined set of rules on which of the particular unit root and stationarity tests to be adopted for five of the selected edible oil prices, this study consider the augmented Dickey and Fuller(1981) [ADF] test in detecting the existence of unit root. While, this study decided to implement the Kwiatkowski, Phillips, Schmidt and Shin (1992) [KPSS] for stationarity test.
Table 3 shows the results obtained from the ADF and KPSS tests on five of the selected
edible oils prices for original series, first order difference and fractionally difference at tY . The
ADF test results toward the original series of five of the selected edible oils prices shows that there is no evidence of significant difference between the computed values of statistics with the critical value at 1%, 5% and 10% level. In addition, the P -value are also insignificant for five of
the time series data. Based from the ADF test, five of the original series at tY , that are CPO,
soybean, rapeseed, sunflower and linseed are insignificant and nonstationary as it fails to reject
the 0H of time series has unit root. Observing the KPSS test for original series at tY , five of the
time series data indicates significant at 1% level. Therefore, we reject the 0H of time series is
stationary at 99% confidence interval. Thus, KPSS test has confirmed that the original series of five selected edible oil prices are nonstationary. The results from the unit root and stationarity tests are consistent with the ACF and PACF inspection. As a result it needs the necessary procedure of first order difference and fractionally difference as fulfilling the assumption of ARIMA and ARFIMA model.
As mentioned previously, ensuring the stationarity of the time series data is vital in fulfilling the assumption of the ARIMA and ARFIMA model. Therefore we start with the necessary procedure of first order difference towards five of the selected edible oil prices. The result demonstrated in Table 3. The ADF test shows that five of the selected edible oil prices are
significant at 1% level. As a result, ADF test reject the 0H of time series has unit root at 99%
confidence interval. With this, the ADF test has confirmed that the effort of first order difference is stationary for five of the time series data. The KPSS test for five of the time series data shows
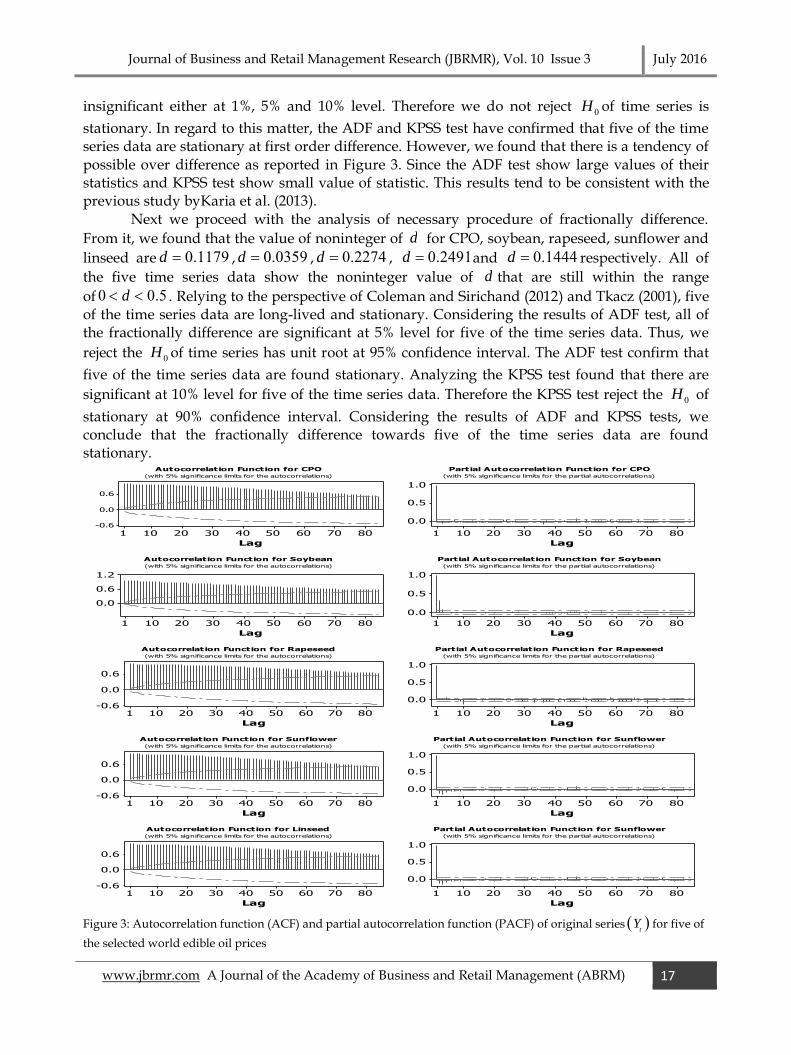
Journal of Business and Retail Management Research (JBRMR), Vol. 10 Issue 3 July 2016
www.jbrmr.com A Journal of the Academy of Business and Retail Management (ABRM) 17
insignificant either at 1%, 5% and 10% level. Therefore we do not reject 0H of time series is
stationary. In regard to this matter, the ADF and KPSS test have confirmed that five of the time series data are stationary at first order difference. However, we found that there is a tendency of possible over difference as reported in Figure 3. Since the ADF test show large values of their statistics and KPSS test show small value of statistic. This results tend to be consistent with the previous study byKaria et al. (2013).
Next we proceed with the analysis of necessary procedure of fractionally difference.
From it, we found that the value of noninteger of d for CPO, soybean, rapeseed, sunflower and
linseed are 0.1179d , 0.0359d , 0.2274d , 0.2491d and 0.1444d respectively. All of
the five time series data show the noninteger value of d that are still within the range
of 0 0.5d . Relying to the perspective of Coleman and Sirichand (2012) and Tkacz (2001), five of the time series data are long-lived and stationary. Considering the results of ADF test, all of the fractionally difference are significant at 5% level for five of the time series data. Thus, we
reject the 0H of time series has unit root at 95% confidence interval. The ADF test confirm that
five of the time series data are found stationary. Analyzing the KPSS test found that there are
significant at 10% level for five of the time series data. Therefore the KPSS test reject the 0H of
stationary at 90% confidence interval. Considering the results of ADF and KPSS tests, we conclude that the fractionally difference towards five of the time series data are found stationary.
80706050403020101
0.6
0.0
-0.6
Lag
80706050403020101
1.0
0.5
0.0
Lag
80706050403020101
1.2
0.6
0.0
Lag
80706050403020101
1.0
0.5
0.0
Lag
80706050403020101
0.6
0.0
-0.6
Lag
80706050403020101
1.0
0.5
0.0
Lag
80706050403020101
0.6
0.0
-0.6
Lag
80706050403020101
1.0
0.5
0.0
Lag
80706050403020101
0.6
0.0
-0.6
Lag
80706050403020101
1.0
0.5
0.0
Lag
Autocorrelation Function for CPO(with 5% significance limits for the autocorrelations)
Partial Autocorrelation Function for CPO(with 5% significance limits for the partial autocorrelations)
Autocorrelation Function for Soybean(with 5% significance limits for the autocorrelations)
Partial Autocorrelation Function for Soybean(with 5% significance limits for the partial autocorrelations)
Autocorrelation Function for Rapeseed(with 5% significance limits for the autocorrelations)
Partial Autocorrelation Function for Rapeseed(with 5% significance limits for the partial autocorrelations)
Autocorrelation Function for Sunflower(with 5% significance limits for the autocorrelations)
Partial Autocorrelation Function for Sunflower(with 5% significance limits for the partial autocorrelations)
Autocorrelation Function for Linseed(with 5% significance limits for the autocorrelations)
Partial Autocorrelation Function for Sunflower(with 5% significance limits for the partial autocorrelations)
Figure 3: Autocorrelation function (ACF) and partial autocorrelation function (PACF) of original series t
Y for five of
the selected world edible oil prices

Journal of Business and Retail Management Research (JBRMR), Vol. 10 Issue 3 July 2016
www.jbrmr.com A Journal of the Academy of Business and Retail Management (ABRM) 18
Table 3: The unit root and stationarity tests for selected world edible oil prices of original series, first order difference
and fractionally difference at t
Y
Time series Test Value of
statistic
1% Critical
value
5% Critical
value
10% Critical
value
P-valuea
CPO prices
Original series
t
Y
ADF -1.453 -3.964 -3.413 -3.128 0.845
KPSS 0.410*** 0.216 0.146 0.119 -
First order difference
1d
ADF -17.676*** -3.964 -3.413 -3.128 0.001
KPSS 0.115 0.216 0.146 0.119 -
Fractionally difference
0.1179d
ADF -3.435** -3.964 -3.413 -3.128 0.047
KPSS 0.146* 0.216 0.146 0.119 -
Soybean prices
Original series
t
Y
ADF -3.077 -3.964 -3.413 -3.128 0.112
KPSS 0.333*** 0.216 0.146 0.119 -
First order difference
1d
ADF -39.669*** -3.964 -3.413 -3.128 0.001
KPSS 0.033 0.216 0.146 0.119 -
Fractionally difference
0.0359d
ADF -3.489** -3.964 -3.413 -3.128 0.041
KPSS 0.144* 0.216 0.146 0.119 -
Rapeseed prices
Original series
t
Y
ADF -1.992 -3.964 -3.413 -3.128 0.605
KPSS 0.468*** 0.216 0.146 0.119 -
First order difference
1d
ADF -42.101*** -3.964 -3.413 -3.128 0.001
KPSS 0.118 0.216 0.146 0.119 -
Fractionally difference
0.2274d
ADF -3.459** -3.964 -3.413 -3.128 0.044
KPSS 0.143* 0.216 0.146 0.119 -
Sunflower prices
Original series
t
Y
ADF -1.515 -3.964 -3.413 -3.128 0.824
KPSS 0.396*** 0.216 0.146 0.119 -
First order difference
1d
ADF -17.430*** -3.964 -3.413 -3.128 0.001
KPSS 0.118 0.216 0.146 0.119 -
Fractionally difference
0.2491d
ADF -3.462** -3.964 -3.413 -3.128 0.044
KPSS 0.145* 0.216 0.146 0.119 -
Linseed prices
Original series
t
Y
ADF -1.379 -3.964 -3.413 -3.128 0.867
KPSS 0.429*** 0.216 0.146 0.119 -
First order difference
1d
ADF -36.111*** -3.964 -3.413 -3.128 0.001
KPSS 0.118 0.216 0.146 0.119 -
Fractionally difference
0.1444d
ADF -3.599** -3.964 -3.413 -3.128 0.030
KPSS 0.145* 0.216 0.146 0.119 -
Note:aBased from MacKinnon (1996) one-sided p-values. The critical values are based on percentage levels of 1%, 5% and 10%, which correspond to 99%, 95% and 90% of confidence level. * Significant at levels of 10%

Journal of Business and Retail Management Research (JBRMR), Vol. 10 Issue 3 July 2016
www.jbrmr.com A Journal of the Academy of Business and Retail Management (ABRM) 19
**Significant at levels of 5% *** Significant at levels of 1%.
The results from the ACF and PACF inspections together with analysis of unit root and
stationarity tests suggest for the necessary procedure of first order difference 1d and
fractionally difference of order d stat ranging 0 0.5d . Now for the first order difference, we found that all of the selected five edible oil prices displaying a stationary pattern. However, from Figure 4 it clearly shows that it reducing the original trend characteristics for five of the selected edible oil prices. Besides, the efforts of first order differencing were not only attenuated but nearly annihilated the characteristics like a trend for five of the time series data. We believed that the first order difference seems to eliminate too much of the important information from the original series data. Moreover, we found that the result shows in Figure 4 is consistent with the results of ACF and PACF and unit root and stationarity tests. The effort of first order difference seems to demonstrate the tendency of over difference as the time series is in long memory or long-lived duration. In this study we also intend to compare the ARIMA and ARFIMA performance which covered in-sample and out-sample forecasting.
For the ARFIMA model, we obtain the non-integer d from package developed by
Doornik and Ooms (2004). The value of non-integer d for CPO, soybean, rapeseed, sunflower and linseed can be derived by the following models respectively.
0.11791 t t tL L Y L (11)
0.03591 t t tL L Y L (12)
0.22741 t t tL L Y L (13)
0.24911 t t tL L Y L (14)
0.14441 t t tL L Y L (15)
The resulting series from fractionally differencing towards five of the selected edible oil prices are shows in Figure 4. The results indicate that there is not much loss in important data if we compared it with the first order difference. This is because the necessary procedure of first order difference is still displaying the characteristic like the trend for five of time series data.
155512449336223111
0.1
0.0
-0.1
155512449336223111
7.0
6.5
6.0
155512449336223111
1
0
-1155512449336223111
6.5
6.0
5.5
155512449336223111
0.1
0.0
-0.1155512449336223111
7.5
7.0
6.5
155512449336223111
0.1
0.0
-0.1
155512449336223111
7.5
7.0
6.5
155512449336223111
0.1
0.0
-0.1
155512449336223111
7.2
6.8
6.4
Plot of First Order Difference of CPO Prices Plot of Fractionally Integrated of CPO Prices
Plot of First Order Difference of Soybean Prices Plot of Fractionally Integrated of Soybean Prices
Plot of Fractionally Integrated of Rapeseed Prices
Plot of Fractionally Integrated of Sunflower Prices
Plot of Fractionally Integrated of Linseed Prices
Plot of First Order Difference of Rapeseed Prices
Plot of First Order Difference of Sunflower Prices
Plot of First Order Difference of Linseed Prices
Figure 4: Plots of the first order difference and fractionally difference for five of the selected world edible oil prices at t
Y

Journal of Business and Retail Management Research (JBRMR), Vol. 10 Issue 3 July 2016
www.jbrmr.com A Journal of the Academy of Business and Retail Management (ABRM) 20
Table 4 reported the in-sample and out-sample forecasting performances from ARIMA
and ARFIMA models in predicting five of the selected edible oil prices at tY .The evidence
demonstrated from this table show mixed results. We found that the ARIMA model is outperformed for the in-sample and out-sample predictions of CPO and linseed prices. Meanwhile, the ARFIMA is better fit for the rapeseed prices predictions. Besides, we found the inconsistent results for the soybean prices prediction since its demonstrated that in-sample and out-sample are associated for the ARIMA and ARFIMA respectively. This inconsistency also revealed for the sunflower prices prediction whereby the ARFIMA and ARIMA are associated for the in-sample and out-sample prediction. These inconsistencies shows a similarity with the case addressed by the study of Kang and Yoon (2013). We do not find any clear model for the edible oils prediction.
The evidence from the analysis of percentage change in root mean squared error
% RMSE also revealed mixed results. From it, we found that there are negative and positive
signs in ARIMA and ARFIMA models respectively. It is found that CPO, soybean, rapeseed and
sunflower prices prediction demonstrated % RMSE . It gives the impression that the ARIMA model is performing better in out-sample forecasting. Whereby the linseed prices suggesting an
opposing result of % RMSE that indicates the out-sample prediction using ARIMA model is degraded. In one hand, the ARFIMA model also suggesting similar result. This model depict
% RMSE for the CPO and linseed prices. Meanwhile, there are % RMSE for the soybean
and sunflower prices. However, there is a mixed result of % RMSE for the rapeseed prices. From the analyses of the Table 4, we found that: (1) the ARFIMA model do not show poor out-sample prediction from that have been found by the study of Xiu and Jin (2007) and Ellis and Wilson (2004) and the reference therein. The ARFIMA model shows decent result and its performance is slightly different with the ARIMA
model. Similar with the ARIMA model, it showed % RMSE and % RMSE that gives impression of degrades and performing better in out-sample forecasting, respectively. (2) The tendency of over difference seems not to give a significant impact toward neither ARIMA nor ARFIMA models. This proven with the results of ARIMA and ARFIMA that displayed mixed results although the analyses of ACF and PACF, and unit root and stationarity tests indicated the tendency of over difference. (3) Consistent with the study byMaqsood and Burney (2014), we found that the ARIMA model is healthier model in forecasting world edible oils prices due to its simplicity rather than complex ARFIMA model. Table 4: The ARIMA and ARFIMA forecasting performances in predicting five of the selected world edible oil prices from 1 January 2008 to 31 December 2013
World
edible oils Model
In-sample Out-
sample*
In-sample Out-sample
RMSE0 RMSE1 ARIMA ARFIMA ARIMA ARFIMA
CPO
prices
ARIMA(1,1,0) 0.017128 0.009000 -47.45
ARIMA(1,1,1) 0.017043 0.010706 -37.18
ARIMA(2,1,0) 0.017090 0.008840 -48.27
ARIMA(2,1,1) 0.017067 0.008695 -49.05
ARIMA(2,1,2) 0.017010 0.011328 -33.40
ARFIMA(1,0.1179,0) 0.017073 0.030308 77.52
ARFIMA(1,0.1179,1) 0.017074 0.030323 77.60
ARFIMA(2,0.1179,0) 0.017073 0.030300 77.47

Journal of Business and Retail Management Research (JBRMR), Vol. 10 Issue 3 July 2016
www.jbrmr.com A Journal of the Academy of Business and Retail Management (ABRM) 21
ARFIMA(2,0.1179,1) 0.017056 0.030248 77.35
ARFIMA(2,0.1179,2) 0.017039 0.030373 78.26
Soybean
prices
ARIMA(1,1,0) 0.033442 0.006761 -79.78
ARIMA(1,1,1) 0.032796 0.006952 -78.80
ARIMA(2,1,0) 0.032877 0.006762 -79.43
ARIMA(2,1,1) 0.032790 0.006910 -78.93
ARIMA(2,1,2) 0.032790 0.006899 -78.96
ARFIMA(1,0.0359,0) 0.033630 0.005708 -83.03
ARFIMA(1,0.0359,1) 0.032853 0.006889 -79.03
ARFIMA(2,0.0359,0) 0.032976 0.006120 -81.44
ARFIMA(2,0.0359,1) 0.032848 0.006821 -79.23
ARFIMA(2,0.0359,2) 0.032848 0.006822 -79.23
Rapeseed
prices
ARIMA(1,1,0) 0.016567 0.003400 -79.48
ARIMA(1,1,1) 0.016516 0.004310 -73.90
ARIMA(2,1,0) 0.016552 0.004004 -75.81
ARIMA(2,1,1) 0.016552 0.004004 -75.81
ARIMA(2,1,2) - - -
ARFIMA(1,0.2274,0) 0.000287 0.018036 6184.32
ARFIMA(1,0.2274,1) 0.016518 0.018072 9.41
ARFIMA(2,0.2274,0) 0.016820 0.001448 -91.39
ARFIMA(2,0.2274,1) 0.016514 0.021065 27.56
ARFIMA(2,0.2274,2) 0.016512 0.018043 9.27
Sunflower
prices
ARIMA(1,1,0) 0.010275 0.003945 -61.61
ARIMA(1,1,1) 0.010069 0.004479 -55.52
ARIMA(2,1,0) 0.010140 0.003902 -61.52
ARIMA(2,1,1) 0.010068 0.004418 -56.12
ARIMA(2,1,2) 0.010066 0.004421 -56.08
ARFIMA(1,0.2491,0) 0.010073 0.005202 -48.36
ARFIMA(1,0.2491,1) 0.010072 0.005207 -48.30
ARFIMA(2,0.2491,0) 0.010073 0.005207 -48.31
ARFIMA(2,0.2491,1) 0.010073 0.005210 -48.28
ARFIMA(2,0.2491,2) 0.010061 0.005243 -47.89
Linseed
prices
ARIMA(1,1,0) 0.014267 0.024042 68.51
ARIMA(1,1,1) 0.014245 0.023205 62.90
ARIMA(2,1,0) 0.014255 0.024047 68.69
ARIMA(2,1,1) 0.014245 0.023208 62.92
ARIMA(2,1,2) 0.014244 0.023140 62.45
ARFIMA(1,0.1444,0) 0.014268 0.038263 168.17
ARFIMA(1,0.1444,1) 0.014256 0.038163 167.70
ARFIMA(2,0.1444,0) 0.014263 0.038206 167.87
ARFIMA(2,0.1444,1) 0.014263 0.038207 167.87
ARFIMA(2,0.1444,2) 0.014255 0.038176 167.81
Total outperformed model 3 2 3 2
Note: * Indicated 10-step ahead forecasting. Whereby researchers will keep 10 last observations from original series of
tY and will be compared with the output from ARIMA and ARFIMA models.
4. Conclusion In this study we sought to identify a good model in predicting the time series data that
observed with the tendency of over difference and long memory behavior. Whereby the previous sections demonstrated that five of the selected world edible oil prices,that are CPO,

Journal of Business and Retail Management Research (JBRMR), Vol. 10 Issue 3 July 2016
www.jbrmr.com A Journal of the Academy of Business and Retail Management (ABRM) 22
soybean, rapeseed, sunflower and linseed prices are predicted using ARIMA and ARFIMA models. We also found that five of these time series data demonstrated highly persistence towards the nonstationarity. Moreover, the analysis of ACF indicated decays at a very hyperbolic rate, in which giving the impression of long memory behaviour and persistence towards nonstationary. Therefore it needs a necessary procedure of differencing as means in fulfilling the assumption of the Box and Jenkins (1976) model. Whereby, this study considered first order difference and fractionally difference. Consistent with the evidence from ACF and PACF inspection, the necessary procedure of first order difference seems to be a good solution in nonstationary behaviour, but the unit root and stationarity tests proved there is a presence of overdifference.
Whilstmethodology seems to be sound, we found mixed results. The addressed overdifference behaviour seems not to give a significant impact toward neither ARIMA nor ARFIMA models. As mentioned by Karia et al. (2013) and Maqsood and Burney (2014), the first order difference is resposible for the loss of important informationof specific time series data, but we are not certain of which of the time series data that will be affected. Moreover, for the case of five selected world edible oil prices, we found the performance from both models demonstrated almost similar result.
In this study, we also found that there is no evidence that the ARFIMA model shows poor in-sample and out-sample prediction considering for specific time-span in our analysis. Even though the ARIMA model suffers from the possible over difference, while ARFIMA model proven stationary with the perspective of Coleman and Sirichand (2012) and Tkacz (2001),ARIMA is the healthier model in predicting five selected world edible oil prices. However the performances from both of these models demonstrated decent and slightly different results. Therefore this study is strongly recommends that the ARIMA model is implemented due to its simplicity in predicting the world edible oil prices. Moreover, this study also suggests that the tendency of over difference be seriously studied in future work as means improving the existing model.
Acknowledgement We thank the anonymous referee for the valuable comments and suggestions. The usual disclaimers apply.
References Arouri, M. E. H., Hammoudeh, S., Lahiani, A., & Nguyen, D. K. (2012). Long memory and structural
breaks in modeling the return and volatility dynamics of precious metals. The Quarterly Review of Economics and Finance, 52, 207-218.
Baillie, R. T., & Chung, S. K. (2002). Modeling and forecasting from trend-stationary long memory models with applications to climatology. International Journal of Forecasting, 18, 215-226.
Bhardwaj, G., & Swanson, N. R. (2006). An empirical investigation of the usefulness of ARFIMA models for predicting macroeconomic and financial time series. Journal of Econometrics, 131, 539-578.
Box, G. E. P., & Jenkins, G. M. (1976). Time series analysis forecasting and control (2nd ed.). San Francisco, CA: Holden-Day.
Chortareas, G., Jiang, Y., & Nankervis, J. C. (2011). Forecasting exchange rate volatility using high-frequency data: Is the euro different? International Journal of Forecasting, 27, 1089-1107.
Chu, F. L. (2008). A fractionally integrated autoregressive moving average approach to forecasting tourism demand. Tourism Management, 29, 79-88.
Coleman, S., & Sirichand, K. (2012). Fractional integration and the volatility of UK interest rates. Economics Letters, 116, 381-384.
Dickey, D. A., & Fuller, W. A. (1981). Likelihood ratio statistics for autoregressive time series with a unit root. Econometrica, 49(4), 1057-1072.

Journal of Business and Retail Management Research (JBRMR), Vol. 10 Issue 3 July 2016
www.jbrmr.com A Journal of the Academy of Business and Retail Management (ABRM) 23
Diebold, F. X., & Inoue, A. (2001). Long memory and regime switching. Journal of Econometrics, 105, 131-159.
Doornik, J. A., & Ooms, M. (2004). Inference and forecasting for ARFIMA models with an application to US and UK inflation. Studies in Nonlinear Dynamics & Econometrics, 8(2), 1-23.
Ellis, C., & Wilson, P. (2004). Another look at the forecast performance of ARFIMA models. International Review of Financial Analysis, 13, 63-81.
Erfani, A., & Samimi, A. J. (2009). Long memory forecasting of stock price index using a fractionally differenced ARMA model. Journal of Applied Sciences Research, 5(10), 1721-1731.
Hosking, J. R. M. (1981). Fractional differencing. Biometrika, 68, 165-176. Hurvich, C. M., & Ray, B. K. (1995). Estimation of the memory parameter for nonstationary or
noninvertible fractionally integrated processes. Journal of Time Series Analysis, 16, 17-41. Ibrahim, M., Jamil, M., Akhtar, A. M., Mir, Z.-u.-H., Akbar, S., & Ahmad, M. (2015). Patient’s influx at
outpatient medical laboratory (OPML); forecasting of patient’s influx at mayo hospital, Lahore using ARIMA model. The Professional Medical Journal, 22(6), 767-775.
Kang, S. H., & Yoon, S.-M. (2013). Modeling and forecasting the volatility of petroleum futures prices. Energy Economics, 36, 354–362.
Karia, A. A., Bujang, I., & Ahmad, I. (2013). Fractionally integrated ARMA for crude palm oil prices prediction: case of potentially overdifference. Journal of Applied Statistics, 40(12), 2735-2748.
Koopman, S. J., Jungbacker, B., & Hol, E. (2005). Forecasting daily variability of the S&P 100 stock index using historical, realised and implied volatility measurements. Journal of Empirical Finance, 12(3), 445-475.
Kwan, W., Li, W. K., & Li, G. (2012). On the estimation and diagnostic checking of the ARFIMA-HYGARCH model. Computational Statistics and Data Analysis 56, 3632-3644.
Kwiatkowski, D., Phillips, P. C. B., Schmidt, P., & Shin, Y. (1992). Testing the null hypothesis of stationarity against the alternative of a unit root. Journal of Econometrics, 54, 159-178.
Maqsood, A., & Burney, S. M. A. (2014). Long memory forecasting: An application to KSE share index. Pak. J. Statist., 30(3), 333-344.
Mostafaei, H., & Sakhabakhsh, L. (2011). Modelling and forecastng of OPEC oil prices with ARFIMA model. International Journal of Academic Research 3(1), 817-822.
Ooms, M., & Doornik, J. (1999). Inference and forecasting for fractional autoregressive integrated moving average models, with an application to US and UK inflation. Econometric Institute Report 9947/A, Erasmus University Rotterdam.
Perron, P., & Qu, Z. (2007). An analytical evaluation of the log-periodogram estimate in the presence of level shifts. Boston University.
Reisen, V. A., & Lopes, S. (1999). Simulations and applications of forecasting long-memory time series models. Journal of Statistical Planning and Inference 80, 269-287.
Sowell, F. (1987). Maximum likelihood estimation of fractionally integrated time series models. Discussion
Paper 87-07, Department of Economics, Duke University, 1-31. Tan, P. P., Galagedera, D. U. A., & Maharaj, E. A. (2012). A wavelet based investigation of long memory in
stock returns. Physica A 391, 2330-2341.
Tkacz, G. (2001). Estimating the fractional order of integration of interest rates using wavelet OLS estimator. Studies in Nonlinear Dynamics and Econometrics, 5, 1-21.
Xiu, J., & Jin, Y. (2007). Empirical study of ARFIMA model based on fractional differencing. Physica A, 377, 138-154.
Zhang, X., Pang, Y., Cui, M., Stallones, L., & Xiang, H. (2015). Forecasting mortality of road traffic injuries in China using seasonal autoregressive integrated moving average model. Annals of Epidemiology, 25(2), 101–106.

Journal of Business and Retail Management Research (JBRMR), Vol. 10 Issue 3 July 2016
www.jbrmr.com A Journal of the Academy of Business and Retail Management (ABRM) 24
Local industrial development in Algeria
Herizi Ratiba Belkacem Djamila ENSSEA, Algeria
Key words Industry, industrial strategy, regional development, clusters,
Abstract In Algeria, regional development was first realized, in the framework of a planned economy in the
1970s, by local development programs or plans for local equipment focused on creating jobs, industry promotion, and development of rural and Saharan regions but without any decision-making autonomy granted to local authorities. The industry, which is the object of our study, then benefited from economic programs of the local industry (PIL). These were to be the basis for creating a second decentralized state industrial sector. The aim of the PIL was to offset the negative effects of state industrialization process in order to use local resources, ensure the satisfaction of local needs and to decentralize land use policy.
Thus, the industrial areas have been created: nearly 500 business zones and 70 industrial zones spread over a total area of 22,000 hectares. These were, however, spaces of corporate storage. Following the liberalization of the economy since the 1990s, the lack of competitiveness of industrial enterprises has become a major problem, and then an industrial strategy has been developed since 2007. One of the principal objectives of this latter was to create integrated industrial development zones (ZIDI) or clusters. According to the national planning strategy, these ZIDI will be created in areas where there are concentration of businesses, infrastructure availability, proximity to university, research institutions and quality of services. We propose in this study to locate the geographical concentration and specialization of economic activities and especially industry after analysing the Algerian local development dynamics.
Introduction Local industrial development in Algeria can be divided into two major periods since
1970. The first one was characterized by an administered economy which involved the 1970s and 1980s. During these decades a sectoral approach of the development prevailed at the expense of local development. Then a second period began from the 1990s and lasts until the present days following the liberalization of the economy and therefore the decline in state intervention. Thus the State had to be more concerned with local development in particular to coordinate the private investment. But, have we changed local development dynamics?
There are at least three forms of local development (Charif.M- 2010): endogenous development (Garofoli.G- 1992), the dynamics of public authorities (H.Shmitz-1990) and finally the exogenous dynamics. The first is based on a strong interaction between the political and the social levels, strong relations between actors in the locality, and a high degree of autonomy. The dynamics of government presupposes a centralized local development with state coordination and control. Exogenous dynamics is through the attraction of FDI (Foreign Direct Investment). What kind of local development dynamics is developed in Algeria?
1. Evolution of industrial local development in Algeria Local development in Algeria has long been marginalized in favor of a sectoral development
carried out as part of an administered economy. At independence in 1962, Algeria inherited through the GPRA (Provisional Government of the Algerian Republic), the General Directorate for planning and economic Studies, which was attached in 1963 to the Presidency. This management was the precursor of the Algerian economic planning organization. In 1965, this

Journal of Business and Retail Management Research (JBRMR), Vol. 10 Issue 3 July 2016
www.jbrmr.com A Journal of the Academy of Business and Retail Management (ABRM) 25
structure was integrated into the Ministry of Finance and Planning. It was only until the launch of the first four-year plan (1970-1973) that functional structures of a State Secretariat for planning (SEP) were implemented. The SEP was however suffering from the inferiority of its legal status. Indeed, the weight of its arbitrage resulted from its power of persuasion with respect to sector leaders and the direct intervention of the head of the State (A. Benachenhou- 1980). Regionally, there was the creation of the Economic Planning Animation Services (SAPEC) in 1971 to address the lack of local capacity for study. SAPEC also suffered from the inferiority of their legal status because they do not participate to the executive of the “Wilaya” (this is the most important local structure hierarchically), institution to which they belonged. It took until 1979 for them to be raised to the status of DPAT (Departments of Planning and Territorial Development) which sit on the executive of the “Wilaya”. These structures had to manage local programs. In 1966 was implemented the first regional program called” the special program of Ouargla”. The first regional development programs were known as "special programs of development." From 1970 to 1973 (first four-year plan) special programs were complemented by the local equipment plan (PEL). In 1970, 05 types (PEL) were implemented to consolidate all the actions of local equipment.
The first type: (EP) plans for full employment to create permanent and temporary jobs assigned to agricultural work or infrastructure.
2nd kind: (DIL) plans for the development of local industry, they cover the following sectors: crafts, tourism, and hydrotherapy.
3rd kind: (DCF) plans for the development of community facilities. It is about creating community facilities to improve the living conditions of the population, conducting sanitation works.
4th kind: (DER) plans for rural development and agricultural production projects in the traditional sector
5th type: (RECLS) plans for renovations and equipment of the Saharan local communities.
The PEL experienced the same limits as the “special programs” that preceded them. - They were not based on a national planning policy. - The design of the PEL experienced shortfalls because of the insufficiency of the technical
competence of local authorities. In an attempt to overcome these limitations the SAPEC were created but these services are not effective as they do not attend meetings of the executive of the “Wilaya” as mentioned above.
During the second four-year (1974 to 1977) there have been attempts to remedy these 02 boundaries by introducing (PCD) municipal development plans completed by the (PIL) local industry plan. During the second four-year plan, the “Walis” (they are in charge of the “wilayas” and, regionally, they represent the most important responsible hierarchically) that once were acting simply by delegation of the line Ministry (Interior Ministry) became authorizing officers of the local budget. The “Walis” and the central administration are the true holders of power decision about the implementation of investment projects. However, “local authorities, “Wilayas” and “communes” (or districts, these are the structures at the lowest regional level) are assisted entities as the funding of their equipment is 90% state» (A- Bouzidi 1988- p 63). Industrial zones (ZI) were developed to accommodate industrial investments which were essentially state. They defy logic of decentralization or regionalization. At the end of the second four-year plan 73 ZI were built on an area of 15 000 hectares with no land use plan. The majority of industrial areas was conducted between 1966 and 1977. An industrial zone was to be

Journal of Business and Retail Management Research (JBRMR), Vol. 10 Issue 3 July 2016
www.jbrmr.com A Journal of the Academy of Business and Retail Management (ABRM) 26
composed of at least five industrial enterprises and provide at least 1,000 jobs in an area of 50-2000 hectares.
Regarding the communal development plans (PCD), they can be classified into 03 categories: 1. Communal plans of agrarian revolution in the second four-year plan (agrarian revolution
consisted in giving lands to the landless peasant) involved 580 communes. 2. Semi urban PC: involved 70 predominantly urban towns 3. The P.M.U: Urban Modernization Plan, applicable to urban areas for the benefit of local
communities where industrial investments of national importance were implemented. They involved 30 municipalities.
Concerning the PIL, it was to be the basis for the creation of a decentralized state industry. Its purpose was to alleviate the negative effects of industrialization process undertaken by public enterprises in terms of job creation, implementation of local resources in order to meet local needs and decentralization of development. In fact, the period from 1967 to 1977 was dominated by a sectoral approach and state (proactive) economic development of Algeria; it took until the 1980s for the implementation of a territorial approach. Indeed, the first law on spatial planning was enacted in 1987, completed in 2001. The latter was to meet the need to locate the investment at national, regional and local levels hence the creation of the SNAT (National Scheme of Territory Development), SRAT (Regional Scheme of Territory Development) and PAW (Territory Development Plans of the “Wilayas”). SNAT locates the main intellectual, economic, transport and communication infrastructures. Concerning the Regional Scheme on Territory Development, 9 regions have been located by the law of year 2001 : NORTH-CENTRAL, NORTH-EAST, NORTH – WEST, CENTRAL HIGHLANDS, HIGHLANDS EAST, HIGHLANDS WEST, SOUTH EAST, WEST SOUTH and the BIG SOUTH.
This new approach should respond to the regional imbalance that resulted from a sectoral approach focused mainly on industry. In addition, the private sector has been asked to complete the action of the state for non-strategic investments (heavy industry and hydrocarbon industry remained a state monopoly). The State, during the 1980s, decided to focus on the completion of investments in progress. Thus, OSCIP (Body for Monitoring and Coordination of Private Investment) was established in 1983 under the supervision of MPAT (Ministry of Planning and Territory Development). Its goal was only to give a technical approval but the final approval depends on private investment regional Commissions as the commission of private investment of the” wilaya” (CAW) or the (CNI) or National Investment Commission. At the end of the 1980s, especially since the drastic fall of oil price in 1986, all economic indicators were red, especially foreign exchange reserves were equivalent to less than one month of imports in 1989 from which the recourse to the International Monetary Fund (IMF ) in the period 1989/ 1998.
During the 1990s, territorial development braked sharply. Indeed, as part of the privatization of public enterprises, which was a measure of the SAP (Structural Adjustment Plan implemented between year 1995 and year 1998), several local companies have been closed aggravating deindustrialization which began in the 1980s. Indeed, before its restructuring, the local public enterprises (EPL) reached the number of 1324 companies spread over the entire national territory and employed nearly 220,000 workers. The restructuring undertaken since 1994 (according to the Finance Law that prepared the privatization of enterprises) resulted in the dissolution of 935 EPL (Herizi.R- 2012). Industrial zones designed to implement the development plan objectives in the context of a planned economy no longer suited the Algerian economy in the process of liberalization under the auspices of the IMF. Thus, new industrial

Journal of Business and Retail Management Research (JBRMR), Vol. 10 Issue 3 July 2016
www.jbrmr.com A Journal of the Academy of Business and Retail Management (ABRM) 27
areas called "new generation areas” are being developed in addition to the renovation of the former ones. These areas are now called "Integrated Industrial Development Zones" or ZIDI or clusters. They were proposed by the MPPI (Ministry of Participation and Promotion of Investment) in 2007 (MPPI, February 2007). They were designed to implement the new industrial strategy based itself on the poles of competitiveness and excellence located by the SNAT 2025 in Sidi Abdellah, Boughzoul, Bouinan for the first poles. Six clusters have been identified by the SNAT 2025, namely:
Sidi Abdellah (ICT) Bouinan : food biotechnology and sports medicine Oran, Mostaganem and Sidi Bel Abbés- Tlemcen: organic chemistry, energy and space
technology and finally telecommunications Constantine, Annaba, Skikda: mechanical, biotechnology, metallurgy and
petrochemistry Setif, Bejaia, Bordj Bou Arreridj, M'sila: plastics, food biotechnology and Productique Medea, Boughezoul, Laghouat: renewable energy, biotechnology, environment, health,
agriculture and food, pharmaceutical industry Ouargla Hassi Messaoud, Ghardaia: petrochemistry, Saharan agronomy, biotechnology
of arid areas. Companies specialized in ICT and pharmaceutical industries are already located in Sidi
Abdellah city. SNAT (2008) includes the creation of the ZIDI in the guideline 4“attractiveness and competitiveness of the territories”. According to the MPPI, the cluster or ZIDI is an innovative territory with institutional, industrial and research potential that can integrate harmoniously into the international competitiveness. The creation of these ZIDI should be done in areas where there are concentration of companies, availability of infrastructure, proximity to university and research institutions and finally quality of services. The pattern of ZIDI is developed by the MIPI (Ministry of Industry and Investment Promotion established in 2008 in replacement of MPPI). The name changes namely MIPI instead of MPPI (Ministry of Participation and Investment Promotion) to mean that now industrialization is the main goal of the ministry rather than privatization. The MPPI has totally failed to remedy deindustrialization. So the MIPI has selected 29 wilayas for the establishment of 42 multi-purposes and specialized ZIDI. Their implementation is performed, from 5 pilot wilayas, by the ANIREF which is “the National Agency for Intermediation and Regulation of Land” created in 2007. The 5 wilayas are: Annaba, Oran, Sétif, Bordj Bou Arreridj and Blida. The ANIREF is responsible for regulating the land and real estate markets for economic activity. The ANIREF and the ANDI (National Agency for the Development of Investment) are the execution levels of new investment system introduced in 2006 (law on investment). Since 2006, investment skills are organized into three levels:
The strategic level represented by the CNI (National Investment Council), under the authority and the presidency of the Head of Government, which decides on the investment strategy and consider and adopt projects of national interest and investments of more than 2 billion dinars since 2016 and 1,5 billion dinars before.
The political level represented by the MIPI (since 2008, MPPI before) which develops the national investment policy and ensures its implementation through the DGI ( General Directorate of Investment)
A run level represented by ANIREF and ANDI under the control and direction of the MIPI.
ANDI examines investor records for the granting of benefits (tax exemption ...). ANIREF offers (ordinance 2008) the concession of land for the benefit of investors in ZIDI by the

Journal of Business and Retail Management Research (JBRMR), Vol. 10 Issue 3 July 2016
www.jbrmr.com A Journal of the Academy of Business and Retail Management (ABRM) 28
auction procedure or private sale (or over the counter sale). The private sale is authorized by the “Wali”. These transactions involve state properties like the residual assets of dissolved companies, surplus assets of the existing economic public companies. The grant is open to any natural or legal person, Algerian or foreign, enjoying his/her civil rights and providing a fixed address. The concession is granted for 33 years renewable 2 times or a maximum of 99 years. Actions to build ZIDI are the promotion of the industrial networking for the benefit of enterprises in need of innovation, the development of new technologies, the export support, and the upgrading of companies (ANIREF 2010). The financing of ZIDI is done by the "industrial competitiveness promotion fund" which is a special Treasury allocation account (CAS) established in 2000 (finance law of year 2000) which the authorizing officer is the Ministry in charge of the MIPI. It is mainly funded by allocations of the state budget and external financing as MEDA. This is the act for the funding, from the European Union, of some operations such as upgrading of enterprises in the framework of the Euro -Mediterranean Partnership launched in Barcelona in 1996. Monitoring the implementation of the investments is provided by ANIREF and CALPIREF (Assistance Committee for the Location and the Promotion of Investments and land Regulation) which is a structure of the “wilayas”. The CALPIREF is about to be deleted in 2016 for its inefficiency.
The cities that appear most competitive and promising for cluster’s creation, according to ANIREF, are: Algiers, Annaba, Bejaia, Blida, Constantine, Oran, Sétif, Sidi Bel Abbes, Skikda, Tizi Ouzou, Tlemcen. They almost all already have major assets such as the presence of universities, the proximity of the EAST / WEST highway, a railway network and industrial experience. These favorable regions to clusters are located in the card below. Graph 1: Location of industrial clusters in Algeria
Source: ANIREF (National Agency of intermediation and Land Regulation), Dec. 2015
Pilot clusters are being established in the food industry, more specifically in the industrial tomato (used as a raw material to produce industrial products) in Annaba and Guelma, dates (Biskra and Ghardaia), drinks and milk (Bejaia) in the framework of the DEVED Program of Sustainable Economic Development in cooperation with the German GIZ (Deutsche Gesellschaft fur international Zusammenarbeit). Similarly, a cluster is being developed in the mechanical industry in Constantine and Rouïba, places where are located SNVI (National Company of Industrial Vehicles) and ENMTP (Public Works Equipment Company). The creation of these clusters is a part of an industrial strategy developed in 2007 that we can present schematically as follows.
Site to launched
Site to substitute
Lqnd regulation ongoing
Studies in progess
Work in progress

Journal of Business and Retail Management Research (JBRMR), Vol. 10 Issue 3 July 2016
www.jbrmr.com A Journal of the Academy of Business and Retail Management (ABRM) 29
Graph 2: The guidelines of the Algerian industrial strategy
Source: MPPI (Ministry of Participations and Investment Promotion): Preliminary draft white paper: "Strategy and industrial development policy" - 2007.
We find that the mechanical and food industries are part of industries that must perform a trace-back upstream. Indeed, the national food industry imports most of its inputs and has a very low export capacity. To remedy this situation consortiums to pool resources in creativity, innovation and expertise, in order to face international competition, are in progress. Existing industrial zones are rather corporate storage, spaces that do not correspond to clusters. We can point among the achievements of ZIDI, the industrial park of Sidi Khettab created in 2012 in Relizane (west of Algiers in the Oran “wilaya”). This industrial zone has a strategic position due to its proximity with the East / West Highway, the presence of a railway and a university and the nearby port of Mostaganem . A project is in progress for the creation of a company which will produce pipelines for transportation of hydrocarbons and water.
We can conclude, regarding the foregoing developments, that Algeria has implemented the dynamics of public authorities for the industrial local growth. This implementation must, however, be improved. We have seen through the above that this development has gradually been integrated into a regional planning approach to remedy the imbalances. These have been aggravated by a sectoral approach and a centralized financing that characterized the 1970s and 1980s. Would the measures taken to the liberalization of the economy since the 1990s, including the creation of ZIDI we have presented above, contribute to solve this industrial regional disequilibrium?
2. Using synthetic indices of Krugman and Herfindahl for measuring the concentration of specialization
Since the publication of the work of P. Krugman on economic geography which he is the founder, the focus is increasingly placed on aspects of homogenization and differentiation of spaces. The use of indicators to measure these aspects is essential. The indicators we retain are the simple synthetic indexes of Krugman and Herfindahl to measure regional specialization and concentration. The index of Krugman The Krugman index is equal to the sum of the differences in absolute value between the industrial structure of an area and the rest of the reference area: The regional specialization Krugman index is given by:
ISKj=
III DEVELOPMENT OF NEW INDUSTRIES (automotive industry and ICT industry)

Journal of Business and Retail Management Research (JBRMR), Vol. 10 Issue 3 July 2016
www.jbrmr.com A Journal of the Academy of Business and Retail Management (ABRM) 30
Krugman index of geographic concentration:
i: sector i = 1 ... n j: Region, j = 1 ... m
: The weight of the population occupied in industry i of region j among the total employed
population of region j; i : secteur, i= 1…n
: Région, j = 1… m
E: represents the employed population
: The weight of the employed population in the region j i industry among the total employed
population in industry i;
: The weight of the total employed population in industry i among the employed population;
: The weight of the total working population of the region j among the employed population;
The value of the index is between 1 and 0. Closer to 0, the index means that the
distribution is homogeneous (specialization and concentration) and therefore there is a relative lack of specificity. Closer to 1, the index of Krugman means there is specialization and regional concentration The Herfindahl index It is equal to the sum of the squares of the weight of all individuals.The Herfindahl index of specialization is given by the following formula:
The Herfindahl index of geographical concentration is:
With : having the same meaning as above.
The value of the HHI is between 1 / n and 1 and n is the number of sectors. This index takes the maximum value of 1 when the entire sector workforce is concentrated in a single area and takes the minimum value 1 / n when the numbers are distributed evenly among the n zones.
Data source The data are collected from the NSO (National Statistics Office of Algiers), the ANIREF
(National Agency for Intermediation and Land Regulation), and the Ministry of Industry . They concern the year 2011 and 48 regions (48 wilayas).

Journal of Business and Retail Management Research (JBRMR), Vol. 10 Issue 3 July 2016
www.jbrmr.com A Journal of the Academy of Business and Retail Management (ABRM) 31
In our case, these regions are divided into sub-regions (according to the survey conducted by the NSO in 2011). The North- Central includes 10 wilayas (regions): Algiers, Blida, Boumerdes, Tipaza, Bouira, Médéa, Tizi Ouzou, Bejaia, Chlef and Ain Defla. The North-west has 7 wilayas: Oran, Tlemcen, Mostaganem, Ain Témouchent, Relizane Sidi Bel Abbes and Mascara. The North- East includes eight wilayas: Annaba, Constantine, Skikda, Jijel, Mila, Souk Ahras, El Tarf and Guelma. The Highlands includes 14 wilayas : Djelfa, Laghouat, M'Sila, Setif, Batna, Khenchela, Bordj Bouarreridj, Oum El Bouaghi, Tebessa Tiaret, Saida, Tissemsilt, Naama and El Bayadh. The Big- South includes 9 wilayas: Bechar, Tindouf, Adrar, Ghardaïa, Biskra, El Oued, Ouargla, Tamanrasset and Illizi.
The selected sectors are industry, trade and services. The first concerns us because the Algerian economy is characterized by high deindustrialisation and industry requires more attention from the government, the services have become very important since trade liberalization induced by the Structural Adjustment Plan (SAP).
The Results The calculation of concentration and specialization indexes for the regions is given by the
following table: Krugman index of the
gographical concentration Herfindahl index of the geographical concentration
Industry and trade and services
Industry and trade and services
The North-Central 0,03449195 0,00595892
The North-West 0,01189859 0,00223538
The North-East 0,00827712 0,00052417
The Highlands 0,01032798 0,00091148
The Big- South 0,00815403 0,0002858
The results show a weak value of the indexes, indicating a low concentration of activities, the North Central region being slightly more concentrated than the rest of the territory. On specialization, both indexes Krugman and Herfindahl show a difference between industry and services (including trade) for different regions. Thus, for the industry the North Central and Highlands are more specialized than the rest of the territory while for services the distribution is more homogeneous and regions are almost equally characterized by the distribution of services. These results corroborate those for industry we have obtained in our study (Belkacem, Herizi, Moussi- 2015). Indeed, statistically we detected an industrial concentration in the “wilayas” of Bejaia, Tizi- Ouzou, Algiers, Oran, Batna and Sétif. Algiers, Bejaia and Tizi- Ouzou are located in the NORTH CENTRAL region. Oran is located in the NORTH-WEST region and Sétif, Batna are situated in the HIGHLANDS region. We find that the industry is mainly located in the NORTH CENTRAL region which is the illustration of the regional imbalance in the industrial field. Krugman Index of regional specialization Herfindahl index for regional specialization:
Krugman index of the regional specialization
Herfindahl index of the regional specialization
Industry Services and Trade
Industry Services and Trade
The North-Central 0,14275824 0,05072461 0,65837145 0,5126852

Journal of Business and Retail Management Research (JBRMR), Vol. 10 Issue 3 July 2016
www.jbrmr.com A Journal of the Academy of Business and Retail Management (ABRM) 32
The Nord-West 0,04518076 0,05610429 0,61575896 0,51346015
The North-East 0,0683363 0,03270737 0,62076696 0,50696931
The Highlands 0,11666802 0,06836481 0,63990162 0,51084734
The Big - South 0,0825884 0,05001336 0,62039208 0,50887396
These results are expected because there is a regional imbalance in terms of infrastructure and the North Central region which includes Algiers is better off. In addition, the majority of SMEs (Small and Medium Societies) and SMIs (Small and Medium Industries) and particularly in services comes from public business creation devices and jobs and resources are generally evenly distributed among regions or weighted by the size of the population. We can conclude that local industrial development in Algeria is initiated, the components of clusters are being formed but their finalization field is late arriving. It faces significant obstacles; the main ones are the deindustrialization of the economy that began during 1980s and worsened by the SAP and also the fact that the Algerian State, to use an expression of G. Schelle (1958), maintains an obsessive relationship with its territory. In other words, financing of industrial territorial development remains highly centralized. Local public services, local taxes and local patrimony are marginal sources of income for regional authorities. Territorial industrial development is then very dependent on the resources and therefore the decisions of the State. Indeed, we have mentioned above, that during the 1970s and the 1980s the local development funding was 90% state (state budget). The local industrial development is now integrated in a territorial approach from the 1990s especially since the creation of the ZIDIs. This new conception has, however, maintained a centralized funding of the local industrial development. In fact, the creation of the ZIDIs is based, as we have presented above, on a special Treasury allocation account (CAS) funded by the state budget. Local authorities have also benefited from many resources intended for them such as the FNI (National Fund of Investment) created by the finance law of year 2009 which attributed to the regions a budget allocation of 48 Billions DA or 1billion per “Wilaya” but these are still funds from the state budget. Similarly, there exists a mutual fund of local councils (FCCL), but its resources are highly dependent on the state budget such a part of the VAT (tax on added value) collected for the state budget. For example, the VAT collected is shared between the state budget (85%), the FFCL (10%) and the districts (5%) (K. Litamine- 2013- p 45). The consequence of this situation is the persistence of regional industrial imbalance that we have demonstrated in this work. Some regions have real potential for industrial development and could, thanks to the presence of universities, research centers ... become competitive clusters at national and international levels. Studies in this direction could be taken to determine more accurately these integrated areas (using clusters models or spatial econometrics).
References Aiginger, K. (2012): “A Systemic Industrial Policy to Pave a New Growth Path for Europe” , WIFO
Working Paper, 421. Aiginger, K. et al (1999): “Specialization and (geographic) concentration of European manufacturing”.
Enterprise DG Working Paper No. 1, Background Paper for: The competitiveness of European industry: 1999 Report, Brussels.
Aiginger, K. et al (1999):“Do industrial structures converge”. A survey on the empirical literature is specialization and concentration of industries "; WIFO - Working papers.
ANIREF (2010) : “ Les ZIDI comme instrument de développement Industriel ”- in ANIREF VOICE- n°5, Avril, P. 4.
ANIREF (National Agency Intermediation and Land regulation) - Quarterly Newsletter edited by ANIREF. Dec. 2015

Journal of Business and Retail Management Research (JBRMR), Vol. 10 Issue 3 July 2016
www.jbrmr.com A Journal of the Academy of Business and Retail Management (ABRM) 33
Belkacem Djamila, Herizi Ratiba, Moussi Oum El Kheir (2015): ”Detection of industrial clusters in Algeria”. JBRMR.volume 9 Issue 2- April 2015- Page 22.
Benachenhou.A (1980): « Planification et développement en Algérie ». Office des Publications Universitaires (OPU)- Alger-Algérie.
Bouzidi A. (1988) : « 25 questions sur le mode de fonctionnement de l’économie algérienne ». Edition APN- Alger-1988- p 63.
Charif. M (2010) : « Zone industrielle et développement local : Quelle articulation ? » Revue du chercheur N°08/2010- Université de Tlemcen, Algérie- 2010.
Coissard S. (2009) : « Paul Krugman. Un économiste engagé ». Ed. PUG, 2009, 160 p Garofoli. G: “Endogenous Development and Southern Europe”- ed. AVEBURY- ALDERSHOT (UK)- 1992. Herizi.R: (2012) : “La privatisation des entreprises industrielles en Algérie »- doctoral Thesis- 2012- p 445. Krugman P. (1991): "Increasing Returns and Economic Geography". The Journal of Political Economy,
Vol.99, 3, 483-499. Law n°87/03du 27/01/1987 on the territory development Law n° 01-20 in date of 12/12/2001 on sustainable territory development Law n°06/08 of 2006 completing law n°01/03 of 20/08/2001 about the development of investment Law of Finance year 2000 completed and modified by the Finance law of year 2012. CAS n° 302/102. Litamine.K , “La TAP a rapporté 60% des recettes aux communes »- Algerian twicemonthly review
« L’éco »- n°79- 2013. Masahisa Fujita, Paul R. Krugman, Anthony Venables (2001), "The Spatial Economy: Cities, Regions, and
International Trade, Massachusetts Institute of Technology", MIT Press paperback edition First 2001 Mouisset H. (2010) « Les ZIDI comme instrument de développement Industriel », ANIREF VOICE- n°5-
Avril- Juin 2010 - Interview of the Chief of DIVISION OF SPATIAL DEVELOPMENT of the MIPI. MPPI (2007): « Déploiement spatial de la stratégie industrielle »- « Assises nationales de l’industrie » held
from 26 to 28/02/2007. MPPI (2007): (Ministry of Participations and Investment Promotion): Preliminary draft white paper:
"Strategy and industrial development policy" - 2007. National Statistics Office (2010) «Prime economically Census 2011 - Preliminary results of the first phase",
Series E: Economic Statistics No. 168 - Algiers, January 2012 - National Statistics Office (2012), "Prime economically Census 2011 - Preliminary results of the first phase",
Series E: Economic Statistics No. 168 - Algiers, January. OECD (2009), Survey of OECD regions, Official publication (2008): Ordinance 08/04 on the concession of land for the implementation of
investment projects enacted in 1st September 2008- art.3- official publication n°49- Algerian Republic- 3rd September 2008
Piero and Gianfranco Bini Tusset (2008):"Theory and Practice of Economic Policy Tradition and Change" by Franco Angeli srl, Milano Italy.
Robert Bernier (2010):"The Canadian space," the university presses of Quebec, Canada. Scelle.G (1958) : « Obsession du territoire, essai d’une étude réaliste du droit international » in Symbolae
Verzijl, Den Haag- Nijhoff- Shmitz. H: (1990) « Petites entreprises et spécialisation simple dans les pays en développement »- Travail
et société- volume 15 n°3. SNAT: “Aménager l’Algérie de 2025” (2008) and “Aménager l’Algérie de 2030” (2010)- the Ministry of
Planning and Territory Development- Algeria.

Journal of Business and Retail Management Research (JBRMR), Vol. 10 Issue 3 July 2016
www.jbrmr.com A Journal of the Academy of Business and Retail Management (ABRM) 34
The impact of firm characteristics on earnings management: an empirical study on the listed firms in Egypt
Sara W Bassiouny Arab Academy for science and technology, AASTCMT
Finance and Accounting Department
Key words Financial Reporting, Earnings Management, Firm Characteristics
Abstract Earnings management has been a great and consistent concern among practitioners and
regulators and has received considerable attention in the accounting literature. Several techniques and reasons exist for the practice of earnings management each is based on the management’s objectives. This paper aims to assess the impact of firm characteristics on earnings management of the listed firms in Egypt. It selects the 50 most active firms in the Egyptian stock exchange and the analysis is done using the financial statements from the disclosure book for the period 2007-2011.After excluding banks and insurance companies, for having different disclosure requirements and different corporate governance code, the final count for the firms included in the paper is 60 firms in five years so this leave us with a total of 300 observations. The tests for this research are done using the random effect generalized least square regression model using the Stata program. Findings found that there is a significant positive relationship between firms' financial leverage and earnings management while other variables of the firm characteristics which are firm size, firm age and firms' audit quality have an insignificant relationship with earnings management.
1. Introduction A series of corporate accounting scandals were witnessed at the beginning of the 21st
century across Europe and the United States and this includes several examples like Enron, WorldCom and Xerox. It is found that the core of these scandals was usually the phenomenon of earnings management (Goncharov 2005). Managers always aim to secure all the funds needed to keep the business running so that no external party can interfere, and at the same time managers aim to gain whatever kind of benefit they can from the business (Kim and Yoon 2009). Since the accounting earnings are of great importance to the stakeholders given the fact that it is the end product of the accounting process and based on the many problems and acts by the managers to try practicing earnings management, stakeholders doubt the credibility and reliability of the financial reports (Uwuigbe et al 2015).
High quality financial reporting is greatly valued by investors and other stakeholders for several reasons. One of them is that it reduces the information asymmetry problem as (Jensen and Meckling 1976) state in their research. In addition to that it provides users with more reliable information to take decisions and better reflection for the company (Wawero and Riro 2013). Moreover, as (Watts and Zimmerman 1978) add, high quality financial reporting boosts the level of transparency and helps in executing better contracts. Finally, the International Chamber of Commerce (ICC 2005) clarifies that the market efficiency and the confidence of the investors are enhanced when the reported information is reliable and of high quality in the sense of consistency, comparability and understandability.
Financial reporting mechanism focuses on promoting public confidence in the financial reporting system as well as maintaining an adequate internal control system by having a competent and independent internal audit staff, adding to this; severe sanctions should be

Journal of Business and Retail Management Research (JBRMR), Vol. 10 Issue 3 July 2016
www.jbrmr.com A Journal of the Academy of Business and Retail Management (ABRM) 35
properly imposed if any financial statement fraud is detected (Michael 1986). Egyptian firms adhering to the letter of law by following the Egyptian Accounting Standards (EAS), in the financial reporting process, that are based on the IFRS with few exceptions (Hassan 2008), is not an indicator to the existence of the spirit of the law as earnings management practice in Egypt is well accepted (Kamel and Elbanna 2010), along with several cases of accounting and auditing malpractices which have been recently detected by the Egyptian Capital Market Authority. Moreover, the recommendations adopted by the Egyptian Corporate Governance Code are not legally binding with an absence of law enforcement so this might encourage strong managers to manipulate earnings (Khalil 2010). The next section of the paper shows the literature and develops the research hypotheses; section 3 presents the methodology, section 4 is the findings and the conclusion, finally section 5 provides the limitations and few recommendations.
2. Literature Review In spite of all the mechanisms adopted in the last decade in Egypt, which aim to increase
the level of transparency and confidence in the content of financial reporting, the ability of companies to manipulate financial reports through the earnings management practice still exists, especially since these management practices are legal and within the flexibility allowed by the accounting standards which differ from illegal practices and that are classified as cases of fraud (Metawee 2013). It is added in a research by (Abdulrahman and Ali 2006) that earnings management practice adheres with GAAP (Generally Accepted Accounting Principles) so the practice falls within the bounds of accepted manipulations of accounting procedures and this differentiates earnings management from fraud as no violation for the rules took place, however this practice leads to inaccurate information about the company.
Earnings management is defined by (Blom 2009) as a purposeful intervention by the management in the process of financial reporting in order to gain personal benefit or for the organization. Based on this definition, earnings management is not informative for shareholders, and therefore it is opportunistic. Earnings management practice is explained by several theories, according to the signaling theory earnings are considered the indicator to the capital market to test whether the firm engaged in value adding activities during a certain period or not (Waweru and Riro 2013). While the stakeholder's theory explains that managers might manipulate earnings in order to enhance their private interests and benefits on the expense of shareholders and additionally the rest of stakeholders (Prior et al 2008). A third theory is the famous agency theory that explains the agency problem which is due to the agent (management) acting in their own benefit and in an opportunistic manner on the expense of the principal (owners/shareholders), as proposed by (Jensen and Meckling 1976).
The rise of earnings management comes from the application of the accrual base rather than cash flow that makes it easy for the management to manipulate the financial information as accruals are less observable (Chen et al 2014). Accrual-based accounting leads to the division of total accruals into non discretionary and discretionary components. The discretionary accruals are the proportion of accruals that management chooses to report (Gul et al 2003). This indicates that by using accrual accounting managers can control the timing of revenue and expense recognition and thus can manipulate the firm's earnings for a given period (Shah et al 2009).
Many prior literature study the determinants of earnings management however very limited research is done to investigate the impact of firm characteristics on earnings management and especially in the developing nations, so this study attempts to study the relation between firm characteristics and earnings management in a developing country, Egypt,

Journal of Business and Retail Management Research (JBRMR), Vol. 10 Issue 3 July 2016
www.jbrmr.com A Journal of the Academy of Business and Retail Management (ABRM) 36
focusing on four main types of firm characteristics which are the ones commonly used and those are firm size, firm financial leverage, firm age, and firm's audit quality.
2.1 Firm size and earnings management The size of a firm varies in many ways and it is essential to consider how the size affects
the quality of reported information. It is argued by (Meek et al 2007) that based on the information asymmetry theory, large firms have lower information asymmetry as they have strong governance and control so this leads to the reduction of the earnings management practice. However, being a large firm is not enough reason to have a strong corporate governance level and therefore reduce earnings management practice as for instance, the fall of Enron, through practicing financial engineering, was mainly due to the failure of corporate governance, and specifically a board problem due to blindly trusting the auditors, and allowing conflict of interest to take place (Munzing 2003). Moreover, (Jensen and Meckling 1976) add that based on the agency theory, large sized firms witness greater agency costs and this means more opportunistic practices.
Several reasons exist to prove a negative relation between firm size and earnings management as explained by (Ahmad et al 2014 and Kim et al 2003), Large-sized firms may have stronger internal control system and may have more competent internal auditors as compared to small-sized firms therefore; an effective internal control system helps in publishing reliable financial information to the public, so this will likely reduce the ability of the management to manipulate earnings. Also large firms are usually audited by one of the big four auditing firms and this helps prevent earnings management due to the efficient and effective audit performed. A third reason is the reputation cost, in large firms the reputation cost is higher than that in the small firms as large firms have better appreciation of market environment, better control over their operations and better understanding of their businesses relative to small-sized firms, therefore this might prevent large firms from engaging in earnings management practices.
On the other side, a positive relation exists as large-sized firms face more pressures to meet the analysts' expectations (Barton and Simko 2002). In addition, large-sized firms have greater bargaining power with auditors so the larger the firm size, the more bargaining power they have in negotiations with auditors.
This is consistent with what some articles in the newspapers mention, as one of the articles (The Netherlands times) argues about imposing fines on the big 4 audit firms due to failure in auditing the financial statements, while the other article (The Telegraph) states that the big audit firms put the management interest before the shareholders interest, creating an agency problem. However, studies conducted produced results that confirm the importance of the existence of the big audit firms to reduce earnings management practice (Becker et al 1998 and Francis and Krishnan 1999). Although real life examples might contradict with the studies, one might prefer to depend on the studies as they are supported with analysis and results.
2.2 Firm financial leverage and earnings management Managers who try to reduce debt covenant costs may adopt certain accounting methods
that enable them to report favorable financial statements in terms of creditworthiness (Bowen and Shores 1995). Therefore there is a link between the debt level and the choice of accounting policy as (Waweru and Riro 2013) explain, debt covenants are based on the accounting numbers reported and any violation in those debt covenants imposes costs on the company and this might lead to the practice of earnings management to avoid costs, as well as improving the firm’s financial flexibility in order to prevent reflecting an image of financial distress (Easton et al 1993).

Journal of Business and Retail Management Research (JBRMR), Vol. 10 Issue 3 July 2016
www.jbrmr.com A Journal of the Academy of Business and Retail Management (ABRM) 37
One of the theories linking the two variables is the financial distress theory explained by (Fung and Goodwin 2013) which examines earnings management incentives among managers in financial distress firms. They argue that when managers manipulate the firm’s earnings, they are doing that to convince their creditors that the financial distress is a temporary nature and will be able to recover soon. Another theory would be the information asymmetry, According to (Jones et al 2005); information asymmetries tend to be less severe for large loans, since any fixed costs associated with obtaining information about a borrower are less of an obstacle for large loans. It is also suggested that small borrowers have greater information asymmetries, and a loan’s size is typically positively correlated with its borrower’s size.
When a company relies on debt, the managers tend to choose accounting policies that increase the income so that they abide by the debt covenants imposed by banks and bondholders and this allows them to avoid any renegotiation costs (Beatty and Weber 2003). Based on the previous studies a negative relation is proposed to exist between firm's financial leverage and earnings management mainly for two reasons, first, leverage requires debt repayment, thus reduces cash available to management for non-optimal spending. Second, when a firm employs debt financing, it undergoes the scrutiny of lenders and is often subject to lender-induced spending restriction (Jensen 1986).
2.3 Firm age and earnings management As time passes, firms discover what they are good at and learn how to do things better as
they specialize more and new techniques are found to standardize, coordinate, and speed up their production processes, as well as to minimize costs and improve quality (Arrow 1962, Ericson and Pakes 1995).
Based on prior research, firms that have been in the market for long times tend to have low level of earnings management than beginners as they are well known companies, that have a great value in the market and they have a reputation to protect, also they are aware of the rules and codes that govern their practices. Moreover, long established firms might have improved their financial reporting practices over time (Alsaeed 2006) and secondly they try to enhance their reputation and image in the market (Akhtaruddin 2005) so the older the firm, the less tendency to perform earnings management practices.
When a firm is familiar in the market, debates exist on whether this will lead to the unwillingness of external parties to question the firm or not. Usually, long established firms are audited by one of the big auditing firms and based on (DeAnglo 1981) big audit firms have incentive to report material misstatements in order to protect their reputation. In addition, governmental agencies always pay attention to firms that have been in the market for a long time more than the newly entered firms, therefore, when the age increases, the firm tends to improve its governance by issuing high quality financial reports without manipulations. (Chalaki et al 2012).
On the other hand, when it comes to real life examples, Enron's scandal opposes the mentioned opinion as Enron was a well known firm that wanted to meet aggressive expectations, left a room for an agency problem and trusted the auditors and did not insure their independence (Munzing 2003). Arthur Andersen as an auditing firm was driven by greed and its main aim was to keep the client happy (Toffler 2004) therefore the audit firm did not tend to question any malpractices performed by the client and covered up Enron's manipulations and therefore performed a poor quality audit.

Journal of Business and Retail Management Research (JBRMR), Vol. 10 Issue 3 July 2016
www.jbrmr.com A Journal of the Academy of Business and Retail Management (ABRM) 38
2.4 Firm's audit quality and earnings management High quality audit is more likely to detect and report errors and irregularities. Thus, it is
an effective barrier to earnings manipulations (DeAngelo 1981). Auditing reduces asymmetries between managers and shareholders by allowing outsiders to verify the validity of financial statements and by that it is a valuable monitoring method used by firms to reduce agency costs (Watts and Zimmerman 1983). The big four auditing firms have a very huge incentive to maintain a high audit quality due to the following reasons, the first one is that they have large number of clients, in addition, better resources employed like the technology, training programs and experience, finally the last reason is having a reputation that might be lost if they didn’t report a misstatement or a manipulation (Rusmin 2010, and Chung et al 2005).
Firms audited with auditors other than the big four report significantly greater discretionary accruals as stated by (Lenard and Yu 2012) confirming this inverse relation (Bartov et al 2000) suggest that higher quality auditors tend to report any error and have no willingness to accept any manipulations. The study by (Yasar 2013) finds that the audit quality doesn't have an impact on discretionary accruals so there is no difference in audit quality between Big Four and non-Big four audit firms in constraining the practice of earnings management, (Piot and Janin 2007) agreed to this finding.
Based on previous studies and results, it can be seen that large sized firms, firm financial leverage level, firm’s age and audit quality and being audited by one of the big 4 audit firms can have significant effect on management opportunistic behavior such as earnings management. Consequently, this paper proposes the following hypotheses: H1: There is a significant relationship between Firm size and earnings management H2: There is a significant relationship between Firm Financial Leverage and earnings management H3: There is a significant relationship between Firm Age and earnings management H4: There is a significant relationship between firms' audit quality and earnings management
3. Methodology Sample selection and data collection
The unit of analysis in this research is constituted of a population of firms that are listed in the Egyptian stock exchange (EGX) as the data will be easily accessible. Specifically, a sample of the 50 most active firms listed in the (EGX) is used from the year 2007-2011 excluding the financial institutions due to their specific and different corporate governance and disclosure requirements. Secondary data type is used as the data gathered to measure the dependent and independent variables is from the financial statements. Data source is mainly the disclosure book and some data is purchased from the Egyptian Company for Information Dissemination (EGID).This study is considering a panel data type and this will require conducting the random effect generalized least square (GLS) regression using the Stata program.
Panel Data This section proposes the use of panel data instead of the cross sectional assumption and
this means that the observations contain both time series and cross sectional units. As defined by (Brooks 2008), "Panel data will embody information across both time and space". Panel analysis begins with determining the type of regression needed for the study and the panel data models are either fixed effects or random effects models. The panel data methodology has an important advantage which is the assumption that firms are heterogeneous, and this is an advantage over studies that use time series or cross sectional data. Other advantages for panel data are added like being very informative and having more variability and less collinearity among the

Journal of Business and Retail Management Research (JBRMR), Vol. 10 Issue 3 July 2016
www.jbrmr.com A Journal of the Academy of Business and Retail Management (ABRM) 39
variables, therefore using panel data is better for having unbiased and more reliable results, this is proposed in a book by (Baltagi 2011).
In models with fixed effects, as explained by (Pintea et al 2014), the error component can be correlated with regressors; research hypothesis states no correlation between regressors and random error component. While the random effects model assumes that the error component is a totally random error, and the assumption is that the error does not correlate with regressors (Baum 2001 and Baltagi 2008). The rationale behind random effects model is that, unlike the fixed effects model, the variation across entities is assumed to be random and uncorrelated with the predictor or independent variables included in the model, so the entity’s error term is not correlated with the predictors which allows for time-invariant variables to play a role as explanatory variables (Kohler and Kreuter 2012 and Greene 2008).
Measurement of the dependent variable The majority of recent earnings management literature relies primarily on discretionary
accruals as a proxy for earnings management and so this study will use the discretionary accruals as a proxy for earnings management. Most researchers prefer to use the cash flow statement approach as it is more useful than the balance sheet approach (Shah et al., 2009, Soliman and Ragab 2014).
This study will use the cash flow statement approach to calculate the total accruals, so based on that approach the total accruals can be calculated as follows: TAt= NIt - CFOt Where: TAt : total accruals in year t, NIt : net income in year t, CFOt : cash flows from operating activities in year t.
Total accruals are not the proxy for earnings management; on the contrary, earnings management is the part of the accruals that managers can have control on and are able to practice manipulations. According to this, the total accruals are divided into two parts which are the discretionary accruals and the non discretionary accruals. So to calculate the discretionary accruals, non discretionary accruals are subtracted from total accruals (Shah and Butt 2009) TA = DA + NDA Where: TA: total accruals, DA: discretionary accruals, NDA: non discretionary accruals
Many models and methods exist to calculate the discretionary accruals, the Healy 1985 model, the De Angelo 1986 model, Jones 1991 model and finally the modified cross sectional Jones 1995 model. Consequently, based on the modified Jones model 1995, that this study uses, the equation to be used in calculating the NDA is as follows: (Uwuigbe et al 2015 and Shah et al 2009)
NDAt= β1j [1/At-1] + β2j [ΔREVt- ΔARt/At-1] + β3j [PPEt/At-1] Where: NDAt : Non discretionary accruals for firm j in year t, At-1: Total assets for firm j
in year t-1, ΔREVt: Change in the revenues (sales) for firm j in year t less revenue in year t-1 , ΔARt : Change in accounts receivables for firm j in year t less receivable in year t-1 , PPEt : Gross properties, plants and equipments for firm j in year t , β1j, β2j, β3j are firm specific parameters
In order to find the firm specific parameters to be used in the NDA equation, a regression equation is used to find those parameters and this equation is as follows: (Ahmad et al 2014, Salleh and Haat 2014 and Uwuigbe et al 2015)
TACt/At-1 = β1j [1/At-1] + β2j [(ΔREVt – ΔARt)]/ At-1 + β3j [PPEt/ At-1] + εt After calculating the total accruals using the cash flow statement approach and
calculating the non discretionary accruals through the equation of the modified Jones model

Journal of Business and Retail Management Research (JBRMR), Vol. 10 Issue 3 July 2016
www.jbrmr.com A Journal of the Academy of Business and Retail Management (ABRM) 40
1995, the discretionary accruals can then be calculated using the following equation: (Salleh and Haat 2014 and Uwuigbe et al 2015)
DAjt = TACjt/Ajt-1 – NDAjt
Measurement of the independent variables Variables Measuring tool
Dependent Variable
Discretionary accruals Modified Jones Model 1995
Independent Variables
Firm Size (FSIZE) Natural log of total assets
Firm Financial leverage (FLEV) Total debt ratio (Total debt/Total Assets)
Firm Age (FAGE) Log of the number of years since the firm’s foundation
Audit Quality (AUQUL) Dummy variable, 1 if the auditor is a big 4 firm and 0 otherwise
Survival (FSUR) Dummy variable, 1 if a firm is active in a year and 0 otherwise
Model Specification To test for the hypotheses, this research utilizes the following regression model to
examine and test for the impact of multiple independent variables which are the firm characteristics on the dependent variable which is the earnings management practice in the 50 most active firms in the Egyptian stock exchange.
DAC = β0 + β1 FSIZE + β2 FLEV + β3 FAGE + β4 AUQUL + β5 FSUR + ε Where: DAC: is the discretionary accrual, FSIZE: is the firm's size, FLEV: is the firm's financial leverage, FAGE: is the firm's age, AUQUL: is the audit quality, FSUR: is the survival variable
and the ε is the error term.
Findings and discussion The analysis will start by the descriptive statistics, followed by the correlation analysis
and then the results of the regression analysis are shown and discussed to see whether the hypotheses are validated or not. The analysis is done using the Stata program.
Descriptive Statistics The descriptive statistics show the mean, minimum and maximum values and the
standard deviation of the dependent and independent variables. The variables used in this research are the independent variables (firm size, firm age, firm financial leverage and firm audit quality) and the dependent variable which is earnings management.
Descriptive Statistics
N Minimum Maximum Mean Std. Deviation
DAC 297 -0.4625478 0.8624406 0.0428084 0.1290379
Firm Size 300 16.989 24.21654 21.05643 1.594065
Leverage 300 0.0001148 0.9709026 0.3903224 0.23564
Age 300 16 41 27.96667 6.788834
Audit Quality 300 0 1 0.2833333 0.4518738
Survival 300 0 1 0.6722222 0.4707127
Table 1: Descriptive statistics
As it is shown in table 1, the results state that the mean value of the dependent variable (Discretionary Accruals "DAC") for the selected sample of firms is equal to (0.0428084) with a

Journal of Business and Retail Management Research (JBRMR), Vol. 10 Issue 3 July 2016
www.jbrmr.com A Journal of the Academy of Business and Retail Management (ABRM) 41
standard deviation of about (12.9%). This average implies that about (4%) on average of the earnings management practices practiced by the sampled firms, are having an upward direction which means manipulating the earnings level by increasing it.
Moving to the independent variables, the results show that the average firm size for the sample is about 21% with a minimum of 16.9% and a maximum of 24.2% and a standard deviation of 1.59, the second independent variable which is the firms' financial leverage averaged to 39% of the total assets which means that the average of the firms depend a little bit more on equity rather than debt. The average age for the sampled firms is 27.96 years, while the minimum firm age for the sample is 16 years and the maximum firm age is 41 years. The fourth independent variable is the firms' audit quality which is measured by a dummy variable so the minimum value is 0 and the maximum value is 1 and it has an average of 28% which means that 28% of the sample firms is audited by one of the big four auditing firms.
Correlation analysis This analysis aims to check the relationship between dependent and independent
variables as well as the independent variables among each other and helps to check for the multicollinearity problem. It is stated by (Ho 2006) that the correlation must be two tailed if the hypotheses are not stating a particular direction for the relation between the independent variables and the dependent variable and that’s the case in this study. The Pearson's correlation matrix is used and it shows the degree of correlation between the independent variables and based on (Soliman 2013, cited in Bryman and Cramer 1997), the Pearson's correlation between independent variables should not exceed 0.8 to prove that there is no multicollinearity problem among the variables. As shown in table 2, the highest correlation is between audit quality variable and the firm survival variable with the amount of 0.4128 and this shows that there is no multicollinearity problem between the independent variables used in this research model, as it does not exceed the 0.8.
Table 2: Correlation analysis
Regression Analysis Hausman test is carried out for the sample of 60 firms for the period from 2007 to 2011,
using the discretionary accruals as a dependent variable. The result indicates an insignificant level equals to (0.1316) compared to (0.05) and this indicated that the random effect regression should be used instead of the fixed effect.
Discretionary Accruals (DAC)
Hausman Test Prob>chi2= 0.1316
Correlations
DAC Firm Size Leverage Age Audit Quality Survival
DAC 1
Firm Size 0.0451 1
Leverage .-0.0563 0.2625 1
Age -0.0553 -0.3967 -0.1203 1
Audit Quality -0.0531 .0.3528 0.0352 0.0650 1
Survival -0.0551 0.0807 -0.1183 0.0682 0.4128 1

Journal of Business and Retail Management Research (JBRMR), Vol. 10 Issue 3 July 2016
www.jbrmr.com A Journal of the Academy of Business and Retail Management (ABRM) 42
Table 3: Hausman test results
Table 4: Random Effect GLS Regression
A random effect model is estimated by Generalized Least Squares (GLS) regression as shown in table 4. The model is found to be highly significant as the significance level is shown to be (0.0000) and the adjusted R Square is equal to (0.1675) which means that 16.75% variation in the dependent variable (earnings management) is explained by the independent variables (firm characteristics) this is similar to the results of (Waweru and Riro 2013) conducting a study on Kenyan listed firms. Regarding the significance level between each independent variable and the dependent variable it was found that only the firms' financial leverage has a significant relationship with earnings management with a significance level of (0.000) leading to the second hypothesis of the study to be accepted, in addition the coefficient is equal to (0.74046090), which shows a positive relationship between both variables, this is similar to the findings of (Weber 2006).
The rest of the independent variables show an insignificant relationship with the dependent variable as their values are greater than 0.05 and even greater than 0.1, as shown in table 4, which leads to the rejection of their hypotheses and these results regarding the relation between the firm size, firm age and firms' audit quality are similar to the findings of (Al saeed 2006, and Chung et al 2005).
Conclusion This paper examines the impact of firm characteristics on earnings management in the 50
most active firms listed in the Egyptian stock exchange from the year 2007-2011 taking four firm characteristics to conduct the research model which are the firm size, firm financial leverage, firm age and firm's audit quality. The study extends research on the quality of financial reporting and its importance. The findings are of great importance for future researchers who aim to conduct further studies in this topic in the Egyptian market and generally speaking the findings are important for investors in developing countries as well as other stakeholders as they depend on the reported financial information to take investment and other decisions.
Findings from the tests conducted indicate that only 16.75% change in the firm's earnings management practice is explained by firms' characteristics, which is not a high percentage however very close and similar to other studies analyzing the same relation. Based on the results of this study, the firms’ financial leverage has a significant positive relation with earnings management which gives an indicator for the firms to control the level of leverage as to avoid the existence of the earnings management practice, and this might be a guidance for the stakeholders to focus and understand the leverage level of the firm before taking any decision.
Research limitations and direction for further research External Validity is defined by (Saunders et al 2009) as the extent to which the research
results are generalizable, that is, whether the findings may be equally applicable to other
DAC = β0 + β1 FSIZE + β2 FLEV + β3 FAGE + β4 AUQUL + β5 FSUR + ε
Variables Coefficient Significance
Firm Size -.0242015 0.326
Firms' Financial Leverage .7404609 0.000
Firm Age -.0867313 0.790
Firms' Audit Quality -.1216824 0.232
Survival .1678682 0.043
Adjusted R Square = 0.1675 Model Significance (Prob>chi2) = 0.0000
Journal of Business and Retail Management Research (JBRMR), Vol. 10 Issue 3 July 2016
www.jbrmr.com A Journal of the Academy of Business and Retail Management (ABRM) 43
research settings, such as other organizations. Based on the above statement, this research faces several limitations.
First of all, this research showed the effect of only four independent variables constituting the firms' characteristics. Those are the most commonly used characteristics in the prior literature testing their effect on earnings management. So this could be a limitation as there might be other characteristics that can explain earnings management and raise the level of the adjusted R square. Another limitation is that the research is conducted only on a sample of the 50 most active firms listed in the Egyptian Stock Exchange (EGX). A third limitation is the inability to access all the needed data so this research is constrained only to the firms located in Egypt. Finally, the use of the disclosure book as a data source is considered a limitation as the last disclosure book issued is that of the year ending 2011.
Future research could consider other firm characteristics rather than those used in this study and other independent variables like corporate governance variables and cultural dimensions that might have a greater impact on the dependent variable (earnings management, measured by the discretionary accruals). It is highly recommended for future research to try linking the Egyptian cultural drivers suggested by the social psychologist Geert Hofstede, with the tendency to practice earnings management and to be applied to the Egyptian firms. References Abdul Rahman, R & Ali, F 2006, ‘Board, audit committee, culture and earnings management: Malaysian
evidence’, Managerial Auditing Journal, vol.21, no.7, pp.783-804
Ahmad, M & Anjum, T & Azeem, M 2014, ‘Investigating the impact of corporate governance on earning management in the presence of firm size; evidence from Pakistan’, International Interdisciplinary Research Journal, vol.3, no.2, pp. 84-90
Akhtaruddin, M 2005, ‘Corporate mandatory disclosure practices in Bangladesh’, the international journal of accounting, vol.40, no. 4, pp. 399-422
Alsaeed, K 2006, ‘the association between firm-specific characteristics and disclosure: The case of Saudi Arabia’, Journal of American Academy of Business, Cambridge, vol. 7, no. 1, pp. 310−321
Arrow, K 1962, ‘Economic implication of learning by doing’, Review of economic studies, vol. 29, no. 3, pp 155-173
Baltagi, B 2008, ’Econometric Analysis of Panel Data’, John Wiley & Sons Ltd Baltagi, B 2011, ‘Econometric Analysis of Panel Data’, 3rd, edn., Amitmse Barton, J & Simko, P 2002, ‘The balance sheet as an earnings management constraint’, the accounting review,
vol.77, pp. 1-27 Bartov, E & Gul, F & Tsui, J 2000, ‘Discretionary accruals models and audit qualifications’, Journal of
Accounting and economics, vol.3, no.3, pp 421-452 Baum, C 2001, ‘Residual diagnostics for cross-section time series regression models’, The Stata Journal, vol.
1, no.1, pp. 101-104 Beatty, A & Weber, J 2003), ‘The effects of debt-contracting on voluntary accounting method changes’, The
Accounting Review, vol.78, no.1, pp. 119-142 Becker, C & DeFond, M & Jiambalvo, J & Subramanyam K 1998, 'The Effect of Audit Quality on Earnings
Management', Contemporary Accounting Research, vol. 15. pp. 1-24. Blom, M 2009, ‘The effect of the implantation of IFRS on the level of earnings management’, Master thesis Bowen, R & Shores, D 1995, ' Stakeholders’ implicit claims and accounting method choice', Journal of
Accounting and Economics, vol.20, no.3, pp. 95-255
Brooks, C 2008, ‘Introductory Econometrics for Finance’, Cambridge University Press, 0521873061, 9780521873062
Bryman, A & Cramer, D 1997, ‘Quantitative data analysis with SPSS for windows: A guide for social scientists’, Rout ledge, London

Journal of Business and Retail Management Research (JBRMR), Vol. 10 Issue 3 July 2016
www.jbrmr.com A Journal of the Academy of Business and Retail Management (ABRM) 44
Chalaki, P & Didar, H & Riahnezhad, M 2012, 'Corporate Governance Attributes and Financial Reporting Quality: Empirical Evidence from Iran', International Journal of Business and Social Science, vol.3, no.15, pp. 223-229
Chen,X & Kong, D & Wang, Y 2014,’Audit firm size, earnings management and information asymmetry’, China accounting & finance review, vol.16, no.1, pp. 1-60
Chung, R & Firth, M & Kim, J 2005, ‘Earnings management, surplus free cash flow and external monitoring’, Journal of business research, vol.58, no.6, pp. 766-776
DeAngelo, L 1981, ‘Auditor size and audit quality’, Journal of Accounting and Economics, vol.3, no.3, pp. 183-199
earnings management in the Egyptian earnings management in the Egyptian Easton, P., Eddey, P & Trevor, H 1993, 'An investigation of revaluation of tangible long-lived assets',
Journal of Accounting Research, vol.31, no.1, pp. 1–38 Ericson, R & Pakes, A 1995, ‘Markov-perfect industry dynamics: a framework for empirical work’, The
Review of economic studies, vol. 62, no.1, pp. 53-82 Francis, J & Krishnan, J 1999. 'Accounting Accruals and Auditor Reporting Conservatism', Contemporary
Accounting Research. Vol.16, pp. 135-165. Fung, S & Goodwin, J 2013, ’Short term debt maturity, monitoring and accruals- based earnings
management’, Journal of contemporary accounting and economics, vol.9, no.1, pp. 67-82. Goncharov, I 2005, ‘Earnings Management and its Determinants: Closing Gaps in Empirical Accounting
Research’, Peter Lang Greene, H 2008, ‘Econometric Analysis’, 6th edn, Upper Saddle River, NJ: Prentice Hall. Gul, F & Leung, S & Srinindhi, B 2003, ‘Informative and Opportunistic Earnings Management and the
Value Relevance of Earnings: Some Evidence on the Role of IOS’, Available at SSRN 429800 Hassan, H 2008, 'The international accounting standards…Where do we stand?', The Executive, April-
June: 28-29. Ho, R 2006, ‘Handbook of univariate and multivariate data analysis and interpretation with spss, Boca
raton- Florida’, chapman and hall/ CRC-Taylor & Francis group Jensen, M & Meckling, W 1976, ‘Theory of the firm: managerial behavior, agency costs and ownership
structure’, Journal of financial economics, vol.3, no.4, pp. 305-360 Jensen, M 1986, ‘The takeover controversy: Analysis and evidence’, Midland Corporate Finance Journal,
vol.4, no.2, pp. 6-32. Jones, J 1991, ‘Earnings management during import relief investigations’, Journal of Accounting Research,
vol.29, no.2, pp.193-228 Jones, S & Frost, G & Loftus, J & Van S 2005, ‘Sustainability reporting practices, performance and
potential’, CPA Australia, 978-1-921742-42-2 Kamel, H. & Elbanna, S 2010, ‘Assessing the perceptions of the quality of reported earnings in Egypt’,
Managerial Auditing Journal, vol. 25, no. 1, pp. 32-52. Khalil, M 2010, ‘Earnings Management, Agency Costs and Corporate Governance: Evidence from Egypt’,
Thesis submitted for the degree of Doctor of Philosophy Kim, H & Yoon, S 2009, ‘Firm Characteristics and Earnings Management of Different Types of Security
Issuers’, Available at SSRN 1325952 Kim, Y & Liv, C & Rhee, S 2003, ‘The effect of firm size on Earnings management, working paper Kohler, U & Kreuter, F 2012, ‘Data Analysis Using Stata’, 2nd edn. PP.24, 978-1-59718-110-5
Lenard, M & Yu, B 2012, ‘Do Earnings Management and Audit Quality Influence Over-Investment by Chinese Companies?’, International Journal of Economics and Finance, vol.4, no.2, pp. 21-30.
Meek, K & Roa, P & Skousen, J 2007, ‘Evidence on factors affecting the relationship between CEO Stock option compensation and earnings management’, Review of accounting and finance, vol. 6, no. 3, pp. 304-323
Metawee, A 2013, ‘the relationship between characteristics of audit committee, board of directors and level of earning management: Evidence from Egypt’, Journal of International Business and Finance, Plymouth Business School, UK

Journal of Business and Retail Management Research (JBRMR), Vol. 10 Issue 3 July 2016
www.jbrmr.com A Journal of the Academy of Business and Retail Management (ABRM) 45
Munzig, P 2003, 'Enron and the economics of corporate governance', Dep. of Economics Stanford University CA, pp.94305-96072.
Pieters, J (2016, March 24). NETHERLANDS AUTHORITY FINES BIG FOUR ACCOUNTING FIRMS. The NL Times. Retrieved from http://www.nltimes.nl/2016/03/24/netherlands-authority-fines-big-four-accounting-firms/
Pintea, M & Stanca, L & Achim, S & Pop, I 2014, ‘Is There a Connection Among Environmental and Financial Performance of a Company in Developing Countries? Evidence from Romania’, Procedia Economics and Finance, vol. 15, pp. 822 – 82
Piot, C & Janin, R. 2007, ‘External auditors, audit committees and earnings management in France’, European accounting review, vol.16, no. 2, pp. 429-454
Prior, D & Surroca, J & Tribo, J 2008, ‘Are socially responsible managers really ethical? Exploring the relationship between earnings management and corporate social responsibility’, corporate governance: An international review, vol.16, no.3, pp. 160-177
Raab, M 1986, 'Detecting and Preventing Financial Statement Fraud: The Roles of the Reporting Company and the Independent Auditor', Yale Law & Policy Review, Vol. 5, no. 2, pp.514-535
Roland, D (2013, February 22). Big Four deny acting against shareholders. The Telegraph. Retrieved from http://www.telegraph.co.uk/finance/newsbysector/banksandfinance/9887648/Big-Four-deny-acting-against-shareholders.html
Rusmin, R 2010, ‘Auditor quality and earnings management: Singapore evidence’, Managerial Auditing
Journal, vol.25, no.7, pp. 618-638 Salleh, N & Haat, M 2014, ‘Audit committee and earnings management: pre and post MCCG’, International
review of management and business research, vol. 3, no. 1, pp. 307-318 Saunders, M & Lewis, P & Thornhill, A 2009, Research methods for business students, Pearson, 978-0-273-
71686-0 Shah, S & Butt, S 2009, ‘Governance and Earnings Management an Empirical: Evidence Form Pakistani
Listed Companies, European Journal of Scientific Research, vol.26, no.4, pp. 624-638
Shah, S & Zafar, N & Durrani, T 2009, ‘Board composition and earnings management an empirical evidence from Pakistani listed companies’, Middle eastern finance and economics, vol.3, no.29, pp. 30-44
Soliman, M & Ragab, A 2014, ‘Audit Committee Effectiveness, Audit Quality and Earnings Management: An Empirical Study of the Listed Companies in Egypt’, Research Journal of Finance and Accounting, vol.5, no.2, pp. 155 – 166.
Soliman, M 2013, ‘Firm Characteristics and the Extent of Voluntary Disclosure: The Case of Egypt’, Research Journal of Finance and Accounting, vol.4, no.17, pp. 71-80
stock market Toffler, B 2004, ' Final Accounting: Ambition, Greed and the fall of Arthur Andersen', 978-0-767-91383-6 Uwuigbe, U & Ranti, O & Bernard, O 2015, ‘Assessment of the effects of firms’ characteristics on earnings
management of listed firms in Nigeria’, Asian economic and financial review, vol.5, no.2, pp. 218-228. Watts, R & Zimmerman, J 1978, ‘Towards a positive theory of the determination of accounting standards’,
the accounting review, vol. 53, no. 1, pp. 112-134
Watts, R & Zimmerman, J 1983, ‘Agency Problems, Auditing, and the Theory of the Firm: Some Evidence’, Journal of Law and Economics, vol.26, no.3, pp. 613-633
Waweru, N & Riro, G 2013, ‘Corporate governance, firm characteristics and earnings management in an emerging economy’, Jamar, vol.11, no.1, pp.43-64
Weber, J 2006, ‘Discussion of the effects of corporate governance on firm's credit rating’, Journal of accounting and economics, vol.42, no.1, pp. 245-254
Yasar, A 2013, ‘Big four auditor's audit quality and earnings management: Evidence from Turkish stock market’, International journal of business and social science, vol. 4, no. 17, pp. 153-163

Journal of Business and Retail Management Research (JBRMR), Vol. 10 Issue 3 July 2016
www.jbrmr.com A Journal of the Academy of Business and Retail Management (ABRM) 46
The applicability of technology acceptance models in the Arab business setting
Dima Dajani Saad G. Yaseen
Al-Zaytoonah University of Jordan, Jordan
Keywords Technology Acceptance Models, Information Technology, Arab Business Settings.
Abstract Information Technology acceptance is one of the most advanced streams of Information
Systems Research (Venkatesh et al., 2012; Venkatesh and Bala, 2008). Research work indicates that the most important strength of Technology Acceptance Models is their generalizability and applicability across a wide range of technologies and settings. However, the literature lacks research that explains technology adoption and use in developing countries; specifically the Arab business settings. Therefore, the aim of this paper is to review the most recent work on Technology Acceptance Models examined in Arab organizations. It highlights different drivers and impediments to the adoption decision of different information technologies in Arab businesses. The study outcome holds implications and provides recommendations for future research.
1. Introduction The impact of Davis' original work of the Technology Acceptance Model (TAM) and the
extensive technology acceptance research that has followed it stresses the importance of this topic the last two decades. By any measures, TAM has qualified as a remarkable accomplishment, even reaching the status of a paradigm (Bagozzi, 2007). The number of citations of Davis' et al. (1989) alone accounts for more than 1000 citations (Venkatesh et al., 2011). As a result, TAM has been used as a leading model or as an extended applied model in various business contexts (Kouforis, 2003; Hong et al., 2006; Martins et al., 2014). Most of these studies replicated TAM while some of them extended TAM by adding new constructs as predictors of behavior intention to use specific systems. However, TAM has been widely criticized for its questionable heuristic value and limited predictive power (Riffai et al., 2012; Benbasat & Barki, 2007; Bagozzi, 2007).
According to the original model, a potential user's overall attitude towards using a given system is hypothesized to be a major determinant of whether or not he/she actually uses it. The attitude towards using, in turn, is a function of two major beliefs: Perceived usefulness and perceived ease of use. External variables are not theorized to have any direct effect on attitude or behavior (Davis, 1986). However, the final conceptualization of TAM excluded the attitude variable in order to better explain behavioral intention to accept Information Technology.
The intensive use of Technology Acceptance Models attracts the efforts of numerous researchers to illustrate model validity and to conduct systematic meta-analysis approaches. As a result, research work indicates that the most important strength of Technology Acceptance Models has been their generalizability across a wide range of technologies and settings. However, most of the Technology Acceptance Models have been extensively tested in the developed countries. The literature lacks technology models that explain technology adoption, acceptance and usage in the developing countries. More specifically, the literature lacks technology models that explain determinants of technology acceptance in the Arab business settings.
Journal of Business and Retail Management Research (JBRMR), Vol. 10 Issue 3 July 2016
www.jbrmr.com A Journal of the Academy of Business and Retail Management (ABRM) 47
Nowadays the world is experiencing a massive growth and acceleration in the
emergence and development of technologies in various fields. This encourages researchers to investigate the technology acceptance and use universally. However, despite the increased growth of technology adoption and use in developed countries, Arab organizations are still classified as late adopters of IT applications (Yaseen, 2008, Al-Sukkar and Hasan, 2005; Abu Shanab et al., 2010). Unfortunately, the literature indicates a limited number of research that examines the use of technologies in Arab organizations (Al-Sukkar and Hasan, 2005; Akour et al., 2005; Dajani, 2011). Thus, the purpose of this research is to develop a rich understanding of the applicability of the Technology Acceptance Models in the Arab business setting and to specify determinants that influence IT acceptance and use in the Arab World. The paper aims to review the most recent efforts on technology acceptance in Arab business settings.
2. Literature review 2.1 Overview of technology acceptance models
Technology Acceptance Models evolved from multidisciplinary fields of knowledge such as psychology, sociology, business and management information systems. Research on the social psychology of IT acceptance and use has been productive compared to other research approaches. Social psychology suggests behavioral intention models as a potential theoretical platform for IT acceptance research. The Theory of Reasoned Action (TRA) (Ajzen & Fishbein, 1980; Fishbein & Ajzen, 1975) is a widely studied model from social psychology based on the assumption that a person's intention to perform or not perform a behavior is the immediate determinant of that action. It is a predictive model for behavior attitude and behavioral intention.
Barring unforeseen events, people are expected to act in accordance with their intentions (Ajzen, 1991). According to the TRA, an individual intention is a function of two determinants: The individual’s positive or negative attitude towards a specific behavior and an individual's perception of social pressures (subjective norms) to perform the behavior. According to Fishbein and Ajzen (1975), a behavioral intention predicts the user's performance or action unless the intention measure does not meet the behavioral criterion. TRA theory has received considerable attention within the field of business and consumer behavior for its capability to predict the performance of any voluntary act unless intention changes prior to performance or the intention measure does not correspond to the behavioral criterion (Sheppard et al., 1988).
The Theory of Planned Behavior (TPB) is an extension of the Theory of Reasoned Action (Ajzen and Fishbein, 1980). Ajzen (1991) incorporates perceived behavioral control together with behavioral intention to overcome TRA limitation. TPB postulates three conceptual constructs: Attitude towards behavior, subjective norm (perceived social pressure), and perceived behavioral control. According to the TPB, perceived behavioral control refers to the perceived ease or difficulty of performing the behavior and it is assumed to reflect past experiences as well as anticipated obstacles (Ajzen, 1991). Thus, both TAM and TPB models are based on TRA, which proposes that beliefs influence attitudes that in turn lead to intentions and then consequently generate behaviors (Fishbein and Ajzen, 1975; Martins et al., 2013). The Technology Acceptance Model (TAM) introduced by Davis (1986) is an adoption of the TRA model (Fishbein and Ajzen, 1975). Davis (1986) adopted the TRA model as the reference paradigm within which the proposed Technology Acceptance Model is developed (Davis, 1986). The TAM suggests that beliefs, attitudes and intention-behavior explained and predicted technology acceptance among potential users.
Journal of Business and Retail Management Research (JBRMR), Vol. 10 Issue 3 July 2016
www.jbrmr.com A Journal of the Academy of Business and Retail Management (ABRM) 48
TAM posits that two particular beliefs, the perceived usefulness (PU) and the perceived ease of use (PEOU) are major determinants of the user's intention to use IT (Davis et al., 1989). It further theorizes that the influence of external variables will be mediated by Perceived Usefulness (PU) and Perceived Ease of Use (PEOU). However, over the last two decades there has been substantial empirical research supporting TAM (e.g. Adams, et al., 1992; Davis, 1993; Davis & Venkatesh, 2004; Davis et al., 1989; Straub et al., 1997; Venkatesh and Davis, 2000; Venkatesh et al., 2003;Venkatesh and Bala, 2008). Most of the studies that have been using TAM as a reference paradigm focus either on the same TAM constructs or extended TAM by adding new predictive constructs (e.g., Venkatesh et al., 2003; Venkatesh and Bala, 2008).
Venkatesh and Davis (2000) proposed TAM 2 as an extended model of TAM. They identified new determinants of perceived usefulness. These constructs were subjective norm, image, job relevance, output quality, result demonstrability and perceived ease of use. In addition to the two moderators: experience and voluntariness. As a result, they found strong support for TAM 2 in their longitudinal research conducted at four organizations in developed countries.
In a further study, Venkatesh (2000) developed a model of the determinants of perceived ease of use and integrated these determinants with TAM 2. His work resulted in a new model called TAM 3. (TAM 3) is an extension of TAM 2 by identifying and theorizing determinants of perceived ease of use constructs namely; Computer Self-efficacy, Perception of External Control, Computer Anxiety, Computer Playfulness, Perceived Enjoyment, and Objective Usability (Venkatesh, 2000). TAM 3 suggests a complete nomological network of the determinants of IT acceptance and use at the individual adoption level (Venkatesh and Bala, 2008).
Furthermore, Venkatesh et al., (2003) suggested a comprehensive synthesis of eight prominent theories of technology acceptance and derived a unified theory of acceptance and use of Technology (UTAUT). The eight models studied by Venkatesh et al., (2003) were the TRA, the TAM, the Motivational model, the TPB, the Combined TAM with TPB, the Model of PC Utilization, the Innovation Diffusion Theory and the Social Cognitive Theory. In a longitudinal research, the UTAUT explained about 70 percent of the variance in behavioral intention to use a technology and about 50 percent of the variance in technology use (Venkatesh et al., 2003). The UTAUT contains four core constructs: Performance Expectancy (synonymous with perceived usefulness), Effort Expectancy (synonymous with perceived ease of use), Social Influence and Facilitating Conditions each capture user expectation about other significant aspects related to IT use (Venkatesh et al., 2003).
The generalizability of the belief constructs in the UTAUT has been demonstrated by a number of studies on the adoption of different IT systems and tools, either in a business or none-business setting (Venkatesh et. al., 2011). However, it is worth noting that most researchers have only studied a subset of the UTAUT constructs. The addition of new constructs could have been helpful to expand the theoretical horizons of the UTAUT (Venkatesh et al., 2012).
The strong generalizability of UTAUT leads to some kind of replications with no substantive theoretical advance in the research paradigm. However, Venkatesh et al., (2012) extended the UTAUT to study users’ IT acceptance in consumers' context. The new model is called the UTAUT2 and it incorporates three constructs: Hedonic Motivation, Price Value and Habit (Venkatesh et al., 2012). The UTAUT2 extended the generalizability of the UTAUT from an employee and organizations setting to a consumer context. Prior research has investigated technology acceptance and use in organizational contexts.
It should be noted that each of the original models of technology acceptance has its own advantages with some limitations. For example, the Theory of Reasoned Action is a widely

Journal of Business and Retail Management Research (JBRMR), Vol. 10 Issue 3 July 2016
www.jbrmr.com A Journal of the Academy of Business and Retail Management (ABRM) 49
studied model of social psychology. However, TRA is a general model and, as such, it does not specify the beliefs that are operated for a specific human behavior. The Technology Acceptance Model (TAM) qualifies as a remarkable research paradigm. The stream of research in this original model is impressive in its volume and scope as TAM has been the leading model for nearly two decades (Bagozzi, 2007). However, the behavioral intention of users to accept a specific IT system is more frequently measured than the actual use of the system. Thus, there is a question if the TAM can act as an accurate predictor of the user's intention rather than actual usage. In addition, TAM makes no attempt to incorporate the effect of the social environment on the behavior intention.
Furthermore, the research findings in the literature revealed that the UTAUT constructs were affected by many external determinants across different researches conducted in different environmental settings. This is a relatively surprising result as the UTAUT denoted to be a unified theory created by mapping together various variables from eight well-established models. Thus, there is a need to carry-out rigorous tests of the UTAUT in different contexts and cultures. This is due to the inconsistent findings among the empirical studies testing the UTAUT model (Al-Gahtani et al., 2007; Dajani, 2011). The literature also indicated the scarce application of the UTAUT in the context of the Arab World.
2.2 Technology acceptance models in the Arab business setting It is widely acknowledged that organizations in the Arab World are late adopters of the
Internet and its applications (Sabri, 2004; Yaseen, 2005; Yaseen, 2008). Despite the increased percentage of Internet use, recent studies on IT adoption indicate that Arabs are still reluctant to use and accept IT for various economic and cultural reasons. (Abu Shanab et al., 2010, Al Sukkar and Hasan, 2005; Akour et al., 2005). Thus, it is necessary to understand the factors that affect the adoption of the IT in the Arab World.
Several methods were used to investigate the effect of culture on the acceptance of technology in organizations. Researchers applied the quantitative methodology to find out and measure national cultural dimensions such as the work of Triandis (1982), Hofstedes and Hofstedes cultural dimensions (2005) and Straub's (2002) social identity theory. The most frequently used cultural dimensions were the ones introduced by Hofstede (1980, 2001). These cultural dimensions affected the managerial values and human behavior in different cultures (Al-Ghatani et al., 2007)
Rose and Straub (1998) investigated the adoption and use of IT in five Arab countries (Egypt, Sudan, Jordan, Saudi Arabia and Lebanon). They applied the TAM model to assess the diffusion of PC and the modified model explained 40 percent of the actual use. In a further study, Straub et al., (2001) introduced a cultural influence model of IT in their research on Arab countries. Their results indicated that Arab culture and beliefs affect the acceptance and use of IT. In addition, Tingari and Mahmoud (2014) discussed the evolution and the adoption of mobile banking in Sudan. Their study indicated that the banking sector lacks efficient infrastructure and the responsible parties are not aware of the importance of e-banking.
Furthermore, Loch et al., (2003) used TAM to identify cultural factors that affect Internet use in Arab countries. They indicated that social norms and the degree of technological acculturation can affect the organizational adoption of the Internet. This indicates that certain Arab countries are very similar in their culture and beliefs. The Technology Acceptance Models were used in different contexts in the Arab business setting. Arab countries almost encounter and experience the same challenges and opportunities in their technology adoption (Dajani, 2016). Table (1) illustrates prior research on the Technology Acceptance Models and their applications in the Arab World.

Journal of Business and Retail Management Research (JBRMR), Vol. 10 Issue 3 July 2016
www.jbrmr.com A Journal of the Academy of Business and Retail Management (ABRM) 50
Technology Acceptance Model
New Constructs
Context Notable Results Moderators References
UTAUT Website Quality
Perception
Internet banking in Jordan and
the UK
The extended UTAUT model is applicable to a non-Western
nation with varying degrees of exploratory power
Gender, Age, Income,
Education Al-Qeisi (2009)
UTAUT - Internet
banking in Jordan
Performance expectancy, effort expectancy, and social influence
were significant in predicting customers’ intention to adopt
Internet banking
UTAUT Moderators:
Gender moderated
relationships between the
three independent
variables and the dependent
Abu Shanab & Pearson (2007)
Extended TAM and IDT
Relative Advantage
Compatibility
e-marketing adoption in
Egypt; Egyptian
small tourism
organization
Culture, organization size, e-marketing adoption, cost,
perceived ease of use are the most important factors on the adoption compatibility and
relative advantage
- El-Gohary,
2012
Revised TAM
Attitudinal intentions,
trust, subjective norms, and perceived
manageability
Internet banking
acceptance in Saudi Arabia
Perceived usefulness and trust fully mediate the impact of
subjective norms and perceived manageability on attitudinal
intentions
- AlSajjan, &
Dennis, 2010
Extended TAM -
Adoption of electronic
health record systems in
Jordan
Perceived threat, social influence, computer self-efficacy, usability, culture
organizational support and professional issues
- Al-Adwan,
2014
UTAUT Competition and external
pressure
e-commerce adoption by Jordanian
travel agents
Adapted UTAUT can also explain e-commerce acceptance
and use of travel agents
Only effort expectancy was moderated by
gender. Age did not moderate the
relationship between social
influence and BI, Gender
moderated this relation
Aldajani, 2011
UTAUT
Cultural and social
influences, technical issues
Adoption of e-
government in Kuwait
Usefulness, ease of use, reforming bureaucracy, culture and social influences technology
issues and lack of awareness
Gender Al Awadhi & Morris, 2009
UTAUT Subjective
norm
Adoption of IT in Saudi
Arabia
Subjective norm positively influences intention
Gender, age, eexperiences
Al-Gahtani et al., 2007
TAM and TPB
Security and privacy, self-
efficacy, government
support, technology
support
Adoption of Internet
banking in Tunisia
The results confirmed with the original TAM. Social norm has significant effect on intention.
Security and privacy have positive influence on intention
- Nasri, &
Charfeddin, 2012
UTAUT
Trust, awareness of
service, output quality,
perceived
Online banking
adoption in Oman
All constructs contributed to explain intention and use of online banking except social influence moderating effects
from UTAUT were not
- Riffaie, et al.,
2012

Journal of Business and Retail Management Research (JBRMR), Vol. 10 Issue 3 July 2016
www.jbrmr.com A Journal of the Academy of Business and Retail Management (ABRM) 51
playfulness, web design
important to explain intention
TAM2 -
Camera mobile
adoption before e-
shopping in the Arab World
TAM2 provides limited results. The intention to use CMP is only determined by subjective norms,
case of use and camera usefulness
- Rouibah et al.,
2011
TAM
Quality of the Internet
connection, self-efficacy, awareness of
services, social influence,
resistance to change , and
trust
Online banking in
Saudi Arabia
Qualities of the Internet connection, awareness of
services, social influence and self-efficacy have significant
effects on the perceived usefulness and perceived ease of
use. Education, trust and resistance to change also have
significance on the attitude 12.4% of intention explained by the model. Perceived usefulness
and perceived ease of use, resistance to change, trust, age, gender, education and income explained 85% of the variance towards online banking use.
Attitude towards use explains 83% of the variance in intention.
- Al-Somali et al.,
2009
TAM Trust, national
culture
Adoption of e-
government services in
Jordan
Citizens’ attitude towards using e-government services is the
strongest determinant of citizen intention to use e-government services. The attitude construct
is in turn determined by perceived public value and
perceived ease of use.
- Al-Hujran et
al., 2015
Table (1): Review of Technology Acceptance in the Arab World Furthermore, it is critical to highlight the vital role of the social media use in the Arab
Spring. The use of Tweets and posts in twitter were utilized during the Arab Spring uprisings in Egypt, Tunisia, Bahrain and Libya. The use of social media in these series of events affects the region and the entire world. The social media was used to organize and sustain protests by clicks from local participants and foreign members. Consequently, the government of some Arab countries, such as Egypt shut down access to the Internet (Halverson et al., 2013; Tufekci and Wilson, 2012; Aday et al., 2012).
Further studies discussed the role of technology acceptance and use in the crisis management of Arab Spring societies. Yaseen (2014) aimed to develop a conceptual framework to investigate the determinants of mobile crowdsourcing acceptance and use in the crisis management of Arab Spring societies. The extended model (UTAUT2) incorporated five dimensions (performance expectancy, effort expectancy, subjective norms, hedonic motivations and cultural values) to investigate the acceptance of crowdsourcing in Arab World.
3. Discussion, implications, and future research It is apparent from the review of literature that most research papers used major theories;
namely; Theory of Reasoned Action, Theory of Planned Behavior and Technology Acceptance Model. The most frequently cited models were the TAM, and the Unified Theory of Acceptance and Use of Technology (Venkatesh et al., 2003). For example, Dajani’s (2011) study indicated that the adopted Unified Theory of Acceptance and Use of Technology (UTAUT) which was originally tested in the developed countries can also explain e-commerce acceptance and use of

Journal of Business and Retail Management Research (JBRMR), Vol. 10 Issue 3 July 2016
www.jbrmr.com A Journal of the Academy of Business and Retail Management (ABRM) 52
travel agents in Jordan. Al-Qeisi (2009) proposed an extended UTAUT and tested the model in two countries (UK and Jordan) to investigate the viability of the model in different settings. Results found support for the effect of the proposed extension and website quality perceptions on the behavior intention to use Internet banking.
Furthermore, Al-Adwan, (2014) used an extended TAM to understand physicians' adoption of electronic health record systems in Jordan. The results indicated that the proposed research framework provided acceptable power as it explained 64.5 percent of the variance in the physicians' behavioral intention. Al Sajjan & Dennis (2008) argued a revised TAM to measure consumers' acceptance of Internet banking among 618 university students in the United Kingdom and Saudi Arabia.
The results suggested the importance of attitude, such that attitude and behavioral intentions emerge as a single factor, denoted as attitudinal intentions (AI). Structural equation modeling confirms the fit of the model in which perceived usefulness and trust fully mediate the impact of subjective norms and perceived manageability on attitudinal intention.
In a further study, El-Gohary (2012) analyzed the different factors affecting the adoption of e-marketing by Egyptian small tourism organizations. The findings confirmed that the TAM and the Innovation Diffusion Theory (IDT) are valid in illustrating e-marketing adoption by Egyptian tourism organizations. As a result, Technology Acceptance Model has been tested for decades with different technologies in Arab business settings and has been accepted as a successful model in predicting and explaining technology acceptance and use in the Arab World. Furthermore, based on the integration between the TAM and the TPB models, Nasri and Charfeddine (2012) examined factors affecting the adoption of Internet banking in Tunisia. The results of their study validated the original TAM. Their research findings revealed that social norms, security and privacy had significant effect on intention.
Most of the reviewed research replicated Technology Acceptance Models and other extended original models by adding constructs as determinants of the behavior intention. The majority of this research contributed to literature on the basis of context-only, or methodology extension only. This research examined the acceptance of new technologies in different Arab organizations and used almost the same constructs that were used in examining technology acceptance in developed nations. This is a critical issue because using translated constructs and measures does not always reveal the same meaning as the original ones (Lin et al., 2008). This is due to cultural differences between the countries in which the measures were originated and tested It is apparent from the literature that most of the research that examined the Technology Acceptance Models avoided the integration of cultural values and beliefs. Cultural issues were included in explaining the results of some of this research, such as Al Awadi and Morris (2009) and Dajani (2011) but not examined solely as determinant of technology adoption.
From a methodological perspective, most of the research using TAM and UTAUT in the Arab World did not consider the specific cultural characteristics of the Arab society. However, some of the researchers who did consider the effect of culture on technology acceptance used Hofstede's cultural dimensions which have received some criticisms such as the work of Al-Ghatani et al., (2007), Straub et al., (1997) and Bandyopadhyay and Fraccastoro (2007).
Furthermore, the literature indicated the scarce application of the UTAUT in the context of the Arab World with the exception of the research conducted by Riffaie et al., (2012); Al-Gahatani et al., (2007); Al Awadhi & Morris (2009); Dajani (2011), and Abu Shanab and Pearson (2007). Most of the Technology Acceptance Models have been extensively tested in developed countries. More specifically, the literature lacks technology models that explain technology acceptance in the Arab World. Furthermore, the review of literature indicates that there is a

Journal of Business and Retail Management Research (JBRMR), Vol. 10 Issue 3 July 2016
www.jbrmr.com A Journal of the Academy of Business and Retail Management (ABRM) 53
limited number of studies that test Technology Acceptance Models such as TAM and UTAUT in specific countries (Jordan, Egypt and Kuwait). This implies that additional investigation must be carried out to ensure applicability and robustness of Technology Acceptance Models in the Arab World. The previous discussion suggests that there is a need to carry out rigorous testing of Technology Acceptance Models in different contexts and different Arab cultures. That is because despite the fact that empirical studies applying Technology Acceptance Models have mainly supported the original TAM and UTAUT models, there are inconsistent findings due to the technology being investigated, the methodology of data analyses and the local culture of a specific Arab country.
Little research has examined the role of gender and age in Arab countries. More specifically, future research needs to focus on the interaction between these two demographic variables. This implies that future research may concentrate on identifying the exact age where effects start to appear for certain constructs, such as effort expectancy, or disappear for other constructs, such as performance expectancy. Further studies should also investigate the role of income, gender, age and experience in adopting information technologies in Arab countries.
The majority of Technology Acceptance Models used the behavior intention construct as the decisive factor in explaining use of technologies. Future research should investigate the role of other constructs such as habit (Venkatesh et al., 2000), hedonic motivation (Venkatesh et al., 2012) and behavioral expectations (Warshaw and Davis, 1985). Moreover, further research should consider the effect of good task technology fit, or emphasis should be on the interaction between IT perception and task technology fit within different Arab work settings.
4. Conclusion Although several previous studies have investigated IT adoption and use, there has been
limited research conducted in the Arab World setting. Most research papers have not fully taken into consideration the richness of Arabic cultural values and their vital impact on IT adoption and acceptance. There is a clear need for more cultural oriented research applications in the Arab business context. If the cultural perspective is lost, it is difficult to restore understanding and meaning of the IT adoption and use. Additional avenues for future research might overcome the limitations of the Technology Acceptance Models tested in the Arab World. Transference of the western scales to the Arab context is problematic. As such, further qualitative research is needed to provide greater insights into the intricacies of technology adoption in the Arab business setting. Researchers need to develop new scales for technology adoption in the Arab World taking into consideration the effect of cultural values. Perhaps future research in this field should concentrate on comparative studies between Arab organizations and western organizations.
5. References Abu Shanab E. and Pearson J. M., (2007). Internet Banking in Jordan: The Unified theory of Acceptance and
Use of Technology (UTAUT) Perspective, Journal of Systems and Information Technology, Vol. 9, No. 1.
Abu Shanab, E. et al., (2010). Internet Banking and Customers' Acceptance in Jordan: The Unified Model's Perspective. Communications of the Association for Information Systems 26 (23): 493-524.
Adams, D.A., Nelson, R.R. & Todd, P.A., (1992). Perceived Usefulness, Ease of Use, and Usage of Information, MIS Quarterly, 16 (2).
Aday, Sean. et al., (2012). Blogs and Bullets II: New Media and Conflict after the Arab Spring. U.S. Institute For Peace.
Ajzen, I., (1991). The Theory of Planned Behavior, Organizational Behavioral Human Decision Processes, 50: 179-211.

Journal of Business and Retail Management Research (JBRMR), Vol. 10 Issue 3 July 2016
www.jbrmr.com A Journal of the Academy of Business and Retail Management (ABRM) 54
Ajzen, I. and Fishbein M., (1980). Understanding Attitudes and Predicting Social Behvior, Prentice-Hall. Englewood Cliffs, NJ: Prentice-Hall.
Akour, I. et al., (2005). An Exploratory Analysis of Culture, Perceived Ease of Use, Perceived Usefulness, and Internet Acceptance: The Case of Jordan. Journal of Internet Commerce 5(3): 83-108.
AlAwadhi S. and Morris, A., (2009). Factors Influencing the Adoption of E-government Services, Journal of Software, Vol. 4, No. 6.
Al-Gahtani, S.S. Hubona, G.S. and Wang, J., (2007). Information Technology (IT) in Saudi Arabia: Culture and the Acceptance and Use of IT, Information & Management, 44: 4.
AlHujran, O. et al., (2015). The Imperative of Influencing Citizen Attitude Toward e-government Adoption and Use, Computers in human Behavior. Vol.53:189-203.
Al Sukkar, A. and Hasan, H., (2005). Toward a Model for the Acceptance of Internet Banking in Developing Countries, Information Technology for Development 11(4).
Al-Adwan, A. S., (2014). Understanding Physicians’ Adoption of Electronic Health Record Systems: An Extended Technology Acceptance Model, The Case of Jordan, PhD Thesis, Cardiff Metropolitan University.
Al-Qeisi, K., (2009). Analyzing the Use of UTAUT Model in Explaining and Online Behavior: Internet Banking Adoption, Ph.D. thesis, Brunel University, UK.
AlSajjan, B. and Dennis, C., (2010). Internet Banking Acceptance Model: Cross-Market Examination, Journal of Business Research 63.
Al-Somali S. Gholami, R. and Ben C., (2009). An Investigation into the Acceptance of Online Banking in Saudi Arabia, Technovation 29.
Bagozzi, Richard P., (2007). The Legacy of the Technology Acceptance Model and Proposal for a Paradigm Shift, Journal of the Association for Information Systems, Vol. 8, Issue, 4.
Bandyopadhyay, K. and Fraccastoro, K., (2007). The Effect of Culture on User Acceptance of Information Technology. Communication of the Association for Information Systems 19.
Benbasat, I., and Barki, H. (2007). Quo vadis, TAM? Journal of the AIS, 8:4. Dajani, D., (2011). A Critical Analysis of E-Commerce Use by Jordanian Travel Agents, Ph.D. thesis,
University of Leeds, UK. Dajani, D., (2016). Using the Unified Theory of Acceptance and Use of Technology to Explain E-Commerce
Acceptance by Jordanian Travel Agencies. Journal of Comparative International Management 19 (1): 121-141.
Davis, F. D., (1986). A Technology Acceptance Model for Empirically Testing New End-User Information Systems: Theory and Results. Doctoral Dissertation, MIT Sloan School of Management, Cambridge, MA.
Davis, F. D., (1989). Perceived Usefulness, Perceived Ease of Use, and User Acceptance, MIS Quarterly, 13 (3). Davis, F. D., (1993). User Acceptance of Information Technology: Systems Characteristics, User Perceptions and
Behavioral Impacts International Journal of Man-Machine Studies, 38 (3).
Davis, F. D. and Venkatesh, V., (2004). Toward Preprototype User Acceptance Testing of New Information Systems: Implications for Software Projects Management, IEEE Transactions on Engineering Management, 51: 1.
Davis, F. D. Bagozzi. R. P. and Warshaw , R., (1989). Users Acceptance of Computer Technology: A Comparison of Two Theoretical Models, Manage. Sci., Vol. 35.
El-Gohary, H., (2012). Factors Affecting E-Marketing Adoption and Implementation in Tourism Firms: An Empirical Investigation of Egyptian Small Tourism Organizations, Tourism Management 33.
Fishbein, m. & Azjen. I., (1975). Belief, Attitude, Intention and Behavior. Reading, MA. Addison-Wesley. Halverson, J. Ruston, S. Trethewey, A., (2013). Mediated Martyrs of The Arab Spring: New Media, Civil
Religion, and Narrative in Tunisia and Egypt. Journal of Communication, 63(2): 312-332. Hofstede, G., (1980). Culture's Consequences: International Differences in Work Related Values. Beverly
Hills, CA: Sage. Hofstede, G., (2001). Culture's Consequences: Comparing Values, Behaviours, Institutions and
Organizations across Nations. Newbury Park, CA:Sage.

Journal of Business and Retail Management Research (JBRMR), Vol. 10 Issue 3 July 2016
www.jbrmr.com A Journal of the Academy of Business and Retail Management (ABRM) 55
Hofstede,G. and Hofstede, J., (2005). Cultures and Organizations Software of the Mind. New York: McGraw-Hill.
Hong, S.J., Thong J.Y. L., and Tamm K.Y. (2006). Understanding Continued Information Technology Usage Behavior: A Comparison of Three Models in the Context of Mobile Internet, Decision Support Systems, Vol. 42, No. 3.
Koufaris, M., (2003) Applying the Technology Acceptance Model and Flow Theory to Online Consumer Behavior, Information Systems Research, vol. 13, No.2.
Loch, K. Straub, D. and Kamel, S., (2003). Diffusing the Internet in the Arab World: The Role of Social Norms and Technological Culturation. IEEE Transactions on Engineering Management 50:45-63.
Lin, C.P. and Bhattacherjee, A., (2008). Elucidating Individual Intention to Use Interactive Information Technologies: The Role of Network Externalities. International Journal of Electronic Commerce 13(1):85-108.
Martins, C., Tiago, O. and Popovic, A., (2014). Understanding the Internet Banking Adoption: A Unified Theory of Acceptance and Use of Technology and Perceived Risk Application, International Journal of
Information Management, 34(1): 1-13.
Nasri Wadie & Charfeddine L., (2012). Factors Affecting the Adoption of Internet Banking in Tunisia: An Integration Theory of Acceptance Model and Theory of Planned Behavior, Journal of High Technology Management Research, 23.
Riffai M. M. A., Kevin, G. and David Edgar (2012). Big TAM in Oman: Exploring the Promise of On-line Banking, its Adoption by Customers and the Challenges of Banking in Oman, International Journal of Information Management, 32.
Rose, G. and Straub, D., (1998). Predicting General IT Use: Applying TAM to the Arab World, Journal of
Global Information Management 6, 39-46.
Rouibah Kamel, Hasan Abbas, and Samia Rouibah (2011). Factors Affecting Camera Mobile Phone Adoption before E-Shopping in the Arab World, Technology in Society, 33.
Sabri, H., (2004). The Application of Information Technology and Decision-Making Orientations in Jordanian Organizations Under the National Culture, the Competitive Conditions, and Uncertainty, Al-Zaytoonah Journal of Scientific Studies and Research Humanities Series: An International Refereed Research
Journal 2(2). Sheppard, B.H., Hartwick., J., Warshaw P.R. (1988). The Theory of Reasoned Action: a Meta –Analysis of
Past Research with Recommendations for Modifications and Future Research, Journal of Consumer Research, 15:3.
Stevens, J., (1996). Applied Multivariate Statistics for the Social Science, New Jersey; Lawrence Erlbaum. Straub, D., (2002). Toward a Theory Based Measurement of Culture. Journal of Global Information
Management 10(1):24-32. Straub, D. Keil, M & Brenner, W., (1997). Testing the Technology Acceptance Model across Cultures, A Three
Country Study, Information and Management, 33 (11). Straub, D. Loch, K. and Hill, C.E., (2001). Transfer of Information Technology to the Arab World: A Test of
Cultural Influence Modeling. Journal of Global Information Management 9(4): 6-28. Tingari, W. and Mahmoud, M., (2014). An Empirical Study Evaluating the Adoption of Mobile Banking in
Sudan, The Journal of Internet Banking and Commerce 63(2): 312-332. Triandis, H., (1982). Dimensions of Cultural Variations as Parameters for Organizational Theories.
International studies of Management and Organization 12 (4):139-159.
Tufekci, Z. and Wilson, C., (2012). Social Media and the Decision to Participate in Political Protest: Observations from Tahrir Square. Journal of Communication, 62:363-379.
Venkatesh, V., (2000). Determinants of Perceived Ease of Use: Integrating Perceived Behavioral Control, Computer Anxiety and Enjoyment into Technology Acceptance Model, Information Systems Research, 11.
Venkatesh, V. Morris M.G. Davis, G. B. and Davis, F.D., (2003). User Acceptance of Information Technology: Toward A Unified View, MIS Quarterly, Vol. 27, No. 3.
Journal of Business and Retail Management Research (JBRMR), Vol. 10 Issue 3 July 2016
www.jbrmr.com A Journal of the Academy of Business and Retail Management (ABRM) 56
Venkatesh, V. Morris, M. G. and Ackerman, P.L., (2000). A Longitudinal Field Investigation of Gender Differences in Individual Technology Adoption Decision Making Processes, Organizational Behavior and Human Decision Processes, Vol. 83, No. 1.
Venkatesh, V. Thong James Y.L., and Xu Xin., (2012) Consumer Acceptance and Use of Information Technology: Extending the Unified Theory of Acceptance and Use of Technology, MIS Quarterly, Vol. 36, No. 1.
Venkatesh, N., Thong James Y.L., Chan Frank K. Y., Hu Paul Jen-Hwa, and Brown Susan A. (2011). Extending the two – stage Information Systems Continuance Model: Incorporating UTAUT Predictors and the Role of Context, Info. Systems, Vol. 21.
Venkatesh, V. & Bala, H., (2008). Technology Acceptance Model 3 and a Research Agenda on Interventions. Decision Sciences, Vol. 39.
Venkatesh, V. & Davis, F. D., (2000). A Theoretical Extension of the Technology Acceptance Model: four Longitudinal Field Studies Management Science, 46 (2).
Warshaw, P. R. and Davis, F. D., (1985). Disentangling Behavioral Intention and Behavioral Expectation, Journal of Experimental Social Psychology 21(3).
Yaseen, S., (2005). Application of Information Technology in the Arab World, Ryad, Saudi Arabia: General Management Institute.
Yaseen, S., (2008). Critique of the Arab Political Mind, Idafat, Arab Association of Sociology. Yaseen, S 2014, 'Mobile Crowdsourcing Technology Acceptance and Use in the Crises Management of Arab
Spring Societies', 10 th International Academic Conference, Vienna.

Journal of Business and Retail Management Research (JBRMR), Vol. 10 Issue 3 July 2016
www.jbrmr.com A Journal of the Academy of Business and Retail Management (ABRM) 57
Linking” expectations and culture at links of London
Herbert Sherman Long Island University-Brooklyn Campus, Brooklyn, USA
Tina Tae LIM College, NY, USA
Key Words Luxury fashion, jewelry, supervisory management, organizational culture, window display, flagship store.
Abstract This field-based case which focuses upon Krissy, a new Assistant Store Manager at Links of
London. She applied to work for the firm because she had read on their website how supportive and developmental they were yet her work experiences there were to the contrary. This paradox comes to light when she was with told by a new corporate leaderwho sought to change the company image with a last minute product repositioning. This request occurred while both her manager and regional manager were unavailable. In spite of her new job withnew job responsibilities and an“emotional” manager, she made a key unilateral decision to leave the store window displays empty overnight. This leads to a demonstrative confrontation with her manager the next day. This case was written to be employed in an introductory retail management or service marketing course although it could also be employed in an introductory management, human relations, or human resource management course.
1. Introduction
The challenges of running a profitable, sustainable retail store are many. They become insurmountable, however, without good planning, and without paying attention to every facet of your operations and customers' experiences. Successful retailers pay careful attention to staffing, sales, logistics, controls on cash and inventory, and are always juggling these concerns. (McClintock, n.d.) “Culture eats strategy for breakfast.” (Peter Drucker, http://www.reply-mc.com/people/peter-drucker/, 1/26/16)
Retail operations has been in the past decade, is and will continue to be under attack by on-line internet sales as technology plays are larger role in consumer spending patterns. The Census Bureau announced that online retail sales for the third quarter of 2015 was $ 87.5 billion dollars (an increase of 4.2% over last quarter) while total retail sales were $ 1,185 billion dollars (a 1.2% increase from the second quarter). The percent of e-commerce sales has therein risen a total of 1.4% from last year to equal 7.4% of total retail sales. (US Census Bureau, 11/15, 2015)
As a result of the changing marketing mix, many traditional retail jewelers for example have created websites to display their merchandise. Online sales are small but growing. Zale's e-commerce segment has grown in recent years and the company believes that e-commerce has long-term growth potential. Online and mobile jewelry sales at online retailers such as Blue Nile have also improved. Many retailers are starting to invest in technology to improve efficiency. Multi-location stores are redesigning store processes using point-of-sale software to improve communication with other stores, vendors, and customers. Data processing improvements such as purchase order management, merchandise planning, accounting systems, and bar coding are being implemented by even single location stores to help with inventory and financial controls.

Journal of Business and Retail Management Research (JBRMR), Vol. 10 Issue 3 July 2016
www.jbrmr.com A Journal of the Academy of Business and Retail Management (ABRM) 58
Large discounters have also entered the jewelry market, adding competition primarily at the lower end of the market. Independent jewelers compete by having a wider selection and a highly trained staff. Although Wal-Mart is one of the largest jewelry retailers, jewelers still command over half of the market and dominate the middle to upper end of the marketplace. Specialty jewelry stores continue to lose market share to mass merchants. Specialty stores account for only about 40 percent of all jewelry sales in the US. The share sold by traditional department stores has also been declining. (Hoovers, n.d.)
2. Links of London: An Overview2 Links of London is subsidiary of the publicly traded Folli Follie Holdings S.A., selling
18K gold and 925 sterling silver jewelry in Europe, Asia, the Americas and the Caribbean and with its 650 employees worldwide is considered to be the English equivalent of New York’s Tiffany’s & Co. (Links of London, 2014).
Figure 1 Links of London535 Madison Ave., New York, NY 10022 Ph.212-588-1177
Links of London’s iconic product is the “Sweetie” bracelet, a heavy sterling silver bracelet in the design of a children’s candy bracelet. It was designed by Annoushka Ducas, the founder of Links of London, who believed that jewelry should be “whimsical and wondrous, commemorative and charismatic” (Links of London, 2014). The Sweetie bracelet is a staple accessory in London. Consequently Annoushka was awarded an MBE (“The Most Excellent Order of the British Empire”, The Official Website of the British Monastery, 1/20/15) “for her services to British jewelry.” (Huffington Post, 2014)
Figure 2Links of London “Sweetie” Bracelet
Annoushka sold Links of London to the Greek Folli Follie Group in 2006 (FF Group, 1/20/2015) after 16 years of business (Huffington Post, 2014). Annoushka and several of the firm’s key executives left Links after disagreeing with Folli Follie’s leadership as to how to run
2Please note that the names of the employees in the NY store have been changed in order to protect their anonymity.

Journal of Business and Retail Management Research (JBRMR), Vol. 10 Issue 3 July 2016
www.jbrmr.com A Journal of the Academy of Business and Retail Management (ABRM) 59
the firm. Since their departure the company has struggled to find the proper leadership to guide the business—especially in the U.S. where Links is less-established and lesser-known by the US public. In 2013 the then CEO David Riddiford was replaced by CFO Declan Delanty after just 15 months at the helm. (Professional Jeweller, 1/23/13)
3. Corporate Culture, Values and Strategy Implementation Peter Druckernoted that management’s main purpose is to maximize customer
satisfaction by delivering quality and value to customers (Drucker, 1993) and that organizational culture is the main vehicle driving service delivery.
Organization culture is the system of values, rules, symbols, taboos and rituals that evolve over time. It is the common perception shared by members that identifies how thing get done in the organization. Culture drives expected behaviors internal to the organization as well and those engaged when interacting with its surrounding environment. Understanding an organization’s culture helps an employee learn the ropes and discover whether their personality is a good fit. The greater the acceptance of key values and norms, the stronger the culture. Strong cultures are associated with employee commitment and organizational performance. The strength of culture is determined by the size of the firm, how long it has been around, intensity and turnover rate.
Culture is transmitted through stories, heroes, villains, rituals, material symbols and language. Stories retell significant events in an organization’s history. They provide keys to what types of behaviors are expected and respected. Stories anchor the present in the past, explain current practices and identify what the organization values. Rituals and ceremonies are repetitive activities that identify and reinforce an organization’s key values and denote important actions and events. For most firms, retirement evokes separation rituals while new employees become assimilated through welcoming ceremonies (usually called orientation programs). Both use material symbols; artifacts that convey who and what is important, how people are expected to work together, and the degree of egalitarianism. Office layout, for example, whether people work in offices or cubicles, the style of furnishings (metal or wood), executive dining rooms, are all indicators of the organization’s character. Over time, organizations develop unique terms to describe their business and operations. These slang expressions can indicate entire sentences of thought with a single word. This specific language acts as a common denominator that unites members of a given culture. Each organization, industry and generation of employee creates their communication linguistic.
In addition to the transmission methods mentioned above, organizations communicate culture through their structure and reward systems. Organizations that value teamwork are likely to have: flatter structures, physical space and computer software that is conducive to team work, reward systems based on team goal achievement and managers who operate as facilitators and coaches. Organizations that value individual achievement have competitive environments with individual bonus systems and clear indicators of individual achievement such as gold cufflinks for reaching one million dollars in net sales. Organizations that value authority will be bureaucratically structured, with formal rules and regulations ranging from communicating with superiors to filing equipment requests through central processing.
Types of Cultures. Organizational cultures are either integrated, differentiated, or fragmented. An integrated or homogenous culture is characterized by consistency, organization-wide consensus, and clarity and this culture reacts to change as a whole as one unit. Differentiated cultures, on the other hand, have conflict and usually have subcultures broken down into those groups in power (the haves, the dominant coalition) and those outside the power structure (the haves not, the minority coalitions). These cultures are inconsistent,

Journal of Business and Retail Management Research (JBRMR), Vol. 10 Issue 3 July 2016
www.jbrmr.com A Journal of the Academy of Business and Retail Management (ABRM) 60
have ambiguity in the minority subcultures yet the subcultures have internal consensus. The firm reacts inconsistently to change, with some subcultures embracing it while other parts will resist it, based upon the source of the change. Fragmented cultures are prominent for their heterogeneity, ambiguity and plurality of disconnected subcultures. It is not clear in this structure, which subculture runs the firm (power is diffused) and there is certainly not a stable organizational consensus. In this type of culture differences of subcultures are not only tolerated but considered the norm and subcultures will emerge to address organizational crisis when needed.
Creating a Fit between People and Organizational Culture. When people join an organization, they are socialized, or taught the procedures and nuances of culture through formal training programs, interactions with mentors and coworkers, and by just being on the job. Within a few months, an employee can determine whether they fit in with the organization’s culture.
The idea of fit suggests that people and organizations have personalities. When both achieve a fit, employees begin to feel comfortable with the organization’s norms, value system and expectations of behavior; their job performance increases. When fit is not achieved, employees may experience conflicts with expectations, disregard codes of conduct, or will not thrive under the work and reward systems. When fit is achieved, people tend to be more satisfied with and committed to their organizations and when fit is not achieved, people become dissatisfied, have sub-optimum performance, may leave the organization, or in the extreme case, engage in sabotage. A lack of fit between culture and the values and mission of a firm can result in the failure to get the firm’s goals and objectives effectively implemented. (Sherman, Rowley and Armandi, 2006)
4. Core Values and Culture at Links of London Links of London devoted a page of their website to their core values and culture as a
cornerstone to their successful operation. Links of London is proud to be an iconic British brand and recruits individuals who reflect the core values of our teams: Accountable & Proactive: People who do what they say they will do and who
approach their day with energy and positivity. Passionate & Innovative: People who are passionate about the brand they work for,
who are creative in coming up with innovative solutions to make life at work even better.
Ambitious & Driven: People with the ambition and drive to work collaboratively as a team to succeed.
Knowledgeable & Engaging: People who know their stuff, what the brand that they work for stands for and who are able to translate that into brilliant customer engagement at every level within the Company.
Respectful & Honest: People who are respectful to others and who approach life at work with honesty and integrity.(http://www.linksoflondon.com/us-en/careers/culture, 1/26/16)
Links of London also denoted on their website their warm welcome that new employees would receive when joining the firm as well as the continual develop employees would obtain in order to maximize their skillset. They claim that their culture is aligned with their vision and that they understand the important part that employees play in delivering world class customer service. Their goal is to align the needs of the firm with the employees. They rely on training and development as well as teambuilding to deliver high performance to their clients in

Journal of Business and Retail Management Research (JBRMR), Vol. 10 Issue 3 July 2016
www.jbrmr.com A Journal of the Academy of Business and Retail Management (ABRM) 61
order to achieve the firm’s objectives. This is accomplished by maximizing the value of employees’ inputs through job satisfaction and team comradery.
We're proud of the people who work for us and are passionate about the Company being an enjoyable, friendly and rewarding place to Work. (http://www.linksoflondon.com/us-en/careers/culture, 1/26/16)
5. Krissy: Applying to the New York Store It was the summer of 2014 and Krissy was perusing LinkedIn when she noticed an
advertisement for the Assistant Store Manager position at Links of London for their Madison Avenue, New York Flagship location. She was very excited about the position and working for Links of London for several reasons:
She had a “passion for fashion” and wanted to work in the “luxury fashion center” of Manhattan – near Saint Laurent, Chanel, and Louis Vuitton. (Luxury Flagships, n.d., http://www.nycgo.com/articles/luxury-flagship-shopping)
She had recently been accepted to a MBA program in fashion merchandising and felt that with this additional education she could work her way up into corporate headquarters and apply her acquired knowledge to the firm’s best advantage.
She went to their website and read about their culture and values and wanted to work for a firm that respected dedication, hard work, leadership and team play.
Krissy was most impressed with their career development program. As noted on their website: The FF Group (US) is committed to enhancing individual and organizational
effectiveness by creating a learning environment to offer people the best opportunities and support to develop their knowledge, skills and behaviors, and to manage their career with us.
Our objective is to match the needs of the Company with those who work for us. We believe in training and developing our people and teams to deliver high performance to achieve the Company objectives and demonstrate our People Values, which maximizes job satisfaction for our teams.
Our commitment to developing our employees includes a diverse range of methods; Learning and Development is not simply about providing standard training courses; we support and facilitate many different types of activities in a partnership between the employee and the Company. Each employee is responsible for driving their own learning and they do this by identifying and discussing their training needs with their Line Manager, giving full commitment to taking part in training events, applying the learning and demonstrating improved performance after receiving training. It is our aim, wherever possible, to promote from within the business and all decisions about promotions will be based upon the skills, experience and aptitude of either internal or external candidates.
(http://www.linksoflondon.com/us-en/careers/careerdevelopment, 2/3/2016) Krissy’s interview in August of 2014 with the store manager went quite smoothly. The
interview was everything she imagined it would be, informative while challenging, and she was elated to see that Mirela mirrored the firm’s sentiment about personal development and team effort. She thought that in Mirela she had found the perfect mentor; someone with many years of industry experience who wanted to show her the ins and outs of the luxury retail market. Mirela was also very supportive of her efforts to obtain a graduate degree and indicated the financial support she would receive from the firm for her continued education. Her second interview with Christine, the District Manager at Links, was also quite positive with Christine emphasizing the importance of the NY store as the “showcase” for Links of London products and services; service had to be “of the highest quality” with the customer always coming first.

Journal of Business and Retail Management Research (JBRMR), Vol. 10 Issue 3 July 2016
www.jbrmr.com A Journal of the Academy of Business and Retail Management (ABRM) 62
Needless to say that when the job offer came to Krissy three weeks after her second interview she jumped at the opportunity.
6. Krissy: As a New Hire at the New York Store It was a Friday in late August when Krissy reported for duty to the Director of Human
Resources at the NY Office. She went through a highly personalized one day training program which included an orientation to Links of London (included background information on the firm as well as employee benefits and their partial commission compensation system), a store walk through, a thorough description of their product lines and services, and an introduction to her fellow store employees. She also learned how to use the cash register and to process special requests that required ordering items from the warehouse.
She was also given her work schedule, six days a week including weekends, with every fourth week allowing for a two day break. The atmosphere was very relaxed and cordial and everyone seemed to get along quite well. She felt quite at home and immediately felt the comradery that Links had described on their website. She talked with her manager Mirela at length and started to develop a more personal relation, one she thought she would need to help her understand Mirela’s needs and management style. That night she stayed in, studied the firm’s website, and created several “mock on-line orders” to see what problems there might be in customer usage; none were apparent.
As the Assistant Manager, Krissy reported to Mirela, the Store Manager, and oversaw 2 full-time and 2 part-time employees (see Figure 3, Partial Organizational Chart). Her responsibilities included making sure that the store achieved sales goals, that store visuals were updated and properly maintained, and to write weekly, monthly and quarterly reports as they were assigned to her by her manager.
Figure 3 Partial Organizational Chart, Links of London, NY Madison Avenue Store
7. Day One: School of Hard Knocks – Sink or Swim The real work started the following two days, the weekend. It was far more hectic to be
in the store than Friday, as customers sailed in and out with Krissy helping them as best as she could with her minimal knowledge of their products.
Mirela was in the back office dealing with a new shipment of goods that had numerous errors both in terms of the product order and the bills of lading. The actual inventory did not match the inventory list nor did the inventory match her inventory request. Mirela had to go on-line as well as directly talk to the warehouse to determine what the problems were with inbound logistics; this should never had occurred with their bar code ordering and inventory system and evidently the system had developed a few “bugs.” Mirela knew that she could not effectively run the NY store if her inventory was delivered accurately and properly accounted

Journal of Business and Retail Management Research (JBRMR), Vol. 10 Issue 3 July 2016
www.jbrmr.com A Journal of the Academy of Business and Retail Management (ABRM) 63
for. Hence she was not available for more than just a few minutes of time to help Krissy out on the floor. Krissy observed that when she was on the floor she was masterful in terms of how she could quickly size up the needs of the customer and help close a sale. Many times would call Krissy over and introduce her customer her as “my number one” – that if she was not available Krissy would provide them with the same class of service.
The few customers that Krissy did deal with on her own had a “special request” which she clearly was not able to handle. She would then politely pass these clients off to one of the store employees, trying her best to make sure that each employee received her fair share of customers. She wanted to make sure that every employee received the opportunity to make a commission yet she also wanted to make sure that every customer who sought assistance would receive it as soon as possible. Waiting time in a luxury store had to be minimal – that meant less than a minute according to her orientation!
It became quickly evident that Azalia was the swiftest and best sales associate, generating nearly twice as many sales as the other employees. Regardless, Krissy did her best to strike a balance with the other sales associates understanding that customer waiting time had to be minimized. On occasion a customer would ask for a specific sales associate and Krissy would do her best to make that customer comfortable (serving them sparkling water and organic gluten free cookies) while informing the already engaged associate that she had a client waiting.
It became apparent that her best role would be as a store greeter and cashier. She continued direct customers to product displays and sales associates as needed and made sure to ask customers as the exited the store how the service was and if they required any additional assistance. Several clients wanted to open up special membership accounts and Krissy was smart enough to use the computerized cash register to muddle her way through the process.
When the store closed that night Krissy was exhausted as was the rest of the employees. After Krissy had helped the other employees close up the store, Mirela finally emerged from the back office complaining about “those geeks in IT.” She looked at the sales for the day, cracked a Cheshire cat smile, complemented everyone on a “job well done” and suggested they all go out for a quick drink on her to welcome Krissy to the team. They stopped at a local bar on 57th Street and while on the way admired the store displays for Louis Vuitton and Polo. Mirela pointed out these displays to Krissy telling her that displays could make or break a luxury store, even one as established as Burberry (Fashion Brands of the World, Top 10 List (n.d.). http://www.wonderslist.com/top-10-fashion-brands-of-the-world/, 2/3/2016).
Sunday was a repeat of Saturday except the store opened later and closed earlier. Sales were not as brusque as on Saturday and Mirela, who was on the floor helping Krissy become more acquainted with the nuances of their product lines, voiced her concern at store closing to all of her employees. “You know we do about 80% of our business over the weekend” she announced “so we really have to be able to qualify our walk-ins3 and close deals.” She pulled Krissy aside and asked that she pay close attention to her sales associates and to see how Krissy could help them if Krissy felt they were losing a customer. Krissy was so busy that she had not had a chance to observe Mirela interacting with the sales associates in this manner. She decided she would talk with each sales associate once she got to know them better and to see how she could assist them given their particular sales style.
8. No Longer a Rookie It was mid-November 2014 and Krissy had been with the company for merely three
months. Krissy received no formal training during that time period but had worked very closely
3 Qualifying walk-ins refers to the practice of deciding whether a customer is a serious buyer or not.

Journal of Business and Retail Management Research (JBRMR), Vol. 10 Issue 3 July 2016
www.jbrmr.com A Journal of the Academy of Business and Retail Management (ABRM) 64
with Mirela (on the job training) on a day to day basis in order to learn most of the routines involved in running the NY store. After her first month on the job Mirela let her “fly solo” (run the store on her own) during the slowest business day for them (Wednesdays) therein allowing Mirela to go back to her six day a week schedule. Mirela had been working seven days a week for the past four months, coming in for half days during the week in order to have some time off and not experience job burnout. Krissy had Wednesdays off and spent much of her time on-line at home looking at competitor products and websites.
The store was heading into the Winter Holiday Sales period as large shipments of product and holiday window décor arrived daily. There was also a new collection of bracelets, rings and necklaces specially created for the holidays, called “Sparkle Stardust.” (See Figure 4, Interlocking Necklace) This new product line was to be soft-launching4 at the end of the month with the option of being extended into the spring.
Figure 4 Links of London, 20/20 Interlocking Necklace (Sparkle Stardust Collection)
Mirela and Krissy received Product Knowledge packets regarding the new collection and were excited to have the new product line in the store. Links of London’s signature product for years has been the “Sweetie” bracelet which continued to sell well yet had reached a saturation point with returning customers who would in the past have purchased the Classic Sweetie, the Mini-Sweetie, and the Sweetie with Amethyst Hearts, the Gold Sweetie, and the Rhodium Sweetie. These loyal customers were now looking for something new and exciting.
Mirela and Krissy took a conference call regarding the new Sparkle Stardust product line’s arrival yet the first thing on the agenda was that there was a new President of Retail named Robert. They were told he had been hired as a result of Folli Follie CEO’s dislike of the prior president of Retail. Robert’s background was impressive in that he came from Michele Watches5, where under his leadership, Michele products pushed into the popular mass market (with a lowered bottom price point of $ 350) with the company obtaining great returns on a brand that was previously waning in popularity. The CEO of Folli Follie hoped Robert could revitalize Links the same way he rejuvenated Michele.
Mirela was caught off-guard by the news and immediately texted another store manager to hear her colleague’s thoughts. Krissy, on the other hand, was excited by the buzz around a new hire but was herself too new to the company to process the ramifications of the firing-hiring news. The conference call then turned to the Sparkle Stardust directives and both Mirella and Krissy took note of the Visual Director’s suggestions and installation deadlines. When the call
4 “A soft launch is the release of a website, hotel, or other product or service to a limited audience. Soft-launching is a method for
gathering data on a product`s usage and acceptance in the marketplace, before making it generally available as a hard launch or grand opening.” http://www.encyclo.co.uk/meaning-of-Soft%20launch, 5/5/15. 5Michele Watches’ website ishttp://www.michele.com/webapp/wcs/stores/servlet/HomepageView?langId=-
1&storeId=12051&catalogId=10051&N=0.
Journal of Business and Retail Management Research (JBRMR), Vol. 10 Issue 3 July 2016
www.jbrmr.com A Journal of the Academy of Business and Retail Management (ABRM) 65
ended, Mirela said, “O-M-G, I can’t believe they just hired someone new and we are in Holiday season!”
The Sparkle Stardusk Collection. The Sparkle Stardust merchandise arrived two days after the conference call. The pieces were a dramatic departure from the gold and silver materials Links had used in the past since the items were made of Steel and Cubic Zirconia. Next to the 18K gold and diamonds in animal and flower motifs, the sleek, modern Sparkle Stardust looked like a distant cousin to the more literal designs Links had been carrying over the years. Krissy and Mirela trained the full-time and part-time associates on Sparkle Stardust Product Knowledge. Azalia, the top-seller for the store, said “They’re ugly” and stated that no one would buy them. Still, Krissy and Mirela urged all of the associates to go through their client books and begin calling clients about the new collection.
The Sparkle Stardust collection sold 10 units through the weekend, a rather low number, while that Monday morning Krissy was writing a report for Corporate as to customer’s preliminary reaction to the new product line. Robert the new President of Retail Sales unexpectedly then walked through the front door to introduce himself to Mirela, Krissy and Azalia who were all present that day. He asked about the business and Mirela showed him the new Sparkle Stardust collection and the figures for the past week and month. Robert asked Mirela how she felt about Sparkle Stardust and she expressed the team’s general feelings about the collection (which was negative), but she stated “we’re just not used to them yet.” Robert agreed that “they’re a new direction for the business.”
9. Heh Sweetie, We’re Back! The following Tuesday, Krissy took the weekly conference call alone as Mirela had called
in sick. Robert was on the call and announced that it was his utmost pleasure to join the company going into the Holiday period. He declared “Holiday is a fantastic time of year to be joining Links and just looking at last year’s figures, I’m excited to see sales take-off!” He then surprised Krissy by introducing a Holiday Incentive for the old line, the Sweetie bracelet, a complete turnaround from the Sparkle Dust launch discussed earlier.
“We’re bringing them back!” chimed Robert. “The associate that sells the most Sweetie bracelets in the month of December will win a $1,000 store credit!” Also, because the Sweetie bracelet functioned as a charm bracelet and could hold multiple Links of London charms, “The associate that has the highest UPT (Units per Transaction) will also win a $1,000 store credit!” He brought the Visual Director onto the call, who gave instructions to the managers to remove the Sparkle Stardust line from the window displays and to put Sweeties with charms in their place.
Krissy ended the call and asked Azalia and Nataliya (a part-time associate) to clear the windows and to assemble 4 Sweetie bracelets with charm “stories”—one with a love theme, one with a wish theme, one that’s whimsical and one that’s ‘luxurious.’ Krissy then called Mirela to tell her about the new initiative.
10. Managing the Store without Mirela Mirela had had a terrible fight with her husband the night before and was in emotional
shock—which was her reason for her calling in sick. She told Krissy “I don’t know why I married him. He does this all the time. I make more money than he does yet his job comes first …” and confided in Krissy that “He made me cry for years before I married him. I can’t do this anymore.” Krissy comforted Mirela over the phone for 20 minutes and Mirela uttered “Thank you, Kris, I’m sorry that I am a wreck. I’ll see you tomorrow even though it is my day off.” Krissy had not mentioned a word about the Sweetie initiative because she felt that Mirela was not in an emotional state to handle more stress.

Journal of Business and Retail Management Research (JBRMR), Vol. 10 Issue 3 July 2016
www.jbrmr.com A Journal of the Academy of Business and Retail Management (ABRM) 66
Krissy went back onto the sales floor and Azalia and Nataliya had finished making one love-themed bracelet, which showcased several heart charms in mismatched colors. (See Figure 5 below.)
Figure 5 Links of London, Sweetie Charm Bracelet with Mismatched Colors
Krissy said “this could look better” and asked Nataliya to remake the bracelet with only red and gold hearts. “Well why didn’t you tell us in the first place,” Nataliya snapped. Nataliya was from the Ukraine and was generally sharp in her response (not an asset in general for customer service) yet her being fluent in Russian was a big draw for Russian financiers who came into the store. She had strong community connections with this client group, with the majority of her sales coming from this narrow market niche. “I didn’t know that this is what you thought was pretty” indicated Nataliya and Krissy responded by apologizing for not giving better, more concise directions.
At that moment, two customers who seemed to be friends came in to see the Sparkle Stardust collection. They saw Links’ e-mails announcing the new collection, and had come to see the products in-person. Azalia and Nataliya both assisted them. It was 45 minutes before closing and the store had only $1,800 in sales for that day with a goal of $7,500; nowhere near their assigned quota. Krissy was anxious to make these last minute sales so she worked sales alongside Azalia and Nataliya to close a sale of $800 with one of the friends.
At closing, the store window displays were still missing Sweetie bracelets.Nataliya had a party to go to in 30 minutes so she asked if she could leave early although she knew that Krissy really needed her assistance. Krissy told her she could if she so chose to but hoped that Links’ fabled “teamwork” would have Nataliya stay and help out.Without blinking an eye, Nataliya went into the back office, picked up her coat, and exited the store. After Nataliya left, Azalia asked “What are we going to do about the windows?” Krissy responded, “I’m going to stay here and do them.” Azalia asked if she could stay and help, but Krissy counted Azalia’s hours for the week and knew the extra time would lead to unapproved overtime. Krissy also recognized that overtime coupled with not meeting their daily sales quota was not a good sign and would be sure to raise an eyebrow or two at the District level. “No, don’t worry about it. Thank you though,” Krissy replied.
Krissy spent the next half-hour assembling the themed Sweeties, but received a call at 7:50 PM on the store phone from Security asking why the lights were still on in the store. Krissy explained her situation, but was told that she needed an approval code to stay in the building past 8 PM. Krissy had 10 minutes to call back with an approval code, held by Mirela or her boss Christine, the District Manager.

Journal of Business and Retail Management Research (JBRMR), Vol. 10 Issue 3 July 2016
www.jbrmr.com A Journal of the Academy of Business and Retail Management (ABRM) 67
Neither Mirela nor Christine picked up their phones, and at 7:58 PM with 2 minutes to go, Krissy hastily set the alarm, locked the doors and exited the store. There were no products showing in the store windows, but she thought, “I’ll get into work early and finish the displays tomorrow.”
11. We Have Met the Enemy …and the Enemy is us! The next day was a bright shining morning in midtown Manhattan and Krissy walked
into the store as she planned an hour earlier than normal in order to complete the window displays.She had stayed up until midnight the night before designing the window layouts on paper so she could efficiently set them up in the morning.
She was astounded to find that Mirela was already on the premises and had already started to open the store. This was quite unusual since it was Krissy’s job to open the store giving Mirelathe free time to call the District Manager for last minute instructions. Krissy put on her biggest customer smile and said “Good Morning, how are you?” expecting her normal friendly reply from Mirela. Mirela unexpectedly replied quite sharply, “Why are there no products in the windows? Did we get robbed?” Krissy began to explain but Mirela cut her off. “The Corporate Visual Director walked by the store this morning on the way to the office and almost screamed when she didn’t see anything in the windows. Do you know what would have happened if Robert the President of Retail Operations saw that? He would have fired the lot of us! How could you close the store without anything in the windows! We’re the Flagship store for the entire firm and we are on the most significant shopping boulevard in Manhattan, Madison Avenue! Do you know how many people walk by our store? What type of impression does an empty display window make with the public? How thoroughly unprofessional of you! Now explain to me why I should not send you home for good this instance and be quick about it!”
Mirela’s accusations and negative comments about the empty windows left Krissy speechless. She had not thought through the ramifications of her decisions and realized she her training and on the job instruction had left her sorely underprepared for last night’s exceptional situation. How could she not have security clearance to keep the store open past 8 PM? Krissy replied “I’m so so sorry! This was not my fault. I got kicked out of the building at 8 PM because I didn’t have a security code. I called you and Christine because I stayed late doing the windows but neither of you called me back!” Mirela responded, “Stayed late? For heaven’s sake why? We only made $2,500! Were you too busy making a last minute sale so that the windows could not have been done earlier?”
Krissy began to feel her eyes tear as Mirela continued her questioning. “Kris, I’m about to lose my husband, are you about to make me lose my job as well?” This was the straw that broke the camel’s back - Krissy was extremely distraught and started crying. Mirela’s reaction was quick and insensitive. “Don’t cry; what are you crying about? I should be crying! I shouldn’t even be here having this conversation with you. You very well know to never close a store without product being displayed in the window. Didn’t they teach you that at your last job or at College?”
At that moment Nataliya walked into the store and noted a red-faced Mirela and a crying Krissy in the middle of the sales floor. Krissy was so embarrassed by her crying that she quickly escaped into the restroom to blow her nose, repair her face and mull over not only the series of events that lead to this morning’s harrowing experience but her whole experience with Links of London. Where was the respect, the teamwork, the comradery that she had read about on their website? Where was the developmental support from a caring and conscientious mentor?

Journal of Business and Retail Management Research (JBRMR), Vol. 10 Issue 3 July 2016
www.jbrmr.com A Journal of the Academy of Business and Retail Management (ABRM) 68
Possible Case Questions: 1. Describe the key events leading up to the empty displays and what precipitated this
catastrophe. If you were Krissy what would have done differently and why? 2. Who is at fault for the displays being empty? Is this just Krissy’s fault or are there other
“culprits” involved? What could her manager and her district manager have done to make sure that this did not occur in the first place?
3. Describe 2-3 immediate difficulties you see at the end of the case as Krissy leaves the store’s selling floor and how you as the store manager would resolve those issues.
4. Describe the culture of the NY Store and how well Krissy seems to fit within that culture. 5. There seems to be a gap between the portrayed culture of the firm on its website and the one
experienced by Krissy – is this just false advertising or are there other possible explanations?
References Anonymous (n.d.).“Fashion Brands of the World, Top 10 List” http://www.wonderslist.com/top-10-
fashion-brands-of-the-world/, 2/3/2016 Anonymous(1/23/13). “Links of London Owner Replaces another Chief.”Professional Jeweller
http://www.professionaljeweller.com/article-12492-links-of-london-owner-replacesanother-chief/, 1/20/15.
Anonymous (n.d.). “The Official Website of the British Monastery.” http://www.royal.gov.uk/MonarchUK/Honours/ Order of the British Empire .aspx, 1/20/2015. Drucker, Peter (1993). The Practice of Management. New York: Harper Business. Drucker, Peter (n.d.). http://www.reply-mc.com/people/peter-drucker/, 1/26/16. FF Group, http://www.ffgroup.com/default.asp?pid=8&la=1&cid=1, 1/20/2015. Galbraith, Jay R. (n.d.). “The Star Model™.” http://www.jaygalbraith.com/images/pdfs/ StarModel.pdf,
January 28, 2015. Hersey, Paul (2001). “Situational Leadership.” Center for Leadership Studies, Inc. Reprinted in Walter E.
Natemeyer and Paul Hersey (2011). Classics of Organizational Behavior, 4th Edition. Long Grove, Ill.: Waveland Press, Inc., 378-383.
Hoovers (n.d.). “Jewelry Stores: Executive Insight.” http://0subscriber.hoovers.com.liucat.lib.liu.edu/H/industry360/executiveInsights.html?industryId=154
0, 12/15/15. Huffington Post. (2014). Annoushka Ducas MBE [Profile]. Huffington Post.
http://www.huffingtonpost.com/annoushka-ducas-mbe/ Links of London (n.d.). Career Development. http://www.linksoflondon.com/us-en/careers/careerdevelopment, 2/3/2016. Links of London. (n.d.). General format. Links of London. http://www.linksof london.com/us-en/,
1/26/16. Links of London (n.d.). Values. Links of London. http://www.linksoflondon.com/us-en/careers/culture,
1/26/16. Lussier, R.N. (2011). Management Fundamentals. New York: Cengage Learning.
Luxury Flagships, (n.d.). http://www.nycgo.com/articles/luxury-flagship-shopping. McClintock, Leslie (12/15/15). “How to Plan Retail Store Operations.” Retrieved from
(http://smallbusiness.chron.com/plan-retail-store-operations-13139.html). Sherman, Herbert, Daniel J. Rowley, and Barry Armandi (2006). Strategic Management: An Organizational
Change Approach. Lanham, MD: University Press of America. US Census Bureau (11/17/15). “Quarterly Retail E-Commerce Sales 3rd Quarter 2015.” CB15-189.
http://www.census.gov/retail/mrts/www/data/pdf/ec_current.pdf, 12/15/15.

Journal of Business and Retail Management Research (JBRMR), Vol. 10 Issue 3 July 2016
www.jbrmr.com A Journal of the Academy of Business and Retail Management (ABRM) 69
A meta-analysis of consumer irrational purchase behavior based on Howard-Sheth mode
Chen Xinhui North China University of Technology, Beijing, PR China
Duan Han North China Electric Power University, Beijing, PR China
Keywords Consumer irrational purchase behavior, Howard-Sheth mode, Meta-analysis, Structure equation model.
Abstract The character of consumer purchase behavior choice is the market basis and decision basis of
enterprise marketing activities. The purpose of this research is to explore how those irrational behavior generate, what factors have great significance on consumer irrational behavior and what kind of marketing methods enterprises can take to increase their revenue. So, a meta-analysis of resent ten years’ empirical study on consumer irrational purchase behavior was conducted and a consumer irrational purchase behavior model was proposed. Furthermore, we tested it by using structural equation modeling. Our study provide an insight into the factors of consumers irrational purchase behavior which hasn’t been researched systematically. The results indicated that the attitude and intention of consumer, the marketing promotion, the product signal release and the guidance of consumer emotion have an obvious significance on consumer irrational purchase behavior. Those conclusions have important meaning on guiding to popularize new products, improve customer loyalty of enterprise and lead a new view to understand consumers purchase behavior.
1. Introduction Consumer purchase behavior is the process of people when they search, choose, purchase,
use, comment and dispose product or service; include consumer’s subjective mental activity and objective material activity. In microeconomics, “Economic Man” as the basic assumption has defined the concept of consumer behavior, which assumes all consumers are rational and mercenary. Traditional consumer theory is also based on such a fundamental assumption. It point that the motivation of people to maximize their benefits is the rationality; people will always choose the minimum cost for maximum output. However, conclusion of “Ultimatum experiment” has told us the offer less than 20% would be rejected by probability of 40%-60%, which does not met the Nash equilibrium. So, human has cognitive biases and irrational behavior. What’s more, there are some scholars who study the irrational behavior of investor consider that the real features of investor in real deal are irrational behavior, and the traditional rational assumption is incompatible with reality. In the current study on consumer rationality and irrationality purchase behavior, some scholars prefer those two aspect are mutually transformed. He D A. (2005) combined the Process rational theory of Simon with Prospect theory of Daniel and applied to reality, then proposed that consumer behavior should be a process of the rational behavior approaching to the irrational. Throughout all arguments about the rational and irrational buying behavior, whether you are the defender of “Economic Man” or amender of “Bounded rationality”, we all recognize the existence of consumer irrational purchase behavior.
Our study on consumer irrational purchase behavior is mainly used meta-analysis on empirical literatures: we review the concept and build model in section 2; we collect data and

Journal of Business and Retail Management Research (JBRMR), Vol. 10 Issue 3 July 2016
www.jbrmr.com A Journal of the Academy of Business and Retail Management (ABRM) 70
code in section 3; data analysis and the results of meta-analysis are showed in section 4; use the correlation coefficient construct structural equation and path analysis is conducted in section 5; put forward the conclusions, Inadequate and future direction in last section.
2. Conceptions and models Academe has recognized the existence of irrational behavior, but the definition of “irrational
behavior” is great different. First proposed of irrational is in the philosophical research, on one hand, rationalism think that rational is ability of identifying, judging, assessing actual reason, or regulating people’s behavior to specific purpose, or other aspect. On the other hand, irrationalism consider that irrational cannot understand by rational and cannot express with logical concept. Philosophical review irrational from the perspective of logical thinking, but economics interpreted from the perspective of purchasing decision-making. Amartya Sen deem that economics define rational in two ways: one is consumer preferences meet completeness and transitivity; another is individuals maximize their own interests. In this paper, we use the irrational consumer behavior’s narrow definition what is admitted by most domestic scholars. It means irrational purchasing decisions consumers have made when affect by a variety of factors, generally performance are consumers don’t pursuit the utility maximization when they purchase, or don’t consider the income constraint when consumption, or lack of knowledge to judge consumer goods, and so on.
In a specific form of irrational purchase behavior, Hinterhuber Partner (2015) accord to different situation to elaborate consumers’ specific manifestations of irrational buying, involve in prices-quality effect, framing, lacking effect, preference reversal, and so on, which reflect the performance of consumers irrational purchase behavior exhaustively. Some domestic scholars introduce consumers’ irrational buying behavior from organizational, environmental and personal aspects. According to this paper’s definition of irrational buying behavior, we then combine the performance of irrational buying behavior of Liu J G. (2006) with the analysis on compulsive buying behavior of Lourenco Leite (2014). At last, we divide consumers irrational purchase behavior into three part: impulsive buying, compulsive buying and excessive buying, which will be used as key words to search related documents about consumers irrational purchase behavior.
The theoretical model build in our paper, we mainly refer to the model in empirical literature and combine with Howard-Sheth mode what reveal the consumer decision process, after that, we sort out the comprehensive model of consumer irrational buying behavior.
What “Howard-sheth mode” represents are the connections among practices of consumers’ behavior response in the process of purchase and decision-makings, the process of purchase and decision-making, as well as the characteristics of commodity in the markets. It is the blending of Kotler, Nicosia and others’ consumer buying behavior models with strong logicality and comprehensive contents, and it can sufficiently explain the buying behavior of different types of products and consumers’ brand choice behavior during a certain period. Based on the “stimulus-response” theory, this model takes the four factors influencing the buying behavior and three phases of behavior generating into account. The four types of factors are input factors, external factors, internal factors and output factors; Three phases refer to concept formation, concept obtaining and concept utilization. Walte (2008) has carried on the elaborate research: on the stage of concept formation, consumers need to develop the selection criteria and standard, be aware of the significance of standards and their relations to choose the merchandise category, meanwhile the choice behavior is also influenced by the dual effect of culture, personality, time pressure, financial situation and other external factors and stimulus from the product, the symbol and society, the input factors. And in this phase the consumer has high uncertainty and

Journal of Business and Retail Management Research (JBRMR), Vol. 10 Issue 3 July 2016
www.jbrmr.com A Journal of the Academy of Business and Retail Management (ABRM) 71
low confidence; In the concept-obtaining phase, the consumer starts to use category knowledge to judge and learn, affected by internal factors of perception and learning, the consumer’s uncertainty is reduced and the confidence is strengthened; In concept-utilization phase, the consumer has formed the category cognition and has paid attention to the choice of specific commodity, and under the influence of the output factor, he or she forms the actual purchase behavior. In addition, on the basis of this model we improve our own models through empirical literature.
Each model in literature of empirical researches has its own priorities and emphasis. In empirical literatures we have collected, there are three kind models of consumers irrational purchase behavior: one is research irrational purchase behavior from consumer preference starting from product itself; one is led to irrational buying behavior by the external environment impact on consumer sentiment; the other is study the consumer's own psychological characteristics, emotions, self-control as the focus on consumer irrational buying behavior.
Parikshat S. Manhas (2012) proposed Lens model in his paper on consumers irrational purchase behavior, he point that consumers form their own preferences by perceiving outside world then affect their final purchase decision, he also elaborate the performance and reason of consumers irrational purchase behavior. Set product characteristics as a starting point, then product characteristics affect consumer perception and preference; what’s more, preference and price affect purchase behavior together. The model is concise and has universal applicability. Li sha(2016) put forward the formation mechanism model of irrational buying behavior of network consumers under the network environment, they point that positive emotions play completely intermediary role in stimulation between irrational purchase intention; and irrational purchase intention significantly influence irrational purchase behavior without limits to the situational factors. This paper is directly research in the irrational purchase behavior under the network environment, the model of this paper has a direct significance for ours. We detailed the influence factor in this model. Domestic scholar Xiong H.S. (2010) emphasis on exploring the mechanism on consumers own factors in her series study about consumers irrational purchase behavior, moreover, she proposed impulse buying influence factor model. She deems that the emotion of consumers affects their desire of impulsive buying and affects the self-control through standardized assessment, finally affects impulsive buying behavior. She also divide consumer personality traits into self-build, adjustment guide and impulse buying tendency three parts, systematically study the effects of consumer personality traits of impulsive buying behavior. Her research in this paper has been an important part of our conceptual model relating to the personal characteristics.
Basing on consumers’ decision making model, the “Howard-sheth” model, this paper synthesizes and redefines model variables and their relationships in literature. We combined the influential factors in “Howard-sheth” model with consumers’ irrational purchase behavior model in the literature to refine and classify the front-end factors, thereby gaining the concept model in this paper. (Figure 1)

Journal of Business and Retail Management Research (JBRMR), Vol. 10 Issue 3 July 2016
www.jbrmr.com A Journal of the Academy of Business and Retail Management (ABRM) 72
Fig.1. Conceptual model of consumer irrational purchase behavior 3. Data collection, coding and descriptive statistics In this section, meta-analysis is mainly used to analyze the various aspects factors influencing consumer purchasing behavior characteristics. We searched a number of other scholars’ study on consumer irrational purchases behavior and get 19 pairs relationships which are in line with our conceptual model.
3.1 Date collection In order to assure the reliability of date used in meta-analysis, we searched a lot of literature
on consumers’ irrational behavior or irrational buying behavior, not only conclude core journals but also conclude book, magazine and proceedings. At first, we conducted the first round of retrieval work in CNKI, Wan fang Data, CSSCI, CSCD and ProQuest. EBSCO, Springer Link, Google Scholar, the main retrieving content is irrational purchase behavior (impulsive buying, compulsive buying, and excessive buying). By extensive reading literatures we got before, we understand the relationship between consumer irrational buying behavior and demographic characteristics. Furthermore, we conducted the second round of retrieval basing on the content of consumer buying behavior characteristics and conceptual model; key words are impulse, group behavior, quality and price, risk, product awareness, self-control etc. We refer to the book, magazine and proceedings to reduce publication bias and improve the safe factor. Finally, we select all literatures again basing on the following criteria:
-We won’t adopt the paper without complete content or doesn’t give the Pearson correlation coefficient;
-The documents must be empirical research and sample size is large enough; -The main part of documents should be consumers; the content of research should be
consumers’ purchase behavior except investment and game behavior; -The same author of the study in the same context should select only one. Besides those screening criteria, a total of 41 articles were selected for the metal-analysis.
Among the 41 articles, 23 articles are in English and 19 in Chinese. As shown in Table 1.

Journal of Business and Retail Management Research (JBRMR), Vol. 10 Issue 3 July 2016
www.jbrmr.com A Journal of the Academy of Business and Retail Management (ABRM) 73
Table1. The article we used in meta-analysis
3.2 Coding We intensive read all literatures and redefine the similar meaning words, merge the sub-
concepts into the collection concept. Thus, we get ten new concept, which is intention and attitude (IT), psychological traits (PT), social groups (SO), products signal (PS), perceived value (PV), perceived risk (PS), product entity (PE), promotional tools (MT), emotion (EM) and irrational purchase behavior (IB). During the encoding process, we consider that intention or attitude is biased definitions or evaluation of emotion and behavior, so we put those tow concept into new one. Psychological traits are stable characteristics of personal natural; the main research in our paper is honesty, belief, worship, vanity, identity, superiority, self-control, psychological coercion and values. We put factors influencing consumers irrational purchase behavior by others into social groups’ variables, which contain subjective norms, social class, peer influence and social environmental impacts. Products signal is product information and awareness passed on to consumers through the media, which includes brand, price, and package. Product signal and product entity jointly constitute the entire product.
Table2. Main Constructs in proposed model 3.3 Descriptive statistics
We do the descriptive statistics analysis for those 19 pairs relationship in all documents, and

Journal of Business and Retail Management Research (JBRMR), Vol. 10 Issue 3 July 2016
www.jbrmr.com A Journal of the Academy of Business and Retail Management (ABRM) 74
display the related literatures. As shown in Table 3. The range of correlation coefficient is the distribution of correlation coefficient of adopted documents, the mean of correlation coefficient Calculated by the weighted average method.
Table3. The results of descriptive statistics 4. Results
This section we do the result combined separately for a lot of independent research result with the same purpose, which is the most critical step for meta-analysis. Compared with traditional narrative literature review method, meta-analysis originated in Fisher’s thoughts of “p value combined”, it is not only a qualitative description but a quantitative calculation and statistics.
In order to guarantee the accuracy and credibility of combined value, we performed the publication bias analysis and heterogeneity analysis for collected data first. In this paper, we judge the publication bias coefficient by calculating the fail-safe N, which method was based on Rosenthal’s (1979) work of “file drawer problem”: For combined p value’s calculation with k researches, we should strive to know how many research should be added else to make the analysis results without statistically significant. Suppose that we missed a study in our analysis whose average value is zero and the results show very little amount of literature are still required to reverse effect, so we can suspect that the real effect value is zero.
Fisher’s r to Z transformation was conducted Following Wolf’s (1986)
formula1Z 0.5 ln1
r
r
, and then the fail-safe N for 0.05p was calculated using the
formula2
fs 0.05N1.64
Zn
, where the n is the number of tests, and Z is the sum of individual
Z scores what means the hypothesis testing with tow-tailed p test for whether real value is zero. Results of analysis could be accepted When fail-safe N coefficient greater than zero. Calculation results as shown in Table 4. The results show us PT-SO, PT-IB, PS-EM, PS-PV has negative fail-

Journal of Business and Retail Management Research (JBRMR), Vol. 10 Issue 3 July 2016
www.jbrmr.com A Journal of the Academy of Business and Retail Management (ABRM) 75
safe N coefficient that is -1、-4、-3、-4. Generally, we should continue to perform sensitivity
analysis to measure the stability of all data to analyze the cause or increase the number of collected literatures to reduce the bias of combined value while fail-safe N coefficient is unqualified. From calculation results we can see that the data of psychological traits to irrational purchase behavior is dispersion, we cannot judge only by existing data. Due to limitations of study time, we will continue to research those four pairs of relationship in the following study. We are no longer conduct deep analysis in this paper.
Q statistics what is used to judge whether effect has significant and how much influence the random factors make was then conduct to test the homogeneity of the distribution of effect sizes. The formula is:
k2
i ik2 i 1
i i ki 1
ii 1
W YQ W Y - ,i 1 2, ,k, n.
W
( )
,
Where the is weighted of i-research, Yi is the correlation coefficient of i-research after
Fisher’s transforming, k is the number of research. df k-1, 1,2, ,k n ; 2 Q-dfT
C . Where Q
is the observed variation of combined effect value, is expected variation, and is the
excessive variation of combined effect value. T2is the estimated variance of effect value, which represent how much variation in chosen literatures could be used to calculate weights. It is also the diffidence between stochastic model and stationary model. The results of Q statistics are shown in Table 4, and heterogeneity is great of 19 pairs’ relationship in our research, so we adopt stochastic model to calculate the combined effect value in next step. Calculation results are in Table 5.
Table4. Fail-safe N coefficient and Q statistics

Journal of Business and Retail Management Research (JBRMR), Vol. 10 Issue 3 July 2016
www.jbrmr.com A Journal of the Academy of Business and Retail Management (ABRM) 76
Table5.Combined effect value We can get combined effect value P and 95% confidence interval from Table 5, among those,
there are four pairs whose 95% CI contain 0, PT-SO, PT-IB, PS-EM, PR-PV, which means they have no significant correlation between the positive and negative or have manipulated variable between relationship. This situation agrees with Z scores and p test. In the meta-analysis, combined effect value is equal to the converted correlation coefficient. Among the rest 15 pairs relationship, IA-MT, SO-PV, PS-IB, PS-PR, EM-IB are weak related; IA-PT, IA-SO, IA-PS, IA-PE, IA-PR, IA-EM, PT-EM, MT-IB are moderate related; IA-PT, PV-PE are strong related. The relationship associated with perceived risk are all negative, which prove perceived risk will reduce the probability of consumers purchase behavior. It is psychological traits, products signal, promotional tools and emotion who directly related with irrational purchase behavior. The most relevant is the promotional tools, correlation coefficient is 0.368; Second is the emotion, correlation coefficient is 0.239. Path coefficients map is shown in Fig 2.
Fig.2. Path analysis results
Journal of Business and Retail Management Research (JBRMR), Vol. 10 Issue 3 July 2016
www.jbrmr.com A Journal of the Academy of Business and Retail Management (ABRM) 77
We conduct path analysis by AMOS 17.0. Data coming from different research for meta-analysis are have great sample size and different Scale, then we suppose that all concepts in our collected literatures have passed normality test and have been standardized processing. So, we
let 1stddev , mean=0, path coefficient as shown in picture, significance level is 0.05, chi-
square=1199,p<0.05; RMP=0.045; GFI=0.977; NFI=0.976; RMSEA=0.077. The model is better
fit, could be accepted. In order to keep the concise of path coefficient map, we don’t display the errors and the path without pass the significant test or fail-safe N test.
Seeing from path coefficient map, there are 15 significant path having great influence on consumers purchase behavior, social groups→perceived value→intention and attitude→emotion→irrational purchase behavior, promotional tools→intention and attitude→emotion→irrational purchase behavior, psychological traits→intention and attitude→emotion→irrational purchase behavior, product entity→perceived value→intention and attitude→emotion→irrational purchase behavior, etc. See specific path coefficient and effect size in schedule. Among them, there are 3 direct path and promotional tools have greatest influence on irrational purchase behavior, effect value is 0.35; next is emotion, effect value is 0.27; the influence of product signal has on irrational purchase behavior is small, effect value is 0.19. This situation means consumers’ irrational behavior often be affected by external stimuli, but the emotion’s influence on irrational behavior shouldn’t be ignored. Among 12 multi-stage paths, the effect value of “perceived value→intention and attitude→emotion→irrational purchase behavior” is max in three-stage path and next is “product signal→intention and attitude→emotion→irrational purchase behavior”; while, “product entity→perceived value→intention and attitude→emotion→irrational purchase behavior” affect value is maxin four-stage path. This means product entity and product signal are the most important determinants of irrational purchase behavior, consumer will give up buying goods when the product comprehensive evaluation can’t reach the minimum satisfied standard. Essentially, consumers purchase behavior original from products or its services. Nevertheless, “perceived risk→intention and attitude→emotion→irrational purchase behavior” is negative path, the probability of irrational purchase behavior become slight while the perceived risk increase. Meanwhile, there are several multi-step and significant paths, the influence of social group to consumer irrational purchase behavior is indirect, long-term, and unconscious.
5. Discussion and Conclusions Rational consumption is necessary for a market economy and irrational consumption is
inevitable under certain conditions, since consumers have irrational consumer behavior so we have to face up to this behavior. With the changing of consumer behavior companies provide a wide variety of marketing method, which bring more benefits for the enterprise but also induce more consumers irrational purchase behavior. Aiming at consumers’ irrational purchasing behavior we research formation process and factors, and give the corresponding management recommendations.
In this paper, some related meta-analysis literature find that there are three direct factors can affect consumers irrational purchase behavior: manufacturers’ promotional tools, customer emotions and product signal. Among them the promotional tools have the biggest impact, that explains why irrational buying behavior of consumers particularly susceptible to their surrounding business environment, resulting in unplanned purchases; Followed by customer
emotions, that is in line with previous academic research on emotion-oriented, which is, people in unstable situations prone to impulse buying mood, and this impulse led to the consumers' purchase behaviors without a comprehensive understanding of the situation; and then product signal, this factor is the existence of objective factors, has no actively influence on the irrational

Journal of Business and Retail Management Research (JBRMR), Vol. 10 Issue 3 July 2016
www.jbrmr.com A Journal of the Academy of Business and Retail Management (ABRM) 78
purchasing behavior of consumers, but as a consumer product access to information sources, can make a greater impact on consumer behavior. Other factors effect on consumer irrational purchase behavior has formed more than 12 multi-stage path, and “perceived value →intention and attitude →emotion →irrational purchase behavior” is the path effect maximally.
Secondly, in the process of researching meta-analysis, we even find that every scholars have given their own exactly opposite conclusion with each other’s in many relevant literature
about customer psychological traits effect on their irrational purchase behavior,this finding
could explain the consumers psychological traits effect is compare complex, so the current researching on it may have missed some important intermediate variables.
Finally, there are still many unknown factors impact on customer irrational purchase behavior, such as :perceived risk, social groups, perceived value, intention and attitude, emotion and product entity, these variable factors acting on the study of irrational purchase behavior obviously.
According to literature, we find perfectly rational behavior of consumers cannot be achieved only can realize in some certain limits, therefore, irrational According to literature, we find perfectly rational behavior ofconsumers cannot be achieved only can realize in some certain limits , therefore, irrational purchasing behavior is inevitable in reality when making purchasing decisions, which has indispensable significance to enterprises. Enterprise should has a correct view of irrational consumer purchasing behavior characteristics, rational use of irrational buying behavior incentive to actively expand marketing activities. This paper about consumers irrational purchase behavior and its mechanism of production are of great significance, concrete manifestations are shown as follows:
Enterprise operator can take advantage of irrational buying behavior of consumers to promote their new products and services. They can make full use of the product and the product signal affect entity intent attitudes and emotions, and guide consumers irrational purchase behavior (impulsive buying), to increase the tentative consumption of consumers for new product or new service. Simultaneously, Provide different products for different people in different market segments with different product signal released method. For example, young people would be used low-cost promotional method with social platforms, and the elderly can used product imagination method and other relationship marketing to accelerate signal diffusion, it’s both low-cost and targeted.
Enterprises’ managers are also able to focus on consumer’s experience when sale products, or in the after-sales service process, which not only can improve consumers intention and attitude towards products and services but can reduce the severity of perceived risk to guide irrational purchase behavior (compulsive buying), to increase customer’s loyalty of existing commodities, enhance brand value and consumer confidence to buy again, and ultimately to promote product sales.
Mangers also can continue to strengthen the use of various of promotional tools, have strong emotional and visual effects to consumers to form a mental impulse or the idea of gaining extra advantage, stimulate the buying desire and facilitate consumers irrational purchase behavior (excessive buying), increase the contribution of individual customer. Such as providing low-cost discount in off-season, on one hand, it can help stimulate consumption and facilitate transactions; on the other hand, it also can avoid loss of profits which caused by long-term discount and low-end products brand image.
6. Research limitations and direction for future research In this paper, there are two deficiencies what could be the point of feature research: there
are four pair correlation coefficient cannot through the publication bias in our meta-analysis, we

Journal of Business and Retail Management Research (JBRMR), Vol. 10 Issue 3 July 2016
www.jbrmr.com A Journal of the Academy of Business and Retail Management (ABRM) 79
accept the revised correlation coefficient but without depth analysis of the causes of publication bias; what’s more, we find some vacancies or manipulated variables on the consumer irrational buying behavior through path-analysis, but our paper can’t give definitive findings about this Reference Ajzen I., & Fishbein M. (1977). Attitude-behavior Relations: A Theoretical Analysis and Review of
Empirical Research. Psychological Bulletin, 84(5), 888-918. Andreas, Hinterhuber. (2015). Violations of rational choice principles in pricing decisions. Industrial
Marketing Management, 2, 1-10. Chen J. (2012). About the discussion of impulse buying and compulsive buying organic union. Special zone
economy, 12, 299-300. Chen W.H. (2014). Consumer behavior. Beijing: Peking University press, 37-38. Fei M. S., & Yang Y. N. (2013). Consumer behavior. Beijing: People's posts press, 69-70. Fu H. W., Qu L.C. (2013). The empirical research of shipping companies’ irrational investment behavior
influence factor. Navigation of China, 02, 124-128. Henry, Assael, PhD. (1974). Product Classification and the theory of consumer behavior. Journal of the
academy of marketing science, 2(4), 539-552. He D.A. (2005). Rational choice to irrational choice behavior analysis. Economic research, 08, 73-83. He X.G. (2015). Securities market regulators irrational behavior research. The journal of central university of
finance and economics, 02, 24-32. Howard J.A., & Sheth J.N., (1989). The Theory of Buyer Behavior. Wilcy, New York NY, 33-34. Li sha, Dai J.H., Yu Y.Y., The irrational purchase behavior of experimental research under the network
environment. Commercial economy research, 02:33-36. Li G.C., Wu M.H, & Yu X.J. (2013). Meta Introduction to analysis. Beijing: Science press, 01:51-56.
Liu J.G., & Liu Y.S. (2006). Irrational consume behavior theory and empirical analysis. Consume economy, 01, 85-88.
Lourenc¸ oLeite P., Pereira, V.M., Nardi A.E., &Silva, A. C. (2014). Psychotherapy for compulsive buying disorder: A systematic review. Psychiatry Research. Advance online publication. 05,037.
Parikshat S, Manhas. (2012). A review and conceptual framework of 'irrational influences' on consumer purchase behavior. Pranjana, 1, 15-15
Qin Z.Q. (2005). Cognitive deviation and rational choice basing on "the ultimatum game experiments of cognitive game. Nankai economic research, 01, 15-22.
Rosenthal, R. (1979).The File drawer problem and tolerance for null results. Psychological Bulletin, 86,638-641.
Su Z. (2011). Rational and irrational game: the evolution of modern investment decision theory. Seeking truth, 04, 70-76.
Walter, van, & Waterschoot. (2008). Consumer learning and its impact on store format selection. Journal of Retailing and Consumer Services, 15, 194-210
Wang J. (2014). Human rational economic. Commercial age, 06, 41-42. WuJ.M.& Wang S.C. What drives mobile commerce? An empirical evaluation of the revised technology
acceptance model. Information and Management, 42(5), 719-729. Wu X., liu J.H., & Yang L.F. (2011). A-stock index futures investors’ irrational behavior research. Special
zone economy, 05,115-116. Wolf, F.M. (1986). Meta-analysis: Quantitative methods for research synthesis. Beverly Hills, CA: Sage,81-
94. Xiong S. H., & Jing F.J. (2010). The new exploration and model building of impulse buying influence
factors. Foreign economic and management, 32(5), 56-64. Zeithaml V. (1988). Consumer Perceptions of Price, Quality, and Value: A Means-End Model and
Synthesis of Evidence, Journal of Marketing, 52 (7), pp.2-22. Zhou W.Y., & Hu F. (2014). Irrational factors in the process of research on cognitive value deviation affect
the differences of the empirical research. Science and technology management, 04, 26-34.

Journal of Business and Retail Management Research (JBRMR), Vol. 10 Issue 3 July 2016
www.jbrmr.com A Journal of the Academy of Business and Retail Management (ABRM) 80
Appendix
Combined effect value of pair wise relationship Annotation: “Lacking of studies” means we can’t find related studies in our literature retrieving;
“unconfirmed” means results in related studies are opposite and mismatch the condition of combined analysis.

Journal of Business and Retail Management Research (JBRMR), Vol. 10 Issue 3 July 2016
www.jbrmr.com A Journal of the Academy of Business and Retail Management (ABRM) 81
The making of an entrepreneur: aligning institutional paradigm to the industry needs
Rodrigo M. Velasco Gulf College, Oman
Keywords Student-Entrepreneur, Entrepreneurship, Curriculum Development, Entrepreneurial Development
Abstract Entrepreneurship is seen as a more viable solution that will both boost the economy and decrease
unemployment indices in the Philippines. Researches show that education plays a very crucial role in the development of entrepreneurs. The Commission on Higher Education (CHED) ranked Business Administration and related program as the most populous program. The challenge is then left to the quality of business education programs of the Higher Education Institutions (HEIs).
The paper assessed the significant differences in the responses of entrepreneurship students, teachers and selected entrepreneurs in attitudes and values needed to become successful entrepreneur, business skills needed to develop entrepreneurial spirit, training programs to develop entrepreneurial abilities and expectations on when to become entrepreneur. Descriptive approach was utilized through a self-made survey questionnaire. Participants were selected students and professors of colleges and universities offering Entrepreneurship and selected entrepreneurs within Quezon and Laguna Provinces in the Philippines. As taken collectively, the four (4) parameters resulted to a significant difference using ANOVA. Results were summarized as: what the teachers taught was neither what the students learned nor what the entrepreneurs need.
There is a gap between theory and practice of entrepreneurship that challenges business schools. School administrators must revisit curriculum and input programs with long-range impact on the students. More practical approaches to teaching and learning should be moderated in place of theoretical methods. Business schools must work hand in hand with local entrepreneurs and industries to equip students with more recent industry trends and practically realistic approaches to business ventures.
Introduction The Philippines is plagued with too many economic problems pressing its citizens to find recourse not only to address poverty but sustain growth and development. Entrepreneurship is seen as a more viable solution that will both boost the economy and decrease unemployment indices. As a matter of fact, the July 2013 Labor Force Survey (LFS) of the Philippine National Statistics Office (NSO) revealed that 41.178 million out of the 64.468 million aged 15 years and over were in the labor force. This made up the employment rate of 92.7 percent of which 28.3 percent is attributed to the self-employed sector.
A college diploma is a necessary passport for an affluent career in the Philippines. However, economics of education show that there is oversupply of college graduates to fill in the demand for workers. Thus, all roads lead to mismatch, underemployment and unemployment. The International Labor Organization’s Youth Employment Networks (YEN) expects that young people who are actively seeking to participate in the world of work are two to three times more likely than the older generations to find themselves unemployed (ILO, 2006). Graduates are then encouraged to venture into entrepreneurship as the most logical solution to being unwaged. Perhaps, this is the underlying notion that led to booming enrollees in business education programs.

Journal of Business and Retail Management Research (JBRMR), Vol. 10 Issue 3 July 2016
www.jbrmr.com A Journal of the Academy of Business and Retail Management (ABRM) 82
The Commission on Higher Education (CHED) ranked Business Administration and related program as the most populous program for S.Y. 2013 – 2014 with a total enrollment of 970,558. Additionally, of the 553,706 college graduates of 2014, Business Administration and related courses topped the list with 142,061. The country is anchored on a belief that these business graduates will act as a leverage to boost the economy through the inculcation of entrepreneurship. Upholding entrepreneurial career has been founded on the Philippine Labor and Employment Plan 2011 – 2016. It supports the growth of entrepreneurship through implementation of community based entrepreneurial activities, transformation of livelihood undertakings of workers groups into community enterprises through public-private partnerships and transformation of knowledge-based workers into suppliers of products and services. The challenge is then left to the quality of business education programs of the Higher Education Institutions (HEIs).
Developing entrepreneurial mind-set can be done by integrating entrepreneurship into education system. In the United States, entrepreneurship education is a fast growing area in colleges and universities. Many universities offer at least one course in entrepreneurship at the graduate and undergraduate level and few actually have a major or minor concentration in the area of entrepreneurship (Hisrich, Peters & Sheperd, 2005). The focus on jobs, labor markets, and cost structures should not make universities lose sight of their larger role of creating global citizens who can also make authentic contributions to the development of their own countries and the larger regional economy in a plethora of ways that include contributing to the labor market, civil society, and community development (Daniel and Uvalic-Trumbic 2008). The ability of the business schools to develop young entrepreneurs is then put to test. Questions linger on the business curricula and the current trends and actual scenarios in the entrepreneurial world. The CHED standards for entrepreneurship programs in the Philippines embody a very promising paradigm for the role of business schools in the proper orientation and motivation of budding entrepreneurs. More than the need for theoretical mastery, attitudes and values need to be developed. As such, entrepreneurship programs aim to develop entrepreneurs who are motivated and knowledgeable in identifying opportunities, developing and preparing business plans and actually starting and managing a business. At the end of the course, graduates are expected to have the orientation and motivation of an entrepreneur, identify business opportunities, prepare business plans, accomplish requirements to start a business and operate and manage a business efficiently and effectively. On such a profound task, the study of Bignotia (2014) revealed that out of 16 entrepreneurship graduates of St. Paul University surveyed, only 3 (18.75%) established a business. Meanwhile, only 26 (23%) of the total 111 entrepreneurial education graduates of a University in Manila, Philippines traced by de Ocampo, Bagano & Tan (2012) were self-employed . This sends an underlying discrepancy between the process and the output of the entrepreneurship programs.
Researches show that education plays a very crucial role in the development of entrepreneurs. Higher levels of education can give entrepreneurs the confidence, motivation and skills to own more than one business (Achim, Popescu & Kadar, 2010). Since entrepreneurship represents a crucial element of today’s society, as it contributes to job creation and growth, increases competitiveness, boosts and fulfills individual potential, and moreover, responsible entrepreneurship serves societal interests, it follows naturally that educators should turn their attention to integrating this component into the school curricula (European Council, 2010). Business educators are expected to be aware of the current entrepreneurial trends and link their classrooms with the realms of realities. The very dynamic local business climate should be

Journal of Business and Retail Management Research (JBRMR), Vol. 10 Issue 3 July 2016
www.jbrmr.com A Journal of the Academy of Business and Retail Management (ABRM) 83
brought to the table for student-entrepreneurs to shift their paradigms from theories to realities. Without exaggeration one can argue that there is a discrepancy between the substantial
amount of resources invested in entrepreneurship education programs – at various levels, for different target groups and with competing learning approaches – and the very limited amount invested in the evaluation of these programs (Braun, 2010). In this context, this study was conceptualized. The researcher believes that school curricula for entrepreneurship are constrained to theoretical discussions, seminar sessions and written assessments. This study will then correlate what entrepreneurship students learn, what teachers taught them to be and what made selected entrepreneurs successful.
The study aims to find significant differences in the responses of entrepreneurship students, teachers and selected entrepreneurs in: (1) attitudes and values needed to become successful entrepreneur; (2) business skills needed to develop entrepreneurial spirit; (3) training programs to develop abilities; and (4) expectations on when to become entrepreneur. The researcher believes that the study is deemed very vital in enhancing entrepreneurship programs in the Philippines. It will provide a backgrounder on the missing link between the institutional paradigm and the industry needs.
Review of Related Literature Entrepreneurship education has a vital role in guiding all learners to become more
entrepreneurial-minded (Hegarty, 2006). In the Philippines, the CHED sees entrepreneurship education as a means to create employers not employees after obtaining college diploma. It has envisioned that graduates will be trained and developed with all the necessary values and skills to take risks in venturing into business. But the road to the delivery of entrepreneurship education by HEIs has been fraught with many challenges and even competing ideologies and pedagogies. Its effectiveness in producing “entrepreneurs” remains to be empirically proven and felt in the coming years (de Ocampo, Bagano & Tan, 2012).
The study of de Ocampo, Bagano & Tan (2012) which was based from part of a larger Graduate Tracer Study (GTS) of the business school of a large university based in the Philippines traced graduates who have actually opened up new businesses. Of the total 111 entrepreneurial education graduates, only 26 (23%) became self-employed who either started their own business and/or helping their existing family business. Most (37%) of the entrepreneurs, started their business less than one year after graduation while a little over half (53%) are not self-started business, while the remaining 46% are self-started ones.
The study further revealed that graduates find opportunity seeking (82%), goal-setting (78%), systematic planning and monitoring (68%), risk taking (64%), and self-confidence (57%) as the most important personal entrepreneurial competencies. With regards to generic competencies, they found communication skills (82%), entrepreneurial skills (75%), human relations skills (61%), problem solving skills (43%), and critical thinking skills (43%) as the most important. As concluded, entrepreneurship education, although still minimal, contributes to the young graduates’ predisposition towards entrepreneurial careers. Most young people still prefer the security of tenure in a job through the employment route, at least shortly after graduation. It appears that the culture of entrepreneurship still needs to take root in the mind-set of the Filipino youth. Almost same findings were generated from the study of Bignotia (2014). The study was pursued to determine the Entrepreneurial engagement of St. Paul University Manila Entrepreneurship graduates Batches 2008 to 20012. The study’s focal concern is to find out the number of entrepreneurial ventures of the graduates right after graduating from the University. From a total of 24 participants, 16 graduates responded. Of the 16 who participated, only 3

Journal of Business and Retail Management Research (JBRMR), Vol. 10 Issue 3 July 2016
www.jbrmr.com A Journal of the Academy of Business and Retail Management (ABRM) 84
(18.75%) were self-employed though 5 (31.25%) attempted to put up an entrepreneurial venture. The Entrepreneurship curriculum that helped the respondents to become an entrepreneur showed Business Implementation, Business Opportunities 2 and Accounting subjects as the most helpful. The graduates recommended improvements in the curriculum of BS Entrepreneurship to enable SPU Manila graduates to engage in entrepreneurial ventures after graduation. The data revealed that most of the respondents recommended exposure to actual business operation be part of the curriculum, increase the students attendance to trainings and seminars as well as activities where students can meet and experience different kinds of people that will eventually help them in putting up their own business. The data also revealed that graduates wanted a “real business” in their Business Implementation and that the University should create a program where the students can put up their own small business as part of the curriculum or as an alternative to thesis. Philippines is not the only country with concerns on the entrepreneurial undertakings of business graduates. For instance, HongYan and YuJie (2010) surveyed a total of 1,103 university students on their entrepreneurial quality and ability in China. The students thought that the main obstacles of entrepreneurial activities are insufficient funds (81.60%), lack of entrepreneurial experience (75.79%) and less social relationships (66.27%). As to the ability of the students, communication and coordination ability (60%), ability to organize and plan (43.33%), and managerial ability (40%) were the top competencies. As to the attitudes, honest sincerity (60%), sense of mission and responsibility (56.67%) and firm and indomitable character (56.66%) were cultivated. In Indonesia, research was conducted by Abduh, Maritz & Rushworth (2012) on 15 lecturers of entrepreneurship and 189 students from seven faculties in Bengkulu University. Results showed that business plan, business opportunities recognition, business development strategy and financial analysis were found to be perceived as the most important units of study. Furthermore, business field practice, conducting field research, and preparing a business plan were most highly valued.
Lorz (2011) assessed the impact of entrepreneurship education to entrepreneurial intention in Germany. Results proved that entrepreneurship education only impacted perceived behavioural control. Attitude toward behaviour, subjective norms and entrepreneurial intention did not change significantly. The analysis of the development of the attitudes and entrepreneurial intention over time within the four-semester programme indicated that the impact of entrepreneurship education was strongest at the beginning of the programme, especially with regard to perceived behavioural control, the intensity of impact decreased with the length of the programme. Perhaps, bringing up a person to an environment of what is called “enterprise culture” can significantly affect a person’s attitudes, values and beliefs that lead him/her to act like an entrepreneur (Bignotia, 2014).
Various researches prove relationship between entrepreneurial knowledge and identification of entrepreneurial opportunities (Shepherd & DeTienne, 2005). Entrepreneurial education programs are source of entrepreneurial attitude and overall intentions to become future entrepreneur (Souitaris, Zerbinati, & Al-Laham, 2007). The fostering of entrepreneurial vision in students should be placed at the core of modern tertiary education. Consequently, syllabus of a typical university course on entrepreneurship should aim at identifying and mobilizing creative talent, enabling students to overcome hesitation and transforming their theoretical knowledge into innovative ideas and practical solutions (Achim, Popescu & Kadar, 2010). It means that more and better entrepreneurship education would affect more and more entrepreneurs (Matlay, 2008).

Journal of Business and Retail Management Research (JBRMR), Vol. 10 Issue 3 July 2016
www.jbrmr.com A Journal of the Academy of Business and Retail Management (ABRM) 85
Kilasi (2013) recommends that entrepreneurship education should be tailored to enhance skills. This should go hand-in-hand with the establishment of boundary crossings between academia and emerging labor market. Donor-oriented projects should be well-negotiated between partners so that entrepreneurship education initiatives are tailored to suit the local context. In addition, Achim, Popescu & Kadar (2010) expect that colleges and universities create a proactive campus environment to foster entrepreneurial mindset, create incubation programmes for graduates who would like to start on their own, organize information and counselling campaigns on campus, and set up “virtual enterprises” on campus.
Methodology The study used descriptive method of research using survey tool as the primary means
of gathering data. The researcher devised a one-page self-made structured questionnaire written in English. The questionnaire is composed of two portions: (1) personal/business profile and (2) assessment of attitudes, business skills, training programs and expectations on being entrepreneurs. Open-ended questions were devised for the second portion of the tool as per the nature of the respondents. The three (3) sets of respondents: students, teachers and entrepreneurs, were given same concepts of survey tool. Questions for students refer to what they have learned from their major subjects while for the teachers those pertain to what they have taught their students. For the selected entrepreneurs, the tool probes on what developed them to be successful.
The respondents of the study are 342 students from 3 public and private HEIs in Quezon and Laguna Provinces, 15 major subjects’ lectures of the three (3) schools and 76 entrepreneurs from different towns in Quezon Province for a total of 433. The participating schools include a community college, a state-run university provincial campus and a private college. These were the few schools offering entrepreneurship course in Quezon and Laguna Provinces. The distribution of respondents shows that state and local schools have higher enrollees than private institutions as reflected by 226 students from state university, 113 from local college and three (3) from a private college. The sample comprised a complete enumeration of the third and fourth year BS Entrepreneurship students of each school. Meanwhile, distribution of the teacher-respondents shows a limited student-teacher ratio in all major contents of the course. Both the state and local run schools have six (6) teacher-respondents while three (3) from private college.
The entrepreneur-respondents were owners and/or managers of different establishments within Quezon Province. The sectoral distribution of the types of business entrepreneur-respondents are engaged include General Merchandise (17), Bread and Pastries (7), Convenience Stores (6), Motor Vehicle Parts and Accessories (5), Ready-made embroidered garments (4), Footwear & RTW (4), Computer Services (4), Food Processing (3), Hardware (3), Household Products (2), Pharmacy (2), Office and School Supplies (2), Purified Drinking Water (2), Poultry (2), Rice Dealers (2), Jewelry Shop (2), Funeral Services (2), Motor Vehicles and Accessories (1), Burger Stand (1), Textile & Upholstery Supplies (1), Telecommunications (1), Flower Arrangements (1), Hotel & Resort (1) and Resto-Bar (1).
The selection of entrepreneurs was based on ability and willingness. Many establishments were surveyed however owners were not willing to partake in the study. A total of 76 entrepreneurs responded for the purpose of the study. General merchandise business obtains the highest number respondents of 17 followed by breads and pastries (7) and convenience stores (6).
The researcher and some enumerators gathered and collected the data. They personally visited the schools and establishments to conduct the survey from the period February 2014 – December 2014. The researcher and the enumerators found challenges on setting appointments

Journal of Business and Retail Management Research (JBRMR), Vol. 10 Issue 3 July 2016
www.jbrmr.com A Journal of the Academy of Business and Retail Management (ABRM) 86
with entrepreneurs and retrieving questionnaires from teachers and some students. Respondents’ specific responses were in the form of exact word, phrases and/or complete sentences. The researcher then categorized, grouped and clustered the multiple responses accordingly. Analysis of Variance (ANOVA) was used to test the significant differences in the responses of the three (3) sets of respondents.
Results and Discussion 1. Attitudes and values needed to become successful entrepreneur Asked on the attitudes and values the students had cultivated on their stay in the
entrepreneurship programs, friendly (70), thrifty (53), innovative (52), self-confident (48) and responsible (42) topped the list as shown in Table 1. The teachers, on the other hand, believed that they had instilled innovative and creative (6), positive (5), honest (5), friendly (5) and goal-oriented (4) characters to their students. However, selected entrepreneurs believe that industrious (61), persevering (38), optimistic (37), creative (34) and trustworthy (33) attitudes are needed to become successful entrepreneur. Among the qualities shared by the students, teachers and entrepreneurs include innovative/creative, risk-taker, optimistic, confident and industrious. The results further showed that qualities such as friendly, confident, honest, goal-oriented, resourceful, responsible and prompt/time conscious were successfully instilled by the teachers to the students. Meanwhile, students and entrepreneurs share common qualities on being thrifty, patient, persevering and open-minded.
Table 1 Comparative ‘Attitudes and Values’ of Students, Teachers and Entrepreneurs

Journal of Business and Retail Management Research (JBRMR), Vol. 10 Issue 3 July 2016
www.jbrmr.com A Journal of the Academy of Business and Retail Management (ABRM) 87
2. Business skills needed to develop entrepreneurial spirit Communication is deemed very vital skill as perceived by the entrepreneurship students, teachers and selected entrepreneurs with combined responses of 193 as being shown in Table 2. It was ranked first (136) by the students, second (52) by the entrepreneurs and third (5) by the teachers. Other business skills casted by the teachers to their students which entrepreneurs perceived as necessary for entrepreneurial growth include marketing and selling with combined responses of 124, leadership and management with 93, planning and decision making with 65 and budgeting and accounting with 44.
Table 2 Comparative Business Skills possessed by students, taught by teachers and needed by entrepreneurs
Students F R Teachers F R Entrepreneurs F R
Communication Skills 136 1 Creativity and Innovation on product development
10 1 Leadership and management skills
55 1
Marketing and Selling Skills
67 2 Leadership and management skills
6 2 Communication Skills 52 2
Creativity and Innovation on product development
52 3 Communication Skills 5 3 Marketing and Selling Skills
34 3
Planning and decision making skills
45 4 Marketing and Selling Skills
5 4 Budgeting and accounting skills
16 4
Leadership and management skills
32 5 Planning and decision making skills
4 5 Technical skills 11 5
Budgeting and accounting skills
25 6 Budgeting and accounting skills
3 6 Planning and decision making skills
5 6
Feasibility studies and business research
19 7 Feasibility studies and business research
1 7
The entrepreneurs believe that technical skill is needed to be successful in any venture. However, teachers and students agree on creativity and innovation on product development and feasibility studies and business research as both needed for entrepreneurial ventures. Interestingly, teachers and students both ranked creativity and innovation on product development higher but entrepreneurs see less weight on its impact on the success of the entrepreneurial venture.
3. Training programs to develop entrepreneurial abilities Students, teachers and entrepreneurs agreed that seminars and trainings is the most important program for the total development of an entrepreneur. Additionally, the results clearly show that the teachers are imposing mixed theoretical and practical trainings with the students. The teachers ranked case analysis and class presentations (2nd), business implementation (3rd), livelihood programs (4th) and tours/company visits (5th) as commonly implemented programs in schools. The students, on the other hand, ranked livelihood programs (2nd), networking business (3rd), internal/external student organizations (4th) and trade fairs/exhibits (5th) as programs that trained and motivated them to be future entrepreneurs. Table 3 summarizes the results.

Journal of Business and Retail Management Research (JBRMR), Vol. 10 Issue 3 July 2016
www.jbrmr.com A Journal of the Academy of Business and Retail Management (ABRM) 88
Table 3 Comparative Training Programs experienced by students, given by teachers and needed to become entrepreneur
Students F R Teachers F R Entrepreneurs F R
Seminars and trainings 136 1 Seminars and trainings
10 1 Seminars and trainings
38 1
Livelihood programs 23 2 Case analysis and class presentations
4 2 Customer relations
37 2
Networking business 16 3 Business implementation
3 3 Marketing and selling
33 3
Internal and external student organizations
9 4 Livelihood programs
2 4.5 Livelihood programs
13 4
Trade Fairs and exhibits
7 5 Tours and company visits
2 4.5 Accounting Literacy
4 5
Consultations with industry experts
6 6 Consultations with industry experts
1 6.5 Network with government
1 6.5
Business integration programs
4 7 Business integration programs
1 6.5 Business integration programs
1 6.5
Business presentations 3 8
Tours and company visits
1 9
Selected entrepreneurs see the need for a more specific training program to become successful in doing business. They ranked customer relations (2nd), marketing and selling (3rd), livelihood programs (4th) and accounting literacy (5th) as necessary preparations for a more effective entrepreneurial management. Meanwhile, it is quite mystifying that business integration program was ranked the least by all respondents. Integration programs give students an actual opportunity to put up and manage a small business within the campus.
4. Expectations on when to become entrepreneur Table 4 Comparative expectations to become entrepreneur
Students F R Teachers F R Entrepreneurs F R
After Graduation
240 1 After Graduation
12 1 After being an employee
54 1
After being Employee
93 2 After being Employee
3 2 Inherited from Family
20 2
After Other careers
6 3 After college graduation
2 3
After Further studies
3 4
Students were asked about their plans after graduation and results show that majority (240) of them want to be entrepreneurs after obtaining their degree. Other students are actually convinced that they will not be self-employed at once because the path they are headed to include employees (93), other careers (6) and further studies (3). The teachers, on the other hand, are still optimistic that students will be entrepreneurs right after graduation. Three of the teachers firmly believe the reality that they will be plain employees first.

Journal of Business and Retail Management Research (JBRMR), Vol. 10 Issue 3 July 2016
www.jbrmr.com A Journal of the Academy of Business and Retail Management (ABRM) 89
The experience of the entrepreneurs show that majority (54) of them started their business after hurdling the world of work and only two (2) started their business after finishing their college degree. Still, family has a strong influence in entrepreneurial intention as depicted by 20 respondents who just continued a family business. Results imply that entrepreneurship students who opted to work after completing a degree have all the possibilities to find their way back to successful entrepreneurship.
Table 5 Single factor ANOVA on the Responses made by the Students, Teachers, and Entrepreneurs
Variables F Computed Value
F Critical Value Decision Verbal Interpretation
Students Teachers Entrepreneurs
3.8469 1.8898 Reject Ho With Significant Difference
The four (4) parameters tested for significant difference resulted to an F computed value of 3.8469 as against the F critical value of 1.8898 which implies significant difference in the responses of students, teachers and entrepreneurs. Analysis of Variance (ANOVA) of the parameters (see appendices) showed that responses of the three (3) sets of respondents have high significant difference in attitudes and entrepreneurial expectations.
Business gurus and countless researchers suggest on the necessary attitudes and values that students must possess in order to become a successful entrepreneur. On the other hand, mentors and lecturers have their immense share in building the fundamentals of students’ life cycle as entrepreneurs. The current study added much to the entrepreneurial literature on the highly significant differences in the mentoring programs of colleges and universities. The results evidently pose a major gap between what mentors should impart and what students should acquire to be better entrepreneurs. It is apparent that business schools prepare student-entrepreneurs with the highest form of idealism without linking curriculums with the real life drama of entrepreneurship. The teachers’ theoretical paradigm and the entrepreneurs’ practical perspective held student-entrepreneurs captives in the puzzling end.
Both the business skills and training programs need to be revisited due to discrepancies in the responses. Teachers impose programs which are handy and not beyond the capacity and resources of the institution. Meanwhile, entrepreneurs go beyond the borderline. It is seemingly lucid that they pertain to business skills and training programs with long-range impact on entrepreneurial venture. While the areas of concentration on business schools are on exposure and motivational trainings, the entrepreneurs expect more of a capability building with innate effect on students. These results posed a great challenge for business schools to revisit core contents of entrepreneurship programs and consider modifications relevant to the industry needs and trends.
As students enter into entrepreneurship program, they need to become entrepreneurs at the end of their baccalaureate educational journey. This is the idealistic expectation. However as the realistic implications of subsequent events as perceived by the selected successful entrepreneurs, timing is really a matter of preparation not by urgency. Most of the entrepreneurs experienced the corporate world prior to their entrepreneurial engagement. As the test of resilience leads them to their proper paths, school foundation is not put in vain. The teachers then should realistically balance the world of entrepreneurial opportunities and capabilities.
Conclusion and Recommendation The paper assessed the significant differences in the responses of entrepreneurship
students, teachers and selected entrepreneurs in attitudes and values needed to become
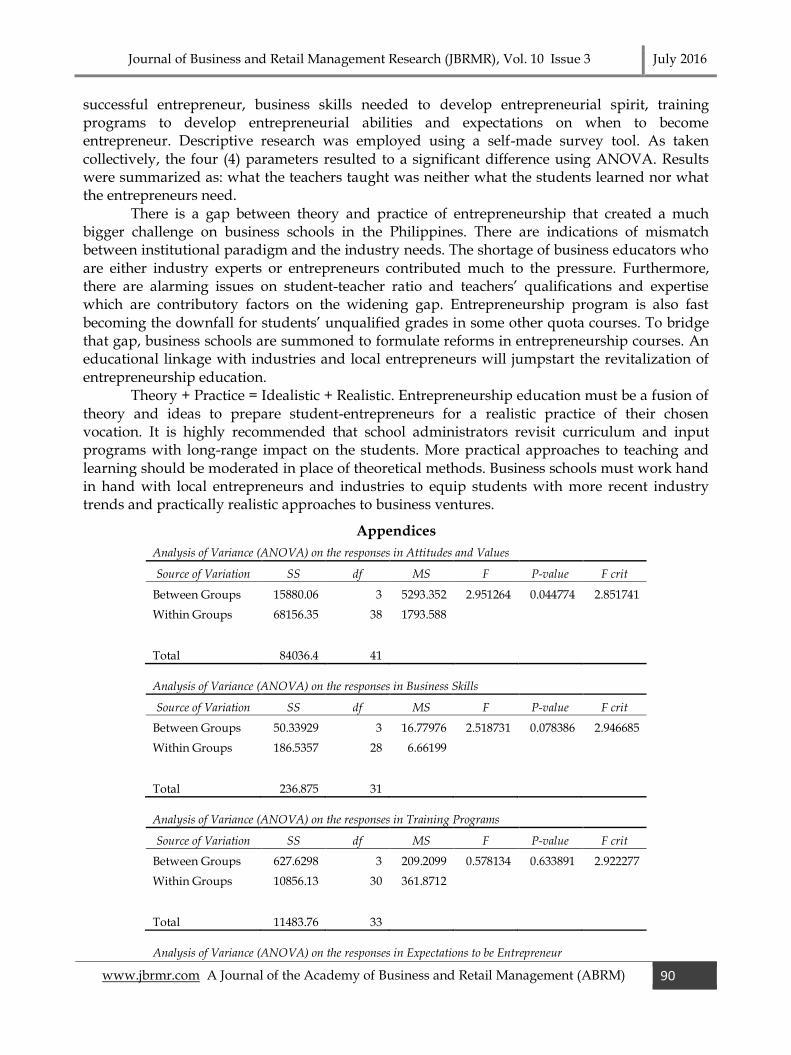
Journal of Business and Retail Management Research (JBRMR), Vol. 10 Issue 3 July 2016
www.jbrmr.com A Journal of the Academy of Business and Retail Management (ABRM) 90
successful entrepreneur, business skills needed to develop entrepreneurial spirit, training programs to develop entrepreneurial abilities and expectations on when to become entrepreneur. Descriptive research was employed using a self-made survey tool. As taken collectively, the four (4) parameters resulted to a significant difference using ANOVA. Results were summarized as: what the teachers taught was neither what the students learned nor what the entrepreneurs need.
There is a gap between theory and practice of entrepreneurship that created a much bigger challenge on business schools in the Philippines. There are indications of mismatch between institutional paradigm and the industry needs. The shortage of business educators who are either industry experts or entrepreneurs contributed much to the pressure. Furthermore, there are alarming issues on student-teacher ratio and teachers’ qualifications and expertise which are contributory factors on the widening gap. Entrepreneurship program is also fast becoming the downfall for students’ unqualified grades in some other quota courses. To bridge that gap, business schools are summoned to formulate reforms in entrepreneurship courses. An educational linkage with industries and local entrepreneurs will jumpstart the revitalization of entrepreneurship education.
Theory + Practice = Idealistic + Realistic. Entrepreneurship education must be a fusion of theory and ideas to prepare student-entrepreneurs for a realistic practice of their chosen vocation. It is highly recommended that school administrators revisit curriculum and input programs with long-range impact on the students. More practical approaches to teaching and learning should be moderated in place of theoretical methods. Business schools must work hand in hand with local entrepreneurs and industries to equip students with more recent industry trends and practically realistic approaches to business ventures.
Appendices
Analysis of Variance (ANOVA) on the responses in Attitudes and Values
Source of Variation SS df MS F P-value F crit
Between Groups 15880.06 3 5293.352 2.951264 0.044774 2.851741
Within Groups 68156.35 38 1793.588
Total 84036.4 41
Analysis of Variance (ANOVA) on the responses in Business Skills
Source of Variation SS df MS F P-value F crit
Between Groups 50.33929 3 16.77976 2.518731 0.078386 2.946685
Within Groups 186.5357 28 6.66199
Total 236.875 31
Analysis of Variance (ANOVA) on the responses in Training Programs
Source of Variation SS df MS F P-value F crit
Between Groups 627.6298 3 209.2099 0.578134 0.633891 2.922277
Within Groups 10856.13 30 361.8712
Total 11483.76 33
Analysis of Variance (ANOVA) on the responses in Expectations to be Entrepreneur

Journal of Business and Retail Management Research (JBRMR), Vol. 10 Issue 3 July 2016
www.jbrmr.com A Journal of the Academy of Business and Retail Management (ABRM) 91
Source of Variation SS df MS F P-value F crit
Between Groups 34910.42 11 3173.674 3.846926 0.000133 1.8898
Within Groups 79199.02 96 824.9898
Total 114109.4 107
Homogeneity of Variances in the Responses of the Students, Teachers, and Entrepreneurs in the Four Parameters
Levene Statistic df1 df2 Sig.
Var2 3.570 6 12 0.029
Var3 4.147 6 12 0.017
Var4 0.670 6 12 0.046
Var5 1.991 6 12 0.047
Var6 1.155 6 12 0.040
Var7 8.211 6 12 0.001
Var8 7.947 6 12 0.001
Var9 4.465 6 12 0.013
Var10 3.733 6 12 0.025
Var11 4.225 6 12 0.016
Var12 4.737 6 12 0.011
@0.05 confidence interval The p values (Sig.) are all less than the 0.05 confidence interval. Thus, the null hypothesis of the difference is rejected. There is significant difference in the variances of the responses of the students, teachers, and entrepreneur.
Chi-Square Test for Normality Assumption in the Responses of the Students, Teachers, and Entrepreneurs in the Four Parameters
Variables ChiQ Test Confidence Interval
Decision Verbal Interpretation
Students Teachers Entrepreneurs
0.279781847 0.05 Accept Ho Not Significant
The Chi-Square Test value is 0.279781847 which is greater than the 0.05 confidence interval. Thus, the null hypothesis is accepted. There is no significant difference on the normality assumption of the responses made by the students, teachers and entrepreneurs.
References Abduh, Muhamad, Maritz, Alex & Rushworth, Susan (2012). An Evaluation Of Entrepreneurship Education
In Indonesia: A Case Study Of Bengkulu University. The International Journal of Organizational Innovation Volume 4 Number 4 Spring 2012
Achim, Moise Ioan, Popescu, Teodora, & Kadar, Manuella (2010). The Role of Tertiary Education in Promoting Innovation and Entrepreneurship. 3rd International Conference on Innovation and Entrepreneurship and 3rd International Conference on Engineering & Business Education Conference Proceedings. La Consolacion College Manila . ISSN 2094 – 7607
Bignotia, Arsenio (2012). Entrepreneurial Engagement of Entrepreneurship Graduates Batches 2008-2012 of St. Paul University Manila. International Conference on Multidisciplinary Trends in Academic Research”. Vol. 1, 77-91. ISBN: 978-969-9948-22-0. Available online at www.globalilluminators.org
Braun, Gerald (2010). Evaluating Entrepreneurship Training Programmes: Intercultural Concepts and Practical Experiences in Developing Countries. 3rd International Conference on Innovation and
Entrepreneurship and 3rd International Conference on Engineering & Business Education Conference Proceedings. La Consolacion College Manila . ISSN 2094 – 7607
Commission on Higher Education available at www.ched.gov.ph

Journal of Business and Retail Management Research (JBRMR), Vol. 10 Issue 3 July 2016
www.jbrmr.com A Journal of the Academy of Business and Retail Management (ABRM) 92
Daniel, J., A. Kanwar, and S. Uvali-Trumbi (2008). The Right to Education: A Model for Making Higher Education Equally Accessible to All on the Basis of Merit. Asian Journal of Distance Education. 6(2): 5–11.
De Ocampo, Melanie, Bagano, April Joan & Tan, Ana Liza (2012). Culture of Entrepreneurship versus Employment. Fifth Taiwan-Philippines Academic Conference: Digital Humanities and Cultural Studies
European Council (2010). EUROPE 2020. A European strategy for smart, sustainable and inclusive growth
available at www.europa.eu Hegarty, C. (2006). It’s not an exact science: Teaching entrepreneurship in Northern Ireland. Journal of Education
+ Training available at http://dx.doi.org/10.1108/00400910610677036 Hisrich, R. D., Peters, M. P., & Shepherd, D. A. (2005). Entrepreneurship (6th ed.). New York: McGraw-
Hill/Irwin. ILO (2006) Global employment trends for youth www.ilo.org Jia HongYan, Jia & YuJie, Huang (2010). Resource and Feasibility Research on University Students’
Entrepreneurial Activities. 3rd International Conference on Innovation and Entrepreneurship and 3rd International Conference on Engineering & Business Education Conference Proceedings. La Consolacion College Manila . ISSN 2094 – 7607
Kilasi, Perpetua Kalimasi (2013). The role of higher education in promoting entrepreneurship education: the case of public universities in Tanzania. A thesis presented to the Department of Education Management and Policy Studies, University of Pretoria, South Africa. Available at http://repository.up.ac.za/handle/2263/40229
Lorz, Michael (2011). The Impact of Entrepreneurship Education on Entrepreneurial Intention. A Dissertation
presented to the University of St. Gallen, School of Management, Economics, Law, Social Sciences and International Affairs, Germany. Dissertation no. 3966 available at
http://www1.unisg.ch/www/edis.nsf/SysLkpByIdentifier/3966/$FILE/dis3966.pdf Matlay, H. (2008). The impact of entrepreneurship education on entrepreneurial outcomes. Journal of Small
Business and Enterprise Development available at http://dx.doi.org/10.1108/14626000810871745 National Statistics Office available at www.ecensus.com.ph Philippine Labor and Employment Plan 2011 – 2016 available at www.dole.gov.ph Shepherd, D.A., DeTienne, D.R., 2005. Prior knowledge, potential financial reward, and opportunity
identification. Entrepreneurship Theory and Practice, Vol. 29, No.1, pp.91–112. Souitaris, V., Zerbinati, S. & Al-Laham Andreas (2007), Do entrepreneurship programmes raise entrepreneurial
intention of science and engineering students? The effect of learning, inspiration and resources. Journal of Business Venturing, Vol. 22, pp. 566-591.

Journal of Business and Retail Management Research (JBRMR), Vol. 10 Issue 3 July 2016
www.jbrmr.com A Journal of the Academy of Business and Retail Management (ABRM) 93
Effect of Transformational Leadership and High Performance Work System on Job Motivation and Task Performance: Empirical Evidence
from Business Schools of Thailand Universities
Purit Pongpearchan Mahasarakham Business School
Mahasarakham University, Thailand
Keywords Transformational Leadership, High Performance Work System, Job Motivation, Power Distance, Task Performance
Abstract This study investigates the effect of transformational leadership and high performance work
system on job motivation and task performance at the business schools of Thai universities. Following the existing literature, transformational leadership, and high performance work system is an origin of job motivation that leads to task performance. Therefore, transformational leadership and high performance work system is important in creating job motivation for the improved performance of a lecturer. The sample was of 896 lecturers from business schools at government Universities in Thailand and the statistics used are tested by ordinary least squared regression. Furthermore, response bias, validity, and reliability were examined by the researcher. These results reveal that that transformational leadership and high performance work system have a significant positive effect on job motivation. Furthermore, job motivation still has a significant relation to task performance. Surprisingly, power distance has no significant positive moderating effect on the relationship of transformational leadership, high performance work system on the job motivation of lecturers in the business schools of government Universities in Thailand. Subsequently, managerial and theoretical contributions, and suggestions for further research are presented.
1. Introduction Due to the recent, competitive business environment, firms have to adapt themselves in terms of human resource management in order to face the changing internal and external environment. Moreover, effective human resource management has led the firms in creating a competitive advantage over their competitors (Barney, 1995). Human resource management is at present starting to use the high performance work system for creating more profit (Huselid, 1995) and to increase the firm’s performance (Appelbaum, 2000; Way, 2002). Also, a firm will use this system to increase motivation, knowledge, skill, and capability of employees that will lead the firm to receive a competitive advantage (Cappelli& Singh, 1992; Huselid, 1995; Jackson & Schuler, 1999; Jones & Wright, 1992; Wright & McMahan, 1992).
The human resource management fields such as; recruitment and selection, training, job promotion, participation, team work creation, performance appraisal, compensation, fairness promotion, organization communication, power distance decreasing, conflict management, workplace safety and security policy have been used in many studies of high performance work system for confirmation of the relationship between human resource management and employee effectiveness (Becker &Huselid, 1998; Chaudhuri, 2009; Guest, 1999; Guthrie, 2001; Huselid, 1995; Pil & MacDuffie, 1996; Truss, 2001; Wood, 1996; Zacharatos, Barling, & Iverson, 2005). When the human resource management used high performance work system, this led to motivation and more commitment from employees within their firm (Datta, Guthrie, & Wright, 2005; Qiao, Khilji, & Wang, 2009). Furthermore, there are many researches in strategic human
Journal of Business and Retail Management Research (JBRMR), Vol. 10 Issue 3 July 2016
www.jbrmr.com A Journal of the Academy of Business and Retail Management (ABRM) 94
resource management that study the effects of high performance work system on a firm’s performance. Whereas, there are few research studies on the effect of high performance work system on attitude, behavior, employee motivation, and firm performance (Appelbaum, 2000; Wu &Chaturvedi, 2009) Transformational Leadership (TL) is used by a leader who can motivate his/her staff for more work inspiration, moral, confidence, and leadership. TL wills effort in building the success of the staff, follower, or customer. They can lead change, innovation, and entrepreneurial capability within their firm. Also, they can coach both for work and life with their staff. Moreover, they are the role model, both in work and life, for their staff (Burns, 1978; Bass, 1997)
Considering the system of universities in Thailand, there is reformation of the system of Thailand Universities such as changing staff status, lecturers and other staff, change from government employee to be a university officer. Moreover, there is the changing of the status of the Government University to be a university in the control of the government. Furthermore, there are many reports that show they are critical of Thailand Universities (http://www.thairath.co.th/content/434275) such as the feeling of instability of university
staff, inequality regarding the welfare and rights between the university officers and the remaining government employees in the university, that include the teachers in primary and secondary schools and in other organization, who undertake the same career. Due to the reasons in this paragraph, these are the causes of the decreasing effectiveness and efficiency of lecturers as Thailand university officers.
For the reasons mentioned above, this research studies the effect of transformational leadership and high performance work system on job motivation and the task performance of Thai lecturers. From the literature review, it is revealed that the high performance work system and TL will have an influence on work motivation and also an indirect effect to better the performance of Thai University lecturers. However, in the dimension of power distance between administrator and lecturer, there are importance facets that influence on the relationship of high performance work system and job motivation. Moreover, the influence of TL on job motivation is the important facet in the context of the lecturer in a university focusing on the school of business in a Thai’s University. The important reason for studying the school of business in Thailand regards the larger number of requirements needed for entrance to the faculty of business administration by Thai students. The expectations from the result of this study are to improve and develop the efficiency and effectiveness of the lecturers in the school of business in Thailand, following the purpose of a university administrator. Also, this study will be an approach to increase the competency of Thai University lecturers to their best efficiency.
2. Literature Review and Hypotheses Development The conceptual model (figure. 1) demonstrates the relationships between transformational leadership, high performance work system, job motivation, and task performance. In this study, transformational leadership includes four dimensions, namely; idealized influence/charisma, inspirational motivation, intellectual stimulation, and individual consideration.

Journal of Business and Retail Management Research (JBRMR), Vol. 10 Issue 3 July 2016
www.jbrmr.com A Journal of the Academy of Business and Retail Management (ABRM) 95
2.1 Transformational Leadership (TL)
Transformational leadership is the concept of person who inspires staff to work towards the goal or vision of their firm. TL will created, communicated, and be the role model for their staff (McShane and Von Glinow, 2009).
TL was developed from a concept by James McGregor Burns in 1978. Burns compared transformational leadership with transactional leadership. The transformational leadership model stresses personal charisma, acting as a role model, and being individually considerate and intellectually stimulating towards staff. It is a beneficial approach for personal and firm’s performance (Bass, 1985; Burns, 1978). TL has a positive influence on an employee’s performance by increasing the cohesiveness, commitment, motivation, and trust. Furthermore, comparative research reveals that TL, when compared with transactional leadership, has a more positive effect on an employee’s efficiency and effectiveness (Waldman, Ramirez, House, and Puranam, 2001).
Transformational Behaviors The four behaviors of transformational leadership are based on the full range of
leadership, which consists of idealized influence, inspirational motivation, intellectual stimulation, and individualized consideration. Idealized influence is from a leader who creates loyalty, confidence and identifies with the followers by setting an example of courage and dedication, and making self-sacrifice in order to benefit the followers of the firms (Yukl, 2010). Inspirational motivation is a method in which the transformational leader shares his or her vision to inspire the followers to more efficiency and effectiveness when performing their duties. TL recognizes how to use inspirational motivation for the ‘can-do’ attitude in achieving organizational targets, as well as providing a purpose for the task and the goals that need to be achieved.
Intellectual stimulation is the behavior of a leader that increases the follower’s awareness of the problems; this leader influences the followers to assessment the problems from a new aspect. Then the TL provides support, encouragement and training to his or her followers (Yukl, 2010).
Individualized consideration appears when the leader empowers the projects for learning experiences, coaching and teaching, and expresses respect to each follower, individually. This leader includes consideration of the followers’ needs, coaching, mentoring, effective communication, and paying attention to the issues and requirements of the individuals who are being led (Lowe et al., 1996). Transformational leadership is the most important theory in recent leadership research (Walumba& Lawler, 2003) and has been the subject of empirical study in management literature for the past 20 years (Walumba, Orwa, Wang, & Lawler, 2005).
H8 (+)
H9 (+)
H8 (+)
H9 (+)

Journal of Business and Retail Management Research (JBRMR), Vol. 10 Issue 3 July 2016
www.jbrmr.com A Journal of the Academy of Business and Retail Management (ABRM) 96
Various studies have revealed that transformational leadership effects on performance appraisal satisfaction (Waldman et al., 1987); financial performance and effective team performance (Avolio, Waldman, & Einstein, 1988); job motivation, employee satisfaction, trust in the leader, role clarity, performance, altruism, sportsmanship (Gillespie & Mann, 2004; Podsakoff et al., 1996); performance and positive feelings towards the leader that are transferred to the organization (Whittington, Goodwin, & Murray, 2004); organizational commitment, and satisfaction (Avolio et al.,2004) ; organizational citizenship behavior and innovation (Boerner et al., 2007); product innovation and performance (Matzler et al., 2008); follower identification with the work unit resulting in individual performance (Walumba et al., 2008); employee creativity (Gong, Huang, &Farh, 2009); and group cohesiveness (Wang & Huang, 2009). Even in collectivist cultures like India, China, and Kenya, transformational leadership behaviors were found to be effective and be were effective across cultures (Walumba& Lawler, 2003).
As a result, this research implies that transformational leadership will have a positive influence on job motivation. Thus, we hypothesize the relationship as follows:
Hypothesis 1: Transformational leadership is positively related to job motivation.
2.2 High Performance Work System (HPWS) Evans and Davis (2005), argued HPWS as an integrative system of HR practices that are
internally and externally consistent with a firm’s strategies. The arrangement of different HR practices like selectivity, employees training, internal career opportunity, performance appraisal, empowerment, incentive pay, (Alam, Talha, Sivanand, &Ahsan, 2005; Bae& Lawler, 2000; Delaney &Huselid, 1996; Wu &Chaturvedi, 2009; Youndt, Snell, Dean, &Lepak, 1996),self-managed team, flexible job assignment, open communication, and performance contingent compensation are contributions from HPWS (Becker &Huselid, 1998; Evans & Davis, 2005; Guthrie, 2001; Pfeffer, 1998). The firms implement HPWS to increase work performance, productivity, and the job motivation of employees. Scholar revealed that these HR practices form an employee’s behavior and attitudes (Guzzo& Noonan, 1994). Employees perceive satisfaction when the firms apply HPWS and include the employees in; setting goals give them autonomy, training, and development opportunities that lead to higher motivation towards their job (Wu &Chaturvedi, 2009). Therefore, it is likely that the high performance work system has a positive effect on job motivation. Hence, the hypothesis is proposed as follows:
Hypothesis 2: High performance work system is positively related to job motivation.
2.3 Job Motivation Motivation was defined as the complex of forces, drives, need, tension states, or other
psychological mechanisms that start and maintain activity towards achieving individual goals (Hoy &Miskel, 1978). Davis (2004) argued that motivation has four facets, including: (1) achievement motivation, the encouragement to master the challenges, for developed and developing; (2) motivation affiliate, the encouragement to connect with people effectively; (3) motivation competence, an encouragement to achieve work with high quality, improve problem-solving skills, and attempt to innovate; (4) motivation power, an encouragement to influence people and change the status.
A lecturer has a responsibility as an educator. The lecturer’s responsibility is to cover all the activities which must be carried out before giving or delivering instructional materials; review the teaching materials, develop the boundaries of the planning exercise, prepare a list of values to define the level and knowledge of trainees etc. (Sartika, 1999). The lecturer, as an
Journal of Business and Retail Management Research (JBRMR), Vol. 10 Issue 3 July 2016
www.jbrmr.com A Journal of the Academy of Business and Retail Management (ABRM) 97
educator, needs good productivity. Sanusi disclosed productive individuals, include (a) constructive actions, (b) believe in yourself, (c) charge, (d) have a love of work, (e) have foresight, (f) be able to overcome and adapt to a changing environment, (g) make innovative contributions, (h) have the power to realize its potential, and (i) have ability in such as skills, knowledge, qualification, experience and characteristics (Sanusi, 1992). Therefore, the job motivation of a lecturer is very important. Due to the reasons mentioned above, it is more likely that job motivation is a positive influence with task performance. Hence, the hypothesis is proposed as follows:
Hypothesis 3: Job motivation is positively related to task performance.
2.4 Task Performance Manullang (2008) revealed that a person who requires success has characteristics which
are: 1) the responsibility to solve the problem; 2) determine the difficult targets and estimate the risk; 3) prioritize importance for feedback. Then, the specific characteristics of a person who has success in motivation are: 1) excited if superior; 2) willing to take calculated risks; 3) would be responsible; 4) selecting a challenging job; 5) requires feedback; 6) work not for money or reward only.
Standard performance is considered as satisfactory if the statement indicates some key areas of responsibility of employees, indicates how a work activity will be carried out and draws attention to the quantity system of how the performance will be measured (Tempe, 1992). Good performance is described as the employees who practice the work with the regulations, and the willingness to collaborate with other employees to achieve the company’s goals. There are many factors that affect job performance such as: personality, abilities and skills (Flippo, 1995) wherever the personality, abilities and employee’s skills will have an effect on work performance, work activities, behavior, and the performance to carry on outcomes.
Based on the reasons mentioned above, it can be summarized that the task performance is several activities or the behavior of workforces in carrying out roles and responsibilities in order to achieve the work in accordance with its intended purpose in the firm.
2.5 The moderating role of power distance
The level of power distance symbolizes the power inequality between executive and employee. In high power distance firms, the firm’s hierarchy is usually observed while low power distance firms have a flat organizational structure (G. H. Hofstede, 1984, 2003). Power sharing and empowerment policies are more effective in firms with low power distance (House, 2004). Workforces from a high power distance culture expect the manager to lead, and this converts to being uncomfortable for both with the delegation of discretionary decisions (Adler, 1997). In low power distance firms, workers are expected to bypass their heads habitually in order to get their task completed; little concern for their title, status, and formality; content in accepting higher levels of responsibility and autonomy. Furthermore, these persons often make firm decisions without any input from their executive (Adler, 1997). The workers who focus on a high power distance culture demonstrate a great deal of respect for those in authority. Title, rank and status carry a lot of weight and minions feel dependent on their executive, fearing to express their disagreement, as in Arabian countries, the Far East and Latin countries (Islam, 2004).The high power distance culture resists innovation when in comparison to low power distance culture (Christopher, 1983; Kato & Kato, 1992; Taylor, 1983). In high power distance firms, managers rely on their formal roles, employees are expected to be told, authoritative leadership and close supervision display the way to satisfaction, performance and productivity, wide salary gaps between the top and bottom of the firm, managers dissatisfied with their career

Journal of Business and Retail Management Research (JBRMR), Vol. 10 Issue 3 July 2016
www.jbrmr.com A Journal of the Academy of Business and Retail Management (ABRM) 98
and information that is constrained by the hierarchy (G. H. Hofstede, 2003).The appropriate power distance between executive and employee forms the nature of people’s relationship with power(Lee, Pillutla, & Law, 2000b).Therefore we predict that: Hypothesis 4: Power distance moderates the relationship between TL and Job motivation In the business school of Thailand.
Hypothesis 5: Power distance moderates the relationship between HPWS and Job motivation in the business school of Thailand.
3. Research Methods 3.1 Sample Selection and Data Collection Procedure
This study selects from the lecturers of Thailand government university business schools except Rajabhat, Rajamangala, Ramkhamhaeng, and Sukhothai University as the population and sample amount to896lecturers. The database was drawn from the Faculty website of each University during March, 2015. A mail survey procedure, via a questionnaire, was used for data collection. The key participants in this study were the lecturers in each business school as population and sample. The questionnaire was sent to the business school or faculty of business of government Universities in Thailand. With regard to the questionnaire mailing, the valid mailing was 896 surveys; the completed and usable surveys were 194. The response rate of this sample is 21.65 %. Consistence with Aker, Kumar, and Day (2002) revealed the acceptance response rate of business research not less than 20% as acceptable.
Finally, to test potential and non-response bias and to detect and consider possible problems with non-response errors, the assessment and investigation of non-response-bias was centered on a comparison of first and second wave data as recommended by Armstrong and Overton (1977). The t-test statistics were used to test the difference between early and late responses in various firm characteristics which consist of the firm size and firm age; the results did not find any significant differences between the two groups. Thus, non-response bias does not pose a significant problem for this study.
3.2 Measurements In this study, all constructs in the model are measured with multi-item scales. Each of
these variables were measured on a five-point Likert scale, ranging from 1 (strongly disagree) to 5 (strongly agree), except demographic and control variables. The measurements of dependent, independent, mediating, moderator and control variables are clarified as follows:
Transformational Leadership (TL) is the main construct of this study. It can be defined as a person who can motivate people to work more. This person can build the confidence of their staff. Moreover, this leadership tries to build the success of their colleagues or even their customers. They can bring change, innovation and the raise the ability of the employee also, as to be the prototype for others to follow, both in work and personal life (Burns, 1978; Bass, 1997).It is measured by a sixteen-item scale covering all four TL dimensions of Idealized Influence, Inspirational Motivation, Intellectual Stimulation, and Individualized Consideration(Yukl, 2010).
High Performance Work System (HPWS) is measured by a four-item scale, and it is defined as the integrative system of HR practices that are internally and externally consistent with a firm’s strategies. The arrangement of different HR practices like selectivity, employees training, internal career opportunity, performance appraisal, empowerment, incentive pay, (Alam, Talha, Sivanand, &Ahsan, 2005; Bae& Lawler, 2000; Delaney &Huselid, 1996; Wu &Chaturvedi, 2009; Youndt, Snell, Dean, &Lepak, 1996)

Journal of Business and Retail Management Research (JBRMR), Vol. 10 Issue 3 July 2016
www.jbrmr.com A Journal of the Academy of Business and Retail Management (ABRM) 99
Job Motivation (JM)is measured by a four-item scale, and it is defined as the complex of forces, drives, need, tension states, or other psychological mechanisms that start and maintain activity towards achieving individual goals (Hoy &Miskel, 1978).
Task Performance (TP) is measured by a four-item scale, and it is defined as several activities or behaviors of workforces in carrying out their roles and responsibilities in order to achieve the work in accordance with its intended purpose in the firm (Manullang, 2008; Tempe, 1992; Flippo, 1995)
Power Distance (PD) is measured by a four-item scale, and it is defined as the power inequality between executive and employee. In high power distance firms, the firm’s hierarchy is usually observed while low power distance firms have flat organizational structure (G. H. Hofstede, 1984, 2003).
Firm Size (FS) affects the ability to redefine, adjust, or renew a firm’s strategy (Baden-Fuller and Volberda, 1997). Large firms tend to rapidly renew the firm’s strategy more than small ones (Jansen et al., 2005). It was measured by the number of employees currently registered as full time at the firm.
Firm Age or Firm Experience (FA) is measured by the number of years that the firm has operated (Kotabe et al., 2011; Patel et al., 2012). Traditional firms have experience in monitoring environmental changes faster than new firms and are more appropriate to improving creative and innovative operations that create a competitive advantage. Mature firms tend to renew strategy or renew organization more than younger firms (Baden-Fuller and Volberda, 1997).
3.3 Methods Factor analysis was firstly utilized to assess the underlying relationships of a large
number of items and to determine whether they can be reduced to a smaller set of factors. The factor analysis was conducted separately on each set of the items representing a particular scale due to limited observations. With respect to the exploratory factory analysis, this analysis has a high potential to inflate the component loadings. Thus, a higher rule-of-thumb, a cut-off value of 0.40, was adopted (Nunnally and Bernstein, 1994). All factor loadings are greater than the 0.40 cut-off and are statistically significant. The reliability of the measurements was evaluated by Cronbach alpha coefficients. In the scale reliability, Cronbach alpha coefficients are greater than 0.70 (Nunnally and Bernstein, 1994). The scales of all measures appear to produce internally consistent results; thus, these measures are deemed appropriate for further analysis because they express an accepted validity and reliability in this study. Table 1 presents the results for both factor loadings and Cronbach alpha for multiple-item scales used in this study.
3.4 Statistical Techniques
The ordinary least squares (OLS) regression analysis is used to test and examine all hypotheses following the conceptual model. Then, the aforementioned variables play significant
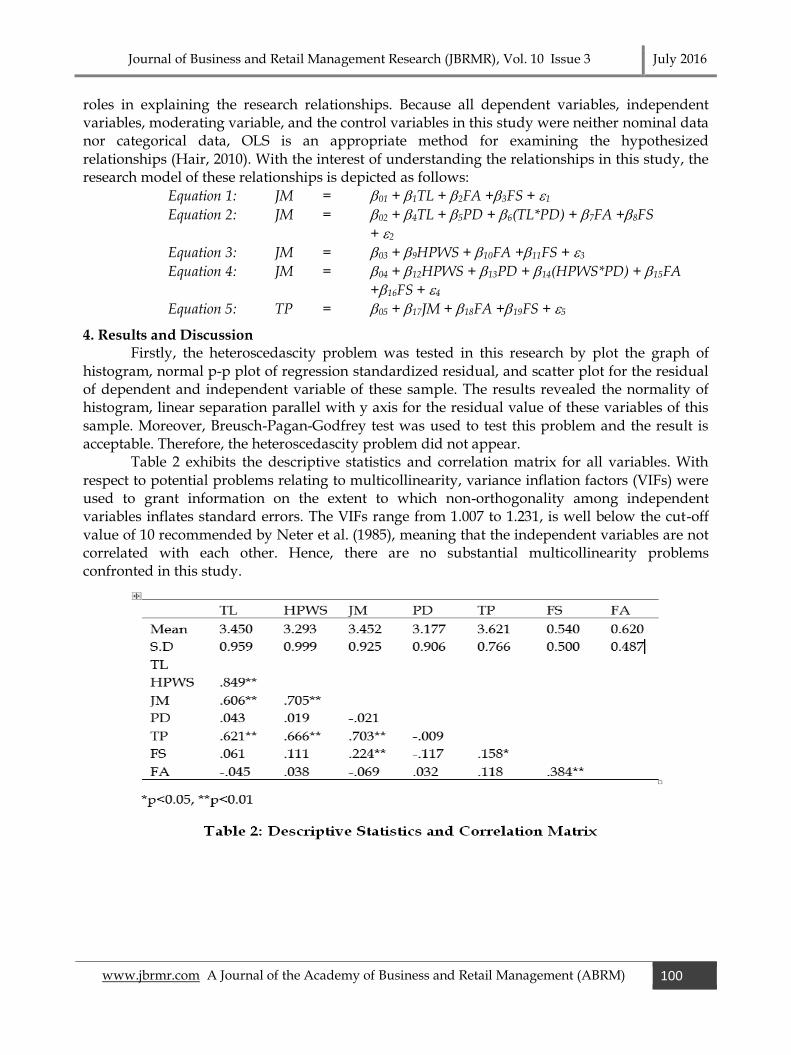
Journal of Business and Retail Management Research (JBRMR), Vol. 10 Issue 3 July 2016
www.jbrmr.com A Journal of the Academy of Business and Retail Management (ABRM) 100
roles in explaining the research relationships. Because all dependent variables, independent variables, moderating variable, and the control variables in this study were neither nominal data nor categorical data, OLS is an appropriate method for examining the hypothesized relationships (Hair, 2010). With the interest of understanding the relationships in this study, the research model of these relationships is depicted as follows:
Equation 1: JM = 01 + 1TL + 2FA +3FS + 1
Equation 2: JM = 02 + 4TL + 5PD + 6(TL*PD) + 7FA +8FS
+ 2
Equation 3: JM = 03 + 9HPWS + 10FA +11FS + 3
Equation 4: JM = 04 + 12HPWS + 13PD + 14(HPWS*PD) + 15FA
+16FS + 4
Equation 5: TP = 05 + 17JM + 18FA +19FS + 5
4. Results and Discussion Firstly, the heteroscedascity problem was tested in this research by plot the graph of
histogram, normal p-p plot of regression standardized residual, and scatter plot for the residual of dependent and independent variable of these sample. The results revealed the normality of histogram, linear separation parallel with y axis for the residual value of these variables of this sample. Moreover, Breusch-Pagan-Godfrey test was used to test this problem and the result is acceptable. Therefore, the heteroscedascity problem did not appear.
Table 2 exhibits the descriptive statistics and correlation matrix for all variables. With respect to potential problems relating to multicollinearity, variance inflation factors (VIFs) were used to grant information on the extent to which non-orthogonality among independent variables inflates standard errors. The VIFs range from 1.007 to 1.231, is well below the cut-off value of 10 recommended by Neter et al. (1985), meaning that the independent variables are not correlated with each other. Hence, there are no substantial multicollinearity problems confronted in this study.

Journal of Business and Retail Management Research (JBRMR), Vol. 10 Issue 3 July 2016
www.jbrmr.com A Journal of the Academy of Business and Retail Management (ABRM) 101
Table 3 presents the results of OLS regression analysis of the relationships among
transformational leadership, high performance work system, power distance, and job motivation. Transformational leadership has a significant positive effect on job motivation (b1=0.611, p<0.01). Thus, Hypothesis 1 is supported. The result of this study is consistent with Gillespie and Mann (2004), Podsakoff et al. (1996) revealed that transformational leadership was significantly positively related to job motivation. Furthermore in the relation of high performance work system and job motivation, HPWS has a significant positive effect on job motivation (b9=0.678, p<0.01).This is consistent with the study of Wu and Chaturvedi (2009)who found that high performance work system has a positive effect on job motivation. Therefore, Hypothesis 2 is supported. Surprisingly, these results reveal that power distance is not the moderate effect on the relation of TL and job motivation, HPWS and job motivation in the context of business school lecturers of government Universities in Thailand. Hence, Hypothesis 4 and 5 are not supported.
Table 4 presents the results of OLS regression analysis of the relationships among job motivation and task performance. Hypothesis 3 proposed job motivation would be positively associated with task performance. As shown in Table 4, it is indicated that job motivation is positively and significantly related to task performance (b17=0.695, p<0.01). Hence, Hypothesis 3 is supported. According with Davis (2004) who provided that job motivation affects the task performance.
5. Contributions and Directions for Future Research 5.1 Theoretical Contributions and Directions for Future Research
This study proposes the escalation understanding of relationship among the transformational leadership, high performance work system, and task performance via job

Journal of Business and Retail Management Research (JBRMR), Vol. 10 Issue 3 July 2016
www.jbrmr.com A Journal of the Academy of Business and Retail Management (ABRM) 102
motivation, and the moderating effect of power distance on the relation of TL, HPWS on job motivation. For progress in the theoretical field, this research attempted to concentrate on the above-mentioned relationships of government business schools in Thailand. Therefore, there is a need for further research, it is obviously seen that a shift to a variety of samples from the other sectors is necessary in order to obtain a precise and reliable framework offering. Interestingly, the contribution of theory was spread to the extent of transformational leadership and empirically testing with consequence constructs which distinctively aspect previous study.
5.2 Managerial Contributions This research also helps administrators to justify and identify the key components that
may be more critical in the quality of Thailand’s academia, especially in the government business schools. From a managerial and practical contribution, many important insights can be received from this research. This research can facilitate the chancellor or the dean and executive, particularly in the business schools of Thailand’s government Universities to perceive how their organization can complete the task performance of their lecturer by using transformational leadership and HPWS to achieve firm success for a higher standard of Thailand’s academia. Hence, transformational leadership and high performance work system had become an important topic for executives in the academic sector. Consistent to the results of this study, it is shown that transformational leadership and HPWS has a significant relationship to job motivation and leads to the task performance of government business school lecturers. This empirical study helps to formulate solutions to the academic system’s problem sat Thai Universities that provide the basis of sustainable success for the organization. Therefore, to maximize the benefit of the firm’s strategy, the chancellor should try these resources to boost effectiveness and create new opportunities for a better standard at their University.
6. Conclusion
This paper discusses transformational leadership and high performance work system in the perspective of business schools of government Universities in Thailand. Coping with the academic system’s changes in staff at the government Universities in Thailand, according to this research, these factors have a direct impact on University performance. The aim of this research indicates that it is to study the relationships among transformational leadership, high performance work system, and task performance via job motivation, and the moderating effect of power distance on the relationship of TL, HPWS on job motivation. The test model is collected data from a mail survey respondent of 194 observation lecturer sat business schools in government Universities in Thailand. Interestingly, this study finds that TL and HPWS have significant positive effects on job motivation. Furthermore, job motivation still has a significant relationship to task performance. Surprisingly, power distance has no significant positive moderating effect on the relationship of TL, HPWS on job motivation of lecturers in the business schools of government Universities in Thailand.
Reference Adler, N. J. 1997. International Dimensions of Organizational Behaviour (Vol. 164). South. Western
College Publishing: Cincinnati Ohio. Aker, D. A., Kumar, V., & George, S. Day. 2002. Marketing research, John Wiley & sons. Alam, S. S., Talha, M., Sivanand, C., & Ahsan, M. N. 2005. Job satisfaction of university woman teachers in
Bangladesh. Journal of Social sciences, 1(2), pp.88-91. Appelbaum, E. 2000. Manufacturing advantage: Why high-performance work systems pay off: Cornell
University Press.

Journal of Business and Retail Management Research (JBRMR), Vol. 10 Issue 3 July 2016
www.jbrmr.com A Journal of the Academy of Business and Retail Management (ABRM) 103
Armstrong, J. S., & Overton, T. S. 1977. Estimating nonresponse bias in mail surveys. Journal of marketing research, pp.396-402.
Avolio, B. J., Waldman, D. A., & Einstein, W. O. 1988. Transformational leadership in a management game simulation impacting the bottom line. Group & Organization Management, 13(1), pp.59-80.
Avolio, B. J., Zhu, W., Koh, W., & Bhatia, P. 2004. Transformational leadership and organizational commitment: Mediating role of psychological empowerment and moderating role of structural distance. Journal of organizational behavior, 25(8), pp.951-968.
Baden-Fuller, C., & Volberda, H. W. 1997. Strategic renewal: How large complex organizations prepare for the future. International Studies of Management & Organization, 27(2), pp.95-120.
Bae, J., & Lawler, J. J. 2000. Organizational and HRM strategies in Korea: Impact on firm performance in an emerging economy. Academy of management journal, 43(3), pp.502-517.
Barney, J. B. 1995. Looking inside for competitive advantage. The Academy of Management Executive, 9(4), pp.49-61.
Bass, B. M. 1985. Leadership and performance beyond expectations: Free Press; Collier Macmillan. Bass, B. M. 1997. Does the transactional–transformational leadership paradigm transcend organizational
and national boundaries? American psychologist, 52(2), pp.130. Becker, B. E., & Huselid, M. A. 1998. Human resources strategies, complementarities, and firm
performance. Paper presented at the Academy of Management Annual Meeting, Boston, MA. Abstract retrieved from
http://mgt.buffalo.edu/departments/ohr/becker/publications/HumanResourcesStrategies. pdf. Boerner, S., Eisenbeiss, S. A., & Griesser, D. 2007. Follower behavior and organizational performance: The
impact of transformational leaders. Journal of Leadership & Organizational Studies, 13(3), pp.15-26.
Burns, J. M. 1978. leadership. NY: Harper & Row. Cappelli, P., & Singh, H. 1992. Integrating strategic human resources and strategic management. Research
frontiers in industrial relations and human resources(Chapter 5). Christoffer, R. 1983. The Japanese mind; The Goliath explained. New York: Linden Shoten. Psychiatry32,
12, 43. Datta, D. K., Guthrie, J. P., & Wright, P. M. 2005. Human resource management and labor productivity:
does industry matter? Academy of management Journal, 48(1), pp.135-145.
Davis, K. 2004. Fundamental Organization Behavior. Diterjemahkan Agus Dharma Jakarta: Penerbit Erlangga.
Delaney, J. T., & Huselid, M. A. 1996. The impact of human resource management practices on perceptions of organizational performance. Academy of Management journal, 39(4), pp.949-969.
Evans, W. R., & Davis, W. D. 2005. High-performance work systems and organizational performance: The mediating role of internal social structure. Journal of management, 31(5), pp.758-775.
Flippo, E. G. 1995. Personnel Management. New York: MacGrawHill. Gillespie, N. A., & Mann, L. 2004. Transformational leadership and shared values: The building blocks of
trust. Journal of Managerial Psychology, 19(6), pp.588-607. Gong, Y., Huang, J.-C., & Farh, J.-L. 2009. Employee learning orientation, transformational leadership, and
employee creativity: The mediating role of employee creative self-efficacy. Academy of management Journal, 52(4), pp.765-778.
Guest, D. E. 1999. Human resource management‐the workers' verdict. Human Resource Management Journal, 9(3), pp.5-25.
Guthrie, J. P. 2001. High-involvement work practices, turnover, and productivity: Evidence from New Zealand. Academy of management Journal, 44(1), pp.180-190.
Guzzo, R. A., & Noonan, K. A. 1994. Human resource practices as communications and the psychological contract. Human resource management, 33(3), pp.447-462.
Hair, J. F. 2010. Multivariate data analysis. Hofstede, G. 1984. The cultural relativity of the quality of life concept. Academy of Management review, 9(3),
pp.389-398. Hofstede, G. H., & Hofstede, G. 2001. Culture's consequences: Comparing values, behaviors, institutions
and organizations across nations: Sage.

Journal of Business and Retail Management Research (JBRMR), Vol. 10 Issue 3 July 2016
www.jbrmr.com A Journal of the Academy of Business and Retail Management (ABRM) 104
House, R. J. 2004. Culture, leadership, and organizations: The GLOBE study of 62 societies: Sage Publications, Inc.
Hoy, W. k Miskel, CG. 1978. Educational administration: Theory, research and practice. Huselid, M. A. 1995. The impact of human resource management practices on turnover, productivity, and
corporate financial performance. Academy of management journal, 38(3), pp.635-672. Islam, N. 2004. Sifarish, sycophants, power and collectivism: Administrative culture in Pakistan.
International Review of Administrative Sciences, 70(2), pp.311-330.
Jansen, J. J., Van Den Bosch, F. A., & Volberda, H. W. 2005. Managing potential and realized absorptive capacity: how do organizational antecedents matter? Academy of management journal, 48(6), pp.999-1015.
Jones, G. R., & Wright, P. M. 1992. An economic approach to conceptualizing the utility of human resource management practices. Research in personnel and human resources management, 10, pp.271-299.
Kato, H. 1992. Understanding and working with the Japanese business world: Prentice Hall Direct. Kotabe, M., Jiang, C. X., & Murray, J. Y. 2011. Managerial ties, knowledge acquisition, realized absorptive
capacity and new product market performance of emerging multinational companies: A case of China. Journal of World Business, 46(2), pp.166-176.
Lee, C., Pillutla, M., & Law, K. S. 2000. Power-distance, gender and organizational justice. Journal of Management, 26(4), pp.685-704.
Lowe, K. B., Kroeck, K. G., & Sivasubramaniam, N. 1996. Effectiveness correlates of transformational and transactional leadership: A meta-analytic review of the MLQ literature. The Leadership Quarterly, 7(3), pp.385-425.
Manullang, I. 2008. Pengaruh kualitas pelayanan terhadap kepuasan pelanggan jasa penerbangan PT. Garuda Indonesia Airlines di bandara Polonia Medan.
Matzler, K., Renzl, B., Müller, J., Herting, S., & Mooradian, T. A. 2008. Personality traits and knowledge sharing. Journal of Economic Psychology, 29(3), pp.301-313.
McShane, S. L., & Von Glinow, M. A. (2009). Organizational Behavior: Essemtols: New York: McGraw-Hill Companies, Inc.
Neter, J., Wasserman, W., & Kutner, M. H. 1985. Applied Linear Statistical Models. Regression, Analysis and Experimental Designs: Homewood, Ill. Irwin.
Nunnally, J. C., & Bernstein, I. 1994. The assessment of reliability. Psychometric theory, 3(1), pp.248-292. Patel, P. C., Terjesen, S., & Li, D. 2012. Enhancing effects of manufacturing flexibility through operational
absorptive capacity and operational ambidexterity. Journal of Operations Management, 30(3), pp.201-
220. Pfeffer, J. 1998. The human equation: Building profits by putting people first: Harvard Business Press. Pil, F. K., & MacDuffie, J. P. 1996. The adoption of high‐involvement work practices. Industrial Relations: A
journal of economy and society, 35(3), pp.423-455. Podsakoff, P. M., MacKenzie, S. B., & Bommer, W. H. 1996. Transformational leader behaviors and
substitutes for leadership as determinants of employee satisfaction, commitment, trust, and organizational citizenship behaviors. Journal of management, 22(2), pp.259-298.
Qiao, K., Khilji, S., & Wang, X. 2009. High-performance work systems, organizational commitment, and the role of demographic features in the People's Republic of China. The International Journal of Human Resource Management, 20(11), pp.2311-2330.
Sanusi, A. 1992. Beberapa Dimensi Mutu Pendidikan. Bandung: FPS IKIP Bandung. Sartika, I. D. 1999. Mutu Total STPDN: Kontribusi Budaya Organisasi yang Berorientasi Manajemen Mutu
Total, Kepuasan Kerja dan Tahapan Mutu Terhadap Kinerja Pengelola Dosen Tetap STPDN Disertai. tidak iterbitkan.
Schuler, R. S., & Jackson, S. E. 1999. Linking competitive strategies with human resource management practices. Strategic human resource management, pp.159-176.
Taylor, J. 1983. Shadows of the rising sun: a critical view of the" Japanese miracle": William Morrow. Tempe, D. 1992. Kinerja. Jakarta: PT. Elex Media Komputerindo. Truss, C. 2001. Complexities and controversies in linking HRM with organizational outcomes. Journal of
Management Studies, 38(8), pp.1121-1149.

Journal of Business and Retail Management Research (JBRMR), Vol. 10 Issue 3 July 2016
www.jbrmr.com A Journal of the Academy of Business and Retail Management (ABRM) 105
Waldman, D. A., Bass, B. M., & Einstein, W. O. 1987. Leadership and outcomes of performance appraisal processes. Journal of occupational psychology, 60(3), pp.177-186.
Waldman, D. A., Ramirez, G. G., House, R. J., & Puranam, P. 2001. Does leadership matter? CEO leadership attributes and profitability under conditions of perceived environmental uncertainty. Academy of management journal, 44(1), pp.134-143.
Walumbwa, F. O., Avolio, B. J., & Zhu, W. 2008. How transformational leadership weaves its influence on individual job performance: The role of identification and efficacy beliefs. Personnel Psychology,
61(4), pp.793-825. Walumbwa, F. O., & Lawler, J. J. 2003. Building effective organizations: Transformational leadership,
collectivist orientation, work-related attitudes and withdrawal behaviours in three emerging economies. International journal of human resource management, 14(7), pp.1083-1101.
Walumbwa, F. O., Orwa, B., Wang, P., & Lawler, J. J. 2005. Transformational leadership, organizational commitment, and job satisfaction: A comparative study of Kenyan and US financial firms. Human resource development quarterly, 16(2), pp.235-256.
Way, S. A. 2002. High performance work systems and intermediate indicators of firm performance within the US small business sector. Journal of management, 28(6), pp.765-785.
Whittington, J. L., Goodwin, V. L., & Murray, B. 2004. Transformational leadership, goal difficulty, and job design: Independent and interactive effects on employee outcomes. The Leadership Quarterly, 15(5), pp.593-606.
Wright, P. M., & McMahan, G. C. 1992. Theoretical perspectives for strategic human resource management. Journal of management, 18(2), pp.295-320.
Wu, P.-C., & Chaturvedi, S. 2009. The role of procedural justice and power distance in the relationship between high-performance work systems and employee attitudes: A multilevel perspective. Journal of Management.
Youndt, M. A., Snell, S. A., Dean, J. W., & Lepak, D. P. 1996. Human resource management, manufacturing strategy, and firm performance. Academy of management Journal, 39(4), pp.836-866.
Yukl, G. 2010.Leadership in organizations. Upper Saddle River, NJ: Prentice-Hall. Zacharatos, A., Barling, J., & Iverson, R. D. 2005. High-performance work systems and occupational
safety. Journal of applied psychology, 90(1), pp.77

Journal of Business and Retail Management Research (JBRMR), Vol. 10 Issue 3 July 2016
www.jbrmr.com A Journal of the Academy of Business and Retail Management (ABRM) 106
A study of customer satisfaction on select service dimensions with reference to ATMs and CDMs services in Oman
Syed Ahsan Jamil
Khaliquzzaman Khan Dhofar University
College of Commerce and Business Administration, Sultanate of Oman,
Key words ATM, CDM, Customer satisfaction, Primary data, Bank
Abstract In order to provide better services to customers, banks have been using different types of online
banking, ATMs, and CDMs. A very large proportion of bank customers use ATMs and CDMs for their routine operations. This study endeavors to gauge the customer satisfaction of ATM and CDM users using six dimensions- accessibility, convenience, efficiency, responsiveness, security & privacy, and reliability. These dimensions were selected based on the literature review and experts’ suggestions. Questionnaire, having closed ended questions only and duly tested in a pilot study, was used for primary data collection. A research model has been developed which consists of the six dimensions as response variables and customer satisfaction as latent variable. Descriptive statistics and structural equation modeling (SEM) technics were applied. The results revealed that all the selected dimensions are found to be significant in influencing the customer satisfaction level.
1. Introduction Information technology and the increasing usage of interest had revolutionized and brought
about global change in the manner in which the business is done today. The impact is so significant that it had influenced every aspect of an individual life style. Consumers across the globe has increasingly being accessing the ‘market space’ rather than the ‘market place’ (Kotler, 2002). The banking industry is no exception to this wave of IT. In fact, it was the first industry to fully integrate and provide IT based products and services. Gone are the days when customer had to go to the bank to either deposit or withdraw cash.
Banks have transformed themselves from just conventional banks offering a few products to ‘Universal banks’, wherein a customer could shop for any and every type of financial products and services. Electronic banking is the key for the success of the banking industry. The ‘hole in the wall’ concept called Automated Teller Machine (ATM) and Cash Deposit Machines(CDMs) are a common sight and customers are increasingly becoming dependent on services offered by the ATMs, which has transformed into the main channel of distribution for banks due to its increasing popularity.
As the global banking sector has developed and reach has increased immensely due to vigorous policy initiative for financial inclusions in almost all countries, the dependence and trust of customers on the banking sector too has enhanced with a multiple progression. It has become imperative to meet and match the expectations of the customers in terms of the services being delivered by banks. With the usage of ATMs and CDMs on the increase, which is non personal service delivery mechanism, it is becoming increasing challenging to satisfy the customers on all possible service dimensions expected to be delivered in an effective manner by the banking sector.

Journal of Business and Retail Management Research (JBRMR), Vol. 10 Issue 3 July 2016
www.jbrmr.com A Journal of the Academy of Business and Retail Management (ABRM) 107
This study is an attempt to explore and find out the level of the customer satisfaction on select service dimensions with reference to the Facilities of ATMs and CDMs among residents in the Sultanate of Oman
2. Literature Review ATM invention has been a subject of debate as to who invented it first. In Inventions &
Technology magazine (2000), in the late 1930s, Luther George Simjian started the first version of the ATM. Later its versions were improved and deployed by many banks and were called cash machine or cash dispenser referring to the Automated Teller Machines (Kevin & David 2008). With time due to its increasing popularity, ATM had become an important tool to retain customers and maintain competitive advantages at the same increase profitability (Folorunso et al, 2010). Increasingly banks started to depute more ATMs resulting in fewer branches as outlet and cutting down the number of employees (Moutinho& Smith, 2000). ATMs and CDMs enables customers to either deposit or withdraw cash at more convenient time and places than during banking hours at branch (Muhammed 2010).
As ATMs started to gain popularity due to their ease of operations, banks increasingly started to pay more importance to this service and laid more and more stress on the service quality of Automatic Teller Machines as they become an instrument of strategic competitiveness in a dynamic business environment. Santos (2003) defined the meaning of quality of service to the customers using electronic networks such as cash deposit machines, automated teller machines, on line banking etc. Service dimensions to gauge the overall satisfaction level of customers has already been proposed in the form of SERVQUAL instrument which contains five dimensions: reliability, responsiveness, assurance, empathy, and tangibles. Parsuraman et al (1988). Later Zeithamal et al (2000) opined that flexibility, access, ease of navigation, site aesthetics, efficiency, price knowledge, and customization are additional dimension of great importance- Res- Qual and E-S-Qual scales were developed by Parasuraman et al (2005) to assess e-service quality and used efficiency, fulfilment, system availability. Privacy, responsiveness, compensation and contact as service quality dimensions.ATM services enhance operations and customer satisfaction in terms of flexibility of time; add value in terms of speedy handling of voluminous transactions (Komal 2009). Yavas, et al (2004) are of the opinion that customer focused ATM delivery mechanism that satisfies their needs and increase operational performance is an important dimension for banks to keep competitive advantage. Lassar et al (2005), in his study opined that there is a significant relationship between service quality and performance based on improved productivity, increased market share, enhanced customers’ loyalty, enhanced staff morale and sustained profitability.
Davies, Moutinho and Curry (1996) opined that cost involved in the use of ATM and its efficient functioning are important factors that influence customers’ satisfaction related to ATM service quality. In a previous study, Moutinho (1992) had already examined the relationship between the dimension of usage rate and performance expectations with customers’ prolonged satisfaction with ATM services. Joseph and Stone (2003) in their study in the United States found that the quality of service from customers’ perception is related with easily accessible location of the machines, their user friendly system, and security.Shamsdouha, Choudhary and Ahsan (2005) established that 24 hours’ service, accuracy and convenient location are the main predictors of customers’ satisfaction. Dilijonas, Krikscuiunen, Sakalouskas and Simutis (2009) explored that adequate number of ATMs, convenient and secure location, user friendly system, speed, minimum errors, high uptime, cash backup, cost and service coverage are essential service quality aspects of ATM service. Secure and convenient location, adequate number of ATMs, user friendly system and functionality of ATM play important role in customer

Journal of Business and Retail Management Research (JBRMR), Vol. 10 Issue 3 July 2016
www.jbrmr.com A Journal of the Academy of Business and Retail Management (ABRM) 108
satisfaction (Joseph and Stone 2003). Customer who are investors are also susceptible to herd behavior and therefore any misinformation could have a negative effect on the reputation of the serviceability of the banks in Oman, Jamil, S. A., & Khan, K. (2016)
However, numerous studies also identified the factor which often leads to dissatisfaction among customers. Customers’ loyalty is based on intense competition and services base latest technology. based new services are shaping customers’ loyalty. These have resulted in the switching of banks by customers based on competitive services (Lewis et al, 1994). Howcroft(1991) also noted that frequent break down of Automated Teller Machines was the main cause of dissatisfaction among customers.
3. Objectives of the Study The basic objectives of the study are:
To examine the important dimensions of ATM service quality.
To examine the customer satisfaction with ATMs services in Oman.
To establish and suggest how ATM service could be improved in Oman.
4. Methodology: In order to study the service dimensions and factors which influence customer’s satisfaction
of ATM in the Sultanate of Oman, a well-structured questionnaire was designed and tested which included six important service quality dimensions on which the customers’ feedback was obtained. Primary data was obtained from a sample (N=180) customers using stratified sampling technique. Four main cities of Oman -Sohar, Nizwa, Muscat, and Salalah were covered. The survey questionnaire consisted of 25 statements based on six service quality dimensions. A Likert scale comprising five points starting from ‘strongly disagree’ to ‘strongly agree’ was used as the scale for all the statements in the questionnaire. Analysis of the data was done using statistical tools like Cronbach alpha reliability test, descriptive statistics, and other tools of inferential statistics.
5. Data analysis 5.1. Reliability Test:
Reliability is a measure of internal consistency or reliability of attitudinal or behavioral attributes. It is measured by Cronbach’s Alpha which is a measure of the validity of each item used in the survey. According to Hendrickson et al (1993) and McGraw and Wong (1996) Cronbach alpha of a scale should be at least0.700 for items to be used together as a scale only then the survey instrument is considered as reliable. The reliability status of individual dimensions of the items used is shown in the following table:
Table 1
Dimensions Value of Cronbach’ Alpha
Accessibility 0.745
Efficiency 0.813
Security & Privacy 0.820
Convenience 0.792
Responsiveness 0.728
Reliability 0.698
5.2. Analysis of the Selected Dimensions: Figure 1 to Figure 6 below show the responses related to the selected dimensions- Accessibility, Efficiency, Security & Privacy, Convenience, Responsiveness, and Reliability. It is easily noticeable from the figures below that all the dimensions have been highly rated by the bank customers.
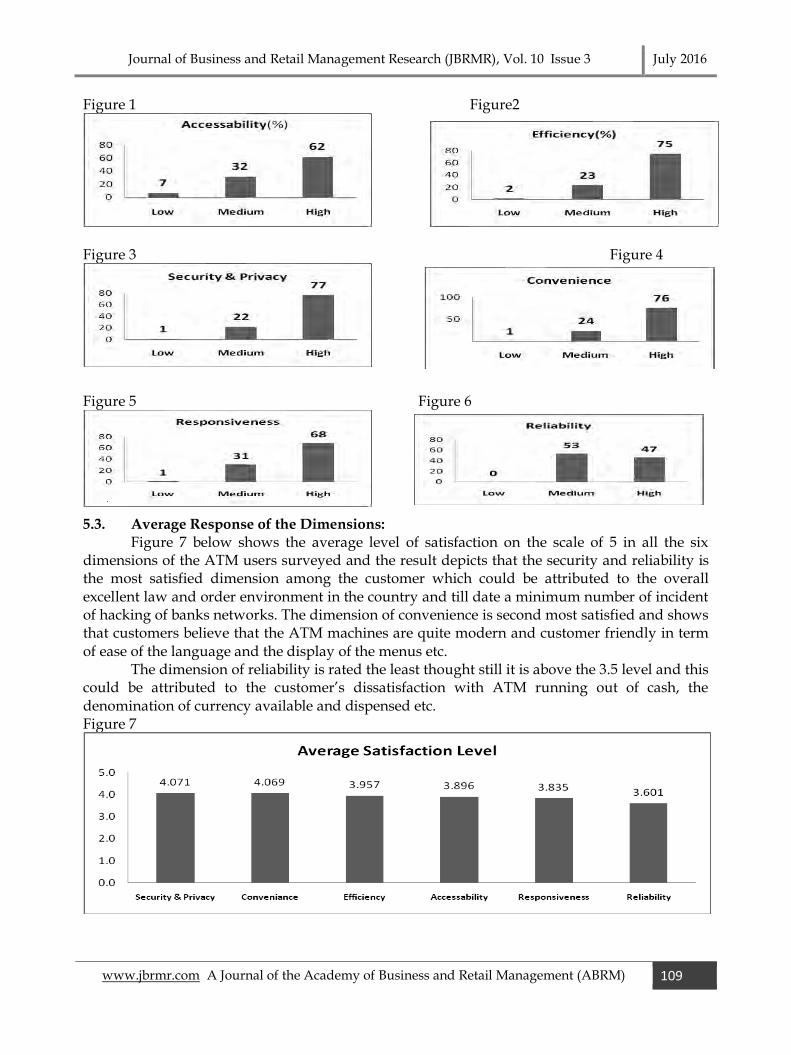
Journal of Business and Retail Management Research (JBRMR), Vol. 10 Issue 3 July 2016
www.jbrmr.com A Journal of the Academy of Business and Retail Management (ABRM) 109
Figure 1 Figure2
Figure 3 Figure 4
Figure 5 Figure 6
5.3. Average Response of the Dimensions: Figure 7 below shows the average level of satisfaction on the scale of 5 in all the six
dimensions of the ATM users surveyed and the result depicts that the security and reliability is the most satisfied dimension among the customer which could be attributed to the overall excellent law and order environment in the country and till date a minimum number of incident of hacking of banks networks. The dimension of convenience is second most satisfied and shows that customers believe that the ATM machines are quite modern and customer friendly in term of ease of the language and the display of the menus etc.
The dimension of reliability is rated the least thought still it is above the 3.5 level and this could be attributed to the customer’s dissatisfaction with ATM running out of cash, the denomination of currency available and dispensed etc. Figure 7

Journal of Business and Retail Management Research (JBRMR), Vol. 10 Issue 3 July 2016
www.jbrmr.com A Journal of the Academy of Business and Retail Management (ABRM) 110
5.4. Customer Satisfaction: A recursive Structural Equation Modeling (SEM) was applied to establish and estimate the customer satisfaction of ATM users. The figure below shows measurement model showing the relationship of the selected factors as manifest variables with customer satisfaction as a latent variable with standardized estimates.
Figure 8
The above results suggest the following model:
5.4.1. Model Fitness Indexes: Few of the commonly used indexes are shown in the table below. Bentler and Bonett
(1980) opined that the in order to have overall understanding of the model other indexes should be considered together. Chi-square, (χ2), Root Mean Square Error of Approximation (RMSEA), and Absolute Goodness of Fit (AGFI) indexes are taken into consideration from absolute fit category. Normed Fit Index (NFI), Increment Fit Index (IFI), and Comparative Fit Index (CFI) are considered for the analysis from relative fit category.
Table 2
Index Values from AMOS output Value for Good Fit
χ2 value p-value = 0.016 > 0.05
RMSEA 0.089 < 0.07
AGFI 0.916 > 0.90
NFI 0.914 > 0.90
IFI 0.948 > 0.90
CFI 0.947 > 0.90
Chi-square value is traditionally used to evaluate the overall fitness of model but it is sensitive to sample size. A larger sample size may lead to near rejection of the model (Mulaik et al, 1989). This tests the null hypothesis that the observed and the implied covariance matrixes are equal. With p-value (0.016) the model can be taken as reasonably fit. RMSEA developed by Steiger and Lind (1980) tells model fitness with population covariance matrix. Till last century, a range of RMSEA between 0.05 to 0.10 was an indication of fair fit. However, recently an upper limit of 0.06 (Hu and Bentler, 1999) or according to Steiger (2007) it can be up to 0.07 for the model to be good fit. RMSEA value in the above mentioned model is a bit higher than 0.07 and that indicates the poor fit of the model.

Journal of Business and Retail Management Research (JBRMR), Vol. 10 Issue 3 July 2016
www.jbrmr.com A Journal of the Academy of Business and Retail Management (ABRM) 111
AGFI is used as an alternative to the Chi-square (χ2) test and gives the part of variance which is accounted for by the estimated covariance of the population (Hooper, Coughlan, & Mullen, 2008). AGFI is derived by adjusting Goodness of Fit (GFI) by its degrees of freedom. A well-fitting model should have its value 0.9 or more. Its value in the Table 2 is 0.916 indicating that the model is well fit.
NFI compares the Chi-square value of the model with that of model with null hypothesis. Bentler and Bonnet (1980) recommended 0.90 or more for a good fit. Bentler (1990) introduced CFI and 0.90 is taken as indictor good fit. CFI is widely used as a fit index as the effect of sample size is almost minimal. (Fan et al, 1999). IFI is the adjusted index of NFI for sample size and degrees of freedom (Bollen, K.A., 1989) and it is, therefore, more stable index in different sample sizes. Its value in the table above is more than minimum acceptable value 0.09.
5.4.2. Model Estimates: Weights of Regression: (Group No. 1: Default model)
Table 3
Estimate* S.E. C.R. P Label
Accessibility <--- Customer Satisfaction 0.739**
Convenience <--- Customer Satisfaction 0.654 .100 7.608 *** par_1
Efficiency <--- Customer Satisfaction 0.778 .098 8.544 *** par_2
Responsiveness <--- Customer Satisfaction 0.421 .088 5.020 *** par_3
Security Privacy <--- Customer Satisfaction 0.567 .089 6.684 *** par_4
Reliability <--- Customer Satisfaction 0.289 .072 3.460 *** par_5
* Standardized Regression Weights ** This regression weight was fixed at 1.000, not estimated.
The p-values of all standardized regressions weights are significant and support the goodness of the model mentioned above.
6. Conclusion: All responses were categorized into three Categories-Low, Medium, and High. In general,
the findings show more than 50 percent of ATM users showed high level of satisfaction in five of the six pre-selected dimensions of customer satisfaction with exception of reliability where in 47 percent showed their high level of satisfaction with 57 percent responded as medium level of satisfaction.
All the six dimensions show reasonable good satisfaction level, Security & Privacy being the top and Privacy ranks the last. Confirmatory model was used when applying structural equation modeling (SEM) model using standardized estimates of response variables and customer satisfaction as latent variable. Model fitness indices and model estimates show a collective good fit of the model. As it was evident from the other results, the relative contribution of reliability is the smallest (β=0.289).
Thus it is concluded that customer in Oman are satisfied with the ATMs and CDMs services being provided by all the Omani and foreign banks in the sultanate in general. The banking industry of Oman has to pay heed on improving the reliability of its ATM services as this dimension was the poorest among all the six dimensions and care has to been taken to be able to make the entire ATM service more reliable which in turn will increase the customer overall satisfaction level.
7. References: Bentler, P. M. (1990). Comparative fit indexes in structural models.Psychological Bulletin, 107(2), 238.

Journal of Business and Retail Management Research (JBRMR), Vol. 10 Issue 3 July 2016
www.jbrmr.com A Journal of the Academy of Business and Retail Management (ABRM) 112
Bentler, P. M., Bonett, Douglas G. (1980). Significance tests and goodness of fit in the analysis of covariance structures. Psychological Bulletin, 88(3), Nov 1980, 588-606.
Bollen, K. A.(1989). Structural equations with latent variables. New York: John Wiley, 612-21. Davis, F.; Moutinho, L. & Curry, B. (1996): ATM users’ attitudes: a neural network analysis. Marketing
intelligence & Planning, 14/2: 26-32 Dilijonas, D., Krikscuiunen, D., Sakalauskas, V. & Simutis, R. (2009). Sustainability Based Service Quality
Approach for Automated Teller Machine Network. http://www.vgtu.lt/leidiniai/leidykla Fan, X., Thompson, B.& Wang, L. (1999). Effects of sample size, estimation methods, and model
specification on structural equation modeling fit indexes. Structural Equation Modeling: A Multidisciplinary Journal, 6(1), 56-83.
Folorunso, O., Ateji, O. A. & Awe, O. (2010). An exploratory study of the critical factors affecting the acceptability of automated teller machine (ATM) in Nigeria. AnaleSeriaInformatica, 8(1), 151-162
Hendrickson, A.R., Massey, P.D. &Cronan, T.P. (1993). On the Test-Retest Reliability of Perceived Usefulness and Perceived Ease of Use Scales, MIS Quarterly, June, 227-229.
Hooper, D., Coughlan, J., & Mullen, M. (2008). Structural equation modeling: Guidelines for determining model fit. Articles, 2.
Howcroft, J. B. (1991). Customer satisfaction in retail banking.The Service IndustryJournal, 11(1), 11-17. Hu, L. T.&Bentler, P. M. (1999). Cutoff criteria for fit indexes in covariance structure analysis:
Conventional criteria versus new alternatives. Structural Equation Modeling: aMultidisciplinary Journal, 6(1), 1-55.
Jamil, S.A.& Khan, K. (2016). Does Gender Difference Investment Decisions? Evidence from Oman. International Journal of Economics and Financial Issues. 6(2), 456-460.
Joseph, M. & Stone, G. (2003): An empirical evaluation of US bank customer perceptions of the impact of technology on service delivery in the banking sector”, International Journal of Retail & Distribution Management, 31 (4): 190-202
Kevin C. and David, K. (2008).Investigating the Human Computer Interaction Problems with Automated Teller Machine (ATM) Navigation Menus. Computer and Information Science, 1 (2),34-51.
Komal, S. S. (2009). Impact of ATM on customer satisfaction (A comparative study of SBI, ICICI & HDFC bank). Business intelligence journal, 2 (2), 276-287
Lassar, W. M.,Manolis, C. &Lassar, S. S. (2005). The relationship between consumer innovativeness, personal characteristics and online banking adoption. International Journal of Bank Marketing, 23 (2), 176-199
Lewis, B. R.,Orledge, J. & Mitchell, V. (1994). Service quality: students’ assessment of banking and societies. International Journal of Banking Marketing, 12 (4): 2-3.
McGraw, K. O. and Wong, S. P. (1996), Forming Inferences about Some Intra-class Correlation Coefficients, Psychological Methods, 1, 30-46.
Mouthiho, L. (1992). Customer satisfaction measurements: prolonged satisfaction with ATMs. International
Journal of Bank Marketing, 10 (7), 30-7 Moutinho, L.& Smith, A. (2000). Modelling bank customer satisfaction through mediation of attitudes
towards human and automated banking. International Journal of Bank Marketing, 18(3), 124-134.
Muhammad, A. K. (2010). An Empirical Study of Automated Teller Machine Service Quality and Customer Satisfaction in Pakistani Banks.European Journal of Social Sciences, 13(3), 333-344.
Mulaik, S.A., James, L.R., Van Alstine, J., Bennet, N., Lind, S., & Stilwell, C.D. (1989). Evaluation of Goodness-of-Fit Indices for Structural Equation Models. Psychological Bulletin, 105 (3), 430-45.
Parasuraman, A. Zeithanl, V. & Berry, L. (1988). SERVQUAL: A multi-item scale for measuring consumer perceptions of service quality. Journal of Retailing, 64 (1), 12-40.
Parasuraman, A., Zeithaml, V. A.& Malhotra, A. (2005). ES-QUAL a multiple-item scale for assessing electronic service quality. Journal of Service Research, 7(3), 213-233.
Santos, J. (2003). E‐service quality: a model of virtual service quality dimensions. Managing Service Quality: An International Journal, 13 (3), 233 – 246.
Shamsuddoha, M., Chowdhury, M. T. & Ahsan, A. B. (2005): Automated Teller Machine: A New Dimension in the Bank Service of Bangladesh. http://paper.ssrn.com/so13

Journal of Business and Retail Management Research (JBRMR), Vol. 10 Issue 3 July 2016
www.jbrmr.com A Journal of the Academy of Business and Retail Management (ABRM) 113
Steiger, J. H. (2007). Understanding the limitations of global fit assessment in structural equation modeling. Personality and Individual Differences, 42(5), 893-898.
Steiger, J. H., & Lind, J. C. (1980, May). Statistically based tests for the number of common factors. In annual meeting of the Psychometric Society, Iowa City, IA (Vol. 758).
Yavas, U.,Benkenstein, M. &Stuhldreier, U. (2004). Relationship between service quality and behavioral outcomes: A study of private bank customers in Germany. The International Journal of Marketing. 22
(2/3), 144-157 Zeithaml, V. A. (2000). Service quality, profitability, and the economic worth of customers: what we know
and what we need to learn. Journal of the Academy of Marketing Science. 28(1), 67-85.

Journal of Business and Retail Management Research (JBRMR), Vol. 10 Issue 3 July 2016
www.jbrmr.com A Journal of the Academy of Business and Retail Management (ABRM) 114
Investigating the effect of the “big five” personality dimensions on compulsive buying behavior of Egyptian consumers
Monika Fayez Ashraf Labib
Faculty of Business and Technology Arab Academy for Science, Technology and Maritime Transport
Keywords Compulsive Buying Behavior, Personality, “Big Five”
Abstract Compulsive buying behavior is an emerging phenomenon nowadays, that has gained greater
attention since the late 1980s (Magee, 1994), reflecting negative behaviours of consumers (Hafez et al., 2013). This research aims to discuss compulsive buying behaviour of Egyptian consumers, taking the “Big Five” personality dimensions as the independent variable that impacts this behaviour, and therefore discussing this topic in the context of developing countries, unlike previous researches. Although many theories exist about the measurement of personality traits, the most famous and widely used approach in the recent years is the “Big Five” model (Quintelier, 2014; Tommasel et. al, 2015), namely; openness to experience, conscientiousness, extraversion, agreeableness, and neuroticism (Leung and Bozionelos, 2004; Lin, 2010; Tommasel et al., 2015). Quantitative research design is used, utilizing a structured questionnaire. Results are gathered from 400 respondents and are later analysed using Statistical Package for Social Sciences Version 20 (SPSS 20). Few tests are done, namely; reliability analysis, factor analysis, descriptive analysis, stepwise regression analysis, and ANOVA test.
The findings of the analysis and tests resulted in a new model, consisting of four new personality dimensions that affect compulsive buying behaviour, namely; anxiety, openness, self-control, and self-confidence. It is recommended to use the resulted model in future research, testing the effect of the new personality measures on compulsive buying behaviour. This research contributes to both application and theory, since it adds to the literature of the discussed topic, while focusing on developing countries. It also highlights the significant influence of some demographic groups on the newly identified relationship. Furthermore, it helps marketers in creating and adopting better marketing strategies.
1. Introduction O'Guinn and Faber (1989) were the firsts to define compulsive buying as “chronic, repetitive
purchasing that becomes a primary response to negative events or feelings”, a definition later on adapted by most of the researchers of this topic. Many factors were previously studied that influence compulsive buying behaviour, however this study’s independent variable of interest is the “Big Five” personality dimensions of personality, which has been discussed by many theories from different points of views. Personality was defined by psychology theories as the combination of emotional, interpersonal and attitudinal processes that originate internally in each person (Quentelier, 2014).The most famous and widely used approach in the recent years is the “Big Five” or the “Five-Factor Model” (Mowen and Spears, 2000; Dant et. al, 2012; Lounsbury et. al, 2014; Tommasel et. al, 2015), namely; openness to experience, conscientiousness, extraversion, agreeableness and neuroticism (Mowen and Spears, 1999; Llewellyn and Wilson, 2003; Leung and Bozionelos, 2004; Matzler et. al, 2006; Johnson and Attman, 2008; Lin, 2010; Tommasel et al., 2015)
This paper aims to examine the relationship between personality and compulsive buying behaviour. Furthermore, previous research in this area focused on this topic in developed

Journal of Business and Retail Management Research (JBRMR), Vol. 10 Issue 3 July 2016
www.jbrmr.com A Journal of the Academy of Business and Retail Management (ABRM) 115
countries, such as USA (Mowen and Spears, 1999; Xu, 2007; Norum, 2008; Attman, 2008), Australia (Phau and Woo, 2008) and China (Li et al., 2009). However, minimum attention was given to developing countries, and among all to Egypt. This is why this research aims to cover this part and fill that gap by investigating compulsive buying behaviour of consumers in developing countries, taking Egypt as the main scope. As for personality, there has been a wide interest in studying the “Big Five” personality dimension, and its effect on compulsive buying behaviour. Many research was done about this topic, however only few literature and research exist that studies this topic in the context of developing countries. This research therefore aims to study the same relationship in the context of employed Egyptian consumers, testing the effect of the “Big Five” personality dimensions on compulsive buying behaviour in the context of the Egyptian market.
2. Literature Review 2.1. Background and Definitions of Compulsive Buying Behavior
Compulsive buying was defined as a “chronic, repetitive purchasing that becomes a primary response to negative events or feelings” (O'Guinn and Faber, 1989; Joireman et al., 2010; Singh and Nayak, 2015), which differs from the general definition of buying intention that is based on the matching between purchase motives with the attributes of the brand under consideration (Moharam and Shawky, 2012).Reviewing the literature highlighted several compulsive buying characteristics namely; impulsiveness (Black, 2001; Dittmar, 2005; Joireman et al., 2010), uncontrollability (Dittmar, 2005; Phau and Woo, 2008; Ergin, 2010), excessiveness (Dittmar, 2005; Li et al., 2009), difficulty to stop (Saraneva and Sääksjärvi, 2008; Black, 2001), irresistibility (Koran et al., 2006; Phau and Woo, 2008), and irrationality (Koran et al., 2006; Phau and Woo, 2008). Other characteristics are low self-esteem (O’Guinn and Faber, 1992; Joireman et. al, 2010; Farrag et al., 2010); depression (O’Guinn and Faber, 1992; Joireman et. al, 2010), anxiety (O’Guinn and Faber, 1992; Joireman et. al, 2010), and obsessions (O’Guinn and Faber, 1992).
2.2. Background Information on Personality The independent variable of interest in this research that impacts compulsive buying
behaviour is personality, which measurement has been discussed by many theories (Quentelier, 2014). Dant et al. (2013) discusses that personality is theorized as a small set of stable characteristics, categorized as “dimensions” or “factors” that affect the way in which an individual acts in different situations. Tommasel et al. (2015) added that personality was defined by psychology theories as the combination of emotional, interpersonal and attitudinal processes that originate internally in each person, and consequently becomes among the main and primary factors that influence human behaviour, since it moderates how people react, behave, and interact with others, and says stable during adulthood. Although many theories exist about the measurement of personality traits, the most famous and widely used approach in the recent years is the “Big Five” or the “Five-Factor Model” (Mowen and Spears, 2000; Llewellyn and Wilson, 2003; Leung and Bozionelos, 2003; Matzler et al., 2006; Sanders, 2008; Lin, 2010; Migliore, 2011; Balmaceda et al., 2012; Wolff and Kim, 2012; Lounsbury et al., 2012; Dant et al., 2012; Lounsbury et al., 2014; Quintelier, 2014; Tommasel et al., 2015). The “Big Five” personality dimensions are; openness to experience, conscientiousness, extraversion, agreeableness and emotional stability/neuroticism (Wolff and Kim, 2012; Lounsbury et al., 2013; Quintelier, 2014).
Migliore (2011) identified Openness to Experience as being intellectually curious, having creative and imaginative cognition styles, and open to new ideas. Openness to experience includes characteristics such as imaginativeness (Guthrie et al., 1998; Robie et al., 2004; Migliore, 2011; Shahjehan et al., 2011; Wolff and Kim, 2012; Lounsbury et al., 2012; Tommasel et al., 2015;

Journal of Business and Retail Management Research (JBRMR), Vol. 10 Issue 3 July 2016
www.jbrmr.com A Journal of the Academy of Business and Retail Management (ABRM) 116
Agyemang et al., 2015) wideness of interests (Leung and Bozionelos, 2004), open-mindedness (Guthrie et al., 1998; Llewellyn and Wilson, 2003; Robie et al., 2004; Leung and Bozionelos, 2004; Sanders, 2008; Saadullah and Bailey, 2014) and adventure-seeking (Leung and Bozionelos, 2004). As a consequent to the mentioned characteristics of openness to experience, most of previous research presented a positive relationship between openness to experience and compulsive buying behavior (Shahjehan et al., 2012).
Conscientiousness is described as the tendency to be productive, achievement oriented, obedient and disciplined (Leung and Bozionelos, 2004). It is described by characteristics like being organized (Robie et al., 2004; Sanders, 2008; Quentelier, 2014; Balmaceda et al., 2014; Tommasel et al., 2015), discipline (Leung and Bozionelos, 2004; Balmaceda et al., 2014; Agyemang et al., 2015), carefulness (Guthrie et al., 1998; Wolff and Kim, 2012; Yang and Hwang, 2014), seriousness (Leung and Bozionelos, 2004; Roberts et al., 2005; Sanders, 2008), and dependability (Sanders, 2008; Shahjehan et al., 2011; Migliore, 2011; Lounsbury, et al., 2012; Dant et al., 2013; Quintelier 2014; Lounsbury, et al., 2014; Agyemang et al., 2015). According to the mentioned characteristics of conscientiousness, most of previous research discusses a negative relationship between conscientiousness and compulsive buying behaviour (Mikołajczak-Degrauwe et al., 2012).
According to Wolff and Kim (2012), extraversion refers to the general tendency of an individual to approach social situations. Moreover, it is distinguished by traits like confidence (Guthrie et al., 1998; Leung and Bozionelos, 2004; Shahjehan et al., 2011; Quintelier, 2014; Agyemang et al., 2015), the experience of positive emotional states (Leung and Bozionelos, 2004; Quintelier, 2014), energy (Robie et al., 2004; Leung and Bozionelos, 2004; Matzler et al., 2006; Dant et al., 2013; Saadullah and Bailey, 2014; Agyemang et al., 2015), sociability (Robie et al., 2004; Leung and Bozionelos, 2004; Shahjehan et al., 2011;Lounsbury et al., 2012; Quentelier, 2014; Lounsbury et al., 2014; Agyemang et al., 2015), and being outgoing (Lounsbury et al., 2012; Lounsbury et al., 2014). As a result to the presented characteristics of extraversion, most of previous research talked about a positive relationship between extraversion and compulsive buying behavior (Mikołajczak-Degrauwe et. al, 2012).
According to Migliore (2011) agreeableness refers to an individual’s concern for social harmony and cooperation with others. It is characterized by traits likeselflessness (Bozionelos, 2004; Mikołajczak-Degrauwe, 2012; Saadullah and Bailey, 2014; Leung and Bozionelos, 2014; Quentelier, 2014), friendliness (Bozionelos, 2004; Balmaceda et al., 2014; Migliore, 2011; Leung and Bozionelos, 2014), modesty (Bozionelos, 2004; Quentelier, 2014; Saadullah and Bailey, 2014),and trust (Sanders, 2008; Shahjehan et al., 2011; Mikołajczak-Degrauwe, 2012; Leung and Bozionelos, 2014; Saadullah and Bailey, 2014; Quentelier, 2014; Agyemang et al., 2015). According to the presented characteristics of agreeableness, most of previous research hypothesized a positive relationship between agreeableness and compulsive buying behaviour (Shahjehan et al., 2012).
Neuroticism was described by Migliore (2011) as excessive worry that leads to mental distress, inability to deal with daily life activities, and emotional suffering. It includes traits like being nervous (Bozionelos, 2004; Shahjehan et al., 2011; Saadullah and Bailey, 2014), pessimism (Bozionelos, 2004), experiencing negative emotions (Bozionelos, 2004; Saadullah and Bailey, 2014; Agyemang et al., 2015), excessive worry (Bozionelos, 2004; Leung and Bozionelos, 2004; Johnson and Attmann, 2008; Migliore, 2011; Agyemang et al., 2015), and anxiety (Guthrie et al., 1998; Sanders, 2008; Mikołajczak-Degrauwe, 2012; Balmaceda et al., 2014; Saadullah and Bailey, 2014; Tommasel et al., 2015; Agyemang et al., 2015).As a consequence to the discussed

Journal of Business and Retail Management Research (JBRMR), Vol. 10 Issue 3 July 2016
www.jbrmr.com A Journal of the Academy of Business and Retail Management (ABRM) 117
characteristics of neuroticism, most of previous research presented a positive relationship between neuroticism and compulsive buying behaviour (Mikołajczak-Degrauwe et. al, 2012). The research aims to examine the existing relationship between the “Big Five” personality dimensions and compulsive buying behavior in the Egyptian society.
3. Research Methodology 3.1. Methodology
This research follows the positivism methodology, since all the factors and criteria of research are known, and are only being tested, employing quantitative methods to get at the truth (Sekaran and Bougi, 2013). Explanatory Research is adopted as the aim is to investigate the relationship between cause and effect; namely the “Big Five” personality dimensions and compulsive buying behavior. Construct validity testifies to how well the results obtained from the use of the measure fit the theories around which the test is designed. Hence, in order to ensure the research construct validity, it is essential to identify research unit of analysis, tools and instruments.
3.2. Instruments As for the instruments, quantitative research technique was used to gather data in this
research, in the form of a structured, close ended, self-administered questionnaire. The questionnaire type is 5-point Likert scale, which is a rating scale that is widely used (Malhotra, 2004), ranging from strongly disagree to strongly agree. The questionnaire was developed in the English language, and was translated to the Arabic language by the college of language and translation at the Arab Academy for Science, Technology and Maritime Transport in Alexandria. As for the suggested data analysis techniques, the gathered data is analyzed using SPSS 20® (Statistical package for social science). First, descriptive analysis is used for the demographics, so that a sample profile is provided, presenting the frequencies of the demographic variables tested in the research; age, gender, completed level of education, marital status, number of children, current occupation, and household income. Following, a factor analysis is done to assess data suitability, followed by reliability analysis to ensure consistency of variables resulted from the factor analysis. Afterwards, regression analysis is done, and finally, ANOVA test was done, which is basically a procedure made to test the differences existing among different groups of data for consistency (Kothari, 2004).
3.3. Scope Non-Probability sampling was used in the research, namely convenience sampling,
where individuals were selected because of their convenient accessibility and closeness to the researcher. Only respondents aging 21 and above, with a job were asked to fill the questionnaire. The study was only tested in Alexandria, due to accessibility reasons, considering it the second largest city in Egypt. Questionnaires were distributed in banks, multinational companies, and universities. 518 questionnaires were originally distributed and 400 were received back. This was selected using Krejcie and Morgan (1970) sampling table. According to this table, the sample size for a population of 1,000,000 or more is 384.
3.4. Research Hypotheses The main aim of this research is to identify the relationship between the “Big Five”
personality dimensions (independent variables) and compulsive buying behavior (dependent variable). The goal is to identify the different effect an individual’s behavior can have on his/her compulsive buying behavior. Therefore, this research hypothesized the following:

Journal of Business and Retail Management Research (JBRMR), Vol. 10 Issue 3 July 2016
www.jbrmr.com A Journal of the Academy of Business and Retail Management (ABRM) 118
According to Mikołajczak-Degrauwe et al. (2012), conscientiousness is characterized by being responsible, disciplined, and precise. Those high on conscientiousness are organized, and think about the consequences of their actions very carefully. On the other hand, compulsive buyers are impulsive and irresponsible in their behavior, and therefore a negative relationship between conscientiousness and compulsive buying behavior is hypothesized. This research therefore hypothesizes:
H1: There is a negative relationship between conscientiousness and compulsive buying behavior. According to Shahjehan et al. (2012), agreeableness is positively related to compulsive
buying. This research therefore hypothesizes: H2: There is a positive relationship between agreeableness and compulsive buying behavior. Mowen and Spears (1999) hypothesized that there is a negative relationship between introversion and compulsive buying behavior. Mikołajczak-Degrauwe et. al, (2012) added that extrovert people are impulsive individuals characterized by lower self-control. Accordingly, the following hypothesis was developed: H3: There is a positive relationship between extraversion and compulsive buying behaviour. According to Shahjehan et al. (2012), openness to experience is positively related to compulsive buying. This research therefore hypothesizes: H4: There is a positive relationship between openness to experience and compulsive buying behaviour.
Mowen and Spears (1999) found that highly neurotic individuals were compulsive buyers. According to Johnson and Attmann (2008), individuals high on neuroticism were found to be compulsive buyers. Other characteristics, such as low self-esteem, anxiety and depression were also found to have a relationship with compulsive buying, and since these variables are found to be similar to neuroticism, it was predicted that those high on neuroticism will be compulsive buyers. Shahjehan et al. (2012) accordingly added that neuroticism is positively related to compulsive buying. This research therefore hypothesizes: H5: There is a positive relationship between neuroticism and compulsive buying behaviour.
4. Analysis 4.1. Factor Analysis
To assess the suitability of the data, factor analysis was conducted. First, an interval scale measurement was used, which is the first requirement (Hair et al., 2010). This was successfully used in the study through the use of a 5-point likert scale questionnaire. Another requirement for using factor analysis is the strong relationship between the variables. The Kaiser-Meyer-Olkin (KMO) Measure of Sampling Adequacy and Bartlett's Test of Sphericity are used to examine the strong relationship between the variables (Mukhopadhyay, 2009). The results of KMO test (Table 1) showed 0.907 which exceeds the minimum recommended value 0.8 (Mukhopadhyay, 2009). Bartlett's Test of Sphericity was 1784.757 with an associated statistical significance (p-value = 0.000). This implies that data is appropriate for factor analysis.
Kaiser-Meyer-Olkin Measure of Sampling Adequacy 0.907
Bartlett's Test of Sphericity Approx. Chi-Square 1784.757
Df 15
Sig. 0.000
Table 1 - KMO and Bartlett's Test
It is considered that a factor loading above 0.3 is considered significant; loadings of 0.40 are considered more important; if the loadings are 0.50 or greater, they are considered very significant (Mukhopadhyay, 2009). All the 23 items have a loading values range from 0.453 to

Journal of Business and Retail Management Research (JBRMR), Vol. 10 Issue 3 July 2016
www.jbrmr.com A Journal of the Academy of Business and Retail Management (ABRM) 119
0.691. This implies that all the items are statistically significant at a 0.05 significance level. Moreover, factor analysis has resulted in four suggested principal components (sevennew variables) as shown in Table 2. Hence, it is vital to reallocate the elements among the new variables (derived from factor analysis) before performing any further analysis to investigate the relationship between the new variables and compulsive buying behavior.
1 2 3 4 5 6 7
Careful .576
Organized .728
Disciplined .752
Serious .703
achievement oriented .460
depend on me .717
Responsible .643
Sympathize .738
Friendly .673
Cooperative .701
Selfless .711
Helpful .719
Modest .711
Trusting .564
Confident .645
Energetic .430
Sociable .741
Talkative .791
Expressive .720
Warm-hearted .486
Worry .727
Pessimistic .623
Nervous .743
Stressed .823
negative emotions .729
Anxious .736
Insecure .518
Moody .612
Sensitive .476
Imaginative .685
many interests .620
open minded .535
seek adventures .733
Curious .617

Journal of Business and Retail Management Research (JBRMR), Vol. 10 Issue 3 July 2016
www.jbrmr.com A Journal of the Academy of Business and Retail Management (ABRM) 120
Innovative .614
Intelligent .522
Table 2 - Rotated Component Matrix 4.2. Reliability Analysis Following factor analysis, the validity of the collected data for the “Big Five” personality dimensions and compulsive buying behavior identified by calculating Cronbach’s alpha (Table 3). Since the calculated Cronbach's alpha values are higher than 0.6, the research can rely on the collected data for testing the research hypotheses (Sekaran, 2003).
Scale No. of indicators Cronbach's alpha
V1 9 0.855
V3 6 0.753
V5 5 0.743
V7 3 0.673
Compulsive Buying Behaviour 6 0.923
Table 3 – Reliability analysis Next, stepwise regression was conducted to find the most suitable model. As a result, four
models were proposed, and the model with the highest R (0.365) was created using only V1, V3, V5, and V7 (Table 4). Accordingly, this research proposed title for each variable based on its general theme. These titles are; V1 (Anxiety), V3 (Openness), V5 (Self Control), and V7 (Self Confidence).
Model Summarye
Model R R Square Adjusted R Square
Std. Error of the Estimate
Durbin-Watson
1 .256a .066 .063 1.00478
2 .308b .095 .090 .99018
3 .343c .117 .111 .97897
4 .365d .133 .124 .97149 1.740
a. Predictors: (Constant), V1
b. Predictors: (Constant), V1, V3
c. Predictors: (Constant), V1, V3, V5
d. Predictors: (Constant), V1, V3, V5, V7
e. Dependent Variable: COMPDEP
Table 4 - Model Summary 4.3. Descriptive analysis
Basic descriptive statistics are conducted to ensure that there is negligible distortion of the questionnaire outputs. Descriptive analysis (Table 5) illustrated that both trimmed mean and median are close to mean. This indicates that extreme scores do not have influence on calculated mean. In addition, the absolute values of the skewness coefficients are relatively low. This means that there is only a weak distortion of the collected data for all variables.
Descriptive Statistics
N Range Minimum Maximum Mean Std. Deviation
Statistic Statistic Statistic Statistic Statistic Std. Error
Statistic

Journal of Business and Retail Management Research (JBRMR), Vol. 10 Issue 3 July 2016
www.jbrmr.com A Journal of the Academy of Business and Retail Management (ABRM) 121
V1 400 4.00 1.00 5.00 3.0681 .03818 .76356
V2 400 3.88 1.13 5.00 3.9778 .03137 .62736
V3 400 3.33 1.67 5.00 3.5113 .03579 .71578
V4 400 4.00 1.00 5.00 3.7008 .04184 .83684
V5 400 3.80 1.20 5.00 3.7335 .03285 .65693
V6 400 4.00 1.00 5.00 4.2675 .03741 .74823
V7 400 4.00 1.00 5.00 3.7717 .03340 .66798
COMPDEP 400 4.00 1.00 5.00 2.7017 .05191 1.03813
Valid N (listwise)
400
Table 5 – Descriptive analysis 4.4. Stepwise Regression analysis
The stepwise selection procedure was employed to ascertain the relationship between the identified new independent variables and compulsive buying behavior (dependent variables).
4.4.1 Hypothesis testing Investigating the relationship between the identified new independent variables and
compulsive buying behavior (dependent variable) illustrated that the overall model was significant as p-value = 0.009 (Healey, 2009), F = 15.155, R-Square = 23.3% (Table 6). An assessment of individual variables significance and the associated estimated regression parameters are displayed in Table 6. The stepwise analysis has identified the best model with four variables (V1, V3, V5, and V7).
Model R R Square Adjusted R Square
Std. Error of the Estimate
Durbin-Watson
1 0.365 0.233 0.124 0.97149 1.740
Model Sum of Squares Df Mean Square F p-value
Regression 57.212 4 14.303 15.155 .000e
Residual 372.798 395 .944
Total 430.010 399
* Predictors: (Constant), V1, V3, V5, V7
Model Unstandardized Coefficients Standardized Coefficients t p-value
B Std. Error Beta
(Constant) 1.112 0.424 2.619 0.009
V1 .385 .066 .283 5.800 .000
V3 .208 .074 .143 2.805 .005
V5 -.322 .081 -.203 -3.978 .000
V7 .233 .087 .150 2.669 .008
Table 6 - Model Summary 4.5. ANOVA and t-test
The next test done was the One-way ANOVA; a statistical method that demonstrates the differences among demographics when affecting compulsive buying behavior. Many previous studies discussed how the different demographic groups could affect compulsive buying behaviour. Consequently, all demographics were tested, but only age, marital status, number of children, and income were found to be significant and their effect differs among the different groups. The results of the independent-samples t-test which was conducted to compare compulsive buying scores for males and females showed that there was an insignificant difference (sig. = 0.138) in scores for females and males.
5. Discussion and Conclusion This study was aiming to measure the effect personality factors have on compulsive buying
behaviour of Egyptian consumers. Five main factors of personality were tested and

Journal of Business and Retail Management Research (JBRMR), Vol. 10 Issue 3 July 2016
www.jbrmr.com A Journal of the Academy of Business and Retail Management (ABRM) 122
hypothesized as determinants of compulsive buying behaviour, namely; conscientiousness, agreeableness, extraversion, openness to experience and neuroticism. All variables except conscientiousness were hypothesized to have a positive relationship with compulsive buying behaviour, a similar case to most previous studies about this topic. Conducting the proper analysis techniques, new possible personality characteristics that affect compulsive buying behaviour and that might be taken into consideration in future research are highlighted
The first test made in analysing the data was the factor analysis. After the conduct of factor analysis, a new distribution of statements was presented. The study began with testing the effect of the “Big Five” personality dimensions, but factor analysis revealed seven new groupings of variables. Therefore, it was not necessary to discuss the previously mentioned hypotheses, since new variables were discovered. Further analysis resulting from stepwise regression revealed that the best suggested model would be consisting of four only of the seven mentioned groups. Accordingly, those new groupings were named; Anxiety, Openness, Self-Control, and Self Confidence. The findings suggest that the new identified factors are a more suitable measure of personality in the Egyptian environment, and better define the personality of Egyptian compulsive buyers.
When ANOVA test was run, it was found that compulsive buying behaviour differs among some of the demographic groups. The results were significant when it comes to age, number of children, marital status and current job status. According to previous studies, there is an existent relationship between compulsive buying behaviour and young consumers (Ergin, 2010; Singh and Nayak, 2015). It was mainly discussed that young people tend to show stronger compulsive buying tendencies than older consumers (Dittmar, 2005). Furthermore, the household income level, which has a significant effect on the relationship between self-confidence and compulsive buying behaviour, was previously discussed by few studies. According to the research of Koran et al. (2006), as well as Ergin (2010) income is one of the significant factors affecting compulsive buying behaviour. Considering the number of children, and the marital status, there are no previous studies indicating a significant effect of this demographic group and compulsive buying behaviour.
According to these results, the equation of the suggested model is y = 1.112 + 0.385 V1 + 0.208 V3 – 0.322 V5 + 0.233 V7. The figure of the suggested model is presented below.
Figure 1 - Suggested Model
Self-Control
Compulsive
Buying Behavior
Openness
Anxiety
Self Confidence
Number of
Children
Marital
Status
Income
Level
Age

Journal of Business and Retail Management Research (JBRMR), Vol. 10 Issue 3 July 2016
www.jbrmr.com A Journal of the Academy of Business and Retail Management (ABRM) 123
It is believed that this research contributes to both practice and theory. Discussing the academic implications, the findings of the present research contribute to the literature concerning the “Big Five” personality dimensions and their relationship to compulsive buying behaviour, identifying new variables with new significant relationship with compulsive buying behaviour of the Egyptian consumers. Moreover, since minimum attention was given to developing countries, and among all to Egypt, this research covers this part and fills that gap by investigating compulsive buying behaviour of consumers in developing countries, taking Egypt as the main scope. When it comes to the sample of the study, it covers a wide variety of demographic information, which offers a wide variety of correlations that could be done, to highlight the linkage and relationship between the variables of interest, as well as show possible exceptions or special cases. Furthermore, this research identified demographic groups with significant influence that were not covered in past research (marital status and number of children), which adds up to the literature.
As for the practical implications, this study points out at some important areas and points that marketers should take into account. It provides a better view on the existing relationship between personality and compulsive buying behaviour, and how individuals’ personality can affect his/her buying behaviour. This helps marketers study their target customers’ personalities to be able to deal with them effectively and help them make purchasing decisions, as well as deal with customers and affect their buying behaviour regarding their products, and also better segment the market and target the right type of customers. Furthermore, this could be useful for marketers in adopting the marketing philosophy of relationship marketing, which aims at establishing, attracting, maintaining and enhancing the relationships with customers (Abd-El-Salam et al., 2013).
5.1 Research limitations and Direction for Future Research Despite the fact that this study increases the knowledge and understanding on the
existing relationship between personality dimensions and compulsive buying behaviour of the Egyptian consumers, it has a number of limitations. However, these limitations build a ground for future research, and do not make the findings less significant. First, the sample consists of residents of Alexandria only, who are employed, and have a personal income. Therefore, the generalization of the study may be limited to this city only, and must be carefully applied, especially since the respondents are asked about shopping in general, without focusing on a specific shopping area. In the future, larger samples can be studied to compare the results of different cities in Egypt with the results found in this study, while focusing on a more specific shopping context, such as Fast Moving Consumer Goods context, since it is has become one of the main economic sectors in Egypt (Tantawi and Negm, 2011). Second, the research aims to focus on the effect of the “Big Five” personality dimensions on compulsive buying behaviour, limiting personality to only these five factors. It is recommended that future studies can focus on other theories of personality, covering other factors of personality than just the “Big Five” personality dimensions, for example taking the new proposed model as a base. Another limitation is the fact that the gathered data is cross-sectional in nature and not longitudinal. Cross-sectional studies fail to capture the changing and dynamic nature of consumers’ behaviour, so longitudinal study is recommended. Finally, the questionnaire was a self-administered one, where individuals used to rate their personality based on a series of statements. This can sometimes result in inaccurate information, since people tend to rate themselves higher on personality dimensions than they actually are. A solution might be the use of a different tool for measurement.

Journal of Business and Retail Management Research (JBRMR), Vol. 10 Issue 3 July 2016
www.jbrmr.com A Journal of the Academy of Business and Retail Management (ABRM) 124
References Abd-El-Salam, E., Shawky, A., El-Nahas, T. (2013). The impact of corporate image and reputation on
service quality, customer satisfaction and customer loyalty: testing the mediating role. Case analysis in an international service company. The Business & Management Review, 3(2), pp.177-196.
Black, D. (2001). Compulsive Buying Disorder. CNS Drugs, 15(1), pp.17-27. Bozionelos, N. (2004). The big five of personality and work involvement. Journal of Managerial Psychology,
19(1), pp.69-81. Burns, Alvin, and Ronald Bush. Marketing Research. 7th ed. Pearson, 2014. Dant, R., Weaven, S. and Baker, B. (2013). Influence of personality traits on perceived relationship quality
within a franchisee‐franchisor context. European Journal of Marketing, 47(1/2), pp.279-302. Dittmar, H. (2005). A New Look at “Compulsive Buying”: Self–Discrepancies and Materialistic Values as
Predictors of Compulsive Buying Tendency. Journal of Social and Clinical Psychology, 24(6), pp.832-859.
Dittmar, H. (2005). Compulsive buying - a growing concern? An examination of gender, age, and endorsement of materialistic values as predictors. British Journal of Psychology, 96(4), pp.467-491.
Ergin, E. (2010). Compulsive buying behavior tendencies: The case of Turkish consumers. African Journal of Business Management, 4(3), pp.pp. 333-338.
Faber, R. and O'Guinn, T. (1992). A Clinical Screener for Compulsive Buying. Journal of Consumer Research, 19(3), p.459.
Farrag, D., El Sayed, I. and Belk, R. (2010). Mall Shopping Motives and Activities: A Multimethod Approach. Journal of International Consumer Marketing, 22(2), pp.95-115.
Hafez, M., El Sahn, M. and Farrag, D. (2013). The Effect of Egyptians' Money Attitudes on Compulsive Buying with the Role of Credit Card Use. The Macrotheme Review, 2(6), pp.73-88.
Hair, J. F., Black, W. C., Babin, B. J. and Anderson, R. E. (2010). Multivariate Data Analysis: A Global Perspective, Seventh Edition, Pearson.
Healey, J. F. (2009), Statistics: A Tool for Social Research, Eighth Edition, Wadsworth Cengage Learning. Johnson, T. and Attmann, J. (2009). Compulsive buying in a product specific context: clothing. Journal of
Fashion Marketing and Management: An International Journal, 13(3), pp.394-405.
Joireman, J., Kees, J. and Sprott, D. (2010). Concern with Immediate Consequences Magnifies the Impact of Compulsive Buying Tendencies on College Students' Credit Card Debt. Journal of Consumer Affairs, 44(1), pp.155-178.
Koran, L., Faber, R., Aboujaoude, E., Large, M. and Serpe, R. (2006). Estimated Prevalence of Compulsive Buying Behavior in the United States. American Journal of Psychiatry, 163(10), pp.1806-1812.
Kothari, C. (2004). Research methodology. New Delhi: New Age International (P) Ltd. Li, D., Jiang, Y., An, S., Shen, Z. and Jin, W. (2009). The influence of money attitudes on young Chinese
consumers' compulsive buying. Young Consumers, 10(2), pp.98-109.
Lin, L. (2010). The relationship of consumer personality trait, brand personality and brand loyalty: an empirical study of toys and video games buyers. Journal of Product & Brand Management, 19(1), pp.4-17.
Llewellyn, D. and Wilson, K. (2003). The controversial role of personality traits in entrepreneurial psychology. Education + Training, 45(6), pp.341-345.
Lounsbury, J., Foster, N., Carmody, P., Young Kim, J., Gibson, L. and Drost, A. (2012). Key personality traits and career satisfaction of customer service workers. Managing Service Quality, 22(5), pp.517-
536. Magee, A. (1994), Compulsive Tendency as a Predictor of Attitudes and Perceptions. Advances in Consumer
Research, 21(1), pp.590-594. Malhotra, Naresh. Marketing Research. 4th ed. Pearson Education International, 2004. Maria Balmaceda, J., Schiaffino, S. and Godoy, D. (2014). How do personality traits affect communication
among users in online social networks?.Online Information Review, 38(1), pp.136-153.
Matzler, K., Bidmon, S. and Grabner‐Kräuter, S. (2006). Individual determinants of brand affect: the role of the personality traits of extraversion and openness to experience. Journal of Product & Brand Management, 15(7), pp.427-434.

Journal of Business and Retail Management Research (JBRMR), Vol. 10 Issue 3 July 2016
www.jbrmr.com A Journal of the Academy of Business and Retail Management (ABRM) 125
Migliore, L. (2011). Relation between big five personality traits and Hofstede's cultural dimensions. Cross Cultural Management, 18(1), pp.38-54.
Moharam, O. and Shawky, A. (2012). Measuring The Effects of Personalized Integrated Marketing Communication Tools on the Consumers’ Intention to Purchase Credit Cards in the Private Banking Sector in Egypt. American Academic & Scholarly Research Journal, 4(5).
Mowen, J. and Spears, N. (1999). Understanding Compulsive Buying Among College Students: A Hierarchical Approach. Journal of Consumer Psychology, 8(4), pp.407-430.
Mukhopadhyay, P. (2009), Multivariate Statistical Analysis, World Scientific. O'Guinn, T. and Faber, R. (1989). Compulsive Buying: A Phenomenological Exploration. Journal of
Consumer Research, 16(2), p.147. Phau, I. and Woo, C. (2008). Understanding compulsive buying tendencies among young
Australians. Marketing Intelligence and Plan, 26(5), pp.441-458. Quintelier, E. (2014). The influence of the Big 5 personality traits on young people’s political consumer
behavior. Young Consumers, 15(4), pp.342-352. Roberts, J. and Roberts, C. (2012). Stress, gender and compulsive buying among early adolescents. Young
Consumers, 13(2), pp.113-123. Sanders, B. (2008). Using personality traits to predict police officer performance. Policing, 31(1), pp.129-
147. Saraneva, A. and Sääksjärvi, M. (2008). Young compulsive buyers and the emotional roller‐coaster in
shopping. Young Consumers, 9(2), pp.75-89. Sekaran, U. (2003), Research Methods for Business: A Skill Building Approach, Fourth Edition, John Wiley and
Sons. Tantawi, P. and Negm, E. (2011). Measuring the Impact of Certain Hedonic and Rational Components on
Consumers’ Intention to Adopt Innovative Fast Moving Consumer Goods (FMCG) in Egypt. The Business & Management Review, 1(2), pp.237-246
Tommasel, A., Corbellini, A., Godoy, D. and Schiaffino, S. (2015). Exploring the role of personality traits in followee recommendation. Online Information Review, 39(6), pp.812-830.
W. Lounsbury, J., M. Loveland, J., W. Gibson, L. and J. Levy, J. (2014). Distinctive personality traits of quality management personnel. The TQM Journal, 26(5), pp.510-521.
Wolff, H. and Kim, S. (2012). The relationship between networking behaviors and the Big Five personality dimensions. Career DevInt, 17(1), pp.43-66.

Journal of Business and Retail Management Research (JBRMR), Vol. 10 Issue 3 July 2016
www.jbrmr.com A Journal of the Academy of Business and Retail Management (ABRM) 126
Engagement in integrated reporting: evidence from the international integrating reporting council adoption framework
Sutana Boonlua Mahasarakham Business School
Mahasarakham University. Thailand
Sirin Phankasem Office of the Auditor General of Thailand
Keywords OAG Engagement, Integrated Reporting, IIRC Framework
Abstract The research objectives are to emphasize that companies in Thailand apply the International
Integrated Reporting Council (IIRC) framework into their integrated report, examine the board of committee responsiveness for the companies’ used the integrated report, investigate of the adoption of the IIRC framework into the integrated report for companies in Thailand, and promote a rethink of corporate reporting, through the release of framework, guidelines and standards to improve the contents of information and process of integrated report in Thailand.The populations of this research came from the delegates, who attended the International Symposium on National Integrity System hosted by Office of the Auditor General (OAG) of Thailand in Chiang Mai, Thailand, on 18-19 February, 2016. There were 42 questionnaires completed by random.
The multi linear regression analysis was employed to analyze 5 independent variables. There are only 2 factors: governance and business model factors are significant and positively affected to the performance and outlook, basis of preparation and presentation at the 5% level of significance. The connectivity of information, OAG and business relationships, materiality, conciseness, reliability and completeness, and consistency and comparability should be discussed in the future research to be better instrument for stakeholders’ decision making.
1. Introduction
For a large part of the last century corporate governance choices aimed at profit maximization (Jensen and Meckling, 1976) and obtainment of shareholders’ short-term consent. This approach, typical of Anglo-Saxon corporations, also predominated in most firms of all industrialized countries, affecting their development and communications. In recent decades, a different role of business in society has been claimed in order to respond to the increasing diffusion of frauds and mismanagement, and to comply with the emerging concepts of sustainable development (Steurer et al., 2005) and stakeholder relations management (Freeman, Martin, and Parmar, 2007). A firm’s sustainable growth underlines the necessary interdependence between stakeholder relationships management and integration of economic, social and environmental responsibilities (Henriques and Richardson, 2004). Firms aim at creating sustainable value as a condition for minimizing risks and protecting profitable durability. This causes a rethink of corporate governance purposes and a redefinition of the interaction among the board, the employees and the external stakeholders; furthermore, it necessitates a careful review of key performance variables and a new approach of communication. Hence, the importance of a holistic and integrated representation of a firm’s economic, social and environmental performance has been progressively recognized since the beginning of this century.

Journal of Business and Retail Management Research (JBRMR), Vol. 10 Issue 3 July 2016
www.jbrmr.com A Journal of the Academy of Business and Retail Management (ABRM) 127
According to these premises, the research focuses on the integrated report as a tool for improving corporate communication through both the OAG (Office of Auditor General of Thailand) engagement for the selection of significant information and transparency on the creation of value over the short, medium and long term. The research is organizes as follows: part one introduces the OAG engagement and integrated reporting, part two considers the evolution of corporate communication in line with the change in governance aims, part three analyzes the international integrated reporting framework, stressing its innovation and continuity compared to other internationally accepted external reporting guidelines, part four describes come selected cases of first-time application of the framework and finally contains some concluding remarks and identifies future research direction based on the possible development of integrated reporting.
Objectives 1. It is to emphasize that companies in Thailand apply the IIRC (International
Integrated Reporting Council) framework into their integrated report. 2. It is to examine the OAG responsiveness for the companies’ used the integrated
report. 3. It is to investigate of the adoption of the IIRC framework into the integrated report
for companies in Thailand. 4. It is to promote a rethink of corporate reporting, through the release of framework,
guidelines and standards to improve the contents of information and process of integrated report in Thailand.
5. It is to stress companies’ innovation in respect to the capital model.
2. Literature Review 2.1 The OAG and Stakeholder Engagement and Corporate Communication
The transition from the shareholder view to stakeholder view has produced a deep modification of corporate governance purposes. In the 1990s, the dominant purpose of the large corporations was the creation of economic value for their shareholders as stated, for example, by the Coca-Cola Company in its 1995 annual report as “We exist for one reason: to maximize share-owner value over time. To accomplish this mission, the Coca-Cola Company and its subsidiaries have developed a comprehensive business strategy focused on four key objectives: (1) increasing volume, (2) expanding share of worldwide beverage sales, (3) maximizing long-term cash flows, and (4) improving economic profit and creating economic value added. We achieve these objectives by investing aggressively in the high-return beverage businesses and by optimizing our cost of capital through appropriate financial policies” (Coca-Cola, 1996). Conversely, the Coca-Cola Company itself explained in its annual review for 2012 as “At the Coca-Cola Company, sustainability is about growing our business as we take positive steps to help enhance people’s lives, build strong communities and protect environment we all share. We are committed to using our marketing expertise, the appeal of our brands and our global scale to create value and make a lasting, positive difference. This commitment is not only about philanthropy, it is about creating a more sustainable business” (Coca-Cola, 2013). It appears that large companies have changed their orientation of corporate governance, at least formally acknowledging the necessity of integration among economic, social and environmental responsibilities. In the meantime, the companies have improved the ways to implement OAG and stakeholder engagement and to be accountable, and they have developed new methods and tools of governance to increase their whole performance.

Journal of Business and Retail Management Research (JBRMR), Vol. 10 Issue 3 July 2016
www.jbrmr.com A Journal of the Academy of Business and Retail Management (ABRM) 128
To emphasize the role of the stakeholders, a company should map the most significant ones and identify their expectations in line with the concept of triple bottom line which are (1) integration of economic, (2) social, and (3) environmental concerns (Salvioni and Bosetti, 2014); then it should select strategic objectives and prioritize them according to the expectations it wants to satisfy firstly, through a globally responsible conduct. Moreover, the company should apply the best mechanisms of governance to spread the culture of corporate responsibility all over the organization and business. Finally, the company should introduce a plan of internal and external integrated communication towards all the stakeholders, in order to meeting their information needs. Recognizing the importance of sustainability and OAG engagement determines an evolution of corporate disclosure founded on the choice of the most adequate contents and means of dissemination to satisfy the information and evaluation needs of the stakeholders. In this regard, the companies have enriched their communication over the years to improve transparency on corporate governance. To complete the traditional financial reporting, an increasing number of firms have published different types of documents such as a corporate governance statement, a remuneration report, a social report, an environmental report, a sustainability report, and an intellectual capital report. Furthermore, the information divulged by the firms has become more and more detailed, and sometimes even abounding and overlapping (Salvioni and Bosetti, 2014). The extension of information to improve transparency has been accompanied by new methods for content dissemination, which facilitate both the access to information and the timeliness. The advancement of information and communication technology (ICT) has improved the effectiveness of corporate communication, reducing costs and time of information preparation and dissemination; moreover, ICT has knocked down space barriers, accelerating the fulfillment of information symmetry and international uniformity (Salvioni and Bosetti, 2014). Participating to a more efficient, environment-oriented and competitive economy involves huge modifications in the complexity of the relationship between a company and its significant stakeholders. Besides, company requires two-way communication such as from the former to the latter and vice versa. The improvements in communication also permit the stakeholders to carry out more reasonable comparisons among firms. Today, successful firms are expected to adopt, maintain and strengthen corporate governance systems in accordance with the commonly accepted international best practices. The systems are necessarily based on transparent and complete information, prepared and disseminated respecting the frameworks acknowledged all over the world. To face the insistent demand for transparency, many organizations have been established with the purpose of providing the operators with reporting frameworks that emphasize the principles of sustainable development and global responsibility, in order to facilitating a positive and equitable interaction between the companies and their stakeholders. The framework released by the international integrated reporting council (IIRC) in 2013 is one of the most interesting proposals in this sense. This framework recommends the publication of an integrated report, primarily intended to inform the investors about how a firm has accomplished its responsibilities and how it has performed, in order to raising consents and resources (Eccles and Krzus, 2010). This evidently involves the necessity for each company to choose and compose the report’s contents in the most proper way to meet the expectations, concerns and understanding capability of its stakeholders.

Journal of Business and Retail Management Research (JBRMR), Vol. 10 Issue 3 July 2016
www.jbrmr.com A Journal of the Academy of Business and Retail Management (ABRM) 129
2.2 The IIRC Framework between Innovation and Continuity Since 2010 the interest in integrated reporting (IR) has considerably increased. This is due in part to the activity of the IIRC, a world association that encourages studying, experiment and divulging the integrated report. The IIRC cooperates have adhered a concise communication about how an organization’s strategy, governance, performance and prospects, in the context of its external environment, lead to the creation of value over the short, medium and long term (Salvioni and Bosetti, 2014). The use of framework is normally voluntary, even if its adoption has already been recommended in some financial markets. It is the case of South Africa, where listed companies are expected to produce integrated reports according to 2009 King Code of Governance for South of Africa, also known as King III. On March 12, 2014 the Integrated Reporting Committee of South Africa, which includes the Johannesburg Stock Exchange as one of its most influential members, officially endorsed the IIRC framework, which it described as the best tool for approaching integrated reporting. The framework essentially contains guidelines for profit organizations of any size that intend to publish an integrated report to boost transparency towards providers of financial capital, such as equity and debt holders, including all lenders, creditors and fund managers, both existing and potential. However, the IIRC does not exclude the possibility that the framework is applied, adapted if necessary, by public and non-profit organizations. In the same way, the IIRC acknowledges the informative value integrated reporting for many other stakeholders: employees, customers, suppliers, commercial partners, local communities, regulators, and public authorities. Indeed, integrated reporting should permit all providers of resources to understand both the significant internal processes and the main external relationships of the company. In particular, it should demonstrate how the interaction among financial, manufactured, social, human, intellectual, and environmental factors operates for the creation of value over time. Integrated reporting requires organizing and linking different pieces of information each other, according to the connectivity principle, which is a framework’s peculiarity. The companies are expected to give a clear representation of the interaction among different resources for the production of benefits for both their shareholders and all other stakeholders. The companies do not need to prepare an additional, stand-alone document: and enrichment of the traditional annual report or sustainability report could be enough. For example, the companies could introduce a specific section to provide details about how they employ the resources in various processes to create value, in other words what they do to obtain the desired economic, social and environmental performance (Salvioni and Bosetti, 2014). Another innovation proposed by the framework is a comprehensive view of capitals, such as stocks of resources that permit a company to work and are transformed into outputs and outcomes, causing a continuous flow of value. Consequently, an integrated report should provide explanations of how and to what extent different types of capitals, as inputs of the business model, produce results in line with the stakeholders’ needs over the short, medium and long term. According to the IIRC, results consist of an increase, a decrease, or a transformation of the capitals. Specially, the framework identifies the following types of capitals each organization can adapt to best match its own characteristics: -financial capital, including the money provided by investors or original through investments,

Journal of Business and Retail Management Research (JBRMR), Vol. 10 Issue 3 July 2016
www.jbrmr.com A Journal of the Academy of Business and Retail Management (ABRM) 130
-manufactured capital, referring to tangible assets belonging to the company (such as buildings and equipment) and infrastructure, -intellectual capital, comprising the intellectual property of patents, copyrights, software, etc., and the organizational capital based on knowledge and internal procedures,
-human capital, composed of the employees’ competencies, capabilities, experience, motivation, loyalty, and spirit of innovation,
-social and relationship capital, consisting in the contribution of the company to enhancing the society’s well-being, the sharing of values and rules, the company’s brand and reputation, and its social legitimacy to work,
-natural capital, representing the environment such as natural resources, biodiversity and eco-system health.
For the capital information, the organization should apply some guiding principles, which are recommended by the framework and reflect the recent evolution of the international reporting standards and guidelines.
Table 1: The IIRC Framework’s Guiding Principles Strategic focus and future orientation The company should describe its strategy specifying how it
relates to internal and external opportunities, risks, and dependencies that can influence the ability to create value over time and effect on the capitals.
Connectivity of information The company should link different types of information to give a picture of the interrelations existing among resources, activities, and results. Connectivity should be applied to quantitative and qualitative information, economic, social and environmental aspects, and the past, present, and future. Cross-reference and links to separate documents or websites improves the connectivity of information.
Stakeholder relationships The company should disseminate about the nature and the quality of its relationships with the main stakeholders it depends on to raise consent and capitals. The company should also describe the processes carried out to understand and satisfy stakeholders’ expectations.
Materiality The company should focus on the factors that influence the creation of value over time significantly. The company should also describe the procedures adopted to identify and prioritize the material issues and to select the relevant information.
Conciseness The company should prepare a concise report using clear and plain language. The report should cover all the material issues. Also, the report should contain cross-reference to other documents.
Reliability and completeness The company should releases a complete, reliable and impartial report, which should contain details concerning internal control on integrated reporting and external, independent assurance.
Consistency and comparability The company should guarantee consistency and comparability of its disclosure. For example, consistency in the selection of key performance indicators facilitates the comparison of reports over time, while the general respect of the framework permits to compare a company with others.
(Salvioni and Bosetti, 2014, p.81). The IIRC has identified the most important content elements of an integrated report:
most of them refer to the organization and its external environment, the activities it has carried

Journal of Business and Retail Management Research (JBRMR), Vol. 10 Issue 3 July 2016
www.jbrmr.com A Journal of the Academy of Business and Retail Management (ABRM) 131
out and the results it has achieved, while other recommended information concerns the procedures to appear the integrated report itself.
Table 2: The IIRC Framework’s Content Elements Organizational overview and external environment
-Corporate culture and values, ownership, operating structure, market position. -Legal, political, macroeconomic, commercial, social, demographic, environmental and technological factors affecting the company.
Governance Leadership, board composition and diversity, decision-making, ethical influence on the use of capitals, remuneration and incentives linked to the use of capitals.
Business model Description of how inputs are transformed into outputs and outcomes by means of the company’s activity, and dependencies on key stakeholders.
Risks and opportunities Identification of the events affecting value creation over time; consequent risk assessment and risk response.
Strategy and resource allocation Strategic analysis of the environment, also considering the results of stakeholder consultation.
Performance Comparison between objectives and results by means of a combined use of qualitative explanation and quantitative measures as a key performance indicator.
Outlook Future challenges and uncertainties, and possible effects on strategy development and performance.
Basis of preparation and presentation Materiality determination process; reporting boundary; summary of significant framework and methods applied to evaluate material matters.
(Salvioni and Bosetti, 2014, p.81-82). The multidimensional concerns the report should according to the triple bottom line, in order to providing all economic, social and environmental information that supports stakeholders/evaluations. Moreover, the report exists in relation to some suggested principles for an effective development of integrated reporting. The international best practice recommends that company adopt mechanisms of OAG engagement, in particular by involving their stakeholders in consultations for optimizing strategic decision-making. Company’s directors could better understand the internal and external expectations that should guide the selection of corporate variables to be monitored and disclosed, given their ability to affect the creation of value. Thus the hypotheses are proposed as:
The organizational overview and external environment factor (H1), governance factor (H2), business model factor (H3), risks and opportunities factor (H4), and strategy and resource allocation factor (H5) positively influence to the performance and outlook, basis of preparation and presentation as integrated reporting evidence from the adoption of the IIRC framework.
3. Methodology In the light of innovation and continuity of the IIRC framework compared to the other
international reporting standards and guidelines adopted worldwide, the research aims at analyzing the state of the art of integrated reporting. Giventhe very recent issue of the framework, this research presents and discusses some cases of the companies followed the IRC framework.
This research was conducted in two phases. The first phase involved secondary research such as reviewing of relevant literatures, journals, publications, books, official reports, working papers, and related information. The second phase, the primary research involved collection of primary data via survey research structured questionnaires. The populations of this research

Journal of Business and Retail Management Research (JBRMR), Vol. 10 Issue 3 July 2016
www.jbrmr.com A Journal of the Academy of Business and Retail Management (ABRM) 132
came from the delegates, who attended the International Symposium on National Integrity System hosted by Office of the Auditor General (OAG) of Thailand in Chiang Mai, Thailand, on 18-19 February, 2016. A total number of 64 delegates (Governing Board and Audit Committee member SAIs, observers, and other invited organizations including CCAF-FCVI Inc., and UN Women) participated in the meeting and discussed key agendas for the ASOSAI. The survey was considered the most suitable research design to obtain empirical evidence on the OAG Engagement and Integrated Reporting Evidence from the Adoption of the IIRC Framework.
The key respondents are from delegate’s /committees/ auditors/ directors/ OAG officers in the International Symposium on National Integrity System hosted by Office of the Auditor General (OAG) of Thailand during 18-19 February, 2016. The interview was also conducted. The questionnaire was revised based on comments. Questionnaires were tried to collect all attendants but only 42 delegates are completed by random. According to Aaker, Kumar, and Day (2001), an acceptable response rate for a mailed survey and appropriate follow up procedure is considered 20%.The acceptable average response rate for questionnaire survey research is 20% (Aaker, Kumar, and Day, 2001). The number of received questionnaires was 42 out of 64 which response rate of 65.63%. Thus this sample size is acceptable and adequate for a study. 4. Research Results
From the frequency and simple correlation analysis, this is to determine the importance level of various factors affecting the OAG engagement and integrated reporting (IR) evidence from the adoption of the IIRC framework and the significance of the relationship. There are 15 independent variables and grouped into five groups as named as O (Organizational overview and external environment), G (Governance), B (Business model), R (Risks and opportunities), and S (Strategy and resource allocation). The correlation matrix shows that the PL (Performance and outlook, basis of preparation and presentation -- dependent variable) have positive correlation to all independent variables at the 1% level of significant.
Table 3: Descriptive Statistics and Correlations Matrix
** Correlation is significant at the 0.01 level (2-tailed) Questionnaire is divided into two parts. Part one is required respondents to rate the
factors on the Likertscale of 1 to 5. There are five factors identified for the research including Organizational overview and external environment factor, Governance factor, Business model factor, Risks and opportunities factor, and Strategy and resource allocation factor. Part two of the questionnaire basically about the general information of the respondents.
The results found that the Organizational overview and external environment factor (O) was rated as the most important factor on average with the mean score of 4.10. Following the Governance factor (G), Business model factor (B), Strategy and resource allocation factor (S), and
Mean S.D. PL O G B R S
PL 4.11 .438 1
O 4.10 .379 .452** (.003)
1
G 4.07 .518 .564** (.000)
.617** (.000)
1
B 4.04 .449 .659** (.000)
.581** (.000)
.406** (.008)
1
R 3.97 .574 .558** (.000)
.576** (.000)
.455** (.003)
.793** (.000)
1
S 4.01 .468 .616** (.000)
.560** (.000)
.622** (.000)
.759** (.000)
.626** (.000)
1

Journal of Business and Retail Management Research (JBRMR), Vol. 10 Issue 3 July 2016
www.jbrmr.com A Journal of the Academy of Business and Retail Management (ABRM) 133
Risks and opportunities (R) have average the mean score of the important level at 4.07, 4.04, 4.01, and 3.97, respectively.
The correlation matrix shows that the performance and outlook, basis of preparation and presentation has a positive correlation with O (.452), G (.564), B (.659), R (.558), and S (.616) indicating that as O, G, B, R, and S improve the performance and outlook, basis of preparation and presentation will also increase. O (Organizational overview and external environment factor) indicating that such as the corporate culture and values, ownership, operating structure, and market position relates to IR; legal, political, macroeconomic, commercial, social, demographic, environmental factors reflect the recent evolution of IR; and technological factor is affecting to the IR increases, the performance and outlook, basis of preparation and presentation will increase. Similarly, the positive correlation between performance and outlook, basis of preparation and presentation and governance factor (G) indicate that as the leadership, board composition and diversity, decision-making, ethical influence on the use of capitals; the IR should be prepared a concise report using clear and plain language. The report should cover all the material issues. Also, the report should contain cross-reference to other documents; and The IR should describe the processes carried out to understand and satisfy OAG expectations concerned to the same direction with the performance and outlook, basis of preparation and presentation. The strongest relationship between performance and outlook, basis of preparation and presentation and independent variables is the business model factor (B) which are the description of how inputs are transformed into outputs and outcomes by means of the auditee’s activity; the report should depend on key of OAG; and the IR should also describe the procedures adopted to identify and prioritize the material issues and to select the relevant information indicate the most concerns of performance and outlook, basis of preparation and presentation.
The risks and opportunities factor (R) indicates that as the Identification of the events are affecting value creation over time; the IR can consequent risk assessment and risk response; and the report should releases a complete, reliable and impartial report, which should contain details concerning internal control on integrated reporting and external, independent assurance become the least important factor among independent variables. The strategy and resource allocation factor (S) indicates that such as the strategic analysis of the environment, also considering the results of OAG consultation; the IR should focus on the factors that influence the creation of value over time significantly; and the IR should describe the procedures adopted to identify and prioritize the material issues and to select the relevant resources increase, the performance and outlook, basis of preparation and presentation will also increase.
Table 4: Summarized Result of the Rotated Factor Analysis No. Factor Name and Items Mean S.D. Factor Loadings Eigenvalues
1 Organizational overview and external factor 4.103 .379 1.711
Corporate culture and values, ownership, operating structure, and market position relates to IR.
4.119 .550 .698
Legal, political, macroeconomic, commercial, social, demographic, environmental factors reflect the recent evolution of IR.
4.167 .490 .536
Technological factor is affecting to the IR. 4.024 .468 .520
2 Governance factor 4.065 .518 2.294
Leadership, board composition and diversity, decision-making, ethical influence on the use of capitals.
4.195 .601 .830
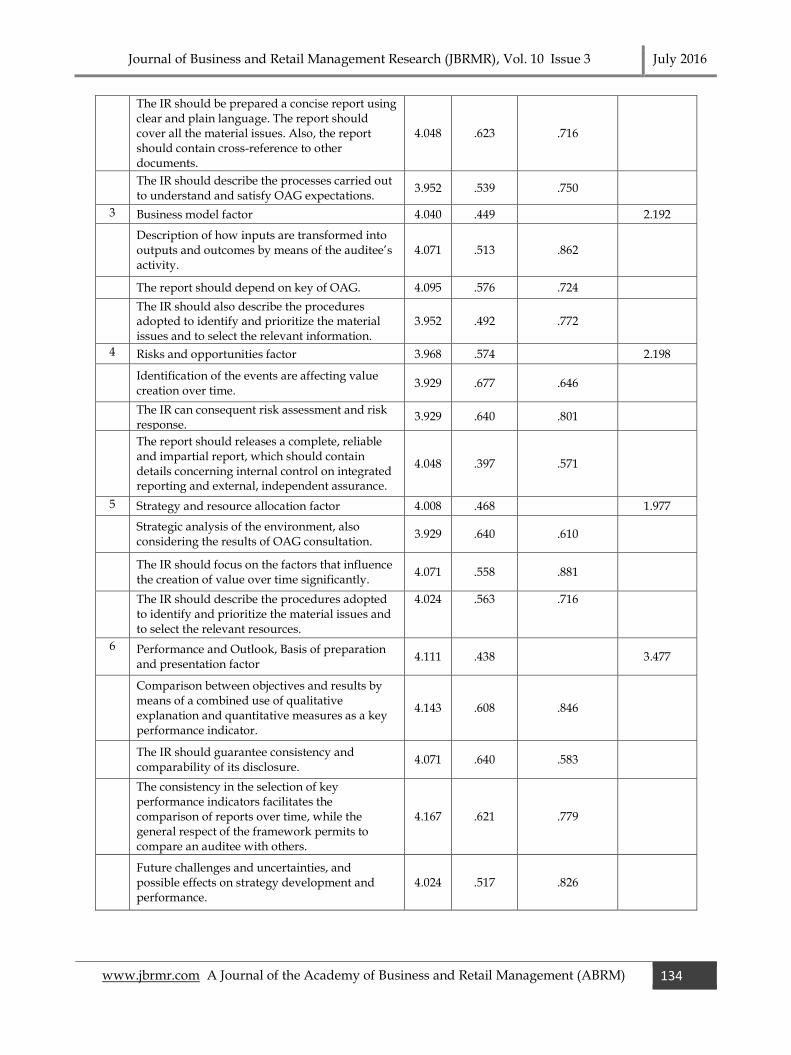
Journal of Business and Retail Management Research (JBRMR), Vol. 10 Issue 3 July 2016
www.jbrmr.com A Journal of the Academy of Business and Retail Management (ABRM) 134
The IR should be prepared a concise report using clear and plain language. The report should cover all the material issues. Also, the report should contain cross-reference to other documents.
4.048 .623 .716
The IR should describe the processes carried out to understand and satisfy OAG expectations.
3.952 .539 .750
3 Business model factor 4.040 .449 2.192
Description of how inputs are transformed into outputs and outcomes by means of the auditee’s activity.
4.071 .513 .862
The report should depend on key of OAG. 4.095 .576 .724
The IR should also describe the procedures adopted to identify and prioritize the material issues and to select the relevant information.
3.952 .492 .772
4 Risks and opportunities factor 3.968 .574 2.198
Identification of the events are affecting value creation over time.
3.929 .677 .646
The IR can consequent risk assessment and risk response.
3.929 .640 .801
The report should releases a complete, reliable and impartial report, which should contain details concerning internal control on integrated reporting and external, independent assurance.
4.048 .397 .571
5 Strategy and resource allocation factor 4.008 .468 1.977
Strategic analysis of the environment, also considering the results of OAG consultation.
3.929 .640 .610
The IR should focus on the factors that influence the creation of value over time significantly.
4.071 .558 .881
The IR should describe the procedures adopted to identify and prioritize the material issues and to select the relevant resources.
4.024 .563 .716
6 Performance and Outlook, Basis of preparation and presentation factor
4.111 .438 3.477
Comparison between objectives and results by means of a combined use of qualitative explanation and quantitative measures as a key performance indicator.
4.143 .608 .846
The IR should guarantee consistency and comparability of its disclosure.
4.071 .640 .583
The consistency in the selection of key performance indicators facilitates the comparison of reports over time, while the general respect of the framework permits to compare an auditee with others.
4.167 .621 .779
Future challenges and uncertainties, and possible effects on strategy development and performance.
4.024 .517 .826

Journal of Business and Retail Management Research (JBRMR), Vol. 10 Issue 3 July 2016
www.jbrmr.com A Journal of the Academy of Business and Retail Management (ABRM) 135
Materiality determination process; reporting boundary; summary of significant framework and methods applied to evaluate material matters.
4.048 .492 .656
Nice, neat, clean and clear. 4.214 .565 .756
As there were many variables, the factor analysis was employed to reduce the variables to a smaller number of facilitate data interpretation and maximize explanation of the whole variable set. The factor analysis results showed that the variables could be grouped in 6 components which provided more even distribution of variables making interpretation simply. The summarized important information contained in all 21 variables under 6 components. The 5 components (only independent variables) of which the highest to the least of Eigenvalues are governance factor (G), risks and opportunities factor (R),business model factor (B), strategy and resource allocation factor (S), and organizational overview and external environment factor (O), respectively.
The multi linear regression analysis was employed to analyze 5 independent variables with the dependent variable after the factor analysis. The regression showed the estimated results of the determinants of the performance and outlook, basis of preparation and presentation for the adoption of the IIRC framework. The adjusted R2 shows 48.20%. The Durbin-Watson test shows no presence of autocorrelation at the score of 1.790. The F-test failed to accept the null hypothesis that the estimated parameters are equal to zero. There are only 2 factors (6 variables) are positive and significant at the 5% level of significance. The governance factor (G) and business model factor (B) are significant and positively affected to the performance and outlook, basis of preparation and presentation.
The results also show that business model factor (B) is the most significant affect to the performance and outlook, basis of preparation and presentation for the adoption of IIRC framework. Holding other factors constant, a 1% increase in business model factor will increase the performance and outlook, basis of preparation and presentation for the adoption of IIRC framework by 0.53%. The governance factor (G) is also positive and statistically significant at the 5% level of significance. Holding other factors constant, a 1% increase in governance factor will increase the performance and outlook, basis of preparation and presentation for the adoption of IIRC framework by 0.34%. This suggests that the performance and outlook, basis of preparation and presentation for the adoption of IIRC framework depend on the honesty, cleared message and procedure, ethics, and relevant information. This evidence supports Hypotheses 2 and 3.
Table 5: The OAG Engagement and Integrated Reporting (IR) Evidence from the Adoption of the IIRC Framework
Independent Variables Coefficients
Constant 1.085*
Organizational overview and external (O) -.163
Governance (G) .344*
Business model (B) .529*
Risks and opportunities (R) -.007
Strategy and resource allocation (S) .046
No. of respondents 42
R2 .546
R2Adjusted .482
F-Statistic 8.435
Durbin-Watson 1.790
Journal of Business and Retail Management Research (JBRMR), Vol. 10 Issue 3 July 2016
www.jbrmr.com A Journal of the Academy of Business and Retail Management (ABRM) 136
* represents statistical significance at 5% level The governance factor is positive and statistically significant at the 5% level of
significance. The great of leadership, board composition and diversity, decision-making, ethical influence on the use of capitals, the performance and outlook, basis of preparation and presentation for the adoption of IIRC framework will be positively associated of better. Hypothesis 2 (H2) is thus supported.
The business model factor proves that the report should follow the key of OAG. It is important to describe the procedures clearly by adopted to identify and prioritize the material issues and to select the relevant information. The description of how inputs are transformed into outputs and outcomes by means of the auditee’s activity also important. Thus, the Hypothesis 3 (H3) is supported.
5. Conclusion The OAG engagement and integrated reporting evidence from the adoption of the IIRC
framework highly regarded for governance and business model factors for any report take place. Therefore, it is must to improve the quality of integrated report and trustworthy. The leader with high ethics of using the organization’s capitals with the report clarity should further develop or upgrade the integrated reports on top priority basis. Besides the accuracy for inputs transformation of auditee’s activities following the OAG rules would improves the reliability of the integrated reports.
To improve the research hypotheses and results, the suggestion for further researches should provide insight regarding the factors that are considered important for the integrated report. Based on the results of this research, further research could be undertaken in understanding the factors in-depth and propose appropriate measures. The connectivity of information, stakeholder relationships, materiality, conciseness, reliability and completeness, and consistency and comparability should be discussed. The different statistical method such as cluster analysis or different technique such as Lisrel will be employed to analyze data which was not apply to this research. It would also be useful to investigate the OAG engagement and integrating reporting from the adoption of the IIRC framework. Considering various report frameworks would help stakeholders, auditors, and auditees to understand the nature of the organization better, as they would be able to measure the level of resources and apply to the better instrument for decision making. Finally, the result would then be much more useful and satisfying.
6. References Aaker, D. A., Kumar, V., & Day, G. (2001). Marketing Research. 7thed. John Wiley and Sons: New York,
USA. Coca Cola. (1996). The Coca-Cola Company and Subsidiaries Annual Report. Atlanta, USA. __________. (2013).The Coca-Cola Company and Subsidiaries Annual Report. Atlanta, USA. Eccles, R.G. &Krzus, M.P. (2010). “One Report: Integrated Reporting for Sustainable Strategy”. Integrated
Reporting Monthly Report October to December 2010, (4): 1-6. Freeman, R.E., Martin, K.E., & Parmar, B.L. (2007).“Stakeholder Capitalism”. Journal of Business Ethics,
74(4): 303-314. Henriques, A. & Richardson, L. (2004).The Triple Bottom Line. Earthscan, London, UK. Jensen, M.C. & Meckling, W. (1976).“Theory of the Firm: Management Behavior, Agency Costs and Ownership
Structure”. Journal of Financial Economics, 3(4): 305-360. Salvioni, D.M. & Bosetti, L. (2014). “Stakeholder Engagement and Integrated Reporting: Evidence from the
Adoption of the IIRC Framework”. Journal of Strategic and International Studies, 9(3): 78-89.

Journal of Business and Retail Management Research (JBRMR), Vol. 10 Issue 3 July 2016
www.jbrmr.com A Journal of the Academy of Business and Retail Management (ABRM) 137
Steurer, R., Langer, M., Konrad, A., & Martinuzzi, R.A. (2005).“Corporations, Stakeholders and Sustainable Development: A Theoretical Exploration of Business-Society Relations”. Journal of Business Ethics, 61(3): 263-281.

Journal of Business and Retail Management Research (JBRMR), Vol. 10 Issue 3 July 2016
www.jbrmr.com A Journal of the Academy of Business and Retail Management (ABRM) 138
Does goods and services tax stimulate economic growth? International evidence
Taufik Abd Hakim Abdul Aziz Karia Imbarine Bujang
Faculty of Business Management Universiti Teknologi MARA (UiTM), Sabah, Malaysia
Keywords Goods and services tax, economic growth, Arrelano-Bond dynamic panel GMM estimation
Abstract This paper examines the impact of goods and services tax (GST) on economic growth in
developing and developed countries using the Arellano-Bond dynamic panel GMM estimation. The empirical results reveal that GST is negatively correlated with economic growth in developing countries, while statistically significant and positively correlated with economic growth in developed countries. Therefore, we conclude that the implementation of the current flat rate of GST is least efficient in collecting the higher revenue and stimulate growth in developing countries. Hence, the implementation of the current GST should be revised to generate higher revenue and economic growth without burdening the consumption and real per capita income in developing countries.
1. Introduction GST or Value Added Tax (VAT) was introduced in 1950s which firstly adopted in France
and followed by more than 160 countries around the world. This kind of tax is an indirect tax and can be considered as one of the regressive tax in the countries that implemented flat-rate of GST for all productions. A study conducted by Palil and Ibrahim (2011) summarized the standard rates of GST in several high income or developed countries range from 5% (Singapore) to 42.58% (Argentina). According to statistical report provided by Royal Malaysian Customs Department (2015), the average rate of GST in developing and developed countries is 12% and 21% respectively.
The first study that investigates the relationship between tax structure and economic indicators has conducted by Gober and Burns (1997) mentioned that any changes in each type of taxes may lead to different impact on a country’s economy. Moreover, a study done by Gold (1991) concluded that an economic growth of a country is relies on the changes on each of tax structure. These studies proved that, any single component of tax structure like GST will lead to give the different impact on economic growth for each country. It is important for a country to predict and find the optimum rate of each tax structure before the implementation of any kind of tax especially GST to make sure it will not burden the consumption as well as economic growth. Palil and Ibrahim (2011) who investigated the impacts of GST on middle income earners mentioned the flow of GST in Australia which found that GST had a significant impact on inflation only in the quarter to September 2000 (the implementation of GST at 10% in July 2000) as resulted an average increase of 2.6% on inflation rate. The domestic consumption of Australia has dramatically increased in the months leading to GST implementation and economic growth declined during the first quarter of 2001.
A study of the impact of the GST on international trade has conducted by Desai and Hines (2005) found that openness and export performance are significantly and negatively related on the presence of GST. Moreover, according to Palil and Ibrahim (2011), the implementation of GST has some potential weaknesses and actually can contribute to the

Journal of Business and Retail Management Research (JBRMR), Vol. 10 Issue 3 July 2016
www.jbrmr.com A Journal of the Academy of Business and Retail Management (ABRM) 139
negative impact on the level of efficiency in developing countries. Furthermore, Keen and Smith (2006) proved that GST can be exposed with the carousel fraud, which relates with the case in United Kingdom that exploits arrangements for the taxation of intra-community trade (amounted 1.5% - 2.5% of net revenue) within the European Union. Consumption tax is believed can increase the level of inefficiency of informal production which contribute for the reducing of welfare (Piggott and Whalley, 2001) while in the presence of an informal sector, GST might cannot compete with the efficiency of tariffs (Emran and Stiglitz, 2005).
Using the dynamic panel data analysis and divided the countries into five groups of countries (low, lower middle, upper middle, high income and OECD countries), Hakim et al. (2013) argued that there is a mixed results between GST on economic growth in all groups of countries. They concluded that GST have significant and negatively correlated with the movement of economic growth in low, lower middle and upper middle income (developing) countries. Conversely, they find an evidence of strong positive correlation between GST and economic growth in high income and OECD countries. Furthermore, a study by Bolton and Dollery (2004) concluded that the GST was highly successful in generating the tax revenue and economic growth in developed countries such as Australia, Canada and New Zealand.
A recent study by Nantob (2014) who implemented the dynamic panel data GMM estimator revealed that tax structure including GST had negative impact on the level of economic growth in developing countries. On the other hand, McNabb and LeMay-Boucher (2014) who adopted the Common Correlated Effects Mean Group (CMG) estimator found that an increase in trade or consumption taxes followed by reductions in personal income taxes can stimulate growth in developing and developed countries. Moreover, Miki (2011) studied the effect of VAT on aggregate consumption and economic growth in 14 developed nations showed that an increase in VAT lead to generate the economic growth. Arnold et al. (2011) investigated further the impact of taxation on economic growth suggest that consumption taxes can be considered the least harmful to growth compared with the personal income taxes (PIT) and corporate income taxes (CIT). They conclude that higher GST does not necessary discourage investment and saving, while higher PIT and CIT are believed discourage investment and reduce the incentive to save as well as economic growth.
The effect of GST is actually influenced by the level of income, in which higher income earners will bear lower proportion of their income to pay GST compared with the lower income earners. Thus, this situation arise an important issue as the government intends to implement GST. Such as (1) Can GST stimulate economic growth without burdening the consumption of lower and middle income earners? (2) Does the flat-rate of GST is an efficient way in stimulating revenue and economic growth for developing and developed countries?
The objective of this study to examines the mixed effects of GST on economic growth in developing and developed countries. In this study, we use a panel data set comprising annual data from 47 developing countries and 23 developed countries over the period 2005-2012. In order to generate efficient and unbiased results, this study employs the Arellano-Bond dynamic panel GMM estimation in the model regression.
The paper is organized as follow. The next section presents our empirical strategy and explanation of the Arellano-Bond dynamic panel data estimation. Section 3 describes the measurement of the data employed in the analysis, while the discussion of the result in developing and developed countries is reported in section 4. Finally section 5 focused on conclusion.

Journal of Business and Retail Management Research (JBRMR), Vol. 10 Issue 3 July 2016
www.jbrmr.com A Journal of the Academy of Business and Retail Management (ABRM) 140
2. Materials and Methods 2.1 Empirical model
Our empirical specification is aimed at investigating the impact of taxes on goods and services (GST) on economic growth in developing and developed countries. In this study, we follow the studies conducted by Nantob (2014) and Miki (2011) which relates several important tax structure especially GST, several of control variables (economic indicators) and economic growth. Thus, this study specifies the dynamic linear equation model to estimate the effect of GST as follows:
1 1 2 3 4 5it it it it it it itGDPPC GDPPC POP INF INVEST GOV TRADE
6 7 8it it it itPIT INTERT GST (1)
Where GDPPC is gross domestic product (GDP) per capita growth, three important tax
structure which are PIT (taxes on income, profits and capital gains/revenue), INTERT (taxes
on international trade/revenue) and GST (taxes on goods and services/revenue). The other
variables also included as control variables namely population growth POP , inflation INF ,
foreign direct investment/GDP INVEST , government expenditure/GDP GOV and trade
openness/GDP TRADE . is an error term which contain of country and time specific fixed
effects:
it i t itu (2)
Where the are assumed to be independent and identically distributed with zero mean
and variance equal to .
2.2 The Arellano-Bond Dynamic Panel Data Estimation In this study, we employ the Arellano-Bond Dynamic GMM estimation which
introduced by Arellano and Bond (1991) to provide unbiased and efficient results. Moreover, Mileva (2007) expresses that the GMM is designed for micro panel data which consists large sample size (N) but small period of time (T). According to Arellano and Bond (1991), there have several econometrics problems (heteroscedasticity, autocorrelation and endogeneity) arise in the static panel data models namely Random Effects and Fixed Effects estimators. These models are assumed tend to be bias and not efficient due to the presence of econometrics problems. In this case, the dynamic GMM estimation eliminates simultaneity bias by using the lagged level of independent variables (regressors) as instruments in the model regression. Baum et al. (2003) conducted a study of Instrumental Variables (IV) and GMM estimation pondered whether to adopt the GMM or not based on the presence of heteroscedasticity and endogeneity in the model regression. If the model regression suffer from heteroscedasticity and endogeneity, the GMM estimation is more efficient than IV. Furthermore, the GMM estimator has ensured all regressors are stationary by differencing the regressors (Baltagi et al., 2009).
The properties of GMM estimation can be specified into three categories which are under identified, just-identified and over identified. Under identified occur when the number of moments (q) is less than the number of unknown parameter (p), while just-identified have q = p. In order to implement the GMM estimator, the model regression must have q > p which can be considered as over identified. Thus, to test for the over identifying restrictions, we employ the Sargan test that proposed by Sargan (1958). Therefore, the null hypothesis of over identifying restrictions are valid cannot be rejected in all cases. In order to measure the validity of instruments in the model regression, we conduct the test for first order and second order autocorrelation. The null hypothesis of the absence of first order autocorrelation can be rejected

Journal of Business and Retail Management Research (JBRMR), Vol. 10 Issue 3 July 2016
www.jbrmr.com A Journal of the Academy of Business and Retail Management (ABRM) 141
but not for the second order autocorrelation. If the model reject the null hypothesis of the second order autocorrelation, the instruments variables must be modified or reconstruct the model is necessary (Arellano and Bond, 1991).
2.3 Measurement of Data To estimate the model, this study utilizes three data sets which consist of 43 developing
countries, 23 developed countries and dataset that includes both developing and developed countries, totalling 70 countries over the period 2005 – 2012 (8 years). All the data are gathered from World Bank Development Indicators (WBDI). Our model of choice is based on the works of Nantob (2014) and Miki (2011). The annual percentage growth rate of gross domestic product (GDP) per capita is selected as dependent variable to measure the economic growth in both developing and developed countries. The explanatory variables of model regression include the several important tax structure and the control variables. Three important tax structures include in this study are taxes on goods and services (GST), taxes on income, profit and capital gains (PIT) and taxes on international trade (INTERT). All these taxes employed in the analysis are proxied by total amount of taxes over revenue collected.
We selected the economic indicators as the control variables namely the annual population growth rate (POP) and inflation rates (INF) as measured by the consumer price index annual percentage change. Theoretically, the higher inflation rates may lead to discourage the purchasing power and consumption as well as economic growth. Elder (2004) revealed that real economic activity tend to has negative correlation with the inflation. On the other hand, Dotsey and Sarte (2000) concluded that higher inflation may generate investment caused by people tend to use their money for saving and investment during the real value of money are decreasing. In the case of population growth, the higher population in a country (ceteris paribus) may lead to reduce the GDP per capita.
GOV is the government expenditure variable that is proxied by the general government final consumption expenditure over GDP. The literature has witnessed that government expenditure also effect the economic growth. Avila and Strauch (2008) and Bergh and Karlsson (2010) revealed that government expenditure led to slowdown the economic growth. An early study conducted by Gwartney et al. (1998) who investigated the relationship between government expenditure on growth in OECD countries argued that there is a significant inverse relationship between government expenditure and the level of investment as well as real GDP growth. Moreover, Dackehag and Hansson (2012) investigated the effect of corporate income tax and personal income tax find a negative effect of government expenditure on economic growth in 25 high-income OECD countries. Thus, this study expects to find a negative correlation of government expenditure and economic growth especially in developed countries.
The other control variables are foreign direct investment (INVEST) is proxied by the net inflows of investment from foreign investors over GDP and lastly trade openness (TRADE) is proxied by the sum of exports and imports of goods and services measured as a share of GDP. The relationship between investment and economic growth is assumed to be positive, in which the higher investment is expected to boost the economic growth in a country. An early study conducted by Lucas (1988) proved that one of the important factors of economic growth is capital accumulation that can be related to investment. The evidence of positive relationship among these variables are supported by De Long and summers (1991), Mankiw et al. (1992), Oju and Oshikoya (1995) and Ghura and Hadjimichael (1996). Unlike the past studies, Carkovic and Levince (2003) who adopted the GMM panel estimator did not support the positive relationship between investment and economic growth. They found that both foreign direct investment and portfolio inflows did not have a positive relationship with economic growth. Thus, we expect to

Journal of Business and Retail Management Research (JBRMR), Vol. 10 Issue 3 July 2016
www.jbrmr.com A Journal of the Academy of Business and Retail Management (ABRM) 142
find the mix results of investment and economic growth among different group of countries. For the case of trade openness, we assume that it will generate the economic growth based on studies that investigated the relationship between trade openness and economic growth (Sach and Warner, 1995; Frankel and Romer, 1999; Irwin and Tervio; 2002; Noguer and Siscart, 2005; Andersen and Babula; 2008).
The data sets are summarized in Tables 1a and 1b. For instance, the average value of GDP per capita growth rate is 3.20 percent per annum, with the standard deviation of 3.98 in developing countries, while the GDP per capita growth and standard deviation in developed countries are 1.57 percent per annum and 4.16. For developing countries, the maximum growth rate (18.49) was reported in Angola, while the lowest growth rate (-14.42) was suffered by Ukraine. Among three different types of taxes, goods and services tax (GST) can be considered as the highest contributor which the mean value reported between 29 to 33 percent of revenue in both developing and developed countries. The highest percentage of GST in developing countries was collected by Guatemala (58.54), while GST in Uruguay (developed countries) was contributed more than 50 percent of its revenue. Trade openness has contributed more than 80 percent of GDP for both developing and developed countries. However, the percentage of international trade tax was stated different among these groups of countries, where 14.48 percent of revenue in developing countries compared with only 4.87 percent of revenue in developed countries. It shows that revenue in developing countries is also depend on the import and exports duties.
Table 1a: Summary statistics of tax structure and economic indicators in 47 developing countries (2005 -2012 Observation = 376).
Variable Unit of Measurement Mean Standard Deviation
Minimum Maximum
GDP per capita growth
Annual percentage growth rate of GDP per capita based on constant 2005 U.S. dollars.
3.20 3.98 -14.42 18.49
Population growth Annual population growth rate.
1.48 1.14 -2.63 4.18
Inflation Inflation as measured by the consumer price index (annual percentage change).
7.61 6.95 -2.40 59.22
Foreign direct investment
% of GDP 5.94 7.57 -5.98 84.95
Government expenditure
% of GDP 14.61 5.09 3.46 39.45
Trade openness % of GDP 87.06 38.33 22.14 225.02 Taxes on income, profits and capital gains
% of revenue 23.16 11.71 0.87 75.24
Taxes on international trade
% of revenue 14.48 12.88 0.11 59.77
Taxes on goods and services
% of revenue 32.85 11.80 1.14 58.54
Source: World Development Indicators, World Bank.
Table 1b: Summary statistics of tax structure and economic indicators in 23 developed countries (2005 -2012 Observation = 184).
Variable Unit of Measurement Mean Standard Deviation
Minimum Maximum
GDP per capita growth
Annual percentage growth rate of GDP per capita based
1.57 4.16 -13.00 12.65

Journal of Business and Retail Management Research (JBRMR), Vol. 10 Issue 3 July 2016
www.jbrmr.com A Journal of the Academy of Business and Retail Management (ABRM) 143
on constant 2005 U.S. dollars. Population growth
Annual population growth rate.
0.48 0.69 -2.08 2.53
Inflation Inflation as measured by the consumer price index (annual percentage change).
3.27 2.79 -135 15.40
Foreign direct investment
% of GDP 4.54 5.52 -5.65 31.61
Government expenditure
% of GDP 18.48 3.09 10.18 24.89
Trade openness % of GDP 80.86 33.76 24.77 179.90 Taxes on income, profits and capital gains
% of revenue 25.67 16.41 1.38 66.48
Taxes on international trade
% of revenue 4.87 10.18 -0.03 47.91
Taxes on goods and services
% of revenue 28.55 10.17 2.45 50.19
Source: World Development Indicators, World Bank.
Table 2a: Correlations matrix for developing countries GDPPC POP INF INVEST GOV TRADE PIT INTERT GST
GDPPC 1.0000 POP -0.0612 1.0000 INF 0.1069 0.0984 1.0000 INVEST 0.0586 -0.0467 0.0925 1.0000 GOV -0.0013 -0.1978 -0.0201 0.1994 1.0000 TRADE 0.0731 -0.2350 0.0434 0.3165 0.3457 1.0000 PIT -0.0505 0.1576 -0.1333 -0.1566 -0.0344 -0.0134 1.0000 INTERT -0.0895 0.2247 0.0130 0.2393 -0.1672 -0.0229 -0.1262 1.0000 GST -0.0334 -0.2942 -0.1754 -0.1673 0.0094 -0.0146 -0.1713 -0.4853 1.0000
Notes: GDPPC = GDP per capita growth; POP = population growth; INF = inflation; INVEST = Foreign direct investment; GOV = government expenditure; TRADE = trade openness; PIT = taxes on income, profits and capital gains; INTERT = international trade tax; GST = goods and services tax. N = 47. List of countries; Angola, Armenia, Bangladesh, Belarus, Benin, Brazil, Bulgaria, Burkina Faso, Cambodia, Cote d’Ivoire, Dominica, Egypt Arab Rep, Ethiopia, Georgia, Ghana, Grenada, Guatemala, Honduras, India, Jamaica, Jordan, Kenya, Liberia, Madagascar, Malaysia, Mali, Macedonia, Moldova, Morocco, Namibia, Nepal, Nicaragua, Pakistan, Paraguay, Peru, Philippines, Sao Tome and Principe, Seychelles, South Africa, Sri Lanka, St. Lucia, St. Vincent and the Grenadines, Thailand, Togo, Tunisia, Uganda, Ukraine.
Table2b: Correlations matrix for developed countries GDPPC POP INF INVEST GOV TRADE PIT INTERT GST
GDPPC 1.0000 POP -0.1044 1.0000 INF 0.2414 -0.1375 1.0000 INVEST 0.2489 0.2968 0.0733 1.0000 GOV -0.3184 -0.0857 -0.0402 -0.1769 1.0000 TRADE 0.1597 -0.1519 -0.0134 0.2097 -0.0768 1.0000 PIT -0.1211 0.5227 -0.2689 -0.1993 0.0217 -0.5448 1.0000 INTERT 0.0490 0.2050 0.2538 0.5769 -0.1904 0.0443 -0.2678 1.0000 GST 0.1189 -0.3778 0.1721 -0.0105 0.0135 0.3163 -0.5209 -0.1367 1.0000
Notes: GDPPC = GDP per capita growth; POP = population growth; INF = inflation; INVEST = Foreign direct investment; GOV = government expenditure; TRADE = trade openness; PIT =

Journal of Business and Retail Management Research (JBRMR), Vol. 10 Issue 3 July 2016
www.jbrmr.com A Journal of the Academy of Business and Retail Management (ABRM) 144
taxes on income, profits and capital gains; INTERT = international trade tax; GST = goods and services tax. N = 23. List of countries; Antigua and Barbuda, Australia, Austria, Canada, Czech Rep, France, Greece, Iceland, Japan, Korea Rep, Latvia, New Zealand, Norway, Poland, Portugal, Russian Fed, Slovak Rep, Slovenia, St. Kitts and Nevis, Switzerland, United States, Uruguay.
Tables 2a and 2b present the correlation among the variables in developing and developed countries. As shown in both tables, the correlations between taxes on income, profits and capital gains are negatively correlated with GDP per capita growth, inflation, investment and trade openness in both developing and developed countries. However, there have an inconsistent results regarding the correlations between taxes on goods and services, taxes on international trade and GDP per capita growth in both groups of countries. For example, the goods and services tax is negatively correlated with all variables except the government expenditure in developing countries, while in developed countries, GST is positively correlated with GDP per capita growth, inflation, government expenditure as well as trade openness. Thus, this study adopts the dynamic panel GMM estimator to support the findings of the correlation matrix.
3. Results and Discussion This study estimates the effects of GST on economic growth in developing and
developed countries by including the other economic indicators as regressors. We adopt the Arellano-Bond dynamic panel data analysis in Equation (1) to control the statistical problems (endogeneity, heteroscedasticity, autocorrelation and country-specific effects) and potential biases that usually occur in the panel data analysis. The main results of this study are presented in Table 3 which consists of developing countries, developed countries and combination of developing and developed countries data set. In all models, the results of Sargan test fails to reject the null hypothesis of the over identifying restrictions are valid. Moreover, the Arellano-Bond test fails to reject the null hypothesis of no second order autocorrelation in the differenced residuals AR (2). Thus, the Sargan and Arellano-Bond tests have confirmed that all instruments uses in the models are valid and support no model misspecification.
Table 3: Results of the Arellano-Bond dynamic panel data estimations. Dependent variable: GDP per capita growth (2005-2012) Developing Countries Developed
countries Developing and Developed countries
Lagged GDPPC -0.1583* (0.0878)
-0.1946 (0.1593)
-0.0660 (0.0714)
POP 0.1645 (0.3434)
-0.2044 (0.1769)
-0.0905 (0.2124)
INF -0.0652 (0.0854)
-0.0634 (0.2611)
-0.1323* (0.0751)
INVEST -0.0145 (0.0535)
0.5505*** (0.1759)
0.0805 (0.1072)
GOV 0.5958 (0.4641)
-11.0777** (4.9225)
0.0032 (0.5251)
TRADE 1.289** (0.5241)
-0.8226 2.2228
1.2897** (0.5041)
PIT -0.8402** (0.4215)
3.3088** (1.4327)
-0.6661* 0.3607
INTERT 0.6020* (0.3298)
-0.1067 (0.1450)
0.1335 (0.1091)
GST -0.3155 (0.3607)
1.2993* (0.7684)
-0.0743 (0.4393)

Journal of Business and Retail Management Research (JBRMR), Vol. 10 Issue 3 July 2016
www.jbrmr.com A Journal of the Academy of Business and Retail Management (ABRM) 145
Constant -3.2801 (2.7085)
20.2937*** (7.0306)
-2.1452 (1.8036)
Mean VIF Test 1.22 1.81 1.32 Sargan Test (p-value) 0.2116 0.1812 0.2647 2nd order Autocorrelation (p-value) 0.4943 0.3211 0.3265 Number of Time Periods (T) 8 8 8 Number of Countries (N) 47 23 70 Number of Observations 376 184 560
Notes: All regressions are estimated using the Arellano-Bond dynamic panel data estimations. Values in the parentheses are standard errors. ***, **, * indicate statistical significance at the 1%, 5% and 10% levels, respectively.
Empirical results reveal that all these taxes are statistically significant and affect differently on economic growth in developing and developed countries. Taxes on income, profits and capital gains are found significantly negatively correlated with economic growth in developing countries and combination of developing and developed countries. The result is consistent with the finding by Nantob (2014) who investigated the impact of taxes on economic growth in developing countries. An increase 1 percent point of taxes on income, profits and capital gains will leads to reduce 0.8 percent on growth in developing countries. Surprisingly, we find that taxes on income, profit and capital gains are significant at 5 percent significance level and positively correlated with the economic growth in developed countries. The different findings among developing and developed countries may be due to the different optimum level of taxes. According to the theory of Laffer curve by Laffer (2004), if the tax rates are still under optimum, an increase in taxes will lead to generate more revenue which a country can utilize higher revenue to improve productivity, employment and income as well as growth. However, if the tax rates are over optimum, an increase in taxes may discourage employment, reduce income and productivity in a country. Thus, this study assumes that the higher taxes on income, profits and capital gains in developed countries are still under optimum which not burdening the employees and the governments have utilized the higher revenue by increasing the personal income to encourage productivity. As a result, higher productivity has boosted economic growth in developed countries.
As expected, we find the mixed results of the impact of GST on growth in developing and developed countries. The coefficient of GST is statistically significant at the 10 percent level and positively correlated with GDP per capita growth in developed countries, while not significant even at 10 percent level and negatively correlated in developing countries. The negative (positive) effect of GST on growth was not influenced by the higher (lower) GST tax rates implemented by developing (developed) countries. A statistical report provided by Royal Malaysian Customs Department (2015) revealed that the average GST rate in developing countries was 12% which is lower than developed countries (21%). Moreover, Miki (2011) studied the effect of value added tax (VAT/GST) rate on consumption and economic growth found that change of VAT rate was significant and positively correlated with both consumption and GDP per capita growth in developed countries. In this case, GST can be considered as least effective and inefficient in developing countries compared with developed countries.
Even the rate of GST in developing countries is lower than developed countries, it still burdens the personal income, purchasing power and consumption for lower and middle income earners. However, the higher GST rate implemented in developed countries were not burdened the purchasing power, personal income and consumption for high income earners. This proven with the positive sign generated from the results of the Arellano-Bond dynamic panel data estimation and correlation matrix. With the higher revenue generated from GST, the
Journal of Business and Retail Management Research (JBRMR), Vol. 10 Issue 3 July 2016
www.jbrmr.com A Journal of the Academy of Business and Retail Management (ABRM) 146
government in developed countries were utilized it properly to boost productivity, economic growth and reduce national’s debt successfully as mentioned by Bolton and Dollery (2004). Moreover, the presence of informal economy also has contributed to the inefficiency of GST especially in developing countries (Emran and Stiglitz, 2005). A summary report conducted by Gerxhani (2004) showed that the average share of informal economy was 35% of GDP in developing countries compared with only 14.5% of GDP in developed countries. Thus, we assume that the higher share of informal economy but not contribute to the collection of GST may lead to inefficiency in collecting the revenue especially revenue collected from GST in developing countries.
4. Conclusion This study examines the effects of goods and services tax (GST) on economic growth
among developing and developed countries. The main objective of this study is to investigate the mixed effects of GST on growth in these two groups of countries. The empirical results adopting the dynamic panel Arellano-Bond GMM estimation suggest that GST has burdened economic growth in developing countries, while significant and positively correlated with economic growth in developed countries. Our results suggest that the current flat rate of GST is least efficient in collecting the higher revenue, stimulate growth and reduce government debt due to the presence of many informal economies in developing countries. We also conclude that, the GST in developing countries has burdened the per capita income growth for lower and middle income earners, which automatically lower down the purchasing power as well as consumption even the average rate of GST by which is lower than developed countries.
In addition, for the practical implications, we suggest that the flat rate of GST is not appropriate solution to generate growth and reduce national’s debt without burdening the personal income and consumption in developing countries. Specifically, the developing countries may implement the different rates of GST on the different productions. For example, a country may implement higher rate of GST for the productions of liquor and expensive goods and services, while lower rate for necessity goods. It may generate greater amount of GST without burdening the consumption for low and middle income earners in developing countries. Moreover, in order to boost consumption as well as aggregate expenditure, a country may reduce the rate of personal income tax (progressive tax) for middle income earners so it can generate higher purchasing power, real personal income and consumption as well as economic growth in developing countries.
References Andersen, L. and R. Babula, 2008. The link between openness and long-run economic growth. Journal of
International Commerce and Economics, 2: 31-50. Arnold, J. B. Brys, C. Heady, A. Johansson, C. Schwellnus and L. Vartia, 2011. Tax policy for economic
recovery and growth. The Economic Journal, 121: 59-80. Bolton, T. and B. Dollery, 2004. Effects of the GST in Australia, Canada and New Zealand. University of
New England School of Economics, Working Paper Series in Economics, 17. Carkovic, M. and R. Levine, 2003. Does Foreign Direct Investment Accelerate Economic Growth?
University of Minnesota, Working Paper. Desai, M.A. and J.R. Hines, 2005. Value added taxes and international trade: the evidence. Mimeo,
Michigan: University of Michigan. Dotsey, M. and P.D. Sarte, 2000. Inflation uncertainty and growth in a cash-in-advance economy. Journal
of Monetary Economics, 45: 631-655. Douglas A.I. and M. Tervio, 2002. Does trade raise income? evidence from the twentieth century. Journal
of International Economics, 58: 1-18.

Journal of Business and Retail Management Research (JBRMR), Vol. 10 Issue 3 July 2016
www.jbrmr.com A Journal of the Academy of Business and Retail Management (ABRM) 147
Elder, J., 2004. Perspective on the Effects of Inflation Uncertainty. Journal of Money, Credit and Banking, 36: 911 – 928.
Emran, S.M. and J.E. Stiglitz, 2005. On selective indirect tax reform in developing countries. ournal of Public Economics, 89: 599–623.
Gerxhani, K., 2004. The informal sector in developed and less developed countries: a literature survey. Public Choice, 120: 267-300.
Gober J.R., and J.O. Burns, 1997. The relationship between tax structures and economic indicators. Journal of International Accounting, Auditing and Taxation, 6: 1-24.
Gwartney, J., R. Lawson and R. Holcombe, 1998. The size and functions of government and economic growth. Joint Economic Committee.
Hakim, T. A., I. Bujang and I. Ahmad, 2013. Do taxes generate more on economic development? Evidence from income’s group and OECD countries. International Journal of Business and Economic Development, 1: 1-12.
Jeffrey, A.F. and D. Romer, 1999. Does trade cause growth? American Economic Review, 89: 379 - 399. Keen, M. and S. Smith, 2006. What do we know about VAT evasion? National Tax Journal, 59: 905–928. Laffer, A., 2004. The laffer curve: past, present and future. The Heritage Foundation. Lucas, R., 1988. On the mechanics of economic development. Journal of Monetary Economics, 22: 3-42. McNabb, K. and P. LeMay-Boucher, 2014. Tax structures, economic growth and development. ICTD
Working Paper, 22. Miki, B., 2011. The effect of the VAT rate change on aggregate consumption and economic growth. CJEB
Working Paper. Nantob, N., 2014. Taxes and Economic Growth in developing countries: a dynamic panel approach.
Munich Personal RePEc Archive, 61346. Noguer, M. and M. Siscart, 2005. Trade raises income: a precise and robust result. Journal of International
Economics, 65: 447-460. Palil, M.R. and M.A. Ibrahim, 2011. The impacts of goods and services tax (GST) on middle income
earners in Malaysia. World Review of Business Reasearch, 1: 192-206. Piggott, J. and J. Whalley, 2001. VAT base broadening, self supply, and the informal sector. American
Economic Review, 91: 1084–1094. RMCD., 2015. Countries implementing GST or VAT.
http://gst.customs.gov.my/en/gst/Pages/gst_ci.aspx. S.D., G., 1991. Changes in state government finances in the 1980s. National Tax Journal, 44: 1-19. Sachs, J. D. and A. Warner, 1995. Economic reform and the process of global integration. Brookings Papers
on Economic Activity, 25th Anniversary Issue.

Journal of Business and Retail Management Research (JBRMR), Vol. 10 Issue 3 July 2016
www.jbrmr.com A Journal of the Academy of Business and Retail Management (ABRM) 148
A study of factors influencing customers’ purchasing behaviours of gold ornaments
Navarwan Chaisuriyathavikun Prattana Punnakitikashem
College of Management, Mahidol University, Thailand
Keywords Decision making, luxury product, purchasing intention, consumer behaviour, gold ornament
Abstract Since late 2013, the demand for gold ornaments in Thailand has been increasing after the global
economic crisis had less impact on gold prices. The purpose of this study was to investigate factors influencing customers’ purchasing intention of gold ornaments. Data collected from 370 respondents in Bangkok and vicinity areas was analyzed by factor analysis and multiple regression. The results revealed that there are two major factors that are significantly related with customers’ intention to purchase gold ornaments; these factors are buyer preference and expected future value. These results can help gold retailers to develop appropriate marketing strategies and enhance business success in changing environments.
1. Introduction Gold bullion has been considered a safe haven for investment to protect the economy and
make profits. However, starting in late 2013, the demand for gold ornaments began increasing because decreasing gold prices shifted the demand for gold ornaments in Thailand’s market. After the global economic crisis had less impact on the price of gold, the demand for gold ornament fabrication increased. Figure 1 shows the purchase of gold in Thailand’s domestic market increasing from 14.3 tons to 20.9 tons in late 2013 (Reuters, survey 2014).
Figure 1: Thai Jewelry Fabrication (Reuters, survey 2014)
In Thailand’s domestic market, there are more than 6,000 gold ornament retail stores (Gold Trader Association Thailand, 2014).It would be beneficial for these retail stores to understand the market conditions and customers’ behavior and purchase intention for gold ornaments. This is particularly important because gold ornaments area luxury product; and the

Journal of Business and Retail Management Research (JBRMR), Vol. 10 Issue 3 July 2016
www.jbrmr.com A Journal of the Academy of Business and Retail Management (ABRM) 149
purchase of “luxury” products involves a strong element of human involvement. Limited supply and value recognition are key components in luxury product purchasing (Cornell 2002, p.47).
In Thailand’s domestic market people purchase gold ornaments at 23.16 carat which equals to 96.5% gold purity (Gold Trader Association Thailand, 2014). Whereas, American and European markets use between 9 and 18 carat (World Gold Council, 2014) as their common standard of gold jewelry fineness. This higher percentage of gold makes the gold ornament in Thailand a luxury good. Gold ornaments include necklaces, bracelets, earrings, etc. which are designed for men, women, and children and used for many purposes (Jain, 2013).
This study uses quantitative research methodologies including a questionnaire of consumers. The purpose of this study was to investigate hidden factors influencing customers’ purchasing intention of gold ornaments. In this study, respondents are selected based on age over 25 years old. Previous research (Research Thailand,2009, Fiscal Policy Office Thailand,2014, Gold Trader Association Thailand, 2014) shows that people in this age group are working and have purchasing power to afford goods that are valuable.To date there are limited studies that have examined factors influencing purchasing behaviour of gold ornaments. It is important to understand elements impacting customers’ decisions to purchase gold ornaments. This study contributes to gold ornament business owners’ understanding about customers’ behaviors and influential factors affecting customers’ intention to buy gold ornaments. For gold retail businesses to be competitive, they need to understand these factors to develop appropriate positioning and marketing strategies that enhance business success. Thus, this study of influential factors on customers’ purchasing intention of gold ornaments is important to be carried out.
The next section presents a review of relevant literature and is followed by a description of the research methodology. Thereafter, the findings, discussion and study conclusions are presented.
2. Literature Review Gold ornaments are a luxury good which fit the luxury concept “of refined enjoyment, of
elegance, of things desirable but not essential” (Goody, 2006, p.341). In addition, jewelry and accessories are also defined as luxury goods which often include a particular branded product meant to bring prestige to the owner (Gao et al., 2009). Individuals usually buy and use luxury goods to improve their image and identity and to gain higher social position (Penz, and Stottinger, 2005). In addition, gold and gold ornaments have a luxury element involved in gift giving (Belk, 1979). Economic exchange, social exchange, communication, and social connection are important elements in gold ornaments as gifts which affects consumers’ purchasing intention.
Consumer Perception and Consumer Behavior Consumer Perception
Perception can be defined as the way in which a person’s attention to a product or service is brought about by the person’s senses (Walters, 1989). It can also be affected in the sensory input where information is received from the skin, tongue, nose, ears, or eye. Furthermore, consumers can also be affected by many different channels used to perceive their surroundings (Antonides et al., 1998). When an individual chooses, arranges, and interprets stimuli to be logical and meaningful is defined as perception (Schiffman et al., 2004). There are three basic dimensions of consumers’ perception which are exposure, perceptive selection, and interpretation (Schiffman et al., 2005).

Journal of Business and Retail Management Research (JBRMR), Vol. 10 Issue 3 July 2016
www.jbrmr.com A Journal of the Academy of Business and Retail Management (ABRM) 150
Understanding Consumer Perception Previous research has shown the key drivers in jewelry shopping and perception of goods
include quality, the brand, the sales person, the store, and the reference group (as defined below) (Jokinen, 2011) which affect consumers’ intention to purchase. Retailing mix is a combination of 6Ps –Product, Price, Place, Promotion, Personal, and Presentation. Retailers can use and tailor these 6Ps to best target their markets (Levy, 2012).
Consumer Behavior Consumer behavior consists of tangible and intangible dimensions which include goods or
services, mental processes, beliefs and values. In addition, consumer behavior refers to an individual’s involvement and decision processes in using products and services. Individual decisions on buying goods and services involve answering questions on what, where, when, how (Engel et al., 1982). Individual decisions on purchasing also involve consideration of the individual’s ideas and experiences on satisfying his/her needs and desires (Kotler, 1999).
Understanding Consumer Behavior Understanding consumer behavior is an opportunity for businesses to predict demand
and find ways to serve the customer better. This approach to buying needs to emphasize motivation on hedonic responses and symbolic meaning which affect people’s intention to buy goods and services. Consumer decision making involves external factors that influence consumer behavior such as cultural, social, and physiological environments. This research will focus on the reference group (as defined below) and its personal value which directly and indirectly affect consumer behavior. Although culture is the deepest influence on consumer behavior, every person also uses his/her instincts to make decisions (Kotler et al., 2002).
2.1 Consumer Segmentation Age, gender, and income are common criteria used to predict who purchases gold
ornaments. Age is a factor which can determine motivation, interest, and perception (Engel, 1993). Different age groups have different needs and wants, interests, purchases, and behavior (Sheth et al., 1999). Past research (Kresearch Thailand, 2009, Fiscal Policy Office Thailand, 2014, Gold Trader Association Thailand, 2014) has found customers who purchase gold ornaments generally are aged above 25 years old because generally at 25 years old individuals begin to work and seek out goods that can represent themselves.
2.2 Retailing Mix (Product, Price, Place, Promotion, Personal, and Presentation) Retailing mix is an important factor in the jewelry market. However, the way to build
perception is through providing customers with information they need to make decisions. In the luxury items (such as jewelry) market, some research has shown that when potential consumers do not know a lot about the product, providing information on the product becomes necessary (Mitchmanand Mazze, 2006). In the gold ornaments market, providing a level of quality can be used to build trust between consumer and seller (Sanguanpiyapana and Jasper, 2009).
Product: Are the shape, line, and all the visible qualities of the product that represent the brand in order to attract customers (Frings, 2005)? People who are fashion conscious are attracted to designs that have attractive styles. Packaging, product design, merchandise display, etc. can stimulate a sale immediately (Verplanken and Herabadi, 2001).
Quality: Customers tend to trust sales representatives rather than buying channels (Jokinen, 2011). In Thailand gold ornament stores need to be certified and registered with the Ministry of Commerce, Thailand and Gold Trader Association, Thailand. However, there are

Journal of Business and Retail Management Research (JBRMR), Vol. 10 Issue 3 July 2016
www.jbrmr.com A Journal of the Academy of Business and Retail Management (ABRM) 151
also other standards that need to be upheld to gain consumer trust such as all gold ornaments need to be at 96.5% gold purity.
Price: Price is a main factor for a buyer when selecting a product (Kotler, 2000). Buyers always compare the price of previous purchases with future purchases. According to Kotler (2000), pricing structure has five basic categories: price discount and allowance, promotional pricing, geographical pricing, discriminatory pricing, and product-mix pricing. In gold ornaments, the buyers are price sensitive and like to bargain for discounts (Aiello et al., 2009).
Place: Companies make products available to consumers where consumers are most likely to buy. Furthermore, distributors, wholesalers, and retailers are involved in distribution networks which serve to make purchases more convenient for customers (Kotler, 2000). Jewelry customers normally buy jewelry at the traditional stand-alone shops along the main roads (Aiello et al., 2009).
Promotion: Promotion involves all activities which companies employ to communicate to the market (Kotler, 2000). These activities include any form of transforming information of products and services to engage potential customers (Walters and Bergiel, 1989). In order to create an interest in a new product, promotional tactics can be applied in order to maintain positive brand images and increase purchasing intention (Aiello et al. 2009). Marketing communication mix has five measure tools: advertising, sales promotion, public relations, personal selling, and direct marketing (Kotler, 2000).
Sales Representatives: Sale representatives have a significant effect on customers’ perception (Hill, 2007).Today big retailers have trained their sales staff to be able to explain the materials and quality of the products in order to influence customers. This increases the importance of the role of sales representatives. Trust is the most important factor for customers when deciding to purchase or not to purchase (Jokinen, 2011). According to a study on customers’ purchasing experiences, customers want to feel and touch the product, get information about the product, and be able to ask the seller questions. The seller should provide customers good experiences by being helpful (Arnold et al., 2005).
Store atmosphere: The environment of the store has a significant impact on customers. The store atmosphere can stimulate customers, and thus, customers are more receptive with a better chance of impulse buying (Donovan and Rossiter, 1994). When customers are excited, it reduces the possibility of their thinking before acting. The stimulation in the shop can be increased by sounds (Holbrook and Anand, 1990), aromas (Mattila and Wirtz, 2008), or colors (Valdez and Mehrabian, 1994). Building a harmonious atmosphere and environment in the store can help increase sale volumes (Laakso 2004, p.57).
2.3 Reference group Reference groups are groups of people that one relates to which can influence their
decisions (Pickton and Broderick, 2005). The social relationship between people exchanging information is important to secure their purchasing decision (Argo et al., 2005). People in this group include family, friends, and colleagues (Kotler et. al., 2002). Moreover, if that information benefits to a community or a group profit, it can be called collectivism society (Hofstede, 2004). For example, some family husband may dominate decision making but some may not, or friend might encourage doing thing.
2.4 Motivation
Motivation is a driver of consumer behavior and actions (Antonides and Raaij, 1998). The purchases of gold ornaments are motivated by social need and self-esteem rather than basic need (Jokinen, 2011). People wear gold ornaments for self-image and social recognition.

Journal of Business and Retail Management Research (JBRMR), Vol. 10 Issue 3 July 2016
www.jbrmr.com A Journal of the Academy of Business and Retail Management (ABRM) 152
However, previous research shows that wearing jewelry is just like wearing clothes where jewelry can be a strong tool for self-image that affects how an individual thinks of his/herself and projects that image to others (Jokinen, 2011). This study focuses on self-image, investment for the future, buying for special occasions, gift-giving, hedonic value, and utilitarian value.
Self-image: Self and ideal self-image both impact purchasing intention of consumers. Actual self-image is one’s perception of what he or she is like; while ideal self-image is the way that one would like to be perceived by others (Schenk, et al., 1980). Therefore, this creates the assumption of one has many selves that can be expressed through many situations depending on social role and social position. When an individual decides on a particular image to express for a social position, he/she uses a particular good or service to display this image (Ertimur, 2003). Gold ornaments always come to people’s attention when people evaluate each other. Moreover, gold ornaments are a tool to build and reflect self-image (Jokinen, 2011).
Investment: People buy luxury goods for future investment because the goods themselves have increasing value (Wang, et al., 2012). Customers pay attention to future value that can give them return on their investment. In addition, consumers purchase gold ornaments as an investment in their future security.
Buying for Special Occasions and Gift Giving: Consumers buy gold ornaments for special occasions such as festivals and holidays. Gold ornaments can be used for social reasons including gift-giving where gold ornaments are given as luxury gifts in order to maintain good relationships with their social groups (Wang, et al., 2012). Gold ornaments in gift giving can involve issues of socialization, communication, economic value, social exchange (Belk, 1979), social connection (Wailendorf, et al., 1988), and rites of passages (Noble, et al., 1997). Research has shown that 56% of gold ornament purchases are for gifts (Aiello, et al., 2009).
Hedonic and Utilitarian Values: People purchase goods and services not only to satisfy physical function, but also to satisfy other intangible attributes (Babin et al., 1994). Hedonic factors also influence purchases, namely various feelings such as guilt, enjoyment, multi-sensory, fantasy, (Okada, 2005) which can justify the experience of the consumer. On the other hand, when people buy goods or services for necessary functions utilitarian values are in play (Okada, 2005).
2.5 Purchase Intention In order to understand the intention behind the purchasing behaviour of luxury goods, it
is important to know both the personal (individual) and social (external) communications that occur during the process of purchasing the goods. Precious jewelryis a product whose purchase requires serious consideration (Taavi, 2008). When the product is risky and expensive, it involves a high level of self-expression which makes consumers investigate the goods with more scrutiny before making a purchase (Kotler, et. al., 2002).
2.6 Conceptual Framework Based on the literature review, this study will cover 3 main dimensions which are retailing
mix (product and quality, price, place, promotion, sales representative, and store atmosphere), reference group (friend and family), and motivations (self-image, investment for the future, buying for special occasions, gift-giving, hedonic value, and utilitarian value) The hypotheses tested are:
H1: Retailing mix will have a positive relationship on Thai customers’ purchasing intention of gold ornaments. H2: Reference group will have a positive relationship on Thai customers’ purchase intention of gold ornaments.

Journal of Business and Retail Management Research (JBRMR), Vol. 10 Issue 3 July 2016
www.jbrmr.com A Journal of the Academy of Business and Retail Management (ABRM) 153
H3: Motivations will have a positive relationship on Thai customers’ purchase intention of gold ornaments.
3. Methodology The quantitative methodology is used to discover Thai customers’ purchasing intention for
gold ornaments in order to understand the impact of factors influencing customers’ behavior and purchasing intention. The quantitative research is selected to study target respondents because it is an appropriated approach to measure the construct and hypotheses (Sekaran and Bougie, 2009).
3.1 Research Instrument This research used questionnaire survey as instrument to gain information from
respondents. The questionnaire was developed from previous literature in Section 2 to encompass the concepts to measure. Most of the measurement variables were adapted from previous surveys from Ertimur (2003), and Jokinen (2011). The study involved three main independent variables including marketing mix, reference group, and motivation. The dependent variable was people’s intention to purchase gold ornaments.
The questionnaire survey consists of four sections which contain 39 questions. Part 1 includes four questions of demographic information. Part 2 consists of general information consists of three questions of influence factor, place, and frequency of purchase. Part 3 consists of 32 questions to measure independent variables those are consumer’s perception and consumer’s behaviour. Part 4 consists of one question to measure dependent variable that is Thai customers on purchasing intention to purchase gold ornament as dependent variable. There are four type of scales –nominal, ordinal, interval, and ratio- that can be used for quantitative research (Sekaran and Bougie, 2009). In this study would use nominal scale for the part 1 and part 2. Interval (Likert) scale would use in part 3 and part 4 of the questionnaire.
The research survey used a 5-point Likert scale (Field, 2005): 5 (strongly agree), 4 (Agree), 3 (neutral), 2 (disagree), and 1(strongly disagree).
3.2 Data Collection Four hundred questionnaires were distributed via hardcopy and online to people in
Bangkok and vicinity areas during July, 2014. The survey was distributed to respondents who live in Bangkok and vicinity. Online surveying was done using Googledoc.com (101 respondents). Three hundred seventy questionnaires were returned giving a response rate of 92.5%.
3.2 Data Analysis To analyse the data, this study used Statistical Package for Social Sciences (SPSS) program
software version 20.0 to test the constructs. The measurements for this research include descriptive analysis, ANOVA, factor analysis, reliability, correlation, and multiple regressions.
4. Findings 4.1 Demographics
Table 4.1 shows the demographic profile of the 370 survey respondents by gender, age and income.

Journal of Business and Retail Management Research (JBRMR), Vol. 10 Issue 3 July 2016
www.jbrmr.com A Journal of the Academy of Business and Retail Management (ABRM) 154
Table 4.1 Respondents’ demographic profiles
There were 126 male respondents and 244 female respondents. The age of the respondents were divided into 5 groups: 132 respondents are 26–30 years old, 80 respondents are 31-35 years old, 50 respondents are 36-40 years old, 48 respondents are 41-45 years old, and 60 respondents are 46 years and older. In addition, the range of respondents’ income illustrated that 45 respondents have incomes less than 10,000 baht(<283.45US$) per month, 109 respondents have incomes around 10,001–20,000 baht (283.47US$ - 566.89US$), 84 respondents have incomes around 20,001–30,000 baht (566.92US$ - 850.34US$), 24 respondents have incomes around 30,001– 40,000 baht (850.36US$ - 1133.79US$), 47 respondents have incomes around 40,001 – 50,000 baht (1133.82US$ - 1417.23US$), and 61 respondents have incomes greater than 50,001 baht (>1417.26US$).
4.2 Factor Analysis Factor analysis is a tool for grouping similar variables as factors where information can be
summarized into meaningful aspects (Field, 2005). All items were exploratory factor analyzed by

Journal of Business and Retail Management Research (JBRMR), Vol. 10 Issue 3 July 2016
www.jbrmr.com A Journal of the Academy of Business and Retail Management (ABRM) 155
principle component analysis. The analysis deletes items that do not load on primary factors. In order to determine factors that are significant, this research study used factor loading which is a correlation between original variables and factors, assessing the cut off value at less than 0.4 which is considered to be the minimum cut off value (Hair et al. 2006, p.129). Eigenvalue needs to be more than 1 (Field, 2005). Some of the hypotheses had to be revised because they could meet the significance level. Table 4.2 displays the six factors influencing Thai customers purchasing behavior in gold ornaments. Table 4.2 Rotated Component Matrix of six factors influencing Thai customers purchasing behavior
in gold ornament
Table 4.2 shows 6 dimensions which influence Thai customers’ purchasing behaviorof gold ornaments. Therefore, the new hypotheses are:
H1: Buyers’ preferences will have a positive relationship on Thai customers’ purchase intention of gold ornaments. H2: Self-image will have a positive relationship on Thai customers’ purchase intention of gold ornaments. H3: Product design will have a positive relationship on Thai customers’ purchase intention of gold ornaments. H4: Trust will have a positive relationship on Thai customers’ purchase intention of gold ornaments. H5: Expected future value will have a positive relationship on Thai customers’ purchase intention of gold ornaments. H6: Price discount will have a positive relationship on Thai customers’ purchase intention of gold ornaments.
4.3 Reliability Analysis The new hypotheses of this study were tested by using correlation analysis and multiple
regressions with the regrouped constructs from the factor analysis. All the variables passed the reliability analysis where Cronbach's alpha of each construct was more than 0.7 (Lehman, 2005).
Table 4.3 Reliability of factors influencing Thai customers’ purchasing behaviour in gold ornament
4.4 Correlation Coefficient Analysis Correlation coefficient is used to measure the correlation between independent variables
and dependent variables (Malhotra, et al., 2006). The correlation coefficient’s value is between -1 and 1; the value gives the direction (positive or negative) of the relationship between the independent variable and dependent variable. A zero value means that there is no relationship

Journal of Business and Retail Management Research (JBRMR), Vol. 10 Issue 3 July 2016
www.jbrmr.com A Journal of the Academy of Business and Retail Management (ABRM) 156
between the variables (Lehman, 2005). Table 4.4 shows the correlation between 6 variables; all were positive.
Table 4.4 Correlation of six factors influencing Thai customers’ purchasing
behaviour in gold ornament 4.5 Multiple Regression Analysis
Multiple regression analysis is used to predict the unknown value of a variable using the relationship between two or more variables with known values (Hair, et al., 2006). This study used a 95% confidence interval in which the P-value is less than 0.05 level of significant in order to avoid errors (Field, 2005).
After running the multiple regressions the Adjusted R-squared coefficient of factors is 7.1%. The study then tested the coefficient of six factors. The results are presented in Table 4.5.
Table 4.5 Coefficients of six factors influencing Thai customers’ purchasing
Behaviour toward purchasing intention in gold ornament
From the multiple regression analysis the significant level of Buyers' Preferences and Expected Future Value are 0.008 and 0.048 respectively and both are ≤ 0.05.
Figure2 below presents a conceptual framework of the relationship on Buyers’ Preference and Expected Future Value on Purchasing Intention.

Journal of Business and Retail Management Research (JBRMR), Vol. 10 Issue 3 July 2016
www.jbrmr.com A Journal of the Academy of Business and Retail Management (ABRM) 157
Therefore, H1 (Buyers’ preferences will have a positive relationship on Thai customers’ purchase intention of gold ornaments.) and H5 (Expected future value will have a positive relationship on Thai customers’ purchase intention of gold ornaments.) are accepted. And, H2 (Self-image), H3 (Product design), H4 (Trust), and H6 (Price discount) are rejected.
4.6Discussion 4.6.1 Motivation for Buyer’s Preference
The results show significant relationships of Buyers’ Preferences (reference group, buying on occasion, and gift) and Expected Future Value (The belief in future value increasing, type of investment, and securing for future needs) on purchase intention. Compared to previous studies, this study provides some consistent and inconsistent findings as discussed below.
“Reference Group”: Thai consumers display more of a collectivism culture using social information exchange in order to make their purchasing decisions (Argo, et al., 2005). This result is similar to previous Asia-related research which showed the respondents needed someone to help them make decisions which is part of a collectivism culture (Hofstede, 2004). However, European research by Jakinen, (2011) showed European consumers are more individualistic (Hofstede, 2004) when they make decisions.
“Buying on Occasions”: This research showed Thai customers buy gold ornaments on special occasions during festivals and holidays (Wang, et al, 2012). The result of this study is consistent with the Asian and European research.
“Self-Gift”: Thai customers purchase gold ornaments as a gift for themselves which is related to a non-functional motive (Sanguanpiyapana and Jasper, 2009), as a gift-identity which is consistent with other Asia-related research (Ertimur, 2003), and (Rao, et al., 2014). In contrast, Jakinen’s (2011) research showed that European customers had no intention to buy jewelry as a self-reward.
“Gift-Giving”: Thai customers’ purchasing intention of gold ornaments is positively related to gift giving for others. The outcome is similar to Asian and European research in which customers buy goldjewelry as a gift for others because it is related to social connection, image, and friendship.
4.6.2 Expected Future Value Expected future value in this research refers to the belief in the future value of the
investment (gold ornaments) increasing and the belief that the investment will provide security for the future. The results illustrate the significant relationship of Thai customers’ purchasing

Journal of Business and Retail Management Research (JBRMR), Vol. 10 Issue 3 July 2016
www.jbrmr.com A Journal of the Academy of Business and Retail Management (ABRM) 158
intention of gold ornaments and their belief that it is an investment for the future (Wang, et al., 2012).
“The Belief in Increasing Future Value”: Thai customers purchase gold ornaments because they believe in the increasing value of gold ornaments. This research result is similar to the result in other Asia-related research (Ertimur, 2003) and (Rao, et al., 2014).
“Type of Investment”: This research revealed that Thai customers buy gold ornaments as a type of investment which is similar to findings in other Asia-related research (Ertimur, 2003), and (Rao, et al., 2014).
“Security for Future Needs”: This research shows that Thai customers buy gold ornaments because gold ornaments can easily be converted to money which is consistent with other Asia-related research (Ertimur, 2003), and (Rao, et al., 2014) where customers bought gold ornaments for dual benefits (adornment and security for future needs). However, Jakinen’s (2011) research found that European customers were influenced by hedonic values for jewelry, buying because of feelings such as love and happiness.
5. Summary and Conclusions This research addresses influential factors affecting Thai customers’ intention to buy gold
ornaments. This study surveyed Thai consumers who are above 25 years old during July2014. There were 370 respondents from Bangkok and vicinity areas, Of the 370 respondents, 126 were males and 244 were females. The majority age groups were 26-30 years old and 31- 35 years old with 132 respondents and 80 respondents, respectively; with income around 10,000–30,000 baht. Survey responses were analysed by factor analysis and multiple regression analysis.
The research results answer the research question regarding Thai customers’ purchasing behavior and their purchasing intention. First, this research revealed the 6 factors (buyers’ preferences, self-image, product design, trust, expected future value, and price discount) which Thai customers used when buying gold ornaments.
Then, this research revealed two factors that influence Thai consumer’ behavior toward purchasing intention of gold ornaments. Buyers’ references in terms of reference group, buying on occasions, self-gift, and gift-giving can influence Thai consumers’ purchasing of gold ornaments. In addition, the expected future value as determined by the consumer includes the belief in increasing future value and security for future needs.
5.1 Recommendations and Practical Implications Firstly, the reference group has an impact on Thai consumers while they make their
decisions to purchase gold ornaments. Therefore, the marketer might consider implementing referral program in which a customer who recommends another customer will get gifts in return for their referral. Business owners need to put importance on giving customers a good experience in order for these customers to refer new customers. Secondly, Thai people buy gold on occasions such as Valentine’s Day, birthdays, etc. Marketers should do marketing campaigns to attract customers to buy gold ornaments during these occasions. Purchases for these occasions can be for self-gifts and gift-giving. Thirdly, Thai consumers purchase gold ornaments for two main reasons: adornment and investment (Ertimur, 2003). Marketers should use these two main reasons to promote the purchase of gold ornaments to Thai consumers for self-adornment and as a means of future investment. Lastly, gold retailers should focus on Thai customers ‘motivation for purchasing gold ornaments as revealed in this research study.
5.2 Limitations This research study only captured general picture of Thai customers’ purchasing behavior
and purchasing intention. It does not look further into the type of product or price range. In

Journal of Business and Retail Management Research (JBRMR), Vol. 10 Issue 3 July 2016
www.jbrmr.com A Journal of the Academy of Business and Retail Management (ABRM) 159
addition, this study does not analyse consumers ‘attitudes, which might not relate to how they act or purchase (Jakinen, 2011).This study only measured people’s intention to buy.
References Aiello, G. Donvito, R. Godey, B. Pederzoli, D. (2009). An international perspective on luxury brand and
country-of-origin effect. Journal of Brand Management. London. Antonides, G. Raaij, W.F. (1998). Consumer Behavior – A European Perspective. John Wiley and Sons Ltd.
Chichester, England. 619p. Argo, J. J., Dahl, D. W. and Manchanda, R. V. (2005). The influence of a mere social presence in a retail
context, Journal of Consumer Research, 32 (2), 207–212
Babin, J. Barry, Darden, R. William and Griffin, Mitch. (1994). “Work and/or Fun: Measuring Hedonic and Utilitarian Shopping Value.” Journal of Consumer Research 20(March): 644-656.
Belk, Russell (1979), "Gift-Giving Behavior," Research In Marketing, Vol. 2, ed JagdishSheth, Greenwich, CT: JAI Press, 95-126.
Cornell, Andres. (2002). ―Cult of luxury: The new opiate of the masses. Australian Financial Review, 27th
April: 47. Ertimur, B. (2003). Gold and Gold Jewelry: Exploration of Consumer Practices Field A. (2005). Discovering Statistics Using SPSS, Second Edition, 66-77. Fiscal Policy Office Thailand, (2014)
http://www.fpo.go.th/SI/Source/Training/training2/training2_2.htm Gold Trader Association Thailand. (2013, May 13). รายงานการวิจัยศนูย์วิจัยทองค าประจ าเดือนพฤษภาคม 2556 .
Retrieved July 9, 2014, from http://goldtraders.or.th/Research/GRC/grc_report08-05-13.pdf Gold Trader Association Thailand.(n.d.).สมาคมค้าทองค า.Retrieved July 9, 2014, from
http://www.goldtraders.or.th/ArticleView.aspx Gao, L., Norton, M.J.T., Zhang, Z., To, C.K, (2009). Potential niche markets for luxury fashion goods in
China. Journal of Fashion Marketing and Management 13 (4), 514–526. Hair, J.F.Jr. Black, W.C. Babin, B.J. Anderson, R.E. Tatham, R.L. (2006).Multivariate Data Analysis.6th ed.,
Prentice-Hall, London. Hofstede, G., and Hofstede, G. J., (2004). Cultures and organizations: Software for the mind, London:
McGraw-Hill Jain, Neeru (2013). Consumer buying behavior with Regard to Branded and Traditional Jewellery with
special reference to Jaipur jewellery market Jokinen Henri, (2011). Consumer Perceptions and Behaviour in Respect to Ethical, Social, and
Environmental Matters in Jewellery Business Kasikorn Bank, Currency Exchange Rate, Retrieved April 17, 2016, from http://www.kasikornbank.com/EN/RatesAndFees/ForeignExchange/Pages/ForeignExchange.aspx Kotler et al. (2002). Principles of Marketing, pp. 212 Kresearch Thailand, (2009). https://www.kasikornresearch.com/th/k-
econanalysis/pages/ViewSummary.aspx?docid=24175 Lehman, A. (2005). JMP for basic univariate and multivariate statistics: a step-by-step guide. 481p. Malhotra, Naresh K. and Birks, David F. (2007).Marketing Research: An Applied Approach. Third
European ed., Pearson Education Limited, Essex, England Maria Eugenia Fernández Moya, (2012). Purchase and Consumption of Luxury Goods Noble, H. Charles and Beth A. Walker (1997). "Exploring the Relationship among Liminal Transitions,
Symbolic Consumption, and the Extended Self," Psychology and Marketing, 14(January), 29-47. Okada, E. M. (2005). Justification effects on consumer choice of hedonic and utilitarian goods. Journal of
Marketing Research, XLII: 43-53. Penz, E., and Stottinger, B., (2005). Forget the "real" thing-take the copy! An explanatory model for the
volitional purchase of counterfeit products, Advances in Consumer Research, 32 (1), 568-575
Rao, P.S., Sahu, P.C., Sathyapriya, J., and Tholath, D.I, (2014). “A Study of Customer’s Attitude and Behaviour on purchase of Gold Jewellery in Chennai City” International Journal of Research in Management and Technology. Volume 4, Number 1, February 2014.

Journal of Business and Retail Management Research (JBRMR), Vol. 10 Issue 3 July 2016
www.jbrmr.com A Journal of the Academy of Business and Retail Management (ABRM) 160
Reuters, Thomus. (2014, April 1). The cover of GFMS Gold survey 2014 features Japan’s Fujiyama covered with Gold Grain Switzerland’s Metterhorn covered with Valcambi CombiBars. . Retrieved July 9, 2014, from http://trmcs-documents.s3.amazonaws.com/
Sanguanpiyapana, T. Jasper, C. (2009). Consumer insights into luxury goods: Why they shop where they do in a jewelry shopping setting. Journal of Retailing and Consumer Services. Volume 17, Issue 2, March 2010. P.52-160.
Schenk, T. Carolyn and Holman, H. Rebecca. (1980). “A Sociological Approach to Brand Choice: The Concept of Situational Self Image.” Advances in Consumer Research (7): 610-614.
TaaviKuisma, (2008). Conspicuous Consumption: An Analysis of Finnish and Malaysian Luxury Good Consumers
Ruesters, Thomus. (2014, April 1). The cover of GFMS Gold survey 2014 features Japan’s Fujiyama covered with Gold Grain Switzerland’s Metterhorn covered with Valcambi CombiBars. . Retrieved July 9, 2014, from http://trmcs-documents.s3.amazonaws.com/
Walters, C.G., and Bergiel, B. J. (1989). “Consumer Behavior: A Decision-making approach”, Cincinnati, OH: South-Western Publishing.
Wang, Ying, Sun, Shaojing and Song, Yiping, (2012). "Chinese Luxury Consumers: Motivation, Attitude and Behaviour." Journal of Promotion Management.
Wailendorf, Melanie and Eric J. Amould (1988), "My Favorite Things: A Cross-Cultural Inquiry into Object Attachment, Possessiveness, and Social Linkage," Journal of Consumer Research, 14(March), 531-547.
World Gold Council. (2014). about gold jewellery, Retrieved July 9, 2014, from http://www.gold.org/jewellery/about-gold-jewellery

Journal of Business and Retail Management Research (JBRMR), Vol. 10 Issue 3 July 2016
www.jbrmr.com A Journal of the Academy of Business and Retail Management (ABRM) 161
Journal of Business and Retail Management Research www.jbrmr.com
General Author Information The Scope of the Journal As a publisher The Academy of Business & Retail Management (ABRM) has substantial experience of journal publishing and pioneering new journals.
Our philosophy is to map new frontiers in emerging and developing business areas in research, industry and governance, and to link with centres of excellence world-wide to provide authoritative coverage in specialist fields.
Our goal is to foster and promote innovative thinking in business, retail and management fields. We collaborate with numerous fields rather than segment into specific areas of research. Hence, our objectives are to build new links, networks and collaborations between the global communities of researchers in order to stimulate and enhance creativity.
Our continued success lies in bringing together research dimensions to encourage industry and public sector growth throughout the world. Thus, research on global businesses and international retail management are highly within the areas of our interest. Similarly, expert opinions and professional commentaries are also published in order to set collaborative directions for the future researchers.
ABRM therefore prides itself in ensuring the high quality and professional standards expected of its journals by pursuing a full double-blind refereeing process for all articles submitted to it for publication.
Formal conditions of acceptance 1. Papers will only be published in English. 2. Each manuscript must be accompanied by a statement that it has not been submitted for
publication elsewhere in English. 3. Previous presentation at a conference, or publication in another language, should be
disclosed. 4. All papers are refereed, and the Chief Editor reserves the right to refuse any
manuscript, whether on invitation or otherwise, and to make suggestions and/or modifications before publication.
5. JBRMR only accepts and publishes articles for which authors have agreed to release under the terms of the Creative Commons Attribution Licence (CCAL) version “CC BY 3.0”. Please note that authors retain ownership of the copyright for their article, but authors allow anyone to download, reuse, and reprint, modify, distribute, and/or copy articles in JBRMR, so long as the original authors are source are cited. No permission is required from the authors or the publishers.
6. JBRMR shall furnish authors of accepted papers with proof for the correction of printing errors. The proof shall be returned within 14 days of receiving the suggested corrections. JBRMR shall not be held responsible for errors which are the result of authors' oversights
7. JBRMR is committed to publish all full text articles online for immediate open access to readers and there is no charge to download articles and editorial comments for their own scholarly use.

Journal of Business and Retail Management Research (JBRMR), Vol. 10 Issue 3 July 2016
www.jbrmr.com A Journal of the Academy of Business and Retail Management (ABRM) 162
Peer review process JBRMR places great emphasis on the quality of the articles it publishes; and therefore, a full double - blind reviewing process is used in which:
Subject to the condition that the paper submitted is in line with the guidelines provided for authors the editor will review its suitability given the aims and objectives of the journal.
If the outcome is positive the paper will be sent for blind reviews to two reviewers.
Decision will be taken as to the acceptability of the paper on the basis of the recommendation of the reviewers.
Should further revision be found necessary it will be communicated to the author accordingly.
Based on the outcome of above the date of publication will be decided and acceptance letter to be issued to the author(s).
For papers which require changes, the same reviewers will be used to ensure that the quality of the revised article is acceptable.
Copyright Policies for Open Access Journal The Academy of Business & Retail Management Research is fully committed to transparency in regards to the issue of copyright and copyright ownership. Authors who submit papers to the Journal of Business and Retail Management Research (JBRMR) retain ownership of their original material. Although as part of the open access process authors permit other individuals, organisations and institutions to access the said material. Whilst other parties may well access materials if they quote from them they are expected to fully credit the author/authors. It is important to remember that the rights of authors are granted and apply only to articles for which you are named as the author or co-author. The author’s rights include the following:
The right to make copies of the article for your own personal use (including in the course of academic teaching and other scholarly endeavours)
The right to reproduce and distribute copies of the article (including in electronic form) for personal use
The right to present the article at conferences and meeting and distribute copies at such gatherings
You have patent and trademark rights to any process or procedure described in the article that was formulated by the author/authors
The right to include the article in full or in part in a thesis or dissertation provided that this is not published commercially
The right to prepare other derivative works, to extend the article into book-length form, or to otherwise reuse portions or excerpts in other works, with full acknowledgement of its original publication in the journal
Copyright Notice Authors who submit papers that are submitted and accepted for publication in the journal agree to the following:
Authors retain copyright and grant the journal right of first publication with the work simultaneously licensed under a Creative Commons Attribution License version “CC BY 3.0”(this allows others to share the work with an acknowledgement of the work’s authorship and the place of first publication)
Authors are perfectly entitled to enter into separate contract arrangements for on-exclusive distribution of the journal’s published version of the work providing there is an acknowledgement of its initial place of publication

Journal of Business and Retail Management Research (JBRMR), Vol. 10 Issue 3 July 2016
www.jbrmr.com A Journal of the Academy of Business and Retail Management (ABRM) 163
Once submitted and accepted papers can post-print provided they are in the same format as it appeared in the journal, however, pre-prints are not permitted.
Authors may use data contained in the article in other works that they create
Authors may reproduce the article, in whole or in part, in any printed book (including a thesis) of which the author, provided the original article is properly and fully attributed
Authors and any scholarly institution where they are employed may reproduce the article, in whole or in part, for the purpose of teaching students
Open Access rights and Permissions for our Open Access
Articles can be distributed under the terms of the Creative Commons Attribution (CC-BY) licence. Authors retain full ownership of the copyright for their article, but undertake to allow anyone to download, reuse, reprint and distribute the article.
Authors are permitted to post the final, published PDF of their article on a website, institutional repository or other free public server, immediately upon publication, provided, a link is included between the web page containing the article and the journal’s website.
Manuscript Submission Procedures Authors are invited to submit original research papers, case studies, reviews, work in progress reports, abstracts, student’s papers or research proposals within the broad scope of the Journal. The following guidelines must be adhered to when submitting the papers: No manuscript will be accepted without the Required Format. All manuscripts should be professionally proofread before the submission
1. Introduction
1.1 Manuscript should be written in English and should be submitted to the Editor-in-chief electronically through the online system as e-mail attachment to [email protected]
1.2 If electronic media is not available, the original paper may be submitted on standard CD to the Editor by using full postal address which is, The Academy of Business & Retail Management, 183 Exeter Road, Harrow, Middlesex HA2 9PG.
1.3 Manuscripts are to be submitted as MS Word documents for Windows. Other formats will not be accepted.
2. General Manuscript Guidelines 2.1 Margin: Set the paper size to A4 with One (1) inch on all sides (Top, bottom, left, right) 2.2 Font size and type: The fonts to be used are Book Antiqua in 12 point pitch. Main
headings-14 and subheadings-12. Please use BOLD for paper title. 2.3 Major and secondary headings must be BOLD, left-justified and in lower case. 2.4 Spacing and punctuation: Space once after commas, colons and semicolons within
sentences. The body of the papers should be single spaced. 2.5 Line spacing: Single spaced throughout the paper, including the title page, abstract,
body of the document, tables, figures, diagrams, pictures, references and appendices. 2.6 Length of the Paper: The paper length should not exceed 15 pages maximum including
figures, tables, references and appendices. 2.7 Paragraphing: A blank line between paragraphs should be left without indent.
3. Structure of the Manuscript 3.1 Cover page The front page of the manuscript must be organised as follows:

Journal of Business and Retail Management Research (JBRMR), Vol. 10 Issue 3 July 2016
www.jbrmr.com A Journal of the Academy of Business and Retail Management (ABRM) 164
(i) Title of the Article –Paper title to be centered on the page, uppercase and lowercase letters, Font size 14, bold
(ii) Author (s) name (s): Uppercase and lowercase letters, centered on the line following the title, font size 12, bold
(iii) Institutional affiliation: name of the institute and country, Uppercase and lowercase letters, centered on the line following the author(s) name, font size 12
(iv) Authors note: Provide information about the author`s departmental affiliation, acknowledgment for any financial and non-financial assistance, mailing address for correspondence, email addresses for all co-authors
(v) Key words: Maximum 6 key words, font size 11
3.2. Abstract: The abstract is self-contained summary of the most important elements of the paper
(i) Pagination: The abstract begins on a new page (ii) Heading: Upper and lower case letters with 12 font size bold and align text to the left. (iii) Length and format: Abstract should be the summary of the paper, not more than 300
words, abstract should include purpose of the paper, design/methodology employed, findings, practical implications and originality statement. Font size 11.
3.3. Body of the manuscript From the second page the rest of manuscript should be included the introduction/background, main body of the paper which can be divided into section and sub-sections. Section and sub-section should be numbered and should be typed in BOLD. The manuscript should be organised as follows:
1. The Introduction 2. Main body of the paper with sections and sub-sections 3. Discussions and conclusions 4. Research limitations and direction for further research 5. References 6. Appendices (if any)
3.4. Use of Table, Figures and Equations (a) All tables are to be centered and numbered sequentially, with their title centered below
the table. (b) All figures must be reproduced black and white. A good quality graphic software to be
used and figures are to be centered with the caption to be centered below the figure (c) All equations must be typeset with the same word processor and type in Math type
(please visit the website at www.mathtype.com for free limited trial).
4. References The Harvard System of referencing should be used for all manuscript(s) submitted to ABRM`s Conferences and Journals for all sources. All sources should be listed together; there should not be separate lists for books, journal articles and electronic sources. Making a list of what you have used must be appropriate to the type of source used; the details you need to record will vary according to the source.

Journal of Business and Retail Management Research (JBRMR), Vol. 10 Issue 3 July 2016
www.jbrmr.com A Journal of the Academy of Business and Retail Management (ABRM) 165
CALL FOR PAPERS JOURNAL OF BUSINESS AND RETAIL MANAGEMENT RESEARCH
ISSN (Print) 1751-8202 The JBRMR, a scholarly and refereed journal, provides an authoritative source of information for scholars, academicians, and professionals in the fields of business and retail management and is publicised twice a year. The journal promotes the advancement, understanding, and practice of business & retail management. It is peer reviewed and is the main research platform of The Academy of Business & Retail Management (ABRM). Scholars across borders are encouraged in advancing the frontiers of management education, particularly in the area of retail trade. Contributions should therefore be of interest to scholars, practitioners and researchers in management in both developed and developing countries targeting a worldwide readership through both print and electronic medium.
Although broad in coverage, the following areas are indicative and nurture the interests of the Academy with a “retail” underpinning:
» Business Ethics and Legal Issues » Business Environment » Business Policies, Strategies, and Performance » Business and Retail Research » Business Security and Privacy Issues » Consumer Behaviour » Emerging Advances in Business and its Applications » Innovation and Product Development » International Business Issues » Management and Retail Marketing » Marketing Management and Strategies » Relationship Management » Risk Management » Retail Management and Communication » New Venture Start-up » Retail Buying » MIS and Retail Management » Demographics and Retail Business » HRM and Retail Business » Innovation in Retail Management » Law and Management
Preference will be given to papers which are conceptually and analytically strong and have empirical relevance. All papers will be reviewed according to the Journal’s criterion. The Journal’s website is www.jbrmr.com. For further information please write to Editor via [email protected]
This Journal is approved for listing in EBSCO Host, ProQuest, SCOPUS and Cabell`s Directory of Refereed publications

Journal of Business and Retail Management Research (JBRMR), Vol. 10 Issue 3 July 2016
www.jbrmr.com A Journal of the Academy of Business and Retail Management (ABRM) 166
Subscription Form
The JBRMR is a scholarly and refereed journal that provides an authoritative source of information for scholars, academicians, and professionals in the fields of business and retail management. The journal is published .four times a year: January, April, July & October Subscription Rates (Yearly):
UK / EU NON UK / EU
Individual Subscription £150 + Postal charges of £40 £200 + Postal charges of £100
Institutional Subscription £200 + Postal charges of £40 £300 + Postal charges of £100
Single Issue £50 + Postal charges of £20 £60 + Postal charges of £25 Subscriber Details: Title: _____________________________ Organisation Name: ___________________ First Name: ________________________ Last Name: ___________________________ Address: ________________________ Country: ______________________________
__________________________ Post Code/Zip Code: __________________ Tel: _______________________________ Email: ________________________________ Payment Method: Payment must be made in pound (£) sterling cheque/bankers draft drawn on a UK bank (payable to The Academy of Business & Retail Management). Please tick the right options ABRM may be contacted for dispatch prices for special or recorded delivery. Student/ Individual Subscription Institute Subscription Single Issue I enclose a cheque for ------------------The Academy of Business and Retail Management (ABRM) Talbot House, 204-226 Imperial Drive, Harrow, Middlesex HA2 7HH The Sum of ____________ Bank Deposit Details: HSBC, Account No: 71468979, Sort Code: 40-42-28, SWIFT Code: MIDLGB22, IBAN: GB09MIDL40422871468979 Cheque, postal order or Bank Draft should be sent to: The Academy Of Business and Retail Management, Talbot House, 204-226 Imperial Drive, Harrow, Middlesex, HA2 7HH. United Kingdom. Tel: +44(0) 2088689883 Email: [email protected], Web: www.abrmr.com
Talbot House, 204-226 Imperial Drive, Harrow, Middlesex HA2 7HH
Tel: +44(0)2088689883 E-mail: [email protected] Web: www.jbrmr.com

Journal of Business and Retail Management Research (JBRMR), Vol. 10 Issue 3 July 2016
www.jbrmr.com A Journal of the Academy of Business and Retail Management (ABRM) 167
Call for Papers
INTERNATIONAL JOURNAL OF BUSINESS & ECONOMIC DEVELOPMENT (Print) ISSN 2051-848X (Online) ISSN 2051-8498
The IJBED, a scholarly and refereed journal, provides an authoritative source of information for scholars, academicians, and professionals in the fields of business and economic development and is published four times a year. The journal promotes the advancement, understanding, and practice of business & economic development. It is peer reviewed and is the main research platform of The Academy of Business & Retail Management (ABRM). Scholars across borders are encouraged in advancing the frontiers of management education, particularly in the area of economic development. Contributions should therefore be of interest to scholars, practitioners and researchers in management in both developed and developing countries targeting a worldwide readership through electronic medium. Authors are invited to submit their original research papers, case study, review, work in progress, reports within the broad scope of the journal. Although broad in coverage, the following areas are indicative and nurture the interests of the Academy with an “economic development” underpinning:
Agriculture and development Demography and development Disaster management Diversification and business performance FDI, Free trade – theory and practice Gender and socio-economic development Geopolitics of development Globalisation, liberalisation and development Health service management Industry sectors and development Information technology and business performance Institutions ,business and development Jobless growth, Labour relations and business Land reform – theory and practice Macro economic parameters and growth Microfinance and development Multinational enterprises and business strategy Natural resources and their internationalisation as leverage factors Natural resources and their internationalisation as leverages NGOs and entrepreneurship development
Preference will be given to papers which are conceptually and analytically strong and have empirical relevance. All papers will be reviewed according to the Journal’s criterion. The Journal’s website is www.ijbed.org. For further information please write to Editor via [email protected]

Journal of Business and Retail Management Research (JBRMR), Vol. 10 Issue 3 July 2016
www.jbrmr.com A Journal of the Academy of Business and Retail Management (ABRM) 168
Call for Papers for the forthcoming conferences
IACP-2016, Paris, France International Academic Conference in Paris
15-16th August 2016
ICILLT-2016, University of Cambridge, UK
19-20th September 2016 2nd International Conference on Institutional leadership, Learning & Teaching
7th ITARC-2016, London, UK
7-8th November 2016 7th International Trade & Academic Research Conference
3rd ICGEEE-2017, Dubai, UAE
20-21st February 2017
3rd International Conference on Globalisation, Entrepreneurship & Emerging Economies (ICGEEE)
6th ICBED-2017, New York-USA
10-11th April 2017
6th International Conference on Business and Economic Development (ICBED)
Authors are invited to submit original research papers, case studies, review, work in progress reports, abstracts, students’ papers or research projects within the broad scope of each conference. All papers should be professionally proofread prior to submission. These conferences will be jointly organised by the Academy of Business & Retail Management and the Journal of Business & Retail Management Research.
For further detail please visit: http://abrmr.com

Journal of Business and Retail Management Research (JBRMR), Vol. 10 Issue 3 July 2016
www.jbrmr.com A Journal of the Academy of Business and Retail Management (ABRM) 169
CALL FOR PAPERS International Journal of Higher Education Management (IJHEM)
(Print) ISSN 2054-984 (Online) ISSN 2054-9857 Aims and Objectives IJHEM is a peer reviewed journal and is a research publication platform for international scholars. Their research can be in any aspect teaching & learning covering the interests of developed and emerging countries alike. The Journal seeks to reach a worldwide readership through print and electronic media. The main aims of the Journal are:
Publish high quality and scholarly empirical based research papers, case studies, reviews in all aspect of teaching & learning, education management and leadership with theoretical underpinnings.
Offer academics, practitioners and researchers the possibility of having in depth knowledge and understanding of the nature of teaching and learning practices and.
Create a forum for the advancement of education management research for the High Education sector.
Subject coverage
Educational policy and Policy impacts on education
Management of education and Relations between lecturers and students
Psychology of education, Psychology of student and teacher/lecturer
Quality of education and Improvement method
Global education and Its challenges and opportunities
E-teaching/E-learning, Educational software and multimedia for education
Teacher education Distance education and Education quality
Methodology of educational research, Adult and continuing education
Special education, Gender, diversity and difference, Vocational education
Assessment processes and mechanisms
Language Education, Listening and acoustics in education environment
Education History
Innovative teaching and Learning methodologies; Multi-virtual environment
Application of educational technology
Education reforms and Practical teaching reform Frequency: Twice a year: February & August
Review process: Blind peer review Indexing with: Ebesco Host, ProQuest, Open J-Gate, Cabell`s Directory
Preference will be given to papers which are conceptually and analytically strong and have empirical relevance. All papers will be reviewed according to the Journal’s criterion. The Journal’s website is www.ijhem.abrmr.com . For further information please write to Editor at [email protected] or call on +44(0)2088689883

Journal of Business and Retail Management Research (JBRMR), Vol. 10 Issue 3 July 2016
www.jbrmr.com A Journal of the Academy of Business and Retail Management (ABRM) 170
CALL FOR PAPERS INTERNATIONAL JOURNAL OF BUSINESS & CYBER SECURITY (IJBCS)
(Print) ISSN 2059-660X (Online) ISSN 2059-6618 IJBCS is a scholarly and refereed journal that provides an authoritative source of information for scholars, academicians, policy makers and professionals regarding business and cyber security. It is peer reviewed journal that is published twice a year and serves as an important research platform. IJBCS is committed to publishing articles that provide insight and informs best practice. Contributions should therefore be of interest to scholars, policy makers, practitioners and researchers internationally. The Editors and Editorial Board of the IJBCS are committed to championing original academic papers that demonstrate academic rigor, originality and integrity. IJBCS seeks to minimise cyber-risk through insight and vigilance.
Authors are invited to submit their original research papers, case study, review, work in progress, reports, abstract, students’ papers or research proposals within the broad scope of the journal. Although broad in coverage, the following areas are indicative and nurture the interests of the Academy with a “cyber security” underpinning:
Business & Cyber Security; Risk awareness & mitigation
eCrime and Cyber Terrorism
Identity Fraud & Access Management; Information hemorrhage
Cryptosystems and Data Protection
Compliance, Legal Safeguards and Obligations
Foresight Leadership and Planning; Industrial Espionage & Counterfeiting
Critical Infrastructure Protection; Building and maintaining cyber resilience
Security architecture and network defense
Vigilance and scrutiny; Attitudinal change
Knowledge transfer & training; Addressing the skills deficit
Brand Protection; Pre-transaction customer verification
Customer protection, reassurance and recovery
Information Risk Management & Governance
Digital Forensics, Evidence and Intelligence
Costing cyber-attacks; Ethical Hacking
Financial Analysis & Control Systems
Privacy, Surveillance and Control; Identity, Trust and Trustworthiness
Security Economics, Incentives and Liabilities
Preference will be given to papers which are conceptually and analytically strong and have empirical relevance. All papers will be reviewed according to the Journal’s criterion. The Journal’s website is www.iijbcs.abrmr.com . For further information please write to Editor via [email protected]

Journal of Business and Retail Management Research (JBRMR), Vol. 10 Issue 3 July 2016
www.jbrmr.com A Journal of the Academy of Business and Retail Management (ABRM) 171
Journal of Business and Retail Management Research (JBRMR) Editorial Review Board
Atchara Sriphan Naresuan University, Phitsanuloke, Thailand
Ayat Yehia Arab Academy for Science, Technology and Maritime Transport, Egypt
Cengiz Kahraman Istanbul Technical University, Istanbul
Tanuja Sharma Management Development Institute, Gurgaon, India
Julia Gordeeva Plekhanov Russian University of Economics, Russia
Nelson Takon Cross River University of Technology, Calabar, Nigeria
Samar M. Baqer Kuwait University, Kuwait
Ahmad Bello Ahmad Bello University, Nigeria
Nagaraja Nanje Gowda University of Mysore, India
Visvanathan Naicker University of the Western Cape, South Africa
Juan Carlos Botello Osorio Universidad Popular Autonoma del Estado de Puebla, Mexico
Muhammad AZAM St. Patricks International College, United Kingdom
Shekh Usman Hassan Ahmadu Bello University, Nigeria
Badreddine TALBI High National School of Statistics and Applied Economics, Algeria
Eman Mohamed Abd-El-Salam Arab Academy for Science and Technology and Maritime Transport, Egypt
Ayambila Sylvester University of Ghana, Ghana
Khalid Kisswani Gulf University for Science & Technology,Kuwait
C. Michael Wernerheim Memorial University of Newfoundland, Canada
Mohamed Karim Kefi Ecole Supérieure de Commerce et de Marketing, Prism Sorbonne, France
Nattachet Pooncharoen Naresuan University, Thailand
Sandeep Goel Management Development Institute, Gurgaon. India
Beenish Bashir NUST Business school, National University of Science and Technology, Pakistan
Duarte Xara-Brasil Instituto Politécnico de Setúbal, Portugal
Ha Viet Nguyen University of New South Wales, Australia
Adhi Baskara University of Indonesia, Indonesia
A. Jayakumar Periyar University, India.
Rasheed Olajide Alao Adeyemi College of Education, Nigeria
Micheletti Patrick Kedge Business School, France
Sarat Chandra Das U Asia, United Kingdom
Fon Sim, Ong The University of Nottingham, Malaysia
Rachid TOUMACHE High National School of Statistics and Applied Economics, Algeria
Cletus O. Akenbor Federal University, Nigeria
Heba Sadek Arab Academy for Science, Technology and Maritime Transport, Egypt
Gabriela Marinescu University of Medicine and Pharmacy “Gr.T.Popa” Iasi, Romania
Khaled ROUASKI High National School of Statistics and Applied Economics, Algeria
Eiman Negm Arab Academy for Science, Technology and Maritime Transport, Egypt
Odoh Patrick Abutu The Federal Polytechnic University, Nigeria
Hossein Mombeini Islamic Azad University, Dubai branch, Dubai, UAE
Waisu Iliyasu Umaru Musa Yar’adua University, Katsina, Nigeria
Abdelali HAJBI Hassan 1st University, Morocco
Des Raj Bajwa Haryana,Panchkula Kurukshetra University, Kurukhsetra
Joseph Teryima Benue State University, Makurdi, Nigeria
Sazib Murtaza Iqra University, Islamabad, Pakistan
Hifza Mahmood Rana Iqra University, Islamabad, Pakistan

Journal of Business and Retail Management Research (JBRMR), Vol. 10 Issue 3 July 2016
www.jbrmr.com A Journal of the Academy of Business and Retail Management (ABRM) 172
Luiz Albzzto Alig Santos Institute Matropolitano of Angola, Republic of Angola
Mansour Esmaeil Zaei Panjab University, India
Idris Zakariyya Kiri Jigawa State College of Education
Manolis I. Skouloudakis University of Macedonia, Greece
Jatin Pancholi Middlesex University, United Kingdom
Vienda A. Kuntjoro 17 Agustus 1945 University, Indonesia
Anita Mathew Institute of Management Technology, Ghaziabad India
Ricardo Peters University of the Western Cape, South Africa
Isaac S.R. Butswat National Open University of Nigeria, Jos, Nigeria
Hideyuki Ishiozaka Osaka Sangyo University, Japan
Neha Purushottam University of South Africa, South Africa
S. Rangnekar Indian Institute of Technology, India
Radhika Lobo
Birla College of Arts, Science and Commerce, Kalyan, India
Latha Krishnadas Mazumder Al Khawarizmi International College, Abu Dhabi, United Arab Emirates
Kanokkan Vichasilp Rajamangala University of Technology Isan, Thailand
Antoine Trad Webster University, Switzerland
Chiloane-Tsoka Germinah University of South Africa, South Africa
Mahwish Waheed International Islamic University, Pakistan
Hemant C Trivedi Pandit Deendayal Petroleum University, India
Ruth Marciniak Glasgow Caledonian University, United kingdom
Abasilim Angela Nneka Wesley University of Science and Technology, Ondo, Nigeria
Huseynov Khatira The Academy of Public Administration under the President of the Republic of Azerbaijan
Şeyda Akyol Lecturer in Marmara University, Istanbul, Turkey
Rania A.M. Shamah Ahram Canadian University, Cairo, Egypt
Ssouhaila A Saeed AL-Zytoonah University, Jordan
Louise Van Scheers University of South Africa, South Africa
Muhammad Jahangir National University of Modern Languages, Pakistan
Lothar Auchter University of Applied Sciences Kaiserslautern, Germany
Michael Chattalas Kean University, New York, USA
Sandeep Puri IMT, Ghaziabad, India
Mudrajad Kuncoro Gadjah Mada University, Indonesia
JBRMR Vol 10 No 3 COVERS.qxp_Layout 1 14/07/2016 13:01 Page 2

Th
e J
ou
rna
l of B
usin
ess a
nd
Re
tail M
an
ag
em
en
t Re
sea
rch
Vo
lum
e 1
0 Issu
e 3
Ju
ly 2
01
6JBRMR Vol 10 No 3 COVERS.qxp_Layout 1 14/07/2016 13:01 Page 1