International Journal of Business and Management, ISSN ...
156
-
Upload
khangminh22 -
Category
Documents
-
view
0 -
download
0
Transcript of International Journal of Business and Management, ISSN ...
International Journal of Business and Management June, 2008
1
Contents The Impact of the Salary Cap in the European Rugby Super League 3Andrew Howarth & T. A Robinson An Analysis on Factors of Success for Chinese/European JVs in Culture Aspect 8Fei Yin Study on the Synergy of Information Technology Innovation and Marketing Innovation for Commercial Banks
13
Xin Li Study on the Current Capital Management of China Modern Enterprises 17Lijie Sha, Yang Li Stats for the Terrified: Impact of Different Teaching & Learning Approaches in the Study of Business Statistics
21
Guru Prakash Prabhakar The Future Development of China Commercial Automobile Water Ro-Ro Transportation Market 29Hao Lv Application of Analysis of Competency Value on the Recruitment of Salesman 33Yongbo Guo,Weihua Liu, Xinmin Zhang Research on the Management of Public Crisis and Environmental Monitoring System of Tourism 38Hejiang Shen & Liqin Zhao Does Economic Environment Affect Ownership-performance Relation? Evidence from Financial Deregulation in Japan
44
Yabei Hu & Shigemi Izumida A Post-Mortem Evaluation of an IT project a Case Study of a Process Enhancement IT-Project In a Maintenance, Repair and Overhaul Company
57
Uwe Lehmann & Guru Prakash Prabhakar A Study on the Strategy of Cultivating China’s Self-Owned Brands 71Xiaoshui Yu Effects of Take-over Motives and Ownership Structure on Premiums Paid: Evidence from Malaysia 75Saw-Imm SONG, Ruhani ALI, Subramaniam PILLAY Research on Firm IT Capability and Competitive Advantages 89Jingfu Guo, Lin Sun, Lijuan Zhong The Theory of Pay Effectiveness 93Yao Li, Weihua Liu, Hao Li Financial Instability, Banking Crisis, and Growth Volatility In Thailand: An Investigation of Bi-Directional Relationship
97
Piriya Pholphirul Risks of Enterprise Merger & Purchase and the Prevention 111Aizhong Chen A Study on the Supervision System with Voluntary Information Disclosure in Chinese Listed Companies 114Zuping Huang
Vol. 3, No. 6 International Journal of Business and Management
2
Does the Current Position of Women in the Labour Market in Asia Pacific Countries Signal an End to Gender Inequality?
118
Liang Cong Value vs Magnitude: Distinguishing Information Sources That Contribute to Malaysian Exporters’ Promotion Competency
123
Jasmine Yeap Ai Leen, Osman Mohamad, T. Ramayah, Ng Kim Soon The Problems in Sustainable Development of Resource Orientated City and Countermeasures 128Zhen Wang, Yuanyuan Liu, Yan Xu A Study on Tactics in Using Talents 132Xiangdong Ma The Corporate Social Responsibility Practice in the Turkish Automotive Distribution Companies 139Ayse KUCUK YILMAZ The Tacit Knowledge Transfer of Transnational Corporation 148Shufang Dong The Classical Model of Decision Making Has Been Accepted as not providing an Accurate Account of How People Typically Make Decisions
151
Bin Li
International Journal of Business and Management June, 2008
3
The Impact of the Salary Cap in the
European Rugby Super League Andrew Howarth
Manchester Business School University of Manchester
Booth St West, Manchester, M15 6PB
T. A Robinson (Corresponding author) Manchester Business School
University of Manchester Booth St West
Manchester, M15 6PB Tel: 44-161-3063488 E-mail: [email protected]
Abstract Salary caps are widely used in professional sports as a mechanism for improving competitive balance in a league. Some commercially important sports leagues such as soccer’s English Premier League are considering their introduction. To guide the decisions of policy-makers in such organizations, information on the effectiveness of salary caps is essential. This paper assesses the impact of the salary cap introduced in rugby league’s European Super league on the competitiveness of the league. Using three measures of competitive balance; share of championships won, the five-club concentration ratio and the Herfindahl-Hirshman index, we find tentative evidence that the salary cap did improve competitive balance after it was introduced. Keywords: Rugby league, Salary cap, Competitive balance 1. Introduction The possibility of a salary cap as a mechanism for limiting the spiraling wages of some professional athletes and the disparities in expenditures within sports leagues has been, and is being, discussed throughout Europe (Commission of the European Communities, 2007). Since salary caps already exist in several European, North American and Australian sports, knowledge of their effects is important to inform and guide the decisions of policymakers. Research on salary caps has been largely theoretical (Szymanski, 2004; Quirk and Fort, 1992; Kesenne ,2000). There has been little empirical work on the effects of salary caps on competitive balance. Fort and Quirk (1995) find that the standard deviation of win percentage increased in the National Basketball Association (NBA) after a cap was introduced in 1980. Endo, Florio, Gerber and Sommers (2003) similarly find that competitive balance diminished after the NBA salary cap. This paper investigates the competitive effects of the imposition of a salary cap in Europe’s premier professional rugby league competition, the European Rugby Super League. The aim is to assess how competitiveness has changed in the top division of rugby league over a set time period and to determine if the introduction of a salary cap had any effect on the competitive balance of the league. Three measures of competitive balance will be used to this end. 2. The European Super League In response to falling attendances and consequent financial distress of several clubs there was a reorganization of British Rugby League in the early 1990’s. The administrators of the sport, the Rugby Football League (RFL), proposed the creation an elite premier division, similar to the recently established soccer equivalent. This would to be a 12-team Super League, containing clubs from London and Paris in order to encourage interest in the game in the south and on the continent. In addition, matches would now to be played in the summer months. The new league was to be called the European Super League and it would commence in March 1996. Each team plays the other twice, once at home and once away, the teams then play an additional five fixtures to take their total games to 27. Once the league games have been concluded the top six teams are entered into a play-off,
Vol. 3, No. 6 International Journal of Business and Management
4
resulting in two teams competing in the Grand Final. As with many other knock-out competitions, the play-offs are designed with the intention of having the higher placed teams at the end of the season meeting in the final, meaning the first and second place teams will face ‘easier’ opposition in the early rounds. There is currently the opportunity for one team in the division below the Super League to gain elite status through promotion, with a Super League team moving in the opposite direction, keeping the number of teams constant. A new structure is yet to be finalised, but once completed, relegation and promotion will be abolished. Instead, to gain entry into the Super League, clubs will be invited to apply for a licence, and in doing so, are required to meet criteria on facilities, fan base and finance. 3. The Salary Cap A controversial proposal, since implemented, for the new league was the introduction of a salary cap for the second 1997 season, forbidding clubs to spend any more than 40% of the gross annual income on players’ financial packages. Financial evidence had to be submitted to the RFL showing gross annual income and total player costs of the previous season, plus expected financial forecasts for the forthcoming season to allow clubs to account sufficiently for the costs of the various activities of the club. This information is required to be submitted to the RFL to be held at the governing body’s headquarters (Thomas, 1997). Many sports leagues throughout the world have imposed salary caps including the Guinness Premiership (European Rugby Union), the National Rugby League (Australian Rugby League), the Australian Football League (Australian Rules Football), the National Football League (American Football), the National Basketball Association (US basketball), the National Hockey League (US ice hockey). There are two main reasons for using salary caps in sport. In the words of the RFL; “There are 2 principal purposes of The Super League Salary Cap. The first is to restrict clubs’ main item of expenditure, players’ costs, to try and ensure, as far as possible, the long-term financial survival of rugby league clubs. The second purpose is to improve the competitiveness of the League by restricting to a finite level of how much one club can spend on its playing staff” (RFL Operational Rules – Section E1 – Salary Cap Regulations – Issue 5 – February 2007) Several clubs have been penalised for breaching the cap since its inception, although some of the larger clubs are repeat offenders. In 2003, Halifax, Hull and Grand Final winners St Helens had two points deducted. Wigan and Bradford were both docked two points after being found guilty of breaching the salary cap in 2005, Hull and St Helens were both fined for minor breaches and Wakefield and Castleford received cautions. Wigan again were penalized in 2006 by having four points deducted while Bradford were docked two points and St Helens were fined £22,000. 4. Measuring Competitive Balance There are many ways in which competitive balance can be measured (Humphreys, 2002). Commonly used measures are the standard deviation of win percentages, Gini coefficients and Lorenz curves. However, these measures were developed with North American sports in mind where a tie is not an option. Whilst a tie is not a common result in rugby league, it is still a possible outcome and therefore must be taken into consideration. Our period of interest is 1976 – 2006. This period takes into account ten years of Super League data and twenty years of data before its inception, which should produce a respectable spread and be a wide enough time scale to show any patterns that may emerge. The necessary data were obtained from the appropriate annual editions of Rothmans Rugby Football Yearbook. A simplistic way of studying competitive balance is look at the share of championships won. In the time period we are focusing on, from 1976 to the present day, there has been only ten clubs who have won the league championship, Bradford, Featherstone Rovers, Halifax, Hull, Hull Kingston Rovers, Leeds, Leigh, St. Helens, Widnes and Wigan. However, only half of these clubs have more than one title to their name. Wigan have dominated, winning an impressive seven consecutive titles. But, since the introduction of the salary cap Wigan, have only won the championship twice in nine years, which is a significant reduction in their success rate. The spread of wins is distributed more evenly between three other clubs, although no surprises emerge when considering the four teams to win the Super League in this time span. Wigan, St Helens, Bradford and Leeds have long been considered to be the dominant forces in rugby league and are referred to as ‘The Big Four’. Michie and Oughton (MO) (2004) used more sophisticated methods of calculating competitive balance in the soccer’s English Premier League and some of their methodology is followed here. They implemented the Five-Club Concentration Ratio (C5). This is normally used for analysing how much an industry is dominated by the largest five firms, and is calculated by dividing the number of points won by the top five clubs by the total number of points by all clubs in the league. This is measured using the following formula:
International Journal of Business and Management June, 2008
5
∑=
==5
1clubs allby by won points ofnumber totalclubs 5 by top points ofnumber total ratio C5
iiS
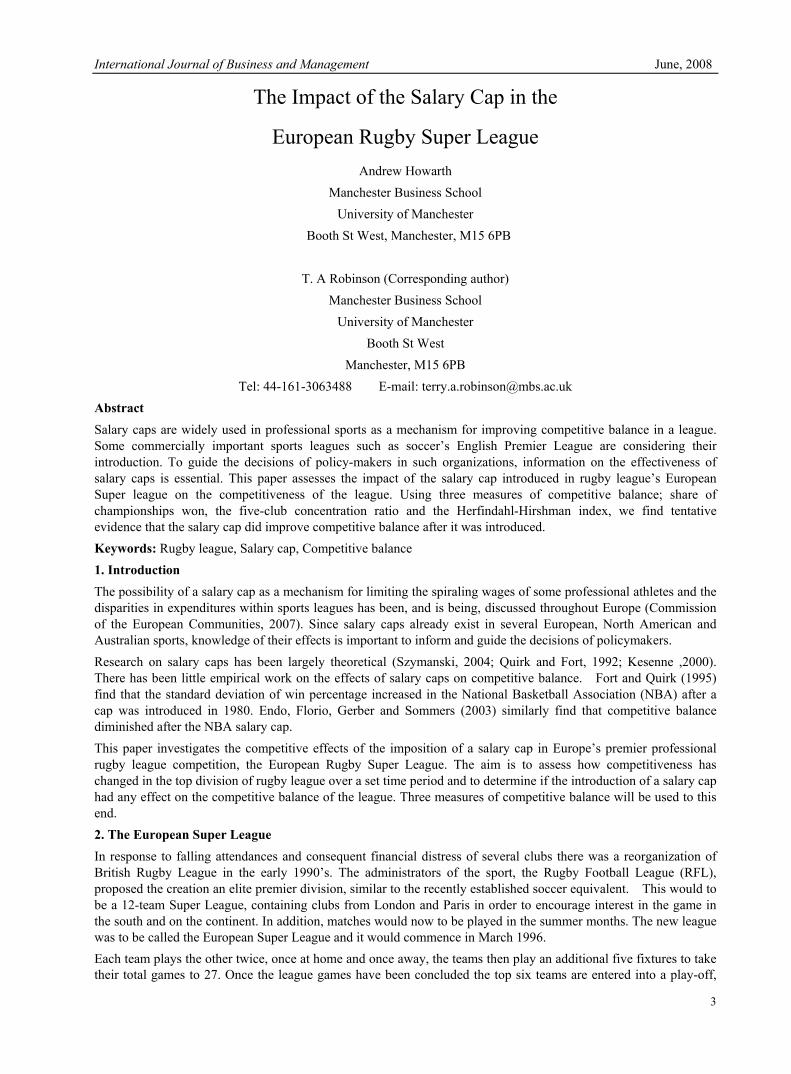
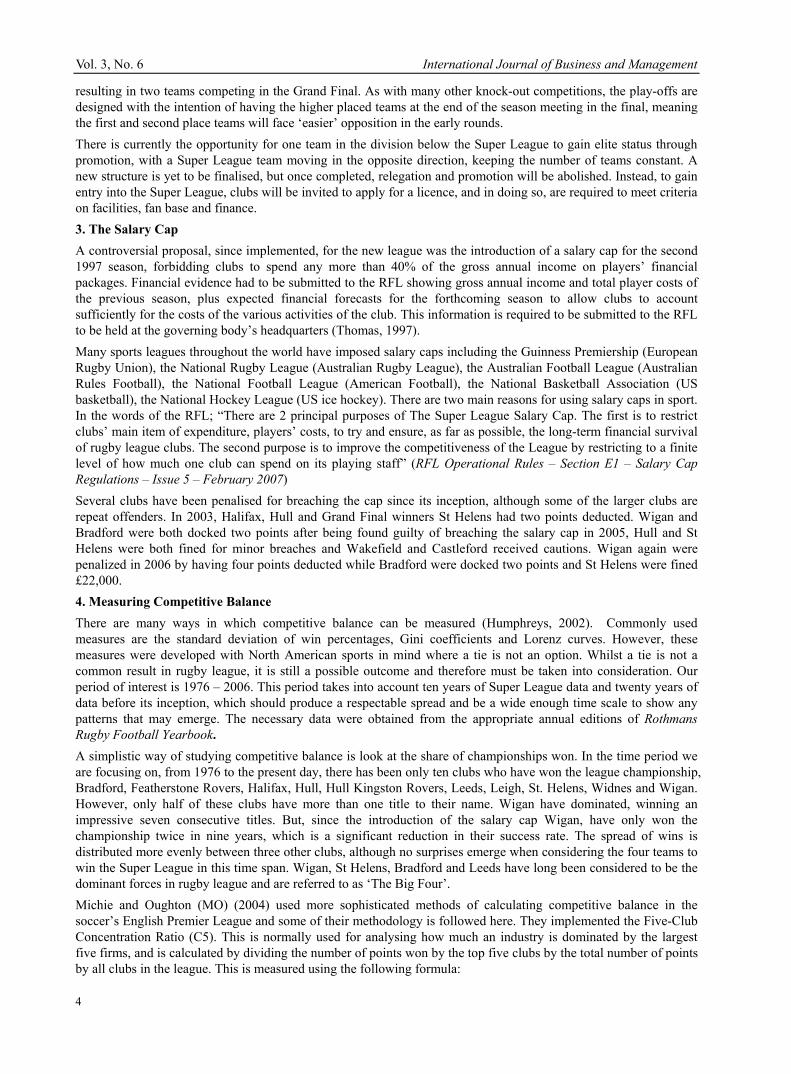
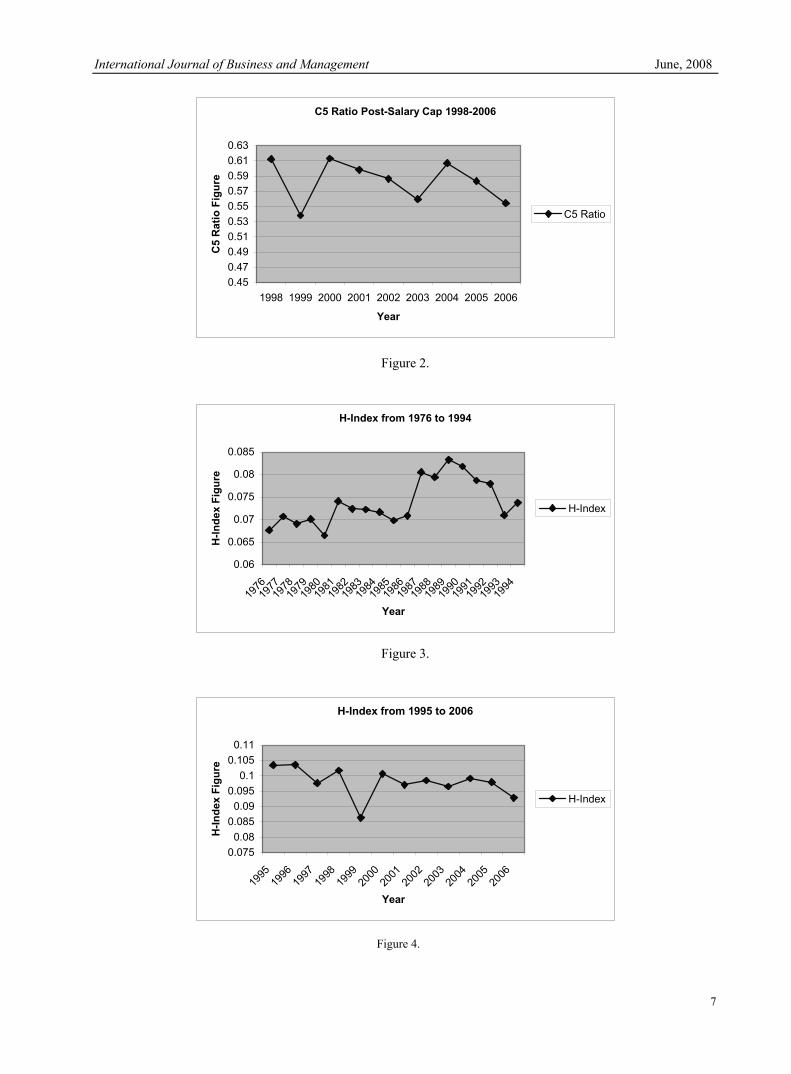
where si is club i’s percentage share of league points. Figures 1 and 2 show the C5 ratio in the time period before the introduction of the salary cap and the period after. It can be seen from the graphs that in the period from 1976 to 1994 the C5 ratio increased slightly, with a 15.4% increase. It is evident that the greatest increase occurred between 1994 and 1995, this was the season before the Super League began; in this year alone there was a 28.4% increase in the five-club concentration ratio. However, it should again be stressed that the number of teams were reduced at this point and this reduction is therefore the likely cause of the leap in the ratio figure. After the introduction of the salary cap up until the most recent completed season, the C5 ratio declines by 9.5%, implying an increase in competitiveness. MO also employ the Herfindahl-Hirshman Index (HHI) which is normally used to measure the inequalities between firms in an industry. When applied to sports, it can be used to measure the inequalities between teams in a league. Having worked out a percentage share of points for each team, this share is then weighted against the average index for the league. The following formula is used:
∑=
=N
iisH
1
2
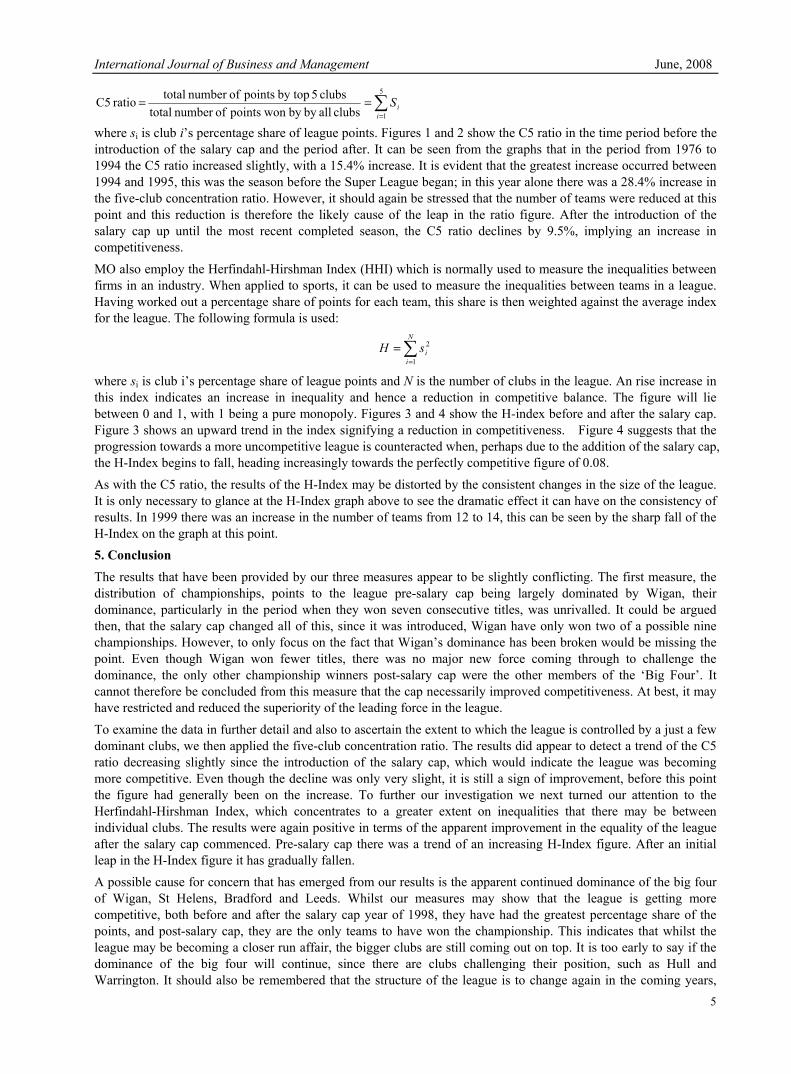
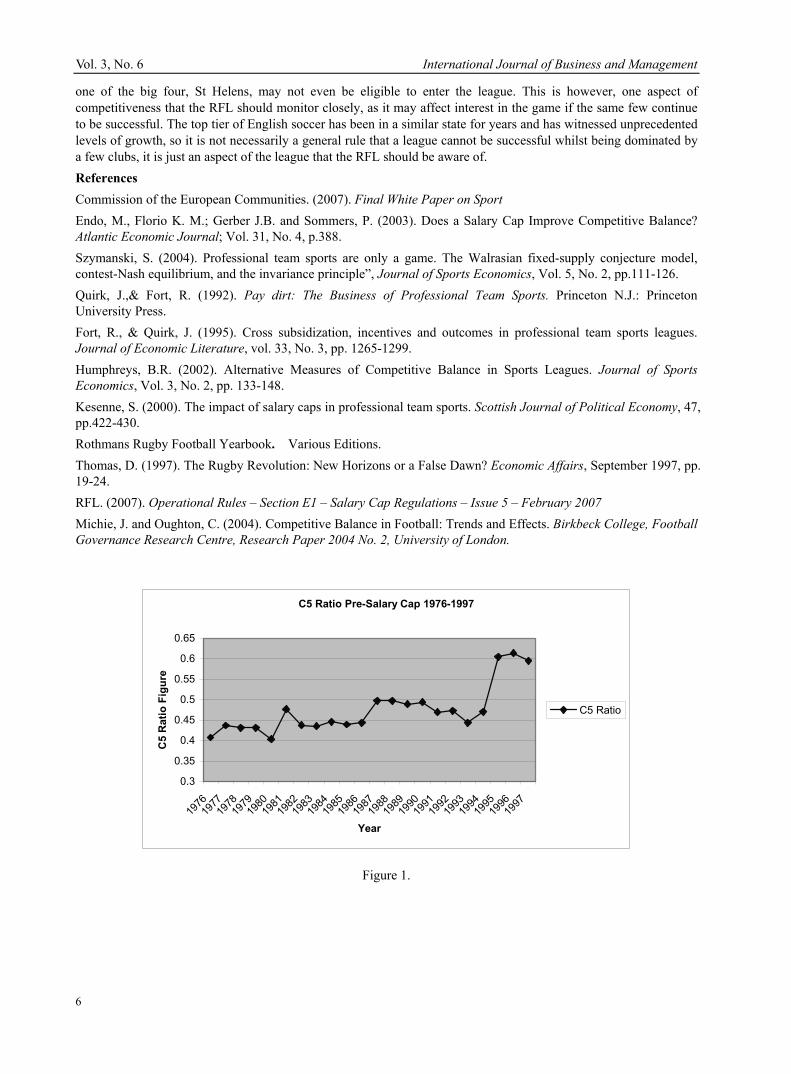
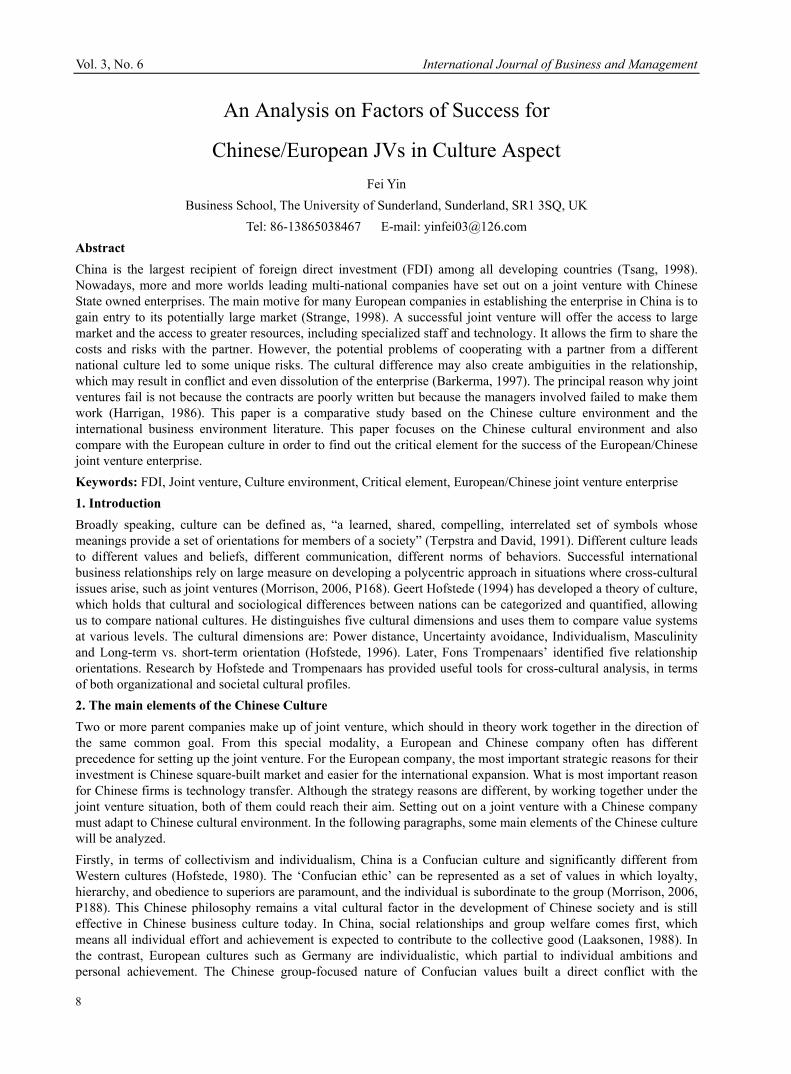
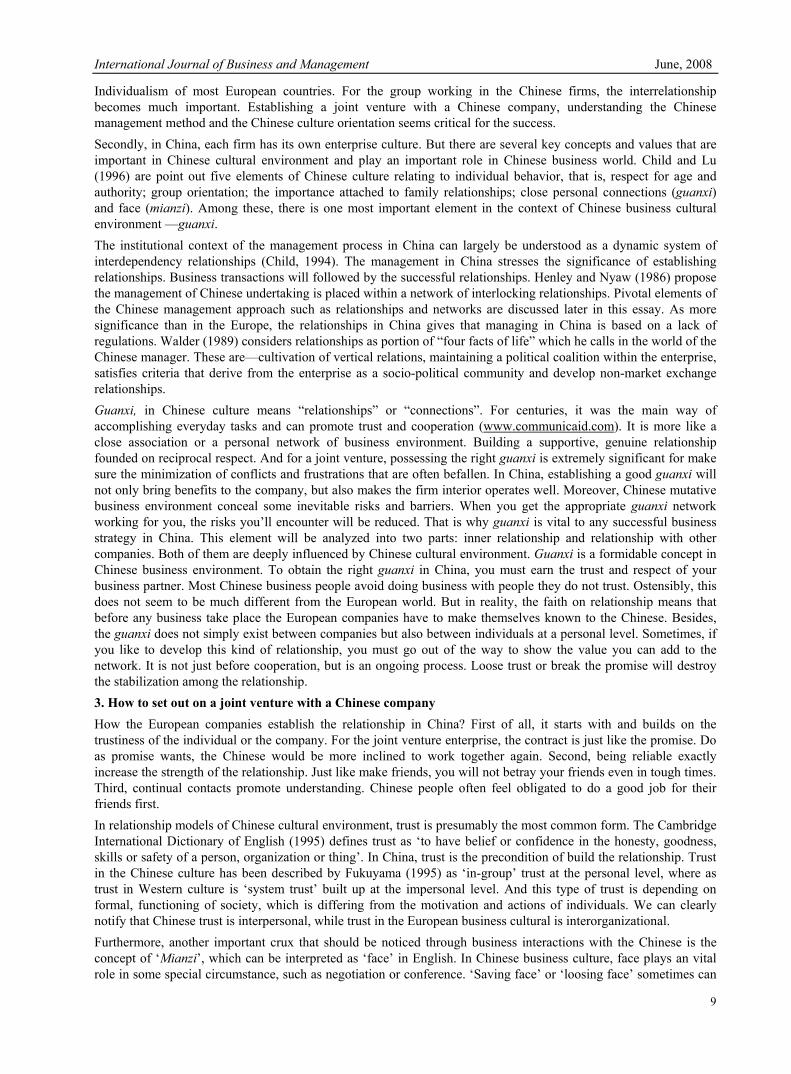
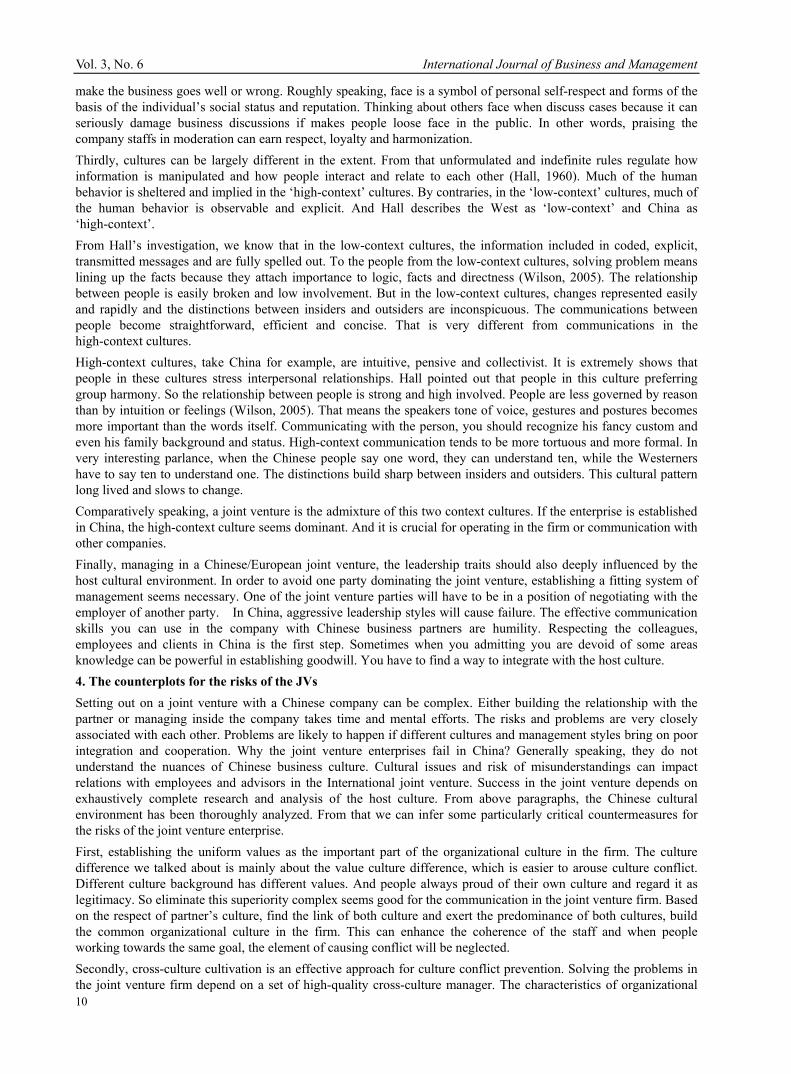
where si is club i’s percentage share of league points and N is the number of clubs in the league. An rise increase in this index indicates an increase in inequality and hence a reduction in competitive balance. The figure will lie between 0 and 1, with 1 being a pure monopoly. Figures 3 and 4 show the H-index before and after the salary cap. Figure 3 shows an upward trend in the index signifying a reduction in competitiveness. Figure 4 suggests that the progression towards a more uncompetitive league is counteracted when, perhaps due to the addition of the salary cap, the H-Index begins to fall, heading increasingly towards the perfectly competitive figure of 0.08. As with the C5 ratio, the results of the H-Index may be distorted by the consistent changes in the size of the league. It is only necessary to glance at the H-Index graph above to see the dramatic effect it can have on the consistency of results. In 1999 there was an increase in the number of teams from 12 to 14, this can be seen by the sharp fall of the H-Index on the graph at this point. 5. Conclusion The results that have been provided by our three measures appear to be slightly conflicting. The first measure, the distribution of championships, points to the league pre-salary cap being largely dominated by Wigan, their dominance, particularly in the period when they won seven consecutive titles, was unrivalled. It could be argued then, that the salary cap changed all of this, since it was introduced, Wigan have only won two of a possible nine championships. However, to only focus on the fact that Wigan’s dominance has been broken would be missing the point. Even though Wigan won fewer titles, there was no major new force coming through to challenge the dominance, the only other championship winners post-salary cap were the other members of the ‘Big Four’. It cannot therefore be concluded from this measure that the cap necessarily improved competitiveness. At best, it may have restricted and reduced the superiority of the leading force in the league. To examine the data in further detail and also to ascertain the extent to which the league is controlled by a just a few dominant clubs, we then applied the five-club concentration ratio. The results did appear to detect a trend of the C5 ratio decreasing slightly since the introduction of the salary cap, which would indicate the league was becoming more competitive. Even though the decline was only very slight, it is still a sign of improvement, before this point the figure had generally been on the increase. To further our investigation we next turned our attention to the Herfindahl-Hirshman Index, which concentrates to a greater extent on inequalities that there may be between individual clubs. The results were again positive in terms of the apparent improvement in the equality of the league after the salary cap commenced. Pre-salary cap there was a trend of an increasing H-Index figure. After an initial leap in the H-Index figure it has gradually fallen. A possible cause for concern that has emerged from our results is the apparent continued dominance of the big four of Wigan, St Helens, Bradford and Leeds. Whilst our measures may show that the league is getting more competitive, both before and after the salary cap year of 1998, they have had the greatest percentage share of the points, and post-salary cap, they are the only teams to have won the championship. This indicates that whilst the league may be becoming a closer run affair, the bigger clubs are still coming out on top. It is too early to say if the dominance of the big four will continue, since there are clubs challenging their position, such as Hull and Warrington. It should also be remembered that the structure of the league is to change again in the coming years,
Vol. 3, No. 6 International Journal of Business and Management
6
one of the big four, St Helens, may not even be eligible to enter the league. This is however, one aspect of competitiveness that the RFL should monitor closely, as it may affect interest in the game if the same few continue to be successful. The top tier of English soccer has been in a similar state for years and has witnessed unprecedented levels of growth, so it is not necessarily a general rule that a league cannot be successful whilst being dominated by a few clubs, it is just an aspect of the league that the RFL should be aware of. References Commission of the European Communities. (2007). Final White Paper on Sport Endo, M., Florio K. M.; Gerber J.B. and Sommers, P. (2003). Does a Salary Cap Improve Competitive Balance? Atlantic Economic Journal; Vol. 31, No. 4, p.388. Szymanski, S. (2004). Professional team sports are only a game. The Walrasian fixed-supply conjecture model, contest-Nash equilibrium, and the invariance principle”, Journal of Sports Economics, Vol. 5, No. 2, pp.111-126. Quirk, J.,& Fort, R. (1992). Pay dirt: The Business of Professional Team Sports. Princeton N.J.: Princeton University Press. Fort, R., & Quirk, J. (1995). Cross subsidization, incentives and outcomes in professional team sports leagues. Journal of Economic Literature, vol. 33, No. 3, pp. 1265-1299. Humphreys, B.R. (2002). Alternative Measures of Competitive Balance in Sports Leagues. Journal of Sports Economics, Vol. 3, No. 2, pp. 133-148. Kesenne, S. (2000). The impact of salary caps in professional team sports. Scottish Journal of Political Economy, 47, pp.422-430. Rothmans Rugby Football Yearbook. Various Editions. Thomas, D. (1997). The Rugby Revolution: New Horizons or a False Dawn? Economic Affairs, September 1997, pp. 19-24. RFL. (2007). Operational Rules – Section E1 – Salary Cap Regulations – Issue 5 – February 2007 Michie, J. and Oughton, C. (2004). Competitive Balance in Football: Trends and Effects. Birkbeck College, Football Governance Research Centre, Research Paper 2004 No. 2, University of London.
C5 Ratio Pre-Salary Cap 1976-1997
0.3
0.35
0.4
0.45
0.5
0.55
0.6
0.65
1976
1977
1978
1979
1980
1981
1982
1983
1984
1985
1986
1987
1988
1989
1990
1991
1992
1993
1994
1995
1996
1997
Year
C5
Rat
io F
igur
e
C5 Ratio
Figure 1.
International Journal of Business and Management June, 2008
7
C5 Ratio Post-Salary Cap 1998-2006
0.450.470.490.510.530.550.570.590.610.63
1998 1999 2000 2001 2002 2003 2004 2005 2006
Year
C5
Rat
io F
igur
eC5 Ratio
Figure 2.
H-Index from 1976 to 1994
0.06
0.065
0.07
0.075
0.08
0.085
197619
7719
7819
7919
8019
8119
8219
8319
8419
8519
8619
8719
8819
8919
9019
9119
9219
9319
94
Year
H-In
dex
Figu
re
H-Index
Figure 3.
H-Index from 1995 to 2006
0.0750.08
0.0850.09
0.0950.1
0.1050.11
1995
1996
1997
1998
1999
2000
2001
2002
2003
2004
2005
2006
Year
H-In
dex
Figu
re
H-Index
Figure 4.
Vol. 3, No. 6 International Journal of Business and Management
8
An Analysis on Factors of Success for
Chinese/European JVs in Culture Aspect Fei Yin
Business School, The University of Sunderland, Sunderland, SR1 3SQ, UK Tel: 86-13865038467 E-mail: [email protected]
Abstract China is the largest recipient of foreign direct investment (FDI) among all developing countries (Tsang, 1998). Nowadays, more and more worlds leading multi-national companies have set out on a joint venture with Chinese State owned enterprises. The main motive for many European companies in establishing the enterprise in China is to gain entry to its potentially large market (Strange, 1998). A successful joint venture will offer the access to large market and the access to greater resources, including specialized staff and technology. It allows the firm to share the costs and risks with the partner. However, the potential problems of cooperating with a partner from a different national culture led to some unique risks. The cultural difference may also create ambiguities in the relationship, which may result in conflict and even dissolution of the enterprise (Barkerma, 1997). The principal reason why joint ventures fail is not because the contracts are poorly written but because the managers involved failed to make them work (Harrigan, 1986). This paper is a comparative study based on the Chinese culture environment and the international business environment literature. This paper focuses on the Chinese cultural environment and also compare with the European culture in order to find out the critical element for the success of the European/Chinese joint venture enterprise. Keywords: FDI, Joint venture, Culture environment, Critical element, European/Chinese joint venture enterprise 1. Introduction Broadly speaking, culture can be defined as, “a learned, shared, compelling, interrelated set of symbols whose meanings provide a set of orientations for members of a society” (Terpstra and David, 1991). Different culture leads to different values and beliefs, different communication, different norms of behaviors. Successful international business relationships rely on large measure on developing a polycentric approach in situations where cross-cultural issues arise, such as joint ventures (Morrison, 2006, P168). Geert Hofstede (1994) has developed a theory of culture, which holds that cultural and sociological differences between nations can be categorized and quantified, allowing us to compare national cultures. He distinguishes five cultural dimensions and uses them to compare value systems at various levels. The cultural dimensions are: Power distance, Uncertainty avoidance, Individualism, Masculinity and Long-term vs. short-term orientation (Hofstede, 1996). Later, Fons Trompenaars’ identified five relationship orientations. Research by Hofstede and Trompenaars has provided useful tools for cross-cultural analysis, in terms of both organizational and societal cultural profiles. 2. The main elements of the Chinese Culture Two or more parent companies make up of joint venture, which should in theory work together in the direction of the same common goal. From this special modality, a European and Chinese company often has different precedence for setting up the joint venture. For the European company, the most important strategic reasons for their investment is Chinese square-built market and easier for the international expansion. What is most important reason for Chinese firms is technology transfer. Although the strategy reasons are different, by working together under the joint venture situation, both of them could reach their aim. Setting out on a joint venture with a Chinese company must adapt to Chinese cultural environment. In the following paragraphs, some main elements of the Chinese culture will be analyzed. Firstly, in terms of collectivism and individualism, China is a Confucian culture and significantly different from Western cultures (Hofstede, 1980). The ‘Confucian ethic’ can be represented as a set of values in which loyalty, hierarchy, and obedience to superiors are paramount, and the individual is subordinate to the group (Morrison, 2006, P188). This Chinese philosophy remains a vital cultural factor in the development of Chinese society and is still effective in Chinese business culture today. In China, social relationships and group welfare comes first, which means all individual effort and achievement is expected to contribute to the collective good (Laaksonen, 1988). In the contrast, European cultures such as Germany are individualistic, which partial to individual ambitions and personal achievement. The Chinese group-focused nature of Confucian values built a direct conflict with the
International Journal of Business and Management June, 2008
9
Individualism of most European countries. For the group working in the Chinese firms, the interrelationship becomes much important. Establishing a joint venture with a Chinese company, understanding the Chinese management method and the Chinese culture orientation seems critical for the success. Secondly, in China, each firm has its own enterprise culture. But there are several key concepts and values that are important in Chinese cultural environment and play an important role in Chinese business world. Child and Lu (1996) are point out five elements of Chinese culture relating to individual behavior, that is, respect for age and authority; group orientation; the importance attached to family relationships; close personal connections (guanxi) and face (mianzi). Among these, there is one most important element in the context of Chinese business cultural environment —guanxi. The institutional context of the management process in China can largely be understood as a dynamic system of interdependency relationships (Child, 1994). The management in China stresses the significance of establishing relationships. Business transactions will followed by the successful relationships. Henley and Nyaw (1986) propose the management of Chinese undertaking is placed within a network of interlocking relationships. Pivotal elements of the Chinese management approach such as relationships and networks are discussed later in this essay. As more significance than in the Europe, the relationships in China gives that managing in China is based on a lack of regulations. Walder (1989) considers relationships as portion of “four facts of life” which he calls in the world of the Chinese manager. These are—cultivation of vertical relations, maintaining a political coalition within the enterprise, satisfies criteria that derive from the enterprise as a socio-political community and develop non-market exchange relationships. Guanxi, in Chinese culture means “relationships” or “connections”. For centuries, it was the main way of accomplishing everyday tasks and can promote trust and cooperation (www.communicaid.com). It is more like a close association or a personal network of business environment. Building a supportive, genuine relationship founded on reciprocal respect. And for a joint venture, possessing the right guanxi is extremely significant for make sure the minimization of conflicts and frustrations that are often befallen. In China, establishing a good guanxi will not only bring benefits to the company, but also makes the firm interior operates well. Moreover, Chinese mutative business environment conceal some inevitable risks and barriers. When you get the appropriate guanxi network working for you, the risks you’ll encounter will be reduced. That is why guanxi is vital to any successful business strategy in China. This element will be analyzed into two parts: inner relationship and relationship with other companies. Both of them are deeply influenced by Chinese cultural environment. Guanxi is a formidable concept in Chinese business environment. To obtain the right guanxi in China, you must earn the trust and respect of your business partner. Most Chinese business people avoid doing business with people they do not trust. Ostensibly, this does not seem to be much different from the European world. But in reality, the faith on relationship means that before any business take place the European companies have to make themselves known to the Chinese. Besides, the guanxi does not simply exist between companies but also between individuals at a personal level. Sometimes, if you like to develop this kind of relationship, you must go out of the way to show the value you can add to the network. It is not just before cooperation, but is an ongoing process. Loose trust or break the promise will destroy the stabilization among the relationship. 3. How to set out on a joint venture with a Chinese company How the European companies establish the relationship in China? First of all, it starts with and builds on the trustiness of the individual or the company. For the joint venture enterprise, the contract is just like the promise. Do as promise wants, the Chinese would be more inclined to work together again. Second, being reliable exactly increase the strength of the relationship. Just like make friends, you will not betray your friends even in tough times. Third, continual contacts promote understanding. Chinese people often feel obligated to do a good job for their friends first. In relationship models of Chinese cultural environment, trust is presumably the most common form. The Cambridge International Dictionary of English (1995) defines trust as ‘to have belief or confidence in the honesty, goodness, skills or safety of a person, organization or thing’. In China, trust is the precondition of build the relationship. Trust in the Chinese culture has been described by Fukuyama (1995) as ‘in-group’ trust at the personal level, where as trust in Western culture is ‘system trust’ built up at the impersonal level. And this type of trust is depending on formal, functioning of society, which is differing from the motivation and actions of individuals. We can clearly notify that Chinese trust is interpersonal, while trust in the European business cultural is interorganizational. Furthermore, another important crux that should be noticed through business interactions with the Chinese is the concept of ‘Mianzi’, which can be interpreted as ‘face’ in English. In Chinese business culture, face plays an vital role in some special circumstance, such as negotiation or conference. ‘Saving face’ or ‘loosing face’ sometimes can
Vol. 3, No. 6 International Journal of Business and Management
10
make the business goes well or wrong. Roughly speaking, face is a symbol of personal self-respect and forms of the basis of the individual’s social status and reputation. Thinking about others face when discuss cases because it can seriously damage business discussions if makes people loose face in the public. In other words, praising the company staffs in moderation can earn respect, loyalty and harmonization. Thirdly, cultures can be largely different in the extent. From that unformulated and indefinite rules regulate how information is manipulated and how people interact and relate to each other (Hall, 1960). Much of the human behavior is sheltered and implied in the ‘high-context’ cultures. By contraries, in the ‘low-context’ cultures, much of the human behavior is observable and explicit. And Hall describes the West as ‘low-context’ and China as ‘high-context’. From Hall’s investigation, we know that in the low-context cultures, the information included in coded, explicit, transmitted messages and are fully spelled out. To the people from the low-context cultures, solving problem means lining up the facts because they attach importance to logic, facts and directness (Wilson, 2005). The relationship between people is easily broken and low involvement. But in the low-context cultures, changes represented easily and rapidly and the distinctions between insiders and outsiders are inconspicuous. The communications between people become straightforward, efficient and concise. That is very different from communications in the high-context cultures. High-context cultures, take China for example, are intuitive, pensive and collectivist. It is extremely shows that people in these cultures stress interpersonal relationships. Hall pointed out that people in this culture preferring group harmony. So the relationship between people is strong and high involved. People are less governed by reason than by intuition or feelings (Wilson, 2005). That means the speakers tone of voice, gestures and postures becomes more important than the words itself. Communicating with the person, you should recognize his fancy custom and even his family background and status. High-context communication tends to be more tortuous and more formal. In very interesting parlance, when the Chinese people say one word, they can understand ten, while the Westerners have to say ten to understand one. The distinctions build sharp between insiders and outsiders. This cultural pattern long lived and slows to change. Comparatively speaking, a joint venture is the admixture of this two context cultures. If the enterprise is established in China, the high-context culture seems dominant. And it is crucial for operating in the firm or communication with other companies. Finally, managing in a Chinese/European joint venture, the leadership traits should also deeply influenced by the host cultural environment. In order to avoid one party dominating the joint venture, establishing a fitting system of management seems necessary. One of the joint venture parties will have to be in a position of negotiating with the employer of another party. In China, aggressive leadership styles will cause failure. The effective communication skills you can use in the company with Chinese business partners are humility. Respecting the colleagues, employees and clients in China is the first step. Sometimes when you admitting you are devoid of some areas knowledge can be powerful in establishing goodwill. You have to find a way to integrate with the host culture. 4. The counterplots for the risks of the JVs Setting out on a joint venture with a Chinese company can be complex. Either building the relationship with the partner or managing inside the company takes time and mental efforts. The risks and problems are very closely associated with each other. Problems are likely to happen if different cultures and management styles bring on poor integration and cooperation. Why the joint venture enterprises fail in China? Generally speaking, they do not understand the nuances of Chinese business culture. Cultural issues and risk of misunderstandings can impact relations with employees and advisors in the International joint venture. Success in the joint venture depends on exhaustively complete research and analysis of the host culture. From above paragraphs, the Chinese cultural environment has been thoroughly analyzed. From that we can infer some particularly critical countermeasures for the risks of the joint venture enterprise. First, establishing the uniform values as the important part of the organizational culture in the firm. The culture difference we talked about is mainly about the value culture difference, which is easier to arouse culture conflict. Different culture background has different values. And people always proud of their own culture and regard it as legitimacy. So eliminate this superiority complex seems good for the communication in the joint venture firm. Based on the respect of partner’s culture, find the link of both culture and exert the predominance of both cultures, build the common organizational culture in the firm. This can enhance the coherence of the staff and when people working towards the same goal, the element of causing conflict will be neglected. Secondly, cross-culture cultivation is an effective approach for culture conflict prevention. Solving the problems in the joint venture firm depend on a set of high-quality cross-culture manager. The characteristics of organizational
International Journal of Business and Management June, 2008
11
culture include common language and shared terminology (Morrison, 2006, P195). So the cross-culture cultivation comprises the language cultivation, cultural sensitivity cultivation, cross-culture communication cultivation and cultural adaptability cultivation. Benefit from these cultivations, the staff can intensively understand the culture of the participator. Then they can better involve in the work without disharmony. Thirdly, localization plays a vital role for the joint venture enterprise. This not only means adapted itself to the local policy, but also means adapted itself to the local cultural situation. Chinese big environment include some especial local situations. The success of the joint venture firm also hinges on whether it fits local cultural environment or not. Use long-term partners, with the resulting awareness of cultural issues. The standardization of multinational parent companies and localization of host countries’ practices will make the joint venture firm runs unhindered. At last, the both sides of the joint venture firm should hold the same developmental target. Make sure joint venture members are not only solid on technical grounds but also maintain a great faith of the foreground. The management of the joint venture should insist on transparency and pursue security for member responsibility. 5. Further thought and Conclusion The late president Deng Xiaoping’s statement is a clear indicator to Western companies, be the same with European firms, before entering China you should understand Chinese culture first. Chinese business action is chiefly concerned with social exchange. In the European/Chinese joint venture firm, cultural exchange between parties helps to avoid conflict and misunderstanding. It also adds to the whole relationship and can be accepted as supporting to a long-term relationship. This paper turns the eyes on the corporate culture of the joint venture enterprise. When corporate culture emerged as a typical management concept, lots of ideas and concepts that linked it into the basic notions of how organizations operate successfully and in particular how they operate in the current climate of unpredictable fast-paced change and fierce competition (Fincham and Rhodes, 2005). It is no doubt that culture fosters success, excellence and innovation of the multicultural companies. Joint ventures between European and Chinese companies continue to experience high rate of failure. From the above analysis, lack of understanding of each other’s manner of business practice can lead to conflict between firms. This paper has examined key elements and discusses the conceivable risks of the Chinese cultural environment, which maybe vital for the success of the joint venture enterprise. However, distinguishing European firms will face with different circumstance. What is clear is that the interaction of the both sides culture occupies a significant status in the business world. We believe that in order to setting out on a joint venture in the Chinese business environment, cross-cultural research needs to take in culture as the actor bonds layer part. Chinese business environment is daedal but deeply based on the cultural environment, which steady continued for centuries. Times are in progress and culture is updating, so research in this aspect will never stop. References Barkema, Harry G., Shenkar, O., Vermeulen, F. and Bell, John H.J. (Apr.,1997). Special Research Forum on Alliances and Networks, The Academy of Management Journal, Vol.40 No.2, pp. 426-442 Cambridge International Dictionary of English (1995), Cambridge, Cambridge University Press. Child, J and Yuan, Lu. eds. (1996). Management issues in China, New York, Routledge. Child, J. (1994). Management in China during the age of reform, Cambridge, Cambridge University Press. Fukuyama, F. (1995). Trust: The social virtues and the creation of prosperity, London, Hamish Hamilton. Fincham, R. and Rhodes, P., (2005), Principles of Organizational Behaviour, Great Clarendon Street, Oxford. Hall, E.T. (1960). The silent language of overseas business, Harvard Business Review, May-June, pp.88-96. Hofstede, G. (1980). Cultures consequences: National Differences in Thinking and organising, Beverly Hills, CA, Sage Press. Harrigan, K.R. ed. (1986). Managing for joint venture success, Lexington, MA, Lexington Books. Henley, J.S. and Nyaw, M.K. (1986). Introducing market forces into managerial decision making in Chinese industrial enterprises, Journal of Management Studies, 23: pp. 635-56. Hofstede, G., (1994). Cultures and Organizations: Software of the Mind, London: HarperCollins. Hofstede, G., (1996). ‘Images of Europe: past, present and future’ in Joynt, P. and Warner, M. ed, Managing Across Cultures: Issues and Perspectives (London: International Thomson Business press), pp. 147-65. Laaksonen, O. (1988). Management in China during and after Mao: Enterprises, government and party, Berlin, Walter de Gruyter.
Vol. 3, No. 6 International Journal of Business and Management
12
Morrison, J. (2006). The International Business Environment, Palgrave, Second Edition. Strange, R. ed. (1998). Management in China: the experience of foreign businesses, London, Frank Cass Publishers. Terpstra,V. and David, K. (1991). The Cultural Environment of International Business, Cincinnati: South-Western Publishing Co. . Tsang, E.W.K. (1998). Foreign Direct Investment in China: A consideration of some strategic options, Journal of General management, vol.24 No.1. Walder, A. (1989).Factory and Manager in an era of reform, The China Quarterly, no.118 pp.242-264. Business Link [Online] Available:http://www.businesslink.gov.uk/bdotg/action/detail?type=Resources&itemI d=1075411648 (December 29, 2007) Communicaid [Online] Available: http://www.communicaid.com (January3, 2008) Wilson, B. (2005), High-context and Low-context Culture Styles. [Online] Available: http://www.marin.cc.ca.us/buscom/index_files/page0009.htm (January 3, 2008) Wilson, J. and Brennan, R. (2001), Managing Chinese/Western Joint Ventures: A Comparative Analysis of the ‘Interaction and Networks’ and ‘Chinese Management’ Literature. [Online] Available: http://web.bi.no/forskning/imp2001papers.nsf/38aab1bcd5118c1bc1256ab7003d9a1a/d965a8fb5a9d636bc1256aae006e5081/$FILE/wilson_brennan.PDF (December 20, 2007)
International Journal of Business and Management June, 2008
13
Study on the Synergy of Information Technology
Innovation and Marketing Innovation for Commercial Banks Xin Li
School of Business, Nankai University, Tianjin 300071, China Abstract The competition among commercial banks is increasingly drastic, and the marketing innovation has been one of important strategic choices to make banks win in the market. At the same time, with gradual deepening of bank informationization, the information technology is gradually infiltrating into various innovation activities of the bank and becoming into the new headspring to realize innovation for the commercial bank. This article put forward the synergy between information technology innovation and the marketing innovation for commercial banks, analyzes key factors to realize both synergistic effect, and opens out both mutual relationships in the innovation activity. Keywords: Commercial banks, Information technology innovation, Marketing innovation, Synergistic effect 1. Introduction The marketing is the root of survival for the commercial bank and the important measure leading the value direction of the bank service. To promote the marketing innovation is not only the necessary requirement to enhance the nuclear competition of the commercial banks, but also the essential guarantee to make the commercial banks step into the golden time of “service first”. However, with the quick development of information and network technology, every part of modern bank can not leave information technology, and the continual innovation and infiltration of information technology drive the enhancements of the whole management decision efficiency and comprehensive management level of commercial banks, and gradually bring along the optimization of operation system of commercial banks. Under this background, it possesses practical meanings to discuss the combined development of marketing innovation with information technology innovation. 2. The concept of synergy between the information technology innovation and the marketing innovation for commercial banks The information technology innovation and the marketing innovation are two important subsystems in the innovation system of commercial banks. On the one hand, the marketing innovation puts forward new requirement for the information technology on the applied layer, and it promotes the information technology continual mature and perfect whether for the foundation technology principle or for the top applied level and drives the innovation of information technology. On the other hand, the innovation of information technology provides increasingly mature information management platform, decision data and service marketing innovation, and the advancement of information security technology offers powerful guarantee for the transformation of marketing production. Both reciprocities are non-linear and complex, and to realize the innovation development of commercial banks together is the typical synergy. 3. The principal part of implementation of synergistic effect between the information technology innovation and the marketing innovation for commercial banks The object of marketing innovation is the new product, service and marketing technology that banks offer to the market. The object of information technology innovation is new technology, and the intention of whole activity is to devote new technology into the core of the bank, i.e. the marketing activity. The premise that both sides implement synergy is that their aims must be coherent. And the coherent aim is the maximization of payoff for commercial bank. The combination of both sides not only can make them produce better effect in their own dimensions, but also can bring the effect of “1+1>2”. In the relationship, the marketing is the final intention, and the innovation of information technology is means and approach. So to implement the synergistic effect between the marketing innovation and the information technology innovation, the “new technology” produced by the information technology innovation is firstly utilized in the marketing innovation and produce “new product” or “new service” and make the new product and service produce increment of economical benefit. So the main body of the implementation of the synergistic effect is the “new product” and “new service” which utilizes “new technology”. To better combine “new technology” with “new product” or “new service”, we must see the essential through the phenomena to find out which innovational factors will produce synergistic effect in these two innovational activities. According to the principle from macro view to microcosmic view, this article summarizes the pivotally synergistic factors of the information technology innovation and the marketing innovation for commercial banks.
Vol. 3, No. 6 International Journal of Business and Management
14
4. The synergy of encouragement effect between the information technology innovation and the marketing innovation for commercial banks The commercial banks have strong power to implement marketing innovation and information technology innovation, which is presented in following aspects. (1) The encouragement of other financial institution. The quick development of information technology makes the efficiency that other financial institutions utilize technology innovation to expedite capital flow continually enhanced, promotes the capital of the market gradually flush, and the banks must actively research, develop and explore new technology of market demand to control capital shunting and solidify the status of traditional banks. (2) The encouragement of non-bank enterprise. Informationization extends the financial market and reduces the entry bulwark, and non-bank enterprises also utilize the innovation concept of information technology to implement network financial services such as the financing services based on electric business pushed by General Electron, General Auto, Toyota and other large-sized transnational companies. (3) The encouragement of foreign banks to domestic banks. After entering into WTO, depending on the information and network technology, foreign banks utilize advanced products and services to impact domestic bank industry and introduce impetus to the innovation of domestic banks at the same time. (4) Mutual encouragements among domestic banks. In order to stabilize their own markets, domestic banks should actively develop information technology and distribution channels, and optimize the product combination, which expedites the step of their own marketing innovation and information technology innovation. Above four sorts of innovation power forms interlink effect and brings synergistic function though mutual influences, which are the impetus headspring of various innovations for commercial banks. 5. The synergy of idea between the information technology innovation and the marketing innovation for commercial banks The transformation and innovation of the concept is the root of innovation. The marketing concept of China commercial banks is transforming from “product oriented” to “customer oriented”. The traditional marketing mode is only to continually develop products which can bring profits for the bank and classify the customer groups according to different product sorts, which can not fulfill customers’ individual demands and make customers passively accept their unnecessary products and services, so customers will loathe the bank and reduce their loyalties to the bank. The concept of “customer oriented” is just to change this actuality, and let bank to actively form good reciprocity. On the one hand, the bank needs “studying”, i.e. finding customer demand and designing corresponding product and service completely, exactly and timely through the collection of information technology and integrated customer information. On the other hand, because customers’ decisions are decided by understandings, to transfer “new product” and “new service” to customers, banks need utilizing advanced information technologies such as cartoon simulation, network advertisement and telephone marketing to let customers deeply understand products and services. The leading idea of information technology development is transforming from “account oriented” to “customer oriented” for commercial banks. Traditional leading idea is only to take the information technology as a sort of record tool, which objectively records data and replaces paper and pen. With the transformation of concept, the information system technology begins to exert large function to the marketing of the bank, and it can not only offer the answers of the problem that “what customers we have, what products they need, what products we develop, and how we transfer them to customers” to help marketing, but also can participate marketing innovation by different formations such as continually innovational informationization product and informationization channel. The synergy of innovational concepts will make the information technology innovation and the marketing innovation healthily develop to the coherent aim for commercial banks. 6. The synergy of organization between the information technology innovation and the marketing innovation for commercial banks The transformation of management concept makes commercial banks urgently want to establish the organization system supporting their new concepts to enhance the market competition. China commercial banks simulated the layer system of “head office- branch- sub branch- outlets” in the past, which had numerous management layers and low efficiency. Afterward, the management concept of “product oriented” and the enterprise division system made that the interior information of the bank could not be favorably communicated and brought inconveniences to customers. Now, the management concept of “customer oriented” makes the bank possess numerous products and services, and the customer classification is more and more deep and delicate, so the organizational innovation of bank is very urgent. With the extensive application of information technology in the management of the bank, the organizational management of the bank is gradually flatting. Through the concentration engineering of the information science and technology system, the bank can establish uniform data center, customer management system, self-contained account trade information system and disaster backup center to put up informationization
International Journal of Business and Management June, 2008
15
platform for the marketing activity, so the “flow bank” emerges as the times require. It not only can realize the responsibility perspicuity, operation standardization, flow standardization of various posts in the interior of the bank, but also can better solve the problems of disunited system and unfavorable data connection induced by business differences and employee distribution differences among sub-branches and regions, and can effectively and reasonably deploy human resources and material resources in the bank and reduce the interior operation costs, and enhance the whole marketing quality and decision efficiency, and largely reduce the cycle of innovation activities such as the information technology innovation and the marketing innovation for the bank. 7. The synergy of core paths between the information technology innovation and the marketing innovation for commercial banks Path one: Deepening the customer relationship management and establishing the decision support system. The customer relationship management is the nuclear content of bank marketing activity, which can offer not only “new technology” to more conveniently approach and understand customers’ demands, but also decision supports of innovation for “new products” and “new service”. The bank needs to establish the customer value evaluation system which classifies customers according to their comprehensive contributions to the bank performance and their potentials of value increase. The bank needs to adopt different marketing strategies to find and realize the good quality customers’ values to maximum extents and increase bank profits from credit operation, credit card, individual financing and other aspects. The bank needs to further improve the uniform platform to associate customers and response customers. The bank needs to offer difference products and services in time aiming at customers’ individual demands, which can strengthen the base of marketing innovation and promote the development of information technology innovation. Therefore, to deepen the route of the customer relationship management can not only gradually integrate bank marketing and information technology management system, enhance the performance of the marketing and information technology innovation, but also improve other innovation activities for commercial banks. Path two: Developing informationization marketing. The quick developments of modern internet networking technology, communication technology and information system management technology create the information transmission mode which has many characters such as numerous customers, quick speed, without time and geographic limits, highly equal information and flexible interaction and feedback system. When commercial banks select this innovation path, they can realize customers’ demands to services such as deposit, withdrawal and credit card, and the anticipated designs of soft products, implement information transmission among customers and lead them to select or put forward more demand information. The informationization marketing breaks the situation that traditional banks largely invest to contest outlets occupation, infinitely extends the distribution channels for the bank, provides “3A (anytime, anywhere, anyhow)” service to customers, and reduce the trade costs for commercial banks to some certain extent. The path of informationization marketing breaks the technical measure of traditional commercial banks, provides visual clues for the standard service, which can make customers identify bank brand, service concept, service quality and level and enhance depositors and customers’ loyalties. Path three: The innovation of risk management technology. The typical “new technology” has important function for the security of marketing information. With large uses of information technology in the products, services and channels innovation of commercial banks, and because of the dummy and opening of computer network and communication network, they will bring risks to customers and bank. The customers’ risks are mainly the credit risks and information security risks, and the commercial banks can enhance the brand influences and customers’ loyalties through the construction of the brand. At the same time, the bank also should strengthen the customer information security management and ensure the security of individual information. The risks of bank mainly come from management risks, credit risks and operation risks. Foreign commercial banks have reduced the operation risks through the risk management software, but for commercial banks in China, how to collect data and establish the risk evaluation model and index system will become into the focus of innovation. To credit risks and operation risks, through some domestic banks have adopted some measures such as “2nd generation ID card networking identification system” and real name system to reduce risks, but the management systems of various commercial banks are not uniform, and the customer credit information base is relatively independent, so to solve the problem radically, the bank needs to further innovate the information technology. 8. The synergy of human resource between the information technology innovation and the marketing innovation for commercial banks The main body of innovation is commercial bank, but the executor is human, so the synergy of both innovations is the synergy of human resource. The “new technology” is not the blind result from the information technology department or simple “bring- it- here- ism” any more, and it must start from the character of the bank to fulfill the demand of marketing innovation. “New product” and “new technology” are more and more taking the understanding
Vol. 3, No. 6 International Journal of Business and Management
16
and exertion of information technology as the premise. To better combine both sides, the bank must promote the integration of the information technology department and the operation department, and change the original orientation that the information technology department is service department and consumption department, and upgrade this department to the strategic altitude of science and technology marketing and make it become into the cooperator of the marketing department. At the same time, it is the important task to foster some integrated talents of “technology- operation” who not only understand the information technology but also know well bank operation through the method of post exchanging. 9. Conclusions With the development of the time, the challenges faced by China commercial banks are larger and larger, and the former method that only passively receives depositors’ savings and loan to enterprises and institutions needed to interest differences can not fulfill the requirement of survival and development of the bank. The modern commercial banks should actively win more customers’ favor and obtain more profit resources by the innovational thinking and measures. Through clearing up the correlations between marketing innovation and information technology innovation, this article opens out the synergistic mechanism between both sides, and discuss both synergistic factors through five aspects including innovational encouragement effect, innovation concept, innovation organization, innovation nuclear path and innovation human resource, in order to provide references for the enterprise innovation for China commercial banks. References Chen, Fengji. (2006). Finance Informationization: The Base of Innovation for Commercial Banks. Financial Computer of Hunan. No.6(6). p.2-7. Huanghan. (2003). Two Innovations of Marketing for Commercial Banks: Service Innovation and Brand Innovation. Finance and Economy. No.11. p.49-50. Liao, Yichen. (2002). Enter WTO and the Marketing Innovation of China Commercial Banks. Commercial Time. No.12(234). p.44-45. Pan, Haiying. (2002). On the Business Innovation of Commercial Bank under the Net Environment. Techno economics & Management Research. No.2. p.101-102. Xu, Guozhi. (2002). System Science. Shanghai: Science Technology Education Press.
International Journal of Business and Management June, 2008
17
Study on the Current Capital Management of
China Modern Enterprises Lijie Sha
Tianjin University, Tianjin 250014, China Shandong University of Finance, Jinan 250014, China
Yang Li China Art Research Institute, Jinan 250014, China
Abstract The current capital management of the enterprise mainly includes cash management, accounts receivable management and inventory management. The following methods should be selected to strengthen the current capital management of modern enterprises, which includes reasonably allocating capitals, really enhancing the cash using efficiency, strengthening the accounts receivable management, revitalizing the capital turnover, emphasizing the inventory management and striving for the unification of the inventory cost and the inventory benefit. Keywords: Current capital management, Environment analysis, Mode The capital is the life line of enterprise economic activity. With the development of market economy and the establishment of modern enterprise system, the enterprise capital management has become the core of enterprise management. If there is no current capital, there is no capital recirculation, which can not bring benefit for the enterprise, so the enterprise can not survive even develop. Therefore, the management of the current capital is very important for the enterprise. And the current capital management coming down to purchase, distribution and payment is the most important thing in the whole process of capital management. Generally speaking, the proportion of current capital in the enterprise management capital can achieve 60-70%, even 80%, which realizes the transfer and increment of values through circulation. If problems occur in certain stage of the circulation process, enterprise product may get into half-paralysis or production stopped status, even it will induce the bankruptcy of the enterprise. Therefore, the current capital management of the enterprise is the “bull nose” of the enterprise capital management. 1. Environment analysis of current capital management The environment analysis of current capital management mainly includes the environment analysis of cash management, the environment analysis of accounts receivable management and the environment analysis of inventory management. 1.1 Environment analysis of cash management The key of cash management work rests with the establishment of the cash income and expenses plan. As a sort of important management method, the cash income and expenses plan is disregarded by many enterprises, so a sort of scientific and applied management method is on the shelf in reality. As viewed from interior environment of the enterprise, two aspects restrict the application of the cash income and expenses plan in the enterprise. One aspect is that managers of the enterprise don’t know this sort of management method or ignore this management work. The other aspect is that relative personnel of the enterprise lack the knowledge and skills in this domain. As viewed from exterior environment of the enterprise, at present, the actuality that many enterprises ignore this scientific management method reminds the society, government and social relative departments should strengthen this sort of management consciousness when they organize relative occupation qualification exams. In addition, in relative continual educations about schooling and occupation, they should actively advocate this management method to direct enterprises exert this scientific management measure in practical management activities. 1.2 Environment analysis of accounts receivable management In reality, many enterprises still have blind area in the accounts receivable management. They always only emphasize the claim of bad debts afterwards, but ignore the evaluation of customers’ credit degree in advance. When they negotiate with customers about the credit items, they always lack scientific and reasonable gist. So following results can be conceivable, the enterprises pay meaningless losses, or they give away the time value of the capital, or they can not take back the accounts receivable investment and influence the normal capital turnover, or they lose the market though they win the lawsuit and draw back the capital, or the accounts receivable becomes into the dead debt and all their previous efforts wasted.
Vol. 3, No. 6 International Journal of Business and Management
18
As viewed from interior environment of the enterprises, three aspects restrict that the accounts receivable investment can not be favorably implemented. (1) In the interior of the enterprise, the accounts receivable investment lacks organizational guarantee, even in large-sized enterprises, there are not professional personnel engage this management work. (2) The credit condition has not been regarded as an important management strategy, and enterprises lack scientific plan to it beforehand. (3) The managers of the enterprise lack cognition to the credit policies or ignore these policies. As viewed from the exterior environment of the enterprise, at present, even if enterprises emphasize the establishment and exertion of the credit policies, when they evaluate customers’ credit degrees, enterprises must pay higher costs because corresponding social institutions or departments can not offer corresponding services for them, so enterprises have to give up this important management part. In addition, the government should exert its macro-control function to the market, establish necessary navigation mark for the enterprises running in the commercial sea, publish the asset-liability ratio that the market can endure, and create necessary conditions for safe management of enterprises. At the same time, in the whole social ideology domain, the government should fully advocate the construction of honesty and morality and make them become into extensive civilizations in society. 1.3 Environment analysis of inventory management The key of the inventory management work rests with the exertion of the inventory economy batch model. At present, the main applied factor of this model is the exterior market environment that enterprises are in, especial the development of the logistic market. Developed exterior market environment is the necessary that the model can be applied in the interior of enterprise. In China, the logistic market has not been mature, and the serious unordered status still exists. The logistic market is divided into many parts and various charge departments lack necessary cooperation. The market is short of logistical enterprise standard and classification standard, and many unworthy logistical enterprises compete out of order in the storage and transportation stage of the logistical domain. At the same time, many logistical enterprises have few science and technology contents, and low productivity level. The development of the third party’s logistic market should be another profit headspring and save logistical costs for the enterprise, but the unordered status of the logistical market cannot make the enterprise realize this object, but bring the threat leaking business secret for the enterprise. Under the condition that the market is not developed in China, generally speaking, the inventory in the current capital of the enterprise almost achieves 50%. Thus, the turnover of inventory capital will directly influence the use effect of the current capital. With the development and improvement of the market economy in China, the time of “zero-inventory” must come, and at that time, the occupancy of the current capital will fully reduce and the use effect of the current capital will be fully enhanced. 2. The mode to strengthen current capital management of modern China enterprises The current capital management directly relates to the production and management, even the life and death of the enterprise. Bad current capital management may directly induce the deficiency of enough capital to pay various necessary account payables, and get in the corner without technical repayment ability, even cannot but suspend payment because of difficult payment. Under the condition of market economy, how to strengthen the current capital management for modern China enterprises? Three aspects can be applied. 2.1 Reasonably allocating capitals and really enhancing the cash using efficiency Cash is the most important assets for the enterprise, which is the exchange media that can put in circulation immediately, such as purchasing commodity, goods and services or repaying debts, and it is also the asset which has the strongest fluidity in the enterprise. With the competition of the market, as one of most important assets that enterprise survives its production and management, the fluidity of the cash has been an important index to judge the management effect, variable ability and agility of the enterprise. The main reason that the enterprise stores cash is to fulfill the trading demand, prevention demand and gamble demand. The trading demand means to fulfill the demand of cash payment in daily business. The prevention demand means to store cash to prevent the payment of the backfire. The gamble demand means to store cash for unusual purchase opportunity, such as cheap raw materials. If the enterprise lacks necessary cash, it will not attach itself to the operation expenditure, and many uncommon opportunities may be missed because of deficient cash, and small amount of mature debt also may induce the bankruptcy of the enterprise because of ineffective cash turnover. By contraries, if the enterprise stores excessive cash, it will not obtain profit because the cash can not be put in the turnover, which also may develop corruptions induced by some holds of cash management. Therefore, for the cash management, enterprise should grasp a balance point, i.e. work out choice between the fluidity of the assets and the profit ability to obtain maximum profits. For a long term, because of the influence of economic system, some problems which can not be ignored occur in the cash management, for example, loose management, lacking necessary cash budget management, taking IOU note, taking return goods payment use for the expenditure of the enterprise and employees’ welfares, and even some
International Journal of Business and Management June, 2008
19
enterprises adopt the method that open accounts in several banks to obtain cashes. Just the uncontrol of cash management make large of capital flow outside, which seriously interferes national economy and financial order and works tremendous losses for the country and enterprises. Therefore, to strengthen the cash management, the enterprise must strictly implement financial laws and regulations, supervise layer upon layer and stoutly stop unreasonable expenditures and prevent potential industrial unhealthy tendency. In addition, for the capital using of production and management, enterprise must invest fixed assets when it fulfills the demand of production and management turnover capital, and strictly arrange enough production and management capital according to the national regulation. For the transfer of capital, enterprise must imperfect the interior control system to ensure the safety of the capital transfer, and enterprise can reflect the payment and cash abilities through the establishment of the cash flow table. The enterprise also should find concealed crisis and reflect the cash situation on the deep layer in time. To enhance the using rate of the capital, the securities is a sort of transfer form for the cash of the enterprise, which has strong cash exchange ability and can be changed into cash at any moment, and when the cash is excessive, the enterprise can change it into securities. Under this situation, the securities becomes into the substitution of the cash. 2.2 Strengthening the accounts receivable management and revitalizing the capital turnover The accounts receivable what we say means the fund drew from purchasing enterprises or those enterprises which accept labor or service and other enterprises because of the distributions of product, material and labor or other reasons. It is a sort of capital investing of the enterprise and it is the result of commercial competition. In the day that the market competition is more and more intense, as a sort of marketing measure, an account sale has been gradually regarded by people. The proportion of an account sale amount continually increases, and the receival of the accounts receivable directly influences the capital turnover. For example, the “chain debts” makes enterprise busily deal with loan and payment, and the so-called “bad debts” will make the enterprise lose part current capitals. Therefore, the strengthening of accounts receivable management is imperative under the situation. The corresponding credit system should be established, the effect of an account sale depends on the credit policy of the enterprise, which includes credit term, credit standard and cash discount policy, and the extension of the credit term may increase the sale, which may product good influences or bad influences. When accounts receivable happens, the enterprise should adopt sorts of measures to strive for take back the debt on schedule, prevent the bad debts that may occur, or else, the enterprise will incur loss. That requires enterprise establish corresponding credit system, for example, fully understanding the reputation of the customer, implementing the distribution principle of close quarters and short term, developing contract system to responsible person, returning in term, examining periodically, clearing rewards and punishment, supervising fund return, strictly auditing relative contracts, adopting flexible account policies including for the customer with short overdue term, the enterprise should avoid frequent press to prevent lose this market, and for the customer with long overdue term, the enterprise should continually politely inquire through telephone or letter, and for the customer who may induce bad debts, the enterprise should use specific and strict dictions, and charge to the court necessarily. 2.3 Emphasizing the inventory management and striving for the unification of the inventory cost and the inventory benefit The inventory means the materials stored by the enterprise for the distribution or consumption in the process of production and management, which includes materials and finished products. The effective inventory management can uniform the inventory cost and the inventory benefit. (1) Establishing and perfecting the system of commodity dispatcher and keeping. The enterprise can classify storage products, check and maintain these products periodically to avoid the quality drop of the commodity because of improper storage, and periodically analyze inventory and clean up improper storages. Under the premise of ensuring supply, the enterprise should reduce the inventory amount, reduce inventory capital and enhance the using rate of the capital farthest. (2) Confirming reasonable safe inventory to prevent the loss induced by out of stock and the stop of the supply. The enterprise should store more inventories to deal with urgent demands, which is called safe inventory. These inventories don’t be used usually, and only when the inventory is excessively used or goods are late delivered. The reasonable inventory can reduce losses induced by above reasons to the least degree. (3) Reducing the inventory of the finished products and quickening up the capital turnover. The measures that the enterprise can adopt include ameliorating technology, enhancing productivity, shortening the production period of the finished product, reducing the inventory time, deepening the market investigation, understanding the market, adjusting the production according to the feedback information, abroad attracting and employing talents and pooling the wisdom and efforts of everyone for the products to go to the market and develop wider market.

Vol. 3, No. 6 International Journal of Business and Management
20
References Huang, Jizhong. (2004). Enterprise Capital Management. Economic and Social Development. No.10. Li, Jingchao. (2002). Problems and Countermeasures Existing in Enterprise Capital Managment. Journal of Henan Institute of Financial Management. No.5. Peng, Youbing, Liu, Xuewei & Yue, Congxue. (2004). Analysis of Problems and Solutions in Enterprise Capital Management. Journal of the Party University of Shijiazhuang City Committee of CPC. No.12. Wang, Hongquan. (2002). Strengthening Enterprise Capital Management and Enhancing Capital Use Benefit. Industrial Technology & Economy. No.2. Xiaoyi & Chen, Yufang. (2005). Analysis of the Mode of Corporate Current Capital Management. Market Modernization. No.27.
International Journal of Business and Management June, 2008
21
Stats for the Terrified: Impact of Different Teaching & Learning
Approaches in the Study of Business Statistics Guru Prakash Prabhakar Bristol Business School
University of the West of England Coldharbour Lane, Frenchay Campus
Bristol- BS16 1QY, UK Tel: 44-117-328-3461 E-mail: [email protected]
Abstract Many students have a fear of studying Statistics & Mathematics. The objective of this study is to highlight the methods that could help students to improve the learning of Business Statistics. This paper could also provide a useful input for teachers who can benefit from knowing what methods improve student learning of Business Statistics based on the personal background of students (for e.g. whether they had studied Statistics before, whether they use Statistics in their jobs etc.) and their preferences. This research work also documents the comparison of how teaching and learning methods differ in reality and in preference when students had studied statistics in past and when they had not attended any course of Statistics in the past. The empirical analysis in this research is based on the data collected from 81 correspondents who are registered in a part time course in MBA or in MA (HRM). Keywords: Statistics education, Teaching methods, Anxiety 1. Introduction Mathematics and statistics are widely recognised as two of the most important subjects in the university curriculum (Orton, 1987). It is commonly believed that customary methods of teaching statistics to students are not very effective (Yilmaz 1996). Statistics as a discipline is an offshoot of Mathematics and has existed for many centuries. In schools and in universities it continues to be one of the subjects which are often considered to be difficult by students who try to avoid it. Statistical concepts are sometimes complex, abstract and involve laborious computations. Drawing on Ramsden (1992), the paper argues for an approach to teaching and learning statistics in ways that are linked to students’ experiences of the world is more tractable to many students (see also, Peiris and Peseta (2004)). There are umpteen numbers of factors affecting performance level of students in Statistics. An important factor that seems to be important is anxiety. Many research studies show that anxiety affect performance (e.g., Leon & Revelle, 1985; MacLeod & Donnellan, 1993; Sorg & Whitney, 1992). Miller and Bichsel (2004) surveyed 100 adults that varied in age (18-66) and education levels (high school degrees to college graduates). The participants were tested for 1-2 hours on five measures: math performance, math anxiety, state-trait anxiety (state anxiety can vary over time and in different situations but trait anxiety is relatively stable), verbal working memory, and visual working memory. Math anxiety was determined to be the most important factor in predicting both basic and applied math performance. After math anxiety, both verbal and visual working memories were important in predicting basic and applied math performance. Math anxiety appeared to be predictive of females’ performance in both basic and applied mathematics but math anxiety affected males more than females in basic math and was not significant for males in applied mathematics. A more representative study of math anxiety was reported by Ma & Xu (2004). These researchers performed structural equation modelling on data from the nationally-representative Longitudinal Study of American Youth to sort out the causal ordering of math anxiety and math achievement. Low math achievement was related to subsequently higher levels of math anxiety. As with Haynes, Mullins & Stein (2004), Ma & Xu found no significant effects of gender on this causal ordering. 2. Methodology The data for this study was gathered through a single questionnaire distributed to two different sets of respondents at the Bristol Business School, University of the West of England. First set being the Masters level students of Human
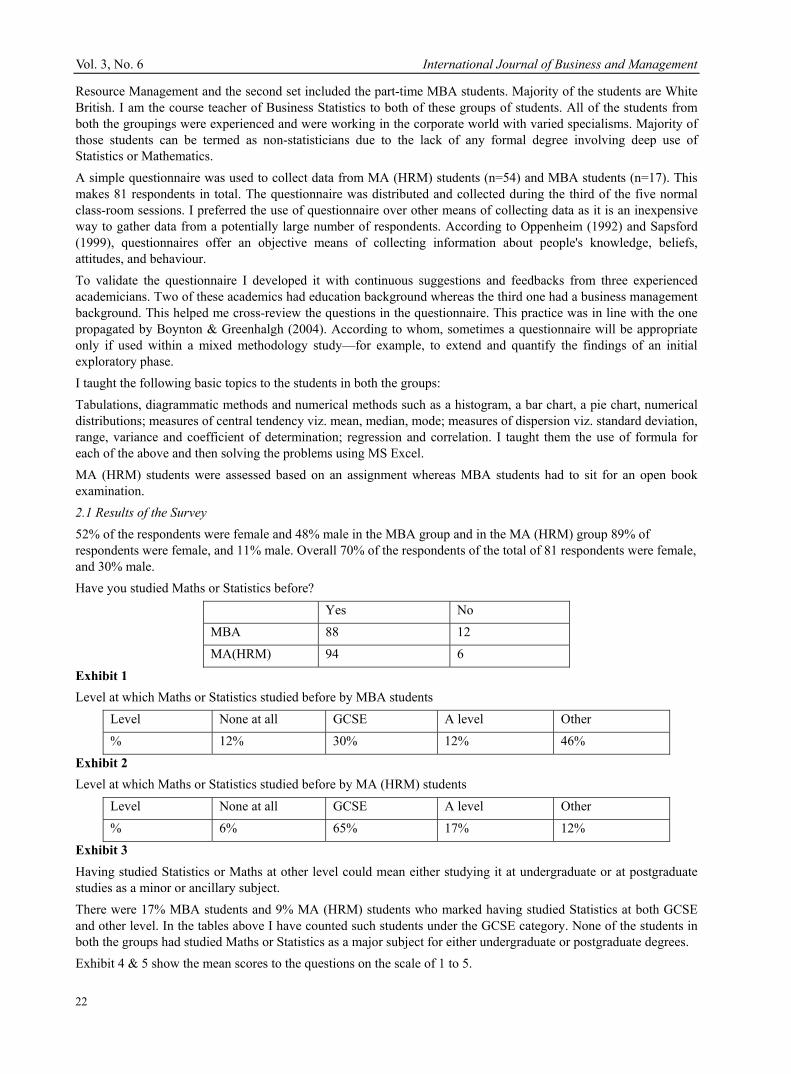
Vol. 3, No. 6 International Journal of Business and Management
22
Resource Management and the second set included the part-time MBA students. Majority of the students are White British. I am the course teacher of Business Statistics to both of these groups of students. All of the students from both the groupings were experienced and were working in the corporate world with varied specialisms. Majority of those students can be termed as non-statisticians due to the lack of any formal degree involving deep use of Statistics or Mathematics. A simple questionnaire was used to collect data from MA (HRM) students (n=54) and MBA students (n=17). This makes 81 respondents in total. The questionnaire was distributed and collected during the third of the five normal class-room sessions. I preferred the use of questionnaire over other means of collecting data as it is an inexpensive way to gather data from a potentially large number of respondents. According to Oppenheim (1992) and Sapsford (1999), questionnaires offer an objective means of collecting information about people's knowledge, beliefs, attitudes, and behaviour. To validate the questionnaire I developed it with continuous suggestions and feedbacks from three experienced academicians. Two of these academics had education background whereas the third one had a business management background. This helped me cross-review the questions in the questionnaire. This practice was in line with the one propagated by Boynton & Greenhalgh (2004). According to whom, sometimes a questionnaire will be appropriate only if used within a mixed methodology study—for example, to extend and quantify the findings of an initial exploratory phase. I taught the following basic topics to the students in both the groups: Tabulations, diagrammatic methods and numerical methods such as a histogram, a bar chart, a pie chart, numerical distributions; measures of central tendency viz. mean, median, mode; measures of dispersion viz. standard deviation, range, variance and coefficient of determination; regression and correlation. I taught them the use of formula for each of the above and then solving the problems using MS Excel. MA (HRM) students were assessed based on an assignment whereas MBA students had to sit for an open book examination. 2.1 Results of the Survey 52% of the respondents were female and 48% male in the MBA group and in the MA (HRM) group 89% of respondents were female, and 11% male. Overall 70% of the respondents of the total of 81 respondents were female, and 30% male. Have you studied Maths or Statistics before?
Yes No
MBA 88 12
MA(HRM) 94 6
Exhibit 1 Level at which Maths or Statistics studied before by MBA students
Level None at all GCSE A level Other
% 12% 30% 12% 46%
Exhibit 2 Level at which Maths or Statistics studied before by MA (HRM) students
Level None at all GCSE A level Other
% 6% 65% 17% 12%
Exhibit 3 Having studied Statistics or Maths at other level could mean either studying it at undergraduate or at postgraduate studies as a minor or ancillary subject. There were 17% MBA students and 9% MA (HRM) students who marked having studied Statistics at both GCSE and other level. In the tables above I have counted such students under the GCSE category. None of the students in both the groups had studied Maths or Statistics as a major subject for either undergraduate or postgraduate degrees. Exhibit 4 & 5 show the mean scores to the questions on the scale of 1 to 5.
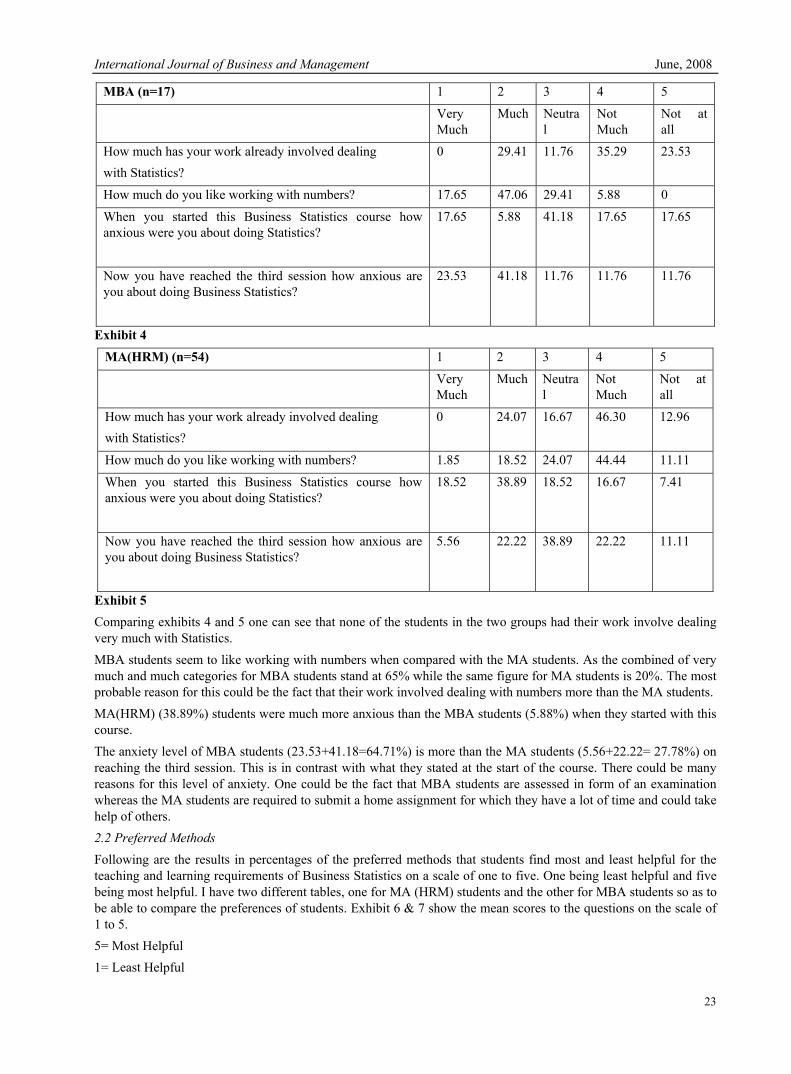
International Journal of Business and Management June, 2008
23
MBA (n=17) 1 2 3 4 5
Very Much
Much Neutral
Not Much
Not at all
How much has your work already involved dealing with Statistics?
0 29.41 11.76 35.29 23.53
How much do you like working with numbers? 17.65 47.06 29.41 5.88 0
When you started this Business Statistics course how anxious were you about doing Statistics?
17.65 5.88 41.18 17.65 17.65
Now you have reached the third session how anxious are you about doing Business Statistics?
23.53 41.18 11.76 11.76 11.76
Exhibit 4
MA(HRM) (n=54) 1 2 3 4 5
Very Much
Much Neutral
Not Much
Not at all
How much has your work already involved dealing with Statistics?
0 24.07 16.67 46.30 12.96
How much do you like working with numbers? 1.85 18.52 24.07 44.44 11.11
When you started this Business Statistics course how anxious were you about doing Statistics?
18.52 38.89 18.52 16.67 7.41
Now you have reached the third session how anxious are you about doing Business Statistics?
5.56 22.22 38.89 22.22 11.11
Exhibit 5 Comparing exhibits 4 and 5 one can see that none of the students in the two groups had their work involve dealing very much with Statistics. MBA students seem to like working with numbers when compared with the MA students. As the combined of very much and much categories for MBA students stand at 65% while the same figure for MA students is 20%. The most probable reason for this could be the fact that their work involved dealing with numbers more than the MA students. MA(HRM) (38.89%) students were much more anxious than the MBA students (5.88%) when they started with this course. The anxiety level of MBA students (23.53+41.18=64.71%) is more than the MA students (5.56+22.22= 27.78%) on reaching the third session. This is in contrast with what they stated at the start of the course. There could be many reasons for this level of anxiety. One could be the fact that MBA students are assessed in form of an examination whereas the MA students are required to submit a home assignment for which they have a lot of time and could take help of others. 2.2 Preferred Methods Following are the results in percentages of the preferred methods that students find most and least helpful for the teaching and learning requirements of Business Statistics on a scale of one to five. One being least helpful and five being most helpful. I have two different tables, one for MA (HRM) students and the other for MBA students so as to be able to compare the preferences of students. Exhibit 6 & 7 show the mean scores to the questions on the scale of 1 to 5. 5= Most Helpful 1= Least Helpful
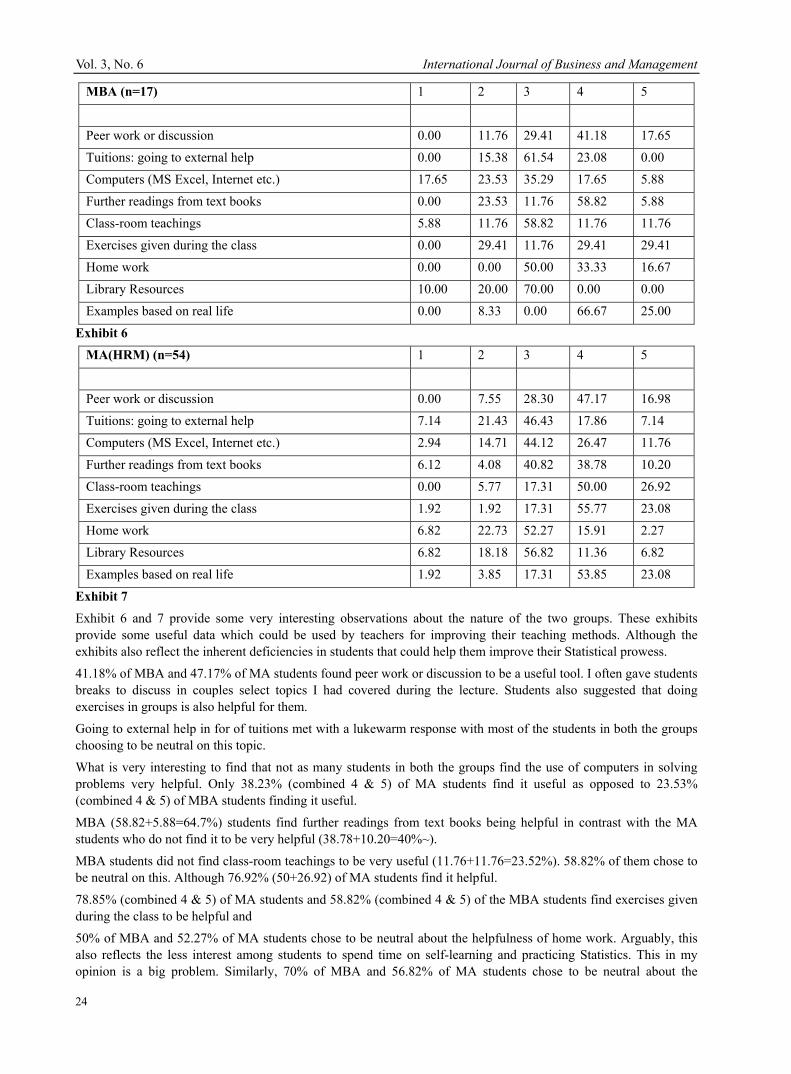
Vol. 3, No. 6 International Journal of Business and Management
24
MBA (n=17) 1 2 3 4 5
Peer work or discussion 0.00 11.76 29.41 41.18 17.65
Tuitions: going to external help 0.00 15.38 61.54 23.08 0.00
Computers (MS Excel, Internet etc.) 17.65 23.53 35.29 17.65 5.88
Further readings from text books 0.00 23.53 11.76 58.82 5.88
Class-room teachings 5.88 11.76 58.82 11.76 11.76
Exercises given during the class 0.00 29.41 11.76 29.41 29.41
Home work 0.00 0.00 50.00 33.33 16.67
Library Resources 10.00 20.00 70.00 0.00 0.00
Examples based on real life 0.00 8.33 0.00 66.67 25.00
Exhibit 6
MA(HRM) (n=54) 1 2 3 4 5
Peer work or discussion 0.00 7.55 28.30 47.17 16.98
Tuitions: going to external help 7.14 21.43 46.43 17.86 7.14
Computers (MS Excel, Internet etc.) 2.94 14.71 44.12 26.47 11.76
Further readings from text books 6.12 4.08 40.82 38.78 10.20
Class-room teachings 0.00 5.77 17.31 50.00 26.92
Exercises given during the class 1.92 1.92 17.31 55.77 23.08
Home work 6.82 22.73 52.27 15.91 2.27
Library Resources 6.82 18.18 56.82 11.36 6.82
Examples based on real life 1.92 3.85 17.31 53.85 23.08
Exhibit 7
Exhibit 6 and 7 provide some very interesting observations about the nature of the two groups. These exhibits provide some useful data which could be used by teachers for improving their teaching methods. Although the exhibits also reflect the inherent deficiencies in students that could help them improve their Statistical prowess.
41.18% of MBA and 47.17% of MA students found peer work or discussion to be a useful tool. I often gave students breaks to discuss in couples select topics I had covered during the lecture. Students also suggested that doing exercises in groups is also helpful for them.
Going to external help in for of tuitions met with a lukewarm response with most of the students in both the groups choosing to be neutral on this topic.
What is very interesting to find that not as many students in both the groups find the use of computers in solving problems very helpful. Only 38.23% (combined 4 & 5) of MA students find it useful as opposed to 23.53% (combined 4 & 5) of MBA students finding it useful.
MBA (58.82+5.88=64.7%) students find further readings from text books being helpful in contrast with the MA students who do not find it to be very helpful (38.78+10.20=40%~).
MBA students did not find class-room teachings to be very useful (11.76+11.76=23.52%). 58.82% of them chose to be neutral on this. Although 76.92% (50+26.92) of MA students find it helpful.
78.85% (combined 4 & 5) of MA students and 58.82% (combined 4 & 5) of the MBA students find exercises given during the class to be helpful and
50% of MBA and 52.27% of MA students chose to be neutral about the helpfulness of home work. Arguably, this also reflects the less interest among students to spend time on self-learning and practicing Statistics. This in my opinion is a big problem. Similarly, 70% of MBA and 56.82% of MA students chose to be neutral about the
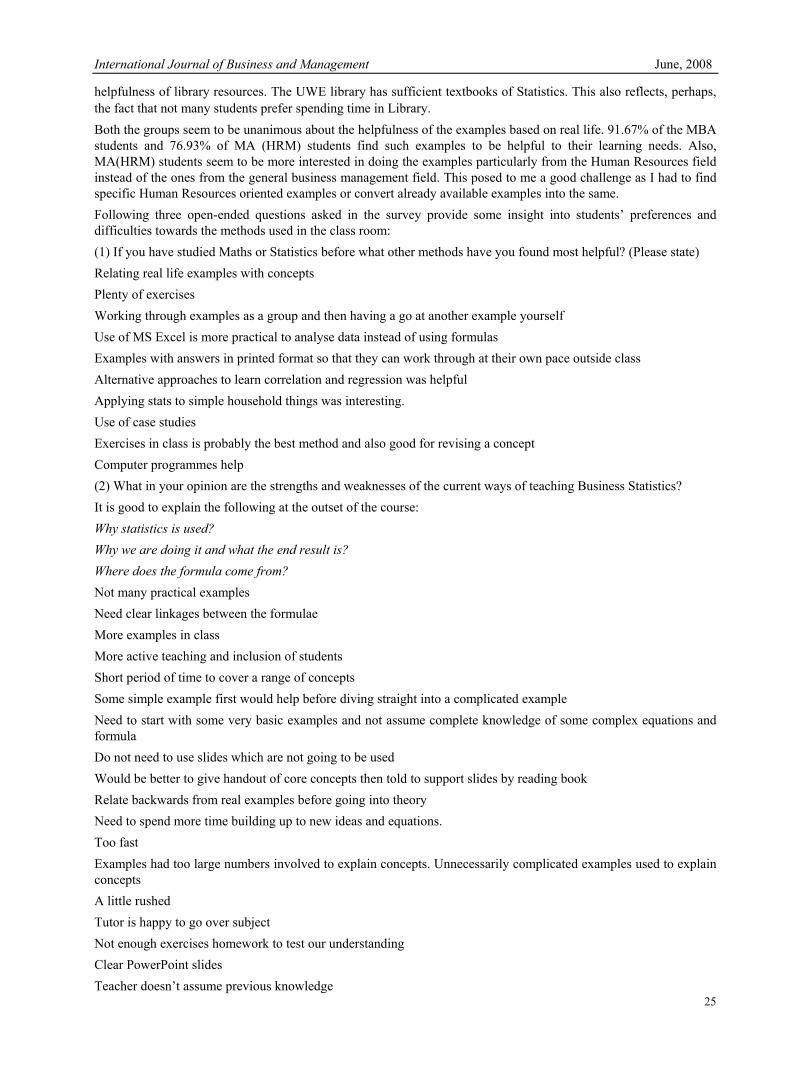
International Journal of Business and Management June, 2008
25
helpfulness of library resources. The UWE library has sufficient textbooks of Statistics. This also reflects, perhaps, the fact that not many students prefer spending time in Library. Both the groups seem to be unanimous about the helpfulness of the examples based on real life. 91.67% of the MBA students and 76.93% of MA (HRM) students find such examples to be helpful to their learning needs. Also, MA(HRM) students seem to be more interested in doing the examples particularly from the Human Resources field instead of the ones from the general business management field. This posed to me a good challenge as I had to find specific Human Resources oriented examples or convert already available examples into the same. Following three open-ended questions asked in the survey provide some insight into students’ preferences and difficulties towards the methods used in the class room: (1) If you have studied Maths or Statistics before what other methods have you found most helpful? (Please state) Relating real life examples with concepts Plenty of exercises Working through examples as a group and then having a go at another example yourself Use of MS Excel is more practical to analyse data instead of using formulas Examples with answers in printed format so that they can work through at their own pace outside class Alternative approaches to learn correlation and regression was helpful Applying stats to simple household things was interesting. Use of case studies Exercises in class is probably the best method and also good for revising a concept Computer programmes help (2) What in your opinion are the strengths and weaknesses of the current ways of teaching Business Statistics? It is good to explain the following at the outset of the course: Why statistics is used? Why we are doing it and what the end result is? Where does the formula come from? Not many practical examples Need clear linkages between the formulae More examples in class More active teaching and inclusion of students Short period of time to cover a range of concepts Some simple example first would help before diving straight into a complicated example Need to start with some very basic examples and not assume complete knowledge of some complex equations and formula Do not need to use slides which are not going to be used Would be better to give handout of core concepts then told to support slides by reading book Relate backwards from real examples before going into theory Need to spend more time building up to new ideas and equations. Too fast Examples had too large numbers involved to explain concepts. Unnecessarily complicated examples used to explain concepts A little rushed Tutor is happy to go over subject Not enough exercises homework to test our understanding Clear PowerPoint slides Teacher doesn’t assume previous knowledge
Vol. 3, No. 6 International Journal of Business and Management
26
Can ask questions and get points clarified Going at a steady pace Doing exercises to test students understand when to read on through the handout to get the answers Not having a clear timetable as to when we will be doing the IT sessions Patience, repetition, encouragement Students need two clear examples for each new thing to ensure understanding Handouts are good It gets complicated quickly Methodical, lots of details, goes through the topics step by step which is very useful Well presented and explained but limited time for topics Something seem to be explained in an overcomplicated way Teacher is helpful and supportive Formulas are very confusing Useful in decision making Not applicable to work situations Too long is given for peer discussions and the conversation moves away from Statistics Good slides Use of Statistical jargons is confusing (3) What in your opinion could be done to improve teaching and learning of Business Statistics? More hours, exercises, mock tests with exam-like questions, derivation and meaning of each component of any statistical formula, detailed explanation of concepts More focus on explanations of theories and how/why they can be used in real life Homework to reinforce learning Make it easier to understand Easier to apply in real life Worked examples on board as a group followed by individual practice Breaking groups into smaller ones to solve problems help support each others understanding during the process Would help to split groups as some people are far too advanced than others More time should be given to interact with others about how to solve the problems Teachers must go through examples more thoroughly and allow less time to discuss with colleagues. Some time may have been wasted using this method. Give choice to students who are at a higher level of understanding, otherwise it would be a waste of time for them Identify what specifically we are to cover at the beginning of each day and summarise. Check off at end to confirm class is happy that methods and formula etc are understood & accepted An appreciation that there are different levels of ability in class Need to slow down slightly Give more examples of exam questions/ assignment questions Explain what the exam would cover Revision of past paper questions Revision of basic concepts or stress this as preparation for course Make sure guidelines for assignment are clearer Explain the topic and its relevance to the present and future roles of students as managers More MS-Excel work early in the course, e.g. teaching one week and excel next week and so on
International Journal of Business and Management June, 2008
27
Have a workbook without the answers to test our understanding and once we have completed the exercises handout the answers If the module was run next to the first modules it would have more relevance Need for more relevant examples 3. Recommendations It is better to organize class and computer sessions alternatively instead of doing all the classes first and then doing all the computer sessions. This gives students an opportunity to practice on computer immediately after their class-room teaching. Some students might need some extra support and clarification. The teacher must try to help such individuals as they are more likely to complain to the deans and programme managers about what not has been done right by the teacher. Students are prejudiced with numbers based on their previous experiences leading to anxiety. Having students in large classes further complicates the situation who are already weak in Maths/ Statistics and are often reluctant to study and pose challenge to the teacher. Teachers should also realise that teaching Statistics to non specialists is a completely different ball game requiring some special preparations. For example, some students can have problem with understanding Greek symbols and also would like to know where the formula comes from and so on. Every aspect of teaching needs to be adapted for teaching non-specialists; the method used, examples, the assessment criteria, time-line, and use of computers and so on. Treating non-statisticians students as statisticians could lead to a catastrophe. 4. Discussion The results of this study indicate that both the groups of students displayed a high level of anxiety. Following are my observations based on the questionnaire and my personal experiences which lead to anxiety among the teacher and the taught and some practical suggestions: (1) Most often there are two types of students in a group. One who know some Statistics and the other who do not. If one satisfies the first lot the second lot is not satisfied and vice versa. It is never easy to strike the balance. In both the situations teacher is bound to lose face and is at the receiving end. (2) Most students do not do self reading from books. What one teaches in class room has to be complemented with a lot of self reading. In 8 or 10 hours of teaching they will not become Gurus of Statistics. (3) Statistics is abstract. To learn application is only possible once you learn the concept. The concept in itself is abstract. One can't teach 100% of application of concepts to the students who do not know the concepts in the first place. (4) Anxiety and frustration is and it is not students fault. It is because of point 2 above and it is not because of point 3 above. (5) It is because of the anxiety and a fear of self that students try to externalise a problem for which actually the solution lies within. They may have assignment deadlines and they could be under pressure. (6) Many students want teachers to spoon feed and explain the same thing over and again (because sometimes some of them have been chatting when a teacher is explaining something). (7) Sometimes they are confused and want teacher to answer their questions. Sometimes teachers should not answer all the questions, because confusion is curiosity which leads individuals to read and find out the truth. This could be taken by students as being unhelpful on the teacher’s part. (8) Also a teacher may not want to answer their direct questions related to the assignment as answering amounts to solving the questions which in turn amounts to giving 100% marks to all of them (9) The handouts and support material teachers generally give are imperfect because what works for some doesn't for others. They are just general points of reference and help. The trick is in the subject which invites criticism of the subject and its teachers in abundance without realising the fact that the subject is a goldmine. 5. Limitations This research study is completely based on the responses and therefore preferences of students. It is sometimes true that the students are not aware of what method of study is good for them and what is not especially when most of the students had no or little exposure to statistics in the past.
Vol. 3, No. 6 International Journal of Business and Management
28
I don’t foresee any major ethical dilemma in this research work. There is a minor ethical dilemma as the students are evaluating my teaching style and in order to reduce this dilemma all the questionnaires were kept completely anonymous. I had asked MA (HRM) students about the helpfulness of using computers before having conducted any computer-oriented exercise sessions. So I relied on their past experiences of having used computers for solving Statistical problems. 6. Summary and Conclusions This article provides a snapshot of helpfulness of different methods in the teaching and study of business statistics. The two focus groups constituted mostly part-time students who were working and can be classed as non-statisticians. The results show that anxiety levels were high among students and students prefer to learn when the teacher uses many examples based on the real life business situations. They tend to spend less-time on self reading and using library resources. Anxiety could be reduced by way of giving simple and pertinent examples in the class, clearly laying down the objectives of the course and also the objectives of each session, clearly defined assessment criteria and expectations to pass the course. Overall, this piece of research might help students and teachers alike to realise the extent of helpfulness of different teaching methods used. References Boynton, P.M. & Greenhalgh, T. (2004). Selecting, designing, and developing your questionnaire. BMJ. pp.1312-1315. Haynes, A.F., A. G. Mullins & B. S. Stein, (2004). Differential Models for Math Anxiety in Male and Female College Students, Sociological Spectrum, 24 (3), 295-318. Leon, M. R., & Revelle, W. (1985). The effects of anxiety on analogical reasoning: A test of three theoretical models. Journal of Personality and Social Psychology, 49, 1302–1315. Ma, X. & J. Xu, (2004). The Causal Ordering of Mathematics Anxiety and Mathematics Achievement: A Longitudinal Panel Analysis, Journal of Adolescence, Vol. 27, No. 2, pp. 165-179. MacLeod, C., & Donnellan, A. M. (1993). Individual differences in anxiety and the restriction of working memory capacity. Personality and Individual Differences, 15, 163–173. Miller, H. & J. Bichsel, (2004). Anxiety, Working Memory, Gender and Math Performance, Personality and Individual Differences, 37 (3), 591-606. Oppenheim AN. (1992). Questionnaire design, interviewing and attitude measurement. London: Continuum. Orton A and Frobisher, L. (1996). Insights into Teaching Mathematics Cassell Education. Peiris, S. and Peseta, T. (2004). Learning Statistics in First Year by Active Participating Students, ScholarlyInquiry into Science Teaching and Learning, UniServe Science, 76-79. Ramsden, P. (1992). Learning to Teach in Higher Education. London & NY: Routledge. Sapsford R. (1999). Survey research. London: Sage. Sorg, B. A., & Whitney, P. (1992). The effect of trait anxiety and situational stress on working memory capacity. Journal of Research in Personality, 26, 235–241. Yilmaz. M. R. (1996). The challenge of teaching statistics to non-specialists. Journal of Statistics Education. 4(1).
International Journal of Business and Management June, 2008
29
The Future Development of China Commercial
Automobile Water Ro-Ro Transportation Market Hao Lv
School of Management, Wuhan University of Technology, Wuhan 430070, China Tel: 86-27-6268-8931 E-mail: [email protected]
Abstract Water Ro-Ro transportation becomes more and more important in China commercial automobile transportation market. The potential market is considerable. The fast development of China automobile industry brings about sufficient market space. The transportation characteristics and the evident location advantages contribute a lot to its further development. Confronting with such a marvelous market opportunity, China water transportation enterprises should focus on continuous innovation, providing with overall logistics services for automobile logistics, pushing the development of China commercial automobile Ro-Ro transportation market. Keywords: Automobile, Ro-Ro transportation, Water transportation, Logistics 1. Introduction After years of development, China automobile industry has already gained significant progresses. According to data from Federation International Automobile (FIA), in 1999 China’s automobile production was 1,805,000, being the No.9 in the world. In 2007, the number increased to 5,600,000, being the No.3 in the world. It is reasonable to predict that the demand for automobile will sustain a high growth along with the continuous increase of China civil economy and the constant improvement of people’s living, which will drive the perfection of automobile industry structure and the stable increase of production, and further push the enlargement of commercial automobile logistics scale. All these factors will inevitably bring about new chances for developing commercial automobile water Ro-Ro transportation. 2. Opportunities for developing China commercial automobile water Ro-Ro transportation market 2.1 The fast development of China automobile industry serves as a guarantee for the market scale of commercial automobile water Ro-Ro transportation market. Since the performance of reform and open policy, China government helps automobile industry to realize the structural adjustment and finally formulate a “3+X” industrial structure (“3” refer to the first-order groups, including Shanghai Auto, China FAW Group, and Dongfeng Motor Cooperation that are supported by the government strongly. “X” refers to the second-order groups, including Changan Group, Beijing Hyundai, Guangzhou Automobile Group, Nanjing Automobile (Group) Cooperation, Shenyang Huachen Automobile cooperation, Hafei Auto, Changhe Auto, Jianghuai Automobile Cooperation, Soueast Motor, and Jiangling Motors Cooperation), in order to improve the international competitiveness of “made-in-China” automobile. As a result, these core automobile production enterprises’ production centralization and the ratio of “made-in-China” automobiles have been improved to a great degree. Meanwhile, because of continuous and powerful pulling of domestic demand, China automobile industry sustains a stable increase in recent three years. On one hand, the output rises at a rate of 12% annually. On the other hand, the products structure is optimized. The output and proportion of saloon cars keep in rising. The automobile industry is prosperous in both production and sales. Before 1990, China automobile market focused on public purchases. The demand was extremely low. 70% of demand was from governments or public causes, 30% or so commercial purchases, and seldom private field. After 1990, public purchase decreased, commercial demand increased, and private purchase started. Since 2002, private purchases have occupied more and more market shares, exceeding 70% of total market shares in 2003, what means the automobile market enters a stage of private purchases. In this stage, saloon car market will expedite to enter the growth period. The private demand far surpasses the public demand, which is an excellent chance for China automobile industry achieving sustainable and fast development. Therefore, during the next twenty years saloon cars will drive the development of automobile industry in China. Saloon cars will occupy a larger proportion in domestic market. It is predicted that more and more saloon cars will enter Chinese families from 2008 to 2010, and after 2010 the growth tends to be stable. The market of passenger cars and trucks will be saturated in the year 2020 or so. Changes of internal market demand structure will become the main development trend. During the next 10-15 years, China will have a great demand for automobiles. The market demand will surpass 10,000,000.
Vol. 3, No. 6 International Journal of Business and Management
30
The improvement of automobile industry structure and the stable increase of output objectively provide with possibilities for commercial automobile’s scale transportation and storage. Besides, China’s wide area helps to separate automobile production from consumption in time and space. Regional sales market comes into being. All theses factors contribute to the continuous growth of commercial automobile water Ro-Ro transportation market. 2.2 Characteristics of water Ro-Ro transportation can benefit the rise of commercial automobile transportation’s share in market In China commercial automobile market, purchases can be realized by three ways, namely highways, railways, and water, except for customers taking the automobiles by themselves. In today’s domestic commercial automobile transportation, highway transportation occupies the largest market share, nearly 80%. Highway transportation possesses unique competitive advantages because of its “door-to-door” service, convenience, and speed. But it does not have competitiveness in price, safety, and goods completeness. Railway transportation occupies a larger proportion, about 12%, that is higher than that of water transportation in commercial automobile transportation. It can achieve ideal speed. But it has lots of rings in transportation. And the transportation price is higher. Although water transportation merely occupies 8% of market share presently, it has obvious advantages in price and volume, what is right for commercial automobile’s large-volume and long-distance transportation. That is why water Ro-Ro transportation can gain further development. Water Ro-Ro transportation can reduce goods damages to a great degree, guaranteeing the quality of transportation, which is extremely more important for the transportation of high value-added goods, such as automobile. Comparing with other commercial automobile transportation ways, water Ro-Ro transportation has certain disadvantages indeed. These disadvantages restrain the development speed of water Ro-Ro transportation in a sense. In detail, water Ro-Ro transportation is not right for small-scale transportation. Only when the transportation volume reaches certain degree, can it realize a scale effect. Besides, water Ro-Ro transportation consumes longer time. If confronting with huge wind, frost, flood, and other natural disaster, the transportation period will be affected heavily. However, it is predictable that along with the continuous enlargement of China commercial automobile logistics, advantages of water Ro-Ro transportation will become more prominent step by step in the price, safety, goods quality guarantee of large-volume and long-distance transportation. 2.3 Water transportation channels based on location advantages give commercial automobile water Ro-Ro transportation market new growing point. China automobile’s main production and sales regions are completely in accord with China’s T water transportation structure. China’s large automobile production enterprises whose yearly production value can realize several billion Yuan mostly locate around Yangtze River region and seaside. Shanghai Auto, China FAW Group, and Dongfeng Motor Cooperation locate in the T transportation structure. In 2007, the market shares of the three giants’ main types realize 38.38%, 1.56%, and 8.52% respectively, occupying an important position in China’s saloon car industry. Plus Changan Auto, Qingling Motors, Fengshen, Quanshun, Changhe, Chery, and many other automobile enterprises that locate in the same region, they occupy the most of domestic saloon car, mini car, small passenger car, and truck market. In fact, more than 80% of market demand focuses on the developed T region in China. Therefore, using water channels to develop water Ro-Ro transportation has evident advantages in location. Water Ro-Ro transportation has a greater development space in future. At present, Shanghai Auto takes water transportation as the main automobile delivery way in south China, middle and south China, southwest China, which is the main business of Yangtze River Ro-Ro transportation. China FAW Group has constructed relatively perfect transfer warehouses in south China. It is extremely right for ocean Ro-Ro transportation. Dongfeng Group chooses water transportation to deliver its automobiles in southwest China, which accounts for one third of its total delivery. The three automobile groups have a huge market space in water transportation field. For the long run, many other automobile enterprises, such as Chongqing Changan, Chongqing Qingling, Hainan Mazda, Guangzhou Honda, Yancheng Yueda, Nanchang Changhe, and Xiangfan Fengshen, may serve as potential customers for water transportation. Presently, these automobile enterprises begin to choose water transportation more or less. Along with the enlargement of their outputs, it is more possible for them to choose water transportation. In three years, more and more automobile delivery will be realized by water transportation. Surely, the T water Ro-Ro transportation net that runs through Yangtze River and the seaside has a great potential in future. 3. To make water transportation companies provide with overall logistics services is the key to explore commercial automobile water Ro-Ro transportation market. Facing up with valuable development chances for commercial automobile water Ro-Ro transportation market, water transportation companies must change their traditional corporate positioning, cultivating and exploring new market by new ideas, new models, and new methods, grasping chances, winning market, and achieving fast development. Automobile production is kind of mature socialized manufacturing. It is hard for it to reduce material consumption
International Journal of Business and Management June, 2008
31
or improve labor productivity. Management practice shows that to adjust commodity’s flowing volume and speed in circulation field is the third important source for cost control and profit creation. It has more potential than enhancing more pressure on production field. For example, General Motor (GM) achieves outsourcing by employing a special logistics company, Automotive Consolidation, to transfer its automobile parts, what can help to save about 6-8 million dollars annually. Ford chooses to cooperate with UPS in its automobile delivery. In China, Shanghai General Motor employs APL to solve its delivery. Under the new economic condition, because of the execution of corporate refocusing strategy, logistics services’ strategic outsourcing has become a widely-accepted strategy for all automobile enterprises in the world. Also, in China’s commercial automobile transportation market, the water transportation companies, as the service providers of automobile delivery, must possess the capabilities of cooperating with automobile enterprises, providing with overall services for the later. Therefore, water transportation companies should position themselves as overall logistics service providers, what is the key to further explore commercial automobile water Ro-Ro transportation market. In order to provide with overall logistics services for automobile products, logistics service providers must satisfy these requirements as follow in product flow, capital flow, and information flow. Firstly, the circulation of automobile products concerns with transportation, storage, maintenance, transfer, allocation, delivery, and many other aspect. In the overall logistics service, the most fundamental point is to provide with “door-to-door” transportation. Commercial automobile water Ro-Ro transportation companies are centered in seaside and Yangtze River. The further perfection of products flow depends on the improvement of highway transfer power. In programming most economic ways for logistics, it is necessary to cooperate with highways and railways and achieve associated transportation for the sake of customers benefit. Besides, because of the large volume in commercial automobile water Ro-Ro transportation, it is a must to construct relevant transfer warehouses around Ro-Ro transportation ports, which can also serve as basic equipments for other logistics services, such as storage and maintenance. Ro-Ro transportation companies can solve this problem independently or by cooperating with storage companies and automobile enterprises. Secondly, automobile is a kind of expensive product. It occupies a large proportion of capitals in transportation. Logistics service providers should decrease the logistics costs and the occupation of capital in transportation as much as possible. At present, Shenyang Jinbei and Guangzhou Honda execute the “zero storage” and Just in Time (JIT) management models. Determine the production by the sales. Achieve many-times and small-volume transportation. Because of the small transportation volume, it is uneconomical to choose water transportation. In the future, public highway carriers can achieve regular transportation, collecting random transportation demand together to satisfy the highly-intense and small-volume transportation. Thirdly, automobile logistics is driven by sales and logistics affects sales market directly. Automobile enterprises, distribution branches, logistics service providers should cooperate and coordinate with each other in the organization of logistics, enhancing information communication and improving control over logistics process. Information can help to realize a transparent logistics process, reducing its uncertainty greatly. Logistics service providers can share information with customers by Internet, what can improve customers’ satisfaction effectively, achieving an increment effect in logistics management. Meanwhile, the transparent logistics process can help to realize a transparent internal management in logistics service providers. They can adjust and control the business operation based on information platform, guaranteeing the total quality and overall efficiency of logistics service. Besides, along with the development of net technology and electronic commerce, the online automobile purchase begins. Individual consumer has high requirements in logistics speed and exact service. Therefore, logistics service providers should construct more advanced information system to meet the demand. In order to keep space with the development trend, logistics service providers must build up the information platform that associates and connect with others. The construction of strategic partnership in logistics service field provides with a stable and effective logistics support and guarantee system for automobile enterprises, reducing the self-operation costs and obtaining high-quality service. At the same time, water transportation companies obtain reliable and high value-added customer sources, reducing business risks. More important, commercial automobile water Ro-Ro transportation market will obtain a wider development space inevitably. 4. Conclusion To sum up, China automobile industry develops very well at present, what will contribute to the large- scale demand for commercial automobile logistics service. At the same time, water Ro-Ro transportation possesses an irreplaceable advantage in commercial automobile transportation market. In China, the automobile production and sales regions are rightly in accord with the T water transportation structure, what makes water transportation

Vol. 3, No. 6 International Journal of Business and Management
32
channels become a growing point for commercial automobile water Ro-Ro transportation market. China water transportation companies should position themselves as overall logistics service providers. Starting from the product flow, capital flow, information flow, and other logistics rings, these water transportation companies should integrate customers sources, construct strategic partnership with automobile enterprises, grasp market opportunities, and push the development of China’s commercial automobile water Ro-Ro transportation market further. References Handfield B. & Nichols L. Jr. (1998). Introduction to Supply Chain Management. US: Prentice Hall. Kikuchi. (1999). Translated by Ding, Liyan. Logistics System Engineering. Beijing: Tsinghua University Press.
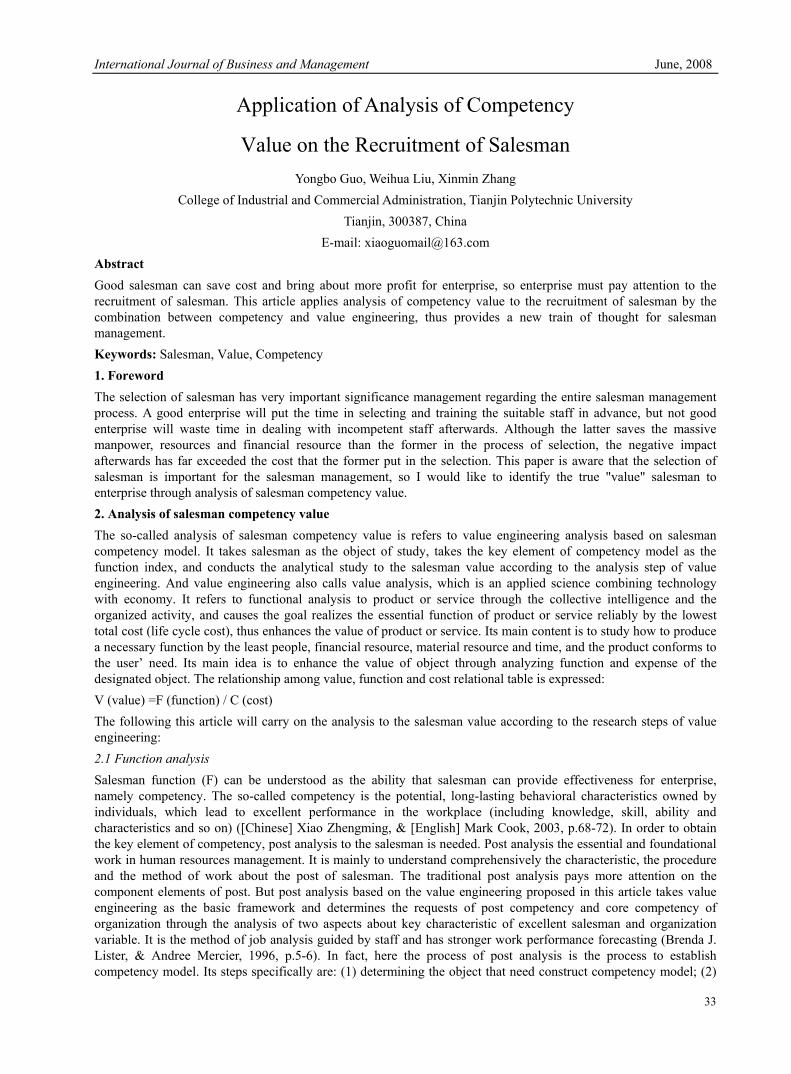
International Journal of Business and Management June, 2008
33
Application of Analysis of Competency
Value on the Recruitment of Salesman Yongbo Guo, Weihua Liu, Xinmin Zhang
College of Industrial and Commercial Administration, Tianjin Polytechnic University Tianjin, 300387, China
E-mail: [email protected] Abstract Good salesman can save cost and bring about more profit for enterprise, so enterprise must pay attention to the recruitment of salesman. This article applies analysis of competency value to the recruitment of salesman by the combination between competency and value engineering, thus provides a new train of thought for salesman management. Keywords: Salesman, Value, Competency 1. Foreword The selection of salesman has very important significance management regarding the entire salesman management process. A good enterprise will put the time in selecting and training the suitable staff in advance, but not good enterprise will waste time in dealing with incompetent staff afterwards. Although the latter saves the massive manpower, resources and financial resource than the former in the process of selection, the negative impact afterwards has far exceeded the cost that the former put in the selection. This paper is aware that the selection of salesman is important for the salesman management, so I would like to identify the true "value" salesman to enterprise through analysis of salesman competency value. 2. Analysis of salesman competency value The so-called analysis of salesman competency value is refers to value engineering analysis based on salesman competency model. It takes salesman as the object of study, takes the key element of competency model as the function index, and conducts the analytical study to the salesman value according to the analysis step of value engineering. And value engineering also calls value analysis, which is an applied science combining technology with economy. It refers to functional analysis to product or service through the collective intelligence and the organized activity, and causes the goal realizes the essential function of product or service reliably by the lowest total cost (life cycle cost), thus enhances the value of product or service. Its main content is to study how to produce a necessary function by the least people, financial resource, material resource and time, and the product conforms to the user’ need. Its main idea is to enhance the value of object through analyzing function and expense of the designated object. The relationship among value, function and cost relational table is expressed: V (value) =F (function) / C (cost) The following this article will carry on the analysis to the salesman value according to the research steps of value engineering: 2.1 Function analysis Salesman function (F) can be understood as the ability that salesman can provide effectiveness for enterprise, namely competency. The so-called competency is the potential, long-lasting behavioral characteristics owned by individuals, which lead to excellent performance in the workplace (including knowledge, skill, ability and characteristics and so on) ([Chinese] Xiao Zhengming, & [English] Mark Cook, 2003, p.68-72). In order to obtain the key element of competency, post analysis to the salesman is needed. Post analysis the essential and foundational work in human resources management. It is mainly to understand comprehensively the characteristic, the procedure and the method of work about the post of salesman. The traditional post analysis pays more attention on the component elements of post. But post analysis based on the value engineering proposed in this article takes value engineering as the basic framework and determines the requests of post competency and core competency of organization through the analysis of two aspects about key characteristic of excellent salesman and organization variable. It is the method of job analysis guided by staff and has stronger work performance forecasting (Brenda J. Lister, & Andree Mercier, 1996, p.5-6). In fact, here the process of post analysis is the process to establish competency model. Its steps specifically are: (1) determining the object that need construct competency model; (2)
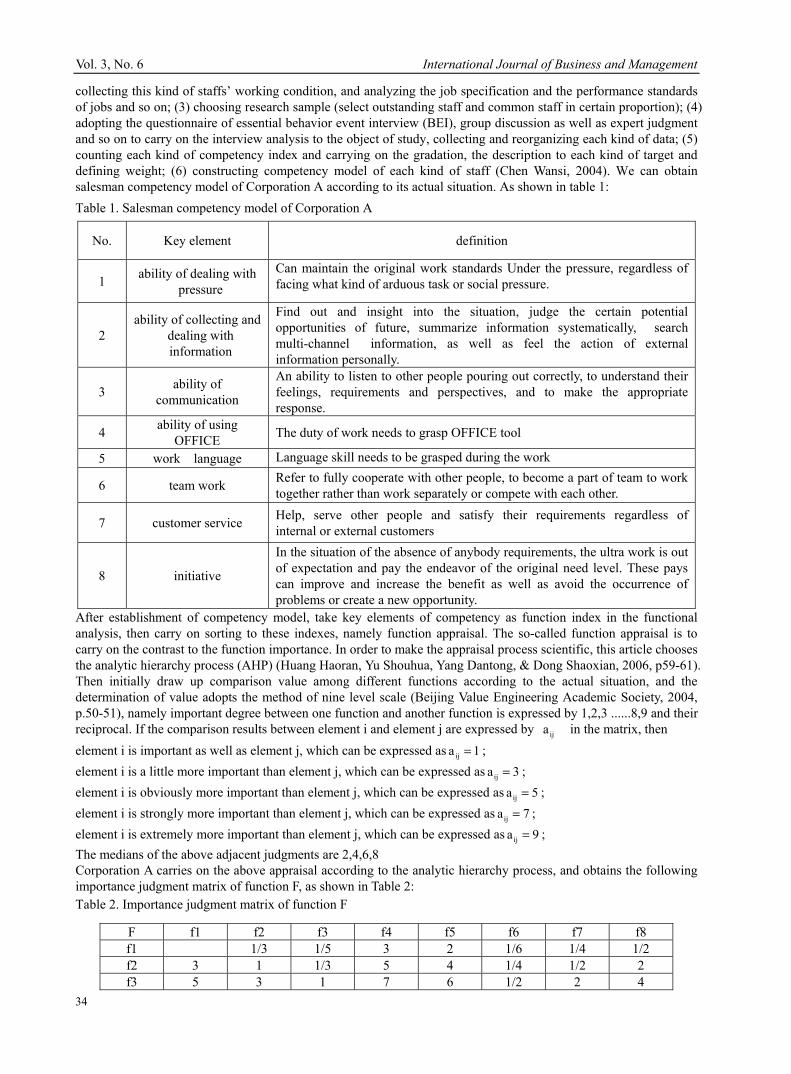
Vol. 3, No. 6 International Journal of Business and Management
34
collecting this kind of staffs’ working condition, and analyzing the job specification and the performance standards of jobs and so on; (3) choosing research sample (select outstanding staff and common staff in certain proportion); (4) adopting the questionnaire of essential behavior event interview (BEI), group discussion as well as expert judgment and so on to carry on the interview analysis to the object of study, collecting and reorganizing each kind of data; (5) counting each kind of competency index and carrying on the gradation, the description to each kind of target and defining weight; (6) constructing competency model of each kind of staff (Chen Wansi, 2004). We can obtain salesman competency model of Corporation A according to its actual situation. As shown in table 1: Table 1. Salesman competency model of Corporation A
After establishment of competency model, take key elements of competency as function index in the functional analysis, then carry on sorting to these indexes, namely function appraisal. The so-called function appraisal is to carry on the contrast to the function importance. In order to make the appraisal process scientific, this article chooses the analytic hierarchy process (AHP) (Huang Haoran, Yu Shouhua, Yang Dantong, & Dong Shaoxian, 2006, p59-61). Then initially draw up comparison value among different functions according to the actual situation, and the determination of value adopts the method of nine level scale (Beijing Value Engineering Academic Society, 2004, p.50-51), namely important degree between one function and another function is expressed by 1,2,3 ......8,9 and their reciprocal. If the comparison results between element i and element j are expressed by ija
in the matrix, then
element i is important as well as element j, which can be expressed as ija 1= ; element i is a little more important than element j, which can be expressed as ija 3= ; element i is obviously more important than element j, which can be expressed as ija 5= ; element i is strongly more important than element j, which can be expressed as ija 7= ; element i is extremely more important than element j, which can be expressed as ija 9= ; The medians of the above adjacent judgments are 2,4,6,8 Corporation A carries on the above appraisal according to the analytic hierarchy process, and obtains the following importance judgment matrix of function F, as shown in Table 2: Table 2. Importance judgment matrix of function F
F f1 f2 f3 f4 f5 f6 f7 f8 f1 1/3 1/5 3 2 1/6 1/4 1/2 f2 3 1 1/3 5 4 1/4 1/2 2 f3 5 3 1 7 6 1/2 2 4
No. Key element definition
1 ability of dealing with pressure
Can maintain the original work standards Under the pressure, regardless of facing what kind of arduous task or social pressure.
2 ability of collecting and
dealing with information
Find out and insight into the situation, judge the certain potential opportunities of future, summarize information systematically, search multi-channel information, as well as feel the action of external information personally.
3 ability of communication
An ability to listen to other people pouring out correctly, to understand their feelings, requirements and perspectives, and to make the appropriate response.
4 ability of using OFFICE The duty of work needs to grasp OFFICE tool
5 work language Language skill needs to be grasped during the work
6 team work Refer to fully cooperate with other people, to become a part of team to work together rather than work separately or compete with each other.
7 customer service Help, serve other people and satisfy their requirements regardless of internal or external customers
8 initiative
In the situation of the absence of anybody requirements, the ultra work is out of expectation and pay the endeavor of the original need level. These pays can improve and increase the benefit as well as avoid the occurrence of problems or create a new opportunity.
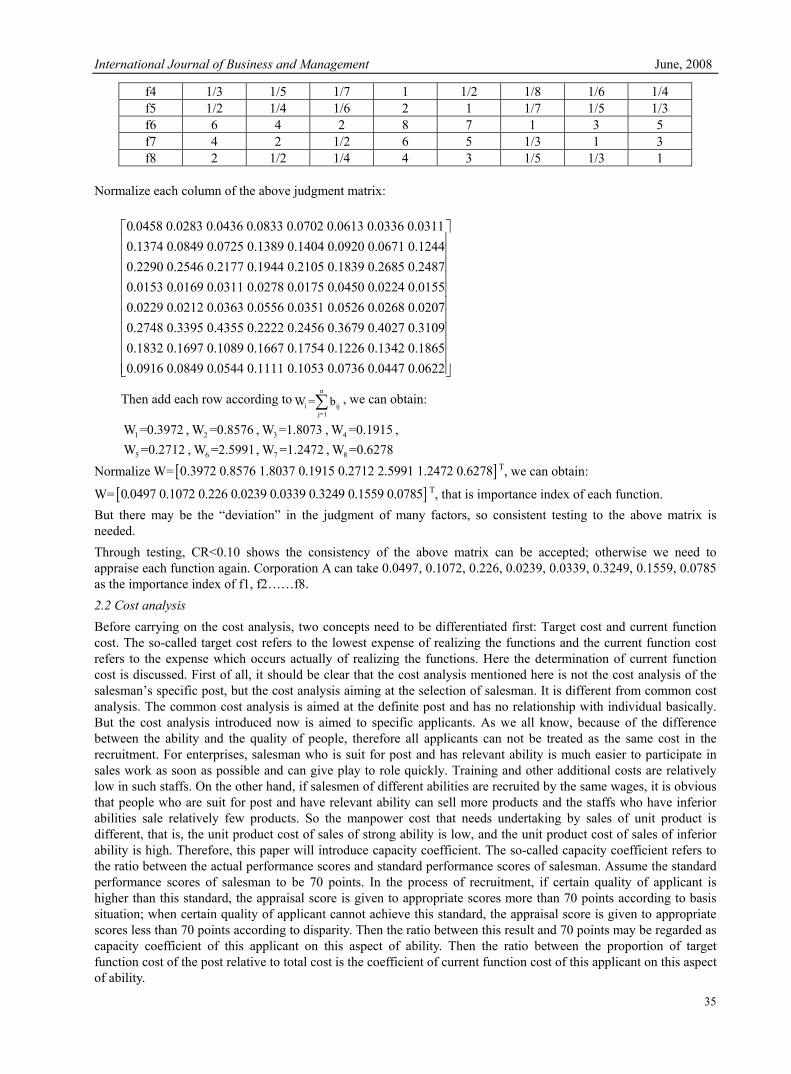
International Journal of Business and Management June, 2008
35
f4 1/3 1/5 1/7 1 1/2 1/8 1/6 1/4 f5 1/2 1/4 1/6 2 1 1/7 1/5 1/3 f6 6 4 2 8 7 1 3 5 f7 4 2 1/2 6 5 1/3 1 3 f8 2 1/2 1/4 4 3 1/5 1/3 1
Normalize each column of the above judgment matrix:
Then add each row according ton
i ijj=1
W = b∑ , we can obtain:
1W =0.3972 , 2W =0.8576 , 3W =1.8073 , 4W =0.1915 ,
5W =0.2712 , 6W =2.5991, 7W =1.2472 , 8W =0.6278 Normalize W= [ ]0.3972 0.8576 1.8037 0.1915 0.2712 2.5991 1.2472 0.6278 T, we can obtain:
W= [ ]0.0497 0.1072 0.226 0.0239 0.0339 0.3249 0.1559 0.0785 T, that is importance index of each function. But there may be the “deviation” in the judgment of many factors, so consistent testing to the above matrix is needed. Through testing, CR<0.10 shows the consistency of the above matrix can be accepted; otherwise we need to appraise each function again. Corporation A can take 0.0497, 0.1072, 0.226, 0.0239, 0.0339, 0.3249, 0.1559, 0.0785 as the importance index of f1, f2……f8. 2.2 Cost analysis Before carrying on the cost analysis, two concepts need to be differentiated first: Target cost and current function cost. The so-called target cost refers to the lowest expense of realizing the functions and the current function cost refers to the expense which occurs actually of realizing the functions. Here the determination of current function cost is discussed. First of all, it should be clear that the cost analysis mentioned here is not the cost analysis of the salesman’s specific post, but the cost analysis aiming at the selection of salesman. It is different from common cost analysis. The common cost analysis is aimed at the definite post and has no relationship with individual basically. But the cost analysis introduced now is aimed to specific applicants. As we all know, because of the difference between the ability and the quality of people, therefore all applicants can not be treated as the same cost in the recruitment. For enterprises, salesman who is suit for post and has relevant ability is much easier to participate in sales work as soon as possible and can give play to role quickly. Training and other additional costs are relatively low in such staffs. On the other hand, if salesmen of different abilities are recruited by the same wages, it is obvious that people who are suit for post and have relevant ability can sell more products and the staffs who have inferior abilities sale relatively few products. So the manpower cost that needs undertaking by sales of unit product is different, that is, the unit product cost of sales of strong ability is low, and the unit product cost of sales of inferior ability is high. Therefore, this paper will introduce capacity coefficient. The so-called capacity coefficient refers to the ratio between the actual performance scores and standard performance scores of salesman. Assume the standard performance scores of salesman to be 70 points. In the process of recruitment, if certain quality of applicant is higher than this standard, the appraisal score is given to appropriate scores more than 70 points according to basis situation; when certain quality of applicant cannot achieve this standard, the appraisal score is given to appropriate scores less than 70 points according to disparity. Then the ratio between this result and 70 points may be regarded as capacity coefficient of this applicant on this aspect of ability. Then the ratio between the proportion of target function cost of the post relative to total cost is the coefficient of current function cost of this applicant on this aspect of ability.
0.0458 0.0283 0.0436 0.0833 0.0702 0.0613 0.0336 0.03110.1374 0.0849 0.0725 0.1389 0.1404 0.0920 0.0671 0.12440.2290 0.2546 0.2177 0.1944 0.2105 0.1839 0.2685 0.24870.0153 0.0169 0.0311 0.0278 0.0175 0.0450 0.0224 0.01550.0229 0.0212 0.0363 0.0556 0.0351 0.0526 0.0268 0.02070.2748 0.3395 0.4355 0.2222 0.2456 0.3679 0.4027 0.31090.1832 0.1697 0.1089 0.1667 0.1754 0.1226 0.1342 0.18650.0916 0.0849 0.0544 0.1111 0.1053 0.0736 0.0447 0.0622
⎡ ⎤⎢ ⎥⎢ ⎥⎢ ⎥⎢ ⎥⎢ ⎥⎢ ⎥⎢ ⎥⎢ ⎥⎢ ⎥⎢ ⎥⎢ ⎥⎣ ⎦
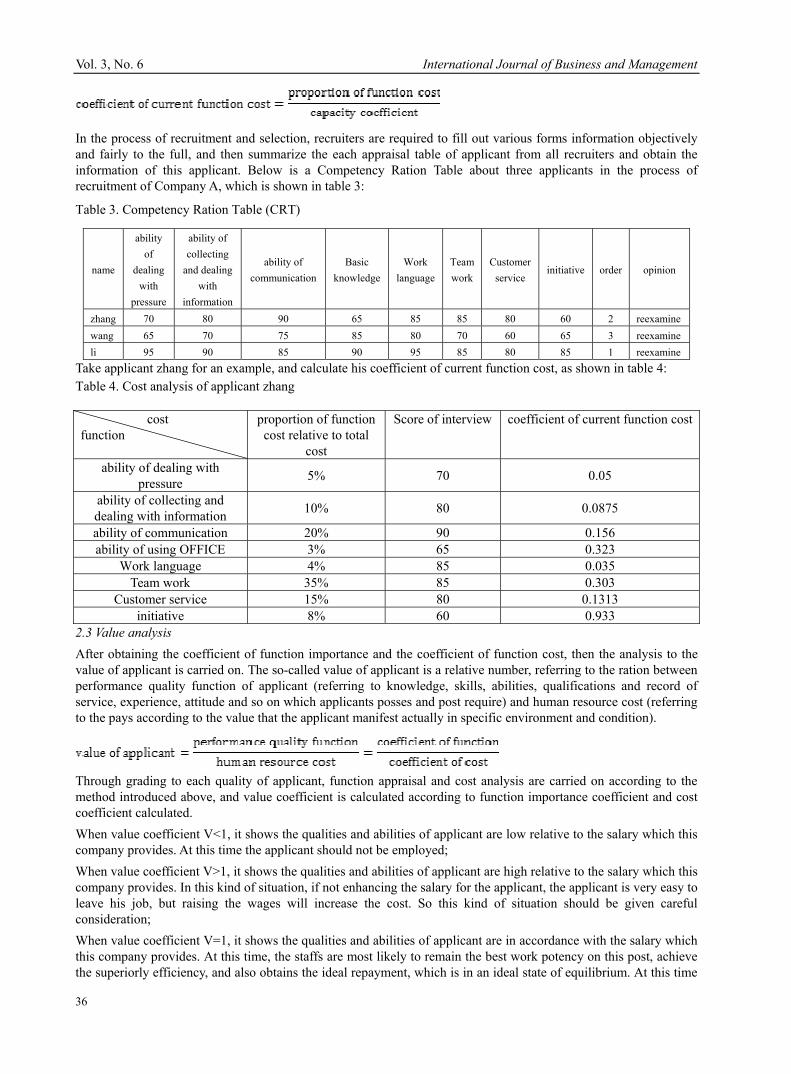
Vol. 3, No. 6 International Journal of Business and Management
36
In the process of recruitment and selection, recruiters are required to fill out various forms information objectively and fairly to the full, and then summarize the each appraisal table of applicant from all recruiters and obtain the information of this applicant. Below is a Competency Ration Table about three applicants in the process of recruitment of Company A, which is shown in table 3:
Table 3. Competency Ration Table (CRT)
name
ability of
dealing with
pressure
ability of collecting
and dealing with
information
ability of communication
Basic knowledge
Work language
Team work
Customer service
initiative order opinion
zhang 70 80 90 65 85 85 80 60 2 reexaminewang 65 70 75 85 80 70 60 65 3 reexamineli 95 90 85 90 95 85 80 85 1 reexamine
Take applicant zhang for an example, and calculate his coefficient of current function cost, as shown in table 4: Table 4. Cost analysis of applicant zhang
2.3 Value analysis After obtaining the coefficient of function importance and the coefficient of function cost, then the analysis to the value of applicant is carried on. The so-called value of applicant is a relative number, referring to the ration between performance quality function of applicant (referring to knowledge, skills, abilities, qualifications and record of service, experience, attitude and so on which applicants posses and post require) and human resource cost (referring to the pays according to the value that the applicant manifest actually in specific environment and condition).
Through grading to each quality of applicant, function appraisal and cost analysis are carried on according to the method introduced above, and value coefficient is calculated according to function importance coefficient and cost coefficient calculated. When value coefficient V<1, it shows the qualities and abilities of applicant are low relative to the salary which this company provides. At this time the applicant should not be employed; When value coefficient V>1, it shows the qualities and abilities of applicant are high relative to the salary which this company provides. In this kind of situation, if not enhancing the salary for the applicant, the applicant is very easy to leave his job, but raising the wages will increase the cost. So this kind of situation should be given careful consideration; When value coefficient V=1, it shows the qualities and abilities of applicant are in accordance with the salary which this company provides. At this time, the staffs are most likely to remain the best work potency on this post, achieve the superiorly efficiency, and also obtains the ideal repayment, which is in an ideal state of equilibrium. At this time
cost function
proportion of function cost relative to total
cost
Score of interview coefficient of current function cost
ability of dealing with pressure 5% 70 0.05
ability of collecting and dealing with information 10% 80 0.0875
ability of communication 20% 90 0.156 ability of using OFFICE 3% 65 0.323
Work language 4% 85 0.035 Team work 35% 85 0.303
Customer service 15% 80 0.1313 initiative 8% 60 0.933
International Journal of Business and Management June, 2008
37
the applicant should be employed. Take applicant Zhang for example, calculate his current function cost coefficient, and then calculate the value of applicant. Relevant data can be seen in Table 5: Table 5. Value analysis of applicant zhang
Seeing from table 5 that value of applicant zhang respectively is: 0.994, 1.225, 1.449, 0.740, 0.967, 1.088, 1.187, 0.841. Seeing from the data, the majority of his each function value is more than 1, only the ability of using OFFICE and initiative are relatively weak, and these two factors are not particularly important factor. Therefore, applicant zhang may be considered to more appropriate for this work. The same method can also be used in value analysis of applicant wang and applicant li. It shows that after analysis: the value of applicant wang respectively is: 0.906, 0.753, 0.658, 1.025, 1.137, 0.653, 0.739, 0.864, 0.913. The most data of value of applicant wang is less than 1 discovering from data, only the minority reaches the standard, and applicant wang does not achieve requirement of ability comparatively important to this post. So the applicant can be considered not suitable for this post. The analytical result of applicant Li is also worth paying attention, and his analytical results of value are as follows: 1.532, 1.421, 1.066, 1.372, 1.333, 1.009, 0.975, 1.374. The value of applicant is very high discovering from the data, and his each value of index is almost greater than 1. So we can be sure he is a very good person, and he will be competent in this post with ease. But if he will be long-term in the post should also similarly be considered. So recruiters must do fully investigation about this regard during the retest. If the applicant is willing to sign long-term contracts or the company may consider promotion in the future, under these circumstances, we may consider enroll this applicant. If not the case, the company should give careful consideration. 3. Brief summary The above is the application of value engineering in the selection of salesman. The process may be relatively more complicated compared to other methods. But the staffs recruited by this method are all staffs of truly having value to company, which can reduce the rate of salesman turnover to a great extent, reduce staffs’ training expense, thus reduce the cost and improve performances rather than waste time and financial resource in dealing with incompetent staffs afterwards. References [Chinese] Xiao Zhengming, & [English] Mark Cook. (2003). Evaluation of Staff Quality, Beijing: Higher Education Press, pp.68-72. Beijing Value Engineering Academic Society. (2004). The collection of essays----- value engineering and value management development: China and the world, Beijing: Machinery Industry Press, pp.50-51. Brenda J. Lister, & Andree Mercier. (1996). Evaluating Job Content: An Approach to Establishing a Job-Worth Hierarchy, ACA, pp.5-6. Chen Wansi. (2004). Study on the Competency Model for Human Resource Administrators in Chinese Companies, thesis of doctor degree, College of Xiamen. Huang Haoran, Yu Shouhua, Yang Dantong, & Dong Shaoxian. (2006). The Application of Analytical Hierarchy Process in Value Engineering, Value Engineering, 10, pp59-61.
cost function
coefficient of current function
cost
coefficient of function importance personnel value of
applicant
ability of dealing with pressure 0.05 0.0497 0.994
ability of collecting and dealing with information 0.0875 0.1072 1.225
ability of communication 0.156 0.226 1.449 ability of using OFFICE 0.323 0.0239 0.740
Work language 0.035 0.0339 0.967 Team work 0.303 0.3294 1.088
Customer service 0.1313 0.1559 1.187 initiative 0.933 0.0785 0.841
Vol. 3, No. 6 International Journal of Business and Management
38
Research on the Management of Public Crisis and
Environmental Monitoring System of Tourism Hejiang Shen
College of Resources & Environment Science, Hebei Normal University, ShiJiaZhuang 050016, China E-mail: [email protected]
Liqin Zhao School of Management, China University of Mining & Technology (Beijing), Beijing 100083, China
Department of Mathematics, ShiJiaZhuang University, ShiJiaZhuang 050035, China E-mail: [email protected]
Abstract The paper discusses the main problems of tourism in current China by recognizing the influence and harm of public crisis on tourism. And then the essential assumption is put forward to strengthen the environmental protection and build an effective monitoring system of tourism. Keywords: Public crisis, Tourism environment, Monitoring system Tourism environment is an important component of the social environment and it is an important place where tourists can enjoy the return to nature, relax and open recreation and the learning experience. It indicates the improvement of the tourism quality and aesthetic taste. At the same time it is also the carrier of sustainable development and harmonious building in tourism. But occurrences of the public crisis, which poses hard threat to human safety and social steadiness, and becomes the most minatory factor which makes tourism industry become the most sensible and suffer the most serious loss. Therefore, the emphasizing on study and how to fully acknowledge the imaginable harm caused by the public crisis possess academic and practical meaning to the problems such as how to strengthen the environmental building, how to improve the attraction of Chinese tourist destination, how to increase the total competition of Chinese tourism industry, how to realize the sustainable development of tourism industry, how to beautify tourism environment, and how to raise the consumer’s life level. To make the object come true, the building of perfect and scientific monitoring system of tourism that is made to anticipate the crisis, to take precautions against crisis, and to deal with crisis is our first instant imperative. The paper just gives the discussion on the previous study. 1. The harm and influence of public crisis on tourism 1.1 Identification of public crisis Public crisis usually refers to the abrupt accident or state of emergency. But now in academic circles many views diverge reasonably. Kathleen Fearn-Banks, one scholar, claims that “crisis is that one incident obstructs normal business transactions and potentially threatens business survival”. Otto Lebinger defines “the crisis as the event threatening the company’s interest rates obtained in future, growing, even survival” (Zhu,2003); However, analyzing from the influence of crisis, some scholars such as Ren-shengde, Xie-bing give the explanation that “ crisis is the incidents or actions potentially making the downside to the honor or credit ,even the economy of local organization(government or enterprise)”( Ren,2003); In addition, many internal scholars who make the crisis contacted with the opportunity consider that in the one hand, crisis stands the dangerous circumstance, in the other hand it also stands lots of opportunities, which dialectically interprets that the crisis and opportunity are the two sides of incident’s development, and that crisis involves the opportunity (Zhang,2003). All the views above have the common characteristic which emphasizes the result of the crisis, and considers the crisis as some kind of disadvantage taken by the harmful incidents to some organization, and “they rarely have the deep anatomy on the origin of crisis” (Zhu, 2003). 1.2 Connotation and harm of public crisis Public crisis differed from the normal accident is not only the crucial instance usually making the great influence to the public life, but also the state of emergency in general which means that “the crisis’ occurrence and eruption that run beyond the ability of the government and social management badly effect the social normal operation and threaten the life, property, and environment and so on, so it requires special measures adopted by the government and society” (Zhang, 2003). The emergencies of public crisis such as 9.11 in American , SARS in 2003, bird flu
International Journal of Business and Management June, 2008
39
erupted in the spring in 2005 all have brought the austere issue that is how to deal with the crisis and how to acknowledge the crisis to the academic and industry ,especially the government. Nowadays, the issue has become the important one that urgently need to be researched. Obviously, the public crisis involves in every aspects of social life, it moreover disorganize the normal social economy instantaneously. How to break away from the hardship not only demands the public administrative management make the decision timely, but also need a high payment. Perniciousness of the public crisis is tremendous. According to the data offered by Global Disaster Statistic, from 1996 to 2000, various disasters and crisis make the economy lost as high as 253 billion dollars, and make 425.000 people die. In the last decade, only the various crisis caused by the nature disaster make the number of the influenced people reach 211 million every year. In developing countries, the number of people died of all kinds of disaster and crisis is 95% of the dead people. During the past 3 decades, nearly half disaster and crisis of the whole world happened in Asia, as the result, Asia becomes the area where the various disasters happen much frequently and is 80% of the world population influenced by disaster and 40% of the dead people and 46% of the economic loss(Zhang,2003). Simultaneously, perniciousness of the public crisis has some extensibility. According to the news from Xinhua News Agency, the latest report issued by Economic Committee of APEC on November the 16th, 2005 indicates that America has lost about 662 billion dollars until 2003 since the events happened on September the 11th, 2001. The loss includes direct loss, macroeconomic shock caused by the decline of consumers’ confidence, and the increasing expenses of security and national defense, and the specific digitals are 45 billion dollars for direct loss, 175 billion dollars for macroeconomic loss, 442 billion dollars increased for security and national defense. Therefore, the loss caused by the eruption of public crisis is not merely on the surface layer, moreover, in the deep level it can make the national economy assigned on a large scale (Yanzhao metropolis newspaper,2005). 1.3 The influence of public crisis on tourism To tourism industry, the harm of public crisis is much more obvious. Tourism activity is the spatial alternation which refers to people leaving from their ghetto to dissimilar place and is the most obvious feature of tourism activity. So tourists’ purpose of the realization of tourism actions must possess great sensibility to the destination’s tourism environment which not only lies on the perfection of integrated system for the six elements-food, hospice, traffic, visiting, shopping, entertainment-in the process of tourism, but also the public security of the destination. Apparently the public security’s current situation of the tourist destination determines the degree of tourists’ accessibility, which also lies on whether the public crisis happens or not. To the tourist activity, the occurrence of public crisis must result in two effects, one is the discontinuity of the ongoing tourist activity, the other one is the cancellation of the unformed tourist action. So the consequence of the above circumstance makes the tourism industry suffer obvious loss certainly. At the same time, the downside brought by public crisis occurrence to the tourism environment is far-reaching. On the one hand, it not only brings about fear and pressure in the tourists psychology, but also lowers the attraction of tourist destination largely, on the other hand, it brings downside to the tourist destination’s environmental safety, environmental health and environment of food and drink. For instance, SARS influenced the tourism industry in our country heavily in 2003. According to the estimated material, the loss of tourism industry in our country should exceed 210 billion in 2003. SARS is the disease with high infectivity, spread velocity, tremendous harm and high mortality rate, until May 2003, it has spread out to 21 provinces since the first case appeared in Guangzhou in November 2002 and become the main enemy jeopardizing the society in our country. The harm and the involved area are so gigantic and wide that we have rarely met before. First, SARS has infectivity. Based on the chemical certification, the path of the infectivity is the close touch between people, especially in the assembled public place such as the supermarkets, bus stations, ports and airports, etc. It is universally acknowledged that the tourism industry is the comprehensive industry that offers the service of the food and drink, the residence, the traffic, the tour, the shopping, the amusement and so on to the tourists. This industry contains all the social departments and every tourist organization, so it possesses the great comprehensive feature. It can clearly be seen that the tourism industry is such one with rather assembled and widely-moving population. Confronting the high infectivity of SARS, tourism environment is deemed to the initial problem attracts the most attraction. To permit SARS to spread out, the government adopts the emergency measures that are the cancellation of the long vocation in May Day and the discontinuity of various tourist activities for the purpose of permitting the further spreading of SARS caused by the wide movement of tourists. Secondly, SARS spreads fast. The pathogen of SARS with frequent saltation has been confirmed as the corona virus like the cold virus. The spread has many ways that mainly are the close touch, saliva and the breath of people. The tourism environment undoubtedly becomes the important place where the pathogen spread because of its features that are tourists’ gather and wide movement. Thirdly, SARS has intricate cause of disease. Therefore, during the process of the cure, there was no effective medicine to kill the SARS virus at that time, so it is necessary to adopt the measure of separation and halt the tourism activity by administrative means. The occurrence of SARS brought the great loss to our country’s tourism
Vol. 3, No. 6 International Journal of Business and Management
40
industry. And the prosperous tourism steps into the state of dormancy or shock dormancy in the turn of a hand, simultaneously, the travel agency also steps into the lowest stage of development since the People's Republic of China was founded. Certainly, the reasons why the previous circumstance appears must be related to the feature of SARS itself and the characteristic of the tourism industry. However, surveyed carefully, when the tourism environment faces this epidemic situation abruptly appearing, it exposed many related elements that were considered as the important reasons for the influence of the unavoidable epidemic situation. 2. The analysis on the present condition of our country’s tourism environment All the catastrophes caused by the nature are the disaster for the human being, for the human being can not resist on the nature. Recently, as developing fastly, the tourism industry has already become the important cornerstone industry of our country, which brings the social benefit and economy benefit; also, it becomes the new economic growth point. But in fact, we emphasized too much the economy benefit of tourism than the social benefit, especially the insistence on the scientific development and the reality of the sustainable development of the tourism industry especially the environmental problem in the tourism development, which to a cetain extent plants the foreshadowing for the occurrence of the crisis. 2.1 Tourism environmental quality is not optimistic As we all know, Clean and beautiful, comfortable and convenient, safe and sanitation, relaxed and happy travel environment is the basis for the survival and development of the tourism industry. So, “a good enviroment is an important basis for the tourism development, and the development of the tourism also can have a good effect on the enviroment protection.”(Lin, 1999), the tourism envrioment influence the continuing development of the tourism. But recent years, the tourism development shows that people pay much more attention on the economic benefit, and ignore the social benefit of the tourism. Among them, the improvement and controling for the tourism enviroment lack a set of efficient means. The tourism enviroment protection and construction are paid less attention and the social benefit of the tourism enviroment are ignored. The tourism action cause a lot of problems, such as air pollution, sound pollution, water pollution and the damage of the zoology vegetation. The over-exploitation of the tourism resource cause the change of the entironment, the damage of the nature and human sight by the people flow and the decline of support ability of the resource and the tourism facility, all the problems have influenced the tourism environment’s entry. These problems have become a kind of social problem and attract more and more people’s attention. The practice proved that, the tourism environment is the precondition and baisis for the continuing development of the tourism, and the environment quality have a direct effect on the tourism’s longterm development. 2.2 Public crisis’s challenge to the tourism environment As the public crisis not only has enormous threatening and destructive ablility, but also has unexpected and uncertain characteristic, if the public crisis break out, the desaster it brings will be heavy. However, public crisis can be prevented, controlled and lowered. As far as tourism is concerned, to strengthen the prevention and control of public crisis, the primary task is to build up an environment controlling system for the industry, and to reinforce the improvement and consolidatation. Improving tourism environment and regulating environment order are the main contents of the sustainable developemt in tourism. furthermore, the destruction of resource caused by the decline of resource loading ability due to tourism activity can be prevented, if a seris of measures can be carrid out to control the deterioration of some environment such as traffic, dinner and accommodation which is the result of overexpantion of tourism activity. Tourism activity involves various social sections. It is its basic elements, tourism subject, object and tourism media that constitute tourism industry. Tourism subject, namely tourists, is the dominating element and always is at the center of tourism activity. But tourists are differ in thousands ways. The different vocation, age, gender, education background of tourists who come from different region and countries give the group great complexity and diversity. Tourism object is the object of tourism activity, namely tourism resources, including natural resources, human and social resources, which are important carrier of tourism industry. Tourism media is the bond that links subject and object together, such as travel agencies, travel service constitutions, travel traffic department and the travel sections of catering, entertainment and shopping. Therefore, the areas that tourism industry involves are very extensive, and whether tourists, who are the most essential part of tourism activity, can accomplish their traveling goals are depend on the effective operation of every aspect of tourism activity as catering, accommodation, traffic, visit, shopping and entertainment. All these activities imply tourists’ characteristic: universality, complexity and mobility. The side effect of these features provide the possibility for the spread of some serious epidemics such as SARS and Bird Flu, and make tourism become an important approach to spread epidemics and cause great safety incidents, such as the
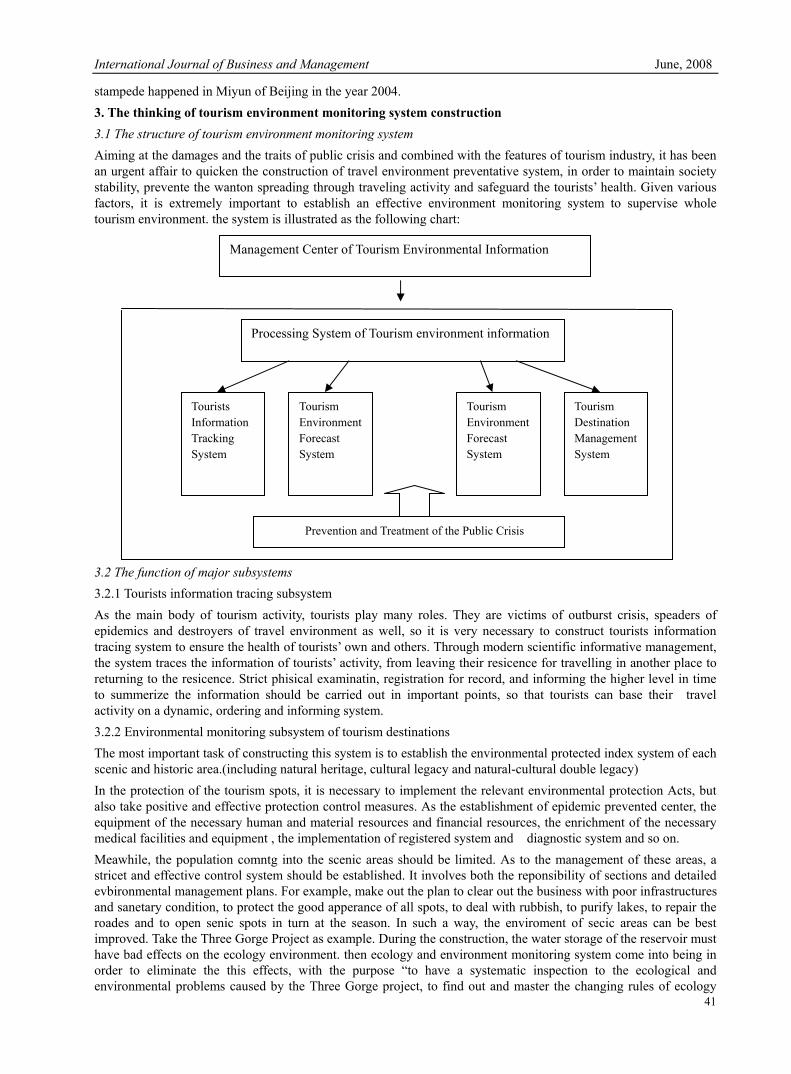
International Journal of Business and Management June, 2008
41
stampede happened in Miyun of Beijing in the year 2004. 3. The thinking of tourism environment monitoring system construction 3.1 The structure of tourism environment monitoring system Aiming at the damages and the traits of public crisis and combined with the features of tourism industry, it has been an urgent affair to quicken the construction of travel environment preventative system, in order to maintain society stability, prevente the wanton spreading through traveling activity and safeguard the tourists’ health. Given various factors, it is extremely important to establish an effective environment monitoring system to supervise whole tourism environment. the system is illustrated as the following chart:
3.2 The function of major subsystems 3.2.1 Tourists information tracing subsystem As the main body of tourism activity, tourists play many roles. They are victims of outburst crisis, speaders of epidemics and destroyers of travel environment as well, so it is very necessary to construct tourists information tracing system to ensure the health of tourists’ own and others. Through modern scientific informative management, the system traces the information of tourists’ activity, from leaving their resicence for travelling in another place to returning to the resicence. Strict phisical examinatin, registration for record, and informing the higher level in time to summerize the information should be carried out in important points, so that tourists can base their travel activity on a dynamic, ordering and informing system. 3.2.2 Environmental monitoring subsystem of tourism destinations The most important task of constructing this system is to establish the environmental protected index system of each scenic and historic area.(including natural heritage, cultural legacy and natural-cultural double legacy) In the protection of the tourism spots, it is necessary to implement the relevant environmental protection Acts, but also take positive and effective protection control measures. As the establishment of epidemic prevented center, the equipment of the necessary human and material resources and financial resources, the enrichment of the necessary medical facilities and equipment , the implementation of registered system and diagnostic system and so on. Meawhile, the population comntg into the scenic areas should be limited. As to the management of these areas, a stricet and effective control system should be established. It involves both the reponsibility of sections and detailed evbironmental management plans. For example, make out the plan to clear out the business with poor infrastructures and sanetary condition, to protect the good apperance of all spots, to deal with rubbish, to purify lakes, to repair the roades and to open senic spots in turn at the season. In such a way, the enviroment of secic areas can be best improved. Take the Three Gorge Project as example. During the construction, the water storage of the reservoir must have bad effects on the ecology environment. then ecology and environment monitoring system come into being in order to eliminate the this effects, with the purpose “to have a systematic inspection to the ecological and environmental problems caused by the Three Gorge project, to find out and master the changing rules of ecology
Processing System of Tourism environment information
Tourists Information Tracking System
Tourism EnvironmentForecast System
Tourism EnvironmentForecast System
Tourism Destination Management System
Prevention and Treatment of the Public Crisis
Management Center of Tourism Environmental Information
Vol. 3, No. 6 International Journal of Business and Management
42
and environment in the Yangzi River basin after the building of the dam, to validate and check the appraisal results of effects on environment so as to provide basis for environmental construction and management of the reservoir area, and to check and put into effect the environmental protective measures during the running and construction of the project” (Tao,2002),The major functions of the system are “ organizing those related sections in the project- affected area to form a cross- regional, cross-department and interdisciplinary monitoring network; carrying out regular inspection, observation and investigation of important ecvironment elements, and seting down the monitoring technique regulation for some items such as hydrology, meteorology, sediment, water quality and so on, having regulare analysis of the monitoring materials so that put forward record and annuals of the environmental quality; establishing an ecological and environmental information database and analyzing the dynamic current so the contermeasures for eliminating the bad effects on ecology and environment can be brought forward; and performing following monitor, supervising, investigation and handling of the outburst ecological and environment accidents.” the system is an enormous scientific monitoring network, including 12 subsystems, namely meteorological observation, the monitoring of atmosphere, noise, water quality, hydrology and sediment, hydrobiology, earthquake and the obserbvation of reservoir band stability, earth resource, terrestrial animals and plants as well as species resources, the obserbation and investigation of population health, and the automatization monitoring (Tao, 2002). 3.2.3 The controling subsystem of tourism management industry. Tourism management trade is the main body of the healthy development of tourism, and is the emphasis of tourism environmental prevention system. It consists of travel agencies, star-level hotels, travel traffic department, travel consultation institution and so on. The regulation of the trade should be based on unified informative managemen, and then an interactive platform can be established between different travel enterprises through technical interface. Such as Various types of enterprises reporting system, including the number of the attraction and the reception of tourists, the tourists geopolitical relationship, the safety precautions for the tourist and so on. Tourism Enterprises should focus to take protective measures on the prevention of the sudden crises and various of the epidemic. For example, the shared facilities and equipment of Various of Star-rated hotels, toilet, rooms, telephone, the corridor and etc. These important places need disinfection and cleaning up; Health and safety targets of stations, ports and terminals, the airport; the Setting standards of epidemic medical institutions, the medical facilities and equipment, the prevention measures of the outbreak of disease, etc. The tourism charge departments should intensify the supervision and management of the system, to ensure the system operate effectively by the measures of the System, supervision and inspection. 3.2.4 The forecast subsystem of tourism environment information service This system is for the purpose of regulating the traveling environment quality from macroscopic and the microscopic aspects, and establish a set of scientific and effective management by supervision pattern and the traveling environment appraisal system through the joint network of the scenic spot, the traveling culture city, traveling transportation system, traveling hotel, travel agency,and so on. For exemple, the climatic change of the traveling scenic area, the air quality forecast, the maxim population index, touring line supporting capacity index, management of traveling vehicle index, the scenic spot service standard index, examination and forecast of tourist’s state of health , establishment and operation of medical service organization, and so on. At the same time, the system should increase the propaganda of related traveling policies and common sense, the security knowledge, the epidemic situation knowledge information’ s propaganda and service, announcement of related epidemic, the traveling guide, the traveling tendency and so on.Through the operation of this system, the entire traveling environment presents one kind of virtuous and dynamic development situation. In brief, crisis is the hidden danger in the tourism development, attach importance to the public crisis, hold closely the important link of traveling environment quality, grasp jointly and manage concertedly the tourism development, the environment quality and the crisis prevention. Properly handling the relations between the short-term interests and the long-term interests, the department interests and the national interests, economic interests, the social benefit and the environment benefit. “Enlarge investment in environmental monitoring, supervisory, emergency system,and propaganda ability construction”. “Improve the environment and safety information, emergency monitoring and early warning system and establish a mechanism for sharing of information resources, the environment for accurate judgement of the situation,provide basis of decision-making for unexpected incidents ”( Xie ,2005),so the tourism environment will be having a long-term development, tourism environmental quality will be improved fundamentally and the tourism industry will be into the healthy, sustained, safe and orderly development track. References ‘9.11’ Made America Take a Loss About 662 Billion, (2005). Yanzhao metropolis newspaper.11,17.

International Journal of Business and Management June, 2008
43
Lin Yueying. (1999).Introduction to Tourism environmental conservation, Tourism Education Press(2). Rendesheng etal, (2003). A Handbook of Tiding over the Crisis, New World Press.(5). Tao Jingliang. (2002).100 Questions for Three Gorges Project of the Yangtze River, Chinese Sanxia Press,(6). Xie Zhenhua, (2005). Our Country’s Environmental Conservation in New Period, Xinhua Tabloid (16). Zhang Chengfu, (2003). Public Crisis Management: Mode of All-around Integration and Choice for Chinese strategy, Chinese Public Administration (7). Zhang Yubo. (2003). Brainpower of Crisis Management, China Machine Press (7). Zhu Yanzhi, ( 2003).Business Crisis Management, China Textile & Apparel Press,(7).
Vol. 3, No. 6 International Journal of Business and Management
44
Does Economic Environment Affect Ownership-performance Relation?
Evidence from Financial Deregulation in Japan
Yabei Hu (Corresponding author) Graduate School of Economics and Management, Tohoku University, Sendai 9808576, Japan
Hebei University, Baoding 071002, China Tel: 81-2-2728-0261 E-mail: [email protected]
Shigemi Izumida
Graduate School of Economics and Management, Tohoku University, Sendai 9808576, Japan Tel: 81-2-2795-6277 E-mail: [email protected]
Abstract This paper examines the effect of the changing economic environment on the relationship between ownership structure and corporate performance by comparing 1984 and 2004 samples of Japanese manufacturing firms. The 1984 evidence shows that in a tightly regulated environment, ownership has little effect on performance. However, the 2004 result presents that in an increasingly market-oriented environment, the overall ownership concentration, as well as certain types of shareholders, is significantly correlated with performance. The contrasting findings suggest that the ownership-performance relation has been influenced by the transformation of corporate governance environment caused by the financial deregulation in Japan over the past two decades. Keywords: Ownership structure, Corporate performance, Financial deregulation 1. Introduction Japanese financial deregulation over the past two decades has created an economic environment which differs from that of postwar. From a viewpoint of corporate governance, it is a noteworthy issue that the economic transformation may influence the effect of ownership structure on corporate performance. Although the ownership-performance relation in Japan has been the subject of a great volume of literature, this issue has received less attention. To this end, this paper contributes to the existing research by empirically exploring whether and how the ownership-performance relation is affected by the shifts of the economic environment driven by the financial deregulation in Japan. The debate on the ownership-performance relation dates back to Berle and Means (1932), who argue that the separation of ownership and control induces the potential that managers deviate from shareholders’ best interests. This concern is developed further by Jensen and Meckling (1976) into agency theory, which has subsequently become known as the guiding framework for corporate finance and governance studies. Since then, researchers have advanced alternative hypotheses to explain the ownership-performance relation, but neither theory nor empirical evidence has reached an agreement. We argue that the lack of attention to the environment in which ownership affects performance could explain, at least partially, the discrepancies among previous research. The ownership-performance relation varies with the realities of the corporate governance environment — the community in which firms operate, the political landscape, and more generally the markets and law/regulation of increasing interest to researchers. Therefore, contextualizing the ownership-performance relation within a broader environment may yield additional insight into this field. To extend this line of research, we examine the cross-sectional relation between ownership and performance with two separate investigation periods, fiscal year 1984 and 2004 (Japanese fiscal year runs between April 1st of the first year and March 31st of the second year). The evidence shows that there is no significant association between ownership and performance in 1984, while the overall concentration of ownership, as well as particular types of shareholders, is significantly correlated with performance in 2004. The contrasting results can be viewed as the evidence of the influence of the economic environment on the ownership-performance relation. The remainder of this paper is organized as follows. Section 2 examines the transition of ownership structure as the financial deregulation proceeded in Japan. Section 3 conducts a literature review and considers testable implications. In Section 4, we describe our data and research design. The empirical results are presented in Section 5 and conclusions are in Section 6. 2. The Changes of Japanese Ownership Structure in Deregulated Financial Markets Japanese ownership structure has changed substantially over the last twenty years. As of 2005, the percentage of equity
International Journal of Business and Management June, 2008
45
ownership held by financial institutions decreased to 31.6% from 43% in the late 1980s. The non-financial corporate shareholdings also declined to 21.1% from 30.1% over the same time. The corollary to the decline in domestic institutional ownership was an increase in foreign shareholding, which jumped from 4.2% in 1989 to 26.7% by 2005. Simultaneously, individual equity ownership was stable at 20% more or less. (See Figure 1) Similarly, the NLI Research Institute (2004) reports the shifts of shareholding pattern. Stable-shareholding and cross-shareholding respectively decreased by more than 20% and more than 10% from 1987 to 2003. Especially since 1997, the first implement year of “Japan’s Big Bang” reforms, banks have begun to dispose of their shares in industrial firms after industrial firms selling their bank shareholdings which took place in the early 1990s. As a result, both stable and cross-shareholding have fallen quite sharply. By 2001, stable shareholding had been lower than 33%, which is the borderline that shareholders have enough voting control to reject the firm’s proposal or to deter external takeovers (Miyamoto, 2004). (See Figure 2) Although the deep ownership structure changes may occur for a variety of reasons, we take a special view on the financial deregulation in Japan. 1984 was a landmark year for Japanese financial deregulation. In that year the United States and Japan reached the Yen-Dollar Agreement on a wide range of deregulatory measures to liberalize Japan’s financial system. The “gradualist approach” deregulation processes were accelerated into a “radical stage” by “Japan’s Big Bang” reforms. In 1996, the Japanese government announced details of the financial deregulation package, which aimed to create a “free, fair and global” financial system. “Big Bang” has reformed the Japanese financial system and legal system comprehensively, and created a new corporate governance environment. The noteworthy deregulatory measures that have profound effects on ownership structure are as follows. First, deregulation on corporate bond issues. The Japanese straight bond market had been tightly regulated for a long time, which limited firms’ opportunities for direct financing. The criteria for issuing straight bonds have been relaxed gradually since 1984 and completely removed in January 1996. A result of the full liberalization was an increase in the amount of straight bonds issued balanced with a reduction in bank financing, which partly explains the distinct decline of stable and cross-shareholding since the mid-1980s. Second, deregulation on financial institutions. Mired in a prolonged and serious recession, Japan has committed itself to the creation of a competitive banking industry to cure the ailing financial system. Banks are prohibited from providing soft loans to the industry as before. In addition, bad debts, shirking assets and expensive rescue operations limit the abilities and willingness of banks to lend both within and outside the keiretsu (corporate group). Japanese banks are shifting their strategies from relationship banking toward investment banking and capital markets. The ties between firms and banks loosened. Finally, deregulation on foreign investment. The present trend in the development of ownership structure around the whole world is marked by a growing fraction of shares held by foreign investors due to globalization of equity markets and equity investment. With respect to Japan, regulatory reforms in the financial system, accompanied by improvements in corporate law, bankruptcy law and accounting principles help attract foreign capital to Japanese firms. Consequently, foreign shareholding has risen steadily during recent years. 3. Ownership Structure and Corporate Performance: Theory and Evidence 3.1 Concentrated Ownership and Corporate Performance: Monitoring vs. Expropriation The concentration of ownership may give a blockholder both the means (enough voting rights) and the incentives (internalization of benefits) to monitor managerial decision-making. As better monitoring of large shareholders partially resolves agency problems inherent in widely held firms, improved performance seems to be expected (Grossman and Hart, 1986; Shleifer and Vishny, 1997). However, a competing view is that concentrated ownership tends to give a dominant shareholder power to expropriate other investors or stakeholders, and then degrades corporate value (Shleifer and Vishny, 1997; La Porta et al., 2002). Whether benefits outweigh costs depends on how ownership is concentrated and the macroeconomic environment where firms are embedded. With respect to Japan, the evidence is mixed. Prowse (1992), using shareholding data from 1984, reports that ownership concentration and return on assets are unrelated in both independent and keiretsu firms. Lichtenberg and Pushner (1994), however, employing data from 1976 to 1989, document evidence of a strong negative coefficient associated with the top ten shareholdings in the regressions of total factor productivity. As in the preceding Section 2, the financial deregulation has resulted in the significant transformation of blockholders’ component and corporate governance environment. If the changing environment does matter, the regression results of performance on concentration should be quite different when the data used are from alternative periods. Without taking account for the dynamic change, prior studies can not clearly define the concentration-performance relation. For this reason, the paper compares the pre-deregulation 1984 sample and the post-deregulation 2004 sample to test the possibility. 3.2 Types of Shareholders and Performance Various motivations and abilities of different types of shareholders may result in their distinctive effectiveness to
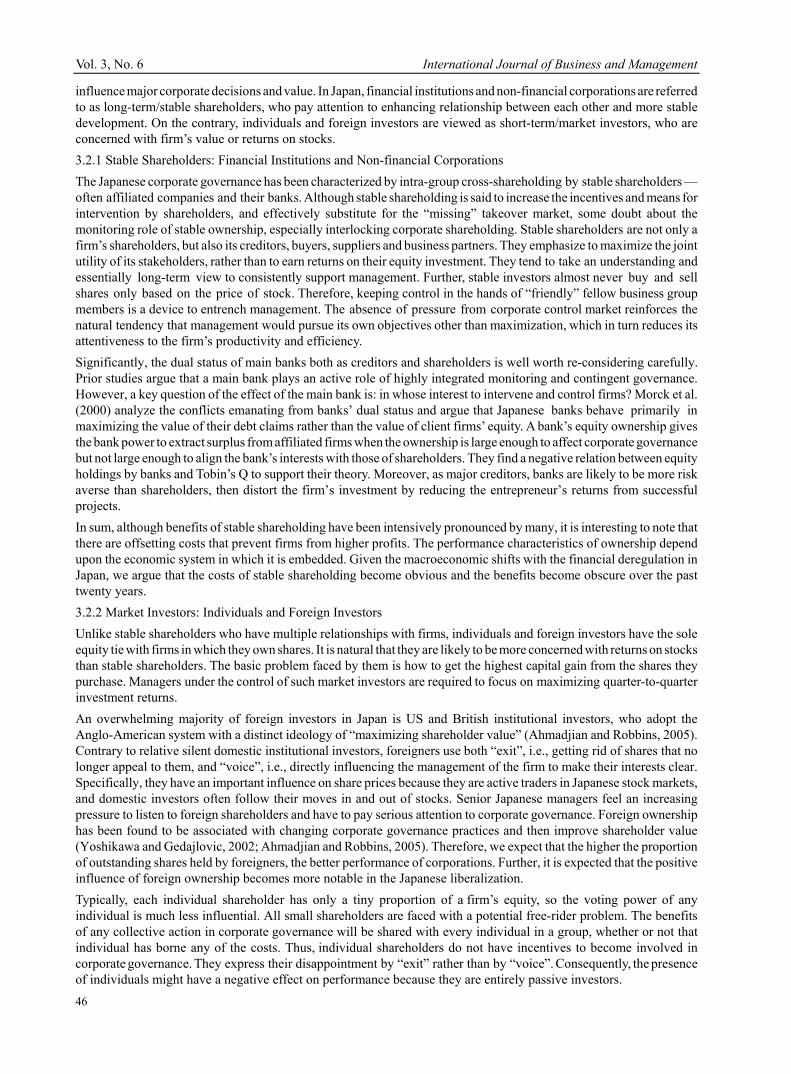
Vol. 3, No. 6 International Journal of Business and Management
46
influence major corporate decisions and value. In Japan, financial institutions and non-financial corporations are referred to as long-term/stable shareholders, who pay attention to enhancing relationship between each other and more stable development. On the contrary, individuals and foreign investors are viewed as short-term/market investors, who are concerned with firm’s value or returns on stocks. 3.2.1 Stable Shareholders: Financial Institutions and Non-financial Corporations The Japanese corporate governance has been characterized by intra-group cross-shareholding by stable shareholders — often affiliated companies and their banks. Although stable shareholding is said to increase the incentives and means for intervention by shareholders, and effectively substitute for the “missing” takeover market, some doubt about the monitoring role of stable ownership, especially interlocking corporate shareholding. Stable shareholders are not only a firm’s shareholders, but also its creditors, buyers, suppliers and business partners. They emphasize to maximize the joint utility of its stakeholders, rather than to earn returns on their equity investment. They tend to take an understanding and essentially long-term view to consistently support management. Further, stable investors almost never buy and sell shares only based on the price of stock. Therefore, keeping control in the hands of “friendly” fellow business group members is a device to entrench management. The absence of pressure from corporate control market reinforces the natural tendency that management would pursue its own objectives other than maximization, which in turn reduces its attentiveness to the firm’s productivity and efficiency. Significantly, the dual status of main banks both as creditors and shareholders is well worth re-considering carefully. Prior studies argue that a main bank plays an active role of highly integrated monitoring and contingent governance. However, a key question of the effect of the main bank is: in whose interest to intervene and control firms? Morck et al. (2000) analyze the conflicts emanating from banks’ dual status and argue that Japanese banks behave primarily in maximizing the value of their debt claims rather than the value of client firms’ equity. A bank’s equity ownership gives the bank power to extract surplus from affiliated firms when the ownership is large enough to affect corporate governance but not large enough to align the bank’s interests with those of shareholders. They find a negative relation between equity holdings by banks and Tobin’s Q to support their theory. Moreover, as major creditors, banks are likely to be more risk averse than shareholders, then distort the firm’s investment by reducing the entrepreneur’s returns from successful projects. In sum, although benefits of stable shareholding have been intensively pronounced by many, it is interesting to note that there are offsetting costs that prevent firms from higher profits. The performance characteristics of ownership depend upon the economic system in which it is embedded. Given the macroeconomic shifts with the financial deregulation in Japan, we argue that the costs of stable shareholding become obvious and the benefits become obscure over the past twenty years. 3.2.2 Market Investors: Individuals and Foreign Investors Unlike stable shareholders who have multiple relationships with firms, individuals and foreign investors have the sole equity tie with firms in which they own shares. It is natural that they are likely to be more concerned with returns on stocks than stable shareholders. The basic problem faced by them is how to get the highest capital gain from the shares they purchase. Managers under the control of such market investors are required to focus on maximizing quarter-to-quarter investment returns. An overwhelming majority of foreign investors in Japan is US and British institutional investors, who adopt the Anglo-American system with a distinct ideology of “maximizing shareholder value” (Ahmadjian and Robbins, 2005). Contrary to relative silent domestic institutional investors, foreigners use both “exit”, i.e., getting rid of shares that no longer appeal to them, and “voice”, i.e., directly influencing the management of the firm to make their interests clear. Specifically, they have an important influence on share prices because they are active traders in Japanese stock markets, and domestic investors often follow their moves in and out of stocks. Senior Japanese managers feel an increasing pressure to listen to foreign shareholders and have to pay serious attention to corporate governance. Foreign ownership has been found to be associated with changing corporate governance practices and then improve shareholder value (Yoshikawa and Gedajlovic, 2002; Ahmadjian and Robbins, 2005). Therefore, we expect that the higher the proportion of outstanding shares held by foreigners, the better performance of corporations. Further, it is expected that the positive influence of foreign ownership becomes more notable in the Japanese liberalization. Typically, each individual shareholder has only a tiny proportion of a firm’s equity, so the voting power of any individual is much less influential. All small shareholders are faced with a potential free-rider problem. The benefits of any collective action in corporate governance will be shared with every individual in a group, whether or not that individual has borne any of the costs. Thus, individual shareholders do not have incentives to become involved in corporate governance. They express their disappointment by “exit” rather than by “voice”. Consequently, the presence of individuals might have a negative effect on performance because they are entirely passive investors.
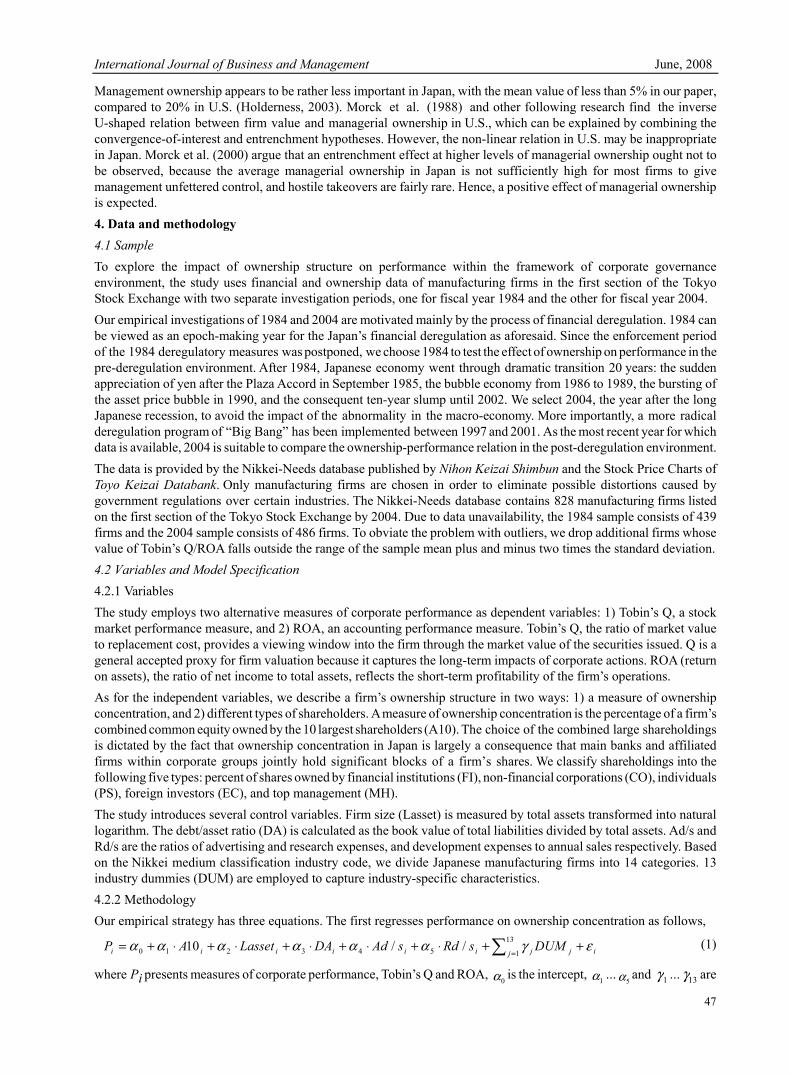
International Journal of Business and Management June, 2008
47
Management ownership appears to be rather less important in Japan, with the mean value of less than 5% in our paper, compared to 20% in U.S. (Holderness, 2003). Morck et al. (1988) and other following research find the inverse U-shaped relation between firm value and managerial ownership in U.S., which can be explained by combining the convergence-of-interest and entrenchment hypotheses. However, the non-linear relation in U.S. may be inappropriate in Japan. Morck et al. (2000) argue that an entrenchment effect at higher levels of managerial ownership ought not to be observed, because the average managerial ownership in Japan is not sufficiently high for most firms to give management unfettered control, and hostile takeovers are fairly rare. Hence, a positive effect of managerial ownership is expected. 4. Data and methodology 4.1 Sample To explore the impact of ownership structure on performance within the framework of corporate governance environment, the study uses financial and ownership data of manufacturing firms in the first section of the Tokyo Stock Exchange with two separate investigation periods, one for fiscal year 1984 and the other for fiscal year 2004. Our empirical investigations of 1984 and 2004 are motivated mainly by the process of financial deregulation. 1984 can be viewed as an epoch-making year for the Japan’s financial deregulation as aforesaid. Since the enforcement period of the 1984 deregulatory measures was postponed, we choose 1984 to test the effect of ownership on performance in the pre-deregulation environment. After 1984, Japanese economy went through dramatic transition 20 years: the sudden appreciation of yen after the Plaza Accord in September 1985, the bubble economy from 1986 to 1989, the bursting of the asset price bubble in 1990, and the consequent ten-year slump until 2002. We select 2004, the year after the long Japanese recession, to avoid the impact of the abnormality in the macro-economy. More importantly, a more radical deregulation program of “Big Bang” has been implemented between 1997 and 2001. As the most recent year for which data is available, 2004 is suitable to compare the ownership-performance relation in the post-deregulation environment. The data is provided by the Nikkei-Needs database published by Nihon Keizai Shimbun and the Stock Price Charts of Toyo Keizai Databank. Only manufacturing firms are chosen in order to eliminate possible distortions caused by government regulations over certain industries. The Nikkei-Needs database contains 828 manufacturing firms listed on the first section of the Tokyo Stock Exchange by 2004. Due to data unavailability, the 1984 sample consists of 439 firms and the 2004 sample consists of 486 firms. To obviate the problem with outliers, we drop additional firms whose value of Tobin’s Q/ROA falls outside the range of the sample mean plus and minus two times the standard deviation. 4.2 Variables and Model Specification 4.2.1 Variables The study employs two alternative measures of corporate performance as dependent variables: 1) Tobin’s Q, a stock market performance measure, and 2) ROA, an accounting performance measure. Tobin’s Q, the ratio of market value to replacement cost, provides a viewing window into the firm through the market value of the securities issued. Q is a general accepted proxy for firm valuation because it captures the long-term impacts of corporate actions. ROA (return on assets), the ratio of net income to total assets, reflects the short-term profitability of the firm’s operations. As for the independent variables, we describe a firm’s ownership structure in two ways: 1) a measure of ownership concentration, and 2) different types of shareholders. A measure of ownership concentration is the percentage of a firm’s combined common equity owned by the 10 largest shareholders (A10). The choice of the combined large shareholdings is dictated by the fact that ownership concentration in Japan is largely a consequence that main banks and affiliated firms within corporate groups jointly hold significant blocks of a firm’s shares. We classify shareholdings into the following five types: percent of shares owned by financial institutions (FI), non-financial corporations (CO), individuals (PS), foreign investors (EC), and top management (MH). The study introduces several control variables. Firm size (Lasset) is measured by total assets transformed into natural logarithm. The debt/asset ratio (DA) is calculated as the book value of total liabilities divided by total assets. Ad/s and Rd/s are the ratios of advertising and research expenses, and development expenses to annual sales respectively. Based on the Nikkei medium classification industry code, we divide Japanese manufacturing firms into 14 categories. 13 industry dummies (DUM) are employed to capture industry-specific characteristics. 4.2.2 Methodology Our empirical strategy has three equations. The first regresses performance on ownership concentration as follows,
ijj jiiiiii DUMsRdsAdDALassetAP εγαααααα ++⋅+⋅+⋅+⋅+⋅+= ∑ =
13
1543210 //10 (1)
where Pi presents measures of corporate performance, Tobin’s Q and ROA, 0α is the intercept, 1α …5α and 1γ … 13γ are
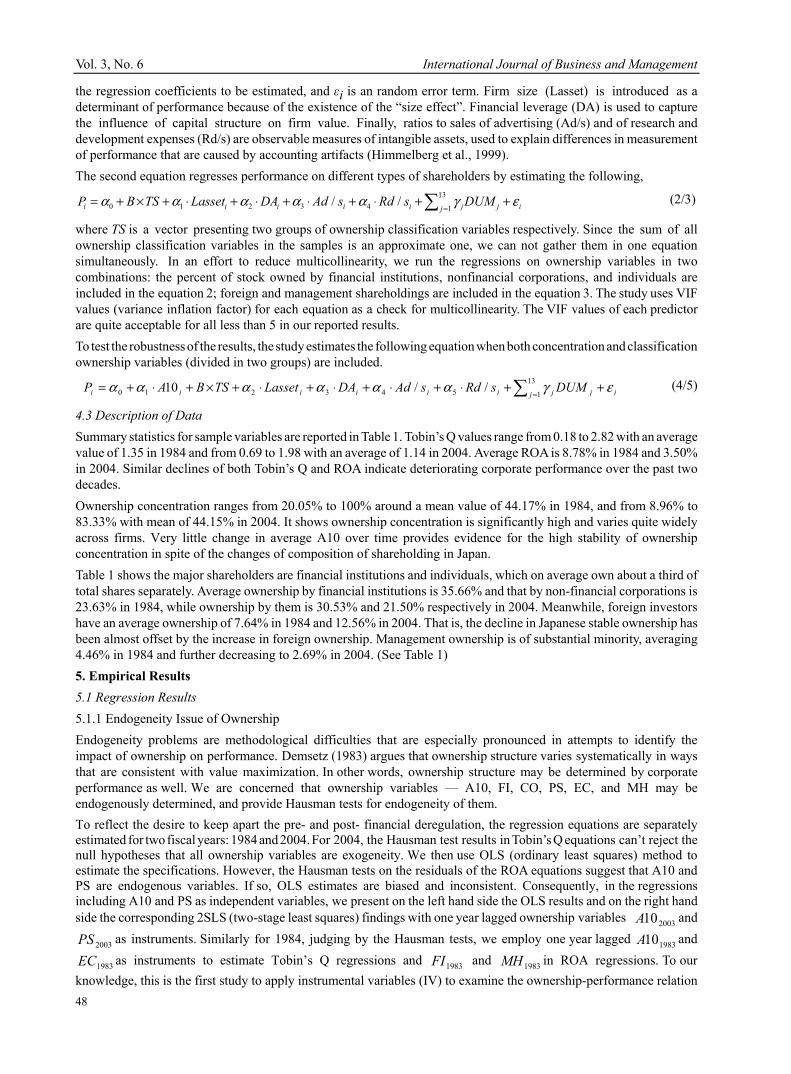
Vol. 3, No. 6 International Journal of Business and Management
48
the regression coefficients to be estimated, and εi is an random error term. Firm size (Lasset) is introduced as a determinant of performance because of the existence of the “size effect”. Financial leverage (DA) is used to capture the influence of capital structure on firm value. Finally, ratios to sales of advertising (Ad/s) and of research and development expenses (Rd/s) are observable measures of intangible assets, used to explain differences in measurement of performance that are caused by accounting artifacts (Himmelberg et al., 1999). The second equation regresses performance on different types of shareholders by estimating the following,
ijj jiiiii DUMsRdsAdDALassetTSBP εγααααα ++⋅+⋅+⋅+⋅+×+= ∑ =
13
143210 // (2/3)
where TS is a vector presenting two groups of ownership classification variables respectively. Since the sum of all ownership classification variables in the samples is an approximate one, we can not gather them in one equation simultaneously. In an effort to reduce multicollinearity, we run the regressions on ownership variables in two combinations: the percent of stock owned by financial institutions, nonfinancial corporations, and individuals are included in the equation 2; foreign and management shareholdings are included in the equation 3. The study uses VIF values (variance inflation factor) for each equation as a check for multicollinearity. The VIF values of each predictor are quite acceptable for all less than 5 in our reported results. To test the robustness of the results, the study estimates the following equation when both concentration and classification ownership variables (divided in two groups) are included.
ijj jiiiiii DUMsRdsAdDALassetTSBAP εγαααααα ++⋅+⋅+⋅+⋅+×+⋅+= ∑ =
13
1543210 //10 (4/5)
4.3 Description of Data Summary statistics for sample variables are reported in Table 1. Tobin’s Q values range from 0.18 to 2.82 with an average value of 1.35 in 1984 and from 0.69 to 1.98 with an average of 1.14 in 2004. Average ROA is 8.78% in 1984 and 3.50% in 2004. Similar declines of both Tobin’s Q and ROA indicate deteriorating corporate performance over the past two decades. Ownership concentration ranges from 20.05% to 100% around a mean value of 44.17% in 1984, and from 8.96% to 83.33% with mean of 44.15% in 2004. It shows ownership concentration is significantly high and varies quite widely across firms. Very little change in average A10 over time provides evidence for the high stability of ownership concentration in spite of the changes of composition of shareholding in Japan. Table 1 shows the major shareholders are financial institutions and individuals, which on average own about a third of total shares separately. Average ownership by financial institutions is 35.66% and that by non-financial corporations is 23.63% in 1984, while ownership by them is 30.53% and 21.50% respectively in 2004. Meanwhile, foreign investors have an average ownership of 7.64% in 1984 and 12.56% in 2004. That is, the decline in Japanese stable ownership has been almost offset by the increase in foreign ownership. Management ownership is of substantial minority, averaging 4.46% in 1984 and further decreasing to 2.69% in 2004. (See Table 1) 5. Empirical Results 5.1 Regression Results 5.1.1 Endogeneity Issue of Ownership Endogeneity problems are methodological difficulties that are especially pronounced in attempts to identify the impact of ownership on performance. Demsetz (1983) argues that ownership structure varies systematically in ways that are consistent with value maximization. In other words, ownership structure may be determined by corporate performance as well. We are concerned that ownership variables — A10, FI, CO, PS, EC, and MH may be endogenously determined, and provide Hausman tests for endogeneity of them. To reflect the desire to keep apart the pre- and post- financial deregulation, the regression equations are separately estimated for two fiscal years: 1984 and 2004. For 2004, the Hausman test results in Tobin’s Q equations can’t reject the null hypotheses that all ownership variables are exogeneity. We then use OLS (ordinary least squares) method to estimate the specifications. However, the Hausman tests on the residuals of the ROA equations suggest that A10 and PS are endogenous variables. If so, OLS estimates are biased and inconsistent. Consequently, in the regressions including A10 and PS as independent variables, we present on the left hand side the OLS results and on the right hand side the corresponding 2SLS (two-stage least squares) findings with one year lagged ownership variables 200310A and
2003PS as instruments. Similarly for 1984, judging by the Hausman tests, we employ one year lagged 198310A and
1983EC as instruments to estimate Tobin’s Q regressions and 1983FI and 1983MH in ROA regressions. To our knowledge, this is the first study to apply instrumental variables (IV) to examine the ownership-performance relation
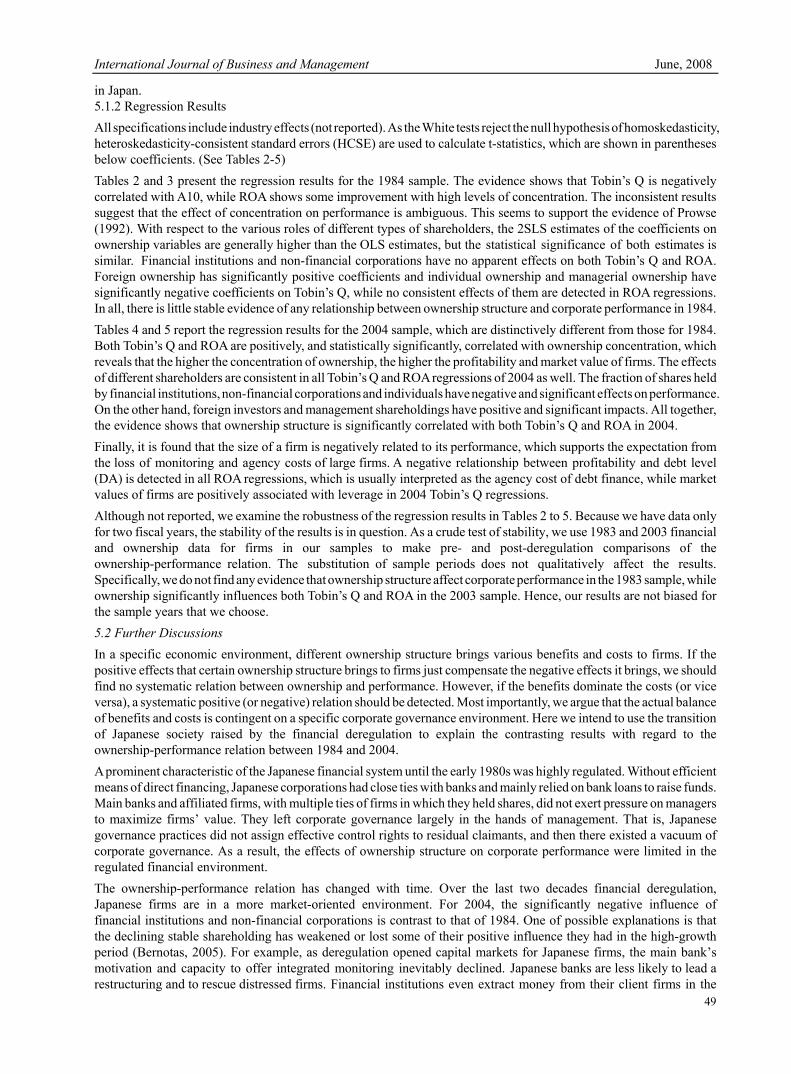
International Journal of Business and Management June, 2008
49
in Japan. 5.1.2 Regression Results All specifications include industry effects (not reported). As the White tests reject the null hypothesis of homoskedasticity, heteroskedasticity-consistent standard errors (HCSE) are used to calculate t-statistics, which are shown in parentheses below coefficients. (See Tables 2-5) Tables 2 and 3 present the regression results for the 1984 sample. The evidence shows that Tobin’s Q is negatively correlated with A10, while ROA shows some improvement with high levels of concentration. The inconsistent results suggest that the effect of concentration on performance is ambiguous. This seems to support the evidence of Prowse (1992). With respect to the various roles of different types of shareholders, the 2SLS estimates of the coefficients on ownership variables are generally higher than the OLS estimates, but the statistical significance of both estimates is similar. Financial institutions and non-financial corporations have no apparent effects on both Tobin’s Q and ROA. Foreign ownership has significantly positive coefficients and individual ownership and managerial ownership have significantly negative coefficients on Tobin’s Q, while no consistent effects of them are detected in ROA regressions. In all, there is little stable evidence of any relationship between ownership structure and corporate performance in 1984. Tables 4 and 5 report the regression results for the 2004 sample, which are distinctively different from those for 1984. Both Tobin’s Q and ROA are positively, and statistically significantly, correlated with ownership concentration, which reveals that the higher the concentration of ownership, the higher the profitability and market value of firms. The effects of different shareholders are consistent in all Tobin’s Q and ROA regressions of 2004 as well. The fraction of shares held by financial institutions, non-financial corporations and individuals have negative and significant effects on performance. On the other hand, foreign investors and management shareholdings have positive and significant impacts. All together, the evidence shows that ownership structure is significantly correlated with both Tobin’s Q and ROA in 2004. Finally, it is found that the size of a firm is negatively related to its performance, which supports the expectation from the loss of monitoring and agency costs of large firms. A negative relationship between profitability and debt level (DA) is detected in all ROA regressions, which is usually interpreted as the agency cost of debt finance, while market values of firms are positively associated with leverage in 2004 Tobin’s Q regressions. Although not reported, we examine the robustness of the regression results in Tables 2 to 5. Because we have data only for two fiscal years, the stability of the results is in question. As a crude test of stability, we use 1983 and 2003 financial and ownership data for firms in our samples to make pre- and post-deregulation comparisons of the ownership-performance relation. The substitution of sample periods does not qualitatively affect the results. Specifically, we do not find any evidence that ownership structure affect corporate performance in the 1983 sample, while ownership significantly influences both Tobin’s Q and ROA in the 2003 sample. Hence, our results are not biased for the sample years that we choose. 5.2 Further Discussions In a specific economic environment, different ownership structure brings various benefits and costs to firms. If the positive effects that certain ownership structure brings to firms just compensate the negative effects it brings, we should find no systematic relation between ownership and performance. However, if the benefits dominate the costs (or vice versa), a systematic positive (or negative) relation should be detected. Most importantly, we argue that the actual balance of benefits and costs is contingent on a specific corporate governance environment. Here we intend to use the transition of Japanese society raised by the financial deregulation to explain the contrasting results with regard to the ownership-performance relation between 1984 and 2004. A prominent characteristic of the Japanese financial system until the early 1980s was highly regulated. Without efficient means of direct financing, Japanese corporations had close ties with banks and mainly relied on bank loans to raise funds. Main banks and affiliated firms, with multiple ties of firms in which they held shares, did not exert pressure on managers to maximize firms’ value. They left corporate governance largely in the hands of management. That is, Japanese governance practices did not assign effective control rights to residual claimants, and then there existed a vacuum of corporate governance. As a result, the effects of ownership structure on corporate performance were limited in the regulated financial environment. The ownership-performance relation has changed with time. Over the last two decades financial deregulation, Japanese firms are in a more market-oriented environment. For 2004, the significantly negative influence of financial institutions and non-financial corporations is contrast to that of 1984. One of possible explanations is that the declining stable shareholding has weakened or lost some of their positive influence they had in the high-growth period (Bernotas, 2005). For example, as deregulation opened capital markets for Japanese firms, the main bank’s motivation and capacity to offer integrated monitoring inevitably declined. Japanese banks are less likely to lead a restructuring and to rescue distressed firms. Financial institutions even extract money from their client firms in the
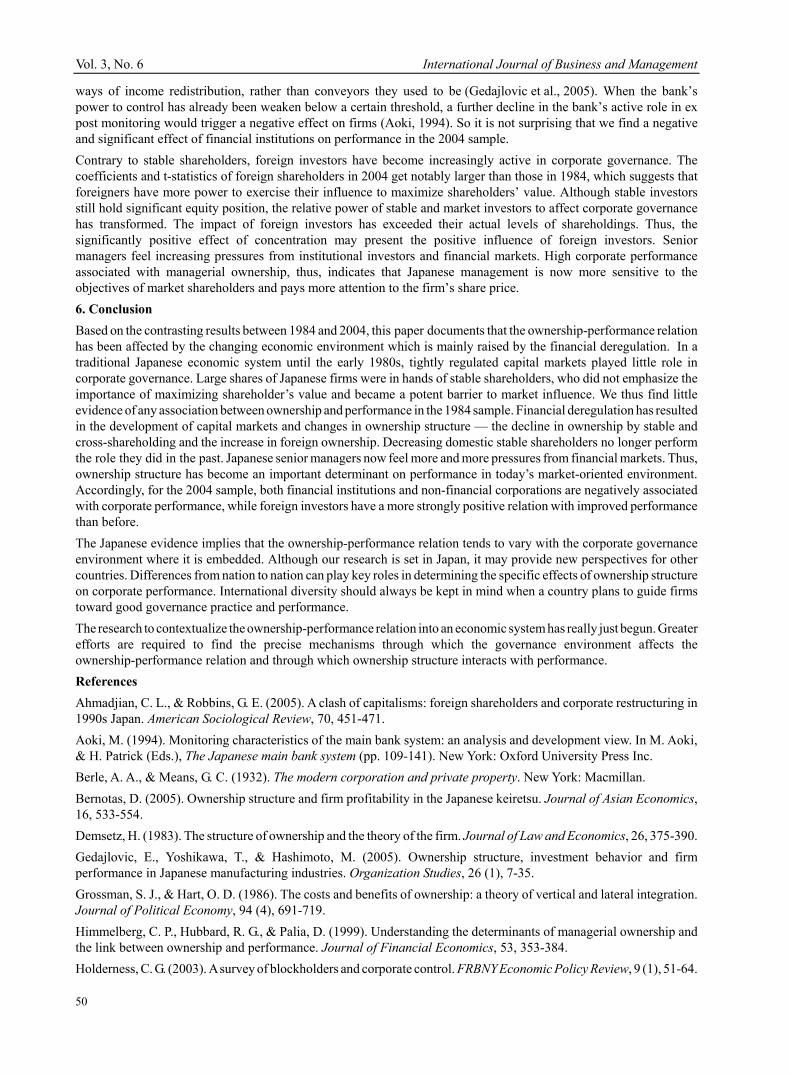
Vol. 3, No. 6 International Journal of Business and Management
50
ways of income redistribution, rather than conveyors they used to be (Gedajlovic et al., 2005). When the bank’s power to control has already been weaken below a certain threshold, a further decline in the bank’s active role in ex post monitoring would trigger a negative effect on firms (Aoki, 1994). So it is not surprising that we find a negative and significant effect of financial institutions on performance in the 2004 sample. Contrary to stable shareholders, foreign investors have become increasingly active in corporate governance. The coefficients and t-statistics of foreign shareholders in 2004 get notably larger than those in 1984, which suggests that foreigners have more power to exercise their influence to maximize shareholders’ value. Although stable investors still hold significant equity position, the relative power of stable and market investors to affect corporate governance has transformed. The impact of foreign investors has exceeded their actual levels of shareholdings. Thus, the significantly positive effect of concentration may present the positive influence of foreign investors. Senior managers feel increasing pressures from institutional investors and financial markets. High corporate performance associated with managerial ownership, thus, indicates that Japanese management is now more sensitive to the objectives of market shareholders and pays more attention to the firm’s share price. 6. Conclusion Based on the contrasting results between 1984 and 2004, this paper documents that the ownership-performance relation has been affected by the changing economic environment which is mainly raised by the financial deregulation. In a traditional Japanese economic system until the early 1980s, tightly regulated capital markets played little role in corporate governance. Large shares of Japanese firms were in hands of stable shareholders, who did not emphasize the importance of maximizing shareholder’s value and became a potent barrier to market influence. We thus find little evidence of any association between ownership and performance in the 1984 sample. Financial deregulation has resulted in the development of capital markets and changes in ownership structure — the decline in ownership by stable and cross-shareholding and the increase in foreign ownership. Decreasing domestic stable shareholders no longer perform the role they did in the past. Japanese senior managers now feel more and more pressures from financial markets. Thus, ownership structure has become an important determinant on performance in today’s market-oriented environment. Accordingly, for the 2004 sample, both financial institutions and non-financial corporations are negatively associated with corporate performance, while foreign investors have a more strongly positive relation with improved performance than before. The Japanese evidence implies that the ownership-performance relation tends to vary with the corporate governance environment where it is embedded. Although our research is set in Japan, it may provide new perspectives for other countries. Differences from nation to nation can play key roles in determining the specific effects of ownership structure on corporate performance. International diversity should always be kept in mind when a country plans to guide firms toward good governance practice and performance. The research to contextualize the ownership-performance relation into an economic system has really just begun. Greater efforts are required to find the precise mechanisms through which the governance environment affects the ownership-performance relation and through which ownership structure interacts with performance. References Ahmadjian, C. L., & Robbins, G. E. (2005). A clash of capitalisms: foreign shareholders and corporate restructuring in 1990s Japan. American Sociological Review, 70, 451-471. Aoki, M. (1994). Monitoring characteristics of the main bank system: an analysis and development view. In M. Aoki, & H. Patrick (Eds.), The Japanese main bank system (pp. 109-141). New York: Oxford University Press Inc. Berle, A. A., & Means, G. C. (1932). The modern corporation and private property. New York: Macmillan. Bernotas, D. (2005). Ownership structure and firm profitability in the Japanese keiretsu. Journal of Asian Economics, 16, 533-554. Demsetz, H. (1983). The structure of ownership and the theory of the firm. Journal of Law and Economics, 26, 375-390. Gedajlovic, E., Yoshikawa, T., & Hashimoto, M. (2005). Ownership structure, investment behavior and firm performance in Japanese manufacturing industries. Organization Studies, 26 (1), 7-35. Grossman, S. J., & Hart, O. D. (1986). The costs and benefits of ownership: a theory of vertical and lateral integration. Journal of Political Economy, 94 (4), 691-719. Himmelberg, C. P., Hubbard, R. G., & Palia, D. (1999). Understanding the determinants of managerial ownership and the link between ownership and performance. Journal of Financial Economics, 53, 353-384. Holderness, C. G. (2003). A survey of blockholders and corporate control. FRBNY Economic Policy Review, 9 (1), 51-64.
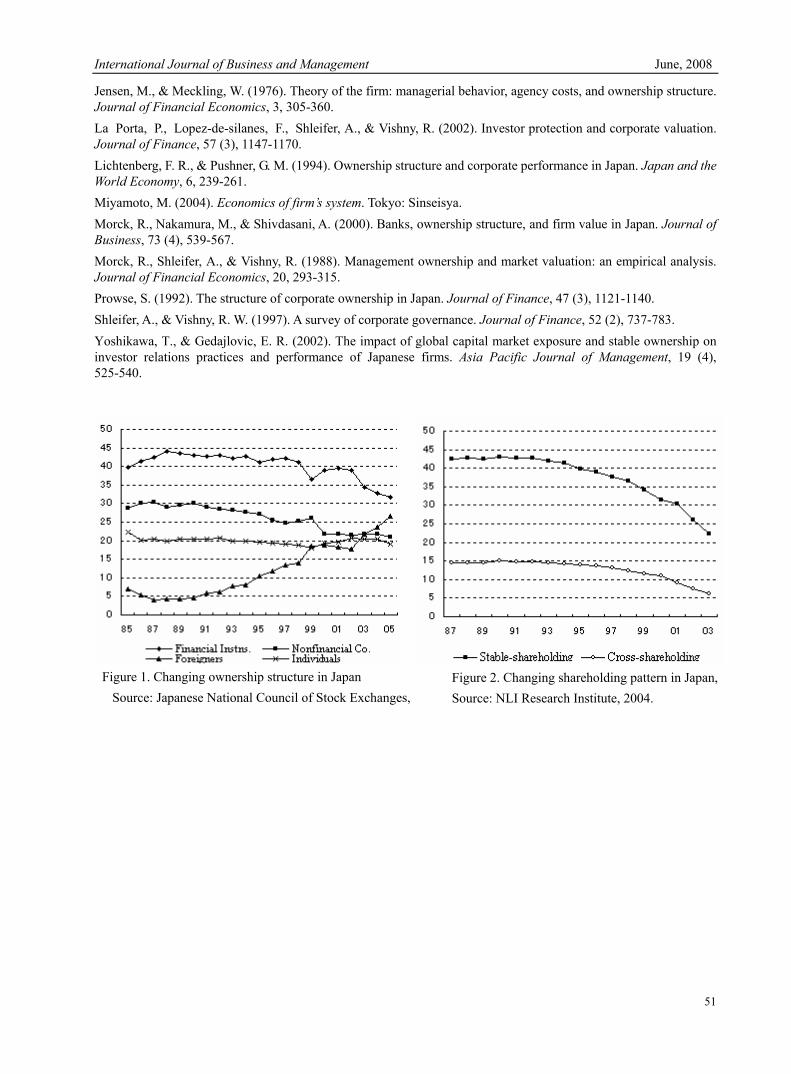
International Journal of Business and Management June, 2008
51
Jensen, M., & Meckling, W. (1976). Theory of the firm: managerial behavior, agency costs, and ownership structure. Journal of Financial Economics, 3, 305-360. La Porta, P., Lopez-de-silanes, F., Shleifer, A., & Vishny, R. (2002). Investor protection and corporate valuation. Journal of Finance, 57 (3), 1147-1170. Lichtenberg, F. R., & Pushner, G. M. (1994). Ownership structure and corporate performance in Japan. Japan and the World Economy, 6, 239-261. Miyamoto, M. (2004). Economics of firm’s system. Tokyo: Sinseisya. Morck, R., Nakamura, M., & Shivdasani, A. (2000). Banks, ownership structure, and firm value in Japan. Journal of Business, 73 (4), 539-567. Morck, R., Shleifer, A., & Vishny, R. (1988). Management ownership and market valuation: an empirical analysis. Journal of Financial Economics, 20, 293-315. Prowse, S. (1992). The structure of corporate ownership in Japan. Journal of Finance, 47 (3), 1121-1140. Shleifer, A., & Vishny, R. W. (1997). A survey of corporate governance. Journal of Finance, 52 (2), 737-783. Yoshikawa, T., & Gedajlovic, E. R. (2002). The impact of global capital market exposure and stable ownership on investor relations practices and performance of Japanese firms. Asia Pacific Journal of Management, 19 (4), 525-540.
Figure 1. Changing ownership structure in Japan Source: Japanese National Council of Stock Exchanges,
Figure 2. Changing shareholding pattern in Japan, Source: NLI Research Institute, 2004.
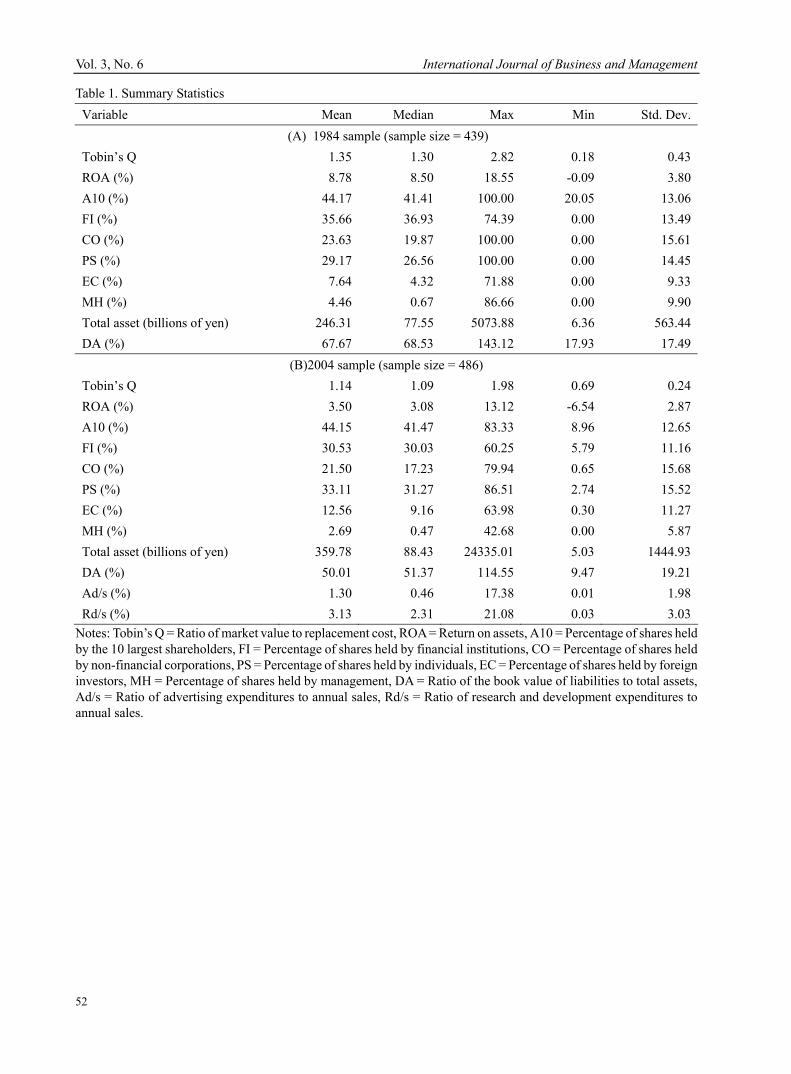
Vol. 3, No. 6 International Journal of Business and Management
52
Table 1. Summary Statistics Variable Mean Median Max Min Std. Dev.
(A) 1984 sample (sample size = 439) Tobin’s Q 1.35 1.30 2.82 0.18 0.43 ROA (%) 8.78 8.50 18.55 -0.09 3.80 A10 (%) 44.17 41.41 100.00 20.05 13.06 FI (%) 35.66 36.93 74.39 0.00 13.49 CO (%) 23.63 19.87 100.00 0.00 15.61 PS (%) 29.17 26.56 100.00 0.00 14.45 EC (%) 7.64 4.32 71.88 0.00 9.33 MH (%) 4.46 0.67 86.66 0.00 9.90 Total asset (billions of yen) 246.31 77.55 5073.88 6.36 563.44 DA (%) 67.67 68.53 143.12 17.93 17.49
(B)2004 sample (sample size = 486) Tobin’s Q 1.14 1.09 1.98 0.69 0.24 ROA (%) 3.50 3.08 13.12 -6.54 2.87 A10 (%) 44.15 41.47 83.33 8.96 12.65 FI (%) 30.53 30.03 60.25 5.79 11.16 CO (%) 21.50 17.23 79.94 0.65 15.68 PS (%) 33.11 31.27 86.51 2.74 15.52 EC (%) 12.56 9.16 63.98 0.30 11.27 MH (%) 2.69 0.47 42.68 0.00 5.87 Total asset (billions of yen) 359.78 88.43 24335.01 5.03 1444.93 DA (%) 50.01 51.37 114.55 9.47 19.21 Ad/s (%) 1.30 0.46 17.38 0.01 1.98 Rd/s (%) 3.13 2.31 21.08 0.03 3.03
Notes: Tobin’s Q = Ratio of market value to replacement cost, ROA = Return on assets, A10 = Percentage of shares held by the 10 largest shareholders, FI = Percentage of shares held by financial institutions, CO = Percentage of shares held by non-financial corporations, PS = Percentage of shares held by individuals, EC = Percentage of shares held by foreign investors, MH = Percentage of shares held by management, DA = Ratio of the book value of liabilities to total assets, Ad/s = Ratio of advertising expenditures to annual sales, Rd/s = Ratio of research and development expenditures to annual sales.
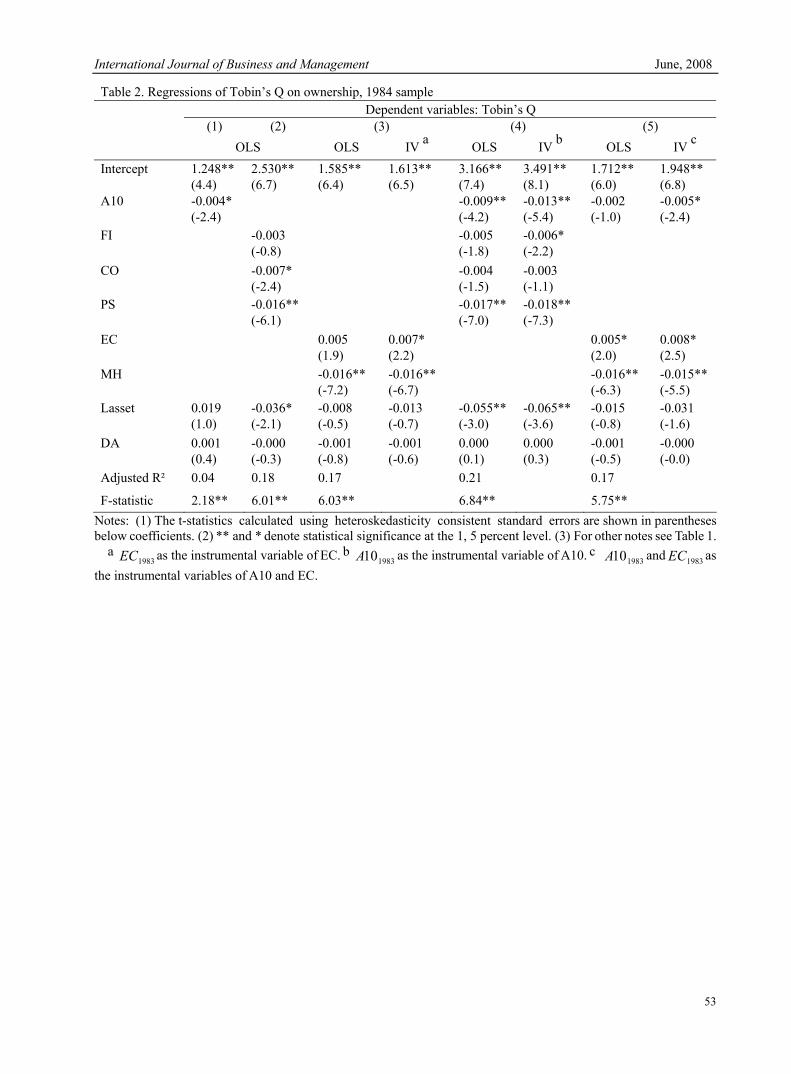
International Journal of Business and Management June, 2008
53
Table 2. Regressions of Tobin’s Q on ownership, 1984 sample Dependent variables: Tobin’s Q
(1) (2) (3) (4) (5) OLS OLS IV a OLS IV b OLS IV c
Intercept 1.248**(4.4)
2.530** (6.7)
1.585** (6.4)
1.613** (6.5)
3.166** (7.4)
3.491** (8.1)
1.712** (6.0)
1.948** (6.8)
A10 -0.004* (-2.4)
-0.009**(-4.2)
-0.013** (-5.4)
-0.002 (-1.0)
-0.005* (-2.4)
FI -0.003 (-0.8)
-0.005 (-1.8)
-0.006* (-2.2)
CO -0.007* (-2.4)
-0.004 (-1.5)
-0.003 (-1.1)
PS -0.016** (-6.1)
-0.017**(-7.0)
-0.018** (-7.3)
EC 0.005 (1.9)
0.007* (2.2)
0.005* (2.0)
0.008* (2.5)
MH -0.016** (-7.2)
-0.016** (-6.7)
-0.016** (-6.3)
-0.015**(-5.5)
Lasset 0.019 (1.0)
-0.036* (-2.1)
-0.008 (-0.5)
-0.013 (-0.7)
-0.055**(-3.0)
-0.065** (-3.6)
-0.015 (-0.8)
-0.031 (-1.6)
DA 0.001 (0.4)
-0.000 (-0.3)
-0.001 (-0.8)
-0.001 (-0.6)
0.000 (0.1)
0.000 (0.3)
-0.001 (-0.5)
-0.000 (-0.0)
Adjusted R² 0.04 0.18 0.17 0.21 0.17
F-statistic 2.18** 6.01** 6.03** 6.84** 5.75** Notes: (1) The t-statistics calculated using heteroskedasticity consistent standard errors are shown in parentheses below coefficients. (2) ** and * denote statistical significance at the 1, 5 percent level. (3) For other notes see Table 1.
a 1983EC as the instrumental variable of EC. b
198310A as the instrumental variable of A10. c 198310A and 1983EC as the instrumental variables of A10 and EC.
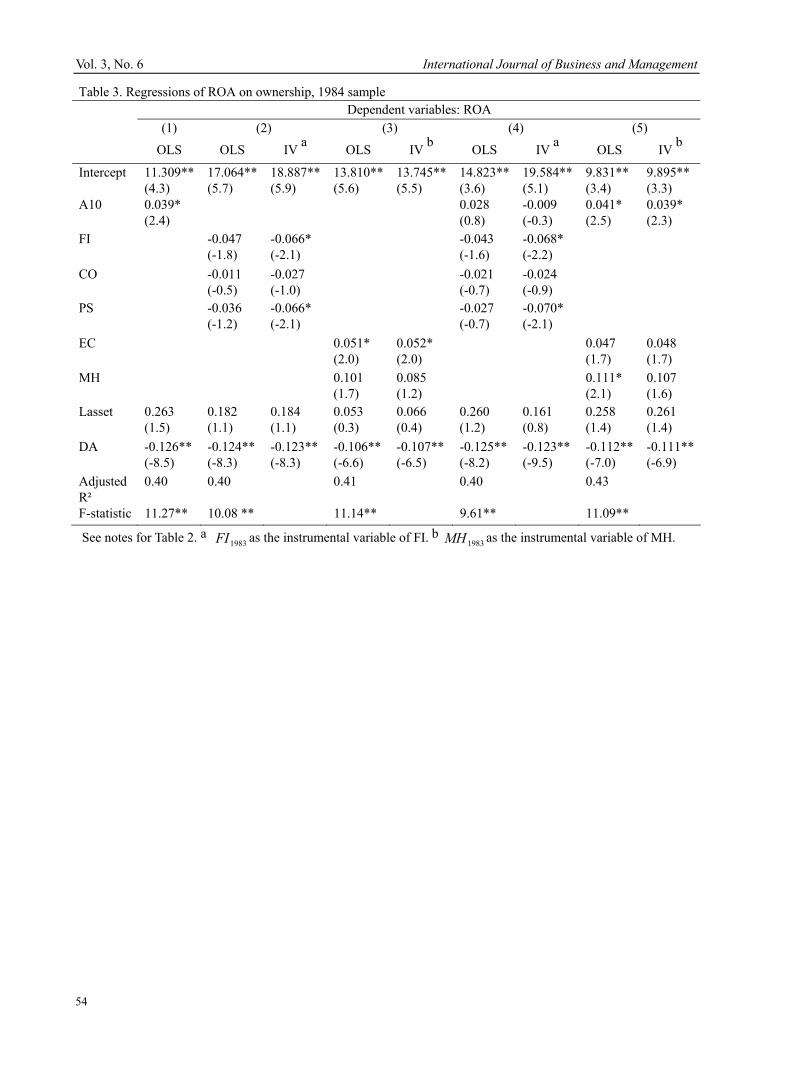
Vol. 3, No. 6 International Journal of Business and Management
54
Table 3. Regressions of ROA on ownership, 1984 sample Dependent variables: ROA
(1) (2) (3) (4) (5)
OLS OLS IV a OLS IV b OLS IV a OLS IV b
Intercept 11.309** (4.3)
17.064** (5.7)
18.887** (5.9)
13.810**(5.6)
13.745**(5.5)
14.823**(3.6)
19.584** (5.1)
9.831** (3.4)
9.895**(3.3)
A10 0.039* (2.4)
0.028 (0.8)
-0.009 (-0.3)
0.041* (2.5)
0.039* (2.3)
FI -0.047 (-1.8)
-0.066* (-2.1)
-0.043 (-1.6)
-0.068* (-2.2)
CO -0.011 (-0.5)
-0.027 (-1.0)
-0.021 (-0.7)
-0.024 (-0.9)
PS -0.036 (-1.2)
-0.066* (-2.1)
-0.027 (-0.7)
-0.070* (-2.1)
EC 0.051* (2.0)
0.052* (2.0)
0.047 (1.7)
0.048 (1.7)
MH 0.101 (1.7)
0.085 (1.2)
0.111* (2.1)
0.107 (1.6)
Lasset 0.263 (1.5)
0.182 (1.1)
0.184 (1.1)
0.053 (0.3)
0.066 (0.4)
0.260 (1.2)
0.161 (0.8)
0.258 (1.4)
0.261 (1.4)
DA -0.126** (-8.5)
-0.124** (-8.3)
-0.123** (-8.3)
-0.106**(-6.6)
-0.107**(-6.5)
-0.125**(-8.2)
-0.123** (-9.5)
-0.112** (-7.0)
-0.111**(-6.9)
Adjusted R²
0.40 0.40 0.41 0.40 0.43
F-statistic 11.27** 10.08 ** 11.14** 9.61** 11.09**
See notes for Table 2. a 1983FI as the instrumental variable of FI. b 1983MH as the instrumental variable of MH.
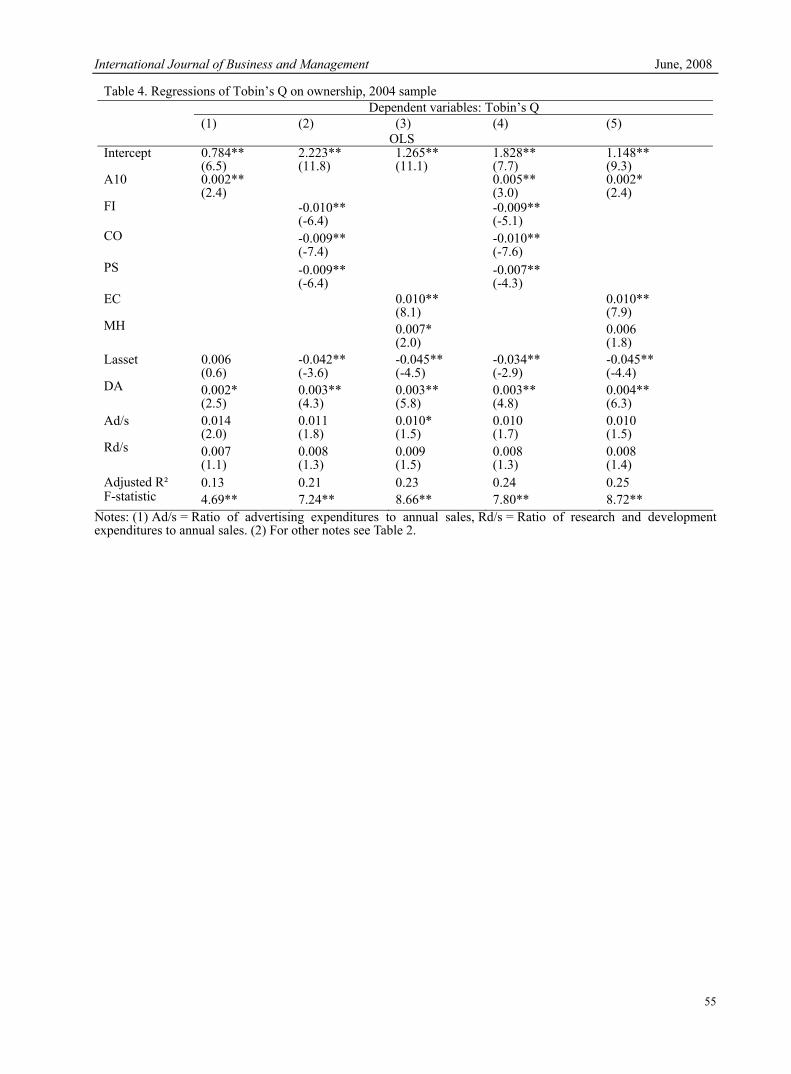
International Journal of Business and Management June, 2008
55
Table 4. Regressions of Tobin’s Q on ownership, 2004 sample Dependent variables: Tobin’s Q
(1) (2) (3) (4) (5) OLS
Intercept 0.784** (6.5)
2.223** (11.8)
1.265** (11.1)
1.828** (7.7)
1.148** (9.3)
A10 0.002** (2.4) 0.005**
(3.0) 0.002* (2.4)
FI -0.010** (-6.4) -0.009**
(-5.1) CO
-0.009** (-7.4) -0.010**
(-7.6)
PS -0.009**
(-6.4) -0.007** (-4.3)
EC 0.010** (8.1) 0.010**
(7.9) MH
0.007* (2.0) 0.006
(1.8) Lasset 0.006
(0.6) -0.042** (-3.6)
-0.045** (-4.5)
-0.034** (-2.9)
-0.045** (-4.4)
DA 0.002* (2.5)
0.003** (4.3)
0.003** (5.8)
0.003** (4.8)
0.004** (6.3)
Ad/s 0.014 (2.0)
0.011 (1.8)
0.010* (1.5)
0.010 (1.7)
0.010 (1.5)
Rd/s 0.007 (1.1)
0.008 (1.3)
0.009 (1.5)
0.008 (1.3)
0.008 (1.4)
Adjusted R² 0.13 0.21 0.23 0.24 0.25 F-statistic 4.69** 7.24** 8.66** 7.80** 8.72**
Notes: (1) Ad/s = Ratio of advertising expenditures to annual sales, Rd/s = Ratio of research and development expenditures to annual sales. (2) For other notes see Table 2.
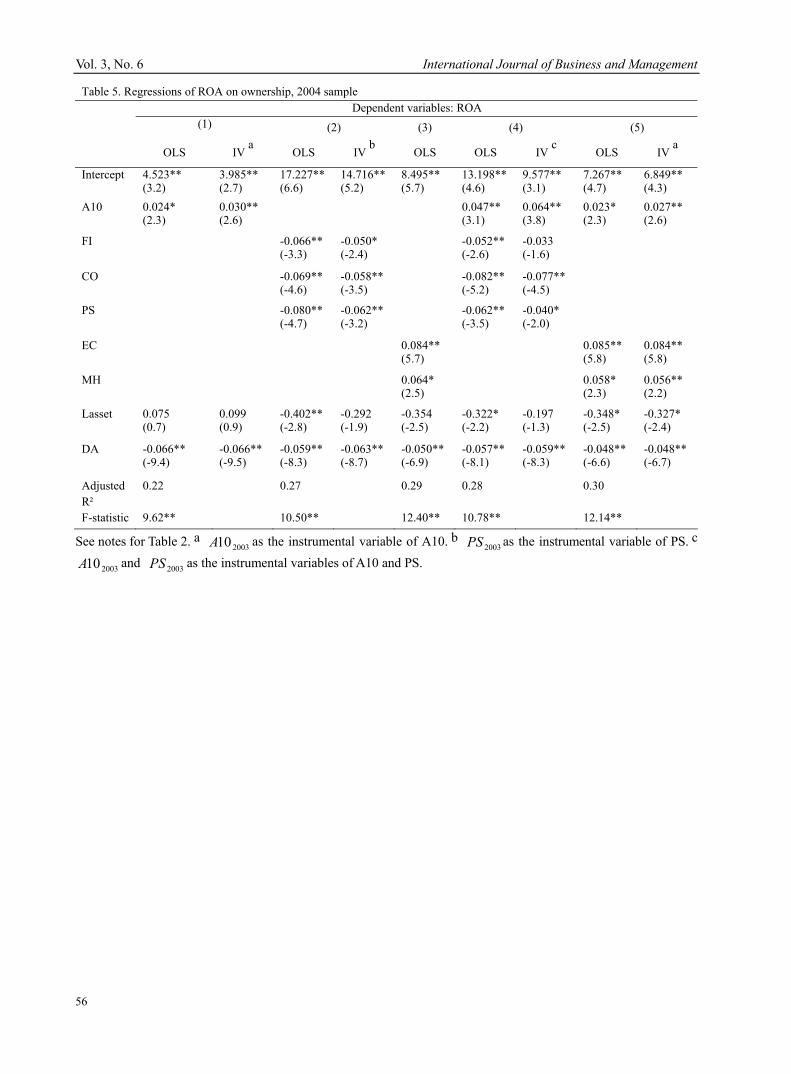
Vol. 3, No. 6 International Journal of Business and Management
56
Table 5. Regressions of ROA on ownership, 2004 sample Dependent variables: ROA
(1) (2) (3) (4) (5)
OLS IV a OLS IV
b OLS OLS IV
c OLS IV
a
Intercept 4.523** (3.2)
3.985** (2.7)
17.227** (6.6)
14.716**(5.2)
8.495** (5.7)
13.198**(4.6)
9.577** (3.1)
7.267** (4.7)
6.849** (4.3)
A10 0.024* (2.3)
0.030** (2.6)
0.047** (3.1)
0.064** (3.8)
0.023* (2.3)
0.027** (2.6)
FI -0.066** (-3.3)
-0.050* (-2.4)
-0.052**(-2.6)
-0.033 (-1.6)
CO -0.069** (-4.6)
-0.058**(-3.5)
-0.082**(-5.2)
-0.077** (-4.5)
PS -0.080** (-4.7)
-0.062**(-3.2)
-0.062**(-3.5)
-0.040* (-2.0)
EC 0.084** (5.7)
0.085** (5.8)
0.084** (5.8)
MH 0.064* (2.5)
0.058* (2.3)
0.056** (2.2)
Lasset 0.075 (0.7)
0.099 (0.9)
-0.402** (-2.8)
-0.292 (-1.9)
-0.354 (-2.5)
-0.322* (-2.2)
-0.197 (-1.3)
-0.348* (-2.5)
-0.327* (-2.4)
DA -0.066** (-9.4)
-0.066** (-9.5)
-0.059** (-8.3)
-0.063**(-8.7)
-0.050**(-6.9)
-0.057**(-8.1)
-0.059** (-8.3)
-0.048** (-6.6)
-0.048**(-6.7)
Adjusted R²
0.22 0.27 0.29 0.28 0.30
F-statistic 9.62** 10.50** 12.40** 10.78** 12.14**
See notes for Table 2. a 200310A as the instrumental variable of A10. b
2003PS as the instrumental variable of PS. c
200310A and 2003PS as the instrumental variables of A10 and PS.
International Journal of Business and Management June, 2008
57
A Post-Mortem Evaluation of an IT project
A Case Study of a Process Enhancement IT-Project
In a Maintenance, Repair and Overhaul Company Uwe Lehmann, Dipl.-Ing., MSc (Corresponding Author)
Bristol Business School, The University of the West of England, Coldharbour Lane, Bristol BS16 1QY, UK Tel: +44(0)7726462645 E-mail: [email protected]
Guru Prakash Prabhakar, PhD (France), PMP (USA), MBA (India), PG-Cert (UK)
School of Operation and Information Management, Bristol Business School The University of the West of England, Coldharbour Lane, Bristol BS16 1QY, UK
Tel: +44(0)1173283461 E-mail: [email protected] Abstract The present work represents a post mortem evaluation of an SAP-IT project. It focuses on critical success factors (CSF) in order to establish an appropriate guideline for the project evaluation. A review of contemporary project management literature identifies general project CSF and SAP-project specific CSF and provides a brief theoretical overview of the purpose of project reviews and points out difficulties regarding performance measurements. The review of the project is a qualitative evaluation based on selected CSF. Project evaluation is an ongoing, multidimensional process and can be used to measure success and to learn from previous experience. The CSF used to measure the project success, need to be well defined and constantly checked as they can change over time. For project success a good communication with all stakeholders involved is fundamental. Constant review becomes necessary in today’s complex project world in order to engage in total quality management and continuous improvement. Keywords: Project Management, Project Review, Project Success, Critical Success Factors 1. Introduction 1.1 BACKGROUND OF THE CASE STUDY PROJECT In 2004 a one year IT project was conscribed at a business unit of German MRO Company in order to improve the overall material process. The project had a budget of about €1Mio (≈ £0.68 Mio) and aimed for the conversion of previous IT solutions into the SAP-standard system to simplify, enhance and condense the material ordering process. The project not only introduced a new IT system but also meant organizational change. The main stakeholders of the project were the Engineering Department, Disposition, Purchasing, Production and Warehousing. 1.2 AIM AND STRUCTURE OF THE STUDY The aim of the present study is to conduct a post mortem analysis and final project evaluation of the case project. A focus is given on the determinants of project success and failure (Critical Success Factors - CSF). Firstly a literature review is given of the contemporary project management literature about CSF and project evaluation. This includes a project definition and the project lifecycle theory. An appropriate framework is presented in order to understand CSF, to enable a qualitative evaluation of the project and as an effort to narrow down the complexity of the topic. Secondly the framework for evaluating project success is applied to the project. This analysis consists of a personal review and feedback collected from previous colleagues and project stakeholders. Finally, some of the learning outcomes of the post mortem evaluation are summarized and recommendations for future project work are derived. The author was involved in the case study project from the start up phase to the close phase and used the newly introduced IT-system for approximately one year after the project closure. The analysis is qualitative and reflects the personal opinion.
Vol. 3, No. 6 International Journal of Business and Management
58
2. Theoretical Background 2.1 PROJECTS AND THEIR CRITICAL SUCCESS FACTORS (CSF) Traditionally a project is defined as “an undertaking to achieve a defined objective, and goes on to state that ‘generally all projects evolve through a similar “lifecycle” sequence during which there should be recognized start and finish points” [Turner and Cochrane, 1993]. This and similar definitions are based on the assumption that the project objectives are clearly defined. The project success could then be measured against the agreed objectives which are usually centered on the iron triangle of project management: Quality, Cost and Time (see Figure 5-1). “Prior to the 1980s it was common to focus exclusively on project performance, which was defined narrowly as meeting cost and time objectives and adhering to a product specification” [Bryde, 2003]. But project success is multidimensional [Bryde, 2003, p.229] and “in the late 1980s, after the introduction of TQM [Total Quality Management], a project was considered to be a success by not only meeting the internal performance measures….” [Tukel and Rom, 2001, p.400]. “For example, in Wateridge’s [1995] study of the impact of success criteria on a number of information technology (IT) projects, he concludes that the customer and other stakeholders, such as users, will define what they mean by quality” [Bryde, 2003, p.230]. A very general framework to analyze performance, and therewith linking to key dimensions of project success, is the EFQM model [Bryde, 2003, p.232] which originates in quality management concepts. The model is visualized in Figure 5-2 and it is used by organizations to evaluate quality aspects of processes, leadership and for project reviews. Project management embraces various schools of thought; thus many different ways of how to approach a project review and of how to evaluate project success can be found in the academic literature. An overview of the development of the CSF-research is given in Table 5-6. This present research focuses on approaches that establish a CSF list and are appropriate to analyze the project performance of the case study. A different angle for instance on project success (strategic approach) was investigated by Jugdev and Müller [2005], suggesting that a successful project must add product, service and strategic value to the company. Some literature also distinguishes clearly between project performance and project manager performance. This present work recognizes this approach but does not make this differentiation in order to simplify the analysis and to provide a holistic view of project success factors. Rather, the work utilizes leadership performance as one CSF to evaluate project success. Again, “methods and techniques for evaluating projects have appeared in the literature for at least 40 years in hundreds of articles. Approaches tend to be either quantitative or qualitative, ranging from rigorous operations research to social-science-based interactive techniques (Henriksen and Traynor, 1999; Danila, 1989; Schmidt and Freeland, 1993). […] “It is a tremendous task to evaluate the value of a project in detail.” […] “It should be noted that the first step in implementing project evaluation is to determine the factors against the projects” [Liang, 2003, p.446]. Table 5-1, Table 5-2 and Table 5-3 list and further describe CSF. Some of the criteria which can be evaluated by the author’s observations will then be used to review the present case study project (see chapter 0). The tables of CSF are overlapping, clarify the complexity of this topic and show links to the quality model: EFQM (see Figure 5-2). The initial definition of a project (see page 58) also includes the project life cycle, which is visualized in Figure 5-3. “Previous research results indicate that the relative importance of several of the critical factors changes significantly, based on life-cycle stages (Pinto & Prescott, 1988)” [Hyväri, 2006]. This is also indicated in the tables (Table 5-1 or Table 5-2) as certain CSF (e.g. Project Schedule and Plan) belong to certain project stages. Gardiner [2005, p.297] emphasizes on the wide variety and types of projects. “Consequently, any list of success or failure factors should be used as a guiding principle only and modified according to the nature and context of each project ….” Therefore and in order to evaluate the case - project with adequate and specific variables, this succeeding chapter 0 includes some CSF for SAP projects. 2.2 CSF FOR SAP PROJECTS The study of Vidyaranya [2005] analyzed 44 published articles of companies that implemented the SAP system. He “identifies six common factors that are indicative of successful or non-successful SAP implementations. It has been found that the lack of appropriate culture and organizational (internal) readiness as the most important factor contributing to failure of SAP implementations in 15 companies.” A summary of the six CSF for SAP Implementations is compiled in Table 5-3.
International Journal of Business and Management June, 2008
59
2.3 THE PURPOSE OF PROJECT REVIEW AND EVALUATION “The processes of review and evaluation are applied at different stages throughout a project …” [Gardiner, 2005, p.296]. Types of project evaluation are [Cicmil, 2007, b]: (1) Pre-project evaluation (2) On-going project evaluation (3) Project completion evaluation (4) Post-project evaluation (5) Post-mortem evaluation “The end of a project marks the last major milestone and provides an important opportunity to capture lessons learned during the project….” This is the motivation for the present work. “It is also an opportunity to revisit the project’s critical success factors” [Gardiner, 2005, p.296]. The idea of the review also includes the continuously improvement approach. “Evaluation is an objective, periodic stock taking to determine the status of a project in relation to its specific goals, taking into account project success criteria and recommendations for improvements of ongoing and future projects” [Cicmil, 2007, b]. Although one can find distinctions between project control and evaluation, Figure 5-4 visualizes the project evaluation/control cycle (also compare to: Figure 5-5 and Figure 5-6). Project control and evaluation are irreplaceable for project success as the planning can always only be a “good guess”. The next part identifies some general difficulties with (performance) measurements, which have to be taken into account for project evaluation. The following chapter then (chapter 0) analyses and evaluates the case study project against the CSF from the previous literature review. Conclusions are then drawn from this post mortem evaluation containing learning outcomes and future managerial implications. 2.4 THE TROUBLE WITH (PERFORMANCE) MEASUREMENTS This subchapter refers to the article of Hammer [2007] “The 7 Deadly Sins of Performance Measurement” and provides fundamental criteria for effective and objective measurements. The findings are useful to identify suitable CSF and to evaluate project success appropriately. According to Hammer [2007], the seven most common measurements mistakes are: Vanity: “measures that will inevitably make the organization, its people and especially its managers look good” Provincialism: “measuring narrowly in organizational boundaries” Narcissism: “measuring from own point of view rather from customer/stakeholder point of view” Laziness: “assuming one knows what is important to measure without giving it adequate thought or effort” Pettiness: “measure only a small component of what matters” Inanity: “Many companies seem to implement metrics without giving any thought to the consequences of these metrics on human behavior and ultimately on enterprise performance.” Frivolity: “not being serious about measurements, passing the blame to others” Summarizing one can say: Identifying the right CSF and measuring/evaluating them is associated with great effort but inevitable for project success. Creating a measurement friendly culture and creating the right metrics is another challenge for a project manager. 3. Evaluation of the Case Study Project The three project goals of the case study project were: (1) Optimization of the overall process of materials allocation (2) Conversion of all past IT solutions to SAP-Standard by February 2005 (3) Continuous illustration of the materials allocation process in SAP – from the parts list to the supply stock storage These three project goals were achieved within the time frame, the budget and with an appropriate quality. However, to evaluate the overall success of the project some critical success factors have to be reviewed (see Table 5-4). Table 5-4 represents a personal, qualitative review of the case study project. For an evaluation ten appropriate CSF identified previously in the literature were selected. Then a descriptive evaluation for each individual CSF is given and the performance-level of each factor is evaluated on a scale from one to ten, with ten meaning that the CSF was fulfilled 100%.
Vol. 3, No. 6 International Journal of Business and Management
60
Finally an overall project success evaluation is provided and the personal opinion is compared to some feedback given from colleagues that are currently working with the IT-system. Overall one can say that the case study project was successful. The project objectives were met within the Iron Triangle (cost, quality, time) and most of the CSF reviewed (see Table 5-4) have been considered during the project execution. However an average “performance – score” of 5.23 out of possible 10 reveals that not all the potential of the project was exploited successfully. The project had a difficult delayed start and was executed within a difficult environment of uncertainty, missing trust, unclear requirements and low commitment of the Engineering Department (part of the stakeholders). Due to the time pressure adequate testing and extensive training of the SAP system was minimized which explains today’s difficulties in using the system among the stakeholders (see feedback Table 5-5). Communications across the various departments and different stakeholders is still far from optimal, although the new SAP layout simplified the processes (see feedback Table 5-5). The change of the external environment and a missing continuously improvement program, including teaching and system adaptation, causes frustration and a blame culture among the users (see feedback Table 5-5). Compared to the previous “IT system maze” and the complex material ordering process of this MRO-Company, the new SAP system certainly increased the performance and quality of the internal processes and material traceability, which is the biggest argument for the project success. On the other hand a majority of the stakeholders are still either not familiar with the system or annoyed by its limitations and inflexibility which indicates that not all CSF were met or regarded with the same importance. 4. Conclusion Projects are used to manage all different kinds of change. Critical Success Factors can be used as a framework to measure project success and are a very useful tool for project managers to effectively manage projects. CSF change over time, can require high skills and expertise and furthermore depend on the type of project. The project evaluation is a process going through all phases of the project life cycle (project control) and can also be used in a post mortem evaluation to learn from the previous experience and to engage in a continuously improvement process (TQM). Important lessons learned by the literature review and future implications could be summarized as follows (also see [Jugdev and Müller 2005, p.29]: (1) Define a certain CSF framework to be able to measure the project success throughout the various phases of the project cycle (2) Identify key project stakeholders and allocate them to a certain category of the CSF (3) Project success is multidimensional and CSF need to include efficiency and effectiveness measurements regarding all project phases and all stakeholder (4) CSF may change over time between initial phase and closure phase (5) A good relationship and good communication with all stakeholders, including teamwork, is essential for the project success The SCOPE post mortem evaluation clarified the importance to break down a project in certain aspects (CSF) in order to evaluate the overall project success. Achieving time, cost and quality objectives does not necessarily mean that all stakeholders are satisfied with the project. Also, a project that is called “successful” does not coevally mean that all requirements are met. The complexity of today’s projects and the constantly changing environment create a situation in which it is fundamental to have a set of critical factors (clearly defined goals, milestones, objectives, CSF) against which the project success can be measured. Constant review and evaluation becomes necessary in order to establish a continuously improvement process (TQM) for the organization and for the project manager himself. References Bryde, D.J. (2003) Modelling project management performance, International Journal of Quality & Reliability Management Vol. 20, No. 2, pp. 229-254 Cicmil, S. (2007) Project Management (UMMK9V-15-M), lecture material, University of the West of England a) Session 5 - Delivery, monitoring, control and EVM, Executing_the_work.ppt
International Journal of Business and Management June, 2008
61
b) Session 6 - Closure, review and audits, Clse_out.ppt Clarke, A. (1999) A practical use of key success factors to improve the effectiveness of project management, International Journal of Project Management Vol. 17, No. 3, pp. 139±145 EFQM (2007) [online], Available from: http://www.efqm.org/Default.aspx?tabid=35 [Accessed 10th April, 2007] Gardiner, P., D. (2005) Project Management, Palgrave Macmillan Hammer, M. (2007) The 7 Deadly Sins of Performance Measurement, Special Report Measuring to Manage, MIT Sloan Management Review, Spring 2007, pp. 19-28, Massachusetts Institute of Technology Henriksen, A. and Traynor, A. (1999) A practical R&D project-selection scoring tool, IEEE Transactions on Engineering Management, Vol. 46 No. 2, pp. 158-70 Hillman, G.P. (1994) Making Self-assessment Successful, The TQM Magazine, Vol. 6 No. 3, pp. 29-31 Hyväri, I. (2006) Success of Project in Different Organizational Conditions, Project Management Institute, Vol. 37, No.4, 31-41 Jugdev, K. and Müller, R. (2005) A Retrospective Look at our Evolving Understanding of Project Success, the Project Management Institute Vol. 36, No. 4, 19-31 Liang, Wen-Yau (2003) The Analytic Hierarchy Process in Project Evaluation, Benchmarking: An International Journal, Vol. 10 No. 5, pp. 445-456 May, L. (1998) Major causes of software project failure, Crosstalk, July. Olander, S., Landin, A. (2004) evaluation of stakeholder influence in the implementation of construction projects, International Journal of Project Management 23 (2005) 321–328 Pinto, J. K., and Prescott, J. E. (1988) Variations in critical success factors over the stages in the project life cycle. Journal of Management 14(1), 5-18. Prabhakar, G.P. (2005) Switch Leadership in Projects; An Empirical Study Reflecting the Importance of Transformational Leadership on Project Success Across Twenty-Eight Nations, Project Management Journal, Vol. 36, No. 4, p. 53-60 Ptak, C. (2000) ERP-Tools, Techniques and Applications for Integrating the Supply Chain, New York, NY, St Lucie Press Turner, J.R. and Cochrane, R.A. (1993) Goals- and methods matrix: coping with projects with ill defined goals and/or method of achieving them, Henley Management College, Vol. 11 No 2 May Schmidt, R. and Freeland, J. (1993) Recent progress in modeling R&D project-selection processes, IEEE Transactions on Engineering Management, Vol. 39 No. 2, pp. 189-201 Slack, N., Chambers, S. and Johnston, R. (2004) Operations Management, 4th Edition, Harlow, Prentice Hall Thyssenkrupp (2007) [online], Available from: http://www.thyssenkruppsteel.com/en/portraet/themenbereiche/images/diagramm_qualitaetsmanagement.gif Tukel, O.I. and Rom, W.O. (2001) An empirical Investigation of Project Evaluation Criteria, International Journal of Operations & Production Management, Vol. 21 No. 3, 2001, pp. 400-416, MCB University Press Vidyaranya B. Gargeya (2005) Success and failure factors of adopting SAP in ERP system implementation, Business Process Management Journal Vol. 11 No. 5, 2005, pp. 501-516 Wateridge, J. (1995) “IT projects: a basis for success”, International Journal of Project Management, Vol. 13 No. 3, pp. 169-72. Wilderom (2007) [online], Available from: http://www.wilderdom.com/images/ELC4.gif [Accessed 01 April 2007]
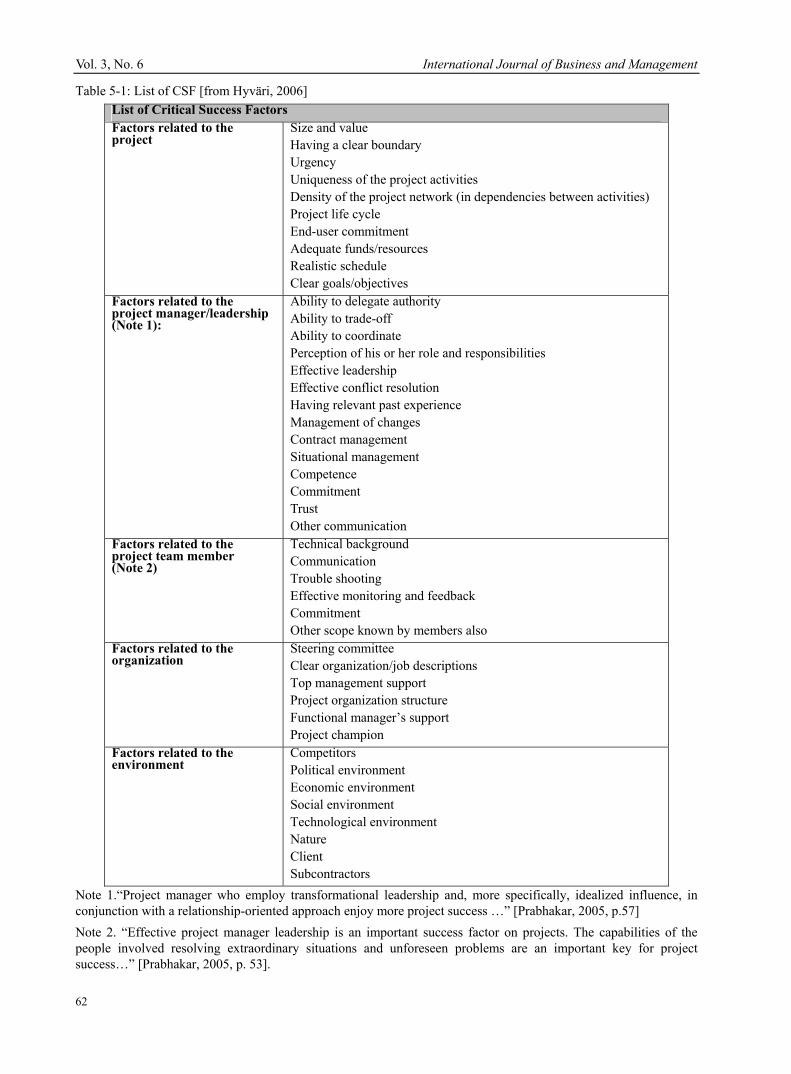
Vol. 3, No. 6 International Journal of Business and Management
62
Table 5-1: List of CSF [from Hyväri, 2006] List of Critical Success Factors Factors related to the project
Size and value Having a clear boundary Urgency Uniqueness of the project activities Density of the project network (in dependencies between activities) Project life cycle End-user commitment Adequate funds/resources Realistic schedule Clear goals/objectives
Factors related to the project manager/leadership (Note 1):
Ability to delegate authority Ability to trade-off Ability to coordinate Perception of his or her role and responsibilities Effective leadership Effective conflict resolution Having relevant past experience Management of changes Contract management Situational management Competence Commitment Trust Other communication
Factors related to the project team member (Note 2)
Technical background Communication Trouble shooting Effective monitoring and feedback Commitment Other scope known by members also
Factors related to the organization
Steering committee Clear organization/job descriptions Top management support Project organization structure Functional manager’s support Project champion
Factors related to the environment
Competitors Political environment Economic environment Social environment Technological environment Nature Client Subcontractors
Note 1.“Project manager who employ transformational leadership and, more specifically, idealized influence, in conjunction with a relationship-oriented approach enjoy more project success …” [Prabhakar, 2005, p.57] Note 2. “Effective project manager leadership is an important success factor on projects. The capabilities of the people involved resolving extraordinary situations and unforeseen problems are an important key for project success…” [Prabhakar, 2005, p. 53].
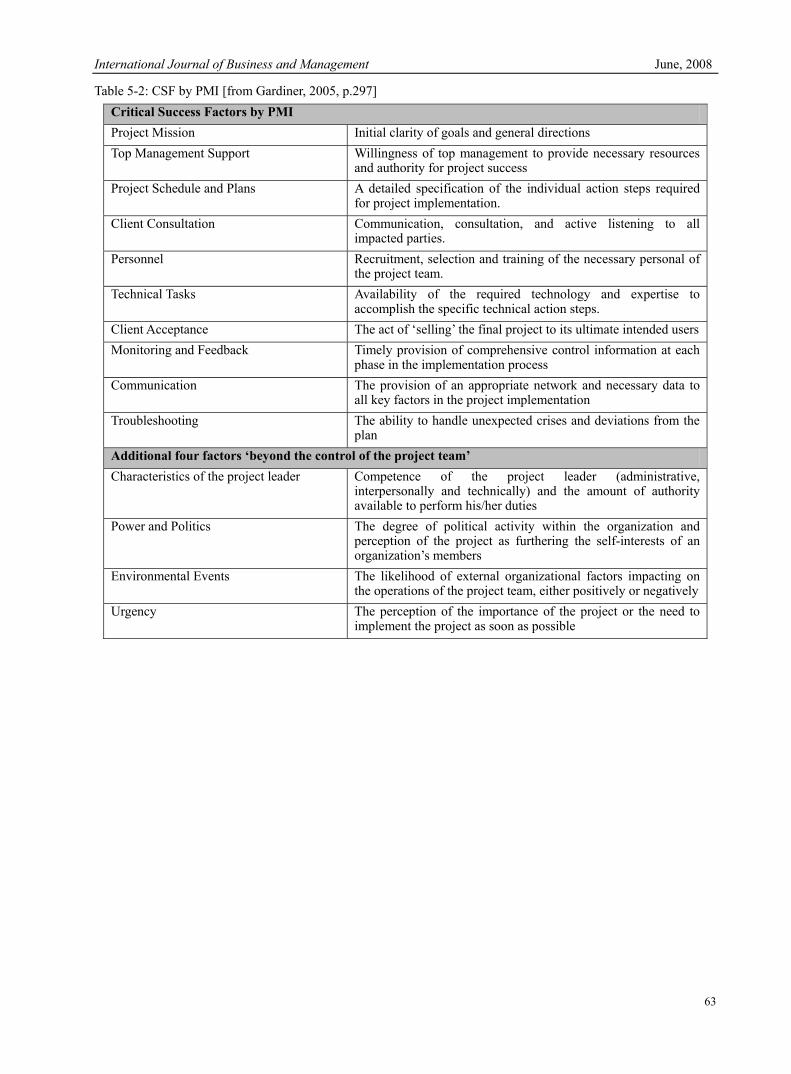
International Journal of Business and Management June, 2008
63
Table 5-2: CSF by PMI [from Gardiner, 2005, p.297] Critical Success Factors by PMI Project Mission Initial clarity of goals and general directions Top Management Support Willingness of top management to provide necessary resources
and authority for project success Project Schedule and Plans A detailed specification of the individual action steps required
for project implementation. Client Consultation Communication, consultation, and active listening to all
impacted parties. Personnel Recruitment, selection and training of the necessary personal of
the project team. Technical Tasks Availability of the required technology and expertise to
accomplish the specific technical action steps. Client Acceptance The act of ‘selling’ the final project to its ultimate intended usersMonitoring and Feedback Timely provision of comprehensive control information at each
phase in the implementation process Communication The provision of an appropriate network and necessary data to
all key factors in the project implementation Troubleshooting The ability to handle unexpected crises and deviations from the
plan Additional four factors ‘beyond the control of the project team’ Characteristics of the project leader Competence of the project leader (administrative,
interpersonally and technically) and the amount of authority available to perform his/her duties
Power and Politics The degree of political activity within the organization and perception of the project as furthering the self-interests of an organization’s members
Environmental Events The likelihood of external organizational factors impacting on the operations of the project team, either positively or negatively
Urgency The perception of the importance of the project or the need to implement the project as soon as possible
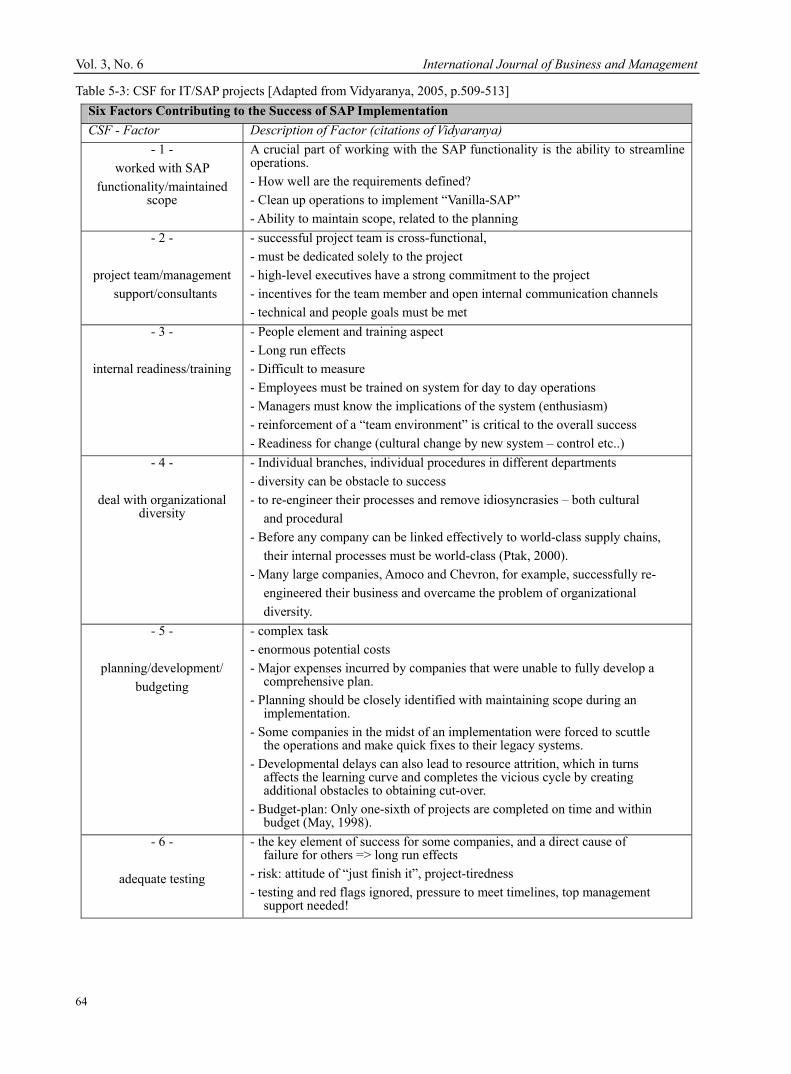
Vol. 3, No. 6 International Journal of Business and Management
64
Table 5-3: CSF for IT/SAP projects [Adapted from Vidyaranya, 2005, p.509-513] Six Factors Contributing to the Success of SAP Implementation CSF - Factor Description of Factor (citations of Vidyaranya)
- 1 - worked with SAP
functionality/maintained scope
A crucial part of working with the SAP functionality is the ability to streamline operations. - How well are the requirements defined? - Clean up operations to implement “Vanilla-SAP” - Ability to maintain scope, related to the planning
- 2 -
project team/management support/consultants
- successful project team is cross-functional, - must be dedicated solely to the project - high-level executives have a strong commitment to the project - incentives for the team member and open internal communication channels - technical and people goals must be met
- 3 -
internal readiness/training
- People element and training aspect - Long run effects - Difficult to measure - Employees must be trained on system for day to day operations - Managers must know the implications of the system (enthusiasm) - reinforcement of a “team environment” is critical to the overall success - Readiness for change (cultural change by new system – control etc..)
- 4 -
deal with organizational diversity
- Individual branches, individual procedures in different departments - diversity can be obstacle to success - to re-engineer their processes and remove idiosyncrasies – both cultural and procedural - Before any company can be linked effectively to world-class supply chains, their internal processes must be world-class (Ptak, 2000). - Many large companies, Amoco and Chevron, for example, successfully re- engineered their business and overcame the problem of organizational diversity.
- 5 -
planning/development/ budgeting
- complex task - enormous potential costs - Major expenses incurred by companies that were unable to fully develop a comprehensive plan. - Planning should be closely identified with maintaining scope during an implementation. - Some companies in the midst of an implementation were forced to scuttle the operations and make quick fixes to their legacy systems. - Developmental delays can also lead to resource attrition, which in turns affects the learning curve and completes the vicious cycle by creating additional obstacles to obtaining cut-over. - Budget-plan: Only one-sixth of projects are completed on time and within budget (May, 1998).
- 6 -
adequate testing
- the key element of success for some companies, and a direct cause of failure for others => long run effects - risk: attitude of “just finish it”, project-tiredness - testing and red flags ignored, pressure to meet timelines, top management support needed!
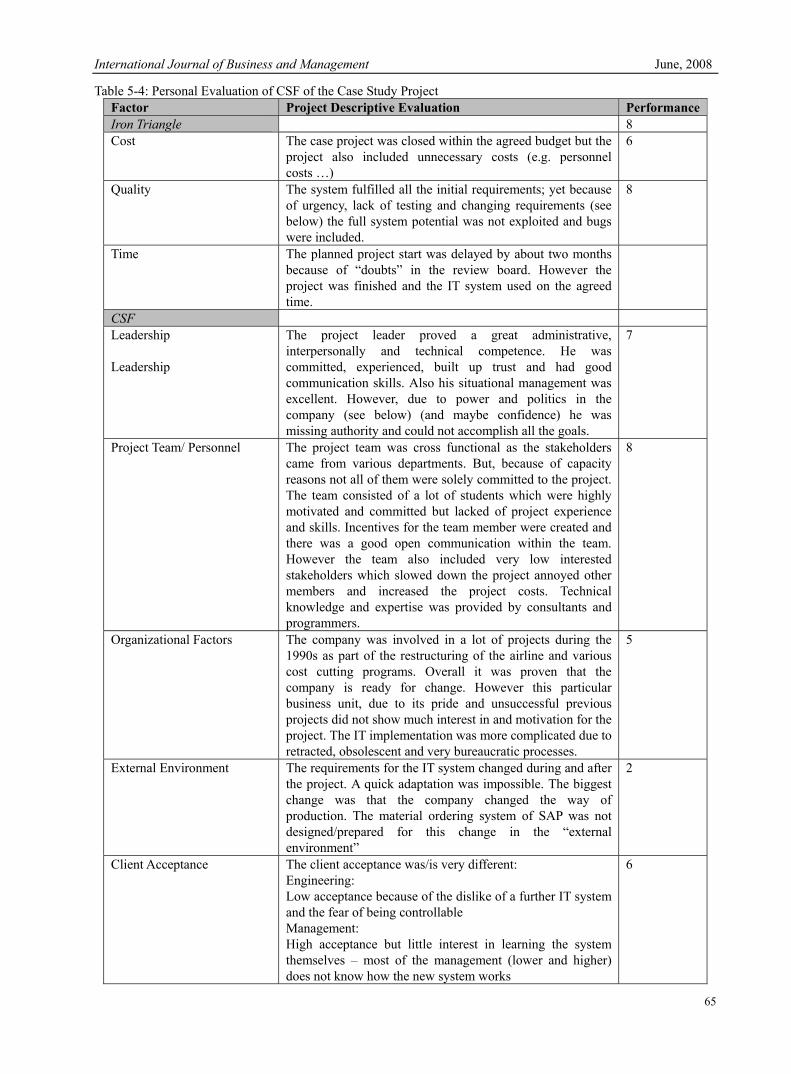
International Journal of Business and Management June, 2008
65
Table 5-4: Personal Evaluation of CSF of the Case Study Project Factor Project Descriptive Evaluation PerformanceIron Triangle 8 Cost The case project was closed within the agreed budget but the
project also included unnecessary costs (e.g. personnel costs …)
6
Quality The system fulfilled all the initial requirements; yet because of urgency, lack of testing and changing requirements (see below) the full system potential was not exploited and bugs were included.
8
Time The planned project start was delayed by about two months because of “doubts” in the review board. However the project was finished and the IT system used on the agreed time.
CSF Leadership Leadership
The project leader proved a great administrative, interpersonally and technical competence. He was committed, experienced, built up trust and had good communication skills. Also his situational management was excellent. However, due to power and politics in the company (see below) (and maybe confidence) he was missing authority and could not accomplish all the goals.
7
Project Team/ Personnel The project team was cross functional as the stakeholders came from various departments. But, because of capacity reasons not all of them were solely committed to the project. The team consisted of a lot of students which were highly motivated and committed but lacked of project experience and skills. Incentives for the team member were created and there was a good open communication within the team. However the team also included very low interested stakeholders which slowed down the project annoyed other members and increased the project costs. Technical knowledge and expertise was provided by consultants and programmers.
8
Organizational Factors The company was involved in a lot of projects during the 1990s as part of the restructuring of the airline and various cost cutting programs. Overall it was proven that the company is ready for change. However this particular business unit, due to its pride and unsuccessful previous projects did not show much interest in and motivation for the project. The IT implementation was more complicated due to retracted, obsolescent and very bureaucratic processes.
5
External Environment The requirements for the IT system changed during and after the project. A quick adaptation was impossible. The biggest change was that the company changed the way of production. The material ordering system of SAP was not designed/prepared for this change in the “external environment”
2
Client Acceptance The client acceptance was/is very different: Engineering: Low acceptance because of the dislike of a further IT system and the fear of being controllable Management: High acceptance but little interest in learning the system themselves – most of the management (lower and higher) does not know how the new system works
6
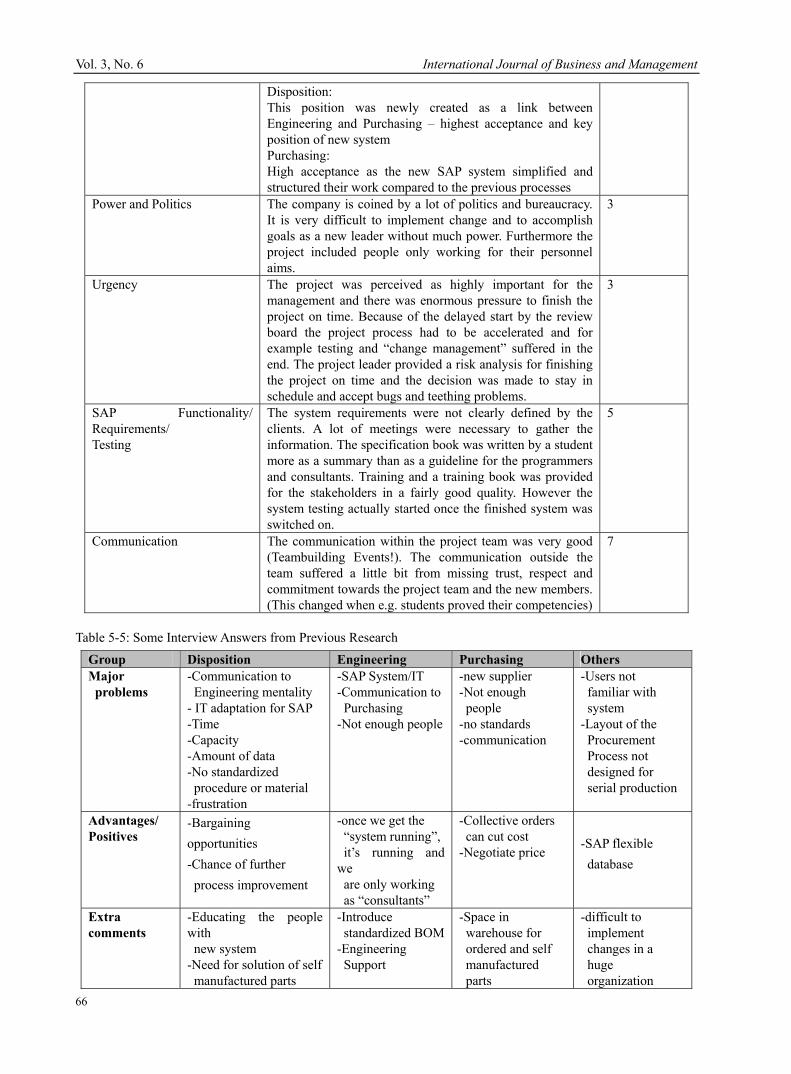
Vol. 3, No. 6 International Journal of Business and Management
66
Disposition: This position was newly created as a link between Engineering and Purchasing – highest acceptance and key position of new system Purchasing: High acceptance as the new SAP system simplified and structured their work compared to the previous processes
Power and Politics The company is coined by a lot of politics and bureaucracy. It is very difficult to implement change and to accomplish goals as a new leader without much power. Furthermore the project included people only working for their personnel aims.
3
Urgency The project was perceived as highly important for the management and there was enormous pressure to finish the project on time. Because of the delayed start by the review board the project process had to be accelerated and for example testing and “change management” suffered in the end. The project leader provided a risk analysis for finishing the project on time and the decision was made to stay in schedule and accept bugs and teething problems.
3
SAP Functionality/ Requirements/ Testing
The system requirements were not clearly defined by the clients. A lot of meetings were necessary to gather the information. The specification book was written by a student more as a summary than as a guideline for the programmers and consultants. Training and a training book was provided for the stakeholders in a fairly good quality. However the system testing actually started once the finished system was switched on.
5
Communication The communication within the project team was very good (Teambuilding Events!). The communication outside the team suffered a little bit from missing trust, respect and commitment towards the project team and the new members. (This changed when e.g. students proved their competencies)
7
Table 5-5: Some Interview Answers from Previous Research
Group Disposition Engineering Purchasing Others Major problems
-Communication to Engineering mentality - IT adaptation for SAP -Time -Capacity -Amount of data -No standardized procedure or material -frustration
-SAP System/IT -Communication to Purchasing -Not enough people
-new supplier -Not enough people -no standards -communication
-Users not familiar with system -Layout of the Procurement Process not designed for serial production
Advantages/ Positives
-Bargaining opportunities -Chance of further process improvement
-once we get the “system running”, it’s running and we are only working as “consultants”
-Collective orders can cut cost -Negotiate price
-SAP flexible database
Extra comments
-Educating the people with new system -Need for solution of self manufactured parts
-Introduce standardized BOM-Engineering Support
-Space in warehouse for ordered and self manufactured parts
-difficult to implement changes in a huge organization
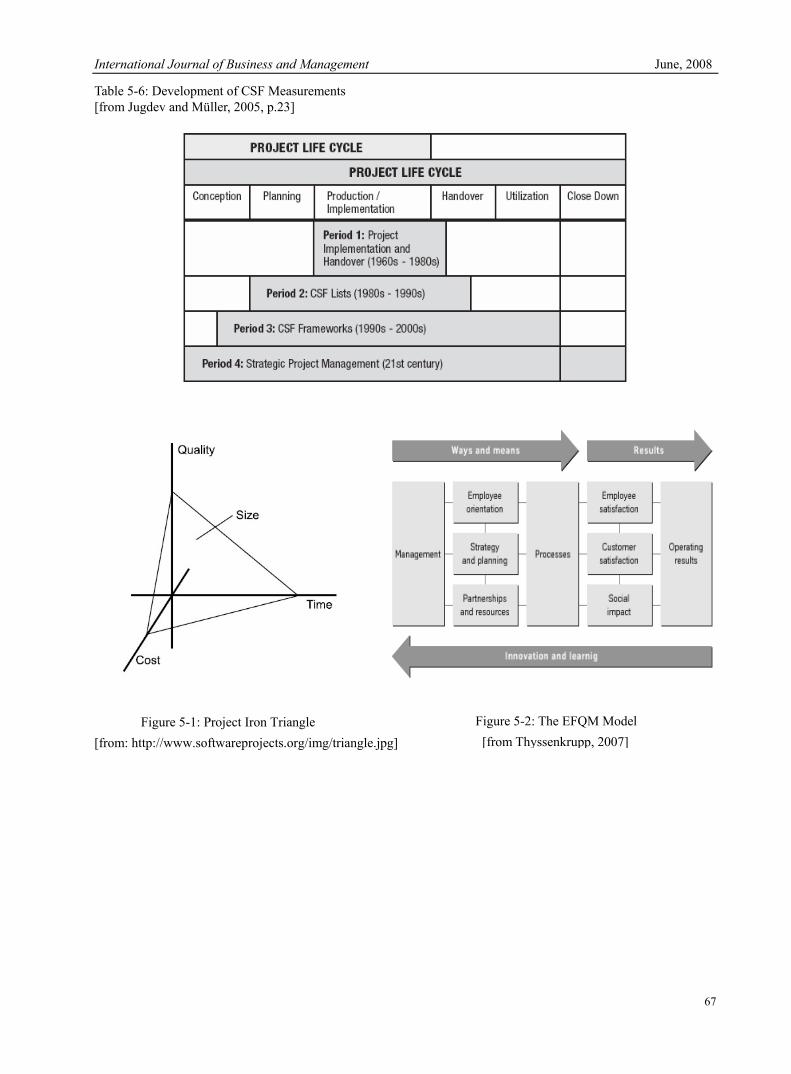
International Journal of Business and Management June, 2008
67
Table 5-6: Development of CSF Measurements [from Jugdev and Müller, 2005, p.23]
Figure 5-1: Project Iron Triangle
[from: http://www.softwareprojects.org/img/triangle.jpg]
Figure 5-2: The EFQM Model [from Thyssenkrupp, 2007]
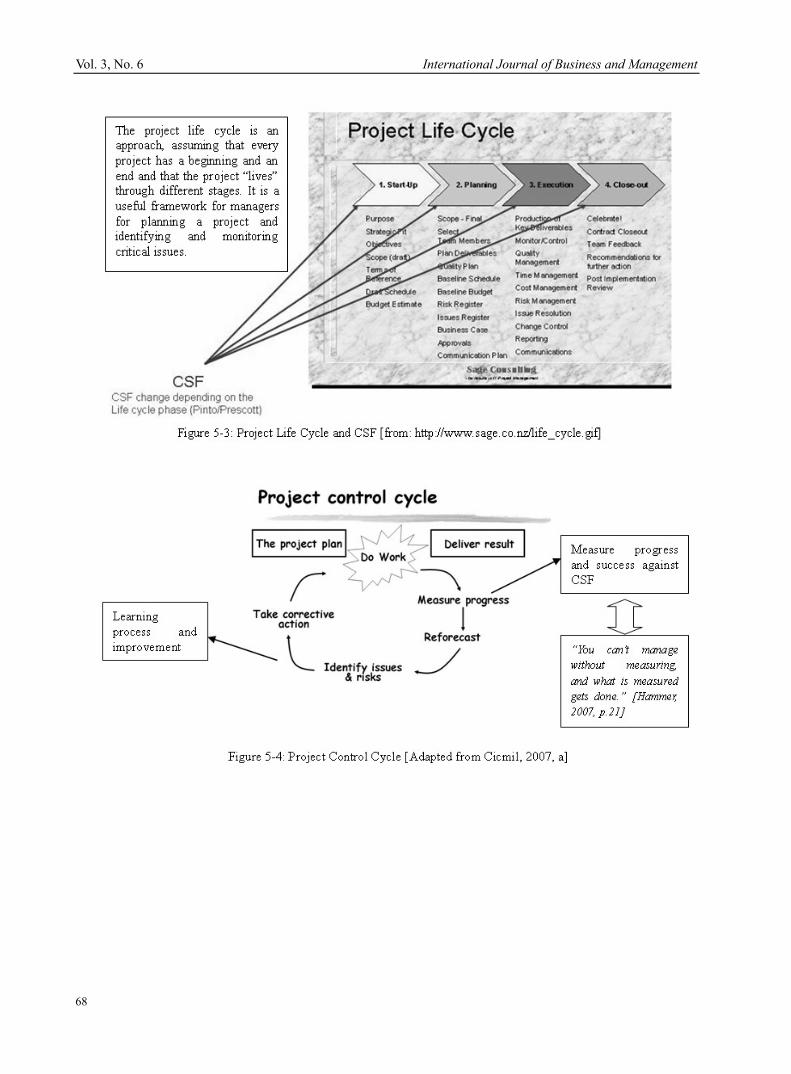
Vol. 3, No. 6 International Journal of Business and Management
68
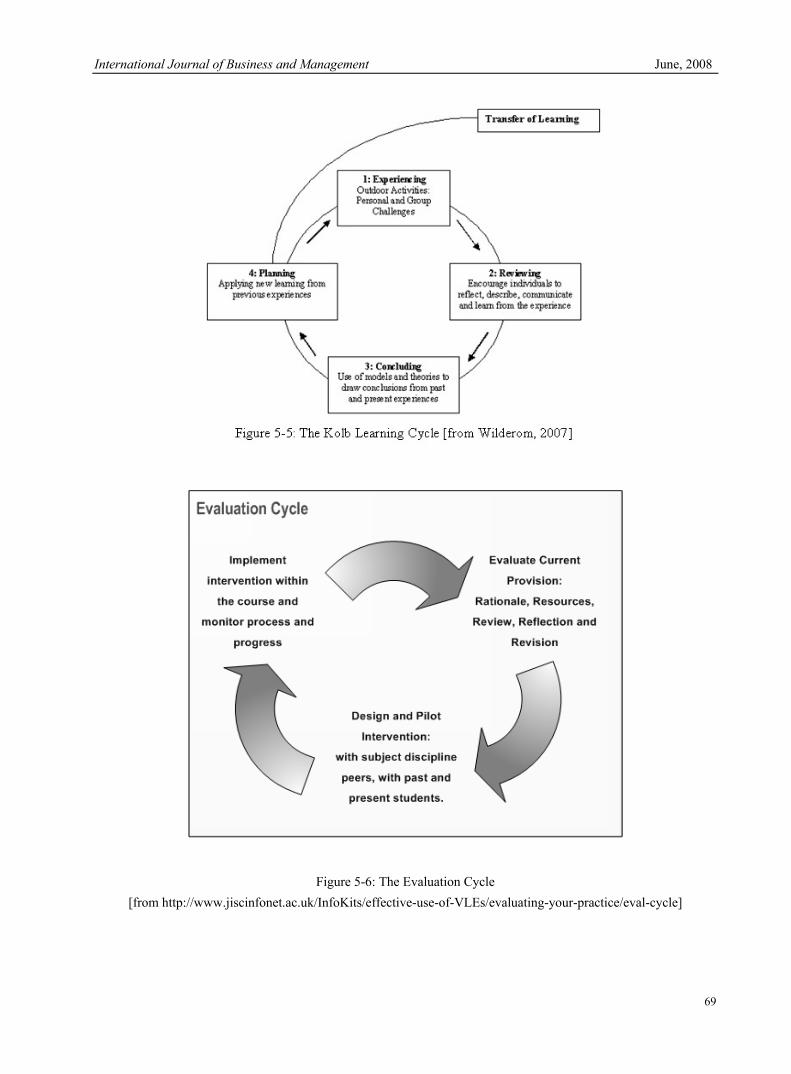
International Journal of Business and Management June, 2008
69
Figure 5-6: The Evaluation Cycle [from http://www.jiscinfonet.ac.uk/InfoKits/effective-use-of-VLEs/evaluating-your-practice/eval-cycle]
Vol. 3, No. 6 International Journal of Business and Management
70
1 Abbreviations AOG Aircraft on Ground ATA Air Transport Association BOM Bill of Material BBS Bristol Business School Bhf 150 name of warehouse in completion hangar (Bahnhof 150) CC Completion Center CSF Critical Success Factors EFQM European Foundation for Quality Management IDL Installation Document List JIT Just in Time MRO Maintenance, Repair and Overhaul Company PMI Project Management Institute SAP “Systems, Applications and Products in Data Processing” (SAP AG)
International Journal of Business and Management June, 2008
71
A Study on the Strategy of Cultivating
China’s Self-Owned Brands Xiaoshui Yu
Shandong University of Finance, Jinan 250014, China E-mail: [email protected]
Abstract Self-owned brand reflects the national innovation. It is the essence of national culture and the hope of China economy. At present, the construction of self-owned brand in China faces a lot of problems, such as the small quantity of brands, the weak brand consciousness, the lack of brand-protection consciousness, the short life cycle of brand, the less added value, and the poor competence. In order to cultivate China’s self-owned brands, we should improve the brand loyalty, create brand association, execute brand innovation, enhance brand protection, and stress on the effect of government. Keywords: Self-owned brand, Brand loyalty, Brand association, Brand innovation Self-owned brand is the synthesis of a company and its product. It has the integrated features of the company in innovation capability, corporate management, market-positioning, marketing, and after-sale service. The core of brand image and brand competence reflected by the self-owned brand is coming from the core product that integrates advanced technologies and continuous innovations together. Possessing the powerful capability of self-development and the core technology with self-owned intelligent right is the most fundamental and key competence for the company. China has already become the No.3 in world trade field. And the brand construction in China has already gained great progresses. However, the weak competence of China’s self-brands has not been changed thoroughly. Most companies still stay in the backward position of the industrial chain, what harms China economy’s further development to a great degree. 1. The importance of developing self-owned brands in China 1.1 Self-owned brands reflect the state innovation. Self-innovation is the focus of economic and social development during the period of the “11th five-year plan” in China. The national innovation system includes four aspects: knowledge innovation system, technology innovation system, fruit prevalence and pervasion system, government and social support system. The development of self-owned brands has to depend on the four systems at the same time. Therefore, the final representation of the state innovation system is the company’s self-brand. 1.2 Self-owned brands are the essence of the national culture. Culture is an important element that distinguishes one nation from other nations in the world. Besides, culture is the key of a brand gaining success in the international market. “Half of the brand is culture.” Brands are impressed with culture. As consumers accept a brand, they accept the special culture reflected by the brand. Brands display the national culture for the world delicately and completely. As the products with certain brand enter the domestic market, people choose them because of the quality and service. As the products enter the international market, people choose them not only because of the quality and service but also the culture of the country. 1.3 Self-owned brands are the hope of China economy. Brands directly reflect the economy and development of regions and countries. In certain region, the quantity and quality of brands can not only reflect the development of regional economy, but also create directly abundant material wealth for the region. 2. The present situation of China developing self-owned brands and the problems Since the execution of reform and open policy, China’s self-brand construction has already achieved historical breakthrough, gaining marvelous achievements. The influences of well-know brands have been extended gradually and the innovation capability of self-owned brands has been improved constantly. Hair, Lenovo, and many other self-owned brands have entered the world market. In 2001, no Chinese brand was in the list of “World Brand Top 500”. But in 2005, four Chinese brands, Hair, Lenovo, CCTV, and Changhong were in the list. And in 2006, the number was 6, accounting for 1.2% of the list. In 2007, the number reached 12. And China Mobile, CCTV, and Hair
Vol. 3, No. 6 International Journal of Business and Management
72
entered the list of Top 100. Although the number is still small, it reflects the continuous growth and development of China brands. At present, the construction of China’s self-owned brands faces these problems as follow. 2.1 The number of brands is small and less are world-known brands. At present, China is the No.4 in the world manufacturing field. More than one hundred products generate the largest output in the world. China is worthy of the name of huge manufacturer. However, concerning with brands, China is trivial. China does not have advantages over world-famous brands in prices, classes, marketing, and research and development ability, what can not match China’s position of being a giant in trade and exporting filed. As a result, it affects China’s world competence severely. In China, corporate brands face three shortages, namely the self-owned brands, the influencing brands, and the world brands. 2.2 Because of the weak consciousness of brand, many domestic brands in China have been purchased or merged by multi-national companies gradually. Some Chinese brands that cooperate with foreign companies are disappearing from the market on the whole. In the cooperation process, Chinese brands recognize the brand crisis gradually. Although Chinese brands are still in use in the cooperation, their values are depreciating. Therefore, Chinese brands have to redeem themselves from the cooperation. Multi-national companies depreciate the values of Chinese brands by reducing the proportion of investment in Chinese brands. By the brand merge & purchase strategy, they can exclude the powerful Chinese competitors on one hand. On the other hand, they can occupy the market completely. 2.3 Chinese brands are lack of trademark-protection consciousness and most suffer from the foreign companies’ trademark preemption. Brands are the products of market economy. The more competitive the market, the more the brand strategy is needed. Nowadays, although China holds Hair, Lenovo, Wahaha, and many other famous brands, many companies still do not have sufficient trademark consciousness and are short of self-protection of brands. Data show that since the execution of reform and open policy, because of the weak trademark consciousness in companies more than 200 domestic brands that work the export field in China have been preempted by foreign companies in foreign countries. And the loss of virtual asset is about more than 1 billion Yuan annually. The frequently happened trademark preemption cases serve as an alarm bell for Chinese companies. However, similar cases still happen one after another. Companies have to re-name themselves, paying high expenses for the recreation of fame. For example, the Reader, a well-know magazine in China, was named as Reader’s Digest. However, because an American magazine, Reader’s Digest registered the name both in English and Chinese, it has to rename itself as Reader. 2.4 China’s brands have short life cycle, less added value, and poor competence, contributing less to economic development. In China, hundreds of thousand new brands appear every year, but their average life cycle is no more than two years. At present, only 3/10,000 Chinese companies possess the core technology that has self-owned intelligent right. 99 percent of companies do not apply patents. 60 percent of companies do not have self-owned trademarks. Although China has already become a giant in world trade field, 55 percent of exports belong to processing trade. Less then 10 percent of products in export possess self-owned brands. 90 percent of high-tech products in export are produced by foreign-funded companies. In the world market, China’ exports’ competence is lower in four aspects: namely the lower product level, the lower price, the lower market share, and the lower profitability. 3. The strategy of China cultivating self-owned brands Under the condition of economic globalization, the competition between countries focuses on the competition between companies, especially multi-national companies. The direct reflection is the sharp conflict between brands, which will bring about sudden changes for world brand map. Brand competence has become an important representation for a country’s competence. Whether an company cultivates a self-owned brand and develop it into a world famous brand, and grow into a world-class company or not has become an important signal to evaluate whether a Chinese company possesses core competence and achieve sustainable development or not. Therefore, Chinese companies still have a long way to go. 3.1 Improve brand loyalty. Brand loyalty refers to consumers’ inclination to make repetitive purchase because of preference for certain brand for a long period of time. Whether a consumer has the loyalty to one brand or not, no matter what it is emotional loyalty or behavioral loyalty, there is a precondition that the consumer must trust in the brand to a great degree. Brand trustiness means the company can fulfill all commitments to target customers. To improve the company’s brand trustiness is one of the ways to improve the brand loyalty.
International Journal of Business and Management June, 2008
73
3.2 Create brand association To arouse a series of associations from customers’ minds is named as brand association. These brand associations form the brand image by integrating together. If there are brand associations, it is easy for consumers to retrieve useful information from memory. (1) A specific brand usually stands for a kind of product. The characteristics of product and service are named as the product attributes. Once a brand becomes the No.1 brand, the attributes of the product with the brand will become the representatives of one sort of products. Consumers will accept these attributes and the sort of products. (2) To combine the brand, the specific users, and the specific using conditions will enhance the brand image. Consumers’ impression of one product is coming from their experiences or advertising. Therefore, the specific place, time, formal or informal situation will help to arouse similar associations of consumers. (3) The natural environment, resources, culture, and tradition in one country or region have close connection with certain features of one product. Therefore, the brand’s original source will affect consumers’ brand association. In other words, to associate with one country or region’s culture becomes a part of brand. (4) The brand personality refers to the communication of products and brand features, and the consumers’ recognition of these features. A brand has five unique personality elements: purity, stimulating, worthy, mature, and straightforward. The brand personality exists in every aspect of a product, such as the product itself, the founder of a brand, and the history of a brand. The cultivation of brand personality should meet consumers’ preferences, making the brand personality be in accord with the personality of target consumers as much as possible. (5) Communication is the core method to create brand association. ① Product package is extremely important. An excellent package can help to create association and popularizing a brand. ② The penetrating, profound, and meaningful advertisement has infinite communication power. It may become target consumers’ life credo and even the life style. ③ The image presenter is the brand’s signal. It can stand for the brand personality and make annotations for the emotional relations between the brand and consumers. As a result, many image presenters have become the representatives of certain product. ④ The core function of promotion is to stimulate the decision of purchase in a short term. ⑤ In the aspect of creating brand association, public relations are better than advertisement sometimes. Positive public relations are more reliable and attractive. Besides, public relations are especially useful in coping with brand crisis. All these methods mentioned above can make consumers form unique brand associations, enhance the brand associations’ intensity, and cultivate the preference toward the brand. By this way, consumers may buy products with the brand. 3.3 Carry out brand innovation. It is necessary to extend more spaces for a brand in order to make it long-lasting and energetic in development. By means of continuous innovation and updating products, we can cultivate new growing point for the brand. (1) New product or new technology is the key, which can show target consumers the features of a brand, reflecting whether a brand emphasizes on consumers’ interests or not, whether a brand possesses the spirit of innovation or not, whether it can meet consumers’ need immediately or not. Product innovation includes many aspects, such as functions, types, and packages, especially the aspect of technology innovation. (2) Advertising is the most important way to cultivating a brand image. New, special, unique, and excellent advertising originality can bring about fresh feelings for people. And the advertising channels need for innovation either. Advertising innovation may concern many fields, such as advertising forms, time periods, media, and so on. (3) Make innovation in marketing. For example, as Haagen-Dazs sales ice cream, it sales love at the same time. As Starbucks sales coffee, it sales an excellent environment either. All these innovations serve as valuable reference for us. We should make marketing innovations based on characteristics of target consumers in China. (4) The strategic innovation can improve the brand competence. In order to improve the global competence, a company has to adopt industrial reengineering on one hand. Some needs to be given up and some integrated and some strategic alliance. On the other hand, it is also important to re-position the company. A company must compete with itself, focus on surpassing itself, give up former achievements, and change game rules continuously in order to improve the competence of self-owned brand. (5) Along with the changes of business environment and consumers’ needs, the form of brand is changing in order to meet the requirements of social and economic development. Therefore, as the corporate signal that is used to reflect the industrial attributes for a long period fails to transfer the information concerning services, humanism, and customer cares, it is necessary to change or construct new brand system.
Vol. 3, No. 6 International Journal of Business and Management
74
3.4 Emphasize on brand protection. (1) Protect the intelligent right. Apply patents. Patents serve as spears for brands on one hand, what can help to enlarge the market by technology certificate trade. On the other hand, patents are shields for brands, preventing other companies from entering certain field. Companies should familiarize with relevant patent knowledge and application procedures, and protect their technologies. Besides, companies can turn patents into exclusive technologies by secret-protecting measures. (2) Protect commercial secrets. Commercial secrets, because of its exclusiveness and utility, can bring about economic benefits for owners. Commercial secrets are usually technological information and business information, including production ways, technologies, procedures, crafts, designs, market information, and customer list, that are protected by owners. Companies should keep these commercial secrets strictly. Any technologically visit is not welcome. (3) Protect the trademark right. The key of protecting brand is to protect the trademark right. In the aspect of trademark register, companies should register their trademarks in advance. Only when a trademark is registered in relevant agencies, can it be protected by the law. Implement a complete trademark register, including vertical register, horizontal register, domestic register, international register, traditional register, and Internet register. Emphasize on trademark’s defensive register. Register a brand for not only one sort or one product but also many sorts of products at the same time. Apply for the origin protection. (4) Protect the quality of a product. Strict quality management is the most important way to protect a brand. Insist on total quality management and full management. Make up practical quality development goals. Adopt the international standards and foreign advanced standards. Form a series of excellent products with high quality and high taste. Improve the brand products’ market share. 3.5 Stress on the effect of government. At present, the government advocates self-innovation and self- owned brand, which contributes a lot to a favorable environment for companies. The government should exert its effects on direction and supervision, aiming at cultivating a healthy market environment. (1) Construct and perfect the brand protection system. Constitute and perfect the Law of Trademark, the Law of Patent, the Law of Advertising, and the Law of Anti-Unfair Competition. Stick strictly on any action that invades companies’ legal rights and interests. Exclude all fake and bad products from the market. Protect the rights and interests of brand owners. Clear away all barriers and jams that stop companies from developing self-owned brands. (2) Constitute brand cultivation policy. All relevant professional official departments should cooperate together to make up a series of policies to support the self-owned brands’ construction, development, and growth, providing with financial, information, training, and legal consultation services for companies’ brand construction. The government should support and lead companies to achieve a sustainable development by enhancing the macro economic adjustment and pulling the increase of domestic demand. By this way, the government can help to create an initial market for companies developing self-owned brands and entering the world market competition gradually. (3) Make up policies for brand popularization and communication. The government can help companies to popularize and advertise their brands by making up standards, organizing competitions, holding exhibit and cultural day. Besides, the government should emphasize on the consciousness of brand and execute the state strategy of innovation, driving the construction of self-owned brands in China. References Huang, Jing. & Wang, Wenchao. (2005). Brand Management. Wuhan: Wuhan University Press. Li, Guangdou. (2004). Brand Competence. Beijing: China Renmin University Press. Nian, Xiaoshan. (2003). Brand Science. Beijing: Tsinghua University Press. Sun, Riyao. (2005). Brand Economics. Beijing: Economic Sciences Press. Zhao, Chen. (2003). Brand Science. Changsha: Hunan Fine Arts Publishing House. Zhenze, Minghao (Japan). (2004). Translated by Cui, Jingshi. Complete Dimensional Operation. Beijing: Central Compilation & Translation Press.
International Journal of Business and Management June, 2008
75
Effects of Take-over Motives and Ownership Structure on
Premiums Paid: Evidence from Malaysia Saw-Imm SONG (Corresponding author)
Universiti Teknologi MARA Sarawak, Jalan Meranek, Kota Samarahan, 94300, Sarawak, Malaysia Tel: 6016-4002361/6082-677636 E-mail: [email protected]
Ruhani ALI
Universiti Sains Malaysia E-mail: [email protected]
Subramaniam PILLAY
University of Nottingham in Malaysia E-mail: [email protected]
Abstract This study seeks to determine the effect of motives for take-overs and ownership structure on the level of premiums paid in take-over transactions in Malaysia. Using 136 take-over transactions for the period of 1990 -1999, we found that the take-over premiums were much higher than those in developed countries. The various motives for take-overs had different impact on the level of premiums paid in different industries. The evidence also suggests that the main motive of the bidders was more towards enhancing the earnings base of the bidders rather than playing the disciplinary role for under-performed target. Family-owned firms paid a lower level of premiums compared to non-family firms unless the targets had good performance (relatively higher ROAs). This study concludes that ownership by family aligned the interests of the owners to that of the shareholders rather than resulting in the expropriation of minority shareholders. Keywords: Corporate Take-overs, Motives, Ownership structure, Premiums paid, Malaysia 1. Introduction Generally premiums paid in take-over transactions are positively related to potential acquisition-related benefits, either from expected synergistic gains or private benefits of control. Given the high concentration of ownership especially in the hands of families, the large controlling owners are expected to align their interests to that of the shareholders (Jensen and Meckling, 1976). However, many studies highlight that the entrenched manager (Note 1) or the controlling shareholders in firms with high concentration of ownership engage in non-value-maximizing activities for private gains in East Asian countries (Claessens et al, 1999; Lemmon and Lin 2003). The phenomenon above is highlighted by Johnson et al. (2000) as “tunnelling” which reflects that controlling shareholders have strong incentive to transfer out resources from the firm for their own private benefits at the expense of minority shareholders. For instance, the controlling shareholders can buy over companies or assets owned by them at a very high premium (Cheung, 2004). This study seeks to examine the effect of ownership structure and the motives for take-overs on the level of premiums paid in take-over transactions in Malaysia. Malaysia provides a good case of study as it was among the most active corporate control markets in the ASEAN region in the 1990s (Metwalli and Tang, 2002). It accounted for 41 percent of the total deals and 38 percent of the M&A transaction value of target firms in ASEAN from 1990 to 2000. M&A transactions between local firms accounted for 74 percent of all the M&A transactions. Using 136 take-over transactions for the period of 1990 -1999, we found that the take-over premiums were much higher than in developed countries. The various determinants have different impact for the level of premiums paid in different industries. Malaysian take-over market was used more for enhancing the earning base of the bidder rather than playing the disciplinary role for under-performed targets. It is found that family owned firms pay a lower level of premiums compared to non-family firms unless the targets have high ROA. High concentration of ownership (by family) tends to align the interests of the owners to that of the shareholders (Jensen and Meckling, 1976) rather than the expropriation of minority shareholders (Claessens et al, 1999).
Vol. 3, No. 6 International Journal of Business and Management
76
The structure of this paper is organised as follows: Section 2 summarises the existing literature on motives for take-overs, ownership structure, and other factors that could have an effect on the level of premiums paid. Section 3 describes the methodology, and the a priori expectation of the variables used. Section 4 describes the data. Section 5 reports results from cross-sectional regressions and finally section 6 summarizes and concludes the paper. 2. Literature Generally, in finance literature, there are three main motives for take-overs, namely, operational, managerial, and financial synergies (Megginson, 2004). The premiums paid represent the expected synergies to be gained from the take-overs. In order to obtain operational synergies, the business combination would require much overlap in the activities of the two firms (Sudarsanam, 1996). This synergy is expected when the assets of the target and bidder firms are used more effectively by the combined firms than by the target and bidder operating separately. As a result of the possible synergistic benefits that may accrue from related acquisitions, e.g economies of scale and scope, the premiums paid should be higher for the target. In terms of managerial synergies, managers will vigorously seek under-performing targets in order to exercise their managerial expertise and transform the target firms into profitable ones. This disciplinary role is more prevalent in the US especially in the 1980s (Shleifer and Vishny, 1988). Managerial synergies could also be generated if targets have unique expertise and thus have strong earning capabilities that would enhance the performance of the bidding firms. Thus, the bidder is not only acquiring the target’s stock but also the right to control that will enable the bidder to use the target’s assets and resources to maximise the value of the bidder’s firm value. Financial synergies occur when a take-over results in lower costs of capital, lower default risks or coinsurance effects of the combined firms. For instance, the bidders would be able to get tax advantages from high gearing targets. If one of the parties, either the bidder or the target, has unused debt capacity while the other already operate at its optimal gearing level, the combination of the two firms will be able to exhaust the unused debt capacity. As such, if the bidder’s motive is to take advantage of the target’s gearing level, he would be willing to pay a higher premium. This is supported by Walkling and Edmister (1985) who found that there is a negative relationship between debt ratio and premiums paid. Generally, there is little empirical evidence on the determinants of premiums paid especially outside the United States. Slusky and Caves (1991) using the U.S. data from 1986-1988, found that real and financial synergies evidently contribute less in explaining the variance of premiums than do agency factors. They contend that weakly monitored managers of acquiring firms overpay. They find a negative relation between premiums paid and substantial shareholders who are not directors, and larger managerial ownership. In companies with high concentration of ownership such as those in the East Asian countries, the direction of the relationship between premiums paid and ownership structure is unclear. Agency theory predicts that managers may indulge in non-maximising transactions such as excessive consumption of perquisite or sub-optimal risk taking activities, such as take-overs, when they do not have a significant ownership stake in the firm (Hubbard and Palia, 1995; Lewellen, Loderer and Rosenfeld, 1985). If managers act to serve their self-interest rather than the shareholders, the tendency for them to overpay the bid premiums is greater as the take-over of companies is associated with greater perquisite and prestige, and lower risk (Amihud and Lev, 1981). At the lower managerial ownership stake, managers are willing to pay a high bid. However if managers hold higher ownership stake, the interest of the managers is more aligned to that of shareholders’ (McConnell and Servaes, 1990) and will result in a negative relationship between the bid premiums and the managerial equity stake. Nevertheless, Hubbard and Palia (1995) highlight that at higher managerial ownership stakes, managers enjoy private benefits of control such as discretion over the choice of investment projects and control over the appointment of members of the board of directors. As such, if they value this control, they are unwilling to sell their stake in the financial markets, which results in managers holding a large non-diversified financial portfolio. In order for the managers to diversify their portfolio, they are willing to pay a high premium for the target even when they own a significant equity ownership. Thus, it is obvious that the impact of large shareholders on mitigating agency problems is still vague. However, given the background that diffused ownership is less desirable in the weak legal systems (Morck and Yeung, 2004) in emerging markets, the presence of large shareholders in mitigating the agency conflicts is more likely. Accordingly, as family ownership is usually concentrated, the motives for take-over by family ownership would mitigate the level of premiums paid. Other determinants of premiums used in the US studies include take-over characteristics such as method of payment and size (Slusky and Caves, 1991; Loughan and Vijh, 1997), number of bidders ( Walker, 2000), and hostile or friendly take-overs(Tse and Soufani, 2001). The take-over characteristics in this study which are relevant, are the
International Journal of Business and Management June, 2008
77
size and method of payment. This is because most of the take-over deals in Malaysia involved only single bidders and are done on a “willing buyer and willing seller" basis. Myers and Majluf (1984) contend that if the management of the bidding firm has superior inside information that its assets are undervalued, cash financed acquisition is more likely to happen. This is a positive signal sent by the bidder to the market that the bidder’s existing assets are undervalued. Shawky et al (1996) argue that there should be a negative relationship between premiums paid and cash offer. However their empirical findings show otherwise. On the other hand, cash offers involve immediate capital-gains tax. (Note 2)Thus, bidders need to pay a higher premium in order to offset the capital gain tax incurred by target shareholders (Wansley, Lan, and Yang, 1983; Brown and Ryngaert, 1991). In a study by Chang (1998) on the returns of bidders on the acquisition of privately-held targets, he found that in stock offers, bidders experience positive abnormal returns, which is in contrast to the negative abnormal returns typically found in acquiring a publicly traded target. He contends that this is due to the creation of large blockholders in the bidding firm from the target if common shares are issued to the target shareholders. These blockholders can serve as an effective monitor of managerial performance. The willingness of target shareholder to take large positions in a firm also conveys favourable information about the firm. Their findings are also supported by Fuller et al (2002) and Abdul Rahman (2002). Thus, the premiums paid would be higher for payments involving cash instead of equity. On the contrary, if the take-overs involve related party transaction, the potential for the expropriation by the controlling parties would be greater (Cheung, 2004). Thus, premiums paid would be greater. The size of the target could be one of the factors that affects the premiums paid to the target. If the target size is bigger, the impact of the combination will be more significant. Jarrell and Poulsen (1989) and Loderer and Martin (1992) found a positive relationship between the relative target size and the cumulative abnormal returns of the bidder upon announcement of the combination. However, this is in contrast to the argument by Palia (1993) and Shawky et al (1996) that smaller targets are priced more competitively than bigger targets. This is because smaller targets will put less strain on the bidder’s financial resources and will require less integration efforts. Thus, the relationship is not absolute. The model for the determinants of premiums paid and their a priori expectations are specified in the next section. It specifically examines the impact of the synergy and ownership variables on the premiums paid, controlling target size, method of payment and Asian Financial crisis that could have had an impact on the premiums paid. 3. Methodology To examine the impact of synergy and ownership variables on premiums paid, we regress the premiums paid on the proxies for the various synergies, ownership structure and control variables. The first and second base models are as follows Premiums paid = f(Motives, Concentrated ownership, Control variables) Premiums paid = f(Motives, Family ownership, Family ownership*Motives, Control variables) Mathematically the models are expressed as follows: Premiums = α + β1RELATEi + β2AVGROAi + β3T_DTAi + β4BIDLARGEi + BIDLARGESQi + β6MPAYi + NEWBLOCi + LOTAR_TAi + β7CRIYEARi + DUMSECii + εi [1] Premiums = α + β1RELATEi + β2AVGROAi + β3T_DTAi + β4FOWNi + FOWN*RELi+ FOWN*ROAi + FOWN*DTA1i + β6MPAYi + NEWBLOCi + LOTAR_TAi + β7CRIYEARi + εi [2]
In the first model, relatedness of business (RELATE as a proxy for types of combination and operational synergies), the difference in debt/asset between the target and bidder (T_DTA as a proxy for latent debt capacity and financial synergies), pre-take-over returns on assets (AVGROA as a proxy for managerial efficiency), ownership concentration (BIDLARGE and BIDLARGESQ for non monotonic relation), method of payment (MPAY), new dominant block of ownership created in the combined firms (NEWBLOC), target size (LOTAR_TA), crisis period dummy variable (CRIYEAR), and industry sector dummy variable (DUMSEC) are used as the independent variable to explain the variations in premiums paid. The computation of premiums paid follows the measure used by Palia (1993) and Shawky, Kilb and Staas (1996) who use the ratio of the offer price divided by the book value of the target. This measure is used as most of targets in the sample were non-public listed firms. This ratio gives an indication of how many times the bidder is willing to pay for the target firm over its book value. The second model includes the interaction effect of the identity of the dominant ownership and motives for take-over. FOWN is a dummy variable equal to one if the firm’s dominant owner is an individual or family, zero otherwise. Appendix 1 shows the definition of the variables used.
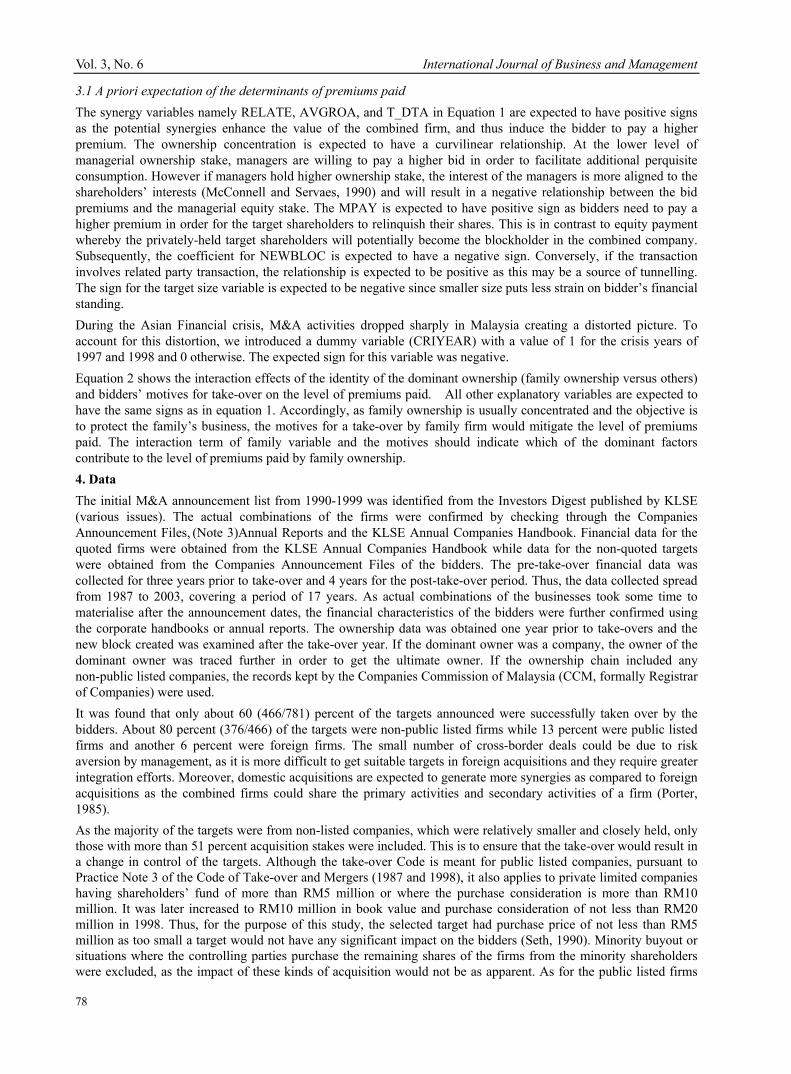
Vol. 3, No. 6 International Journal of Business and Management
78
3.1 A priori expectation of the determinants of premiums paid The synergy variables namely RELATE, AVGROA, and T_DTA in Equation 1 are expected to have positive signs as the potential synergies enhance the value of the combined firm, and thus induce the bidder to pay a higher premium. The ownership concentration is expected to have a curvilinear relationship. At the lower level of managerial ownership stake, managers are willing to pay a higher bid in order to facilitate additional perquisite consumption. However if managers hold higher ownership stake, the interest of the managers is more aligned to the shareholders’ interests (McConnell and Servaes, 1990) and will result in a negative relationship between the bid premiums and the managerial equity stake. The MPAY is expected to have positive sign as bidders need to pay a higher premium in order for the target shareholders to relinquish their shares. This is in contrast to equity payment whereby the privately-held target shareholders will potentially become the blockholder in the combined company. Subsequently, the coefficient for NEWBLOC is expected to have a negative sign. Conversely, if the transaction involves related party transaction, the relationship is expected to be positive as this may be a source of tunnelling. The sign for the target size variable is expected to be negative since smaller size puts less strain on bidder’s financial standing. During the Asian Financial crisis, M&A activities dropped sharply in Malaysia creating a distorted picture. To account for this distortion, we introduced a dummy variable (CRIYEAR) with a value of 1 for the crisis years of 1997 and 1998 and 0 otherwise. The expected sign for this variable was negative. Equation 2 shows the interaction effects of the identity of the dominant ownership (family ownership versus others) and bidders’ motives for take-over on the level of premiums paid. All other explanatory variables are expected to have the same signs as in equation 1. Accordingly, as family ownership is usually concentrated and the objective is to protect the family’s business, the motives for a take-over by family firm would mitigate the level of premiums paid. The interaction term of family variable and the motives should indicate which of the dominant factors contribute to the level of premiums paid by family ownership. 4. Data The initial M&A announcement list from 1990-1999 was identified from the Investors Digest published by KLSE (various issues). The actual combinations of the firms were confirmed by checking through the Companies Announcement Files, (Note 3)Annual Reports and the KLSE Annual Companies Handbook. Financial data for the quoted firms were obtained from the KLSE Annual Companies Handbook while data for the non-quoted targets were obtained from the Companies Announcement Files of the bidders. The pre-take-over financial data was collected for three years prior to take-over and 4 years for the post-take-over period. Thus, the data collected spread from 1987 to 2003, covering a period of 17 years. As actual combinations of the businesses took some time to materialise after the announcement dates, the financial characteristics of the bidders were further confirmed using the corporate handbooks or annual reports. The ownership data was obtained one year prior to take-overs and the new block created was examined after the take-over year. If the dominant owner was a company, the owner of the dominant owner was traced further in order to get the ultimate owner. If the ownership chain included any non-public listed companies, the records kept by the Companies Commission of Malaysia (CCM, formally Registrar of Companies) were used. It was found that only about 60 (466/781) percent of the targets announced were successfully taken over by the bidders. About 80 percent (376/466) of the targets were non-public listed firms while 13 percent were public listed firms and another 6 percent were foreign firms. The small number of cross-border deals could be due to risk aversion by management, as it is more difficult to get suitable targets in foreign acquisitions and they require greater integration efforts. Moreover, domestic acquisitions are expected to generate more synergies as compared to foreign acquisitions as the combined firms could share the primary activities and secondary activities of a firm (Porter, 1985). As the majority of the targets were from non-listed companies, which were relatively smaller and closely held, only those with more than 51 percent acquisition stakes were included. This is to ensure that the take-over would result in a change in control of the targets. Although the take-over Code is meant for public listed companies, pursuant to Practice Note 3 of the Code of Take-over and Mergers (1987 and 1998), it also applies to private limited companies having shareholders’ fund of more than RM5 million or where the purchase consideration is more than RM10 million. It was later increased to RM10 million in book value and purchase consideration of not less than RM20 million in 1998. Thus, for the purpose of this study, the selected target had purchase price of not less than RM5 million as too small a target would not have any significant impact on the bidders (Seth, 1990). Minority buyout or situations where the controlling parties purchase the remaining shares of the firms from the minority shareholders were excluded, as the impact of these kinds of acquisition would not be as apparent. As for the public listed firms

International Journal of Business and Management June, 2008
79
that were relatively larger, only those with more than 20 percent acquisition stakes were considered. This is because a 20 percent purchase stake is sufficient to effect a change in control of the public listed corporation (Loh, 1996). About 24 percent (110/466) were excluded due to complications involved in the restructuring exercise; for instance, the purchase of RZ equities by Malaysian Helicopter Service Bhd followed by the restructuring of MAS. Other conglomerates such as UEM, Berjaya Group, Uniphone Telecommunication which announced the take-overs of the targets but were followed by major series of corporate rationalisation activities were also excluded. Other exclusion criteria for the sample include those targets that did not have the profit and loss account or balance sheet before the announcements. These were usually newly incorporated companies, dormant companies, foreign targets, and targets that held concessions or licenses for operation. For instance, the acquisition of Sampling Plywood (Baramas) Sdn Bhd, which held timber concessions, by Glenealy Bhd was valued based on the estimated cash flow of the concession and thus financial statement were not applicable. Out of the 158 available targets, 14 with negative book values and 8 with incomplete transaction information were omitted. Thus, the final sample for the targets was about 30 percent (136/466) of the confirmed targets that met the criteria to be included in the sample. 4.1 Descriptive Statistics Take-over activities in Malaysia were concentrated more in the first half of the 1990s, with 79.5 percent in value and 78.4 percent in number of cases by 1995. The M&A activities were at its peaks in 1993 and 1995. Table 1 shows the descriptive statistics of the targets and bidders in the sample. More than 50 percent of the targets earned a positive profit. About 50 percent of the targets had asset size of more than RM51 million. On average the total liabilities and book value of the targets were about two third (98/145) and one third (46/145) of their assets respectively. The average returns on assets (ROA) was rather high at 56 percent, but the median ROA was only 7 percent. (See Table 1). The mean and median of the premiums paid were at 8.16 and 3.64 times book value, respectively. (Note 4) This is higher than the average paid in the US (Shawky, Kilb and Staas, 1996, 2.24x; Slusky and Caves, 1991, 1.5x; Walkling and Edmister, 1985, 1.5x; Hanouna, Sarin, and Shapiro, 2001, 1.3x). As for the largest ownerships stake, it is found that 50 percent of the largest owners had 59 percent stake and above while the average was at 62 percent. 67 percent (92/136) had ownership stakes of 100 percent. As the majority of the targets were closely held, very often the largest shareholders were also the founders of the companies. As such, the successful rate of this type of take-overs was higher as control was solely in the hand of the founders and thus, most of the time they were friendly take-overs. The largest ownership stake of the bidders on average was 32 percent. Related party transaction (where the substantial shareholders or directors of the bidding firms own equity stakes in the target) constitute about 40 percent of the sample. About 12 percent of the transactions resulted in reverse take-overs where the targets’ dominant owners became the dominant owners in the bidding firms. Table 2 shows the characteristics of various proxies for motives and premiums paid for the targets by industry. The sample shows that in the 1990, the majority of the targets (54/136, 39 percent) were from the trading and services sector, followed by property sector (22 percent) and industrial products sector (17 percent). The mining sector, which was a major sector in the KLSE in the early days, had the fewest number of take-over activities as many mining firms had ceased operation in the 1990s. Most of the take-overs in the sample had purchase prices ranging between RM 20 – 100 million and about one third had a purchase price more than RM100 million. In terms of diversification, 54 percent of the transactions were in the same or related industries and 46 percent were in unrelated industries. The majority of the bidders in the property sector and trading and services sector diversified into related sectors. In the case of targets, all the firms in consumer products sector were acquired by bidders from the same sector. Out of the 136 targets, 18 (13 percent) were suffering losses when acquired. The majority of these firms came from the property sector. Most of the targets were already performing well prior to acquisition. This shows that the disciplinary role of market for corporate control was not really taking place here. The take-over could have been motivated by the prospects of broadening the earnings base of the bidders as the majority of the acquisitions were in the trading and services sector which was booming in the 1990s. The service industry was the major contributor to Malaysia's gross domestic products (GDP) in the 1990s and is much larger than the manufacturing and agricultural sectors in Malaysia's economy. Except for the plantation sector, the majority of the targets had very high debt/asset ratios. Theoretically, capital structure should differ systematically across industries; however, in the context of Malaysia, there was generally a
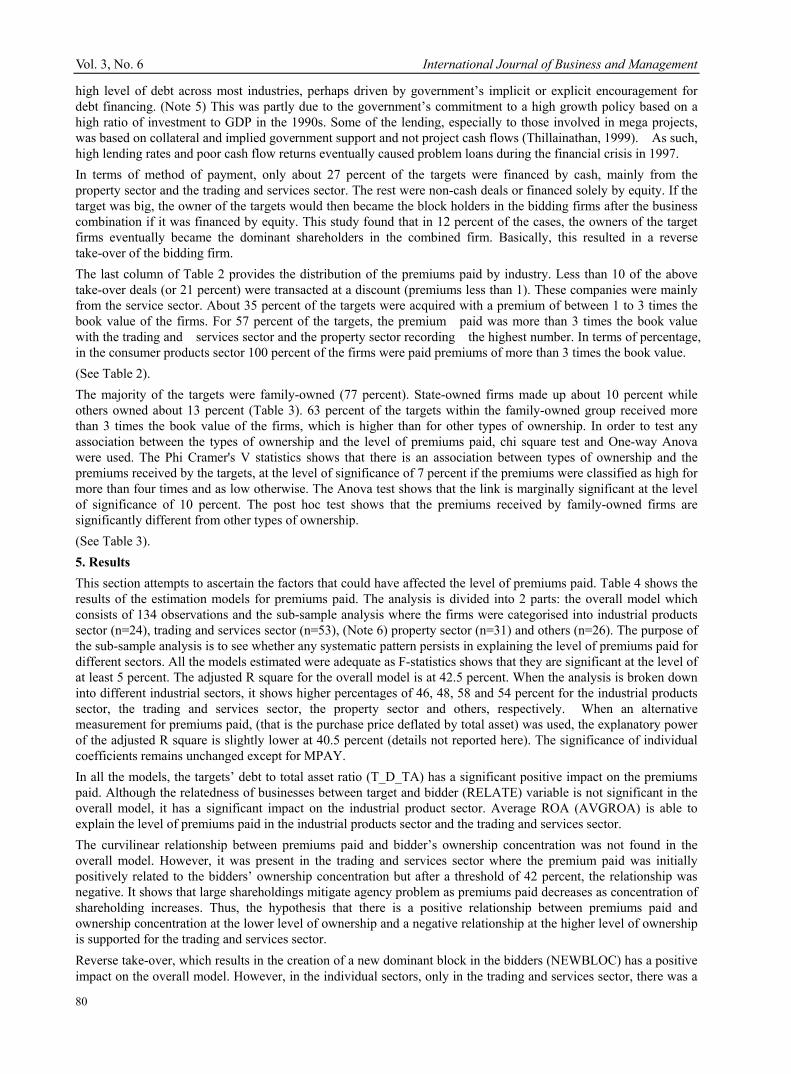
Vol. 3, No. 6 International Journal of Business and Management
80
high level of debt across most industries, perhaps driven by government’s implicit or explicit encouragement for debt financing. (Note 5) This was partly due to the government’s commitment to a high growth policy based on a high ratio of investment to GDP in the 1990s. Some of the lending, especially to those involved in mega projects, was based on collateral and implied government support and not project cash flows (Thillainathan, 1999). As such, high lending rates and poor cash flow returns eventually caused problem loans during the financial crisis in 1997. In terms of method of payment, only about 27 percent of the targets were financed by cash, mainly from the property sector and the trading and services sector. The rest were non-cash deals or financed solely by equity. If the target was big, the owner of the targets would then became the block holders in the bidding firms after the business combination if it was financed by equity. This study found that in 12 percent of the cases, the owners of the target firms eventually became the dominant shareholders in the combined firm. Basically, this resulted in a reverse take-over of the bidding firm. The last column of Table 2 provides the distribution of the premiums paid by industry. Less than 10 of the above take-over deals (or 21 percent) were transacted at a discount (premiums less than 1). These companies were mainly from the service sector. About 35 percent of the targets were acquired with a premium of between 1 to 3 times the book value of the firms. For 57 percent of the targets, the premium paid was more than 3 times the book value with the trading and services sector and the property sector recording the highest number. In terms of percentage, in the consumer products sector 100 percent of the firms were paid premiums of more than 3 times the book value. (See Table 2). The majority of the targets were family-owned (77 percent). State-owned firms made up about 10 percent while others owned about 13 percent (Table 3). 63 percent of the targets within the family-owned group received more than 3 times the book value of the firms, which is higher than for other types of ownership. In order to test any association between the types of ownership and the level of premiums paid, chi square test and One-way Anova were used. The Phi Cramer's V statistics shows that there is an association between types of ownership and the premiums received by the targets, at the level of significance of 7 percent if the premiums were classified as high for more than four times and as low otherwise. The Anova test shows that the link is marginally significant at the level of significance of 10 percent. The post hoc test shows that the premiums received by family-owned firms are significantly different from other types of ownership. (See Table 3). 5. Results This section attempts to ascertain the factors that could have affected the level of premiums paid. Table 4 shows the results of the estimation models for premiums paid. The analysis is divided into 2 parts: the overall model which consists of 134 observations and the sub-sample analysis where the firms were categorised into industrial products sector (n=24), trading and services sector (n=53), (Note 6) property sector (n=31) and others (n=26). The purpose of the sub-sample analysis is to see whether any systematic pattern persists in explaining the level of premiums paid for different sectors. All the models estimated were adequate as F-statistics shows that they are significant at the level of at least 5 percent. The adjusted R square for the overall model is at 42.5 percent. When the analysis is broken down into different industrial sectors, it shows higher percentages of 46, 48, 58 and 54 percent for the industrial products sector, the trading and services sector, the property sector and others, respectively. When an alternative measurement for premiums paid, (that is the purchase price deflated by total asset) was used, the explanatory power of the adjusted R square is slightly lower at 40.5 percent (details not reported here). The significance of individual coefficients remains unchanged except for MPAY. In all the models, the targets’ debt to total asset ratio (T_D_TA) has a significant positive impact on the premiums paid. Although the relatedness of businesses between target and bidder (RELATE) variable is not significant in the overall model, it has a significant impact on the industrial product sector. Average ROA (AVGROA) is able to explain the level of premiums paid in the industrial products sector and the trading and services sector. The curvilinear relationship between premiums paid and bidder’s ownership concentration was not found in the overall model. However, it was present in the trading and services sector where the premium paid was initially positively related to the bidders’ ownership concentration but after a threshold of 42 percent, the relationship was negative. It shows that large shareholdings mitigate agency problem as premiums paid decreases as concentration of shareholding increases. Thus, the hypothesis that there is a positive relationship between premiums paid and ownership concentration at the lower level of ownership and a negative relationship at the higher level of ownership is supported for the trading and services sector. Reverse take-over, which results in the creation of a new dominant block in the bidders (NEWBLOC) has a positive impact on the overall model. However, in the individual sectors, only in the trading and services sector, there was a
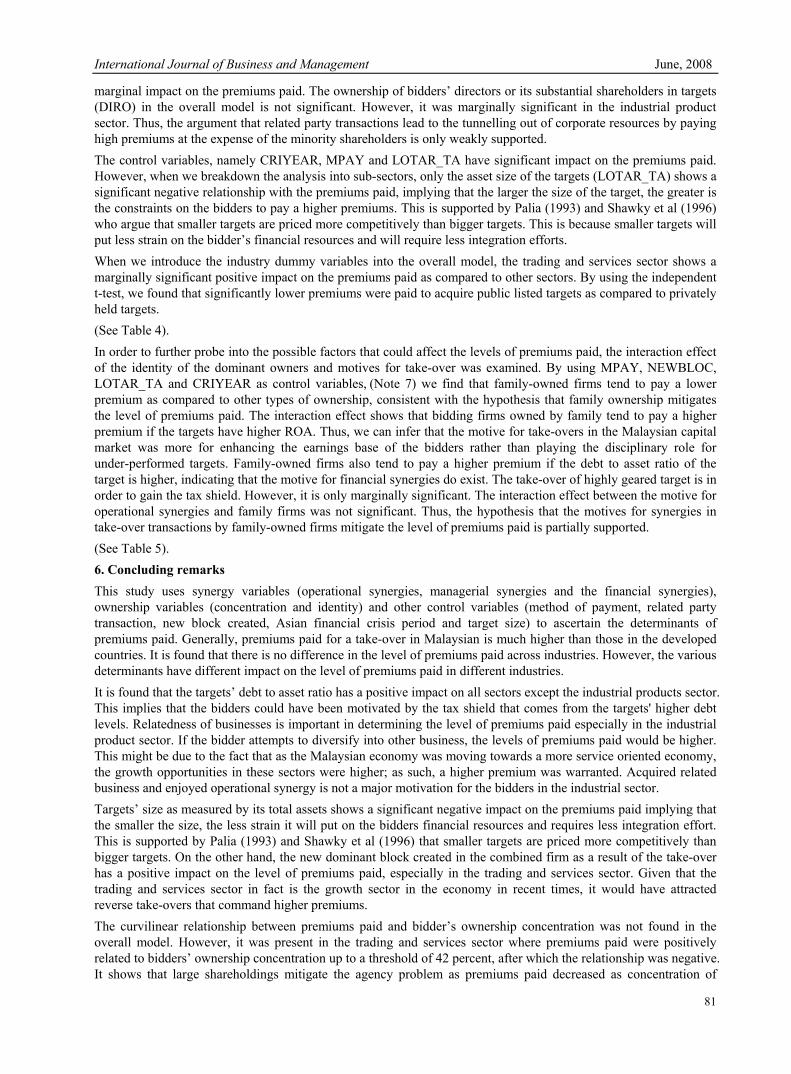
International Journal of Business and Management June, 2008
81
marginal impact on the premiums paid. The ownership of bidders’ directors or its substantial shareholders in targets (DIRO) in the overall model is not significant. However, it was marginally significant in the industrial product sector. Thus, the argument that related party transactions lead to the tunnelling out of corporate resources by paying high premiums at the expense of the minority shareholders is only weakly supported. The control variables, namely CRIYEAR, MPAY and LOTAR_TA have significant impact on the premiums paid. However, when we breakdown the analysis into sub-sectors, only the asset size of the targets (LOTAR_TA) shows a significant negative relationship with the premiums paid, implying that the larger the size of the target, the greater is the constraints on the bidders to pay a higher premiums. This is supported by Palia (1993) and Shawky et al (1996) who argue that smaller targets are priced more competitively than bigger targets. This is because smaller targets will put less strain on the bidder’s financial resources and will require less integration efforts. When we introduce the industry dummy variables into the overall model, the trading and services sector shows a marginally significant positive impact on the premiums paid as compared to other sectors. By using the independent t-test, we found that significantly lower premiums were paid to acquire public listed targets as compared to privately held targets. (See Table 4). In order to further probe into the possible factors that could affect the levels of premiums paid, the interaction effect of the identity of the dominant owners and motives for take-over was examined. By using MPAY, NEWBLOC, LOTAR_TA and CRIYEAR as control variables, (Note 7) we find that family-owned firms tend to pay a lower premium as compared to other types of ownership, consistent with the hypothesis that family ownership mitigates the level of premiums paid. The interaction effect shows that bidding firms owned by family tend to pay a higher premium if the targets have higher ROA. Thus, we can infer that the motive for take-overs in the Malaysian capital market was more for enhancing the earnings base of the bidders rather than playing the disciplinary role for under-performed targets. Family-owned firms also tend to pay a higher premium if the debt to asset ratio of the target is higher, indicating that the motive for financial synergies do exist. The take-over of highly geared target is in order to gain the tax shield. However, it is only marginally significant. The interaction effect between the motive for operational synergies and family firms was not significant. Thus, the hypothesis that the motives for synergies in take-over transactions by family-owned firms mitigate the level of premiums paid is partially supported. (See Table 5). 6. Concluding remarks This study uses synergy variables (operational synergies, managerial synergies and the financial synergies), ownership variables (concentration and identity) and other control variables (method of payment, related party transaction, new block created, Asian financial crisis period and target size) to ascertain the determinants of premiums paid. Generally, premiums paid for a take-over in Malaysian is much higher than those in the developed countries. It is found that there is no difference in the level of premiums paid across industries. However, the various determinants have different impact on the level of premiums paid in different industries. It is found that the targets’ debt to asset ratio has a positive impact on all sectors except the industrial products sector. This implies that the bidders could have been motivated by the tax shield that comes from the targets' higher debt levels. Relatedness of businesses is important in determining the level of premiums paid especially in the industrial product sector. If the bidder attempts to diversify into other business, the levels of premiums paid would be higher. This might be due to the fact that as the Malaysian economy was moving towards a more service oriented economy, the growth opportunities in these sectors were higher; as such, a higher premium was warranted. Acquired related business and enjoyed operational synergy is not a major motivation for the bidders in the industrial sector. Targets’ size as measured by its total assets shows a significant negative impact on the premiums paid implying that the smaller the size, the less strain it will put on the bidders financial resources and requires less integration effort. This is supported by Palia (1993) and Shawky et al (1996) that smaller targets are priced more competitively than bigger targets. On the other hand, the new dominant block created in the combined firm as a result of the take-over has a positive impact on the level of premiums paid, especially in the trading and services sector. Given that the trading and services sector in fact is the growth sector in the economy in recent times, it would have attracted reverse take-overs that command higher premiums. The curvilinear relationship between premiums paid and bidder’s ownership concentration was not found in the overall model. However, it was present in the trading and services sector where premiums paid were positively related to bidders’ ownership concentration up to a threshold of 42 percent, after which the relationship was negative. It shows that large shareholdings mitigate the agency problem as premiums paid decreased as concentration of
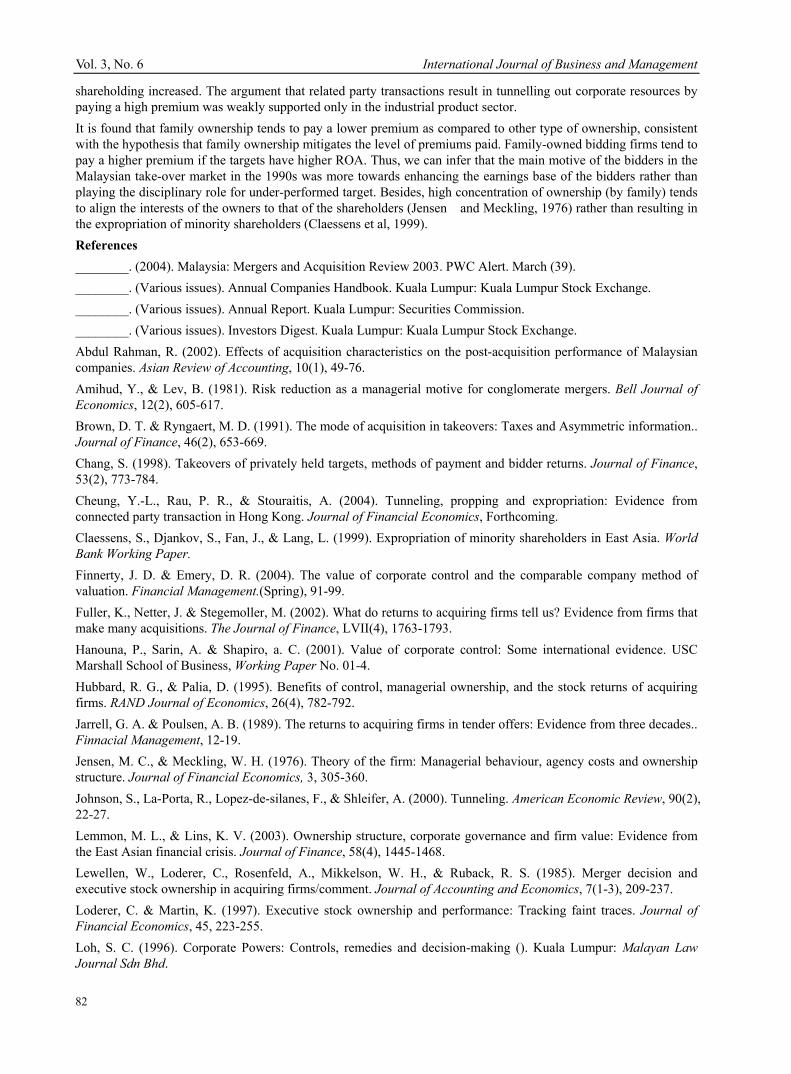
Vol. 3, No. 6 International Journal of Business and Management
82
shareholding increased. The argument that related party transactions result in tunnelling out corporate resources by paying a high premium was weakly supported only in the industrial product sector. It is found that family ownership tends to pay a lower premium as compared to other type of ownership, consistent with the hypothesis that family ownership mitigates the level of premiums paid. Family-owned bidding firms tend to pay a higher premium if the targets have higher ROA. Thus, we can infer that the main motive of the bidders in the Malaysian take-over market in the 1990s was more towards enhancing the earnings base of the bidders rather than playing the disciplinary role for under-performed target. Besides, high concentration of ownership (by family) tends to align the interests of the owners to that of the shareholders (Jensen and Meckling, 1976) rather than resulting in the expropriation of minority shareholders (Claessens et al, 1999). References ________. (2004). Malaysia: Mergers and Acquisition Review 2003. PWC Alert. March (39). ________. (Various issues). Annual Companies Handbook. Kuala Lumpur: Kuala Lumpur Stock Exchange. ________. (Various issues). Annual Report. Kuala Lumpur: Securities Commission. ________. (Various issues). Investors Digest. Kuala Lumpur: Kuala Lumpur Stock Exchange. Abdul Rahman, R. (2002). Effects of acquisition characteristics on the post-acquisition performance of Malaysian companies. Asian Review of Accounting, 10(1), 49-76. Amihud, Y., & Lev, B. (1981). Risk reduction as a managerial motive for conglomerate mergers. Bell Journal of Economics, 12(2), 605-617. Brown, D. T. & Ryngaert, M. D. (1991). The mode of acquisition in takeovers: Taxes and Asymmetric information.. Journal of Finance, 46(2), 653-669. Chang, S. (1998). Takeovers of privately held targets, methods of payment and bidder returns. Journal of Finance, 53(2), 773-784. Cheung, Y.-L., Rau, P. R., & Stouraitis, A. (2004). Tunneling, propping and expropriation: Evidence from connected party transaction in Hong Kong. Journal of Financial Economics, Forthcoming. Claessens, S., Djankov, S., Fan, J., & Lang, L. (1999). Expropriation of minority shareholders in East Asia. World Bank Working Paper. Finnerty, J. D. & Emery, D. R. (2004). The value of corporate control and the comparable company method of valuation. Financial Management.(Spring), 91-99. Fuller, K., Netter, J. & Stegemoller, M. (2002). What do returns to acquiring firms tell us? Evidence from firms that make many acquisitions. The Journal of Finance, LVII(4), 1763-1793. Hanouna, P., Sarin, A. & Shapiro, a. C. (2001). Value of corporate control: Some international evidence. USC Marshall School of Business, Working Paper No. 01-4. Hubbard, R. G., & Palia, D. (1995). Benefits of control, managerial ownership, and the stock returns of acquiring firms. RAND Journal of Economics, 26(4), 782-792. Jarrell, G. A. & Poulsen, A. B. (1989). The returns to acquiring firms in tender offers: Evidence from three decades.. Finnacial Management, 12-19. Jensen, M. C., & Meckling, W. H. (1976). Theory of the firm: Managerial behaviour, agency costs and ownership structure. Journal of Financial Economics, 3, 305-360. Johnson, S., La-Porta, R., Lopez-de-silanes, F., & Shleifer, A. (2000). Tunneling. American Economic Review, 90(2), 22-27. Lemmon, M. L., & Lins, K. V. (2003). Ownership structure, corporate governance and firm value: Evidence from the East Asian financial crisis. Journal of Finance, 58(4), 1445-1468. Lewellen, W., Loderer, C., Rosenfeld, A., Mikkelson, W. H., & Ruback, R. S. (1985). Merger decision and executive stock ownership in acquiring firms/comment. Journal of Accounting and Economics, 7(1-3), 209-237. Loderer, C. & Martin, K. (1997). Executive stock ownership and performance: Tracking faint traces. Journal of Financial Economics, 45, 223-255. Loh, S. C. (1996). Corporate Powers: Controls, remedies and decision-making (). Kuala Lumpur: Malayan Law Journal Sdn Bhd.
International Journal of Business and Management June, 2008
83
Loughan, T., & Vijh, A. M. (1997). Do long term shareholders benefit from corporate acquisitions? Journal of Finance, LII(5), 1765-1790. McConnell, J. J., & Servaes, H. (1990). Additional evidence on equity ownership and corporate value. Journal of Financial Economics, 27(2), 595-612. Megginson. (2004). Mergers, Acquisitions, and Corporate Control. In Corporate Finance (pp. 844-81). Metwalli, A. M., & Tang, R. Y. (2002). Southeast Asia: The next M&A hotspot. Journal of Corporate Acounting and Finance, 13(2), 39-47. Morck, R., & Yeung, B. (2004). Corporate Governance and family control. World Bank Policy Research Working Paper: Special issues related to corporate governance and family control (No. 3406). Myers, S. C. & Majluf, n. S. (1984). Corporate financing and investment decisions when firms have information that investors do not have. Journal of Financial Economics, 13, 187-221. Palia, D. (1993). The managerial, regulatory, and financial determinants of bank merger premiums. Journal of Industrial Economics, XLI(1), 91-101. Porter, M. (1985). Competitive Advantage: Creating and sustaining superior performance. New York: Free Press. Seth, A. (1990). Value creation in acquisitions: A re-examination of performance issues. Strategic Management Journal, 11, 99-115. Shawky, H. A., Kilb, T. & Staas, C. F. (1996). Determinants of Bank merger Premiums. Journal of Economics and Finance, 20(1), 117-131. Shleifer, A., & Vishny, R. W. (1988). Value maximization and the acquisition process. Journal of Economic Perspectives, 2(1), 7-20. Sirower, M. (1997). The synergy trap. New York: The Free Press. Slusky, A. R. & Caves, R. E. (1991). Synergy, agency, and the determinants of premia paid in mergers. The Journal of Industrial Economics, XXXIX(March), 277-296. Sudarsanam, S., Holl, P. & Salami, A. (1996). Shareholders wealth gains in mergers: Effect of synergy and ownership structure. Journal of Business Finance and Accounting, 23(5/6), 673-698. Thillainathan, R. (1999). Corporate governance and restructuring in Malaysia- A review of markets, mechanisms, agents and the legal infrastructure. Paper presented at the Survey of Corporate Governance- World Bank. Tse, T., & Soufani, K. (2001). Wealth effects of takeovers in merger activity eras: Empirical evidence from the UK. International Journal of the Economics of Business, 8(3), 365-377. Walker, M. M. (2000). Corporate takeovers, strategic objectives, and acquiring-firm shareholder wealth. Financial Management(Spring), 53-66. Walkling, R. A. & Edmister, R. O. (1985). Determinants of Tender Offer Premiums. Financial Analysts Journal, Jan/Feb, 27-37. Wansley, J. W., Lane, W. R. & Yang, H. C. (1983). Abnormal returns to acquired firms by types of acquisition and method of payment. Financial Management, 12(3), 16-22. Notes Note 1. Morck at al 1988 define an entrenched manager as a ‘Manager who control a substantial fraction of the firm’s equity may have enough voting power or influence more generally to guarantee his employment with the firm at an attractive salary’ Note 2. Capital gain tax is not applied in Malaysia. Note 3. It contains documents related to companies’ announcements such as Circular to Shareholders in relation to take-overs, etc. Note 4. Note that premiums compiled exclude those with negative values. Note 5. About 30 percent of the market shares were held by government owned or government controlled banks. Note 6. One outlier Texchem Resource was excluded. Note 7. AVGROA was dropped from the model as it is found to have high multicollinearity.
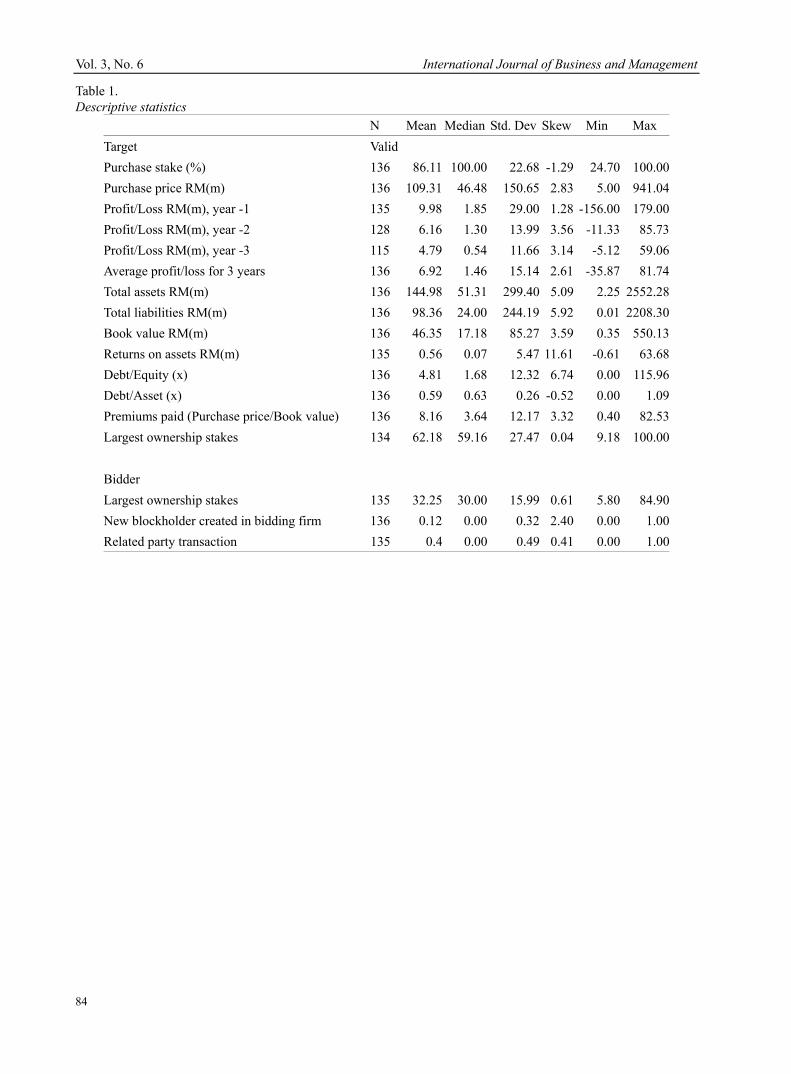
Vol. 3, No. 6 International Journal of Business and Management
84
Table 1. Descriptive statistics
N Mean Median Std. Dev Skew Min Max Target ValidPurchase stake (%) 136 86.11 100.00 22.68 -1.29 24.70 100.00Purchase price RM(m) 136 109.31 46.48 150.65 2.83 5.00 941.04Profit/Loss RM(m), year -1 135 9.98 1.85 29.00 1.28 -156.00 179.00Profit/Loss RM(m), year -2 128 6.16 1.30 13.99 3.56 -11.33 85.73Profit/Loss RM(m), year -3 115 4.79 0.54 11.66 3.14 -5.12 59.06Average profit/loss for 3 years 136 6.92 1.46 15.14 2.61 -35.87 81.74Total assets RM(m) 136 144.98 51.31 299.40 5.09 2.25 2552.28Total liabilities RM(m) 136 98.36 24.00 244.19 5.92 0.01 2208.30Book value RM(m) 136 46.35 17.18 85.27 3.59 0.35 550.13Returns on assets RM(m) 135 0.56 0.07 5.47 11.61 -0.61 63.68Debt/Equity (x) 136 4.81 1.68 12.32 6.74 0.00 115.96Debt/Asset (x) 136 0.59 0.63 0.26 -0.52 0.00 1.09Premiums paid (Purchase price/Book value) 136 8.16 3.64 12.17 3.32 0.40 82.53Largest ownership stakes 134 62.18 59.16 27.47 0.04 9.18 100.00 Bidder Largest ownership stakes 135 32.25 30.00 15.99 0.61 5.80 84.90New blockholder created in bidding firm 136 0.12 0.00 0.32 2.40 0.00 1.00Related party transaction 135 0.4 0.00 0.49 0.41 0.00 1.00
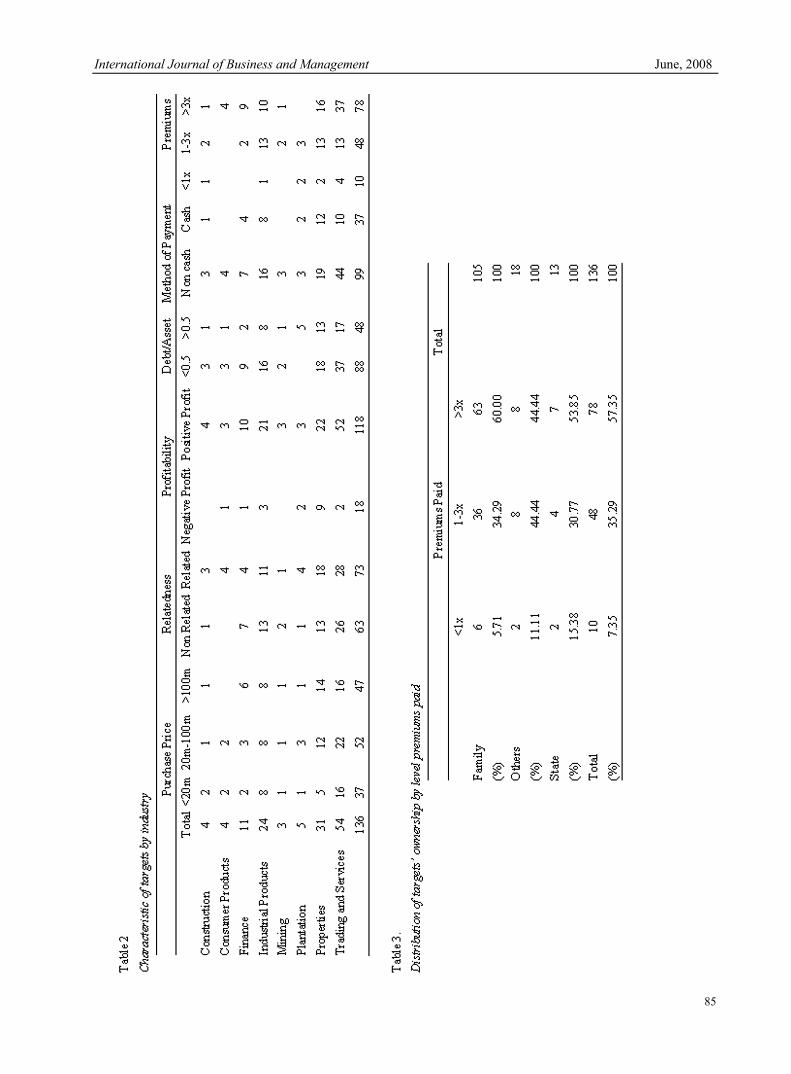
International Journal of Business and Management June, 2008
85
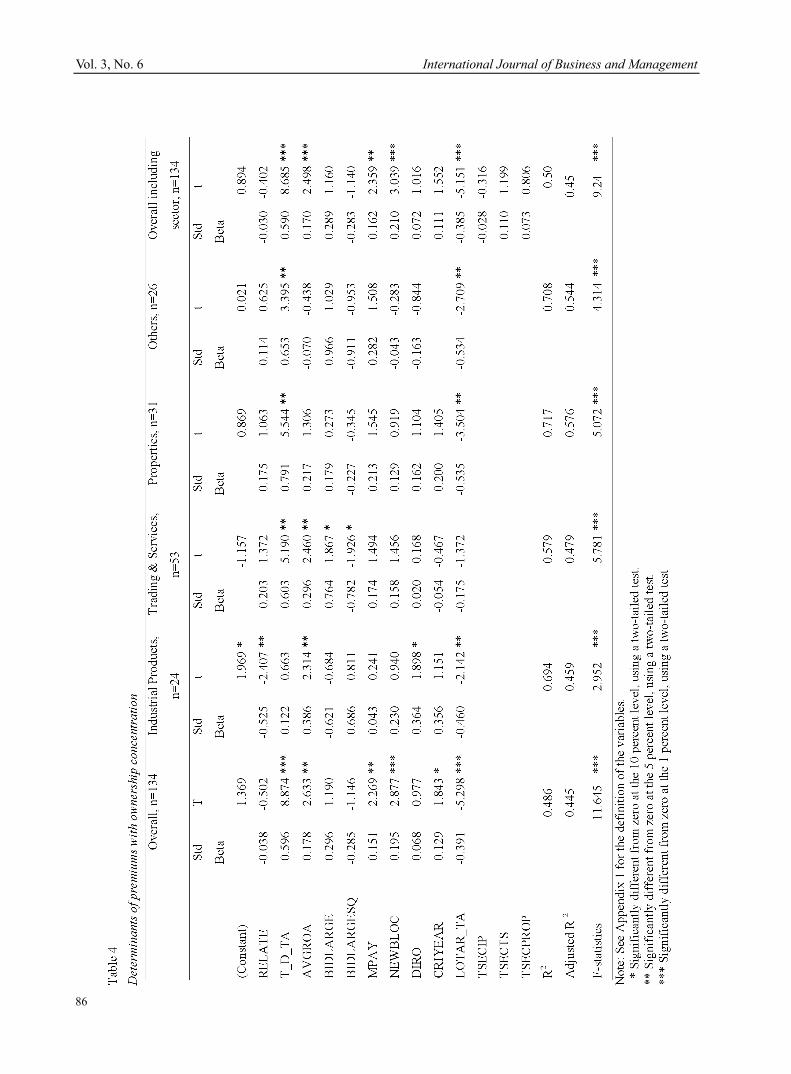
Vol. 3, No. 6 International Journal of Business and Management
86
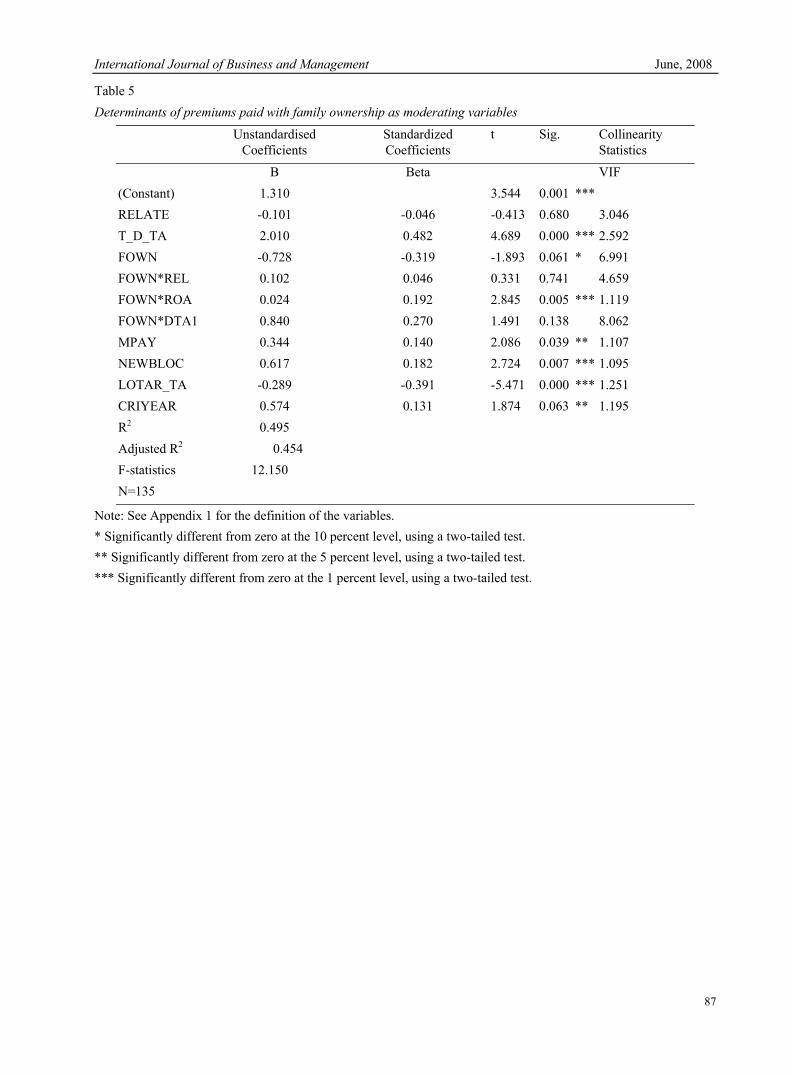
International Journal of Business and Management June, 2008
87
Table 5 Determinants of premiums paid with family ownership as moderating variables
Unstandardised Coefficients
Standardized Coefficients
t Sig. Collinearity Statistics
B Beta VIF (Constant) 1.310 3.544 0.001 *** RELATE -0.101 -0.046 -0.413 0.680 3.046 T_D_TA 2.010 0.482 4.689 0.000 *** 2.592 FOWN -0.728 -0.319 -1.893 0.061 * 6.991 FOWN*REL 0.102 0.046 0.331 0.741 4.659 FOWN*ROA 0.024 0.192 2.845 0.005 *** 1.119 FOWN*DTA1 0.840 0.270 1.491 0.138 8.062 MPAY 0.344 0.140 2.086 0.039 ** 1.107 NEWBLOC 0.617 0.182 2.724 0.007 *** 1.095 LOTAR_TA -0.289 -0.391 -5.471 0.000 *** 1.251 CRIYEAR 0.574 0.131 1.874 0.063 ** 1.195 R2 0.495 Adjusted R2 0.454 F-statistics 12.150 N=135
Note: See Appendix 1 for the definition of the variables. * Significantly different from zero at the 10 percent level, using a two-tailed test. ** Significantly different from zero at the 5 percent level, using a two-tailed test. *** Significantly different from zero at the 1 percent level, using a two-tailed test.
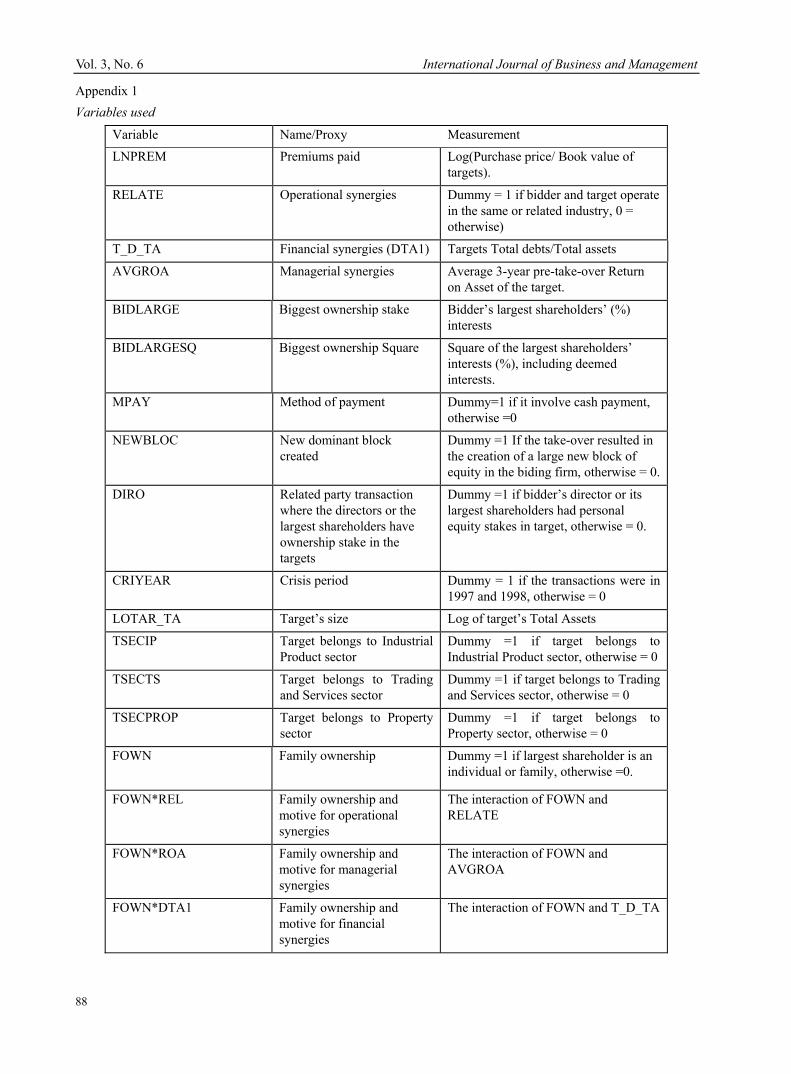
Vol. 3, No. 6 International Journal of Business and Management
88
Appendix 1 Variables used
Variable Name/Proxy Measurement LNPREM Premiums paid Log(Purchase price/ Book value of
targets).
RELATE Operational synergies Dummy = 1 if bidder and target operate in the same or related industry, 0 = otherwise)
T_D_TA Financial synergies (DTA1) Targets Total debts/Total assets
AVGROA Managerial synergies Average 3-year pre-take-over Return on Asset of the target.
BIDLARGE Biggest ownership stake Bidder’s largest shareholders’ (%) interests
BIDLARGESQ Biggest ownership Square
Square of the largest shareholders’ interests (%), including deemed interests.
MPAY Method of payment Dummy=1 if it involve cash payment, otherwise =0
NEWBLOC New dominant block created
Dummy =1 If the take-over resulted in the creation of a large new block of equity in the biding firm, otherwise = 0.
DIRO Related party transaction where the directors or the largest shareholders have ownership stake in the targets
Dummy =1 if bidder’s director or its largest shareholders had personal equity stakes in target, otherwise = 0.
CRIYEAR Crisis period Dummy = 1 if the transactions were in 1997 and 1998, otherwise = 0
LOTAR_TA Target’s size Log of target’s Total Assets
TSECIP Target belongs to Industrial Product sector
Dummy =1 if target belongs to Industrial Product sector, otherwise = 0
TSECTS Target belongs to Trading and Services sector
Dummy =1 if target belongs to Trading and Services sector, otherwise = 0
TSECPROP Target belongs to Property sector
Dummy =1 if target belongs to Property sector, otherwise = 0
FOWN
Family ownership Dummy =1 if largest shareholder is an individual or family, otherwise =0.
FOWN*REL Family ownership and motive for operational synergies
The interaction of FOWN and RELATE
FOWN*ROA Family ownership and motive for managerial synergies
The interaction of FOWN and AVGROA
FOWN*DTA1 Family ownership and motive for financial synergies
The interaction of FOWN and T_D_TA
International Journal of Business and Management June, 2008
89
Research on Firm IT Capability and Competitive Advantages Jingfu Guo, Lin Sun, Lijuan Zhong
Dalian University for Nationalities, Dalian 116600, China E-mail: [email protected]
Abstract Effective and efficient use of IT capability is a key factor for a firm to get competitive advantages. This paper develops the concept of IT-capability and it’s function mechanism, firm IT resources are classified as IT infrastructure, human IT resources, and IT relationship infrastructure as well as IT-Related capabilities. The paper discusses valuable, competitive, and dynamic capabilities as three related IT capabilities, and presents a model that describes relationship between these capabilities and competitive advantages. This study also interprets that a firm’s ability to effectively leverage its IT investments by developing a strong IT capability can result in improving firms performances, such as integration of customer relationship management (CRM), E-Supply chain management etc. Keywords: IT capability, Competitive advantage, Firm performance, IT infrastructure 1. Introduction IT competence of a corporation is an important factor of a company’s abilities, and it also attracts many researchers interests in the relative academic fields. On this concept, different scholars have different opinions and viewpoints, and there isn’t an uniform definition until now. Ross (Jeanne W. Ross etc. 1996) first brought up the concept of IT capability, he defined IT capability as the ability that a company’s controlling its IT expenditure and cost, and delivering in time to promote the realization of the company’s targets. Ross believed that the IT capability comes from three kinds of relative resources, they are the IT human resources, IT technology resources and the IT relationship resources. Bharadwaj (S. Anandhi A.Bharadwaj, 2000) also did research about the issues, he defined this ability as the competence to mobilize and deploy its IT-based resources and this kind of IT resource should be combined with other resources of the company. While Van der heijden thought that IT capabilities are of organizing abilities based on a firm’s behaviors, business processing, technology and resources. Chinese scholar Zeng qingfeng (Zeng & Huang, 2003) defined IT capability as a competence that a company mobilizes its related IT resources to achieve operation goals. We can find that IT resources are important to a company and its IT capability. Augmenting the conceptual analysis of IT’s effects on firm performance is the resource-based view (RBV) of the firm which links the performance of organizations to resources and skills that are firm-specific, rare, and difficult to imitate or substitute. The resource-based view is presently the dominant theoretical perspective in strategic management literature, and focuses on costly-to-copy attributes of a firm which are seen as the fundamental drivers of performance. Now there have been a lot of researches about IT capabilities, they were carried out from different viewpoints, but these studies seldom studied the relations between IT capabilities and competitive advantages as well as the mechanism how IT capabilities can lead to competitive advantages. In the following paragraphs, the identification of IT as an organizational capability created by the interaction of IT infrastructure, human IT resources, and IT-related capabilities are explicated, it is also to study and interpret the mechanism between IT capability and competitive advantages by an examination of the links between IT resources and firm performances. 2. IT related abilities and function mechanism Firms that achieve competitive advantage through IT have also learned to combine effectively their IT resources to create an overall IT capability, successful firms employ their technology base and human IT skills to develop IT-enabled intangibles such as customer orientation, synergy, and superior organizational knowledge. 2.1 Human IT resources The corporation human resources generally comprise training experience, relationships, and insights of employees. The critical dimensions of human IT resources include: (1) technical IT skills, such as programming, systems analysis and design, and competencies in emerging technologies, and (2) the managerial IT skills, which include abilities such as the effective management of IS functions, coordination and interaction with user community, and project management and leadership skills. (D. G. Copeland and J. L. McKenney, 1988). Technical and managerial IT skills typically evolve over long periods of time through the accumulation of experience. Furthermore, managerial IT skills are often tacit, dependent on other interpersonal relationships, which may take years to develop. For example, creating a user community that welcomes technological change and embraces new systems takes several years over which the IS group has to engage in mutual trust building and commitment to share goals.
Vol. 3, No. 6 International Journal of Business and Management
90
2.2 Leader’s IT capabilities and applications Recently, some researchers have framed the discussion in terms of IT capabilities, and argue that managing IT is a capability that can create uniqueness and provide organizations a competitive advantage. Thus, despite uniformly high investments in technology, such organizational capabilities tend to be heterogeneously distributed across firms leading to differential business value to firms by improving organizational efficiency and effectiveness. 2.3 IT infrastructure A firm's overall IT infrastructure comprises the computer and communication technologies and the shareable technical platforms and databases. The IT infrastructure is a shared information delivery base, the business functionality of which has been defined in terms of its reach and range. While the reach determines the locations that the platform can access and to which it can link, its range defines the kind of information that can be seamlessly and automatically shared across systems and services. A firm's IT infrastructure has been described as a major business resource and a key source for attaining long-term competitive advantage. A firm’s IT infrastructure which is in good conditions and has flexible properties can meet the requirements of new IT application projects. The IT infrastructure provides the resources that make feasible innovation and continuous improvement of products. The unique characteristics of the IT infrastructure that enable firms to implement the right applications at the right time render the cost and value of technological innovation different from different firms. 2.4 IT relationship infrastructure The IT relationship infrastructure consists of sharing risk and responsibility of IT application between IT and business unit management. Only business units are in a position to effectively utilize IT in their strategy and daily work. Therefore, in order to make effective use of IT, the IT responsibilities and roles should be shared between line management and IT management. Unless line management and IT groups call coordinate their responsibilities and accountabilities, the firm is unlikely to acquire, deploy, and leverage its IT resources effectively. One major component of the relationship infrastructure is the trust that is developed between IT groups and business units. Because development of trust takes time, thus, according to Barney and Hansen (J. B. Barney, and M. Hansen, 1994), the relationship infrastructure constitutes a source of competitive advantage for the firm. We posit that once an organization succeeds in forming trust between IT groups and business units, their interaction enables knowledge flow and knowledge diffusion throughout the organization, which is likely to bring a greater appreciation for each unit’s work, expertise, and roles in the organization. 2.5 IT-Related capabilities In fact, several key organizational intangible factors, such as value capabilities, competitive capabilities and dynamic capabilities have been recognized as key drivers of superior firm performance. We argue that such capabilities are not only valuable but heterogeneously distributed and difficult to transfer. (F. J. Mata et al, 2001)
provide two reasons why such managerial IT capabilities are likely to be the major source of competitive advantage. First, they evolve through history and “learning by doing” making these experiences very heterogeneous across firms. Second, the relationship between IT managers and those in other business functions develop over years, which are socially complex, and involve a number of minor decisions over time. Superior IT capabilities described above allow firms to respond quickly to environmental threats and leverage opportunities, this broader organizational capability captures the ability to search, explore, acquire, assimilate, and applies knowledge about resources, opportunities, and how resources can be configured to exploit opportunities. Based on above research, here we propose the mechanism model(Fig.1), it shows IT capability affects business productivity by IT application programs, and how IT capability brings competitive advantages. 3. IT capability and firm competitive advantages Competitive advantage is rooted in the deployment and use of idiosyncratic valuable, and inimitable resources and capabilities. Firms leverage two distinct strategic mechanisms: resource-picking and capability-building. Firms that have superior knowledge capabilities do better on acquiring resources and building capabilities. Capability-building refers to the ability of firms to build unique competencies and capabilities that call leverage their resources, these capabilities are embedded, making them comparatively more valuable and inimitable, and therefore superior to resources as determinants of long-term performances. 3.1 Synergy Synergy refers to the sharing of resources and capabilities across organizational divisions. Beyond operational efficiencies, knowledge and information sharing across functional units enables firms to be more flexible and to respond faster to market needs. As Brown and Duguid (J. S. Brown and P. Duguid, 1991) point out, information technologies geared toward creating organizational synergies can aid in the delivery of needed resources by
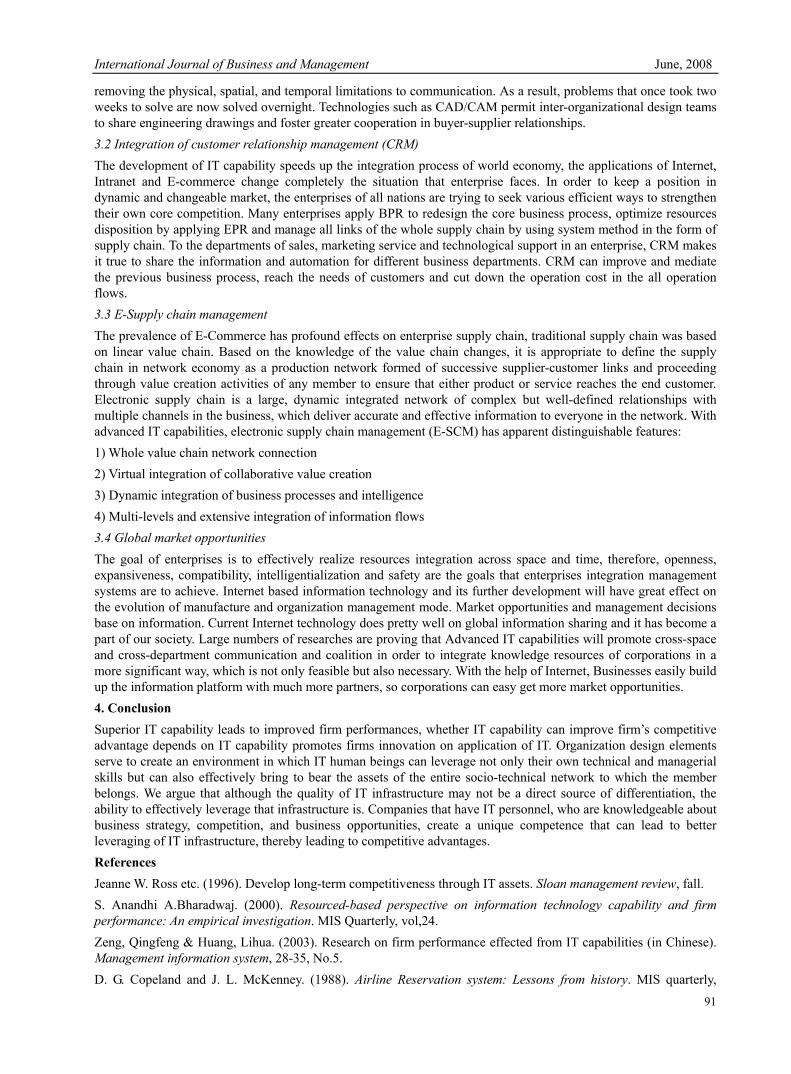
International Journal of Business and Management June, 2008
91
removing the physical, spatial, and temporal limitations to communication. As a result, problems that once took two weeks to solve are now solved overnight. Technologies such as CAD/CAM permit inter-organizational design teams to share engineering drawings and foster greater cooperation in buyer-supplier relationships. 3.2 Integration of customer relationship management (CRM) The development of IT capability speeds up the integration process of world economy, the applications of Internet, Intranet and E-commerce change completely the situation that enterprise faces. In order to keep a position in dynamic and changeable market, the enterprises of all nations are trying to seek various efficient ways to strengthen their own core competition. Many enterprises apply BPR to redesign the core business process, optimize resources disposition by applying EPR and manage all links of the whole supply chain by using system method in the form of supply chain. To the departments of sales, marketing service and technological support in an enterprise, CRM makes it true to share the information and automation for different business departments. CRM can improve and mediate the previous business process, reach the needs of customers and cut down the operation cost in the all operation flows. 3.3 E-Supply chain management The prevalence of E-Commerce has profound effects on enterprise supply chain, traditional supply chain was based on linear value chain. Based on the knowledge of the value chain changes, it is appropriate to define the supply chain in network economy as a production network formed of successive supplier-customer links and proceeding through value creation activities of any member to ensure that either product or service reaches the end customer. Electronic supply chain is a large, dynamic integrated network of complex but well-defined relationships with multiple channels in the business, which deliver accurate and effective information to everyone in the network. With advanced IT capabilities, electronic supply chain management (E-SCM) has apparent distinguishable features: 1) Whole value chain network connection 2) Virtual integration of collaborative value creation 3) Dynamic integration of business processes and intelligence 4) Multi-levels and extensive integration of information flows 3.4 Global market opportunities The goal of enterprises is to effectively realize resources integration across space and time, therefore, openness, expansiveness, compatibility, intelligentialization and safety are the goals that enterprises integration management systems are to achieve. Internet based information technology and its further development will have great effect on the evolution of manufacture and organization management mode. Market opportunities and management decisions base on information. Current Internet technology does pretty well on global information sharing and it has become a part of our society. Large numbers of researches are proving that Advanced IT capabilities will promote cross-space and cross-department communication and coalition in order to integrate knowledge resources of corporations in a more significant way, which is not only feasible but also necessary. With the help of Internet, Businesses easily build up the information platform with much more partners, so corporations can easy get more market opportunities. 4. Conclusion Superior IT capability leads to improved firm performances, whether IT capability can improve firm’s competitive advantage depends on IT capability promotes firms innovation on application of IT. Organization design elements serve to create an environment in which IT human beings can leverage not only their own technical and managerial skills but can also effectively bring to bear the assets of the entire socio-technical network to which the member belongs. We argue that although the quality of IT infrastructure may not be a direct source of differentiation, the ability to effectively leverage that infrastructure is. Companies that have IT personnel, who are knowledgeable about business strategy, competition, and business opportunities, create a unique competence that can lead to better leveraging of IT infrastructure, thereby leading to competitive advantages. References Jeanne W. Ross etc. (1996). Develop long-term competitiveness through IT assets. Sloan management review, fall. S. Anandhi A.Bharadwaj. (2000). Resourced-based perspective on information technology capability and firm performance: An empirical investigation. MIS Quarterly, vol,24. Zeng, Qingfeng & Huang, Lihua. (2003). Research on firm performance effected from IT capabilities (in Chinese). Management information system, 28-35, No.5. D. G. Copeland and J. L. McKenney. (1988). Airline Reservation system: Lessons from history. MIS quarterly,
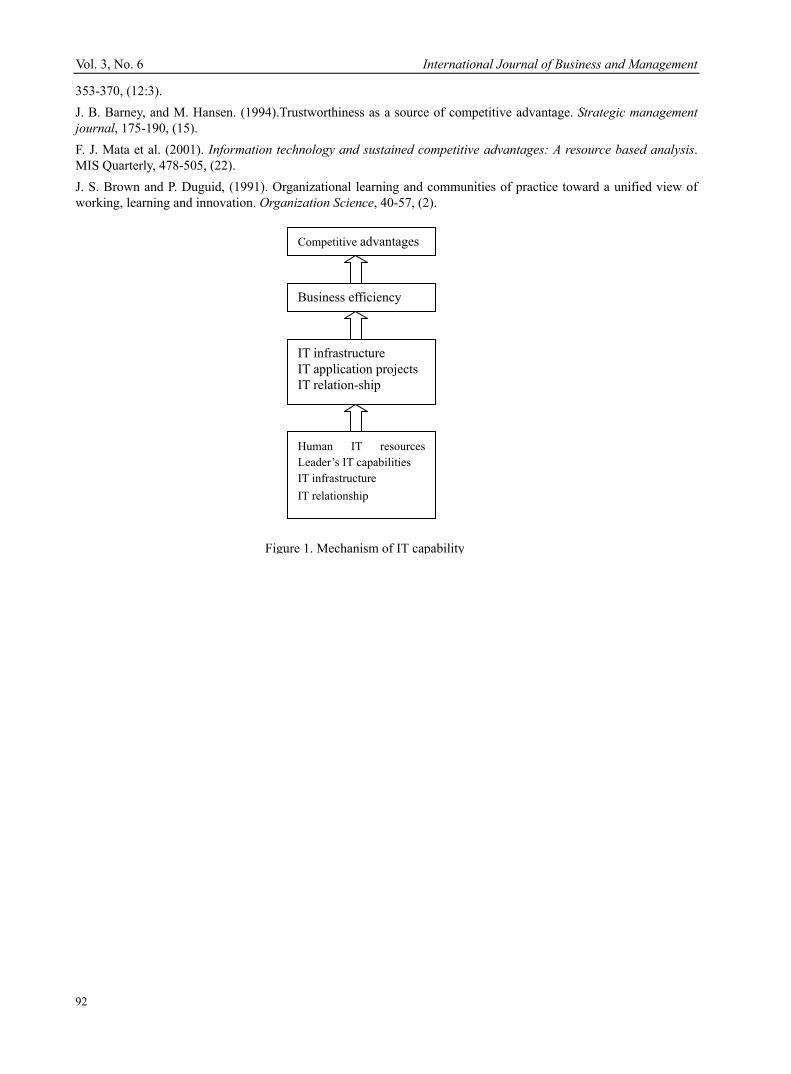
Vol. 3, No. 6 International Journal of Business and Management
92
353-370, (12:3). J. B. Barney, and M. Hansen. (1994).Trustworthiness as a source of competitive advantage. Strategic management journal, 175-190, (15). F. J. Mata et al. (2001). Information technology and sustained competitive advantages: A resource based analysis. MIS Quarterly, 478-505, (22). J. S. Brown and P. Duguid, (1991). Organizational learning and communities of practice toward a unified view of working, learning and innovation. Organization Science, 40-57, (2).
Human IT resources Leader’s IT capabilities IT infrastructure IT relationship
Competitive advantages
Business efficiency
IT infrastructure IT application projects IT relation-ship
Figure 1. Mechanism of IT capability
International Journal of Business and Management June, 2008
93
The Theory of Pay Effectiveness Yao Li, Weihua Liu, Hao Li
College of Industrial and Commercial Administration, Tianjin Polytechnic University Tianjin, 300387, China
E-mail: [email protected] Abstract The core function in human resource management is compensation management, and it is also the focus problem which brings the dispute and conflict between employers and employees. In this passage we will discuss some important factors of pay effectiveness. Keywords: Compensation management, Pay effectiveness, Pay system 1. Introduction Any enterprise takes pay system seriously and is eager to know how the validity of the pay system. But how to assess its effectiveness is a problem for the majority of enterprise. At present, many practices are that organizational performance is equal to the pay system, which is a simplified approach. Therefore, it reflects that there are no mature evaluation tools which can be applied to. Just thinking about it, if the organization evaluated the effectiveness of the pay system skillfully and accurately, the pay adjustment will have a decision-making basis and the determination of payment will have a direction. 2. The conception of pay effectiveness Evaluation of effectiveness of the remuneration system is generally used the concept of pay effectiveness, which means the contribution of the remuneration system for the organizational strategy. Broadly speaking, it refers to the contribution made to the organizational performance and can motivate the staff to work. One of pay effectiveness research keystone is how to evaluation, which is to decide a standard for evaluation. 3. The evaluation criteria of pay effectiveness At present, domestic researches in the pay effectiveness relatively are rare in the literature. In addition, the study of pay effectiveness has not formed a conclusion abroad, especially in the different areas. Firstly, several different views will be introduced here. 3.1 View in Strategic Management field David and Luis measure the effectiveness of pay system with sixteen terms and four dimensions. They are general performance, recruitment performance, incentive performance and reservation performance. Firstly, the recruitment performance means that the recruitment could attract enough people of which number could pass the actual number of people. What’s more, incentive performance means that the payment system could prompt the staff that needs encouragement. Finally, the employees should not leave their posts because of the salary. The four areas which mentioned above establish a standard directly. The final criteria are the organizational performance. Therefore, the organizational performance is one integral part of payment performance evaluation. In addition, it is often to regard the organization profit as one element of pay performance, from which we can clearly see that the evaluation of this field settled on the organizational level. When Andrew S.Richter evaluated effectiveness of the pay strategy, he had proposed an integration model that was used to analysis the pay strategy (Andrew S.Richter, 2002, p30). From picture 1, we can clearly see that this model evaluates the pay strategy from three aspects, which are Value Proposition, Performance Differentiation and Cost Competitive. The index of value proposition means to the capacity of organization to attract and reserve person with ability. What’s more, employees don’t leave their post because of the payment. The index of performance differentiation means to pay employees according to their performance difference and to establish performance culture of the organization. The third index means that the organization should control the cost of payment and analyze the availability factor according to the budget. The three layers reflect the basic objects of pay system which are market competitive and paying and controlling cost according to the performance difference. There are contradictions among the three layers.
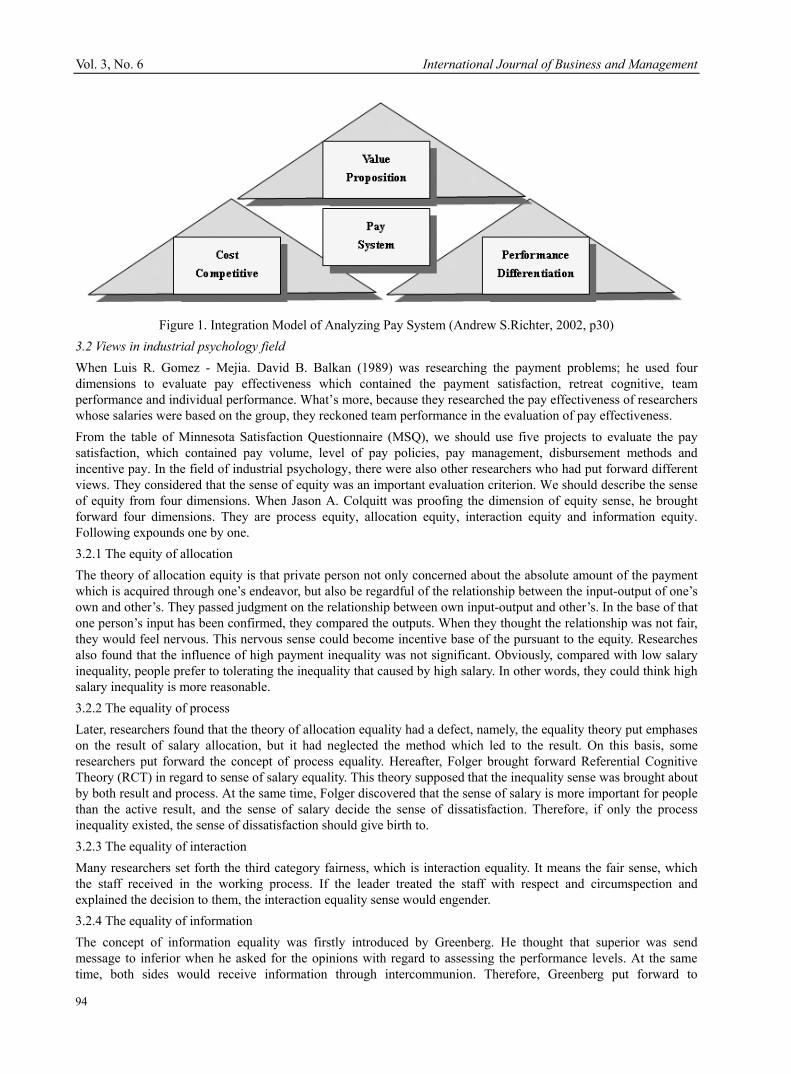
Vol. 3, No. 6 International Journal of Business and Management
94
Figure 1. Integration Model of Analyzing Pay System (Andrew S.Richter, 2002, p30) 3.2 Views in industrial psychology field When Luis R. Gomez - Mejia. David B. Balkan (1989) was researching the payment problems; he used four dimensions to evaluate pay effectiveness which contained the payment satisfaction, retreat cognitive, team performance and individual performance. What’s more, because they researched the pay effectiveness of researchers whose salaries were based on the group, they reckoned team performance in the evaluation of pay effectiveness. From the table of Minnesota Satisfaction Questionnaire (MSQ), we should use five projects to evaluate the pay satisfaction, which contained pay volume, level of pay policies, pay management, disbursement methods and incentive pay. In the field of industrial psychology, there were also other researchers who had put forward different views. They considered that the sense of equity was an important evaluation criterion. We should describe the sense of equity from four dimensions. When Jason A. Colquitt was proofing the dimension of equity sense, he brought forward four dimensions. They are process equity, allocation equity, interaction equity and information equity. Following expounds one by one. 3.2.1 The equity of allocation The theory of allocation equity is that private person not only concerned about the absolute amount of the payment which is acquired through one’s endeavor, but also be regardful of the relationship between the input-output of one’s own and other’s. They passed judgment on the relationship between own input-output and other’s. In the base of that one person’s input has been confirmed, they compared the outputs. When they thought the relationship was not fair, they would feel nervous. This nervous sense could become incentive base of the pursuant to the equity. Researches also found that the influence of high payment inequality was not significant. Obviously, compared with low salary inequality, people prefer to tolerating the inequality that caused by high salary. In other words, they could think high salary inequality is more reasonable. 3.2.2 The equality of process Later, researchers found that the theory of allocation equality had a defect, namely, the equality theory put emphases on the result of salary allocation, but it had neglected the method which led to the result. On this basis, some researchers put forward the concept of process equality. Hereafter, Folger brought forward Referential Cognitive Theory (RCT) in regard to sense of salary equality. This theory supposed that the inequality sense was brought about by both result and process. At the same time, Folger discovered that the sense of salary is more important for people than the active result, and the sense of salary decide the sense of dissatisfaction. Therefore, if only the process inequality existed, the sense of dissatisfaction should give birth to. 3.2.3 The equality of interaction Many researchers set forth the third category fairness, which is interaction equality. It means the fair sense, which the staff received in the working process. If the leader treated the staff with respect and circumspection and explained the decision to them, the interaction equality sense would engender. 3.2.4 The equality of information The concept of information equality was firstly introduced by Greenberg. He thought that superior was send message to inferior when he asked for the opinions with regard to assessing the performance levels. At the same time, both sides would receive information through intercommunion. Therefore, Greenberg put forward to
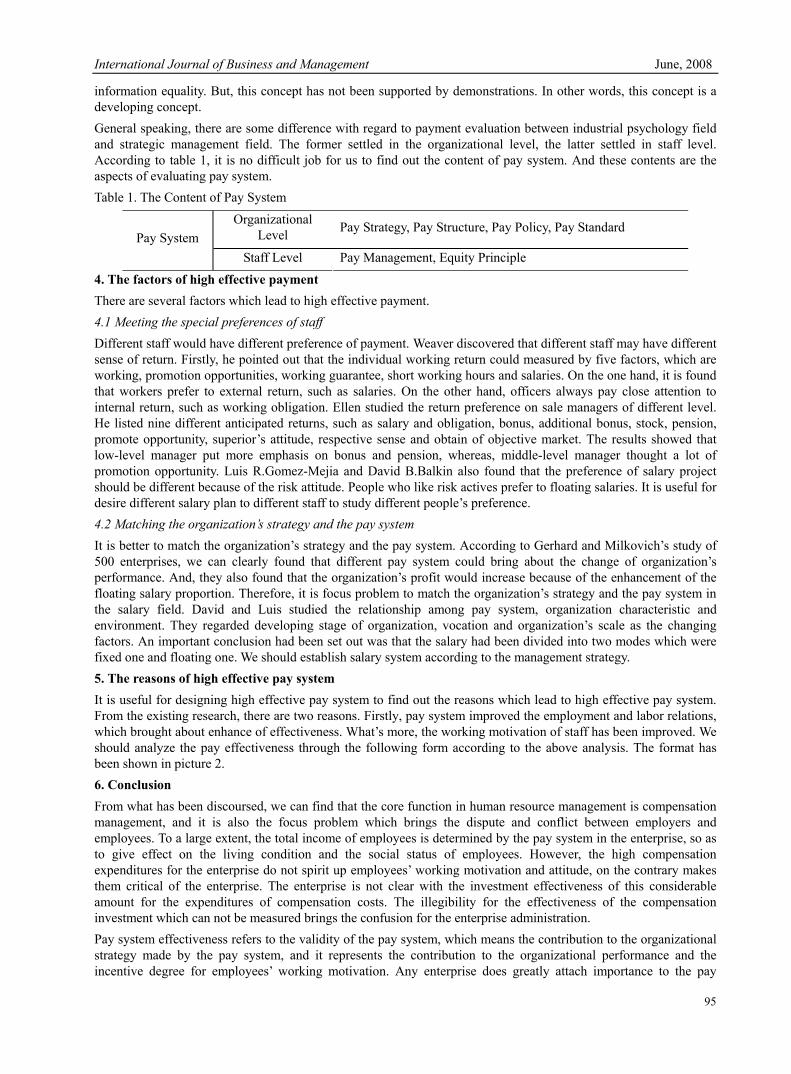
International Journal of Business and Management June, 2008
95
information equality. But, this concept has not been supported by demonstrations. In other words, this concept is a developing concept. General speaking, there are some difference with regard to payment evaluation between industrial psychology field and strategic management field. The former settled in the organizational level, the latter settled in staff level. According to table 1, it is no difficult job for us to find out the content of pay system. And these contents are the aspects of evaluating pay system. Table 1. The Content of Pay System
Organizational Level Pay Strategy, Pay Structure, Pay Policy, Pay Standard
Pay System Staff Level Pay Management, Equity Principle
4. The factors of high effective payment There are several factors which lead to high effective payment. 4.1 Meeting the special preferences of staff Different staff would have different preference of payment. Weaver discovered that different staff may have different sense of return. Firstly, he pointed out that the individual working return could measured by five factors, which are working, promotion opportunities, working guarantee, short working hours and salaries. On the one hand, it is found that workers prefer to external return, such as salaries. On the other hand, officers always pay close attention to internal return, such as working obligation. Ellen studied the return preference on sale managers of different level. He listed nine different anticipated returns, such as salary and obligation, bonus, additional bonus, stock, pension, promote opportunity, superior’s attitude, respective sense and obtain of objective market. The results showed that low-level manager put more emphasis on bonus and pension, whereas, middle-level manager thought a lot of promotion opportunity. Luis R.Gomez-Mejia and David B.Balkin also found that the preference of salary project should be different because of the risk attitude. People who like risk actives prefer to floating salaries. It is useful for desire different salary plan to different staff to study different people’s preference. 4.2 Matching the organization’s strategy and the pay system It is better to match the organization’s strategy and the pay system. According to Gerhard and Milkovich’s study of 500 enterprises, we can clearly found that different pay system could bring about the change of organization’s performance. And, they also found that the organization’s profit would increase because of the enhancement of the floating salary proportion. Therefore, it is focus problem to match the organization’s strategy and the pay system in the salary field. David and Luis studied the relationship among pay system, organization characteristic and environment. They regarded developing stage of organization, vocation and organization’s scale as the changing factors. An important conclusion had been set out was that the salary had been divided into two modes which were fixed one and floating one. We should establish salary system according to the management strategy. 5. The reasons of high effective pay system It is useful for designing high effective pay system to find out the reasons which lead to high effective pay system. From the existing research, there are two reasons. Firstly, pay system improved the employment and labor relations, which brought about enhance of effectiveness. What’s more, the working motivation of staff has been improved. We should analyze the pay effectiveness through the following form according to the above analysis. The format has been shown in picture 2. 6. Conclusion From what has been discoursed, we can find that the core function in human resource management is compensation management, and it is also the focus problem which brings the dispute and conflict between employers and employees. To a large extent, the total income of employees is determined by the pay system in the enterprise, so as to give effect on the living condition and the social status of employees. However, the high compensation expenditures for the enterprise do not spirit up employees’ working motivation and attitude, on the contrary makes them critical of the enterprise. The enterprise is not clear with the investment effectiveness of this considerable amount for the expenditures of compensation costs. The illegibility for the effectiveness of the compensation investment which can not be measured brings the confusion for the enterprise administration. Pay system effectiveness refers to the validity of the pay system, which means the contribution to the organizational strategy made by the pay system, and it represents the contribution to the organizational performance and the incentive degree for employees’ working motivation. Any enterprise does greatly attach importance to the pay
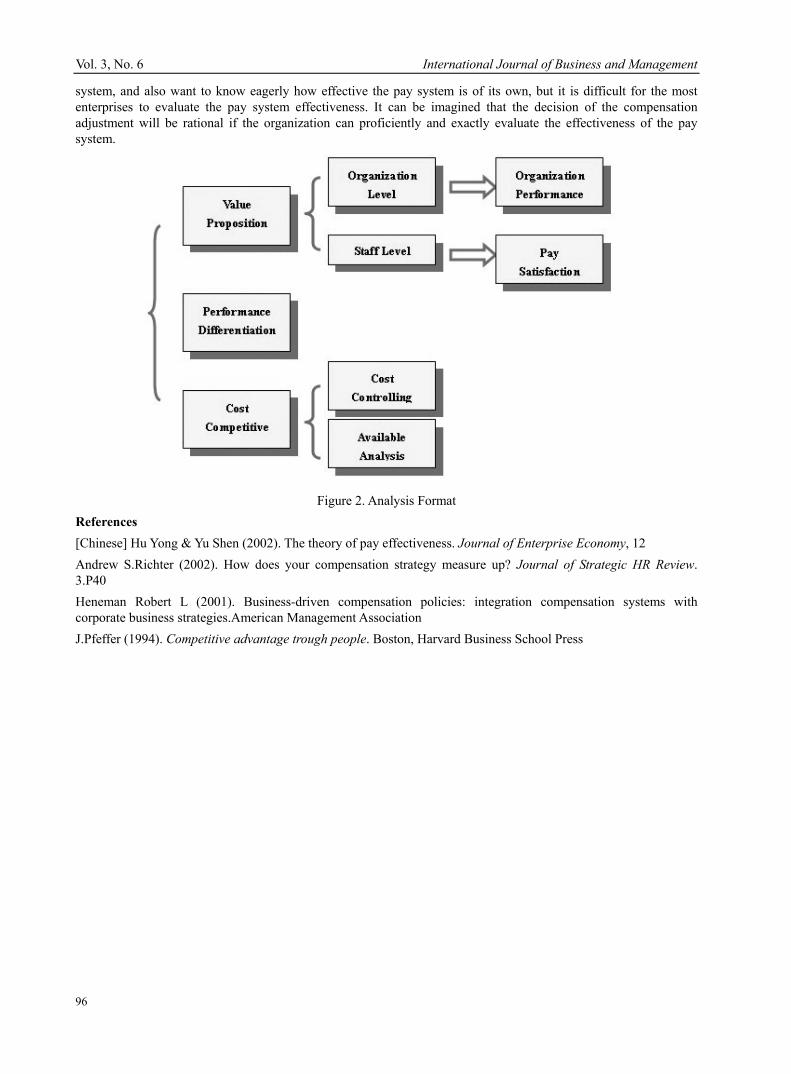
Vol. 3, No. 6 International Journal of Business and Management
96
system, and also want to know eagerly how effective the pay system is of its own, but it is difficult for the most enterprises to evaluate the pay system effectiveness. It can be imagined that the decision of the compensation adjustment will be rational if the organization can proficiently and exactly evaluate the effectiveness of the pay system.
Figure 2. Analysis Format References [Chinese] Hu Yong & Yu Shen (2002). The theory of pay effectiveness. Journal of Enterprise Economy, 12 Andrew S.Richter (2002). How does your compensation strategy measure up? Journal of Strategic HR Review. 3.P40 Heneman Robert L (2001). Business-driven compensation policies: integration compensation systems with corporate business strategies.American Management Association J.Pfeffer (1994). Competitive advantage trough people. Boston, Harvard Business School Press
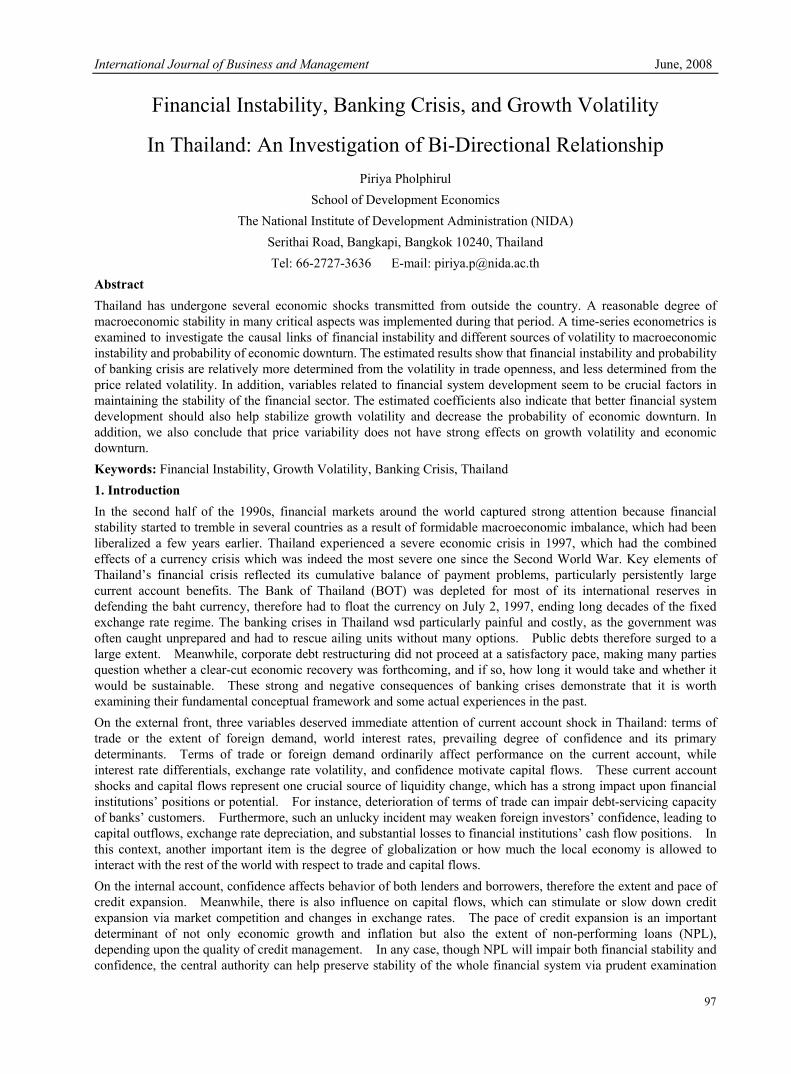
International Journal of Business and Management June, 2008
97
Financial Instability, Banking Crisis, and Growth Volatility
In Thailand: An Investigation of Bi-Directional Relationship Piriya Pholphirul
School of Development Economics The National Institute of Development Administration (NIDA)
Serithai Road, Bangkapi, Bangkok 10240, Thailand Tel: 66-2727-3636 E-mail: [email protected]
Abstract Thailand has undergone several economic shocks transmitted from outside the country. A reasonable degree of macroeconomic stability in many critical aspects was implemented during that period. A time-series econometrics is examined to investigate the causal links of financial instability and different sources of volatility to macroeconomic instability and probability of economic downturn. The estimated results show that financial instability and probability of banking crisis are relatively more determined from the volatility in trade openness, and less determined from the price related volatility. In addition, variables related to financial system development seem to be crucial factors in maintaining the stability of the financial sector. The estimated coefficients also indicate that better financial system development should also help stabilize growth volatility and decrease the probability of economic downturn. In addition, we also conclude that price variability does not have strong effects on growth volatility and economic downturn. Keywords: Financial Instability, Growth Volatility, Banking Crisis, Thailand 1. Introduction In the second half of the 1990s, financial markets around the world captured strong attention because financial stability started to tremble in several countries as a result of formidable macroeconomic imbalance, which had been liberalized a few years earlier. Thailand experienced a severe economic crisis in 1997, which had the combined effects of a currency crisis which was indeed the most severe one since the Second World War. Key elements of Thailand’s financial crisis reflected its cumulative balance of payment problems, particularly persistently large current account benefits. The Bank of Thailand (BOT) was depleted for most of its international reserves in defending the baht currency, therefore had to float the currency on July 2, 1997, ending long decades of the fixed exchange rate regime. The banking crises in Thailand wsd particularly painful and costly, as the government was often caught unprepared and had to rescue ailing units without many options. Public debts therefore surged to a large extent. Meanwhile, corporate debt restructuring did not proceed at a satisfactory pace, making many parties question whether a clear-cut economic recovery was forthcoming, and if so, how long it would take and whether it would be sustainable. These strong and negative consequences of banking crises demonstrate that it is worth examining their fundamental conceptual framework and some actual experiences in the past. On the external front, three variables deserved immediate attention of current account shock in Thailand: terms of trade or the extent of foreign demand, world interest rates, prevailing degree of confidence and its primary determinants. Terms of trade or foreign demand ordinarily affect performance on the current account, while interest rate differentials, exchange rate volatility, and confidence motivate capital flows. These current account shocks and capital flows represent one crucial source of liquidity change, which has a strong impact upon financial institutions’ positions or potential. For instance, deterioration of terms of trade can impair debt-servicing capacity of banks’ customers. Furthermore, such an unlucky incident may weaken foreign investors’ confidence, leading to capital outflows, exchange rate depreciation, and substantial losses to financial institutions’ cash flow positions. In this context, another important item is the degree of globalization or how much the local economy is allowed to interact with the rest of the world with respect to trade and capital flows. On the internal account, confidence affects behavior of both lenders and borrowers, therefore the extent and pace of credit expansion. Meanwhile, there is also influence on capital flows, which can stimulate or slow down credit expansion via market competition and changes in exchange rates. The pace of credit expansion is an important determinant of not only economic growth and inflation but also the extent of non-performing loans (NPL), depending upon the quality of credit management. In any case, though NPL will impair both financial stability and confidence, the central authority can help preserve stability of the whole financial system via prudent examination
Vol. 3, No. 6 International Journal of Business and Management
98
and supervision. Finally, politics is also another significant domestic factor that has strong psychological impact on investor confidence. However, regardless of the 1997 economic crisis, we can observe how well the Thai economy performed in the past if one concentrates on lists of macroeconomics indicators, for example the real growth of national income, inflation or changes of price level, and rates of employment. Thailand’s average growth rate between 1970 and 1990 was fairly high at 6.7 percentage points per annum if compared to those of other emerging countries. Actually, it is widely agreed that Thai economy also enjoyed considerable expansion as early as the 1950s. Nonetheless, among high and steady growth, instabilities did occur, like other countries, Thailand, in the past, has undergone several economic shocks, most of them were transmitted from outside the country but some emerged internally. However, since macroeconomic variables show how well the country could adjust themselves to those shocks, questions that might be addressed are, firstly, how could the Thai economy perform quite well during the periods of 1970-1990 even though there were a number of external shocks that affected the country’s current account? Secondly, what were the major factors of shocks that caused the Thai economy more struggle since 1990 and, at the end, led the country to the most turbulent period in to financial market and severe economic crisis at the end of 1990s? In this occasion, the relationship between economics financial instability and financial development to economic growth has received a lot of attention in economic literature in the last ten years. Undoubtedly, financial stability/instability and macroeconomic stability/instability are intricately related. Applied to the case of Thailand, relationships between weak financial institutions and macroeconomic condition should be addressed to analyze how the financial volatility determines macroeconomic imbalances. In addition, there are a number of shocks, especially from external factors, that causes institution weakening, for example the financial liberalization that mounted to excessive capital inflows in the early 1990s, and macroeconomic volatility, for example two oil shocks in the 1970s. Should we follow the econometrics reasoning by estimating lists of regressions, the volatility occurrences in the periods before 1990 is believed to be less affected to macroeconomic variables, e.g. GDP growth, inflation, and government budget. However, the relationship might be changed since the beginning of the 1990s when capital inflows surged. Beyond this hypothesis, some questions need to be answered to confirm the result which are (i) Do economies with higher levels of financial intermediary development experience more or less volatility in economic growth rates? and (ii) Do intermediaries dampen the impact of external shocks on the economy or do they amplify them through the credit channel? Many literatures have empirically investigated a positive impact of financial sector development on economic growth. Specifically, a series of empirical articles by King and Levine (1993a, 1993b, 1993c) brought the discussion to the forefront of economic literatures in the 1990s. Some empirical work in this vein includes Gelb (1989), Roubini and Sala-i-Martin (1992), Pagano (1993), Levine (1997, 1998), Beck, Levine, and Loayza (2000), and Rioja and Valev (2004). However, the potential links between financial development and the volatility of economic growth have not been studied thoroughly yet. Previous papers have found that financial development reduces macroeconomic volatility (Easterly, Islam, and Stiglitz, 2000; Hausmann and Gavin, 1996). Nevertheless, many literatures adopt the cross-country studies to determine the causal relationship between those two variables. Further, none of these papers have tried to identify the channels through which financial development potentially affects growth volatility. The imbalances of financial institutions, or financial instability in Thailand exist in a sense of prosperity during the expansion path giving rise to over optimism, complacency, and over confidence. As soon as overvaluation of asset prices has been realized, a loss of confidence, pessimism, and over-reaction set in. Rising bankruptcies, non-performing assets, and bank runs are the order of the day in a debt-deflation economy. The greater the amount of debt accumulated over the expansion phase of the cycle, the deeper the trough and the longer the duration of the recession. Financial instability therefore leads to macroeconomic instability and vice versa. Section II constructs the model specification of the simultaneous econometrics time series capturing the relationship of financial instability and growth volatility. Variables measuring economic volatility, financial instability, and various sources of volatility will be announced in this section. Section III investigates the determinants of financial instability and banking crisis from different sources of volatility by using bivariated regression. Section IV also investigates the determinants of growth volatility and probability of economic downturn from different sources of volatility. Section V adopts the method of instrumental variable (IV) to treat the effect of simultaneity of financial instability and growth volatility. It also includes both general level of volatility, which is measured by standard deviation of variables, and excess volatility, which was determined during the period of economic turbulence in 1997-1998. And, Section VI concludes. 2. Model Specification and Variables. The detailed explanation of this section was lead us to implement the econometrics framework to capture volatility. For the purposes of this section, time series econometrics framework attempts to investigate how the stability of
International Journal of Business and Management June, 2008
99
Thailand’s financial institution incorporated by a macroeconomic volatility and its downturn. On the other hand, how the instability of Thailand’s macroeconomics variability affects financial instability. Since the financial crisis erupted in Thailand in 1997, the key elements of Thailand’s economic crisis, which follow the banking crisis, reflected its cumulative balance of payment problem, particularly and persistently large current account deficits, and unsustainable financing through short-term borrowing. Crockett (1996) defines financial instability as a situation when economic performance is adversely affected by fluctuations in prices of financial assets and when financial intermediaries have difficulty in meeting their contractual obligations. The volatility of financial institutions should also be simultaneously determined by the economic volatility. Since the bi-directional causal relationship is applied in this study, the system equations capturing simultaneous between those two variables: macroeconomics volatility and financial institution; should be investigated. The important form of endogeneity of explanatory variables is simultaneity. The most important point to remember in using simultaneous equations models (SEMs) is that each equation in the system should have a ceteris paribus in causal interpretation. Therefore, to observe bi-directional relationship between institution volatility and growth volatility, the method of ordinary least square (OLS) is biased and inconsistent when applied to a structural equation in a simultaneous equation system. Thus, two equations are suffering from simultaneous bias performance as the following structural equations:
Yt = α1.It + β1Xt + ε1t (1) It = α2Yt + β2Xt + ε2t (2)
For simplicity, the intercept for each equation is suppressed. To show that the economic volatility (Y) is generally correlated with the error term ε2., two equations can be solved for Y in terms of the exogenous variables (X) and the error term by plugging Equation (2) into the Equation (1), we get
Yt = α1.(α2Yt + β2Xt + ε2t )+ β1Xt + ε1t Or,
(1- α1.α2)Yt = (α1.β2 + β2).Xt + ε1t + α1.ε2t (3) The assumption of α1.α2 ≠ 1 must hold in order to solve for Y. Dividing Equation (3) by (1- α1.α2), Y can be rewritten as
Yt = П1.Xt + ν1t (4) Where, П1 = (α1.β2 + β2)/(1- α1.α2) and ν1t = (ε1t + α1.ε2t)/ (1- α1.α2). The Equation (4) expresses Y in terms of the exogenous variables and the error terms, is the reduced form for Y. The parameter П is therefore called reduced form parameters. Also, П as itself is simultaneously determined from Y, a reduced form also exists for I by plugging Equation (1) into the Equation (2) and getting,
It = α2.(α1It + β1Xt + ε1t )+ β2Xt + ε2t Or,
(1- α1.α2)It = (α2.β1 + β2).Xt + ε2t + α2.ε1t (5) The assumption of α1.α2 ≠ 1 must also hold to solve for I. Dividing Equation (5) by (1- α1.α2), I can be rewritten as the reduced form function shown in the Equation (6) below:
It = П2.Xt + ν2t (6) Where, П2 = (α2.β1 + β1)/(1- α1.α2) and ν2t = (ε2t + α2.ε1t)/ (1- α1.α2). The endogenous variable (Y) is the macroeconomic volatility measured by: Y1: Standard deviation of changes in real GDP per capita, and Y2: Probability of economic downturn The endogenous variable (I) measures the volatility and fragility of the financial institution. In general, performances of banks are measured in term of size, activity, and efficiency as explained in a number of literatures. Since the domestic financial architecture framework in Thailand is performing on a bank-based system, banks play a leading role in mobilizing savings, allocating capital, overseeing the investment decision of corporate managers, and providing risk management vehicles. Even though, lists of variables might be considerably adopted to measure the degree of volatility in the banking sector, this study points out the following two potential variables: I1: Standard deviation of liquidity asset/deposit ratio, and
Vol. 3, No. 6 International Journal of Business and Management
100
I2: Standard deviation of capital account/risk asset ratio The first variable I1 measures how the liquidity status of commercial bank might fluctuate. Since commercial banks regularly borrow in the financial markets, liquidity takes on the added dimension of the ability to borrow funds at minimum cost. Bank liquidity thus refers to a bank’s capacity to acquire immediately available funds at a reasonable price. The lower the ratio indicates less liquidity channel of the deposit, which thereafter causes less performance in financial institutions. The second variable I2, the standard deviation of capital account/risk asset ratio, determines the volatility of the banking sector that holds high proportion of risky asset. The higher the ratio implies more volatility of the financial institution. Both variables were found to be highly volatized during the periods of severe economic crisis 1997-1999. Vector X denotes a set of exogenous variables, which are the variables measuring different sources of volatility. Since the volatility from different sources determine both endogenous variables Y and I, the set of X variables in this case are mutually overlapping and therefore there is no rule of exclusion restriction on the variables X. The measurement used in general both in terms of level and in term of standard deviation of the variables are under study. They are defined as the following categories: (2) Trade and Financial Openness (X1) Standard deviation of change in term of trade; (export + import)/GDP; Standard deviation of (export + import)/GDP; Private capital inflow/ GDP; Standard deviation of (Private capital inflow/ GDP); (3) Financial System Development(X2) M3/GDP; Standard deviation of M3/GDP; Stock market capitalization/GDP; Standard deviation of stock market capitalization/GDP; Credit to private sector/ GDP; Standard deviation of credit to private sector/ GDP; Standard deviation of change in private credit/ GDP; (4) Price Variability (X3) Standard deviation of oil price index; Standard deviation of changes in oil price index; Standard deviation of agriculture price index; Standard deviation of changes in agriculture price; Standard deviation of manufacturing price index; (5) Policy Volatility (X4) Standard deviation of fiscal balance/GDP; Net foreign asset/GDP; Standard deviation of net foreign asset/GDP; Central bank asset/ GDP; Standard deviation of central bank asset/ GDP; Some literatures within the theoretical consideration suggest that greater openness to trade and finance may expose the country to more external shocks. Especially, in the case of Thailand, greater openness of the capital account might expose to greater dependence of credit that might at the end make the country more vulnerable. More trade opening might create acute portfolio problems since the relative prices change. Hence weak firms and business practices become insolent, and thereafter reflect to economic volatility. Financial openness is applied in the case of Thailand where excessive short-term capital inflow was the major cause of the country to acute external debt, which thereafter was the major cause of the financial and economic crisis.
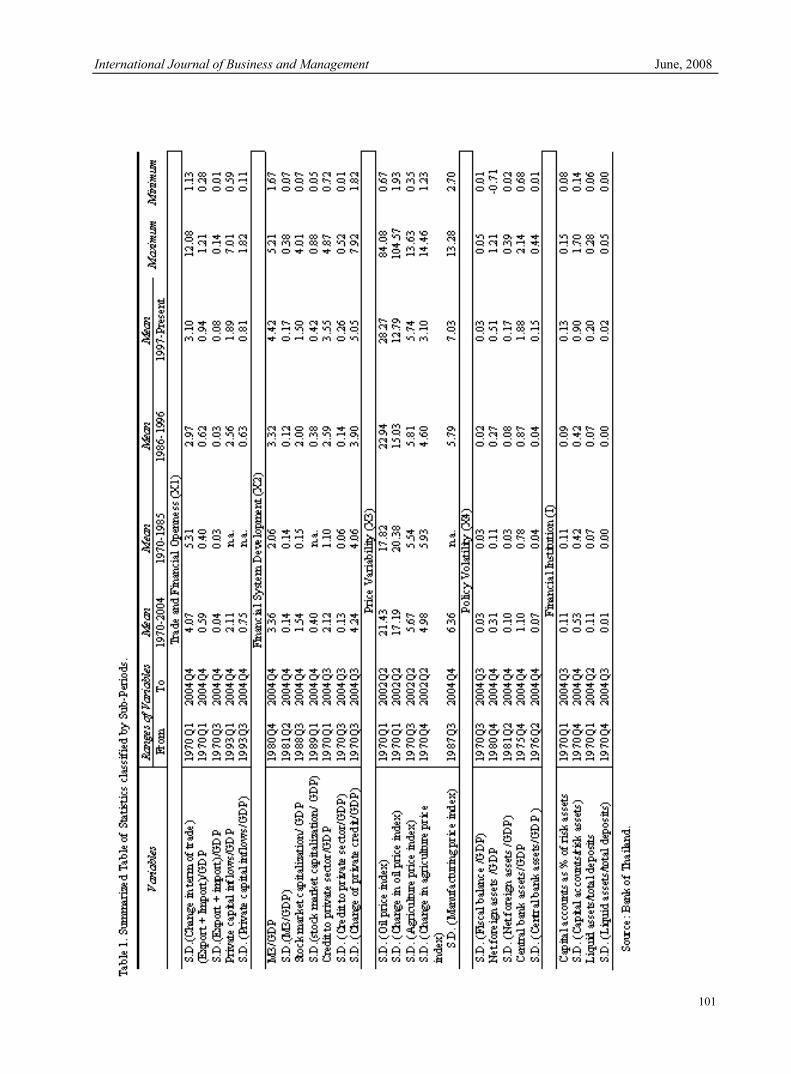
International Journal of Business and Management June, 2008
101
Vol. 3, No. 6 International Journal of Business and Management
102
Financial system development experienced both more and less volatility in economic growth rate. Different literatures produce different answers. It is possible that financial development might alleviate the agency costs and cash flow constraints, and thereafter dampen the impact of real shocks to the economy. On the other hand, there is the dampening effect of financial intermediaries on the propagation of real shock and a magnifying effect of the propagation of monetary shock. In this case, financial development might have an overall dampening or amplifying impact of growth volatility. Reasonable price volatility is possibly a crucial prerequisite for effective and efficient domestic resource mobilization and allocation through the financial sector. High price volatility implies unpredictability. Economic activity, including banking activities, therefore, takes place in an increasingly uncertain world. Uncertainty causes economic inefficiency. The macroeconomic policies, which are related to fiscal policy or to monetary policy, no doubt have an effect on the economic growth and economic volatility. Expansionary fiscal policy has medium and long-run effects on economic volatility. A series of expansionary fiscal policy shocks raise the ratio of net government credit to total domestic credit. Monetary policy, on the other hand, produces exogenous shock, in the same way as the variance of money growth shock. Monetary policy implementation determines many of the constraints under which financial institutions must operate. Thereafter, compared to the fiscal policy, monetary policy is more assessing to activities and performances of financial institutions. 3. Determinants of Financial Instability and Banking Crisis This section aims to investigate the financial volatility from the different sources of volatility in the Thai economy. Volatility and crises deteriorate the quality of financial institutions. Thailand is no exception; banking volatility has no meaning except the variability of financial performance, which is determined from different characteristics of volatility. The measurement of banking volatility is as of denoted in the previous section. To investigate the impacts of financial stability to economic volatility, the bivariated regression of financial volatility (I1 and I2) is individually estimated with numbers of volatility (X) as given by the Equation (6), which is the reduced form equation for I. Also, estimating with time trend, Table 2 shows the bivariated estimation of trans-log function of I1: standard deviation (capital account/risk asset) and Table 3 shows the estimated results trans-log function of I2: standard deviation (liquidity asset/ deposit). From the above estimated results, both tables indicate that term of trade volatility and openness to trade volatility is individually associated with increased financial volatility. Even though, the volatility of financial openness is not found to be statistically associated to the financial volatility I1, it is observed to decrease financial volatility I2. Mostly, the indicators of financial system development are found to decrease financial volatility. Some of the most influential variables are, for example, the size of financial market (M2/GDP), capital market development and its volatility, and the financial depth and its volatility (credit to private sector/GDP). These results can be explained as that the better development of financial system and capital market, the more encouraging it is for financial institutions to manage their domestic resource mobilization and thereafter helping in stabilizing the institutions.
Nevertheless, by observing the estimated coefficients, the variables related to price variability are less likely to cause financial institution more volatility. Both standard deviation of agriculture price and oil price is found to increase venerability of financial institution. It might be argued that the impacts of oil price and agriculture price should not be direct determinants of the financial sector, but rather to be passed-through to the real sector. Nevertheless, more flexibility of price index in both agriculture sector and manufacturing sector is observed to decrease financial volatility. Policy variability in fiscal related and net foreign asset are also associated with decreased financial volatility. However, the variability in net foreign asset to GDP is associated with increased financial volatility. In addition, central bank asset and its volatility are also associated with increased volatility in financial institutions. Nonetheless, compared with other significant variables; the volatility of trade openness seems to generate the highest determinant to the financial volatility, followed by the volatility in the related policy. Compared to other sources of volatility, the volatility in price seems likely to generate the least impact to financial institution’s volatility in Thailand. This therefore leads to the conclusion that the volatility in Thailand’s financial institutions is largely influenced by the external factors. Throughout the periods studied, international openness in trade and capital inflow has caused Thailand’s financial institution to be more volatized. Nonetheless, the variables related to financial development are important to help in the stabilization of this sector.
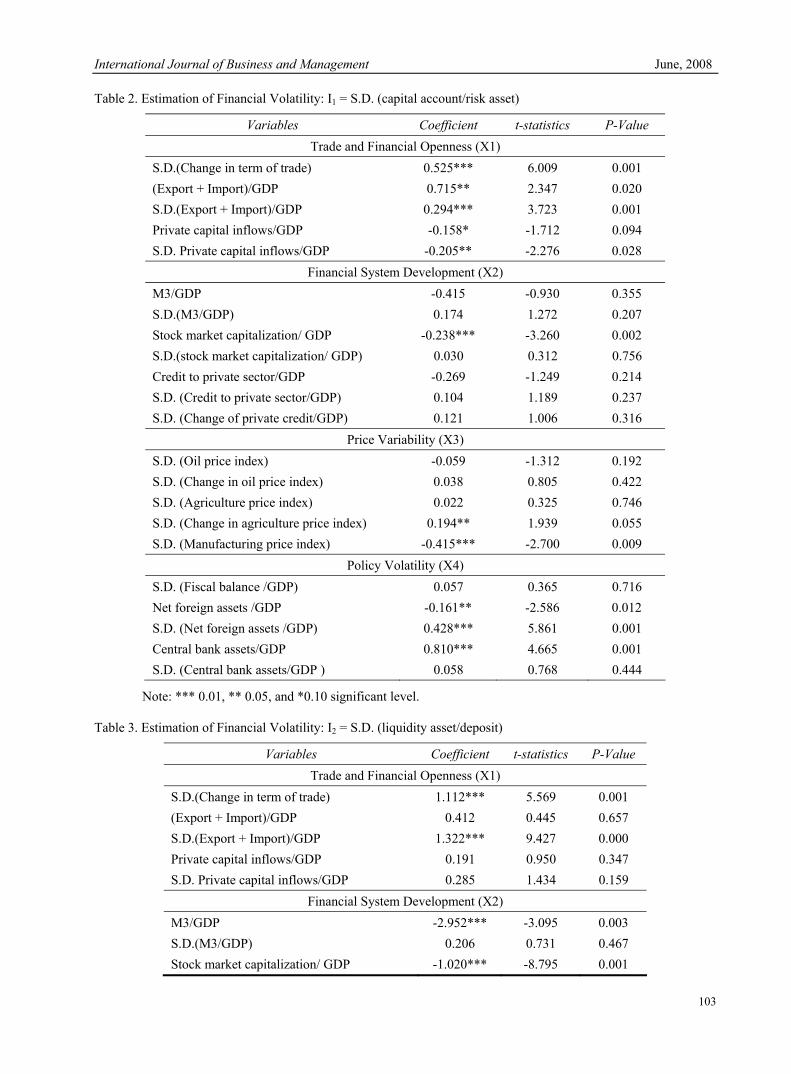
International Journal of Business and Management June, 2008
103
Table 2. Estimation of Financial Volatility: I1 = S.D. (capital account/risk asset)
Variables Coefficient t-statistics P-Value Trade and Financial Openness (X1)
S.D.(Change in term of trade) 0.525*** 6.009 0.001 (Export + Import)/GDP 0.715** 2.347 0.020 S.D.(Export + Import)/GDP 0.294*** 3.723 0.001 Private capital inflows/GDP -0.158* -1.712 0.094 S.D. Private capital inflows/GDP -0.205** -2.276 0.028
Financial System Development (X2) M3/GDP -0.415 -0.930 0.355 S.D.(M3/GDP) 0.174 1.272 0.207 Stock market capitalization/ GDP -0.238*** -3.260 0.002 S.D.(stock market capitalization/ GDP) 0.030 0.312 0.756 Credit to private sector/GDP -0.269 -1.249 0.214 S.D. (Credit to private sector/GDP) 0.104 1.189 0.237 S.D. (Change of private credit/GDP) 0.121 1.006 0.316
Price Variability (X3) S.D. (Oil price index) -0.059 -1.312 0.192 S.D. (Change in oil price index) 0.038 0.805 0.422 S.D. (Agriculture price index) 0.022 0.325 0.746 S.D. (Change in agriculture price index) 0.194** 1.939 0.055 S.D. (Manufacturing price index) -0.415*** -2.700 0.009
Policy Volatility (X4) S.D. (Fiscal balance /GDP) 0.057 0.365 0.716 Net foreign assets /GDP -0.161** -2.586 0.012 S.D. (Net foreign assets /GDP) 0.428*** 5.861 0.001 Central bank assets/GDP 0.810*** 4.665 0.001 S.D. (Central bank assets/GDP ) 0.058 0.768 0.444
Note: *** 0.01, ** 0.05, and *0.10 significant level.
Table 3. Estimation of Financial Volatility: I2 = S.D. (liquidity asset/deposit)
Variables Coefficient t-statistics P-Value Trade and Financial Openness (X1)
S.D.(Change in term of trade) 1.112*** 5.569 0.001 (Export + Import)/GDP 0.412 0.445 0.657 S.D.(Export + Import)/GDP 1.322*** 9.427 0.000 Private capital inflows/GDP 0.191 0.950 0.347 S.D. Private capital inflows/GDP 0.285 1.434 0.159
Financial System Development (X2) M3/GDP -2.952*** -3.095 0.003 S.D.(M3/GDP) 0.206 0.731 0.467 Stock market capitalization/ GDP -1.020*** -8.795 0.001
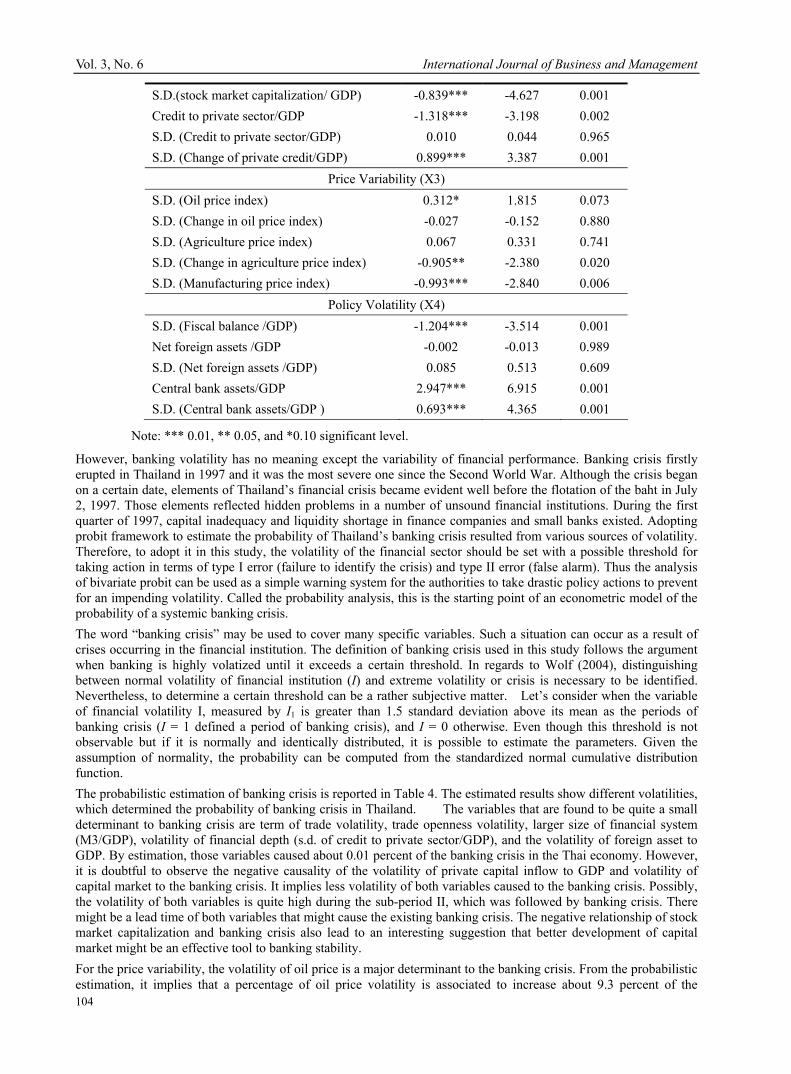
Vol. 3, No. 6 International Journal of Business and Management
104
S.D.(stock market capitalization/ GDP) -0.839*** -4.627 0.001 Credit to private sector/GDP -1.318*** -3.198 0.002 S.D. (Credit to private sector/GDP) 0.010 0.044 0.965 S.D. (Change of private credit/GDP) 0.899*** 3.387 0.001
Price Variability (X3) S.D. (Oil price index) 0.312* 1.815 0.073 S.D. (Change in oil price index) -0.027 -0.152 0.880 S.D. (Agriculture price index) 0.067 0.331 0.741 S.D. (Change in agriculture price index) -0.905** -2.380 0.020 S.D. (Manufacturing price index) -0.993*** -2.840 0.006
Policy Volatility (X4) S.D. (Fiscal balance /GDP) -1.204*** -3.514 0.001 Net foreign assets /GDP -0.002 -0.013 0.989 S.D. (Net foreign assets /GDP) 0.085 0.513 0.609 Central bank assets/GDP 2.947*** 6.915 0.001 S.D. (Central bank assets/GDP ) 0.693*** 4.365 0.001
Note: *** 0.01, ** 0.05, and *0.10 significant level.
However, banking volatility has no meaning except the variability of financial performance. Banking crisis firstly erupted in Thailand in 1997 and it was the most severe one since the Second World War. Although the crisis began on a certain date, elements of Thailand’s financial crisis became evident well before the flotation of the baht in July 2, 1997. Those elements reflected hidden problems in a number of unsound financial institutions. During the first quarter of 1997, capital inadequacy and liquidity shortage in finance companies and small banks existed. Adopting probit framework to estimate the probability of Thailand’s banking crisis resulted from various sources of volatility. Therefore, to adopt it in this study, the volatility of the financial sector should be set with a possible threshold for taking action in terms of type I error (failure to identify the crisis) and type II error (false alarm). Thus the analysis of bivariate probit can be used as a simple warning system for the authorities to take drastic policy actions to prevent for an impending volatility. Called the probability analysis, this is the starting point of an econometric model of the probability of a systemic banking crisis. The word “banking crisis” may be used to cover many specific variables. Such a situation can occur as a result of crises occurring in the financial institution. The definition of banking crisis used in this study follows the argument when banking is highly volatized until it exceeds a certain threshold. In regards to Wolf (2004), distinguishing between normal volatility of financial institution (I) and extreme volatility or crisis is necessary to be identified. Nevertheless, to determine a certain threshold can be a rather subjective matter. Let’s consider when the variable of financial volatility I, measured by I1 is greater than 1.5 standard deviation above its mean as the periods of banking crisis (I = 1 defined a period of banking crisis), and I = 0 otherwise. Even though this threshold is not observable but if it is normally and identically distributed, it is possible to estimate the parameters. Given the assumption of normality, the probability can be computed from the standardized normal cumulative distribution function. The probabilistic estimation of banking crisis is reported in Table 4. The estimated results show different volatilities, which determined the probability of banking crisis in Thailand. The variables that are found to be quite a small determinant to banking crisis are term of trade volatility, trade openness volatility, larger size of financial system (M3/GDP), volatility of financial depth (s.d. of credit to private sector/GDP), and the volatility of foreign asset to GDP. By estimation, those variables caused about 0.01 percent of the banking crisis in the Thai economy. However, it is doubtful to observe the negative causality of the volatility of private capital inflow to GDP and volatility of capital market to the banking crisis. It implies less volatility of both variables caused to the banking crisis. Possibly, the volatility of both variables is quite high during the sub-period II, which was followed by banking crisis. There might be a lead time of both variables that might cause the existing banking crisis. The negative relationship of stock market capitalization and banking crisis also lead to an interesting suggestion that better development of capital market might be an effective tool to banking stability. For the price variability, the volatility of oil price is a major determinant to the banking crisis. From the probabilistic estimation, it implies that a percentage of oil price volatility is associated to increase about 9.3 percent of the
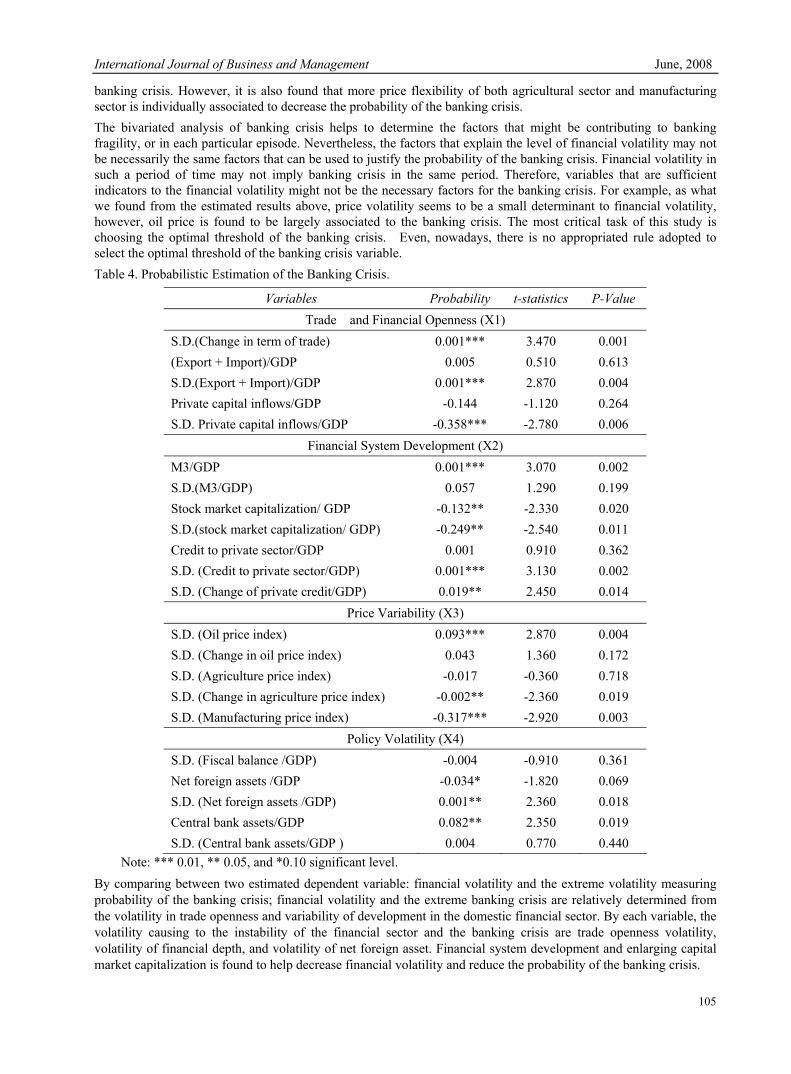
International Journal of Business and Management June, 2008
105
banking crisis. However, it is also found that more price flexibility of both agricultural sector and manufacturing sector is individually associated to decrease the probability of the banking crisis. The bivariated analysis of banking crisis helps to determine the factors that might be contributing to banking fragility, or in each particular episode. Nevertheless, the factors that explain the level of financial volatility may not be necessarily the same factors that can be used to justify the probability of the banking crisis. Financial volatility in such a period of time may not imply banking crisis in the same period. Therefore, variables that are sufficient indicators to the financial volatility might not be the necessary factors for the banking crisis. For example, as what we found from the estimated results above, price volatility seems to be a small determinant to financial volatility, however, oil price is found to be largely associated to the banking crisis. The most critical task of this study is choosing the optimal threshold of the banking crisis. Even, nowadays, there is no appropriated rule adopted to select the optimal threshold of the banking crisis variable. Table 4. Probabilistic Estimation of the Banking Crisis.
Variables Probability t-statistics P-Value Trade and Financial Openness (X1)
S.D.(Change in term of trade) 0.001*** 3.470 0.001 (Export + Import)/GDP 0.005 0.510 0.613 S.D.(Export + Import)/GDP 0.001*** 2.870 0.004 Private capital inflows/GDP -0.144 -1.120 0.264 S.D. Private capital inflows/GDP -0.358*** -2.780 0.006
Financial System Development (X2) M3/GDP 0.001*** 3.070 0.002 S.D.(M3/GDP) 0.057 1.290 0.199 Stock market capitalization/ GDP -0.132** -2.330 0.020 S.D.(stock market capitalization/ GDP) -0.249** -2.540 0.011 Credit to private sector/GDP 0.001 0.910 0.362 S.D. (Credit to private sector/GDP) 0.001*** 3.130 0.002 S.D. (Change of private credit/GDP) 0.019** 2.450 0.014
Price Variability (X3) S.D. (Oil price index) 0.093*** 2.870 0.004 S.D. (Change in oil price index) 0.043 1.360 0.172 S.D. (Agriculture price index) -0.017 -0.360 0.718 S.D. (Change in agriculture price index) -0.002** -2.360 0.019 S.D. (Manufacturing price index) -0.317*** -2.920 0.003
Policy Volatility (X4) S.D. (Fiscal balance /GDP) -0.004 -0.910 0.361 Net foreign assets /GDP -0.034* -1.820 0.069 S.D. (Net foreign assets /GDP) 0.001** 2.360 0.018 Central bank assets/GDP 0.082** 2.350 0.019 S.D. (Central bank assets/GDP ) 0.004 0.770 0.440
Note: *** 0.01, ** 0.05, and *0.10 significant level. By comparing between two estimated dependent variable: financial volatility and the extreme volatility measuring probability of the banking crisis; financial volatility and the extreme banking crisis are relatively determined from the volatility in trade openness and variability of development in the domestic financial sector. By each variable, the volatility causing to the instability of the financial sector and the banking crisis are trade openness volatility, volatility of financial depth, and volatility of net foreign asset. Financial system development and enlarging capital market capitalization is found to help decrease financial volatility and reduce the probability of the banking crisis.
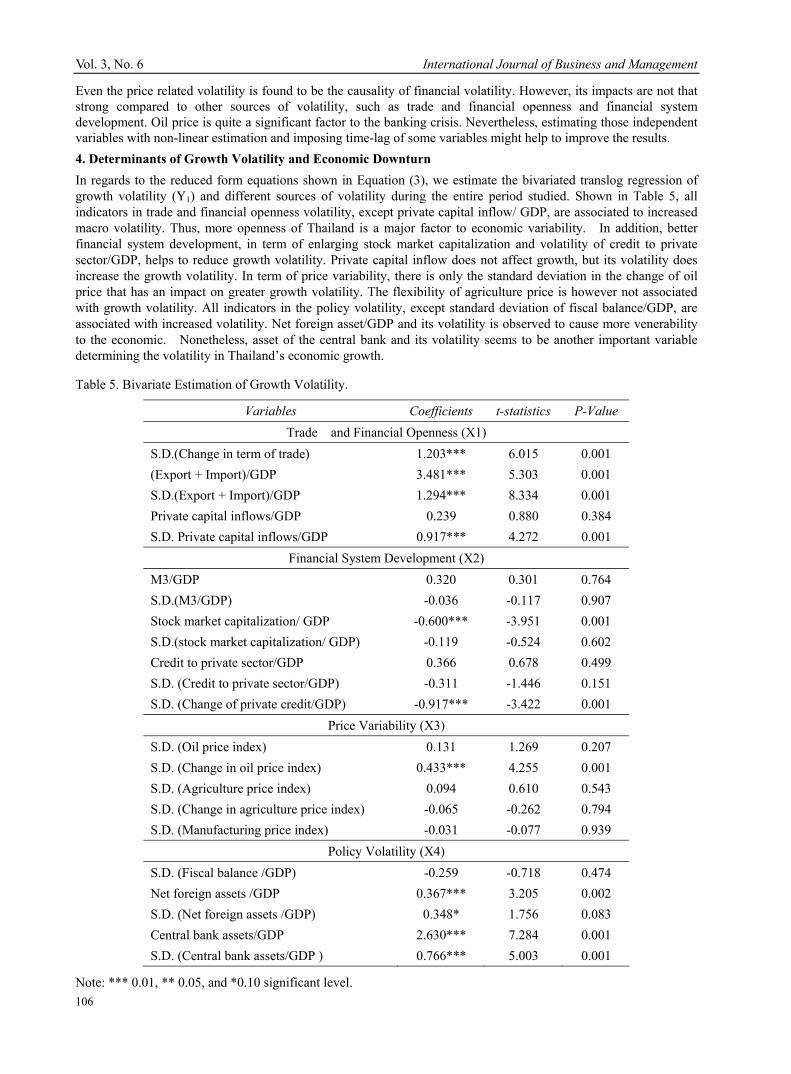
Vol. 3, No. 6 International Journal of Business and Management
106
Even the price related volatility is found to be the causality of financial volatility. However, its impacts are not that strong compared to other sources of volatility, such as trade and financial openness and financial system development. Oil price is quite a significant factor to the banking crisis. Nevertheless, estimating those independent variables with non-linear estimation and imposing time-lag of some variables might help to improve the results. 4. Determinants of Growth Volatility and Economic Downturn In regards to the reduced form equations shown in Equation (3), we estimate the bivariated translog regression of growth volatility (Y1) and different sources of volatility during the entire period studied. Shown in Table 5, all indicators in trade and financial openness volatility, except private capital inflow/ GDP, are associated to increased macro volatility. Thus, more openness of Thailand is a major factor to economic variability. In addition, better financial system development, in term of enlarging stock market capitalization and volatility of credit to private sector/GDP, helps to reduce growth volatility. Private capital inflow does not affect growth, but its volatility does increase the growth volatility. In term of price variability, there is only the standard deviation in the change of oil price that has an impact on greater growth volatility. The flexibility of agriculture price is however not associated with growth volatility. All indicators in the policy volatility, except standard deviation of fiscal balance/GDP, are associated with increased volatility. Net foreign asset/GDP and its volatility is observed to cause more venerability to the economic. Nonetheless, asset of the central bank and its volatility seems to be another important variable determining the volatility in Thailand’s economic growth.
Table 5. Bivariate Estimation of Growth Volatility.
Variables Coefficients t-statistics P-Value Trade and Financial Openness (X1)
S.D.(Change in term of trade) 1.203*** 6.015 0.001 (Export + Import)/GDP 3.481*** 5.303 0.001 S.D.(Export + Import)/GDP 1.294*** 8.334 0.001 Private capital inflows/GDP 0.239 0.880 0.384 S.D. Private capital inflows/GDP 0.917*** 4.272 0.001
Financial System Development (X2) M3/GDP 0.320 0.301 0.764 S.D.(M3/GDP) -0.036 -0.117 0.907 Stock market capitalization/ GDP -0.600*** -3.951 0.001 S.D.(stock market capitalization/ GDP) -0.119 -0.524 0.602 Credit to private sector/GDP 0.366 0.678 0.499 S.D. (Credit to private sector/GDP) -0.311 -1.446 0.151 S.D. (Change of private credit/GDP) -0.917*** -3.422 0.001
Price Variability (X3) S.D. (Oil price index) 0.131 1.269 0.207 S.D. (Change in oil price index) 0.433*** 4.255 0.001 S.D. (Agriculture price index) 0.094 0.610 0.543 S.D. (Change in agriculture price index) -0.065 -0.262 0.794 S.D. (Manufacturing price index) -0.031 -0.077 0.939
Policy Volatility (X4) S.D. (Fiscal balance /GDP) -0.259 -0.718 0.474 Net foreign assets /GDP 0.367*** 3.205 0.002 S.D. (Net foreign assets /GDP) 0.348* 1.756 0.083 Central bank assets/GDP 2.630*** 7.284 0.001 S.D. (Central bank assets/GDP ) 0.766*** 5.003 0.001
Note: *** 0.01, ** 0.05, and *0.10 significant level.
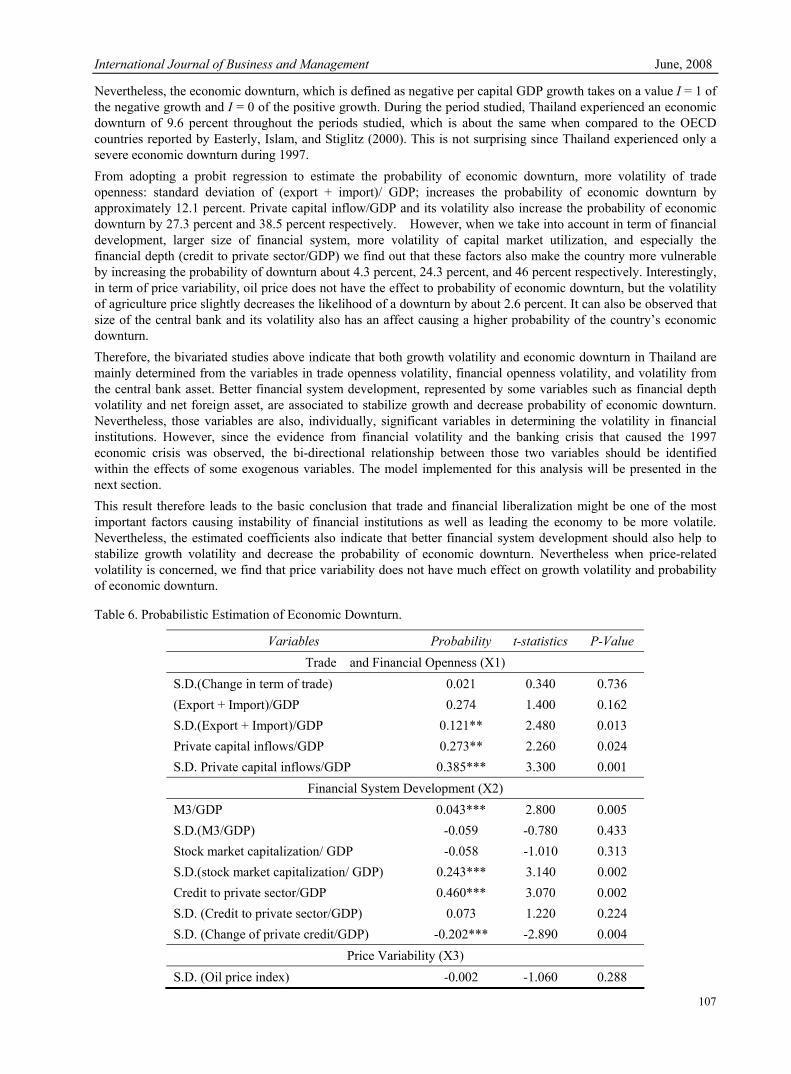
International Journal of Business and Management June, 2008
107
Nevertheless, the economic downturn, which is defined as negative per capital GDP growth takes on a value I = 1 of the negative growth and I = 0 of the positive growth. During the period studied, Thailand experienced an economic downturn of 9.6 percent throughout the periods studied, which is about the same when compared to the OECD countries reported by Easterly, Islam, and Stiglitz (2000). This is not surprising since Thailand experienced only a severe economic downturn during 1997. From adopting a probit regression to estimate the probability of economic downturn, more volatility of trade openness: standard deviation of (export + import)/ GDP; increases the probability of economic downturn by approximately 12.1 percent. Private capital inflow/GDP and its volatility also increase the probability of economic downturn by 27.3 percent and 38.5 percent respectively. However, when we take into account in term of financial development, larger size of financial system, more volatility of capital market utilization, and especially the financial depth (credit to private sector/GDP) we find out that these factors also make the country more vulnerable by increasing the probability of downturn about 4.3 percent, 24.3 percent, and 46 percent respectively. Interestingly, in term of price variability, oil price does not have the effect to probability of economic downturn, but the volatility of agriculture price slightly decreases the likelihood of a downturn by about 2.6 percent. It can also be observed that size of the central bank and its volatility also has an affect causing a higher probability of the country’s economic downturn. Therefore, the bivariated studies above indicate that both growth volatility and economic downturn in Thailand are mainly determined from the variables in trade openness volatility, financial openness volatility, and volatility from the central bank asset. Better financial system development, represented by some variables such as financial depth volatility and net foreign asset, are associated to stabilize growth and decrease probability of economic downturn. Nevertheless, those variables are also, individually, significant variables in determining the volatility in financial institutions. However, since the evidence from financial volatility and the banking crisis that caused the 1997 economic crisis was observed, the bi-directional relationship between those two variables should be identified within the effects of some exogenous variables. The model implemented for this analysis will be presented in the next section. This result therefore leads to the basic conclusion that trade and financial liberalization might be one of the most important factors causing instability of financial institutions as well as leading the economy to be more volatile. Nevertheless, the estimated coefficients also indicate that better financial system development should also help to stabilize growth volatility and decrease the probability of economic downturn. Nevertheless when price-related volatility is concerned, we find that price variability does not have much effect on growth volatility and probability of economic downturn.
Table 6. Probabilistic Estimation of Economic Downturn.
Variables Probability t-statistics P-Value Trade and Financial Openness (X1)
S.D.(Change in term of trade) 0.021 0.340 0.736 (Export + Import)/GDP 0.274 1.400 0.162 S.D.(Export + Import)/GDP 0.121** 2.480 0.013 Private capital inflows/GDP 0.273** 2.260 0.024 S.D. Private capital inflows/GDP 0.385*** 3.300 0.001
Financial System Development (X2) M3/GDP 0.043*** 2.800 0.005 S.D.(M3/GDP) -0.059 -0.780 0.433 Stock market capitalization/ GDP -0.058 -1.010 0.313 S.D.(stock market capitalization/ GDP) 0.243*** 3.140 0.002 Credit to private sector/GDP 0.460*** 3.070 0.002 S.D. (Credit to private sector/GDP) 0.073 1.220 0.224 S.D. (Change of private credit/GDP) -0.202*** -2.890 0.004
Price Variability (X3) S.D. (Oil price index) -0.002 -1.060 0.288
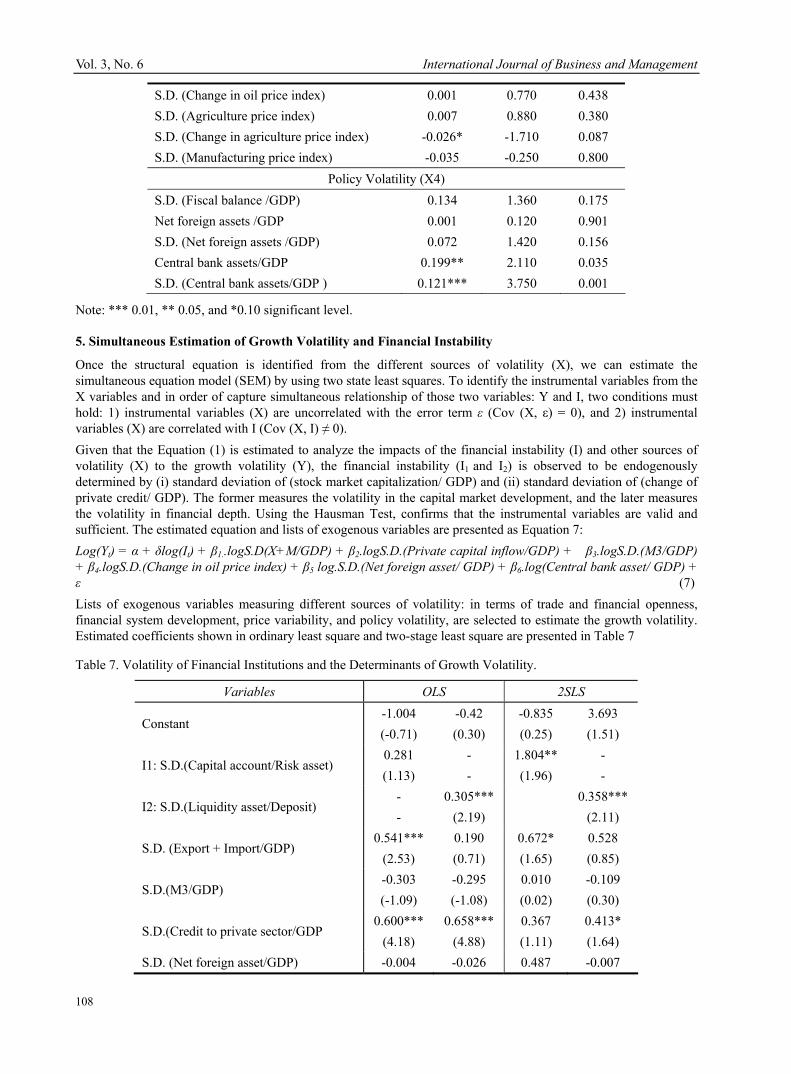
Vol. 3, No. 6 International Journal of Business and Management
108
S.D. (Change in oil price index) 0.001 0.770 0.438 S.D. (Agriculture price index) 0.007 0.880 0.380 S.D. (Change in agriculture price index) -0.026* -1.710 0.087 S.D. (Manufacturing price index) -0.035 -0.250 0.800
Policy Volatility (X4) S.D. (Fiscal balance /GDP) 0.134 1.360 0.175 Net foreign assets /GDP 0.001 0.120 0.901 S.D. (Net foreign assets /GDP) 0.072 1.420 0.156 Central bank assets/GDP 0.199** 2.110 0.035 S.D. (Central bank assets/GDP ) 0.121*** 3.750 0.001
Note: *** 0.01, ** 0.05, and *0.10 significant level.
5. Simultaneous Estimation of Growth Volatility and Financial Instability
Once the structural equation is identified from the different sources of volatility (X), we can estimate the simultaneous equation model (SEM) by using two state least squares. To identify the instrumental variables from the X variables and in order of capture simultaneous relationship of those two variables: Y and I, two conditions must hold: 1) instrumental variables (X) are uncorrelated with the error term ε (Cov (X, ε) = 0), and 2) instrumental variables (X) are correlated with I (Cov (X, I) ≠ 0). Given that the Equation (1) is estimated to analyze the impacts of the financial instability (I) and other sources of volatility (X) to the growth volatility (Y), the financial instability (I1 and I2) is observed to be endogenously determined by (i) standard deviation of (stock market capitalization/ GDP) and (ii) standard deviation of (change of private credit/ GDP). The former measures the volatility in the capital market development, and the later measures the volatility in financial depth. Using the Hausman Test, confirms that the instrumental variables are valid and sufficient. The estimated equation and lists of exogenous variables are presented as Equation 7: Log(Yt) = α + δlog(It) + β1..logS.D(X+M/GDP) + β2.logS.D.(Private capital inflow/GDP) + β3.logS.D.(M3/GDP) + β4.logS.D.(Change in oil price index) + β5 log.S.D.(Net foreign asset/ GDP) + β6.log(Central bank asset/ GDP) + ε (7) Lists of exogenous variables measuring different sources of volatility: in terms of trade and financial openness, financial system development, price variability, and policy volatility, are selected to estimate the growth volatility. Estimated coefficients shown in ordinary least square and two-stage least square are presented in Table 7
Table 7. Volatility of Financial Institutions and the Determinants of Growth Volatility.
Variables OLS 2SLS
Constant -1.004 (-0.71)
-0.42 (0.30)
-0.835 (0.25)
3.693 (1.51)
I1: S.D.(Capital account/Risk asset) 0.281 (1.13)
- -
1.804**(1.96)
- -
I2: S.D.(Liquidity asset/Deposit) - -
0.305***(2.19)
0.358***
(2.11)
S.D. (Export + Import/GDP) 0.541***
(2.53) 0.190 (0.71)
0.672* (1.65)
0.528 (0.85)
S.D.(M3/GDP) -0.303 (-1.09)
-0.295 (-1.08)
0.010 (0.02)
-0.109 (0.30)
S.D.(Credit to private sector/GDP 0.600***
(4.18) 0.658***
(4.88) 0.367 (1.11)
0.413* (1.64)
S.D. (Net foreign asset/GDP) -0.004 -0.026 0.487 -0.007
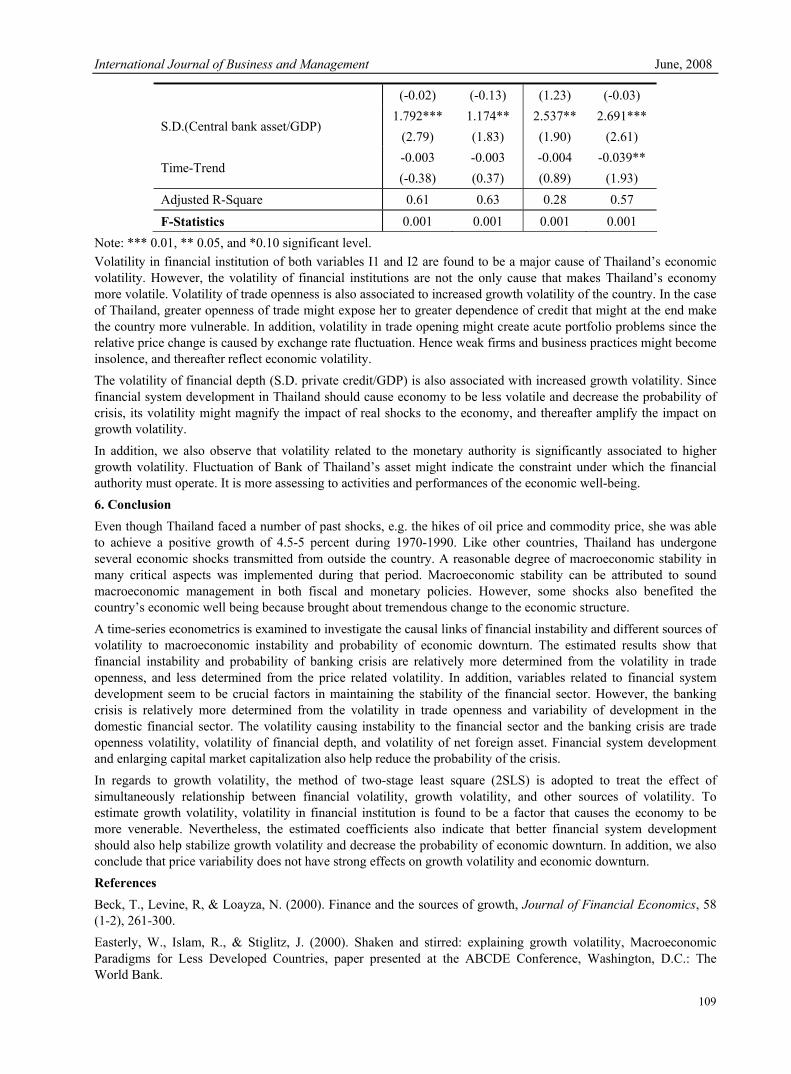
International Journal of Business and Management June, 2008
109
(-0.02) (-0.13) (1.23) (-0.03)
S.D.(Central bank asset/GDP) 1.792***
(2.79) 1.174** (1.83)
2.537** (1.90)
2.691*** (2.61)
Time-Trend -0.003 (-0.38)
-0.003 (0.37)
-0.004 (0.89)
-0.039** (1.93)
Adjusted R-Square 0.61 0.63 0.28 0.57
F-Statistics 0.001 0.001 0.001 0.001 Note: *** 0.01, ** 0.05, and *0.10 significant level. Volatility in financial institution of both variables I1 and I2 are found to be a major cause of Thailand’s economic volatility. However, the volatility of financial institutions are not the only cause that makes Thailand’s economy more volatile. Volatility of trade openness is also associated to increased growth volatility of the country. In the case of Thailand, greater openness of trade might expose her to greater dependence of credit that might at the end make the country more vulnerable. In addition, volatility in trade opening might create acute portfolio problems since the relative price change is caused by exchange rate fluctuation. Hence weak firms and business practices might become insolence, and thereafter reflect economic volatility. The volatility of financial depth (S.D. private credit/GDP) is also associated with increased growth volatility. Since financial system development in Thailand should cause economy to be less volatile and decrease the probability of crisis, its volatility might magnify the impact of real shocks to the economy, and thereafter amplify the impact on growth volatility. In addition, we also observe that volatility related to the monetary authority is significantly associated to higher growth volatility. Fluctuation of Bank of Thailand’s asset might indicate the constraint under which the financial authority must operate. It is more assessing to activities and performances of the economic well-being. 6. Conclusion Even though Thailand faced a number of past shocks, e.g. the hikes of oil price and commodity price, she was able to achieve a positive growth of 4.5-5 percent during 1970-1990. Like other countries, Thailand has undergone several economic shocks transmitted from outside the country. A reasonable degree of macroeconomic stability in many critical aspects was implemented during that period. Macroeconomic stability can be attributed to sound macroeconomic management in both fiscal and monetary policies. However, some shocks also benefited the country’s economic well being because brought about tremendous change to the economic structure. A time-series econometrics is examined to investigate the causal links of financial instability and different sources of volatility to macroeconomic instability and probability of economic downturn. The estimated results show that financial instability and probability of banking crisis are relatively more determined from the volatility in trade openness, and less determined from the price related volatility. In addition, variables related to financial system development seem to be crucial factors in maintaining the stability of the financial sector. However, the banking crisis is relatively more determined from the volatility in trade openness and variability of development in the domestic financial sector. The volatility causing instability to the financial sector and the banking crisis are trade openness volatility, volatility of financial depth, and volatility of net foreign asset. Financial system development and enlarging capital market capitalization also help reduce the probability of the crisis. In regards to growth volatility, the method of two-stage least square (2SLS) is adopted to treat the effect of simultaneously relationship between financial volatility, growth volatility, and other sources of volatility. To estimate growth volatility, volatility in financial institution is found to be a factor that causes the economy to be more venerable. Nevertheless, the estimated coefficients also indicate that better financial system development should also help stabilize growth volatility and decrease the probability of economic downturn. In addition, we also conclude that price variability does not have strong effects on growth volatility and economic downturn. References Beck, T., Levine, R, & Loayza, N. (2000). Finance and the sources of growth, Journal of Financial Economics, 58 (1-2), 261-300. Easterly, W., Islam, R., & Stiglitz, J. (2000). Shaken and stirred: explaining growth volatility, Macroeconomic Paradigms for Less Developed Countries, paper presented at the ABCDE Conference, Washington, D.C.: The World Bank.
Vol. 3, No. 6 International Journal of Business and Management
110
Gelb, A. H. (1989). Financial policies, growth, and efficiency, World Bank Working Paper No.202, Washington, D.C.: The World Bank. Hausmann, R. and Gavin, M. (1996). Securing stability and growth in a shock prone region: The policy challenge for Latin America, Working Paper No.315, The Inter-American Development Bank. King, R. G. & Levine, R. (1993a). Financial intermediation and economic development, In C. Mayer & X. Vives (Eds), Financial Intermediation in the Construction of Europe. (pp.156-189). London: Centre of Economic Policy Research. King, R. G. & Levine, R. (1993b). Finance and growth: Schumpeter might be right, Quarterly Journal of Economics, 33(2), 513-542. King, R. G. & Levine, R. (1993c). Finance, entrepreneurship, and growth: theory and evidence, Journal of Monetary Economics, 32(3), 513-542. Levine, R. (1997). Financial development and economic growth: views and agenda, Journal of Economic Literature, 35(2), 688-726. Levine, R. (1998). The legal environment, banks, and long-run economic growth, Journal of Money, Credit, and Banking, 30(3), 596-613. Pagano, M. (1993). Financial markets and growth: An overview, European Economic Review, 37(2-3), 613-622. Rioja, F. K. and Valev, N. (2004). Does one size fit all: a reexamination of the finance and growth relationship, Journal of Development Economics, 74(2), 429-447. Wolf, H. (2004). Volatility: Definitions and Consequences, World Bank Draft Chapter for Managing Volatility and Crisis: A Practitioner’s Guide, Washington, D.C.: The World Bank.
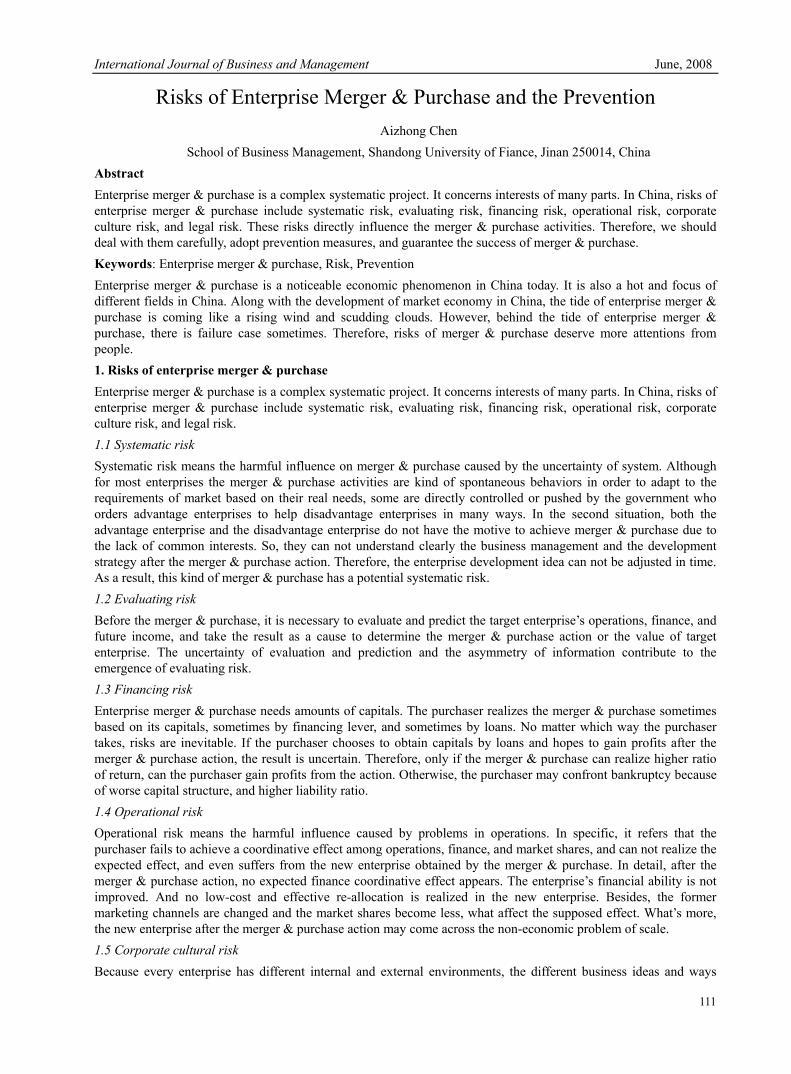
International Journal of Business and Management June, 2008
111
Risks of Enterprise Merger & Purchase and the Prevention Aizhong Chen
School of Business Management, Shandong University of Fiance, Jinan 250014, China Abstract Enterprise merger & purchase is a complex systematic project. It concerns interests of many parts. In China, risks of enterprise merger & purchase include systematic risk, evaluating risk, financing risk, operational risk, corporate culture risk, and legal risk. These risks directly influence the merger & purchase activities. Therefore, we should deal with them carefully, adopt prevention measures, and guarantee the success of merger & purchase. Keywords: Enterprise merger & purchase, Risk, Prevention Enterprise merger & purchase is a noticeable economic phenomenon in China today. It is also a hot and focus of different fields in China. Along with the development of market economy in China, the tide of enterprise merger & purchase is coming like a rising wind and scudding clouds. However, behind the tide of enterprise merger & purchase, there is failure case sometimes. Therefore, risks of merger & purchase deserve more attentions from people. 1. Risks of enterprise merger & purchase Enterprise merger & purchase is a complex systematic project. It concerns interests of many parts. In China, risks of enterprise merger & purchase include systematic risk, evaluating risk, financing risk, operational risk, corporate culture risk, and legal risk. 1.1 Systematic risk Systematic risk means the harmful influence on merger & purchase caused by the uncertainty of system. Although for most enterprises the merger & purchase activities are kind of spontaneous behaviors in order to adapt to the requirements of market based on their real needs, some are directly controlled or pushed by the government who orders advantage enterprises to help disadvantage enterprises in many ways. In the second situation, both the advantage enterprise and the disadvantage enterprise do not have the motive to achieve merger & purchase due to the lack of common interests. So, they can not understand clearly the business management and the development strategy after the merger & purchase action. Therefore, the enterprise development idea can not be adjusted in time. As a result, this kind of merger & purchase has a potential systematic risk. 1.2 Evaluating risk Before the merger & purchase, it is necessary to evaluate and predict the target enterprise’s operations, finance, and future income, and take the result as a cause to determine the merger & purchase action or the value of target enterprise. The uncertainty of evaluation and prediction and the asymmetry of information contribute to the emergence of evaluating risk. 1.3 Financing risk Enterprise merger & purchase needs amounts of capitals. The purchaser realizes the merger & purchase sometimes based on its capitals, sometimes by financing lever, and sometimes by loans. No matter which way the purchaser takes, risks are inevitable. If the purchaser chooses to obtain capitals by loans and hopes to gain profits after the merger & purchase action, the result is uncertain. Therefore, only if the merger & purchase can realize higher ratio of return, can the purchaser gain profits from the action. Otherwise, the purchaser may confront bankruptcy because of worse capital structure, and higher liability ratio. 1.4 Operational risk Operational risk means the harmful influence caused by problems in operations. In specific, it refers that the purchaser fails to achieve a coordinative effect among operations, finance, and market shares, and can not realize the expected effect, and even suffers from the new enterprise obtained by the merger & purchase. In detail, after the merger & purchase action, no expected finance coordinative effect appears. The enterprise’s financial ability is not improved. And no low-cost and effective re-allocation is realized in the new enterprise. Besides, the former marketing channels are changed and the market shares become less, what affect the supposed effect. What’s more, the new enterprise after the merger & purchase action may come across the non-economic problem of scale. 1.5 Corporate cultural risk Because every enterprise has different internal and external environments, the different business ideas and ways
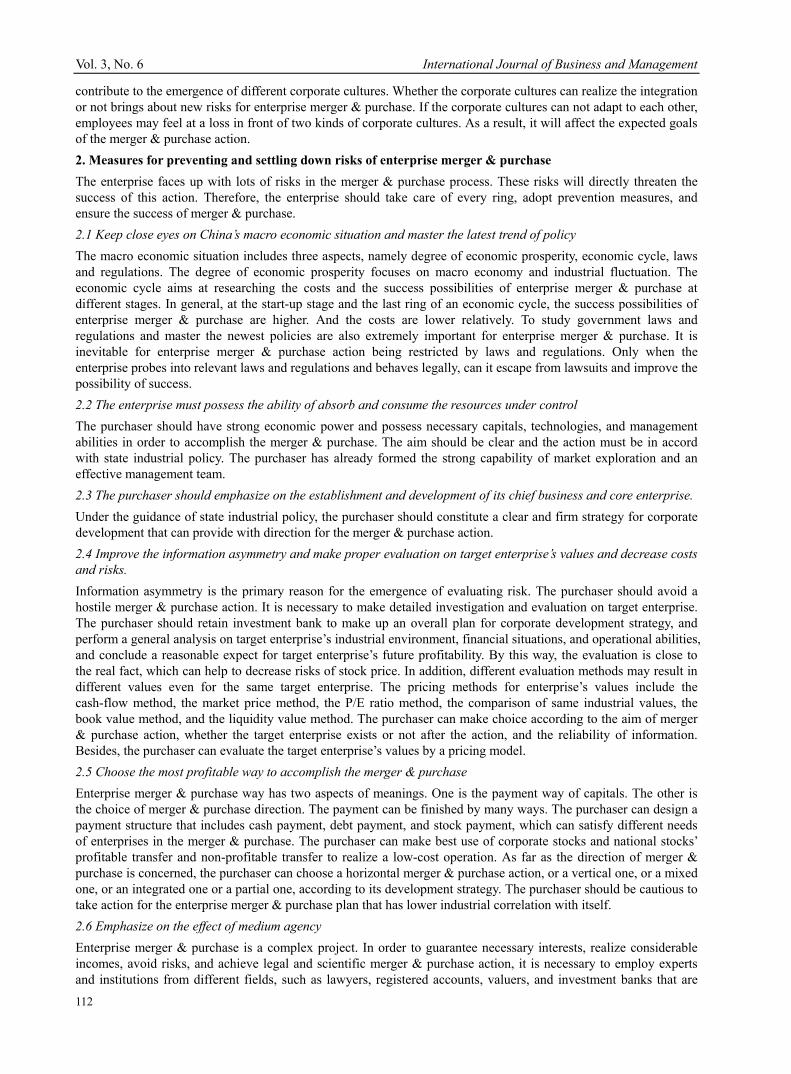
Vol. 3, No. 6 International Journal of Business and Management
112
contribute to the emergence of different corporate cultures. Whether the corporate cultures can realize the integration or not brings about new risks for enterprise merger & purchase. If the corporate cultures can not adapt to each other, employees may feel at a loss in front of two kinds of corporate cultures. As a result, it will affect the expected goals of the merger & purchase action. 2. Measures for preventing and settling down risks of enterprise merger & purchase The enterprise faces up with lots of risks in the merger & purchase process. These risks will directly threaten the success of this action. Therefore, the enterprise should take care of every ring, adopt prevention measures, and ensure the success of merger & purchase. 2.1 Keep close eyes on China’s macro economic situation and master the latest trend of policy The macro economic situation includes three aspects, namely degree of economic prosperity, economic cycle, laws and regulations. The degree of economic prosperity focuses on macro economy and industrial fluctuation. The economic cycle aims at researching the costs and the success possibilities of enterprise merger & purchase at different stages. In general, at the start-up stage and the last ring of an economic cycle, the success possibilities of enterprise merger & purchase are higher. And the costs are lower relatively. To study government laws and regulations and master the newest policies are also extremely important for enterprise merger & purchase. It is inevitable for enterprise merger & purchase action being restricted by laws and regulations. Only when the enterprise probes into relevant laws and regulations and behaves legally, can it escape from lawsuits and improve the possibility of success. 2.2 The enterprise must possess the ability of absorb and consume the resources under control The purchaser should have strong economic power and possess necessary capitals, technologies, and management abilities in order to accomplish the merger & purchase. The aim should be clear and the action must be in accord with state industrial policy. The purchaser has already formed the strong capability of market exploration and an effective management team. 2.3 The purchaser should emphasize on the establishment and development of its chief business and core enterprise. Under the guidance of state industrial policy, the purchaser should constitute a clear and firm strategy for corporate development that can provide with direction for the merger & purchase action. 2.4 Improve the information asymmetry and make proper evaluation on target enterprise’s values and decrease costs and risks. Information asymmetry is the primary reason for the emergence of evaluating risk. The purchaser should avoid a hostile merger & purchase action. It is necessary to make detailed investigation and evaluation on target enterprise. The purchaser should retain investment bank to make up an overall plan for corporate development strategy, and perform a general analysis on target enterprise’s industrial environment, financial situations, and operational abilities, and conclude a reasonable expect for target enterprise’s future profitability. By this way, the evaluation is close to the real fact, which can help to decrease risks of stock price. In addition, different evaluation methods may result in different values even for the same target enterprise. The pricing methods for enterprise’s values include the cash-flow method, the market price method, the P/E ratio method, the comparison of same industrial values, the book value method, and the liquidity value method. The purchaser can make choice according to the aim of merger & purchase action, whether the target enterprise exists or not after the action, and the reliability of information. Besides, the purchaser can evaluate the target enterprise’s values by a pricing model. 2.5 Choose the most profitable way to accomplish the merger & purchase Enterprise merger & purchase way has two aspects of meanings. One is the payment way of capitals. The other is the choice of merger & purchase direction. The payment can be finished by many ways. The purchaser can design a payment structure that includes cash payment, debt payment, and stock payment, which can satisfy different needs of enterprises in the merger & purchase. The purchaser can make best use of corporate stocks and national stocks’ profitable transfer and non-profitable transfer to realize a low-cost operation. As far as the direction of merger & purchase is concerned, the purchaser can choose a horizontal merger & purchase action, or a vertical one, or a mixed one, or an integrated one or a partial one, according to its development strategy. The purchaser should be cautious to take action for the enterprise merger & purchase plan that has lower industrial correlation with itself. 2.6 Emphasize on the effect of medium agency Enterprise merger & purchase is a complex project. In order to guarantee necessary interests, realize considerable incomes, avoid risks, and achieve legal and scientific merger & purchase action, it is necessary to employ experts and institutions from different fields, such as lawyers, registered accounts, valuers, and investment banks that are
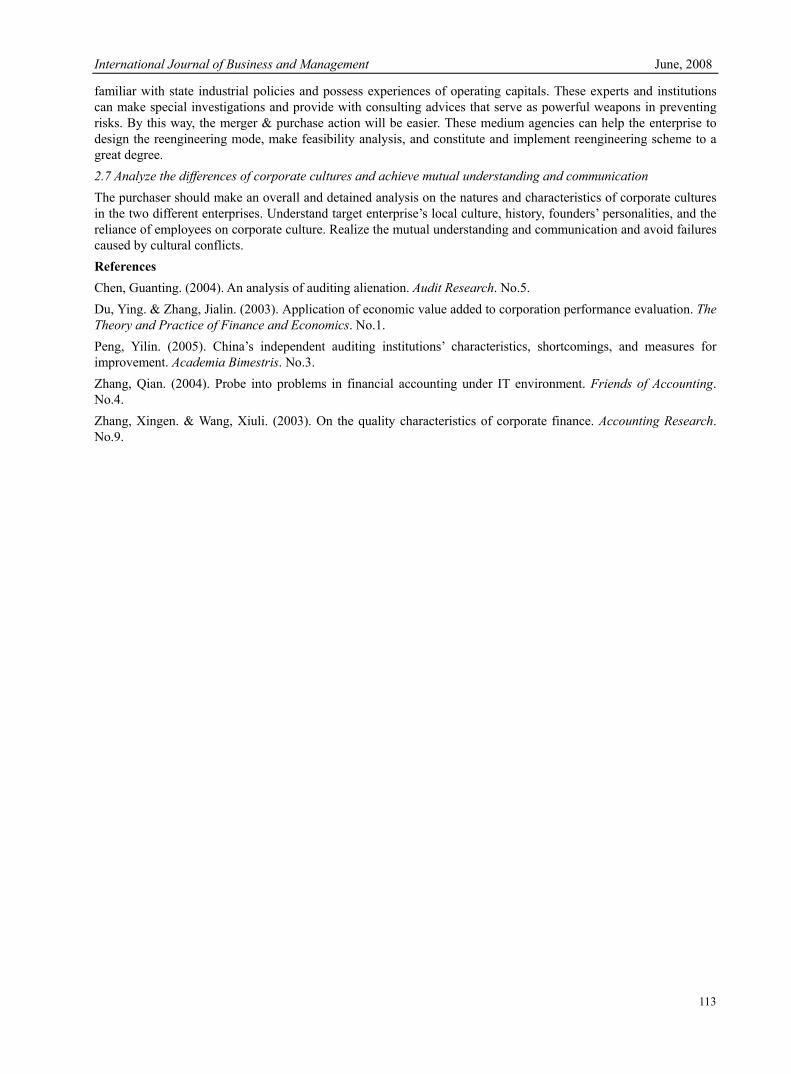
International Journal of Business and Management June, 2008
113
familiar with state industrial policies and possess experiences of operating capitals. These experts and institutions can make special investigations and provide with consulting advices that serve as powerful weapons in preventing risks. By this way, the merger & purchase action will be easier. These medium agencies can help the enterprise to design the reengineering mode, make feasibility analysis, and constitute and implement reengineering scheme to a great degree. 2.7 Analyze the differences of corporate cultures and achieve mutual understanding and communication The purchaser should make an overall and detained analysis on the natures and characteristics of corporate cultures in the two different enterprises. Understand target enterprise’s local culture, history, founders’ personalities, and the reliance of employees on corporate culture. Realize the mutual understanding and communication and avoid failures caused by cultural conflicts. References Chen, Guanting. (2004). An analysis of auditing alienation. Audit Research. No.5. Du, Ying. & Zhang, Jialin. (2003). Application of economic value added to corporation performance evaluation. The Theory and Practice of Finance and Economics. No.1. Peng, Yilin. (2005). China’s independent auditing institutions’ characteristics, shortcomings, and measures for improvement. Academia Bimestris. No.3. Zhang, Qian. (2004). Probe into problems in financial accounting under IT environment. Friends of Accounting. No.4. Zhang, Xingen. & Wang, Xiuli. (2003). On the quality characteristics of corporate finance. Accounting Research. No.9.
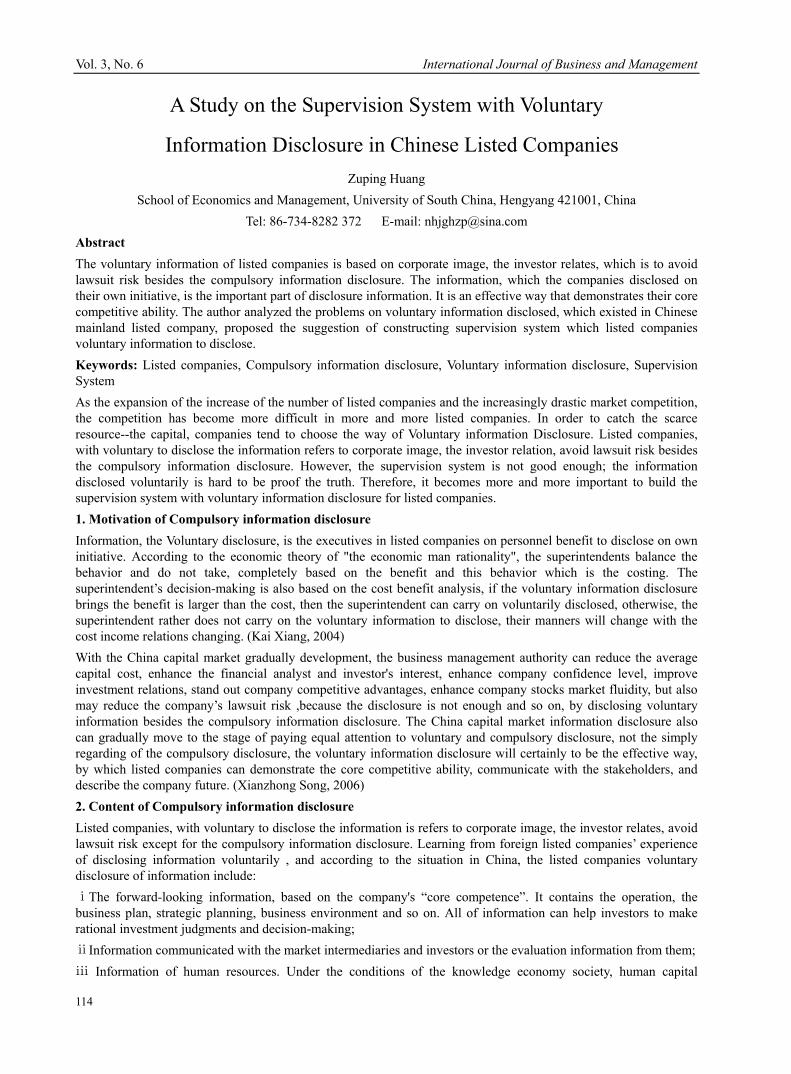
Vol. 3, No. 6 International Journal of Business and Management
114
A Study on the Supervision System with Voluntary
Information Disclosure in Chinese Listed Companies Zuping Huang
School of Economics and Management, University of South China, Hengyang 421001, China Tel: 86-734-8282 372 E-mail: [email protected]
Abstract The voluntary information of listed companies is based on corporate image, the investor relates, which is to avoid lawsuit risk besides the compulsory information disclosure. The information, which the companies disclosed on their own initiative, is the important part of disclosure information. It is an effective way that demonstrates their core competitive ability. The author analyzed the problems on voluntary information disclosed, which existed in Chinese mainland listed company, proposed the suggestion of constructing supervision system which listed companies voluntary information to disclose. Keywords: Listed companies, Compulsory information disclosure, Voluntary information disclosure, Supervision System As the expansion of the increase of the number of listed companies and the increasingly drastic market competition, the competition has become more difficult in more and more listed companies. In order to catch the scarce resource--the capital, companies tend to choose the way of Voluntary information Disclosure. Listed companies, with voluntary to disclose the information refers to corporate image, the investor relation, avoid lawsuit risk besides the compulsory information disclosure. However, the supervision system is not good enough; the information disclosed voluntarily is hard to be proof the truth. Therefore, it becomes more and more important to build the supervision system with voluntary information disclosure for listed companies. 1. Motivation of Compulsory information disclosure Information, the Voluntary disclosure, is the executives in listed companies on personnel benefit to disclose on own initiative. According to the economic theory of "the economic man rationality", the superintendents balance the behavior and do not take, completely based on the benefit and this behavior which is the costing. The superintendent’s decision-making is also based on the cost benefit analysis, if the voluntary information disclosure brings the benefit is larger than the cost, then the superintendent can carry on voluntarily disclosed, otherwise, the superintendent rather does not carry on the voluntary information to disclose, their manners will change with the cost income relations changing. (Kai Xiang, 2004)
With the China capital market gradually development, the business management authority can reduce the average capital cost, enhance the financial analyst and investor's interest, enhance company confidence level, improve investment relations, stand out company competitive advantages, enhance company stocks market fluidity, but also may reduce the company’s lawsuit risk ,because the disclosure is not enough and so on, by disclosing voluntary information besides the compulsory information disclosure. The China capital market information disclosure also can gradually move to the stage of paying equal attention to voluntary and compulsory disclosure, not the simply regarding of the compulsory disclosure, the voluntary information disclosure will certainly to be the effective way, by which listed companies can demonstrate the core competitive ability, communicate with the stakeholders, and describe the company future. (Xianzhong Song, 2006) 2. Content of Compulsory information disclosure Listed companies, with voluntary to disclose the information is refers to corporate image, the investor relates, avoid lawsuit risk except for the compulsory information disclosure. Learning from foreign listed companies’ experience of disclosing information voluntarily , and according to the situation in China, the listed companies voluntary disclosure of information include: ⅰThe forward-looking information, based on the company's “core competence”. It contains the operation, the business plan, strategic planning, business environment and so on. All of information can help investors to make rational investment judgments and decision-making; ⅱInformation communicated with the market intermediaries and investors or the evaluation information from them; ⅲ Information of human resources. Under the conditions of the knowledge economy society, human capital
International Journal of Business and Management June, 2008
115
becomes more and more important. Particularly in the high tech, high-growth companies, employees are the company's most valuable asset. Research shows that these companies were significantly better than other companies, in the above-mentioned aspects of the voluntary disclosure of information; ⅳ According to the accounting standards of the conservative principles, there is also lack of proper disclosure rules or low in requirements disclosure, which is useful for the investment decision-making, such as fair value; ⅴ Corporate governance, environmental protection and social responsibility do not have mandatory disclosure information, because of complexity from the measurement and disclosure (Derong Zhang, 2004). 3. Main problems exist in Compulsory information disclosure 3.1 Low Voluntary Disclosure Rate and low initiative A number of listed companies regard voluntary disclosure of information as an additional burden, rather than a kind of obligation or the right, which should be given to the shareholders. Thus they will be passive to disclose the information, that’s to say, they will take less disclosure as less as possible. With time going by, the concept of this understanding is accepted by people, so that the deviation in the information disclosure makes listed companies in a passive response. The main reason is that the listed company is too worry to tell the public the secret in its management, and thus the disclosure of information creates a psychological fear and evasive to them. 3.2 Lack of integrity of Voluntary information disclosure Today, Chinese listed companies’ practice of disclosing information voluntarily is not satisfactory. Many listed companies are reluctant to disclose, and some listed companies only disclose the company's financial information; but the "bad news" or involved matters with a certain risk, or other seriously matters, the companies are kept silent. Moreover, many listed companies do not disclose fully credibility, hoping the investors rely on the “popular”, then to help them succeed .Chinese investors are not maturity, particularly in the processing, handling and analyzing information. Therefore, it is very difficult to judge the value of the company through the signal transferred by the company. 3.3 The voluntary disclosure of false information Generally speaking, the voluntary information disclosure has high credibility. To the non-mandatory requirements information, managers often disclose the less likely to lead to the disclosure of risk information for reducing the risk of litigation and avoiding legal sanctions. In addition, the main motive of high-quality enterprises disclosing the information to the investors is to convey the signal quality of enterprises, so as to reduce monitoring costs. Voluntary information disclosure generally has higher quality. However, the absence of mandatory disclosure is as strict guidelines as regulate, and authorities have the tendency of opportunism, prone to the problem of moral hazard. What’s more, the poor quality of the enterprises are based on the theory of signal transduction, transmission of false information, the voluntary disclosure of information is not the same to the mandatory information , as to undergo a rigorous audit. And voluntary disclosure of information is difficult to guarantee the quality. 3.4 Content of voluntary information disclosure is not standard At present, mainly Chinese listed companies are the compulsory disclosure of information, and voluntary disclosure of information in some documents are scattered, in reality, Chinese listed companies ,disclosing voluntarily information, can not meet regulators, securities analysts and investors demand regardless of content or quality. Chinese listed companies in the voluntary disclosure of information content norms. The China Securities Regulatory Commission issued the "public offerings stock, the disclosure of corporate information content and format standards" of the relevant provisions of 1-6 in the annotated "Open-here," although voluntary disclosure of information to the left of the room, but the lack of specific guidelines and the corresponding policy support, the overall level of the listed companies to disclose information voluntarily is low. Therefore, Chinese voluntary disclosure of information is worthy of paying attention and needs to be solved. 4. Improve Supervision System of Voluntary information Disclosure in listed companies As growing competition of capital in the market and the gradually standardization of legal system, there will be a growing trend of voluntary information disclosure for adapt with the complex and ever-changing and highly uncertain economic environment. For the problems existing in Chinese listed companies voluntary information disclosure, and learning from the practical experience on foreign listed companies, the author makes the following recommendations: 4.1 Actively encourage and protect listed companies voluntarily disclose information With the gradually maturation of Chinese capital market, on the basis of the management company completing the mandatory disclosure of information provided voluntary disclosure of information. Therefore, the regulatory
Vol. 3, No. 6 International Journal of Business and Management
116
departments should encourage listed companies to voluntary disclosure of information, add clauses in the policies and regulations, encourage listed companies to disclose the voluntary information besides existing laws, regulations and rules, meet the investors’ growing demands. At the same time, in order to avoid some of the company's management should not be faced litigation risk and other problems, regulators need to study and formulate relevant policies for the company's voluntary disclosure of information act to protect them. "Deliberate manipulation" and "accidental factors" belong to different nature of the situations and treat them differently. It should investigate the law liability to parties in the first case. Otherwise, only the listed companies have adequate evidences and can explain reasonably, don’t look into their liability. 4.2 Strengthen supervising and managing prevent to disclose the false information at will and protect the market order Once the voluntary disclosure information published, it must accept the essential surveillance and the restraint equally with the compulsory disclosure information. But voluntary information disclosure is still lack essential surveillance rules currently, should establish a set of voluntary information disclosure supervising and managing system, standard voluntary information quality. For example: to establish voluntary information assurance and compensation system, to perform the heavy fine to the enterprise which misleads the investor and so on. The negotiable securities supervising and managing department and the Exchanges should strengthen supervising and managing to voluntary information disclosure market, prevent to disclose the false information at will, protects the market order. The voluntary information disclosure supervising and managing should contain following several aspects: First, integrity, listed companies voluntarily disclose of the information are both "positive" information, also includes the "negative" information; Second, systemic, whether listed companies from different angles, through various information disclosure to reveal the same, whether formed a distinctive pattern of voluntary disclosure of information; Third, dynamic, long-term voluntary listed companies to disclose certain information, and constantly adjusted to improve the reliability of information; Fourth, widespread, as long as all investors equal access to all listed companies to voluntarily disclose information; Fifth, the comparative, whether the compulsory information disclosure is mandatory or not, it can be the standards of judgment for the quality of reference standards. 4.3 Giving full attention to the role of market intermediaries to establish the authority of the disclosure of company information quality evaluation system Listed companies should strengthen communication with institutional investors, brokers, securities analysts and other market intermediaries. Understanding the company's external information needs to reduce the company's asymmetric information through voluntary disclosure of information. Giving full attention to the role of market intermediaries, establish the listed company disclosure information quality evaluation system by market intermediaries. Acts according to the specialized knowledge and after the company interior information full understanding and the analysis by the market facilitating agency which it has makes the omni-directional appraisal opinion, regularly promotes voluntary information disclosure quality rating results, provides certain authority to information disclosure quality appraisal opinion for the investor, shows the risk by the police which the ordinary investor possibly can face. (HongYin, 2004). 4.4 Strengthen CPA audit to voluntary disclosure of information CPA audit is an independent, objective and impartial system, it can ensure the credibility of the accounting information. Voluntary Information is provided by the authorities. With speculative risks, the authenticity and reliability of voluntary information should be tested by certified public accountant. Although the audit of voluntary information is not as strict as the mandatory information, it should also have forensic capabilities by registered accountants carrying out the necessary scrutiny, to improve and guarantee the credibility of its information. Therefore, it is necessary to formulate and improve audit rules on voluntary disclosure of information, and to increase violation of professional ethics or legal responsibility for the responsibility of a certified public accountant. 4.5 Introduction of voluntary disclosure of information regulatory documents On a global scale, the voluntary disclosure of information is an irresistible trend of development. With the increasing speed of the change of the economic environment, the requirement for the accounting information relevant are higher and higher, by the extraneous user, the existing compulsory disclosure information will be inevitably difficult to satisfy their information need. Therefore, the extraneous information user on the existence to the business
International Journal of Business and Management June, 2008
117
management authority disclosed voluntarily some information help policy-making the demand. We believed that, every the one which does not fall in the scope of the compulsory information disclosure content stipulation, and be helpful to the benefit counterparts to the policy-making information, all may be defined as the voluntary information disclosure. United States Financial Accounting Standards Board (FASB) in 2001 on the voluntary disclosure of the contents of information provides as follows: "operational data, the analysis of the data management, and forward-looking information, relating to the management and shareholders of the information, not be confirmed in statements of intangible assets". Therefore, China should and must make a comprehensive and in-depth investigation for stakeholder information needs, and model the frame which the Stering committee proposed in FASB, namely confirmed some information is whether useful, by this to decide to provide the information or not, and standardize the content of the information disclosure. When the accounting standard setters sector and the securities regulatory departments are in the formulation of policies and programs should take into account that how to guide enterprises to carry out some of the disclosure of private information, and the securities regulatory departments should be introduced listed companies to disclose information voluntarily charter guidelines as soon as possible, to encourage and regulate listed companies voluntarily information disclosure. References Kai Xiang. (2004). Listed companies to disclose information voluntarily Cause of Economic Analysis of the. Accounting Communications, (5). Xianzhong Song. (2006). Enterprise core competencies of the voluntary disclosure of information. Accounting Research, (2) Derong Zhang. (2004). Enterprise voluntary disclosure of information. Accounting Digest, (1) HongYin. (2004). Optimization of China's listed companies Opinion on voluntary disclosure of information. Accounting Digest, (6)
Vol. 3, No. 6 International Journal of Business and Management
118
Does the Current Position of Women in the Labour Market in
Asia Pacific Countries Signal an End to Gender Inequality? Liang Cong
Human Resource Management, Business School, Leeds University Shanghai 200093, China
E-mail: [email protected] Abstract This article aims to prove that gender inequality still exists and is likely to remain in the region of Asia Pacific countries. In the first part, it will consider the data on three perspectives which are participation, wages and occupational composition of employment for women in order to understand the current situation of women employment. In the second part, it will focus on China and Japan to analyze which blocks women in management. In the third part, it will outline a couple of barriers to gender equality in the Asia Pacific. Finally, it will provide ideas which may reduce the gender discrimination in Asia Pacific area and conclude that gender inequality in the Asia Pacific region is still ongoing. Keywords: Gender inequality, Women, Labour market, Asia Pacific countries 1. Introduction Asia has undergone economic developments in the past two decades. The rapid growth of economies may have had some impacts on women’s promotion to management and their progress in this role. Women’s participations in the labour force and employment have risen in most developed countries, also in the Asian countries. Does it mean that women’s lives have been improved or women’s status has risen? Is that true that gender inequalities will disappear in the future? During the last decade, many theories of gender inequalities have developed. Some orthodox theories imply that gender inequalities will be short-term. Such as the Statistical Discrimination theory (Phelps, 1972), which did not give any hope for improvement, indicating that the situation could not be changed until women’s length of service reached the level of men. But they have shortcomings. For example, most of them fail to explain why discrimination may occur. However, there are other theories such as institutional and feminist theories suggesting that cultural and institutional factors would result in gender inequalities in the long-run. The Marxist-Feminist approach contributed significantly to understanding the structural cause for discrimination, unfair treatment. Nevertheless, neither ‘patriarchy’ nor ‘capitalism’ can be easily taken away. (Yuasa, 2005, p195) Those theories such as Feminist models and organizational theory stress the importance of institutions and the sexual division of labour in shaping women’s consciousness which are a deep-rooted cultural phenomenon. (Forde, 2007) 2. Trend of Women and Employment in the Asia Pacific Region The current situation of women employment can be seen in terms of participation, pay levels and occupational segregation. The relative data can be found in Global Employment Trends for Women (ILO 2004, in Ford 2007). Firstly, female participation in labour market has increased in recent years across the world, including Asia. According to the statistic figure of ILO (2004), little or no change in female participate rate happened in East Asia, and female participate rate in South-East Asia and South Asia increased. The growing proportion of women in the labour force result to the decrease of participate rate of man. But the gap between the sexes in terms of labour force participation still exists. Secondly, female and male wage ratios for the Asian countries studied in the paper of Labour Statistics (Forde, 2007) indicate the gender wage gap. There is no close relationship between economic development and female relative earnings. Women in Japan and Korea seem to earn the last relative to their male counterparts, whereas women in China seem to have the highest relative earnings. Women in South-Korea and Japan earned about 54 and 50 percent of the respective male rate of pay in 1990. Moreover, women not only earn less than men, they also tend to own fewer assets. Thirdly, women in Asia are mainly distributed in clerical and service occupations and relatively highly concentrate in professional occupations such teaching and nursing. But there are very few proportions in managerial occupations. Recently, proportion of women in professional and managerial positions has risen. In the collection of Benson and
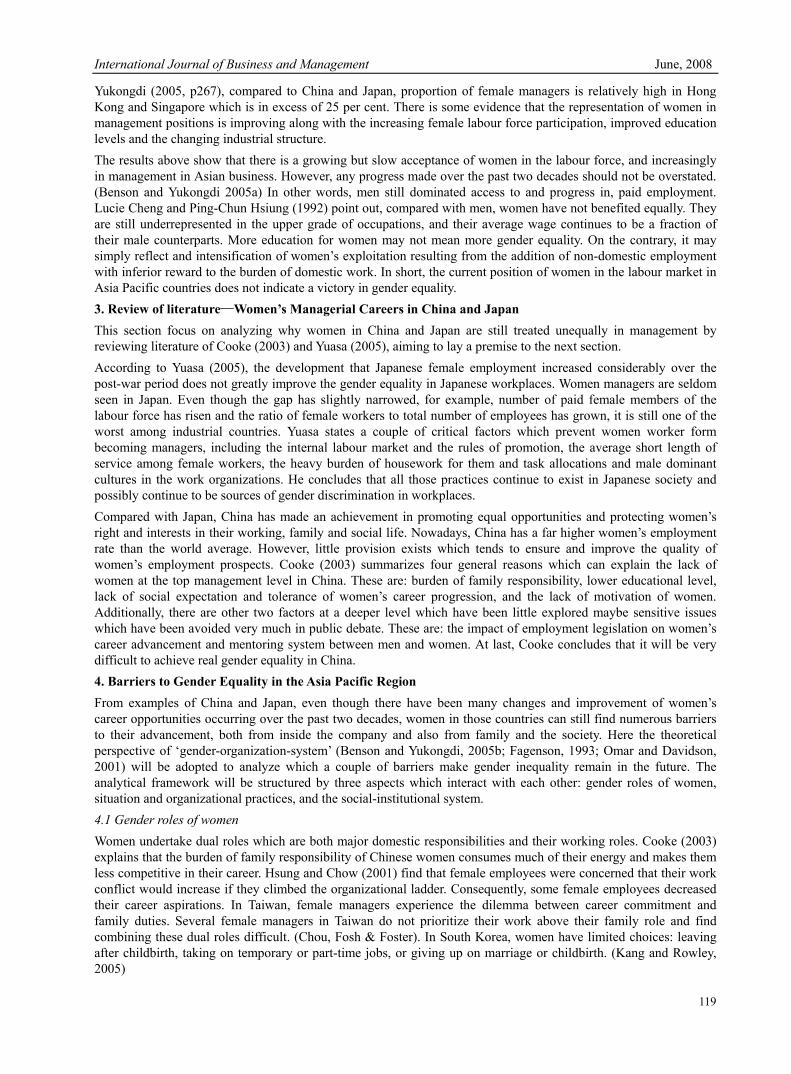
International Journal of Business and Management June, 2008
119
Yukongdi (2005, p267), compared to China and Japan, proportion of female managers is relatively high in Hong Kong and Singapore which is in excess of 25 per cent. There is some evidence that the representation of women in management positions is improving along with the increasing female labour force participation, improved education levels and the changing industrial structure. The results above show that there is a growing but slow acceptance of women in the labour force, and increasingly in management in Asian business. However, any progress made over the past two decades should not be overstated. (Benson and Yukongdi 2005a) In other words, men still dominated access to and progress in, paid employment. Lucie Cheng and Ping-Chun Hsiung (1992) point out, compared with men, women have not benefited equally. They are still underrepresented in the upper grade of occupations, and their average wage continues to be a fraction of their male counterparts. More education for women may not mean more gender equality. On the contrary, it may simply reflect and intensification of women’s exploitation resulting from the addition of non-domestic employment with inferior reward to the burden of domestic work. In short, the current position of women in the labour market in Asia Pacific countries does not indicate a victory in gender equality. 3. Review of literature—Women’s Managerial Careers in China and Japan This section focus on analyzing why women in China and Japan are still treated unequally in management by reviewing literature of Cooke (2003) and Yuasa (2005), aiming to lay a premise to the next section. According to Yuasa (2005), the development that Japanese female employment increased considerably over the post-war period does not greatly improve the gender equality in Japanese workplaces. Women managers are seldom seen in Japan. Even though the gap has slightly narrowed, for example, number of paid female members of the labour force has risen and the ratio of female workers to total number of employees has grown, it is still one of the worst among industrial countries. Yuasa states a couple of critical factors which prevent women worker form becoming managers, including the internal labour market and the rules of promotion, the average short length of service among female workers, the heavy burden of housework for them and task allocations and male dominant cultures in the work organizations. He concludes that all those practices continue to exist in Japanese society and possibly continue to be sources of gender discrimination in workplaces. Compared with Japan, China has made an achievement in promoting equal opportunities and protecting women’s right and interests in their working, family and social life. Nowadays, China has a far higher women’s employment rate than the world average. However, little provision exists which tends to ensure and improve the quality of women’s employment prospects. Cooke (2003) summarizes four general reasons which can explain the lack of women at the top management level in China. These are: burden of family responsibility, lower educational level, lack of social expectation and tolerance of women’s career progression, and the lack of motivation of women. Additionally, there are other two factors at a deeper level which have been little explored maybe sensitive issues which have been avoided very much in public debate. These are: the impact of employment legislation on women’s career advancement and mentoring system between men and women. At last, Cooke concludes that it will be very difficult to achieve real gender equality in China. 4. Barriers to Gender Equality in the Asia Pacific Region From examples of China and Japan, even though there have been many changes and improvement of women’s career opportunities occurring over the past two decades, women in those countries can still find numerous barriers to their advancement, both from inside the company and also from family and the society. Here the theoretical perspective of ‘gender-organization-system’ (Benson and Yukongdi, 2005b; Fagenson, 1993; Omar and Davidson, 2001) will be adopted to analyze which a couple of barriers make gender inequality remain in the future. The analytical framework will be structured by three aspects which interact with each other: gender roles of women, situation and organizational practices, and the social-institutional system. 4.1 Gender roles of women Women undertake dual roles which are both major domestic responsibilities and their working roles. Cooke (2003) explains that the burden of family responsibility of Chinese women consumes much of their energy and makes them less competitive in their career. Hsung and Chow (2001) find that female employees were concerned that their work conflict would increase if they climbed the organizational ladder. Consequently, some female employees decreased their career aspirations. In Taiwan, female managers experience the dilemma between career commitment and family duties. Several female managers in Taiwan do not prioritize their work above their family role and find combining these dual roles difficult. (Chou, Fosh & Foster). In South Korea, women have limited choices: leaving after childbirth, taking on temporary or part-time jobs, or giving up on marriage or childbirth. (Kang and Rowley, 2005)
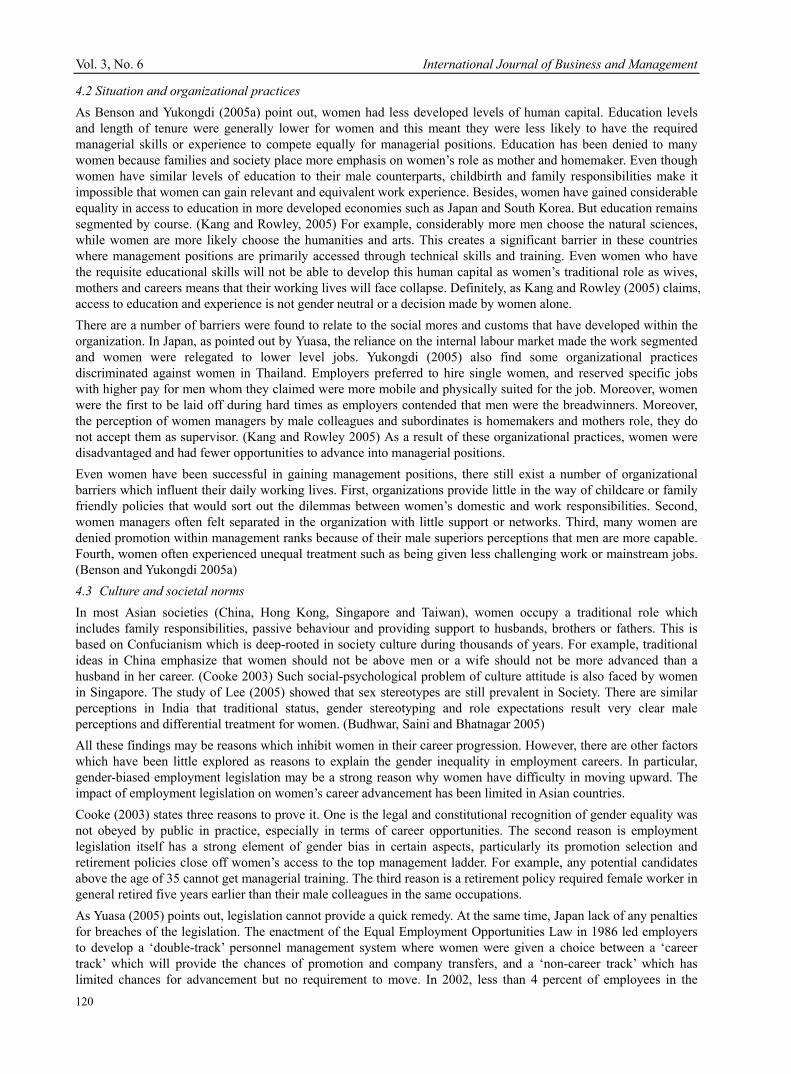
Vol. 3, No. 6 International Journal of Business and Management
120
4.2 Situation and organizational practices As Benson and Yukongdi (2005a) point out, women had less developed levels of human capital. Education levels and length of tenure were generally lower for women and this meant they were less likely to have the required managerial skills or experience to compete equally for managerial positions. Education has been denied to many women because families and society place more emphasis on women’s role as mother and homemaker. Even though women have similar levels of education to their male counterparts, childbirth and family responsibilities make it impossible that women can gain relevant and equivalent work experience. Besides, women have gained considerable equality in access to education in more developed economies such as Japan and South Korea. But education remains segmented by course. (Kang and Rowley, 2005) For example, considerably more men choose the natural sciences, while women are more likely choose the humanities and arts. This creates a significant barrier in these countries where management positions are primarily accessed through technical skills and training. Even women who have the requisite educational skills will not be able to develop this human capital as women’s traditional role as wives, mothers and careers means that their working lives will face collapse. Definitely, as Kang and Rowley (2005) claims, access to education and experience is not gender neutral or a decision made by women alone. There are a number of barriers were found to relate to the social mores and customs that have developed within the organization. In Japan, as pointed out by Yuasa, the reliance on the internal labour market made the work segmented and women were relegated to lower level jobs. Yukongdi (2005) also find some organizational practices discriminated against women in Thailand. Employers preferred to hire single women, and reserved specific jobs with higher pay for men whom they claimed were more mobile and physically suited for the job. Moreover, women were the first to be laid off during hard times as employers contended that men were the breadwinners. Moreover, the perception of women managers by male colleagues and subordinates is homemakers and mothers role, they do not accept them as supervisor. (Kang and Rowley 2005) As a result of these organizational practices, women were disadvantaged and had fewer opportunities to advance into managerial positions. Even women have been successful in gaining management positions, there still exist a number of organizational barriers which influent their daily working lives. First, organizations provide little in the way of childcare or family friendly policies that would sort out the dilemmas between women’s domestic and work responsibilities. Second, women managers often felt separated in the organization with little support or networks. Third, many women are denied promotion within management ranks because of their male superiors perceptions that men are more capable. Fourth, women often experienced unequal treatment such as being given less challenging work or mainstream jobs. (Benson and Yukongdi 2005a) 4.3 Culture and societal norms In most Asian societies (China, Hong Kong, Singapore and Taiwan), women occupy a traditional role which includes family responsibilities, passive behaviour and providing support to husbands, brothers or fathers. This is based on Confucianism which is deep-rooted in society culture during thousands of years. For example, traditional ideas in China emphasize that women should not be above men or a wife should not be more advanced than a husband in her career. (Cooke 2003) Such social-psychological problem of culture attitude is also faced by women in Singapore. The study of Lee (2005) showed that sex stereotypes are still prevalent in Society. There are similar perceptions in India that traditional status, gender stereotyping and role expectations result very clear male perceptions and differential treatment for women. (Budhwar, Saini and Bhatnagar 2005) All these findings may be reasons which inhibit women in their career progression. However, there are other factors which have been little explored as reasons to explain the gender inequality in employment careers. In particular, gender-biased employment legislation may be a strong reason why women have difficulty in moving upward. The impact of employment legislation on women’s career advancement has been limited in Asian countries. Cooke (2003) states three reasons to prove it. One is the legal and constitutional recognition of gender equality was not obeyed by public in practice, especially in terms of career opportunities. The second reason is employment legislation itself has a strong element of gender bias in certain aspects, particularly its promotion selection and retirement policies close off women’s access to the top management ladder. For example, any potential candidates above the age of 35 cannot get managerial training. The third reason is a retirement policy required female worker in general retired five years earlier than their male colleagues in the same occupations. As Yuasa (2005) points out, legislation cannot provide a quick remedy. At the same time, Japan lack of any penalties for breaches of the legislation. The enactment of the Equal Employment Opportunities Law in 1986 led employers to develop a ‘double-track’ personnel management system where women were given a choice between a ‘career track’ which will provide the chances of promotion and company transfers, and a ‘non-career track’ which has limited chances for advancement but no requirement to move. In 2002, less than 4 percent of employees in the
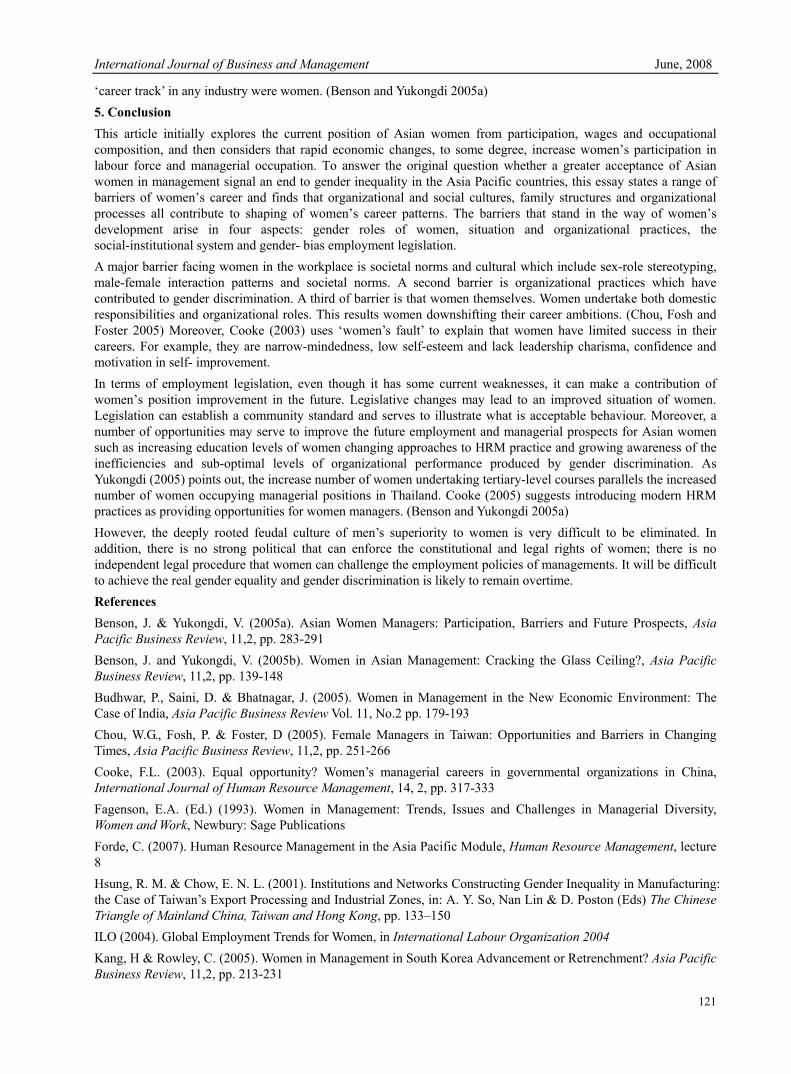
International Journal of Business and Management June, 2008
121
‘career track’ in any industry were women. (Benson and Yukongdi 2005a) 5. Conclusion This article initially explores the current position of Asian women from participation, wages and occupational composition, and then considers that rapid economic changes, to some degree, increase women’s participation in labour force and managerial occupation. To answer the original question whether a greater acceptance of Asian women in management signal an end to gender inequality in the Asia Pacific countries, this essay states a range of barriers of women’s career and finds that organizational and social cultures, family structures and organizational processes all contribute to shaping of women’s career patterns. The barriers that stand in the way of women’s development arise in four aspects: gender roles of women, situation and organizational practices, the social-institutional system and gender- bias employment legislation. A major barrier facing women in the workplace is societal norms and cultural which include sex-role stereotyping, male-female interaction patterns and societal norms. A second barrier is organizational practices which have contributed to gender discrimination. A third of barrier is that women themselves. Women undertake both domestic responsibilities and organizational roles. This results women downshifting their career ambitions. (Chou, Fosh and Foster 2005) Moreover, Cooke (2003) uses ‘women’s fault’ to explain that women have limited success in their careers. For example, they are narrow-mindedness, low self-esteem and lack leadership charisma, confidence and motivation in self- improvement. In terms of employment legislation, even though it has some current weaknesses, it can make a contribution of women’s position improvement in the future. Legislative changes may lead to an improved situation of women. Legislation can establish a community standard and serves to illustrate what is acceptable behaviour. Moreover, a number of opportunities may serve to improve the future employment and managerial prospects for Asian women such as increasing education levels of women changing approaches to HRM practice and growing awareness of the inefficiencies and sub-optimal levels of organizational performance produced by gender discrimination. As Yukongdi (2005) points out, the increase number of women undertaking tertiary-level courses parallels the increased number of women occupying managerial positions in Thailand. Cooke (2005) suggests introducing modern HRM practices as providing opportunities for women managers. (Benson and Yukongdi 2005a) However, the deeply rooted feudal culture of men’s superiority to women is very difficult to be eliminated. In addition, there is no strong political that can enforce the constitutional and legal rights of women; there is no independent legal procedure that women can challenge the employment policies of managements. It will be difficult to achieve the real gender equality and gender discrimination is likely to remain overtime. References Benson, J. & Yukongdi, V. (2005a). Asian Women Managers: Participation, Barriers and Future Prospects, Asia Pacific Business Review, 11,2, pp. 283-291 Benson, J. and Yukongdi, V. (2005b). Women in Asian Management: Cracking the Glass Ceiling?, Asia Pacific Business Review, 11,2, pp. 139-148 Budhwar, P., Saini, D. & Bhatnagar, J. (2005). Women in Management in the New Economic Environment: The Case of India, Asia Pacific Business Review Vol. 11, No.2 pp. 179-193 Chou, W.G., Fosh, P. & Foster, D (2005). Female Managers in Taiwan: Opportunities and Barriers in Changing Times, Asia Pacific Business Review, 11,2, pp. 251-266 Cooke, F.L. (2003). Equal opportunity? Women’s managerial careers in governmental organizations in China, International Journal of Human Resource Management, 14, 2, pp. 317-333 Fagenson, E.A. (Ed.) (1993). Women in Management: Trends, Issues and Challenges in Managerial Diversity, Women and Work, Newbury: Sage Publications Forde, C. (2007). Human Resource Management in the Asia Pacific Module, Human Resource Management, lecture 8 Hsung, R. M. & Chow, E. N. L. (2001). Institutions and Networks Constructing Gender Inequality in Manufacturing: the Case of Taiwan’s Export Processing and Industrial Zones, in: A. Y. So, Nan Lin & D. Poston (Eds) The Chinese Triangle of Mainland China, Taiwan and Hong Kong, pp. 133–150 ILO (2004). Global Employment Trends for Women, in International Labour Organization 2004 Kang, H & Rowley, C. (2005). Women in Management in South Korea Advancement or Retrenchment? Asia Pacific Business Review, 11,2, pp. 213-231

Vol. 3, No. 6 International Journal of Business and Management
122
Lucie Cheng & Ping-Chun Hsiung (1992). Women, Export-Oriented Growth, and the State: The Case of TaiWan, in Appelbaum R.P. & Henderson J. (eds). States and Development in the Asian Pacific Rim, Sage, London Omar, A. & Davidson, M. J. (2001). Women in management: a comparative cross-cultural overview, Cross Cultural Management, 8 (3/4), pp. 35-97 Phelps, E. S. (1972). The statistical theory of racism and sexism, American Economic Review Yuasa, M (2005). Japanese Women in Management: getting closer to ‘Realities’ in Japan’, Asia Pacific Business Review, 11,2, pp. 195-211 Yukongdi, V. (2005). Women in Management in Thailand: Advancement and Prospects, Asia Pacific Business Review, Vol. 11, No.2, pp. 267-281
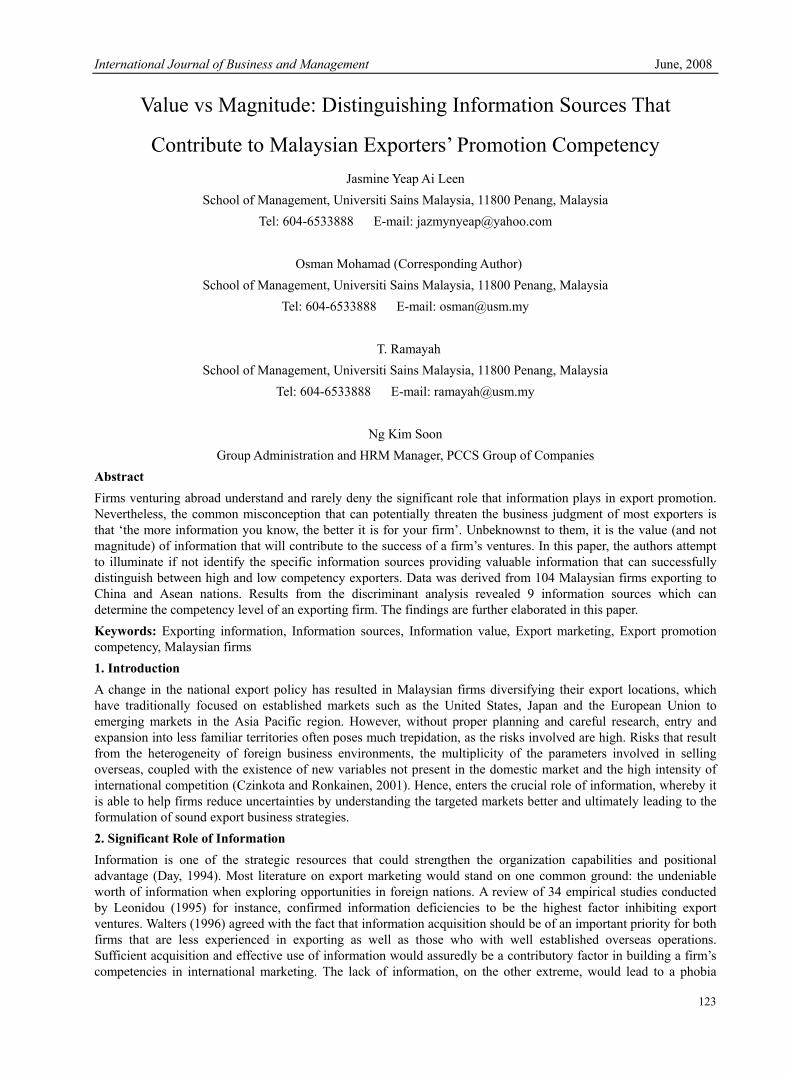
International Journal of Business and Management June, 2008
123
Value vs Magnitude: Distinguishing Information Sources That
Contribute to Malaysian Exporters’ Promotion Competency Jasmine Yeap Ai Leen
School of Management, Universiti Sains Malaysia, 11800 Penang, Malaysia Tel: 604-6533888 E-mail: [email protected]
Osman Mohamad (Corresponding Author)
School of Management, Universiti Sains Malaysia, 11800 Penang, Malaysia Tel: 604-6533888 E-mail: [email protected]
T. Ramayah
School of Management, Universiti Sains Malaysia, 11800 Penang, Malaysia Tel: 604-6533888 E-mail: [email protected]
Ng Kim Soon
Group Administration and HRM Manager, PCCS Group of Companies Abstract Firms venturing abroad understand and rarely deny the significant role that information plays in export promotion. Nevertheless, the common misconception that can potentially threaten the business judgment of most exporters is that ‘the more information you know, the better it is for your firm’. Unbeknownst to them, it is the value (and not magnitude) of information that will contribute to the success of a firm’s ventures. In this paper, the authors attempt to illuminate if not identify the specific information sources providing valuable information that can successfully distinguish between high and low competency exporters. Data was derived from 104 Malaysian firms exporting to China and Asean nations. Results from the discriminant analysis revealed 9 information sources which can determine the competency level of an exporting firm. The findings are further elaborated in this paper. Keywords: Exporting information, Information sources, Information value, Export marketing, Export promotion competency, Malaysian firms 1. Introduction A change in the national export policy has resulted in Malaysian firms diversifying their export locations, which have traditionally focused on established markets such as the United States, Japan and the European Union to emerging markets in the Asia Pacific region. However, without proper planning and careful research, entry and expansion into less familiar territories often poses much trepidation, as the risks involved are high. Risks that result from the heterogeneity of foreign business environments, the multiplicity of the parameters involved in selling overseas, coupled with the existence of new variables not present in the domestic market and the high intensity of international competition (Czinkota and Ronkainen, 2001). Hence, enters the crucial role of information, whereby it is able to help firms reduce uncertainties by understanding the targeted markets better and ultimately leading to the formulation of sound export business strategies. 2. Significant Role of Information Information is one of the strategic resources that could strengthen the organization capabilities and positional advantage (Day, 1994). Most literature on export marketing would stand on one common ground: the undeniable worth of information when exploring opportunities in foreign nations. A review of 34 empirical studies conducted by Leonidou (1995) for instance, confirmed information deficiencies to be the highest factor inhibiting export ventures. Walters (1996) agreed with the fact that information acquisition should be of an important priority for both firms that are less experienced in exporting as well as those who with well established overseas operations. Sufficient acquisition and effective use of information would assuredly be a contributory factor in building a firm’s competencies in international marketing. The lack of information, on the other extreme, would lead to a phobia
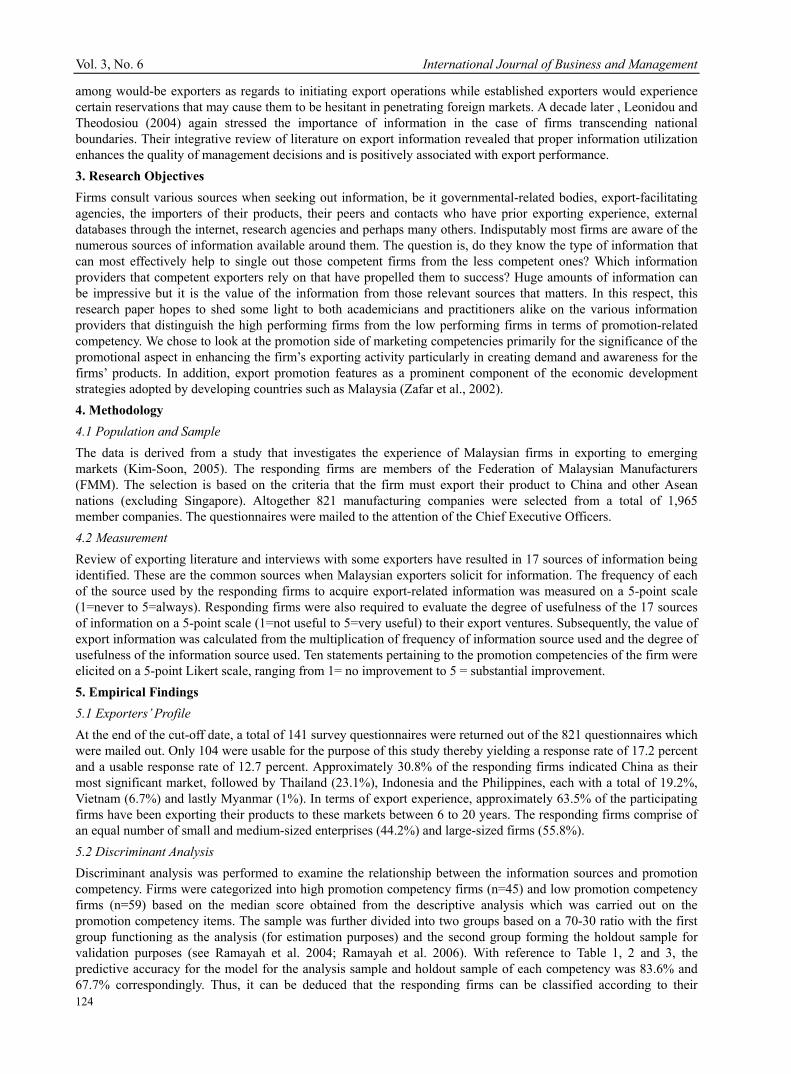
Vol. 3, No. 6 International Journal of Business and Management
124
among would-be exporters as regards to initiating export operations while established exporters would experience certain reservations that may cause them to be hesitant in penetrating foreign markets. A decade later , Leonidou and Theodosiou (2004) again stressed the importance of information in the case of firms transcending national boundaries. Their integrative review of literature on export information revealed that proper information utilization enhances the quality of management decisions and is positively associated with export performance. 3. Research Objectives Firms consult various sources when seeking out information, be it governmental-related bodies, export-facilitating agencies, the importers of their products, their peers and contacts who have prior exporting experience, external databases through the internet, research agencies and perhaps many others. Indisputably most firms are aware of the numerous sources of information available around them. The question is, do they know the type of information that can most effectively help to single out those competent firms from the less competent ones? Which information providers that competent exporters rely on that have propelled them to success? Huge amounts of information can be impressive but it is the value of the information from those relevant sources that matters. In this respect, this research paper hopes to shed some light to both academicians and practitioners alike on the various information providers that distinguish the high performing firms from the low performing firms in terms of promotion-related competency. We chose to look at the promotion side of marketing competencies primarily for the significance of the promotional aspect in enhancing the firm’s exporting activity particularly in creating demand and awareness for the firms’ products. In addition, export promotion features as a prominent component of the economic development strategies adopted by developing countries such as Malaysia (Zafar et al., 2002). 4. Methodology 4.1 Population and Sample The data is derived from a study that investigates the experience of Malaysian firms in exporting to emerging markets (Kim-Soon, 2005). The responding firms are members of the Federation of Malaysian Manufacturers (FMM). The selection is based on the criteria that the firm must export their product to China and other Asean nations (excluding Singapore). Altogether 821 manufacturing companies were selected from a total of 1,965 member companies. The questionnaires were mailed to the attention of the Chief Executive Officers. 4.2 Measurement Review of exporting literature and interviews with some exporters have resulted in 17 sources of information being identified. These are the common sources when Malaysian exporters solicit for information. The frequency of each of the source used by the responding firms to acquire export-related information was measured on a 5-point scale (1=never to 5=always). Responding firms were also required to evaluate the degree of usefulness of the 17 sources of information on a 5-point scale (1=not useful to 5=very useful) to their export ventures. Subsequently, the value of export information was calculated from the multiplication of frequency of information source used and the degree of usefulness of the information source used. Ten statements pertaining to the promotion competencies of the firm were elicited on a 5-point Likert scale, ranging from 1= no improvement to 5 = substantial improvement. 5. Empirical Findings 5.1 Exporters’ Profile At the end of the cut-off date, a total of 141 survey questionnaires were returned out of the 821 questionnaires which were mailed out. Only 104 were usable for the purpose of this study thereby yielding a response rate of 17.2 percent and a usable response rate of 12.7 percent. Approximately 30.8% of the responding firms indicated China as their most significant market, followed by Thailand (23.1%), Indonesia and the Philippines, each with a total of 19.2%, Vietnam (6.7%) and lastly Myanmar (1%). In terms of export experience, approximately 63.5% of the participating firms have been exporting their products to these markets between 6 to 20 years. The responding firms comprise of an equal number of small and medium-sized enterprises (44.2%) and large-sized firms (55.8%). 5.2 Discriminant Analysis Discriminant analysis was performed to examine the relationship between the information sources and promotion competency. Firms were categorized into high promotion competency firms (n=45) and low promotion competency firms (n=59) based on the median score obtained from the descriptive analysis which was carried out on the promotion competency items. The sample was further divided into two groups based on a 70-30 ratio with the first group functioning as the analysis (for estimation purposes) and the second group forming the holdout sample for validation purposes (see Ramayah et al. 2004; Ramayah et al. 2006). With reference to Table 1, 2 and 3, the predictive accuracy for the model for the analysis sample and holdout sample of each competency was 83.6% and 67.7% correspondingly. Thus, it can be deduced that the responding firms can be classified according to their
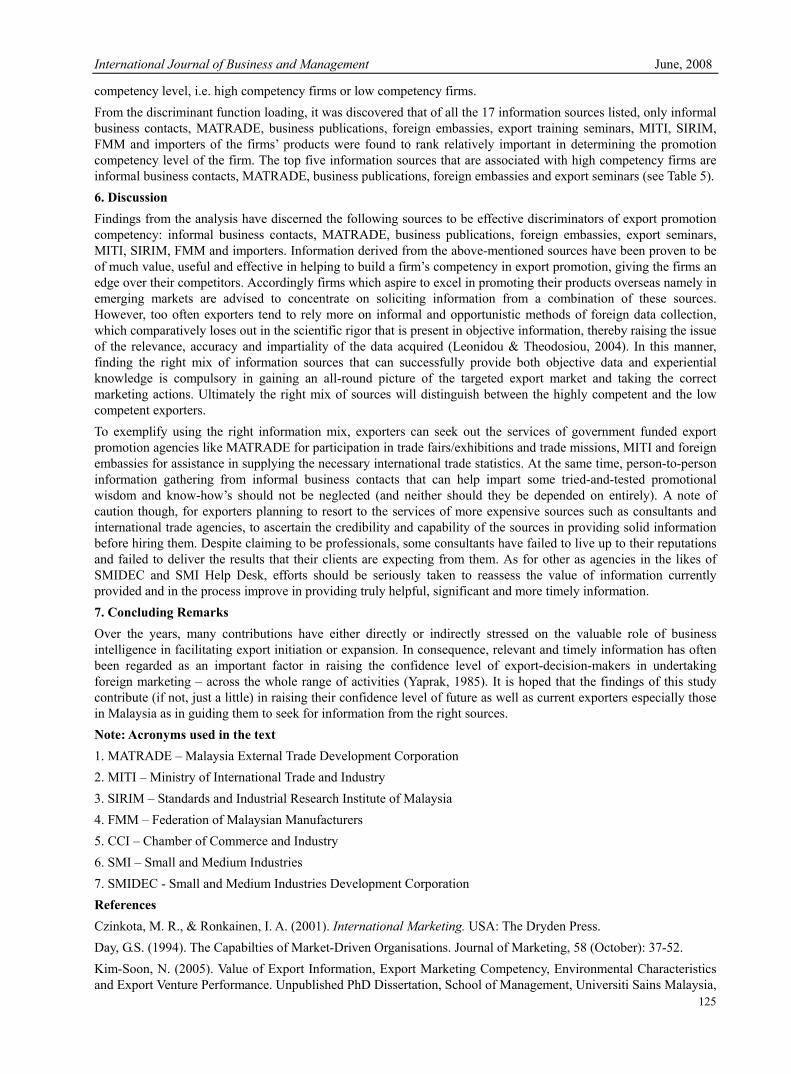
International Journal of Business and Management June, 2008
125
competency level, i.e. high competency firms or low competency firms. From the discriminant function loading, it was discovered that of all the 17 information sources listed, only informal business contacts, MATRADE, business publications, foreign embassies, export training seminars, MITI, SIRIM, FMM and importers of the firms’ products were found to rank relatively important in determining the promotion competency level of the firm. The top five information sources that are associated with high competency firms are informal business contacts, MATRADE, business publications, foreign embassies and export seminars (see Table 5). 6. Discussion Findings from the analysis have discerned the following sources to be effective discriminators of export promotion competency: informal business contacts, MATRADE, business publications, foreign embassies, export seminars, MITI, SIRIM, FMM and importers. Information derived from the above-mentioned sources have been proven to be of much value, useful and effective in helping to build a firm’s competency in export promotion, giving the firms an edge over their competitors. Accordingly firms which aspire to excel in promoting their products overseas namely in emerging markets are advised to concentrate on soliciting information from a combination of these sources. However, too often exporters tend to rely more on informal and opportunistic methods of foreign data collection, which comparatively loses out in the scientific rigor that is present in objective information, thereby raising the issue of the relevance, accuracy and impartiality of the data acquired (Leonidou & Theodosiou, 2004). In this manner, finding the right mix of information sources that can successfully provide both objective data and experiential knowledge is compulsory in gaining an all-round picture of the targeted export market and taking the correct marketing actions. Ultimately the right mix of sources will distinguish between the highly competent and the low competent exporters. To exemplify using the right information mix, exporters can seek out the services of government funded export promotion agencies like MATRADE for participation in trade fairs/exhibitions and trade missions, MITI and foreign embassies for assistance in supplying the necessary international trade statistics. At the same time, person-to-person information gathering from informal business contacts that can help impart some tried-and-tested promotional wisdom and know-how’s should not be neglected (and neither should they be depended on entirely). A note of caution though, for exporters planning to resort to the services of more expensive sources such as consultants and international trade agencies, to ascertain the credibility and capability of the sources in providing solid information before hiring them. Despite claiming to be professionals, some consultants have failed to live up to their reputations and failed to deliver the results that their clients are expecting from them. As for other as agencies in the likes of SMIDEC and SMI Help Desk, efforts should be seriously taken to reassess the value of information currently provided and in the process improve in providing truly helpful, significant and more timely information. 7. Concluding Remarks Over the years, many contributions have either directly or indirectly stressed on the valuable role of business intelligence in facilitating export initiation or expansion. In consequence, relevant and timely information has often been regarded as an important factor in raising the confidence level of export-decision-makers in undertaking foreign marketing – across the whole range of activities (Yaprak, 1985). It is hoped that the findings of this study contribute (if not, just a little) in raising their confidence level of future as well as current exporters especially those in Malaysia as in guiding them to seek for information from the right sources. Note: Acronyms used in the text 1. MATRADE – Malaysia External Trade Development Corporation 2. MITI – Ministry of International Trade and Industry 3. SIRIM – Standards and Industrial Research Institute of Malaysia 4. FMM – Federation of Malaysian Manufacturers 5. CCI – Chamber of Commerce and Industry 6. SMI – Small and Medium Industries 7. SMIDEC - Small and Medium Industries Development Corporation References Czinkota, M. R., & Ronkainen, I. A. (2001). International Marketing. USA: The Dryden Press. Day, G.S. (1994). The Capabilties of Market-Driven Organisations. Journal of Marketing, 58 (October): 37-52. Kim-Soon, N. (2005). Value of Export Information, Export Marketing Competency, Environmental Characteristics and Export Venture Performance. Unpublished PhD Dissertation, School of Management, Universiti Sains Malaysia,
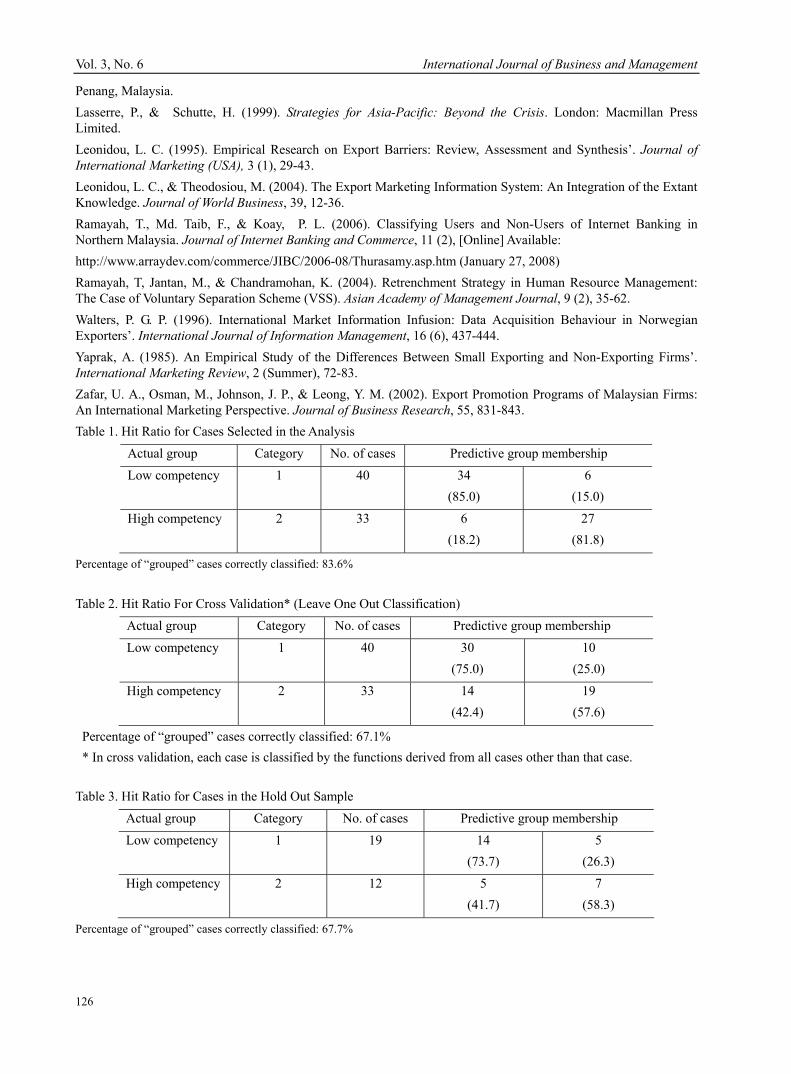
Vol. 3, No. 6 International Journal of Business and Management
126
Penang, Malaysia. Lasserre, P., & Schutte, H. (1999). Strategies for Asia-Pacific: Beyond the Crisis. London: Macmillan Press Limited. Leonidou, L. C. (1995). Empirical Research on Export Barriers: Review, Assessment and Synthesis’. Journal of International Marketing (USA), 3 (1), 29-43. Leonidou, L. C., & Theodosiou, M. (2004). The Export Marketing Information System: An Integration of the Extant Knowledge. Journal of World Business, 39, 12-36. Ramayah, T., Md. Taib, F., & Koay, P. L. (2006). Classifying Users and Non-Users of Internet Banking in Northern Malaysia. Journal of Internet Banking and Commerce, 11 (2), [Online] Available: http://www.arraydev.com/commerce/JIBC/2006-08/Thurasamy.asp.htm (January 27, 2008) Ramayah, T, Jantan, M., & Chandramohan, K. (2004). Retrenchment Strategy in Human Resource Management: The Case of Voluntary Separation Scheme (VSS). Asian Academy of Management Journal, 9 (2), 35-62. Walters, P. G. P. (1996). International Market Information Infusion: Data Acquisition Behaviour in Norwegian Exporters’. International Journal of Information Management, 16 (6), 437-444. Yaprak, A. (1985). An Empirical Study of the Differences Between Small Exporting and Non-Exporting Firms’. International Marketing Review, 2 (Summer), 72-83. Zafar, U. A., Osman, M., Johnson, J. P., & Leong, Y. M. (2002). Export Promotion Programs of Malaysian Firms: An International Marketing Perspective. Journal of Business Research, 55, 831-843. Table 1. Hit Ratio for Cases Selected in the Analysis
Actual group Category No. of cases Predictive group membership
Low competency 1 40 34 (85.0)
6 (15.0)
High competency 2 33 6 (18.2)
27 (81.8)
Percentage of “grouped” cases correctly classified: 83.6% Table 2. Hit Ratio For Cross Validation* (Leave One Out Classification)
Actual group Category No. of cases Predictive group membership
Low competency 1 40 30 (75.0)
10 (25.0)
High competency 2 33 14 (42.4)
19 (57.6)
Percentage of “grouped” cases correctly classified: 67.1% * In cross validation, each case is classified by the functions derived from all cases other than that case. Table 3. Hit Ratio for Cases in the Hold Out Sample
Actual group Category No. of cases Predictive group membership
Low competency 1 19 14 (73.7)
5 (26.3)
High competency 2 12 5 (41.7)
7 (58.3)
Percentage of “grouped” cases correctly classified: 67.7%
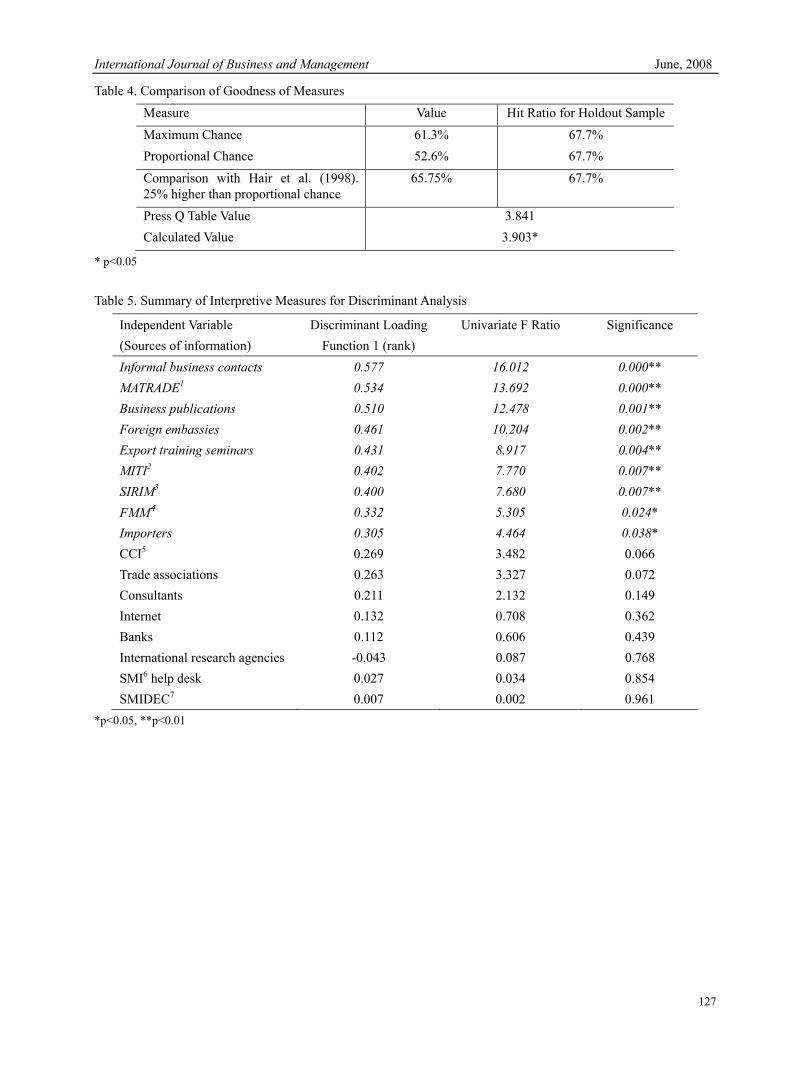
International Journal of Business and Management June, 2008
127
Table 4. Comparison of Goodness of Measures
Measure Value Hit Ratio for Holdout Sample
Maximum Chance Proportional Chance
61.3% 52.6%
67.7% 67.7%
Comparison with Hair et al. (1998). 25% higher than proportional chance
65.75% 67.7%
Press Q Table Value Calculated Value
3.841 3.903*
* p<0.05
Table 5. Summary of Interpretive Measures for Discriminant Analysis
Independent Variable (Sources of information)
Discriminant Loading Function 1 (rank)
Univariate F Ratio Significance
Informal business contacts 0.577 16.012 0.000** MATRADE1 0.534 13.692 0.000** Business publications 0.510 12.478 0.001** Foreign embassies 0.461 10.204 0.002** Export training seminars 0.431 8.917 0.004** MITI2 0.402 7.770 0.007** SIRIM3 0.400 7.680 0.007** FMM4 0.332 5.305 0.024* Importers 0.305 4.464 0.038* CCI5 0.269 3.482 0.066 Trade associations 0.263 3.327 0.072 Consultants 0.211 2.132 0.149 Internet 0.132 0.708 0.362 Banks 0.112 0.606 0.439 International research agencies -0.043 0.087 0.768 SMI6 help desk 0.027 0.034 0.854 SMIDEC7 0.007 0.002 0.961
*p<0.05, **p<0.01
Vol. 3, No. 6 International Journal of Business and Management
128
The Problems in Sustainable Development of
Resource Orientated City and Countermeasures Zhen Wang
School of Business Management, Shandong University of Finance, Jinan 250014, China Yuanyuan Liu
School of Control Science and Technology, Shandong University, Jinan 250061, China Yan Xu
Shandong Science and Technology Museum, Jinan 250011, China Abstract Sustainable development of resource orientated city is a highly regarded problem in China and in the world. By analyzing the status quo of resource orientated city, this paper puts forward the problems in the development of resource orientated city, such as economic structure, spatial structure, environmental pollution, capital and technology, and puts forward countermeasures for these problems. It is concluded that cities should insist on sustainable development in the future. Keywords: Resource orientated city, Economic structure, Sustainable development Resource orientated city is the city that rises and develops because of the exploitation of natural resources, in which resource (including minerals, forests and so on) related industries account for large proportion of industry. The number of resource orientated city is one fourth of the total number of the Chinese city; they play important roles in national economic development. In a long period of time, resource oriented strategy is applied in resource orientated city, it destructively exploits and sells resource in order to accelerate the development of city and district. So the resources in many resource oriented city are gradually exhausted, the industry and product are single, follow-up industry and diversified economy are vulnerable, employment occupation is limited, and the social burden is heavier and heavier, accordingly, the environment is polluted and the natural vegetation is destroyed. The economic and social development of resource orientated city are being confronted with great challenge, so it is of significance to study and explore the sustainable development of resource orientated city and improve the economic and social development level of resource orientated city. 1. The status quo of resource orientated city development in China Resource orientated city provides large amount of mineral product and energy for the economic development of China, and plays important role in Chinese economic development. The development of resource orientated city depends on the reserves of resources; mineral is non-renewable resource, so the development of mining economy will definitely undergo a process of exploration, flourish, decline and exhaustion, and the economic development in mining city will definitely undergo a process of rise, boom, and recession. In recent years, two thirds of the mines are declining, a quarter of the resource oriented cities are being confronted with resource exhaustion, the contradictions in resource orientated city in the aspects of economy, society and ecological environment are becoming more and more obvious. Generally speaking, resource oriented city is being confronted with the problems as follows: 1.1 Economic structure is single, there is little growth potential Resource orientated city depends greatly on resource exploitation and manufacture, the chain of industry is short with feeble ability in sustainable development. In most resource orientated cities, resource exploitation and manufacture account for 30% of the gross output of industry, in many cities, it is 50%. State-owned economy accounts for large proportion in resource orientated city, and the public-owned economy lacks energy. Further effort should be made in the reform of state-owned enterprises, most of the enterprises have heavy historical burden, they mainly produce primary product, and have low economic efficiency, and the local economic development is directly influenced by the price fluxion of resource, so it is difficult to realize steady growth. 1.2 The spatial structure of the city is incompact Resource orientated city is developed on the basis of mining region, usually, it is constructed along the mining region and develops with the mining region. Mining industry is restricted by deposited condition and mining condition, most enterprises are distributed in the mountain area and the outskirts of country. Besides, the distribution
International Journal of Business and Management June, 2008
129
of mineral resources has the characteristic that “the large mine is concentrated and the small mine is scattered”, so the spatial structure of resource oriented city is incompact, it has “many spots, long line and large area”, which increases the cost in urban construction, reduces the use efficiency of capital, and leads to the phenomenon of “establishing society by enterprises”, because enterprise has to establish its own school, hospital, store etc, it will greatly increase the burden of enterprise. 1.3 Environment is deteriorating because of “three wastes” and the destroy of geological structure Mineral resource is the material foundation for the human and social development. The present usage of resources on the one hand caused severe pollution, on the other hand destroyed the geological structure, and severely influenced the ecological balance. In China, 220 billions of mine water and 28 millions of slime water are discharged every year, the farmland around the mine is polluted and the physical characteristic of the soil is changed, which directly influences the health of people, in some districts, poisoning caused human and livestock death. In addition, air pollution, acid rain and acid fog greatly influence the development of resource orientated city. Along the 5000 kilometers of coal transportation line in Shanxi, the crops are covered by the power of coal and the photosynthesis is influenced, 14 million kilograms of grain are reduced every year, the agricultural economy is severely affected. 1.4 Resource oriented city lacks effective capital accumulation mechanism and technology. Capital and technology are the basic factors of regional economic development. Owing to the price system established by the government in the past, resource orientated city lost large amount of economic interest, so it lacks capital now. Meanwhile, resource oriented city is underdeveloped, national income is small, so the capital accumulation rate and the capital that is changed into save are extremely low. The situation of capital and finance make resource orientated city cannot develop local industries, and cannot carry out large scale infrastructure construction, so the regional economy and social development are far lagged behind comparing with that in other districts and cities. Further more, the quality of people is low, and the ability to use external capital and technology is poor. All these problems should be solved in the sustainable development of resource orientated city. 2. Sustainable development is the inevitable choice of resource orientated city. Sustainable development is development that meets the needs of the present without compromising the ability of future generations to meet their own needs. The problems in resource orientated city are comprehensive and have accumulated for a long period of time. So resource orientated city should be regulated in the aspects of economy, society, human, environment and resource so as to get out of the dilemma. Specifically speaking, resource orientated city should insist on sustainable development, which is the demand of the following three aspects, firstly, urbanization is a global development trend, urban development should transform the concept of sustainable development into action. The economic center is mainly in the area of town accumulation; regional sustainable development is based on the sustainable development of towns, and then will realize the national and global sustainable development. The exploration and protection of natural resources are the guarantee for the application of sustainable development strategy, the economic system and social system of sustainable development must be based on the reasonable utilization of resources and environment. In 21st century, the whole world falls short of resources, so resource will be one of the most regarded aspects in sustainable development. Secondly, the implementation of sustainable development strategy in China cries for the sustainable development of resource orientated city. In the China’s Agenda 21, Chinese government pays much attention to the sustainable development of residence and the protection and continuing utilization of natural resources. Resource orientated city plays irreplaceable role in the national economy and livelihood of the people, its problems should be solved immediately. Thirdly, sustainable development is needed for resource orientated city to overcome the difficulties and do second round of business establishment. Planned economic system and extensive growth manner are typical in resource orientated city, and the development of the city is greatly restricted by the two factors. So it is of realistic and long-term significance for resource orientated city to realize two fundamental transformations, accelerate the evolvement of economic structure, and carry out sustainable development strategy. 3. Countermeasures for resource orientated city to realize sustainable development The sustainable development of resource orientated city relates to the important problems including national energy, safety of raw material supply, economic growth, environment protection and social stability. The resource oriented city should base on the commonness and individuality of resource orientated economic region, insist on the strategic programming of “unified planning, rational distribution, moderate exploitation and coordinated development”, base on the practical situation of resource orientated economic region, strengthen management, introduce reorganization and system reform, finally realize the common development of government, city and individual.
Vol. 3, No. 6 International Journal of Business and Management
130
3.1 Resource orientated city should energetically adjust the economic structure Adjust industrial structure, accelerate the harmonious development of primary industry, the secondary industry and the tertiary industry, try to establish new industrial pattern that is suitable for the local area, vigorously develop continued industry and substitute industry. Firstly, pay attention to the development of non resource orientated industry, which will be propitious to the foster of new economic growth point and the reinforcing the ability to resist economic risk. Secondly, accelerate the transformation of resource orientated industry to market orientated industry, and the transformation of single industrial structure to multiple industrial structures. Thirdly, pay attention to the development of the tertiary industry, increase the proportion of service industry. Fourthly, coordinate the relationship between new industry and traditional industry; realize the optimization of industrial structure. Fifthly, strengthen the adjusting of product structure, low grade, extensive and single product structure should be changed to high grade, intensive and diversified product structure, the product should be bettered and diversified. Sixthly, strengthen reorganization and reform in the traditional industries such as metallurgy, petroleum chemistry industry, and machinery industry, realize the upgrade of product. 3.2 High new technology will provide power for the sustainable development of resource orientated city. Reforming and reconstructing the traditional industry by high new technology is the development trend of Chinese resource orientated city, is the key to industrial structure optimization and upgrading, and is effective measure to reinforce the competitive ability of the product of traditional industry. The application of high new technology will make labor intensive industry change to technology intensive industry in resource orientated city. Firstly, technology introduction and technological innovation should be combined, when introducing new technology, resource orientated city should cooperate with the large companies in the world, and the introduction should avoid repeat and thoroughly think about the technology absorption ability. Secondly, the innovation and development of high new technology should be combined. Enterprises that have strong technological ability should be encouraged to carry out technological innovation according to their own characteristics, and the high new technology development ability should be improved in these enterprises. 3.3 Construct ecological resource orientated city It takes people long time to realize the ecological value of resources. In the past, people just paid attention to the commercial value of resource, and neglected its ecological value, accordingly, a series of ecological problems came up. The concept of ecological civilization should be built up in the construction of resource orientated city. Ecological civilization demands that the “human centered” idea should be discarded when considering the relationship between human and nature, human should be taken as one member of nature, so all the behaviors of human, especially the production and life, should abide by the ecological principle, the concept of nature-economy-environment should be established, and the needs of future generations should be taken into the civilization system. The concept of ecological civilization is the ideological basis for the construction of resource orientated city, much importance should be attached to the concept. Ecological city is a city, in which the productive and consumptive manner, the decision making and management method will be changed by using the principle of ecological economics and the method of system engineering, the potential of resource in the city will be thoroughly brought into play, with the purpose of establishing a series of industries that have sound economic effect and ecological effect, and realizing the unification of economic development and environmental protection, material civilization and spiritual civilization, natural ecology and human ecology. 3.4 Try to create good environment to attract foreign investment Firstly, energetically carry out environmental improvement, and improve the ecological environment. The environment in resource orientated city is destroyed, and there is much wasted land. German and French invested much money in environment, for example, 500 to 600 hectares of wasted land are improved every year in north Nord-Pas-de-Calais of France, which is financially supported by the European Union, central government and local government. In Ruhrg-ebiet of Germany, many discarded mines were rebuilt as educational and training bases or exhibition base for traditional industry. Secondly, provide preferential policy for the foreign investment, as it does in Germany and France, including revenue support, investment allowance and so on. It is a long-term and arduous job to promote the sustainable development of resource orientated city, the resource orientated city in the European and American developed countries also experienced long-term economic transition, which is 30-40 years or 70-80 years. It takes long time to solve the problems in resource orientated city, we should seize every minute, and try to make breakthrough with as short time as possible. References Chai, Lu. Li, Shouyi. Sun, Yingnan. Wu, Shangkun and Zhang, Tingting. (2006). Measures on sustainable

International Journal of Business and Management June, 2008
131
development of resource-based cities of China. Natural Resource Economics of China. 02. Li, Changxi. (2005). On the substainable development of resource type cities. Journal of Shengli College China University of Petroleum. 03. Meng, Fansheng and Wang, Chao. (2005). The research about strategy of the sustainable development of Chinese resource-driven cities. Journal of Harbin University of Commerce (Social Science Edition). 05. Song, Xiaowu. (2006). Vigorously promote sustainable development of resource orientated city in China. Northern Economy. 13. Zhang, Yichun. (2005). Study on the countermeasure for the sustainable development of resource orientated city. China Science and Technology Information. 13.
Vol. 3, No. 6 International Journal of Business and Management
132
A Study on Tactics in Using Talents Xiangdong Ma
School of Management, Guangdong Vocational College of Science & Trade Guangzhou 510640, China
E-mail: [email protected] Abstract In various cases of using talents, the tactics in using talents win special attentions and stresses of politicians, thinkers, militarists, strategists, scholars and even common people in generations. This paper has put forward the system of tactics in using talents, and generalized the core content to nine aspects, namely self-using, observation, selection and recommendation, integrated using, borrowing strength, inspiration, ruling, retaining, train and education. This paper has analyzed the nine aspects compactly, and pointed out the purpose and meaning in studying and researching these tactics. Keywords: Tactics in using talents, Self-using, Observation, Selection and recommendation, Integrated using, Borrowing strength, Inspiration, Ruling, Retaining, Train and education 1. Put Forward What is tactic? The word of "tactic" was first seen in the book of “Three Kingdoms’ Record” in China. The author Shou Chen appraised Yu Chen and Jia Guo as “Talented and tactical, the thaumaturge of the world” in “The book of Wei”. And in “The book of Wu”, he appraised Xun Lu as “Xun Lu’s tactics make me astonish, and the ability to recognize talents of Quan Sun makes me acclaim. So they can make huge accomplishment”. This word is to commend the militarists who are bellyful of knowledge. “The book of Han------the Record of Art and Literature” has separated ancient Chinese military book as four species, namely the leadership strategy of military, the situation of military, the two sides of military, the techniques of military. Leadership strategy means tactic. “The Record of Art and Literature” has given an explanation of the leadership strategy of military as “The leadership strategy is the skill to manage a country, to control the army, to know the situation and the two sides of things”. We can find out the abundant meaning of tactics through these famous words. Xiang Liu, who was the famous author in the Han Dynasty, pointed out that “Tactics have two sides, the better tell the fate, and the next tell the affair. Which tell the fate can foresee the root of live or death and fortune or disaster. They help people to know the rise and fall at the first beginning, to prevent before the accident, and to take refuge in immateriality. Which tell the affair are also not bad. They help people to recognize gain and loss at the beginning of accident, and to find the reason. So people will not be defeated. That’s the essence of tactics. Wanli Chang puts forward the theory in the “Ideas Man’s Secret” that strategy has six levels, that are tiny skill, with intellect, through quiet, concrete, sit-in meditation and meditation according to its different levels. The appearance, feature and content of each level in the six levels of the strategy are not all of the same. “Tiny skill” level is the “point”, like “spot”, the influential power of which is limited. The strategy of “with intellect” and “through quiet” levels can reach the thought realm of “segment” or “side”, but still be partial. The “concrete” strategy is just the overall one and has a physical truss of strategy. To reach the “sit-in meditation” thought realm, it is not only a physical truss but enters the core from the surface, and surpasses the physical appearance to enter the “meaning” world. As for “meditation” strategy, which is a level higher than “sit-in meditation”, it runs through “spirit” into the strategy body, so as to make the strategy body get rid of external creation and become an individual life that can produce self demands inside. Once the strategy of this level is put to use, its power always exceeds the commanding scope of strategy subject. It seems that a trend of power forces all the subjects and objects to act. It can be seen from the above that the strategy has different levels and the thought realm is profound. As to the definition of tactic, different person has different opinion. I prefer the definition written by Bingyan Li in the book “The discrimination of tactic’s definition” through research and comparison, which is “Tactic is decision-makers’ brain, wisdom and capacity, stratagem in competition. It helps decision-maker forecast the future, grasp chances, plan as a whole, tend towards benefit and avoid harm”. Tactic in using talents is an old and renewable subject. It has win special attentions and stresses of politicians, thinkers, militarists, strategists, scholars and even common people in generations. Recently, through studying the tactic monograph at all times and in all over the world and the monograph written by leaders and worthy, and the
International Journal of Business and Management June, 2008
133
employment practice of Chinese and foreign companies, I consider that the main content of researching tactics in using talents is the stratagem in using talents’ field. The system of tactics in using talents includes nine aspects, namely self-using, observation, selection and recommendation, integrated using, inspiration, borrowing strength, ruling, retaining, train and education. These nine aspects combine together and form an integrated and organic body. From these nine aspects, we can understand and master the contents and essence of tactics in using talents systematically, precisely and completely. 2. Content 2.1 Self-using tactics. For employers, making better use of talents, the first requirement it to make better use of themselves. To create talents first create themselves. On one hand, the success or failure in using talents’ activities, lies on the diathesis and tactics of employers. On the other hand, the employers also have the problem of being used. Because all conductors have two attributes, to underlings, they are leaders, and to their boss, they are the person being used. Employers also have two attributes, which are using talents and being used. So the employers must first consider the problems of being used in using talents’ activities. The self-using tactics are the stratagems of using oneself, which include three aspects: The first is the diathesis and culture of employers. The diathesis and culture of employers means that the employers must be provided with high diathesis, such as good psychology diathesis, abundant knowledge, modern conception, high political quality, strong compositive quality, and healthy physique. Employers must advance all these diathesis, enhance compositive quality. That is the basic of using talents. You must remember, if the employers are demoralization, narrow-minded, wacky, narrow-gauge, lose loyalty when seeing benefits, and have no faith, their want to make better use of talents means nonsense. So, the employers should advance all kinds of diathesis continually and insistently, take effort to achieve the new ambit and high level. Only in that way, they can make good use of talents, and make success. In this aspect, self-using tactics include all-conquering when no desire, incorruptibility, modest and careful, be admired by personality, not be frightened before accident, be faithful, and accept other’s opinion with an open mind and so The second is that the employers should master the self sale promotion skills. The employers should be good at sale promotion in any occasion. To let others admit their ability, and to let their boss know their clinging pursuance and responsible quality. So that their boss will provide them all kinds of opportunities and good working environment, in order to let them make outstanding achievement and miracle. In this aspect, self-using tactics include volunteer one’s services, seek for breach, self sale promotion, choose boss to follow and so on. The third is to hide. When using talents, the employers may sometimes encounter jealous and offensive leaders, and stay in an adverse circumstances which are full of danger, cautiousness, and abandon. In such adverse circumstances, employers should take the self-using tactic, which is to hide. Such as “The best is to tolerance”. Human beings have emotions. Their feelings are often subject to the external environment and internal desire of interaction. If these effects can be properly controlled, it may switch disaster to lucky. Otherwise, they might endanger themselves because of anger. Tolerance for the major includes: First, when facing threat, you should tolerant. Second, when being humiliated, you should tolerant. Third, when facing money, honor and desire, you should tolerant. Forth, when proud, you should tolerant. Fifth, when anger, you should tolerant. In short, to tolerant what others can’t tolerance. Many famous person set "tolerance" as their exploits and achievements in social motto. In "Romance of the Three Kingdoms", Yi Sima becomes a merit because of his strong power on tolerance. Face Cao Cao’s discrimination and oppression, tolerance and colleagues excluded frame-up, the wise forbearance "women humiliated" Junior tolerance of bullying Shuang Cao, a firm resolute map's exploits have come. A "forbearance" of Sima Yi throughout the entire life, it has also fostered an eternal Dili Sima Yi. Numerous facts have proved that people can not emotion, the patient Department to be patient. Only then can we deal with it sensibly, calm, fair and appropriate, can accomplish a great deal. 2.2 Tactics in observation is a strategy and general plan of observation and discerning talents. Tactics in observation is one of the parts of the foundation of employees' managering and it's also the basic precondition which should be focused on of study and mastering employees managering systems. The using of Tactics in observation is also the basic ability which should be made efforts on of employer. To treat Tactics in observation like what is mentioned above is because employees managering require the employer knows how to observe an employee. In other words, employer must research, analyse, understand and know the employees' quality on various fields and unique skill well, and must distinguish the characteristic, specialty and ability and political integrity situation of the employees, and ensure the information collected is much enough, deep enough and correct enough to build the foundation of succeeding in employees' managering and to lead the employer choose the
Vol. 3, No. 6 International Journal of Business and Management
134
appropriate employees ,arrange them to the position which could make their ability's function most, max the power of people and objects, get the good achievement of employees' managering, and win a unassailable position while competing in various fields. The research of view strategies can be started with the following three aspects: first, the traditional view strategy passed down from the ancientry; second, the strategy to identify and view talents by psychology, behavioral science and other knowledge, and modern telecommunications means; third, the view strategy put forward by modern leaders and prominent figures, and frequently used in modern employment practice. As Seven View Methods: Seven View Methods was put forward in the “Way of the General” (Jiang Yuan) by Liang Zhuge to identify and view employers. (1) Ask him right and wrong for his ideal; Ask him about right and wrong to view his ambition. (2) Examine him questions for his ability to take action; Argue with him to view his resourcefulness and eloquence. (3) Consult him resourcefulness for his knowledge level; Discuss stratagem with him to view his wisdom. (4) Assign him difficult work for his courage; Confront him with disaster and hardship to view his courage. (5) Drink him wine for his nature; Make him drunk to view his nature. (6) Chance him benefit for his probity; Seduce him with benefit to view his probity. (7) Entrust him work for his credit. Appoint him a task to view his credit. The view strategies mainly include seven view methods, observe tiny things for its trend, eight view methods, imagining the big from the small, nip in the bud, methods of detecting treacherousness and other methods. 2.3 Electing and Recommending Strategies. In the Romance of the Three Kingdoms, Yuanzhi went straight to recommend Liang Zhuge and Liang Zhuge recommended Tong Pang, which had been widely read by the people. The behavior that “talent should be the sole standard” and knowing and recommending talents was the characteristic of the outstanding figures in past dynasties. Electing and recommending talents have been the noble quality of employers. Employers should identify personnel and recommend talents. Only by recommending talents, can the talent be put to good use and can the business be developed. During using the personnel, employers should identify and view to find talents in each aspect, and to recommend those talents for the leading department of each layer with high responsibility and enterprise, then let them play their roles in each key department, which is the requirement of developing the business and also an important element of employment strategy. Knowing and recommending talents. A typical example was that Ze Kan of Wu Kindom recommended Xun Lu in the Romance of the Three Kingdoms. In A.D.222, in order to reseize Jing Zhou and revenge for Yu Guan, Bei Liu led on 100 thousand soldiers himself to go to the east, went deep into the border of Wu Kindom for five or six hundreds miles, and besieged the Yi Ling city defended by Heng Sun of East Wu. The armies and civilians of East Wu were in a state of anxiety and the situation was serious. Just at this moment, Ze Kan came out to recommend Xun Lu as the chief commander. He said to Quan Sun, “Emperor, why not use Xun Lu? His talent is not less than Yu Zhou. To reseize Jing Zhou and to defeat Yu Guan are all his ideas. Now facing the formidable enemy, if you could use him, we must defeat Shu Kingdom. In case of any loss, I’d like to bear the imputation together.” Ze Kan said firmly, but that was greatly difficult. Although Xun Lu had been over 40 years old, he was still “so young” in the grand old men’s opinions of East Wu. In addition, people always regarded him as an “intellectual” not a generalship. As a result, Ze Kan referred to it just now, Zhao Zhang, Yong Gu and other people opposed immediately. They thought if Xun Lu was assigned, all the generals would not obey that might result in disorder and delayed the great event. At that time, Ze Kan was anxious urgently and spoke loudly, “If not using Boyan Lu (Xun Lu), East Wu must be defeated. I guaranteed him by my whole family.” Then, Quan Sun noticed to use Xun Lu uncompromisingly, and according to Ze Kan’s opinion, celebrated by building an altar to worship the general and favored him a sword for authorization. Finally, Xun Lu won the Yi Ling War for East Wu. The strategy of knowing and recommending talents mostly inspires us two points, one is to know people, with enough understanding on talents; the other is to recommend with smart methods and the employers like to accept and put the talents in an important position. Electing and recommending strategies include putting forward worthy persons, “talent should be the sole standard”, knowing and recommending talents, recommending including enemies outside and relatives inside, and recommending talents with both ability and political integrity, and etc. 2.4 Tactics of integrating the talents. It is the tactics of uniting and using talents. Firstly, integrate various talents to work for employers. Secondly, by
International Journal of Business and Management June, 2008
135
giving proper work suited to his abilities, exert the maximum effect of the talents. In the profound and unpredictable fields of using talents, integrating the talents is the most important content. At all times and in all over the world, the leaders and outstanding persons are always proud of their ability of integrating the talents. These wonderful foresights have left a lot of excellent tactics of integrating the talents to the later generations. For example, hire employees with unbeatable salary. That means offering excellent salary attracts the employees. It is a popular method in America. In 1945, the allied forces conquered Berlin. Soviet Russia troops delivered all the German mechanical machines back to Russia. While, America government sent a few planes to Germany to take a lot of German scientist and senior engineers to America as prisons of war. After being assessed, they are hired with very good salary. Using this method, America integrated a lot of talents. As we all know, Kissinger is Jew, Brzezinski is Polish, and Brown Michell is Jewish refugee. They are all brilliant politician of America. There are more examples of scientist. During the Second World War, among ten professors, such as Fermi, who help America develop scientific researches, only one is American. Among winners of Nobel Physics Prize, six people immigrated from Europe. There are a lot of foreign engineers, even 1/3 of them are Chinese, who involved in the famous event, i.e. Apollo Luna Landing. According to the statistics, from 1946 to 1974, America hired 240,000 foreign senior scientist, engineers and doctor with excellent salary. The American assistant secretary of state, Mr. Holland, disclosed that America gained $12 billion profits from other countries. (The government should consume $50,000 per person to complete his education from primary school to university in America. So 240,000 will consume $12 billion.) Not only America government, but also America corporations pay importance to hire employees with unbeatable salary. One Swiss graduate student developed an electronic pen and assistant equipments, which can correct the infrared photos taken by remote sensing satellite. This significant invention caught eyes from the entire world. One American corporation immediately contacted this inventor and persuaded him to work for this company with excellent salary. But, some Swiss companies tried to hold him as well. So, both sides wanted to have this talent and his invention by offering better salary. Finally, clever and adventurous American said: “All right, we will not increase the salary step by step like Swiss company. However, we will give you 5 times of salary offered by Swiss company regardless of how much it is.” Eventually, this graduated student went to America with his invention. At the current knowledge and economic times, hiring the employees with excellent salary still is an important tactic. The employers should know it very well. Tactics of integrating the talents includes using employees with talents, using the talents properly, making the same purpose, controlling key point, respecting talents, using talents without doubt, learning from others' strong points to offset one's weakness, using talents in accordance with their abilities, using talents at proper time, luring the enemy away from his base, being good at making friends and encouraging competition. 2.5 Tactics of asking for resources. Using the talents intrinsically is how to ask for resources to make the employees exert all their strength and talents unreservedly. It is a good fortune and basis of achieving career successfully that asking for resources from human, material, heaven and earth, superior, junior and colleagues to achieve the success of using the talents. At all times and in all over the world, the leaders always attach importance to the tactics of asking for resources. They showed the superb skills of using talents. Some of them even have high degree of professional proficiency. For example, make use of other person to get rid of an enemy. In The romance of Three Kingdoms, Bei Liu used to hold Xu State. However, because Fei Zhang was addicted to drinking, Bu Lv seized an opportunity to take Xu State. Bei Liu had to settle his troops at Xiao Pei which is near to Xu State. Cao Cao sent a letter to Bei Liu, and ask him to watch for a chance to raid Bu Lv. Unfortunately, this letter was intercepted by Bu Lv. Bu Lv was so angry that he attacked Bei Liu. At that time, the military strength of Bei Liu was very weak, so he asked for resource from Cao Cao. Cao Cao led his troops and seized Bu Lv at Pi City. Bundled Bu Lv was sent under escort to Cao Cao. He said to Cao Cao:” What you are worrying is only me. But now I have surrendered to you, so you have nothing to worry. I am willing to assist you to get the whole country.” Cao Cao heard what Bu Lv said and hesitated to make a decision. Bei Liu said to Cao Cao:” Do you forget that Bu Lv served Yuan Ding and Zuo Dong before?” Cao Cao heard it and made a decision to kill Bu Lv. Bei Liu made use of Cao Cao to get rid of his enemy, also Cao Cao wouldn’t make Bu Lv work for him. So it is a great idea. Tactics of asking for resources includes making enemy work for us, making use of other person to get rid of an enemy, using others’ resources, using pretext of god, sailing boat with wind, borrowing chicken to make eggs and having follower on the trees. 2.6 Tactics of inspiring the talents. It is necessary for the employees to have the endless motivity. At all times and in all over the world, the successful
Vol. 3, No. 6 International Journal of Business and Management
136
employers are the superior of inspiring the talents. They are good at using these tactics, and each has his strong point. For example, inspire the employees with affection. In March, 1642, the captured leader of Ming troop, Chengchou Hong, would never surrender, regardless of how Taiji Huang persuaded him. When Taiga Huang could find no way out, Fey Zhuang offered him a wonderful idea as follows. One night, after several days without any food, drowsy Chengchou Hong was lying in the bed with closed eyes. Suddenly, the door was opened and one person was walking to his bed gently. He was not interested in it at all and kept on sleeping without opening his eyes. He just felt that person slowly sat on the bed side and coved his quilt slightly. After long time silence with sweet-smelling, Chengchou Hong was wondering why this person came here. He opened his eyes slightly and saw a peerlessly beautiful lady with the lotus-face and willow-waist wearing Manchu suits. She was holding a kettle with her pretty hand and watching him tenderly. After several extremely stressful days, a pretty woman suddenly stood in front of him, he could not sir and eyelid any longer and asked:” Who are you? Why do you come here?” The lady answered with a smile:” Because I know you are belt-spirit and I respect you, I come to serve you.” He had been feeling lonely for long time since he was caught. It was for him that one day seemed like a year. So, it was really good chance to relieve his loneliness by chatting with such a beautifully woman. The lady asked him how he was caught and the current conditions of his relatives with warmly care and sympathy, by which the grieved memory in his deep heart was called to his mind. His eyes were full of tears. The lady also wept for his sufferings. Then he felt so comfortable and tasted the soup. Surprisingly, he knew it was superb healthy gen-seng soup. He was really grateful to the lady and asked again:” Why do you serve me like this? Who on earth are you?” The lady had to tell him the truth:” I am the imperial concubine, Your Majesty let me serve you.” As soon as he heard it, he quickly got up and fell down feelingly. Fei zhuang supported him stand up with a smile and said:” Your Majesty respects your knowledge, so he asks me to console you. Your Majesty don’t have other purposes, please don’t think too much and feel free.” At the same time, she was intended to observe the hint given with his eyes. Chengchou Hong shook his head slightly with a sigh and kept silence. Fei Zhuang noticed his embarrassment and said:” Actually, Your Majesty is not intended to invade your country. So Your Majesty sent a few letters to Emperor Ming to make a peace. However, perversity Emperor Ming trusted absurd words and kept sowing dragon's teeth. If you can be in charge of the process of making a peace, the people of both countries can avoid the chaos caused by war. It should be a boundless beneficence. You can write a letter to Emperor Ming, and inform him that although your body is in Man State, your heart is still in your country. At this stage, a civil strife is happening in Dynast Ming. As Emperor Ming believes you are intervening for your country, he definitely will not put your relatives in trouble. Therefore, it is a satisfactory to both sides. i.e. your country and your family.” With her tender and care, Fei Zhuang relieved his wariness. Her sympathetic words recalled his sufferings. Further, she could put herself in his position and made him feel touched. Eventually, Chengchou Hong was influence by the passion of Fei Zhuang and was most willing to work for Taiji Huang and became a loyal and devoted great idea man. Fei Zhuang used affection to change the behavior of Chengchou Hong and resolved this nail-biting problem. Tactics of inspiring the talents includes inspiring the talents with songs, killing leader and awarding humblers, awarding one to inspire others, awarding people according to their contributions, punishing one to warn others, simulating person, career inspire and emotional inspire. 2.7 Tactics of leading the talents is how to guide the senior employees. How to control the important employees, master their information clearly, lead and inspire them to lead other employees and make them forward as planned is the content of tactics of leading the talents. By using these tactics properly, the employers can unite the knowledgeable person and employees as an unconquerable and invincible group to go through fire and water for them. For example, one of these tactics is make a psychological attack as priority. For any conduct of using talents going on wheels, there are two preconditions: Firstly, the boss is willing to use the underling; Secondly, the underling is willing to accept the order from their boss. From the certain point of view, due to the more complicated emotion of the underline locating at the lower position, the will of the underline is more important and difficult than that of the boss. Hence, the employers should correctly find out the employees’ innermost feelings to conquer the employees’ heart and make them trust you, respect you, love you and work for you. However, it is a hard job. For instance, Bei Liu asked Liang Zhuge to take up a responsible post repeatedly and was neglected by Liang Zhuge in the beginning. Until affected by his persistence and courtesy, Liang Zhuge was jumped at his invitation to help him to revive Han. Afterwards, Liang Zhuge spared no effort in the performance of his duty and worked for Bei Liu to the end of his days. Tactics of leading the talents include making a psychological attack as priority, unpredictable activities, conquering
International Journal of Business and Management June, 2008
137
opponents separately, showing falsehood and hiding truth, conquering the opponents by getting rid of their following, seizing the head firstly, applying the benefits and punishments together, punishing someone as a warning to others, forgiving the defects of the employees, placating the world and wining without war. 2.8 As the basic point of using the talents, the employers have to retain the talents. The key point of retaining the talents is to keep the soul of the talents with the precondition of knowing his soul. Retaining the talents means retaining the talents who are needed by the employers in the activities of using the talents. It contains three aspects: Firstly, retain the talents with salary. The employer can attract and retain the talents by offering better salary and eliminating their worries constantly which is the basic condition of retaining the talents. Secondly, retain the talents with emotional care. The employer can attract and retain the talents by the emotional communication with each other and satisfying emotional request of the talents. As a Chinese special way to retain the talents, Chinese intellectual has the traditional concept like “soldier will die for the man who knows his soul”. Therefore, the employers of the Chinese state company should think about this way more often to retain the talents. Thirdly, retain the talents with bright career prospect. The employers can attract and retain the talents with not only the development of the employers’ own career but also satisfying the individual development of the talents. It contains two meanings: (1) The development of the employers’ career; (2) The individual development of the talents. Only if the employers have the bright career prospect and the talents can fully and healthily develop, the talents can be attracted and held stably. The moral of the talents can also be inspired and enhanced. Further, the talents can work for the employer with all his heart. Therefore, as one of the strategies of retaining the talents, providing the bright career prospect is the most important issue. For example, “good horse eats grass back”. Different companies have the widely divergent attitudes towards the resigned employees. Some companies will never hire these ex-employees. According to the data base which has the record of each employee, whenever and wherever the employee resigned from any of department or branch, he will never be allowed to enter into this company again. However, other companies have the totally contrast attitudes towards the resigned employees. They are glad to re-cooperate with these ex-employees by overcoming the past enmity, as long as these ex-employees have the abilities to work for the company. There are several reasons why so many CGO agree this kind of strategy to retain the talents just like “good horse eats grass back”. Firstly, by means of re-cooperation and frankly communication, the company can understand the real reason of the resign. Hence, the manager can take the specific strategies to retain the talents. Secondly, the employees normally have complicated circumstance which leads them to resign. Most of these reasons are disappointing relationship with colleagues, superiors and subordinates, unhappy emotion with work position. However, so many changes have happed by now. Hence, re-cooperating is beneficial to both of the employers and employees. Thirdly, even though these guys were sacked by the employers, they are familiar with the aspects of the company. So, they can work for the company immediately without training which results in low cost. Finally, considering the trend like more and more job-hopping and selecting career with more individual concern, it is a good option to re-cooperate with the ex-employees without pay too much attention to their backgrounds. Retaining talents contains job-shifting within the company, 100% trust, emotional care, heart-contract better than paper-contract, good horse eats grass back and special tasks and so on. 2.9 The strategy of training is the basic issue of using the talents. Training is the basic method to develop and improve the intelligence and quality of the employees. It is the method of communication between the employers and the employees in terms of the knowledge and emotion. Further, it is the basic guarantee of the success of the future career. The strategy of training means how to train and teach the talents, which contains two aspects: (1) Training the talents; (2) Teaching the talents, which is the organic combination of profound training, thought and strategies of teaching talents. For example, ‘teaching students in accordance of their aptitude’. This idiom comes from The Analects-Yong Ye:“Zi says: ‘The advanced knowledge can only be taught to the students with high quality.’”. As quote in Zhuxi Collection, Jingfu Zhang said:” There is no difference between the profound and superficial principle of the sage. However, different training should be afforded to different students in accordance with their aptitude.” It is based on the fully understanding of the their personality. Kong zi claims that he has 3,000 students and 72 wisdoms. Why can he achieve such a great success? The reason is strongly due to his fully understanding and properly teaching his students. According to his saying” Cai is fool, Can is rude, Shi is prejudiced……” it can be seen that he knows his students like the palm of his own hand.
Vol. 3, No. 6 International Journal of Business and Management
138
Lun Yu Xianjin recorded such an example: Zilu, Kongzi’s student, asked him:” Do I have to exactly follow what I heard?” Kongzi answered:” How can you do it without considering the opinions of your father and brothers? “However, when another student, Ran, asked him the same question, Kongzi gived him a totally different answer:” Yes, does what you heard.” At the moment, another student, Gong Xihua, felt confused:” Why did you give two different answers for the same question?” Kongzi said:” Ran hesitates to make a decision, so I encourage him to go ahead. While, Zilu is a rude person, so I have to put him a little bit backward.” For the employers of the time, the up-to-date meaning of ‘teaching students in accordance of their aptitude’ is to afford different training to different employees. For example, for the employees having poor mentality, the employers should improve their mental quality. For the employees lacking of knowledge, the employers should improve their knowledge. The strategy of training includes: Faith training; Persistent learning; Teaching students accordance of their aptitude; Acting is better than knowledge; Subtle influence and. 3. Significance of Studying on Tactics in Using Talents Tactics in using talents is the one of the basis condition of achieving successful career. Further, it is the combination of various scientific knowledge and the sublimation of experience and art of using talents. Therefore, it has being significantly concerned by not only politician, ideologist, militarist and strategist but also ordinary people. Learning and studying the tactics in using talents can enhance the understating of art, knack and tactics in using talents. It also can raise the art of using talents up to a higher conception which would establish the basis for overcoming the difficulties, defeating the opponents, leading and using talents. References Bai, Sha & Lu, Jinglin. (1992). Emperors’ Excellent Schemes. Jinan, Shandong Friendship Publishing Company, Dec. Chai, Yuqiu. (1990). Strategies Collection. Beijing, Blue Sky Press, June. Chai, Yuqiu. (1992). Strategies Collection (Continued). Nanning, Guangxi People’s Publishing House, June. Feng, Menglong. (1994). All Schemes. Beijing, China Superexcellent Publishing House, Dec. Wang, Yuanrui, (1989). Art in Modern Personnel Management. Beijng, China University of Political Science and Law Press, Feb. Zhou, Zhiming. (1991). Excellent Schemes. Beijing, Tidal Press, Jan.
International Journal of Business and Management June, 2008
139
The Corporate Social Responsibility
Practice in the Turkish Automotive Distribution Companies
Ayse KUCUK YILMAZ Anadolu University, 2 Eylul Campus, School of Civil Aviation, 26470 Eskisehir, Turkey.
Tel: +90 535 462 55 90 E-mail: [email protected] Abstract Corporate Social Responsibility (CSR) has become an important subject for business. Corporate Social Responsibility (CSR) is newly emerged concept for Turkish companies. This paper is investigated the current status of CSR efforts in the Turkish automotive distribution companies. Sabanci Holding, Dogus Group and Koç Group are selected as the top three best CSR practice cases for Turkish automotive distributor companies. Sabanci Holding, Doğuş Group and Koç Group have improved practice in the CSR subject at Turkey. Their practice will guide for other companies and will increase of awareness for importance of CSR. Information from has been gathered both through personal interviews and by reviewing web sites of the corporations. This paper is contributed to increased awareness and practical application of CSR principles among Turkish Automotive distributor companies, investors and regulators. The aim of this paper is firstly to define corporate sustainability and corporate social responsibility and then to highlight the corporate social responsibility efforts of the Turkish Automotive distributions companies. Keywords: Corporate sustainability, Corporate social responsibility, Turkish Automotive distributors 1. Introduction Companies that change their viewpoint about environmental and social pressures and integrate sustainability issues to their business strategy will have a competitive advantage over their rivals and accrue the benefits sustainability offers for them (Nemli, 2004). Corporate Social Responsibility (CSR) is a concept whereby organizations consider the interests of society by taking responsibility for the impact of their activities on customers, employees, shareholders, communities and the environment in all aspects of their operations (Wikipedia, 2008). Business is doing more than ever to tackle the sustainability challenge; to recognize social responsibilities, to reduce environmental impacts, to guard against ethical compromises, to make governance more transparent, and be more accountable to stakeholders. CSR is no longer a trend just among large multinational companies operating in developed countries. More and more emerging market companies are seeing the value of committing to responsible business practices. A strong strategy and reputation as a responsible business can help these companies build trust with local stakeholders thereby establishing a local license to operate. Better ways of approaching employee concerns, such as progressive labor relations, have also been shown to enhance productivity and reduce costs associated with recruitment and turnover (International Finance Corporation, World Bank Group, 2008). CSR can contribute to Turkish competitiveness. According to the December 2005 issue of Capital magazine, the five Turkish companies with the best reputations -- Arçelik, Vestel, Turkcell, Koç H./Sabanci, Garanti Banks, and Coca-Cola -- all also have some form of CSR programmes. Some scholars argue that CSR promotes “reputational capital” and trust which sustains long-term relationships. Customers are more loyal (and buy certain brands – such as Fair trade – because they think these brands are responsible. Workers stay longer and ask for lower wages because they get other benefits (Barney and Hansen, 1994). The purpose of this study is to present the main findings from a survey of the Turkish automotive distributor companies on the extent of their CSR policies and practices. The paper is organized into five main sections and begins with explanation of the corporate sustainability and corporate social responsibility. The methodology of research is given section 3. Corporate Social Responsibility Practice in the selected Turkish Automotive distributor companies is given in section 4. The overall conclusion is given last section. 2. Corporate Sustainability and Corporate Social Responsibility Concept Corporate sustainability (CS) is a new and evolving corporate management paradigm. Although the concept acknowledges the need for profitability, it differs from the traditional growth and profit-maximization model in that it places a much greater emphasis on environmental, social, and economic performance, and the public reporting on this performance. CS can be viewed as a new and evolving corporate management paradigm. The term ‘paradigm’ is used deliberately, in that CS is an alternative to the traditional growth and profit-maximization model. While
Vol. 3, No. 6 International Journal of Business and Management
140
corporate sustainability recognizes that corporate growth and profitability are important, it also requires the corporation to pursue societal goals, specifically those relating to sustainable development — environmental protection, social justice and equity, and economic development (Wilson, 2003). Corporate Social Responsibility (CSR) is defined as the voluntary integration by firms of the environmental and social issues in their daily business operations and in their interactions with all their stakeholders. CSR is thus closely linked to the concept of sustainable development, which is a development that "meets the needs of the present without compromising the ability of future generations to meet their own needs” (Agence Française de Développement, 2008). CSR deals with the role of business in society. Its basic premise is that corporate managers have an ethical obligation to consider and address the needs of society, not just to act solely in the interests of the shareholders or their own self-interest (Wilson, 2003). Profit making is the fundamental dimension for an enterprise to sustain, perform and grow, which means wealth maximization and mobilization; whereas social responsibility is the fundamental accountability of the state that focuses on social enlistment in its totality. CSR is also concerned with treating the stakeholders of the firm ethically or in a responsible manner. Ethically or responsible’ means, treating stakeholders in a manner deemed acceptable in civilized societies. Stakeholders exist both within a firm and outside. The wider aim of social responsibility is to create higher and higher standards of living, while preserving the profitability of the corporation, for peoples both within and outside the corporation (Joshi, 2008). CSR has become a crucial element of firms’ efforts to foster sustainable and equitable development within countryside and worldwide since last two decades. Because, in today’s business environment sustainable business success and shareholder value cannot be achieved solely through maximizing short-term profits, but instead through market-oriented yet responsible behavior. Thus, companies, as well as automobile supply manufacturers, should be aware that they could contribute to sustainable development by managing the operations in such a way as to enhance economic growth and increase competitiveness whilst ensuring environmental protection and promoting social responsibility, including consumer interests (Eraslan and Bulu, 2004). CSR contributes to CS by providing ethical arguments as to why corporate managers should work toward sustainable development: If society in general believes that sustainable development is a worthwhile goal, corporations have an ethical obligation to help society move in that direction (Wilson, 2003). 3. Methodology of Research The purpose of this paper is to determine the most successful companies on corporate social responsibility issues based on the data collected through a field survey and to see the corporate social responsibility (CSR) approach of the 3 most successful Turkish Automotive distributor companies, their future projects, and improvement of CSR awareness in the Turkey. In this study, data was collected from two sources, at first; a literature survey is completed about Turkish Automotive distributor companies. These companies have CSR practice. Second, face-to-face interviews are realized on CSR issues of these firms. Their CSR efforts and practices are presented in this study. These companies are leaders in the field. The most important issues according to these managers, and the main basic principles of the companies making a CSR investment, are determined. The aim of this study has been to examine the current and future prospects of CSR practice in Turkish automotive distributor companies. Concerning the interviews, only three leading company are included in the second part of the study. The study enriches the extant literature and provides future research areas. As the subject of the study is open to continuous development, this study shows the current situation on CSR issues via the leader automotive distributor companies in Turkey. Turkey possesses a dynamic domestic market with nearly 50 competing brands and a strong and well-established automotive industry. Many international automotive brands have production facilities in Turkey, either through joint ventures or wholly owned subsidiaries, making Turkey an important international production hub. In 2006, the automotive sector, including the component industry, had exports of USD15.5 billion or 18% of Turkey's total exports, making it the country's top exporting sector. The Turkish automotive sector is in a strong position to attract new large-scale export projects in the coming years due to the cost advantages of its workforce and other production inputs, engineering skills and advanced technological infrastructure, geographic location and zero customs access to the EU market. Ascigil (2003), in her unpublished survey conducted for TESEV explored management attitudes towards CSR in Turkey. Using Caroll’s (1979) and Aupperle’s (1994) contextualized questionnaires, Ascigil found that 75% of the managers included in the survey gave priority to economic criteria when making decisions whereas 19.11% gave priority to ethical criteria and only 6% to legal criteria. Ascigil notes that Turkish managers do not differentiate between legal and ethical responsibilities as evidenced by the structural analysis of their responses. Furthermore, the study shows that customers are considered to be the most important stakeholders by 75.8% of managers; employees being the second by 50.8% and the society at large by only 24.3%. According to the same survey, 53.5% of the managers would not give priority to ethical considerations if these would negatively impact economic performance.
International Journal of Business and Management June, 2008
141
“Quality” and “Customers” are the most frequently used concepts in companies’ mission statements by 61.5%. “Society” is mentioned in only 22.1% of statements whereas “Profitability” is mentioned only in 3.3%. This may be related to the timidity regarding wealth and concerns about the legitimacy of business. Ascigil notes that the mere existence of a mission statement positively affects management attitudes towards CSR and that companies’ awareness of CSR increases with post graduate education and with an increased share of foreign capital. She further notes that 49.7% of managers consider themselves as reactive with respect to CSR issues, 13.6% totally ignore the concept and 33.5% believe that they handle CSR as a strategic matter. She concludes that CSR in Turkey has not moved beyond a public relations matter in Turkish companies. The research is conducted to major Turkish automobile distributor companies in semi-structured in-depth interviewing, high level managers, environment managers, quality managers and logistics managers. Information from has been gathered both through personal interviews and by reviewing web sites of the corporations. This paper is contributed to increased awareness and practical application of CSR principles among Turkish Automotive distributor companies, investors and regulators. Further data on the background information of holdings is obtained from company records, annual and internal reports. 4. Corporate Social Responsibility Practice in the Turkish Automotive Sector GfK Turkey has completed third “The Leaders in Social Responsibility in Turkey” survey, which they first started in 2005. This year framework of the year, which covers 1305 people, has been expanded to include the perceptions of business circles regarding corporate social responsibility in addition to those of the public. In Turkey there are tens of companies which are aware of the concept of corporate social responsibility and which are actively working on the subject. Sabanci Holding, which invests an average of Euro 6.6 million a year just in environmental issues, is just one of them. The Holding spends approximately €1 million on reducing emissions and another €3.5 million just on purification of waste water and solid waste. Since 1974 it has via the Vaksa foundation invested US $1.11 billion social projects. This is why Sabanci Holding has been chosen as the most successful company in GfK Turkey survey of “The Leaders in Social Responsibility in Turkey” for the last three years (Firat, 2007). Business interest in CS and CSR is growing in Turkey. The aim of the research is to investigate leading Turkish automotive distribution companies’ practice to CSR. This study is offered to the best samples of the corporate social sustainability practices in the Turkish Automotive Sector. The reason why these companies is selected for the research is that these companies are the leading companies in their sectors, they are innovative firms, they have quality management systems, and hence are more likely to have a positive approach to corporate sustainability and have integrated environmental and social dimensions in their sustainability strategies. The pre-research studies showed that only a few of these companies have formal CS and CSR strategies. So it was decided that to examine the sustainability practices of these few companies would be more informative about sustainability in Turkey. Turkish companies are at the beginning of sustainability journey. In this section, Dogus Group, Sabanci Group and Koç Group are selected as best samples according to the corporate sustainability efforts and related practice. 4.1 The corporate social responsibility practice in the Doğuş Group The Doğuş Group combines its business development and growth across a variety of sectors and dozens of companies with strong commitment to social responsibility, based upon an approach transcending commercial investment and interests, and carries out these two disparate activities in a holistic way. Today, major responsibilities fall upon both corporations and individuals to enhance social welfare and promote development that is sustainable economically, socially and environmentally. These corporate responsibilities are classified as: Economic (being productive and profitable), Legal (complying with regulations and laws), Ethical (acting in accord with social norms and expectations, as well as the body of law) and Social (voluntarily contributing to solving social issues). Well-attuned to its corporate responsibilities, the Doğuş Group aims to make a difference socially by integrating this commitment into its code of conduct and throughout its work environment. At the Doğuş Group, their understanding of “Corporate Social Responsibility” rests upon helping to create the future of our country and our world. Dogus Group work to ensure that this perception is shared by as broad a base as possible and that it takes an even stronger foothold. This socially responsible philosophy and outlook is best demonstrated in projects implemented by the Group and its companies in education, culture, the arts, sports, health and the environment, as well as in the constant and systematic support provided for these undertakings. As an indication of its sensitivity towards sustainable development, the Doğuş Group has become one of the companies to sign the United Nations Global Compact asof April 2007. By signing the Global Compact, the Doğuş Group's corporate attitude, based on awareness of social responsibilities and commitment to contributing to society, will include compliance with the ten principles of the United Nations. The Global Compact initiative, with a vision of “sustainable and inclusive global economy” and based on voluntary participation, was launched when the
Vol. 3, No. 6 International Journal of Business and Management
142
Secretary-General of the United Nations, Kofi Annan, called upon business leaders during a speech on the “Millennium Development Goals” at the 1999 Davos World Economic Forum. Subsequently, Ten Principles were established under headings such as human rights, working standards, environmental protection, and fight against corruption. Companies from all over the world started to join the initiative and to declare that they would integrate these global principles with their business strategies, operations and cultures. Through existing and planned projects of social responsibility, Doğuş Otomotiv seeks to enhance society and the environment, by improving living standards. Due to this fact, at the heart of all projects lies the quality of human life. Every year, hundreds of Turkish citizens lose their lives in traffic accidents. In light of this tragic statistic, Doğuş Otomotiv implements a variety of social activities to instill awareness of traffic rules, and thereby reduce the incidence of traffic-related casualties. Sponsoring pioneering projects such as “Traffic is Life!” and “The Backseat is mine”, Doğuş Otomotiv underlines crucial topics such as widespread provision of training in safe driving techniques and of appropriate traffic-related education at young ages. Responding to the need for well-trained and qualified employees, one of the industry's core concerns, Doğuş Otomotiv supports the establishment of training labs at industrial schools. Instructors and students selected for these Training Labs have the opportunity to gain in-depth knowledge of the Volkswagen brand and technology through theoretical and practical training courses offered at the workshop and computer lab. Each year, the Volkswagen Training Lab offers training to 32 students at Şişli Industrial School in two classes of 16 students, and to 18 students at the Kartal Samandıra Industrial School (Dogus Group, 2008). 4.2 The corporate social responsibility practice in the Sabanci Group With this policy statement, the Sabanci Group stresses CSR principles and the importance and priority given to the topic by the Group. Based on the accepted core values of modesty, respect and proximity to people, the Sabanci Group regards basing all corporate conduct on the awareness of CSR as an unchangeable core component of its management approach. Sabanci Group expects all of their establishments that constitute the Sabanci Group to manage the economic, social and environmental impact of their actions with responsibility and to place priority on the development of society. Sabanci Group does not regard the scope of their CSR limited to just their business operations or their impact. Sabanci determine their level of CSR and its priority on what is good for society and the environment as a whole. Sabanci Group pursues a pioneering role with regard to actions that protect democracy, human rights as well as the environment. As the Sabanci Group, the SA-Ethics program prepared and put into practice in accordance with the principles of CSR constitute a guide to their business operations (Sabanci Group, 2008). The basic principles that govern Sabanci Holding CSR practices are (Sabanci Group, 2008); 1- The Sabanci Group fulfill their social and environmental responsibilities toward society in all places that they operate, in close collaboration with their shareholders, employees, public, non-governmental organizations and other stakeholders. 2- The Sabanci Group regards their human resources as the most significant component in creating sustainable growth. Sabanci Group ensures that all employees take advantage of their personal rights as members of the Group, fully and accurately. Sabanci Group treats their employees with honesty and fairness; they are committed to creating a non-discriminatory, safe and healthy work environment. They are undertaking efforts to enable the personal development of all employees while pursuing a balance between their private and professional lives. Any discrimination within the organization based on race, religion, gender, age, political opinion, language, physical challenge or similar reasons are not tolerated. Sabanci Group strive to ensure that people of different beliefs, views and opinions work together in harmony by creating a positive and cordial work environment that supports cooperation and prevents conflict. Sabanci Group administers programs that contribute to preserving employee health that they accept as important to ensuring their employees’ quality of life and success. The Sabanci Group believes that all employees deserve to work in a healthy and secure work environment consistent with human dignity. Sabanci Group employees are their most valuable assets and they strive to provide employee safety and security as their primary goal. 3- The Sabanci Group manages the environmental impact of their activities with a sense of responsibility. All of Sabanci Group companies are required to identify and apply the necessary improvements and development activities that minimize or eliminate negative environmental impact. Sabanci Group requires their companies, beyond their legal requirements, to apply the best environmental solutions to all they do and to support any initiative that will develop and deploy environment-friendly technology and enhance environmental awareness. 4- The Sabanci Group struggle toward the improvement of society pursuant to their sense of corporate social responsibility. Sabanci Group encourages their employees to take part in social and societal volunteering. 5- The Sabanci Group develops and implements approaches to ensure that all of their partners and particularly their suppliers act in accordance with social responsibility standards of the Group.
International Journal of Business and Management June, 2008
143
6- The Sabanci Group shows sensitivity to the traditions and culture of Turkey and other countries in which they operate. Sabanci Group complies with all legal regulations currently in effect. 7- The Sabanci Group encourages their Group companies to comply with international standards and assure that their operations are certified. All principles of this policy statement are put into practice in accordance with the relevant regulations; relevant units audit the level of implementation. Sabanci Group considers the success of the companies with regard to social responsibility activities as a significant criterion for evaluating overall company performance. The Sabanci Group share CSR activities realized by their Group with the public via annual reports and on their website. All of their executives and employees, starting with the CEO of H.Ö. Sabanci Holding A.Ş., undertake accountability for carrying out CSR activities. This policy document has been prepared to share with their employees, shareholders and all other stakeholders, their public commitment on the part of the Sabanci Group to fulfill its responsibility to help create a better world and a better future. 4.3 Corporate social responsibility practice in the Koç Group Established in 1926, Koç Holding operates in the automotive, durable goods, food, retailing, energy, financial services, tourism, construction and IT industries. Koç Group has 88.912 employees and 14.000 dealers as well as agencies and after-sales services and operates having in mind international standards in the areas of corporate governance, corporate social responsibility, environmental protection, customer satisfaction and human resources. Koç Holding is not only the largest company in Turkey, but it is also rapidly climbing the steps in the ranking of world's 500 largest corporations, with leadership positions in profitable business lines. Total exports of Koç Group account for 12% of Turkey's total exports, while Koç Holding and 19 publicly traded Group companies comprise 16% of the total market value of companies traded on the Istanbul Stock Exchange (Koç Holding, 2008). Koç Holding CSR Projects are presents in the following parts. Since its establishment, Koç Group has worked to give back to its country through projects that will add value to the community. Every year Koç extends thousands of scholarships and initiates numerous projects in the arts, environment and healthcare sectors. In addition to projects at home, Koç Group sponsors events and activities abroad in order to promote Turkey in the international arena. A pioneer in Turkey in countless areas, Koç Group has broken new ground by establishing the country's first private philanthropic foundation, Vehbi Koç Foundation, which in turn signed up to many “firsts” like the first privately operated museum, first industrial museum and first student dormitory. Koç Holding carries out projects all of which share the common aim of being an engine of change for economic and societal transformation by striving for excellence in all its activities and commitments. The Group's 80th anniversary provided an impetus to add new projects to complement and expand past efforts. One of the major CSR projects initiated in 2006 and aimed to increase attractiveness of vocational secondary schools. As a major employer of blue collar workers, Koç invests in their education from the secondary school level, thus bringing attention to the issue of the need for skilled workers on one hand, and unemployment on the other. Thus it is envisioned that the project will support Turkey's bid for membership to the EU by triggering a structural change in the economy through productivity increase and enhanced value creation. This project was developed to create awareness among public and to set off a public debate among the private and academic circles on the needs of vocational education. Koç Holding has pledged to grant 8,000 students scholarships throughout their education, while providing internship opportunities and priority in employment. The Vehbi Koç Building of the Faculty of Vocational and Technical Education in Adıyaman was opened on September 20, 2006. The Faculty will be the main pillar of a university to be established in this southeastern city. Foundations for the building were laid in 2005 by Koç Holding and Vehbi Koç Foundation and construction has been completed in one year at a cost of USD2 million. Limon and Zeytin, the characters of cartoonist Salih Memecan's popular Sizinkiler series, came to life in a children's musical performed by the BKM Players. Nearly 100,000 children saw the show, which was performed in Istanbul and then in 16 cities in Turkey through the support of Koç Holding as part of its 80th anniversary celebrations. Koç Holding has sponsored the Turkish Radio & Television (TRT) April 23rd International Children's Festival for the past ten years. In 2006, children from 45 countries, representing a variety of languages, religions and races participated in the Festival at Antalya's antique Aspendos Theatre in a celebration of brotherhood, love, peace and friendship. After replacing the wax figure of Mustafa Kemal Atatürk, the founder of Turkish Republic, in 2005, donated a copy of the wax figure to Atatürk's Mausoleum in Ankara on April 23rd 2006 as a present to the Turkish public. As a tribute to its 80th anniversary, the Group launched in 2006, a grassroots effort to spread social responsibility efforts through its distribution network in 81 Turkish cities which will be celebrated with a new project at the Group's Anniversary, during the last week of May every year. The initiative asks all distributors, 87,000 employees and 15 thousand local subsidiaries to bring in personal involvement and creativity to address a communal problem such as renovation of a school, building of a park or even cleaning a lake. The projects encompassed a wide variety of ideas:
Vol. 3, No. 6 International Journal of Business and Management
144
144 focused on repairing and equipping schools, 51 contributed to orphanages and rehabilitation centers, others dealt with specific social and environment problems. Dealers from Kahramanmaraş, for example, organized annual newspaper subscriptions to 185 families who did not receive newspapers; in Mersin a daycare center was opened to look after street children; and in Van employees of Migros and Tansaş organized a clean-up of Lake Van together with local citizens. Some projects initiated for “For My Country” Day have become part of the way our companies do business. For example, Divan collects and refrigerates the leftovers from industrial meals it serves and donates them to animal shelters. A major part of Koç Group's CSR activities is carried out through Vehbi Koç Foundation. After the enactment in 1967 of the law enabling the establishment of private foundations, which he personally led, Vehbi Koç founded in 1969, the first private philanthropic foundation in Turkey. The Foundation has supported education, culture and healthcare for nearly 40 years. With an endowment of close to USD1 billion, Vehbi Koç Foundation is one of the largest foundations not only in Turkey but also in Europe. It operates The Koç School, a private elementary and high school, and Koç University in the area of education; American Hospital and MedAmerican Polyclinic in the field of healthcare; Sadberk Hanım Museum, Vehbi Koç and Ankara Research Center and Suna - İnan Kıraç Mediterranean Civilizations Research Institute and Kaleiçi Museum in the field of culture. These organizations are among the most highly regarded in their fields in Turkey, serving hundreds of thousands of people every year. Both Koç School and University give scholarship support to promising low-income students over and above the legal thresholds set by law. Koç University has succeeded in becoming a world-class institution of higher learning in a short period of time in terms of various criteria including student rankings, success of graduates in business and academic life and the number of publications per faculty member. In 2006, Koç University faculty members published a total of 412 articles, 24 books and received 11 patents. Of the published materials, 140 appeared in ICI attributed journals. The Scholarship Program, one of the most important activities since the establishment of the Foundation, gave over 5,000 scholarships during the 2006 - 2007 academic years. The Vehbi Koç Award, which was first presented in 2002, was given in the area of education in 2006 to the Governor of Sakarya for his leadership and exemplary efforts in the field of pre-school education. During the year, American Hospital and MedAmerican Polyclinic treated over 220,000 people. SANERC (Semahat Arsel Nursing Education and Research Center) continued its program of research, training and publications and initiated the “Nursing Services and Quality Program” in cooperation with the Ministry of Health. The seminars, conferences and exhibitions organized by Sadberk Hanım Museum, VEKAM and Suna - İnan Kıraç Mediterranean Civilizations Research Institute (AKMED) in 2006 continued to make important contributions to cultural life. The Museum also lent 64 objects for the “Istanbul - The City and the Sultan” exhibition opened in Amsterdam. Adalya, the periodic journal of AKMED, succeeded in becoming the only Turkish journal listed in the 2006 Arts & Humanities Citation Index. Founded in 1994, The Rahmi M. Koç Museum is the first major museum in Turkey dedicated to the history of transport, industry and communications. Housed in magnificent buildings–prime examples of industrial archaeology themselves–on the shore of the historic Golden Horn, the collection contains thousands of items from gramophone needles to full size cars, ships and aircraft. The Museum also conducts corporate social responsibility projects like “MuseumBus Project”. An exceptionally designed bus travels to the villages all around Turkey and provides children the opportunity to see certain parts of the exhibitions. Thus, it allows children to comprehend the significance of technological developments and to gain the conscience to protect historical artifacts. Group companies support the efforts of various key non-governmental organizations such as Turkish Volunteers for Education (TEGV), Foundation for Combating Soil Erosion, Reforestation and Protection of Natural Habitats (TEMA), Family Health and Planning Foundation (TAPV), and Turkish Maritime Environment Protection Association (TURMEPA). Within Koç Group, 21 companies apply ISO 9001 environmental management system at 31 plants. Thirteen companies have attained ISO 14001 certification for waste facilities while eight companies apply OHSAS 18001, the international occupational health and safety management system specifications to minimize the risk of occupational accidents and dangers and provide a safe working environment. Koç Group Occupational Health and Safety Committee meet every month. The Committee's major objective is to share information, formulate a joint stance on universal problems and carry out activities to boost the environmental performance of Group companies. The Koç Group Environmental Reference Handbook, published in 2005, is a vital guide for all the companies in the Group. An environmental inventory has been completed and is being used to prioritize activities. Migros, a member of Migros-Çevko, continues to be a leader in recycling by providing financial support to collection centers and recycling facilities. Energy savings of around 5% have been attained in stores and management offices through computerized control of lighting and temperature, an important step toward preserving the ecological balance and effective use of resources. In 2006, Otokar received the Akdeniz University
International Journal of Business and Management June, 2008
145
Environmental Service Award for the environmental projects it has carried out in Turkey. Otokar has made an important contribution to the effective use of natural resources by treating and recycling all sorts of waste water in a way that does not harm the environment. With the support of the Ministry of National Education, Yapı Kredi and TURMEPA organized the Limitless Blue project to make primary, middle and high school students aware of the need to preserve natural resources. The program reached 3,000 teachers and 400,000 students in 2006. Sensitivity to the environment prompted reforestation projects from several companies including DemirDöküm, Otokar and Koç Allianz. The Koç Allianz project in Çeşme hopes to save the nearly extinct mastic tree. Through the Green Road Project, Opet has planted 261,923 trees and other plants around 302 stations and in areas designated by city governments, taking care to choose plants suited to the region's climate and soil. This project won Golden Compass Awards from the Turkish Public Relations Association in the categories of Social Responsibility and Environment. Yapı Kredi and The Educational Volunteers Foundation (TEGV) organized “I am reading and learning Project”, which is a multifaceted educational project to contribute to the personal and social development of primary school children. The project aims to develop the capacity of school-age children to think, do research, question and analyze. With Yapı Kredi's support, the project will be implemented at TEGV's 11 Education Parks and 57 Teaching Units by volunteer teachers, including well-known academicians, through 2010 in order to instill the love of reading among 50,000 students. Migros prepared and distributed Turkish and Mathematics CDs to students in the fourth through eighth grades in a campaign that benefited 15,000 students. During the year, the company also sponsored the April 23 Migros Theater Festival in cooperation with State Theaters in 11 provinces, bring the colorful and exciting world of the theater to 18,000 children. Throughout 2006, Migros Children's Theater treated 25,400 children in eight provinces to free productions of plays dealing with important topics such as love and friendship. Otokoç cooperated with Aygaz and TEGV to support the “Firefly Mobile Learning Units”. The project targets supporting the personal development of 7-16 year olds by introducing them to computers and encouraging their participation in drama, reading and other activities, In 2006, Otokoç and Aygaz mobile units reached close to 104,000 children. Aygaz organized a Careful Children Campaign for primary school children instructing them in first aid and how to behave in case of accidents at home or in school, earthquakes, traffic accidents and fires. A play concerning Careful Children was performed free-of-charge and a total of 310,000 children were presented with certificates. Arçelik's Volunteers for Education Association, in cooperation with the Ministry of National Education, provides support to elementary-age students in 300 Boarding Schools throughout Turkey. The project aims to contribute to the formation of modern, self-confident young men and women by raising the quality of education received by children studying in boarding schools. The project also intends to create public awareness of the needs of these state-run boarding schools. In 2006, the number of schools covered by the project increased to 101 in 24 provinces, touching the lives of 80,000 students. Effective training was given to 253 teachers who have in turn trained another 1800 teachers. At the end of the eight-year project, the program will have reached close to 200,000 students attending 300 Boarding Schools. Arçelik highlighted its support for culture and the arts by sponsoring the Leonardo: Universal Genius, a traveling international exhibit, in order to expand the values of innovation and technology to a broad audience. Over 114,000 people visited the blockbuster exhibit at the Rahmi M. Koç Museum in Istanbul from November 2 - December 31. The exhibit featured real-life replicas of machines designed according to Leonardo Da Vinci's original drawings. Çatalhöyük: From Earth to Eternity was the first exhibit in Turkey devoted to the excavations of the Hittite city of Çatalhöyük, a site of great interest to archeologists since its discovery. The exhibit at the Yapı Kredi Vedat Nedim Tör Museum reflected Koçbank's ten years of support for the ongoing excavation. Yapı Kredi Private Banking assumed sponsorship of fund-raising events to support the continuing excavation at Afrodisias, one of the most beautiful Hellenistic and Roman sites in Turkey. The temple to Aphrodite and the well-preserved stadium, theatre, baths and marketplace colonnade make the site especially noteworthy. Aygaz has underwritten since 2005, the restoration of the antique city of Sagalassos, 110 km from Antalya in the Ağlasun district of Burdur and is the sole sponsor for the restoration of the Antonin Fountain (161-180 A.D.), the site's most spectacular structure. The work is expected to be completed by 2010. Aygaz was one of the main sponsors of Turks: A Journey of a Thousand Years, 600-1600, a landmark exhibition held at the Royal Academy of Art in London. The exhibit explored the artistic and cultural riches of the Turks from Inner Asia to Istanbul and beyond over a period of a thousand years, showing the artistic diversity that culminated in the splendors of the Ottoman Empire. The exhibit reached a broad audience through a program of gallery talks, workshops and conferences. Koç Allianz provided Fine Arts Insurance to bring various exhibitions to Turkey including a show of Alev Ebüzziya Siesbye's ceramics from the Danish Museum of Decorative Art at the Istanbul Museum of Turkish and Islamic Art, and Drawings from Rembrandt and His Circle from Rotterdam's Boijmans van Beuningen Museum as part of the
Vol. 3, No. 6 International Journal of Business and Management
146
worldwide celebrations of Rembrandt's 400th anniversary. As part of Opet's Respect to History project, rehabilitation of the villages of Alçıtepe, Seddülbahir, Bigalı, Kilitbahir Büyük and Küçük Anafarta was completed and the surroundings renewed. Work was also done on the Eceabat region. Improvements were made in the infrastructure and appearance of the Gallipoli peninsula and villages, an area heavily visited by local and foreign tourists on March 18 and April 24. In the villages on the peninsula, progress was made in key areas such as education, health, environment and tourism. Respect to History educates locals regarding the importance of historical preservation while ensuring that visitors to the area (over the 3.5 million annually) are pleased and impressed by what they see. Classes in English, cleanliness, hygiene and bed and breakfast services were conducted in cooperation with the Popular Education Center; the landscaping of village squares and modernization of museums, toilets and shops have helped encourage tourism to the region, securing a source of income for villages. For Arçelik, investing in sports activities is a part of its vision to support youth and to develop appreciation for and encourage participation to sports. In 2006, Arçelik assumed the sponsorship of the Turkish Basketball League for four years under the “Beko” brand, a symbol of youth, innovation and dynamism. With the long-term cooperation between the Basketball Federation and the Beko brand, Arçelik believes it will make a significant contribution to the development of young athletes who represent Turkey abroad in international competitions. As main sponsor of the Fenerbahçe Women's Basketball Team for the 2004-2006 seasons, Koç Allianz has also contributed to the popularity of basketball in Turkey. Since 1999, Koç Allianz has sponsored Basketball Schools for children from 6 to 16 and sponsored many tournaments. In addition, Koç Allianz is the main sponsor of the Marmaris Yacht Festival, continuing to bond with yacht enthusiasts since 2001 through the sponsorship of the Aegean Yacht Rally. The company widened its involvement in this area with sponsorship of the Winter Trophy organized by the Bodrum Yacht Club Association (BAYK) since 2005. Migros has supported the Special Olympics in Turkey for three years and given sports training to 1,000 mentally challenged athletes for the past two years. In 2006, in cooperation with P&G, it supported the sports training of 1500 handicapped athletes. Opet's Clean Toilet Campaign is one of the longest running social projects in Turkey. The project highlights the importance of cleanliness and hygiene in public restrooms. In cooperation with the Ministry of National Education, nearly 100,000 school children were educated. Furthermore, the restrooms in Opet gas stations were redressed for the handicapped. Standards thus introduced were enforced in all stations. Animated films were prepared to instruct children and adults and these films were broadcast on television. The Opet Clean Toilet Campaign was awarded first place in the International Public Relations Association (IPRA) Golden World Awards in 2004 in the Social Responsibility category as well as in the Golden Compass Award given by the Turkish Public Relations Association. Opet was ranked as one of the “Top Companies” of Turkey in the Social Responsibility category in an annual survey published by Nokta weekly magazine. 4. Conclusion Companies have three general objectives as acquiring of profit, providing of sustainability and corporate benefits. They should be interrelated and supported each other for corporate sustainability. As well as quality and reduced prices, social responsible and appropriate moral activities also became necessary condition for competition. Corporate Social Responsibility (CSR) has become an increasingly important topic in our country. The study shows that Turkish companies are getting more interesting in corporate social responsibility activities. There is a growing awareness of the importance of corporate social responsibility in Turkey. The leading Turkish automotive distribution companies is communicated with environment related non-governmental organizations, local, national, and international press in order to inform stakeholders about their environmental progress. Thus other companies should follow the same path for corporate sustainability. The study also shows that the Turkish companies are getting more interesting in CS subject and CSR activities. Achieving of corporate objectives and improving the company's image is the main reasons of CSR. When the subject of corporate responsibility comes up, Turkish companies most companies still see corporate responsibility as a matter of philanthropy and PR. Environmental protection is weak, and corruption remains a problem. Within the framework of meeting European standards, Turkish companies must make the demonstration of their capacity to build more sustainable modes of production, which is an essential stake to optimize their contribution to the improvement of the quality of employment and to the sustainable development of Turkey. According to research result, the Turkish automobile distribution companies should promote CS and CSR as part of its mandate to create the foundation for a more productive, competitive, knowledge-based economy. This can help to support improving innovation performance, employment growth, and income growth of the Turkish automotive distributor companies. In order to stay competitive in international area, Turkish automobile distribution companies should continuously improve their process efficiency and innovation capacity.
International Journal of Business and Management June, 2008
147
References Agence Française de Développement. (2008). To promote the companies’ “Corporate Social Responsibility”. [Online] Available: http://www.afd.fr/jahia/Jahia/lang/en/home/Qui-Sommes-Nous/Filiales-et-reseau/reseau/Turquie/pid/471?matrix=8946 (January 12, 2008) Ascigil, S. (2004), Turkish Economic and Social Studies Foundation (TESEV) research on CSR, [Online] Available: www.arge.com/UserFiles/File/ARGE%20%20COP%202006.pdf (February 23, 2008) Barney, J., & Hansen, M. (1994). Trustworthiness as a source of competitive advantage. Strategic Management Journal, Winter Special Issue 15: 175–190 Dogus Group, Doğuş Group Social Responsibility. [Online] Available: http://www.dogusgrubu.com.tr/en/icerik/9985/56/web_sektorlere_gore_sosyal_sorumluluk_projeleri/automotive/ (January 29, 2008). Eraslan, I. H., & Bulu, M. (2004). Managing Environmental Risks in Turkish Automobile Supplying Industry for Sustainable Development and Competitive Advantage, Business Strategy and the Environment Conference, Devonshire Hall, University of Leeds (UK 13 th & 14th September 2004) Firat, E. (2007). The leaders in social responsibility in Turkey. Capital Monthly Business and Economics Journal. [Online] Available: www.capital.com.tr/haber.aspx?HBR_KOD=1954 (February 10, 2007) Joshi, E. M., (2008) Corporate Social Responsibility: Global Perspective, Competitiveness, Social Entrepreneurship & Innovation. [Online] Available: http://ssrn.com/abstract=999348 (February 04, 2008) Hanli, H. (2008). Yeni Dünya Düzeni: Avrupa Birliği ve Kurumsal (Toplu) Sosyal Sorumluluk. [Online] Available: http://www.elegans.com.tr/arsiv/57/haber050.html (February 4, 2008) International Finance Corporation, World Bank Group, (2008), Promoting corporate social responsibility in emerging markets, [Online] Available: http://www.ifc.org/ifcext/enviro.nsf/AttachmentsByTitle/fly_SocRespBrochure/$FILE/SocResp_6pbrochure.pdf (February 04, 2008) Koç Group (2008), Koç Holding corporate social responsibility projects. [Online] Available: http://www.koc.com.tr/en-US/SocialResponsibility/SocialProjects/ (January 29, 2008) Nemli, E., (2004) “The status of corporate sustainability in Turkish companies”, Second Global Compact Academic Conference, Pennsylvania, U.S.A. (September 16-18) Sabanci Group (2008), Corporate social responsibility policy and principles, [Online] Available: http://www.sabanci.com/En/st_sosyal_sorumluluk.asp (January 29, 2008) Wilson, Mel. (2003). Corporate sustainability: What is it and where does it come from? Ivey Business Journal, in March/April 2003 issue of Ivey Business Journal, 3, [Online] Available: findarticles.com/p/articles/mi_go1922/is_200303 (February 14, 2008) Wikipedia, the free encyclopedia (2008), [Online] Available: en.wikipedia.org/wiki/2008
Vol. 3, No. 6 International Journal of Business and Management
148
The Tacit Knowledge Transfer of Transnational Corporation Shufang Dong
School of Business Management, Shandong University of Finance, Jinan 250014, China E-mail: [email protected]
Abstract Knowledge is the essential source of enterprise competitive predominance. As the changes of the enterprise environment, the multinational corporation will pay more attention to the effective flow of knowledge and internal integration. But the cross-border transfer of the knowledge has many obstacles, especially the tacit knowledge sharing. As viewed from the tacit knowledge characteristic, it is demonstrated that the human communication is the effective method to promote tacit knowledge. Keywords: Tacit knowledge, Knowledge shift, Transnational Corporation 1. Introduction Knowledge is the essential source of enterprise competitive predominance; it has turned into scholars’ consensuses. But the knowledge sharing is very difficulty especially in different countries. Through the research to 26 transnational enterprises, Teece (1981) obtained the conclusion that the proportion of knowledge transfer cost occupies the total cost of project is from 2.25% to 59%, with an average of 19.16%. Knowledge mainly includes two types, explicit knowledge and tacit knowledge. The explicit knowledge is the knowledge which can be clearly expressed by language, letter, data, chart and formula, which possesses characteristics of standardization and systematization, and is easy to communicate and share and generally includes product appearance, document, data base, instruction, consensuses, computer program and other forms. With the rapid development of information technology, explicit knowledge sharing and application is become extremely quickly and highly effective, interior network, knowledge database, knowledge map, electric forum and E-mail are being used in many transnational enterprises. Tacit knowledge is the knowledge with high individualization, which possesses the character that is difficult to be standardized, and always roots in the behavior itself and is not easy to share with others, and generally exists through individual experience, technical knack, organizational culture and other forms. Thinking mode, belief, viewpoint and value view also belong to tacit knowledge. Comparing with explicit knowledge, the tacit knowledge more depends on the communication among individuals and its sharing is more difficult. The spread of the tacit knowledge is more dependent on space, knowledge distance, cultural distance and absorption ability. 2. The tacit knowledge sharing of transnational corporation Through system analysis of knowledge management practice, we can see that the tacit knowledge transfer of transnational corporations mainly includes following forms. (1) Scene demonstrations inspection. Through scene demonstration study, TNCs managers can learn the advanced experience and knowledge of other enterprises, thereby promoting transnational corporations internal organizational learning and knowledge transfer. For example, to enable the management staff to NUMMI(a joint venture between GM and TOYOTA enterprises) to learn its unique production practices, General Motors Corp launched a series of professional and demonstration activities. Each demonstration activities are reflected in their outstanding management policies, practices and systems, some of the design for the middle and senior management, while the other is for the bottom. (2) Conference and forum. The conferences and forums with various topics periodically can strengthen the link between the parent company and overseas subsidiaries. The managers of the parent company and overseas subsidiaries can realize knowledge sharing through formal and informal individual communications in the conference or forum. More communications will produce more talking and stimulate employees’ sixth senses, intuitions, thinker modes, beliefs, experiences and other tacit knowledge, and make for the speed of “exteriority” and “socialization”. For example, Matsushita's overseas branches will be held regularly “zoning meeting” to compare their own performance, and highlight “best business”. Through “zoning meeting”, those firms with similar scale of the operation, similar business problems and similar stage of production can be regular exchange of information and dissemination of knowledge. (3) Cross-functional team. The cross-functional team is generally composed by employees from different overseas
International Journal of Business and Management June, 2008
149
subsidiaries or departments, and it is a sort of organizational form independently existing for completing certain project or plan. Cross-functional team is a very flexible form, members in the different units within the organization can face-to-face exchange. Because the team members come from different departments, have different knowledge and experience, when they work together, they can observe and imitate each other, the new knowledge was soon learned and mastered, so cross-functional team cross-functional team is of benefit to the tacit knowledge sharing in the internal of multinational companies. P & G's “European brand teams” is a success story of cross-functional team. The manager of “European brand teams” is the manager of a subsidiary of outstanding leadership, its members include other subsidiary responsible for manufacturing and advertising manager from Procter & Gamble Europe headquarters, as well as the headquarters of functional managers. “European brand teams” provides a forum for the exchange of knowledge, where managers can constructively address such issues as standard packaging models, and consistent brand positioning, as well as common advertising theme, and so on. They are even able to discuss some of the more competitive strategy on a wide range of issues, such as product display for the first time, the threat of competition for collaborative response. (4) Personnel rotation. As early as in 1977, Edstrom and Galbraith noted that the rotation and transfer of personnel in the multinational corporations plays a very important role. With the increasing importance of the transfer of multinational global knowledge, personnel rotation, as for the flow of effective knowledge management tools, had become increasingly used by multinational corporations. Personnel rotation can enhance the communication between knowledge holders and recipients, and eliminate the cultural differences between the two, at the same time will also help to establish a personal network which can enhance their own knowledge and technology dissemination. In addition, personnel rotation will also help staff understand Enterprise business from various angles, so that the knowledge more easily transmitted and put into practice. In the management of practice, there are usually three types of staff rotation of jobs: the first is the parent company for the main staff rotation and that various Managers of subsidiaries are assigned by the parent company. For example, Panasonic's foreign managers come from parent company, and they will come back after work 5 to 10 years there. The second is the staff rotation of the subsidiaries. For example, the most promising managers worked in Philips, spent mostly overseas, they work two to four years in every subsidiaries. The third is transnational personnel rotation, that is, mobility occurred in a balanced manner of parent companies and subsidiaries and affiliates. For example, Ericsson will form several team from 50 to 100 engineers and managers every two years. These teams will be flowed between Swedish parent company and all subsidiaries according to need. (5) Educational training. The educational training is propitious to widen the transmitted channel of knowledge. Through taking part in the training project together, managers from different departments in the transnational corporations can develop formal and informal communications and establish close human relation network. The research of training project in Xerox Company shows that most skills learned by technical commissaries who take part in the training are not from formal training tutorial, but from some activities outside the relative domains, such as the participation to solve the actual problems and informal discussions with colleagues. In fact, when technical commissaries drink coffee, have lunch and solve difficult problems, their experiences told each other have very important meanings for their individual learning. In addition, the educational training can also create organizational culture. Through training, employees are taught blueprint for the development and value systems of enterprises. For example, Matsushita requested that all white-collar employees accept the “cultural and spiritual” training during the first six months. They not only learn the tenets and seven spirits of Matsushita, at the same time, they have to study more comprehensive philosophy of Matsushita Konosuke. At the end of the educational training, the staff need to further discuss how to implement this philosophy into their daily work duties. In this way, the company's objectives and value system will become the staff’s intrinsic concept. Also, it will become the basis for business decisions. (6) Practice community. The practice community means the team of knowledge communication and sharing composed voluntarily by those employees with special specialties or works. The knowledge transfer process in the practice community can be looked as a fine circulation of “communication- trust- learning- sharing”. Since they have the same interest and common aspiration of share the common knowledge and experience, so when members exchange experience together, it will develop into a common behavior, a common set of practices and a common vision, then members of the community create an atmosphere of mutual trust. In such an environment of mutual trust, members of the community are willing to take the knowledge and experience of others initiatively. To learn more knowledge, the more they are willing to share with other members of the knowledge, and knowledge sharing can trigger further exchange between members, thereby the virtuous circle of knowledge transfer in the community of practice is formed. For example, except for some directors, most members is voluntary to take part in the practice
Vol. 3, No. 6 International Journal of Business and Management
150
community of Xerox Company, and members of the community are from various units, and they have diversiform backgrounds, and the knowledge leader is produced according to the actual problem by community members, and the high degree trust and communication exist among members, and though members are good at utilizing information technology, they will communicate usually face to face, and whatever the knowledge they have learned themselves or knowledge from exterior, they will share with community members to the sky. 3. Conclusion Knowledge is the source of enterprise competitive predominance, and tacit knowledge sharing is fundamental of enterprise constant innovation. So the knowledge sharing within the organization, in particular the tacit knowledge sharing has always been the core of enterprise knowledge management, especially multinational companies. Because of the character differences between tacit knowledge and explicit knowledge, their transfer modes are different. However, that doesn’t mean the insulation of these two modes. The electrical spread offers guide for the transfer of the tacit knowledge, but through the information knowledge loads explicit knowledge, it can indicate the owner of the tacit knowledge as a guider. Inquirers can find the potential owner of the tacit knowledge through database, electrical forum and other information system, and then obtain the tacit knowledge what they need through individual communications face to face. In other words, the information technology of promoting explicit knowledge and interpersonal communication of promoting tacit knowledge can be combined. To truly achieve all units of the effective transfer of knowledge, Multinational corporations must also treat the relation between the electrical spread and human communication exactly. References Simonin, B.L. (1999). Ambiguity and the Process of Knowledge Transfer in Strategic Alliances. Strategic Management Journal. Teece,D.J. (1981).The Market For Know-how and the Efficient International Transfer of Technology.
International Journal of Business and Management June, 2008
151
The Classical Model of Decision Making Has Been
Accepted as not providing an Accurate Account of
How People Typically Make Decisions Bin Li
Foreign Languages Department, Guang Dong University of Finance Guangzhou, 510521, China
E-mail: [email protected] Abstract Decision making is an accepted part of everyday human life. People all make varying importance decisions every day, thus the idea that decision making can be a rather difficult action may seem so strange and unbelievable. However, a large number of empirical studies have shown that most people in organizations are much poorer at decision making. Therefore, people began to pay more attention to understand hot to make a suitable decision. Keywords: Decision making, Rational decision-making, Demonstrate classical decision making 1. Introduction Decision making is one of the most central processes in organizations and a basic task of management at all levels. According to Cole (2004:151), decision making is “a process of identifying a problem, evaluating alternatives, and selecting one alternative.” During the whole process, people are making the best choice from among several option based on the current situation. Additionally, Rollinson (2002) considered that decision making is the process of producing a solution to a recognized problem. There are three basic activities involved in decision making: intelligence activity, design activity and choice activity. Although all the decisions are made based on these three main activities, not all decisions are the same (www.bized.ac.uk). Some are relatively simple and others involve a more complex range of considerations. Consequently, people need an approach to understand decisions making. Good decision making is an essential skill for career success generally, and effective leadership particularly. 2. The classical decision making model The traditional approach to understanding individual decision making is based upon classical decision making theory or the rational economic model (Huczynski & Buchanan, 2001). The classical view of decision making has always integrated the concept of rationality and rational decisions within the whole process of discussions and prescriptions. Obviously, a rational decision-making process is often suggested as the way in which decisions should be made trough those three activities, and it involves the following strictly defined sequential process shown in Chart 1 (Heracleous, 1994). It begins with seeking to ask the right questions, continues by discovering creative answers and finishes by making sure that the chosen solution is valuable and useful. According to Hucaynski & Buchanan (2002:740), “rationality is equated with scientific reasoning, empiricism and positivism and with the use of decision criteria of evidence, logical argument and reasoning”. And the rational decisions are decisions which are based on the rationality. The advantage of the classical model is to indicate a rational approach that can be applied to the business of reaching decisions in organizations. On the other hand, Lee et, al. (1999:18) considered that “classical decision theory views the decision maker as acting in a world of complete certainty.” It assumes that “decision makers are objective, have complete information and consider all possible alternatives and their consequences before selecting the optimal solution.” (Huczynski 2001:738) Based on the definition above, it is clear that classical decision making theory is derived from several assumptions. However, all those assumptions are not reality within this modern information age. Herbert (1981) agreed that this process is underlain by certain assumptions and characteristics, which are highly unrealistic in practice and are widely argued among managerial field. In the managerial field, how to make a suitable decision is very important. Faulty strategic and operational decisions can and must seriously weaken companies’ competitiveness. It is possible misleading to a completely wrong developing direction. According to the research by Robbins (2003), he considered that classical model of decision making could not fully represent how people make decisions in organizations, because people do not know how accurate the data is used to make decisions, how reliable are the estimates of the probabilities and how useful the data is related to the event.
Vol. 3, No. 6 International Journal of Business and Management
152
Besides all above reasons, there are others evidence to challenge classical assumptions, which to demonstrate classical decision making model is not providing an accurate account of how people typically make decisions. In general, based on the research by Robbins (2003), he summarized all the assumptions of classical decision making model illustrated in Chart 2. Robbins (2003) considered that all these assumptions are subjective and can not represent the real situation in the practice. Cole (2004) also agreed with that all these assumptions would be correct as people in a completely perfect world where does not exist. Moreover, all these assumptions would be disadvantages as people could not discover this model entirely relies on the accuracy of the data used and must require qualitative input to give complete picture. Based on the disadvantages of classical model of decision making, in the following section, it is going to stick to the sequence of classical model of decision making to challenge its assumptions in details one by one. 3. Further analysis in the decision making model In the first step of classical model of decision making, people have to identify what problem they face or deal with. And the model assumes that all the problems are easy to be defined and discovered. In fact, there are two types of problem. One is bounded problems, which means that “problems that can be more easily defined and treated as separate from the context in which they exist” (Rollinson, 2002:254). Under this situation, people can easily define the problem, because the problem is usually small, less important and is not complex without limitation by time or cost. Obviously, these kinds of problems will have actual solutions in practical experience; people have enough knowledge to define the nature of the problem, such as an organization makes a decision to purchase a new machine to replace the old one, which is an easy decision to make without more limitation by others factors. Thus people can continue to make decisions through the classical model. However, there is another kind of problem which is unbounded problems. In general, these kinds of problem are much more complex then bounded problems in terms of scale, implications or time of problem. It is necessary to recognize the nature of the problem before identification. Rollinson (2002) defined that unbounded problems are “ambiguous problems that are harder to define and which cannot easily be separated from the context in which they exist” (Rollinson, 2002:254). Therefore, in the first step of the classical decision making process, people are hard to clearly define the nature of every problem, so that there is a trap within the first step, because there are many unknown factors surrounding the problem. People in any organizations who make decisions have to be care about the real nature of the problem and various factors which influence the development of the whole problem before defining. Moreover, unbounded problems may be new problems which people do not have any kinds of knowledge and solutions. Under this situation, people are lacking knowledge to handle the problem leading to making wrong decisions. To illustrate an unbounded problem in organization, Koran electric giant Samsung Electronics has some worries about its ageing product line in the early stage of its development. This scale of the problem is much larger and has potentially serious implications for the whole organization, which has strong influence in the future. However, although Samsung has noticed about the age of its products, there is little clarity about whether a problem actually exists or what its nature might be. Also, management team did not find out a clear solution at that time, hence a replacement range of products cannot be selected, because the cost, sales and production implications are not known. In the case of this example, it is proved that the nature of problem is quite different. Only under the situation, which people can easily define the actual nature of the problem, people can apply the first step of classical decision making. Through discussing the bounded problem and unbounded problem, it is clear that the nature of each of those problems is different. It is not just the size of the issue that is significant. Consequently, the first assumption of classical model, which problem is clear and unambiguous, did not come into existence. As to the third stage of the classical model, that comprehensive search for alternative courses of action and their consequences is feasible and is carried out is completely wrong. It assumes that the decision maker have entire information about the consequences of alternatives. This assumption is the most serious mistake in decision making theory. To illustrate its mistake, there are several aspects to challenge decision makers’ abilities and awareness. One is that some alternatives will not have occurred to the decision maker, since there are too many. Cole (2004) suggested that everything in the world is changed all the time. Decision makers can not catch all the information by his or her ability. When decision makers intend to legitimize their chosen courses of action, by the appearance of rationality, “empirical studies show that memory search is the initial tactic followed, and only if the problem persists is a more extensive search undertaken”(Heracleous1994:18). This statement indicated that most people making decision depend on their brain. And this kind of search for possible solutions and their consequences is largely informal, qualitative and conditioned by the organizational nature and regulations.
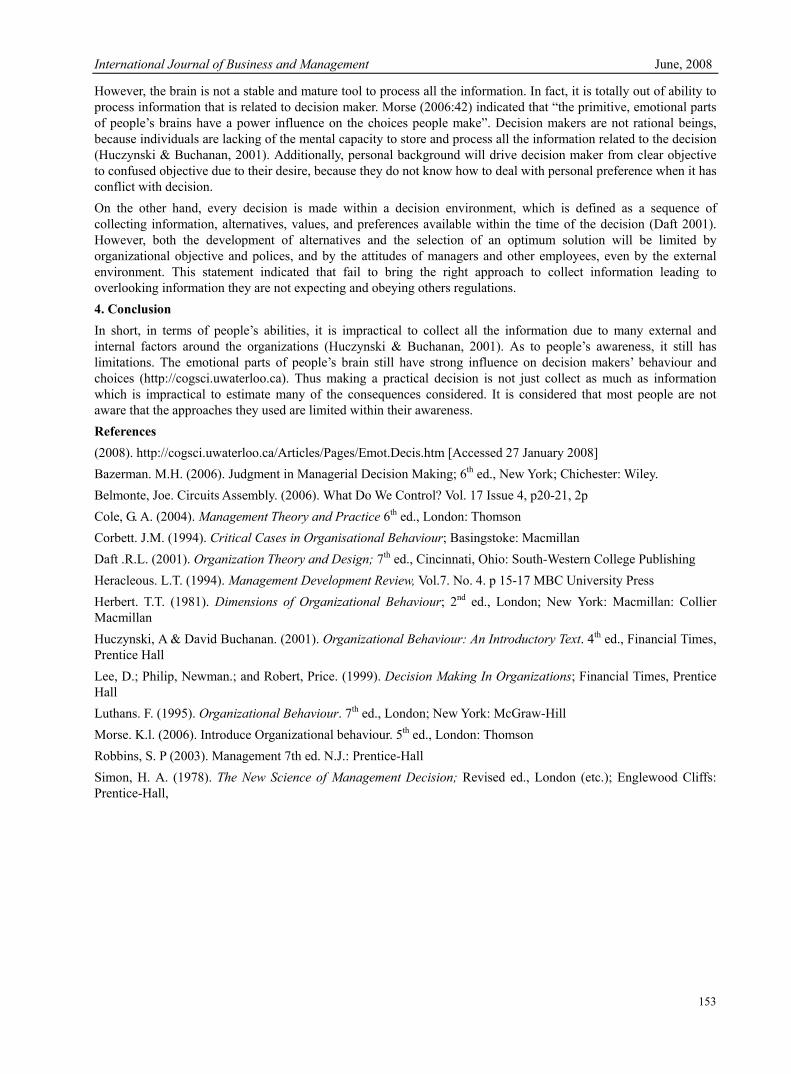
International Journal of Business and Management June, 2008
153
However, the brain is not a stable and mature tool to process all the information. In fact, it is totally out of ability to process information that is related to decision maker. Morse (2006:42) indicated that “the primitive, emotional parts of people’s brains have a power influence on the choices people make”. Decision makers are not rational beings, because individuals are lacking of the mental capacity to store and process all the information related to the decision (Huczynski & Buchanan, 2001). Additionally, personal background will drive decision maker from clear objective to confused objective due to their desire, because they do not know how to deal with personal preference when it has conflict with decision. On the other hand, every decision is made within a decision environment, which is defined as a sequence of collecting information, alternatives, values, and preferences available within the time of the decision (Daft 2001). However, both the development of alternatives and the selection of an optimum solution will be limited by organizational objective and polices, and by the attitudes of managers and other employees, even by the external environment. This statement indicated that fail to bring the right approach to collect information leading to overlooking information they are not expecting and obeying others regulations. 4. Conclusion In short, in terms of people’s abilities, it is impractical to collect all the information due to many external and internal factors around the organizations (Huczynski & Buchanan, 2001). As to people’s awareness, it still has limitations. The emotional parts of people’s brain still have strong influence on decision makers’ behaviour and choices (http://cogsci.uwaterloo.ca). Thus making a practical decision is not just collect as much as information which is impractical to estimate many of the consequences considered. It is considered that most people are not aware that the approaches they used are limited within their awareness. References (2008). http://cogsci.uwaterloo.ca/Articles/Pages/Emot.Decis.htm [Accessed 27 January 2008] Bazerman. M.H. (2006). Judgment in Managerial Decision Making; 6th ed., New York; Chichester: Wiley. Belmonte, Joe. Circuits Assembly. (2006). What Do We Control? Vol. 17 Issue 4, p20-21, 2p Cole, G. A. (2004). Management Theory and Practice 6th ed., London: Thomson Corbett. J.M. (1994). Critical Cases in Organisational Behaviour; Basingstoke: Macmillan Daft .R.L. (2001). Organization Theory and Design; 7th ed., Cincinnati, Ohio: South-Western College Publishing Heracleous. L.T. (1994). Management Development Review, Vol.7. No. 4. p 15-17 MBC University Press Herbert. T.T. (1981). Dimensions of Organizational Behaviour; 2nd ed., London; New York: Macmillan: Collier Macmillan Huczynski, A & David Buchanan. (2001). Organizational Behaviour: An Introductory Text. 4th ed., Financial Times, Prentice Hall Lee, D.; Philip, Newman.; and Robert, Price. (1999). Decision Making In Organizations; Financial Times, Prentice Hall Luthans. F. (1995). Organizational Behaviour. 7th ed., London; New York: McGraw-Hill Morse. K.l. (2006). Introduce Organizational behaviour. 5th ed., London: Thomson Robbins, S. P (2003). Management 7th ed. N.J.: Prentice-Hall Simon, H. A. (1978). The New Science of Management Decision; Revised ed., London (etc.); Englewood Cliffs: Prentice-Hall,
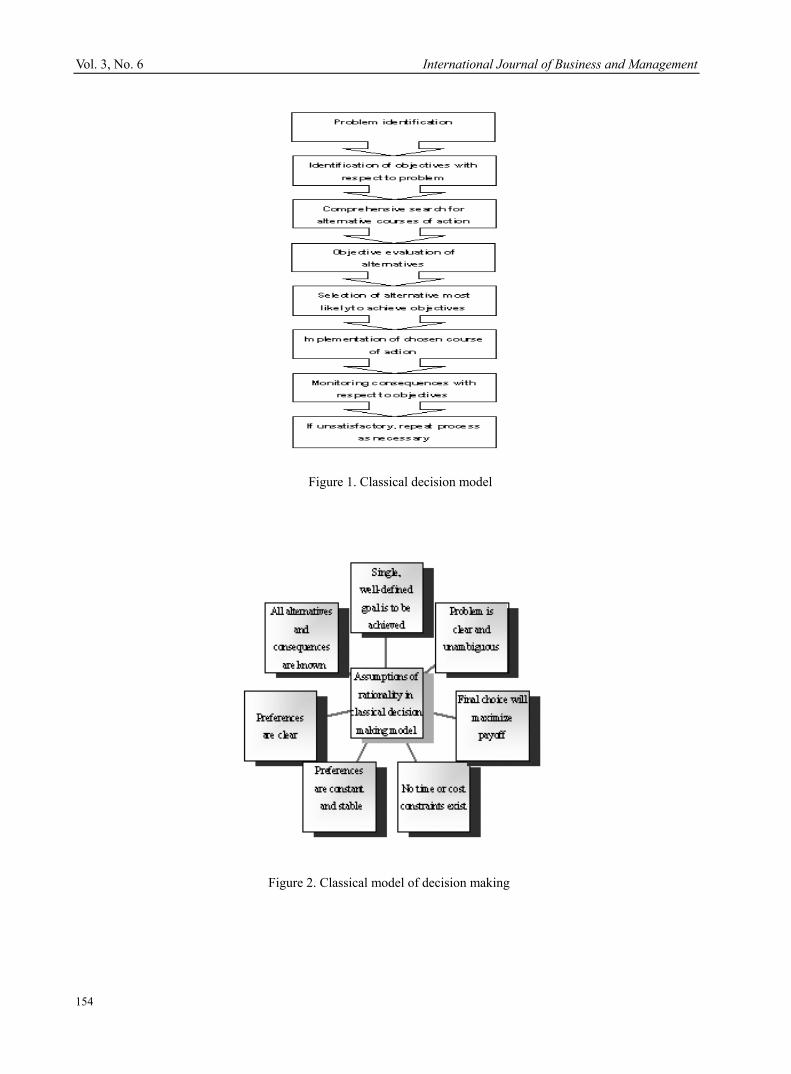
Vol. 3, No. 6 International Journal of Business and Management
154
Figure 1. Classical decision model
Figure 2. Classical model of decision making