International Journal of Information, Business and Management
330
VOLUME 8 NUMBER 2 May 2016 International Journal of Information, Business and Management ISSN 2076-9202 (Print) ISSN 2218-046X (Online)
-
Upload
khangminh22 -
Category
Documents
-
view
0 -
download
0
Transcript of International Journal of Information, Business and Management

VOLUME 8 NUMBER 2 May 2016
International Journal of Information,
Business and Management
ISSN 2076-9202 (Print)
ISSN 2218-046X (Online)

International Journal of Information, Business and Management, Vol. 8, No.2, 2016
ISSN 2076-9202
i
International Journal of Information, Business and Management
ABOUT JOURNAL
The International Journal of Information, Business and Management (IJIBM) was first published in 2009,
and is published 4 issues per year. IJIBM is indexed and abstracted in EBSCO, DOAJ, Ulrich's
Periodicals Directory, ProQuest (ABI/INFORM Global) , ZORA (Zurich Open Repository and
Archive), IndexCopernicus, JournalSeek, New Jour, getCITED, Directory of Research Journals
Indexing, Open J-Gate, Universal Impact Factor, CiteFactor, ResearchBib, EBSCO Open Access
Journals, Scientific Indexing Service, InnoSpace - SJIF Scientific Journal Impact Factor, The Index
of Information Systems Journals, National Central Library Taiwan, National Library of Australia.
Since 2011, the IJIBM is listed and inedxed in the Cabell's Directory in Computer Science and Business
Information Systems (www.cabells.com), which is accepted in many universities for credit towards tenure
and promotion. Since 2013, the IJIBM has been included into the EBSCO (Business Source Corporate
Plus database), one of the largest full-text databases around the world. Since 2013, the IJIBM has been
included into the ProQuest (ABI/INFORM Global) list.
IJIBM is an international journal that brings together research papers on all aspects of Information,
Business and Management in all areas. The journal focuses on research that stems from academic and
industrial need and can guide the activities of managers, consultants, software developers and
researchers. It publishes accessible articles on research and industrial applications, new techniques and
development trends.
IJIBM serves the academic and professional purposes for those such as scientists, professionals,
educators, social workers and managers. It provides new methodology, techniques, models and practical
applications in various areas.

International Journal of Information, Business and Management, Vol. 8, No.2, 2016
ISSN 2076-9202
ii
International Journal of Information, Business and Management
CONTENTS
1 Publisher, Editor in Chief, Managing Editor and Editorial Board
2 EFFECT OF STRATEGIC LEADERSHIP STYLES ON SALES AND EMPLOYMENT GROWTH IN
SMALL AND MEDIUM ENTERPRISES IN NIGERIA
PATRICK OLAJIDE OLADELE, NIYI ISRAEL AKEKE
3 STRATEGY-PERFORMANCE RELATIONSHIP: A SCORING METHOD FRAMEWORK FOR
TYPOLOGICAL RESEARCH
JAMIL ANWAR, SAF HASNU
4 EXPLORING THE LINK BETWEEN INTELLECTUAL CAPITAL AND PERCEIVED
ORGANIZATIONAL PERFORMANCE
AKANBI, PAUL A, PH. D
5 MASSIVELY SCALABLE PARALLEL NEURAL NETWORKS: A BIG DATA EXPERIMENT
SHANNON D. MCMURTREY, PH.D., RANDALL SEXTON, PH.D.
6 A STUDY OF MOMENTUM AND CONTRARIAN STRATEGIES BASED PORTFOLIOS IN US
MARKET
VENKATA VIJAY KUMAR P
7 BEST MODEL OF CSR: AN ANALYSIS OF THE IMPACT OF CORPORATE SOCIAL
RESPONSIBILITY FOR IMPROVING THE SOCIAL DEVELOPMENT OF THE STAKEHOLDERS-
A STUDY ON FOUR PRIVATE COMMERCIAL BANKS
MOHAMMED SHAKHAWAT HOSSAIN, MD. AL-AMIN
8 UNDERSTANDING THE ASPECTS OF CULTURAL SHOCK IN INTERNATIONAL BUSINESS
ARENA
DR. N.KATHIRVEL, MRS. I.M.CHRISTINA FEBIULA
9 ADOPTION OF ELECTRONIC HUMAN RESOURCES MANAGEMENT (E-HRM) TECHNOLOGY
IN PALESTINE
MAHA SALEH, YAHYA SALEH
10 INVESTIGATING THE EFFECT OF INTERNET MARKETING ON CUSTOMERS’ DECISION TO
PURCHASE (CASE STUDY: AMICO INDUSTRIAL GROUP)
MOJTABA FADAEI
11 VARIABLE COSTING AND ITS APPLICATIONS IN MANUFACTURING COMPANY
MD. SALIM HASAN
12 MODELLING THE IMPACT OF INTERNATIONAL FINANCIAL REPORTING STANDARD ON
CORPORATE PERFORMANCE (A STUDY OF SOME SELECTED BANKS IN NIGERIA)

International Journal of Information, Business and Management, Vol. 8, No.2, 2016
ISSN 2076-9202
iii
EZELIORA MARTIN MMADUABUCHI, UGOCHUKWU ORAJAKA AND OKOLI IFEANYI SUNDAY
13 STRUCTURAL CHANGES AND PRODUCTIVITY TRENDS’ EVIDENCE FROM JORDAN’S
MANUFACTURING INDUSTRY (2000 – 2014)
MOHAMMAD.M . ALALAYA, ADEL AL KHATTAB, MAHMAOD AL-RAWAD
14 VALIDATING A RETAIL SERVICE QUALITY INSTRUMENT IN GROCERY SPECIALTY STORES
ISHFAQ HUSSAIN BHAT
15 A STUDY OF DISCOVERING AND DEVELOPING THE CONCEPT OF SCHOLAR
MD. MIZANUR RAHMAN, ATIKUR RAHMAN BAIZID
16 A STUDY ON INFLUENCING FACTORS TO AFFECT THE ECONOMIC STATUS OF LAYER
POULTRY FARMERS IN NAMAKKAL DISTRICT OF TAMILNADU
MR. P.RAVICHANDRAN, DR.A.KHAN MOHAMED
17 REPUTATION RISK MANAGEMENT IN THE INTERNATIONAL OIL COMPANIES
EVANGELIA FRAGOULI, JOSEPH EKRUKA
18 RETAIL COMMERCE & BIG RETAIL CHAINS IN GREECE: THE CASE OF DIY (DO IT
YOURSELF) SECTOR AND THE EXAMPLE OF “IKEA”
EVANGELIA FRAGOULI, PANAGIOTA KOULI
19 WOMEN PARTICIPATION IN INDIAN MSMES IN GLOBALIZED ERA
RAJ KUMAR GAUTAM, PH.D, YOGESH KUMAR
20 ENABLING AND STIMULATING ENTREPRENEURSHIP EDUCATION IN HIGHER EDUCATION
INSTITUTIONS: CATALYST FOR VENTURESOME YOUTHS AND SUSTAINABLE
DEVELOPMENT IN NIGERIA
OLUWASANYA ADEWALE TONY
21 ENTREPRENEURSHIP EDUCATION: CHALLENGES AND IMPLICATIONS FOR EDUCATORS
IN HIGHER EDUCATION INSTITUTIONS
OLUWASANYA ADEWALE TONY
International Journal of Information, Business and Management, Vol. 8, No.2, 2016
ISSN 2076-9202
iv
International Journal of Information, Business and Management
Publisher: Elite Hall Publishing House
Editor in Chief: Managing Editor:
Dr. Muzaffar Ahmed (Bangladesh)
E-mail:[email protected]
Dr. Jia Chi Tsou
Associate Professor, Department of Business Administration
China University of Technology, Taiwan
E-mail: [email protected]
Editorial Board:
Dr. Claudio De Stefano
Professor, Department of Computer Science
University of Cassino, Italy.
E-mail: [email protected]
Prof. Paolo Pietro Biancone
Professor of Financial Accounting, Faculty of Management
and Economics
University of Turin, Italy
Email: [email protected]
Dr. Michael A. Hignite, Ph.D.
Professor, Department of Computer Information Systems,
College of Business
Missouri State University, USA
Email: [email protected]
Dr. Seema Varshney
Assistant Professor, Waljat college of applied sciences
Muscat, Oman
E-mail: [email protected]
Dr. Morteza Rasti Barzoki
Assistant Professor, Department of Industrial Engineering
Isfahan University of Technology, Iran
E-mail: [email protected]
Mr. Mohsen Fathollah Bayati
Department of Industrial Engineering
Iran University of Science and Technology, Iran
E-mail: [email protected]
Dr. Edgardo Palza Vargas
Telfer School of Management
University of Ottawa, Canada
Email: [email protected]
Dr. Solomon Markos
Assistant Professor, Department of Management
Arbaminch University, Ethiopia
Email: [email protected]
Mr. Olu Ojo
Lecturer, Department of Business Administration
Osun State University, Nigeria
Email: [email protected]
Dr. Mohammed-Aminu Sanda
Visiting Research Fellow, Lulea University of Technology,
Sweden
Senior Lecturer, Department of Organization and Human
Resource Management, University of Ghana, Ghana
Email: [email protected]
Dr. Khalid Zaman
Assistant Professor, Department of Management Sciences
COMSATS Institute of Information Technology, Pakistan
Email: [email protected]
Dr. Kartinah Ayupp
Deputy Dean, Economics and Business
Universiti Malaysia Sarawak, Malaysia
Email: [email protected]
Dr. Malyadri. Pacha
Principal, Government Degree College
Affiliated to Osmania University, India
Email: [email protected]
Dr. Arif Anjum
Assistant Professor, M.S.G. Arts, Science & Commerce
College, Malegaon, India
Managing Editor, International Journal of Management
Studies
Email: [email protected]
Mr. Andrew McCalister
Global Research Awardee, Royal Academy of Engineering,
University of Cambridge, UK
Email: [email protected]
Dr. Mohsin Shaikh
Professor & Head, Department of Management Studies
SKN College of Engineering, Pune, India
Email: [email protected]
Dr. M. Razaullah Khan
Associate Professor, Department of Commerce &
Management Science
Maulana Azad College, Aurangabad, India
Email: [email protected]
Mr. Kai Pan
Research Assistant & Ph.D. Candidate, Department of
Software and Information Systems
University of North Carolina (UNC Charlotte), USA
Email: [email protected]
Dr. Sundar Kumararaj
Associate Professor, Commerce Wing, Directorate of
Distance Education,
Annamalai University, Annamalai Nagar, Tamil Nadu, India
E-Mail: [email protected]
Dr. Mohammad Alawin
Associate Professor, Business Economics Department
The University of Jordan, Amman, Jordan
E-mail: [email protected]
Mr. Dinh Tran Ngoc Huy
Visiting lecturer, PhD candidate , Banking University HCMC,
Vietnam
Email: [email protected]
Web: http://ijibm.elitehall.com
ISSN 2076-9202 (Print) ISSN 2218-046X (Online)
International Journal of Information, Business and Management, Vol. 8, No.2, 2016
ISSN 2076-9202
1
EFFECT OF STRATEGIC LEADERSHIP STYLES ON SALES AND
EMPLOYMENT GROWTH IN SMALL AND MEDIUM ENTERPRISES
IN NIGERIA
Patrick Olajide Oladele
Department of Business Administration,
Faculty of Management Sciences,
Ekiti State University, Ado- Ekiti. Nigeria
+2348033009401
Niyi Israel Akeke
Department of Business Administration,
Faculty of Management Sciences,
Ekiti State University, Ado- Ekiti. Nigeria
Corresponding author: [email protected] +2348035645876
Abstract
A well managed and healthy SME is characterised by high performance and act as a sources of
employment opportunities and wealth creation in the environment it is located. This study seeks
to examine the effect of strategic leadership styles on sales and employment growth of SMEs in
Nigeria. The data for the study were collected from owners/CEOs of SMEs through a structured
self-administered questionnaire using a two-stage sampling technique on a sample of 550
respondents. The leadership factors were ranked using relative importance index while the
identified factors were included in the regression analysis. The results indicate that charismatic
and individual consideration were related to sales growth and only inspirational motivation was
significantly related to employment growth, while management by objective had negative
relationship with sales growth and contingent reward was related positively to employment
growth. The study concluded that improvement on charismatic leadership styles is a good
catalyst to increasing sales growth and that inspirational motivation of the leadership style is not
International Journal of Information, Business and Management, Vol. 8, No.2, 2016
ISSN 2076-9202
2
sufficient enough to increase employment growth in SMEs.
Keywords: Strategic leadership, Sales growth, employment growth, SMEs
Introduction
Small and medium scale enterprises (SMEs) are expected to provide the driving force for the
industrialization and overall development of the developing economy and also play significant
roles in meeting some basic economic and industrial developmental objectives. But the extent to
which the expanding SMEs in developing nation like Nigeria have achieved such goals has
hardly been examined. Studies have shown that SMEs provide the training ground for the
development and growth of indigenous entrepreneurs (Kilby, 1988); serve as vehicles for the
propagation and diffusion of innovative ideas for far reaching dimensions (Casson, 1982); and
transformation of traditional industry (Owualah, 1987). Thus a fledging SMEs sector can be a
means of achieving a smooth transition from the traditional to the modern industrial sector
(United Nations, 1984) and generate sustainable employment while achieving the objective
function of the enterprise in form of the increased profit through an increase in sales.
There are high expectations for growth and performance of SMEs in the economic growth and
development plans for Nigeria, but some salient features of these enterprises and the dynamic
nature of a highly global economy make the effective and efficient contributions unattainable.
Nevertheless, Kotey and Meredith (1997) maintained that owner/managers who are the strategic
decision makers are billed to act as catalyst for developing this subsector because they have the
International Journal of Information, Business and Management, Vol. 8, No.2, 2016
ISSN 2076-9202
3
ability to understand the entire organisation and the environment within which they operate.
Amos (2007) identified these leaders as strategic leaders. The way leaders who are at the top
level have impact on organisation performance through their behaviours (Jung et al., 2004;
Phipps & Burbach, 2010 in Oladele, Akeke, Adebisi, & Adeusi, 2013) has been emphasised in
the literature. Beside, upper echelon theory maintained that organisation reflects the cognitive
behaviour and characteristics of their executives and hence, determine the developmental
trajectory of the firms (Hambrick, 2007; Nielson, 2010). Therefore, as leaders impact firm
success, there is likelihood for growth in size of the enterprise, as such will lead to demanding for
more workforces. Although, as the literature has been extensively examined over the leadership
process and performance relationship, much empirical study on the aggregation of the concept
of leadership process and performance were observed. The identification of those behavioural
factors of the multifactor leadership questionnaire (MLQ) developed by Bass (1985) that are
critical for the success of enterprises have not been examined. Thus, this study propose that in
today business context characterised by crisis or major changes, it is necessary to factor out and
examine the leadership characteristics that are critical in enhancing SMEs performance
outcomes.
Literature review
Strategic leadership refers to the study of people at the top with potential not only to express a
strategic vision for the enterprise, but to motivate and persuade others to acquire that vision.
Thus, their focus is on the overall responsibility for the entire organisation whose main objective
International Journal of Information, Business and Management, Vol. 8, No.2, 2016
ISSN 2076-9202
4
is strategic productivity and the development of a context in which the workers can forecast
organisational needs along their own jobs. Since the behavioural components of these leaders
significantly affect the performance of firms (Bycio, Hacket and Allen, 1995), therefore,
contemporary literature on leadership research according to Riaz and Haider (2010), focuses on
transformational and transactional styles as the two main dimensions of leadership.
Transformational leaders alter the beliefs and attitudes of followers and inspire the subordinates
in their own interests parallel with the betterment of the organization (Burns, 1978).
Transformational leaders facilitate new understandings by increasing or altering awareness of
issues. Resultantly, they foster inspiration and excitement to put extra efforts to achieve common
goals. According to Burns (1978), cited in Riaz and Haider (2010), transformational leadership
has four components (idealized influence, inspirational motivation, intellectual motivation, and
individual consideration).
The idealized influence in transformational leadership behaviour involves sacrificing leader’s
own gain for the good of the organization. They are role models who build trust in people
because those who work with them know that they are committed to the common good and can
see the good in others first and when it is not obvious Avolio (2005) maintained that they work to
bring out their subordinates strengths through continuous endeavour.
The inspirational motivation behaviour involves encouraging subordinates to generate
enthusiasm and challenge people. According to Stewart (2006), these leaders create clear
understanding of expectations and demonstrate high commitment to organizational goals and
International Journal of Information, Business and Management, Vol. 8, No.2, 2016
ISSN 2076-9202
5
shared vision. They behave in ways that motivate and inspire people around them by providing
meaning and challenge to their followers’ work, giving continuous encouragement and applying
what Sarros and Santora (2001) called principles of shared power. This therefore arouses team
spirit that enables leaders get followers involved in envisioning attractive future states (Shibru &
Darshan, 2011).
The intellectual stimulation skill enables leaders not only to motivate for innovation and engage
in material culture, but also make followers to challenge the old ways of doing their jobs, try new
techniques, work through difficulties and use their problem solving skill for taking decisions of
mutual consensus between them and followers.
The individual consideration behaviour deals with developing subordinates in the way of
coaching, teaching and providing mentorship. According to Shibru and Darshan (2011),
individual consideration skill treats subordinates as individual and exhibits high concern for them.
They attend to followers’ needs and treat them as important contributors to the enterprise.
Transactional leadership consists of three behavioural factors: contingent reward and
management by exception (active/passive). Contingent reward is behaviour that provides reward
for contracts completed. Management-by-exception is the behaviour that avoids giving directions
where current methods work and performance goals are met (Ejere & Abasilim, 2013)
Empirical evidence of Strategic leadership and performance relationship
Most research findings examined in the literature showed that leadership style has a significant
relationship with firm performance, and that different leadership styles may have a mixed finding
International Journal of Information, Business and Management, Vol. 8, No.2, 2016
ISSN 2076-9202
6
with organisational performance. For instance, the study of Flanigan, Stewardson, Dew,
Feig-Palmer, & Reeve (2013) on the effects of leadership styles on financial performance at the
local level of an industrial distributor found that a leader’s self-reported transformational
leadership styles was positively associated with sales and profit margin performance while
followers’ ratings of a leader’s transactional leadership style was negatively associated with
sales performance. Rejas, Ponce, Almonte & Ponce (2006) carried
out an investigation in Chile, which was aimed at finding out whether or not leadership style
influences the performance of small firms. The results revealed that transformational leadership
has a positive impact on performance, while transactional leadership and laissez-faire style had
negative impacts. Obiwuru, Okwu, Akpa & Nwankere (2011) carried out a survey of selected
small scale enterprises in Nigeria as regard the effects of leadership styles on organisational
performance and found out that while transactional leadership style had a significant positive
effect on performance, transformational leadership style had positive but insignificant effect on
performance. Huang (2006) study showed that a transformational leadership style has a positive
correlation with performance than exchange leadership. The study of Wang, Chich-Jen &
Mei-Ling (2010) found charismatic, transformational and visionary leadership are positively
related to organisational performance. Muterera’s (2012) study carried out in the United States of
America, showed that both transactional and transformational leadership behaviours are
positively related with organisational performance but that transformational leadership behaviour
positively contributed to organisational performance over and above the contribution made by
International Journal of Information, Business and Management, Vol. 8, No.2, 2016
ISSN 2076-9202
7
transactional leadership. Sun (2002) comparative study of leadership styles with leadership
performance where leadership performance correlates organisational performance in schools
and enterprises found that leadership has a significantly positive correlation with organisational
performance in schools as well as the enterprise.
While there have been numerous attempts by studies to appraise SMEs, research has hardly
evaluated the effects of various leadership styles on desirable business performance outcomes
such as growth in sales and employment. As a result, this study becomes imperative. Specifically,
this study highlights the importance of strategic leadership styles that are predominant among
SMEs in Nigeria and estimates the specific effects the identified leadership styles have on sales
growth and employment generation.
Methodology
Area of study
The study was carried out in three of the Southwestern geopolitical regions of Nigeria. The
southwestern zone lies between latitudes 4˚N and 9˚N and longitudes 3˚E and 6.2˚E. It is
bounded in the North by Kwara and Kogi states; in the East by Edo and Delta states; to the
South by the Atlantic Ocean and in the West by the Republic of Benin.
Research design
The research design that was employed is survey and was carried out with the use of a well
structured questionnaire to collect information from respondents.
Sampling procedure and size
International Journal of Information, Business and Management, Vol. 8, No.2, 2016
ISSN 2076-9202
8
A two-stage sampling technique was used to elicit data from the respondents. In the first stage,
three states of the Southwest region; Ekiti, Ondo and Osun were purposively selected based on
the high proportion of SMEs in the states relative to others. In the second stage, a total of 550
respondents from SMEs in the study area were randomly sampled. These respondents included
directors, managers and owners of SMEs.
Data collection instrument and reliability
The data were collected through the use of structured questionnaire. The questionnaire
composed of 18 questions determining the leadership factors based on the Multifactor
Leadership Questionnaire developed by Avolio and Bass (2004) scale, and as used by Vera and
Crossan (2004). Objective and subjective methods which consist of sales and employment
growth were used to measure performance based on (Whitehead, Write, & Ucbasaran, 2001;
Murphy, et al., 1996) recommendations. The measures were obtained through a self reported
performance by owners/ managers. Self reported were appropriate and reliable (Dess &
Robbinson, 1984; Fairoz, Hirobumi, & Tanaka, 2010). Reliabilty of the instrument was tested by
Cronbach’ alpha is high at 0.78
Data analysis
Data were collected on leadership strategies employed by the enterprise and variables such as
sales growth and employment growth. Data collected on leadership styles were measured on
5-point Likert response scale while outcome variables such as sales and employment growth
were measured on a nominal scale. Hence, relative importance index (R.I.I.) (Tonidandel,
International Journal of Information, Business and Management, Vol. 8, No.2, 2016
ISSN 2076-9202
9
LeBreton, & Perkins, 2006) was used to rank the leadership strategies found with the sampled
SMEs prior to their inclusion in the regression analysis which was used to measure the effect of
specific leadership styles. Relative importance index was first used in order to permit a greater
understanding of the relationship between strategic leadership styles and change interventions.
Importantly, these analyses can reveal the underlying impact of a particular predictor more
accurately than standardized regression coefficients or simple correlations. Relative importance
analysis is a useful supplement to analysis such as multivariate regression (Tonidandel et al.,
2006). In the context of this study, its primary aim was to establish the relative importance of the
various factors identified as the components of strategic leadership styles and change
interventions in SMEs. Multivariate regression analysis was used to model the value of
multivariate dependent scale variables to two or more predictors. Assumptions of multivariate
regression are; X2 and X3 are non-stochastic, that is, their values are fixed in repeated sampling.
The error term e has a zero mean value (Σe/N=0). Homoscedasticity, that is the variance of “e”,
is constant. No autocorrelation exists between the error term and the explanatory variable. Also,
no exact co-linearity exists between X2 and X3. The error term “e” follows the normal distribution
with a mean of zero and constant variance
Results and Discussion
Prior to the estimation of effect of strategic styles, various leadership styles identified with SMEs
in the study area are evaluated using (R.I.I). Results (Table 1) shows that among charismatic
leadership styles, the most important and relevant to SMEs, as indicated by the ranking of
International Journal of Information, Business and Management, Vol. 8, No.2, 2016
ISSN 2076-9202
10
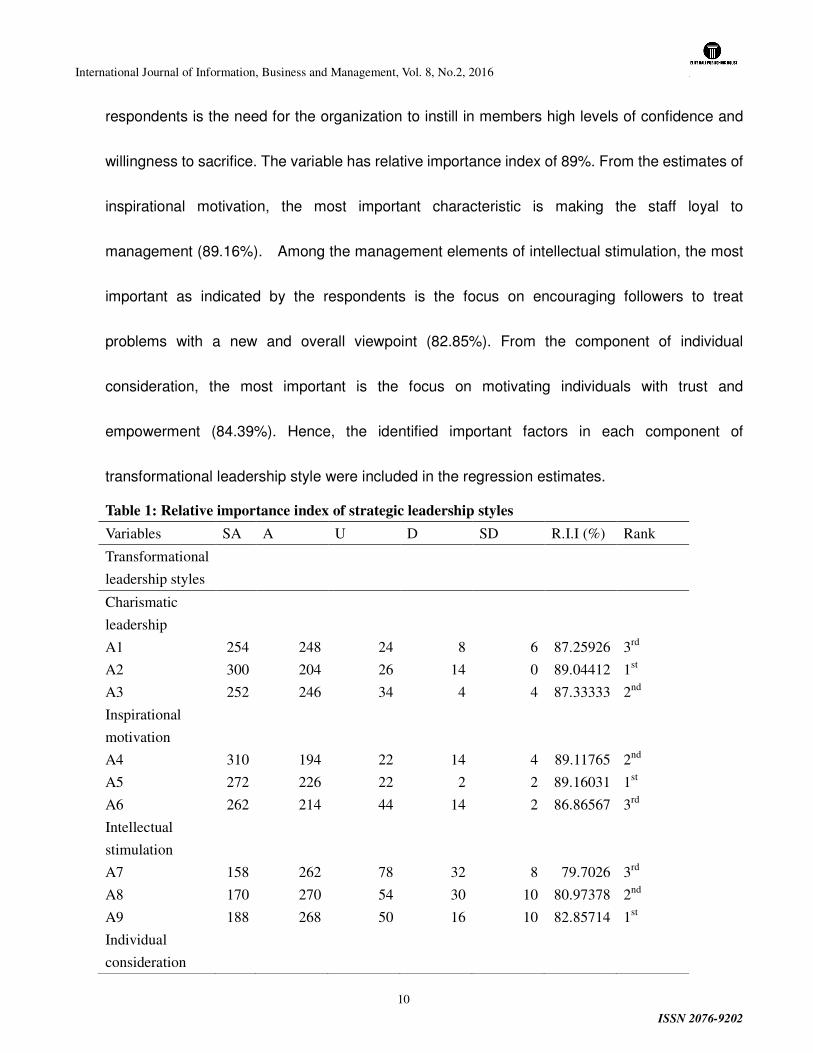
respondents is the need for the organization to instill in members high levels of confidence and
willingness to sacrifice. The variable has relative importance index of 89%. From the estimates of
inspirational motivation, the most important characteristic is making the staff loyal to
management (89.16%). Among the management elements of intellectual stimulation, the most
important as indicated by the respondents is the focus on encouraging followers to treat
problems with a new and overall viewpoint (82.85%). From the component of individual
consideration, the most important is the focus on motivating individuals with trust and
empowerment (84.39%). Hence, the identified important factors in each component of
transformational leadership style were included in the regression estimates.
Table 1: Relative importance index of strategic leadership styles
Variables SA A U D SD R.I.I (%) Rank
Transformational
leadership styles
Charismatic
leadership
A1 254 248 24 8 6 87.25926 3rd
A2 300 204 26 14 0 89.04412 1st
A3 252 246 34 4 4 87.33333 2nd
Inspirational
motivation
A4 310 194 22 14 4 89.11765 2nd
A5 272 226 22 2 2 89.16031 1st
A6 262 214 44 14 2 86.86567 3rd
Intellectual
stimulation
A7 158 262 78 32 8 79.7026 3rd
A8 170 270 54 30 10 80.97378 2nd
A9 188 268 50 16 10 82.85714 1st
Individual
consideration
International Journal of Information, Business and Management, Vol. 8, No.2, 2016
ISSN 2076-9202
11
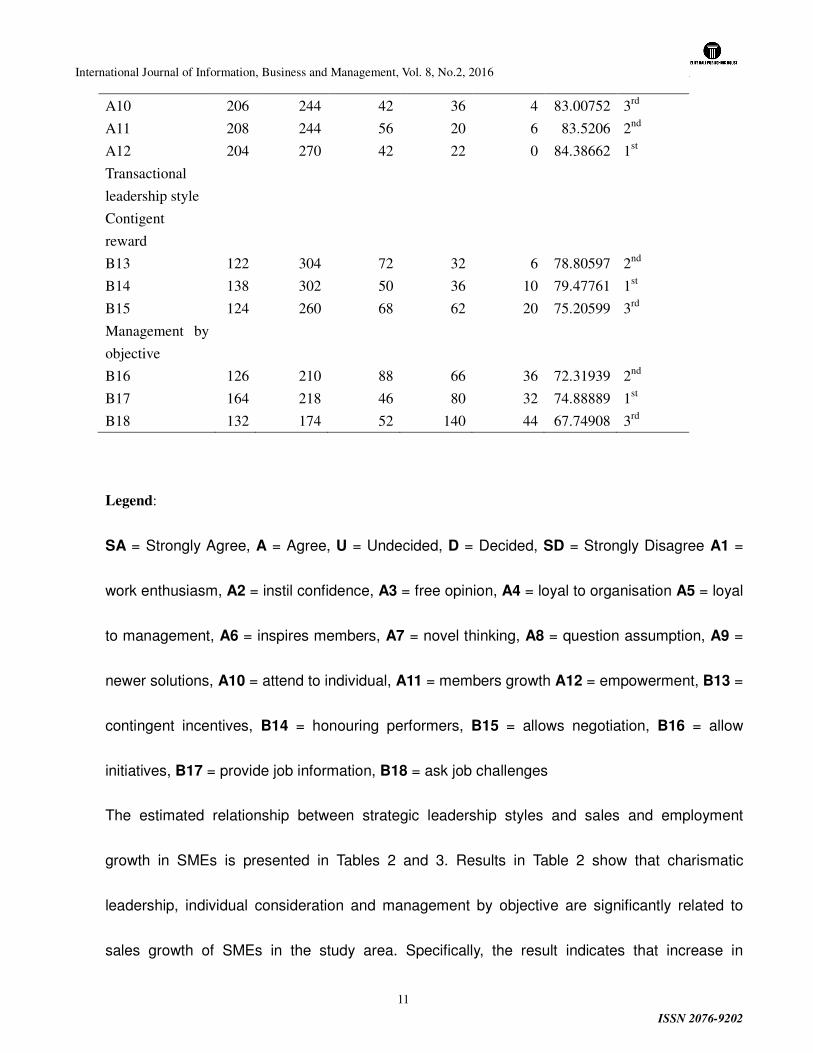
A10 206 244 42 36 4 83.00752 3rd
A11 208 244 56 20 6 83.5206 2nd
A12 204 270 42 22 0 84.38662 1st
Transactional
leadership style
Contigent
reward
B13 122 304 72 32 6 78.80597 2nd
B14 138 302 50 36 10 79.47761 1st
B15 124 260 68 62 20 75.20599 3rd
Management by
objective
B16 126 210 88 66 36 72.31939 2nd
B17 164 218 46 80 32 74.88889 1st
B18 132 174 52 140 44 67.74908 3rd
Legend:
SA = Strongly Agree, A = Agree, U = Undecided, D = Decided, SD = Strongly Disagree A1 =
work enthusiasm, A2 = instil confidence, A3 = free opinion, A4 = loyal to organisation A5 = loyal
to management, A6 = inspires members, A7 = novel thinking, A8 = question assumption, A9 =
newer solutions, A10 = attend to individual, A11 = members growth A12 = empowerment, B13 =
contingent incentives, B14 = honouring performers, B15 = allows negotiation, B16 = allow
initiatives, B17 = provide job information, B18 = ask job challenges
The estimated relationship between strategic leadership styles and sales and employment
growth in SMEs is presented in Tables 2 and 3. Results in Table 2 show that charismatic
leadership, individual consideration and management by objective are significantly related to
sales growth of SMEs in the study area. Specifically, the result indicates that increase in
International Journal of Information, Business and Management, Vol. 8, No.2, 2016
ISSN 2076-9202
12
charismatic leadership styles such as the practice of instilling high level of confidence, serve as
role model and willingness to sacrifice in members make them admired, respected and trusted.
Thus, followers identified their personality and attracted to emulate them which is capable of
significantly (β = 0.24 p < 0.10) increase the sales growth of SMEs and sustain positive
relationship. Similarly, individual consideration is positively and significantly (β = 0.64 p < 0.05)
related to sales growth of SMEs. This shows that the ability of a leader to exhibit the skill of
paying special attention to each individual follower’s needs for achievement and growth by acting
as a coach, advisor, mentor, role model and particularly creating new learning opportunities with
supportive climate with trust and empowerment would positively raise the growth level of sales of
SMEs. This is consistent with the result of the studies of Koech and Namusonge (2012) that by
being a role model will inspire, provide meaning and challenge to work of subordinates, which
will stimulate their efforts to be more creative.
However, management by objective which includes denying members the capability to take
initiative and only instructing subordinates on what they need to know results is in negative
relationship with sales growth of SMEs. An increase in objective management styles is found to
be inversely and significantly (β = -0.12, p < 0.10) related to sales growth of SMEs in the study
area which supports the work of Koech and Namusonge (2012), and Cossin and Caballero
(2013), where correlation between transactional leadership and performance relationship was
low. The findings imply that, in order to increase sales growth of SMEs, strategic leadership
styles such as the characteristics of management by objective need to be de-emphasized or
International Journal of Information, Business and Management, Vol. 8, No.2, 2016
ISSN 2076-9202
13
leader be encouraged not only to provide clarity on procedures for the implementation of tasks
assigned to followers but oversight prevent on the part of subordinates so that mistakes at work
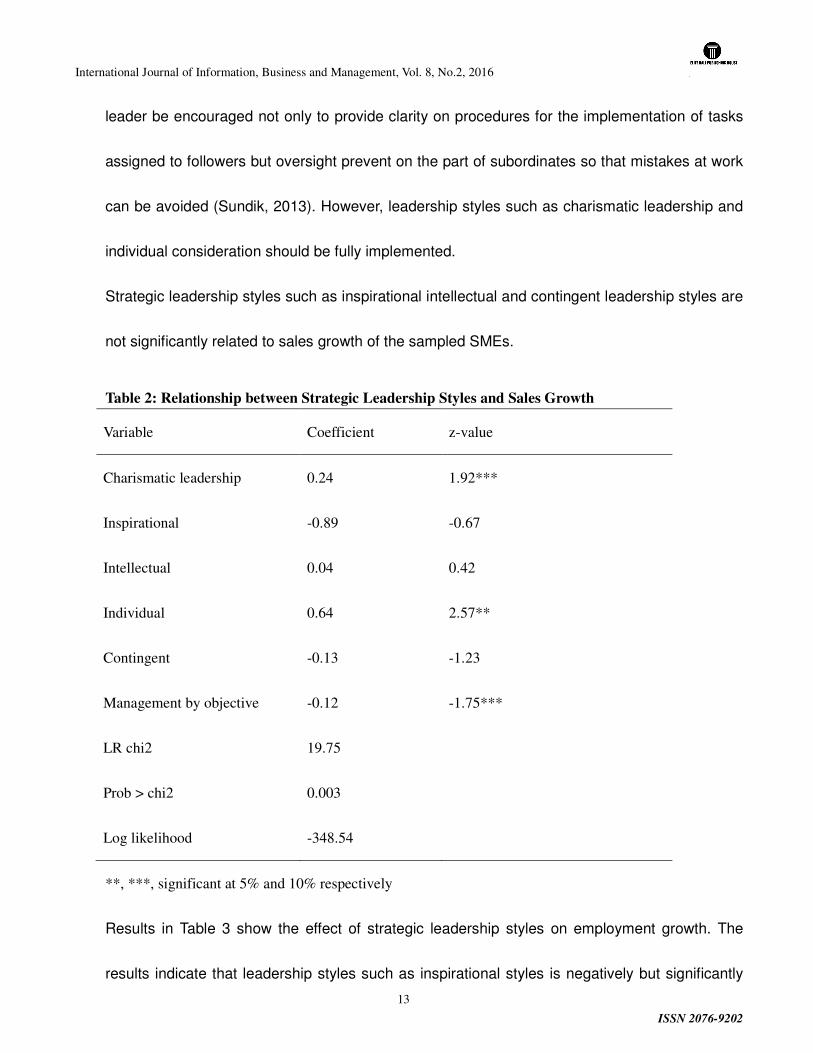
can be avoided (Sundik, 2013). However, leadership styles such as charismatic leadership and
individual consideration should be fully implemented.
Strategic leadership styles such as inspirational intellectual and contingent leadership styles are
not significantly related to sales growth of the sampled SMEs.
Table 2: Relationship between Strategic Leadership Styles and Sales Growth
Variable Coefficient z-value
Charismatic leadership 0.24 1.92***
Inspirational -0.89 -0.67
Intellectual 0.04 0.42
Individual 0.64 2.57**
Contingent -0.13 -1.23
Management by objective -0.12 -1.75***
LR chi2 19.75
Prob > chi2 0.003
Log likelihood -348.54
**, ***, significant at 5% and 10% respectively
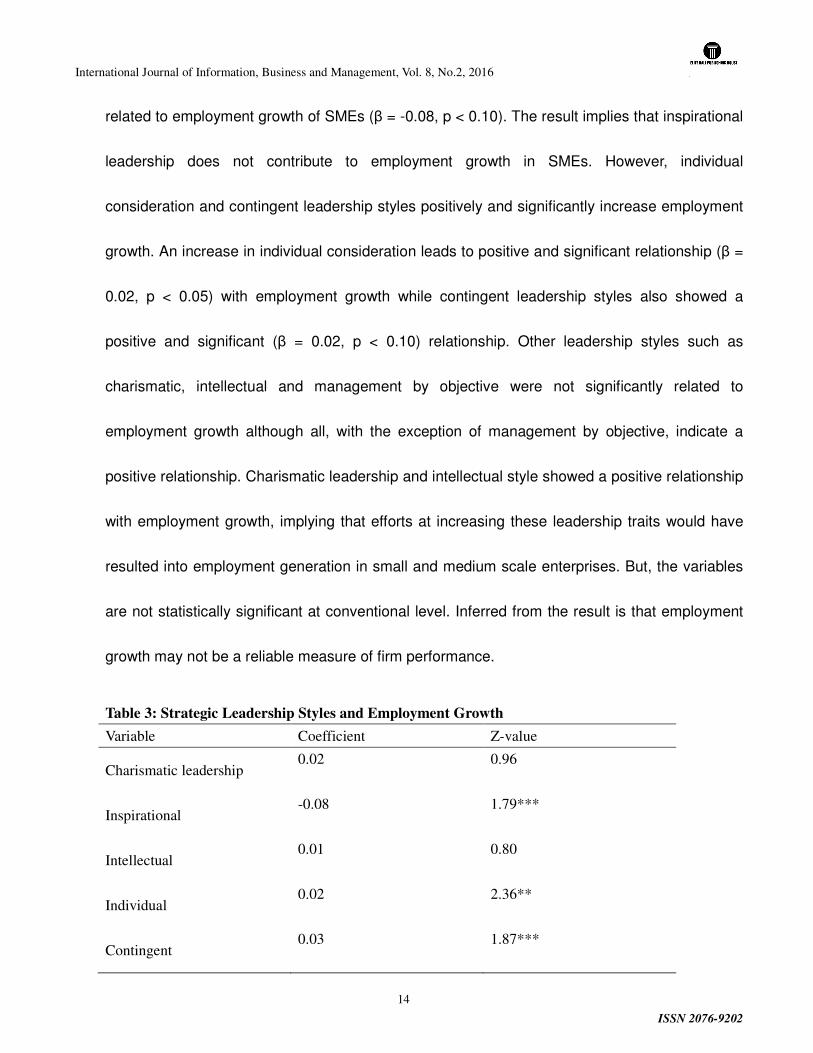
Results in Table 3 show the effect of strategic leadership styles on employment growth. The
results indicate that leadership styles such as inspirational styles is negatively but significantly
International Journal of Information, Business and Management, Vol. 8, No.2, 2016
ISSN 2076-9202
14
related to employment growth of SMEs (β = -0.08, p < 0.10). The result implies that inspirational
leadership does not contribute to employment growth in SMEs. However, individual
consideration and contingent leadership styles positively and significantly increase employment
growth. An increase in individual consideration leads to positive and significant relationship (β =
0.02, p < 0.05) with employment growth while contingent leadership styles also showed a
positive and significant (β = 0.02, p < 0.10) relationship. Other leadership styles such as
charismatic, intellectual and management by objective were not significantly related to
employment growth although all, with the exception of management by objective, indicate a
positive relationship. Charismatic leadership and intellectual style showed a positive relationship
with employment growth, implying that efforts at increasing these leadership traits would have
resulted into employment generation in small and medium scale enterprises. But, the variables
are not statistically significant at conventional level. Inferred from the result is that employment
growth may not be a reliable measure of firm performance.
Table 3: Strategic Leadership Styles and Employment Growth
Variable Coefficient Z-value
Charismatic leadership 0.02 0.96
Inspirational -0.08 1.79***
Intellectual 0.01 0.80
Individual 0.02 2.36**
Contingent 0.03 1.87***
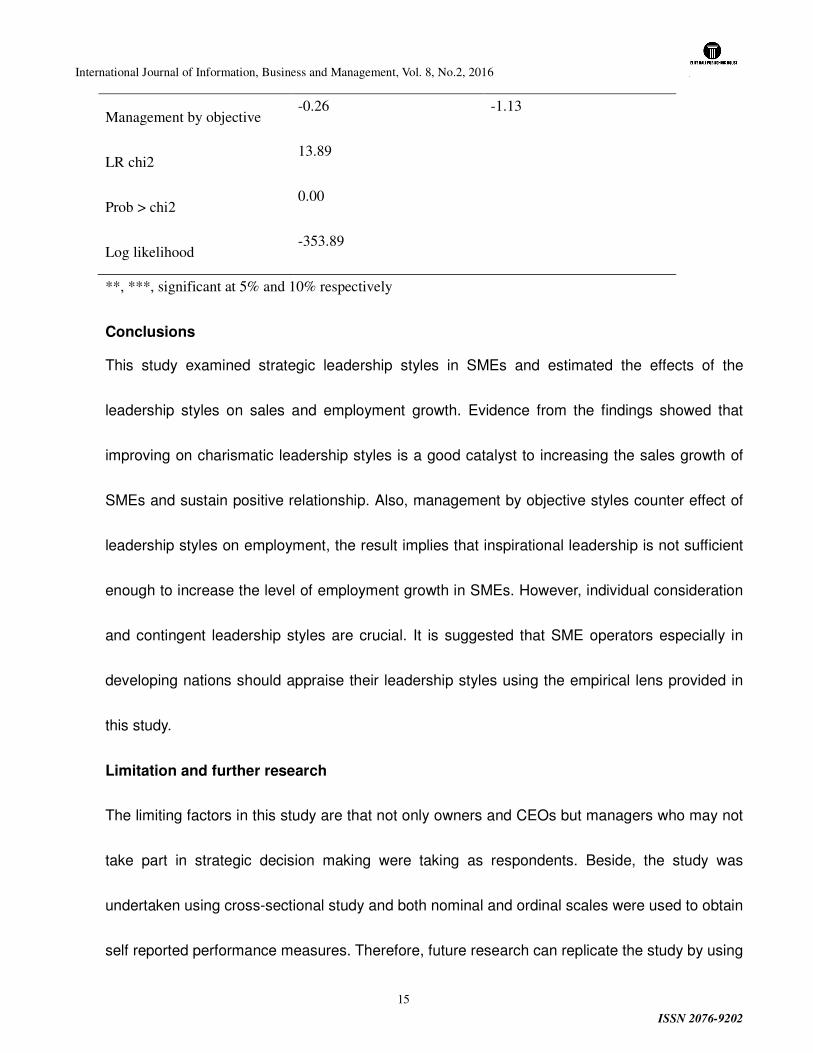
International Journal of Information, Business and Management, Vol. 8, No.2, 2016
ISSN 2076-9202
15
Management by objective -0.26 -1.13
LR chi2 13.89
Prob > chi2 0.00
Log likelihood -353.89
**, ***, significant at 5% and 10% respectively
Conclusions
This study examined strategic leadership styles in SMEs and estimated the effects of the
leadership styles on sales and employment growth. Evidence from the findings showed that
improving on charismatic leadership styles is a good catalyst to increasing the sales growth of
SMEs and sustain positive relationship. Also, management by objective styles counter effect of
leadership styles on employment, the result implies that inspirational leadership is not sufficient
enough to increase the level of employment growth in SMEs. However, individual consideration
and contingent leadership styles are crucial. It is suggested that SME operators especially in
developing nations should appraise their leadership styles using the empirical lens provided in
this study.
Limitation and further research
The limiting factors in this study are that not only owners and CEOs but managers who may not
take part in strategic decision making were taking as respondents. Beside, the study was
undertaken using cross-sectional study and both nominal and ordinal scales were used to obtain
self reported performance measures. Therefore, future research can replicate the study by using

International Journal of Information, Business and Management, Vol. 8, No.2, 2016
ISSN 2076-9202
16
a longitudinal study and delineate owner/CEO from managers.
Acknowledgement
The authors hereby acknowledge Prof. Abel Lamina Toriola of Tswane University of Technology,
Pretoria, South Africa for his editorial input.
References
Amos, T. 2007. Strategic leadership: key driver for strategic implementation. Management Today,
May
Burns, J.M. (1978), The concept of transformational leadership, New York: Harper & Row n
Casson, M. (1982). The entrepreneur: An economic theory. Oxford: Martin Robertson.
Cossin, O. & Caballero, J. (2013). Transformational leadership. IMD Global Board Center, 1-24
Ejere, E.I. & Abasilim, U.D. (2013). Impact of transactional and transformational leadership styles
on organisational performance: Evidence from Nigeria. The Journal of Commerce, 5(1), 30-41
Flanigan,R.L., Stewardson, G., Dew, J., Fleig-Palmer, M.M. & Reeve, E. (2013). Effects of
leadership on financial performance at the local level of an industrial distributor. Journal of
Technology, Management, and Applied Engineering, 29(4), 1-10
Hambrick, D.C. (2007). Upper echelons theory: an update, Academy of Management Review,
32(2), 334-343.
Huang LS (2006). Transformational leadership has effect on organizational performance: The
organizational culture as an intermediary variable. Unpublished master's thesis, National Taipei
University, Taipei, Taiwan.
Kilby, P. (1988). Breaking the entrepreneurial bottleneck in less developing countries: Is there a
useful role for government. Journal of Development Planning, 18.
Kotey, B., and G.G. Meredith (1997), Relationships among owner/manager personal values,
business strategies, and enterprise behaviour, Journal of Small Business Management, 35(2).
International Journal of Information, Business and Management, Vol. 8, No.2, 2016
ISSN 2076-9202
17
Muterera, J. (2012). Leadership behaviours and their impact on organizational performance in
governmental entities. International Journal of Sustainable Development, 19-24.
Nielson, S. (2010). Top management team diversity, A review of theories and methodologies.
International Journal of Management Reviews, 12(3), 301-316
Obiwuru, T.C., Okwu, A.T., Akpa, V.O. & Nwankwere, I.A. (2011). Effects of leadership style on
organisational performance: A survey of selected SMEs in Ikosi-Ketu Council Development Area
of Lagos State, Nigeria. Australian Journal of Business and Management Research, 1 (7),
100-111
Oladele, P.O., Akeke, N.I., Adebisi, O.S. & Adeusi, S.O. (2013). Effects of strategic leadership on
organisational development in SMEs in Lagos, Nigeria. Net Journal of Social Sciences, 1(2),
54-60
Owualah, S.I. (1987). Proving Necessary Economic Infrastructures for Small Business. Whose
responsibility? International Small Business Journal, 6(1), 10-13.
Phipps, K.A. & Burbach, M.E. (2011). Strategic leadership in nonprofit sector: Opportunities for
research. Institute of Behavioural and Applied Management, 137-154
Rejas, L. P., Ponce, E. R., Almonte, M. D., & Ponce, J. R. (2006). Transformational and
transactional leadership: A study of their influence in small companies. Ingeniare-Revista
Chilena de Ingenieria, 14(2), 159-166.
Riaz, A. & Haider, M.H. (2010). Role of transformational and transactional leadership on job
satisfaction and carreer satisfaction. Business and Economic Horizon, 1(1), 29-38
Sarros, J.C., & Santora, J.C. (2001). The Transformational-Transactional Leadership Model in
Practice, Leadership and Organisational Development Journal, 383(11).
Shibru, B. & Darshan, G.M. (2011). Transformational and its relationship with subordinate
satisfaction with leader (The case of Leather Industry in Ethiopia). Interdisciplinary Journal of
Contemporary Research in Business, 3(5), 686-697
Stewart, J. (2006). Transformational leadership: An evolving concept examined through the
works of Burns, Bass, Avolio, and Leithwood. Canadian Journal of Educational Administration
and Policy, 54, 1-29
Sun, R.Y. (2002). The relationship among the leadership style, organizational culture and
organizational effectiveness based on competing value framework: An empirical study for the
institute of technology in Taiwan. Doctoral dissertation, National Taipei University, Taipei, Taiwan.
International Journal of Information, Business and Management, Vol. 8, No.2, 2016
ISSN 2076-9202
18
www.academicjournals.org/article1380534513 (Downloaded March 21, 2015)
Sundik, K. (2013). Effect of Transformational leadership and transactional leadership oon
employee performance of Konawe Education Department at Southeast Sulawesi Province.
International Journal of Business and Management Invention, 2(12), 50-58
Tonidandel, S., LeBreton, J., & Perkins, J. (2006). Applying relative importance to multivariate
analysis of variance. In J. Cortina (Chair), Devoting rashly something as holy, ye must then
reconsider: Revisiting methodological sacred cows. Symposium conducted at the 21st Annual
Meeting of the Society for Industrial and Organizational Psychology, Dallas, Texas.
United Nations, (1984). The role of small-scale and medium-scale industries. O.I.C.member
states. New York, October, 5
Wang, F., Che-Jen, S. & Mei-Ling, T. (2010). Effect of leadership styles on organisational
performance as viewed from human resource management strategy. African Journal of Business
and Management, 4(18), 3924-3936

International Journal of Information, Business and Management, Vol. 8, No.2, 2016
ISSN 2076-9202
19
STRATEGY-PERFORMANCE RELATIONSHIP: A SCORING
METHOD FRAMEWORK FOR TYPOLOGICAL RESEARCH
Jamil Anwar
(Corresponding Author)
Assistant Professor, Department of Management Sciences, COMSATS Institute of Information
Technology, Abbottabad
SAF Hasnu
Professor, Department of Management Sciences, COMSATS Institute of Information Technology,
Abbottabad
Abstract
The purpose of the paper is to address the issues relating to the methodological quality applied for the
identification of Miles and Snow typology when archived financial data is used. Specifically, the issues
include: one, there is no standard procedure for categorization of strategic types; two, identification of
reactor strategy is always ignored and excluded from the analysis; and three, the behavior of firms’
strategic orientation over time is under-researched. A conceptual research framework is developed for
identification of strategic types, and their consistency behavior over the time. A step-by-step coding is done
in SAS. Verified outputs are also presented for ready references to replicate the process for real data sets.
The framework can be used for longitudinal study for other typological classifications.
Key Words: Typology; Strategy; Scoring Methodology; SAS

International Journal of Information, Business and Management, Vol. 8, No.2, 2016
ISSN 2076-9202
20
Introduction
Miles and Snow (1978), in their famous work “Strategy, Structure, and Process” presented a typology to
categorize the strategy types as defenders, analyzers, prospectors, and reactors along with a description of
an adaptive cycle for organizations to solve their entrepreneurial, engineering, and administrative
problems at various stages of organizational life cycle. Defenders are businesses that prosper through
stability, and efficiency. Prospectors prosper by stimulating and meeting new product-market
opportunities. Analyzers flourish by creating a balance and purposely being more innovative in their
product-market initiative than defenders but doing so more cautiously and selectively than prospectors.
Reactors depend on the environmental forces in their approaches and hence do not prosper at all.
Of the numerous strategy classification systems, this has been the most enduring, scrutinized, and
validated strategy classification. It has been debated and supported by many researchers in a wide array of
settings and domains. The typology has provided a host of relationships of various business domains.
However, a number of researchers have commented on the need of further empirical validation and
testing of its underlying assumptions (Conant, Mokwa, & Varadarajan, 1990; Desarbo, Benedetto, Song,
& Sinha, 2005; Shortell & Zajac, 1990). The methodology for identification of strategic types is one
such area that needs more explanation especially when archived financial data is used.
The purpose of the study is to prepare a base line for strategy-performance relationship using different
typologies, especially Miles and Snow typology, and to investigate the impact of contingent factors on
this relationship. For this to achieve, it is important to: develop a step-by-step methodological framework
to categorize the strategic orientation of the firms; to compare the strategic consistency of the firms over
time; and, to identify the reactor strategy. Options for data analysis and testing of hypotheses are also
proposed.
The remaining part is divided in to two: part one refers to the summary of the empirical research on Miles
and Snow typology and conceptual and theoretical development of scoring methodology; and part two
presents the step-by-step procedure of research framework using scoring methodology for identification
of strategic types of the firms.
International Journal of Information, Business and Management, Vol. 8, No.2, 2016
ISSN 2076-9202
21
Part A:
Empirical Literature Summary
The applicability of Miles and Snow typology is widespread which is evidenced from the literature as the
research is done in many industries investigating a number of measures and relationships. However, the
mainstream research is mostly in developed countries leaving room for research in developing countries.
Since the political, economic, socio-cultural, technological, environmental and legal contexts are different
for developed and developing countries, the outcome may also be different.
The argument of Miles and Snow that three viable strategies are likely to be distributed equally in an
industry is not overwhelmingly supported. The presence of all strategic types are found where
classification of strategic types is based on self-typing, questionnaire, or expert opinion data (Blackmore
& Nesbitt, 2012; Conant et al., 1990; Daniel Rajaratnam & Chonko, 1995; Desarbo et al., 2005; Jennings
et al., 2003; Mcdaniel & Kolari, 1987b; Olson et al., 2005; Shortell & Zajac, 1990; Slater et al., 2011;
Smith et al., 1986, 1989; Snow & Hrebiniak, 1980). In all these instances the respondents are bound to
classify the firm in one of the four strategic types. The researchers who used archived data, and classify
firms according to ranking or scoring methods, usually capture three types (defenders and prospectors at
the extreme and analyzers as the balancing strategy) ignoring the reactor strategy (Evans & Green, 2000;
Hambrick, 1981, 1982, 1983; Liang, Musteen, & Datta, 2009; Sarac, Ertan, & Yucel, 2014; Thomas &
Ramaswamy, 1996). The percentage of prospectors and defenders is usually less than the analyzers in
most of the strategies. This may be because of neutralized response where perceived data is collected and
because of the subjective cut points when ranking techniques are used by the researchers.
For identification of strategic types self typing approach, cluster analysis, and scoring methods are used.
The archival data is used to measure the realized strategy while other data collection methods such as
self-typing approach, standardized questionnaires, and interviews are used to measure the perceived
strategy. In scoring methods, particularly when archived financial data is used, ranking techniques
(quintiles, percentiles, scoring etc) are used. But there is no standardized method of identifying strategic
International Journal of Information, Business and Management, Vol. 8, No.2, 2016
ISSN 2076-9202
22
types as the different researchers used different steps to categorize the strategic types. Another deficiency
of scoring method, when used for archival data, is the identification of only two strategic types
(prospectors and defenders) representing the extreme ends of the continuum while analyzers are
automatically chosen as the balancing strategy.
The proxies used for measuring strategy are targeted to find; the marketing and R&D focus; growth and
production capability; capital intensity; cost efficiency; and diversification of the firms. For financial
performance measures ROA, ROE, ROS, and growth rates are used most of the time. Other financial
performance measures include Return on Capital Employed (ROCE), Cash Flow on Investment (CFOI),
EPS, and annual stock return etc whereas customer satisfaction and service quality are used as
non-financial performance measures ( Bentley, Omer, & Sharp, 2013; Blackmore & Nesbitt, 2012; D.
Ittner, Larcker, & Rajan, 1997; Evans & Green, 2000; Hambrick, 1983; Lin, Tsai, & Wu, 2014; Sarac et
al., 2014; Thomas & Ramaswamy, 1996).
Conceptual and Theoretical Development for Scoring Method
In scoring method the strategic variables are ranked based on quintiles or percentiles. The composite
scores are used for final categorization of strategic type of an organization. But the problem with this
method is that different researchers used different steps to categorize the strategic types. As Conant et al.
(1990), pointed out that one of the limitations is to identify only two strategy types, the defenders and
prospectors at the end points and putting analyzers in the middle. Another area of interest is to extend the
three viable strategic types from three to five by differentiating pure defenders, analyzers, and prospectors
from those firms that lie between defenders and analyzers or between prospectors and analyzers on the
continuum. Although these concepts have been discussed before but no concrete effort has been made to
develop a standard for such classification. For example, Hambrick, (1981; 1983), introduced the terms
“pure defenders/prospectors” and “extreme defender/prospector” to distinguish the strategic types and
emphasized that it would be more accurate to label firm which lags its industry in new product sales as
“defender-like” and as “prospector- like” the firm which surpasses its industry in new product sales. He
suggested that for ideal strategy measure, it would be preferable to have multiple indicators for
International Journal of Information, Business and Management, Vol. 8, No.2, 2016
ISSN 2076-9202
23
identifying defenders and prospectors. Although, there are instances where different terms such as pure
defenders/prospectors and mixed strategies (Valos & Mavando, 2003) and low-cost defenders and
differentiated defenders (Slater et al., 2011) are used but we found no subsequent research which
categorizes the strategies in this way.
To address these issues, average data for strategy measures is used to calculate the composite ranking
scores. The highest quintiles are given a score of 4; those in the second highest quintile are given a score
of 3, and so on, while those observations in the lowest quintiles are given a score of 0. The reverse
ranking is calculated for variable where defenders are expected to score more than prospectors. The
scores are summed over the four measures in such a way that a company could receive a maximum score
of 16 and a minimum score of 0. The discrete “Strategy” score ranges along a continuum in value from 0
to 16 with defender and prospector firms closer to the endpoints and rest of the companies constituting the
middle of the continuum, consistent with organizational theory (Bentley et al., 2013; Evans & Green,
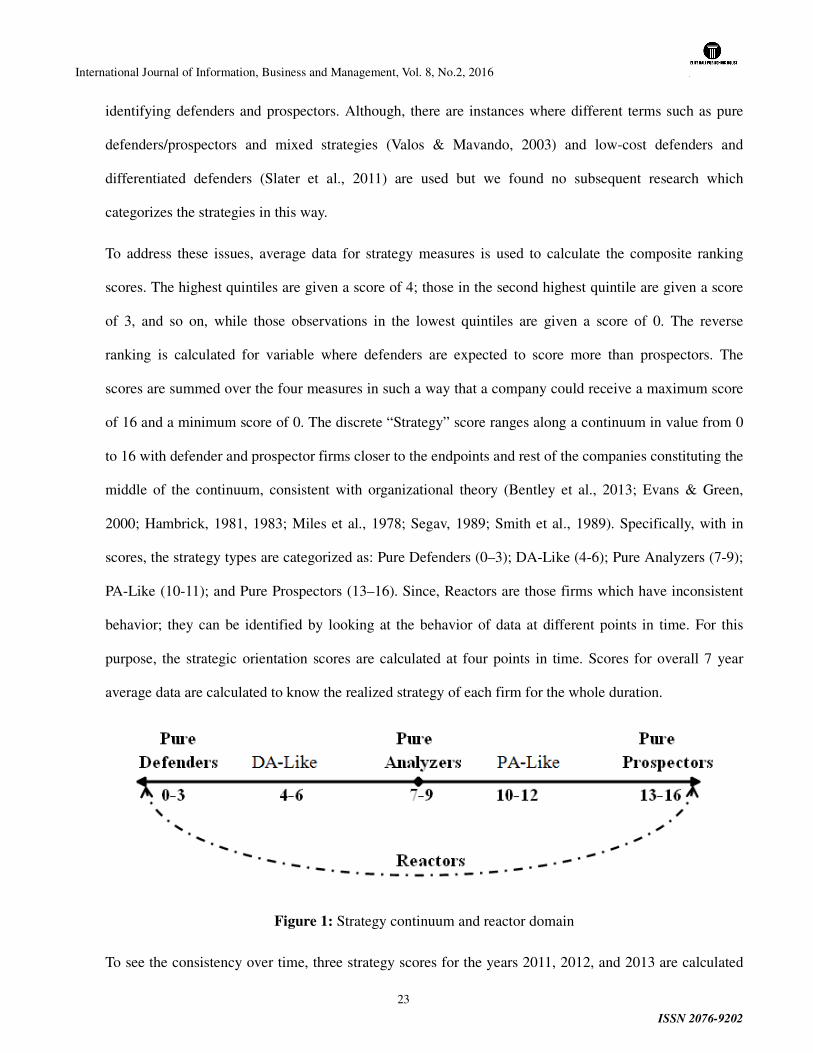
2000; Hambrick, 1981, 1983; Miles et al., 1978; Segav, 1989; Smith et al., 1989). Specifically, with in
scores, the strategy types are categorized as: Pure Defenders (0–3); DA-Like (4-6); Pure Analyzers (7-9);
PA-Like (10-11); and Pure Prospectors (13–16). Since, Reactors are those firms which have inconsistent
behavior; they can be identified by looking at the behavior of data at different points in time. For this
purpose, the strategic orientation scores are calculated at four points in time. Scores for overall 7 year
average data are calculated to know the realized strategy of each firm for the whole duration.
Figure 1: Strategy continuum and reactor domain
To see the consistency over time, three strategy scores for the years 2011, 2012, and 2013 are calculated
International Journal of Information, Business and Management, Vol. 8, No.2, 2016
ISSN 2076-9202
24
by taking preceding five years averages. The resultant strategic orientation of each firms at 4 points are
compared. The final selection is based on the rule that for strategy to be considered as viable, it must
occur at least three times out of four otherwise it was treated as reactor. Since, reactors behave
inconsistently; they can be from within other strategic types as depicted in figure (Figure 1).
The range of groups, other than pure prospectors and pure defenders, is kept equal while the range of
score for pure defenders and prospectors (extreme ends) is high because of the fact that very few
organizations receive score near to extreme ends.
Part B:
Step-by-Step Process to Calculate the Strategy Types using SAS Codes
The following sections present a step-by-step procedure using a self generated raw panel data to explain
the coding steps, procedures, and the outcomes to facilitate the researchers how to identify the strategic
orientation of firms from a given data set of their interest. The software used for this purpose is SAS –a
statistical analysis software used in many fields of research. SAS can read data files created by other
statistical packages such as data files created by SPSS®, Excel®, Minitab®, Stata®, Systat, and others to
be incorporated into a SAS program. SAS is versatile and powerful enough to meet researchers’ needs in
data analyses. It is flexible, with a variety of input and output formats and numerous procedures for
descriptive, inferential, and forecasting of statistical analyses. It includes a wide range of analysis
procedures to help researchers navigate through data so (SAS Inc, 2015).
a) SAS Data Set
A data set is prepared for the step-by-step procedure and explanation. The 7 years data contains the
information of 18 firms from 5 industries with four strategy variables, assets for measuring size, and one
performance variable. The composite score calculated through the steps explained below for strategy
variables (V1, V2, V3, and V4) treated as independent variable. Sector and size are considered as
contingent variables and ROA as dependent variable. The purpose of the study is to prepare a base line for
strategy-performance relationship using different typologies, especially Miles and Snow typology, and to
investigate the impact of contingent factors on this relationship. The following code generates the data set

International Journal of Information, Business and Management, Vol. 8, No.2, 2016
ISSN 2076-9202
25
for this exercise:
Data test.practice;
input Sector Firms Years V1 V2 V3 V4 Asset ROA;
Datalines;
1 1 2008 12 23 45 30 200 0.09
1 1 2009 11 22 50 31 225 0.21
1 1 2010 11 25 33 32 250 0.08
1 1 2011 10 30 45 33 250 0.17
1 1 2012 12 27 34 34 245 0.22
1 1 2013 12 30 40 35 252 0.09
1 1 2014 13 33 45 36 250 0.25
1 2 2008 32 45 21 37 155 0.21
…………
…………
5 3 2011 24 27 25 104 120 0.2
5 3 2012 24 25 30 105 100 0.24
5 3 2013 34 35 25 106 130 0.26
5 3 2014 12 24 24 107 125 0.1
;
Run;
b) Average Calculation
The researchers use averages (simple or moving/rolling) to calculate proxies for strategic types and to
smooth the variations of a time series data due to seasonal or other variations. For moving/rolling
averages, one of the most suitable SAS procedures is PROC EXPAND (Premal P. Vora, 2008). Following
code can be used to calculate the 5 years rolling averages, for non-missing values:
\*Program for Calculating Rolling (Moving Averages)*/

International Journal of Information, Business and Management, Vol. 8, No.2, 2016
ISSN 2076-9202
26
Proc Expand data=test.practice out=test.ma;
convert v1 =v1ma/transformin=(setmiss 0) transformout=(movave 5);
convert v2 =v2ma/transformin=(setmiss 0) transformout=(movave 5);
…………..;
convert roa =roama/transformin=(setmiss 0) transformout=(movave 5);
By sector firms;
Run;
The “By” clause is added to calculate the rolling averages within industry of firms. If there is an even
number of years then centered moving average is used. For this, the key word “movave” is replaced by
“cmovave”. For our purpose, following PROC SQL code is used to calculate the simple averages,
rounded off to 2 decimal points, for each firm within an industry.
\*Calculation of Simple Averages*/
Proc SQL;
Create Table test.avg as
Select Sector,firms,
round(mean(v1),0.001) as V1,round(mean(v2),0.001) as V2,
round(mean(v3),0.001) as V3,round(mean(v4),0.001) as V4,
round(mean(asset),0.001) as Asset,round(mean(ROA),0.001) as ROA
From test.practice
Group by sector, firms;
Quit;
c) Rank Calculation
The ranking is done based on the theoretical foundations for each selected variable. For example, in our
raw data set variables: V1, V2, V3, and V4 refer to the variables selected for measuring strategic

International Journal of Information, Business and Management, Vol. 8, No.2, 2016
ISSN 2076-9202
27
orientation. As evidenced from the previous research, it is supposed that prospectors score high for V1,
V2, and V3 and low score for V4. Therefore, reverse ranking will be calculated for V4. PROC RANK
procedure of SAS (Bilenas, Morgan, & Bank, 2009) facilitates to rank variables according to their
demand. The following code generate ranking and reverse ranking. For this purpose, quintiles are used to
divide the data into five bins. The coding for within sector scores and scores for ranking is given below:
\*Program for Data Sorting, Calculating Ranks and Reverse Ranks, and Merging of Files*/
Proc Sort Data=test.avg;
By sector firms;
Run;
Proc Rank data=test.avg Out=quantiles Groups=5;
By sector; Var V1 V2 V3; Ranks R1 R2 R3;
Run;
Proc Rank Data=test.avg out=quantiles1 Descending Groups=5;
By sector; Var V4; Ranks R4;
Run;
Proc Rank Data=test.avg out=quantiles2 Groups=3;
Var asset; Ranks RA;
Run;
Proc SQL;
Create Table size as select RA as Size from quantiles2;
Quit;
Proc SQL;
Create Table merge as Select a.sector, a.firms, a.v1, a.v2, a.v3, b.v4, a.asset,a.roa, a.r1,a.r2,a.r3,b.r4,
a.r1+a.r2+a.r3+b.r4 as Strategy
From quantiles a, quantiles1 b
Where a.sector=b.sector and a.firms=b.firms;
Quit;
Data test.main;
Merge test.merge size;
Run;
The above codes sort the data in ascending order. The firms are sorted within sectors. The next step is to
calculate, within sectors, the ranking of first three strategy variables in ascending order. This is done for
standardization of scores across the four strategy variables. The ranking is done for size calculation as

International Journal of Information, Business and Management, Vol. 8, No.2, 2016
ISSN 2076-9202
28
well. The last two steps are used to merge the required information in one table.
The ranking is calculated keeping in view the firm’s standing in comparison to its industry. For
calculating the ranking of a firm in comparison to the overall economy, the “by sector” clause from the
above codes is to be removed. It is an important point for researchers to note the differences in results and
hence in its implications.
d) Categorization of firms
The next step is to categorize the firms according to their strategic orientation and according to the size of
the firm. The following codes accomplish this task:
\*Program for Categorization of Firms*/
Data test.strategy;
Set test.Main;
If strategy>=13 then Orientation="Prospectors";
Else if strategy<=3 then Orientation="Defenders";
Else if strategy in (4 5 6) then Orientation="DA-Like";
Else if strategy in (7 8 9) then Orientation="Analyzers";
Else Orientation="PA-Like";
If Size=0 then Sz='Small ';
Else if size=1 then Sz='Medium';
Else Sz="Large ";
Run;
Proc sort data=test.main1;
By sector firms;
Run;
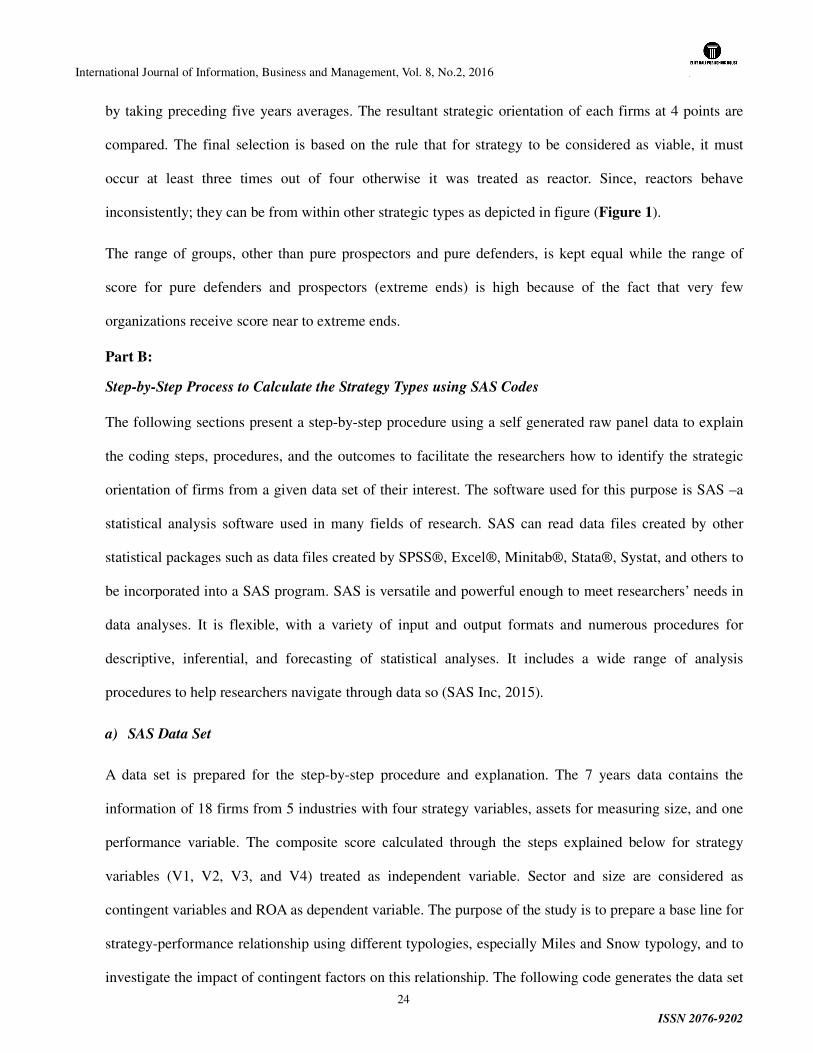
The outcome of the codes written in sections “b”, “c” and “d” above, produce the data set having
averaged values for strategy and performance variables, ranking for strategy variables and for assets, total
score of strategy variables and categorization of the firms according to respective strategic type and size
are presented below (Table 3).
Table 3: Variables, ranking, total score, and classification of Strategic types and size of the firms
International Journal of Information, Business and Management, Vol. 8, No.2, 2016
ISSN 2076-9202
29
Ob
servatio
ns
Secto
r
Firm
s
V1
V2
V3
V4
Asset
RO
A
R1
R2
R3
R4
Tota
l Sco
re
Asset R
an
k
Stra
tegy
Size
1 1 1 11.571 27.143 41.714 33.000 238.857 0.159 1 1 2 3 7 2 Analyzers Large
2 1 2 39.143 43.286 21.571 40.000 138.286 0.293 3 3 1 1 8 1 Analyzers Medium
3 1 3 36.000 39.429 47.286 37.286 133.857 0.276 2 2 3 2 9 1 Analyzers Medium
4 2 1 26.000 50.000 35.000 37.000 142.143 0.149 3 3 3 2 11 2 PA-Like Large
5 2 2 19.000 30.143 23.857 41.571 132.429 0.184 1 2 1 1 5 1 DA-Like Medium
6 2 3 25.429 29.714 26.714 33.000 145.000 0.224 2 1 2 3 8 2 Analyzers Large
7 3 1 23.286 34.286 25.571 38.143 129.143 0.203 1 1 0 3 5 1 DA-Like Medium
8 3 2 30.286 36.857 27.571 34.000 124.429 0.246 3 3 2 4 12 1 PA-Like Medium
9 3 3 30.286 33.000 27.286 41.000 123.714 0.244 3 0 2 2 7 0 Analyzers Small
10 3 4 68.857 60.143 54.857 48.000 115.571 0.203 4 4 4 2 14 0 Prospectors Small
11 3 5 23.857 36.857 29.857 55.000 124.429 0.246 2 3 3 1 9 1 Analyzers Medium
12 3 6 18.143 36.429 26.429 62.000 123.714 0.244 0 2 1 0 3 0 Defenders Small
13 4 1 25.143 48.000 51.000 69.000 267.571 0.159 1 3 3 3 10 2 PA-Like Large
14 4 2 40.143 40.429 24.429 76.000 138.286 0.293 3 1 1 2 7 1 Analyzers Medium
15 4 3 36.000 42.143 49.714 83.000 133.857 0.276 2 2 2 1 7 1 Analyzers Medium
16 5 1 21.429 50.714 33.857 90.000 142.143 0.149 2 3 3 3 11 2 PA-Like Large
17 5 2 19.000 30.143 22.143 97.000 107.429 0.184 1 2 1 2 6 0 DA-Like Small
18 5 3 25.429 29.714 26.571 104.00 114.286 0.224 3 1 2 1 7 0 Analyzers Small
V1…V4 are averages of strategy variables and R1…R4 are ranks for V1…V4 respectively
e) Comparison of Strategies over time and identification of Reactor Strategy
Zahra Shaker A. & Pearce (1990), urged the researchers to study the strategic change and transitional
characteristics of strategic types over the time as studying shifts among strategic types in this way will
make it possible to examine parallel changes in strategic process. Specifically, to check: are there

International Journal of Information, Business and Management, Vol. 8, No.2, 2016
ISSN 2076-9202
30
predictable paths of strategic change (e.g. a defender becomes analyzer); and is a certain strategic
transition is more conducive than others to effective firm performance? Another important question is the
identification of reactor strategy using archival data. According to Miles and Snow (1978), reactors
respond to the challenges of the adaptive cycle in uneven and transient ways; they tend to be short-term
oriented and environmentally dependent. Conant et al. (1990) labeled reactors as 'less stable' and
'inconsistent'. Reactors are unassertive and varied in strategic orientation and consistently inconsistent
behavior pattern. Blackmore & Nesbitt (2012), asserted that reactors could exhibit the behavioral
characteristics of defenders, analyzers and prospectors.
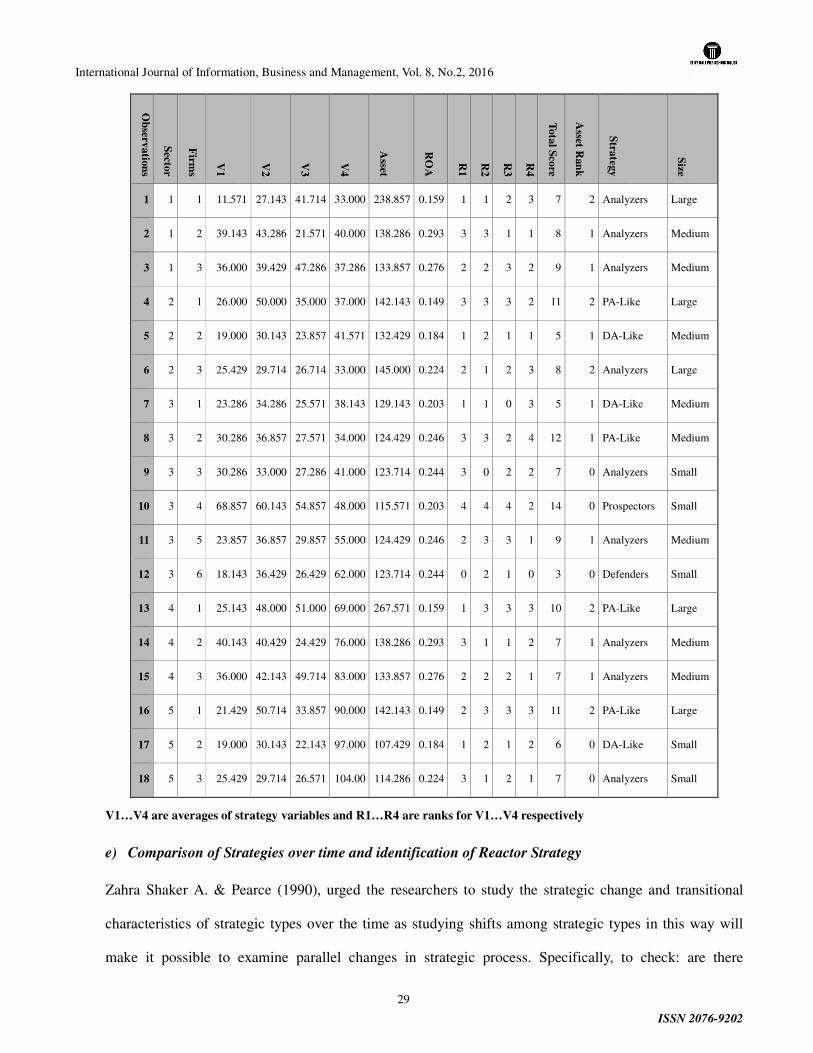
Table 4: Strategic Orientations of the firms over time
Strategic Orientation Over Time
Final
Grading* Obs Sector Firms
Strategy at
Time 1
Strategy at
Time 2
Strategy at
Time 3 Strategy Overall
1 1 1 Analyzers Analyzers Analyzers Analyzers Analyzers
2 1 2 Analyzers Analyzers Analyzers Analyzers Analyzers
3 1 3 PA-Like+ Analyzers Analyzers Analyzers Analyzers
4 2 1 PA-Like PA-Like PA-Like PA-Like PA-Like
5 2 2 DA-Like+ DA-Like DA-Like DA-Like DA-Like
6 2 3 Analyzers PA-Like Analyzers Analyzers Analyzers
7 3 1 DA-Like Analyzers Analyzers DA-Like Reactor
8 3 2 PA-Like PA-Like PA-Like PA-Like PA-Like
9 3 3 Analyzers DA-Like Analyzers Analyzers Analyzers
10 3 4 Prospectors Prospectors Prospectors Prospectors Prospectors
11 3 5 DA-Like Analyzers Analyzers Analyzers Analyzers
12 3 6 DA-Like Defenders Defenders Defenders Defenders
13 4 1 Analyzers PA-Like Analyzers PA-Like Reactors
14 4 2 DA-Like Analyzers Analyzers Analyzers Analyzers
15 4 3 Analyzers Analyzers Analyzers Analyzers Analyzers
International Journal of Information, Business and Management, Vol. 8, No.2, 2016
ISSN 2076-9202
31
Strategic Orientation Over Time
Final
Grading* Obs Sector Firms
Strategy at
Time 1
Strategy at
Time 2
Strategy at
Time 3 Strategy Overall
16 5 1 PA-Like PA-Like PA-Like PA-Like PA-Like
17 5 2 DA-Like DA-Like DA-Like DA-Like DA-Like
18 5 3 Analyzers Analyzers Analyzers Analyzers Analyzers
*Final grading is based on the rule as: a strategic type is considered final if it occurs at least 3 out of 4 times; else “Reactors”
+PA-Like=Prospector-Analyzers-Like, DA-Like=Defender Analyzers Like
To answer the above important questions, and for identification of the reactor strategy coding is done to
find strategic orientation of the firms over the time. It is assumed that 3-to-5 years are sufficient time
period for any strategy to mature. Five years average data is used to find the strategic orientation and
marginal effect at year 2012, 2013, and 2014. The output is presented in Table 4. The identification of the
reactor strategy is also possible by monitoring the movement of strategic orientation over time. For
example, a strategy type is considered as final if it occurs at least three times out of four. Otherwise, the
firm is considered as reactor firm (see observation number 7 and 13). The firms at serial number 1, 2, 4, 5,
10, 15, and 18 have the most consistent strategic approach.
f) Data Analysis
Once the identification is completed, the analysis such as descriptive statistics, cross-tabulation, analysis
of variance, correlation, and regression analysis can be done by applying a number of SAS procedures.
The commonly used procedures for this purpose are: PROC SUMMARY; PROC MEANS; PROC
UNIVARIATE; PROC FREQ; PROC GLM; PROC REG; PROC Logistics; and PROC CATMOD
( Kleinman & Horton, 2010).
Conclusion
The paper presented, in first part, a brief overview of empirical research on Miles and Snow typology to
identify the insights about the application diversity, distribution of strategic types in industries,
International Journal of Information, Business and Management, Vol. 8, No.2, 2016
ISSN 2076-9202
32
methodologies applied, and list of strategy and performance measures. One of the findings is that the
scoring methodology presents a sketchy picture lacking clear explanation and documentation. The second
part of this paper presents a step-by-step procedure with examples to explain the scoring methodology for
identification of strategic types including reactor strategy. The consistency of the strategic orientation
over time is also checked. The specific contribution of the study include: a framework where three viable
strategic types are extended to five strategic types as pure defenders, DA-Like, pure analyzers, PA-Like
and pure prospectors; codes are developed to facilitate the researchers in preparation of dataset for
multidimensional analysis; strategic types were identified at 3 points in time and then compared it with
overall averaged data is an important aspect of the study to check the consistency of the strategic
orientation over time; and the identification of the reactor strategy when archived financial data is used.
Further analysis including descriptive statistics, cross-tabulation, ANOVA, and regression etc can easily
be done through the use of powerful SAS procedures or by using any other software of their choice as
SAS has the facility of importing and exporting data into the number of other formats. The methodology
presented here can be used in similar situations where groupings or typologies are to be categorized in
business strategy or in any other field of study.
References
Balsam, S., Fernando, G. D., & Tripathy, A. (2011). The impact of firm strategy on performance
measures used in executive compensation. Journal of Business Research, 64, 187–193.
doi:10.1016/j.jbusres.2010.01.006
Base SAS 9.3: Procedures Guide Statistical Procedures (Second Edition). (2012). SAS Institute Inc.
USA.
Bentley, K. A., Omer, T. C., & Sharp, N. Y. (2013). Business Strategy, Financial Reporting Irregularities,
and Audit Effort. Contemporary Accounting Research, 30(2), 780–817.
doi:10.1111/j.1911-3846.2012.01174.x
Bilenas, J. V, Morgan, J. P., & Bank, C. (2009). PROC RANK and PROC UNIVARIATE to Rank or
Decile Variables, 1–16.

International Journal of Information, Business and Management, Vol. 8, No.2, 2016
ISSN 2076-9202
33
Blackmore, K., & Nesbitt, K. (2012). Verifying the Miles and Snow strategy types in Australian small-
and medium-size enterprises. Australian Journal of Management, 38(1), 171–190.
doi:10.1177/0312896212444692
Conant, J. S., Mokwa, M. P., & Varadarajan, P. R. (1990). Strategic Types, Distinctive Marketing
Competencies and Organizational Performance: A Multiple Measures-Based Study. Strategic
Management Journal, 11(5), 365–383.
D. Ittner, Larcker, D. F., & Rajan, M. V. (1997). The Choice Performance Measures in Annual Bonus
Contracts. The Accounting Review, 72(2), 231–255.
Daniel Rajaratnam, & Chonko, L. B. (1995). The Effect of Business Strategy Type on Marketing
Organization Design, Product-market Growth Strategy, Relative Marketing Effort, and Organization
Performance. Journal of Marketing Theory and Practice, 3(3), 60–75.
Desarbo, W. S., Benedetto, C. A. Di, Song, M., & Sinha, I. (2005). Revisiting the Miles and Snow
Strategic Framework: Uncovering Interrelationships between Strategic Types , Capabilities ,
Environmental Uncertainty , and Firm Performance. Strategic Management Journal, 26(1), 47–74.
Evans, J. D., & Green, C. L. (2000). Marketing Strategy, Constituent Influence, and Resource Allocation:
An Application of the Miles and Snow Typology to Closely Held Firms in Chapter 11 Bankruptcy.
Journal of Business Research, 50, 225–231.
Hambrick, D. C. (1981). Strategic Awareness within Top Management Teams. Strategic Management
Journal, 2(3), 263–279.
Hambrick, D. C. (1983). Some Tests of the Effectiveness and Functional Attributes of Miles and Snow’s
Strateic Types. The Academy of Management Journal, 26(1), 5–26.
Jennings, D. F., Rajaratnam, D., & Lawrence, F. B. (2003). Strategy-Performance Relationships In
Service Firms : A Test For Equifinality. Journal of Managerial Issues, 15(2), 208–220.
Jennings, D. F., & Seaman, S. L. (1994). High and Low Levels of Organizational Adaptation: An
Empirical Analysis of Strategy, Structure, and Performance. Strategic Management Journal, 15(6), 459–
475.
Ketchen, D. J., & Shook, J. and C. L. (1996). The Application of Cluster Analysis in Strategi
Management Research: An Analysis and Critique. Strategic Management Journal, 17(6), 441–458.
Kleinman, K., & Horton, N. J. (2010). SAS and R: Data Management, Statistical Analysis, and Graphics.
Chapman & hall/CRC. Taylor and Francis Group, 6000 Broken Sound Parkway NW, Suit 300 Boca
Raton, FL 33487-2742.

International Journal of Information, Business and Management, Vol. 8, No.2, 2016
ISSN 2076-9202
34
Liang, X., Musteen, M., & Datta, D. K. (2009). Strategic Orientation and the Choice of Foreign Market
Entry Mode: An Empirical Examination. Management International Review, 49(3), 269–290.
doi:10.1007/S11575-009-0143-Z
Lin, C., Tsai, H.-L., & Wu, J.-C. (2014). Collaboration strategy decision-making using the Miles and
Snow typology. Journal of Business Research, 67(9), 1979–1990. doi:10.1016/j.jbusres.2013.10.013
Mcdaniel, S. W., & Kolari, J. W. (1987). Marketing Strategy Implications of the Miles and Snow
Strategic Typology. Journal of Marketing, 51(4), 19–30.
Miles, R. E., Snow, C. C., Meyer, A. D., & Coleman Jr, H. J. (1978). Organizational Strategy, Structure
and Process. Academy of Management Review, 3(3), 564–562.
Olson, E. M., Slater, S. F., & Hult, G. T. M. (2005). The Performance Implication of Fit among Business
Strategy , Marketing Organization Structure and Strategic Behavior. Journal of Marketing, 69(3), 49–65.
Parnell, J. A., Long, Z., & Lester, D. (2015). Competitive strategy, capabilities and uncertainty in small
and medium sized enterprises (SMEs) in China and the United States. Management Decision, 53(2), 402–
431.
Premal P. Vora. (2008). Easy Rolling Statistics with PROC EXPAND Penn State Harrisburg ,
Middletown , PA . SAS Global Forum 2008 Applications Development, 1–6.
Sarac, M., Ertan, Y., & Yucel, E. (2014). How Do Business Strategies Predict Firm Performance ? An
Investigation On Borsa Istanbul 100 Index. The Journal of Accounting and Finance, 61, 121–134.
Shortell, S. M., & Zajac, E. J. (1990). Perceptual and Archival Measures of Miles and Snow’s Strategic
Types: A Comprehensive Assesment of Reliability and Validity. The Academy of Management Journal,
33(4), 817–832.
Slater, F., Olson, E. m., & Finnegan, C. (2011). Business strategy , marketing organization culture , and
performance. Marketting Letters, 22(3), 227–242. doi:10.1007/sl
Smith, K. G., Guthrie, J. P., & Chen, M. (1989). Strategy, Size and Performance. Organization Studies,
10(1), 63–81.
Snow, C. C., & Hrebiniak, L. G. (1980). Strategy , Distinctive Competence , and Organizational
Performance. Administrative Science Quarterly, 25(2), 317–336.
Thomas, A. S., & Ramaswamy, K. (1996). Matching Managers to Strategy: Further Tests of the Miles
and Snow Typology. British Journal of Management, 7(3), 247–261.
doi:10.1111/j.1467-8551.1996.tb00118.x

International Journal of Information, Business and Management, Vol. 8, No.2, 2016
ISSN 2076-9202
35
Thompson, S. R. (2012). FREQ Out – Exploring Your Data the Old School Way. SAS Institute Inc. USA.
Valos, M., & Mavando, F. (2003). Aligning Marketing Strategy and Marketing Implementation for
Marketing Performance. In ANZMAC 2003: A Celebration of Ehrenberg and Basss: Marketing
Discoveries, knowledge and contribution (pp. 2380–2387). University of South Australia.
Zahra Shaker A. (1987). Corporate strategic types, environmental perceptions, managerial philosophies,
and goals: An empirical study. Akr on Blusiness and Economic Review, 18(2), 64–77.
Zahra Shaker A., & Pearce, J. A. (1990). Research Evidence on Miles and Snow Typology. Journal Of
Management, 16(4), 751–768.
International Journal of Information, Business and Management, Vol. 8, No.2, 2016
ISSN 2076-9202
36
EXPLORING THE LINK BETWEEN INTELLECTUAL CAPITAL
AND PERCEIVED ORGANIZATIONAL PERFORMANCE
AKANBI, Paul A, Ph. D
Department of Business Administration
Faculty of Social and Management Sciences
Ajayi Crowther University , Oyo P.M.B. 1066
Oyo State, Nigeria.
[email protected], [email protected]
+234-8034813651
Abstract
The role that intellectual capital plays in organizational performance and in gaining sustainable
competitive advantage cannot be ignored by organizations. Intellectual capital is considered an asset, and
can broadly be termed as the collection of all informational resources a company has at its disposal that
can be used to drive profits, gain new customers, create new products, or otherwise improve the business.
This study explored the link between intellectual capital and perceived organizational performance in
Dana Group of Companies, Lagos. The objectives of this research work were to determine the association
between human capital and perceived organizational performance and the relationship between customer
capital and perceived organizational performance. It is also aimed at ascertaining the nexus between
structural capital and perceived organizational performance as well as the connection between innovation
capital and organizational performance.
The study employed survey research. Primary data was used for the study with questionnaires as research
instruments. The subjects of the study were one hundred and forty nine employees of Dana Group of
Companies, Lagos. The participants for this study were selected using stratified random technique. The
hypotheses formulated for the study were tested using Pearson’s Correlation.
Findings from this study revealed a significant relationship between human capital and organizational
performance with r = .327**, N= 149, P < .01. The research indicated a significant a significant
relationship between customer capital and organizational performance with r = .321**, N= 149, P < .01.
The study also showed a significant relationship between structural capital and organizational
performance with r = .321**, N= 149, P < .01. The results of the study indicated a significant relationship
between innovation capital and organizational performance with r = .321**, N= 149, P < .01.
The study concluded and recommended that efforts should be made by organizations to put in place a
robust intellectual capital platform that can bring about superior performance and sustainable competitive
advantage.
International Journal of Information, Business and Management, Vol. 8, No.2, 2016
ISSN 2076-9202
37
Keywords: Intellectual capital, human capital, customer capital, structural capital, innovation capital,
organizational performance.
Introduction
Intellectual capital is a combination of individual knowledge and capabilities that can result in the
creation of value and wealth as well as a type of organizational capital that includes human relation
(common values and philosophy of management) and commercial assets (commercial signs and royalty)
(Lu and Hung, 2011). Intellectual capital as a kind of knowledge that companies use to gain competitive
advantage (Li et al, 2010) is the key resource and key stimulant of organizational performance in order to
create value. This value can be obtained through innovation, increased productivity, reducing cost and
customer loyalty (Kim et al, 2011).
Some reasons for importance of intellectual capital that can be referred to are as follows: the
need to skilled and expert, the importance of customer value and attention to concepts such as learning
and innovation in new economy (Ienciu et al, 2011). Therefore the progress in new economy emphasizes
this fact that creating more value rely on intangible assets. Intellectual capital is considered as the main
resource for economic expansion and key factor for promoting organizational performance (Shojaie and
Baghbaniyan, 2009) and as a result nowadays efficiency and performance of organizations rely on
efficient management of intellectual capital (Ramezan, 2011). In the knowledge-based economy, the most
successful organizations will be those who use their intellectual capital in the most effective ways to
improve performance.
In modern economic perspectives, effective knowledge management determines organizational
outcomes, organizational performance and sustainable competitive advantage(Ogunsiji and Akanbi,2013).
This system shares opinion that conventional capitals such as natural resources, financial resources, and
other tangible assets resources are meaningless without knowledge-base and technological base capital.
The implementation of knowledge-base and technological base capital in a company will accelerate the
efficiency and effectiveness of the implementation of other resources, so that they will lead to the
competitive advantage of the company. According to resource-based theory, the intellectual capital (IC) is
a main source to improve business performance (Roos et al., 1997). Therefore, intellectual capital has
been studied by many past researchers (Amir and Lev, 1996; Bontis, 2001; Edvinsson and Malone, 1997;
Ittner and Larcker, 1998; Stewart, 1997; Wang and Chang, 2005), who investigate the influence of
intellectual capital on business performance. This study therefore investigates the connection between
intellectual capital and perceived organizational performance in Dana Group of Companies, Lagos.
Objectives of the Study
This study is broadly targeted at the relationship between intellectual capital and perceived
organizational performance. There are four objectives that this study intends to achieve. They are:
1. To explore the link between human capital and perceived organizational performance.
2. To determine the relationship between customer capital and perceived organizational
performance.
International Journal of Information, Business and Management, Vol. 8, No.2, 2016
ISSN 2076-9202
38
3. To examine the connection between structural capital and perceived organizational
performance.
4. To ascertain the link between innovation capital and perceived organizational performance.
Hypotheses of the Study
In line with the objectives of the study, the following hypotheses are tested in this study.
1. There is a significant relationship between human capital and perceived organizational
performance.
2. There is a significant relationship between customer capital and perceived organizational
performance.
3. There is a significant relationship between structural capital and perceived organizational
performance.
4. There is a significant relationship between innovation capital and perceived organizational
performance.
Literature Review
Ling (2011) confirmed that intellectual capital does enhance a firm’s global initiatives, and
intellectual capital complementarities have positive impact on a firm’s global initiatives (global
innovation and global marketing) in both high and low dynamic context. Gabriela et al. (2012) were of
the opinion that intellectual capital consists of stocks and flows of knowledge available in an organization.
Intellectual capitals are intellectual materials that can be captured as assets, such as knowledge,
information, intellectual property, and employees’ experiences, commitments or capabilities (Barney,
2002). Although intellectual capital has being viewed as a key determinant of business performance,
relatively little is known about how dimensions of intellectual capital individually and compositely affect
a firm’s performance (Tovstiga and Tulugurova, 2007). Hsu (2006) suggested that intellectual capital
dimensions such as human capital, innovation capital and structural capital are important and act as
integral knowledge in an organization. However, there is no consistency as to the types of capitals to
include as dimensions of intellectual capital. Some studies examined dimensions from a classification and
conceptual models perspective (Bontis, 1999, 2002; Van Buren, 1999; Pike, Rylander and Roos, 2002),
while others measured dimensions of intellectual capital using accounting, financial and disclosure
methods (Kamath, 2007; Mavridis, 2004). Thus, there is a need to study more closely the specific
dimensions of intellectual capital that are crucial to the firm performance.
Typically most firms have three forms of IC embedded in their people, structures, and customers.
These are human capital, structural capital, and relational capital (Stewart, 2001; Grace, 2006; Curado
and Bontis, 2007; De Castro and Saez, 2008; Hsu and Fang, 2009). Human capital is the knowledge,
skills, experience, intuition, and attitudes of the workforce (Stewart, 1997), and can be enhanced by
increasing the capacity of each worker (Teo, 1998). Structural capital has to with patents, copyrights, and
information-age assets such as data bases and software. These are organizational and technological
elements that pursue integration and coordination within the firm (De Castro and Saez, 2008). Relational
International Journal of Information, Business and Management, Vol. 8, No.2, 2016
ISSN 2076-9202
39
capital refers to the value of a firm’s relationships with the people with whom it does business. It is the
likelihood that these people will keep doing business with the firm (Stewart, 1997; Edvinsson and Malone,
1997). Firms with more human, relational and structural capital should be able to better enact their
environment as well as respond and adapt to environmental changes (Gold, Malhotra and Segars, 2001).
The dimension of relational capital is based on the idea that organizations are conceptualised not to
be isolated systems but as systems that are, to a great extent, dependent on their relations with their
environment. Thus, this type of capital includes the value generated by relationships not only with
customers, suppliers or shareholders, but with all stakeholders, both internal and external (Hormiga and
Batista-Canino, 2010). The relationships of this type that contribute value to the firm are regarded as
relational capital; the knowledge embedded in the relationships established with the outside environment
and inter organization (Bontis,1997 , Edvinsson, and Sullivan,1996). Relationships in the organizations
can be viewed as social relationships (between individual, which can be professional or nonprofessional)
and inter organizational relationships.
This study is anchored on the theories of Knowledge-based View (KBV) and Resource-based View
(RBV) of the firm which are important theories or perspectives in Strategic Management. KBV of the
firm addresses the issues of the existence, the boundaries, and the internal organization of the
multi-person firm (Foss, 1996). The starting point is that knowledge is the key explanatory factor, and the
nature of knowledge is an important determinant enhancing understanding of firm organization and
behaviour (Foss, 2005). The RBV states that a firm develops competitive advantage by not only acquiring
but also developing, combining, and effectively deploying its physical, human, and organizational
resources in ways that add unique value and are difficult for competitors to imitate (Barney, 1991). Most
resource- based arguments are rooted in human resources. The RBV is mainly interested in identifying the
essential productive (knowledge) resources and examining how these resources can be acquired, protected,
and valuated (Spender, 1996b). It is based on the cognitivist perspective on knowledge that assumes
knowledge can be managed with tight procedures, policies, and defined action (Von Krogh, 1998). The
KBV, in contrast, is based on the constructionist view of knowledge, which assumes that knowledge
cannot be completely controlled but can only be managed by creating enabling conditions (Von Krogh,
1998), and focuses on how knowledge resources are utilized and coordinated (Spender, 1996b).
Methodology
Research Design
The design for this study is a survey design with intellectual capital as independent variable which
was measured by human capital, customer capital, structural capital and innovation capital and perceived
organizational performance as dependent variable.
Subjects
The respondents of this study were one hundred and forty-nine employees of Dana Group of
Companies, Lagos consisting of one hundred and one males and forty eight females with age from
eighteen years to fifty-five years.
Instruments
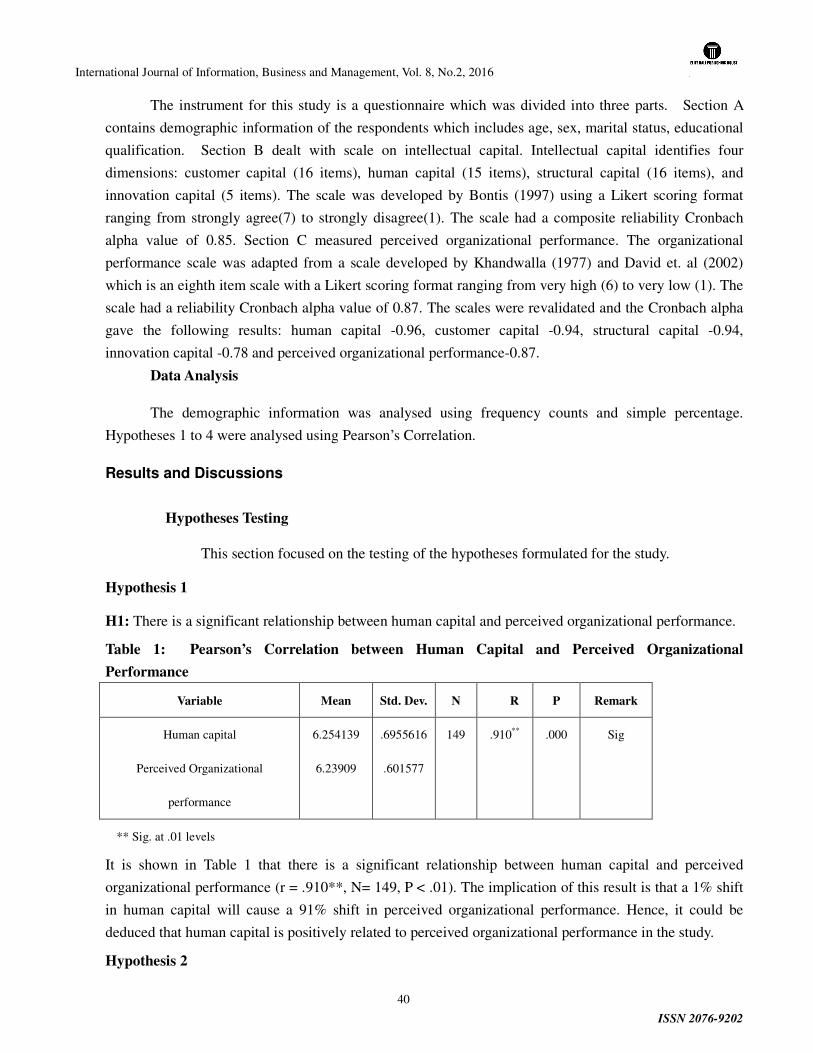
International Journal of Information, Business and Management, Vol. 8, No.2, 2016
ISSN 2076-9202
40
The instrument for this study is a questionnaire which was divided into three parts. Section A
contains demographic information of the respondents which includes age, sex, marital status, educational
qualification. Section B dealt with scale on intellectual capital. Intellectual capital identifies four
dimensions: customer capital (16 items), human capital (15 items), structural capital (16 items), and
innovation capital (5 items). The scale was developed by Bontis (1997) using a Likert scoring format
ranging from strongly agree(7) to strongly disagree(1). The scale had a composite reliability Cronbach
alpha value of 0.85. Section C measured perceived organizational performance. The organizational
performance scale was adapted from a scale developed by Khandwalla (1977) and David et. al (2002)
which is an eighth item scale with a Likert scoring format ranging from very high (6) to very low (1). The
scale had a reliability Cronbach alpha value of 0.87. The scales were revalidated and the Cronbach alpha
gave the following results: human capital -0.96, customer capital -0.94, structural capital -0.94,
innovation capital -0.78 and perceived organizational performance-0.87.
Data Analysis
The demographic information was analysed using frequency counts and simple percentage.
Hypotheses 1 to 4 were analysed using Pearson’s Correlation.
Results and Discussions
Hypotheses Testing
This section focused on the testing of the hypotheses formulated for the study.
Hypothesis 1
H1: There is a significant relationship between human capital and perceived organizational performance.
Table 1: Pearson’s Correlation between Human Capital and Perceived Organizational
Performance
Variable Mean Std. Dev. N R P Remark
Human capital
Perceived Organizational
performance
6.254139
6.23909
.6955616
.601577
149 .910** .000 Sig
** Sig. at .01 levels
It is shown in Table 1 that there is a significant relationship between human capital and perceived
organizational performance (r = .910**, N= 149, P < .01). The implication of this result is that a 1% shift
in human capital will cause a 91% shift in perceived organizational performance. Hence, it could be
deduced that human capital is positively related to perceived organizational performance in the study.
Hypothesis 2
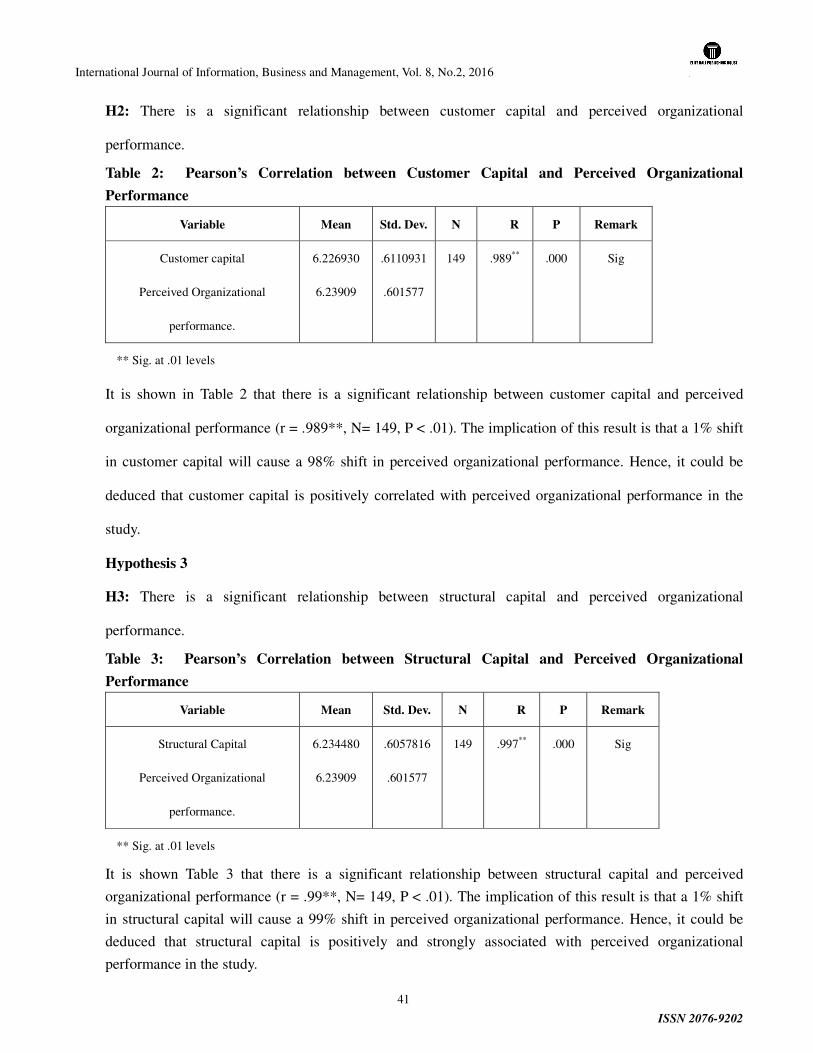
International Journal of Information, Business and Management, Vol. 8, No.2, 2016
ISSN 2076-9202
41
H2: There is a significant relationship between customer capital and perceived organizational
performance.
Table 2: Pearson’s Correlation between Customer Capital and Perceived Organizational
Performance
Variable Mean Std. Dev. N R P Remark
Customer capital
Perceived Organizational
performance.
6.226930
6.23909
.6110931
.601577
149 .989** .000 Sig
** Sig. at .01 levels
It is shown in Table 2 that there is a significant relationship between customer capital and perceived
organizational performance (r = .989**, N= 149, P < .01). The implication of this result is that a 1% shift
in customer capital will cause a 98% shift in perceived organizational performance. Hence, it could be
deduced that customer capital is positively correlated with perceived organizational performance in the
study.
Hypothesis 3
H3: There is a significant relationship between structural capital and perceived organizational
performance.
Table 3: Pearson’s Correlation between Structural Capital and Perceived Organizational
Performance
Variable Mean Std. Dev. N R P Remark
Structural Capital
Perceived Organizational
performance.
6.234480
6.23909
.6057816
.601577
149 .997** .000 Sig
** Sig. at .01 levels
It is shown Table 3 that there is a significant relationship between structural capital and perceived
organizational performance (r = .99**, N= 149, P < .01). The implication of this result is that a 1% shift
in structural capital will cause a 99% shift in perceived organizational performance. Hence, it could be
deduced that structural capital is positively and strongly associated with perceived organizational
performance in the study.
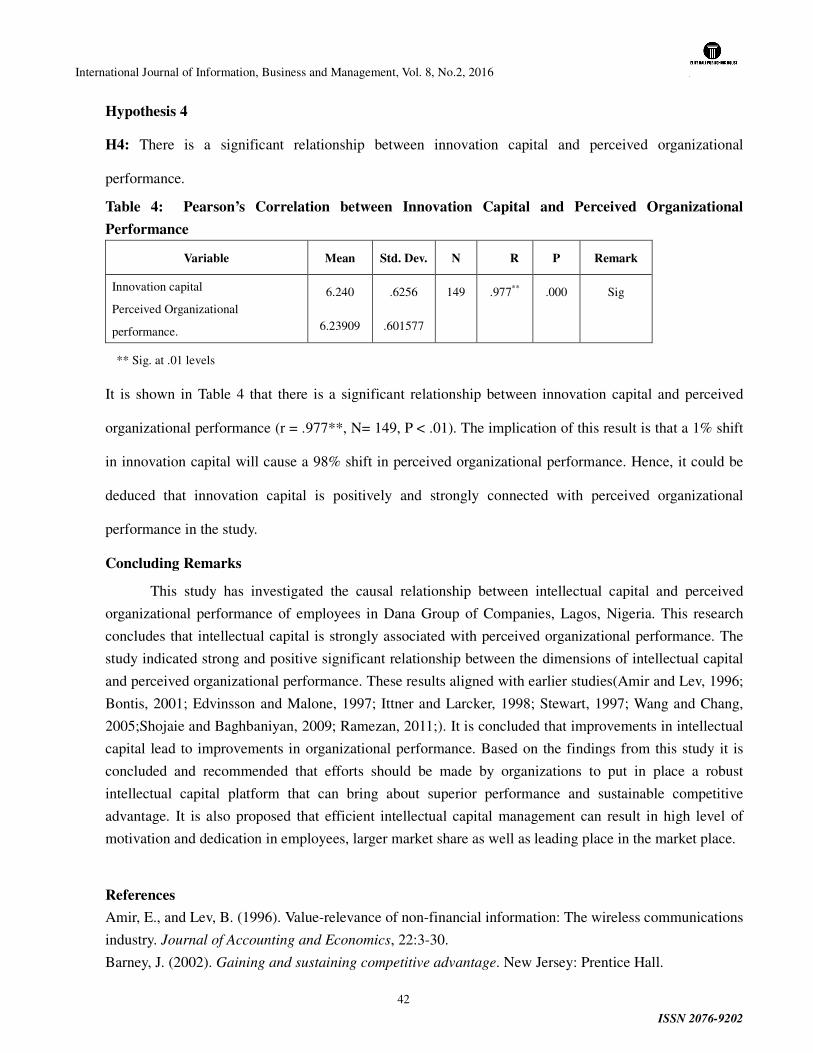
International Journal of Information, Business and Management, Vol. 8, No.2, 2016
ISSN 2076-9202
42
Hypothesis 4
H4: There is a significant relationship between innovation capital and perceived organizational
performance.
Table 4: Pearson’s Correlation between Innovation Capital and Perceived Organizational
Performance
Variable Mean Std. Dev. N R P Remark
Innovation capital
Perceived Organizational
performance.
6.240
6.23909
.6256
.601577
149 .977** .000 Sig
** Sig. at .01 levels
It is shown in Table 4 that there is a significant relationship between innovation capital and perceived
organizational performance (r = .977**, N= 149, P < .01). The implication of this result is that a 1% shift
in innovation capital will cause a 98% shift in perceived organizational performance. Hence, it could be
deduced that innovation capital is positively and strongly connected with perceived organizational
performance in the study.
Concluding Remarks
This study has investigated the causal relationship between intellectual capital and perceived
organizational performance of employees in Dana Group of Companies, Lagos, Nigeria. This research
concludes that intellectual capital is strongly associated with perceived organizational performance. The
study indicated strong and positive significant relationship between the dimensions of intellectual capital
and perceived organizational performance. These results aligned with earlier studies(Amir and Lev, 1996;
Bontis, 2001; Edvinsson and Malone, 1997; Ittner and Larcker, 1998; Stewart, 1997; Wang and Chang,
2005;Shojaie and Baghbaniyan, 2009; Ramezan, 2011;). It is concluded that improvements in intellectual
capital lead to improvements in organizational performance. Based on the findings from this study it is
concluded and recommended that efforts should be made by organizations to put in place a robust
intellectual capital platform that can bring about superior performance and sustainable competitive
advantage. It is also proposed that efficient intellectual capital management can result in high level of
motivation and dedication in employees, larger market share as well as leading place in the market place.
References
Amir, E., and Lev, B. (1996). Value-relevance of non-financial information: The wireless communications
industry. Journal of Accounting and Economics, 22:3-30.
Barney, J. (2002). Gaining and sustaining competitive advantage. New Jersey: Prentice Hall.

International Journal of Information, Business and Management, Vol. 8, No.2, 2016
ISSN 2076-9202
43
Barney, J. B. (1991). Firm resources and sustained competitive advantage. Journal of Management, 17:
99–120.
Bontis, N. (1997), Intellectual Capital Survey Questionnaire, Hamilton: Institute for Intellectual Capital
Research, retrieved in 2006, from the World Wide Web:
www.business.mcmaster.ca/mktg/nbontis/ic/publications/BontisMDIC1998survey.pdf.
Bontis, N. (1999). Intellectual capital: an exploratory study that develops measures and models.
Management Decision, 36(2): 63-76.
Bontis, N. (2001). Assessing knowledge assets: a review of the models used to measure intellectual
capital. International Journal of Management Reviews, 3(1):41-60.
Bontis, N. (2002). Intellectual capital: an exploratory study that develops measures and models. In C.W.
Choo & N. Bontis (eds). The strategic management of intellectual capital and organizational knowledge.
New York: Oxford University Press.
Curado, C. and Bontis, N. (2007). Managing intellectual capital: the MIC matrix. International Journal of
Knowledge and Learning, 3(2/3):316-328.
David, W., Chin,H.O and Victor, K. (2002). Strategic Human Resource Management and organizational
Performance in Singapore. Sage Publications,July/August.
De Castro, G.M. and Saez, P.L. (2008). Intellectual capital in high tech firms: the case of Spain. Journal
of Intellectual Capital, 9(1):25-36.
Edvinsson, L. and Sullivan, P. (1996). Developing a model for management intellectual capital, European
Management Journal, 14(4): 187-199.
Edvinsson, L., and Malone, M. S. (1997). Intellectual capital – Realizing your company’s true value by
finding its hidden roots. New York, NY: Harper Business.
Foss, N. (1996). Knowledge-based approaches to the theory of the firm: Some critical comments.
Organization Science, 7(5): 470-481.
Foss, N. (2005). Strategy, economic organization and the knowledge economy, The Coordination of firms
and Resources. Oxford University Press: Oxford.
International Journal of Information, Business and Management, Vol. 8, No.2, 2016
ISSN 2076-9202
44
Gabriela, H.M., Dorinela, N., and Alexandra, I. (2012). Learning Organization: The Importance of
Innovation and Adaptation. “Ovidius” University Annals, Economic Sciences Series, XII( 2): 145-150.
Gold, A.H., Malhotra, A. and Segars, A.H. (2001). Knowledge management: an organizational
capabilities perspective. Journal of Management information Systems, 18:185-215.
Grace, C.C.L. (2006). Integrating knowledge management into market orientation: impact on hotel
performance. Unpublished PhD thesis, Hong Kong Polytechnic University, Hong Kong.
Hsu, H.Y. and Fang, W. (2009). Intellectual capital and new product development performance: the
mediating role of organizational learning capability. Technological Forecasting and Social Change, 76(5):
664-677.
Ienciu, N., Dumitru, M.M. and Ionel-Alin,I. (2011). The importance of intellectual capital within
Romanian listed entities. International Journal of Business Research, 11 (1).
Ittner, C. D., and Larcker, D. F. (1998). Are non-financial measures leading indicators of financial
performance? An analysis of customer satisfaction. Journal of Accounting Research, 36:1-35.
Kamath, G.B. (2007). The intellectual capital of Indian banking sector. Journal of Intellectual Capital,
8(1): 96-123.
Khandwalla,P.(1977).The design of organizations.NewYork:Harcourt Brace Jovanovich.
Kim, T. G., Woo, S. P., Simon, L. and Gyehee, J, B. (2012). Intellectual Capital and Business
Performance: What Structural Relationships Do They Have in Upper-Upscale Hotels?.International
Journal of Tourism Research, (14): 391–408.
Li, S.T., Tsai, M. H. and Lin, C. (2010). Building a taxonomy of a firm’s knowledge assets: A perspective
of durability and profitability. Journal of Information Science, 36 (1). 36–56.
Ling, Y.H. (2011). The Influence of Intellectual Capital on Organizational Performance in two Contexts.
Proceedings of the 8th International Conference on Intellectual Capital, Knowledge Management &
Organisational Learning. The Institute for Knowledge and Innovation, Southeast Asia (IKI-SEA) of
Bangkok University, Bangkok, Thailand, 27-28 October 2011, pp. 34.
Lu, W.M. and Hung, S. W.( 2011). Exploring the operating efficiency of Technology Development
Programs by an intellectual capital perspective- A case study of Taiwan. Technovation, 31:374–383.
Mavridis, D.G. (2004). The intellectual capital performance of the Japanese banking sector. Journal of
International Journal of Information, Business and Management, Vol. 8, No.2, 2016
ISSN 2076-9202
45
Intellectual Capital, 5(1): 92-115.
Ogunsiji, A.S..and Akanbi, P.A. (2013). Strategic Impact of Knowledge Management and Organizational
Learning on the Perceived Performance of Selected Banks in Oyo State of Nigeria. Journal of Economics
and Sustainable Development, 4 (12): 45-53.
Pike, S., Rylander, A. and Roos, G. (2002). Intellectual capital: management and disclosure. In C.W.
Choo & N. Bontis (eds). The strategic management of intellectual capital and organizational knowledge.
New York: Oxford University Press.
Ramezan, M.(2011). Intellectual capital and organizational organic structure in knowledge society: How
are these concepts related?. International Journal of Information Management, 3: 88–95.
Roos, J., Roos, G., Dragonetti, N., and Edvinsson, L. (1997). Intellectual Capital: Navigating the New
Business Landscape. London: MacMillan Press.
Shojaee, N. and Baghbaniyan, M. (2009). Examining the relationship between intellectual capital and
organizational performance of banking industry in Iran (Case Study: Kurdistan province), Journal of
Industrial Management, 4(9):107-117.
Spender, J.C. (1996b). Making knowledge the basis of a dynamic theory of the firm. Strategic
Management Journal, 17: 45-62.
Stewart, T.A. (2001). The wealth of knowledge: intellectual capital and the twenty-first century
organization. New York: Currency Books.
Teo, C.H. (1998). Intellectual capital. Presidents and Prime Ministers, 7(6): 15-16.
Tovstiga, G. and Tulugurova, E. (2007). Intellectual practices and performance in Russian enterprises.
Journal of Intellectual Capital, 8(4): 695-707.
Van Buren, M.E. (1999). A yardstick for knowledge management. Training and Development, 53: 71-78.
Von Krogh, G. (1998). Care in knowledge creation. California Management Review, 40 (3): 133-153.
Wang, W. Y., and Chang, C. (2005). Intellectual capital and performance in causal models evidence from
the information technology industry in Taiwan. Journal of Intellectual Capital, 6(2):222-236.

International Journal of Information, Business and Management, Vol. 8, No.2, 2016
ISSN 2076-9202
46
MASSIVELY SCALABLE PARALLEL NEURAL NETWORKS: A BIG
DATA EXPERIMENT
Shannon D. McMurtrey, Ph.D.
Missouri State University
Randall Sexton, Ph.D.
Missouri State University
Abstract
As the cost of computer hardware goes down, the efficiency of processors and secondary storage
continues to increase at a rapid pace. These conditions have led us to storing huge amounts of data, which
is sometimes referred to as Big Data. The Neural Network (NN) has been shown in the past as a capable
tool for prediction. However, operating in serial on such huge data sets is cumbersome and time
consuming.
In this research, a parallelized NN that uses a modified genetic algorithm known as Neural
Network Simultaneous Optimization Algorithm (NNSOA) is shown to significantly speed up the training
process. Past research has shown that the NNSOA was well suited for parallelizing the NN training
process on computer generated data (McMurtrey, 2013). This research extends the experiment to
real-world data for validity.
1. Introduction
Feed forward neural networks have been used as universal approximators for over fifty years
(McCulloch & Pitts, 1943). Examples can be easily found and are numerous that range from predicting
International Journal of Information, Business and Management, Vol. 8, No.2, 2016
ISSN 2076-9202
47
breast cancer to bankruptcy. The majority of NNs in operation today uses some form of back-propagation
(BP) algorithm for training (Fausett, 1994). The BP algorithm has done quite well for finding adequate
solutions, but its limitations are well known (Seiffert, 2004, Sexton et al, 1998). An additional limitation
to BP is its effectiveness when used in a parallel environment (Long & Gupta, 2005, Seiffert, 2004).
This research uses NNSOA as the search technique, which overcomes all of these limitations (Sexton et al,
2006, Sexton et al, 2005, Sexton et al, 2003, Sexton et al, 1998). No matter what we are predicting
today, our technology drives us to be able to handle terabytes of data in a short amount of time to gain
competitive advantage.
The Neural Network Simultaneous Optimization Algorithm (NNSOA) differs from BP in that it is
not a gradient descent algorithm. This provides a greater search of the error surface allowing it to find
solutions that usually generalize better than networks trained using gradient descent methods (such as BP).
The NNSOA does not depend on the backward propagation of errors and better lends itself to parallel
implementations as it reduces the communication overhead during training (Sexton et al, 1998). As
discussed by Sieffert (2004), this communication and processing overhead isn’t a function of the neural
network topology, but is instead a function of the training algorithm used.
The goal of this research is to show the parallelized NNSOA not only speeds up the training process,
but also gives us superior solutions using real world data. This research builds on previous research
(McMurtrey, 2013, Seiffert, 2004, Sexton et al, 2006, Sexton et al, 2005, Sexton et al, 2003, Sexton et al,
1998) by investigating the effect of parallelizing the NNSOA on real-world data. The specific research

International Journal of Information, Business and Management, Vol. 8, No.2, 2016
ISSN 2076-9202
48
question that this research addressed was: Does the parallel version of the NNSOA obtain better results
in a given amount of time than the serial version on a variety of real-world data sets?
2. Algorithm Architecture and Training
The NNSOA is a serial algorithm that uses a modified genetic algorithm to train the neural
network (NN), optimize the architecture, and identify the inputs that are contributing to the solution
(Sexton et al, 2003, Sexton et al, 2005, Sexton et al, 2004, Sexton et al, 1998). Although the NNSOA
has been found in past research to outperform the most commonly used NN search technique, back
propagation (BP), limitations still occur when applied to complex and/or large data sets. Gradient search
techniques, such as BP, have well-known limitations when applied to complex nonlinear optimization
problems that often result in inconsistent and unpredictable performance (Rumelhart et al, 1986, Prechelt,
1996). Because of their gradient nature, BP optimized NNs are required to have non-zero values for
every weight. This limitation forces the networks to assign unneeded non-zero weights that, when
applied to the training data, offset other inputs that are not contributing to the prediction. This results in
the network predicting well with in-sample observations, and predicting poorly with out of sample
observations (poor generalization). Although the effects of these unneeded weights are minimized on
the training data, when applied to testing data or out-of-sample data, they no longer zero out and add error
to the predictions.

International Journal of Information, Business and Management, Vol. 8, No.2, 2016
ISSN 2076-9202
49
Since the NNSOA is not limited in this fashion, it can zero out the unneeded weights and has been
shown to generalize to out-of-sample data much better, which is the ultimate goal for the researcher.
However, a limitation that still needs to be addressed for the NNSOA is the ability to timely find
solutions for large/complex data sets. The NNSOA searches globally as opposed to BP techniques and
requires many more calculations to find a solution. Some problem sets are very large with many inputs
and/or observations and can take considerable time in achieving a high level of predictive accuracy.
Also, some problems may not necessarily be large considering the number of inputs and/or observations,
but are so complex in their relationship between inputs and outputs that an exhaustive search (large
amount of generations) is required to find a solution. This has limited researchers purely on the basis of
time to run the problem set
This research extends prior research that focused on parallelizing the NNSOA, which addressed
this limitation and provided not only superior solutions, but did so in a timely manner (McMurtrey, 2013).
Since time is a constraint in searching for good NN solutions, especially for large datasets, this research
shows that by parallelizing the NNSOA, a NN can now be applied to datasets that were once thought to
be too large/complex. In this case, using a NN in a serial manner would usually result in abandonment
of the search before an optimal solution was found. Although the significant reduction in time for
finding optimal NN solutions was the goal, it should be realized that given the same amount of time to
find a NN solution, the parallel version of the NNSOA also found a better solutions than the serial version
of the NNSOA. This makes intuitive sense, because the parallel version can run many more generations
(or search more exhaustively) than the serial version given a specific time constraint. The hypothesis

International Journal of Information, Business and Management, Vol. 8, No.2, 2016
ISSN 2076-9202
50
tested in this research compared the performance of the parallel version of the algorithm with the serial
version of the algorithm using real-world data sets.
Hypothesis to be tested
The hypothesis tested was:
1. The parallel version of the NNSOA will obtain better results in a given amount of time than
the serial version, on a variety of real-world data sets.
3. Experimental Design
The steps taken to achieve this, discussed further below, using real-world data sets for training and
testing that included only relevant inputs as well as data sets that include many irrelevant inputs as error
or noise, and then extensive testing and analysis comparing the serial version of the algorithm to the
parallel version. We also examined the effect of adding CPUs to the cluster to see if we get a linear or
non-linear speedup, and where (if at all) we see the optimal number of CPUs for the given problems.
Finally the algorithm was tested with real world data sets that have been used in past research, discussed
further below, to benchmark the performance of the parallel NNSOA against other algorithms.
A presentation of the serial NNSOA follows:
(1) For a single hidden layer feed-forward neural network using the sigmoid activation function at the hidden layer,
select an initial parent population of S solutions, si, i = 1, …, S, by drawing random real values from a uniform
distribution [-1,1] for input weights wij, i = 1, …, X (number of inputs), j = 1, …, H (number of hidden nodes).
This will happen only once during the training process.

International Journal of Information, Business and Management, Vol. 8, No.2, 2016
ISSN 2076-9202
51
(2) Each vector x = (x1…xN) where N = the number of observations, is then applied to the current solutions
corresponding wij, resulting in a dot product for each hidden node. The resulting dot product is then inserted into
the sigmoid activation function. The output weights wjk, j = 1, …, H, k = 1, …, O (number of outputs) are simply
the betas that are produced by regressing the values coming out of the activation function for each hidden node,
on the actual outputs using Ordinary Least Squares (OLS). If the current model includes an adequate number of
hidden nodes, all non-linearity will be accounted for and an additional sigmoid activation function for the output
layer is unneeded. By using OLS for finding the output weights, the search process becomes more efficient,
only using the NNSOA to search for the input weights.
(3) Equation 1 shows the objective function that will be used in this research for evaluating each solution in the
current population.
���� = ∑ � − � � + ��∑ ��������������
��� (1)
Here N is the number of observations in the data set, O is the observed value of the dependent
variable, Ô is the NN estimate, and C is the number of non-zero weights in the network. The penalty
for keeping an additional weight varies during the search and is equal to the current value of the Root
Mean Squared Error (RMSE). This means that the penalty for keeping additional weights is high at
the beginning of the training process, however the errors are also high at this point. As the
optimization process gets closer to the final solution the errors are decreased and the penalty value
becomes smaller. This allows the training process to only eliminate those weights that have little to
no effect on the prediction.
(4) Once each member of the current S population is evaluated by the fitness function a probability P(si) is assigned

International Journal of Information, Business and Management, Vol. 8, No.2, 2016
ISSN 2076-9202
52
to each solution si based on its fitness. This assigned probability is the percent chance that it will be drawn for
the next generation. The probability is calculated by dividing the distance of the current string’s error from the
worst error in the generation by the sum of all distances in the current generation.
���� = !"�#��#$�∑ % !"�#��#$�&'���
(2)
Where max(E) equal to the worst error in the current population S.
(5) Selecting solutions from the current population based on their assigned probability creates a mating pool of S
solutions. This is done by selecting a random number in the range of 0 and the sum of all probabilities (or 1) and
comparing it to the cumulative probability of the current string. When it is found that the random value is less
than the current string’s cumulative probability, the current string is drawn for the next generation. This is
repeated until the entire new generation of S solutions is drawn. The S new solutions will likely contain identical
solutions from the prior generation, omitting some, and duplicating others.
(6) The solutions in the mating pool are then randomly paired. A point is randomly selected for each pair (the point
will range from 1 to the number of weights in the solution) in which the parent solutions will switch the weights
that are preceding that point, generating S new solutions or the next generation. This is referred to as crossover
in GA terminology. For example, if there were 20 input weights and the random number chosen was 8, then
weights 1 through 8 will be switched between them, generating two new solutions.
(7) For each weight in a generation across all solutions, a random number is drawn, if the random value is less than
0.05, the weight will be replaced by a randomly drawn value in the entire weight space. By doing this, the entire
weight space is globally searched enhancing the algorithm’s ability to find global solutions or at least the global

International Journal of Information, Business and Management, Vol. 8, No.2, 2016
ISSN 2076-9202
53
valley. This is usually referred to as mutation.
(8) An additional mutation is included in order to eliminate unneeded weights. For each weight in a generation a
random number is drawn, if the random value is less than 0.05, the weight will be replaced by a hard zero. By
doing this, unnecessary weights in the solutions can be disconnected based on how the error measure changes
during evaluation. At this point, the algorithm will loop back to step (2) and repeat a user defined specified
number of generations until 70% of those user defined generations has occurred. Once that happens, the
algorithm will go to step 9.
(9) Once 70% of the maximum set of generations has been completed, the best solution so far replaces all the strings
in the current generation. The weights of these S identical solutions are then modified by adding/subtracting a
small random value to the current weight. These random values decrease to an arbitrarily small number as the
number of generations increase to its set maximum amount. This is similar to ES (evolution strategy) and EP
(evolutionary programming) strategies and is used for helping the solution to converge upon the global solution.
(10) The algorithm will terminate on a user specified number of generations.
The algorithm above is currently implemented in a serial fashion. For example, each si is plugged
into a NN model one at a time and the training data is put through the model to find its specific fitness.
This research took this same algorithm and modified the implementation of it so that it can process in
parallel instead of serial. For example, each si will be assigned to the next available cluster node. If S
is equal to 12 and we have 12 cluster nodes available, then we can process all 12 solutions simultaneously.

International Journal of Information, Business and Management, Vol. 8, No.2, 2016
ISSN 2076-9202
54
The parallel version of the NNSOA algorithm is stated below using the same 10 steps but only showing
the differences.
(1) Using a cluster machine of CM machines, cmi, i=1, …, CM, cm1 will perform step one as shown in the
serial version. Then it will broadcast the initial S solutions as well as the training data to all
remaining cluster nodes using MPI (Message Passing Interface) calls to other cluster members.
(2) Based on availability of cluster nodes cm2, …, cmCM will be assigned a specific solution (si) to plug
into the NN model and perform the calculations (OLS) that result in output weights for that solution.
This continues until the entire population of S solutions is complete.
(3) For each cluster node and its assigned solution, it will then evaluate the solution and return the fitness
value to the cm1 machine using MPI calls. Once all fitness values are returned to the main node, the
remaining NNSOA steps are completed by cm1 the main node and the process repeats.
4. Data Description
The original NNSOA with a serial implementation used a set of five real-world problems in
past-published research to demonstrate its ability to generalize better then BP. The problems include the
Gene, Thyroid, Building, Spam, and Poker problems that can be found on the UCI Machine Learning
Repository (http://archive.ics.uci.edu/ml/).
1. Gene: This dataset consists of 3,175 examples each consisting of 120 inputs and 3 outputs. 25% of the
examples represent donors and 25% of the examples represent acceptors. A donor represents an intron/exon

International Journal of Information, Business and Management, Vol. 8, No.2, 2016
ISSN 2076-9202
55
boundary while an acceptor represents an exon/intron boundary. The remaining 50% of the examples
represent neither donors, nor acceptors. The inputs are DNA sequence elements each of which has a
four-valued nominal attribute encoded to binary, using two binary inputs. This dataset was created based on
the splice junction problem dataset from the UCI repository of machine learning.
2. Thyroid: This dataset consists of 7,200 examples each consisting of 21 inputs and 3 outputs. The three
outputs represent whether or not a patient’s thyroid has over function, normal function, or under function.
The inputs represent information gathered during patient query and examination. This dataset was created
based on the Artificial Neural Network (ANN) version of the thyroid disease problem dataset from the UCI
repository of machine learning databases.
3. Building: This is an approximation problem. The dataset consists of 3,156 examples each consisting of 14
inputs and 3 outputs. The three outputs represent the usage of electrical energy, hot water, and cold water,
based on the date, time of day, outside temperature, outside humidity, solar radiation, and wind speed. This
dataset was created based on problem A from “The Great Energy Predictor Shootout – the first building data
analysis and prediction problem” contest organized in 1993 for the ASHRAE meeting in Denver Colorado.
4. Spam: This dataset consists of 4,000 training examples, and 599 testing examples, each consisting of 57
inputs and 1 output. It was created in July of 1999 by HP labs and donated to the UCI repository. The
output represents whether the e-mail is spam or non-spam. The initial 48 inputs represent the percentage of
words in the e-mail that match a given word. The next six inputs represent the percentage of characters in
the e-mail that match a given character. The next input represents the average length of uninterrupted

International Journal of Information, Business and Management, Vol. 8, No.2, 2016
ISSN 2076-9202
56
sequences of capital letters. The last two integer inputs represent the longest uninterrupted sequence of
capital letters, and the total number of capital letters respectively.
5. Poker: This dataset consists of 25,010 training examples and 1,000,000 testing examples, each consisting
of 85 inputs and 1 output. The output is an ordinal value (0-9) that represents the poker hand. For example,
a 0 represents nothing in the hand, while a 9 represents a royal flush. The inputs represent the five cards in
the hand with four inputs devoted to the suit and 13 inputs devoted to the rank for each of the five cards.
5. Data Analysis
The hypothesis was concerned with the ability of the parallel NNSOA to outperform the serial
NNSOA in a given amount of time using a variety of real world data sets. Prechelt found (1995, 1996) that
most theoretical NN articles were based on comparisons using computer generated or synthetic data, which
does not adequately test the algorithms performance. Prechelt addressed this problem by collecting
real-world data sets formatted in a standard way and suggested a standardized methodology for using them
in learning algorithm evaluations (Prechelt, 1994). This research used three problems from his original
research with the addition of two current problems from the UCI repository for machine learning. The
additional problems used Prechelt’s suggestions for structuring the comparison for benchmarking
purposes. The inclusion of these real world data sets added rigor, while at the same time giving more
reliable comparisons to previous studies based on these same data sets (Sexton et al, 2004, Prechelt, 1994).
The problems selected for analysis of the hypothesis were ones that had more inputs and/or
observations. The following tables compare the classification error percentages for each of the
classification problems.
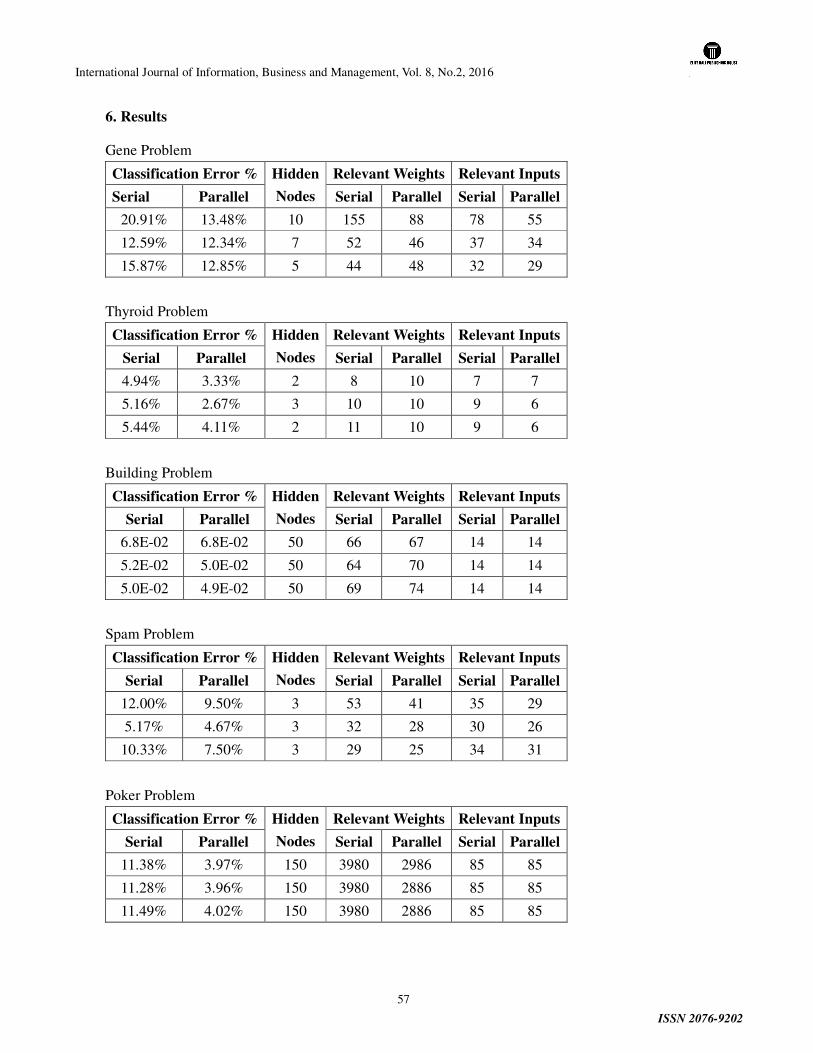
International Journal of Information, Business and Management, Vol. 8, No.2, 2016
ISSN 2076-9202
57
6. Results
Gene Problem
Classification Error % Hidden
Nodes
Relevant Weights Relevant Inputs
Serial Parallel Serial Parallel Serial Parallel
20.91% 13.48% 10 155 88 78 55
12.59% 12.34% 7 52 46 37 34
15.87% 12.85% 5 44 48 32 29
Thyroid Problem
Classification Error % Hidden
Nodes
Relevant Weights Relevant Inputs
Serial Parallel Serial Parallel Serial Parallel
4.94% 3.33% 2 8 10 7 7
5.16% 2.67% 3 10 10 9 6
5.44% 4.11% 2 11 10 9 6
Building Problem
Classification Error % Hidden
Nodes
Relevant Weights Relevant Inputs
Serial Parallel Serial Parallel Serial Parallel
6.8E-02 6.8E-02 50 66 67 14 14
5.2E-02 5.0E-02 50 64 70 14 14
5.0E-02 4.9E-02 50 69 74 14 14
Spam Problem
Classification Error % Hidden
Nodes
Relevant Weights Relevant Inputs
Serial Parallel Serial Parallel Serial Parallel
12.00% 9.50% 3 53 41 35 29
5.17% 4.67% 3 32 28 30 26
10.33% 7.50% 3 29 25 34 31
Poker Problem
Classification Error % Hidden
Nodes
Relevant Weights Relevant Inputs
Serial Parallel Serial Parallel Serial Parallel
11.38% 3.97% 150 3980 2986 85 85
11.28% 3.96% 150 3980 2886 85 85
11.49% 4.02% 150 3980 2886 85 85

International Journal of Information, Business and Management, Vol. 8, No.2, 2016
ISSN 2076-9202
58
7. Summary of Findings
A side-by-side comparison of the serial NNSOA and the parallel NNSOA makes it evident that the
parallel NNSOA produces networks that possess a more efficient structure and produce better results. Both
algorithms were allowed to run an equal number of generations during the hidden node search to allow both
networks equal opportunity to find a global solution for the problem. As the following table shows, this
resulted in finding the same number of hidden nodes. However, the parallel NNSOA has a better (lower)
classification error percentage for all classification problems. This makes intuitive sense, because the
parallel algorithm’s was able to better search the weight space and find solutions that were more
parsimonious in structure. This allowed the networks to generalize better by only including those weights
and inputs that were relevant for prediction.
8. Conclusion
This research has shown that in a given amount of time the parallel NNSOA will obtain better results
than the serial NNSOA on a variety of real-world problems. While it makes intuitive sense that more
computers should yield better results, Seiffert (2004) found that it is not always the case. He found that
the training algorithm (back propagation in the paper referred to above) could actually cause performance
to decrease if there is a significant amount of data communications overhead (Seiffert, 2004). This
research contributes to the body of scientific knowledge in the areas of data mining, and parallel neural
networks. It has also resulted in software components that will be used to make further advancements
possible. The research was designed to answer the research question:

International Journal of Information, Business and Management, Vol. 8, No.2, 2016
ISSN 2076-9202
59
Future research will explore new ways of parallelizing the modified genetic algorithm used by the
NNSOA. Better results may be possible if new, more efficient methods are found to parallelize the
algorithm. This research has provided a benchmark for future research to compare against as new
approaches are created. The software components created by this research for the presentation and
analysis of data can also be used in future research allowing the researchers to spend more time on the
optimization of the algorithm and less time analyzing and presenting results.
This research has also made it possible to evaluate networks utilizing a far greater number of hidden
nodes. The time required by the serial NNSOA to evaluate complex networks is far too great.
The need to efficiently process ever-growing amounts of data continues to motivate researchers in
the areas of machine learning and data mining. Neural network researchers have utilized parallel
processing in hopes of finding scalable algorithms that will handle large data sets and complex networks.
Massively scalable neural networks trained and optimized using a genetic algorithm can now be
applied to a wide range of problems including prediction, data classification and approximation problems.
Further research is needed to explore various ways to parallelize the NNSOA algorithm using the
benchmarks provided by this research. As hardware advances continue to be driven by Moore’s law,
software such as the parallel NNSOA is needed to fully utilize the processing power available.
Reference List
Fausett, L. (1994). Fundamentals of Neural Networks: Architectures, Algorithms, and Applications. New
York: Prentice Hall.

International Journal of Information, Business and Management, Vol. 8, No.2, 2016
ISSN 2076-9202
60
Long, L., & Gupta, A. (2005). Scalable Massively Parallel Artificial Neural Networks. AIAA Paper,
2005-7168.
McCulloch, W., & Pitts, W. (1943). A logical calculus of the ideas immanent in nervous activity. Bulletin
of Mathematical Biology, 5 (4), 115-133.
McMurtrey, S., Sexton, R., NyShadham, E. (2013) “Massively Scalable Parallel Neural-Networks: A
Modified Genetic Algorithm Approach” Insights to a Changing World Journal, 2013(3).
Prechelt, L. (1996). A quantitative study of experimental evaluations of neural network learning
algorithms: Current. Neural Networks, 9 (2), 457-462.
Prechelt, L. (1994). Proben1: A set of neural network benchmark problems and benchmarking rules.
Technicak Report.
Prechelt, L. (1995). Some notes on neural learning algorithm benchmarking. Neurocomputing, 9,
343-347.
Rumelhart, D., Hinton, G., Williams, R. (1986). Learning representations by back-
progating errors. Nature, 323, 533-556.
Seiffert, U. (2004). Artificial neural networks on massively parallel computer hardware. Neurocomputing,
57, 135-150.
Sexton, R., Dorsey, R., & Johnson, J. (1998). Toward global optimization of neural networks: A
comparison of the genetic algorithm Decision Support Systems, 22 (2), 171-185.
Sexton, R., Dorsey, R., & Sikander, N. (2004). Simultaneous optimization of neural network function and
architecture algorithm. Decision Support Systems, 36 (3), 283-296.
Sexton, R., McMurtrey, S., & Cleavenger, D. (2006). Knowledge discovery using a neural network
simultaneous optimization algorithm on a real world. European Journal of Operational Research, 168
(3), 1009-1018.
Sexton, R., McMurtrey, S., Michalopoulos, J., & Smith, A. (2005). Employee turnover: a neural network
solution. Computers and Operations Research, 32 (10), 2635-2651.
Sexton, R., Sriram, R., & Etheridge, H. (2003). Improving Decision Effectiveness of Artificial Neural
Networks: A Modified Genetic Algorithm. Decision Sciences 34 (3), 421-442.
International Journal of Information, Business and Management, Vol. 8, No.2, 2016
ISSN 2076-9202
61
A STUDY OF MOMENTUM AND CONTRARIAN STRATEGIES
BASED PORTFOLIOS IN US MARKET
Venkata Vijay Kumar P
Assistant Professor
Indian Institute of Management Raipur, India
Email: [email protected]
Abstract
Paper studies the mean reversion phenomena and momentum phenomena in the standard and
poor 100 stocks index in US markets by forming the portfolio by varying sizes of 10 stocks, 20
stocks and 30 stocks. The resilience parameter of stock in terms of price is used to calculate a
ratio. This ratio is undertaken as the identifying the stocks for the portfolio formation. Various
portfolios are formed on the basis of number of observation days and holding period. Momentum
portfolio provides the negative returns for all the short and long term portfolios. Whereas, the
portfolios based on contrarian strategy were providing the significant positive return across all
the holding periods. It is also found that the highest returns were generated by portfolios which
were formed on the basis of one previous day information for selection of stocks, rather than
longer historical information. The presences of abnormal returns reflect the semi strong form of
market efficiency. Hence the market investors can build the portfolio on the basis of historical
information with mean reversion and momentum characteristics in order to generate abnormal
returns.
Keywords: Momentum, Contrarian, Mean reversion, Portfolio performance
Introduction
The objective of the investment is to generate returns at the least risk levels. Momentum and mean
reversion are the two major phenomena’s that have been researched in the equity markets. Momentum
and contrarian strategies (mean reversion) are found to earn abnormal returns at low risk as due to neutral
investment characteristic. Most of the studies have found that the presence of momentum in the period of
more than 12 months, whereas the mean reversion phenomena presence was realised in portfolios with
minimum period of three to three and half years (Ronald Wu Yangru Gilliland Erik Balvers, 2000).
Investment portfolios built based on contrarian strategy is one of interesting areas in the global markets.
The source of returns generated from the contrarian strategies have been attributed to either of systematic
risk of formed portfolio or because of the over expectation of the investors from the past winners. The
International Journal of Information, Business and Management, Vol. 8, No.2, 2016
ISSN 2076-9202
62
strong form of markets have no place for the over expectation (i.e. as they are corrected immediately).
The developed markets are considered to be tending towards the strong form of efficient markets.
Financial markets of United States are considered to be part of developed markets. The S&P 100 Index
(Standard & Poor’s), a sub-set of the S&P 500®, measures the performance of large cap companies in the
United States. The Index comprises 100 major, blue chip companies across multiple industry groups.
Individual stock options are listed for each index constituent.
Literature Review
Mean reversion a phenomenon is studied in US and other developed markets for the past half century.
The contrarian strategy is handled in two ways i.e. restricted and unrestricted contrarian strategy (Ramiah
et al., 2011). Majority of the studies have undertaken the analysis on the basis of monthly returns. Stocks
are classified as hot stocks and cold stocks on the basis of daily returns of individual stocks. The gainers
are classified as hot stocks and losers as cold stocks (Ramiah et al., 2011). The contrarian strategy based
portfolios are built in order to capture the mean reversion phenomena. Contrarian strategy is to have short
position with recent winners and long position on the recent losers. Stocks are ranked on the basis of the
previous returns and are classified as winners (stocks with positive returns) and losers (stocks with
negative returns) (Narasimhan Jegadeesh and Sheridan Titman, 1993). Once the winners and losers are
classified then the portfolio is built with equal weights for winners and losers.
Mean reversion phenomenon is studied at national/international markets and developed/developing
financial markets. The few significant studies in the developed economies are: De Bondt and Thaler
(1985) worked with the CRSP monthly return data between 1933 and 1979. Campbell & Limmack (1997)
studied UK companies (1979-1990) classified as winners and losers. Ramiah et al. (2011) studied
Australian markets from the contrarian and momentum perspective. Kudryavtsev (2013) worked on data
of Dow Jones Industrial Index stocks for the period January 2002-September 2011. Studies were done on
the developing markets by various researchers. Liu et al. (2008) studied both the momentum and mean
reversion phenomena in Asian markets; Asian markets were further categorised into developing and
developed markets. Liu et al. (2011) analysed the 20 major stock markets with data from 1975 to 2006.
Richards (1997) studied the data of 16 countries national stock returns, data of 1970 to 1995 were
undertaken for the study. Balvers et al. (2000) worked on data of national equity prices of 18 nations in
the period of 1969 to 1999. Balvers & Wu (2006) studied the momentum and mean reversion phenomena
in 18 country indexes of Morgan Stanley Capital International; the time period studied was from 1969 to
1999. Sevim and Akarim (2013) analysed data of 18 country indexes in the period of 1995-2010.
De Bondt and Thaler (1985) studied the portfolio returns generated because of longterm reversals.
Jegadeesh and Titman (1993) ranked the stocks into deciles based on returns generated in the medium
term. It is found the top decile portfolio (winners) consistently outperforms the bottom decile portfolio
(losers) in medium term. Najand and Alsubaie (2009) studied stock returns in the Saudi stock market:
found the presence of price reversals phenomena in short term rather than price rise after the stock
reaches the 52-week high. Mun (1999) studied the performance of portfolio on the basis of contrarian
International Journal of Information, Business and Management, Vol. 8, No.2, 2016
ISSN 2076-9202
63
strategy: found that the abnormal returns were present in both Germany and France markets. Balvers et al.
(2000) utilized panel for testing mean reversion. Balvers et al. (2000) utilized parametric contrarian
strategy in making of portfolio, and generate returns of the same. George and J.Hwang (2004) used the
ratio calculated as current price as the numerator and 52-week high as the denominator. According to this
ratio, portfolio is formed by taking a long position on top 30 percentile (winners) and short position on the
bottom 30 percentile (losers) stocks. This particular portfolio positions are held for a term of 6 to 12
months.
Lakonishok et al. (1993) found abnormal earnings from portfolio based on contrarian strategy. The
study categorizes stocks as value stocks and glamour stocks. The portfolio is formed with long position
on value stocks and shorting the glamour stocks. Campbell & Limmack (1997) finds that small firms with
negative returns have reversed in positive returns in the next 2 to 5 years, whereas small firms with the
positive returns in the first year continued to generate positive returns in the long term. The results of the
study contradict the US studies with contrarian strategies. Richards (1997) noted that large reversals are
found in small markets as compared to large markets. They noted that the reversal phenomenon was
strongest in minimum portfolio duration of 3 years and has generated six percent (approx) per annum
since 1970. Campbell & Limmack (1997) found that the size of firms has also role in the return reversion
phenomena. Many studies found that the abnormal returns could be availed due to the irrationality of
investors. This continued short term returns could be explained with the help of the macro economic
variables identified by the authors. Researchers have noted that the lagged economic variables forecasted
values could actually remove the short term returns of the stocks (Chordia and Shivakumar, 2002). It is
found that there is no significant difference between the loser countries portfolio and winner countries
portfolio in terms of risk, standard deviations, covariance (Richards, 1997).
De Bondt and Thaler (1985) found that people overreact to unexpected and dramatic news: they found
that portfolio of losers stocks generate 25 percent more returns than the portfolio of winner stocks.
However, this phenomenon has occurred in the duration of more than 5 years after portfolio formation.
Parametric contrarian strategy resulted in generating the higher returns in comparison to buy and hold
strategies and contrarian strategy of De Bondt and Thaler (Balvers et al. 2000). Researchers have studied
the momentum and mean reversion phenomena from behavioural aspects as well. The contrarian
portfolios have been found to generate returns in intermediate and short term periods (Mun, 1999).
Badrinath and Kini (2001) concluded that the systematic risk was not contributing towards the abnormal
earnings earned by the contrarian strategy and hence the expectation theory as the sole reason for the
abnormal earnings. George and J. Hwang (2004) analysed the momentum and mean reversion phenomena
from behavioural dimension and narrowed down to anchor and adjust bias. Investors are reluctant to
move the price higher than the reference points (like 52 week high) on receiving the good news; however
on passage of time the investors do overcome the initial bias and rectify the price. Their paper found that
nearer the 52 week high, better is the predictive power for the future returns. However, the nearness to 52
week high strategy could not explain the long term reversal. The abnormal earnings earned in contrarian
strategies can be attributed to either irrational pricing or risk of the stocks (Xu, 2001).
International Journal of Information, Business and Management, Vol. 8, No.2, 2016
ISSN 2076-9202
64
Liu et al. (2008) found the cause of abnormal returns in contrarian strategy to be the overreaction of
investors. Lakonishok et al. (1993) found that investors overestimate growth rates of the value stocks and
also conclude that the risk is not a reason for higher returns from value stocks. Balvers et al. (2000)
established presence of mean reversion phenomena in stock indexes. Their study found that it takes
around three to three-and-half years for the mean reversion to take place. With help of panel approach and
Monte-Carlo simulation it was found that mean reversion strategy based portfolio can generate about 18
to 20 percent per year. Liu et al. (2011) found that the 52 week high price is better predictor for the
forecasting the future prices. Kudryavtsev (2013) analysed the daily data and found that higher stock
returns are attained in the case of large difference in high to close price, whereas lower stock returns are
attained in the following days with large price differences for low to close price. Mun (1999) concludes
that the source of the abnormal returns is overreaction hypothesis and these returns were not related to the
risk coefficients. Similarly, Du (2008) also confirms that the investors do overreact while correcting the
initial bias. They further concluded that investors not only underreact to information but are equivalently
‘overreactive’ to new news. The literature provides the systematic risk of portfolio, expectation of
investors, irrational pricing, risk of stocks, and overreaction of the investors as the major reasons for mean
reversion phenomena.
Liu et al. (2008) found empirical results supporting the abnormal returns generated with help of
contrarian strategies in the developing markets of Asia for both short and long duration. Ramiah et al.
(2011) found that both restricted and unrestricted contrarian strategies do generate abnormal profits. Paper
finds that the volumes have significant impact upon the returns generated by contrarian strategy. Mean
reversion phenomena was found reflected in the portfolio duration of 30 to 38 months (Sevim and Akarim,
2013). They have found that the mean reversion phenomena exists, reflecting the presence of
inefficiencies in the weak form of the developing economies.
Focussing on the developed markets of Asia, Liu et al. (2008) concludes that the momentum strategies
provides abnormal returns in the long term, while contrarian strategies provides abnormal returns in the
short term. Balvers & Wu (2006) finds that there is significant presence of both momentum and mean
reversion phenomena: they found negative correlation between momentum and mean reversion
phenomena (r = -0.35). Balvers & Wu (2006) formed the indicator on the basis of momentum and mean
reversion phenomena. Portfolio formed by taking a long position on highest indicator national market and
short position on the lowest indicator national market has a potential of annual excess return of 19.4%
over the 20 years sample period 1980-1999. Balvers & Wu (2006) concluded that abnormal returns
generated by joint momentum – mean reversion model is greater than the excess return generated by
either momentum or mean reversion models. Du (2008) empirically found that both short-run momentum
and long-run reversals phenomena occur simultaneously in international stock indices after risk
adjustment. These results are applicable for both the strategies based on past returns and nearness to 52
week high. Sevim and Akarim (2013) found that the Contrarian strategy had the highest return portfolio,
whereas momentum portfolio provided the second highest returns. The Max3-Min3 portfolio was the best
performer in the contrarian strategy and Max1-Min1 portfolio was found to be the worst portfolio.

International Journal of Information, Business and Management, Vol. 8, No.2, 2016
ISSN 2076-9202
65
Campbell & Limmack (1997) found that winner companies that provided abnormal positive returns
and loser portfolio generated negative returns. George and J. Hwang (2004) also found that the 52-week
high strategy returns in long term are explained majorly by momentum returns and not because of return
reversals. Liu et al. (2011) studied momentum in international markets and empirically confirmed the
presence of momentum phenomena. However, profits were not significant once the transaction costs were
incorporated.
While various studies do confirm the existence of mean reversion and momentum phenomena in
developed markets, there is dearth of studies with help of ‘daily returns’. The present study undertakes the
analysis of the mean reversion and momentum phenomena of stocks listed on the Standard & Poor (S&P)
with help of daily returns of the stocks. The form of the markets is also studied with help of the stock data
of S&P. The momentum strategy considered in the present study is to take long position on the stocks
with higher CLHL ratio (past winners) (Jegadeesh et al., 1993, Ramiah et al., 2011);the contrarian
strategy considered is to take long position on the stocks with least CLHL ratio (past losers) and to take
short position on the stocks with highest CLHL ratio (past winners) in order to capture the mean reversion
phenomena (Badrinath and Kini, 2001, Mun, 1999). On the basis of literature review and research
objective, following are the two hypotheses to be studied:
Null hypothesis 1: There is no significant positive earnings of the portfolio formed on the basis of
momentum strategy
Null hypothesis 2: There is no significant positive earnings of the portfolio formed on the basis of
contrarian strategy
Data and Methodology
Daily data of 100 stocks from 1st January 2000 to June 2013 belonging to Standard & Poor (S&P)
Index are considered for the analysis. The daily values of closing, High, Low price are considered of 3395
data points for each stock of S&P. detect
The CLHL ratio of difference of closing price and low price to the difference of high price to low price
is calculated. This ratio reflects that the part of return attained to maximum return could have attained.
CLHLRatio = �∗�1234567895:;�23<895:;��=57>895:;�?3<895:;� − 1 (1)
CLHL ratio attained as per the formula 1, explains the nearness of stock price to the low (high) price,
ranges in between ‘-1’ and ‘1’. CLHL ratio with value ‘1’ reflects that the stock price has the same value
as High price, and ‘-1‘ value states that the stock price is same as low price. Hence, the lower the CLHL
ratio, more is the possibility of mean reversion phenomena i.e. as it is presently near to low price, the
stock price would tend to move towards high price. The CLHL ratio measures the resilience of the stock
in term of market price.
Once the ratio for the daily returns for 100 stocks are calculated. Portfolio is formed by taking a long

International Journal of Information, Business and Management, Vol. 8, No.2, 2016
ISSN 2076-9202
66
position on stocks with lower CLHL ratio and short position on stocks CLHL ratio greater than zero. The
transaction costs were assumed to be zero for this particular study. The portfolio return is calculated on
the basis of logarithmic returns of individual stocks in the portfolio.
Three different portfolios are built for study of mean reversion and momentum strategy. The number
of day’s information considered for attaining the values of closing price, opening price, high price and
low price in order to calculate CLHL ratio defines the type of portfolio. Portfolio type 1 considers the past
1 day data for attaining the closing price, opening price, high price and low price of the stock. In portfolio
type 2, data of past 3 days is considered and in portfolio type 3 the data of past 5 days are considered.
Once the information is retrieved, then CLHL ratio is calculated for the each of these stocks on the basis
of retrieved information. In each phase both the momentum and mean reversion portfolios were built. In
the momentum portfolios, long position of stocks with highest CLHL ratios is undertaken. Whereas in the
contrarian portfolios there is a long position of stocks with lowest CLHL ratios and short position on the
stocks with highest CLHL ratios.
Three portfolios were built under the momentum strategy: portfolio with long position on the 10
stocks with highest CLHL ratio, portfolio with long position on the 20 stocks with highest CLHL ratio
and portfolio with long position on the 30 stocks with highest CLHL ratio. Similarly, three portfolios were
built under contrarian strategy: portfolio with long position on the 10 stocks with the least CLHL ratio
and short position on the 10 stocks with the highest CLHL ratio, portfolio with long position on the 20
stocks with the least CLHL ratio and short position on the 20 stocks with the highest CLHL ratio and
portfolio with long position on the 30 stocks with the least CLHL ratio and short position on the 30 stocks
with the highest CLHL ratio. Portfolios are formed every day and dissolved by the other day; this process
is repeated for the various tenures of 1, 2, 3, 4, 5 and 10 years.
In building a Momentum portfolio A, the CLHL ratio (depending on the portfolio type, the number of
previous days is considered for the attaining values of High price, Low price and Closing price) is
calculated for all the 100 stocks of S&P as part of first step. In second step, top 10 stocks (on the basis of
CLHL ratio) are selected to form the portfolio and long position is taken on these stocks. Day return of
the portfolio is calculated on the weighted sum of all the 10 stock day returns. Finally, the position is
squared off in the evening. The whole process is repeated on the next day.
Similarly portfolio B, the number of the stocks considered are 20 and portfolio C, the number of stocks
considered are 30.
In building a contrarian portfolio CA, the CLHL ratio (depending on the portfolio type, the number of
previous days is considered for the attaining values of High price, Low price and Closing price) is
calculated for all the 100 stocks of S&P as part of first step. In second step, short position is taken on top
10 stocks (on the basis of CLHL ratio) and long position is taken on the bottom 10 stocks(on the basis of
CLHL ratio). Day return of the portfolio is calculated on the weighted sum of all the daily return of 10
stocks of long position and it is deducted by the weighted sum of daily returns of 10 stocks of short
International Journal of Information, Business and Management, Vol. 8, No.2, 2016
ISSN 2076-9202
67
position. Finally, the positions are squared off in the evening. The whole process is repeated on the next
day.
Similarly portfolio CB, the number of the stocks considered are 20 for short position and 20 stocks for
long position and portfolio CC, the number of stocks considered are 30 for short position and 30 stocks
for long position.
One sample t test is conducted on the returns generated by portfolios for various tenure periods of 1, 2,
3, 5, 10 and 13 years in order to test the hypothesis.
One-sample t-test
In testing the null hypothesis that the population mean is equal to zero, the statistic equation used as
per the formula 2.
t = A̅�C4/√6
(2)
Where the sample mean, S is calculated by the standard deviation of the sample with n as the
sample size. The degrees of freedom used in this test are n − 1. The distribution of the population of
sample means, , is assumed to be normal.
Empirical Results
Portfolios built on the basis of momentum strategy and contrarian strategies are found to generate
positive returns. Table 1 and table 3 provide the average daily returns and Cumulative returns of the
portfolios formed on the basis of momentum strategy. Similarly, Table 2 and table 4 provide the average
daily returns and Cumulative returns of the portfolios formed on the basis of contrarian strategy
Momentum results
Momentum of the portfolio is calculated on the basis of taking the long position of the stocks having
the Higher CLHL ratio. Momentum based portfolios have generated the negative returns across varying
holding periods. However, the results were significant (at 99 percent confidence level) for all tenure
periods. The average day returns ranged from -0.44% to -0.06% for the different portfolios.
Portfolio type 1 (where opening price, close price, high price are attained from one prior day
information) had an average day returns in between -0.44% to -0.08%. Portfolio A1 with 10 stocks in the
momentum strategy had significant negative average day returns of -0.16% for the holding period 10
years and above, and cumulative return of -432.79% return for same 10 year holding period. Portfolio B1
with 20 stocks had the significant average day returns lower than C1 portfolio. Similarly, for the portfolio
C1 with 30 stocks had the significant average day returns of -0.1% returns for the holding period of 10

International Journal of Information, Business and Management, Vol. 8, No.2, 2016
ISSN 2076-9202
68
years and above. The cumulative return attained was -49.86% for one year to -262.69% for ten years.
Portfolio type 2 (where opening price, close price, high price are attained from past three days
information) had an average day returns in between -0.34% to -0.06%. Portfolio A3 with 10 stocks in the
momentum strategy had significant negative average day returns of -0.15% for the holding period 10
years, and cumulative return of -365.47% return for same 10 year holding period. Portfolio B3 with 20
stocks had the significant average day returns of -0.1% for the holding period of 10 years and above. The
cumulative return attained was -257.12% returns for ten years. Similarly, for the portfolio C3 with 30
stocks had the significant average day returns of -0.09% returns for the holding period of 10 years and
above. The cumulative return attained was -214.78% for ten years.
Portfolio type 3 (where opening price, close price, high price are attained from past five days
information) had an average day returns in between -0.32% to -0.06%. Portfolio A5 with 10 stocks in the
momentum strategy had significant negative average day returns of -0.13% for the holding period 10
years, and cumulative return of -318.83% return for same 10 year holding period. Portfolio B3 with 20
stocks had the significant average day returns of -0.1% for the holding period of 10 years and above. The
cumulative return attained was -240.52% returns for ten years. Similarly, for the portfolio C3 with 30
stocks had the significant average day returns of -0.08% returns for the holding period of 10 years. The
cumulative return attained was -198.38% for ten years.
All the portfolios in the momentum have negative returns across the period. The momentum
phenomena have significant results for all the tenure periods of 1, 2,3,4,5 and 10 years. The losses in the
portfolios have decrease on the increment in the number of stocks in the portfolio. Loss is also decreased
once the CLHL ratio is calculated on the basis of previous 5 days rather than on the basis of previous day
or previous three days information.
Contrarian results
Portfolios formed on the basis of contrarian strategy have also yielded the positive returns across the
varying holding periods. Returns generated in all the varying holding period were significant at 95%
confidence level. The average daily returns were in the range of 0.11% to 0.65% and the cumulative
returns in 85.78% for a year to the 672.83% for a ten year period.
In the portfolio type 1, portfolio CA1 with long position on the 10 stocks with the least CLHL ratio
and short position on the 10 stocks with the highest CLHL ratio. The returns obtained were in the range of
0.65% average day return for 1 year holding period and 0.26% for a 10 holding period. Whereas the
cumulative returns were 162.02% for the 1 year holding and 672.83% for the 10 year holding period.
Returns generated by the portfolios CB1 with long on 20 stocks and short on 20 stocks was having lower
returns in than CA1. Similarly, portfolio CC1 with long on 30 stocks and short on 30 stocks was having
lower returns than CA1 and CB1.
In the portfolio type 2, portfolio CA3 with long position on the 10 stocks with the least CLHL ratio
International Journal of Information, Business and Management, Vol. 8, No.2, 2016
ISSN 2076-9202
69
and short position on the 10 stocks with the highest CLHL ratio. The returns obtained were in the range of
0.61% average day return for 1 year holding period and 0.23% for a 10 year holding period. Whereas the
cumulative returns were 150.76% for the 1 year holding and 579.92% for the 10 year holding period.
Returns generated by the portfolios CB3 with long on 20 stocks and short on 20 stocks was having lower
returns in than CA3. Similarly, portfolio CC3 with long on 30 stocks and short on 30 stocks was having
lower returns than CA3 and CB3.
In the portfolio type 3, portfolio CA5 with long position on the 10 stocks with the least CLHL ratio
and short position on the 10 stocks with the highest CLHL ratio. The returns obtained were in the range of
0.50% average day return for 1 year holding period and 0.22% for a 10 holding period. Whereas the
cumulative returns were 122.31% for the 1 year holding and 540.03% for the 10 year holding period.
Returns generated by the portfolios CB5 with long on 20 stocks and short on 20 stocks was having lower
returns in than CA5. Similarly, portfolio CC5 with long on 30 stocks and short on 30 stocks was having
lower returns than CA5 and CB5.
It has been found that the average day return falls as the holding period increases. It is also found that
the average day returns falls from the portfolio type 1 through portfolio type 3. This reflects that the
increment in the number of past day information would result in lower returns. Finally, portfolio with
long position on 10 stocks (lower CLHL ratio) and short on 10 stocks (higher CLHL position) is having
higher returns as compared to rest of the portfolio returns. That is the increment in number of stocks in
the portfolio is leading to averaging out and hence decrement in the overall portfolio. Secondly, the
contrarian strategy portfolio had generated returns and was significant for various tenures as in 1,2,3,5
and 10 years. Thirdly, the aggregate returns are decreased with incorporation of older data or have higher
return generation capability with help of the recent information. This reflects the efficiency of the S&P
markets i.e. semi strong and better form of the market efficiency.
Conclusion
The study finds that the presence of mean reversion phenomena in the S&P markets in the past 13
years. The study also finds that the strategy applied can generate abnormal returns in the long term. This
also reflects that the presence of ineffectiveness even in the developed market. Study also finds the
presence of the momentum phenomena in the S&P markets across all the tenures of portfolios formed.
Momentum portfolios formed on the basis of the information of the CLHL ratio calculated on the
previous 5 days were having significant and higher returns compared to rest of the portfolios. It is also
found that the momentum portfolios with 10 stocks, 20 stocks or 30 stocks were having the significant
negative returns, however the portfolio with 30 stocks was having the least losses as due to more number
of stocks.
Portfolios formed on the basis of contrarian strategy in S&P markets have the significance across all
the tenures. Portfolios with shorting of 10 stocks and longing of 10 stocks have the highest returns as
International Journal of Information, Business and Management, Vol. 8, No.2, 2016
ISSN 2076-9202
70
compared to the rest of the portfolios. Even in the contrarian strategy portfolios it is found that the
portfolios formed with the CLHL ratio calculated on the basis previous day information.
In contrarian strategy, the results reflect that portfolios based with one day old information have better
performance than the rest of the portfolios. So, investors have the opportunity to attain returns only with
the latest information rather than old information. This also reflects the semi strong and better form of the
market efficiency.
References
Akarim Y.D, Sevim S. (2013), "The Impact of Mean Reversion Model on Portfolio Investment Strategies:
Empirical Evidence from Emerging Markets." Econ. Model. Economic Modelling, Vol. 31, No. 1 pp.
453-59.
Alsubaie, A. Najand M. (2009), "Trading Volume, Price Momentum, and the 52-Week High Price
Momentum Strategy in the Saudi Stock Market." International Journal of Finance, Vol. 21, no. 4 pp.
6248-75.
Badrinath, S G, and O Kini. (2001), "The Robustness of Abnormal Returns from the Earnings Yield
Contrarian Investment Strategy." Journal of Financial Research, Vol. 24 pp.385-402.
Balvers, R. J. Wu Y. (2006), "Momentum and Mean Reversion across National Equity Markets." Journal
of Empirical Finance, Vol. 13, no. 1 pp.24-48.
Balvers, Ronald Wu Yangru Gilliland Erik. (2000), "Mean Reversion across National Stock Markets and
Parametric Contrarian Investment Strategies." The Journal of Finance, Vol. 55, no. 2 pp.745-72.
Campbell, Kevin Limmack Robin J. (1997), "Long-Term over-Reaction in the Uk Stock Market and Size
Adjustments." Applied Financial Economics, Vol. 7, no. 5 pp.537-48.
Chordia, Tarun Shivakumar Lakshmanan. (2002), "Momentum, Business Cycle, and Time-Varying
Expected Returns." The Journal of Finance, Vol. 57, no. 2 pp.985-1019.
De Bondt, Werner F. M., and Richard Thaler. (1985), "Does the Stock Market Overreact?" Journal of
Finance, Vol. 40, no. 3 pp.793-805.
Du, D. (2008), "The 52-Week High and Momentum Investing in International Stock Indexes." The
Quarterly Review of Economics and Finance, Vol. 48, no. 1 pp.61-77.
George, Thomas, and J. Hwang Chuan-Yang. (2004), "The 52-Week High and Momentum Investing."
The Journal of Finance, Vol. 59, no. 5 pp.2145-76.
Jegadeesh, Narasimhan, and Sheridan Titman. (1993), "Returns to Buying Winners and Selling Losers:
Implications for Stock Market Efficiency." Journal of Finance, Vol. 48, no. 1, pp.65-91.
International Journal of Information, Business and Management, Vol. 8, No.2, 2016
ISSN 2076-9202
71
Kudryavtsev, Andrey. (2013), "Stock Price Reversals Following End-of-the-Day Price Moves."
Economics Letters, Vol. 118, no. 1, pp.203-05.
Lakonishok, Josef Vishny Robert, and W. Shleifer Andrei. (1993), Contrarian Investment, Extrapolation,
and Risk. Cambridge (Mass.): National bureau of economic research.
Liu, Ming Liu, Qianqiu Ma, Tongshu. (2011), "The 52-Week High Momentum Strategy in International
Stock Markets." Journal of International Money and Finance, Vol. 30, no. 1: 180-204.
Liu, Y. l Wang K. y Peng S. C. Huang Y. S. (2008), "The Performance of the Contrarian Strategy and the
Momentum Strategy in the Asia Pacific Region." International Journal of Finance, Vol. 20, no. 3,
pp.4863-83.
Mun, J. (1999), "Tests of the Contrarian Investment Strategy Evidence from the French and German
Stock Markets." International Review of Financial Analysis, Vol. 8, no. 3, pp.215-34.
Ramiah, Vikash Mugwagwa, and Tafadzwa Naughton Tony. (2011), "Hot and Cold Strategies." Review of
Pacific Basin Financial Markets and Policies, Vol. 14, no. 02, pp.271-95.
Richards, Anthony J. (1997), "Winner-Loser Reversals in National Stock Market Indices: Can They Be
Explained?" The Journal of Finance, Vol. 52, no. 5 pp.2129-44.
Xu, Xingzhong. (2001), "Discussion of an Analysis of Contrarian Investment Strategies in the Uk."
Journal of Business Finance & Accounting, Vol. 28, no. 9 pp.1229-33
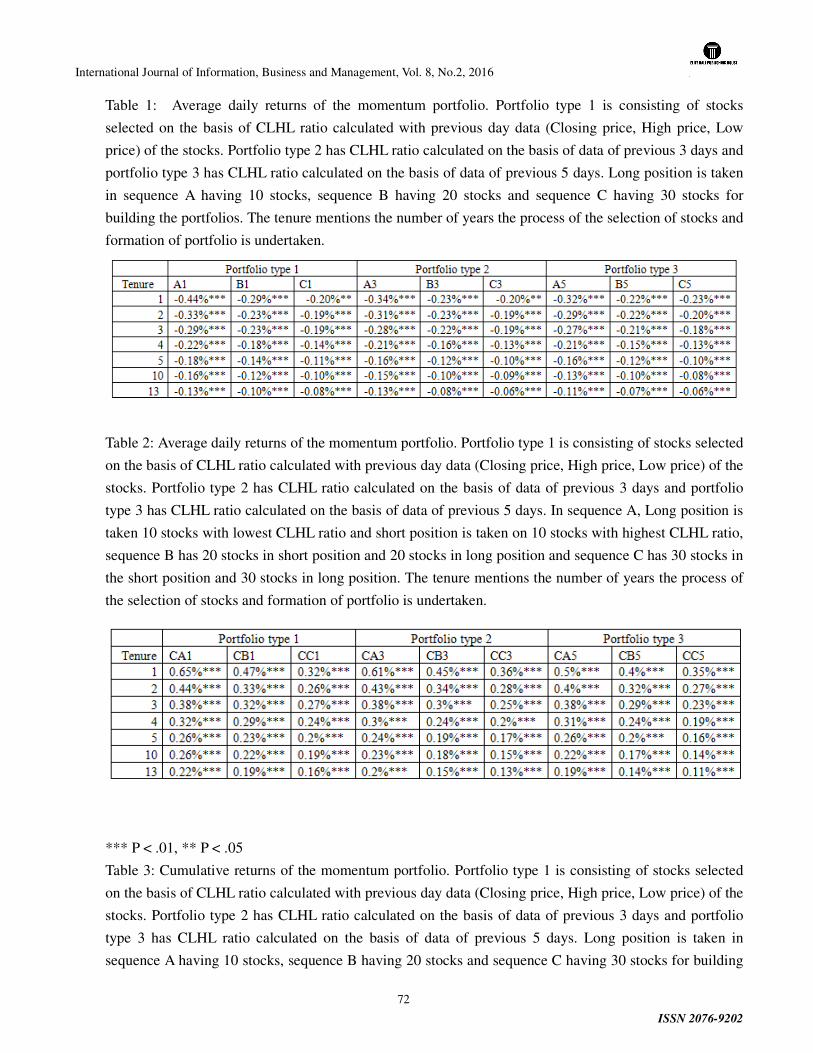
International Journal of Information, Business and Management, Vol. 8, No.2, 2016
ISSN 2076-9202
72
Table 1: Average daily returns of the momentum portfolio. Portfolio type 1 is consisting of stocks
selected on the basis of CLHL ratio calculated with previous day data (Closing price, High price, Low
price) of the stocks. Portfolio type 2 has CLHL ratio calculated on the basis of data of previous 3 days and
portfolio type 3 has CLHL ratio calculated on the basis of data of previous 5 days. Long position is taken
in sequence A having 10 stocks, sequence B having 20 stocks and sequence C having 30 stocks for
building the portfolios. The tenure mentions the number of years the process of the selection of stocks and
formation of portfolio is undertaken.
Table 2: Average daily returns of the momentum portfolio. Portfolio type 1 is consisting of stocks selected
on the basis of CLHL ratio calculated with previous day data (Closing price, High price, Low price) of the
stocks. Portfolio type 2 has CLHL ratio calculated on the basis of data of previous 3 days and portfolio
type 3 has CLHL ratio calculated on the basis of data of previous 5 days. In sequence A, Long position is
taken 10 stocks with lowest CLHL ratio and short position is taken on 10 stocks with highest CLHL ratio,
sequence B has 20 stocks in short position and 20 stocks in long position and sequence C has 30 stocks in
the short position and 30 stocks in long position. The tenure mentions the number of years the process of
the selection of stocks and formation of portfolio is undertaken.
*** P < .01, ** P < .05
Table 3: Cumulative returns of the momentum portfolio. Portfolio type 1 is consisting of stocks selected
on the basis of CLHL ratio calculated with previous day data (Closing price, High price, Low price) of the
stocks. Portfolio type 2 has CLHL ratio calculated on the basis of data of previous 3 days and portfolio
type 3 has CLHL ratio calculated on the basis of data of previous 5 days. Long position is taken in
sequence A having 10 stocks, sequence B having 20 stocks and sequence C having 30 stocks for building
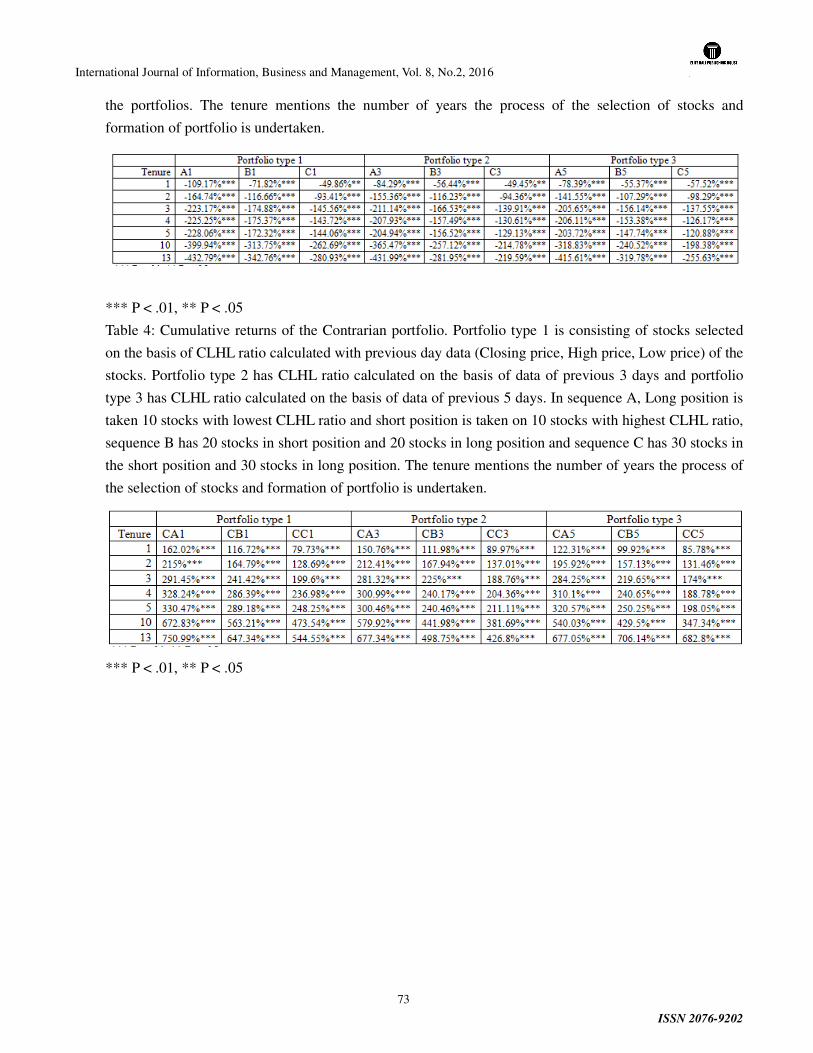
International Journal of Information, Business and Management, Vol. 8, No.2, 2016
ISSN 2076-9202
73
the portfolios. The tenure mentions the number of years the process of the selection of stocks and
formation of portfolio is undertaken.
*** P < .01, ** P < .05
Table 4: Cumulative returns of the Contrarian portfolio. Portfolio type 1 is consisting of stocks selected
on the basis of CLHL ratio calculated with previous day data (Closing price, High price, Low price) of the
stocks. Portfolio type 2 has CLHL ratio calculated on the basis of data of previous 3 days and portfolio
type 3 has CLHL ratio calculated on the basis of data of previous 5 days. In sequence A, Long position is
taken 10 stocks with lowest CLHL ratio and short position is taken on 10 stocks with highest CLHL ratio,
sequence B has 20 stocks in short position and 20 stocks in long position and sequence C has 30 stocks in
the short position and 30 stocks in long position. The tenure mentions the number of years the process of
the selection of stocks and formation of portfolio is undertaken.
*** P < .01, ** P < .05
International Journal of Information, Business and Management, Vol. 8, No.2, 2016
ISSN 2076-9202
74
BEST MODEL OF CSR: AN ANALYSIS OF THE IMPACT OF
CORPORATE SOCIAL RESPONSIBILITY FOR IMPROVING THE
SOCIAL DEVELOPMENT OF THE STAKEHOLDERS- A STUDY ON
FOUR PRIVATE COMMERCIAL BANKS
Mohammed Shakhawat Hossain1
Md. Al-Amin2
1-Principal, Daffodil Institute of IT (DIIT)
2-Lecturer, Daffodil Institute of IT (DIIT)
Abstract
Corporate social responsibility (CSR) becomes an omnipresent topic in today’s business literature, but this has
largely neglected the institutional role. The introductory report to the essential matters of socio economic review
has examined the potential contributions of Best model theory to understand CSR as governance’s mode. The
options have suggested going beyond grounding CSR in the organization’s voluntary behavior. And also it tries to
understand the vast number of historical & political determinants of weather & in what types of form the
corporations have taken on social responsibility. From the historical time, the prevailing notions of CSR emerged
via the defeat of more customary forms of socio solidarity in open market economic activities. Meanwhile, CSR is
heavily linked to the formal organizations of the stakeholder participation or CSR might also state the intervention
in 0ther progressive frugalities. The tensions arise among the multiple stakeholders & business driven form of CSR
has been extended to the transnational level from where the meaning and also the form of CSR remains very
consistent & contested. The practice & research of CSR thus rest on a basis paradox among a contrary implication,
social binding responsibilities & also the notions of voluntary engagements. On the other hand, the institutional
theory is seemed to be promising avenue in order to discover that the way how the boundaries among the business,
human resource & the society have been constructed in various ways & also it develops our understandings of the
effective of CSR within the wider institutional area of fiscal monitoring.
Key Terms: Corporate Social Responsibility, Black Cat, Private Commercial Banks, corporate
conscience, corporate citizenship, social performance, or sustainable responsible business; Responsible
Business, transnational companies, Stakeholder.
1.1 Introduction
There is a strong debate surrounding the potentiality of Corporate Social Responsibility to improve the
International Journal of Information, Business and Management, Vol. 8, No.2, 2016
ISSN 2076-9202
75
social development since its beginning. The researchers of Corporate Social Responsibility are divided
into optimistic and pessimistic. Optimistic believe that the business organization must have potential to
improve the social developments in which they are operating (Visser, 2007). But the pessimist believes
that business cannot improve social development because they can’t violate their profit maximization
rules. Actually the most of the CSR researchers agree that CSR has a direct or indirect impact on the
social development of the country (Cheney and Roper, 2007).
As the authors are from third world country and they have experienced hostile and crucial issues of
developing countries from their birth. When the authors of the project was in Bangladesh, they saw
several issues and attended many workshops on Corporate Social Responsibility not only of Different
Companies of Bangladesh but also of some renowned other organizations. Thus, the aim of this project is
to find out the impact of Corporate Social
Responsibility (CSR) for improving the Social Development of the stakeholders: A Case Study different
banks of Bangladesh.
1.1 The Objectives of the Project:
The objectives of the study are given in the following:
� To search out the Black Cat of the CSR initiatives practiced by different Banks of Bangladesh.
� To detect the impacts of Corporate Social Responsibility (CSR) for improving the Social
Development of the citizen.
� To propose a CSR Model for improving the CSR practice of Private Commercial Banks of
Bangladesh.
1.2 Research question
� How are the CSR initiatives practiced by different Companies of Bangladesh?
� What are the impacts of Corporate Social Responsibility (CSR) for improving the Social
Development of the citizen?
� What are the recommendations for different Companies of Bangladesh through the critical data
analysis results for improving its CSR practices?
1.3 Research Hypothesis
� The CSR initiatives practiced by different companies of Bangladesh are not focused on social
development
� CSR approaches are one of the main black cat of social corruption of stakeholders
� Proper CSR initiatives do influence over the goal of the business and the environment around
it
International Journal of Information, Business and Management, Vol. 8, No.2, 2016
ISSN 2076-9202
76
2. Literature Review
In the preceding section only strategy of finding information about CSR is stated but no definition of CSR
is drawn. According to Bhattacharya and Sen (2007) corporate social responsibility (CSR, also called
corporate conscience, corporate citizenship, social performance, or sustainable responsible business;
Responsible Business) is a form of corporate self-regulation integrated into a business model. However,
Creyer and Ross (1996) argue on this point that CSR policy functions as a built-in, self-regulating
mechanism whereby a business monitor and ensures its active compliance with the spirit of the law,
ethical standards, and international norms. Klein and Dawar (2004) mention in this topic the CSR is a
process with the aim to embrace responsibility for the company's actions and encourage a positive impact
through its activities on the environment, consumers, employees, communities, stakeholders and all other
members of the public sphere who may also be considered as stakeholders. Thus, it is clear that different
organizations have framed different definitions - although there is a considerable common ground
between them. Therefore, CSR is about how different Companies of Bangladesh manages the business
processes to produce an overall positive impact on society.
2.1 The Rise of Corporate Social Responsibility
Bhattacharya and Sen (2007) on this point said that historically, from the industrial revolution to
contemporary globalization, the relationship between business and society has been a recurring point of
discussion and concern. But Barnett (2007) argues on this view that the interest in corporations’ social
responsibilities particularly heightened as a consequence of the process of ‘globalization’ and the
neoliberal policies driving that process: the economic liberalization of goods, services and finance, and
the promotion of a minimal state. The experimental data are rather controversial, and there is no general
agreement about Market mechanisms which have come to dominate world structures, making
transnational companies (TNCs) both economically and politically powerful in the developed and the
developing world. Peloza (2013), however, on this point said that the increased mobility of capital
enabled TNCs to exploit regulatory differences between states by (re)locating or threatening to relocate
their production facilities in countries with regimes more favorable to the financial bottom line. Since
they needed foreign direct investment to boost their own economic development, developing countries
came under intense competition to attract the TNCs. So-called global ‘value chains’, with northern buyers
controlling a web of low-cost southern suppliers, and economic processing zones offering tax incentives
emerged.
Peloza’ analysis has been criticized by a number of writers. Campbell (2007) for example noted that aided
by equally globalizing communication technologies, international awareness of the consequences of
global economic liberalization grew in the 1990’s. TNCs stood accused of enjoying the benefits of
International Journal of Information, Business and Management, Vol. 8, No.2, 2016
ISSN 2076-9202
77
globalization but letting others pay the bill, most notably the developing countries. Therefore, Klein and
Dawar (2004), labor and environmental conditions deteriorated and the number of respondents living in
extreme poverty failed to decline whereas inequality increased. However, for example, Creyer and Ross
(1996) point out that companies such as Shell, Nike, Gap and Levi Strauss were challenged to justify their
actions and Wall Street demonstrated that the increased significance of ‘the brand’ and ‘corporate
reputation’ made leading companies vulnerable to the effect bad publicity has on profit.
Actually Peloza (2013) failed to note out that changes in development thinking further increased CSR’s
momentum. Development strategies focusing on economic growth moved to incorporate the social
dimensions of development, exemplified by the global adoption of the UN Millennium Development
Goals (MDGs) and the focus on poverty eradication. But Wood(1991) argues on this point that
liberalization, deregulation and a reduced state role meant that key developmental functions traditionally
associated with the state, such as the provision of basic infrastructure, health and education and access to
water and electricity had been taken over by a range of civil society and market actors (Godfrey et al.,
2011).
Thus, it is clear that The Different Companies of Bangladesh only concerned with the short-term financial
bottom line might not make the long-term investments necessary to promote human development,
socially responsible business, however, was expected to ensure a wider spread of benefits and so
demonstrating that there are sound business reasons (‘a business case’) for companies to take CSR
seriously has become important to maintaining the momentum. In the next section the dimension of
Corporate Social Responsibility has been discussed.
2.2 Corporate Social Development and Social Development
The debate surrounding the potential of CSR to contribute positively to development has been raging
since the inception of the term. Commentators on the issue are distinctly divided into the optimists and
the pessimists. According to Schuler et al., (2006) the optimists believe that business does indeed have
great potential to contribute positively to the social and economic development of the regions they operate
in. On the other hand Golob and Jancic (2011) pointed out that the pessimists doubt this belief and assert
that businesses cannot contribute to social development because they neither have the requisite authority
– which lies with the state – nor the correct incentives.
Schuler et al., (2006) also said that the optimists believe that as businesses are so deeply embedded within
the communities they operate, they have great potential to address the social and environmental problems
of these communities. However, Trudel et al., (2013) said on this point that by launching innovative
initiatives, such as setting up schools and vocational training centres in underdeveloped areas, firms can
contribute significantly to improving the lives of respondents living in these areas. They can also improve
International Journal of Information, Business and Management, Vol. 8, No.2, 2016
ISSN 2076-9202
78
living conditions by curtailing certain practices which may harm the environment or the respondents
directly. Through such actions, optimists believe CSR has great potential to bring about substantial social
improvements (Auger, 2003).
On the other hand, Golob and Jancic (2011) pointed out that pessimists believe that CSR does not have
the potential to solve social problems. This is mainly due to two reasons. Firstly, they believe that firms
cannot escape their primary goal of making profits. CSR activities will only be followed until they can
provide tangible gains to the firm. Although the social environment may improve in the process, the
improvement is likely to be short lived. Secondly, they believe that social provision should be solely the
job of the state. Godfrey (2011), however, for example mentioned that the state is the elected
representative of the respondents entrusted with the task of improving social conditions. It has the
required expertise and resources to be able to understand and address the needs of the respondents.
Campbell et al., (2007) said that firms lack this expertise and knowledge and should therefore not aim to
fulfil the state’s obligations. In fact, such an act can actually result in further worsening the condition of
respondents. Holbrook (2006), for example, by prohibiting child labour in developing countries, firms can
actually undermine the welfare of these children and their families by depriving them of their primary
source of income (Frynas, 2005)
Keeping the above issues in mind, Bhattacharya and Sen (2007) suggest that the future critical research
agenda on CSR and development should focus on the following four areas: a) the relationship between
business and poverty reduction; b) the impact of CSR initiatives; c) governance dimensions of CSR; and
d) power and participation in CSR. In the research conducted Bhattacharya and Sen (2007) also
emphasizes the importance of understanding the socio-cultural setting in developing countries for CSR
activities to make a substantial a positive contribution to development. Finally, Klein and Dawar (2004)
highlight the importance of monitoring the state-business relationship in leading the development process.
2.3 Impact of corporate social responsibility (CSR) on The Society
According to Goldstein (2011) corporate social responsibility (CSR) is about how business aligns their
values and behavior with the expectations and needs of stakeholders - not just customers and investors,
but also employees, suppliers, communities, regulators, special interest groups and society as a whole.
Ellen (2000) pointed out on this matter that CSR describes a company's commitment to be accountable to
its stakeholders. With businesses focusing on generating profits, sustainability was not a popular concern
among companies up until recently. Many analysts now argue that the strategy of CSR has not been
successful. Wang (2011) for example, argues that in this era of globalization, multinational corporations
(those that conduct business in more than one country) and local businesses are no longer able to conduct
destructive and unethical practices, such as polluting the environment, without attracting negative
feedback from the general public. With increased media attention, pressure from non-governmental
International Journal of Information, Business and Management, Vol. 8, No.2, 2016
ISSN 2076-9202
79
organizations, and rapid global information sharing, there is a surging demand from civil society,
consumers, governments, and others for corporations to conduct sustainable business practices. In
addition to this Okad (2005) said that in order to attract and retain employees and customers, companies
are beginning to realize the importance of being ethical while running their daily operations. Thus it is
clear that the corporate response has often meant an adoption of 'a new consciousness', and this has been
known as Corporate Social Responsibility (CSR) since the 1970s.
However, Auger (2011) argues that CSR is not only about fulfilling a duty to society; it should also bring
competitive advantage. He also said that many CSR initiatives are executed by corporate in partnership
with Non-governmental organizations (NGOs) who are well versed in working with the local
communities and are experts in tackling specific social problems.
2.4 How Corporate Social Responsibility makes a Difference in the Development of the Society
A range of scholars, however, question whether CSR can be adapted into meeting the needs of the poor
(Luchs et al., 2010). The very idea of business playing a role in development is subject to considerable
debate, because it implies the acceptance that the company can meet ocial and environmental challenges
through market-based solutions, and that the privatesector is better at optimizing resources than the public
sector (Trudel and Cotte, 2013).
The latter point has been devastatingly critiqued by Schuler and Cording (2006) that criticism is aimed at
CSR being 1) misplaced as a concept. Further critique is pointed to 2) competing interests between
short-term and long-term horizons; between shareholders and any other stakeholders; between outputs
and outcomes when defining CSR’s actual impact; and between sharing and withholding social learning.
Criticism is also directed at the 3) dominance of northern and TNC perspectives and at 4) not addressing
power and participation issues. The 5) inconsistencies in business’ behaviour furthermore question
whether CSR is able to ‘walk the talk’.
First, opponents to CSR Hirschman and Holbrook (1982) argue that there is no place for business to be
involved in social development. Neoliberal economists such as Shavit (1990), argue that companies have
‘no business’ getting involved in the public as they already contribute to society through the creation of
jobs, the payment of tax and the delivery of goods and services (Okada, 2013). Other opponents, such as
Elkington (1997) argue that CSR is only a public relations tool used to mask the sometimes devastating
impact large corporations can have on vulnerable respondents and the environments in which they live,
pointing to the continuing negative effects.
Second, the competing logics of development imperatives and business realities are not easily reconciled
(Wang et al., 2011)). To accomplish social change takes long-term extensive effort, but most businesses
look for short-term maximum returns; company shareholders’ interests tend to dominate over the interests
of other stakeholders.
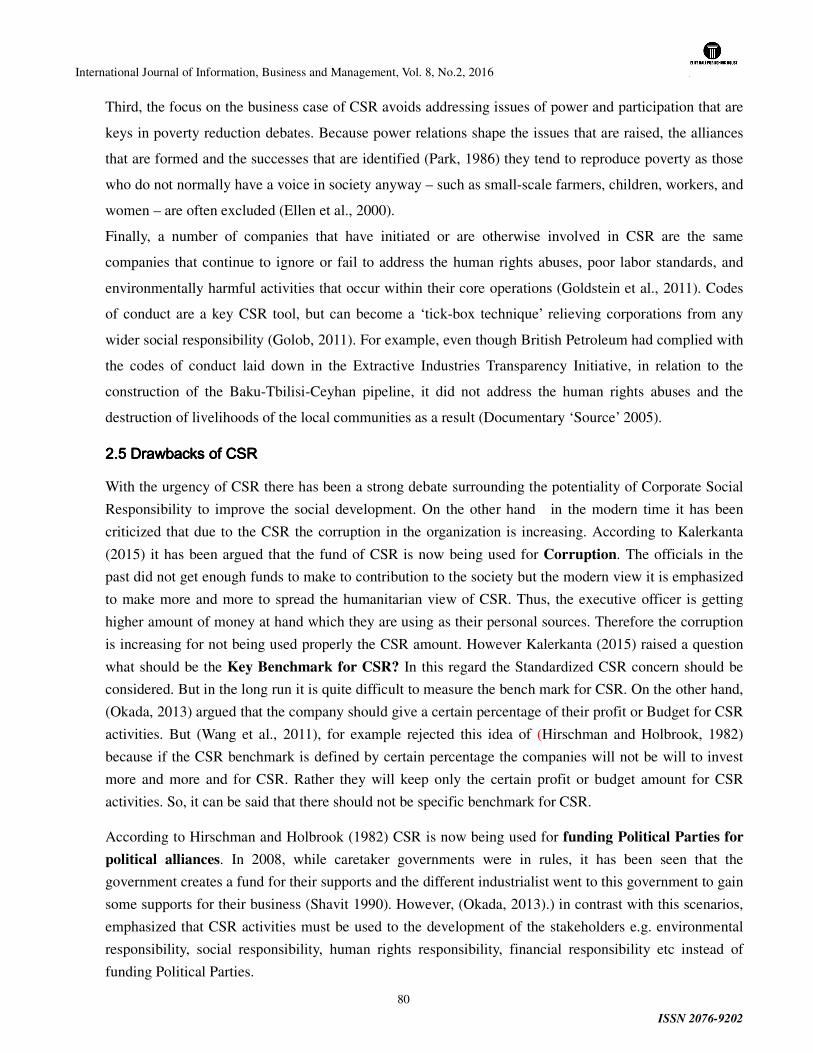
International Journal of Information, Business and Management, Vol. 8, No.2, 2016
ISSN 2076-9202
80
Third, the focus on the business case of CSR avoids addressing issues of power and participation that are
keys in poverty reduction debates. Because power relations shape the issues that are raised, the alliances
that are formed and the successes that are identified (Park, 1986) they tend to reproduce poverty as those
who do not normally have a voice in society anyway – such as small-scale farmers, children, workers, and
women – are often excluded (Ellen et al., 2000).
Finally, a number of companies that have initiated or are otherwise involved in CSR are the same
companies that continue to ignore or fail to address the human rights abuses, poor labor standards, and
environmentally harmful activities that occur within their core operations (Goldstein et al., 2011). Codes
of conduct are a key CSR tool, but can become a ‘tick-box technique’ relieving corporations from any
wider social responsibility (Golob, 2011). For example, even though British Petroleum had complied with
the codes of conduct laid down in the Extractive Industries Transparency Initiative, in relation to the
construction of the Baku-Tbilisi-Ceyhan pipeline, it did not address the human rights abuses and the
destruction of livelihoods of the local communities as a result (Documentary ‘Source’ 2005).
2.5 Drawbacks of CSR2.5 Drawbacks of CSR2.5 Drawbacks of CSR2.5 Drawbacks of CSR
With the urgency of CSR there has been a strong debate surrounding the potentiality of Corporate Social
Responsibility to improve the social development. On the other hand in the modern time it has been
criticized that due to the CSR the corruption in the organization is increasing. According to Kalerkanta
(2015) it has been argued that the fund of CSR is now being used for Corruption. The officials in the
past did not get enough funds to make to contribution to the society but the modern view it is emphasized
to make more and more to spread the humanitarian view of CSR. Thus, the executive officer is getting
higher amount of money at hand which they are using as their personal sources. Therefore the corruption
is increasing for not being used properly the CSR amount. However Kalerkanta (2015) raised a question
what should be the Key Benchmark for CSR? In this regard the Standardized CSR concern should be
considered. But in the long run it is quite difficult to measure the bench mark for CSR. On the other hand,
(Okada, 2013) argued that the company should give a certain percentage of their profit or Budget for CSR
activities. But (Wang et al., 2011), for example rejected this idea of (Hirschman and Holbrook, 1982)
because if the CSR benchmark is defined by certain percentage the companies will not be will to invest
more and more and for CSR. Rather they will keep only the certain profit or budget amount for CSR
activities. So, it can be said that there should not be specific benchmark for CSR.
According to Hirschman and Holbrook (1982) CSR is now being used for funding Political Parties for
political alliances. In 2008, while caretaker governments were in rules, it has been seen that the
government creates a fund for their supports and the different industrialist went to this government to gain
some supports for their business (Shavit 1990). However, (Okada, 2013).) in contrast with this scenarios,
emphasized that CSR activities must be used to the development of the stakeholders e.g. environmental
responsibility, social responsibility, human rights responsibility, financial responsibility etc instead of
funding Political Parties.
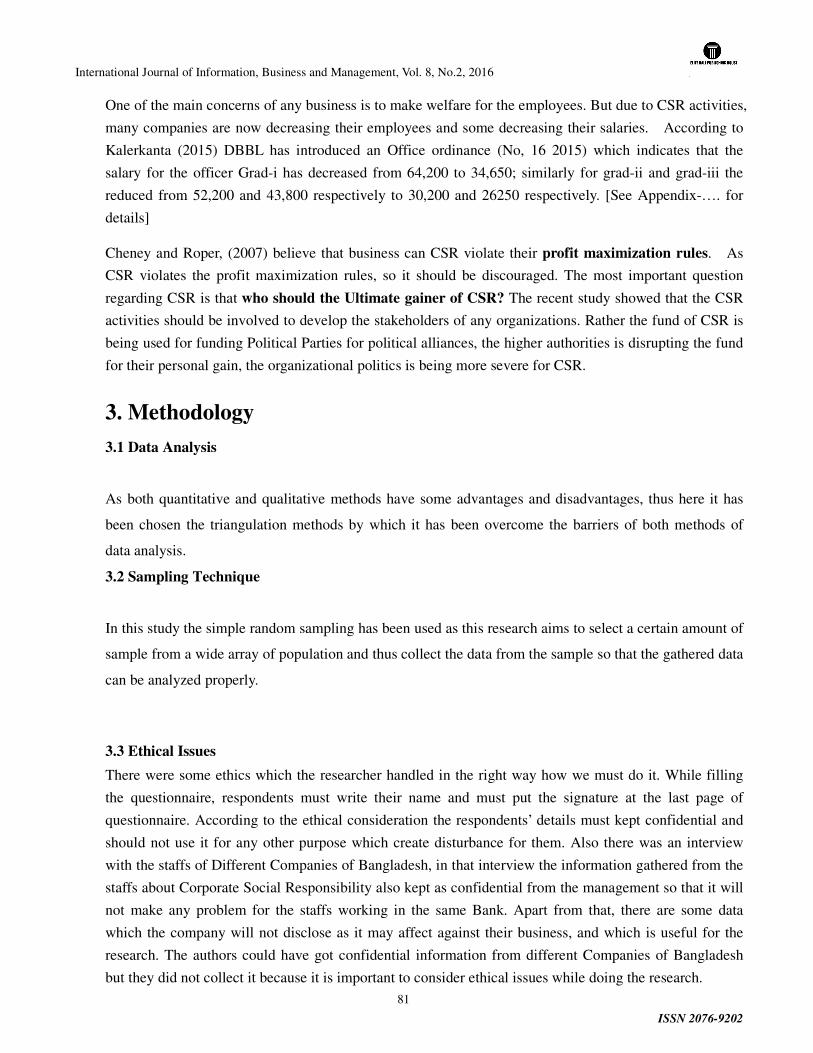
International Journal of Information, Business and Management, Vol. 8, No.2, 2016
ISSN 2076-9202
81
One of the main concerns of any business is to make welfare for the employees. But due to CSR activities,
many companies are now decreasing their employees and some decreasing their salaries. According to
Kalerkanta (2015) DBBL has introduced an Office ordinance (No, 16 2015) which indicates that the
salary for the officer Grad-i has decreased from 64,200 to 34,650; similarly for grad-ii and grad-iii the
reduced from 52,200 and 43,800 respectively to 30,200 and 26250 respectively. [See Appendix-…. for
details]
Cheney and Roper, (2007) believe that business can CSR violate their profit maximization rules. As
CSR violates the profit maximization rules, so it should be discouraged. The most important question
regarding CSR is that who should the Ultimate gainer of CSR? The recent study showed that the CSR
activities should be involved to develop the stakeholders of any organizations. Rather the fund of CSR is
being used for funding Political Parties for political alliances, the higher authorities is disrupting the fund
for their personal gain, the organizational politics is being more severe for CSR.
3. Methodology
3.1 Data Analysis
As both quantitative and qualitative methods have some advantages and disadvantages, thus here it has
been chosen the triangulation methods by which it has been overcome the barriers of both methods of
data analysis.
3.2 Sampling Technique
In this study the simple random sampling has been used as this research aims to select a certain amount of
sample from a wide array of population and thus collect the data from the sample so that the gathered data
can be analyzed properly.
3.3 Ethical Issues
There were some ethics which the researcher handled in the right way how we must do it. While filling
the questionnaire, respondents must write their name and must put the signature at the last page of
questionnaire. According to the ethical consideration the respondents’ details must kept confidential and
should not use it for any other purpose which create disturbance for them. Also there was an interview
with the staffs of Different Companies of Bangladesh, in that interview the information gathered from the
staffs about Corporate Social Responsibility also kept as confidential from the management so that it will
not make any problem for the staffs working in the same Bank. Apart from that, there are some data
which the company will not disclose as it may affect against their business, and which is useful for the
research. The authors could have got confidential information from different Companies of Bangladesh
but they did not collect it because it is important to consider ethical issues while doing the research.
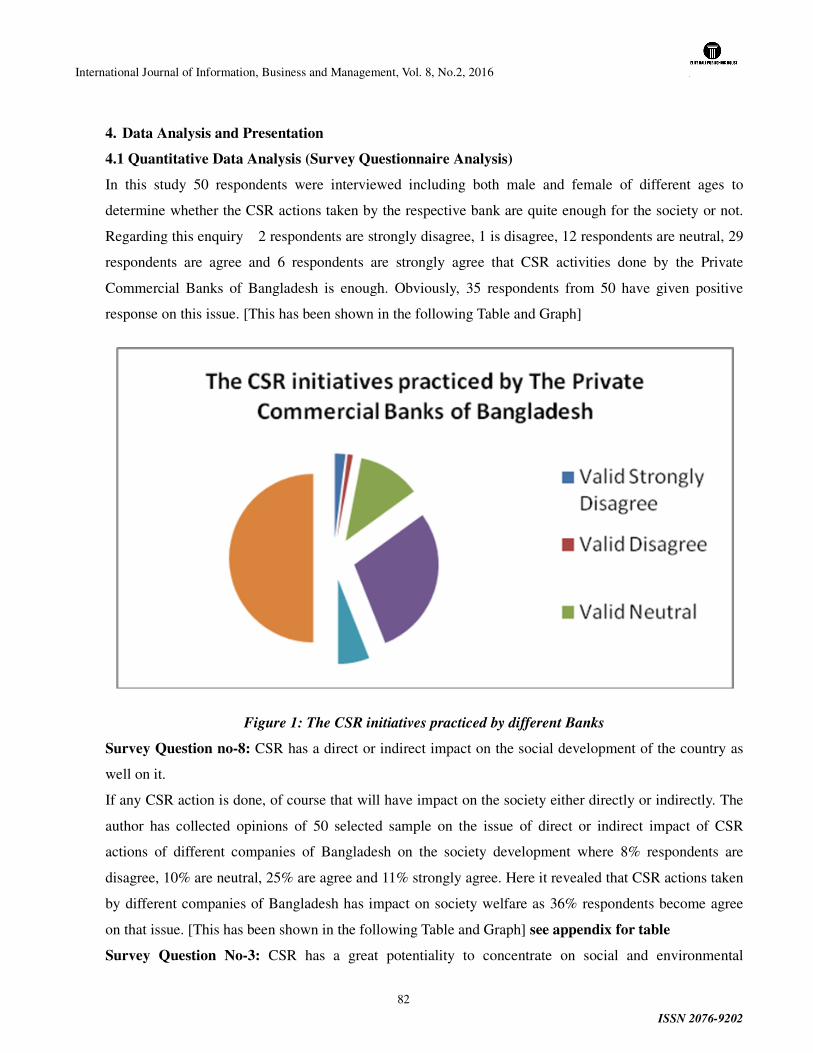
International Journal of Information, Business and Management, Vol. 8, No.2, 2016
ISSN 2076-9202
82
4. Data Analysis and Presentation
4.1 Quantitative Data Analysis (Survey Questionnaire Analysis)
In this study 50 respondents were interviewed including both male and female of different ages to
determine whether the CSR actions taken by the respective bank are quite enough for the society or not.
Regarding this enquiry 2 respondents are strongly disagree, 1 is disagree, 12 respondents are neutral, 29
respondents are agree and 6 respondents are strongly agree that CSR activities done by the Private
Commercial Banks of Bangladesh is enough. Obviously, 35 respondents from 50 have given positive
response on this issue. [This has been shown in the following Table and Graph]
Figure 1: The CSR initiatives practiced by different Banks
Survey Question no-8: CSR has a direct or indirect impact on the social development of the country as
well on it.
If any CSR action is done, of course that will have impact on the society either directly or indirectly. The
author has collected opinions of 50 selected sample on the issue of direct or indirect impact of CSR
actions of different companies of Bangladesh on the society development where 8% respondents are
disagree, 10% are neutral, 25% are agree and 11% strongly agree. Here it revealed that CSR actions taken
by different companies of Bangladesh has impact on society welfare as 36% respondents become agree
on that issue. [This has been shown in the following Table and Graph] see appendix for table
Survey Question No-3: CSR has a great potentiality to concentrate on social and environmental

International Journal of Information, Business and Management, Vol. 8, No.2, 2016
ISSN 2076-9202
83
problems of the communities.
In this analysis it is found that among the respondents 25 shows agree while 11 are strongly agree on the
issue where great potentiality of CSR of different companies of Bangladesh in social and environmental
problems of the communities is asked. After evaluating, it is found that, CSR has great potentiality to
solve any social or environmental problems as 36 respondents has given positive response regarding this.
[For graph see appendix]
Research Question-Two: How can different companies of Bangladesh improves the living standard of
citizen of Bangladesh by CSR practices?
The impacts of Corporate Social Responsibility (CSR) are great concern now a day for improving the
Social Development of the stakeholders. [For table statistics 3 see appendix]
Survey Question No-2: CSR is contributing to the growth of Bangladesh and its citizens
Interview of the study shows the result that 2% become strongly disagree, 8% disagree, 20% is neutral,
50% agree and 22% become strongly agree. Here the percentage of agreed respondents is more which
indicates that CSR has great contribution on the growth of organizations. [This has been shown in the
following Table and Graph]
See appendix for table
Figure 2 CSR has a direct or indirect impact on the social development
Survey Question No-3: CSR is a rising issue for Social development
Today, corporate social responsibility is an urge for every trade company. Here in this research the author
has understood that CSR activities taken by the different companies of Bangladesh have great riding issue
for social development. In this enquiry, 25 are agree, 11 are strongly agree, 10 are neutral, 4 are disagree
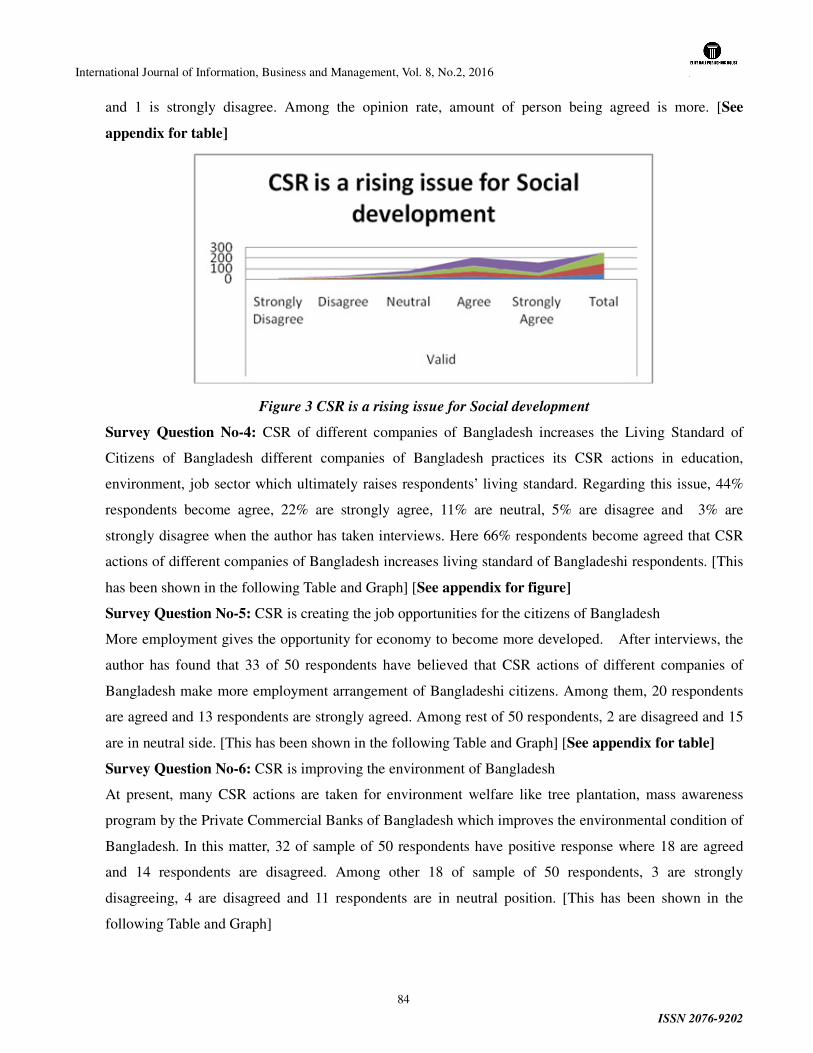
International Journal of Information, Business and Management, Vol. 8, No.2, 2016
ISSN 2076-9202
84
and 1 is strongly disagree. Among the opinion rate, amount of person being agreed is more. [See
appendix for table]
Figure 3 CSR is a rising issue for Social development
Survey Question No-4: CSR of different companies of Bangladesh increases the Living Standard of
Citizens of Bangladesh different companies of Bangladesh practices its CSR actions in education,
environment, job sector which ultimately raises respondents’ living standard. Regarding this issue, 44%
respondents become agree, 22% are strongly agree, 11% are neutral, 5% are disagree and 3% are
strongly disagree when the author has taken interviews. Here 66% respondents become agreed that CSR
actions of different companies of Bangladesh increases living standard of Bangladeshi respondents. [This
has been shown in the following Table and Graph] [See appendix for figure]
Survey Question No-5: CSR is creating the job opportunities for the citizens of Bangladesh
More employment gives the opportunity for economy to become more developed. After interviews, the
author has found that 33 of 50 respondents have believed that CSR actions of different companies of
Bangladesh make more employment arrangement of Bangladeshi citizens. Among them, 20 respondents
are agreed and 13 respondents are strongly agreed. Among rest of 50 respondents, 2 are disagreed and 15
are in neutral side. [This has been shown in the following Table and Graph] [See appendix for table]
Survey Question No-6: CSR is improving the environment of Bangladesh
At present, many CSR actions are taken for environment welfare like tree plantation, mass awareness
program by the Private Commercial Banks of Bangladesh which improves the environmental condition of
Bangladesh. In this matter, 32 of sample of 50 respondents have positive response where 18 are agreed
and 14 respondents are disagreed. Among other 18 of sample of 50 respondents, 3 are strongly
disagreeing, 4 are disagreed and 11 respondents are in neutral position. [This has been shown in the
following Table and Graph]
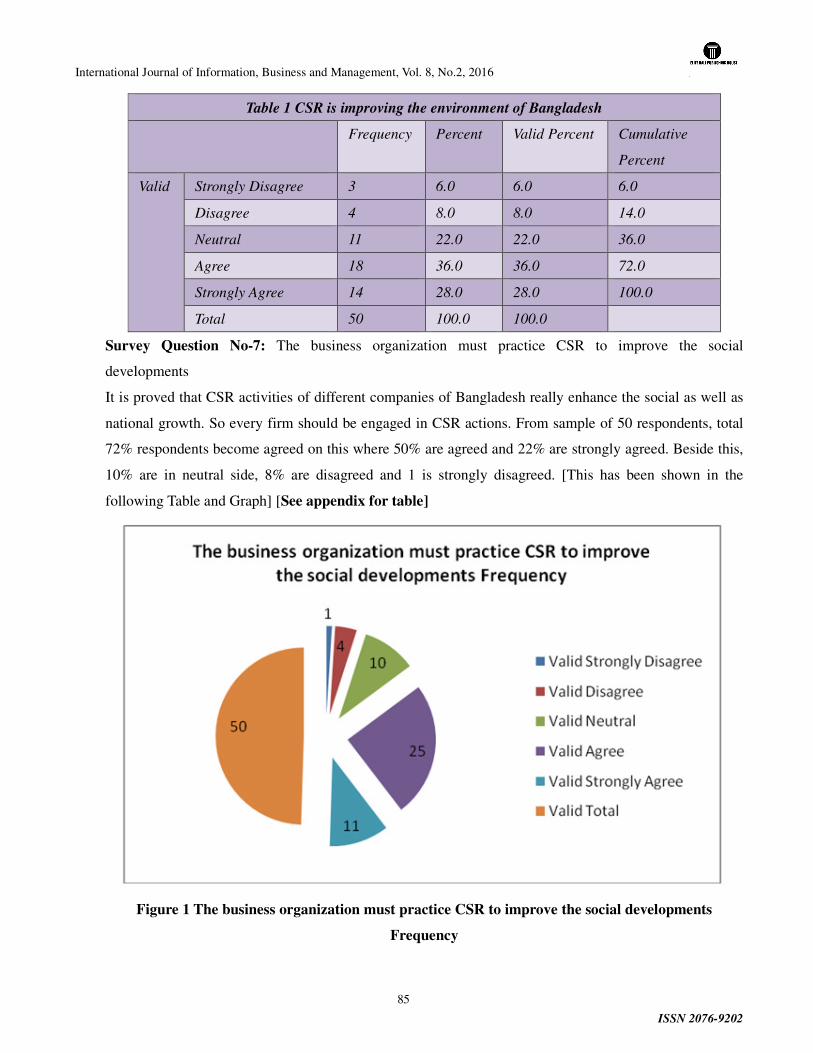
International Journal of Information, Business and Management, Vol. 8, No.2, 2016
ISSN 2076-9202
85
Table 1 CSR is improving the environment of Bangladesh
Frequency Percent Valid Percent Cumulative
Percent
Valid Strongly Disagree 3 6.0 6.0 6.0
Disagree 4 8.0 8.0 14.0
Neutral 11 22.0 22.0 36.0
Agree 18 36.0 36.0 72.0
Strongly Agree 14 28.0 28.0 100.0
Total 50 100.0 100.0
Survey Question No-7: The business organization must practice CSR to improve the social
developments
It is proved that CSR activities of different companies of Bangladesh really enhance the social as well as
national growth. So every firm should be engaged in CSR actions. From sample of 50 respondents, total
72% respondents become agreed on this where 50% are agreed and 22% are strongly agreed. Beside this,
10% are in neutral side, 8% are disagreed and 1 is strongly disagreed. [This has been shown in the
following Table and Graph] [See appendix for table]
Figure 1 The business organization must practice CSR to improve the social developments
Frequency
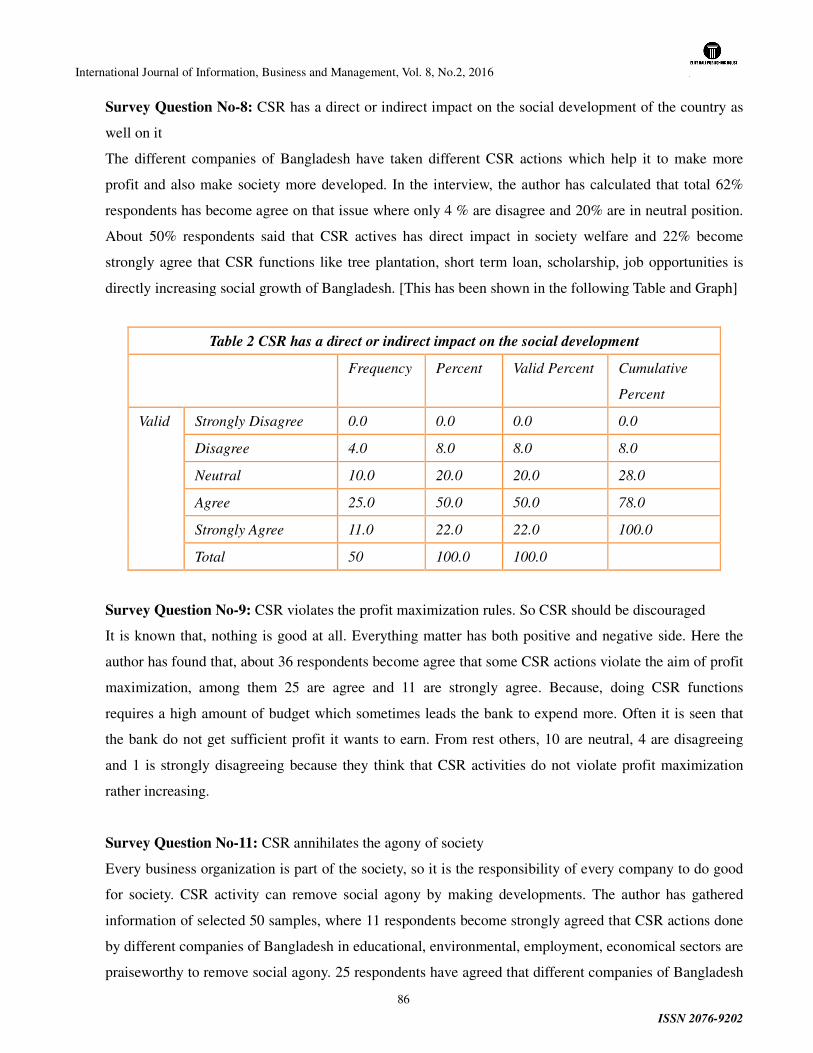
International Journal of Information, Business and Management, Vol. 8, No.2, 2016
ISSN 2076-9202
86
Survey Question No-8: CSR has a direct or indirect impact on the social development of the country as
well on it
The different companies of Bangladesh have taken different CSR actions which help it to make more
profit and also make society more developed. In the interview, the author has calculated that total 62%
respondents has become agree on that issue where only 4 % are disagree and 20% are in neutral position.
About 50% respondents said that CSR actives has direct impact in society welfare and 22% become
strongly agree that CSR functions like tree plantation, short term loan, scholarship, job opportunities is
directly increasing social growth of Bangladesh. [This has been shown in the following Table and Graph]
Table 2 CSR has a direct or indirect impact on the social development
Frequency Percent Valid Percent Cumulative
Percent
Valid Strongly Disagree 0.0 0.0 0.0 0.0
Disagree 4.0 8.0 8.0 8.0
Neutral 10.0 20.0 20.0 28.0
Agree 25.0 50.0 50.0 78.0
Strongly Agree 11.0 22.0 22.0 100.0
Total 50 100.0 100.0
Survey Question No-9: CSR violates the profit maximization rules. So CSR should be discouraged
It is known that, nothing is good at all. Everything matter has both positive and negative side. Here the
author has found that, about 36 respondents become agree that some CSR actions violate the aim of profit
maximization, among them 25 are agree and 11 are strongly agree. Because, doing CSR functions
requires a high amount of budget which sometimes leads the bank to expend more. Often it is seen that
the bank do not get sufficient profit it wants to earn. From rest others, 10 are neutral, 4 are disagreeing
and 1 is strongly disagreeing because they think that CSR activities do not violate profit maximization
rather increasing.
Survey Question No-11: CSR annihilates the agony of society
Every business organization is part of the society, so it is the responsibility of every company to do good
for society. CSR activity can remove social agony by making developments. The author has gathered
information of selected 50 samples, where 11 respondents become strongly agreed that CSR actions done
by different companies of Bangladesh in educational, environmental, employment, economical sectors are
praiseworthy to remove social agony. 25 respondents have agreed that different companies of Bangladesh
International Journal of Information, Business and Management, Vol. 8, No.2, 2016
ISSN 2076-9202
87
can increase social improvement by its CSR functions. About 10 respondents did not say anything in
positive or negative. 4 respondents are disagreed and 1 is strongly disagreed regarding this issue. But
majority sample are in same opinion that CSR functions can remove social agony by removing poverty,
increasing environmental safety, increasing importance of education.
4.2 Qualitative Data Analysis (In depth Interview Analysis)
Objective-one is to discover the CSR initiatives practiced by different companies of Bangladesh,
Bangladesh. From interviews about the different CSR initiatives done by the Private Commercial Banks
of Bangladesh, in 2010, the company kept budget for doing CSR activities of Tk.15 crore where it spent
Tk. 1 crore on CSR actions. But in 2013, there is a significant development made. Banks of Bangladesh
spend almost 20 crore on CSR activities which is 5 crore more than 2010. So it is seen that, the Private
Commercial Banks of Bangladesh have given more attention on performing CSR activities for society.
The analysis implies that these banks usually allocate almost 98 lacs to educational sectors for giving
scholarship to poor and bright students, to set up different educational institutions. In the mid-2013, these
banks have used about 2 crore to make mass awareness programs regarding environmental safety which is
really praiseworthy. According to the interview question the author realized that BRAC Bank is trying to
keep contribution on environmental issues, thus it is doing tree plantation, mass awareness program to
keep environment clean. It also makes CSR actions in educational sector. But the amount contributed in
educational sector is less than the amount given by the Dutch Bangla Bank in educational side. Dutch
Bangla Bank launches many ATM booths in many locations to ensure easy convenience. Different
companies of Bangladesh should give attention on this issue; it should also increase its amount of ATM
booth for making easier for respondents to use anytime. This information is gathered by the authors from
the questionnaire’s answers given by the employees of those four private Commercial Banks of
Bangladesh.
According to the interview question the author realized that how will different companies of Bangladesh
influence the CSR practice in the future? From the opinion of employees of those four private
Commercial Banks of Bangladesh, the author has come to know that the Private Commercial Banks of
Bangladesh should increase its CSR contribution in society in several sectors. It should give more focus
on its employee, should provide more benefit than their current rate because when employee become
more valued, they will give their best service. On the other hand, different companies of Bangladesh
should involve in more mass awareness program regarding environmental issue so that respondents can
stop themselves from abusing natural resources. The employees of those four private Commercial Banks
of Bangladesh have said that they prefer more Dutch Bangla Bank because of its easy convenience, so

International Journal of Information, Business and Management, Vol. 8, No.2, 2016
ISSN 2076-9202
88
different companies of Bangladesh should give its emphasize on this issue, it should take initiative to set
up more ATM booths for respondent’s easy convenience.
5.4.2 Study Objective Two
By analyzing the in depth Interview Question No-5 which is do you think Corporate Social Responsibility
(CSR) has great potential to bring about substantial social improvements by curtailing certain practices
which may harm the environment or the respondents’ directly.How?
In the era of societal marketing, every company should keep concern on its society as well as nation’s
wellbeing. Thus, Corporate Social Responsibility executed in a way which operates for social welfare.
CSR practices done by the company can prevent environment abuses by raising mass awareness.
Employees of those four private Commercial Banks of Bangladesh have said to author that they have
evaluated the CSR actions done by the Private Commercial Banks of Bangladesh, which is really
appreciable. Because different companies of Bangladesh raises awareness among respondents to stop
polluting water and air, to plant more trees, to keep soil dirty free, to use dustbin, sanitary latrine for
keeping environment clean. So CSR activities have great potential to bring substantial social
developments by removing bad practices.
In depth Interview Question No-6. How can different companies of Bangladesh improve the living
standard of citizen of Bangladesh by CSR practices?
From the in-depth interview, the author has become able to conclude that different companies of
Bangladesh improves nation’s living standard. By making tree plantation, it keeps environment healthy
which remain respondents healthy. By mass awareness program, is more concern to stop unnecessary
usage. By giving scholarship to student, these different companies of Bangladesh increase the importance
of education among respondents. But different companies of Bangladesh should increase its employee’s
welfare by giving more salary, rewards or incentives so that employee productivity increases which
ultimately keep contribution in the economic growth of Bangladesh.
In depth Interview Question No-8. How does CSR direct or indirect influence on the social
development of the country as well on it.
Among respondents participated in depth interview, CSR activities influence on social development of
Bangladesh. The first influence is that this tries to keep environment healthy, ever green by tree plantation
activities. This makes awareness among respondents in society to plant trees, stops abusing something,
encourages sending their children in school, encourages to continue education, makes them understood
the importance of education.
In depth Interview Question No-9. “CSR increases the corporate images of any organization.” How will
you consider the statements?
When anything good is done for society, ultimately inhabitants of that society become grateful to that.
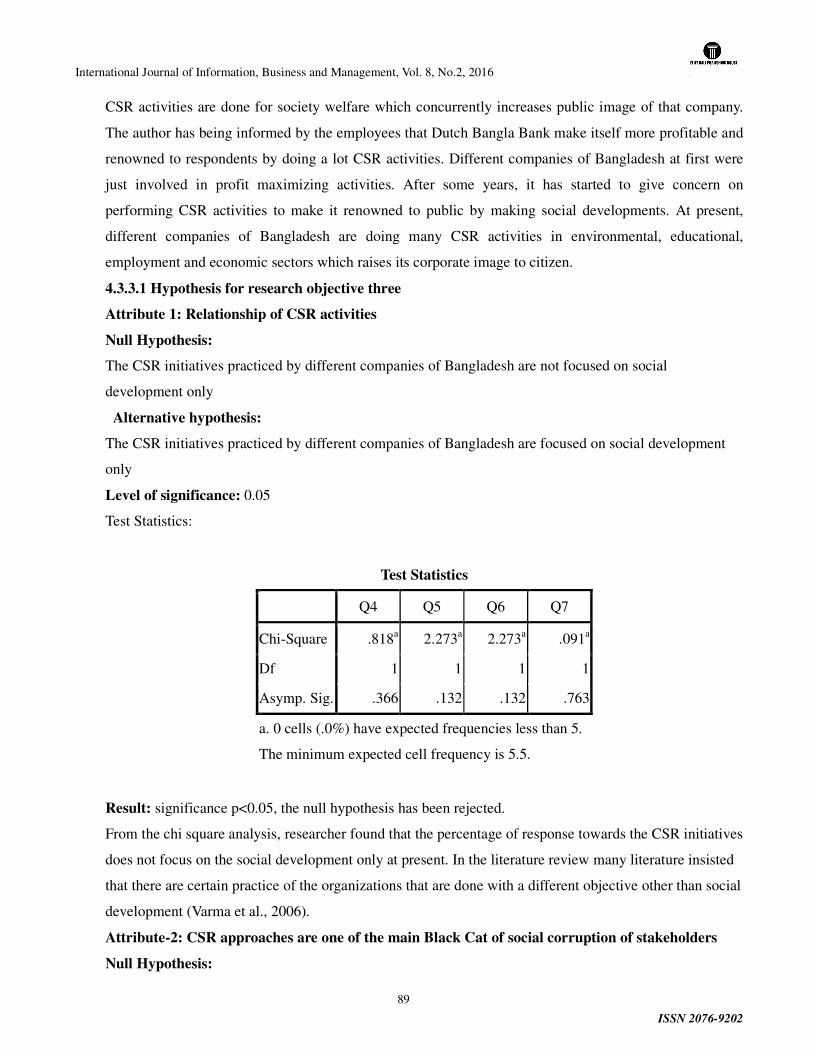
International Journal of Information, Business and Management, Vol. 8, No.2, 2016
ISSN 2076-9202
89
CSR activities are done for society welfare which concurrently increases public image of that company.
The author has being informed by the employees that Dutch Bangla Bank make itself more profitable and
renowned to respondents by doing a lot CSR activities. Different companies of Bangladesh at first were
just involved in profit maximizing activities. After some years, it has started to give concern on
performing CSR activities to make it renowned to public by making social developments. At present,
different companies of Bangladesh are doing many CSR activities in environmental, educational,
employment and economic sectors which raises its corporate image to citizen.
4.3.3.1 Hypothesis for research objective three
Attribute 1: Relationship of CSR activities
Null Hypothesis:
The CSR initiatives practiced by different companies of Bangladesh are not focused on social
development only
Alternative hypothesis:
The CSR initiatives practiced by different companies of Bangladesh are focused on social development
only
Level of significance: 0.05
Test Statistics:
Test Statistics
Q4 Q5 Q6 Q7
Chi-Square .818a 2.273a 2.273a .091a
Df 1 1 1 1
Asymp. Sig. .366 .132 .132 .763
a. 0 cells (.0%) have expected frequencies less than 5.
The minimum expected cell frequency is 5.5.
Result: significance p<0.05, the null hypothesis has been rejected.
From the chi square analysis, researcher found that the percentage of response towards the CSR initiatives
does not focus on the social development only at present. In the literature review many literature insisted
that there are certain practice of the organizations that are done with a different objective other than social
development (Varma et al., 2006).
Attribute-2: CSR approaches are one of the main Black Cat of social corruption of stakeholders
Null Hypothesis:
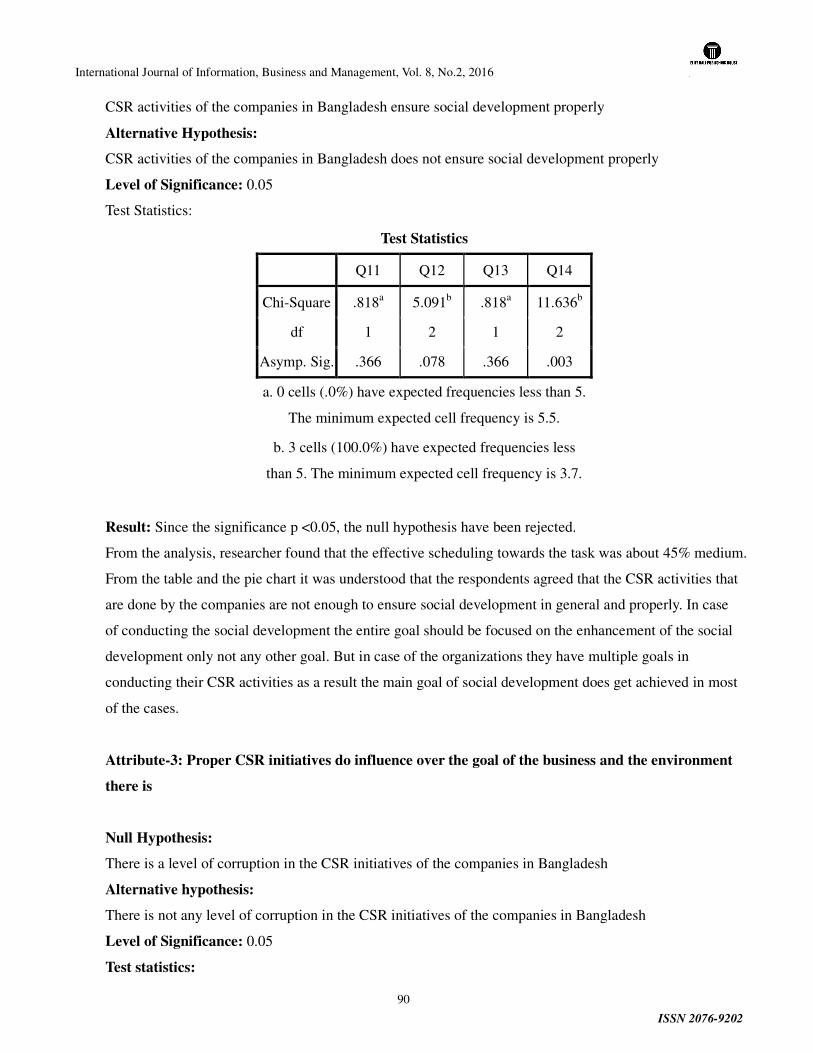
International Journal of Information, Business and Management, Vol. 8, No.2, 2016
ISSN 2076-9202
90
CSR activities of the companies in Bangladesh ensure social development properly
Alternative Hypothesis:
CSR activities of the companies in Bangladesh does not ensure social development properly
Level of Significance: 0.05
Test Statistics:
Test Statistics
Q11 Q12 Q13 Q14
Chi-Square .818a 5.091b .818a 11.636b
df 1 2 1 2
Asymp. Sig. .366 .078 .366 .003
a. 0 cells (.0%) have expected frequencies less than 5.
The minimum expected cell frequency is 5.5.
b. 3 cells (100.0%) have expected frequencies less
than 5. The minimum expected cell frequency is 3.7.
Result: Since the significance p <0.05, the null hypothesis have been rejected.
From the analysis, researcher found that the effective scheduling towards the task was about 45% medium.
From the table and the pie chart it was understood that the respondents agreed that the CSR activities that
are done by the companies are not enough to ensure social development in general and properly. In case
of conducting the social development the entire goal should be focused on the enhancement of the social
development only not any other goal. But in case of the organizations they have multiple goals in
conducting their CSR activities as a result the main goal of social development does get achieved in most
of the cases.
Attribute-3: Proper CSR initiatives do influence over the goal of the business and the environment
there is
Null Hypothesis:
There is a level of corruption in the CSR initiatives of the companies in Bangladesh
Alternative hypothesis:
There is not any level of corruption in the CSR initiatives of the companies in Bangladesh
Level of Significance: 0.05
Test statistics:
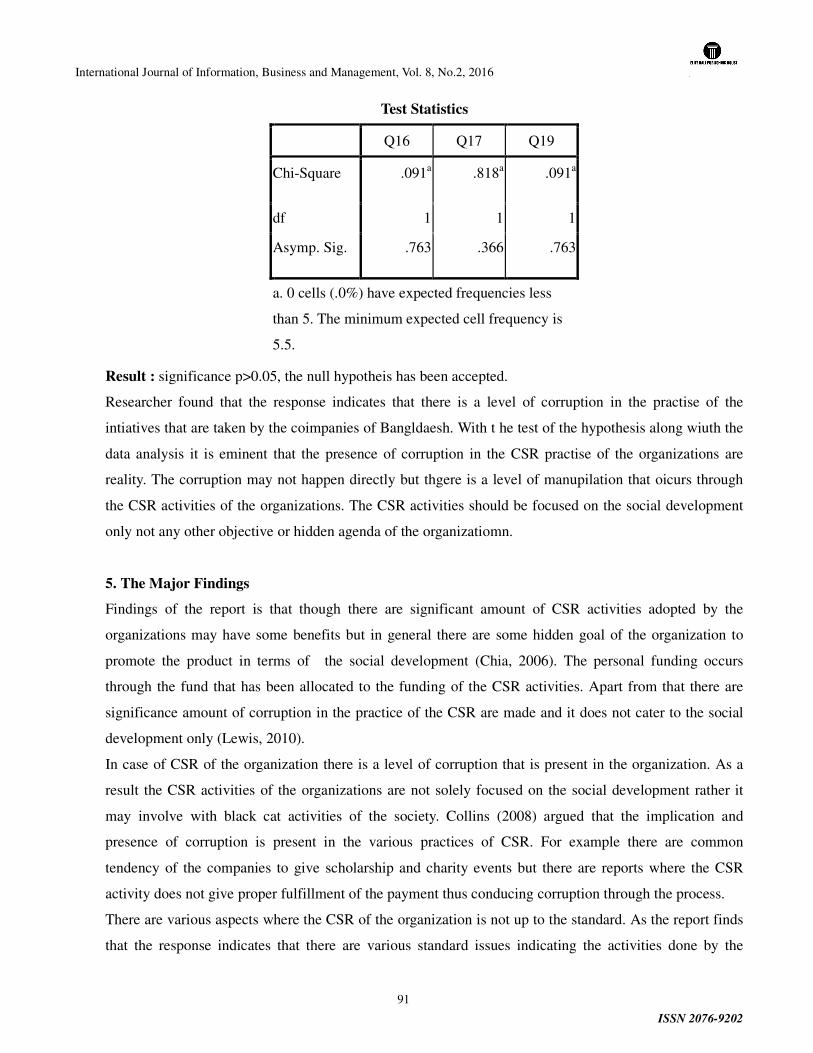
International Journal of Information, Business and Management, Vol. 8, No.2, 2016
ISSN 2076-9202
91
Test Statistics
Q16 Q17 Q19
Chi-Square .091a .818a .091a
df 1 1 1
Asymp. Sig. .763 .366 .763
a. 0 cells (.0%) have expected frequencies less
than 5. The minimum expected cell frequency is
5.5.
Result : significance p>0.05, the null hypotheis has been accepted.
Researcher found that the response indicates that there is a level of corruption in the practise of the
intiatives that are taken by the coimpanies of Bangldaesh. With t he test of the hypothesis along wiuth the
data analysis it is eminent that the presence of corruption in the CSR practise of the organizations are
reality. The corruption may not happen directly but thgere is a level of manupilation that oicurs through
the CSR activities of the organizations. The CSR activities should be focused on the social development
only not any other objective or hidden agenda of the organizatiomn.
5. The Major Findings
Findings of the report is that though there are significant amount of CSR activities adopted by the
organizations may have some benefits but in general there are some hidden goal of the organization to
promote the product in terms of the social development (Chia, 2006). The personal funding occurs
through the fund that has been allocated to the funding of the CSR activities. Apart from that there are
significance amount of corruption in the practice of the CSR are made and it does not cater to the social
development only (Lewis, 2010).
In case of CSR of the organization there is a level of corruption that is present in the organization. As a
result the CSR activities of the organizations are not solely focused on the social development rather it
may involve with black cat activities of the society. Collins (2008) argued that the implication and
presence of corruption is present in the various practices of CSR. For example there are common
tendency of the companies to give scholarship and charity events but there are reports where the CSR
activity does not give proper fulfillment of the payment thus conducing corruption through the process.
There are various aspects where the CSR of the organization is not up to the standard. As the report finds
that the response indicates that there are various standard issues indicating the activities done by the
International Journal of Information, Business and Management, Vol. 8, No.2, 2016
ISSN 2076-9202
92
organization do not imply in the perspective of the standard of the activities as a result there are various
issues regarding the standard of the CSR activities Godfrey, 2006).
From the report it has been found that there are evidence that the organizations often uses the funding that
has been allocated for the CSR of the organization is used in other factors such as organization utilizes
those CSR funding in case of donating to use money in various political parties. (Hoffman, 2011) argued
apart from that those organization that are backed up by political affiliation and has their own political
group then they utilizes those CSR money in case of supporting and developing the political group
instead of developing the society.
There have been allegations regarding various Banks that are governing under the authority of foreign
involvement have been subject to investing the CSR money in various terrorism based activities.
(Goldstein, 2008) stated hence there are other version of that scenario, but the point is whether the
incident is true or not or whether the organization is foreign governed or not many organization uses
money of CSR in the political terrorism to gain power and so on which is also a violation of the CSR
rules.
The metaphorical indication of the black cat in the CSR indicates that the organizations that does CSR in
general then the aspects that should be kept hidden and not addressed that the CSR activities of the
organization. (Collins, 2005) identified the black cat is the indication that there are some aspects that the
organization can address though giving an eye wash regarding the aspect that the organization covers
under the banner of CSR. But there is hue and cry that has emerged that there are some levels of faulty
aspect of the CSR activities.
In today’s age of holistic marketing, most of the banks are engaged in performing CSR activities.
Different companies of Bangladesh are not the exception one. different companies of Bangladesh has also
keeping its attention in performing CSR functions in different sectors including- Environmental sector,
Educational sector, Employment sector, Economic sector, Social sector, Cultural sector. So from this
finding of the author, it can be cleared that the objective 1 mentioned in chapter 1 is well-fulfilled.
Higher budgets for estimated for CSR activities by different companies of Bangladesh. Every year
different companies of Bangladesh have been keeping a fixed amount for performing CSR functions. In
the year of 2010, the bank was allocated 15 crore where it expended 1 crore in different CSR sectors it
has decided to serve. In the year of 2011, the bank has expended 25 crore in these CSR sectors which is
great contribution by the Bank and 30 Crore in 2012. The bank has focusing on the importance of
education, thus it has issued 98 lacs money on the purpose of giving scholarship to students to make them
interested in education. The bank has also given attention on making mass awareness program where it
allocated 2 crore for this purpose. The author’s this finding is completely similar with the objective 1
mentioned in chapter 1.
International Journal of Information, Business and Management, Vol. 8, No.2, 2016
ISSN 2076-9202
93
The improvement of environmental sector by different companies of Bangladesh’s CSR practices.
Different companies of Bangladesh are doing a great job in case of keeping environment fresh by its CSR
actions. The bank has been making program of tree plantation to increase interest and importance among
respondents of planting trees for keeping environment healthy. The bank has also focusing itself in
making awareness among respondents to stop themselves from unnecessary cutting trees and making
them understood the bad impact of cutting trees on the nature and also the human life. So different
companies of Bangladesh has been keeping a great contribution in making environment ever green and
keeping healthy. The author’s this finding is completely similar with the objective 2 mentioned in chapter
1.
It is true that different companies of Bangladesh have been providing financial incentives to make its
employee happy with the work and for motivating them so that they can provide their best service. But
the contribution the bank has made to its employee is not enough and is not satisfactory compared to
other banks. So from this finding of the author, it can be cleared that the objective 2 mentioned in chapter
1 is well-fulfilled.
Almost all the bank is doing CSR actions to improve the country’s economy besides attaining their own
profit maximization objective. Different companies of Bangladesh has been providing different type of
short term loan to poor respondents of our country and influences them to be engaged in some work using
that loan, recently the bank has been providing small and medium loan to poor women, so that they can
start their own business or do some work. This contribution of different companies of Bangladesh is
reducing the unemployment rate of the country which ultimately keeping great contribution in the
economy by increasing the productivity of new employed respondents. Author’s this findings is matched
with the objective 2 mentioned in chapter 1.
Every type of business works in particular society. So this society should be improved by that business’s
contribution. Different companies of Bangladesh are performing different types of CSR actions to
improve the condition of the society. So from this finding of the author, it can be cleared that the objective
2 mentioned in chapter 1 is well-fulfilled.
Overall direct impact of CSR of the Private Commercial Banks of Bangladesh in social development:
different companies of Bangladesh are keeping great contribution for the social development of the
country. The bank has been making respondents aware to keep environment clean, to stop abusing natural,
social resources. By giving scholarship, the bank is increasing the importance of education among
respondents. So the Bank should increase its number of ATM booths to increase easy convenience and to
give quick response to its customers anytime when necessary. Author’s this findings is matched with the
objective 2 mentioned in chapter 1.

International Journal of Information, Business and Management, Vol. 8, No.2, 2016
ISSN 2076-9202
94
Living standard of by CSR is increasing: With the social development, the Private Commercial Banks of
Bangladesh is improving the life standard of Bangladeshi respondents. The bank is teaching respondents
to engage in tree plantation activities to keep environment and also themselves healthy. With the
arrangement of mass awareness program the bank is raising concern among respondents to stop
unnecessary wastages. The bank’s performance will be higher if the employees do their best. So the bank
should motivate its employee by some financial rewards, additional salary etc. The author’s this finding is
completely similar with the objective 3 mentioned in chapter 1.
Increasing corporate image to better increase the life standard of respondents through CSR actions:
different companies of Bangladesh is increasing its corporate image among respondents both in home and
foreign country by doing CSR activities for the development of society. The bank is increasing its
public image by doing better activities in sphere of educational, economic, environmental and social
sectors. By this, the bank has been made itself able to attract foreign investors and different private
organizations for making investment here. When the investment rate increases, the bank will be able to
allocate more budgets on giving scholarship, on giving more shirt and medium sized loan which finally
lead the respondents of Bangladesh to enjoy a better life. So from this finding of the author, it can be
cleared that the objective 3 mentioned in chapter 1 is well-fulfilled.
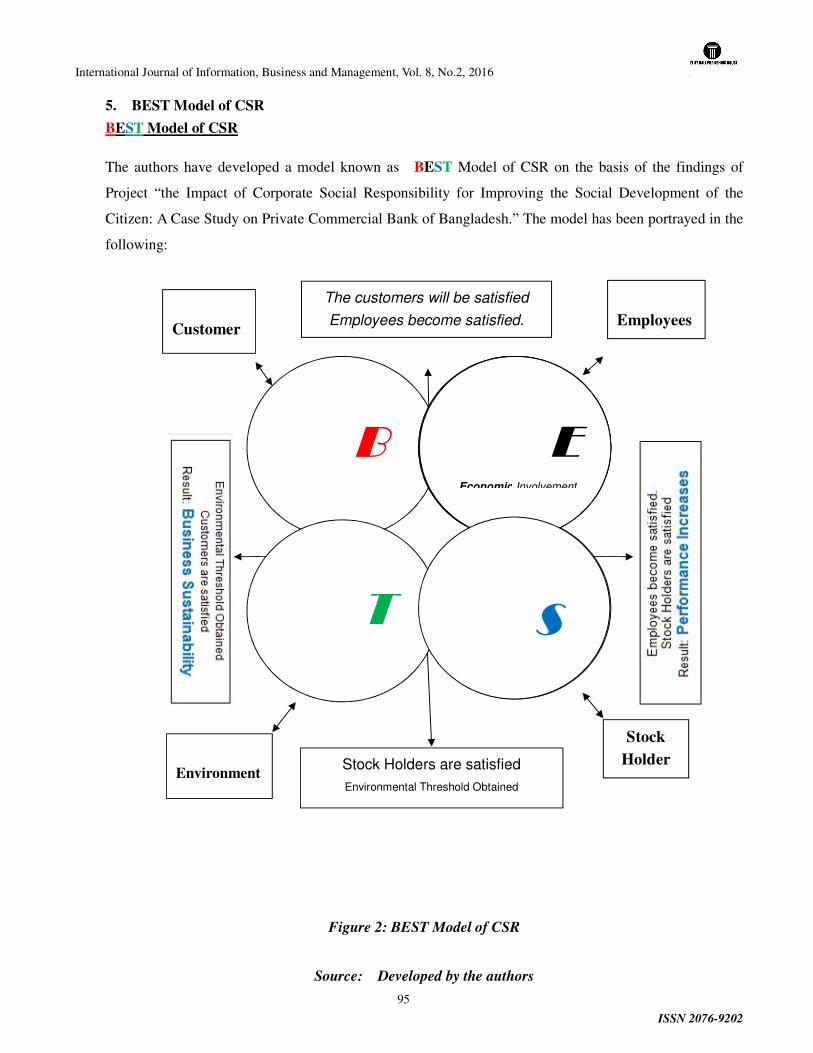
International Journal of Information, Business and Management, Vol. 8, No.2, 2016
ISSN 2076-9202
95
5. BEST Model of CSR
BEST Model of CSR
The authors have developed a model known as BEST Model of CSR on the basis of the findings of
Project “the Impact of Corporate Social Responsibility for Improving the Social Development of the
Citizen: A Case Study on Private Commercial Bank of Bangladesh.” The model has been portrayed in the
following:
Figure 2: BEST Model of CSR
Source: Developed by the authors
The customers will be satisfied
Employees become satisfied.
Stock Holders are satisfied
Environmental Threshold Obtained
Result: Green Environment
B E E E E
Customer
s
Employees
Stock
Holder
E E Economic Involvement
S S T Environmental Threshold
Environment
International Journal of Information, Business and Management, Vol. 8, No.2, 2016
ISSN 2076-9202
96
The authors have described to improvement CSR activity of Private Commercial Banks of Bangladesh
should have follow The Four Activities which are involved with basic four dimensions of CSR. The
activities are described in the following:
1. B stands for Business Practice of an origination. Here the authors’ mean that CSR activities are not the
philanthropy activities rather the activities are the Business Practice of the Organizations. However, this
business practices should be performed toward to Customers of the Organization. This means that as the
business organizations produce their products for the customers, they should have the CSR activities as a
complementary feature of their products. Thus, the customers will be satisfied
2. E stands for Economic Involvement of an origination. The employees are the human resources of
organizations and they worked for the organizations. However, the organization should have involved in
such a way so that the employees of the organization become satisfied with the organizations.
3. S stands for Stock Holder Solidity Practice of an origination. If an organization involved in such kind
of CSR activity in the way of solid and honest fund distribution to the stockholders on time. The
stockholder will be satisfied. There would increases the Capital Investment.
3. T stands for Environmental Threshold of an organization. This is a (ecology) a point that, when
crossed, can bring rapid and sometimes unpredictable change in a trend. An example would be the sudden
altering of ocean currents due to the melting of ice at the poles. If the organizations continue to practice in
these sectors, it is possible to obtain the Green environment which is livable to all.
Thus, the by these sectors’ CSR practices the organization will be able to obtain business Sustainability.
6. Recommendations and Conclusions
6.1 Recommendations
The recommendations are given in the following:
Consumer Education: The Private Commercial Banks of Bangladesh should provide commercial free
and professional financial knowledge to help consumers understand financial investment and associated
risks.
The process of CSR should be modified and there should have strong monitoring system
Education and Social Development: The Private Commercial Banks of Bangladesh must believe that
education is crucial to the development and prosperity of every country. By supporting education in
Bangladesh, The Private Commercial Banks of Bangladesh should seek to contribute to nurturing talent
for Bangladesh’s future success.
Ethical Banking: Ethical banking should be The Private Commercial Banks of Bangladesh’s approach to
lending and investment that follows guidelines set by international standards. This approach takes into
consideration society’s expectations and the interests of future generations.
Environmental Protection: The environment is the foundation for sustainable business. Protecting the
environment is a key CSR focus of The Private Commercial Banks of Bangladesh.
International Journal of Information, Business and Management, Vol. 8, No.2, 2016
ISSN 2076-9202
97
Corporate Governance: The Private Commercial Banks of Bangladesh should adopt corporate
governance which means maintaining a high level of integrity and transparency in the way we conduct
our business. This involves providing timely and accurate disclosure of information for our stakeholders.
The Private Commercial Banks of Bangladesh Climate Partnership: The Private Commercial Banks
of Bangladesh should help to tackle climate change with a four-year, global programme of the The Private
Commercial Banks of Bangladesh should Climate Partnership.
6.2 Conclusions
CSR is not only about charitable donations, the environment or society, but also about making decisions
that maintain the right balance between the environment, society and the Bank’s business. The Private
Commercial Banks of Bangladesh is committed to the Group’s emphasis on education, the environmental
protection and support of local communities. The Private Commercial Banks of Bangladesh CSR
activities also focus on social development, staff volunteering, consumer education and ethical banking.
CSR initiatives practiced by The Private Commercial Banks of Bangladesh, detect the impacts of
Corporate Social Responsibility (CSR) for improving the Social Development of the citizen and to
analyze the issues by which The Private Commercial Banks improve the living standard of citizen of
Bangladesh . The author has been able to achieve his objective four by proposing a model which is known
as BEST Model of CSR in this study.
8. References
Auger, P., Burke, P., Devinney, T. M., and Louviere, J. J. (2003) “What Will Customers Pay for Social
Product Features?” Journal of Business Ethics p. 42 281-304.
Babbie, E. (2010) The Practice of Social Research, 12th Edition, Belmont, Wadsworth Cengage Learning.
Barnett, M. (2007) “Stakeholder Influence Capacity and the Variability of Financial Returns to Corporate
Social Responsibility.” Academy of Management Review 32, 3: p. 794-816.
Campbell, J.L. (2007) “Why Would Corporations Behave in Socially Responsible Ways? Institutional
Theory of Corporate Social Responsibility.” Academy of Management Review 32,. p. 3-950.
Cargan, L. (2007) Doing Social Research, 1st Edition, Maryland, Rowman and Littlefield Publishers Inc.
Chia, R. (2002) Essential Skills for Management Research, London, Sage Publications.
Cohen, L. Manion, L. and Morrison, K. (2000) Research Methods In Education, 5th Edition, London
RoutledgeFalmer.
International Journal of Information, Business and Management, Vol. 8, No.2, 2016
ISSN 2076-9202
98
Collis, J. and Hussey, R. (2013) Business Research, 2rd Ed. England, Palgrave Macmillan.
Creswell, J. W. (2003) Research Design; Qualitative, Quantitative and Mixed Methods Approaches, 3rd
Editon, London, Sage Publications Ltd.
Creyer, E. H., and Ross Jr., W. T. (1996) “The Impact of Corporate Behavior on Perceived Product Value.”
Marketing Letters 7,p no. 2 173-185.
Du, S., Bhattacharya, C. B., and Sen, S. (2007) “Reaping Relational Rewards from Corporate Social
Responsibility: The Role of Competitive Positioning.” International Journal of Research in Marketing 24,
p. 3 224-241.
Edward F., 1984. Strategic Management: A Stakeholder Approach. Cambridge University Press: UK
Elkington, J. 1997Cannibals with forks: The triple bottom line of 21st century business. Oxford:
Capstone.
Ellen, P. S., Mohr, L. A., and Webb, D. J. (2000) “Charitable Programs and The Retailer: Do They Mix?”
Journal of Retailing 76, p. 3 393-406.
Ellen, P. S., Webb, D. J., and Mohr, L. A. (2006) “Building Corporate Associations: Customer
Attributions for Corporate Socially Responsible Programs.” Journal of the Academy of Marketing
Science 34, P. 2 147-157.
George Cheney, and Juliet Roper, 2007. The Debate over Corporate Social Responsibility. England :
Oxford University Press.
Godfrey, P. C., Merrill, C. B, and Hansen, J. M. (2011) “The Relationship between Corporate Social
Responsibility and Shareholder Value: An Empirical Test of the Risk Management Hypothesis.” Strategic
Management Review p. 425-445.
Goldstein, N. J., Cialdini, R. B., and Griskevicius, V. (2011) “A Room with a Viewpoint: Using Social
Norms to Motivate Environmental Conservation in Hotels.” Journal of Customer Research 35, p. 3
472-482.
Golob, U., Lah, M., and Jancic, Z. (2011) “Value Orientations and Customer Expectations of Corporate
Social Responsibility.” Journal of Marketing Communications 14, p. 2 83-96.
Gray, D.E (2002) Doing Research in the Real World, 1st Edition, London, Sage Publications.
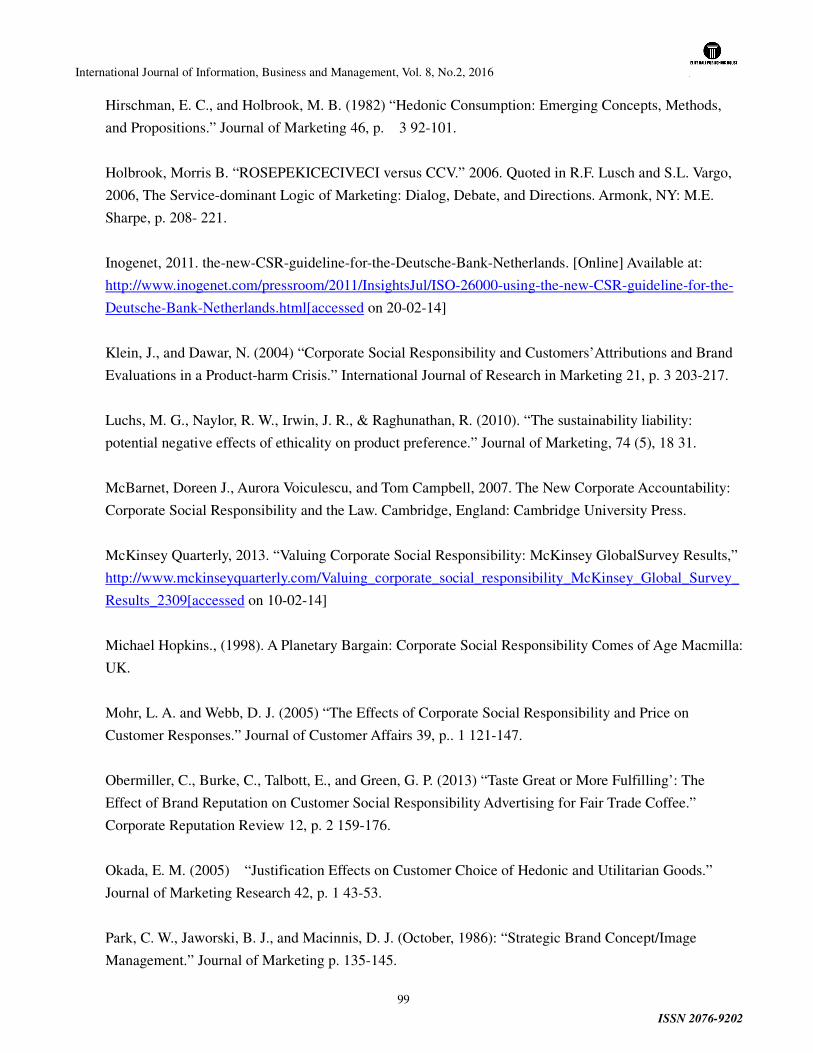
International Journal of Information, Business and Management, Vol. 8, No.2, 2016
ISSN 2076-9202
99
Hirschman, E. C., and Holbrook, M. B. (1982) “Hedonic Consumption: Emerging Concepts, Methods,
and Propositions.” Journal of Marketing 46, p. 3 92-101.
Holbrook, Morris B. “ROSEPEKICECIVECI versus CCV.” 2006. Quoted in R.F. Lusch and S.L. Vargo,
2006, The Service-dominant Logic of Marketing: Dialog, Debate, and Directions. Armonk, NY: M.E.
Sharpe, p. 208- 221.
Inogenet, 2011. the-new-CSR-guideline-for-the-Deutsche-Bank-Netherlands. [Online] Available at:
http://www.inogenet.com/pressroom/2011/InsightsJul/ISO-26000-using-the-new-CSR-guideline-for-the-
Deutsche-Bank-Netherlands.html[accessed on 20-02-14]
Klein, J., and Dawar, N. (2004) “Corporate Social Responsibility and Customers’Attributions and Brand
Evaluations in a Product-harm Crisis.” International Journal of Research in Marketing 21, p. 3 203-217.
Luchs, M. G., Naylor, R. W., Irwin, J. R., & Raghunathan, R. (2010). “The sustainability liability:
potential negative effects of ethicality on product preference.” Journal of Marketing, 74 (5), 18 31.
McBarnet, Doreen J., Aurora Voiculescu, and Tom Campbell, 2007. The New Corporate Accountability:
Corporate Social Responsibility and the Law. Cambridge, England: Cambridge University Press.
McKinsey Quarterly, 2013. “Valuing Corporate Social Responsibility: McKinsey GlobalSurvey Results,”
http://www.mckinseyquarterly.com/Valuing_corporate_social_responsibility_McKinsey_Global_Survey_
Results_2309[accessed on 10-02-14]
Michael Hopkins., (1998). A Planetary Bargain: Corporate Social Responsibility Comes of Age Macmilla:
UK.
Mohr, L. A. and Webb, D. J. (2005) “The Effects of Corporate Social Responsibility and Price on
Customer Responses.” Journal of Customer Affairs 39, p.. 1 121-147.
Obermiller, C., Burke, C., Talbott, E., and Green, G. P. (2013) “Taste Great or More Fulfilling’: The
Effect of Brand Reputation on Customer Social Responsibility Advertising for Fair Trade Coffee.”
Corporate Reputation Review 12, p. 2 159-176.
Okada, E. M. (2005) “Justification Effects on Customer Choice of Hedonic and Utilitarian Goods.”
Journal of Marketing Research 42, p. 1 43-53.
Park, C. W., Jaworski, B. J., and Macinnis, D. J. (October, 1986): “Strategic Brand Concept/Image
Management.” Journal of Marketing p. 135-145.

International Journal of Information, Business and Management, Vol. 8, No.2, 2016
ISSN 2076-9202
100
Peloza, J. (2013) “The Challenge of Measuring Financial Impacts from Investments in Corporate Social
Performance.” Journal of Management 35, p. 1518-1541.
Remenyi, D. (1990) Strategic Information Systems: Current Practice and Guidelines, Doctoral
Dissertation, United Kingdom, Henley Management College.
Saunders, M., Lewis, P. and Thornhill, A. (2013). Research Methods for Business Students. London:
Financial Times.
Schuler, D. A., and Cording, M. (2006) “A Corporate Social Performance- Corporate Financial
Performance Behavioral Model for Customers.” Academy of Management Review 31, p. 3 540-558.
Schutt, R. K. (2006), Investigating the social world: the process and practice of research, 5th Edition,
London, Pine forge publication.
Shavitt, S. (1990) “The Role of Attitude Objects in Attitude Functions.” Journal of Experimental Social
Psychology 26, p. 2 128-148.
Simmons, C. J. and Becker-Olsen, K. L. (2006). “Achieving Marketing Objectives Through Social
Sponsorships.” Journal of Marketing 70, Vol no. 4. p. 154-169.
Trigg, R. (1980). Reality at Risk. Sussex, the Harvester Press Limited.
Trudel, R., and Cotte, J. (2013 “Does It Pay to Be Good?” MIT Sloan Management Review 50, no. 2): p.
61-68.
Visser, Wayne, Dirk Matten, Manfred Pohl, and Nick Tolhurst (Editors), 2007. The A to Z of Corporate
Social Responsibility. London : Wiley.
Wang, H., Choi, J., and Li, J. (2011) “Too Little or Too Much? Untangling the Relationship between
Corporate Philanthropy and Firm Financial Performance.” Organization Science 19, no. 1. P. 143-159.
Wood, D. J. (1991) “Corporate Social Performance Revisited.” Academy of Management Review 16. P.
693.
9. Appendices
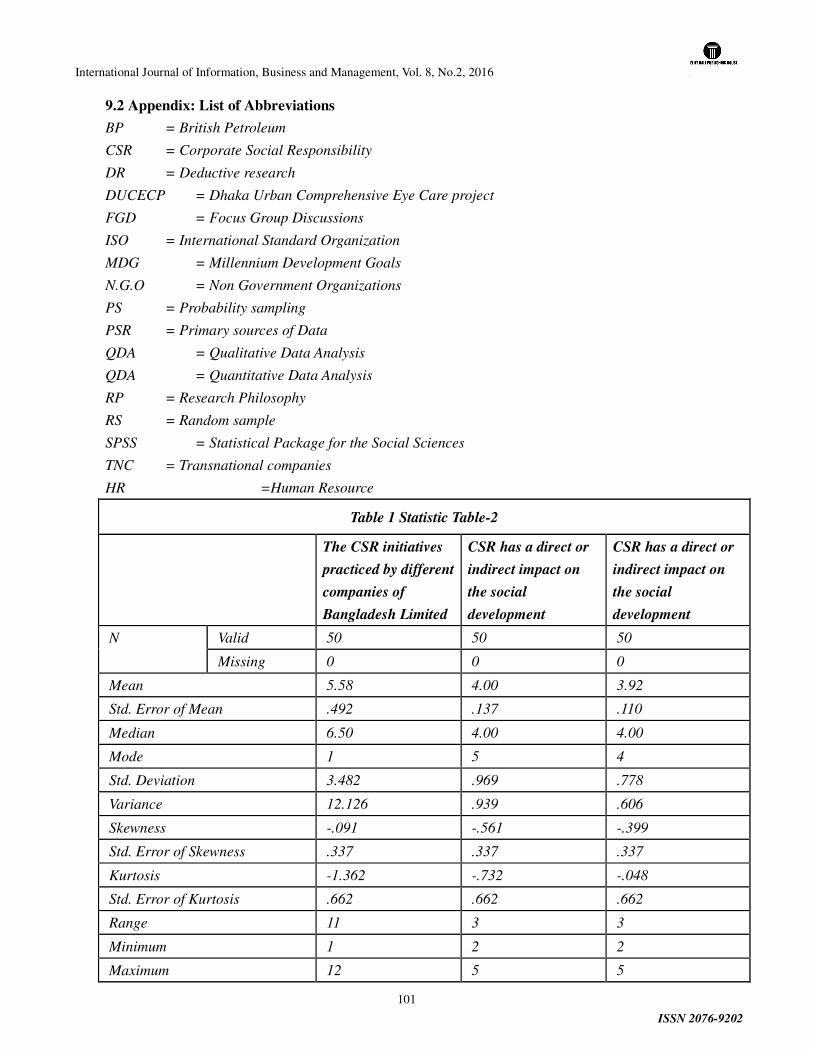
International Journal of Information, Business and Management, Vol. 8, No.2, 2016
ISSN 2076-9202
101
9.2 Appendix: List of Abbreviations
BP = British Petroleum
CSR = Corporate Social Responsibility
DR = Deductive research
DUCECP = Dhaka Urban Comprehensive Eye Care project
FGD = Focus Group Discussions
ISO = International Standard Organization
MDG = Millennium Development Goals
N.G.O = Non Government Organizations
PS = Probability sampling
PSR = Primary sources of Data
QDA = Qualitative Data Analysis
QDA = Quantitative Data Analysis
RP = Research Philosophy
RS = Random sample
SPSS = Statistical Package for the Social Sciences
TNC = Transnational companies
HR =Human Resource
Table 1 Statistic Table-2
The CSR initiatives
practiced by different
companies of
Bangladesh Limited
CSR has a direct or
indirect impact on
the social
development
CSR has a direct or
indirect impact on
the social
development
N Valid 50 50 50
Missing 0 0 0
Mean 5.58 4.00 3.92
Std. Error of Mean .492 .137 .110
Median 6.50 4.00 4.00
Mode 1 5 4
Std. Deviation 3.482 .969 .778
Variance 12.126 .939 .606
Skewness -.091 -.561 -.399
Std. Error of Skewness .337 .337 .337
Kurtosis -1.362 -.732 -.048
Std. Error of Kurtosis .662 .662 .662
Range 11 3 3
Minimum 1 2 2
Maximum 12 5 5
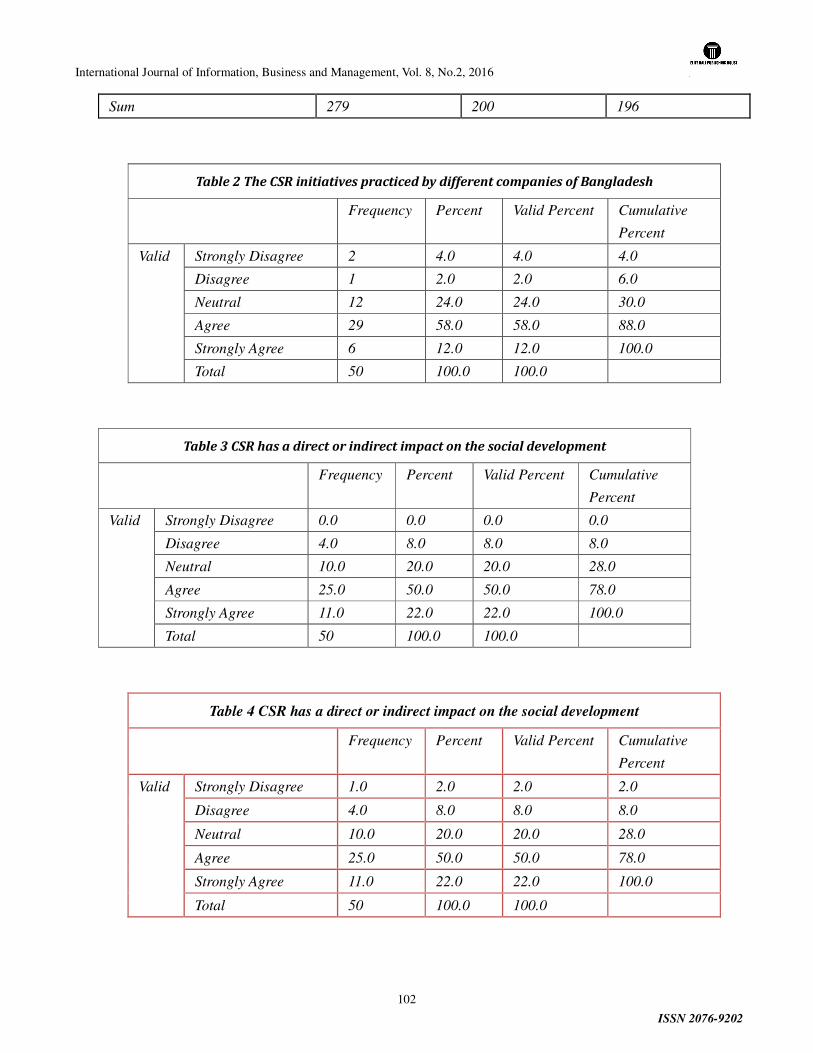
International Journal of Information, Business and Management, Vol. 8, No.2, 2016
ISSN 2076-9202
102
Sum 279 200 196
Table 2 The CSR initiatives practiced by different companies of Bangladesh
Frequency Percent Valid Percent Cumulative
Percent
Valid Strongly Disagree 2 4.0 4.0 4.0
Disagree 1 2.0 2.0 6.0
Neutral 12 24.0 24.0 30.0
Agree 29 58.0 58.0 88.0
Strongly Agree 6 12.0 12.0 100.0
Total 50 100.0 100.0
Table 3 CSR has a direct or indirect impact on the social development
Frequency Percent Valid Percent Cumulative
Percent
Valid Strongly Disagree 0.0 0.0 0.0 0.0
Disagree 4.0 8.0 8.0 8.0
Neutral 10.0 20.0 20.0 28.0
Agree 25.0 50.0 50.0 78.0
Strongly Agree 11.0 22.0 22.0 100.0
Total 50 100.0 100.0
Table 4 CSR has a direct or indirect impact on the social development
Frequency Percent Valid Percent Cumulative
Percent
Valid Strongly Disagree 1.0 2.0 2.0 2.0
Disagree 4.0 8.0 8.0 8.0
Neutral 10.0 20.0 20.0 28.0
Agree 25.0 50.0 50.0 78.0
Strongly Agree 11.0 22.0 22.0 100.0
Total 50 100.0 100.0
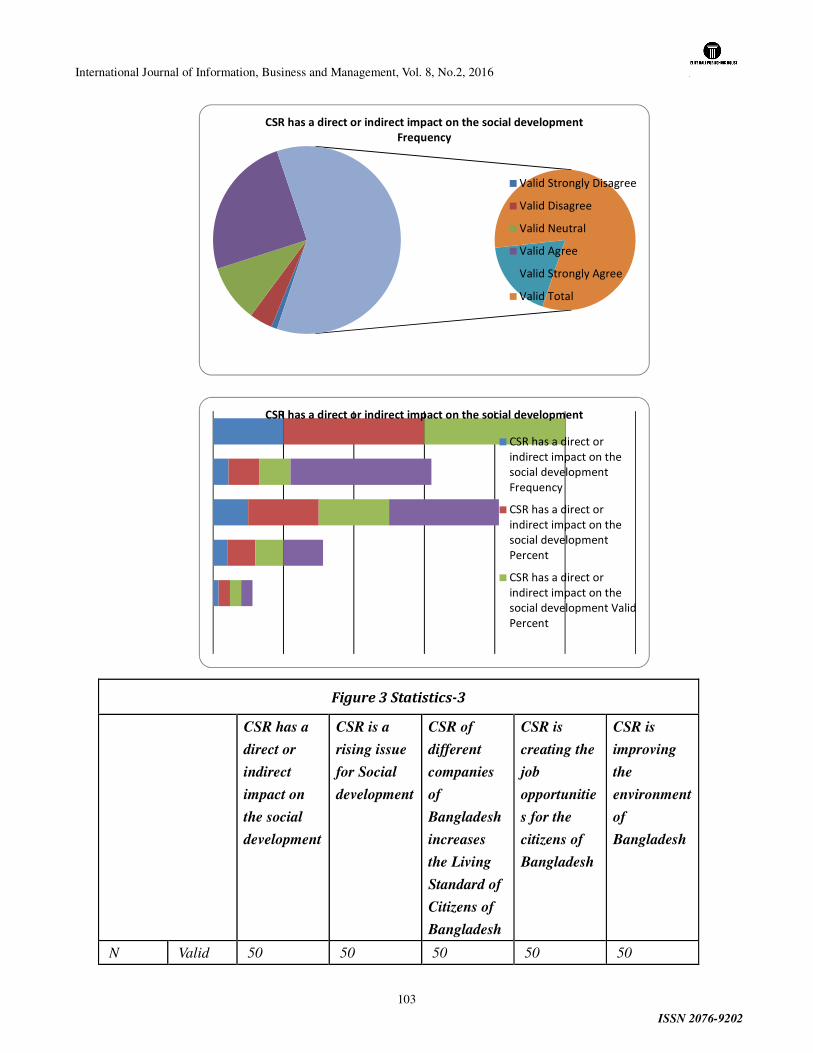
International Journal of Information, Business and Management, Vol. 8, No.2, 2016
ISSN 2076-9202
103
Figure 3 Statistics-3
CSR has a
direct or
indirect
impact on
the social
development
CSR is a
rising issue
for Social
development
CSR of
different
companies
of
Bangladesh
increases
the Living
Standard of
Citizens of
Bangladesh
CSR is
creating the
job
opportunitie
s for the
citizens of
Bangladesh
CSR is
improving
the
environment
of
Bangladesh
N Valid 50 50 50 50 50
CSR has a direct or indirect impact on the social development
Frequency
Valid Strongly Disagree
Valid Disagree
Valid Neutral
Valid Agree
Valid Strongly Agree
Valid Total
CSR has a direct or indirect impact on the social development
CSR has a direct or
indirect impact on the
social development
Frequency
CSR has a direct or
indirect impact on the
social development
Percent
CSR has a direct or
indirect impact on the
social development Valid
Percent
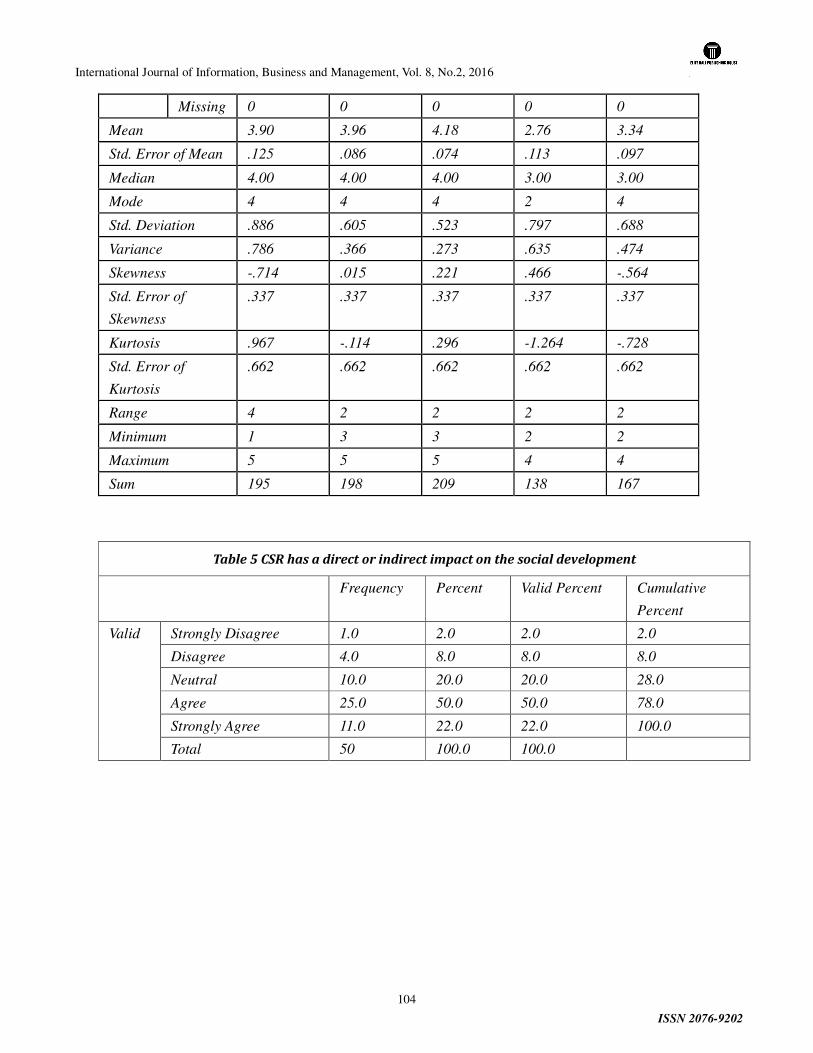
International Journal of Information, Business and Management, Vol. 8, No.2, 2016
ISSN 2076-9202
104
Missing 0 0 0 0 0
Mean 3.90 3.96 4.18 2.76 3.34
Std. Error of Mean .125 .086 .074 .113 .097
Median 4.00 4.00 4.00 3.00 3.00
Mode 4 4 4 2 4
Std. Deviation .886 .605 .523 .797 .688
Variance .786 .366 .273 .635 .474
Skewness -.714 .015 .221 .466 -.564
Std. Error of
Skewness
.337 .337 .337 .337 .337
Kurtosis .967 -.114 .296 -1.264 -.728
Std. Error of
Kurtosis
.662 .662 .662 .662 .662
Range 4 2 2 2 2
Minimum 1 3 3 2 2
Maximum 5 5 5 4 4
Sum 195 198 209 138 167
Table 5 CSR has a direct or indirect impact on the social development
Frequency Percent Valid Percent Cumulative
Percent
Valid Strongly Disagree 1.0 2.0 2.0 2.0
Disagree 4.0 8.0 8.0 8.0
Neutral 10.0 20.0 20.0 28.0
Agree 25.0 50.0 50.0 78.0
Strongly Agree 11.0 22.0 22.0 100.0
Total 50 100.0 100.0
International Journal of Information, Business and Management, Vol. 8, No.2, 2016
ISSN 2076-9202
105
UNDERSTANDING THE ASPECTS OF CULTURAL SHOCK IN
INTERNATIONAL BUSINESS ARENA
Author: Dr.N.Kathirvel1 & Mrs. I.M.Christina Febiula
2
ABSTRACT
Cultural Shock is an experience of trauma when the culture transition is felt home culture. It is a
communication problem that involves the frustrations of not understanding the verbal and non- verbal
communication of the host culture- its customs and value systems. It is no surprise that cultural shock can
cause many problems with an employee’s comfort level, particularly, in corporate inter personal
relationship responses, leading to psychological stress. The psychological stress is an outcome of
adaptability to major differences in lifestyles, living conditions and business practices in another cultural
setting that the disrupt the employee’s routines and comfort levels leading to anxiety and frustration in
workplace. In this paper an attempt is made to understand the nature of cultural shock and its aspects, to
identify the typical stages of cultural shock and based on these evaluations, suggestions are proposed to
alleviate and minimize cultural shock in the international business arena.
Key Words: Cultural Shock, International Business
The Nature of Culture Shock
“Culture Shock”, a term popularized by anthropologist Kalvero Oberg, refers to the
psychological disorientation experience by people who suddenly find them living and working in
radically different cultural environments. Oberg (1960) describes culture shock as the anxiety that results
when all familiar cultural props have been knocked out from a person who is entering into a new culture.
Culture shock ranges from mild irritation to a deep-seated psychological panic or crisis. It usually carries
with it the feelings of helplessness and irritability, while producing fears of being cheated, injured,
contaminated or discounted. Both social scientists and laypeople use the term culture shock to define in
very broad terms the unpleasant consequences of experiencing a foreign culture. According to Oberg
(1960), the culture shock involves the following dimensions: A sense of….
• Confusion over expected role behavior
• Surprise
• Loss of the old familiar surroundings and cultural patterns
• Being rejected
• Loss of self-esteem
• Feeling impotence at having little or no control over the environment
• Strong sense of doubt when old values are brought into question
1 Research Supervisor, Bharathiar University & Assistant Professor, Department of Commerce, Government Arts College, Udumalpet, Tirupur District, Coimbatore, TamilNadu, India, [email protected]. 2 MBA, M Phil, Research Scholar, Bharathiar University & Assistant. Professor, Department of Management, Sri .Ramakrishna Institute of Technology, Coimbatore, TamilNadu, India. [email protected].
International Journal of Information, Business and Management, Vol. 8, No.2, 2016
ISSN 2076-9202
106
Robert Kohls (1984) and Elizabeth Marx (1999) provide a fairly comprehensive list of the some major
symptoms that have been observed in relatively severe cases of culture shock:
• Homesickness
• Boredom
• Need for excessive amount of sleep
• Tenseness, moodiness, and irritability
• Marital stress
• Hostility toward host nationals
• Feelings of isolation
• Loss of confidence
• Loss of ability to work effectively, etc…
Because culture shock is characterized by a large and diverse set of symptoms, the malady is
frequently difficult to predict and control. It is important to point out, however, that not every
employee will experience all the symptoms, but almost all employees will experience some or other.
Moreover, some symptoms, or combination of symptoms will vary in severity as the case may be. The
anxiety of culture shock can interpret work patterns, increase the number of bad solutions to problems
and impair decision making, planning, and personal relationships in one’s overseas assignments.
Ironically, some of the personality characteristics traditionally considered positive for business people
at home are the very traits that can most readily contribute to culture shock. Although most
international businesspeople will anticipate a certain number of problems and discomforts when
entering a new cultural environment that are frequently unprepared for the myriad of problems
especially while returning home. Moreover, culture shock encourages the sufferers to confront their
own cultural heritage and to develop a new awareness.
Aspects of Cultural Shock
Aspects of Cultural Shock include cultural stress, social alienation, social class -
Poverty/wealth extremes, financial matters, relationships and family considerations .
In addition, differences between the extent to which persons in the host and home cultures
reveal their private selves may cause acculturation problems, particularly in communication.
Cultural Stress
Entering an unfamiliar culture is stressful; in fact, transitions of any type are both psychologically
and physically stressful. Expatriates learn to use a variety of coping skills to alleviate stress. Some
companies have found that providing prospective expatriates with a mentor who has worked in the host
country can help reduce anxiety about adjustments that may be necessary in the new culture. Above all,
maintaining a sense of humor is very important in dealing with cultural stress.
Social Alienation
Feelings of alienation may be delayed somewhat because concern over such basic matters as housing,
transportation and work may buffer these feelings initially. Making an effort to become familiar with the
nuances of the culture and cultivating friendships with colleagues from the home culture as well as the
host culture can alleviate feelings of alienation like enrolling in language classes and entertaining
International Journal of Information, Business and Management, Vol. 8, No.2, 2016
ISSN 2076-9202
107
programs pave the way toward a better understanding and appreciation of their colleagues’ culture.
Social Class and Poverty/ Wealth Extreme
Social Classes and extremes in poverty and wealth are readily apparent. According to people in
the lower stratum class, is related monitory value. People in the middle stratum acknowledge the
economic implications but still value the work expertise and education. People in the top stratum believe
that our tastes, values, styles and behaviour indicate the class, regardless of education, occupation or
money (Fussell, 1983). Mentors in the host culture can be very helpful in advising the employees in the
organisation regarding acceptable ways of dealing with poverty/wealth extremes and with gaining an
insight into the class structure of the culture.
Financial Matters
Adapting to a new culture and reentering the home culture does involve financial adjustments and
corporate should provide financial counseling (i.e. information as cost and availability of housing,
banking practices and costs involved for schooling for employee’s children and cost of maintaining the
family) both to expatriates and repatriates. Although the focus is a little different, the primary
consideration is the same; optimum use of the financial resources available. Because substantial salary
increases are often related to an employees’ willingness to relocate, these increases should be discussed in
terms of real purchasing power. By providing counseling before home country re-entry, the company is
acknowledging that financial problems will occur and is demonstrating a willingness to support to
overcome financial problems. The focus of financial counseling for repatriates includes costs involved in
relocating in a stateside home, accompanying adjustments to a lower salary and the loss of perquisites. To
ease the transition financially, some companies provide a relocation pay supplement, particularly children
whose adolescence is delayed. Because repatriated children are usually retarded three to four years
socially, counseling is often needed to help them work through this transition of readjusting to the home
culture (Bird & Dunbar, 1991).
Relationships and Family considerations
Problems with relationships, such as the failure of the spouse and other family members to adapt to
the new culture, are a major factor in the early return of expatriates. Family and personal issues can be
disruptive to acculturation, especially for families with children ages 3 to 5 and 14 to 16 (Harvey, 1985).
Care must be taken to prepare children for the move by discussing openly their anxieties and fears and by
providing them with information concerning expected changes in their lives. Two- career families in
which one spouse (usually the wife) gives up a career to accompany the relocated spouse pose special
adjustment problems. Job opportunities in the new culture may be nonexistent, and resentment and
boredom may lead to family conflict. Adding unhappy children and an unhappy spouse to the stress of the
new job in a foreign culture increases the probability of an early return to the home culture (Harvey,
1985). Companies that provide training for employees prior to departure rarely include the family in such
training. Because adjustment problems often involve the family, difficulties could be avoided in many
cases by including family members in pre-departure training.
Stages of Cultural Shock
Cultural shock generally goes through five stages: excitement or initial euphoria, crisis or disenchantment,
International Journal of Information, Business and Management, Vol. 8, No.2, 2016
ISSN 2076-9202
108
Adjustment, Acceptance and Reentry. Davis and Krapels (2005) visualize cultural shock as being
represented by a U- shaped curve, with the top of the left side of the curve representing the positive
beginning, the crisis stage starts down the left side to the base of the U, the adjustment phase starts at the
base of the curve, then acceptance moves up the right side of the curve, and reentry into the original
culture is at the top of the right side of the curve.
The first stage is excitement and fascination with the new culture, which can last only a few days
or several months. During this time, everything is new and different; the employees are fascinated with
the food and the people. Sometimes this stage is referred as the “Honeymoon” stage (Black et al., 1999).
During the Second stage, the crisis or disenchantment period, the “honeymoon” is over; the
employees excitement have turned to disappointment as you encounter more and more differences
between their own culture and the new culture. Problems with transportation, unfamiliar foods and the
people who do not speak English now seem overwhelming. Employees at this stage often cope with the
situation by making disparaging remarks about the culture; it is sometimes referred to as the “fight-back”
technique.
In the third stage, the adjustment phase, the employees begin to accept the new culture or they
return home. Employees try new foods and make adjustments in behavior to accommodate the shopping
lines and the long waits for public transportation. They begin to see the humor situations and realize that a
change in attitude toward the host culture will make the stay abroad more rewarding.
In the fourth phase, the acceptance or adaptation phase, employees feel at home in the new culture,
become involved in activities of the culture, cultivate friendships among nationals and feel comfortable in
social situations with people from the host culture. Employees learn language and may adopt the new
culture’s style of doing things.
The final phase is reentry shock, which can be almost as traumatic as the initial adjustment to a
new culture, particularly after an extended stay abroad. Many individuals are shocked at the fact that they
feel the same emotional, psychological, and physiological reactions they did when they entered the new
culture. Reentry shock is experienced on returning to the home country and may follow the stages
identified earlier: initial euphoria, crisis or disenchantment, adjustment and acceptance or adaptation. The
employees would first be happy to be back home but then become disenchanted when it is realized that
the friends are not really interested to hear about overseas experiences , the standard of living goes down,
and the hard earned skills as knowledge foreign language really do not earn bargain power in the
market.
In research conducted by Chaney and Martin (1993), the four types of reentry shock experienced by
college students who had travelled abroad were statistically significant- adjusting to lifestyle, readjusting
to changes in social life, readjusting to changes in standard of living, and reestablishing friendships. Many
repatriates have found that maintaining ties with the home culture cushions the shock associated with
reentry (Dodd, 1977).
Therefore, it is imperative that employers put repatriates into realistic positions upon their return. Some
reentry problems are personal in nature. Many repatriates have changed; they have acquired a broadened
view of the world and have undergone changes in values and attitudes. Because reentry shock is a natural
International Journal of Information, Business and Management, Vol. 8, No.2, 2016
ISSN 2076-9202
109
part of cultural shock, multinational corporations must provide training for repatriates to ensure that the
transition to the home culture is a favorable experience.
Alleviating Cultural Shock
Many multinational firms find that cultural shock can be alleviated by selecting employees for
overseas assignments who possess certain personal and professional qualifications. Employees who have
been given feedback on how they are doing and who have been developed to their maximum potential
will be more satisfied with their assignments. Another method of easing cultural shock is to conduct
training programs for employees prior to overseas deployment (Krapels, 1993).
Selecting Overseas Personnel
Careful selection of employees for overseas assignments is important to enhance the chances for a
successful sojourn. Personal Qualifications needed when working in an unfamiliar culture include
adaptability, flexibility, empathy and tolerance. Good interpersonal and high self-esteem are also
important. Usually, recruiters think that tolerance can be developed but adaptability is difficult to develop;
they prefer, therefore, to hire employees who have already acquired this trait through living abroad (Geber,
1992). Adaptability screening reduces costly turnover. Harvey (1985) suggests some of the use of the
following questions to determine a candidate’s adaptability:
• Is the employee open to the opinions of others?
• Is the employee patient when dealing with problem situations?
• Is the employee resilient when faced with adverse situations?
• How does the employee react to criticism?
• Is the employee cooperative, agreeable and sensitive to others? etc.
The ability to see the environment from the perspective of the host nationals is an indication of empathy.
Benett’s concept of empathy recommends replacing the Golden Rule (do unto others as would have them
do unto self) with the Platinum Rule (do unto others as they would have done unto self). Employees can
still maintain their cultural identity but be able to interpret the new culture through the eyes of the
national (Broome, 1991). An individual success or failure is tried to qualities such as self-efficacy, prior
international experience, age, cross- cultural fluency, interpersonal skills, flexibility, cultural sensitivity
and adaptability. Therefore, Socio-cultural adjustments are helped if the host country people see the
sojourner as a positive rather than a negative addition. Socio-cultural training is very important to the
success of this adaptation (Davis & Krapels, 2005).
Providing Pre departure Training for Host Country
An effective approach to cross-cultural training is to first explore how employees adjust to new
cultures. Learning principles that affect the success of training programs for global managers can be
broken into three steps: Observing and emulating behaviors of employees in the host culture, retaining
what has been learnt and experimenting with the new behavior until it becomes comfortable (Black,
Gregersen & Mendenhall, 1992).
Global educational networks with various universities are being developed to train executives who
are going abroad. Computers are being used to enhance training effectiveness. Computer-aided training or
learning has immense potential for multicultural education because it cuts across traditional language

International Journal of Information, Business and Management, Vol. 8, No.2, 2016
ISSN 2076-9202
110
barriers (Harris et al., 2004).
Approaches to intercultural training may be grouped as follows (Lilian H. Chaney & Jeanette S.
Martin (2008) :
• The intellectual model (Class room model) is based on the belief that cognitive
understanding is necessary for performing effectively on overseas assignment.
• The area training model (Simulation Model) is Centered on the trainee rather than the
trainer that requires the involvement of the trainee in the learning process and emphasizes
problem solving rather than acquiring information.
• The self- awareness model(Human Relations Model) is Based on the assumption that the
trainee will adapt to the new culture better with self-understanding and will therefore be
more effective in the overseas assignment.
• In the cultural awareness mode the Participants recognize their own values to the
contrasting their values with those of other cultures, using a variety of techniques, that
include realistic role playing.
• The interaction approach is Based on participants’ interacting with people in the host
country, either nationals or home country people who have been in the host country for an
extended time (Harris & Moran, 2004)
• The multidimensional approach is Based on the concept that using any single training
approach is not as effective as using an approach that attempts to combine cognitive,
affective and behavioral aspects of training.
Providing Feedback & Rewards
Global Managers need feedback and rewards just as managers in the home culture do. The
appraisal and rewards system is different from the home system because employees in overseas
assignments have to be evaluated and rewarded in a way that takes into account the values of persons in
the host culture and the expectations of the particular assignment. The evaluations criteria must be made
clear. Many companies use a rating team headed by a senior human resources management executive.
Persons who may be involved in the appraisal process include on-site superiors, peer managers,
subordinates, and clients. The team leader might be expected to prepare an appraisal on the global
manager every six months (Black et al., 192). Reward systems used for global managers need to take
consideration the idea of equity- the ratio between what they contribute and what they receive.
Developing Employees to their Maximum Potential
In fact, an estimated 20% of managers leave the firm within a year following repatriation Lilian H.
Chaney & Jeanette S. Martin (2008). The significance of focusing on repatriation becomes clear when the
firm’s investment on creating successful global managers. Plans for successful repatriation adjustment
should begin before the manager leaves the host country; the company should make clear the reason for
the new assignment, what new skills and knowledge will be learnt, and how the employee will contribute
to the company’s development upon his or her return. In addition, human resources department personnel
International Journal of Information, Business and Management, Vol. 8, No.2, 2016
ISSN 2076-9202
111
should begin initial preparations for the manager’s return at least six months prior to repatriation by
providing home country information and contacts. Other recommendations for successful repatriation
include providing appropriate compensation for transition expenses, allowing sufficient time to move and
get settled before reporting to work, assisting in the location of proper housing and showing appreciation
to the entire family for their contributions to the company during their overseas assignment (Black et al.,
1992).
Minimizing Culture Shock
Some people simply do not have the desire, inclination, or temperament for international business.
One very effective way of totally avoiding culture shock is to choose to stay at home rather than enter the
international arena as there may be others who are suited for some foreign cultures. Yet those must live
and work in a foreign culture for a year or two are faced with new ways of behaving, thinking and
communicating. The international businessperson who is most likely to do well abroad is the person who i)
has a realistic understanding of the problems and promises of international business, ii) possesses a
number of important cross-cultural coping skills, and iii) sees the world marketplace as providing vast
opportunities for professional and personal growth. Those who can’t meet these criteria may be so
ill-suited to working in an international business setting that they would be virtually unable to overcome
the more deleterious effects of culture shock.
For those who do select the international business arena, the best single piece of advice for
minimizing culture shock is to be prepared. The more thorough the preparation for an overseas
assignment, the fewer surprises there will be the accumulated negative effect. Understanding the
cultural environment constitutes the cornerstone of the Cognitive Approach. To prepare for an
international business encounter, it really suggests a fourfold approach:
1. General understanding of the concept of culture can provide a fuller appreciation of others
cultures, regardless of where one might be conducting business.
2. A second way of preparing for culture shock is to become familiar with local patterns of
communication, both verbal and non-verbal.
3. It involves a healthy dose of cultural self-awareness.
4. It is important to become familiar with as much specific cultural information as possible about
the country or countries with which one is conducting business.
By conscientiously pursuing these four content areas- the international businessperson will have
touched on the major areas of cultural knowledge, thereby avoiding total alienation and some of the more
debilitating consequences of culture shock.
Some of the Suggestions for reducing culture shock and enhancing the International Business experience
may summarized as follows:
1. Understand that learning about the host culture is a process that continues throughout the stay in
the host culture and beyond.
2. On arrival , become familiar with immediate physical surroundings of new environment
3. Within the first several days of arrival, work on familiarizing with some of the basic, everyday
survival skills that the host take it for granted.

International Journal of Information, Business and Management, Vol. 8, No.2, 2016
ISSN 2076-9202
112
4. As difficult as it may be try to understand host’s culture rather than self.
5. Particularly in the beginning, learn to live with the ambiguity of not having all the answers.
6. Understand that flexibility and resourcefulness are key elements to adapt to a new culture.
7. Don’t lose the sense of humor.
8. Avoid going negative.
9. Be adventurous.
10. Learn how best to manage stress.
Therefore, it is suggested that to be certain, no bottled remedies for culture shock are to be found at
the pharmacy. The anxiety resulting from trying to operate in a different environment is normal. But it is
also important to remain realistic. For whatever reason, some will not become close friends while others,
purely for personal reasons, will not like and vice-versa and some of the things may never be understood.
But once these problems are understood, while real and frustrating, are perfectly normal reactions for any
sojourner, then a begin for solution search may be attempted.
Conclusion
Based on the above discussion the following conceptual model could be concluded for an
effective understanding of the aspects and coping with cultural shock in international business scenario.
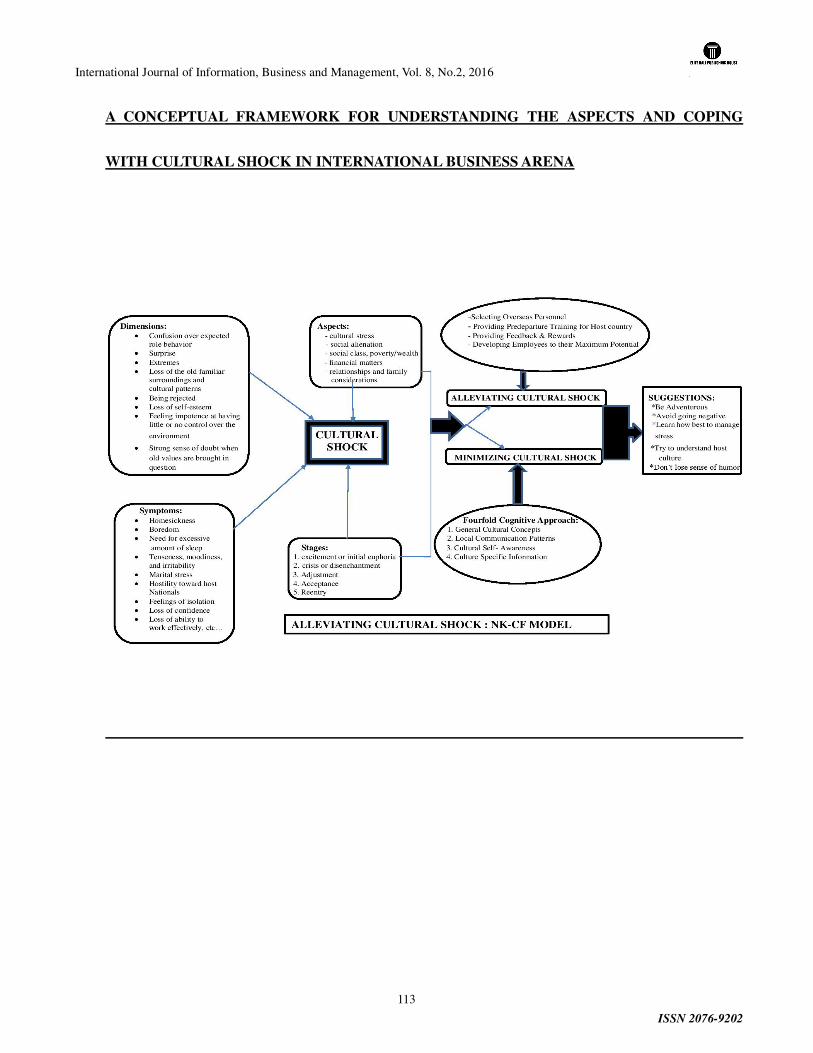
International Journal of Information, Business and Management, Vol. 8, No.2, 2016
ISSN 2076-9202
113
A CONCEPTUAL FRAMEWORK FOR UNDERSTANDING THE ASPECTS AND COPING
WITH CULTURAL SHOCK IN INTERNATIONAL BUSINESS ARENA
International Journal of Information, Business and Management, Vol. 8, No.2, 2016
ISSN 2076-9202
114
REFERENCES
1. Benette, J.M. (1986). Modes of cross-cultural training: Conceptualizing cross-cultural training as education. International Journal of Intercultural Relations, 10, 117-134.
2. Bird, A., & Dunbar, R. (191, Spring). Getting the job done over there: Improving expatriate productivity. National Productivity Review, 145-156.
3. Black, J.S., Gregersen, H.B., & Mendenhal, M.E. (1992). Global assignments: Successfully expatriating and repatriating international managers. San Francisco, CA: Jossey-Bass.
4. Black, J.S., Gregersen. H.B., Mendenhal, M.E., & Stroh, L.K. (1999). Globalizing people through international assignments. Reading. M.A: Addison- Wesley Publishing.
5. Broome, B.J. (1991). Building shared meaning: Implications of a relational approach to empathy for teaching intercultural communication. Communication Education, 40(7), 236-249.
6. Chaney, L.H.,& Martin, J.S.(1993, October). Cultural shock: An intercultural communication problem. Paper presented at the annual convention of the Association for Business Communication, Montreal, Quebec, Canada.
7. Davis, B.,& Krapels R.H.(2005). Culture shock and reverse culture shock: Developing coping skills. In S. O’ Brien (ed.), Communication for a global society, 2005 NBEA Yearbook (pp.115-131). Reston, V A: National Business Education Association.
8. Dodd, C.H. (1997). Dynamics of intercultural communication (5th ed.). New York: McGraw Hill.
9. Fussell, P. (1983). Class. New York: Ballantine.
10. Geber, B. (1992, July). The care and breeding of global managers. Training, 33-37.
11. Harris, P.R., Moran R.T., & Moran, S.V.(2004). Managing cultural differences (6th ed.). Burlington, M.A: Elsevier Butterworth- Heinemann.
12. Harvey, M.G.(1985, Spring). The executive family: An overlooked variable in international assignments. Columbia Journal of World Business, 84-92.
13. Kohls, L.Robert. 1984. Survival kit for overseas living. Chicago: Intercultural Press.
14. Krapels, R.H. (1993). Pre departure intercultural communication preparation provided international business managers and professionals and perceived characteristics of intercultural training needs. Unpublished doctoral dissertation, Memphis State University. Memphis, TN.
15. Marx, Elizabeth. 1999. Breaking through culture shock: What you need to succeed in international business. London: Nicholas Brealey Publishing.

International Journal of Information, Business and Management, Vol. 8, No.2, 2016
ISSN 2076-9202
115
16. Oberg, Kalvero. 1960. Culture Shock: Adjustments to new cultural environments. Practical Anthropology, July-August: 17.
International Journal of Information, Business and Management, Vol. 8, No.2, 2016
ISSN 2076-9202
116
ADOPTION OF ELECTRONIC HUMAN RESOURCES
MANAGEMENT (E-HRM) TECHNOLOGY IN PALESTINE
First received: 2015/11/5; Revised:2016/1/3; Accepted: 2016/2/3
Maha Saleh ([email protected]), Yahya Saleh(1,*) ([email protected])
(1)Industrial Engineering Department, An-Najah National University, Nablus, P.O. Box 7, PALESTINE,
(*)Corresponding author.
Abstract
Electronic human resource management (e-HRM) technology has been an impressive subject in light of
rapid technical progress in this global networking era. Management of human resource in an organization
can work smoothly when e-HRM technology is adopted properly. This study aims to investigate the
factors affecting the adoption of e-HRM technology in the Palestinian service sector. Such investigation
was based on the extension of many models available in the literature, namely, technology acceptance
model (TAM) with theory of planned behavior (TPB), Yale model of communication and persuasion,
perceived risk, social risk and organizations role. To this end, pertinent data from banking, governmental,
health care, insurance, internet providing, logistics, telecommunication and academic organizations
working in Palestine, was gathered via questionnaires and interviews. The analysis of collected data
indicates that perceived ease of use, attitude, intention, and communication are the most significant
factors influencing e-HRM technology adoption in the targeted organizations. On the other hand,
perceived risk, system security, organization’s role, and availability of resources are found to be less
influential factors on e-HRM technology adoption.
Keywords: electronic human resources management (e-HRM) technology, Palestinian service sector,
Technology Acceptance Model, Theory of Planned Behavior, Yale Model.
1. Introduction
The advancement in technological aspects has serious effects on human resource management (HRM)
processes and practices, and is propelling to adopt new strategies in order to improve the development
environment and workflow to reach the goals in a more effective manner. HRM is the management of an
organizations workforce, or human resource; it is responsible for the attraction, selection, training,
assessment, and rewarding of employees. HRM is the most important management function that focuses
on the human element, which is the most precious resource and the most influential on productivity in the
organization. The two important resources in organizations; people and information, can significantly
affect the overall performance of a business and the business success naturally requires the management
of both (Martinsons, 1994; Teo et al., 2007). Therefore, managers must combine these two resources by
International Journal of Information, Business and Management, Vol. 8, No.2, 2016
ISSN 2076-9202
117
adopting new systems which can drive the organization to great success. This stems the need for these
systems due to the great development of technology that could be employed in all areas.
This study is based on three technology adoption models available in literature. More specifically, the first
model is the Technology Acceptance Model (TAM) by Davis et al. (1989). This model presents a theory
of the acceptance and attitude towards Information Technology (IT) systems in general. The second
model is a Theory of Planned Behavior (TPB) which was developed to predict an individual's intention to
engage in a behavior at a specific place and time, and it is based on the Theory of Reasoned Action in
1980. The third model is the Yale Model of Communication and Persuasion developed by Hovland and
his colleagues and constitutes one of the most widely-cited models of communication.
This study aims to investigate factors affecting the adoption of e-HRM technology in the Palestinian
service sector and to develop a model for adopting such an e-HRM technology. The development of the
proposed model is based on the extension of many models available in the literature, namely, technology
acceptance model (TAM) with theory of planned behavior (TPB), Yale model of communication and
persuasion, perceived risk, social risk and organizations role. Within the Palestinian context, pertinent
data from banking, governmental, health care, insurance, internet providing, logistics, telecommunication
and academic (universities) organizations working in Palestine, was gathered via questionnaires and
interviews. The analysis of collected data indicates that perceived ease of use, attitude, intention, and
communication are the most significant factors influencing e-HRM technology adoption in Palestine. On
the other hand, perceived risk, system security, organizations role, and availability of resources are
influencing e-HRM technology adoption in less degree. Based on the findings, Palestinian organizations
should work on formulating new strategies, developing their operational process, introducing services
with high quality, and coordinating with other entities such as Information and Communication
Technology (ICT) companies and government that would be helpful in achieving employees and
managers trust in order to spread e-HRM technology usage among Palestinian organizations.
The rest of the paper is organized as follows. Section 2 presents the pertinent literature review; namely, a
general background on e-HRM technology and its models are presented. Section 3 presents the
hypotheses related to the factors affecting the adoption of e-HRM as well as the proposed model of that.
Section 4 presents the methodology of conducting this study. Section 5 presents the hypotheses and
proposed research model. Section 6 includes the main results and findings of this study. The last section
presents the conclusions.
2. Literature Review
2.1 General Background
Given that various authors published articles related to e-HRM technology and information technology, it
is visible that there are interchangeable terms used to refer to e-HRM technology. For instance Human
Resource Information Systems (HRIS), HR intranet, web-based HR, computer-based human resource
management systems, virtual HR, and HR portals. Several authors argued about internet or web-based
channels as a venture of HRIS (Lengnick-Hall and Morritz, 2003). While some authors preferred to use
the term e-HRM technology over HRIS, many authors agreed that a line cannot be drawn between
International Journal of Information, Business and Management, Vol. 8, No.2, 2016
ISSN 2076-9202
118
IT-based information system for HR and internet-based HR applications as these two are basically doing
similar jobs (Ruel, Magalhaes, and Chiemeke, 2011). Thus, Ruel et al.(2011) defined HRIS as “ all
IT-based information system and application either stand alone or networked, for the human resource
management purpose, utilized for facilitating HR practices, policies or strategies”. The core difference
between HRIS and e-HRM technology is basically that HRIS are direct towards the HR department itself
whereas with e-HRM technology, the target group is not only the HR staff but people outside this
department are also included. Technically speaking, it can be said that e-HRM technology is the technical
unlocking of HRIS for all employees of an organization.
Olivas-Lujan et al. (2007) mentioned that the term e-HR or e-HRM technology was first used in the late
1990s when “e-commerce” was sweeping the business world. In the literature, e-HR is used
interchangeably with virtual HRM, HR intranet, web-based HR, computer-based human resource
management systems (CHRIS), and HR portals (Ruel et al., 2007). According to Voermans and
Veldhoven (2007), e-HRM technology could be narrowly defined as the administrative support of the HR
function in organizations by using Internet technology. Ruel et al. (2007, 2011) defined e-HRM
technology as a way of implementing HR strategies, policies, and practices in organizations through a
conscious and directed support and/or with the full use of web-technology-based channels.
The importance of e-HRM technology is derived from the importance of technology in different areas of
work. Surveys of HR consultants suggest that both the number of organizations adopting e-HRM
technology and the depth of applications within the organizations are continually increasing (Crestone,
2007). This increase in adopting new technologies in different companies is a great guide on the
importance and multi-benefits of it. In addition, an escalating number of practitioner reports provides a
strong evidence that e-HRM technology is becoming increasingly common and must lead to remarkable
changes and support for competitive advantage. In addition, they are increasingly using these systems to
determine employee needs, deliver training, manage employee performance, and administer
compensation and benefit systems plus evaluation systems (Strohmeier, 2007).
To date, research has suggested that e-HR systems typically increase the efficiency of all HR processes
and procedures, reduce administrative costs, and decrease transaction times (e.g., the time of recruitment,
time to replace employees) (Gueutal and Stone, 2005). On the other hand, connecting e-HRM technology
and strategic decision making improves organizational performance. Based on data of more than 19,000
organizations, Liu et al. (2007) showed that HRM has a significant added-value in terms of influencing an
organizations performance. Also, it shows that the importance of strategic decision making and the
added-value of HRM were strongest when HRM decisions were related to strategy.
In fact, the role of information technology (IT) systems in human resources (HR) function primarily
seeks to provide support at an administrative level, while IT support for strategic purposes is lacking
(Strohmeier, 2007). Although electronic applications (e-HRM technology) are being used in various
disciplines of HRM such as recruitment (Stone et al., 2003), selection (Chapman and Webster, 2003),
performance management and payroll administration (Teo et al., 2001), organizations do not yet realize
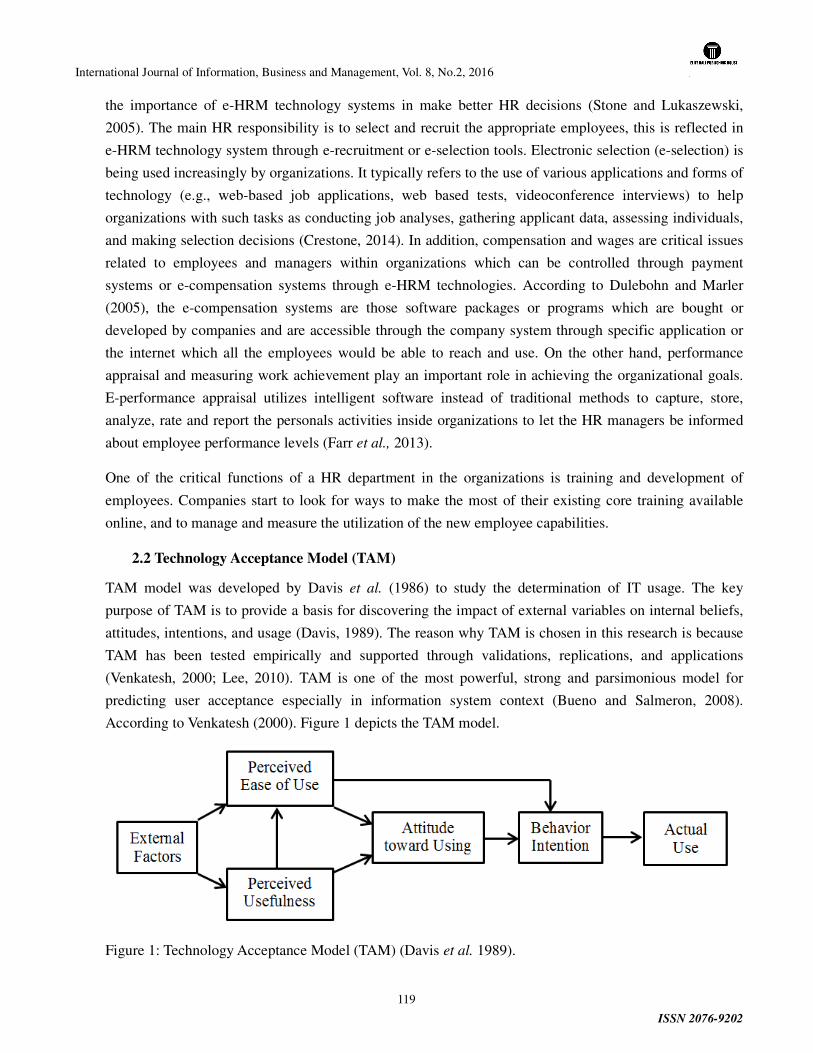
International Journal of Information, Business and Management, Vol. 8, No.2, 2016
ISSN 2076-9202
119
the importance of e-HRM technology systems in make better HR decisions (Stone and Lukaszewski,
2005). The main HR responsibility is to select and recruit the appropriate employees, this is reflected in
e-HRM technology system through e-recruitment or e-selection tools. Electronic selection (e-selection) is
being used increasingly by organizations. It typically refers to the use of various applications and forms of
technology (e.g., web-based job applications, web based tests, videoconference interviews) to help
organizations with such tasks as conducting job analyses, gathering applicant data, assessing individuals,
and making selection decisions (Crestone, 2014). In addition, compensation and wages are critical issues
related to employees and managers within organizations which can be controlled through payment
systems or e-compensation systems through e-HRM technologies. According to Dulebohn and Marler
(2005), the e-compensation systems are those software packages or programs which are bought or
developed by companies and are accessible through the company system through specific application or
the internet which all the employees would be able to reach and use. On the other hand, performance
appraisal and measuring work achievement play an important role in achieving the organizational goals.
E-performance appraisal utilizes intelligent software instead of traditional methods to capture, store,
analyze, rate and report the personals activities inside organizations to let the HR managers be informed
about employee performance levels (Farr et al., 2013).
One of the critical functions of a HR department in the organizations is training and development of
employees. Companies start to look for ways to make the most of their existing core training available
online, and to manage and measure the utilization of the new employee capabilities.
2.2 Technology Acceptance Model (TAM)
TAM model was developed by Davis et al. (1986) to study the determination of IT usage. The key
purpose of TAM is to provide a basis for discovering the impact of external variables on internal beliefs,
attitudes, intentions, and usage (Davis, 1989). The reason why TAM is chosen in this research is because
TAM has been tested empirically and supported through validations, replications, and applications
(Venkatesh, 2000; Lee, 2010). TAM is one of the most powerful, strong and parsimonious model for
predicting user acceptance especially in information system context (Bueno and Salmeron, 2008).
According to Venkatesh (2000). Figure 1 depicts the TAM model.
Figure 1: Technology Acceptance Model (TAM) (Davis et al. 1989).
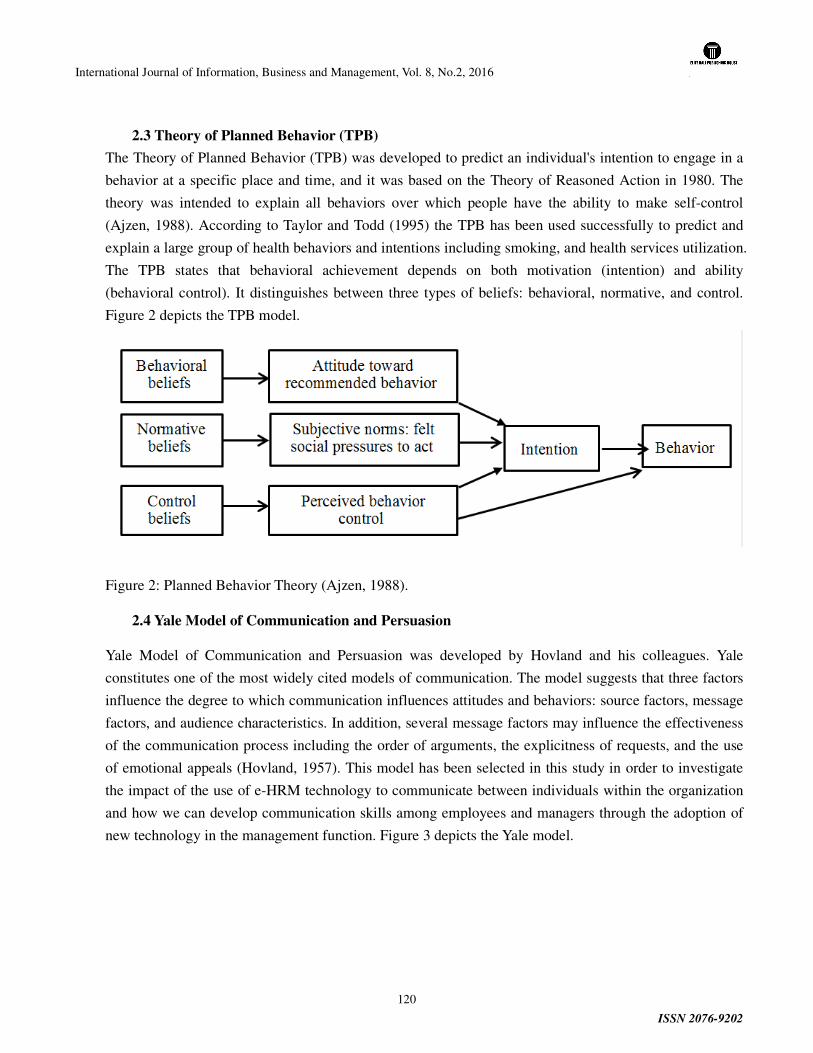
International Journal of Information, Business and Management, Vol. 8, No.2, 2016
ISSN 2076-9202
120
2.3 Theory of Planned Behavior (TPB)
The Theory of Planned Behavior (TPB) was developed to predict an individual's intention to engage in a
behavior at a specific place and time, and it was based on the Theory of Reasoned Action in 1980. The
theory was intended to explain all behaviors over which people have the ability to make self-control
(Ajzen, 1988). According to Taylor and Todd (1995) the TPB has been used successfully to predict and
explain a large group of health behaviors and intentions including smoking, and health services utilization.
The TPB states that behavioral achievement depends on both motivation (intention) and ability
(behavioral control). It distinguishes between three types of beliefs: behavioral, normative, and control.
Figure 2 depicts the TPB model.
Figure 2: Planned Behavior Theory (Ajzen, 1988).
2.4 Yale Model of Communication and Persuasion
Yale Model of Communication and Persuasion was developed by Hovland and his colleagues. Yale
constitutes one of the most widely cited models of communication. The model suggests that three factors
influence the degree to which communication influences attitudes and behaviors: source factors, message
factors, and audience characteristics. In addition, several message factors may influence the effectiveness
of the communication process including the order of arguments, the explicitness of requests, and the use
of emotional appeals (Hovland, 1957). This model has been selected in this study in order to investigate
the impact of the use of e-HRM technology to communicate between individuals within the organization
and how we can develop communication skills among employees and managers through the adoption of
new technology in the management function. Figure 3 depicts the Yale model.
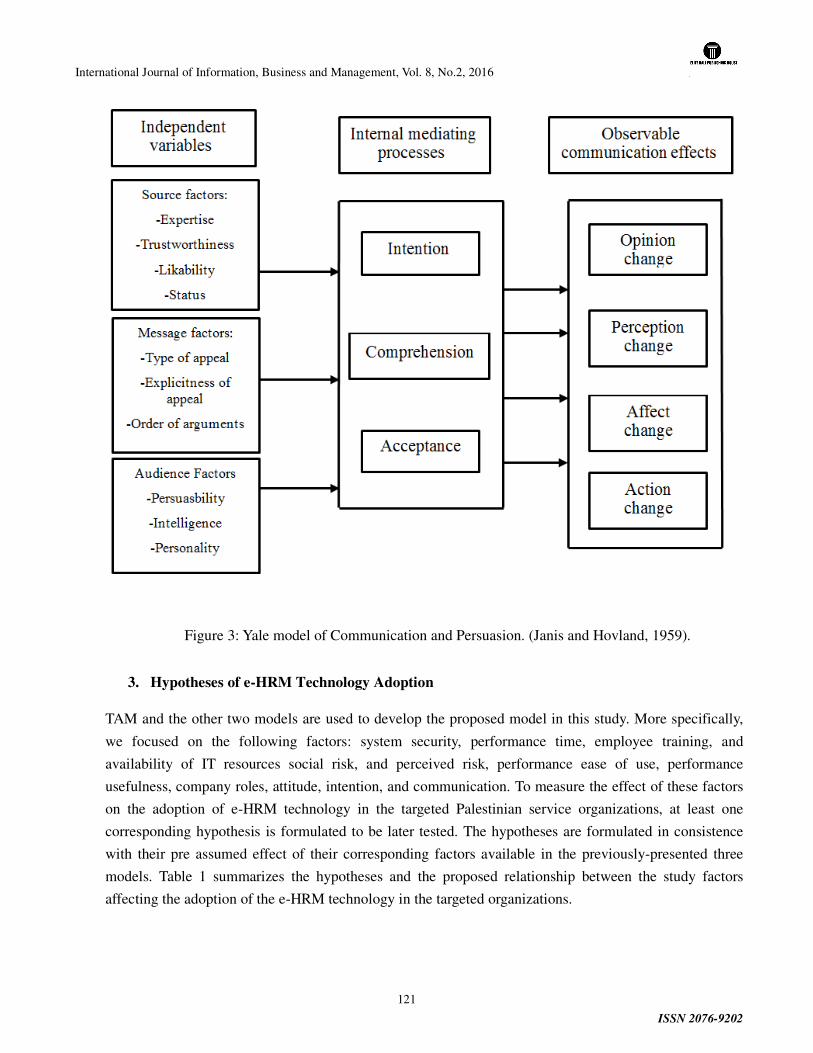
International Journal of Information, Business and Management, Vol. 8, No.2, 2016
ISSN 2076-9202
121
Figure 3: Yale model of Communication and Persuasion. (Janis and Hovland, 1959).
3. Hypotheses of e-HRM Technology Adoption
TAM and the other two models are used to develop the proposed model in this study. More specifically,
we focused on the following factors: system security, performance time, employee training, and
availability of IT resources social risk, and perceived risk, performance ease of use, performance
usefulness, company roles, attitude, intention, and communication. To measure the effect of these factors
on the adoption of e-HRM technology in the targeted Palestinian service organizations, at least one
corresponding hypothesis is formulated to be later tested. The hypotheses are formulated in consistence
with their pre assumed effect of their corresponding factors available in the previously-presented three
models. Table 1 summarizes the hypotheses and the proposed relationship between the study factors
affecting the adoption of the e-HRM technology in the targeted organizations.
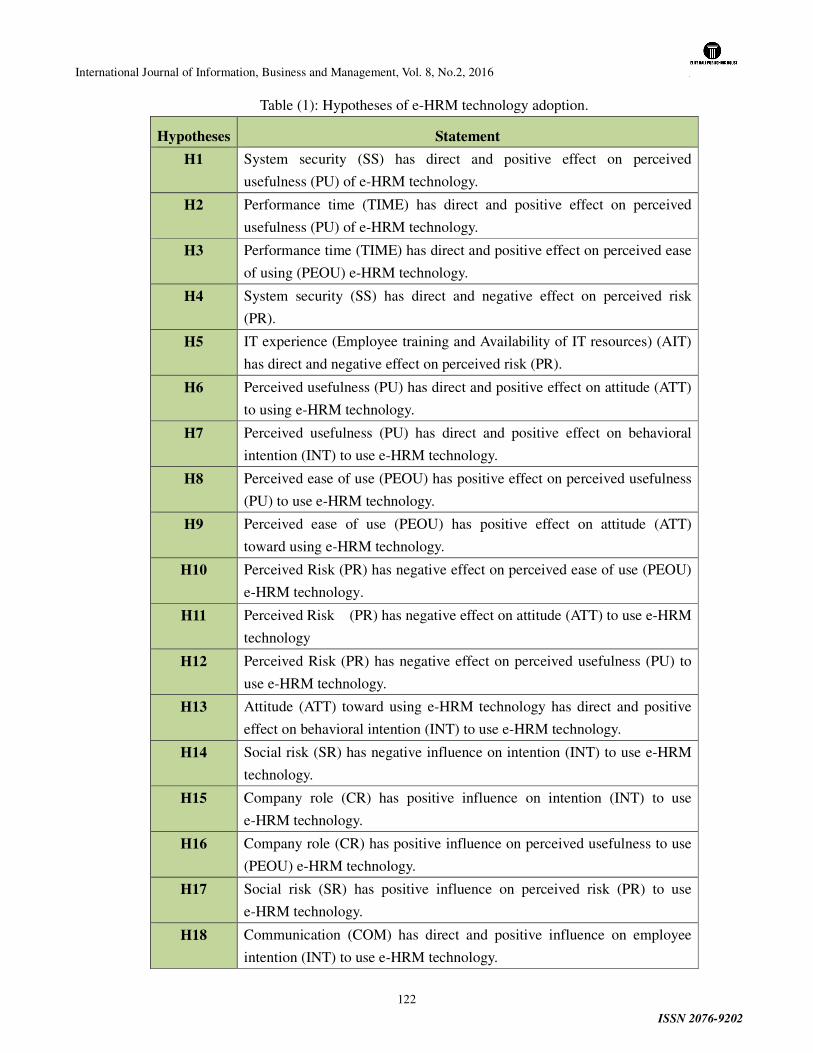
International Journal of Information, Business and Management, Vol. 8, No.2, 2016
ISSN 2076-9202
122
Table (1): Hypotheses of e-HRM technology adoption.
Hypotheses Statement
H1 System security (SS) has direct and positive effect on perceived
usefulness (PU) of e-HRM technology.
H2 Performance time (TIME) has direct and positive effect on perceived
usefulness (PU) of e-HRM technology.
H3 Performance time (TIME) has direct and positive effect on perceived ease
of using (PEOU) e-HRM technology.
H4 System security (SS) has direct and negative effect on perceived risk
(PR).
H5 IT experience (Employee training and Availability of IT resources) (AIT)
has direct and negative effect on perceived risk (PR).
H6 Perceived usefulness (PU) has direct and positive effect on attitude (ATT)
to using e-HRM technology.
H7 Perceived usefulness (PU) has direct and positive effect on behavioral
intention (INT) to use e-HRM technology.
H8 Perceived ease of use (PEOU) has positive effect on perceived usefulness
(PU) to use e-HRM technology.
H9 Perceived ease of use (PEOU) has positive effect on attitude (ATT)
toward using e-HRM technology.
H10 Perceived Risk (PR) has negative effect on perceived ease of use (PEOU)
e-HRM technology.
H11 Perceived Risk (PR) has negative effect on attitude (ATT) to use e-HRM
technology
H12 Perceived Risk (PR) has negative effect on perceived usefulness (PU) to
use e-HRM technology.
H13 Attitude (ATT) toward using e-HRM technology has direct and positive
effect on behavioral intention (INT) to use e-HRM technology.
H14 Social risk (SR) has negative influence on intention (INT) to use e-HRM
technology.
H15 Company role (CR) has positive influence on intention (INT) to use
e-HRM technology.
H16 Company role (CR) has positive influence on perceived usefulness to use
(PEOU) e-HRM technology.
H17 Social risk (SR) has positive influence on perceived risk (PR) to use
e-HRM technology.
H18 Communication (COM) has direct and positive influence on employee
intention (INT) to use e-HRM technology.
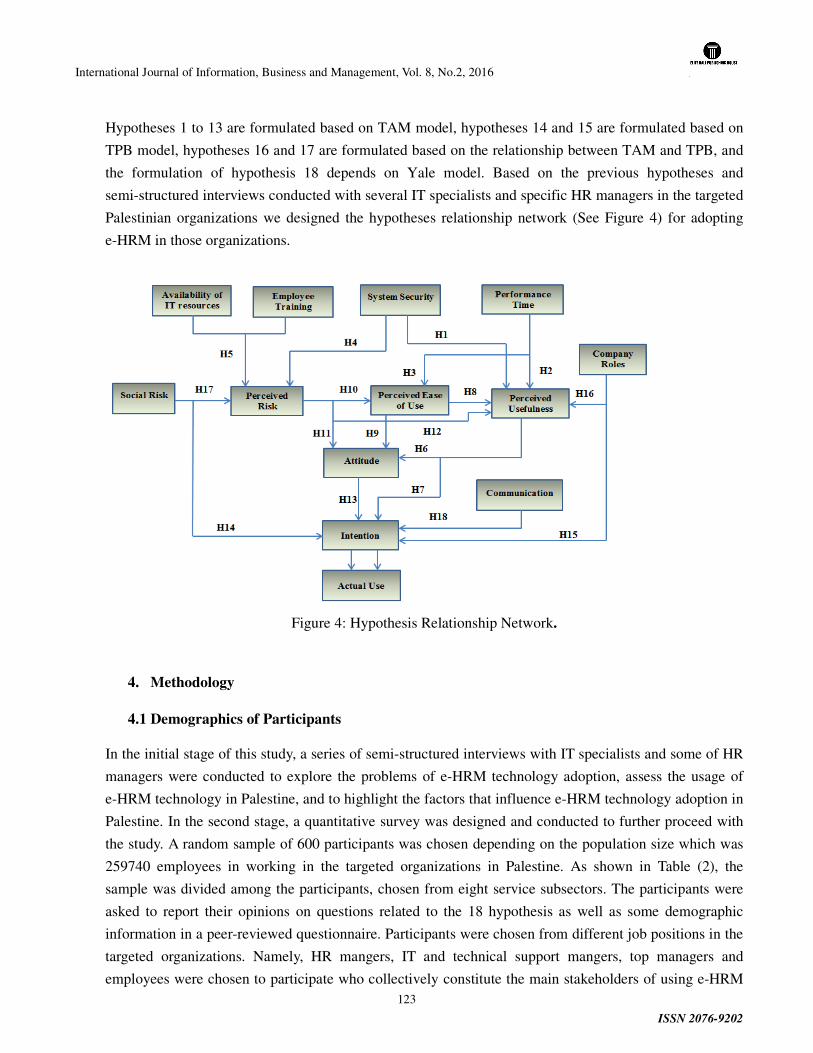
International Journal of Information, Business and Management, Vol. 8, No.2, 2016
ISSN 2076-9202
123
Hypotheses 1 to 13 are formulated based on TAM model, hypotheses 14 and 15 are formulated based on
TPB model, hypotheses 16 and 17 are formulated based on the relationship between TAM and TPB, and
the formulation of hypothesis 18 depends on Yale model. Based on the previous hypotheses and
semi-structured interviews conducted with several IT specialists and specific HR managers in the targeted
Palestinian organizations we designed the hypotheses relationship network (See Figure 4) for adopting
e-HRM in those organizations.
Figure 4: Hypothesis Relationship Network.
4. Methodology
4.1 Demographics of Participants
In the initial stage of this study, a series of semi-structured interviews with IT specialists and some of HR
managers were conducted to explore the problems of e-HRM technology adoption, assess the usage of
e-HRM technology in Palestine, and to highlight the factors that influence e-HRM technology adoption in
Palestine. In the second stage, a quantitative survey was designed and conducted to further proceed with
the study. A random sample of 600 participants was chosen depending on the population size which was
259740 employees in working in the targeted organizations in Palestine. As shown in Table (2), the
sample was divided among the participants, chosen from eight service subsectors. The participants were
asked to report their opinions on questions related to the 18 hypothesis as well as some demographic
information in a peer-reviewed questionnaire. Participants were chosen from different job positions in the
targeted organizations. Namely, HR mangers, IT and technical support mangers, top managers and
employees were chosen to participate who collectively constitute the main stakeholders of using e-HRM
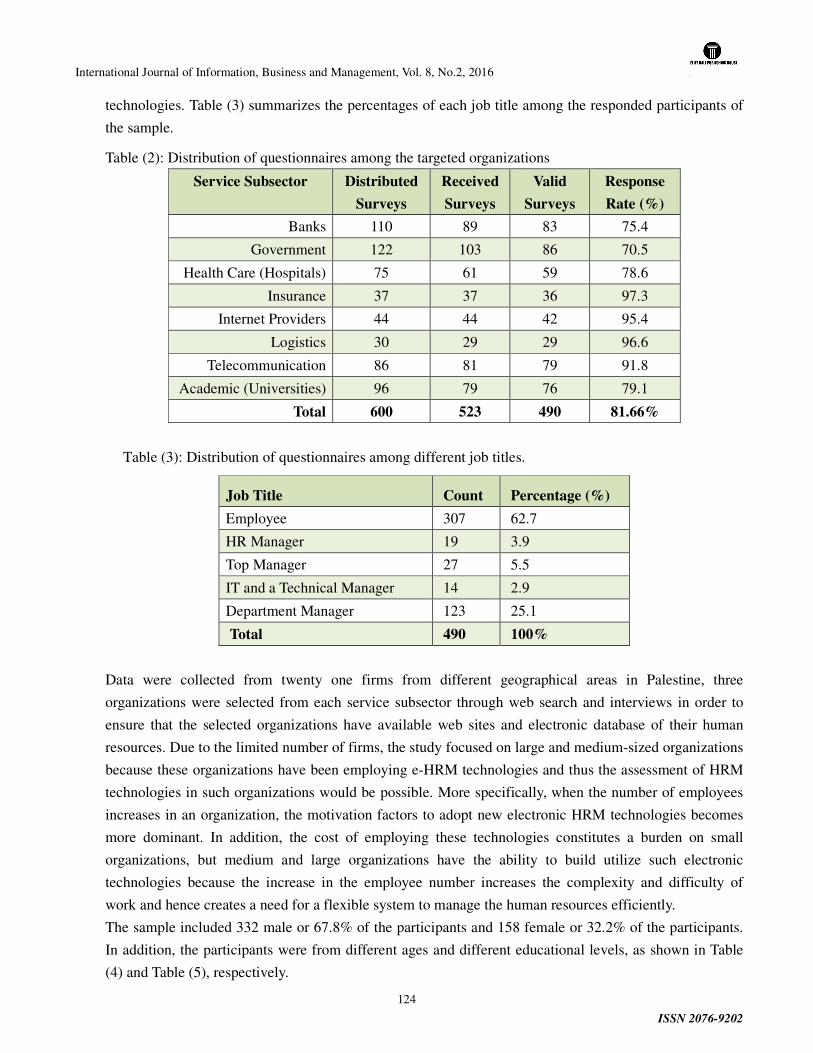
International Journal of Information, Business and Management, Vol. 8, No.2, 2016
ISSN 2076-9202
124
technologies. Table (3) summarizes the percentages of each job title among the responded participants of
the sample.
Table (2): Distribution of questionnaires among the targeted organizations
Service Subsector Distributed
Surveys
Received
Surveys
Valid
Surveys
Response
Rate (%)
Banks 110 89 83 75.4
Government 122 103 86 70.5
Health Care (Hospitals) 75 61 59 78.6
Insurance 37 37 36 97.3
Internet Providers 44 44 42 95.4
Logistics 30 29 29 96.6
Telecommunication 86 81 79 91.8
Academic (Universities) 96 79 76 79.1
Total 600 523 490 81.66%
Table (3): Distribution of questionnaires among different job titles.
Job Title Count Percentage (%)
Employee 307 62.7
HR Manager 19 3.9
Top Manager 27 5.5
IT and a Technical Manager 14 2.9
Department Manager 123 25.1
Total 490 100%
Data were collected from twenty one firms from different geographical areas in Palestine, three
organizations were selected from each service subsector through web search and interviews in order to
ensure that the selected organizations have available web sites and electronic database of their human
resources. Due to the limited number of firms, the study focused on large and medium-sized organizations
because these organizations have been employing e-HRM technologies and thus the assessment of HRM
technologies in such organizations would be possible. More specifically, when the number of employees
increases in an organization, the motivation factors to adopt new electronic HRM technologies becomes
more dominant. In addition, the cost of employing these technologies constitutes a burden on small
organizations, but medium and large organizations have the ability to build utilize such electronic
technologies because the increase in the employee number increases the complexity and difficulty of
work and hence creates a need for a flexible system to manage the human resources efficiently.
The sample included 332 male or 67.8% of the participants and 158 female or 32.2% of the participants.
In addition, the participants were from different ages and different educational levels, as shown in Table
(4) and Table (5), respectively.
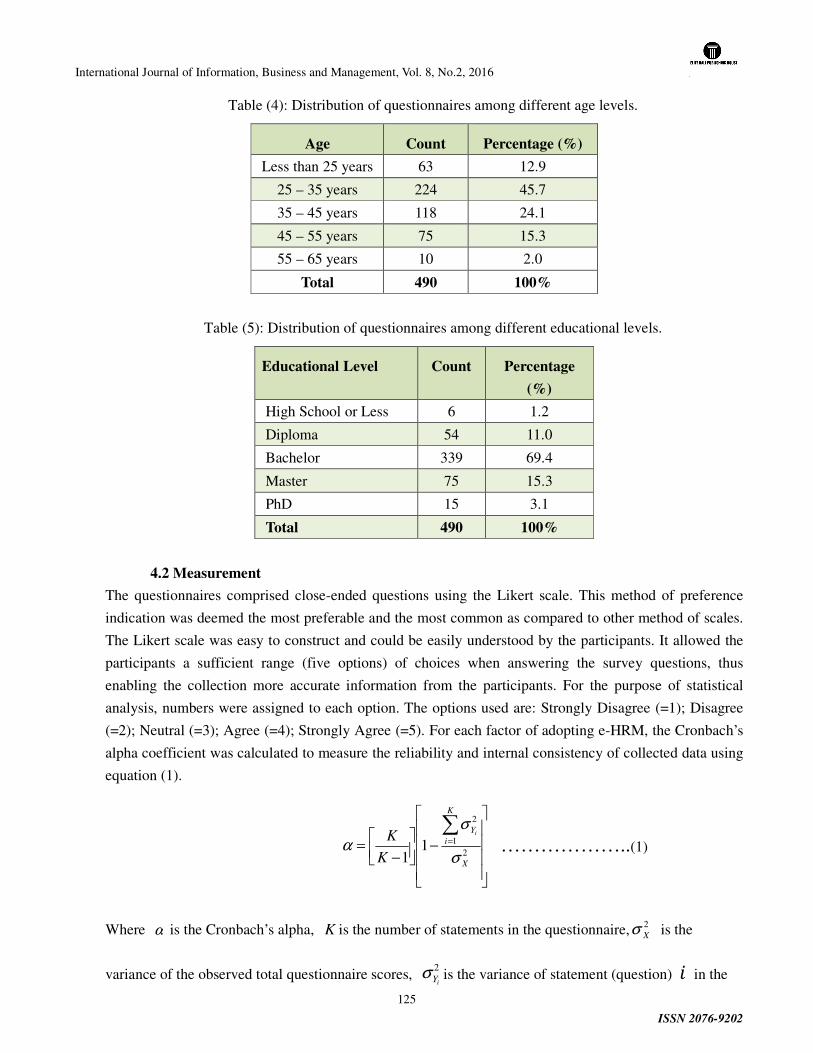
International Journal of Information, Business and Management, Vol. 8, No.2, 2016
ISSN 2076-9202
125
Table (4): Distribution of questionnaires among different age levels.
Age Count Percentage (%)
Less than 25 years 63 12.9
25 – 35 years 224 45.7
35 – 45 years 118 24.1
45 – 55 years 75 15.3
55 – 65 years 10 2.0
Total 490 100%
Table (5): Distribution of questionnaires among different educational levels.
Educational Level Count Percentage
(%)
High School or Less 6 1.2
Diploma 54 11.0
Bachelor 339 69.4
Master 75 15.3
PhD 15 3.1
Total 490 100%
4.2 Measurement
The questionnaires comprised close-ended questions using the Likert scale. This method of preference
indication was deemed the most preferable and the most common as compared to other method of scales.
The Likert scale was easy to construct and could be easily understood by the participants. It allowed the
participants a sufficient range (five options) of choices when answering the survey questions, thus
enabling the collection more accurate information from the participants. For the purpose of statistical
analysis, numbers were assigned to each option. The options used are: Strongly Disagree (=1); Disagree
(=2); Neutral (=3); Agree (=4); Strongly Agree (=5). For each factor of adopting e-HRM, the Cronbach’s
alpha coefficient was calculated to measure the reliability and internal consistency of collected data using
equation (1).
−
−=
∑=
21
2
11
X
K
i
Yi
K
K
σ
σ
α ………………..(1)
Where α is the Cronbach’s alpha, K is the number of statements in the questionnaire, 2Xσ is the
variance of the observed total questionnaire scores, 2
iYσ is the variance of statement (question) � in the
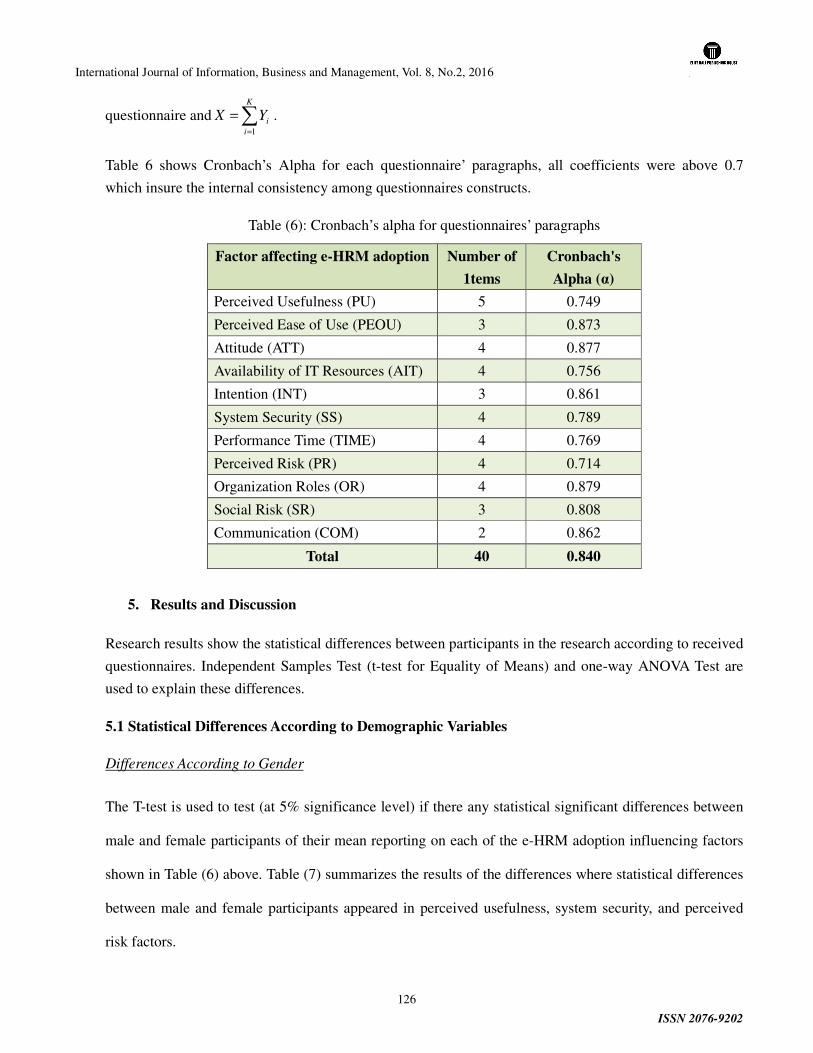
International Journal of Information, Business and Management, Vol. 8, No.2, 2016
ISSN 2076-9202
126
questionnaire and ∑=
=K
i
iYX1
.
Table 6 shows Cronbach’s Alpha for each questionnaire’ paragraphs, all coefficients were above 0.7
which insure the internal consistency among questionnaires constructs.
Table (6): Cronbach’s alpha for questionnaires’ paragraphs
Factor affecting e-HRM adoption Number of
1tems
Cronbach's
Alpha (α)
Perceived Usefulness (PU) 5 0.749
Perceived Ease of Use (PEOU) 3 0.873
Attitude (ATT) 4 0.877
Availability of IT Resources (AIT) 4 0.756
Intention (INT) 3 0.861
System Security (SS) 4 0.789
Performance Time (TIME) 4 0.769
Perceived Risk (PR) 4 0.714
Organization Roles (OR) 4 0.879
Social Risk (SR) 3 0.808
Communication (COM) 2 0.862
Total 40 0.840
5. Results and Discussion
Research results show the statistical differences between participants in the research according to received
questionnaires. Independent Samples Test (t-test for Equality of Means) and one-way ANOVA Test are
used to explain these differences.
5.1 Statistical Differences According to Demographic Variables
Differences According to Gender
The T-test is used to test (at 5% significance level) if there any statistical significant differences between
male and female participants of their mean reporting on each of the e-HRM adoption influencing factors
shown in Table (6) above. Table (7) summarizes the results of the differences where statistical differences
between male and female participants appeared in perceived usefulness, system security, and perceived
risk factors.
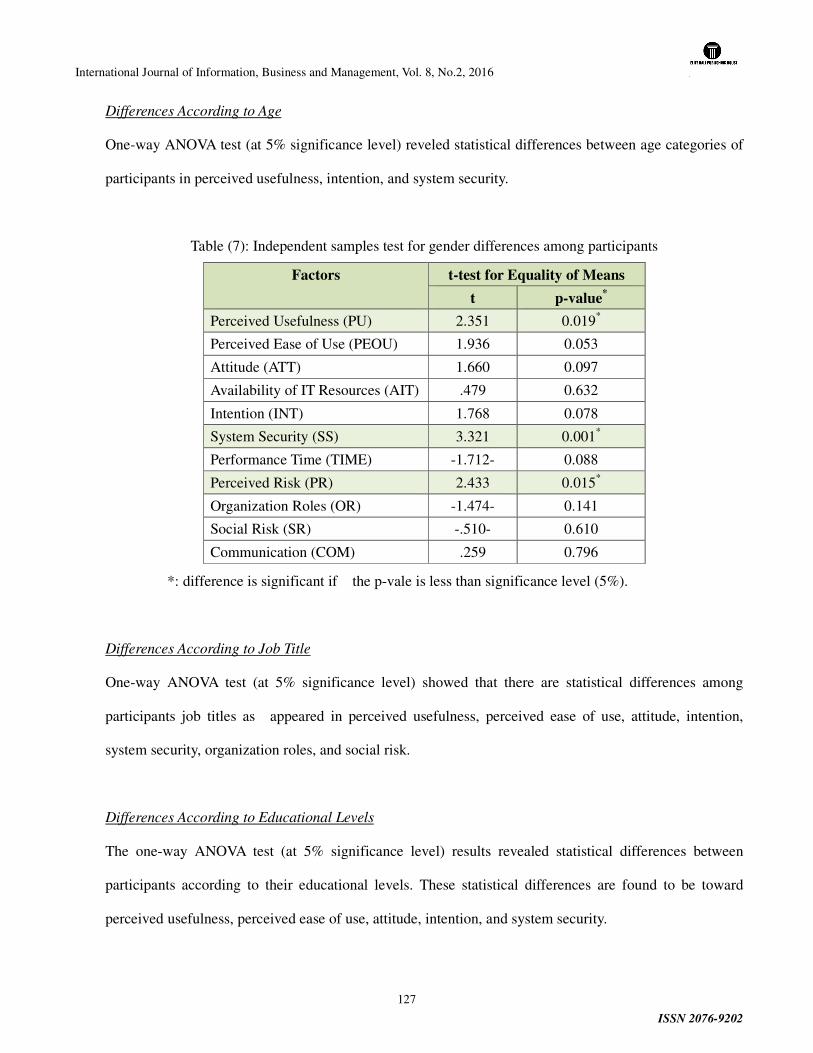
International Journal of Information, Business and Management, Vol. 8, No.2, 2016
ISSN 2076-9202
127
Differences According to Age
One-way ANOVA test (at 5% significance level) reveled statistical differences between age categories of
participants in perceived usefulness, intention, and system security.
Table (7): Independent samples test for gender differences among participants
Factors t-test for Equality of Means
t p-value*
Perceived Usefulness (PU) 2.351 0.019*
Perceived Ease of Use (PEOU) 1.936 0.053
Attitude (ATT) 1.660 0.097
Availability of IT Resources (AIT) .479 0.632
Intention (INT) 1.768 0.078
System Security (SS) 3.321 0.001*
Performance Time (TIME) -1.712- 0.088
Perceived Risk (PR) 2.433 0.015*
Organization Roles (OR) -1.474- 0.141
Social Risk (SR) -.510- 0.610
Communication (COM) .259 0.796
*: difference is significant if the p-vale is less than significance level (5%).
Differences According to Job Title
One-way ANOVA test (at 5% significance level) showed that there are statistical differences among
participants job titles as appeared in perceived usefulness, perceived ease of use, attitude, intention,
system security, organization roles, and social risk.
Differences According to Educational Levels
The one-way ANOVA test (at 5% significance level) results revealed statistical differences between
participants according to their educational levels. These statistical differences are found to be toward
perceived usefulness, perceived ease of use, attitude, intention, and system security.

International Journal of Information, Business and Management, Vol. 8, No.2, 2016
ISSN 2076-9202
128
5.2 Hypotheses Testing Results
To test the research hypotheses Pearson Correlation was used. Tables (8) shows the significant values
between all factors affecting the adoption of e-HRM. Based on Pearson Correlation statistical analysis
shown in Table (8), the results of hypotheses show that all hypotheses have been accepted except H5.
Depending on the statistical analysis between the relationship of the factors the, results show that
statistical differences are found (P< 0.05) for all hypotheses accepted for H5 (P> 0.05).
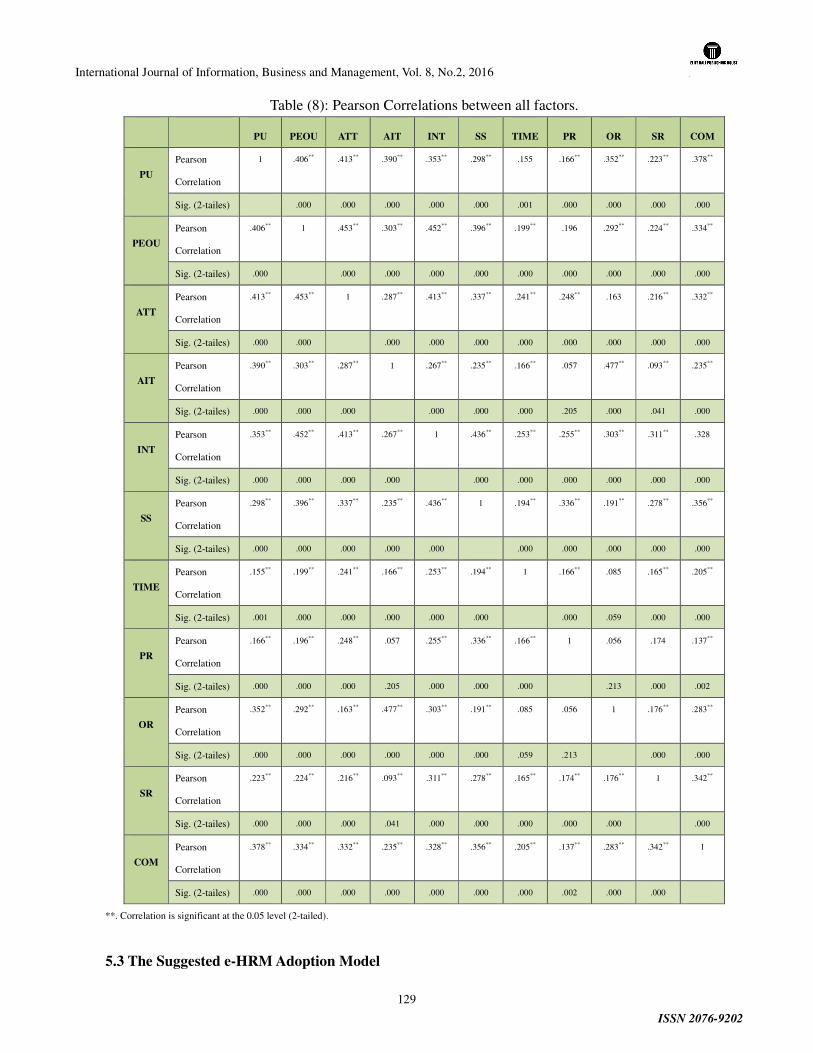
International Journal of Information, Business and Management, Vol. 8, No.2, 2016
ISSN 2076-9202
129
Table (8): Pearson Correlations between all factors.
**. Correlation is significant at the 0.05 level (2-tailed).
5.3 The Suggested e-HRM Adoption Model
PU PEOU ATT AIT INT SS TIME PR OR SR COM
PU
Pearson
Correlation
1 .406** .413** .390** .353** .298** .155 .166** .352** .223** .378**
Sig. (2-tailes) .000 .000 .000 .000 .000 .001 .000 .000 .000 .000
PEOU
Pearson
Correlation
.406** 1 .453** .303** .452** .396** .199** .196 .292** .224** .334**
Sig. (2-tailes) .000 .000 .000 .000 .000 .000 .000 .000 .000 .000
ATT
Pearson
Correlation
.413** .453** 1 .287** .413** .337** .241** .248** .163 .216** .332**
Sig. (2-tailes) .000 .000 .000 .000 .000 .000 .000 .000 .000 .000
AIT
Pearson
Correlation
.390** .303** .287** 1 .267** .235** .166** .057 .477** .093** .235**
Sig. (2-tailes) .000 .000 .000 .000 .000 .000 .205 .000 .041 .000
INT
Pearson
Correlation
.353** .452** .413** .267** 1 .436** .253** .255** .303** .311** .328
Sig. (2-tailes) .000 .000 .000 .000 .000 .000 .000 .000 .000 .000
SS
Pearson
Correlation
.298** .396** .337** .235** .436** 1 .194** .336** .191** .278** .356**
Sig. (2-tailes) .000 .000 .000 .000 .000 .000 .000 .000 .000 .000
TIME
Pearson
Correlation
.155** .199** .241** .166** .253** .194** 1 .166** .085 .165** .205**
Sig. (2-tailes) .001 .000 .000 .000 .000 .000 .000 .059 .000 .000
PR
Pearson
Correlation
.166** .196** .248** .057 .255** .336** .166** 1 .056 .174 .137**
Sig. (2-tailes) .000 .000 .000 .205 .000 .000 .000 .213 .000 .002
OR
Pearson
Correlation
.352** .292** .163** .477** .303** .191** .085 .056 1 .176** .283**
Sig. (2-tailes) .000 .000 .000 .000 .000 .000 .059 .213 .000 .000
SR
Pearson
Correlation
.223** .224** .216** .093** .311** .278** .165** .174** .176** 1 .342**
Sig. (2-tailes) .000 .000 .000 .041 .000 .000 .000 .000 .000 .000
COM
Pearson
Correlation
.378** .334** .332** .235** .328** .356** .205** .137** .283** .342** 1
Sig. (2-tailes) .000 .000 .000 .000 .000 .000 .000 .002 .000 .000

International Journal of Information, Business and Management, Vol. 8, No.2, 2016
ISSN 2076-9202
130
Next, we build the e-HRM technology adoption model depending on hypotheses results. Table (9) shows
the supported hypotheses that have been accepted and being adopted by the research model. In addition, a
new relationship appeared between the intention to use e-HRM technology and the level of system
security. This new relationship illustrates the importance of the existence of a link between the intention
of employees to use e-HRM technology and the level of the system security. More specifically, when the
level of system security increases, employees will be more motivated to adopt the e-HRM system and use
it. This relationship has not been noted in the previous studies in literature but the statistical differences in
our study proved the existence of this relationship because (P< 0.05) between this two factor. Therefore,
our research model includes this new relationship in addition to the previous relations which are proven
through hypotheses as well as in previous studies in literature.
Table (9): Correlations between factors affecting e-HRM system
Perceive
d
Usefulne
ss (PU)
Perceiv
ed
Ease of
Use
(PEOU
)
Attitud
e (ATT)
Intentio
n (INT)
Perceive
d Risk
(PR)
Organizati
on Roles
(OR)
Perceived
Usefulness (PU)
H6 * H7 *
Perceived Ease of
Use (PEOU)
H8 * H9 * H--
Attitude (ATT) H13 *
Availability of IT
resources (AIT)
H5 H--
System security
(SS)
H1 * H-- H4 *
Time (TIME) H2 * H3 *
Perceived risk
(PR)
H12 * H10 * H11 *
Company roles
(CR)
H16 * H15 *
Social risk (SR) H14 * H17 *
Communication
(COM)
H18 *
*: Supported hypothesis. H--: Strong relationship.
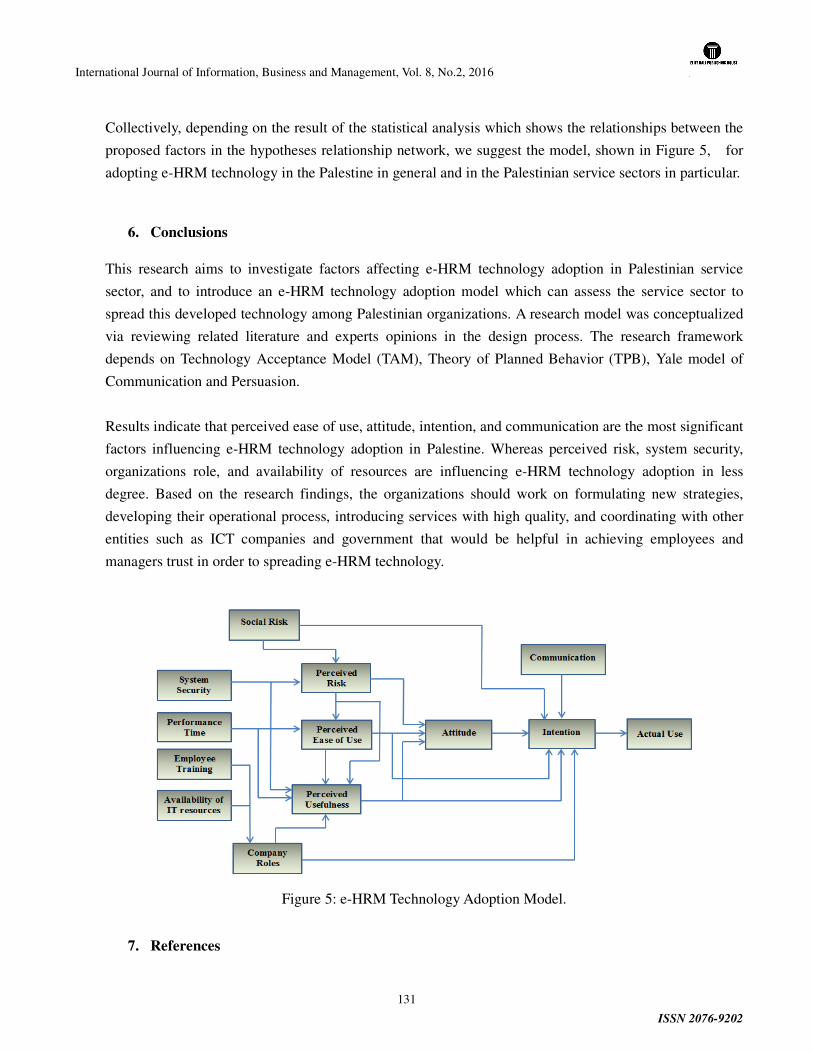
International Journal of Information, Business and Management, Vol. 8, No.2, 2016
ISSN 2076-9202
131
Collectively, depending on the result of the statistical analysis which shows the relationships between the
proposed factors in the hypotheses relationship network, we suggest the model, shown in Figure 5, for
adopting e-HRM technology in the Palestine in general and in the Palestinian service sectors in particular.
6. Conclusions
This research aims to investigate factors affecting e-HRM technology adoption in Palestinian service
sector, and to introduce an e-HRM technology adoption model which can assess the service sector to
spread this developed technology among Palestinian organizations. A research model was conceptualized
via reviewing related literature and experts opinions in the design process. The research framework
depends on Technology Acceptance Model (TAM), Theory of Planned Behavior (TPB), Yale model of
Communication and Persuasion.
Results indicate that perceived ease of use, attitude, intention, and communication are the most significant
factors influencing e-HRM technology adoption in Palestine. Whereas perceived risk, system security,
organizations role, and availability of resources are influencing e-HRM technology adoption in less
degree. Based on the research findings, the organizations should work on formulating new strategies,
developing their operational process, introducing services with high quality, and coordinating with other
entities such as ICT companies and government that would be helpful in achieving employees and
managers trust in order to spreading e-HRM technology.
Figure 5: e-HRM Technology Adoption Model.
7. References
International Journal of Information, Business and Management, Vol. 8, No.2, 2016
ISSN 2076-9202
132
1. Ajzen, I.: “The Theory of Planned Behaviour”, Organizational Behavior and Human Decision Processes, 50, 2, 1991/ 179-211.
2. Ajzen, I.: Attitudes, personality and behavior, Milton Keynes: Open University Press. 1988.
3. Bueno, S., Salmeron, J., L.:” TAM-based success modeling in ERP”, Interact. Comp. 20, 6, 2008/ 515 – 523.
4. CedarCrestone, “HR technologies, service delivery approaches, and metrics”, Available at www.cedarcrestone.com/ research.php. Retrieved Feb, 2014.
5. Chapman, D. S., &Webster, J.:” The use of technologies in the recruiting, screening, and
selection processes for job candidates”, International Journal of Selection and Assessment, 11, 2003/ 113−120.
6. Davis, F. D., Bagozzi, R. P., & Warshaw, P. R.: “User acceptance of computer technology: a
comparison of two theoretical models”, Management Science, 35, 8, 1989/ 982-1003.
7. Davis, F. D.: “Perceived usefulness, perceived ease of use, and user acceptance of information
technology”, MIS Quarterly, 13, 3, 1989/319-340.
8. Davis, F.D.: A Technology Acceptance Model for empirically testing new end-user
information systems: theory and results, Doctoral Dissertation Thesis. 1986.
9. Dulebohn J. H. and Marler J. H.:” e-Compensation the Potential to Transform Practice”. The
Brave New World of eHR: Human Resources Management in the Digital Age, San Francisco: Jossey Bass. 2005/ 166-189.
10. Elizabeth T. Welsh, Connie R. Wanberg, Kenneth G. Brown and Marcia J. Simmering.:’’ E-learning: emerging uses, empirical results and future directions”, International Journal of
Training and Development, Volume 7, pages 245–258, December 200.
11. Farr J. L., Fairchild J., and Cassidy S. E., Technology and Performance Appraisal. The Psychology of Workplace Technology (eBook), East sussex: Routledge, 2013.
12. Gueutal, H. G., Stone, D. L.: “The brave new world of e HR: Human resources management
in the digital age”, San Francisco: Jossey Bass. 2005.
13. Hovland, C. I., & Janis, I. L.:” Personality and persuasibility”, New Haven, CT: Yale University Press. 1959.
14. Hovland, C. I.:” Order of presentation in persuasion”, New Haven, CT: Yale University. 1957.
15. Lee, M., C.:” Explaining and predicting users' continuance intention toward e-learning: an
extension of the expectation-confirmation model”, Comp. Edu., 54, 2010/ 506 – 516.
16. Lengnick-Hall, M. L., & Moritz, S.:”The impact of e-HR on the human resource management
function”, Journal of Labor Research, 24, 3, 2003/ 365-379.
17. Liu, Y., Combs, J. G., Ketchen, D. J., Ireland, R. D. “The value of human resource management
for organizational performance”. Business Horizons, 2007/ 503–511.

International Journal of Information, Business and Management, Vol. 8, No.2, 2016
ISSN 2076-9202
133
18. Olivas-Lujan, MR., Raminez, J., Zapata-Cantu, L.:” E-HRM TECHNOLOGY in Mexico:
Adapting innovations for global competitiveness”, Inter. J. Manpower, 28, 5, 2007/ 418-434.
19. Ruel, H., Magalhaes, R., Chiemeke, C.:”Human Resource Information System: An Integrated
Research Agenda. Electronic HRM in Theory and Practice”, Advanced Series in Management, Emerald Group Publishing Limited, 8, 2011/ 21-39.
20. Ruel, HJM., Bondarouk, TV., Van der Velde, M.:”The contribution of e-HRM technology to
HRM effectiveness: results from a quantitative study in a Dutch Ministry” Emp.,29, 3, 2007/ 280 - 291.
21. Stone, D. L., Lukaszewski, K. M., & Isenhour, L.:” E-recruiting: Online strategies for attracting
talent”, The brave new world of e-HR ,San Francisco, CA: Jossey-Bass. 2005/22−53.
22. Stone, D. L., Stone-Romero, E. F., Lukaszewski, K.:“The functional and dysfunctional
consequences of human resource information technology for organizations and their employees”, Advances in human performance and cognitive engineering research, Greenwich, CT: JAI Press. 2003/ 37−68.
23. Strohmeier, S.:” Research in e-HRM technology: Review and implications”, Human Resource
Management Review, 17, 2007/ 19−37.
24. Taylor, s., & Todd, P.A.: “Understanding information technology usage: a test of competing
Models”, Information system research, 6, 2, 1995/144 – 176.
25. Teo, T. S. H., Lim, G. S., Fedric, S. A.:”The adoption and diffusion of human resources
information systems in Singapore”, Asia Pacific Journal of Human Resources, 45, 1, 2001/ 44-62.
26. Venkatesh, V.:” Determinants of perceived ease of use: integrating control, intrinsic Motivation,
and Emotion into the Technology Acceptance Model”, Info. Syst. Res., 11, 4, 2000/ 342–365.
27. Voermans, M., van Veldhoven, M.:”Attitude towards E-HRM TECHNOLOGY: An empirical
study at Philips”, Personnel. Rev., 36, 6, 2007/ 887-902.
International Journal of Information, Business and Management, Vol. 8, No.2, 2016
ISSN 2076-9202
134
INVESTIGATING THE EFFECT OF INTERNET MARKETING ON
CUSTOMERS’ DECISION TO PURCHASE (CASE STUDY: AMICO
INDUSTRIAL GROUP)
Mojtaba Fadaei
MA in Business Management, Expert in the R & D Unit, Amico Industrial Group
Abstract
The objective of the present study is to investigate the effect of internet marketing on the decision of
customers of Amico Industrial Group. The present study is an applied on in terms of objective and a
descriptive-survey study in terms of method and data collection method (field study). For this research, 3
secondary hypotheses and a main hypothesis was developed. The population of the research are those
customers who referred to the agencies of Amico Industrial Group in the City of Tabriz during one month
for purchase and after sales services of business machines and motorcycles. They were estimated as 88
individuals. To collect data, a questionnaire was used and to analyze data, Pearson correlation coefficient
and regression tests as well as the SPSS software were used. The results indicate that internet marketing
techniques (websites, Banner ads, and social networks) have positive effects on the customers’ purchase
from Amico. The findings also indicate that Amico Industrial Group can influence positively on its
customers using internet marketing and results in increasing the purchase of products and customers’
satisfaction.
Key words: internet marketing and purchase decision, customers, Amico.
Introduction
Internet has been considered as the biggest center for online sales of a lot of industries and businesses all
over the world. It is predicted that in Canada, in 5 to 8 next years, individuals do their tasks outside the
home online. In addition, now in Canada and Toronto, only 3% of newspapers are printed in paper and
traditionally for printing, distributing and doing all affairs (Barnes, 2010). In recent years, in Iran the
number of internet users is significantly increasing. Iran is advancing in terms of digital marketing. If
managers do not use these chances appropriately, they lose a lot of opportunities and therefore, will be
defeated by their competitors (Eftekhar Manavi et al. 2013). Kotler and Armstrong state that designing
and implementing strategies of internet marketing is very important. Managers and experts should be
familiar with marketing issues and know how customers’ behaviors change (Kotler and Armstrong, 2013).
On the other hand, attaining customers’ satisfaction is the main factor of attaining competitive advantage
of organizations. The necessity of attracting customers’ satisfaction is to realize their needs fully and to
International Journal of Information, Business and Management, Vol. 8, No.2, 2016
ISSN 2076-9202
135
identify their wants, expectations, desires, abilities, and limitations attentively in purchasing products. By
access to such information, factors affecting customers’ behaviors can be appropriately identified and they
can be used in adopting marketing decision making in companies. Therefore, companies’ products should
be compatible with customers’ expectations. In this line, identifying different dimension of purchaser’s
decisions and determining the relationship of elements intertwined with marketing are necessary (Sharj
Sharifi, Cherakh, 2013). In addition, industrial companies, in the past, emphasized more on traditional
marketing. Increasing industrial companies and the existence of competitive market and using marketing
techniques and internet marketing for industrial companies such as service organization seem necessary.
Amico Industrial Group includes a set of industrial companies which can use internet marketing for
attracting their specific customers. The use of internet capabilities particularly the characteristics of
designing products and communicative interactions of appropriate competitive instruments for motivating
potential customers to purchase products and surviving and developing in the industry of business
machines, motorcycles and parts manufacturing of Iran Electronics Industries of the market. Therefore,
designing is the internet marketing mix design for enhancing current condition seems necessary.
Statement of the problem
The present age has been along with characteristics such as frequency of supply, competition
development, technological upheavals and globalization, which has resulted in a lot of benefits for
customers such as choice, increase in bargaining power and achievement of greater values for customers
and more reasons for customers to purchase them and create long-term relationship with companies.
Nowadays, customers want products with higher quality, more services, quicker supply, and with more
appropriate prices appropriate with their own needs. Companies which have accepted the marketing
philosophy, i.e. they have emphasized customers and the society as the axes of their operations, are
consistently exert their efforts for creating and increasing value for their customers (Kotler and Armstrong,
2011).
Nowadays, the success of companies and institutions depends on the identification of customers,
competitors, and other factors affecting the market. Regarding the fact that needs and demands of
customers have always been changing, only it is in case of identifying these changes that a company can
be successful. On the one hand, to attract customers, they do their best and on the other hand, the changes
in market’s conditions and rules governing it such as changes in technology and rules and regulations can
influence the success of institutions in a market (Rusta et al. 2004).
Identifying different dimensions of marketing management in industries among which the competition is
very severe and customers have different needs and wants, is very important (Wang and Kototorakes,
2011) because in competitive industries, due to increase in the number of competitors which reduces the
volume of purchase and the technological differences are gradually removed among commercial names,
companies either should be in search of parts of new markets or take the share of competitors’ market via
reducing prices of their product, provide better services or intangible benefits whose their competitors are
not able to provide them. By technological advancement in machine-manufacturing industries and the
emergent of economic crises, the increase in the purchase and stability of a competitive market and the
International Journal of Information, Business and Management, Vol. 8, No.2, 2016
ISSN 2076-9202
136
penetration into new markets have make the need to use modern marketing techniques such as internet
marketing inevitable. In the present study, the researcher is to answer this question whether in the industry
of manufacturing diesel cars and motorcycles, internet marketing techniques based on marketing
principles are effective on the degree of decisions to purchase because the development of market share
and increase in productivity of companies depend attracting customers and increasing the purchase of
companies’ products.
Theoretical framework
Internet marketing
Kotler and Armstrong (2013) states that internet marketing is the process of constructing and keeping
relations with customers in online activities. This process includes seven stages:
1. developing a company’s macro strategies
2. identifying market opportunities
3. formulizing marketing strategies
4. designing customers’ experiences
5. designing marketing planning
6. creating customers’ skills
7. evaluating the results of marketing programs
(Kotler and Armstrong, 2013)
Sum Siu (2002) states that in internet markets, customers are equal and a real customers equal to a virtual
one, and internet marketing is founded on this principle (Sum Siu, 2002).
Internet marketing techniques
Internet marketing techniques and methods are diverse. As follows, the most important methods are
briefly discussed.
Advertising banners
In this method, banners with other sites are exchanged and relationships, attract a lot of customers and
visitors to the website of a company. Banner advertisement are rectangular advertisements which usually
are observed at the top part of websites. It should be noticed that if banner advertisements are not
attractive enough, they cannot guide and attract customers to websites (Mirzaei and Mohebbi, 2014: 36).
Websites
Basically websites are powerful instruments which the communication path between business of
companies and customers are transformed via unbound suggestions. Nowadays, companies, due to
competition in the global world, increasingly develop their own activities in line with this communication
channel. The direct result of e-commerce is appearance of a new type of customers called electronic
customers, those who use the Internet for purchasing products and services (Mark, 2011: 12). Summarily,
International Journal of Information, Business and Management, Vol. 8, No.2, 2016
ISSN 2076-9202
137
the characteristics of websites can be presented as follows:
1. attractive and beautiful design appropriate to customers’ taste in each website
2. easy access to available information in websites
3. attentive classification with scientific method of information
4. low volume of graphic programming increasing load speed
5. avoiding any repeated and extra information
6. the possibility of searching in websites
7. important engine search should be introduced
8. the possibility of updating information should be feasible
9. the security of information should be guaranteed
10. the view of builders and owners of websites should be functionalist
(Hooper, 2013).
Social networks
An internet social network is a website or a set of websites which allows its own users to share their
interests, thoughts, and activities with each other. A social network also can be used for identifying
geographical positions of each individual. Social networks, in spite of being virtual in order for
individuals to find new friends or make their old friends aware of the trend of changes, are places for
exchanging information and ideas particularly for the youth and sharing ideas and beliefs (Khatami, 2010).
Accordingly, Twitter, Facebook, Stumble Upon, Digg, +Google, Reddit, LinkedIn, DZone, are among the
most famous social network which can be considered as instruments for sending information in social
networks and attract frequent traffics and visitors towards companies’ websites (Saman, 2013).
Advantages of marketing with social networks can be summarized as follows
1. Approximately all layers of the society can be found in these networks;
2. The popularity of companies can respond users’ question and make close relationship with them
3. Activity in social networks causes that a lot of individuals can see the link of companies’ products
in their own profiles;
4. Marketers can attract thousands of fans to companies by releasing images, videos, or interesting
texts.
(Alipour Marzangu and Ghorbani, 2013).
Customers’ decision making
Wang et al. and also Wilson et al. define decision making as a process in which the superior alternatives
or the better executive paths, by considering criteria and specific strategies are selected from among a set
of alternatives (Hosseini and Talaei, 2011).
Scholars believe that customers use the problem-solving process for selecting products and services. They
believe that the process of purchasing starts with identifying needs. After identifying a need, searching for
information about products and services which may realize needs is to be conducted. After collecting
information, evaluating alternatives and purchase decision are to be conducted. Figure 1-2 indicate the
International Journal of Information, Business and Management, Vol. 8, No.2, 2016
ISSN 2076-9202
138
decision making process towards purchases.
Figure 1. The purchase process of a customer (Perkash, 2002)
Research hypotheses
Main hypotheses
Internet marketing dimensions are positively effective on the purchase decision making of customers of
Amico Industrial Group.
Secondary hypotheses
Marketing via internet advertising banners is positively effective on the purchase decision making of
customers of Amico Industrial Group.
Marketing via websites is positively effective on the purchase decision making of customers of Amico
Industrial Group.
Marketing via social networks banners is positively effective on the purchase decision making of
customers of Amico Industrial Group.
Research method
The present study is an applied research in terms of objective and in terms of method, on the one hand, in
terms of statement of the current status of research variables, it is a descriptive-survey research and on the
other hand, in terms of the researcher’s intention to investigate and illustrate the cause-effect relationship
in his research, it is considered as a causal research.
The population of the research includes all customers who referred to the agencies of Amico Industrial
Group for purchasing or using after sales services of business machines and motorcycles during one
months. They were 88 individuals. The data were collected via a researcher made questionnaire designed
for internet marketing dimensions (including 15 questions) and for purchase decision making (10
questions) in a five point Liker scale. The reliability was obtained as 0.823 using the Chronbach’s alpha
coefficient for the internet marking questionnaire. In addition, the reliability of the purchase decision
making questionnaire was obtained as 0.792. These values indicate that firstly, the questions of the
questionnaire enjoy high correlation with each other and secondly, the questionnaire enjoys high
reliability. To determine the validity of the research instrument, form validity was used. Accordingly, the
initial questionnaire was designed and were submitted to two professors and experts of marketing in order
to comment about the issue whether these questions measure what is to measure or not? Then, the ideas of
professors and experts about the questionnaire were considered and necessary amendments were adopted.
The research data were analyzed at two descriptive and analytical levels. At the descriptive statistical
level, the table of frequency and mean scores were used; but at the inferential level, Pearson correlation
and regression were employed.
Testing hypothesis
Searching information Evaluating after Evaluating needs Purchase decision making Identifying needs
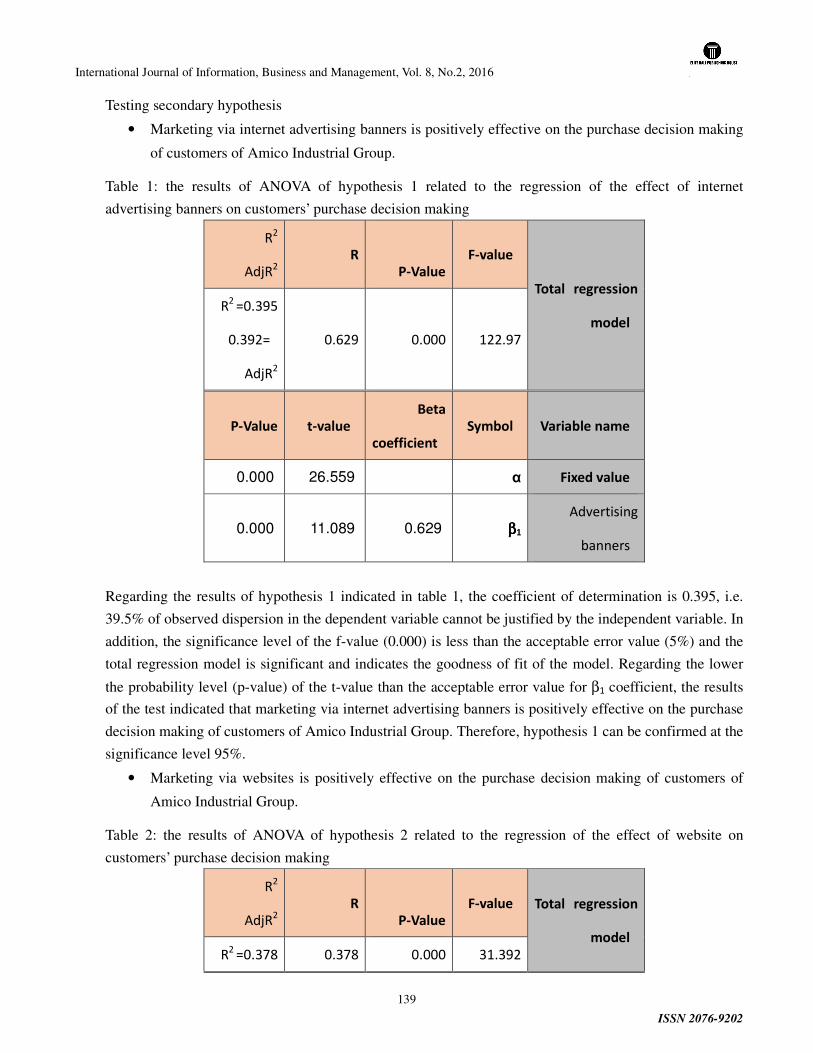
International Journal of Information, Business and Management, Vol. 8, No.2, 2016
ISSN 2076-9202
139
Testing secondary hypothesis
• Marketing via internet advertising banners is positively effective on the purchase decision making
of customers of Amico Industrial Group.
Table 1: the results of ANOVA of hypothesis 1 related to the regression of the effect of internet
advertising banners on customers’ purchase decision making
Total regression
model
F-value
P-Value
R
R2
AdjR2
122.97 0.000 0.629
R2
=0.395
0.392=
AdjR2
Variable name Symbol
Beta
coefficient
t-value P-Value
Fixed value α 26.559 0.000
Advertising
banners
ββββ1 0.629 11.089 0.000
Regarding the results of hypothesis 1 indicated in table 1, the coefficient of determination is 0.395, i.e.
39.5% of observed dispersion in the dependent variable cannot be justified by the independent variable. In
addition, the significance level of the f-value (0.000) is less than the acceptable error value (5%) and the
total regression model is significant and indicates the goodness of fit of the model. Regarding the lower
the probability level (p-value) of the t-value than the acceptable error value for β1 coefficient, the results
of the test indicated that marketing via internet advertising banners is positively effective on the purchase
decision making of customers of Amico Industrial Group. Therefore, hypothesis 1 can be confirmed at the
significance level 95%.
• Marketing via websites is positively effective on the purchase decision making of customers of
Amico Industrial Group.
Table 2: the results of ANOVA of hypothesis 2 related to the regression of the effect of website on
customers’ purchase decision making
Total regression
model
F-value
P-Value
R
R2
AdjR2
31.392 0.000 0.378 R2
=0.378

International Journal of Information, Business and Management, Vol. 8, No.2, 2016
ISSN 2076-9202
140
0.143=
AdjR2
Variable name Symbol
Beta
coefficient
t-value P-Value
Fixed value α 33.765 0.000
Advertising
banners
ββββ1 0.378 5.603 0.000
Regarding the results of hypothesis 2 indicated in table 2, the coefficient of determination is 0.378, i.e.
38.8% of observed dispersion in the dependent variable cannot be justified by the independent variable. In
addition, the significance level of the f-value (0.000) is less than the acceptable error value (5%) and the
total regression model is significant and indicates the goodness of fit of the model. Regarding the lower
the probability level (p-value) of the t-value than the acceptable error value for β1 coefficient, the results
of the test indicated that marketing via website is positively effective on the purchase decision making of
customers of Amico Industrial Group. Therefore, hypothesis 2 can be confirmed at the significance level
95%.
• Marketing via social networks banners is positively effective on the purchase decision making of
customers of Amico Industrial Group.
Table 3: the results of ANOVA of hypothesis 3 related to the regression of the effect of social networks on
customers’ purchase decision making
Total regression
model
F-value
P-Value
R
R2
AdjR2
86.223 0.000 0.561
R2
=0.314
0.311=
AdjR2
Variable name Symbol
Beta
coefficient
t-value P-Value
Fixed value α 14.000 0.000
Advertising ββββ1 0.561 9.289 0.000
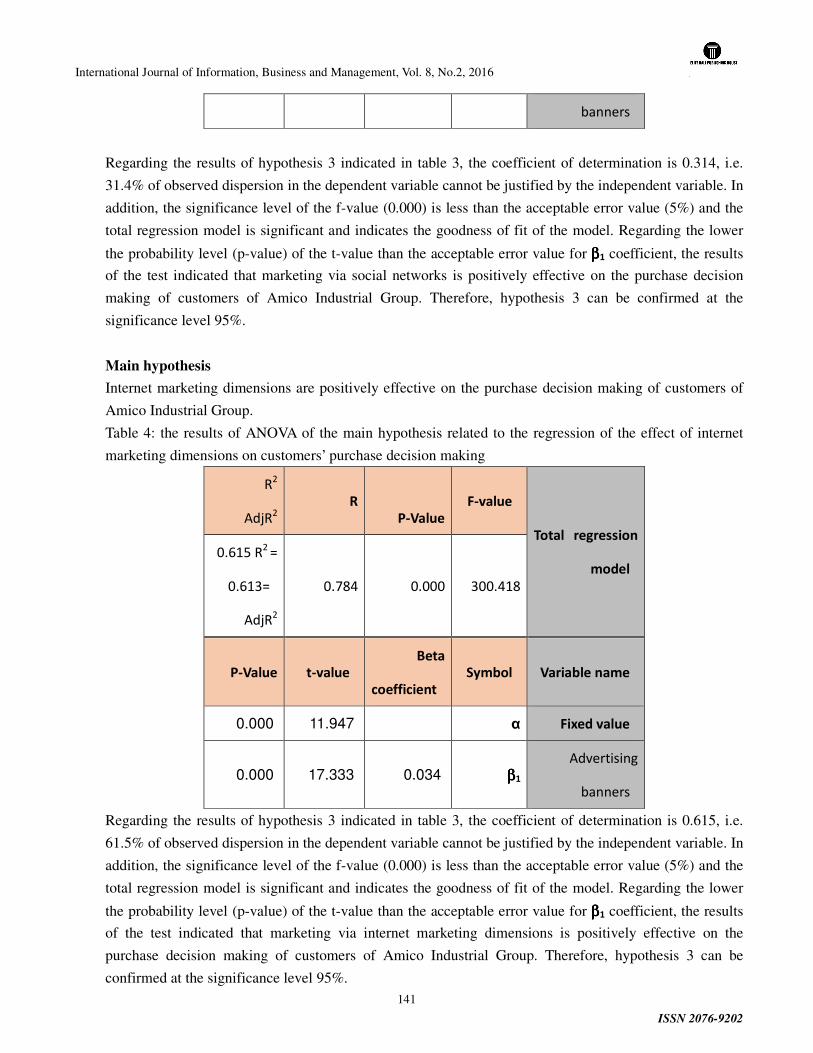
International Journal of Information, Business and Management, Vol. 8, No.2, 2016
ISSN 2076-9202
141
banners
Regarding the results of hypothesis 3 indicated in table 3, the coefficient of determination is 0.314, i.e.
31.4% of observed dispersion in the dependent variable cannot be justified by the independent variable. In
addition, the significance level of the f-value (0.000) is less than the acceptable error value (5%) and the
total regression model is significant and indicates the goodness of fit of the model. Regarding the lower
the probability level (p-value) of the t-value than the acceptable error value for ββββ1 coefficient, the results
of the test indicated that marketing via social networks is positively effective on the purchase decision
making of customers of Amico Industrial Group. Therefore, hypothesis 3 can be confirmed at the
significance level 95%.
Main hypothesis
Internet marketing dimensions are positively effective on the purchase decision making of customers of
Amico Industrial Group.
Table 4: the results of ANOVA of the main hypothesis related to the regression of the effect of internet
marketing dimensions on customers’ purchase decision making
Total regression
model
F-value
P-Value
R
R2
AdjR2
300.418 0.000 0.784
0.615 R2
=
0.613=
AdjR2
Variable name Symbol
Beta
coefficient
t-value P-Value
Fixed value α 11.947 0.000
Advertising
banners
ββββ1 0.034 17.333 0.000
Regarding the results of hypothesis 3 indicated in table 3, the coefficient of determination is 0.615, i.e.
61.5% of observed dispersion in the dependent variable cannot be justified by the independent variable. In
addition, the significance level of the f-value (0.000) is less than the acceptable error value (5%) and the
total regression model is significant and indicates the goodness of fit of the model. Regarding the lower
the probability level (p-value) of the t-value than the acceptable error value for ββββ1 coefficient, the results
of the test indicated that marketing via internet marketing dimensions is positively effective on the
purchase decision making of customers of Amico Industrial Group. Therefore, hypothesis 3 can be
confirmed at the significance level 95%.
International Journal of Information, Business and Management, Vol. 8, No.2, 2016
ISSN 2076-9202
142
Conclusion and suggestions
With the advent of modern marketing methods about 79 years ago, experts of this profession were noticed
of its direct effects on the society; effects which images on newspapers all the time create in people’s
minds. Nowadays, these images can appear on the screen of a computer and even lively and dynamically
can be illustrated with voice. The Internet as the biggest world network was created according to the
tradition of free access to information, but rapidly it changed from a research instrument into one of the
most expansive trade facilities in the world which requires its own particular marketing and advertising
methods. As in the previous studies investigated, the results of the present study is consistent with the
previous studies in different industries confirming the positive effect of internet marketing on customers’
behavior and decision making.
In these studies, regarding the existence of different techniques on the positive effects of internet
marketing on purchase decision making of customers of business machines and motorcycles of Amico
Industrial Group, the following results are presented for managers of organization and marketers:
• Supporting agencies, motivating and encouraging them in attracting and training marketers,
expanding the purchase network, agencies and creating branches in all regions of Iran for
servicing and introducing companies to individuals in the society for creating and keeping
relationship with customers are important factors.
• Enhancing the beauty of webpages related to companies: by managing webpages, a lot of values
can be added to webpages.
• Posting regularly: providing updated information on the services provided by the company
• Creating posts with pictures and videos: image posts of companies’ services, interviews of
authorities and social activities of companies.
• Creating the grounds for free conversation and sharing users’ ideas about services and products of
companies.
• Designers of websites should instead of concentrations on the visual profile of websites,
concentrate on the use of feasibility of purchase.
• Before purchasing goods or services of the process of ordering, purchasing goods in the image
from and stage by stage, they will be illustrated for customers in order that they can purchase
goods as easily as possible.
• It should be noted that current questions which customers’ regularly ask, are prepared and are put
in websites with answers.
• Beautifully designed and appropriate advertising banners store
• Using multi-dimensional moving images and advertising banners
Research limitations
International Journal of Information, Business and Management, Vol. 8, No.2, 2016
ISSN 2076-9202
143
• There are a lot of internet marketing techniques which in the present study regarding the
population, internet marketing methods are limited to websites techniques, advertising banners,
and social networks.
• The population of the case study includes those customers who referred to agencies of Amico in
the City of Tabriz for purchasing or receiving business machines and motorcycles.
• Data collection instrument are limited to a questionnaire.
References
Alipour Marzanglu, A. and Ghorbani, M. (2011). Small Business Marketing through Social Networking Conference on Computer Engineering and Information Technology Management. Tehran.
Armesh, H, Salarzehi, H. (2010). Impact of Online/Internet Marketing on Computer Industry in Malaysia in Enhancing Consumer Experience, International Journal of Marketing Studies, Vol. 2, No. 2.
Barnes, Stuart J.; Bauer, Hans H.; Neumann, Marcus M.; and Huber, Frank (2010). Segmenting cyberspace: a customer typology for the internet, European Journal of Marketing, Vol. 41 No. 1/2, pp. 71-93
Eftekharmanavi, S., SafaeiKvishaei, E., Fomani, E. S., EbrahimiFard, S., PooryunesAbkenar, M, (2013). Internet role in attracting tourists, “Internet Tourism, International Journal of Business and Behavioral
Sciences Vol. 3, No.4.
Hosseini, S. M. and Talaei, A. A. (2011). Decision Theory and Techniques, University of Shahrood.
Hooper, J. (2013), Internet marketing trends: An Analysis of website and social media use in New York state’s equine industry, Rochester Running Head: Internet Marketing Trends, Institute of Technology
RIT Scholar Works, 2-8
Golriz Khatami, S. (2010). The impact of social networks in electronic marketing, strategy journal, No. 173.
Kotler, F. and Armstrong, G. (2013). Principles of Marketing. Translated by A. Parsian. Adbstan Publication. Fourteenth Edition, 2012.\
Jun, G., Ismawati Jaafar, N, (2011), A Study on Consumers’ Attitude towards Online Shopping in China, International Journal of Business and Social Science Vol. 2 No. 22.122-132.
Mirzaei, M. Mohebbi, N. (2014). Online marketing. Tehran: SAMT.
Mark, F. (2011). Successful management of web business, Kermanshah. Translated by Nourani, M. and Bozorgmehr, P.
Prakash, A, (2002).Green Marketing, Public Policy and Managerial Strategies, Bus. Strat. Env. 11.
Rusta, A. (2004). Marketing Management (Second Edition), Tehran: SAMT.
Saman, M. (2013). 10 Ways Social Networking for publication: available at: http: //www.webhub.ir/10.
Sharji Sharifi, A. and Charakh, M. (2013). The relationship between marketing mix elements and the tendency to buy an insurance policy from the perspective of insurance customers in Asia, the first national conference on innovation and information technology. Tehran.

International Journal of Information, Business and Management, Vol. 8, No.2, 2016
ISSN 2076-9202
144
Sum siu, W,(2002), Marketing activates and performance, A comparison of Internet based and tradition small firms in Iran, In dustrial Marketing Management, Vol 31, 177-189.
Tiago, M, T(2012), Revisiting the Impoaet of Integrated Intemet Marketing on Firms Online Performance: European Evidences, Procardia Technology, Vol5, 418-426
Wang, C,L., Katawetawaraks, C, (2011), Online Shopper Behavior: Influences of Online Shopping Decision, Asian Journal of Business Research,Vo 1 No 2, 66-74.
International Journal of Information, Business and Management, Vol. 8, No.2, 2016
ISSN 2076-9202
145
VARIABLE COSTING AND ITS APPLICATIONS IN
MANUFACTURING COMPANY
Md. Salim Hasan
Senior Lecturer
Department of Business Administration, Uttara University, Bangladesh
E-mail: [email protected]
Abstract:
Variable Costing has now arrived of a period and is providing to be an exceptionally important
tool in planning and controlling operations in many large industrial companies. However still not
as broadly working as absorption costing, it is progressively gaining popularity in use. In Variable
Costing, product costs contain only those manufacturing costs which are directly related to the
product and vary with production volume. Under absorption costing all manufacturing costs,
direct and indirect, are included as cost of manufactured goods. This article discusses variable
costing that is used only for internal reporting and analysis and its applicability in the
manufacturing situation. Variable and absorption costing are not commonly exclusive.
Accountants find that variable costing more effectively meets internal requirements because it
provides better insight into cost relationship while the absorption costing method meets external
reporting requirements.
Keywords: Absorption costing, Contribution margin, Variable Costing, Fixed factory overhead, Variable
factory overhead.
1. Introduction
Cost accounting supplies management with the necessary information for decision making. Accounting
information enables a manager to take the right decision instead of his relying upon intuition and hunch.
Accounting information concerning expected future costs and revenues, and an analysis of the same, will
assist management in making right decision. Product costing is one of the objects of cost accounting.
Appropriate costing of a product is essential for taking appropriate managerial decisions. Costing is,
International Journal of Information, Business and Management, Vol. 8, No.2, 2016
ISSN 2076-9202
146
according to the definition of the Chartered Institute of Management Accountants (CIMA) Terminology
(p.10), “the process of determining the costs of products, services and activities”. Accordingly, the cost of
manufactured products is generally based on either Absorption Costing (the full costing concept) or
Variable Costing (the variable costing concept). As all of we are familiar with the methodologies and
accounting treatment of absorption costing, this paper has attempted to give a detailed aspect of variable
costing .The purpose of this paper is to review literature on variable costing in our manufacturing
environment. The paper will be useful to researchers, cost accountants and others concerned with
product costing to understand the official importance of variable costing. The main limitation is that this
is not an empirical investigation of variable costing in our manufacturing firms.
2. Meaning of Direct or Variable Costing
Under absorption costing, all factory overhead costs, both variable and fixed, are treated as product costs.
Under Variable Costing, only factory overhead costs that vary with volume are charged to products. That
is only the costs of direct materials, direct labor, and variable factory overhead are included in inventory.
The concept of Variable Costing considers only the costs of direct materials, direct labor and variable
factory overhead to be product costs. Fixed factory overhead under Variable Costing is not included in
inventory. The concept of Variable Costing considers fixed factory overhead to be a period cost. In
Variable Costing, fixed costs are differentiated from variable costs not only in internal reports but in the
various cost accounts as well.
3. Impact of Automated Manufacturing Environment
Variable costing was appropriate when variable costs were a high proportion of total production costs.
Also, variable costing was appropriate when product diversity was small and there was not a wide
variation of product demands made on the firm’s production and marketing resources. Changes in the
factory environment have decreased the percentage of variable costs in total manufacturing cost. With
automation on the increase in industry, fixed costs become an ever larger element. Depreciation and
related costs of automated equipment cause a large portion of overhead to be fixed, not variable. The
spread of guaranteed annual wage contracts also causes more of the labor costs to be fixed. Thus, fixed
costs are becoming a larger share of total manufacturing costs. The competitive environment is forcing
companies to produce an increasing variety of products that make different demands on equipment and
support departments. Some accountants argue that in this cost accounting environment, absorption
costing becomes the only meaningful costing method. Other accountants believe that as automation
International Journal of Information, Business and Management, Vol. 8, No.2, 2016
ISSN 2076-9202
147
increases, costing is dysfunctional for management accounting decisions. Their view is rooted in the idea
that all product costs are based on assumptions, estimates, allocations, and averages. This is especially
prevalent for assigning factory overhead cost and other indirect product costs. Variable costing
overcomes the limitation of absorption costing, but it excludes fixed cost elements that many
accountants believe they should assign to products. Such shifts in the cost characteristics of a company
emphasize the importance of management understanding the impact of fixed cost. The company has less
flexibility in altering decisions, because it has invested more dollars in machinery and plant. However,
merely grouping fixed overhead items together to charge to the period under variable costing may be
insufficient to control a company’s raising fixed overhead costs. On the other hand, differentiating
between fixed and variable costs as plants become more automated can be a first step in controlling costs.
Managers need better information because they have to deliberate more carefully over the expansion of
labor force and production facilities. Admittedly, with increased fixed costs experienced in automated
manufacturing, omitting fixed costs from products may have less merit.
4. Variable Costing versus Absorption Costing
In addition to long-range statements to evaluate factors affecting income, companies need short-period
income statements that do not consider the entire production and sales cycle. Variable costing meets this
need even in small business with limited cost accounting systems. Variable costing is an overhead costing
approach that consolidates the desirable features of breakeven analysis and profit planning involving
both generally accepted accounting principles and tax regulations require manufacturing companies to
use an absorption costing system. This does not mean that it must be used for managerial purposes.
However for internal reporting and control purposes, management can use any kind of information it
wishes. There is only one criterion: the information must be useful. Because of the complexities
associated with absorption costing, many companies have chosen to use something somewhat more
intuitive, and therefore useful, for internal purposes: variable costing. The major differences between
Variable Costing and absorption costing are briefly discussed as follows:
1. Absorption costing income statement presented in the traditional or functional format makes no
distinction between fixed and variable costs. As a result, absorption costing income statements do not
show cost-volume-profit relationships as clearly as variable costing income statements.
2. Inventory values are smaller with variable costing because it capitalizes only variable costs as asset.
Inventory values using absorption costing have an additional amount for fixed factory overhead.

International Journal of Information, Business and Management, Vol. 8, No.2, 2016
ISSN 2076-9202
148
3. Variable costing income is lower than that for absorption costing when production exceeds sales.
Variable costing charges total fixed cost incurred against sales revenue, while absorption costing
applies part of it to inventory and defer the cost until sale of the product. If there is an increase in
inventories, variable costing income will be less than absorption costing income will be less than
absorption costing income.
4. Variable costing income is higher than absorption costing income when units are sold exceeds units
produced. Variable costing income always moves in the same direction as sales volume.
5. Conventional absorption costing determines an intermediate income figure called gross margin that
reflects the difference between sales and the fixed and variable costs of sales. This figure normally
varies significantly from the manufacturing contribution margin determined with variable costing,
because we subtract only the variable expenses of the goods sold from sales revenue.
6. The difference between the operating incomes under the absorption Variable Costing is due to the
amount of fixed factory overhead in the work-in-process and finished goods inventories.
5. Uses of variable costing in a manufacturing concern
Variable Costing focuses attention on the product and its costs. This interest moves in two directions:
A. To internal uses of the fixed-variable cost relationship and the contribution margin concept, and
B.To external uses involving the costing of inventories, income determination, and financial
reporting.
5.1 internal uses of variable costing
Executive Management, including marketing executives, production managers, and cost analysts, has
generally praised the planning, control, and analytical potentialities of Variable Costing. Fixed costs
calculated on a unit cost basis tend to vary. On the other hand, direct costs and the contribution margin
per unit tend to remain constant for various volumes of production and sales.
5.1.1 Variable costing as a profit-planning tool:
A profit plan, often called a budget or plan of operations covers all phases of future operations to attain a
stated profit goal. Although such a plan includes both long-term and short-term operations, Variable
Costing is quite useful in planning for short periods, in pricing special orders, or in making current
operation decisions. With its separation of variable and fixed costs and its calculation of the contribution
margin, Variable Costing facilitates analysis of cost-volume- profit relationship. Variable Costing aids in
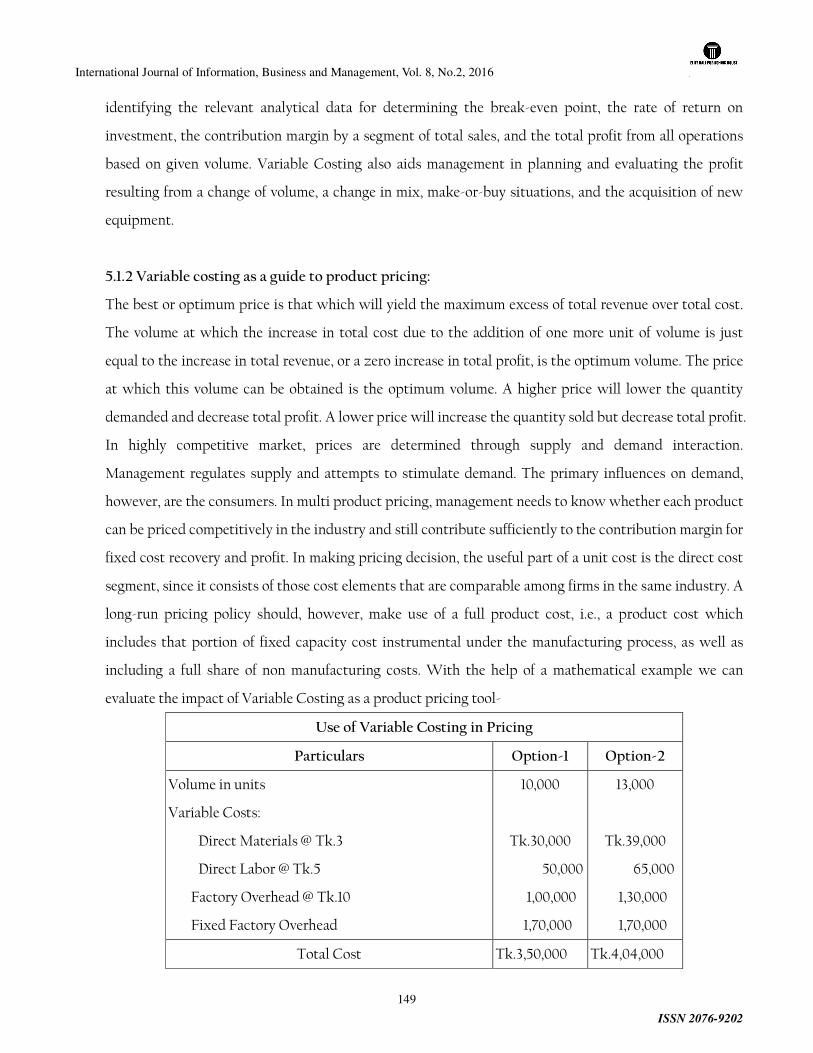
International Journal of Information, Business and Management, Vol. 8, No.2, 2016
ISSN 2076-9202
149
identifying the relevant analytical data for determining the break-even point, the rate of return on
investment, the contribution margin by a segment of total sales, and the total profit from all operations
based on given volume. Variable Costing also aids management in planning and evaluating the profit
resulting from a change of volume, a change in mix, make-or-buy situations, and the acquisition of new
equipment.
5.1.2 Variable costing as a guide to product pricing:
The best or optimum price is that which will yield the maximum excess of total revenue over total cost.
The volume at which the increase in total cost due to the addition of one more unit of volume is just
equal to the increase in total revenue, or a zero increase in total profit, is the optimum volume. The price
at which this volume can be obtained is the optimum volume. A higher price will lower the quantity
demanded and decrease total profit. A lower price will increase the quantity sold but decrease total profit.
In highly competitive market, prices are determined through supply and demand interaction.
Management regulates supply and attempts to stimulate demand. The primary influences on demand,
however, are the consumers. In multi product pricing, management needs to know whether each product
can be priced competitively in the industry and still contribute sufficiently to the contribution margin for
fixed cost recovery and profit. In making pricing decision, the useful part of a unit cost is the direct cost
segment, since it consists of those cost elements that are comparable among firms in the same industry. A
long-run pricing policy should, however, make use of a full product cost, i.e., a product cost which
includes that portion of fixed capacity cost instrumental under the manufacturing process, as well as
including a full share of non manufacturing costs. With the help of a mathematical example we can
evaluate the impact of Variable Costing as a product pricing tool-
Use of Variable Costing in Pricing
Particulars Option-1 Option-2
Volume in units
Variable Costs:
Direct Materials @ Tk.3
Direct Labor @ Tk.5
Factory Overhead @ Tk.10
Fixed Factory Overhead
10,000
Tk.30,000
50,000
1,00,000
1,70,000
13,000
Tk.39,000
65,000
1,30,000
1,70,000
Total Cost Tk.3,50,000 Tk.4,04,000

International Journal of Information, Business and Management, Vol. 8, No.2, 2016
ISSN 2076-9202
150
Absorption Cost Per Unit Tk.35 Tk.31.08
For example, assume XYZ Company is producing and selling 10,000 units at a Tk.40 unit sales price
when it receives an offer from a foreign distributor to buy 3,000 units at a unit sales price of Tk.32. The
absorption cost per unit as shown in the table indicates that this Tk.32 sales price is less than the
Tk.31.08 average unit full cost to make 13,000 units. Management may not take advantage of the sales
offer if it relies on the absorption cost per unit to make the decision. Instead, managers should use
variable costs along with any extra costs of the foreign sale in evaluating this sales offer. With Tk.18 unit
variable costs, Tk.40 unit sales price, and Tk.170,000 annual fixed costs, current net income before taxes
is Tk.50,000, computed as follows:
Details Taka Taka
Sales [10,000 units @Tk.40]
Costs:
Variable [10,000 units @ Tk.18
Fixed
1,80,000
1,70,000
4,00,000
3,50,000
Net Income Before Tax 50,000
If the order is accepted and can be produced without any plant expansion, net income will be Tk.92,000
computed as follows:
Details Taka Taka
Sales [10,000 units @ Tk.40; 3,000 units @ Tk.32]
Costs:
Variable [13,000 units @ Tk.18]
Fixed
2,34,000
1,70,000
4,96,000
4,04,000
Net Income Before Tax 92,000
XYZ Company should accept the Tk.32 sales price even though it is lower than average unit cost because
a unit contribution margin of Tk.10.67 on the new units results. By accepting the sales offer, the company
makes a Tk.32,000 contribution margin to the recovery of fixed costs and, after full recovery, to income.
Net income of only Tk.50,000 results from continuing to produce 10,000 units. Because the export of the
product at a sharply reduced price is unlikely to affect the regular market, the company should accept the
International Journal of Information, Business and Management, Vol. 8, No.2, 2016
ISSN 2076-9202
151
order, assuming it does not violate international trade agreements. Finally, variable costing highlights the
serious results that often accompany price cutting. Cutting prices by a certain percentage and trying to
increase volume by the same percentage under the assumption that the volume increase will
compensable for the price reduction is a common error. To gain market share from a competitor, however,
one should understand just how far a cut in price can go before it becomes unprofitable. Managers who
understand how price cutting to gain market share seriously affects profits, should be more cautious
about cutting prices to undersell a competitor; they may be cutting themselves out of business.
5.1.3 Arguments for variable costing in managerial decision making
Similar to financial accounting, managerial accounting accumulates and analyzes data to make logical
economical decisions. "Variable costing" is an accounting decision-making tool that managers utilize for
internal reporting purposes. As opposed to "absorption costing," which is a system that considers all
manufacturing costs for reporting purposes, many managers argue that variable costing is more effective
for decision making because this method excludes fixed overhead costs of goods sold.
5.1.4 Variable costing as a control tool
The Variable Costing procedure is said to be the product of an allegedly incomprehensible income
statement prepared for management. By adopting Variable Costing, management and marketing
management in particular believe that a more meaningful and understandable income statement can be
furnished by the accountant. However, reports issued should serve not only the marketing department
but all divisions of an enterprise. It seems, appropriate, therefore, to prepare reports for all departments
or responsibility centers based on standard costs, flexible budgets, and a division of all costs into their
fixed and variable components. Other managers can examine and interpret their reports with respect to
the production cost variances originating in their respective areas of responsibility. Reports constructed
on the Variable Costing basis and augmented by the responsible management group are continually
reminded of the original profit objective for the period. Subsequent approved deviations from the
objective are reappraised in light of the current performance. Accounting by organizational lines makes it
possible to direct attention to the appropriate responsibility. Performance is no longer evaluated on the
basis of last month or last year, since each period now has its own standard.
5.2 External uses of variable costing
International Journal of Information, Business and Management, Vol. 8, No.2, 2016
ISSN 2076-9202
152
The proponents of Variable Costing believe that the separation of fixed and variable expenses, and the
accounting for each according to some Variable Costing plan, simplifies both the understanding of the
income statement and the assignment of costs to inventories. To keep fixed overhead out of the reported
product costs, variable and fixed expenses should be recorded in separate accounts. Therefore, the chart
of accounts should be expanded so that each natural classification has two accounts, as needed-one for
the variable and one for the fixed portion of the expense.
5.2.1 Costs assigned to inventory
The differences in ending inventories are caused by the elimination of fixed manufacturing expenses from
inventories in Variable Costing. In absorption costing, these fixed expenses form part of the
predetermined factory overhead rate and are included in inventories. The exclusion of this overhead from
inventories and its offsetting effect on periodic income determination has been particularly criticized by
opponents of Variable Costing. It has been observed that the amount of fixed cost charged to inventory is
affected not only by the quantities produced but also by the inventory costing method employed-a fact
which is largely overlooked. It is often correct but not universally valid to say that when production
exceeds sales, absorption costing shows a higher profit than does Variable Costing; or when sales exceed
production, absorption costing shows a lower profit than does Variable Costing. In relation to four
method of inventory costing-average costing, First In-First-Out (FIFO), Last-In-First-Out (LIFO), and
standard costing [LIFO is not permitted as per International Accounting Standard (IAS)- 2] - an analysis
of the differences in operating income under absorption costing and Variable Costing has shown that the
usual generalizations about full and Variable Costing hold only under the LIFO and the standard costing
methods. However, under the FIFO and the average costing methods, the results are more complex than
those considered by the usual generalizations, which therefore do not apply. Managers favor Variable
Costing because sales figures guide cost figures. The variable cost of goods of varies directly with sales
volume, and the influence of production on profit is eliminated. The idea of selling overhead to
inventories might sound plausible and appear pleasing at first; but when the prior month’s inventories
become this month’s beginning inventories, the apparent advantages cancel out. The absorption costing
income statement also demonstrates the effect of expensing the fixed over or under applied factory
overhead resulting from production fluctuations.
5.2.2 Operating profits
International Journal of Information, Business and Management, Vol. 8, No.2, 2016
ISSN 2076-9202
153
The inclusion or exclusion of fixed expenses from inventories and cost of goods sold causes the gross
profit to vary considerably from the gross contribution margin. The gross contribution margin [sales
revenue-variable manufacturing cost] in Variable Costing is greater than the gross profit in absorption
costing. This difference has also resulted in some criticisms of Variable Costing. It is argued that a greater
gross contribution margin might mislead the marketing function into asking for lower prices or
demanding higher bonuses or benefits. In most cases, however, sales prices and bonuses are based not on
gross profit but on operating income.
5.2.3 Financial reporting
The use of Variable Costing for financial reporting is not accepted by the American Institute of Certified
Public Accountants [AICPA], the Internal Revenue Service [IRS], or the Securities and Exchange
Commission [SEC], nor has it been endorsed by the Financial Accounting Standard Board [FASB].
International Accounting Standard Board [IASB] The position of these groups is generally based on their
opposition to excluding fixed costs from inventories.
6. Dangers of variable costing
The simplicity of Variable Costing allows management to easily understand the resulting figures.
However, managers may misapply the principle of variable costing. Many accountants contend that
variable costing does not provide all the answers or the best answers in certain business situations. Many
non-accountants (outsider and insider of companies) use accounting figures. These people have become
accustomed to the normal relationship of sales to total costs and to using gross margin and net income
data. A change to another accounting method that gives a completely different picture under similar
labels may confuse them. Although the purpose of the change in costing methods is to bring about better
understanding, it may cause more confusion instead. Another danger is that managers may assign
variable costing income a broader significance than it deserves. When sales substantially exceed current
production, for instance, variable costing profits are higher than those under absorption costing, and
management may take improper action based on these increased profits. These profits may mislead
marketing executives to ask for lower prices. Managers may also demand higher employee benefits or
sales bonuses when, in fact, there is no justifications for such actions. The major limitations of Variable
Costing are as follows:
6.1 Long range pricing policies
International Journal of Information, Business and Management, Vol. 8, No.2, 2016
ISSN 2076-9202
154
Since Variable Costing income is higher than absorption costing income when sales substantially exceed
current production, opponents of variable costing argue that managers who receive only variable cost
data are tempted to cut prices to the degree the company profits suffer. Yet, an adequate pricing system
avoids this because companies allocate fixed overhead on some volume base for long range pricing
policies. Admittedly, allocations are somewhat arbitrary; however, more companies are improving their
cost allocation techniques as they gain access to computer facilities. Thus, variable costing generates
product figures providing little basis for long range pricing policies.
6.2 Fixed costs must be covered
Elimination of fixed overhead costs from inventories is questionable in view of the increased fixed costs
automation brings. It is possible to foresee a time when direct material constitutes the only variable
manufacturing cost. Thus, the company with the largest fixed expenses would have the smallest unit
inventory costs. This appears contrary to management’s objective of having expenses covered by
sales-regardless of how they value in inventory. With automation, higher ratios of fixed costs to variable
costs limit the ability of companies to respond to changes in the economy. While labor intensive
industries can cut costs during a recession by lay-off of workers, companies with robots lack this
flexibility. This is a serious threat to the usefulness of variable costing and its acceptability for inventory
valuation. This is one reason the FASB and the Internal Revenue Service has not recognized variable
costing as an acceptable method of inventory costing.
6.3 Separations of variable and non-variable costs
The opponents of Variable Costing argue that while Variable Costing appears theoretically attractive, it
cannot be reliably achieved in practice. For example, there are a number of mixed costs which cannot be
readily separated into variable and non variable costs. However, this reasoning is misleading. The
variable and non variable components can be reasonably distinguished.
6.4 Variable Costing for External Reporting
The principal disadvantage of Variable Costing is its lack of acceptance for external reporting by the
American Institute of Certified Public Accountants [AICPA], the Internal Revenue Service, and the
Securities and Exchange Commission. Their opposition is highlighted as follows:
International Journal of Information, Business and Management, Vol. 8, No.2, 2016
ISSN 2076-9202
155
6.4.1 FASB position
Even though most accountants agree that variable costing provides valid information for internal
decision making, there is no agreement concerning its appropriateness for external reporting. The FASB
has not recognized variable costing as a generally accepted inventory valuation method because of its
belief that fixed production costs are as much a part of manufacturing the product as are variable costs.
In addition, variable costing violates the cost attaching and matching principle.
6.4.2 American institute of certified public accountants
According to AICPA Accounting Research Bulletin No 43, “The primary basis of accounting for
inventories is cost, which has been defined generally as the price paid or consideration given to acquire
an asset. As applied to inventories, cost means in principles the sum of the applicable expenditures and
charges directly or indirectly incurred in bringing a report to its existing condition and location.” This
section also states that, “It should also be recognized that the exclusion of all overheads from inventory
does not constitute an accepted accounting procedure.”
6.4.3 IASB position
International Accounting Standard [IAS]-2 requires that absorption costing be employed. If an entity
uses Variable Costing for internal budgeting or other purposes, adjustments must be made to develop
alternative information for financial reporting purposes.
7. Conclusion and Recommendations
A large number of companies now keep their records for both internal and external reporting needs. The
records are maintained on the Variable Costing basis for management’s daily needs, and at the end of the
year when tax returns and formal financial statements are prepared for regulatory agencies and
stockholders, a simple adjustment is made. The fixed factory overhead costs which were excluded under
Variable Costing are added back to inventories and cost of goods manufactured, and the net income is
adjusted to what it would have been if absorption costing had been used. Under absorption costing net
income will tend to vary with production because the deferred fixed costs are included in inventory,
whereas under Variable Costing net income will vary with sales. Absorption costing is the required
inventory method for external reporting in most countries. Yet, many companies use variable costing for
internal reporting to reduce the undesirable incentives to build up inventories that absorption costing
can create. The undesirable effects of absorption costing can be reduced in several ways:
International Journal of Information, Business and Management, Vol. 8, No.2, 2016
ISSN 2076-9202
156
1) Careful budgeting and inventory planning to reduce management’s freedom to build up excess
inventory. For example, the budgeted monthly balance sheets have estimates of the dollar amount of
inventories. If actual inventories exceed these dollar amounts, top management can investigate the
inventory buildups.
2) Change the accounting system. Discontinue the use of absorption costing for internal reporting;
instead use variable costing. This change will eliminate the incentives of managers to product for
inventory because all fixed manufacturing costs will be expensed.
3) Incorporate a carrying charge for inventory in the internal accounting system. For example, an
inventory carrying charge of 1percent per month could be assessed for the investment tied up in
inventory and for spoilage and obsolescence when evaluating a manager’s performance.
4) Change the period used to evaluate performance. Critics of absorption costing give examples in which
mangers take actions that maximize quarterly of annual income at the potential expense of long-run
income. By evaluating performance over a 3-to-5 year period, managers will be less tempted to
produce for inventory.
5) Include non financial as well as financial variables in the measures used to evaluate performance.
Companies are currently using non financial and physical measures, such as the following, to monitor
manager’s performance in key areas: (a) Ending inventories in units this period/Ending inventory in
units last period; and ( b) Sales in units this period/Ending inventory in units this period
References
Abdurrouf, M.(2013)Cost Accounting, 3rd Edition, Hazi Publication, Dhaka
Abdurrouf, M.(2013)Management Accounting, 2nd Edition, Hazi Publication, Dhaka
IASB (2011) International Accounting Standard-2 [IAS-2]: Inventory
Inman, M. L. (1993). Cost Accounting, 3rd Edition, Butterworth Heinemann (Published in association with CIMA), Boston
Iyengar, S. P. (2000). Cost Accounting-Principles & Practice, Sultan Chand & Sons, New Delhi,
Garrison, R. S. and E Noreen, (2005) 10th edition, Managerial Accounting, McGraw-Hill Irwin , New York.
Jawhar Lal (2002) Cost Accounting, 3rd edition, Tata McGraw-Hill Publishing Company Limited, New

International Journal of Information, Business and Management, Vol. 8, No.2, 2016
ISSN 2076-9202
157
Delhi
Horngren, C. T., Datar, S. m. and Foster, G. (2005). Cost Accounting- A Managerial Emphasis, 11th edition, Pearson Education, New Jersey.
Kaplan R. S. and A. A. Atkinson (2001) Advanced Management Accounting, 3rd edition, Pearson Education Asia, Singapore
Matz A. and M. F. Usry (2002) Cost Accounting-Planning and Control, 8th edition, South-Western Publishing Co., Cincinnati, Ohio
Polimeni, R. S., F. J. Fabozzi, A. H. Adelberg, and Kole (1991) Cost Accounting-Concepts and
Applications for Management Decision Making, 3rd edition, McGraw-Hill International, New York.
Rayburn, L. G. (1996) Cost Accounting- Using a Cost Management Approach, 6th edition, Irwin, New York
International Journal of Information, Business and Management, Vol. 8, No.2, 2016
ISSN 2076-9202
158
MODELLING THE IMPACT OF INTERNATIONAL FINANCIAL
REPORTING STANDARD ON CORPORATE PERFORMANCE (A
STUDY OF SOME SELECTED BANKS IN NIGERIA)
Ezeliora Martin Mmaduabuchi; Ugochukwu Orajaka and Okoli Ifeanyi Sunday 1Department of Business Administration, Faculty of Management Sciences, National Open University of
Nigeria; Tel. No: 2347037452498 2Economics Department, Faculty of Social Sciences, Anambra State University, Igbariam Campus,
Anambra State, Nigeria; Tel. No: 2348034099500
Email address: [email protected] (Ezeliora M. M), [email protected] (Orajaka
Ugochukwu)
Abstract: The research work was based on the modelling of the effect of IFRS on corporate performance
in private organizations. The case studies of this work were first bank Nig. Plc, Diamond bank Nig. PLC,
zenith bank, Fidelity bank Nig. Plc and United bank of Africa. The data were collected based on the
research questions and the annual report of the selected case study banks. Descriptive research design was
used in this research project. The aim of the research design is the desire to simplify the complex issue of
the modelling of the impact of IFRS on corporate performance for a better understanding. However, the
sources of data used for this research is secondary data. The descriptive method was used to analyze the
data generated for the research. Regression models were developed to model the corporate performance
of some selected private companies. From the findings the researcher observed that there is a need to
model the corporate performance of some selected organizations. Based on the above findings the
researcher made recommendations that will help to improve the financial system.
Key words: Liquidity, Earnings per share, financial reports, IFRS, Regression Analysis, return on
investment (ROI) and Profitability
Introduction
The basis of financial planning analysis and decision making is the financial information. Financial
information is needed to predict, compare and evaluate a firm’s earning ability. It is also required to aid in
economic decision making investment and financing decision making. The financial information of an
enterprise is contained in the financial statements.
Financial statement according to Gavtam (2005) is defined as financial information which is the
information relating to financial position of any firm in a capsule form.
Financial statement according to Ohison (1999) was defined as a written report that summarizes the
financial status of an organization for a stated period of time. It includes an income statement and statement
of the financial position describing the flow of resources, profit and loss and the distribution or retention of
profit.
International Journal of Information, Business and Management, Vol. 8, No.2, 2016
ISSN 2076-9202
159
Financial statements are source documents of accounting information. They are referred to as the
final accounts. Information has been an important factor in decision making process. In recent times,
people and organizations try their best to acquire information in a timely manner to aid them as they
battle to manage their businesses. The increasing complexity of the society especially, as is manifested in
social, political and economic institutions, has necessitated the more, man’s quest for more relevant
information on a more regular basis. The processing of facts can be traced back to thousand years ago.
Every financial manager has been concerned with the processing of facts or data, about his
businesses operation so as to provide the most accurate and timely information to management. In order
to provide this accurate and timely information to management, financial manager continuously sought
more improved means of processing data. With the advent of industrial revolution, the need for faster,
more efficient and also other methods of processing data became apparent. To satisfy these needs, various
types of automated devices were introduced into the business world. Of these, electric computer is the
most efficient and foremost as well as the fastest, and most sophisticated device built by man to speedy up
communication and information system. This technique has immensely helped the Nigerian Banking
system to improve in their accounting system and also in decision making (Studymode.com, 2014).
The present trend in the preparation of financial statement is to ensure that IFRS principles are strictly
adhered to. Firstly, what do we mean by IFRS?
Many countries use or are moving towards using the International Financial Reporting Standards (IFRS),
which were established and maintained by the International Accounting Standards Board (IASB). In some
countries, local accounting principles are applied for regular companies, but listed or larger companies
must conform to the IFRS, so statutory reporting is comparable internationally, across jurisdictions
(boundless.com, 2014).
The objective of this research work is to model the impact of IFRS in corporate performance of the
shareholders and/or the investors, other specific objectives of the study include:
i. To determine whether financial reporting adopted has significance influence on liquidity of banks in
Nigeria.
ii. To determine whether financial reporting adopted has significance influence in earnings of banks in
Nigeria.
iii. To determine whether financial reporting adopted has significance influence on profitability in
Nigeria.
iv. To determine whether financial reporting adopted has significance influence on return on
investment (ROI) in Nigeria.
Hypotheses of the Study
For the purpose of this research work and for it to be effectively evaluated and considering the
nature and problems associated with banking industry.
International Journal of Information, Business and Management, Vol. 8, No.2, 2016
ISSN 2076-9202
160
The researcher considers the following hypotheses
H0: There is no significance relationship between financial reporting adopted and liquidity of banks
Hi: There is significance relationship between financial reporting adopted and liquidity of banks.
H0: To determine whether financial reporting adopted has no significance influence in earnings of banks
Hi: To determine whether financial reporting adopted has significance influence in earnings of b
Ho: To determine whether financial reporting adopted has no significance influence on profitability.
Hi: To determine whether financial reporting adopted has significance influence on profitability.
H0: To determine whether financial reporting adopted has no significance influence on return on
investment (ROI).
Hi: To determine whether financial reporting adopted has significance influence on return on investment
(ROI).
International Financial Reporting Standards (IFRS) are designed as a common global language for
business affairs so that company accounts are understandable and comparable across international
boundaries. They are a consequence of growing international shareholding and trade and are particularly
important for companies that have dealings in several countries. They are progressively replacing the
many different national accounting standards. The rules to be followed by accountants to maintain books
of accounts which is comparable, understandable, reliable and relevant as per the users internal or
external.
IFRS began as an attempt to harmonize accounting across the European Union but the value of
harmonization quickly made the concept attractive around the world. They are sometimes still called by
the original name of International Accounting Standards (IAS). IAS was issued between 1973 and 2001
by the Board of the International Accounting Standards Committee (IASC). On 1 April 2001, the new
International Accounting Standards Board (IASB) took over from the IASC the responsibility for setting
International Accounting Standards. During its first meeting the new Board adopted existing IAS and
Standing Interpretations Committee standards (SICs). The IASB has continued to develop standards
calling the new standards International Financial Reporting Standards.
In the absence of a Standard or an Interpretation that specifically applies to a transaction,
management must use its judgment in developing and applying an accounting policy that results in
information that is relevant and reliable. In making that judgment, IAS 8.11 requires management to
consider the definitions, recognition criteria, and measurement concepts for assets, liabilities, income, and
expenses in the Framework.
Requirements of IFRS
IFRS financial statements consist of (IAS1.8)
i. A statement of financial position
ii. A statement of comprehensive income separate statements comprising an income statement and
separately a statement of comprehensive income, which reconciles profit or loss on the income
statement to total comprehensive income
International Journal of Information, Business and Management, Vol. 8, No.2, 2016
ISSN 2076-9202
161
iii. A statement of changes in equity (SOCE)
iv. A cash flow statement or statement of cash flows
v. Notes, including a summary of the significant accounting policies
Comparative information is required for the prior reporting period (IAS 1.36). An entity preparing
IFRS accounts for the first time must apply IFRS in full for the current and comparative period although
there are transitional exemptions (IFRS1.7).
On 6 September 2007, the IASB issued a revised IAS 1 Presentation of Financial Statements. The
main changes from the previous version are to require that an entity must:
i. Present all non-owner changes in equity (that is, 'comprehensive income') either in one Statement of
comprehensive income or in two statements (a separate income statement and a statement of
comprehensive income). Components of comprehensive income may not be presented in the
Statement of changes in equity.
ii. Present a statement of financial position (balance sheet) as at the beginning of the earliest
comparative period in a complete set of financial statements when the entity applies the new
standard.
iii. Present a statement of cash flow.
iv. Make necessary disclosure by the way of a note.
The revised IAS 1 is effective for annual periods beginning on or after 1 January 2009. Early
adoption is permitted.
Method of Data Analysis
The descriptive method of data analysis was used to analyze data generated for the research. This
was supported for the research. This was supported by tables showing variables, responses and
percentages of the banks earning.
FGHIGJKLMG = NOPQGHRSTGUVRJUGWRKLXNYPQGHRSTGUVRJZGJKU × \]]\
The data generated for this study were analyzed with appropriate statistical techniques. The
techniques included percentages and regression analysis. The hypotheses postulated were put in null (Ho).
All analysis was done using software called Minitab version 16.1. The hypotheses were tested as follows.
Regression analysis is a statistical tool used to determine the relationship between two or more
variables. It determines the nature or direction, extent or degree and causal relationship between variables
International Journal of Information, Business and Management, Vol. 8, No.2, 2016
ISSN 2076-9202
162
(Kothari, 2004). In this study, regression analysis was used to develop a regression model which shows
that the approach is expressed in a mathematical equation as:
Y = a + b x
Where Y is the dependent variables or quantity being predicted = the independent variables
a = the value of Y when = 0, i.e. the interceptor of the line with Y – axis
b = the slope or gradient. It estimates the rate of change in Y for a unit change in X. It is positive
for direct and negative for inverse relationships.
Decision Rule
If the calculated correlations, t-tests, goodness of fit tests and regression show significant values, the
null hypothesis is rejected, given room for the acceptability of the alternative hypothesis.
But if the calculated results show a non significant value, the null hypothesis will be accepted, while
the alternative hypothesis will be rejected.
Presentation and Analysis of Data Based on Research Questions
Data were collected through the copies of the financial reports (i.e. five years of annual reports from each
of the selected banks) and were presented and analyzed in this chapter. In this research work, the
researcher makes use of tables, frequency, percentages and regression models in the analysis of the data.
Research Question 1
i. To determine whether financial reporting adopted has significance influence on liquidity of banks
Table 1: Responses to Research Question 1
S/N Bank Name Liquidity Percentage (%) of the Liquidity
1 Zenith (2009) 1.263801 20.6171
2 2010 1.243505 20.286
3 2011 1.207015 19.6907
4 2012 1.219124 19.8882
5 2013 1.196429 19.518
Total 6.129874 100
1 Fidelity (2009) 1.335846 20.9828
2 2010 1.391316 21.8541
3 2011 1.246674 19.5821
4 2012 1.214443 19.0759
5 2013 1.178102 18.5051
Total 6.366381 100
1 Diamond(2009) 1.22356 20.9445
2 2010 1.270858 21.7542
3 2011 1.121057 19.1899
4 2012 1.112749 19.0477
5 2013 1.113678 19.0636

International Journal of Information, Business and Management, Vol. 8, No.2, 2016
ISSN 2076-9202
163
Total 5.841902 100
1 First Bank (2009) 1.424769 22.0585
2 2010 1.589212 24.6044
3 2011 1.14793 17.7724
4 2012 1.158344 17.9337
5 2013 1.13879 17.6309
Total 6.459045 100
1 Eco (2009) 1.158998 20.6233
2 2010 1.140895 20.3012
3 2011 1.092936 19.4478
4 2012 1.122368 19.9715
5 2013 1.104651 19.6562
Total 5.619848 100
Table 1 above shows the liquidity of the selected banks (i.e. zenith, fidelity, First bank, Eco bank and
Diamond bank). It shows the annual report of the liquidity for a period of five year. The percentage
liquidity of the annual report was also observed for the period of five year on the selected banks.
Research Question 2
To determine whether financial reporting adopted has significance influence in earnings of banks.
Table 2: Responses to Research Question 2
S/N Bank Name Gross Earnings Percentage (%) of the Gross Earnings
1 Zenith (2009) 254,147 20.6823
2 2010 169,370 13.7832
3 2011 214,980 17.4949
4 2012 279,042 22.7082
5 2013 311,275 25.3313
Total 1228814 100
1 Fidelity (2009) 34,716 8.5414
2 2010 55,623 13.6853
3 2011 70,048 17.2344
4 2012 119,137 29.3122
5 2013 126,918 31.2266
Total 406442 100
1 Diamond(2009) 40,191,657 7.9149
2 2010 70,262,088 13.8366
3 2011 98,163,095 19.3311
4 2012 131,166,141 25.8304
5 2013 168,015,252 33.087
Total 507798233 100

International Journal of Information, Business and Management, Vol. 8, No.2, 2016
ISSN 2076-9202
164
1 First Bank (2009) 175,390 30.019
2 2010 230,606 39.4695
3 2011 21,395 3.6619
4 2012 95,834 16.4025
5 2013 61,039 10.4472
Total 584264 100
1 Eco (2009) 6,472,459 10.9618
2 2010 7,924,585 13.4211
3 2011 12,076,495 20.4528
4 2012 15,566,640 26.3637
5 2013 17,005,522 28.8006
Total 59045701 100
Table 2 above shows the gross earning of the selected banks (i.e. zenith, fidelity, First bank, Eco bank and
Diamond bank). It shows the annual report of the gross earning for a period of five year. The percentage
gross earning of the annual report was also observed for the period of five year on the selected banks.
Responses to Research Question 3
i. To determine whether financial reporting adopted has significance influence on profitability.
Table 3: Responses to Research Question 3
S/N Bank Name Profitability Percentage (%)of the Profitability
1 Zenith (2009) 3.416109 9.4308
2 2010 2.164329 5.975
3 2011 3.810851 10.5206
4 2012 9.267073 25.5835
5 2013 17.56454 48.4902
Total 36.2229 100
1 Fidelity (2009) 0.443211 8.8856
2 2010 1.393566 27.9385
3 2011 1.963353 39.3617
4 2012 0.820884 16.4572
5 2013 0.366968 7.357
Total 4.987982 100
1 Diamond(2009) 1.889218 8.0631
2 2010 2.273187 9.7019
3 2011 6.20352 26.4765
4 2012 5.900619 25.1837
5 2013 7.163736 30.5747
Total 23.43028 100
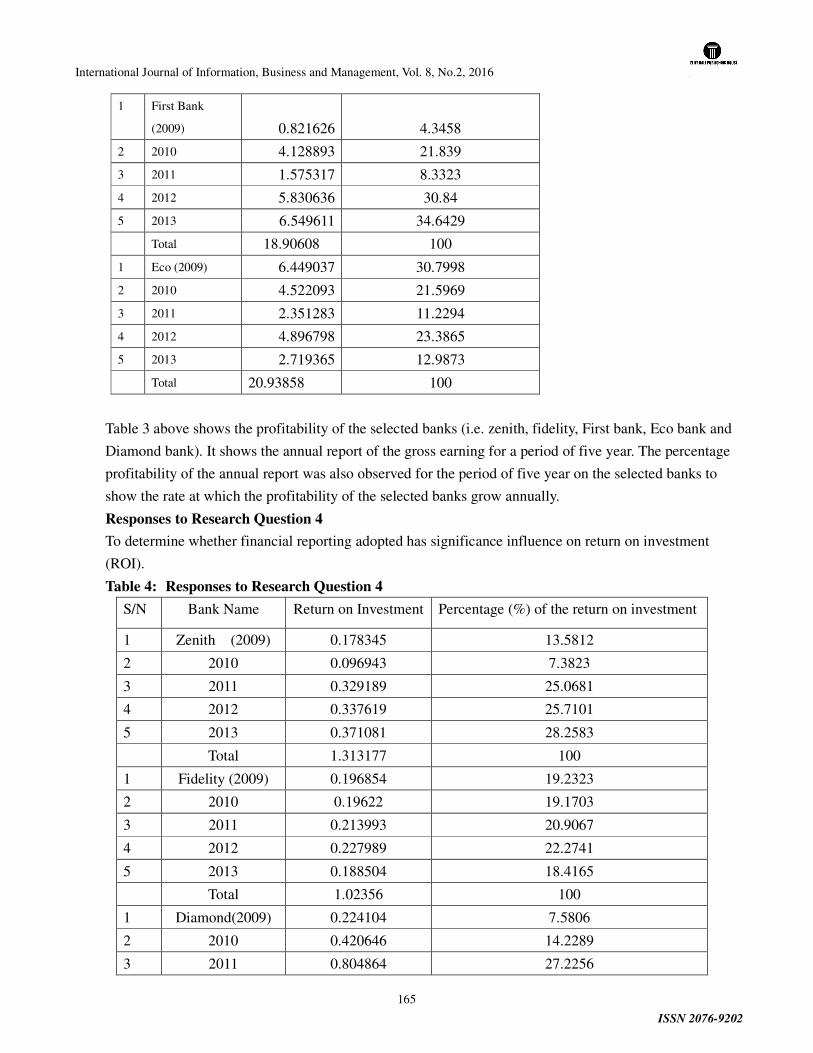
International Journal of Information, Business and Management, Vol. 8, No.2, 2016
ISSN 2076-9202
165
1 First Bank
(2009) 0.821626 4.3458
2 2010 4.128893 21.839
3 2011 1.575317 8.3323
4 2012 5.830636 30.84
5 2013 6.549611 34.6429
Total 18.90608 100
1 Eco (2009) 6.449037 30.7998
2 2010 4.522093 21.5969
3 2011 2.351283 11.2294
4 2012 4.896798 23.3865
5 2013 2.719365 12.9873
Total 20.93858 100
Table 3 above shows the profitability of the selected banks (i.e. zenith, fidelity, First bank, Eco bank and
Diamond bank). It shows the annual report of the gross earning for a period of five year. The percentage
profitability of the annual report was also observed for the period of five year on the selected banks to
show the rate at which the profitability of the selected banks grow annually.
Responses to Research Question 4
To determine whether financial reporting adopted has significance influence on return on investment
(ROI).
Table 4: Responses to Research Question 4
S/N Bank Name Return on Investment Percentage (%) of the return on investment
1 Zenith (2009) 0.178345 13.5812
2 2010 0.096943 7.3823
3 2011 0.329189 25.0681
4 2012 0.337619 25.7101
5 2013 0.371081 28.2583
Total 1.313177 100
1 Fidelity (2009) 0.196854 19.2323
2 2010 0.19622 19.1703
3 2011 0.213993 20.9067
4 2012 0.227989 22.2741
5 2013 0.188504 18.4165
Total 1.02356 100
1 Diamond(2009) 0.224104 7.5806
2 2010 0.420646 14.2289
3 2011 0.804864 27.2256

International Journal of Information, Business and Management, Vol. 8, No.2, 2016
ISSN 2076-9202
166
4 2012 0.790195 26.7294
5 2013 0.716464 24.2354
Total 2.956273 100
1 First Bank (2009) 0.046596 3.3303
2 2010 0.0479 3.4235
3 2011 0.374898 26.7946
4 2012 0.485046 34.6671
5 2013 0.444714 31.7845
Total 1.399154 100
1 Eco (2009) 0.011538 12.7965
2 2010 0.008565 9.4993
3 2011 0.01271 14.0964
4 2012 0.031691 35.1478
5 2013 0.025661 28.46
Total 0.090165 100
In Table 4 above shows the profitability of the selected banks (i.e. zenith, fidelity, First bank, Eco bank
and Diamond bank). It shows the annual report of the gross earning for a period of five year. The
percentage profitability of the annual report was also observed for the period of five year on the selected
banks to show the rate at which the profitability of the selected banks grow annually.
Test of Hypothesis 1
The researcher in the study precisely in chapter one formulated a hypothesis and this have to be tested in
order to verify the validity of the working hypothesis. The percentages and partial least square regression
analysis were employed.
PLS Regression: Banks versus Zenith, Fidelity, Diamond, Eco bank, First Bank
Method
Cross-validation None
Components to calculate Set
Number of components calculated 4
Analysis of Variance for Banks
Source DF SS MS F P
Regression 4 10 2.5 * *
Residual Error 0 0 *
Model Selection and Validation for Banks
Components X Variance Error R-Sq
1 0.89655 2.28883 0.77112
2 0.93641 0.64120 0.93588
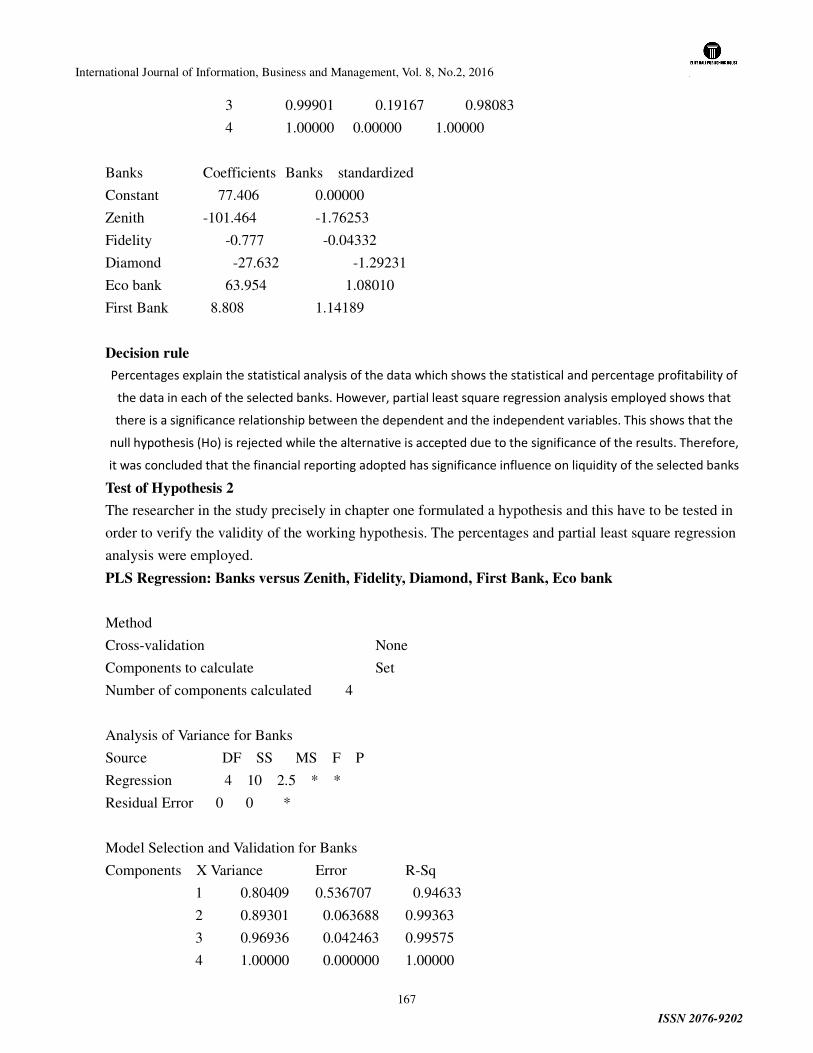
International Journal of Information, Business and Management, Vol. 8, No.2, 2016
ISSN 2076-9202
167
3 0.99901 0.19167 0.98083
4 1.00000 0.00000 1.00000
Banks Coefficients Banks standardized
Constant 77.406 0.00000
Zenith -101.464 -1.76253
Fidelity -0.777 -0.04332
Diamond -27.632 -1.29231
Eco bank 63.954 1.08010
First Bank 8.808 1.14189
Decision rule
Percentages explain the statistical analysis of the data which shows the statistical and percentage profitability of
the data in each of the selected banks. However, partial least square regression analysis employed shows that
there is a significance relationship between the dependent and the independent variables. This shows that the
null hypothesis (Ho) is rejected while the alternative is accepted due to the significance of the results. Therefore,
it was concluded that the financial reporting adopted has significance influence on liquidity of the selected banks
Test of Hypothesis 2
The researcher in the study precisely in chapter one formulated a hypothesis and this have to be tested in
order to verify the validity of the working hypothesis. The percentages and partial least square regression
analysis were employed.
PLS Regression: Banks versus Zenith, Fidelity, Diamond, First Bank, Eco bank
Method
Cross-validation None
Components to calculate Set
Number of components calculated 4
Analysis of Variance for Banks
Source DF SS MS F P
Regression 4 10 2.5 * *
Residual Error 0 0 *
Model Selection and Validation for Banks
Components X Variance Error R-Sq
1 0.80409 0.536707 0.94633
2 0.89301 0.063688 0.99363
3 0.96936 0.042463 0.99575
4 1.00000 0.000000 1.00000
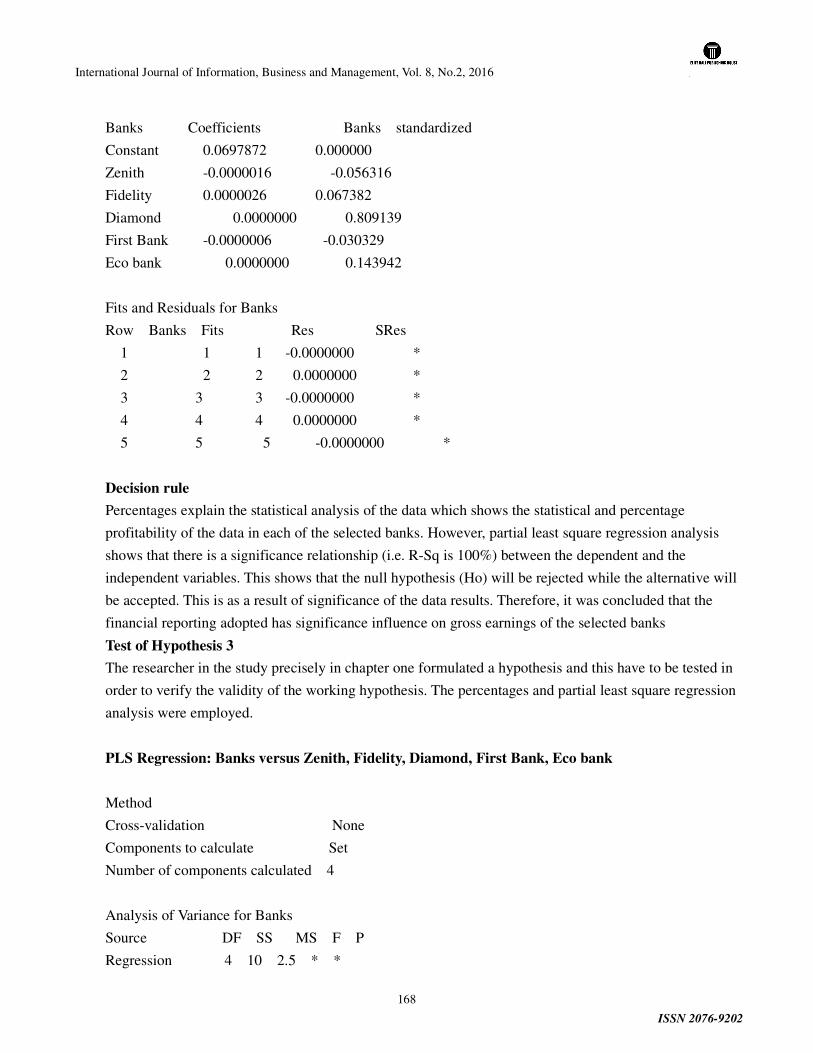
International Journal of Information, Business and Management, Vol. 8, No.2, 2016
ISSN 2076-9202
168
Banks Coefficients Banks standardized
Constant 0.0697872 0.000000
Zenith -0.0000016 -0.056316
Fidelity 0.0000026 0.067382
Diamond 0.0000000 0.809139
First Bank -0.0000006 -0.030329
Eco bank 0.0000000 0.143942
Fits and Residuals for Banks
Row Banks Fits Res SRes
1 1 1 -0.0000000 *
2 2 2 0.0000000 *
3 3 3 -0.0000000 *
4 4 4 0.0000000 *
5 5 5 -0.0000000 *
Decision rule
Percentages explain the statistical analysis of the data which shows the statistical and percentage
profitability of the data in each of the selected banks. However, partial least square regression analysis
shows that there is a significance relationship (i.e. R-Sq is 100%) between the dependent and the
independent variables. This shows that the null hypothesis (Ho) will be rejected while the alternative will
be accepted. This is as a result of significance of the data results. Therefore, it was concluded that the
financial reporting adopted has significance influence on gross earnings of the selected banks
Test of Hypothesis 3
The researcher in the study precisely in chapter one formulated a hypothesis and this have to be tested in
order to verify the validity of the working hypothesis. The percentages and partial least square regression
analysis were employed.
PLS Regression: Banks versus Zenith, Fidelity, Diamond, First Bank, Eco bank
Method
Cross-validation None
Components to calculate Set
Number of components calculated 4
Analysis of Variance for Banks
Source DF SS MS F P
Regression 4 10 2.5 * *
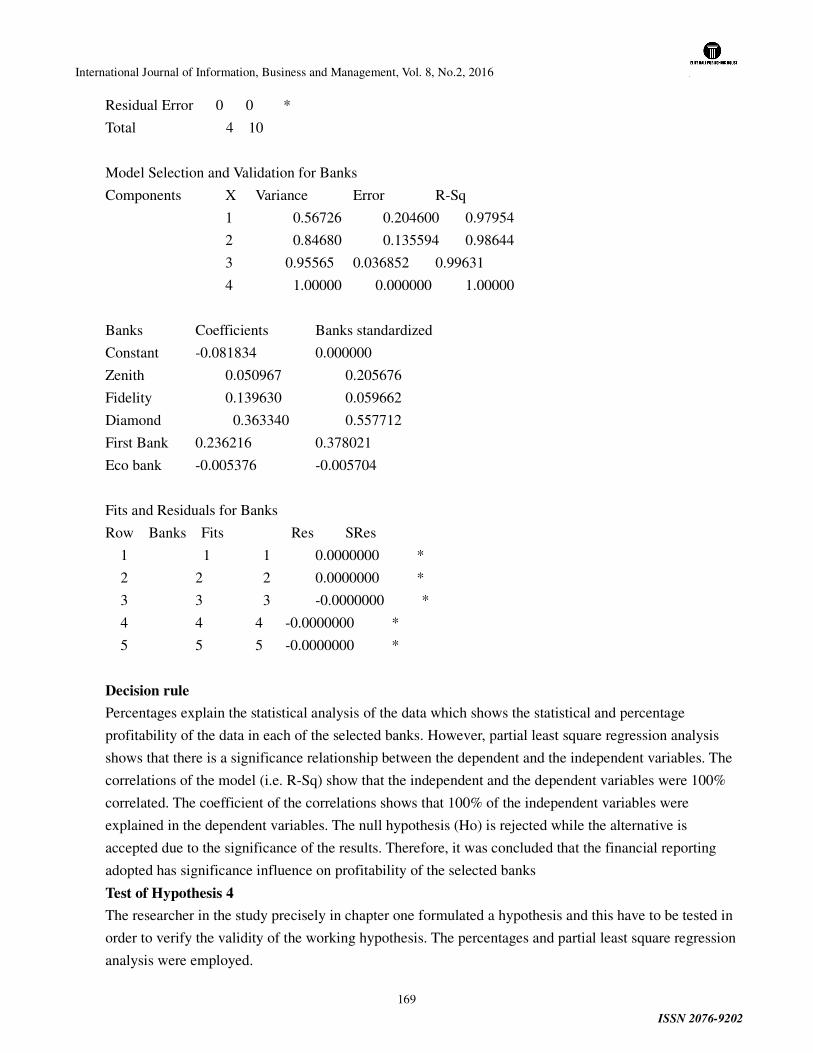
International Journal of Information, Business and Management, Vol. 8, No.2, 2016
ISSN 2076-9202
169
Residual Error 0 0 *
Total 4 10
Model Selection and Validation for Banks
Components X Variance Error R-Sq
1 0.56726 0.204600 0.97954
2 0.84680 0.135594 0.98644
3 0.95565 0.036852 0.99631
4 1.00000 0.000000 1.00000
Banks Coefficients Banks standardized
Constant -0.081834 0.000000
Zenith 0.050967 0.205676
Fidelity 0.139630 0.059662
Diamond 0.363340 0.557712
First Bank 0.236216 0.378021
Eco bank -0.005376 -0.005704
Fits and Residuals for Banks
Row Banks Fits Res SRes
1 1 1 0.0000000 *
2 2 2 0.0000000 *
3 3 3 -0.0000000 *
4 4 4 -0.0000000 *
5 5 5 -0.0000000 *
Decision rule
Percentages explain the statistical analysis of the data which shows the statistical and percentage
profitability of the data in each of the selected banks. However, partial least square regression analysis
shows that there is a significance relationship between the dependent and the independent variables. The
correlations of the model (i.e. R-Sq) show that the independent and the dependent variables were 100%
correlated. The coefficient of the correlations shows that 100% of the independent variables were
explained in the dependent variables. The null hypothesis (Ho) is rejected while the alternative is
accepted due to the significance of the results. Therefore, it was concluded that the financial reporting
adopted has significance influence on profitability of the selected banks
Test of Hypothesis 4
The researcher in the study precisely in chapter one formulated a hypothesis and this have to be tested in
order to verify the validity of the working hypothesis. The percentages and partial least square regression
analysis were employed.

International Journal of Information, Business and Management, Vol. 8, No.2, 2016
ISSN 2076-9202
170
PLS Regression: Banks versus Zenith, Fidelity, Diamond, First Bank, Eco bank
Method
Cross-validation None
Components to calculate Set
Number of components calculated 4
Analysis of Variance for Banks
Source DF SS MS F P
Regression 4 10 2.5 * *
Residual Error 0 0 *
Model Selection and Validation for Banks
Components X Variance Error R-Sq
1 0.74935 2.04758 0.79524
2 0.90132 0.61258 0.93874
3 0.92457 0.00008 0.99999
4 1.00000 0.00000 1.00000
Banks Coefficients Banks standardized
Constant 9.9418 0.000000
Zenith -4.0955 -0.307492
Fidelity -52.1548 -0.527903
Diamond 4.4409 0.722639
First Bank 2.5493 0.348169
Eco bank 81.5989 0.519222
Fits and Residuals for Banks
Row Banks Fits Res SRes
1 1 1 0.0000000 *
2 2 2 -0.0000000 *
3 3 3 0.0000000 *
4 4 4 0.0000000 *
5 5 5 -0.0000000 *
Decision rule
Percentages explain the statistical analysis of the data which shows the statistical and percentage
profitability of the data in each of the selected banks. However, partial least square regression analysis
shows that there is a significance relationship between the dependent and the independent variables. The
correlations of the model (i.e. R-Sq) show that the independent and the dependent variables were 100%
International Journal of Information, Business and Management, Vol. 8, No.2, 2016
ISSN 2076-9202
171
correlated. The coefficient of the correlations shows that 100% of the independent variables were
explained in the dependent variables. The null hypothesis (Ho) is rejected while the alternative is
accepted. This is as a result of significance of the data. Therefore, it was concluded that the financial
reporting adopted has significance influence on return on investment (ROI).
Summary of Findings, Conclusions and Recommendations
This chapter aimed to review the problems investigated, summarized the methods adopted in the study,
summarized the research findings, draw conclusions and make recommendations.
Summary of Findings
The findings of this research investigated are as follows:
The adoption of IFRS system in financial reporting is beneficial to the selected banks.
The financial reporting adopted has significance influence on annual liquidity of the selected banks
The financial reporting adopted has significance influence in earnings of the selected banks.
The financial reporting adopted has significance influence on the annual profitability of the selected
banks.
The financial reporting adopted has significance influence on annual return on investment (ROI) in
the selected banks.
Conclusion
From the findings above, there is a need to have published the financial reports of the selected
organization, because it helps the investors and the shareholders to have a perfect financial report that will
indicate perfect information for investment decision making. However, for financial statement to be more
effective in investment decision-making, accountants must try not to become barriers to effective
communication in other to attract more investors to the case study banking industries for the growth of the
selected banks.
Based on the findings, the researcher made the following recommendations.
Accountants should as well utilize grapevine information because it tends to facilitate social relationship
between organizational members.
Accountants should be continuously trained to keep them abreast with the up-to-date development and
improved communication.
To enhance communication network effectively for decision-making, the organizational structure and
rules should be carved out in such a way as not to limit one’s freedom
There is a need to adoption of IFRS system in financial reports which will be beneficial to the selected
banks.
There is a need to publish the financial statements of the selected banks in order to attract more investors
There is need to improve financial statements of the selected case study banks annually.
There is a need of effective financial reports in other to attract more foreign investors

International Journal of Information, Business and Management, Vol. 8, No.2, 2016
ISSN 2076-9202
172
ReferencesReferencesReferencesReferences
1. History of Accountancy, New York State Society of CPAs, November 2003, retrieved December 28, 2013.
2. Harper, Douglas. "communication". Online Etymology Dictionary. Retrieved 2013-06-23.
3. Heeffer, Albrecht (November 2009). "On the curious historical coincidence of algebra and double-entry bookkeeping". Foundations of the Formal Sciences. Ghent University. p. 11.
4. Heyman, Richard. Why Didn't You Say That in the First Place? How to Be Understood at Work Retrieved 2013-02-28.
5. Horngren, Charles T.; Datar, Srikant M.; Foster, George (2006), Cost Accounting: A Managerial Emphasis (12th ed.), New Jersey: Pearson Prentice Hall
6. http://www.accountingcoach.com/accounting-principles/explanation retrieved march 2014 7. http://www.publishyourarticles.net/knowledge-hub/accounting/what-are-the-functions-of-accounting.
html, retrieved on April 2013. 8. http://www.studymode.com/essays/Effect-Of-Information-System-On-Accounting-1523069.html
retrieved on 2014-03-28
9. Knowledge guide to UK Accounting Standards, ICAEW, 2014, retrieved January 1, 2014
10. Leeuwen, Theo Van. Reading Images: The Grammar of Visual Design. Routledge, 2006 - Pg. 4
11. Lung, Henry (2009). Fundamentals of Financial Accounting. Elsevier.
12. Needles, Belverd E.; Powers, Marian (2013). Principles of Financial Accounting. Financial Accounting Series (12 ed.). Cengage Learning.
13. Oldroyd, David & Dobie, Alisdair: Themes in the history of bookkeeping, The Routledge Companion to Accounting History, London, July 2008, ISBN 978-0-415-41094-6, Chapter 5, p. 96
14. Oldroyd, David: The role of accounting in public expenditure and monetary policy in the first century AD Roman Empire, Accounting Historians Journal, Volume 22, Number 2, Birmingham, Alabama, December 1995, p.124, Olemiss.edu,, retrieved December 28, 2013.
15. Peggy Bishop Lane on Why Accounting Is the Language of Business, Knowledge @ Wharton High School, September 23, 2013, retrieved December 25, 2013
16. Perks, R. W. (1993). Accounting and Society. London: Chapman & Hall. p. 16. ISBN 0-412-47330-5, retrieved December 28, 2013.
17. Pixley, Francis William: Accountancy—constructive and recording accountancy (Sir Isaac Pitman & Sons, Ltd, London, 1900), p4
18. Robbins, S., Judge, T., Millett, B., & Boyle, M. (2011). Organisational Behaviour. 6th ed. Pearson, French's Forest, NSW p315-317.

International Journal of Information, Business and Management, Vol. 8, No.2, 2016
ISSN 2076-9202
173
19. Robson, Keith. 1992. “Accounting Numbers as ‘inscription’: Action at a Distance and the Development of Accounting.” Accounting, Organizations and Society 17 (7): 685–708.
20. Roy M. Berko, et al., Communicating. 11th ed. (Boston, MA: Pearson Education, Inc., 2010) 9-12
21. Schramm, W. (1954). How communication works. In W. Schramm (Ed.), The Process and Effects of Communication (pp. 3–26). Urbana, Illinois: University of Illinois Press.
22. Shannon, C. E., & Weaver, W. (1949). The Mathematical Theory of Communication. Urbana, Illinois: University of Illinois Press
23. Shannon, Claude E. (1949). The Mathematical Theory of Communication.
24. Stephen B. Wicker, Saejoon Kim (2003). Fundamentals of Codes, Graphs, and Iterative Decoding. Springer. pp. 1 ff. ISBN 1-4020-7264-3.
25. Vigo, R. (2011). "Representational information: a new general notion and measure of information". Information Sciences, 181 (2011),4847-4859.
26. Vigo, R. (2013).Complexity over Uncertainty in Generalized Representational Information Theory (GRIT): A Structure-Sensitive General Theory of Information. Information, 4(1), 1-30; doi:10.3390/info4010001
27. Weber, Richard P., and W. C. Stevenson. 1981. “Evaluations of Accounting Journal and Department Quality.” The Accounting Review 56 (3): 596–612.
28. Wisconsin Business Alumni; Why Good Communication Is Good Business; Marty Blalock retrieved on 2005
29. Witzany, G (ed) (2012). Biocommunication of Fungi. Springer. ISBN 9978-94-007-4263-5
30. Wollner, Alexandre. Visual Design 50 years. Cosac & Naify, 2003
31. Wood, J. T. (2009). Communication in Our Lives (4th ed.). Belmont, CA: Thomson-Wadsworth.
32. Xin Li. "Complexity Theory - the Holy Grail of 21st Century". Lane Dept of CSEE, West Virginia University Retrieved 2013-09-20.http://indiacode.nic.in/coiweb/welcome.html
International Journal of Information, Business and Management, Vol. 8, No.2, 2016
ISSN 2076-9202
174
STRUCTURAL CHANGES AND PRODUCTIVITY TRENDS’
EVIDENCE FROM JORDAN’S MANUFACTURING INDUSTRY (2000
– 2014)
Mohammad.M . Alalaya
AlHussien Ben Talal University – Ma'an
Administrative and Economics Faculty
E-mail: [email protected]
Adel Al Khattab
Al-Hussain Bin Talal University
College of Business School, Department of Accounting,
Ma’an, Jordan. Tel: +962 777 640 240
Mahmaod Al-Rawad
Al-Hussain Bin Talal University
College of Business School, Department of Accounting
Ma’an, Jordan. Tel: +962 790206960
Abstract:
This paper investigated the productivity in Jordan industry, and the impacts of innovations,
structural changes, technological changes, foreign direct investment, investment, and the effect of treaty
and regulations of world trade organization (W.T.O).
In this paper, the data series collected are from different sources for the period 2001 – 2014. The
data of inputs and outputs were transferred to logarithm. Translog method used an estimated series by
least square series, once with dummies of industries and other times, without a translog prediction
function. The other model is utilized in the analysis of data such as fixed effects and random effects to
estimate the (KLAMS) function. Then, LML (Limited Maximum Likelihood) method to capture the
International Journal of Information, Business and Management, Vol. 8, No.2, 2016
ISSN 2076-9202
175
coefficients of productivity manufacturing industries in Jordan and estimate the coefficients of
independent variables such as chemical and fertilizer, petroleum and service sectors among other factors
of production function.
Positive relationship remarked the signs of innovation and technology. TFP and W.T.O. were tagged
time.(t-1) is used to show the impact of the total gross productivity on these variable, the elasticity for
these variables sometimes is too weak and in some cases, close to one. It means that capital and labor
demands are more elastic than demand of materials, foreign direct investment and innovations and
structural changes. Hence, the paper presents an alternative set of estimates of TFP growth of Jordan
manufacturing industry, the water demand increased in the period of the study within 8% while the
industrial productivity increased 5.6% as a compound average.
Key words: TFP (total factor productivity) translog production function,
Jell classification: D2 / D24.
Section one : Introduction:
Generally, productivity signifies the measurement of how well an individual entity uses its
resources to produce outputs from inputs a glance at the productivity literature and its various application
quickly reveals that there is neither a productivity have focused on the individual labor productivity
estimates are often performed by using combination of analytical techniques and personal judgment
(Portas and Abdul rizak, 1997), but worker haves estimates are usually obtained through direct interaction
with a scheduler, the site manager or related sub contractors who are knowledgeable enough to reflect
the actual condition of project and its constituent. Circumstantial evidence points to the services industries,
(Griliches,1994),pointed out that some of services industries in the period 1947 to 1973 whose
productivity growth rates were higher than productivity growth the manufacturing industries .Also,
innovation means some improvements in productivity and firms’ input and output based on acts and
audretch results , many more of the innovative firms will have introduced improvements to existing
products rather than entirely new goods and services . (Kongsamut,et al ; 1997)making comparison across

International Journal of Information, Business and Management, Vol. 8, No.2, 2016
ISSN 2076-9202
176
countries’ results indicates to appositive relationship between the per capita income and the intensity of
use of services in manufacturing industries. Industrial firms make use of services procured from outside
because of the advantages offered by these services .In the production firms, process service produced
generally depends on:
1) The relative cost of in –house provision of service as against their procurement from outside
agencies which in the firms, culture of employment and type of technology.
2) The pressure on the firm to rise affected reduction in cost and improved competitiveness which
depends on the domestic and international competition.
3) Available services which depend on the level of development of the service sector in the
economy beyond the management plans of the firms.
Rubal Cabo, 2007,taking the new characteristic of the service economy as a basis, his
analysis is reasonable; the analysis represents the major share of developed economies and are
increasingly integrated in the overall production system.
Secondly, the creation of employments added value and income is increasingly related to good
performance economies of services.
Thirdly, they played a more active role in market integration and globalization. This means that the
analyses will be deep into the role impact of services in economics growth and productivity. This is one of
the most conventional statements in economics with regard to other industrial sectors as whole.
Truly, in this century, all highly industrialized countries have become service economies, as
we considered the share of the work force in services and even more so if the employment share in
service occupations is considered. As few authors (Schettkat, 2003 and Tocarini, 2006), (Bosworth and
Tripeltt, 2001) and (Rubaicaba, 2007) suggested that Baumol's hypothesis may still hold validity for the
service sectors as such.
(Messina, 2004; OCED, 2005 a) growth and development of services might be based on

International Journal of Information, Business and Management, Vol. 8, No.2, 2016
ISSN 2076-9202
177
human capital, it is known fact that production in the tertiary sector has a higher amount of qualified labor
than in manufacturing the growth of some business services (such as management Consultants has been
associated with the accumulation of expertise and specialization processes. (Stanback, 1979), and (Wood,
1991) have the opinion that says competitive pressures associated with market globalization have changed
the relationships among companies,thereby increasing the need for modernization and promoting
interaction.
(Echevarria, 1979; Kongssamut, et. al., 1997) ;.( Xu, 1993); ( Kozicki, 1997), assumed
a standard in multisectoral growth models that service sector exhibits lower productivity growth than
other manufacturing industries .(Bontelsman, et. al., 2006) ;( Hsieh and Klenow, 2009), have focused on
the dispersion in total productivity across plants; the former for the arrangement of advanced and semi
industrial economies and the latter of china and India. They have found that between a third and a half of
the gap in these countries manufacturing TFP via – avis ,would be closed the excess dispersion in plant
productivity were removed. There is a parallel between many studies, they attempted to capture the
finer details of misallocation with individual sectors and cross plants and firms but a compensating factor
may able to track the general equilibrium effects of reallocation. (Diewert and Nakamura, 2009),
say that the bias to the input price index will be proportional to the growth in share captured by the low
cost supplier and the percentage discount offered by the low-cost supplier, and of growth in the input
price index is overstated, productivity and real value added will also be observed and they have using a
variety of assumption about the magnitude of the discounts from off shoring.
(Feenstra, et. al., 2009) who documented the effect of various biases in published
statistics for aggregate output of measurement problems, which are tantamount to under reported term of
trade gains, create a significant upward bias to measured output and multifactor productivity growth in
the U.S.A. Changes in the industrial activity (production effects), changes in the structural of
production output over time (the structural effects , and changes in energy efficiencies of individual
industries, comparison the linkages between decomposition methods and economic index number can be
stated for Jordan that analyzed current and future energy requirement for different sectors and
International Journal of Information, Business and Management, Vol. 8, No.2, 2016
ISSN 2076-9202
178
industries. ( Abdalat, et.al, 2011). When we study the consumption of energy of Jordanian industrial
sector, the paper showed that the main driver behind the energy demand increase between 1998 – 2005
was the rapid increase in industrial production output. However, implying innovation, technical changes,
diffusion and adaptability to more efficient technologies and the structural changes in the industrial sector
have been countered this rapid increase. (Hanibbaani and Shania, 1989) had estimated two inputs,
Cobb-Douglas production function for Jordanian industrial sector 1967 – 1986. They found that
production function were decreasing returns to scale over the period of study.
Section two:
2 – 1: Literature review of structural of productivity in Jordan :
1: Productivity: Productivity can be defined as "is the quantity of output that can be produced by using a
given level of inputs. At this level of the definition, there is not even a presumption of optimality or
efficiency in production. The relationship between output and the level of inputs using a production
function which can be express as follows:
Q= AKa L
B…………. (1)
Where: Q is output, K is the capital stock level and L is labor. A is the overall level of productivity
which may vary a cross entities. Where Total Factor Productivity (TFP) can be as follows:
TFP = ait = ait + acit + Blit ……… (2) (i= entity, t= time).
Two approaches can be used to estimates the parameters A and B. One of them will assume the
input markets are competitive, which implies that the coefficients are the share of revenue received by
each factors. The second approach assumed that coefficients are constant across entities and estimate
them via regression. In essence, some technical change or innovation has been transformed from TFP to
its input. Universal productivity indicators have aimed to work out with concept of total factor
productivity measures; partial and total factor productivity measures are represented in figure (1).
Figure (1):Measures of Productivity Methodological Approaches
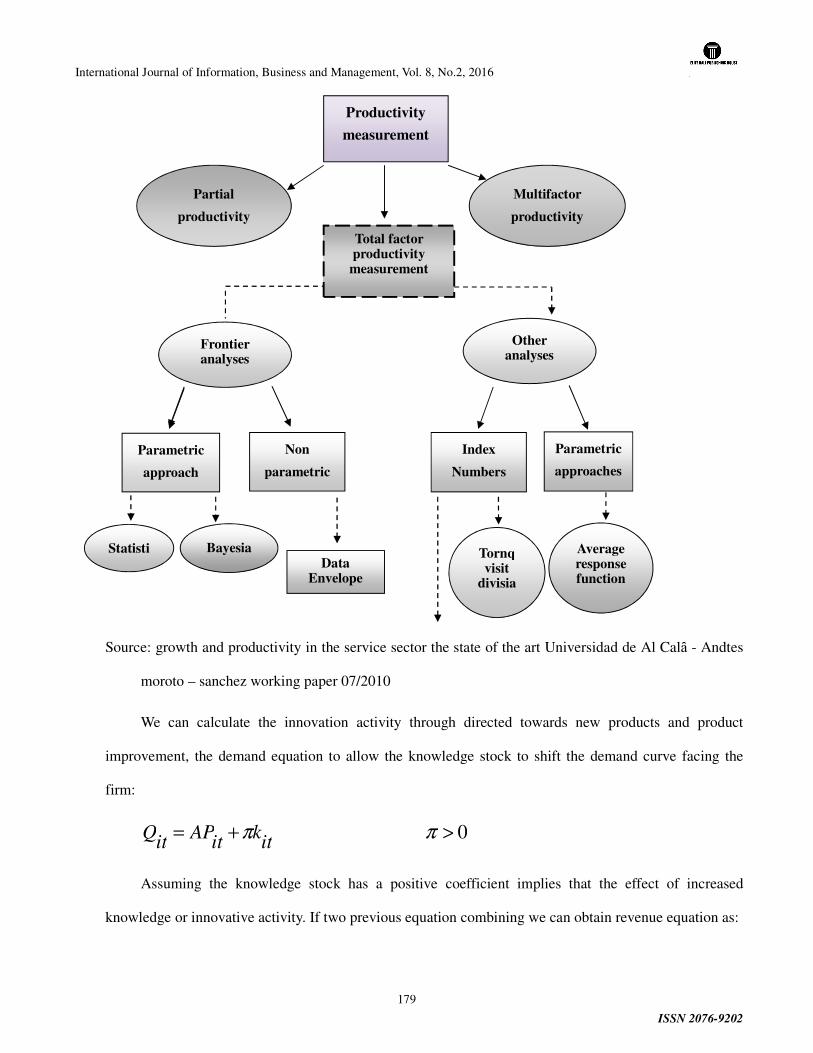
International Journal of Information, Business and Management, Vol. 8, No.2, 2016
ISSN 2076-9202
179
Source: growth and productivity in the service sector the state of the art Universidad de Al Calȃ - Andtes
moroto – sanchez working paper 07/2010
We can calculate the innovation activity through directed towards new products and product
improvement, the demand equation to allow the knowledge stock to shift the demand curve facing the
firm:
0 >+= ππit
kit
APit
Q
Assuming the knowledge stock has a positive coefficient implies that the effect of increased
knowledge or innovative activity. If two previous equation combining we can obtain revenue equation as:
Productivity
measurement
Multifactor
productivity
Partial
productivity
Total factor productivity measurement
Frontier analyses
Other analyses
Average response function
Statisti Tornq visit
divisia
Bayesia
Parametric
approaches
Index
Numbers
Theory
Non
parametric
Parametric
approach
Data Envelope

International Journal of Information, Business and Management, Vol. 8, No.2, 2016
ISSN 2076-9202
180
itk
itBl
ita
itr ))1(()(1
ηηηγ
ηη −+
+++
= ………,(4 )
Two Channels can be measured productivity growth, one of them directly increasing the efficiency
of production, and indirect by shifting the demand curve for the firms products outward (η is negative),
the analysis of supply side sources of growth of Jordan manufacturing is based on a KLEMS production
function estimated by panel data procedure. The equation can be written:
........),.........;,,,,(it
Ait
Sit
Mit
Eit
Lit
kfit
Q =
Where: E: energy (fuel and power), M: material, and s: services i and t are for industry and time and
Ait represents technology, through this term, inter industrial and inter temporal aviation in total (factor
productivity are incorporated into the production function a Cobb-Douglas term represents the efficiency
Ait has been speechified as exp (Ci) + exp (Nt), we can use the logarithmic transformation. Therefore the
production function can be as follows:
ititS ln it Eln Mln itk ln 2a t )it(L Ln1a ita )it(Q nL ∑+++++=+= θσµς …………………
……………… (6)
2 - 2- Intermediate materials:
As depicted, the aggregate share of imported intermediate goods has increased in Jordan trade from
20% to 35% over the period of this study, (2001 – 2014), driven up largely by increasing the detailed
product data underlying the aggregate shares. Thus, we can determine the share of countries accruing at
which countries expense through the data of Jordanian trade, intermediate share is growing faster than
domestic share which has failed.
Implying that advanced input share is falling as well as other developing countries after 2007. Most
of the action involves the shifting from domestic sources to developing and intermediate foreign
sources.Since there are no direct data sources for this discount spanning the large number of industries of
Jordan .Specifically, the price changes were computed when a given firm switches providers to a new
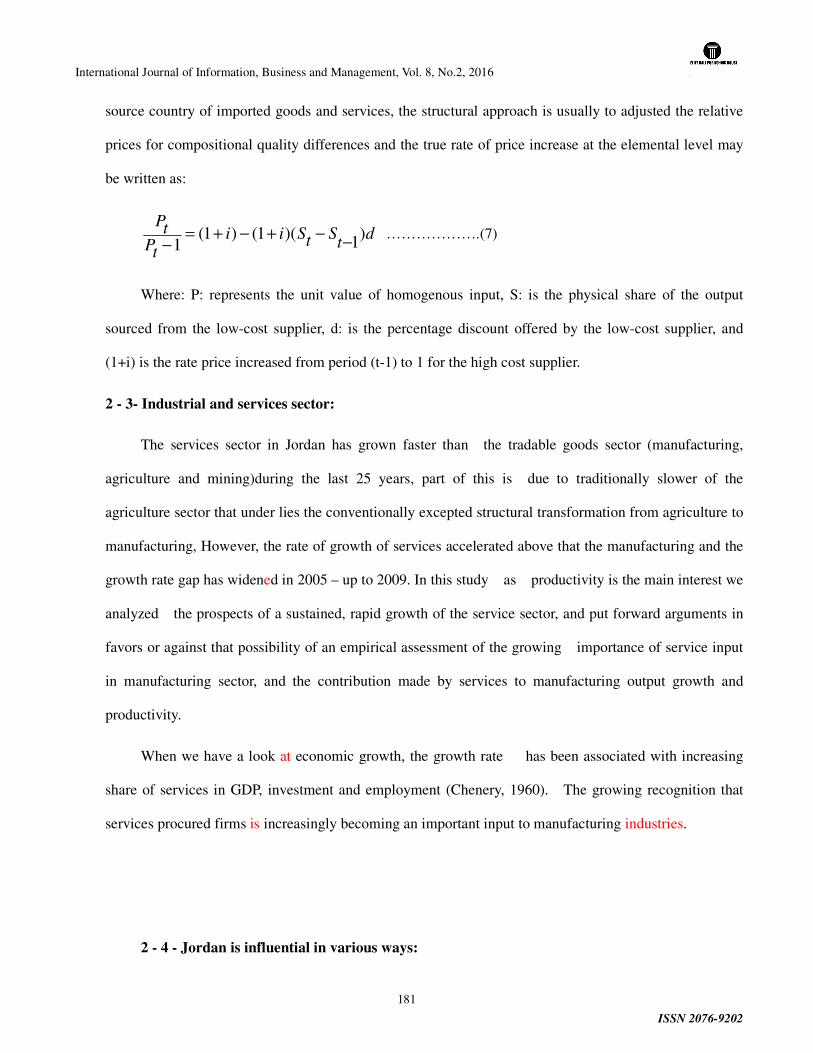
International Journal of Information, Business and Management, Vol. 8, No.2, 2016
ISSN 2076-9202
181
source country of imported goods and services, the structural approach is usually to adjusted the relative
prices for compositional quality differences and the true rate of price increase at the elemental level may
be written as:
dt
StSiitP
tP)1)(1()1(
1 −−+−+=
− ……………….(7)
Where: P: represents the unit value of homogenous input, S: is the physical share of the output
sourced from the low-cost supplier, d: is the percentage discount offered by the low-cost supplier, and
(1+i) is the rate price increased from period (t-1) to 1 for the high cost supplier.
2 - 3- Industrial and services sector:
The services sector in Jordan has grown faster than the tradable goods sector (manufacturing,
agriculture and mining)during the last 25 years, part of this is due to traditionally slower of the
agriculture sector that under lies the conventionally excepted structural transformation from agriculture to
manufacturing, However, the rate of growth of services accelerated above that the manufacturing and the
growth rate gap has widened in 2005 – up to 2009. In this study as productivity is the main interest we
analyzed the prospects of a sustained, rapid growth of the service sector, and put forward arguments in
favors or against that possibility of an empirical assessment of the growing importance of service input
in manufacturing sector, and the contribution made by services to manufacturing output growth and
productivity.
When we have a look at economic growth, the growth rate has been associated with increasing
share of services in GDP, investment and employment (Chenery, 1960). The growing recognition that
services procured firms is increasingly becoming an important input to manufacturing industries.
2 - 4 - Jordan is influential in various ways:

International Journal of Information, Business and Management, Vol. 8, No.2, 2016
ISSN 2076-9202
182
Apart from the existence of public services and the management of services in liberalization
processes, we can also recreate public regulations in Jordan, then, set a growth factor for some services,
such as professional services and the private institutions which have also undergone social changes that
have boosted the growth of specific services. Summarily, four types of essential changes can be
distinguished as group factors affecting the growth of productivity , namely; changes in production
factors mainly labor and human capital, changes in productive system (flexibility and integration goods
and services), changes in markets and income (due to economic growth and external economics) and
lastly changes in institutional systems (public services, regulations, cultural and social changes); for each
of these factors, three decisive elements of current societies interact. We can summarize the relationship
between services and economic growth as figure (2).
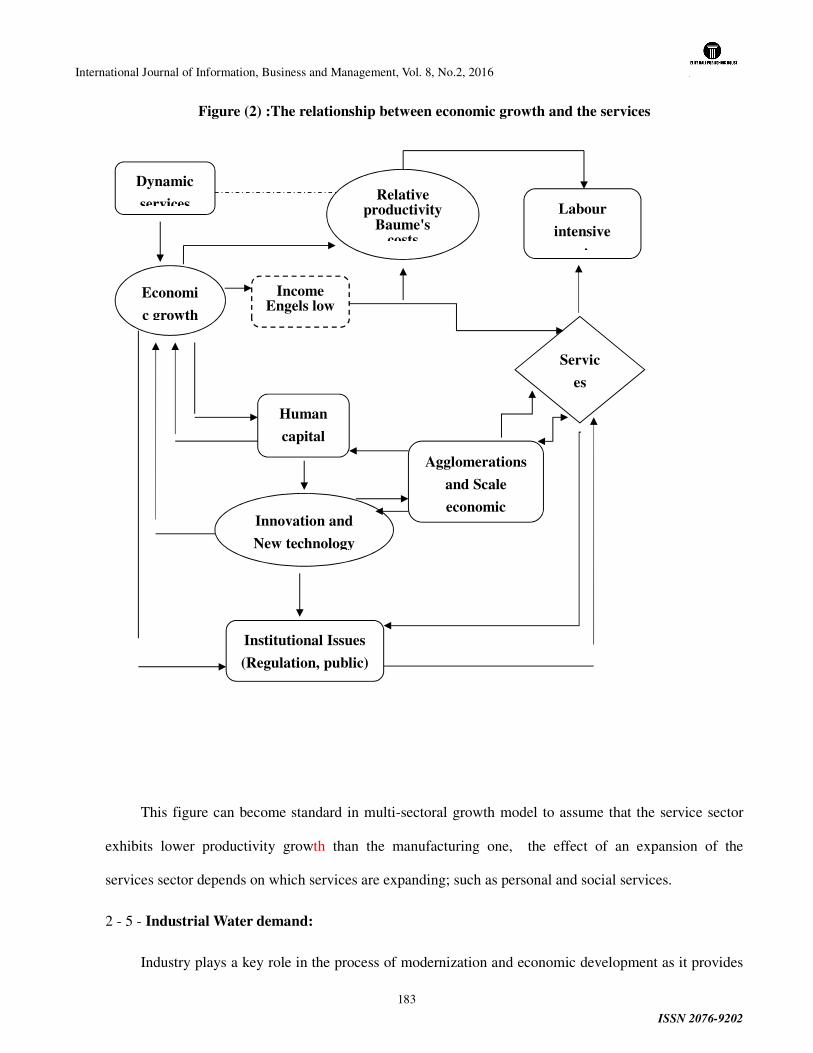
International Journal of Information, Business and Management, Vol. 8, No.2, 2016
ISSN 2076-9202
183
Figure (2) :The relationship between economic growth and the services
This figure can become standard in multi-sectoral growth model to assume that the service sector
exhibits lower productivity growth than the manufacturing one, the effect of an expansion of the
services sector depends on which services are expanding; such as personal and social services.
2 - 5 - Industrial Water demand:
Industry plays a key role in the process of modernization and economic development as it provides
Dynamic
services
Economi
c growth
Relative productivity
Baume's costs
Labour
intensive
services
Income Engels low
Human
capital
Agglomerations
and Scale
economic Innovation and
New technology
Institutional Issues
(Regulation, public)
Servic
es
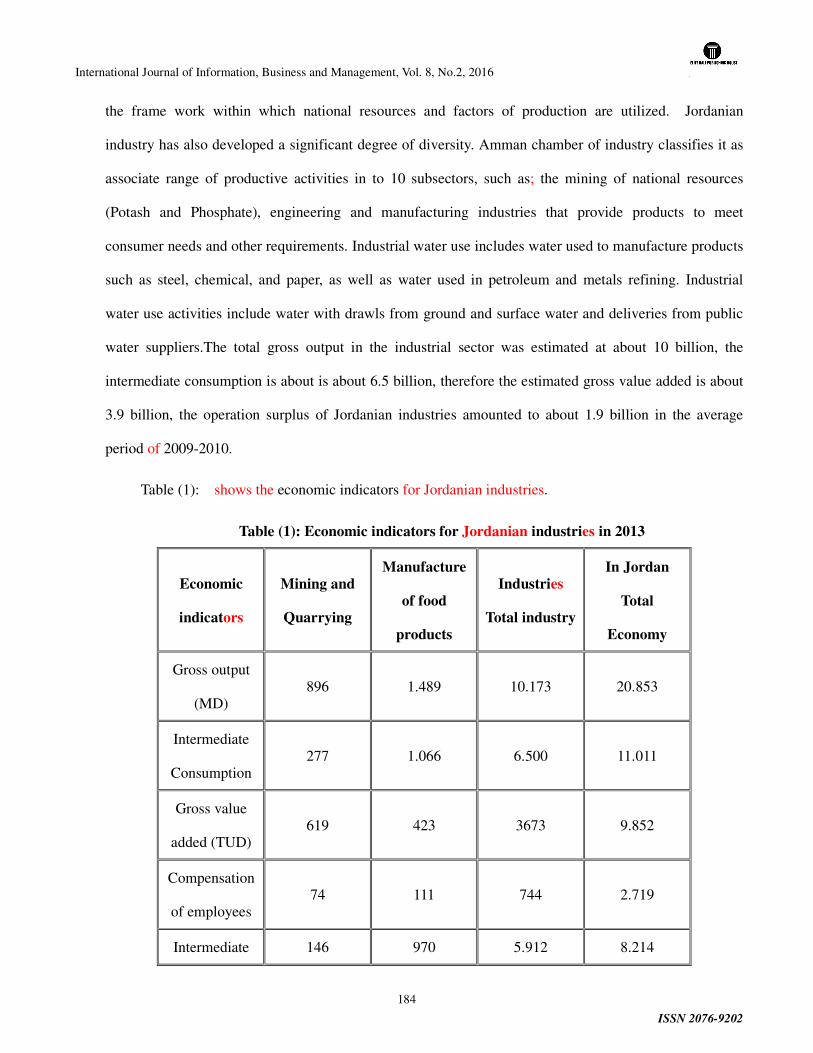
International Journal of Information, Business and Management, Vol. 8, No.2, 2016
ISSN 2076-9202
184
the frame work within which national resources and factors of production are utilized. Jordanian
industry has also developed a significant degree of diversity. Amman chamber of industry classifies it as
associate range of productive activities in to 10 subsectors, such as; the mining of national resources
(Potash and Phosphate), engineering and manufacturing industries that provide products to meet
consumer needs and other requirements. Industrial water use includes water used to manufacture products
such as steel, chemical, and paper, as well as water used in petroleum and metals refining. Industrial
water use activities include water with drawls from ground and surface water and deliveries from public
water suppliers.The total gross output in the industrial sector was estimated at about 10 billion, the
intermediate consumption is about is about 6.5 billion, therefore the estimated gross value added is about
3.9 billion, the operation surplus of Jordanian industries amounted to about 1.9 billion in the average
period of 2009-2010.
Table (1): shows the economic indicators for Jordanian industries.
Table (1): Economic indicators for Jordanian industries in 2013
Economic
indicators
Mining and
Quarrying
Manufacture
of food
products
Industries
Total industry
In Jordan
Total
Economy
Gross output
(MD) 896 1.489 10.173 20.853
Intermediate
Consumption 277 1.066 6.500 11.011
Gross value
added (TUD) 619 423 3673 9.852
Compensation
of employees 74 111 744 2.719
Intermediate 146 970 5.912 8.214
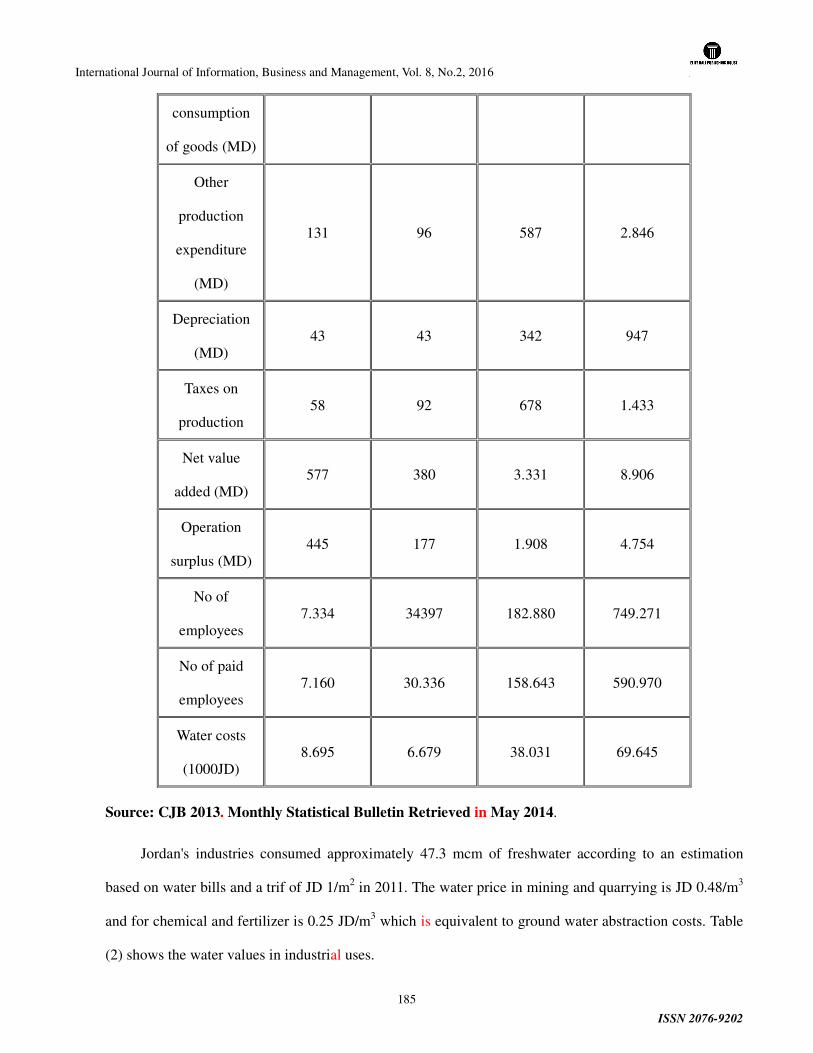
International Journal of Information, Business and Management, Vol. 8, No.2, 2016
ISSN 2076-9202
185
consumption
of goods (MD)
Other
production
expenditure
(MD)
131 96 587 2.846
Depreciation
(MD) 43 43 342 947
Taxes on
production 58 92 678 1.433
Net value
added (MD) 577 380 3.331 8.906
Operation
surplus (MD) 445 177 1.908 4.754
No of
employees 7.334 34397 182.880 749.271
No of paid
employees 7.160 30.336 158.643 590.970
Water costs
(1000JD) 8.695 6.679 38.031 69.645
Source: CJB 2013. Monthly Statistical Bulletin Retrieved in May 2014.
Jordan's industries consumed approximately 47.3 mcm of freshwater according to an estimation
based on water bills and a trif of JD 1/m2 in 2011. The water price in mining and quarrying is JD 0.48/m3
and for chemical and fertilizer is 0.25 JD/m3 which is equivalent to ground water abstraction costs. Table
(2) shows the water values in industrial uses.
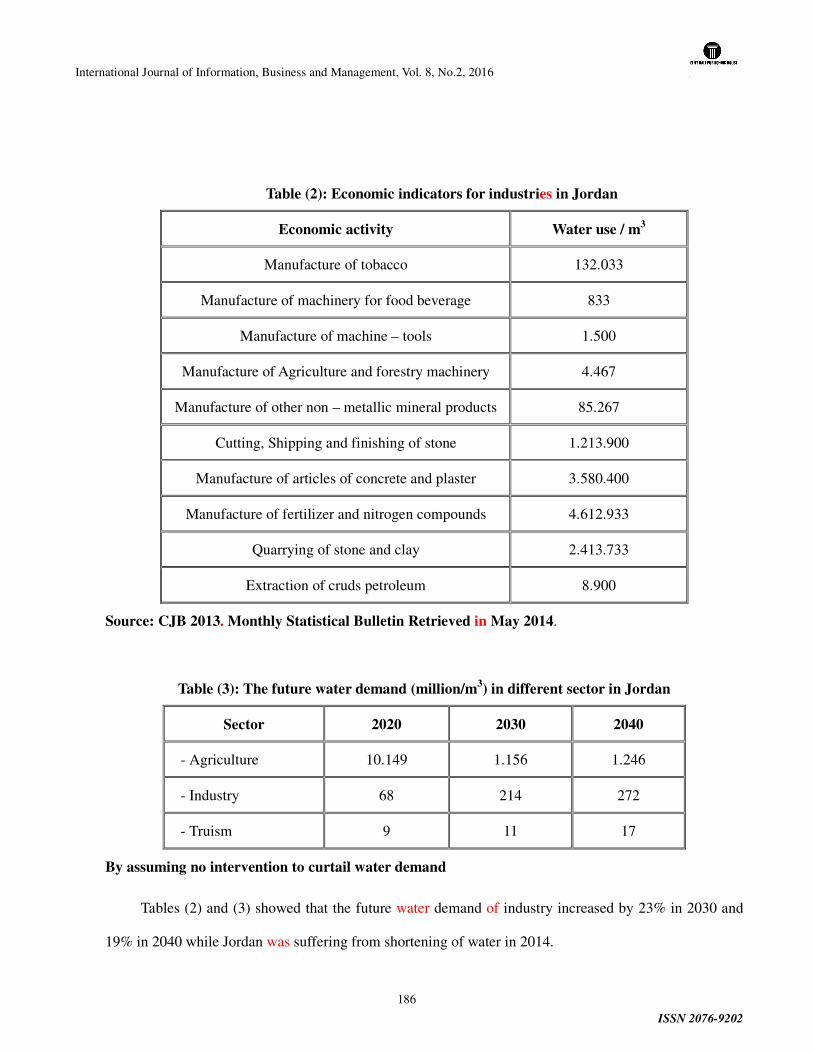
International Journal of Information, Business and Management, Vol. 8, No.2, 2016
ISSN 2076-9202
186
Table (2): Economic indicators for industries in Jordan
Economic activity Water use / m3
Manufacture of tobacco 132.033
Manufacture of machinery for food beverage 833
Manufacture of machine – tools 1.500
Manufacture of Agriculture and forestry machinery 4.467
Manufacture of other non – metallic mineral products 85.267
Cutting, Shipping and finishing of stone 1.213.900
Manufacture of articles of concrete and plaster 3.580.400
Manufacture of fertilizer and nitrogen compounds 4.612.933
Quarrying of stone and clay 2.413.733
Extraction of cruds petroleum 8.900
Source: CJB 2013. Monthly Statistical Bulletin Retrieved in May 2014.
Table (3): The future water demand (million/m3) in different sector in Jordan
Sector 2020 2030 2040
- Agriculture 10.149 1.156 1.246
- Industry 68 214 272
- Truism 9 11 17
By assuming no intervention to curtail water demand
Tables (2) and (3) showed that the future water demand of industry increased by 23% in 2030 and
19% in 2040 while Jordan was suffering from shortening of water in 2014.
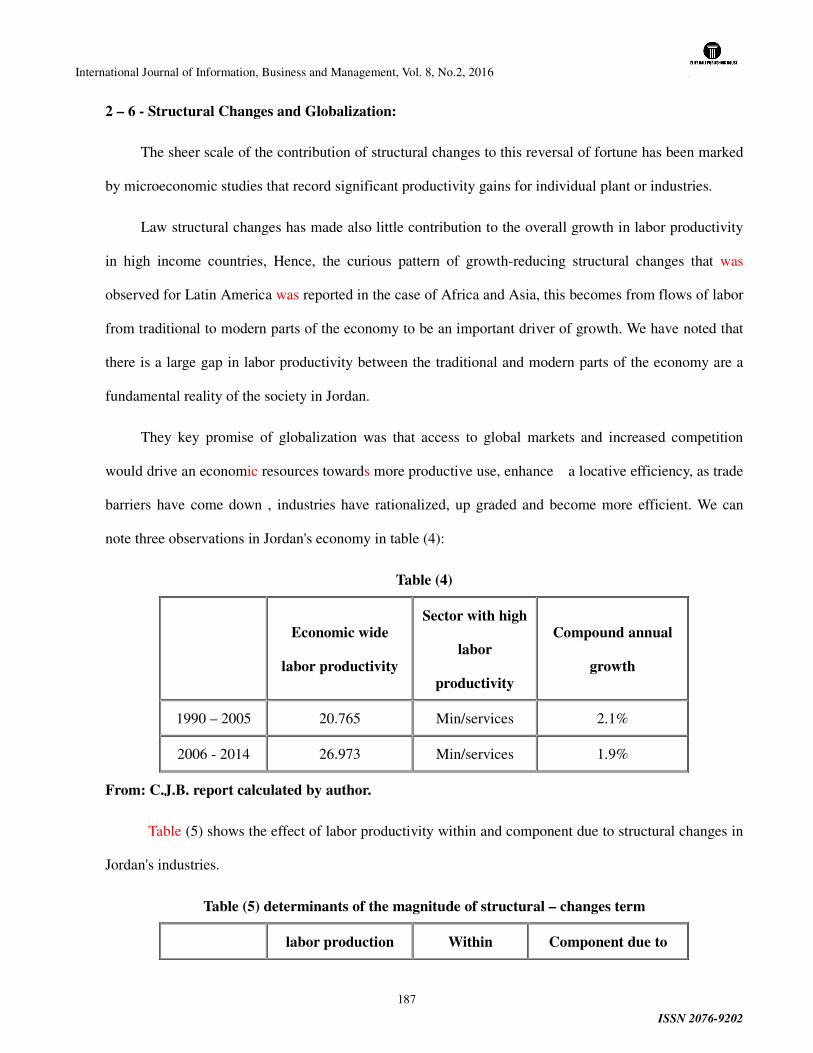
International Journal of Information, Business and Management, Vol. 8, No.2, 2016
ISSN 2076-9202
187
2 – 6 - Structural Changes and Globalization:
The sheer scale of the contribution of structural changes to this reversal of fortune has been marked
by microeconomic studies that record significant productivity gains for individual plant or industries.
Law structural changes has made also little contribution to the overall growth in labor productivity
in high income countries, Hence, the curious pattern of growth-reducing structural changes that was
observed for Latin America was reported in the case of Africa and Asia, this becomes from flows of labor
from traditional to modern parts of the economy to be an important driver of growth. We have noted that
there is a large gap in labor productivity between the traditional and modern parts of the economy are a
fundamental reality of the society in Jordan.
They key promise of globalization was that access to global markets and increased competition
would drive an economic resources towards more productive use, enhance a locative efficiency, as trade
barriers have come down , industries have rationalized, up graded and become more efficient. We can
note three observations in Jordan's economy in table (4):
Table (4)
Economic wide
labor productivity
Sector with high
labor
productivity
Compound annual
growth
1990 – 2005 20.765 Min/services 2.1%
2006 - 2014 26.973 Min/services 1.9%
From: C.J.B. report calculated by author.
Table (5) shows the effect of labor productivity within and component due to structural changes in
Jordan's industries.
Table (5) determinants of the magnitude of structural – changes term
labor production Within Component due to
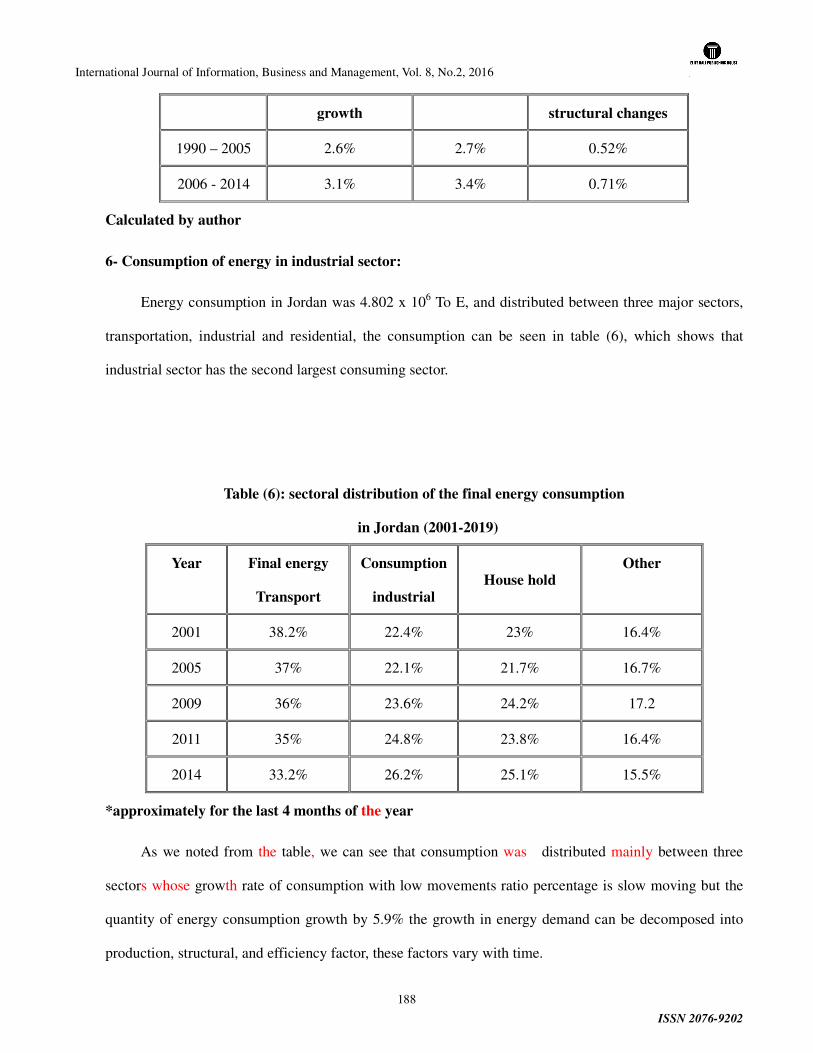
International Journal of Information, Business and Management, Vol. 8, No.2, 2016
ISSN 2076-9202
188
growth structural changes
1990 – 2005 2.6% 2.7% 0.52%
2006 - 2014 3.1% 3.4% 0.71%
Calculated by author
6- Consumption of energy in industrial sector:
Energy consumption in Jordan was 4.802 x 10⁶ To E, and distributed between three major sectors,
transportation, industrial and residential, the consumption can be seen in table (6), which shows that
industrial sector has the second largest consuming sector.
Table (6): sectoral distribution of the final energy consumption
in Jordan (2001-2019)
Year Final energy
Transport
Consumption
industrial
House hold Other
2001 38.2% 22.4% 23% 16.4%
2005 37% 22.1% 21.7% 16.7%
2009 36% 23.6% 24.2% 17.2
2011 35% 24.8% 23.8% 16.4%
2014 33.2% 26.2% 25.1% 15.5%
*approximately for the last 4 months of the year
As we noted from the table, we can see that consumption was distributed mainly between three
sectors whose growth rate of consumption with low movements ratio percentage is slow moving but the
quantity of energy consumption growth by 5.9% the growth in energy demand can be decomposed into
production, structural, and efficiency factor, these factors vary with time.
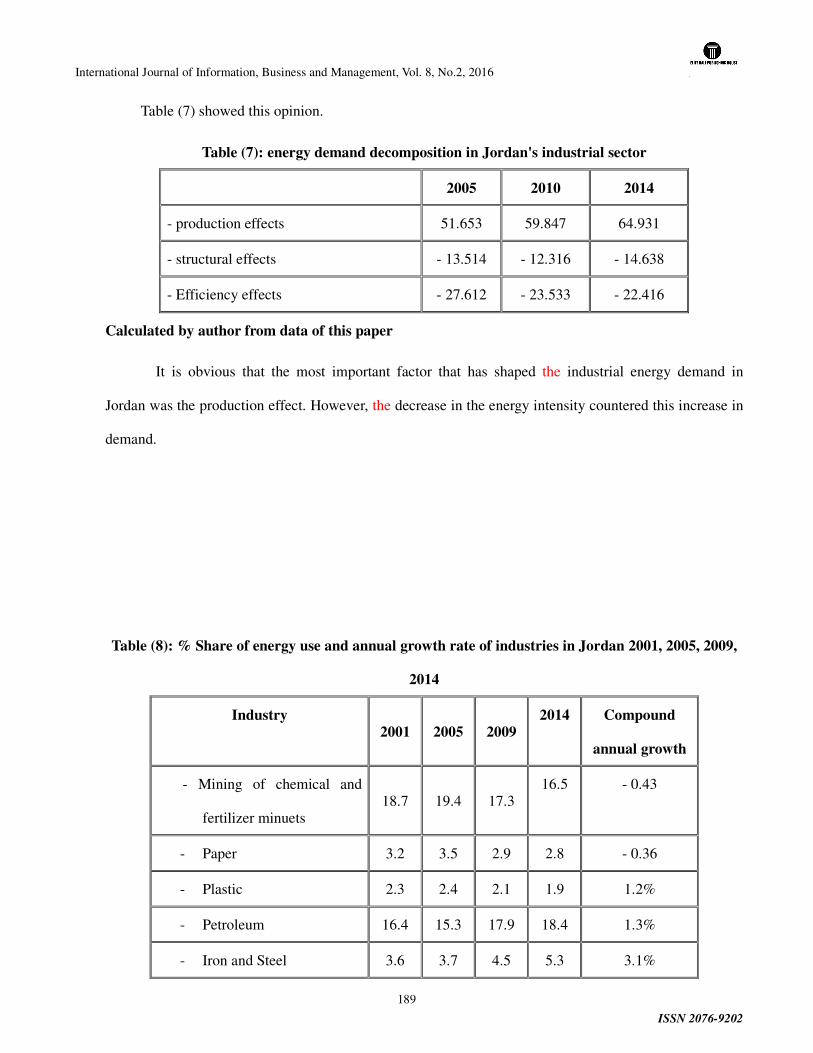
International Journal of Information, Business and Management, Vol. 8, No.2, 2016
ISSN 2076-9202
189
Table (7) showed this opinion.
Table (7): energy demand decomposition in Jordan's industrial sector
2005 2010 2014
- production effects 51.653 59.847 64.931
- structural effects - 13.514 - 12.316 - 14.638
- Efficiency effects - 27.612 - 23.533 - 22.416
Calculated by author from data of this paper
It is obvious that the most important factor that has shaped the industrial energy demand in
Jordan was the production effect. However, the decrease in the energy intensity countered this increase in
demand.
Table (8): % Share of energy use and annual growth rate of industries in Jordan 2001, 2005, 2009,
2014
Industry
2001 2005 2009
2014 Compound
annual growth
- Mining of chemical and
fertilizer minuets 18.7 19.4 17.3
16.5 - 0.43
- Paper 3.2 3.5 2.9 2.8 - 0.36
- Plastic 2.3 2.4 2.1 1.9 1.2%
- Petroleum 16.4 15.3 17.9 18.4 1.3%
- Iron and Steel 3.6 3.7 4.5 5.3 3.1%

International Journal of Information, Business and Management, Vol. 8, No.2, 2016
ISSN 2076-9202
190
- Cement 26.1 26.2 27.3 28.1 2.5%
- Others 33.3 29.5 2.8 27 ---
As the results, table (8) shows that all types of industries have a low annual growth in the period
of this study; this means that many technical adaptations have been pointed out and industrial sectors
gained improvements in energy efficiency over time in Jordan industries.
7- The value added in Jordan
Table (9) results declare the share of value added and average annual growth rate of the chemical
manufacturers and tobacco products were among the largest contribution to the intensive industries,
where the added value increased due to the structural changes and globalization and internationals.
Table (9): Shares of value added and Average annual growth of Jordanian industries in percentage
(%)
Industry
2001 2005 2009
2014 % Average
annual growth
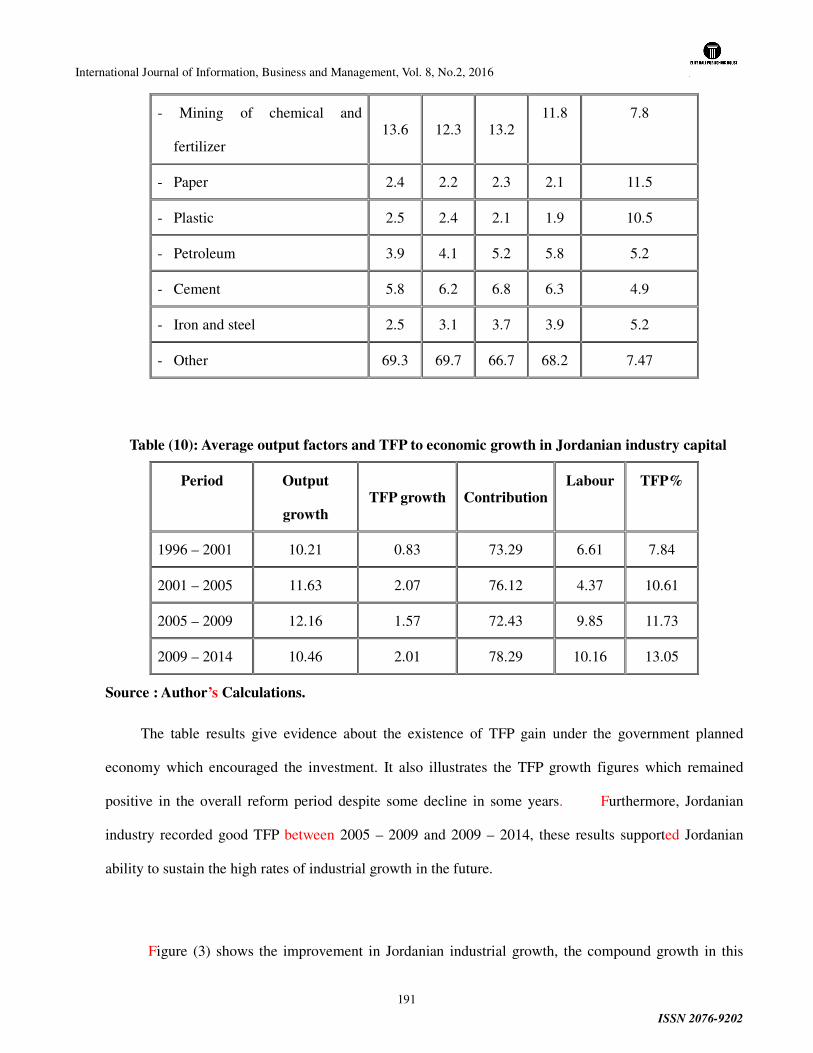
International Journal of Information, Business and Management, Vol. 8, No.2, 2016
ISSN 2076-9202
191
- Mining of chemical and
fertilizer 13.6 12.3 13.2
11.8 7.8
- Paper 2.4 2.2 2.3 2.1 11.5
- Plastic 2.5 2.4 2.1 1.9 10.5
- Petroleum 3.9 4.1 5.2 5.8 5.2
- Cement 5.8 6.2 6.8 6.3 4.9
- Iron and steel 2.5 3.1 3.7 3.9 5.2
- Other 69.3 69.7 66.7 68.2 7.47
Table (10): Average output factors and TFP to economic growth in Jordanian industry capital
Period Output
growth
TFP growth Contribution Labour TFP%
1996 – 2001 10.21 0.83 73.29 6.61 7.84
2001 – 2005 11.63 2.07 76.12 4.37 10.61
2005 – 2009 12.16 1.57 72.43 9.85 11.73
2009 – 2014 10.46 2.01 78.29 10.16 13.05
Source : Author’s Calculations.
The table results give evidence about the existence of TFP gain under the government planned
economy which encouraged the investment. It also illustrates the TFP growth figures which remained
positive in the overall reform period despite some decline in some years. Furthermore, Jordanian
industry recorded good TFP between 2005 – 2009 and 2009 – 2014, these results supported Jordanian
ability to sustain the high rates of industrial growth in the future.
Figure (3) shows the improvement in Jordanian industrial growth, the compound growth in this
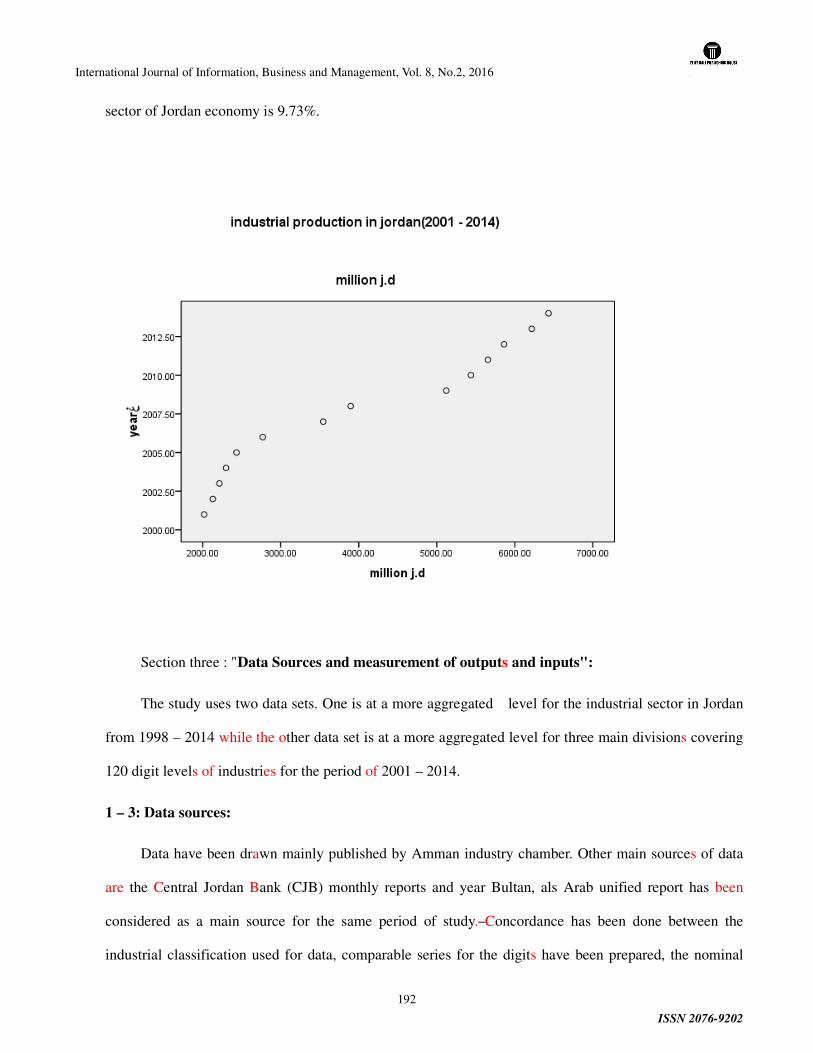
International Journal of Information, Business and Management, Vol. 8, No.2, 2016
ISSN 2076-9202
192
sector of Jordan economy is 9.73%.
Section three : "Data Sources and measurement of outputs and inputs":
The study uses two data sets. One is at a more aggregated level for the industrial sector in Jordan
from 1998 – 2014 while the other data set is at a more aggregated level for three main divisions covering
120 digit levels of industries for the period of 2001 – 2014.
1 – 3: Data sources:
Data have been drawn mainly published by Amman industry chamber. Other main sources of data
are the Central Jordan Bank (CJB) monthly reports and year Bultan, als Arab unified report has been
considered as a main source for the same period of study. Concordance has been done between the
industrial classification used for data, comparable series for the digits have been prepared, the nominal

International Journal of Information, Business and Management, Vol. 8, No.2, 2016
ISSN 2076-9202
193
price have been used on data to obtain the series for 120 industry groups, the series at nominal prices have
been deflated to obtain real output and input series, then logarithm has been calculated to the series.
2 – 3: Measurement of inputs and outputs:
• Output: for all series of industry group has been obtained by deflating the nominal figures by
whole sale price index.
• Net Capital Net: fixed capital stock at a constant price.
• Labor: total number of workers who are engaged including workers’ properties.
• Material input: series of deflated materials to obtain materials input at constant prices.
• Energy: input at constant price by using price of energy then deflated by the number of
consumer.
Section four: THE MODELS:
1 – 4: First model:
As mentioned before, the analysis of supply side sources of growth of Jordan manufacturing is
based on:
);,,,,(it
Ait
Sit
Mit
Eit
Lit
kfit
Q =
…………………… (7)
The cob doglus function has been chosen to be estimated, then, logarithm has been obtained, the
equation preformed as:
.....)ln(V)()()()(()(ln ∑+++Ψ++++=itit
Sit
ELnMLnit
kBLnit
LnatNCQit
σ …………. (8)
The results are reported in table (10) by panel data fixed effects model and the random effects model.
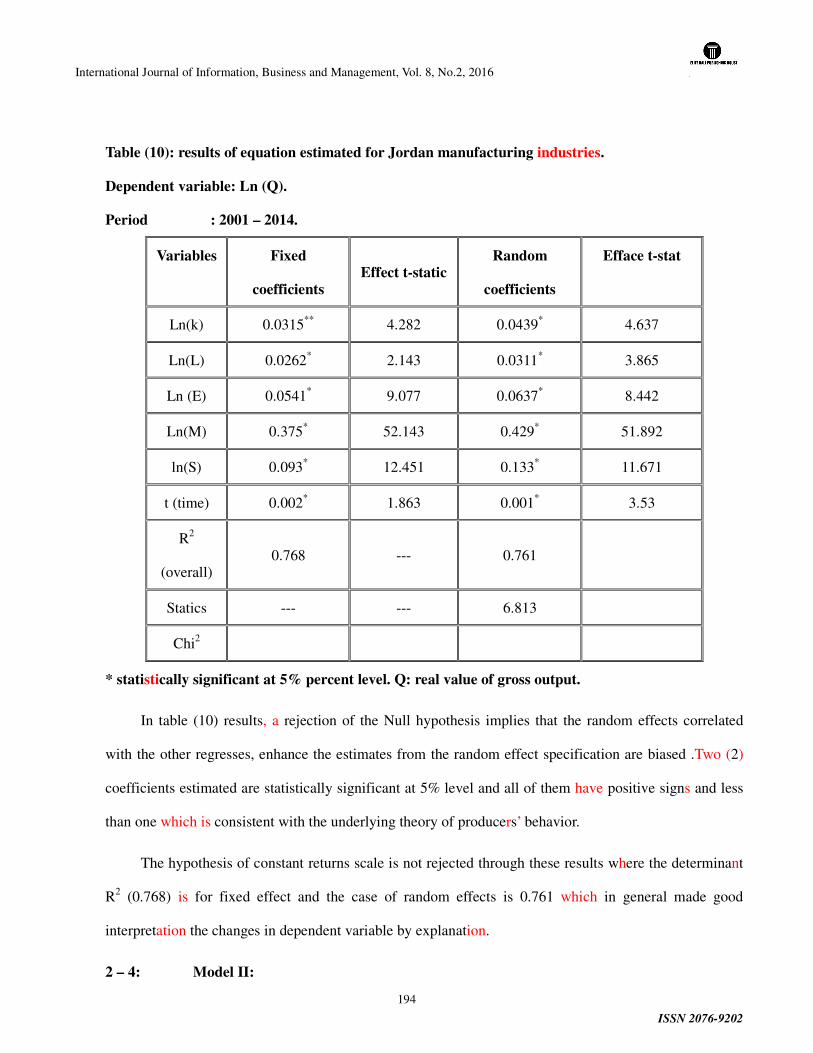
International Journal of Information, Business and Management, Vol. 8, No.2, 2016
ISSN 2076-9202
194
Table (10): results of equation estimated for Jordan manufacturing industries.
Dependent variable: Ln (Q).
Period : 2001 – 2014.
Variables Fixed
coefficients
Effect t-static Random
coefficients
Efface t-stat
Ln(k) 0.0315** 4.282 0.0439* 4.637
Ln(L) 0.0262* 2.143 0.0311* 3.865
Ln (E) 0.0541* 9.077 0.0637* 8.442
Ln(M) 0.375* 52.143 0.429* 51.892
ln(S) 0.093* 12.451 0.133* 11.671
t (time) 0.002* 1.863 0.001* 3.53
R2
(overall) 0.768 --- 0.761
Statics --- --- 6.813
Chi2
* statistically significant at 5% percent level. Q: real value of gross output.
In table (10) results, a rejection of the Null hypothesis implies that the random effects correlated
with the other regresses, enhance the estimates from the random effect specification are biased .Two (2)
coefficients estimated are statistically significant at 5% level and all of them have positive signs and less
than one which is consistent with the underlying theory of producers’ behavior.
The hypothesis of constant returns scale is not rejected through these results where the determinant
R2 (0.768) is for fixed effect and the case of random effects is 0.761 which in general made good
interpretation the changes in dependent variable by explanation.
2 – 4: Model II:

International Journal of Information, Business and Management, Vol. 8, No.2, 2016
ISSN 2076-9202
195
The constant – returns to scale translog production function can be estimated as the following
model.
0
0)()())()(( 2
1)(
2
1)(
2
1)ln(
4
2220
=+
=++++
++++++=
kTLt
LkkTiLK
rrkky
BR
BnkBTLnLBLnkLnLB
TBLnBLnLBUTBBLnkLnLtaCQ
………………… (9)
Results of estimation are reported in table (11).
Table (11): estimation of translog production in Jordan's industries
Estimated by the restricted
least squares
Estimated by the restricted
least squares and damages
C0 - 0.9376 (- 6.354)* - 0.6754 (- 3.69)
BL 0.6387 (5.983) 0.59921 (4.36)
Bk 0.1844 (2.135) 0.1768 (1.397)
BT 0.0768 (2.347) 0.1931 (2.45)
Bkk - 0.08992 (- 2.193) 0.6972 (-1.238)
BLL - 0.07673 (- 2.084) - 0.0635 (- 1.316)
BLk 0.1345 (2.812) 0.00635 (- 1.365)
BLT - 0.0294 (3.246) - 0.003 (- 1.364)
BkT 0.0294 (3.246) - 0.0003 (- 1.36)
Industry dummies
No Yes
R2 0.836 0.916
BTT -(0.2763) (-3.897) - 0.0062 (- 2.63)
*in between parentheses is t – static.

International Journal of Information, Business and Management, Vol. 8, No.2, 2016
ISSN 2076-9202
196
The results of table (11) show that the parameters or slopes are estimated by restricted least square
(R. L.S) in both cases, one with dummies and other without, both of them based on panel data.
The mono tonicity and concavity conditions are satisfied at the sample mean, However the fixed
effect model with dummies may regarded as less satisfactory than without dummies, because several
estimated coefficients are statistically insignificant. Hence, we can derive the electricity of output from
the first set of results . The parameters of the translog production function indicates that BL, Bk, BT, BLk,
BkT are positive signs. Where in the second model with dummies BL, Bk, BT, BLL, Bkk, BLT are positive
signs, also there is no indication of a growing divergence between labor income and elasticity as use in
all the period trends.
3 – 4: The third model
Again, we return to production function of cob – doglus as (Hanel, 2000). Production function
consists of two equations ; function of technical progressive and input use function which are as follows.
itititFAQ •=
……………………………….(10)
Where: itA : technical progressive function , itF : input function
.
LNt
m
mt
it
Xit
F
akit
A
+
−
=
=
α
ψ
Where a: Constant, L : labor Number in t period, ψ : electricity of capital factor, N : the direction
of technical changes. Xm: productivity of capital and labor.
If the substitute in the first equation results is:
.)1( :by capital ofry getinvanto can We
L
1
Nt
−−+∆=
Π=
ttt
am
mtit
kkK
XaktQ
σ
ψ
Where: tk ∆ : changes in capital in period t. σ : depreciation Average.
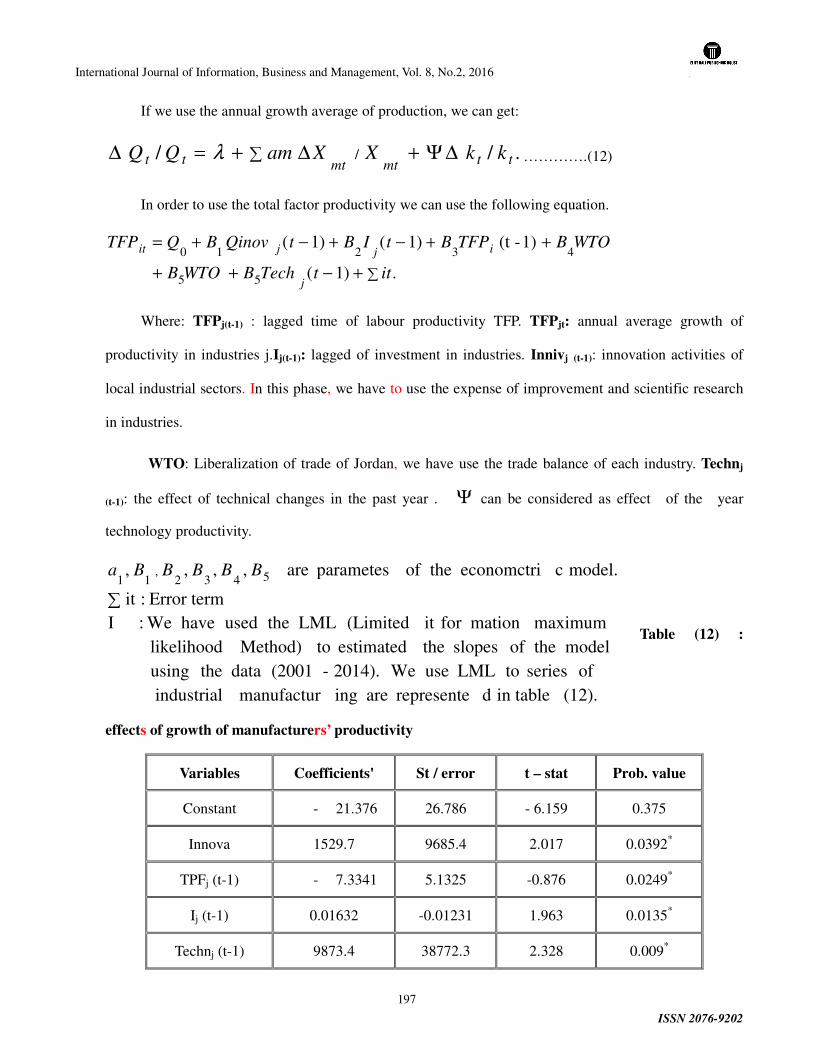
International Journal of Information, Business and Management, Vol. 8, No.2, 2016
ISSN 2076-9202
197
If we use the annual growth average of production, we can get:
./ / / ttmtmttt kkXXamQQ ∆Ψ+∆+=∆ ∑λ ………….(12)
In order to use the total factor productivity we can use the following equation.
.)1(
1)-(t )1()1(
55
432
10
∑+−++
++−+−+=
ittTechBWTOB
WTOBTFPBtIBtQinovBQTFP
j
ijjit
Where: TFPj(t-1) : lagged time of labour productivity TFP. TFPjt: annual average growth of
productivity in industries j.Ij(t-1): lagged of investment in industries. Innivj (t-1): innovation activities of
local industrial sectors. In this phase, we have to use the expense of improvement and scientific research
in industries.
WTO: Liberalization of trade of Jordan, we have use the trade balance of each industry. Technj
(t-1): the effect of technical changes in the past year . Ψ can be considered as effect of the year
technology productivity.
(12). in table drepresente are ingmanufactur industrial of series toLML use We2014). - (2001 data theusing
model theof slopes theestimated toMethod) likelihood maximummation for it (Limited LML theused have We: I
Error term :it
model. ceconomctri theof parametes are ,,,, 5432,
11
∑
BBBBBa
Table (12) :
effects of growth of manufacturers’ productivity
Variables Coefficients' St / error t – stat Prob. value
Constant - 21.376 26.786 - 6.159 0.375
Innova 1529.7 9685.4 2.017 0.0392*
TPFj (t-1) - 7.3341 5.1325 -0.876 0.0249*
Ij (t-1) 0.01632 -0.01231 1.963 0.0135*
Technj (t-1) 9873.4 38772.3 2.328 0.009*
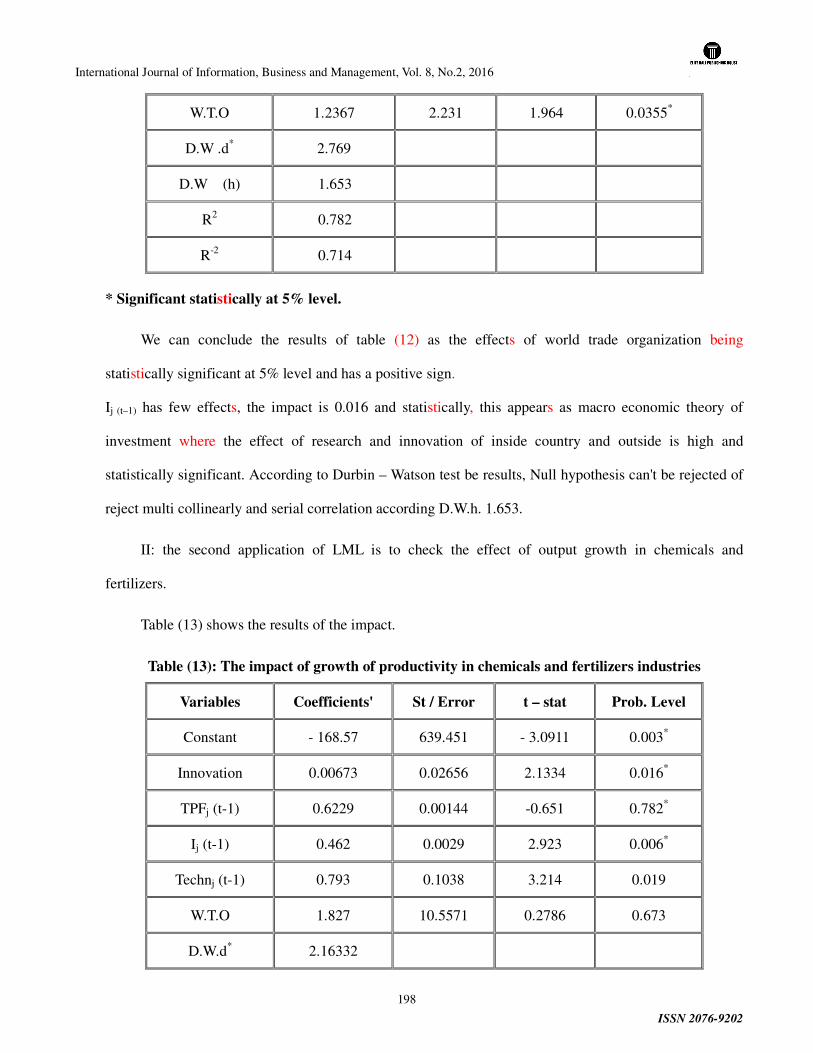
International Journal of Information, Business and Management, Vol. 8, No.2, 2016
ISSN 2076-9202
198
W.T.O 1.2367 2.231 1.964 0.0355*
D.W .d* 2.769
D.W (h) 1.653
R2 0.782
R-2 0.714
* Significant statistically at 5% level.
We can conclude the results of table (12) as the effects of world trade organization being
statistically significant at 5% level and has a positive sign.
Ij (t–1) has few effects, the impact is 0.016 and statistically, this appears as macro economic theory of
investment where the effect of research and innovation of inside country and outside is high and
statistically significant. According to Durbin – Watson test be results, Null hypothesis can't be rejected of
reject multi collinearly and serial correlation according D.W.h. 1.653.
II: the second application of LML is to check the effect of output growth in chemicals and
fertilizers.
Table (13) shows the results of the impact.
Table (13): The impact of growth of productivity in chemicals and fertilizers industries
Variables Coefficients' St / Error t – stat Prob. Level
Constant - 168.57 639.451 - 3.0911 0.003*
Innovation 0.00673 0.02656 2.1334 0.016*
TPFj (t-1) 0.6229 0.00144 -0.651 0.782*
Ij (t-1) 0.462 0.0029 2.923 0.006*
Technj (t-1) 0.793 0.1038 3.214 0.019
W.T.O 1.827 10.5571 0.2786 0.673
D.W.d* 2.16332
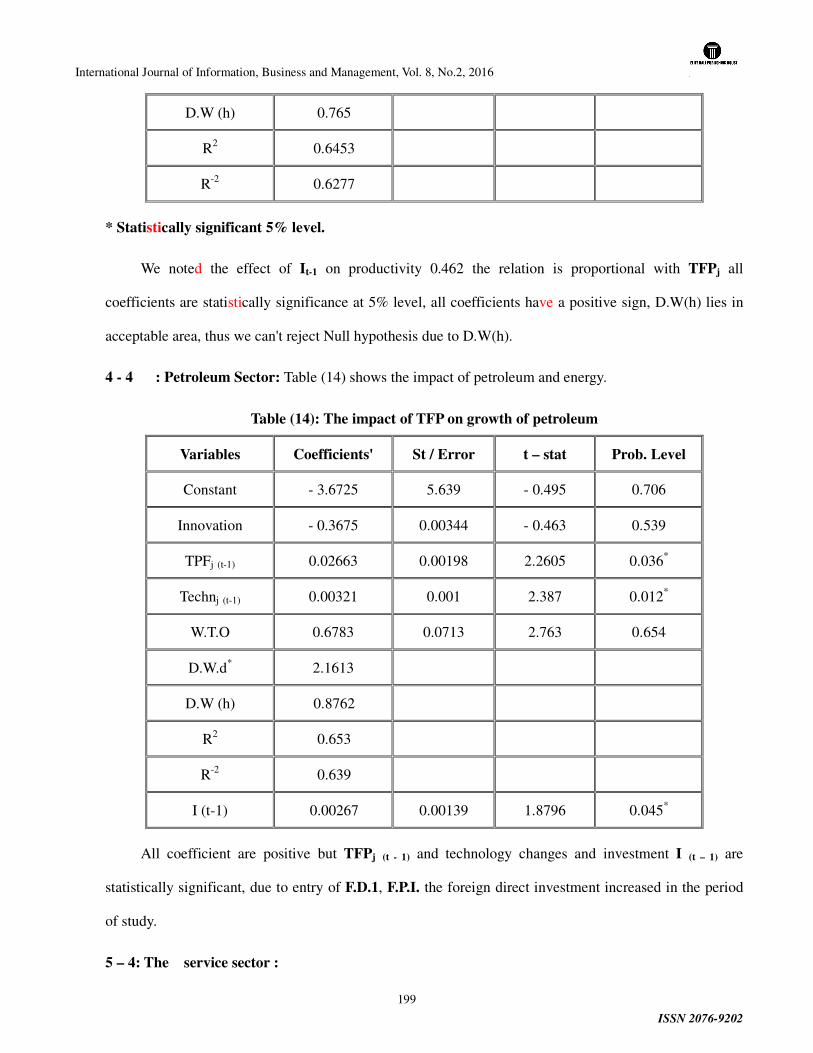
International Journal of Information, Business and Management, Vol. 8, No.2, 2016
ISSN 2076-9202
199
D.W (h) 0.765
R2 0.6453
R-2 0.6277
* Statistically significant 5% level.
We noted the effect of It-1 on productivity 0.462 the relation is proportional with TFPj all
coefficients are statistically significance at 5% level, all coefficients have a positive sign, D.W(h) lies in
acceptable area, thus we can't reject Null hypothesis due to D.W(h).
4 - 4 : Petroleum Sector: Table (14) shows the impact of petroleum and energy.
Table (14): The impact of TFP on growth of petroleum
Variables Coefficients' St / Error t – stat Prob. Level
Constant - 3.6725 5.639 - 0.495 0.706
Innovation - 0.3675 0.00344 - 0.463 0.539
TPFj (t-1) 0.02663 0.00198 2.2605 0.036*
Technj (t-1) 0.00321 0.001 2.387 0.012*
W.T.O 0.6783 0.0713 2.763 0.654
D.W.d* 2.1613
D.W (h) 0.8762
R2 0.653
R-2 0.639
I (t-1) 0.00267 0.00139 1.8796 0.045*
All coefficient are positive but TFPj (t - 1) and technology changes and investment I (t – 1) are
statistically significant, due to entry of F.D.1, F.P.I. the foreign direct investment increased in the period
of study.
5 – 4: The service sector :
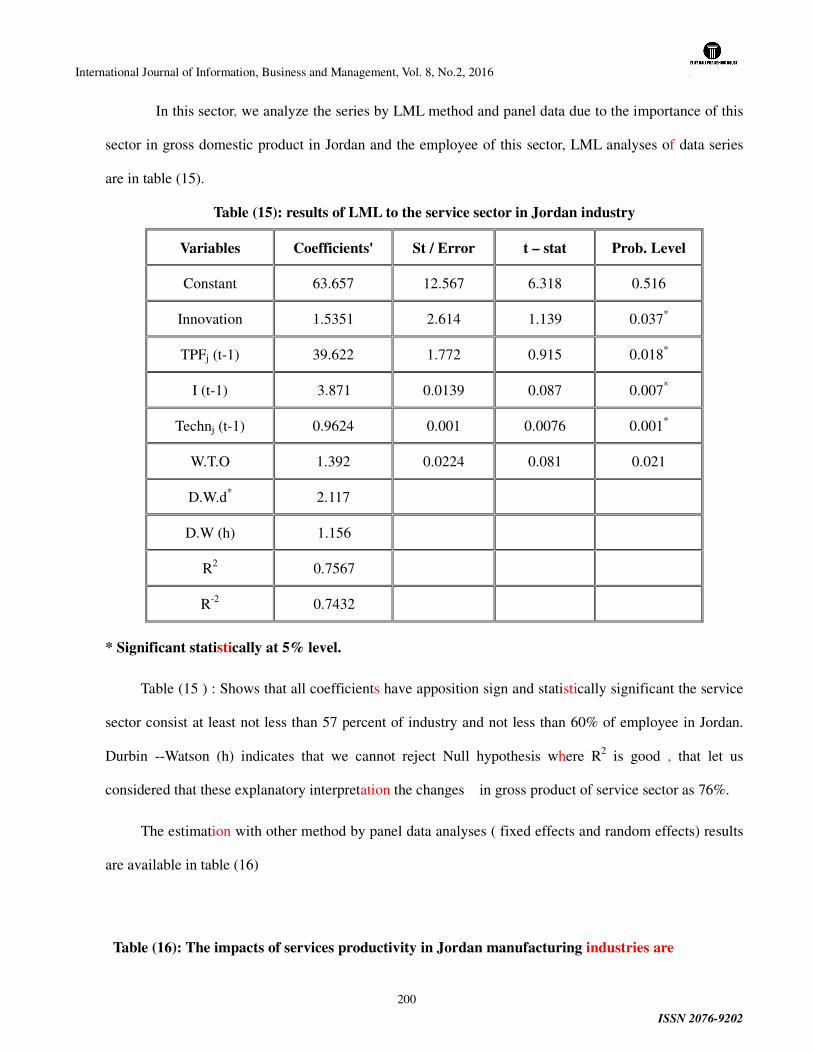
International Journal of Information, Business and Management, Vol. 8, No.2, 2016
ISSN 2076-9202
200
In this sector, we analyze the series by LML method and panel data due to the importance of this
sector in gross domestic product in Jordan and the employee of this sector, LML analyses of data series
are in table (15).
Table (15): results of LML to the service sector in Jordan industry
Variables Coefficients' St / Error t – stat Prob. Level
Constant 63.657 12.567 6.318 0.516
Innovation 1.5351 2.614 1.139 0.037*
TPFj (t-1) 39.622 1.772 0.915 0.018*
I (t-1) 3.871 0.0139 0.087 0.007*
Technj (t-1) 0.9624 0.001 0.0076 0.001*
W.T.O 1.392 0.0224 0.081 0.021
D.W.d* 2.117
D.W (h) 1.156
R2 0.7567
R-2 0.7432
* Significant statistically at 5% level.
Table (15 ) : Shows that all coefficients have apposition sign and statistically significant the service
sector consist at least not less than 57 percent of industry and not less than 60% of employee in Jordan.
Durbin --Watson (h) indicates that we cannot reject Null hypothesis where R2 is good , that let us
considered that these explanatory interpretation the changes in gross product of service sector as 76%.
The estimation with other method by panel data analyses ( fixed effects and random effects) results
are available in table (16)
Table (16): The impacts of services productivity in Jordan manufacturing industries are
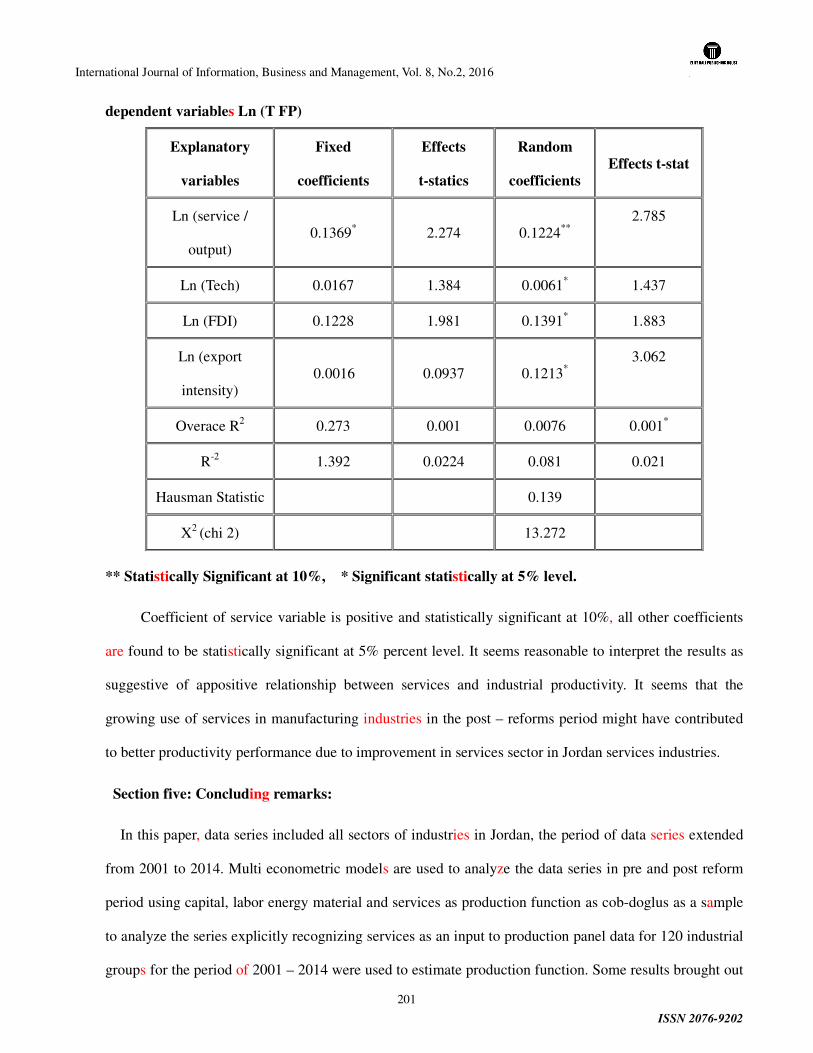
International Journal of Information, Business and Management, Vol. 8, No.2, 2016
ISSN 2076-9202
201
dependent variables Ln (T FP)
Explanatory
variables
Fixed
coefficients
Effects
t-statics
Random
coefficients
Effects t-stat
Ln (service /
output) 0.1369* 2.274 0.1224**
2.785
Ln (Tech) 0.0167 1.384 0.0061* 1.437
Ln (FDI) 0.1228 1.981 0.1391* 1.883
Ln (export
intensity) 0.0016 0.0937 0.1213*
3.062
Overace R2 0.273 0.001 0.0076 0.001*
R-2 1.392 0.0224 0.081 0.021
Hausman Statistic 0.139
X2 (chi 2) 13.272
** Statistically Significant at 10%, * Significant statistically at 5% level.
Coefficient of service variable is positive and statistically significant at 10%, all other coefficients
are found to be statistically significant at 5% percent level. It seems reasonable to interpret the results as
suggestive of appositive relationship between services and industrial productivity. It seems that the
growing use of services in manufacturing industries in the post – reforms period might have contributed
to better productivity performance due to improvement in services sector in Jordan services industries.
Section five: Concluding remarks:
In this paper, data series included all sectors of industries in Jordan, the period of data series extended
from 2001 to 2014. Multi econometric models are used to analyze the data series in pre and post reform
period using capital, labor energy material and services as production function as cob-doglus as a sample
to analyze the series explicitly recognizing services as an input to production panel data for 120 industrial
groups for the period of 2001 – 2014 were used to estimate production function. Some results brought out
International Journal of Information, Business and Management, Vol. 8, No.2, 2016
ISSN 2076-9202
202
the importance of technological changes in improvement of productivity, also the competition increased
in the domestic market were found to be responsible to a certain extent for the increase in the intensity of
use of services in manufacturing sector.
Movements in growth rate in index number of industrial production differ from period to others. We
noticed that the movement in growth rate in TFP as (real value added) increasingly diverged from the
movements in growth rate of industrial production index number, and the largest discrepancy gives a sign
that there is impact of technology and increased investment, even foreign direct investment or domestic
innovations has a positive relationship with TFP.
Ultimately, the W.O.T has a broader and statistically significant overall productivity trends
evaluations, the overall impacts of procession innovation requires consideration of its impacts on prices as
well as quantity. Hence, one of the main consequences of innovation is likely to be the exit of some
inefficient firms and the entry of new innovative firms.
Also, the energy demanded increased between 2001 to 2014 .Also, the whole demand was a rapid
increased in the industrial productions output. However, these results according to implying technological
changes and diffusion and adaptability to more efficient technologies and the new structural changes in
Jordan industries, also implying innovation, all these factors has countered this rapid increase.
In addition, the water demanded is increasing due to the uses of water for many purposes in
manufacturing industries in Jordan. The paper has established the demand of water in the future.
Finally, translog production function as an appropriate production as a well – behaved panel data
estimation has used as enhance the results differs. One can conclude that fixed effects are acceptable more
than random effects in Jordan industries series.
References :
1- A. Al-Shehri, (2000)“A simple forecasting model for industrial electric energy consumption”. International Journal of Energy Research, Vol. 24, 2000, 719-726.
2- A. Al-Ghandoor, P. E. Phelan, R. Villalobos (2005), “Projected impact of industrial assessment center

International Journal of Information, Business and Management, Vol. 8, No.2, 2016
ISSN 2076-9202
203
program recommendations on U.S. manufacturing energy consumption”. In Proceeding of 2005 ACEEE Summer Study on Energy Efficiency in Industry: Cutting the High Cost of Energy, New York: American Council for Energy-Efficient Economy, Washington, D.C.
3- A. Tamimi, “Energy situation in Jordan”. Energy Conversion and Management, Vol. 34, 1993, 519-521.
4- Bose, R.K. and M. Shukla, M.( 1999). “ Elasticities of electricity demand in India.” Energy Policy,pp 137-147.
5 = Ceylan H, Ozturk HK(2005)". Estimating energy demand of Turkey based on economic indicators using genetic algorithm approach.” Energy Conversion and Management 2004; 45;pp. 2525-2357. -
6-Commandeur JF, Koopman SJ(2004) ". An Introduction to State Space Time Series Analysis". Oxford- University Press: Oxford ; 2007 .
7= C. Flores, P. E. Phelan, J. Mou, H. Bryan, (2004) “Forecasting the electricity consumption of the Mexican border states maquiladoras”. International Journal of Energy Research , Vol. 28, 2004, 641-660.
8 - Doornat V, Koopman SJ, Ooms M, Dessertaine A and Collet J(2008). "An hourly periodic state space model for modeling French national electricity load". International Journal of Forecasting "; 24, pp.566-587.
9- Erdal G, Erdal H. and Esengun K. The causality between energy consumption and economic growth in Turkey. Energy Policy 2008; 36; 3838-3842.
10= Ediger VS, Tatlidil H.(2002)" Forecasting the primary energy demand in Turkey and analysis of cyclic pattern"{s. Energy Conversion and Management 2002; 43; 473-487.
11- Goldar, Bishwanath and Anita Kumari (2003), “Import Liberalization and Productivity
Growth in Indian Manufacturing Industries in the 1990s”, Developing Economies , December, 41(4): 436-60.
Gorden, Jim and Poonam Gupta (2003), “ Understanding India’s Services Revolution,”
12 - Paper prepared for IMF-NCAER conference on ‘A Tale of Two Giants: India’s and China’s Experience with Reform’, November 14-16, 2003, New Delhi .
13 - Griliches, Zvi.( 1994). “Productivity, R&D, and the Data Constraint.” American Economic Review 84-1 March.p.p 1-23.
14 - Gullickson, William and Michael Harper.( 1999). “Possible Measurement Bias in Aggregate ProductivityGrowth,” Monthly Labor Review (February), pp. 47-67.
15 - Harvey AC, Koopman SJ. (1993)" Forecasting hourly electricity demand using time varying" Journal

International Journal of Information, Business and Management, Vol. 8, No.2, 2016
ISSN 2076-9202
204
of American Statistical Association 1993; 88-424; 1228-1236
16 -Harvey AC, Scott A. (1994) ," Seasonality in dynamic regression models". Economic Journal 104,pp.1324-1345. Hunt LC, Judge G. and Ninomiya Y. (2003)" Underlying trends and seasonality in UK energy
17 - demand: a sectoral analysis". Energy Economics( 2003); 25; 93–118 .
18 -Hunt LC, Judge G and Ninomiya Y. (2000) "Modelling Technical Progress: An Application of the Stochastic Trend Model to UK Energy Demand". Surrey Energy Economics Discussion Paper seed 99.
19- J. O. Jaber, M. S. Mohsen, S. Probert, M. Alees *2001), “Future electricity-demands and greenhouse-gas emissions inJordan”. Applied Energy, Vol. 69, 2001, 1-18.
20 - K. F. Tso, K. W. Yau , ( 2007 ),” Predicting electricity energy consumption: A comparison of regression analysis, decision tree and neural networks”. Energy, Vol. 32, 2762-2768.
21 - Kapoor, M., Kelejian, Harry H, Prucha, Ingmar R.,( 2007)." Panel data models with spatially correlated error components". Journal of Econometrics, 140(1), 97–130.
22 - Labandeira, X., Labeaga, J.M., López-Otero, X., (2011)." Estimation of Elasticity Price of
Electricity with Incomplete Information". Energy Economics 34(3), 627–633 .
LeSage, J.P. & Pace, R.K.,( 2009)." Introduction to spatial econometrics", CRC Press .
23- Leth‐Petersen, S., Togeby, M. (2001). "Demand for Space Heating in Apartment Blocks:
24- Measuring Effects of Policy Measures Aiming at Reducing Energy Consumption" .
Energy Economics 23(4), 387‐403. ..
25- MEMR. Industrial Electricity consumption. 2007. Retrieved on 02, 15,( 2007) from http://www.memr.gov.jo.
26- Portas, J. and AbouRizk, S.( 1997). "Neural network model for estimating construction productivity". Journal of Construction Engineering and Management,123: 399-410. Kongsamut, P., S. Rebelo and D. Xie (1997), “Beyond balanced Growth”, NBER Working Paper no. 6159, National Bureau of Economic Research, Cambridge MA.
27- Tiwari, P. (2000). “Architectural, demographic, and economic causes of electricity consumption in Bombay.” Journal of Policy Modeling 22(1): 81–98.
28- UN-Habitat.( 2007). " Global Report on Human Settlements 2007": Enhancing Urban Safety and Security. Earth scan. London .
International Journal of Information, Business and Management, Vol. 8, No.2, 2016
ISSN 2076-9202
205
VALIDATING A RETAIL SERVICE QUALITY INSTRUMENT IN
GROCERY SPECIALTY STORES
Ishfaq Hussain Bhat
Research Scholar, School of Management Studies, University of Hyderabad, Central University
PO, Gachibowli, Hyderabad – 500046. Mobile: 9703487120. E-mail: [email protected]
ABSTRACT:
Retailing in India is developing at a very rapid pace. Majority of the retail market is still untapped, and is
key factor for global retail giants to make inroads, Formats of shopping malls is becoming attractive for
global retail players. Most of the retail giants rapidly adopted the culture of shopping malls in large cities.
The shopping malls aim at attracting the customers, in order to provide great buying experience to the
customers.
Retailers have to provide quality services from entry to exit of the customer. The term service quality
become widely used and implemented in all the sectors especially when service is a top priority. Retail is
one arena where business carried out mostly depends on customer experience and satisfaction level. The
proportion of organized grocery stores is 5% and it is expected to grow at a compounded annual growth
rate of more than 25% with a prediction of Rs 37 lacs crores by 2020.
There is greater opportunity in Indian grocery retailing to exploit the market, therefore providing the best
service quality to customers becomes a challenge to retailers .The study gives an overview regarding the
service quality and provides a relook at validation and reexamination of retail service quality scale given
by Dabholkar et al (1996) in the context of the Indian rural setup especially in grocery stores.
The sample consists of 100 respondents from two grocery stores of Jalandhar district of Punjab. A
questionnaire on 5 point Likert scale was used. The findings obtained by using reliability test,
confirmatory factor analysis and Structural equation modeling are that this Scale(RSQS) can be validated
in the Rural Indian Context of Retail stores of groceries. The implication of retail service quality scale has
International Journal of Information, Business and Management, Vol. 8, No.2, 2016
ISSN 2076-9202
206
been discussed.
Key words
Retailing, Service Quality, Grocery stores, Retail Service Quality Scale (RSQS), Scale validation,
Jalandhar.
Introduction
Retailing in the world is the largest contributor to the GDP of around 8% and it also employs one sixth of
the labor force of the world (Steven Greenhouse 2012). The Retail segment of India is presently among
top five quickest developing markets all over the world and by 2015 it is going to touch Rs 37 lack crores
(Anand Dikshit 2011). The greater part over largely developed and changed due to the presence of retail
industries, India is no different from the rest and is considered to be the most emerging markets in retail.
It has now become the 2nd largest contributor to our GDF nest to agriculture (Mohammad Amin 2007).
According to a survey conducted by the business consultancy: India’s retail market is expected to touch
Rs 37 lacs corers by 2020 at a compounded annual growth rate of more than 25%. But the grocery retail
has not emerged fully and about only 5% are under organized retail,(fnbnews 2013) but with the starting
of big retail chains it is being organized at a very fast pace. The nature of services differs in different
categories of services. In grocery retailing maintaining quality as per the expectations of the consumers is
very complex because the people are very conscious about their diet and health. So there arises a need for
an instrument which can measure the service quality of grocery stores. So the application of retail service
quality scale in measuring the gap between the customers’ expectations and their perceptions about the
service quality of retail stores in jalandher city of Punjab, India.
SERVQUAL
Widely popular scale SERVQUAL was developed by PARASURAMAN et al (1988) to evaluate service
quality. According to the developers of SERVQUAL, service quality is measured from a comparison
between customer expectation and customer perception. The difference which we get from perceptions
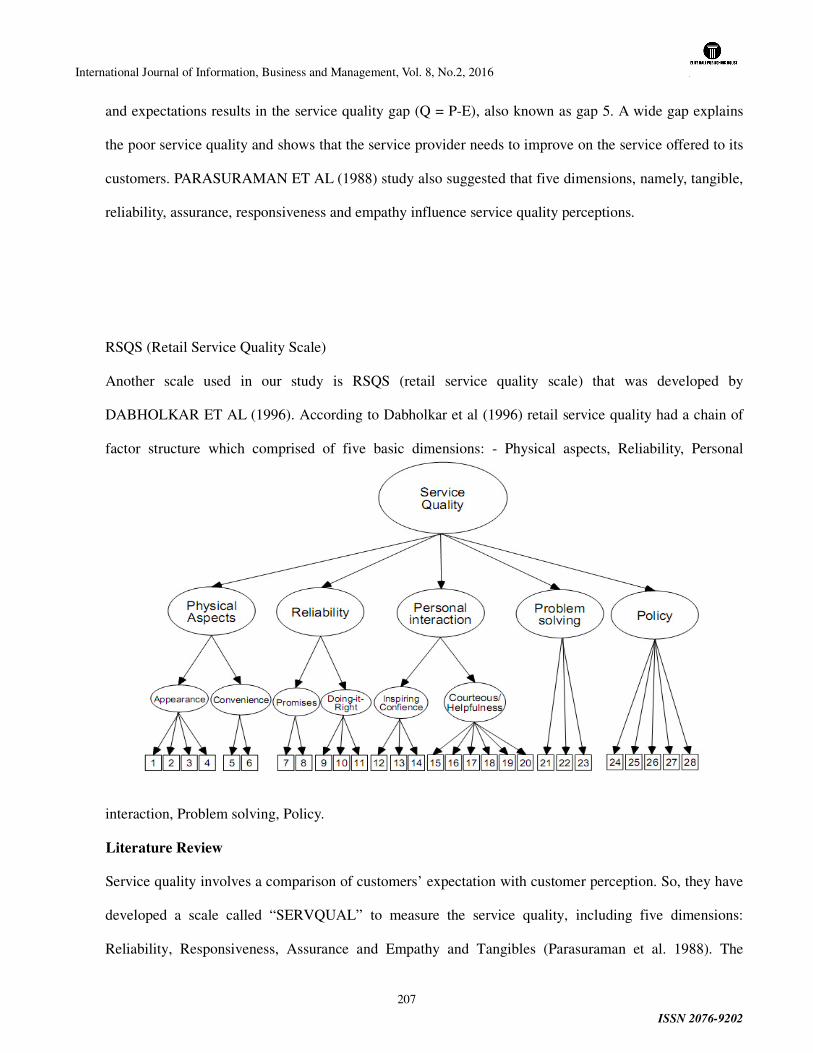
International Journal of Information, Business and Management, Vol. 8, No.2, 2016
ISSN 2076-9202
207
and expectations results in the service quality gap (Q = P-E), also known as gap 5. A wide gap explains
the poor service quality and shows that the service provider needs to improve on the service offered to its
customers. PARASURAMAN ET AL (1988) study also suggested that five dimensions, namely, tangible,
reliability, assurance, responsiveness and empathy influence service quality perceptions.
RSQS (Retail Service Quality Scale)
Another scale used in our study is RSQS (retail service quality scale) that was developed by
DABHOLKAR ET AL (1996). According to Dabholkar et al (1996) retail service quality had a chain of
factor structure which comprised of five basic dimensions: - Physical aspects, Reliability, Personal
interaction, Problem solving, Policy.
Literature Review
Service quality involves a comparison of customers’ expectation with customer perception. So, they have
developed a scale called “SERVQUAL” to measure the service quality, including five dimensions:
Reliability, Responsiveness, Assurance and Empathy and Tangibles (Parasuraman et al. 1988). The
International Journal of Information, Business and Management, Vol. 8, No.2, 2016
ISSN 2076-9202
208
service quality in retailing differs from other service or product environments; so a scale was developed
to measure retail service quality by Dabholakar, Thrope and Rentz (1996) and coined the name 'Retail
Service Quality Scale- RSQS' which has a five dimensional structure (Physical aspects, Reliability,
Personal interaction. Problem solving and Policy) they have also identified in their extended study that all
these five dimensions were valid in the USA Gagliano and Hathcote 1994). The RSQS was then applied
to the Indian Retail setting with a sample of 144 apparel retail customers selected in Bangalore. the
observation was that only four dimensions where appropriate to measure the overall Apparel Retail
Service Quality of the store. There is a need to study the RSQS to other cities with comparatively large
sample having different demographics to explore new dimensions of retail service quality scale. So it is
evident from the earlier studies that there was no generic scale to measure service quality in Indian
Retailing (Subhashini Kaul, 2005). SERVQUAL has not been successful adapted and validated in a retail
store environment. Based on extensive literature review and findings from their study, they have
developed a scale entitled Retail Service Quality Scale that includes 5 dimensions. They are namely
Physical Aspects, Reliability, Personal Interaction, Problem Solving and Policy. It is considered as a good
scale to be applied to retail business that offer a different mix of service and goods, such as
departmental or specialty stores . (Dabholkar et al. 1996). In another study five items designed to measure
the scale, the Policy dimension was found to be unreliable in two countries. Personal interaction and
Problem solving were combined into a single dimension named Personal attention. Measurement
equivalence also did not exist across the US and Korean samples. So RSQS could not be viewed as a
reliable and valid measure for cross-cultural comparisons (Kim and Jin (2001). The service quality on
Retail stores have a place in the service industry, which offer a mix of goods and service, thus retail
product management not only have the common characters of good quality but also have the special
characters of services quality. This paper mainly focused on two quality scales of the retailers:
SERVQUAL and RSQS, the first is prevailing in universal business service management and the latter is
developed specifically for retail stores. The applying situations and the limitations of the two scales are
also concluded respectively (WANG Shucui 2003). The other conceptual paper identifies the service
International Journal of Information, Business and Management, Vol. 8, No.2, 2016
ISSN 2076-9202
209
quality dimensions critical to urban grocery shoppers for small, medium, and large-sized grocery stores. It
will identify the critical quality dimension of Malaysia urban grocery shoppers based on the Retail
Service Quality Scale by Dabholkar et al., (1996) that takes into account the retail setting. (Nor Khalidah
Abu 2004)
Scope of the Study
This study has set out to validate the Retail Service Quality Scale developed by Dabholkar et al.
(1996) in the Indian business setting. If proven valid and reliable the Retail Service Quality Scale (RSQS)
may be further used by researchers and academicians in Indian business setting and particularly in
Grocery stores. A large number of upcoming organized retail stores can also use the instrument in
enhancing their service quality levels.
Objectives
• The main aim of this study is to look at validation of the retail service quality instrument in rural
Indian business setting specifically in context of Grocery stores in Jalandhar district of Punjab.
• To re-examine the RSQS with reference to Grocery retail in Jalandhar district of Punjab.
RESEARCH METHODOLOGY
The study is descriptive in nature and is based on both the secondary data and primary data.
The secondary data was collected from books, journals, periodicals, websites etc. and the
primary data was collected from a sample of 100 respondents from two national retail chains i.e
‘Reliance Fresh’ and ‘Easy Day present in Jalandhar Punjab. The two national retail stores were
selected because of their maximum number of outlets in Jalandhar. The purposive sampling
technique was used to collect the data from respondents. The population of the study consisted
of consumes who visited these two stores regularly. The present study is based on Respondents,
divided equally among selected stores, were surveyed by using a Retail Service Quality Scale
(RSQS) and measure the validity and reliability of RSQS dimensions (Physical Aspects,
International Journal of Information, Business and Management, Vol. 8, No.2, 2016
ISSN 2076-9202
210
Personal Interaction, Problem Solving, Policy and Reliability). Confirmatory Factor Analysis (CFA)
using AMOS 18.0 was used to test the retail service quality scale factor structure.
Analysis and Discussion
Structural equation modeling using AMOS18.0 has used to test the retail service quality model.
Confirmatory factor analysis has been performed on the five basic dimensions of retail service quality
scale and the following results are obtained. In order to measure the validation of retail service quality
measurement instrument in Indian stores context first of all reliability of the collected data has been
checked.
A. RELIABILITY AND VALIDITY RESULTS
1. RELIABILITYANALYSIS:-
“Reliability is the tendency of a respondent to respond in the same or in a similar manner to an identical
or a near identical question (Burns &Bush, 1999).”
“The internal consistency reliability is used to assess the reliability of a summated scale by which
several items are summed to form a total score (Malhotra, 2004).”
The basic approach to measure the internal consistency reliability is split-half technique .In this
technique; the items are divided into equivalent groups. This division is done on the basis of some
predefined aspects as odd versus even number questions in the questionnaire or split of items randomly.
After division, responses on items are correlated. High correlation coefficient indicates high internal
consistency, and low correlation coefficient indicates low internal consistency.
Internal reliability of the scale was examined using the Cronbach alpha coefficients. The results (Table1)
indicate that the retail service quality scale proposed by Dabholkar, Thorpe andrentz (1996) is a reliable
instrument, returning an overall cronbach alpha of 0.92. Taking 0.7 and above as indicator of reliability
(Nunnally, 1978), we see that all under lying sub- dimensions/dimensions are r e l i a b l e e x c e p t t h e
c o n v e n i e n c e sub-dimension pe r ta i n in g to Physical aspects dimension of Service quality
(alpha=0.63).
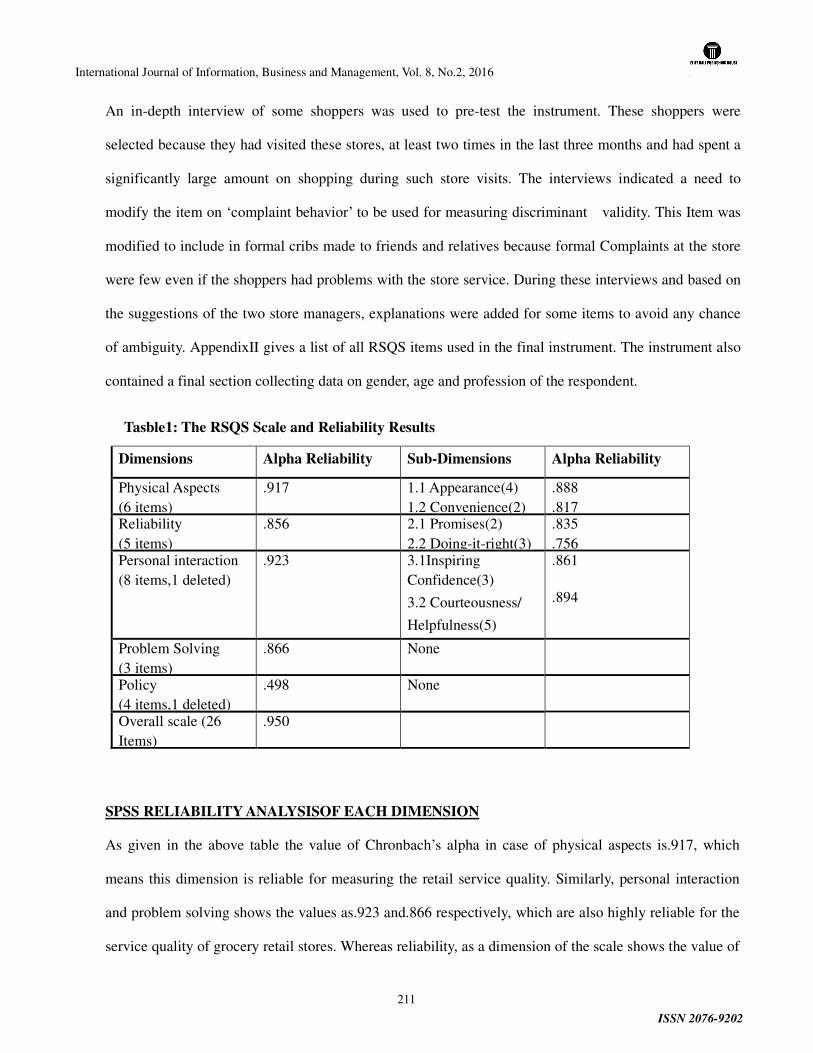
International Journal of Information, Business and Management, Vol. 8, No.2, 2016
ISSN 2076-9202
211
An in-depth interview of some shoppers was used to pre-test the instrument. These shoppers were
selected because they had visited these stores, at least two times in the last three months and had spent a
significantly large amount on shopping during such store visits. The interviews indicated a need to
modify the item on ‘complaint behavior’ to be used for measuring discriminant validity. This Item was
modified to include in formal cribs made to friends and relatives because formal Complaints at the store
were few even if the shoppers had problems with the store service. During these interviews and based on
the suggestions of the two store managers, explanations were added for some items to avoid any chance
of ambiguity. AppendixII gives a list of all RSQS items used in the final instrument. The instrument also
contained a final section collecting data on gender, age and profession of the respondent.
Tasble1: The RSQS Scale and Reliability Results
Dimensions Alpha Reliability Sub-Dimensions Alpha Reliability
Physical Aspects (6 items)
.917 1.1 Appearance(4) 1.2 Convenience(2)
.888
.817 Reliability (5 items)
.856 2.1 Promises(2) 2.2 Doing-it-right(3)
.835
.756 Personal interaction (8 items,1 deleted)
.923 3.1Inspiring Confidence(3)
3.2 Courteousness/
Helpfulness(5)
.861 .894
Problem Solving (3 items)
.866 None
Policy (4 items,1 deleted)
.498 None
Overall scale (26 Items)
.950
SPSS RELIABILITY ANALYSISOF EACH DIMENSION
As given in the above table the value of Chronbach’s alpha in case of physical aspects is.917, which
means this dimension is reliable for measuring the retail service quality. Similarly, personal interaction
and problem solving shows the values as.923 and.866 respectively, which are also highly reliable for the
service quality of grocery retail stores. Whereas reliability, as a dimension of the scale shows the value of
International Journal of Information, Business and Management, Vol. 8, No.2, 2016
ISSN 2076-9202
212
0.856 along with policy which is.498 which means customers are not very much rely on these two
dimensions specially the dimension of Policy of Grocery retail stores.
The above statistics show the Cronbach’s alpha‘s value that is.950 of overall scale which indicates very
good results of the study means it indicates that the data collected for measuring the validity of the RSQS
scale in Indian grocery store context is highly reliable. However, two items/sub dimensions, namely
‘telephonic interaction with customers’ and ‘store own credit cards’, as they are not suitable in the Indian
context in comparison of another dimension.
2. VALIDITY ANALYSIS:-
Validity is the extent to which a test measures what it claims to measure. It is vital for a test to be valid
in order for the results to be accurately applied and interpreted. Validity isn’t determined by a single
statistic, but by a body of research that demonstrates the relationship between the test and the behavior it
is intended to measure. These are:-
I. Content validity:
When a test has content validity, the items on the test represent the entire range of possible items, the
test should cover. Individual test questions may be drawn from a large pool of items that cover a broad
range of topics. In some instances, where a test measures a trait that is difficult to define, an expert
judge may rate each items’ relevance. Because each judge is basing their rating on opinion, two
independent judges rate the test separately. Items that are rated as strongly relevant by both judges will
be included in the final test, so, two items / sub dimensions, namely ‘telephonic interaction with
customers ’and‘ store own credit cards’ ,as they are not suitable in the Indian context in comparison of
other dimension. An improvement in the process used in this study was that in addition to our analysis,
two other sources were used to examine the face validity of the items: independent expert faculty
members with extensive academic and consulting experience in Indian retailing and store managers of
the Grocery specialty stores (Easy Day &Reliance Fresh).
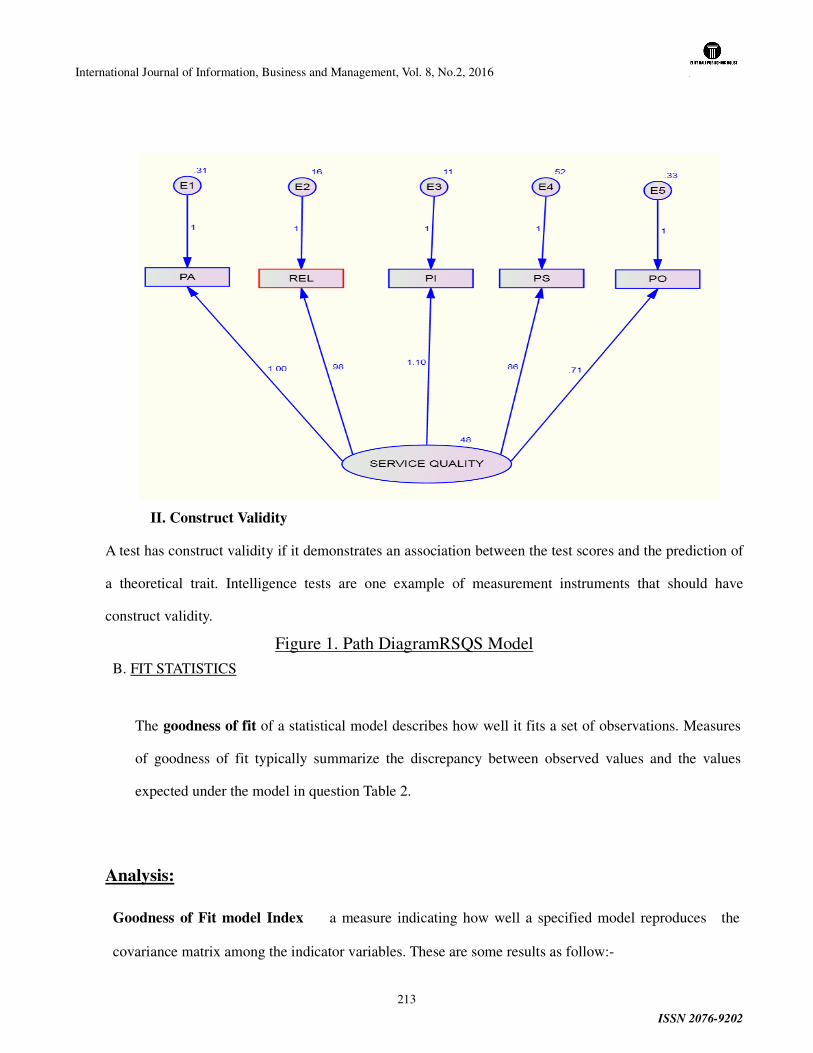
International Journal of Information, Business and Management, Vol. 8, No.2, 2016
ISSN 2076-9202
213
II. Construct Validity
A test has construct validity if it demonstrates an association between the test scores and the prediction of
a theoretical trait. Intelligence tests are one example of measurement instruments that should have
construct validity.
Figure 1. Path DiagramRSQS Model
B. FIT STATISTICS
The goodness of fit of a statistical model describes how well it fits a set of observations. Measures
of goodness of fit typically summarize the discrepancy between observed values and the values
expected under the model in question Table 2.
Analysis:
Goodness of Fit model Index a measure indicating how well a specified model reproduces the
covariance matrix among the indicator variables. These are some results as follow:-
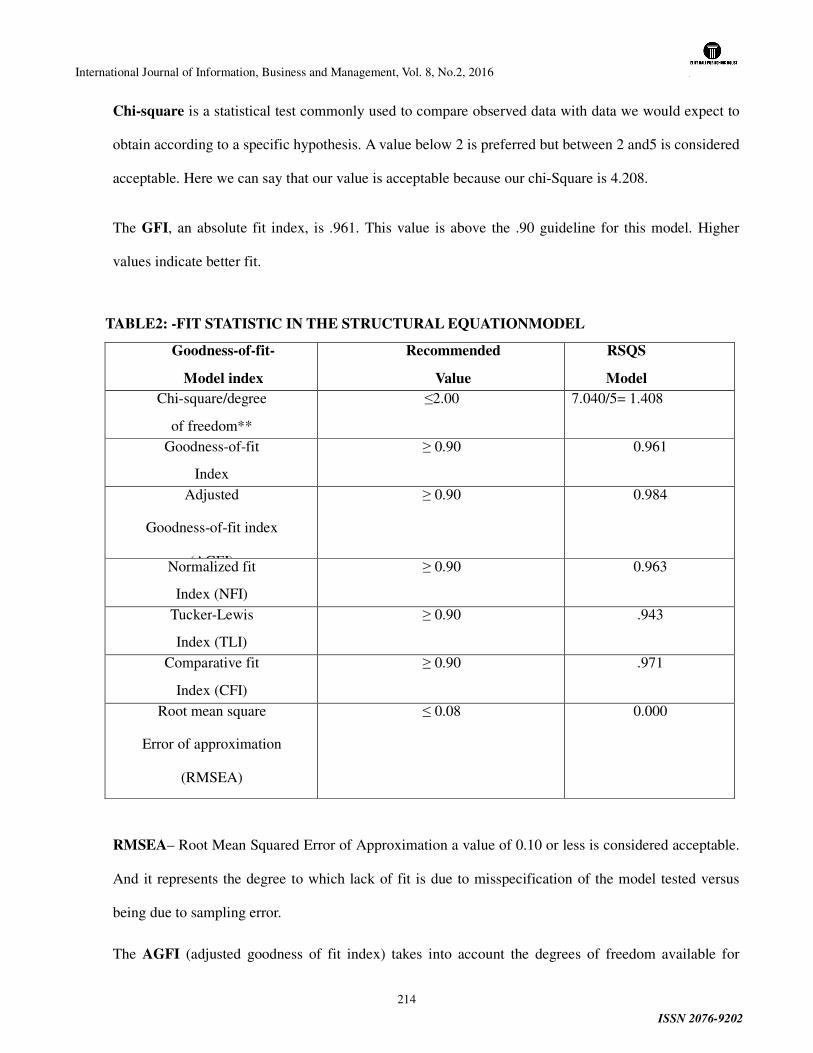
International Journal of Information, Business and Management, Vol. 8, No.2, 2016
ISSN 2076-9202
214
Chi-square is a statistical test commonly used to compare observed data with data we would expect to
obtain according to a specific hypothesis. A value below 2 is preferred but between 2 and5 is considered
acceptable. Here we can say that our value is acceptable because our chi-Square is 4.208.
The GFI, an absolute fit index, is .961. This value is above the .90 guideline for this model. Higher
values indicate better fit.
TABLE2: -FIT STATISTIC IN THE STRUCTURAL EQUATIONMODEL
RMSEA– Root Mean Squared Error of Approximation a value of 0.10 or less is considered acceptable.
And it represents the degree to which lack of fit is due to misspecification of the model tested versus
being due to sampling error.
The AGFI (adjusted goodness of fit index) takes into account the degrees of freedom available for
Goodness-of-fit-
Model index
Recommended
Value
RSQS
Model Chi-square/degree
of freedom**
≤2.00 7.040/5= 1.408
Goodness-of-fit
Index
≥ 0.90 0.961
Adjusted
Goodness-of-fit index
(AGFI)
≥ 0.90 0.984
Normalized fit
Index (NFI)
≥ 0.90 0.963
Tucker-Lewis
Index (TLI)
≥ 0.90 .943
Comparative fit
Index (CFI)
≥ 0.90 .971
Root mean square
Error of approximation
(RMSEA)
≤ 0.08 0.000
International Journal of Information, Business and Management, Vol. 8, No.2, 2016
ISSN 2076-9202
215
testing the model. It is given by
Where.
The AGFI is bounded above by one, which indicates a perfect fit. It is not, however, bounded below by
zero, as the GFI is.
CFI represents the improvement of fit of the specified model over a base line model in which all
variables are constrained to be uncorrelated. Our value is 0.971 which is good because it should be
>0.90.
Findings
• The two dimensions ‘telephonic interaction with customers’ and‘ store own credit cards’ are not
valid in the context of Indian Retail (Grocery) market or stores.
•The main finding is that this Scale (RSQS) can be validated in the Indian Context Retail stores as
results are favorable
• The Indian consumer does not distinguish between service attributes related to Reliability and Policy.
An examination of the items indicates that the items in both dimensions have a common characteristic
• The RSQS scale shows good convergent and predictive validity as well as an acceptable level of
reliability in the Indian retail setting. Though, the discriminant validity of the scale could not be
established, these findings indicate that the RSQS can be used to assess overall service quality in grocery
retail stores.
Recommendations
International Journal of Information, Business and Management, Vol. 8, No.2, 2016
ISSN 2076-9202
216
•A large number of upcoming organized retail stores can also use the instrument in enhancing their
service quality levels. Being proven valid and reliable the Retail Service Quality Scale (RSQS) may be
further used by researchers and academicians in Indian business setting and particularly in grocery
retailing.
• The customers in Indian business setting are not yet accustomed with the credit card usage or do not
find it as a safe option for payment.
Conclusions and Implications for Retailers
The RSQS validity and reliability in the Indian retail setting indicate that the RSQS can be used to assess
the overall service levels provided by the store and for tracking changes in overall service levels over a
period of time. But RSQS would help identify only three service areas for focus; a relatively clear
dimension of ‘Physical aspects’, a slightly hazy ‘Problem solving’ area and one confusing generic
dimension of ‘Store Policy’. Even the six sub-dimensions are highly collinear not just within the same
dimension but even across different dimensions adding to the haziness of dimensions. This severely
restricts the usefulness of the scale as a diagnostic tool for providing strategic direction. Retailers wanting
greater clarity in identifying areas for service improvement will be disappointed with the RSQS hazy
dimensions.
Retailers and researchers applying multi-dimensional service quality scales developed internationally,
such as the RSQS in the Indian context are advised to pay special attention to scale adaptation to ensure
that the scale has reliable diagnostic ability. International retailers planning a foray into India would
require careful re-thinking before applying their existing perspectives on service quality gained in other
countries to Indian shoppers.
References/Bibliography
International Journal of Information, Business and Management, Vol. 8, No.2, 2016
ISSN 2076-9202
217
� Mohammad Amin (2007). Competition and Labor Productivity in India’s Retail Stores, p.1.
World Bank. p. 57.
� Steven Greenhouse (October 27, 2012). "A Part-Time Life, as Hours Shrink and Shift". The New
York Times. Retrieved October 28, 2012
� Anand Dikshit (12 August 2011). "The Uneasy Compromise - Indian Retail". The Wall Street
Journal.
� http://www.fnbnews.com/article/detnew.asp?articleid=34352§ionid=25
� Abu Nor Khalidah,(2004) "Service Quality Dimensions: A Study on Various Sizes of Grocery
Retailers"- A eonceptual paper
� Parasuraman. A. et al,(1988) "SERVQUAL: A Multiple Item Scale for Measuring Consumer
Perceptions of Service Quality," Journal of Retailing, 64 (Spring), 12-40
� Dabholkar Pratibha A. et al, (1996) "A Measure of Service Quality for Retail Stores: Scale
Development and Validation," Journal of the Academy of Marketing Science, Winter, 24 (1), 3-16
� Malhotra, N.K. (1993). Marketing Research: An Applied Orientation. Englewood Cliffs:
Prentice-Hall.
� Cronin, J.J. Jr. and Taylor, S.A. (1992) ‘Measuring service quality: a re-examination
andExtension’, Journal of Marketing, July, Vol. 56, pp.55–68.
� Vazquez (2001), “Expectations: a comparison standard in measuring service quality:
anAssessment of a reassessment”, Journal of Marketing, Vol. 58 No. 1, pp. 132-9.
International Journal of Information, Business and Management, Vol. 8, No.2, 2016
ISSN 2076-9202
218
A STUDY OF DISCOVERING AND DEVELOPING THE CONCEPT
OF SCHOLAR
Md. Mizanur Rahman1 and Atikur Rahman Baizid2
1 Department of English, Leading University, Sylhet, E-mail: [email protected].
2 Department of Business Administration, Leading University, Sylhet.
E-mail: [email protected]
Abstract
The paper examines the way to become a scholar. Everyone can try to be a scholar but can not be a perfect scholar without
hard practice and patience. A scholar is a person, whose intellectuality is much higher than a common man. He is like world
eye and world heart. In this paper we have discovered the various distinguishing features of a scholar and depending on those
ideologies, we developed this concept of being a Scholar.
Keywords: Scholar, Nature, Books, Tree, Features of Scholar, Soft hearted man, Source of hope.
1. Introduction
The word ‘scholar’ is better to describe than define. A scholar is a specialist in a given branch of knowledge. A scholar is a
learned person and has great knowledge and extensive research in the field. To become a great scholar one should do in-depth
research. This is scholar, who always works for the betterment of mankind and he is the person who unites the man instead of
dividing them. “He is like the world eye, he is the world heart” [1].

International Journal of Information, Business and Management, Vol. 8, No.2, 2016
ISSN 2076-9202
219
2. Materials and Methods
Scholar; a store house of knowledge: It is palpable that, for being a scholar a person needs to work hard along with patience.
It is necessary that, Scholar will be a store house of knowledge. That means, scholar should have the vast knowledge about
everything. So, it is necessary that a scholar must have to be educated and trained first and to do this there are several ways
that he can apply.
2.1. Nature; true master to scholar: Nature has great and enormous influence upon the mind of scholar. The scholar is a
man who is attracted most of all by scenes, sights and phenomena of Nature. There is continuity in Nature instead of chaos.
Such as, every day the sun shines and after setting, the stars appear in the sky. Ever the winds blow and ever the grass grows.
Everything used to follow the law of nature. A Scholar should make his life according to the well disciplined rules. Scholar
should provide benefit to mankind and should not receive any advantages from mankind as natural things. For instance,
An important object of Nature, which always supply benefit to mankind, though it is used by mankind according to their wish.
And this is tree, which also always gives shadow, fruits, wood, etc. which is very much needed to mankind. A scholar will be
as like as tree, who will be like a shadow, and whenever any problem, difficulty and suffering will come he will take it under
his cover like the shadow of a tree. Scholar will be man of no complaint, no objection rather he will work for the betterment of
mankind. A tree sacrifices everything for giving the benefit, profit and advantage to mankind, in the same way a scholar will
sacrifice everything for all.
It is proved from the history that, nature has given the advantages to the people. As for example, Newton learned from nature
and discovered the law of gravitation. Everything moves according to the law of gravitation. He stated the story "After dinner,
the weather being warm, we went into the garden and drank tea, under the shade of some apple trees...he told me, he was just

International Journal of Information, Business and Management, Vol. 8, No.2, 2016
ISSN 2076-9202
220
in the same situation, as when formerly, the notion of gravitation came into his mind. It was occasioned by the fall of an apple,
as he sat in contemplative mood. Why should that apple always descend perpendicularly to the ground, thought he to
himself..."[2]. Now this theory is using worldwide and without reading this law of gravitation anybody will not be able to
complete his graduation in Physics. So, it is proved that, this is Nature which helped Newton to discover this idea and to work
for the people of the world. So, Scholar should have this feeling and excellencies to accept the fruitful attitudes of nature.
Many people thought that the man cannot fly and it was impossible according to some of them. But there were some other
persons, who started working to invent the flying machine, by which people can move from one place to another within a short
span of time. Many invented this flying machine but when started flying it crashed immediately and they were unable to find
out the reason of crush. That was Orville and Wilbur Wright, who learned from nature and eventually able to invent the flying
machine. “They studied the way birds move through the air and tried to duplicate it with their models”[3] This is only nature
which directly shows the success.
An animal, that always works for its master until the last breath of it’s life. It never thinks about himself such as, whether it is
getting food or not, even it never thinks about its suffering whether it is day or night, it always serves it’s master and never
leave it’s master’s house by the misbehavior of master, rather it always guard and obey its master, even it is ready to sacrifice
its life for his master. And this is non other than Dog. Like it, a scholar will not think about his receiving, rather he will
always work for the betterment of people. There is a possibility that he will get sufferings from the people instead of reward
but a scholar will not leave behind the people, instead of leaving them he will work for the people until the end of time.
So it’s clear that, each and every Natural object is serving the human being without thinking the benefit of itself and also
providing the message of sacrifice. Scholar will accept these sacrificing tendencies of nature. Nature is a master to Scholar.
Nature is always ready to lose it’s everything for the betterment of the people.

International Journal of Information, Business and Management, Vol. 8, No.2, 2016
ISSN 2076-9202
221
2.2. Books; a guide, inspiration, and better source : The best way to learn without getting a formal education is to read a lot.
Read as much as you can at every opportunity. This is the way to be a scholar. People in general are largely affected by books.
Books have a profound influence and impact upon all reading people, but especially upon the mind of a scholar. Scholars
should not spend their time idly. Every moment is very much worthy to them. They give value to their time. “Books are
scholar’s idle time” [4]. For getting guide and inspiration every minute scholar will spend. To common people a novel for
instance contains a story but to scholar this is not only a novel but also it’s a picture of life, which contains information of its
age.
2.3. Selection and rejection from books: Books are the best company and friend to men. A friend of no objection. Scholars
when read the books they take the proper juice from the books.”Books are the best of things, well used; abused, among the
worst” [4] . This is only Scholar, who is much aware in selecting and rejecting the philosophy and ideology. And this is true
that, the character of pleasure, which derive from books, is remarkable. Also, there is no doubt that the knowledge we get from
the books is outstanding and noteworthy. It is an important fact that, the idea, which we obtain from book, is not applicable for
all ages. Scholar read books carefully and accept only those ideas that are relevant for his age and reject the irrelevant ones. So,
while reading Scholars absorb everything from the books. But they apply those things, which is fruitful for the nations.
2.3. Understanding of previous scholars: For being a scholar, it is necessary to find out the characteristics and depth of the
previous scholar. Here, it is necessary to have that knowledge to bring out the fruitful and positive outcome of the previous
scholar. While studying the previous scholar, several things will come in front of the eyes, but scholar will acknowledge those
virtues which will bring the fruitful result for the nation. For example, a scholar had done many things for the mass people and
while doing that he sacrificed a lot. So, when a scholar is reading their life, he will accept these sacrificing tendencies of the

International Journal of Information, Business and Management, Vol. 8, No.2, 2016
ISSN 2076-9202
222
scholar and ability of endurance whilst doing the work. It is important that, Scholar will not allow himself to find out the faults
of previous scholar. His only duty is to search the beauties of previous scholar and absorb.
3. Distinguishing features of scholar:
There are several characteristics needed to be a scholar, these uniqueness are higher than ordinary characteristics.
3.1. Inquisitiveness: Scholars are naturally curious to know the unknown things and this makes them different from others.
Scholars always want to go to the depth of object. It may say that, natural curiosity and to go the depth of object is an inborn
quality of a scholar. Whenever something is happening around us, scholar tries to find out the reason of this, whereas the
common people are just observing it, to them this is nothing but to a scholar it’s an important and great thing. That is scholar
who is not like an ordinary man, that’s why he always remembers his responsibility towards the society. This responsibility
pushes him to find out the main reason. So that he will work for the society in a proper way. For example, in which way, a
doctor wants to know the reason for the illness of the patient and yearn for discovering the root of illness, in the same way, a
scholar is yearning for discovering the real fact of the problem. Scholars are people who are naturally curious. They want to
know everything.
3.2. Open minded: The mind and heart of scholars are wide like sky and depth like ocean. They are not narrow minded. They
know that, whatever they know this is not like Holly speech, it might be wrong. And this makes him totally different than rigid
person, who tries to establish his own ideology without thinking the betterment of people. On the other hand, scholars are
flexible persons, who always think the betterment of people and for the betterment of common men they can change their mind
and can accept the new information. Scholars have to be willing to change their mind when they get new information that
challenges their previous views. This is one of the most important skills for a scholar. Be open minded and willing to be wrong,

International Journal of Information, Business and Management, Vol. 8, No.2, 2016
ISSN 2076-9202
223
in the pursuit of being right.
3.3. Free from greed of wealth and reputation : There is a general tendency of people that, they want money, because it is
well known that the person who has money can do everything. But this is only the scholar who does not have the tendency to
get more money. They do not run after money. Also they do not have the mentality to be popular. That is why they don’t do
anything that focus and attract the common men to get money or name or fame, rather they do everything, which is productive
and which bring benefits for the people.
There is a subtle thing and that is, people will believe and depend on scholar and this is not an easy task to earn and acquire the
belief of people. If people don’t believe the scholar then it will be very much complicated and difficult to establish the ideology
of Scholar. The ideology can be rejected at the very beginning and without accepting the philosophy, people may criticize the
Scholar and this is very normal and easy thing, scholar need to consider.
3.4. Service to mankind: It is easy to point out the mistakes of men but it is very much difficult to show the right way. That is
scholar who always thinks about the rectification of himself and mankind. So he works as like as Mother for this refinement.
He will not find out the mistakes of mankind. A scholar must put humanity as the main objective of each inquiry. He does not
hate people, rather he loves all. That’s why people comes to him, takes his advice for rectification. In which way, mother loves
her child and always thinks about them in the same way, a scholar is always concern about the mankind. This concern makes
him totally different. It is found in the society that, people may easily criticize on the fault of men. While discovering and
discussing this fault, there is no positive result come. So, that person will not be a scholar who criticizes the error of common
men. He is always recovering the fault of men.

International Journal of Information, Business and Management, Vol. 8, No.2, 2016
ISSN 2076-9202
224
3.5. Scholar; a soft hearted man: Scholar should be soft hearted. He will cry not for himself but for the common people. That
means when he will see the suffering of men, his heart will be broken. Whatever he has, he will try to spend for the welfare of
men. He will not see the other people whether they are spending or not and his mind is not like the man who thinks if the other
person do then I will do. Rather he is ready to do every possible thing for the people. Also from history we find that, the men
who had feelings for the sufferings of the people they had done many works for them. For example, “Ishwar Chandra
Vidyasagar would start crying in distress whenever he saw poor and weak people lying on the footpath and street. He used to
spend a part of his scholarships and salary for the welfare of those poor people. He would also buy medicine for the sick” [5].
Like Ishwar Chandra Vidyasagar there are so many people who had soft feelings for the people. Likewise, this is only scholar
who has this feelings for the people.
3.6. Active in fulfilling the purpose: A Scholar is neither a silent listener nor an only observer. It is easy to find out the
solution of the problem, but without implementation, it is considered as nothing. So, here the important task of a scholar that,
he not only will say but also he will work his best to implement it. In other words it can be said that, the soul of a scholar
should be active. His active soul will find out the absolute truth at first, and then he will utter this truth and try his level best to
implement it. It is well known that, implementation is necessary for getting the fruitful result of society. Without the
implementation there is no difference between common men and scholar. It is said that, common people might be able to
recognize the solution of the problem but they are unable to accomplish or implement it. Because to implement anything, first,
the thing which come in the mind is courage and strength and audacity to implement it. Also it is necessary to have the ability
to face the difficulties, which may come. Here, it is found that, though common people find the solution, but when the problem
comes they just go behind. On the other hand, scholars are the only persons, who do not go behind whatever the problem

International Journal of Information, Business and Management, Vol. 8, No.2, 2016
ISSN 2076-9202
225
comes rather they are energetic to fulfill the purpose. He sacrifices everything for the implementation of the solution of every
problem if needed.
3.7. Acquisition of self trust: “In self-trust all the virtues are comprehended. Free should the scholar be – free and brave” [4].
A scholar is brave in heart. Bravery and freedom are the spiritual and moral qualities of a scholar. Brave is he, who puts fear
behind. He does not flee away from danger. He investigates into the nature of danger and controls it. That is scholar, who does
not follow the popular opinions. To go against popular opinion with logic is self trust. That is why; scholar goes to the depth of
the things and discovers the fact. If a scholar does not have the confidence that His ideology will bring the fruitful result for the
common people then he won’t be able to apply his ideology. Before applying anything, self trust is important.
3.8. A Role Model to Society: It was a time that whenever a scholar tells anything people just obeyed it but time has changed.
People now want to see that whether the scholar who told the ideology is maintaining his philosophy or not. That means, at
present time or in this modern world, Scholar must have to be model in the eyes of common people and it will be possible
when a scholar will maintain or will run his life according to the ideology which he told. That time it will be much easier for
the common people to run or maintain their life consequently. If not happen, then people will not believe the ideology of the
scholar and the role of scholar will vanish. That is why, scholars self rectification is most important for the common people and
for himself also.
3.9. Scholar; a person of indiscrimination: Everyone is equal in the eyes of a scholar. There is no class distinction in his eyes.
There is no difference to white and black or with Asian people or African people. Rather scholar will work for everyone. He
will break the notion of differences and establish equality. When we search the history we also find it. For example, Ishwar
Chandra Vidyasagar initiated the concept of widow remarriage and raised concern for the abolition of child-marriage and

International Journal of Information, Business and Management, Vol. 8, No.2, 2016
ISSN 2076-9202
226
polygamy. He also opened the doors of the colleges and other educational institutions to lower caste students, which was
earlier reserved only for the Brahmins [6].
3.10. Source of hope: Present world’s people are frustrated. And this frustration comes for even a single reason. Because of
this frustration people are going to do different things. Among these things it is needed to mention suicide. People want to
commit suicide even not thinking the result of it. There is a general tendency that, everyone just wants to follow the successful
person. They are not ready to think about a unsuccessful person. But the gigantic thing is that a failed person can be a role
model for society. If an unsuccessful person tells, what are the things he has done and the reason for being unsuccessful, then
these ideologies will be an asset for the society. So, here the main duty of scholar is to motivate these unsuccessful persons by
telling his duty towards the society. Though this is not an easy task, but scholar first have to realize the mind of that person and
have to take the initiatives. Scholar has the ability to change the negative things into positive.
4. Results and Discussion
This is scholar who watches nature as his master. He learns to lose everything for the betterment of mankind from nature. His
reading is different than common men. He reads books not only for pleasure rather he reads books to take guide and to find out
the possible solution for mankind. His natural curiosities push him to go to the depth of the objects and all this things he does
for the betterment of the mankind. And he does not find out the fault of men rather he finds out the high-qualities of men. He
neither runs after money nor the fame. Scholars don’t be frustrated for the criticism of the people. He lives not for Him but for
people. His self trust prevents him to become weaker and shows the fruitful upcoming results. Scholar is a man, who not only
reveals the truth but also he tries his level best to implement the truth. He is a man of action. He is a source of hope to every
person. He is a man, to whom every person comes to take advice and shelter. He shows the ways of coming pleasure. Every
International Journal of Information, Business and Management, Vol. 8, No.2, 2016
ISSN 2076-9202
227
person believes him, more than myself and trusts him.
5. Conclusion
We have studied the learning places of a Scholar by which he can acquire knowledge at first. We have also studied the
distinguishing features of the concept of Scholar by which anyone can develop himself to be a scholar. This research will open
new dimensions for discovering and developing the concept of Scholar.
References
[1] Emerson, Ralp Waldo. The American Scholar, The Norton Anthology of American Literature. New
York, 2003. p.1139.
[2] Accessed at:
http://www.newscientist.com/blogs/culturelab/2010/01/newtons-apple-the-real-story.html.
[3] Accessed at: http://teacher.scholastic.com/activities/flight/wright/invent.htm.
[4] Emerson, Ralp Waldo. The American Scholar, The Norton Anthology of American Literature. New
York: 2003.
[5] Accessed at: http://www.culturalindia.net/reformers/ishwar-chandra-vidyasagar.html.
[6] Accessed at: http://www.culturalindia.net/reformers/ishwar-chandra-vidyasagar.html.
International Journal of Information, Business and Management, Vol. 8, No.2, 2016
ISSN 2076-9202
228
A STUDY ON INFLUENCING FACTORS TO AFFECT THE
ECONOMIC STATUS OF LAYER POULTRY FARMERS IN
NAMAKKAL DISTRICT OF TAMILNADU
Mr. P.Ravichandran1
Part Time Research Scholar,
Department of Economics,
Jamal Mohamed College(Autonomous),
Tiruchirappalli - 620 020.
Dr.A.Khan Mohamed2,
Associate Professor,
Department of Economics,
Jamal Mohamed College(Autonomous),
Tiruchirappalli - 620 020.
ABSTRACT:
Poultry industry is one of the fastest growing segments of the agricultural sector in India. The
important aspect of poultry development in India is the significant variation in the industry across
different regions. Namakkal poultry farmers faced many constraints in poultry egg production due to
climate factor, disease outbreak, poor quality of chicks, lack of quality feed and, Bio security, seasonal
variations in egg prices and demand, poor infrastructural facility. The economic status of Namakkal
poultry farmers highly influenced by the above said factors in day-today life. Among these factors, the
climatic factor ranks first in affecting the economic status of poultry farmers. This factor influences the
prices of the eggs, productivity of eggs. We conclude that if the poultry farm is not affected by climatic
factor, the revenue would be more throughout the year. This study suggests that the poultry farmers may
adopt a suitable precautionary method to prevent the outbreaks by climatic factor. Then the economic
status of the poultry farmers will be in equilibrium.
Key terms:
Poultry, Layer farm, Economic status, solution factor, Constraints, Diseases, Egg price fluctuations.
1. INTRODUCTION:
An economy or economic system consists of the production, distribution or trade, and consumption
of limited goods and services by different agents [4]. Economics is the social science that studies
economic activity to gain an understanding of the processes that govern the production, distribution and
consumption of goods and services in an economy [4]. Historically, India has classified and tracked its
economy and GDP as three sectors - agriculture, industry and services. Agriculture includes crops,
horticulture, milk and animal husbandry, aquaculture, fishing, sericulture, aviculture, forestry and related
International Journal of Information, Business and Management, Vol. 8, No.2, 2016
ISSN 2076-9202
229
activities. Industry includes various manufacturing sub-sectors. India's definition of services sector
includes its construction, retail, software, IT, communications, hospitality, infrastructure operations,
education, health care, banking and insurance, and many other economic activities[2][3].
2. INDIAN ECONOMY:
The economy of India is the tenth-largest in the world by nominal GDP and the third-largest by
purchasing power parity (PPP)[5]. The country is one of the G-20 major economies, a member of BRICS
and a developing economy that is among the top 20 global traders according to the WTO [7]. India was
the 19th-largest merchandise and the sixth largest services exporter in the world in 2013; it imported a
total of $616.7 billion worth of merchandise and services in 2013, as the 12th-largest merchandise and
seventh largest services importer [8]. India's economic growth slowed to 4.7% for the 2013–14 fiscal year,
in contrast to higher economic growth rates in 2000s[9]. The Indian Finance Ministry projects the GDP
growth for fiscal 2014 will be 5.5% [10]. IMF projects India's GDP to grow at 5.6% over 2014-15 [11].
Agriculture sector is the largest employer in India's economy but contributes a declining share of its GDP
(13.7% in 2012-13) [6]. Its manufacturing industry has held a constant share of its economic contribution,
while the fastest-growing part of the economy has been its services sector - which includes construction,
telecom, software and information technologies, infrastructure, tourism, education, health care, travel,
trade, banking and other components of its economy.
The economy was then characterized by extensive regulation, protectionism, public ownership of
large monopolies, pervasive corruption and slow growth [12][13]. Since 1991, continuing economic
liberalization has moved the country towards a market-based economy [12][13]. By 2008, India had
established itself as one of the world's faster-growing economies. Growth significantly slowed to 6.8% in
2008–09, but subsequently recovered to 7.4% in 2009–10, while the fiscal deficit rose from 5.9% to a
high 6.5% during the same period [14]. India's current account deficit surged to 4.1% of GDP during Q2
FY11 against 3.2% the previous quarter. The unemployment rate for 2012–13, according to Government
of India's Labour Bureau, was 4.7% nationwide, by UPS method; and 3% by NSSO method. India's
consumer price inflation has ranged between 8.9 to 12% over the 2009-2013 periods [15].
3. POULTRY INDUSTRY IN INDIA:
• The Poultry Business in India is a very old practice and this food industry is one of the important
contributors to the economy of rural and semi-urban India. India ranks seventeenth in the world poultry
production index.
• Further, India is the fifth largest producer of eggs and ninth largest producer of poultry meat
amongst all the countries.
• Indian Poultry Industry is 5,000 years old, since last 4 decades it began to witness remarkable
International Journal of Information, Business and Management, Vol. 8, No.2, 2016
ISSN 2076-9202
230
growth from backyard to poultry industry.
• The organized sector of poultry industry is contributing nearly 70% of the total output and the rest
30% in the unorganized sector.
• The broiler industry is well dominated in southern states in our country with nearly 60-70% total
output coming from these states.
• The layer industry once again is represented more in southern states especially, Andhra Pradesh,
Tamil Nadu and Maharashtra producing nearly 70% of the country's egg production.
• India's 75% of egg production consumed by the 25% population living in urban, semi-urban areas.
Presently more than 800 hatcheries are operating in the country.
• India has emerged as the only country in the developing world a self-reliant, technology driven
industry, with capability to produce every essential input for successful poultry farming including
indigenous genetic resource and breeding, world class poultry vaccines and medicines, specific pathogen
free eggs (SPF), farms and hatchery automation systems, pelleted feed, egg processing, poultry
processing, nationwide network of disease diagnostic laboratories and facilities for entrepreneurial
development and training in both private and public sectors [16].
3.1 BENEFITS OF POULTRY FARMING:
The poultry farming is very versatile agro-business and it provides some benefits. They are
• It was source of high quality human food. Egg is not only supports in nutritive value, nut also it is
very easily digested and cab be served indifferent ways. Of this also used in many ways like
binders and levering agents in banking and furnishes richness in ice-cream, sauces, curlards and
candues
• Poultry farming is highly adaptable under various conditions. It fits well in mixed farming system
to provide continuous income to the farmers during their lean periods and also helps to engage
their family labor profitable throughout the year.
• It provides employment avenues. There are many diversified types of business allied poultry
farming like egg production, broiler production. All these business can develop as rural industries,
which will have many avenues of employment of rural side particularly among educated
unemployed and under-employed persons.
• Poultry waste is an excellent source of organic manure, which can utilized for growing field crops.
It estimated that of the poultry manure utilized properly, it could produce more food grains them
the birds consume as feed.
• It serves as source of raw materials for industrial products. Eggs have many industrial uses in
preparation of vaccines, varnished printers land, soap, shampoo etc. Eggshells are using as
minerals in animal feed. Endocrine glands of birds are using for preparation of hormones and any
other biological preparations.
4. PROFILE OF THE STUDY AREA (NAMAKKAL DISTRICT, TAMILNADU, INDIA):

International Journal of Information, Business and Management, Vol. 8, No.2, 2016
ISSN 2076-9202
231
Namakkal District is an administrative district in the state of Tamil Nadu, India. The district was
bifurcated from Salem District with Namakkal town as Headquarters on 25-07-1996 and started to
function independently from 01-01-1997. The district has 4 taluks (subdivisions); Tiruchengode,
Namakkal, Rasipuram, Velur and Kolli Hills(in descending order of population) and has two Revenue
Divisions; Namakkal and Tiruchengode. It was ranked second in a comprehensive Economic
Environment index ranking of districts in Tamil Nadu not including Chennai prepared by Institute for
Financial Management and Research in August 2009. It was major source of Tamil Nadu Economy. As of
2011, Namakkal district had a population of 1,726,601 with a sex-ratio of 986 females for every 1,000
males.
History:
After the struggle between the Cheras, Cholas and Pandyas, the Hoysalas rose to power and had the
control till the 14th century followed by Vijayanagara Empire till 1565 AD. Then the Madurai Nayakas
came to power in 1623 AD. Two of the Poligans of Tirumalai Nayak namely, Ramachandra Nayaka and
Gatti Mudaliars ruled the Salem area. The Namakkal fort is reported to have been built by Ramchandra
Nayaka. After about 1635 AD, the area came successively under the rule of Muslim Sultans of Bijapur
and Golkonda, Mysore kings and then the Marattas, when about the year 1750 AD Hyder Ali came to
power. During this period, it was a history of power struggle between Hyder Ali and later Tippu Sultan,
with the British.
Geography
Namakkal district is bounded by Salem district on the north; on the east by Attur taluk of Salem
district, Perambalur and Tiruchirapalli District's; by Karur District on the south and on the west by Erode
district.
Namakkal District comes under the North Western Agro climatic zone of Tamil Nadu. It is situated
in the dividing portion of two watersheds between Cauvery and the Vellar System with the Taluks of
Attur, Rasipuram and Namakkal on the East and Salem, Omalur and Mettur on the West. Tiruchengode
taluk alone is placed under Western Agro-climatic zone.
Besides the above two zones, Kolli and a few isolated hills and ridges are scattered over Namakkal,
Rasipuram and Tiruchengode and along with the valleys and rolling hills, make up the characteristic
topography of the district.
Demographics:
According to 2011 census, Namakkal district had a population of 1,726,601 with a sex-ratio of 986
females for every 1,000 males, much above the national average of 929. A total of 150,699 were under
the age of six, constituting 78,754 males and 71,945 females. Scheduled Castes and Scheduled Tribes
accounted for 20.% and 3.3% of the population respectively. The average literacy of the district was
International Journal of Information, Business and Management, Vol. 8, No.2, 2016
ISSN 2076-9202
232
68.12%, compared to the national average of 72.99%. The district had a total of 475,511 households.
There were a total of 898,245 workers, comprising 152,497 cultivators, 228,614 main agricultural
labourers, 35,156 in house hold industries, 422,885 other workers, 59,093 marginal workers, 5,976
marginal cultivators, 25,112 marginal agricultural labourers, 3,641 marginal workers in household
industries and 24,364 other marginal workers.
Industry
The main occupation in the district is agriculture. The cultivation generally depends on monsoon
rains, wells and tanks. Nearly 90 percent of the cultivated area is under food crops. The principal cereal
crops of this district are paddy, cholam, cumbu and ragi. Panivaragu, Kuthiraivali, Samai Varagu and
Thinai are some of the millets cultivated. Among pulses, the major crops are redgram, blackgram,
greengram and horsegram. Among oil seeds groundnut, castor and gingelly (sesame) occupy important
places. Of the commercial crops, sugarcane, cotton and tapioca are some of the important crops. Tapioca
is used for the manufacture of sago.
Namakkal district is noted for Truck and Lorry external body building which dates back to 1956.
Throughout India Tiruchengode is known for its Body Building industry for Trucks, Trailers, Tankers and
Rig Unit. Finished trucks and Rig Units are even exported to foreign countries from Namakkal. Nearly
25000 people are employed either directly and indirectly in truck body building activity and about 300
units in Namakkal and 100 Units in Tiruchengode are engaged in this activity.
Poultry development has been rather phenomenal in the district of Namakkal. The district is also
well known for its poultry and dairy industries, accounting for a bulk of supply of poultry products to
neighbouring industries. In fact, Namakkal produces about 65% of the egg output of Tamil Nadu.
5. FACTORS AFFECTING THE EGG PRODUCTION:
There are many factors that can adversely affect egg production. Unraveling the cause of a sudden
drop in egg production requires a thorough investigation into the history of the flock. Egg production can
be affected by such factors as feed consumption (quality and quantity),water intake, intensity and duration
of light received, parasite infestation, disease, and numerous management and environmental factors[17].
Following sharp declining in prices, egg farmers in Namakkal, which accounts for 20 per cent of
country's production, is now seeing some price correction. Poultry farms in the Namakkal cluster in
Southern Tamil Nadu produce around 3.08 crore eggs a day. About 40 per cent of the total eggs are
consumed by the Kerala market and by schools in Tamil Nadu under the free meal programme. Around
45 lakh eggs are supplied a day for the Mid-day Meals scheme, according to sources. The other major
market was Hyderabad. Every day around 30 lakh eggs are exported from Namakkal.
International Journal of Information, Business and Management, Vol. 8, No.2, 2016
ISSN 2076-9202
233
The increase of demand in Hyderabad now has an impact in the price of eggs in Namakkal. If the
demand is high in Hyderabad, the eggs from Namakkal could be transported there, which helps the
distributors. The ban on fishing in the west cost of the country, such as in Kerala, has increased demand
of eggs there and generally, during the rainy season the demands are high, which is the reason for the
increase in prices. Given the current trend, the prices are expected to go up further in the coming days,
which would help the poultry farmers who has been suffering in the past. Consumption is also good in
Mumbai and Gujarat and this is reflecting in the increase of prices in the national level.
Orders from all the three major consumers - Andhra Pradesh, Kerala and Tamil Nadu -- dropped
drastically, which in turn brought down the rates drastically earlier, says the Egg Producers Association
representatives. Order from the Tamil Nadu Government was reduced due to the Election Code of
Conduct on supplies for mid day meals.
6. RESEARCH METHODOLOGY:
This study is an empirical study based on survey method. The data collected for the study both
primary and secondary data collected from journals and magazines. Primary data were collected directly
from the farmers through personnel interview method aided by a schedule. Secondary data has collected
from various books, journals, magazines, periodicals, reports, websites, official documents and
unpublished thesis and veterinary doctors.
Field work:
The field work was carried out during the year 2012 to 2014. Each interview took about half a day.
Nearly 350 poultry farm entrepreneurs were interviewed for collecting data. The interview was
conversational in style and respondents were made to feel at home and easy.
Limitations:
Estimation of the economic status for the previous years was difficult. Most of the poultry farmers
do not keep correct accounts of their receipts and expenditures or any other statistical data. Most of them
are given by the respondents only from their memory which may not be accurate. However, every effort
has been taken by researcher to collect the data as accurate as possible.
6.1 DATA COLLECTION:
After identifying and defining the research problem and determining specific information required to
solve problem, the researchers task is to look for the type and sources of data, which may yield the
defined results. Generally, the researcher straight away resorts to survey method for data collection.
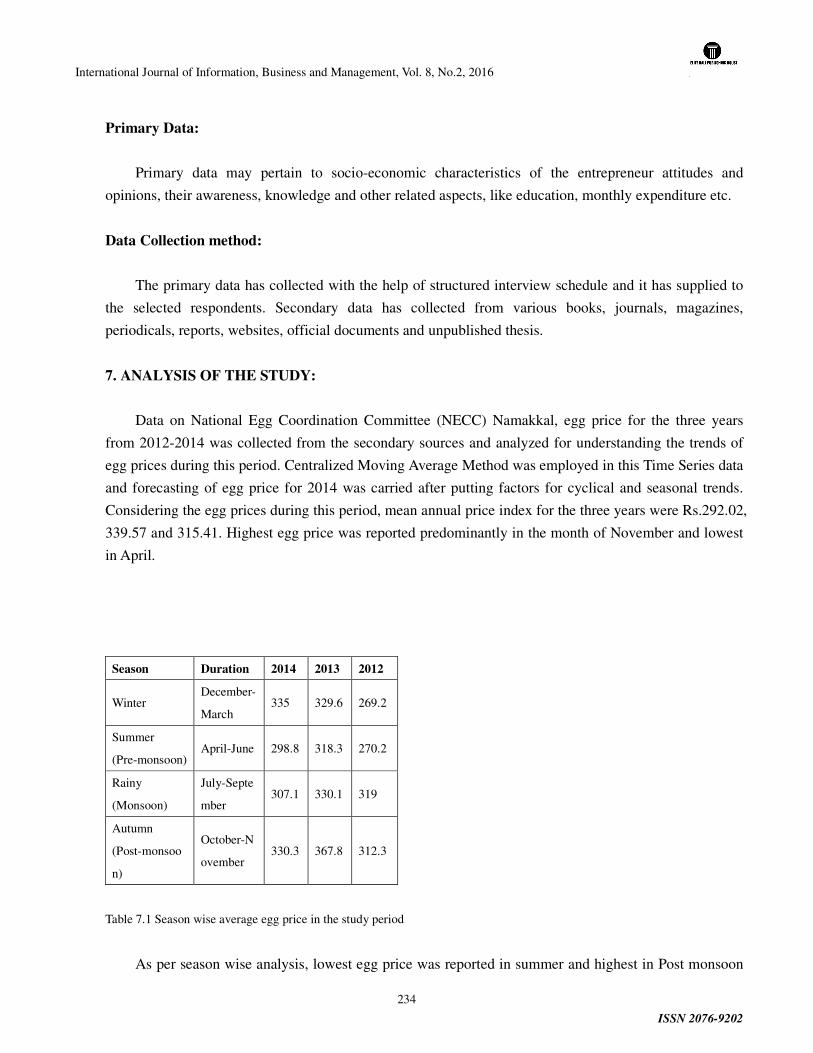
International Journal of Information, Business and Management, Vol. 8, No.2, 2016
ISSN 2076-9202
234
Primary Data:
Primary data may pertain to socio-economic characteristics of the entrepreneur attitudes and
opinions, their awareness, knowledge and other related aspects, like education, monthly expenditure etc.
Data Collection method:
The primary data has collected with the help of structured interview schedule and it has supplied to
the selected respondents. Secondary data has collected from various books, journals, magazines,
periodicals, reports, websites, official documents and unpublished thesis.
7. ANALYSIS OF THE STUDY:
Data on National Egg Coordination Committee (NECC) Namakkal, egg price for the three years
from 2012-2014 was collected from the secondary sources and analyzed for understanding the trends of
egg prices during this period. Centralized Moving Average Method was employed in this Time Series data
and forecasting of egg price for 2014 was carried after putting factors for cyclical and seasonal trends.
Considering the egg prices during this period, mean annual price index for the three years were Rs.292.02,
339.57 and 315.41. Highest egg price was reported predominantly in the month of November and lowest
in April.
Season Duration 2014 2013 2012
Winter December-
March 335 329.6 269.2
Summer
(Pre-monsoon) April-June 298.8 318.3 270.2
Rainy
(Monsoon)
July-Septe
mber 307.1 330.1 319
Autumn
(Post-monsoo
n)
October-N
ovember 330.3 367.8 312.3
Table 7.1 Season wise average egg price in the study period
As per season wise analysis, lowest egg price was reported in summer and highest in Post monsoon

International Journal of Information, Business and Management, Vol. 8, No.2, 2016
ISSN 2076-9202
235
period. The mean difference between highest and lowest egg price in the year 2014 was 36.2, indicates
the high fluctuations in the egg prices during the reported period. Based on the table, the highest egg price
was forecasted in November -2014 (Rs.353.83) and lowest in April -2014(Rs.258.13) with the mean
annual egg price of Rs.315.41
Month Year
2014 2013 2012
January 343.87 336.9 284.58
February 319.82 365.86 261.66
March 294.94 310.16 261.39
April 258.13 296.67 230.33
May 314.52 289.45 269.45
June 323.83 368.9 310.83
July 316 334.68 290.03
August 282.26 323.55 311.03
September 323 332 356.07
October 306.68 345.84 314.52
November 353.83 389.77 309.17
December 348.1 381.16 305.29
Average 315.41 339.57 292.02
Table 7.2 Month wise Average Egg price during the Study Period
The above table shows the average egg price for month wise in the study period. These average
prices have applied to a graph.
Figure 7.1.a Graph for Month wise Average Egg price during the Study Period
The above graph shows the average egg price in the study period. The information from the above
graph the summer period the poultry farmer’s economic ratio has got down in each year. This economic
fluctuation has created by the climate.
0
100
200
300
400
500
jan
feb
ma
r
ap
r
ma
y
jun
jul
au
g
sep
oct
no
v
de
c
2014
2013
2012

International Journal of Information, Business and Management, Vol. 8, No.2, 2016
ISSN 2076-9202
236
Month(2014)
Average Maximum
Temparature
(in Celsius /
Namakkal District,
Tamilnadu)
January 30.645
February 33.285
March 36.193
April 39.767
May 37.806
June 38.833
July 37.677
August 36.774
September 37.067
October 33.548
November 30.067
December 30.162
Table 7.3 Average Maximum temperature has recorded in the Study area in the year 2014
The above table shows the Average Maximum temperature has recorded in Namakkal District,
Tamilnadu, India. Due to climate factor the birds had been suffered by combined diseases. So, the people
do not prefer to take these kind of foods in the summer period.
Figure 7.1.b Graph for average maximum temperature in the study area during the year 2014
The above graph shows the average maximum temprature recorded in study area. In this study
conclude that the summer period the birds were being affected by the combined diseases. Due to incrase
the economic status of the poultry farmers we have to give the precautionary measures which have to
follow the poultry farmers in the summer period. If the poultry farmers save the birds from disease
outbreak during the summer period, definitely they will get unflectuated economic status.
0
10
20
30
40
50
Jan
Fe
b
Ma
r
Ap
r
Ma
y
Jun
Jul
Au
g
Se
p
Oct
No
v
De
c
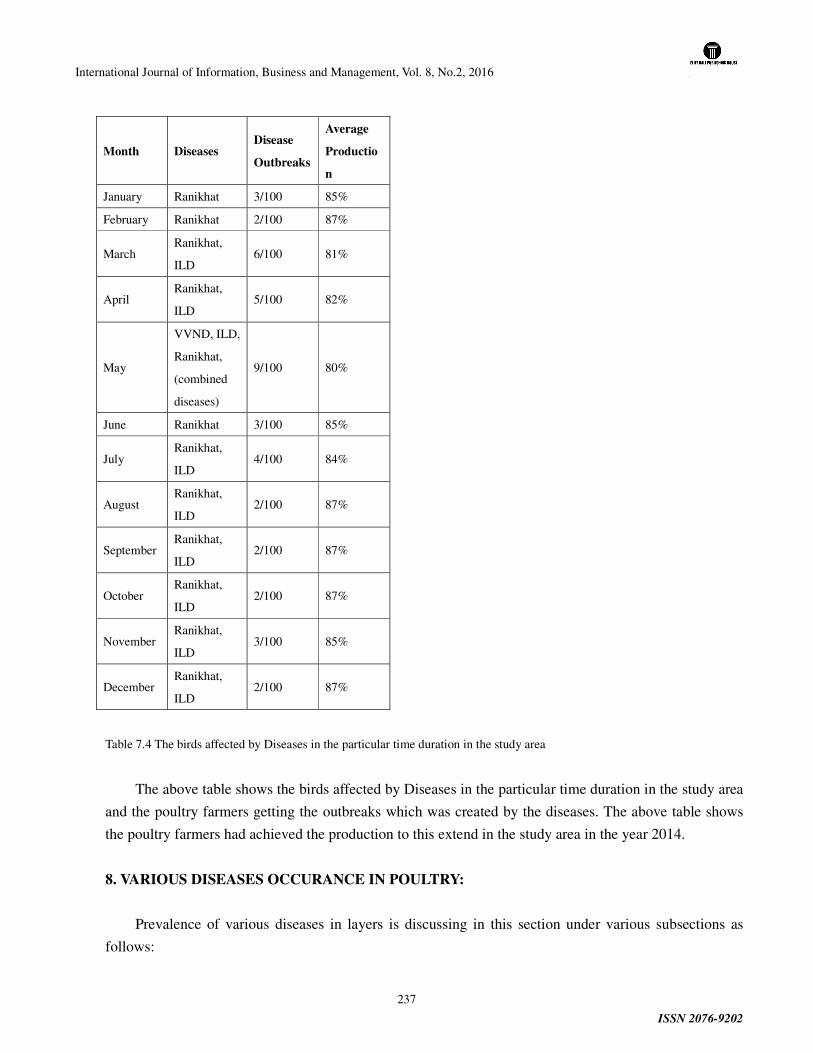
International Journal of Information, Business and Management, Vol. 8, No.2, 2016
ISSN 2076-9202
237
Month Diseases Disease
Outbreaks
Average
Productio
n
January Ranikhat 3/100 85%
February Ranikhat 2/100 87%
March Ranikhat,
ILD 6/100 81%
April Ranikhat,
ILD 5/100 82%
May
VVND, ILD,
Ranikhat,
(combined
diseases)
9/100 80%
June Ranikhat 3/100 85%
July Ranikhat,
ILD 4/100 84%
August Ranikhat,
ILD 2/100 87%
September Ranikhat,
ILD 2/100 87%
October Ranikhat,
ILD 2/100 87%
November Ranikhat,
ILD 3/100 85%
December Ranikhat,
ILD 2/100 87%
Table 7.4 The birds affected by Diseases in the particular time duration in the study area
The above table shows the birds affected by Diseases in the particular time duration in the study area
and the poultry farmers getting the outbreaks which was created by the diseases. The above table shows
the poultry farmers had achieved the production to this extend in the study area in the year 2014.
8. VARIOUS DISEASES OCCURANCE IN POULTRY:
Prevalence of various diseases in layers is discussing in this section under various subsections as
follows:

International Journal of Information, Business and Management, Vol. 8, No.2, 2016
ISSN 2076-9202
238
MAREKS DISEASE:
Mareks is one of the important diseases of chicken characterized by leg paralysis and lymphocyte
infilteration of brachial and sciatic nerves, potentially causing 4.2-20.8% mortality in layers.
INFECTIOUS BURSAL DISEAS (IBD):
Infectious Bursal Disease (IBD) also known as Gumboro had been reported to cause heavier losses in
chickens (75 - 85%). The disease is characterized by lameness, severe morbidity and mortality in chicken. It
is considered as AIDS of the chicken, because it adversely affects the chicken's immune system.
NEWCASTLE DISEASE (ND)
Newcastle disease is one of the destructive diseases of chickens characterized by severe mortality,
greenish diarrhea and thirst. The birds tend to drink more water and decrease their consumption of feed.
Newcastle disease caused 60% losses in egg type layers (Savic, 1999); however, lower losses of 12.58%
had also been reported by Srithar et al. (1997). On any standard these losses were high because the increase
in mortality beyond 8-10% was not admissible in egg type layers. Aside from higher mortality, Newcastle
disease caused a 15% drop in eggs of infected flocks and simultaneously resulted in 5% soft shell eggs.
INFECTIOUS CORYZA
Infectious coryza is also an important bacterial disease of chickens characterized by respiratory
complications, swollen head syndrome, nasal discharge and severe drop in egg production. The most
common cause is Haemophilus gallinarum. Conditions of poor hygiene, chilly environment and adverse
climate exposure could work as predisposing factors for the onset of this disease. Chickens of all type and
age were found susceptible to this infection and the disease caused 2-5% mortality and 35% drop
in egg production.
INFECTIOUS BRONCHITIS (IB)
Highly infectious viral disease characterized by respiratory symptoms, increased mortality and
decreased egg production. The disease could occur at any stage of the chicken's life and during any season
of the year. However, it was found to be more prevalent (35.7%) in 7 days to 5 weeks of age with special
reference to its higher incidence (66.6%) in the winter season.
AVIAN INFLUENZA
International Journal of Information, Business and Management, Vol. 8, No.2, 2016
ISSN 2076-9202
239
Avian influenza is an important poultry disease that had emerged with higher mortality in the recent
decades. This disease caused 90% morbidity and 80% mortality in 30 week aged chickens. Pathogenisity of
avian influenza was more in egg laying birds than in broilers.
MYCOPLASMOSIS
Mycoplasmosis is a series of bacterial infections caused by bacterium mycoplasm of various types in
egg type layers. Mycoplasmosis results in severe economic losses in egg type layers in terms of reduced egg
production and higher mortality.
SALMONELLOSIS
Salmonellae, one of the bacterial species, are abundantly found in most of the areas where chances of
contamination are greater; primarily poultry sheds and feed reservoirs. Salmonella had also been isolated
from litter (42%), drinking water (36%), feed (28%) and water tanks (17%) in poultry premises.
COCCIDIOSIS
Coccidiosis a protozoan disease, is one of the major problems of the chicken industry, characterized by
blood tinged feces, ruffled feathers, loss of appetite, poor growth and reduced egg production. Coocidiosis
had been reported to result in higher mortality (51.38%) and economic losses ($35 to $200 million/year in
USA; Hofstad et al., 1978).
YOLK SAC INFECTION
It is one of the most common bacterial infections of chicken observed during the first few weeks of a
chicken's life. Drowsiness, minimal mobility, vent pasting and the lack of interest of feeding in the chicken
characterize yolk sac infection. There may be several predisposing factors such as poor hygiene and
stressful conditions leading to this anomaly because, it is a general bacterial infection.
ESCHERICHIA COLI (E. COLI)
E. coli is one of the major problems in chicken production influencing heavier losses and severe drop
in egg production. About 5.5% mortality and 10-20% drop in eggs was observed with E. coli infections in
egg type layers reared in cages (Qu et al., 1997). Zanella et al. (2000) also reported 5-10% mortality due to
E. coli infections with no pronounced signs, suggesting that the infection may be there but couldn't be easily
detected until regular tests are performed for its proper diagnosis.
International Journal of Information, Business and Management, Vol. 8, No.2, 2016
ISSN 2076-9202
240
EGG PROLAPES AND CANNIBALISM
Egg prolapes has become one of the major issues in egg type layers during the past few years. Egg
prolapes could cause higher mortality and in turn, would result in huge economic losses (Tablante et al.,
1994). The authors reported 9.4% egg prolapse cases in egg type layers. Abrahamsson and Tauson (1998)
reported cannibalism as the picking habit of chicken, causing 4-20% mortality.
AFLATOXICOSIS
Presently, aflatoxicosis is one of the major issues in chicken production. The common cause of
aflatoxicosis is contaminated feed, resulting in higher mortality and severe drop in egg production.
Prathapkumar et al. (1997) reported 10% mortality and 20% drop in egg production due to aflatoxin B1 in
the diet. Drop in egg production was as higher as 26-55% with increased level of aflatoxin B1
(Mukopadhyay et al., 2000). To avoid such losses it is important to regularly monitor feed quality. In case of
aflatoxicosis, change of feed will be a better option. Choudary (1986) also reported reduction in mortality
and gradual increase in egg production when feed suspected for aflatoxicosis was changed.
INTERSTITIAL LUNG DISEASE
Interstitial lung disease is a general category that includes many different lung conditions. All
interstitial lung diseases affect the interstitium, a part of the lungs' anatomic structure. The interstitium is a
lace-like network of tissue that extends throughout both lungs. The interstitium provides support to the
lungs' microscopic air sacs (alveoli). Tiny blood vessels travel through the interstitium, allowing gas
exchange between blood and the air in the lungs. Normally, the interstitium is so thin it can't be seen on
chest X-rays or CT scans.
Types of Interstitial Lung Disease
All forms of interstitial lung disease cause thickening of the interstitium. The thickening can be due to
inflammation, scarring, or extra fluid (edema). Some forms of interstitial lung disease are short-lived;
others are chronic and irreversible.
Some of the types of interstitial lung disease include:
Interstitial pneumonia: Bacteria, viruses, or fungi may infect the interstitium of the lung. A
bacterium called Mycoplasma pneumonia is the most common cause.
Idiopathic pulmonary fibrosis: A chronic, progressive form of fibrosis (scarring) of the interstitium.
Its cause is unknown.

International Journal of Information, Business and Management, Vol. 8, No.2, 2016
ISSN 2076-9202
241
Nonspecific interstitial pneumonitis: Interstitial lung disease that's often present with autoimmune
conditions (such as rheumatoid arthritis or scleroderma).
Hypersensitivity pneumonitis: Interstitial lung disease caused by ongoing inhalation of dust, mold,
or other irritants.
Cryptogenic organizing pneumonia (COP): A pneumonia-like interstitial lung disease but without
an infection present. COP is also called bronchiolitis obliterans with organizing pneumonia (BOOP).
Acute interstitial pneumonitis: A sudden, severe interstitial lung disease, often requiring life
support.
Desquamative interstitial pneumonitis: An interstitial lung disease that's partially caused by
smoking.
Sarcoidosis: A condition causing interstitial lung disease along with swollen lymph nodes, and
sometimes heart, skin, nerve, or eye involvement.
Asbestosis: Interstitial lung disease caused by asbestos exposure.
Causes of Interstitial Lung Disease
Bacteria, viruses, and fungi are known to cause interstitial pneumonias. Regular exposures to inhaled
irritants at work or during hobbies can also cause some interstitial lung disease.
RANIKHET DISEASE
Ranikhet disease, also known in the West as Newcastle disease is a contagious and highly fatal daises
of flows. In spite of the notable work done towards its control, this disease still ranks as one of the most
serious virus diseases of poultry. The disease occurs in almost all countries and usually assumes a server
form affecting birds of all ages. Mortality in flows varies from 50 to 100 per cent.
Ranikhet disease is largely a disease of flows, but it also effects turkeys, pigenosn, grows, ducks, geese,
koel pheasants, guinea-flows, partridges and doves. hedgehogs have been suspected as reservoirs of the
disease. The disease is also suspected to cause conjunctivitis among laboratory workers and persons
handling infected birds.
NECROTIC ENTERITIS (NE)
Necrotic enteritis (NE) is an acute Clostridium infection characterized by severe necroses of
intestinal mucosa. The disease begins suddenly, with a sharp increase in death rate. A strong dehydration
is observed. The skin is sticked on or adhered to body musculature and is hardly removed.
9. TREATMENT AND PREVENTION
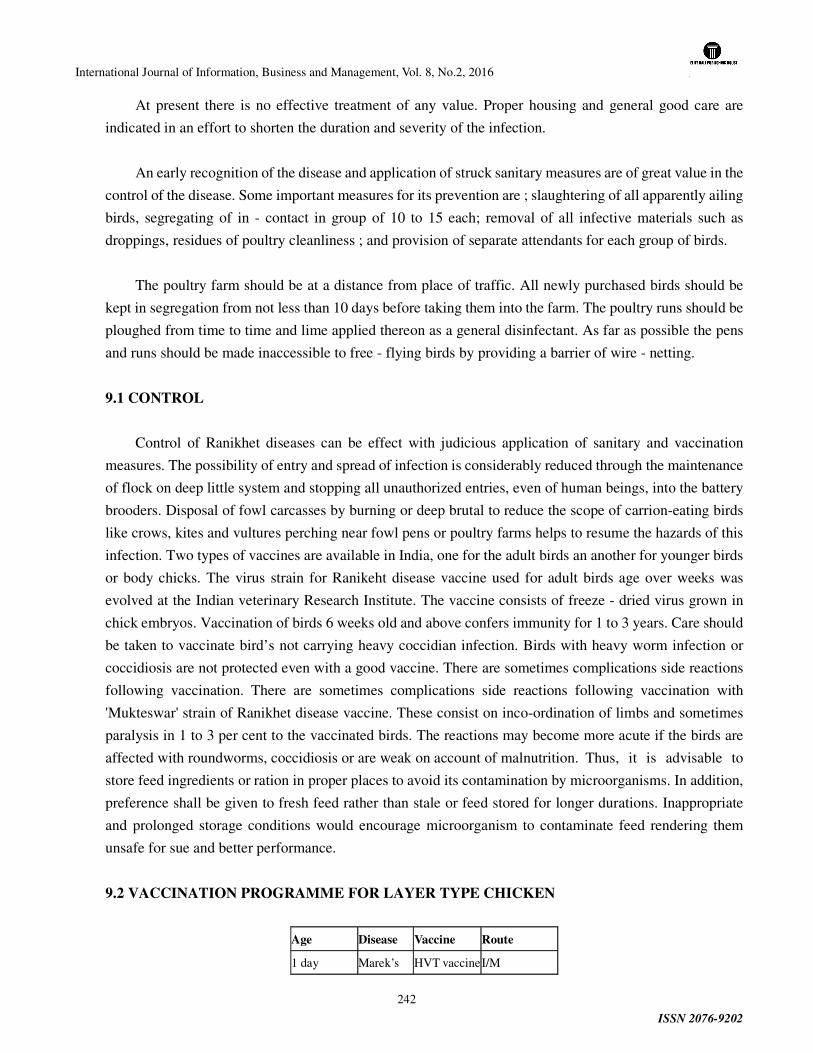
International Journal of Information, Business and Management, Vol. 8, No.2, 2016
ISSN 2076-9202
242
At present there is no effective treatment of any value. Proper housing and general good care are
indicated in an effort to shorten the duration and severity of the infection.
An early recognition of the disease and application of struck sanitary measures are of great value in the
control of the disease. Some important measures for its prevention are ; slaughtering of all apparently ailing
birds, segregating of in - contact in group of 10 to 15 each; removal of all infective materials such as
droppings, residues of poultry cleanliness ; and provision of separate attendants for each group of birds.
The poultry farm should be at a distance from place of traffic. All newly purchased birds should be
kept in segregation from not less than 10 days before taking them into the farm. The poultry runs should be
ploughed from time to time and lime applied thereon as a general disinfectant. As far as possible the pens
and runs should be made inaccessible to free - flying birds by providing a barrier of wire - netting.
9.1 CONTROL
Control of Ranikhet diseases can be effect with judicious application of sanitary and vaccination
measures. The possibility of entry and spread of infection is considerably reduced through the maintenance
of flock on deep little system and stopping all unauthorized entries, even of human beings, into the battery
brooders. Disposal of fowl carcasses by burning or deep brutal to reduce the scope of carrion-eating birds
like crows, kites and vultures perching near fowl pens or poultry farms helps to resume the hazards of this
infection. Two types of vaccines are available in India, one for the adult birds an another for younger birds
or body chicks. The virus strain for Ranikeht disease vaccine used for adult birds age over weeks was
evolved at the Indian veterinary Research Institute. The vaccine consists of freeze - dried virus grown in
chick embryos. Vaccination of birds 6 weeks old and above confers immunity for 1 to 3 years. Care should
be taken to vaccinate bird’s not carrying heavy coccidian infection. Birds with heavy worm infection or
coccidiosis are not protected even with a good vaccine. There are sometimes complications side reactions
following vaccination. There are sometimes complications side reactions following vaccination with
'Mukteswar' strain of Ranikhet disease vaccine. These consist on inco-ordination of limbs and sometimes
paralysis in 1 to 3 per cent to the vaccinated birds. The reactions may become more acute if the birds are
affected with roundworms, coccidiosis or are weak on account of malnutrition. Thus, it is advisable to
store feed ingredients or ration in proper places to avoid its contamination by microorganisms. In addition,
preference shall be given to fresh feed rather than stale or feed stored for longer durations. Inappropriate
and prolonged storage conditions would encourage microorganism to contaminate feed rendering them
unsafe for sue and better performance.
9.2 VACCINATION PROGRAMME FOR LAYER TYPE CHICKEN
Age Disease Vaccine Route
1 day Marek’s HVT vaccineI/M
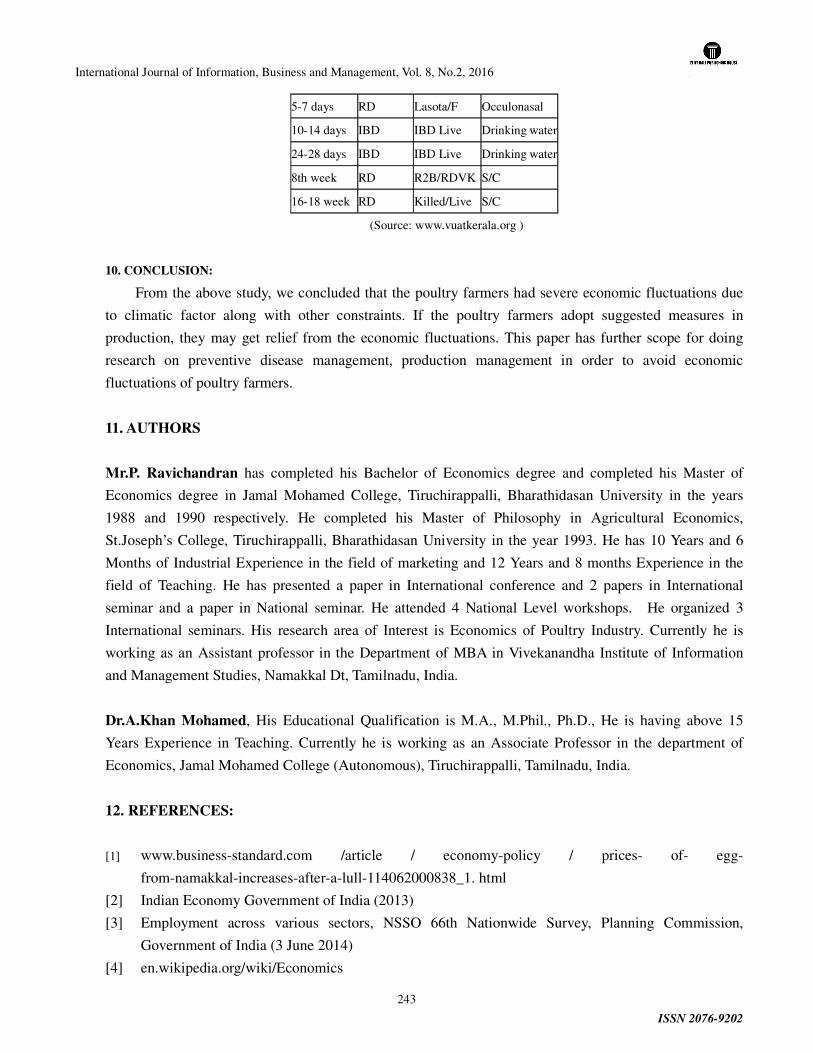
International Journal of Information, Business and Management, Vol. 8, No.2, 2016
ISSN 2076-9202
243
5-7 days RD Lasota/F Occulonasal
10-14 days IBD IBD Live Drinking water
24-28 days IBD IBD Live Drinking water
8th week RD R2B/RDVK S/C
16-18 week RD Killed/Live S/C
(Source: www.vuatkerala.org )
10. CONCLUSION:
From the above study, we concluded that the poultry farmers had severe economic fluctuations due
to climatic factor along with other constraints. If the poultry farmers adopt suggested measures in
production, they may get relief from the economic fluctuations. This paper has further scope for doing
research on preventive disease management, production management in order to avoid economic
fluctuations of poultry farmers.
11. AUTHORS
Mr.P. Ravichandran has completed his Bachelor of Economics degree and completed his Master of
Economics degree in Jamal Mohamed College, Tiruchirappalli, Bharathidasan University in the years
1988 and 1990 respectively. He completed his Master of Philosophy in Agricultural Economics,
St.Joseph’s College, Tiruchirappalli, Bharathidasan University in the year 1993. He has 10 Years and 6
Months of Industrial Experience in the field of marketing and 12 Years and 8 months Experience in the
field of Teaching. He has presented a paper in International conference and 2 papers in International
seminar and a paper in National seminar. He attended 4 National Level workshops. He organized 3
International seminars. His research area of Interest is Economics of Poultry Industry. Currently he is
working as an Assistant professor in the Department of MBA in Vivekanandha Institute of Information
and Management Studies, Namakkal Dt, Tamilnadu, India.
Dr.A.Khan Mohamed, His Educational Qualification is M.A., M.Phil., Ph.D., He is having above 15
Years Experience in Teaching. Currently he is working as an Associate Professor in the department of
Economics, Jamal Mohamed College (Autonomous), Tiruchirappalli, Tamilnadu, India.
12. REFERENCES:
[1] www.business-standard.com /article / economy-policy / prices- of- egg-
from-namakkal-increases-after-a-lull-114062000838_1. html
[2] Indian Economy Government of India (2013)
[3] Employment across various sectors, NSSO 66th Nationwide Survey, Planning Commission,
Government of India (3 June 2014)
[4] en.wikipedia.org/wiki/Economics

International Journal of Information, Business and Management, Vol. 8, No.2, 2016
ISSN 2076-9202
244
[5] "India". International Monetary Fund. Retrieved 2014-04-08.
[6] Agriculture's share in GDP declines to 13.7% in 2012-13 The Economic Times.
[7] World Trade Organization, World Trade Report 2013, Geneva, ISBN 978-92-870-3859-3
[8] Modest trade growth anticipated for 2014 and 2015 following two year slump World Trade
Organization (14 April 2014)
[9] RBI governor Raghuram Rajan meets Narendra Modi LiveMint (1 June 2014)
[10] "Mid-Year Economic Analysis 2014-2015, The Indian Finance Ministry". 2014-12-19. Retrieved 19
December 2014.
[11] "IMF projects India's GDP to pick up in 2015 to 6.4 per cent". The Economic Times. 8 October 2014.
Retrieved 23 October 2014.
[12] "Economic survey of India 2007: Policy Brief" (PDF). OECD. Retrieved 2009-06-21.
[13] ref name="potential">"India's Rising Growth Potential" (PDF). Goldman Sachs. 2007. Retrieved
2009-06-21.
[14] Economic Survey 2010, pp. 1–2.
[15] Inflation, consumer prices (annual %) The World Bank (2014)
[16]
www.gktoday.in/indian-economy-meat-poultry-industry-of-india-national-meat-and-poultry-pro
cessing-board/
[17] J.P. Jacob, H.R. Wilson, R.D. Miles, G. D. Butcher, and F.B. Mather", "Factors Affecting Egg
Production in Backyard Chicken Flocks", edis.ifas.ufl.edu/pdffiles/PS/PS02900.pdf, PS35.
International Journal of Information, Business and Management, Vol. 8, No.2, 2016
ISSN 2076-9202
245
REPUTATION RISK MANAGEMENT IN THE INTERNATIONAL OIL
COMPANIES
Evangelia FRAGOULI Assistant Professor Aarhus University, DK & Management Lecturer MBA, MSc University of Dundee, UK. Address: 4 Lytton str. , G/R, Dundee, DD2 1EU UK email:[email protected] Joseph EKRUKA (MSc) Address: Dundee, UK email:[email protected]
ABSTRACT
The oil and gas companies face a number of risks but the most critical one is the risk of corporate
reputation. Corporate reputation can be a key contributor to an organization’s success but can also lead to
an organization’s failure. Evidence has linked corporate reputation and reputation risk management (RRM)
with many intangible and tangible assets, with scandals from media activists and public opinions. This
study introduces and explains the reasons why International Oil Companies’ (IOCs) Reputation Risk
Management (RRM) has led to the oil’s sector reputation damage. It also presents a critical review of
policy issues and approaches for managing reputation risk in the petroleum industry. The conclusion of
the study is that RRM and corporate reputation influence IOCs’ communication with the public,
contributes to enhancement of international law when associated with transparency, but, sometimes make
IOCs vulnerable to external threats. The study proposes that corporate social responsibility (CSR) can
enhance corporate reputation risk management approaches, but, is not enough unless development of the
appropriate culture through implementation of effective risk management policies takes place.
Keywords: Corporate reputation, Reputation Risk Management (RRM), International Oil Companies
(IOC), Corporate Social Responsibility (CSR).
REPUTATION RISK MANAGEMENT IN THE INTERNATIONAL OIL COMPANIES
1. INTRODUCTION
The petroleum industry is one of the largest, most complex and important global industries in the world as
it touches every part of the human life with products such as gasoline, gasoil, asphalt, lubricants and
International Journal of Information, Business and Management, Vol. 8, No.2, 2016
ISSN 2076-9202
246
numerous of petrochemicals. Unlike the financial institutions and other service organisations, the
activities involved in producing these products are difficult, expensive and risky. These factors expose the
petroleum industry to a large pool of risks including natural, engineering, management and economic. All
these risks either individually or collectively affect the performance and reputation of the petroleum
industry in case of an occurrence (Yanting and Xing, 2011; Inkpen and Moffett, 2011).The importance of
risk analysis in the petroleum industry over the past years has received much attention. Yanting, and Xing,
(2011) investigated risk management of petroleum operations and found that, the top priority for
petroleum enterprises is the establishment of risk management system and control mechanisms in
accordance with features of petroleum operations to meet the needs of modern management. Andersen
and Mostue, (2012) also studied the risk analysis and risk management approaches applied to the
petroleum industry and their applicability to Integrated Operations (IO) concepts. Using the Norwegian
oil and gas industry as the basis, they theorized that, traditional risk analysis and management approaches
in the oil and gas industry are challenged and thus require a more modern and concerted approaches to
analysing and managing risk. The role of reputation in the petroleum industry cannot be over emphasized.
In past decades, risk controls were directed toward capital losses arising from credit risk, trading and
market operations. But today, due to the complex nature of the business environment, the profound risk
which must be identified, mitigated, controlled and monitored is reputation risk (Holmes, 2004 p.g 14;
Abelman et al 2006). The reputation of any company in the world of business is both its most important
asset as well as the asset that is most difficult to recover once it is lost. A good reputation strengthens a
company’s market position and increases shareholder value; hence generate great reward for the company
(Brown, 2007; Scandizzo, 2011). Reputation risk management in the petroleum industry requires a
well-coordinated framework and a more comprehensive approach as compared to financial institutions
(Andersen and Mostue, 2012). This is because management decisions regarding policy issues and other
stakeholder’s expectations are directly linked to the performance of the industry (Kavaq Business
Intelligence, 2005). This situation makes the management of reputation risk more challenging and
unrestricted to only compliance with rules and control. Therefore it depends on strong ethical culture with
the application of sound judgement within a risk-conscious and structured environment (Verhezen, 2006).
2. MANAGEMENT OF REPUTATION RISK IN THE PETROLEUM INDUSTRY
The nature of operations in the petroleum industry is more integrated making it very difficult for
traditional risk analysis and management approaches to address the challenges affecting the image of
companies within the industry. Since its inception, the petroleum industry has faced various policy
issues regarding mergers and acquisitions, corporate responsibility, corporate governance and leadership,
regulatory compliance, workplace talent and culture, communication and other human and environmental
related issues as its activities in one way or the other affect the socio-economic, political and the natural
environment. Consequences emanating from these activities adversely affect the operations and image of
the company and its partners, lives and property of employees as well as the natural environment (Inkpen
and Moffett, 2011; Yergin D., 1991; Andersen and Mostue, 2012).
International Journal of Information, Business and Management, Vol. 8, No.2, 2016
ISSN 2076-9202
247
The management of reputation risk has always been a serious challenge to managers and decision makers.
Whenever challenged with such a situation in financial institutions and other service companies, most of
them take false comfort from the fact that they have a public relations department. This is because
reputation risk management in such organisations is perceived to be synonymous to media management
(Davies, 2002).
As theorized by Scandizzo, (2011), these organisations assume that customers and members of the
general public form their perceptions based on information from the media, regulators and auditors since
they have limited knowledge concerning the inner workings of the organisation. Hence spend substantial
amount of time on the media and financial reports neglecting their own behaviour and responsibility to
their customers and the society at large. Reputation risk management looks
different in the petroleum industry due to the integrated nature of operations in the industry (Inkpen, and
Mofett, 2011; p.g 20; Andersen, and Mostue 2012; Zheng 2010). According to the Integrated
Operations Centre (IOC), cited by Andersen, and Mostue, (2012), the integrated operations involve “the
integration of people, work processes and technology to make smarter decisions and better execution. It
is enabled by the use of ubiquitous real-time data, collaborative techniques and multiple expertises’
across disciples, organisations and geographical locations”. The integrated operations provide the
opportunity for the industry to achieve better safety working conditions, extended operational life,
reduced cost, higher production and recovery rates upon which reputation is built.
Reputation risk management is directly tied to these achievements as they are the benefits emanating from
the policy issues such as corporate responsibility, corporate governance and leadership, regulatory
compliance, workplace talent, safety and culture, and communication considered by management.
However, managers face various challenges in the executions of these policy issues. The costs involve in
meeting corporate responsibility, ensuring workplace talent and safety and delivering effective
communication are always high and as such hinder the fulfilment of these responsibilities. The petroleum
industry is also subjected to special regulations and supervision by state agencies and
environmentally-concerned organisations. Proposed regulations in most cases are counterproductive and
hence, lead management into the adoption of unethical behaviours which increases the risk portfolio of
the company. All these impact on the operations and have long-run effect on the reputation of the
petroleum industry. Even though their operations are integrated, few of them have risk reduction
methodologies in place across all areas of potential risk. Thus, reputation risk remains at stake. It is
important to note that even organisations with good reputation such as Exxon Mobil and BP had suffered
serious and to some extent irreparable damage from their operations (Ernst and Young, 2010; Aven, and
Renn 2012; Abelman et al, 2006). For instance, the Gulf of Mexico oil spill which occurred in 2010 has
landed the reputation of BP into disrepute. This incident left the life of cherished marine animals such as
the sea turtles and dolphin in danger. BP is still standing trial in the US court, which could lead the
company to huge fine despite its agreement in 2012 to pay £2.9 billion as criminal charges (New England
Aquarium, 2013). Such a case and the likes within the petroleum industry make reputation risk
management more important. Therefore, when taking policy decisions regarding regulatory compliance,
financial performance, employee working conditions and environmental considerations, managers
International Journal of Information, Business and Management, Vol. 8, No.2, 2016
ISSN 2076-9202
248
together with the board of directors consider the impact they will have on the reputation of the company
and as such develop a more comprehensive and coordinated approach towards managing them (Aven, and
Renn, 2012; Davies, 2002; Rayner, 2010).
Effective reputation risk management in the petroleum industry depends upon identifying and controlling
all the risk at each point of operations (Lam, 2003; Yanting and Xing, 2011; Aven and Renn, 2012).
Reputation is best managed through strong corporate governance and leadership, ensuring regulatory
compliance, meeting stakeholder’s expectations and fulfilling corporate responsibilities. Also,
preserving a strong reputation revolves around effective communication and establishment of strong and
solid relationships between the organisation and stakeholders.
3. CORPORATE REPUTATION AND INTERNATIONAL OIL COMPANIES (IOCs)
The public and non-governmental organizations blame the International Oil Companies (IOCs) and
governments for environmental challenges, poverty and corruption. This rapidly rising social and
environmental pressure for the oil companies indicate that solutions have to be provided addressing
technological as well as social needs. The social issue is focused on corporate reputation and the
management of the components of reputation risk. The anticipation and management of the risk
components such as the stakeholder and media can help mitigate the degradation of natural resources and
deterioration of the environment (Jenny, 2003). Corporate reputation and RRM occur within and outside
an organization (Zhang, 2009; Ladipo and Rahim, 2013). Their influence on the IOCs may be of a
positive or negative impact due to the hidden risk element an oil company faces (Nathalie and Serban,
2012). Risk management often is linked with a company’s financial performance, workers performance
and public preference (Martin, 2009). However, corporate reputation risk might be more important. In
order corporate reputation and RRM to benefit the oil sector, issues such as corporate social
responsibilities, stakeholder management and regulatory compliance should be involved, otherwise,
managing wrongly, this may lead to a crisis which can damage an organization’s image, leading to
disconnection of consumers (Hale et al., 2005) and resulting to business relation disruption (O’Rourke,
2001). A negative corporate reputation yields negative cognitive association which in turn creates a
problematic image for an organization. For instance, the Brent Spar crisis led to a serious talk about Shell
that clearly harmed the company’s image (Heugens and Zyglidopoulos, 2007). Research (Dowling, 2004;
Nathalie and Serban, 2012) has linked corporate reputation and RRM with various intangible assets,
tangible assets, scandals from media and activists over-dramatization and public opinion.
4. CORPORATE REPUTATION AND REPUTATION RISK MANAGEMENT (RRM) ON
INTERNATIONAL OIL COMPANIES (IOCs)
Corporate reputation, due to its complexity, has made researchers unable to describe the total concept. A
summarized definition that captures the measurement and value of the concept is “a collective
examination of a company’s pleasant appearance to a precise group of stakeholders relative to a
reference group of companies with which the company competes for resources” (Michael and Timothy,
2012, p.7). The term evolves into a strategic and intangible corporate asset and reflects corporate
International Journal of Information, Business and Management, Vol. 8, No.2, 2016
ISSN 2076-9202
249
reputation as a firm’s strategic behaviour to make plans and establish functions for growth, survival and
profitability (Ladipo and Rahim, 2013). A good corporate reputation is inevitably linked with an effective
RRM approach. According to Marconi (2002), RRM is the assembly of processes designed to protect and
promote a company’s reputation. RRM helps to shape an effective corporate image (Marconi, 2002). In
cases where IOCs are faced with a problematic corporate image, a risk of corporate crisis may occur.
Based on this perspective, frameworks to escape harmful consequences of crisis have been built around
appropriate reputation context, hence known as Reputation Risk Management (RRM) (Koronis and Ponis,
2012). These two components may influence the IOCs in a number of ways as illustrated in the next
section. RRM is a support for corporate governance, competent management, organization profitability
and media management in the oil industry. It accounts for management of intangible assets such as
corporate reputation, employees’ reputation, culture, strategic decision making and license to operate. A
good RRM is considered as an alternative for poor information about product and practice. This statement
is the reason why most practitioners in the oil sector may suffer the negative influence of RRM. However,
the positive effect outweighs the negative influence (Marion, 2004).
4.1 Reputation Risk Management in International Oil Companies (IOCs)
The importance of corporate reputation and RRM for IOCs is to effectively manage customers,
investors, employees, suppliers and other rational and emotional elements of the oil sector. This point is
underscored by the CEOs of an oil company who said that; ‘Companies that act with principles of good
corporate citizenship may reap a reputational dividend in markets where consumers are increasingly
socially aware among a growing number of investors and in the employment market’ (Mitchell, 2000, p
1). IOCs’ reports and websites have also revealed that reputation is a major issue and must be managed
effectively (Shell, 2013; Suncor 2013). An effective management with strong corporate reputation in the
oil sector can influence an outperformance of an IOC’s competitor/s by over 100 percent (Metrica, 2011).
This has led to the foundation by which IOCs have focused on managing environmental and social
responsibilities to improve their RRM approach. The outperformance advantage arises when RRM is
combined with crisis management stakeholder and media management as its major components (Jenny,
2003; Jean and Jenny, 2009). Media and stakeholder management are crucial assets for oil companies.
They have become more important in this era of global business due to transparency and communication
via the internet. This is because non-governmental organizations, environmental activists and the public
have become well informed and connected to social-medias. This has caused a detrimental effect on oil
companies who do not effectively manage their corporate reputation. An example illustrated by Jenny
(2003, p37) in her book shows that campaigners have labelled ExxonMobil as an environmental enemy in
the US-based Campaign ExxonMobil. The company stands in total contrast with its competitors BP and
Shell who were advantageous due to their effective management of stakeholders by backing the Kyoto
Protocol by investing in renewables (Jenny, 2003).
Corporate reputation and RRM is a competitive advantage for the IOCs as it serves as a ‘reservoir of good
will’ often called reputational equity or reputational capital in events of crisis (Mahon, 2002; Varadarajan
et al., 2006). However, RRM can only become effective when corporate reputation is associated with trust,
transparency, credibility and communication (Gillies, 2010). The reputation of a company depends on
International Journal of Information, Business and Management, Vol. 8, No.2, 2016
ISSN 2076-9202
250
58% of public’s perception about a firm and only 42% depends on perception of the firm’s products and
services (Reputation Institute, 2011). Therefore, an incident like Shell’s plan to dump the Brent Spar in
the bottom of the sea (in 1995) will still hold a negative image for the companies especially in the case of
environmental disasters news (Meijer and Kleinnijenhuis, 2006). The IOCs have understood and
acknowledged RRM and corporate reputation as a competitive advantage and this has influenced them to
manage three major components: stakeholders, corporate social responsibilities and international
regulations. However, mismanagement of these components may limit their functioning.
4.2 International Oil Companies (IOCs) and Stakeholders
IOCs have strengthened their relationship with stakeholders through engagement with external
stakeholders and also with government bodies as they know that stakeholders influence their reputation
status. Stakeholders’ engagement is a prerequisite for IOCs as the level of systematic and transparent
approach of dealing with stakeholders has been improved nowadays. Shell indicates this fact by using its
Annual Sustainability Report and its websites (Shell, 2013). ExxonMobil uses a similar approach to show
dedication to stakeholders using corporate citizenship reports to strengthen its corporate governance
(Exxon, 2008). The oil companies also try to win a good reputation in the eyes of academics through
scholarships and grants. For example, Shell Oil shows commitment to environment, education, and the
community through its participation in the 2013 Texas regional competitions (Tamutimes, 2013). Bad
reputation is contagious thus too much involvement with corrupted stakeholders or governments may
damage the reputation of oil companies.
4.3 Corporate Social Responsibility (CSR)
Since the public blames the oil companies for most political vices, they expect the sector more than any
other sector to do more than just to comply with laws (Gillies 2010; Spence, 2011). Hence, the public
demands CSRs which includes transparency, charities, environmental protection where the companies’
business contribute to human and habitant security (Spence 2011). The limit to CSR is illustrated by
Henry Ford, “you can’t build a reputation on what you are going to do”. Getting CSR right is seen as a
good business practice which can promote competitive advantage, growth and high productivity however,
getting it wrong will damage the reputation of the perpetrator, and the whole sector (Jenny, 2003).
4.4 Regulatory Compliance
RRM influences IOCs to embrace international legal regulations (like the Extractive Industries
Transparency Initiative and Extractive Industries Review) and to ensure been regulatory compliant. The
Extractive Industries Transparency Initiative (EITI) promotes transparency as an international norm. It
supports governance in countries rich with resources by verifying and publishing IOCs payments and
government’s oil, gas and mining revenues (EITI, 2004). The World Bank promotes good governance
through the Extractive Industries Review (EIR) which is believed that protects against the resource curse
(World Bank 2004a).
The limitation to this particular approach is that the importance of the systems is overstated as a policy
International Journal of Information, Business and Management, Vol. 8, No.2, 2016
ISSN 2076-9202
251
tool by the IOCs. For instance, the EITI has failed to secure commitments in some countries like Trinidad
& Tobago, and, Angola. Pegg (2006) also argued that EIR has failed projects in extractive industries like
the Chad Cameroon pipeline project. Furthermore, the regulatory compliance point should not be
exaggerated to say that environmental damage, human rights violations, and oil-driven corruption has
been eliminated (Pegg, 2006). The limitations of the positive influences make room for the negative
impact of RRM on corporate reputation for IOCs.
4.5 Application of Reputation Risk Management (RRM) : the other side of the coin
The previous section highlighted some of the benefits of corporate reputation and RRM which is mainly
due to transparency and communication factors. These factors have strengthened external stakeholder’s
abilities to spot and expose inaccurate doings of IOCs. The greatest of the risks to reputation to the IOCs
is the environmental and biodiversity risk and this is because it occurs in public, where almost every
handy gadget (phones and iPods) is a camera. The internet has also made it very easy for the media and
the public to access information through YouTube and other websites. The negative influence arises as a
result of how the IOCs use their RRM and corporate reputation.
IOCs use their RRM for diverse motives either positive or negative. Their motives illuminate agendas
derived from diverse elements, ranging from public cost issues (Spence, 2011), internal political state of
affairs to different international ambitions (Gillies, 2010). In the case of Elf (now Total), a political
motive and a pillar of corruption was seen in its association with several African governments in 1994
(Shaxson, 2007). Some IOCs use reputation to be compliant with international law (Guzman, 2002).
Because it can create status and behaviours used to access parts and services of the society and increase
bargaining power for investment in norm valued communities (Risse et al., 1999). Gillies (2010) also
explained that IOCs when are insecure about their reputation status they tend to embrace international
norms. He also indicated that new norms and transparency improves reputation and are powerful
mechanisms of power production (Gillies, 2010). This can form a background on which most
international oil companies (IOCs) can use reputation as a shield when faced with self-perpetrated crisis
as happened in the Niger Delta Shell case; Shell settled the defendant families involved with $15.5
million before court trial in 2009 claiming that it was a reconciliatory process with Nigeria (Spence,
2011). This makes it clear that some IOCs may embrace public relation activities like CSR because they
believe that it is wrong to leave a bequest of social displacement through toxic contamination and poverty.
The point does not suggest that Shell used an effective RRM to cover their tracks, it merely suggests that
if Shell did, we just never know.
Events like that stated above may pique stakeholder’s ability to interpret an IOC’s attempt to manipulate
its reputation. IOCs lack of information on the influence of stakeholders’ perception on companies' act,
may lead to negative influence of RRM and corporate reputation (Mahon, 2002).
4.6 The influence of stakeholders’ perception on reputation risk management (RRM)
Corporate reputation’s is difficult to manage because it is based on stakeholders’ assessments, impressions,
and perceptions which fluctuate easily within a short period of time. Based on this fact, while operational
and financial damages of a firm can be contained, the public impression and perception cannot (Koronis
and Ponis, 2012). Hence, reputation must be managed as an asset class referred to as “social approval
International Journal of Information, Business and Management, Vol. 8, No.2, 2016
ISSN 2076-9202
252
asset” (Michael and Timothy, 2012).
While a good corporate reputation and RRM has its positive side, it can also have a negative side on IOCs
such as Shell, ExxonMobil, BP. Bartley and Child (2007) demonstrate how positive management traits
that favour image, performance and openness can ironically make IOCs possible targets to activists since
they are easily vulnerable to ‘shaming’ (Bartley and Child, 2007, p.6). This is seen in Niger-Delta
Royal-Dutch Shell case in connection with the Nigerian activist Ken Saro-Wiwa who illustrated the idea
in his statement: ‘‘Shell is always there in the background even if it denies all participation. I believe, and
not without reason, that the company’s ready cash is always at play, goading officials to illegal, covert,
and overt actions’’ (as quoted from Okonta and Douglas 2003, p.128). This caused a negative impact on
Shell’s reputation as international non-governmental organizations and journalists forced Shell to undergo
a large-scale campaign in public as a response strategy (Spence 2011; Gillies, 2010). Based on the Shell
case, one can suggest that IOCs can anticipate that openness or transparency resulting from the corporate
approach towards RRM, may lead to vulnerabilities, such as to bad press; to activists’ reactions, and to
attraction of legal investigations.
5. THE ROLE OF CORPORATE SOCIAL RESPONSIBILITY (CSR)
A question that is raised is the following: does corporate social responsibility (CSR) benefit the
influence of corporate reputation and reputation risk management (RRM) on IOCs? Some scholars
(Zhang 2009; Alniacik et al., 2011) have argued that CSR is the major and effective corporate RRM
approach in oil or other industries especially for stakeholder management. However, according to
Nathalie and Serban (2012), CSR can help but it is not essential, and, sometimes may worsen crisis
scenarios. Their survey illustrates that CSR is not a key determinant of RRM. They also add that some
respondents in their research claimed there was no direct connection between CSR and corporate
reputation (Nathalie and Serban, 2012). The case of BP’s oil spill in the Gulf of Mexico mirrors the effect
above. Despite the investment of billions in CSR, the BP stock fell by 52% in 50 days due to the crisis
(Jenny, 2003). An ex BP chief executive also uses his silver words to earn social license to operate by
having a good reputation through CSR
‘Our global business nature also drives the need to be involved in the societies in which we operate. Not
out of altruism, but out of enlightened self-interest, due to our believe that if big companies are not seen
to be making constructive social investments their license to operate will in the end be limited. And if the
ability to operate is restricted, then your performance is limited’ (John Browne, former executive, BP).
This strategic reputation risk management approach is quite effective for companies when applied, but
depends on ‘when’ and ‘how’ is applied, especially in crisis situations. CSR in crisis is not as efficient as
that used before crisis; for example, in the Campaign ExxonMobil case, the management tried to contain
their reputation crisis by donating $100 million to a Stanford University project to mitigate global
warming but this was dismissed and regarded as a delaying tactic by Greenpeace (Rob cited from Jenny,
2003). Kaplan and Mikes (2011) explained that managing risk is not easy and can sometimes be
demanding. Organizations can pay now to measure, mitigate, manage and identify their risks, or, can pay
later (Nathalie and Serban, 2012). This is seen in BP and other institutions that failed in 2007 and 2008
and learned the high cost of paying later rather than now (Kaplan and Mike, 2011).
International Journal of Information, Business and Management, Vol. 8, No.2, 2016
ISSN 2076-9202
253
6. CONCLUSION
The petroleum industry is one of the critical sectors in the global economy. The nature of operations in the
industry is more integrated making it very difficult for traditional risk analysis and management
approaches to address the challenges affecting the image of companies within the industry. Most
organisations are much informed about their tangible assets and as such develop strategies towards
managing them. However, reputation as an intangible asset in most cases is usually given less attention as
it is difficult to identify and manage. There is enough evidence to support the argument that any company
whose reputation suffers a blow will see it translated into real and painful consequences (Rayner, 2011;
Scandizzo, 2011; Brown 2007; Davies 2002).
The study has clearly demonstrated that RRM and corperate reputation influence the IOCs in a number
ways such as to shape the external stakeholders’ perception in the way in which IOCs communicate with
the public. It also maintains that RRM enhances international law when associated with transparency and
other good practices however; the negative impact is that RRM may sometimes lead IOCs to be
vulnerable to external threats. The oil and gas industry is technically complicated and the influence of
corporate reputation and reputation management makes it socially and politically complex. Since IOCs
tend to operate globally, they may get involved in situations where they have to deal with corrupted
governments and other external factors in this process of operating in new environments, which may lead
to negative effects for them in the short or long run. RRM and corporate reputation may lead to the
success or failure of IOCs
6.1 Recommendations
Some recommendations to be attached to the IOCs management approaches to make them more effective
could be:
ⱱ Create a good Corporate Reputation to Earn Social License
This involves the words of the mouth; that is, “say what you mean and mean what you say”. A social
license should be acquired from local communities and indigenous people (World Bank, 2004b) and not
just by saying what makes you feel and look good in public. IOCs should reflect at past management
strategies and develop policies to meet all stakeholders. The management tools to be used here may
include Strengths, Weaknesses, Opportunities and Threats analysis (SWOT analysis) and Politics,
Economics, Social and Technological analysis (PEST analysis) (Nelson and Scoble, 2006). To summarize
this point, the best way to obtain a social license is for IOCs to endure a positive corporate reputation (see
Appendix 2).
ⱱ Have an Organizational Culture through effective Reputation Risk Management Operations of IOCs
should encourage honesty and openness throughout all areas of operations which must include value for
employees, trust, freedom to act and expression of viewpoints. The culture must align with innovation,
communication, criticism and a crisis management plan. The organization norm; integrity, responsibility
and ethical behaviour should be shaped from the top down management hierarchy. Culture is important to
shape reputation since it is an everyday process (Holmes, 2004).
In today’s growing business environment, “societal expectations of corporate behaviour” is a major
International Journal of Information, Business and Management, Vol. 8, No.2, 2016
ISSN 2076-9202
254
challenge to management in their quest to fulfil their Corporate Social Responsibility (CSR). This
“behaviour is alleged by a stakeholder to be expected by society or morally required and is therefore
justifiably demanded of a business” (Whetten et al. 2002, p. 374). CSR is concept that is
stakeholder-oriented and holds the view that, organizations exist within networks of stakeholders and face
the potentially conflicting demands of these stakeholders. This therefore requires organisations to
translate the demands of these stakeholders into their CSR objectives and policies (Lindgreen and Swaen,
2010). Also, it is these expectations that form the perceptions held by stakeholders regarding the activities
of the organisation. This shows that, any organisation that is able to meet these expectations is likely to be
in the good books of these stakeholders and hence build strong reputation for it. Based on this, the study
recommends that, organisations should consider adopting CRS policies especially the petroleum industry
as of part their reputation risk management approach.
REFERENCES
Books
Abelman, F. Schwab (2006). Interactive Risk Management System and Method with Reputation
Risk Management , Patent Application Publication, Peterson, New York, US.
Holmes, A. (2004). Smart Risk. Capstone Publishing Limited, England.
Jenny, R. (2003). Managing reputation risk, curbing threats, leveraging opportunities. John Wiley
and Sons Limited, England.
Inkpen, A. and Moffett, M.(2011). The Global Oil and Gas Industry, Management, Strategy and
Finance, PennWell Corporation 1421 South Sheridian Road Tulsa, Oklahoma 74112-6600 USA,
Pages 2-80
Lam, J. (2003). Enterprise Risk Management: From Incentives to Control, Willey &Sons,
Inc., 111 River Street, Hoboken, New Jersey, 07030, USA, pages, 43-55
Marconi, J. (2002). Reputation Marketing: Building and sustaining your organization's greatest asset.
McGraw-Hill, Chicago.
Risse, T., Ropp, S. C. and Sikkink, K. (1999). The power of human rights: International norms and
domestic change (66). Cambridge: Cambridge University Press.
Shaxson, N. (2007). Poisoned Wells: The Dirty Politics of African Oil. New York: Palgrave
Macmillan.

International Journal of Information, Business and Management, Vol. 8, No.2, 2016
ISSN 2076-9202
255
Whetten D.A., Rands G. and Godfrey P. (2002). What are the responsibilities of business to society?
In Pettigrew, A., Thomas, H. and Whittington, R. (eds), Handbook of Strategy and Management.
London: Sage, pp. 373–408.
Yergin, D. (2008). The Prize; The Epic Quest for Oil Money and Power, (FP) Free Press, A Division
of Simon and Schuster, Inc. 1230 Avenue of the Americas, New York 10020, pages 96-99
Journals
Alniacik, U., Alniacik, E. and Genc, N. (2011). How corporate social responsibility information
influences stakeholders' intentions. Corporate Social Responsibility and Environmental Management,
18(4), 234-245.
Andersen, S. and Mostue, B. (2012). Risk analysis and risk management approaches applied to the
petroleum industry and their applicability to IO concepts, Safety Science journal, 50, 2010-2019
Aven, T. and Renn, O. (2012). On the Risk Management and Risk Governance of Petroleum
Operations in the Barents Sea Area, Risk Analysis Journal, 32(9), 1539-6924
Brown,W. (2007); Understanding Reputational Risk: Identify, Measure, and Mitigate the Risk, SRC
Insights journal, fourth quarter 2007, Vol. 12. Iss. 2, pages 1-14
Davies, D. (2002); Risk Management – Protecting Reputation: Reputation Risk Management- The
Holistic Approach. Computer Law & Security Report, 18(6), 414-420.
Dowling, G. R. (2004). Corporate reputations: should you compete on yours? California Management
Review, 46(3), 19–36.
Gillies, A. (2010). Reputational concerns and the emergence of oil sector transparency as an
international norm. International Studies Quarterly, 54(1), 103-126.
Guzman, A. T. (2002). A compliance-based theory of international law. California Law Review, 90,
1823–1883.
Lindgreen, A. and Valérie Swaen,V (2010); Corporate Social Responsibility, International Journal of
Management Reviews.
Hale, J. E., Dulek, R. E. and Hale, D. P. (2005). Crisis response communication challenges: building
theory from qualitative data. Journal of Business Communications, 42(2), 112–134.
International Journal of Information, Business and Management, Vol. 8, No.2, 2016
ISSN 2076-9202
256
Jean, P. L. and Jenny, R. (2009). Towards the holy grail of defining brand. Marketing Theory, 9(1):
101-105.
Koronis, E. and Ponis, S. T. (2012). Introducing corporate reputation continuity to support
organizational resilience against crises. Journal of Applied Business Research (JABR), 28(2), 283-290.
Ladipo, P. and Rahim A. (2013). Corporate reputation as a strategic asset. International Journal of
Business and Social Science, 4(2), 220-225.
Mahon, J. (2002). Corporate reputation research agenda using strategy and stakeholder literature.
Business and Society, 41(4), 415-445.
Martin, G. (2009). Driving corporate reputations from the inside: A strategic role and strategic
dilemmas for HR. Asia Pacific Journal of Human Resource Management, 47(2), 219–35.
Meijer, M. M., and Kleinnijenhuis, J. (2006). Issue news and corporate reputation: Applying the
theories of agenda setting and issue ownership in the field of business communication. Journal of
Communication, 56(3), 543-559.
Michael L. B. and Timothy G. P. (2012). Building and maintaining a strong corporate reputation: a
broad look at a core issue. The European Financial Review, 6-9.
O’Rourke, J. (2001). Bridgestone/Firestone, Inc. and Ford Motor Company: How a product safety
crisis ended a hundred-year relationship. Corporate Reputation Review, 4 (3), 255-264.
Okonta, I. and Douglas, O. (2003). Where Vultures Feast: Shell, Human Rights and Oil. London:
Verso on PLS-SEM Model. International Business Research, 2 (3): 28-35.
Rayner, J. (2010); Understanding Reputation Risk and Its Importance, Journal of Finance, Available
at,
http://www.qfinance.com/business-strategy-best-practice/understanding-reputation-risk-and-its-import
ance?full
Pegg, S. (2006). Can Policy Intervention Beat the Resource Curse? Evidence from the Chad
Cameroon Pipeline Project. African Affairs 105(418), 1–25.
Spence, D., B. (2011). Corporate social responsibility in the oil and gas industry: The importance of
reputational risk. Chicago-Kent Law Review, 86 (1): 59-85.
Scandizzo, S. (2011); A framework for the analysis of reputational risk, the Journal of Operational
Risk , 6(3) 41–63
International Journal of Information, Business and Management, Vol. 8, No.2, 2016
ISSN 2076-9202
257
Varadarajan, R., DeFanti, M. P. and Busch, P. S. (2006). Brand portfolio, corporate image, and
reputation: managing brand deletions. Journal of the Academy of Marketing Science, 34(2), 195-205.
Verhezen, P. (2006); “Governance and International Business” Department of Management &
Marketing, University of Melbourne, Australia
Yanting, Z. and Liyun Xing, L. (2011); ‘Research on risk management of petroleum operations’
Energy Procedia, Vol. 5, pages. 2330-2334
Zheng L. (2010). A study on safety management in oil and natural gas companies, Journal of Social
Sciences, Southwest Petroleum University,China, Vol. 1, pages15-18
Zhang, Y. (2009). A study of corporate reputation’s influence on customer loyalty based on
PLS-SEM Model. International Business Research, 2(3), 28-35.
Electronic sources
Bartley, T., and Child, C. (2007). Shaming the corporation: globalization, reputation, and the
dynamics of anti-corporate movements. In annual meeting of the American Sociological Association,
New York. Accessed online on 12th April, 2013. Available at:
http://citation.allacademic.com//meta/p_mla_apa_research_citation/1/8/4/7/3/ pages184737/p
184737-6.php
Kavaq Business Intelligence (2005); “Still betting on your reputation?” Reputation Risk Management
12TH – 14TH June 2005, Renaissance Dubai Hotel,
http://www.idrisk.com/v2articles/ReputationalRisk.pdf (last visited 19/02/2013)
The Ernst & Young Business Risk Report, (2010); The top 10 risks for business: A sector-wide view
of the risks facing businesses across the globe, Available at; htt://wwwEITI, (2004). EITI Summary.
Oslo: Extractive industries transparency initiative. Accessed online on 12th April, 2013. Available at:
http://www.eitransparency.org/eiti/summary.
Exxon, (2008). Corporate Citizenship Report (2008). Accessed online on 14th April, 2013. Available
at http://www.socialfunds.com/shared/reports/1243310437ExxonMobil 2008
Corp_Citizenship_Report.pdf.
Heugens, P. M. and Zyglidopoulos, S. C. (2007). Unfit to Learn? How Long View Organizations
Adapt to Environmental Jolts. ERIM Report Series Research in Management Reference. Accessed
online on 14th April, 2013 Available at: http://repub.eur.nl /res/pub/9404/ ERS -2007-014-ORG.pdf

International Journal of Information, Business and Management, Vol. 8, No.2, 2016
ISSN 2076-9202
258
Marion, T. (2004). Reputation, Risk and Governance. Risk Management Topic Paper, 6. Accessed
online 10th April 2013. Available at: http://www.marionturnerconsulting.pwp.Blue
yonder.co.uk/images/RM%20topic%20paper%206%20%20Reputation%20Mar%2004.pdf
Mitchell, J. V. (2000, November). Reputation and responsibility: the new corporate overhead?. In
Presentation to the 2000 Oil and Money Conference (Vol. 15). Accessed online April 13th 2013.
Available at http://www.chathamhouse.org/sites/ default /files/
public/Research/Energy,%20Environment%20and%20Development/reputationandresponsibi lity.pdf
Oxford Metrica, (2011). Reputation Review. Accessed online 12th April, 2013. Available online at:
www.oxfordmetrica.com
Reputation Institute, (2011). The Global RepTrak 100: A study of the world most reputable companies
in 2011. Available online at:
http://www.scribd.com/doc/69946069/2011-Global-RepTrak-100-REPORT
Shell, (2013). Accessed online 12th April, 2013. Available at: http://www.shell.com/global
/environment-society/reporting.html
Suncor, (2013). Accessed online 12th April, 2013. Available at: http://www.suncor.com/ default.aspx
Tamutimes, (2013). Accessed online 12th April, 2013. Available at: http://tamutimes.tamu.
edu/2013/01/31/shell-oil-to-co-sponsor-ocean-science-competitions-in-texas/
World Bank, (2004a). Striking a Better Balance, the World Bank Group and Extractive Industries. The
Final Report of the Extractive Industries Review.
World Bank. (2004b). Final World Bank Group EIR Management Response. Washington, DC: World
Bank. Available at http://go.worldbank.org/TFN5LIZXR0.
Others
Nathalie and Serban, (2012). Corporate Reputation: Is your Most Strategic Asset at Risk. Center for
Interuniversity Research and Analysis on Organization (CIRANO).
Nelson, J., and Scoble, M. (2006). Social license to operate mines: Issues of situational analysis and
process. Department of Mining Engineering, University of British Columbia, Vancouver.
International Journal of Information, Business and Management, Vol. 8, No.2, 2016
ISSN 2076-9202
259
RETAIL COMMERCE & BIG RETAIL CHAINS IN GREECE: THE
CASE OF DIY (DO IT YOURSELF) SECTOR AND THE EXAMPLE OF
“IKEA”
Evangel ia FRAGOULI Ass istant Professor Aarhus Universi ty, DK & Management Lecturer MBA, MSc Universi ty of Dundee, UK. Address : 4 Lyt ton st r. , G/R, Dundee, DD2 1EU UK emai l:e .f ragoul [email protected] Panagiota KOULI (MBA) Address : Konstantilieri 39-43, Attiki, Athens emai l: yiota-koul i@ yahoo.gr
Abstract
In the middle of the world wide crisis and the adverse effects of credit crunch to global growth, the
sectors which have the ability to adapt to changes, to market and consumer needs are those that can
survive and develop. An indicative sector is “Do It Yourself” (DIY). The aim of this study is to analyse
the retail commerce in Greece the penetration of the big foreign retailers focusing on the sector of “Do It
Yourself”(DIY). It aims to investigate the global enterprises of DIY household sector, the changes they
have caused in the Greek market and in consumers’ behavior providing an outline for DIY’s future
development. For the successful completion of the present study relevant literature is reviewed, secondary
sources are consulted and a collection from interviews of professionals of DIY sector is used. A case
study is presented and analyzed, in order to support the study’s findings and claims. The main conclusion
of the study refer to that although the economic crisis in Greece has influenced the retail sector and
consumers’ behavior, however, the DIY sector for home improvement is developing, mostly because of
its competitive advantage of “good quality & low price” goods and its ability to adapt to the current
market conditions compared to the local producers who strive to survive.
Key words: DIY (Do It Yourself), retail, consumer
1. INTRODUCTION
The penetration of foreign retail enterprises in the Greek market and the collaborations which have been
made, have caused great changes in the structure of retail commerce. Retail is characterized by the
presence of big centralized enterprises, which lead to the form of oligopolistic markets, following the
global trends.
Due to the economic recession and the global credit crunch, people are generally reluctant to built or
buy a new house and are instead focused on improving their home and living conditions resulting in DIY
house ware and hardware growth. Despite the decline in construction activity, the DIY market is gaining
market share in countries that are still under development. The sector of DIY has changed a lot in Greece
International Journal of Information, Business and Management, Vol. 8, No.2, 2016
ISSN 2076-9202
260
and consumers have turned to alternative ways of purchasing. The traditional family-run business and the
local specialists have lost their power, whereas big foreign chains have gained the market. These foreign
retailers with the concept of ‘Low Price” being their main competitive advantage became a trend,
especially because of their low-cost products. The current economic crisis which affected the global
market and especially Europe has influenced consumer behavior and companies’ strategies. New products
and new commercial policies have been followed by those enterprises that penetrated in global markets, in
order to survive and develop. Consumers have turned to more “value for money” products and solutions,
especially regarding their home improvement and consequently, companies try to adapt their products and
cover consumers’ needs with lower cost solutions.
The present study focuses on the foreign multinational enterprises in Greece, their influence on the
market and the changes that they have brought in the DIY household sector and in consumer’s behaviour.
Through the case of “IKEA” the expansion and the success of these retailers is presented. IKEA is a
characteristic big DIY retail enterprise which has influenced the global and national markets.
2. RETAIL & MAIN CHARACTERISTICS
2.1. “Retail globalization” and “multinational” enterprises
During the last half of the twentieth century, many barriers to international trade fell and a wave of
firms began pursuing global strategies to gain a competitive advantage. However, some industries benefit
more from globalization than do others, and some nations have a comparative advantage over other
nations in certain industries (Balafoutis G, 2011). The Retail & Consumer industry is among off the
sectors that are most affected by globalisation, where multinational companies expand their network and
increase the number of their subsidiaries (QuickMBA.com, 2010). Retailing is considered to be a global
industry. With a greater emphasis being placed on private-label merchandise, retailers are working with
manufacturers located throughout the world to acquire merchandise. (Levy M. & Weitz B., 2009). Some
retailers invest globally in order to take advantage on to fast-growing consumer markets, especially when
their home markets are stagnant – like Germany and Japan. Retailers expand globally in order to leverage
their existing assets (Deloitte Touche Tohmachu Limited, 2011).The lessons from global retailing and the
examples of global retailers, with the common used term “multinational firms” reveal that expansion far
from the home market to international ones is a complicated and complex procedure (Tatoglu E,
Demirbag M. & Kaplan G., 2003).
The best global retailers spend substantial resources and time in learning about the local market. This
entails understanding supply chains, regulation, sources of merchandise, and, most importantly, consumer
tastes and habits. The latter is the most challenging. Understanding a foreign culture is enormously
difficult under the best of circumstances. (Hofstede F., Wedel M. & Steenkamp M., 2002). A motivated
workforce is a key factor for success not only in multinational companies, but in all retail firms.
Motivation is important because of its significance as a determinant of performance and its intangible
nature (Mishra, Sita, Gupta & Bindu, 2009).. Bent and Freathy (1997) mentioned that a key to
organization's competitive performance has been the successful motivation of staff (Bent, R. & Freathy,

International Journal of Information, Business and Management, Vol. 8, No.2, 2016
ISSN 2076-9202
261
P., 1997). In order for a multinational company to succeed, developing local relationships is crucial. Also,
a global retailer has to be prepared to make big mistakes, to learn and change-adapt. And finally,
retailers have to be prepared to invest on a large scale. To achieve rapid growth, successful retailers will
be wise to seek out new territories (Deloitte Touche Tohmachu Limited, 2011). Central and South
America with Brazil and Argentina, Africa, Asia, India, Eastern Europe and Russia, are some of the new
emerging markets with great prospects of growth. These are the new destinations were global retailers are
now turning their interest (A.T. Kearney Global Retail Development Index 2011).
2.2. Retail sector in Greece
In Greece, retail commerce has changed a lot, especially within the last ten years (Skordili S.,
2004).The penetration of foreign retail enterprises in the Greek market and the collaborations which have
been made, the institutional changes regarding the operation of domestic retail and the expansion of big
domestic chains have caused great changes in the structure of retail commerce. The penetration of the
multinational giant Carrefour, in the field of super-markets and Ikea in the home improvement were of the
most significant developments, followed by other global retailers, such as Saturn, Media Mark & Fnac
(electronic-multimedia field), Zara and Pull & Bear (apparel field) are some of the most indicative ones.
(Retail business, 2011).The traditional pattern of the local retailer who offered a narrow range of items
has changed to an area where consumers have at their disposal a great variety of goods and solutions
(Retail business, 2011). As a consequence, consumer’s behavior has also followed the above changes and
the creation of a new generation of “Western consumer culture” abandoning the traditional purchasing
methods was inevitable. Consumers today derive value from their purchases and the new retailing formats
provide them with a total experience. (Teller C., & Reutterer T., 2008).
Greek commerce has been influenced by many market changes and new classifications in the structure
of employment, indicating the changes in the structure of the Greek production model. Low
entrepreneurship and high rates of owned businesses, where usually the owners are responsible for all the
operating things without extra employees were soon abandoned for salaried employment. Employees’
rights are more protected, working hours, wages, working environment, medical and private insurance are
among off the high priorities of all the human resources departments of big retail chains nowadays
(Aranitou V. & Sagias I., 2011).
3. RETAIL & THE DIY SECTOR
3.1. Do It Yourself (DIY) sector in Greece
Do it yourself (DIY) is a term used to describe building, modifying, or repairing of something without
the aid of experts or professionals. The DIY market has a presence of more than 70 years worldwide and
with a remarkable performance in Europe and America. During the years the market has changed
significantly following the trends of global retail. In North America, Western and Centre Europe, as well
as in all developed economies the DIY market has already a significant market share in retail trade and
International Journal of Information, Business and Management, Vol. 8, No.2, 2016
ISSN 2076-9202
262
the biggest retailers are involved in this sector. According to the latest Retail report of 2011 of Deloitte
Group of Companies and also the official statistics centre for DIY, European Federation of DIY
Manufacturers (FEDIYMA), the top ten global retailers in the world are big multinational enterprises who
have expand their business internationally.
The DIY sector in Greece recorded a delayed development compared to other European countries,
where the particular market is characterized by large market shares. The situation has changed the last
decade, as the changes in Greek retail and consumer behaviour have been rapid and determinant for the
future of the market.
The Greek consumer is likely little handyman. In a survey of the French Economic Committee for the
Greek DIY market and retail in 2006, it appears that while three of four Greek undertake small DIY
jobs (small repairs, painting, gardening) when it comes to more complex work, they appeal to the
specialist (plumber , electrician etc.). This is mainly due to the low level of technical knowledge of Greek
handyman. Finally, till 2005-6 there are no specialized newspapers, with few exceptions (Frager E,
Kotsovassilis M, Takvorian M, & Pikri M, 2006).
The low cost of local labor was far, another obstacle to the development of crafts. As a measure, the
local workforce has been replaced by foreign labor, cheaper, for which the household is using Greek for
repairs and maintenance considered more complex.
The market for distributors is a tool for local business and small retail outlets in each district of Athens or
Thessalonica, where "the handyman"-technicians can get the tools they need at a low price. “The
handyman” team is either not supplied with sophisticated equipment for the investment required or the
machinery is large relative to the number of uses it will perform (Frager E, Kotsovassilis M, Takvorian M,
& Pikri M, 2006).
3.2. Greek DIY retailing and factors of development
The last decade was crucial for retail trade in Greece and for the DIY market which has been under
great changes and growth. The development of the construction sector after 1995, because of the private
and public investments, was a major factor in the improvement of DIY. The rise in prices was 15% in
2000, 17.6% in 2001 and 16.2% in 2002. In 2003 and 2004 the increase was more moderate (one digit).
The year 2005 confirms the stabilizing high price level. The period 1995-2004 the real estate market has
grown strongly. Demand for new homes has surged 134% increase across the country and 164% in the
Athens area. All these combined with the new infrastructure (airports, bridge of Rio-Antirrio, highway
works) had contributed to the rise of constructions and new dwellings (Frager E, Kotsovassilis M,
Takvorian M, & Pikri M, 2006).
In the above period, Greek households expected higher prices for houses and as the borrowing bank
rates were very competitive, there was an increase in new dwellings. Within the European Union, Greece
had the highest percentage of households own their homes (79.6%) according to Eurostat official statistics.
DIY is an area where professionals provide fragmented and disparate offers. The presence of big DIY
retailers is limited. With regards to local stores, they try to diversify their offerings by extending a set of
products found in the DIY sector.Their offer is aimed both at the general public and professionals. This is
International Journal of Information, Business and Management, Vol. 8, No.2, 2016
ISSN 2076-9202
263
due to the development of the construction market in 2004-5 that created some capital gains for
companies wishing to invest in these new businesses to establish their presence and reputation. This
development had later become a necessity by the gradual arrival of large international retailers, whose
expertise was threatening to the entities that could adapt (Frager E, Kotsovassilis M, Takvorian M, &
Pikri M, 2006).
All the above factors in combination with the retail globalization and the multinational’s enterprises
expansion resulted in the penetration of big global DIY retailers in the Greek market. This was a major
change in the structure of DIY retailing in Greece, a change with important effects on the market and the
consumer behavior. DIY retail trade in Greece has changed significantly the last decade both in its
structure and retail forms following the global trends, while big multinational firms are now the ones that
lead the market. (Euromonitor International, 2011). IKEA company is, perhaps, one of the world's most
successful multinational retailing firms operating as a global organization based in its unique concept that
the furniture is sold in kits that are assembled by the customer at home (Dimitriadis N., 2002). The typical
IKEA customer is young, low to middle income family. Based on a recent research made by IKEA for its
customers, the average age of the IKEA visitor is 42 and 60% of the visitors are women (Fourlis Holdings
report, 2010).
3.3. IKEA: Key Reasons for IKEA’s success
The IKEA brand is associated with simple, low cost, stylish products. Initially, IKEA did not
customize its products to local markets, but kept to standardized products and operations
worldwide. This standardized strategy of internationalizing minimized costs. This is one of the
characteristics that make IKEA the leader amongst internationalising retailers. (Retail Business, 2009, 78;
quoted from Olsson, 2011, p.12). IKEA developed a model for the business, where it was able to keep
costs low. In order to maintain low cost, Ikea shoppers are half producers, and half consumers. In
other words, they have to assemble the products themselves (Burt S., Johansson U., & Thelander A.,
2008). The “Do It Yourself” concept has already started to become worldwide known and familiar to
consumer.IKEA has excellent international procurement. Thirty buying offices were created to source
from over 1,400 suppliers worldwide, IKEA negotiates prices that are between 20-40% lower than
competitors for comparable goods. IKEA has excellent supply chain management and utilizes the latest
IT infrastructure, as well as, has a global network of distribution centres, most of which are near
container ports and major truck and rail routes. (Magonelly L., 2002).Over all IKEA is doing
differentiation and cost leadership. Differentiation, because their products are different compared to the
conventional ones already in the market. Anticipating the needs and wants of customers IKEA is
successful in product design and ensuring ranges which are modern and of good quality (Burt S.,
Johansson U., & Thelander A., 2008).Location of the stores, Services to the customers, Store’s design
and facilities, children playrooms, restaurants are some of the areas that IKEA pays high attention. (IKEA
corporate site, http://www.ikea.com).
And last but not less important, IKEA has a social and environmental profile. All IKEA campaigns
have “Environment” and “Sustainable Development” as the major and basic message. This in
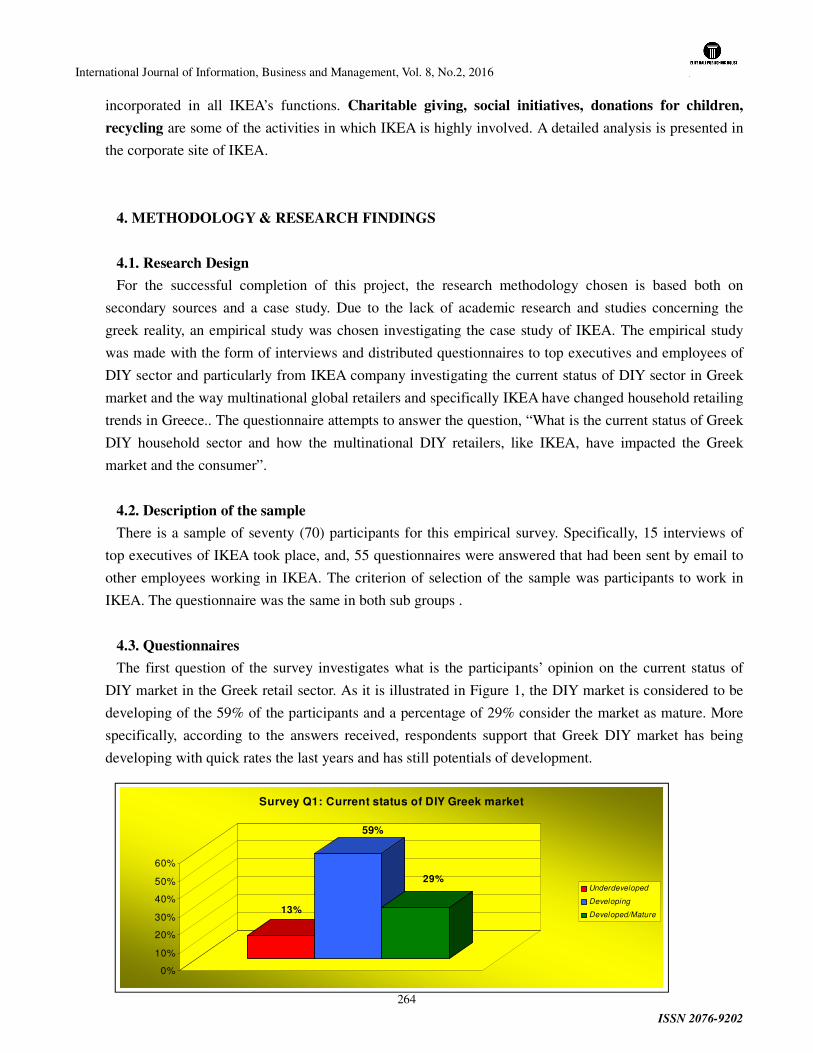
International Journal of Information, Business and Management, Vol. 8, No.2, 2016
ISSN 2076-9202
264
incorporated in all IKEA’s functions. Charitable giving, social initiatives, donations for children,
recycling are some of the activities in which IKEA is highly involved. A detailed analysis is presented in
the corporate site of IKEA.
4. METHODOLOGY & RESEARCH FINDINGS
4.1. Research Design
For the successful completion of this project, the research methodology chosen is based both on
secondary sources and a case study. Due to the lack of academic research and studies concerning the
greek reality, an empirical study was chosen investigating the case study of IKEA. The empirical study
was made with the form of interviews and distributed questionnaires to top executives and employees of
DIY sector and particularly from IKEA company investigating the current status of DIY sector in Greek
market and the way multinational global retailers and specifically IKEA have changed household retailing
trends in Greece.. The questionnaire attempts to answer the question, “What is the current status of Greek
DIY household sector and how the multinational DIY retailers, like IKEA, have impacted the Greek
market and the consumer”.
4.2. Description of the sample
There is a sample of seventy (70) participants for this empirical survey. Specifically, 15 interviews of
top executives of IKEA took place, and, 55 questionnaires were answered that had been sent by email to
other employees working in IKEA. The criterion of selection of the sample was participants to work in
IKEA. The questionnaire was the same in both sub groups .
4.3. Questionnaires
The first question of the survey investigates what is the participants’ opinion on the current status of
DIY market in the Greek retail sector. As it is illustrated in Figure 1, the DIY market is considered to be
developing of the 59% of the participants and a percentage of 29% consider the market as mature. More
specifically, according to the answers received, respondents support that Greek DIY market has being
developing with quick rates the last years and has still potentials of development.
13%
59%
29%
0%
10%
20%
30%
40%
50%
60%
Survey Q1: Current status of DIY Greek market
Underdeveloped
Developing
Developed/Mature
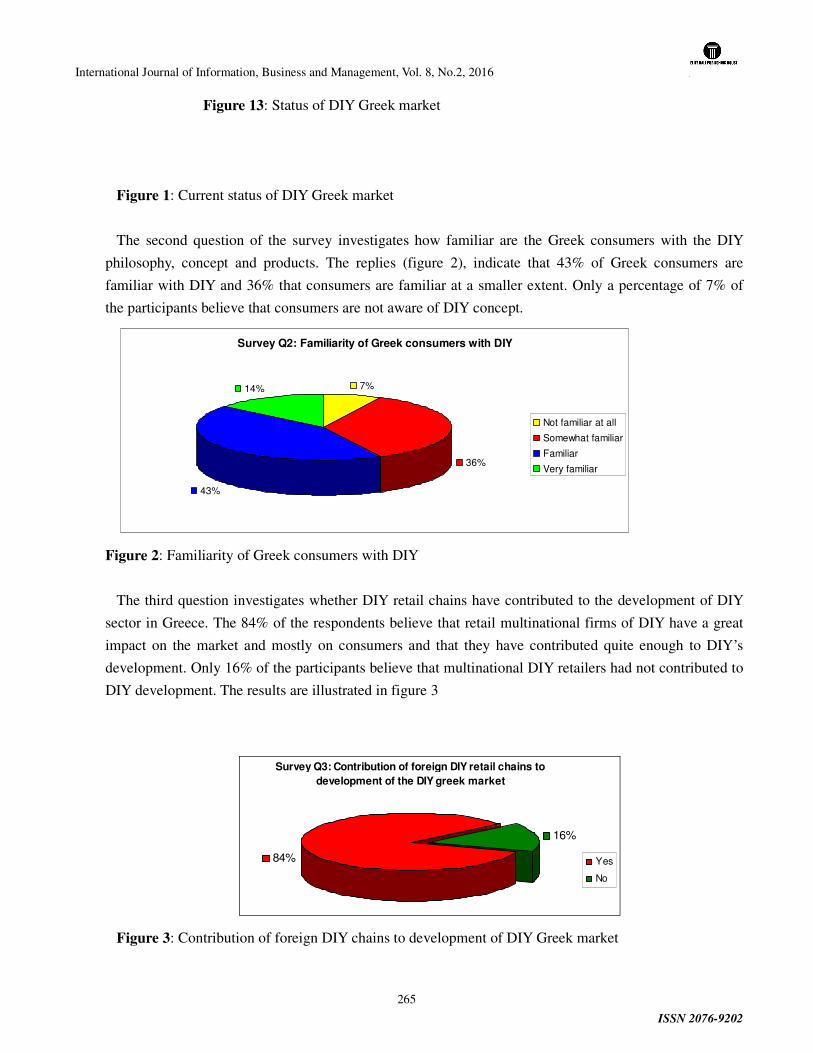
International Journal of Information, Business and Management, Vol. 8, No.2, 2016
ISSN 2076-9202
265
Figure 13: Status of DIY Greek market
Figure 1: Current status of DIY Greek market
The second question of the survey investigates how familiar are the Greek consumers with the DIY
philosophy, concept and products. The replies (figure 2), indicate that 43% of Greek consumers are
familiar with DIY and 36% that consumers are familiar at a smaller extent. Only a percentage of 7% of
the participants believe that consumers are not aware of DIY concept.
Figure 2: Familiarity of Greek consumers with DIY
The third question investigates whether DIY retail chains have contributed to the development of DIY
sector in Greece. The 84% of the respondents believe that retail multinational firms of DIY have a great
impact on the market and mostly on consumers and that they have contributed quite enough to DIY’s
development. Only 16% of the participants believe that multinational DIY retailers had not contributed to
DIY development. The results are illustrated in figure 3
Figure 3: Contribution of foreign DIY chains to development of DIY Greek market
Survey Q2: Familiarity of Greek consumers with DIY
7%
36%
43%
14%
Not familiar at all
Somewhat familiar
Familiar
Very familiar
Survey Q3: Contribution of foreign DIY retail chains to
development of the DIY greek market
16%
84% Yes
No
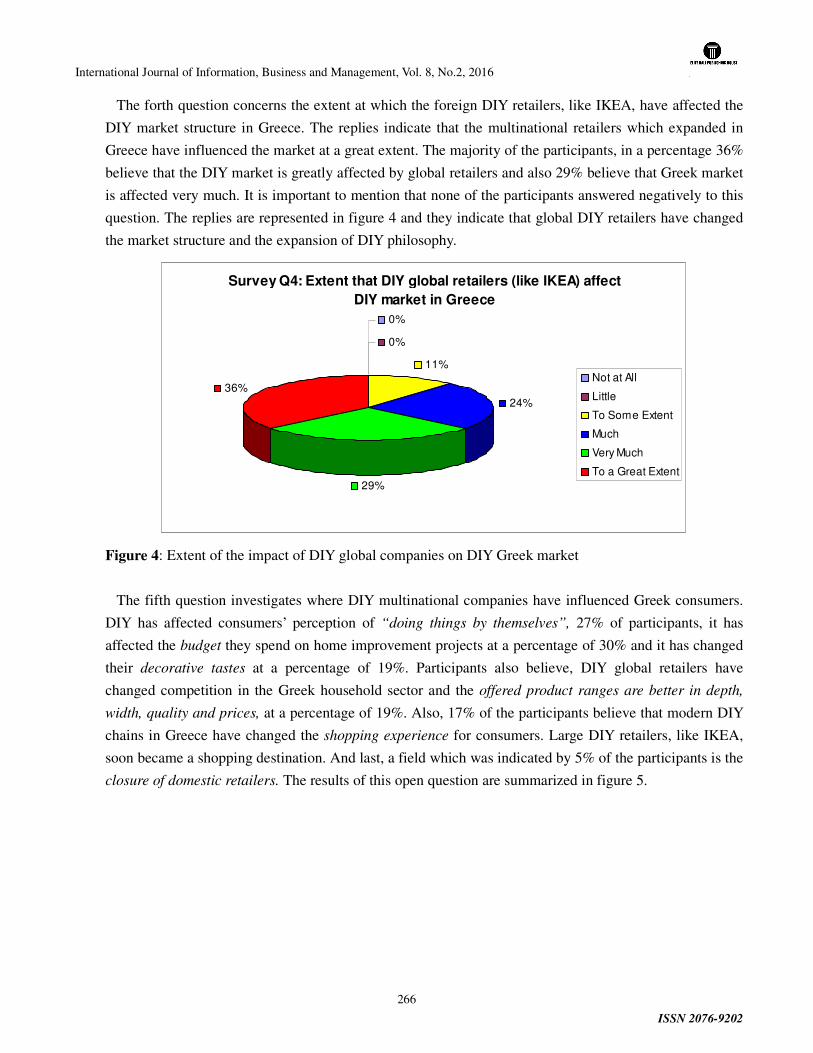
International Journal of Information, Business and Management, Vol. 8, No.2, 2016
ISSN 2076-9202
266
The forth question concerns the extent at which the foreign DIY retailers, like IKEA, have affected the
DIY market structure in Greece. The replies indicate that the multinational retailers which expanded in
Greece have influenced the market at a great extent. The majority of the participants, in a percentage 36%
believe that the DIY market is greatly affected by global retailers and also 29% believe that Greek market
is affected very much. It is important to mention that none of the participants answered negatively to this
question. The replies are represented in figure 4 and they indicate that global DIY retailers have changed
the market structure and the expansion of DIY philosophy.
Figure 4: Extent of the impact of DIY global companies on DIY Greek market
The fifth question investigates where DIY multinational companies have influenced Greek consumers.
DIY has affected consumers’ perception of “doing things by themselves”, 27% of participants, it has
affected the budget they spend on home improvement projects at a percentage of 30% and it has changed
their decorative tastes at a percentage of 19%. Participants also believe, DIY global retailers have
changed competition in the Greek household sector and the offered product ranges are better in depth,
width, quality and prices, at a percentage of 19%. Also, 17% of the participants believe that modern DIY
chains in Greece have changed the shopping experience for consumers. Large DIY retailers, like IKEA,
soon became a shopping destination. And last, a field which was indicated by 5% of the participants is the
closure of domestic retailers. The results of this open question are summarized in figure 5.
Survey Q4: Extent that DIY global retailers (like IKEA) affect
DIY market in Greece
0%
0%
11%
24%
29%
36%Not at All
Little
To Some Extent
Much
Very Much
To a Great Extent
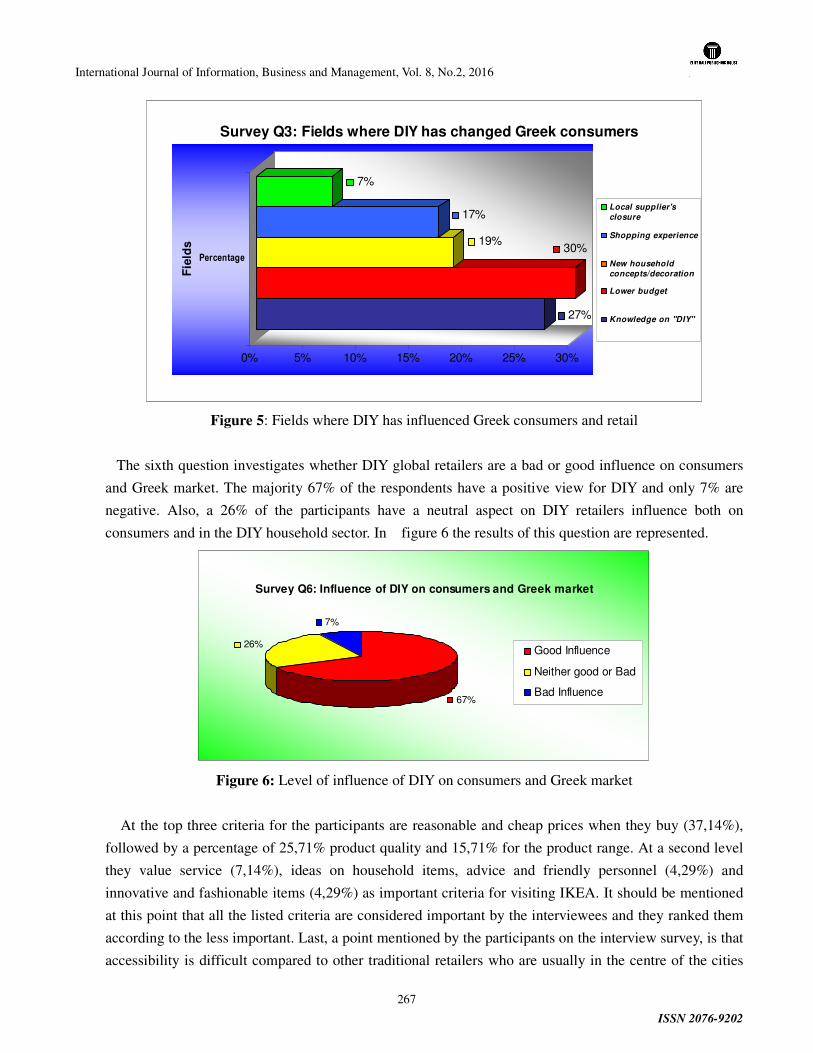
International Journal of Information, Business and Management, Vol. 8, No.2, 2016
ISSN 2076-9202
267
Figure 5: Fields where DIY has influenced Greek consumers and retail
The sixth question investigates whether DIY global retailers are a bad or good influence on consumers
and Greek market. The majority 67% of the respondents have a positive view for DIY and only 7% are
negative. Also, a 26% of the participants have a neutral aspect on DIY retailers influence both on
consumers and in the DIY household sector. In figure 6 the results of this question are represented.
Figure 6: Level of influence of DIY on consumers and Greek market
At the top three criteria for the participants are reasonable and cheap prices when they buy (37,14%),
followed by a percentage of 25,71% product quality and 15,71% for the product range. At a second level
they value service (7,14%), ideas on household items, advice and friendly personnel (4,29%) and
innovative and fashionable items (4,29%) as important criteria for visiting IKEA. It should be mentioned
at this point that all the listed criteria are considered important by the interviewees and they ranked them
according to the less important. Last, a point mentioned by the participants on the interview survey, is that
accessibility is difficult compared to other traditional retailers who are usually in the centre of the cities
27%
30%19%
17%
7%
0% 5% 10% 15% 20% 25% 30%
Percentage
Fie
lds
Survey Q3: Fields where DIY has changed Greek consumers
Local supplier's
closure
Shopping experience
New household
concepts/decoration
Lower budget
Knowledge on "DIY"
Survey Q6: Influence of DIY on consumers and Greek market
67%
26%
7%
Good Influence
Neither good or Bad
Bad Influence
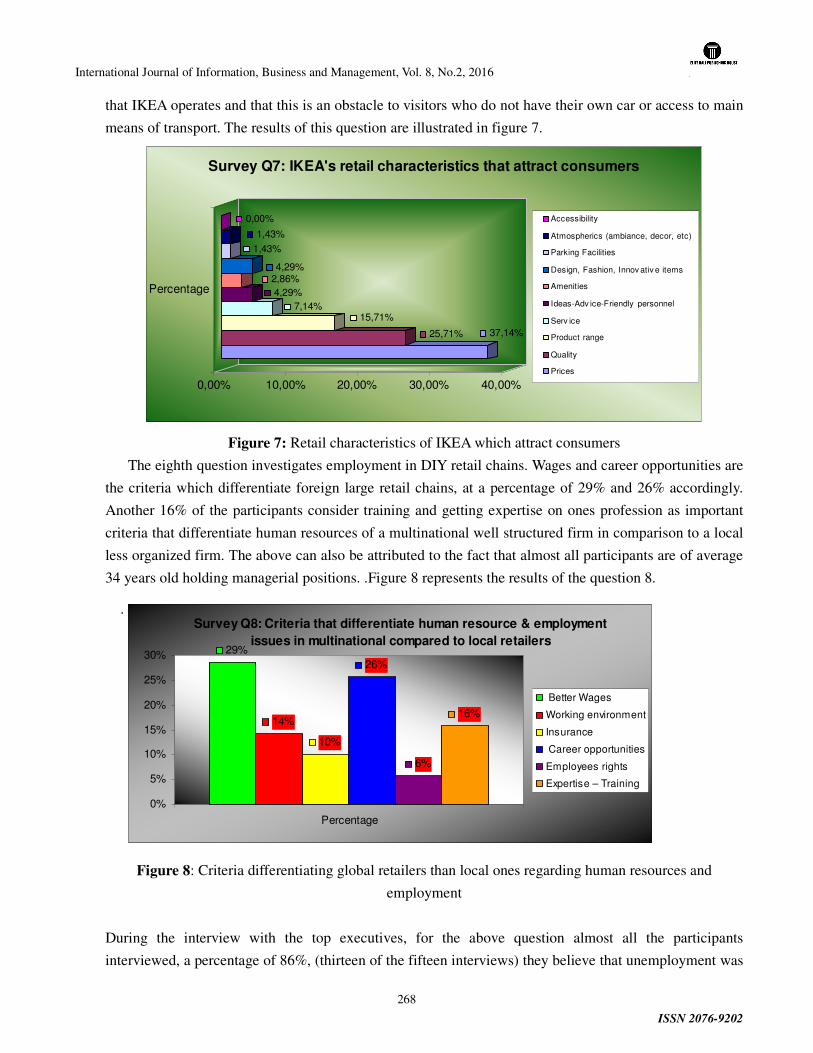
International Journal of Information, Business and Management, Vol. 8, No.2, 2016
ISSN 2076-9202
268
that IKEA operates and that this is an obstacle to visitors who do not have their own car or access to main
means of transport. The results of this question are illustrated in figure 7.
Figure 7: Retail characteristics of IKEA which attract consumers
The eighth question investigates employment in DIY retail chains. Wages and career opportunities are
the criteria which differentiate foreign large retail chains, at a percentage of 29% and 26% accordingly.
Another 16% of the participants consider training and getting expertise on ones profession as important
criteria that differentiate human resources of a multinational well structured firm in comparison to a local
less organized firm. The above can also be attributed to the fact that almost all participants are of average
34 years old holding managerial positions. .Figure 8 represents the results of the question 8.
.
Figure 8: Criteria differentiating global retailers than local ones regarding human resources and
employment
During the interview with the top executives, for the above question almost all the participants
interviewed, a percentage of 86%, (thirteen of the fifteen interviews) they believe that unemployment was
37,14%25,71%
15,71%7,14%
4,29%
2,86%4,29%
1,43%
1,43%
0,00%
0,00% 10,00% 20,00% 30,00% 40,00%
Percentage
Survey Q7: IKEA's retail characteristics that attract consumers
Accessibility
Atmospherics (ambiance, decor, etc)
Parking Facilities
Design, Fashion, Innov ativ e items
Amenities
Ideas-Adv ice-Friendly personnel
Serv ice
Product range
Quality
Prices
Survey Q8: Criteria that differentiate human resource & employment
issues in multinational compared to local retailers
14%
10%
26%
6%
16%
29%
0%
5%
10%
15%
20%
25%
30%
Percentage
Better Wages
Working environment
Insurance
Career opportunities
Employees rights
Expertise – Training
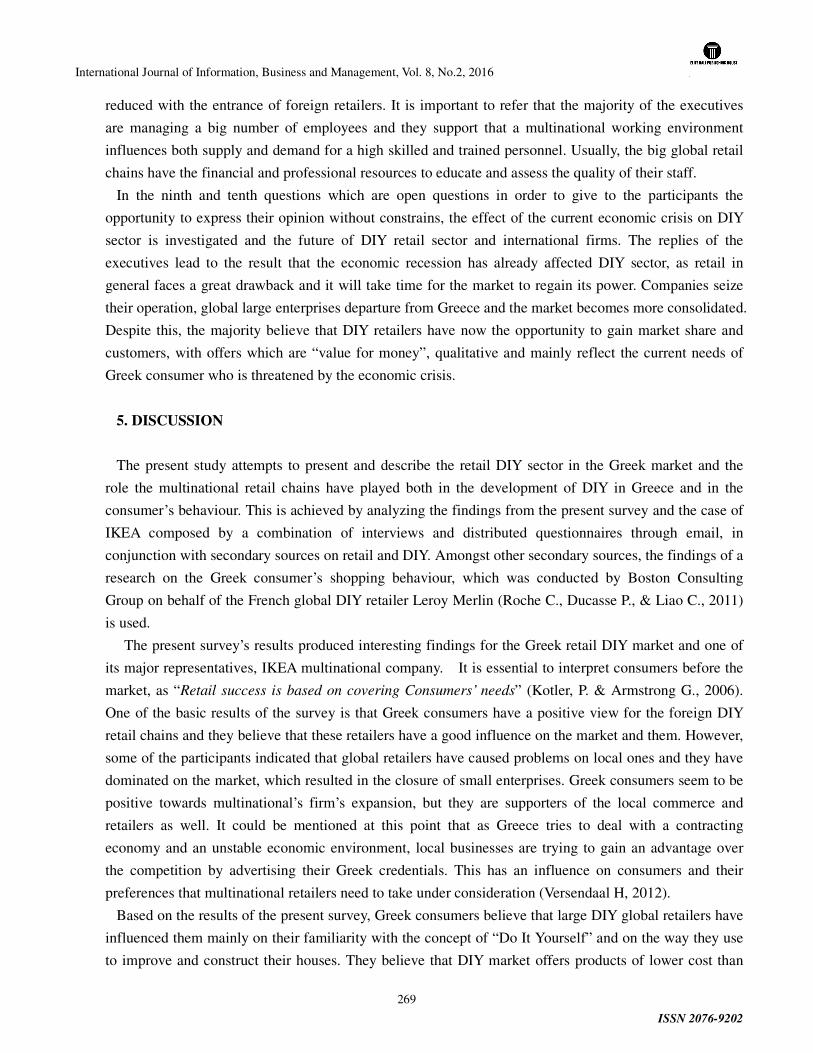
International Journal of Information, Business and Management, Vol. 8, No.2, 2016
ISSN 2076-9202
269
reduced with the entrance of foreign retailers. It is important to refer that the majority of the executives
are managing a big number of employees and they support that a multinational working environment
influences both supply and demand for a high skilled and trained personnel. Usually, the big global retail
chains have the financial and professional resources to educate and assess the quality of their staff.
In the ninth and tenth questions which are open questions in order to give to the participants the
opportunity to express their opinion without constrains, the effect of the current economic crisis on DIY
sector is investigated and the future of DIY retail sector and international firms. The replies of the
executives lead to the result that the economic recession has already affected DIY sector, as retail in
general faces a great drawback and it will take time for the market to regain its power. Companies seize
their operation, global large enterprises departure from Greece and the market becomes more consolidated.
Despite this, the majority believe that DIY retailers have now the opportunity to gain market share and
customers, with offers which are “value for money”, qualitative and mainly reflect the current needs of
Greek consumer who is threatened by the economic crisis.
5. DISCUSSION
The present study attempts to present and describe the retail DIY sector in the Greek market and the
role the multinational retail chains have played both in the development of DIY in Greece and in the
consumer’s behaviour. This is achieved by analyzing the findings from the present survey and the case of
IKEA composed by a combination of interviews and distributed questionnaires through email, in
conjunction with secondary sources on retail and DIY. Amongst other secondary sources, the findings of a
research on the Greek consumer’s shopping behaviour, which was conducted by Boston Consulting
Group on behalf of the French global DIY retailer Leroy Merlin (Roche C., Ducasse P., & Liao C., 2011)
is used.
The present survey’s results produced interesting findings for the Greek retail DIY market and one of
its major representatives, IKEA multinational company. It is essential to interpret consumers before the
market, as “Retail success is based on covering Consumers’ needs” (Kotler, P. & Armstrong G., 2006).
One of the basic results of the survey is that Greek consumers have a positive view for the foreign DIY
retail chains and they believe that these retailers have a good influence on the market and them. However,
some of the participants indicated that global retailers have caused problems on local ones and they have
dominated on the market, which resulted in the closure of small enterprises. Greek consumers seem to be
positive towards multinational’s firm’s expansion, but they are supporters of the local commerce and
retailers as well. It could be mentioned at this point that as Greece tries to deal with a contracting
economy and an unstable economic environment, local businesses are trying to gain an advantage over
the competition by advertising their Greek credentials. This has an influence on consumers and their
preferences that multinational retailers need to take under consideration (Versendaal H, 2012).
Based on the results of the present survey, Greek consumers believe that large DIY global retailers have
influenced them mainly on their familiarity with the concept of “Do It Yourself” and on the way they use
to improve and construct their houses. They believe that DIY market offers products of lower cost than
International Journal of Information, Business and Management, Vol. 8, No.2, 2016
ISSN 2076-9202
270
the traditional retailers of DIY. Particularly, IKEA has resulted in the decrease of the budget needed for
home improvement. Low cost products in combination with good quality and wide product ranges are
important for Greek consumers and IKEA’s dominance in the household DIY sector has contributed to
that. Similar to the above is the result regarding the basic retail characteristics consumers believe IKEA
has compared to other DIY household retailers. The majority of our sample identified prices, product
range and quality as the three main criteria for purchasing from IKEA. They also consider it as a
“shopping experience” which offers a wide range of facilities and services. These are the main criteria
they seek when making their purchases.
The above coincide with the results of the research conducted by Boston Consulting Group (BCG) on
Greek consumer’s behaviour (Roche C., Ducasse P., & Liao C., 2011). According to it, after the economic
recession Greek consumers intend to reduce expenditure of non-essential items and they are more
interested in offers and purchases from discount stores, where they can purchase goods on discount and
private labels which are both cheaper and of good quality. According to BCG’s survey, in the list of
values which are most important for Greek consumers, the top five listed are: “Value for
money”Purchases, Health, Friends, “My Home", Cheerfulness and Serenity. The firms which may adapt
more efficiently and effectively to these values will gain market share. Some years ago, Greek consumer
used to spend handsome amounts on luxury items, “image”, well known brand names and trendy leisure
activities. Things have changed after economic recession. Consumers in Greece not only pay higher
prices on many products and services but also earn lower incomes. Their purchasing power is therefore
less than the other Europeans. Hence, the impact of the economic recession on Greek consumers’
consumption will be the same or even greater compared to the rest of EU countries (Mpaltas, G. 2008).
The responses received regarding the level of the DIY market in Greece characterize it as developing.
Almost all the respondents believe that despite the economic crisis, it is now the opportunity to take
advantage of this and remain in the market. It is a result that can be combined with the question on the
future of DIY sector in Greece. The fact that a small percentage of the respondents selected the choice of
“mature” serves as evidence that there are opportunities of growth for the particular market.
As far as the global DIY retails chains and their influence on the local DIY market, the responds were
interesting. The majority of the participants mentioned that the multinational firms have changed the
market structure at a great extent and imported in Greece new business techniques and store concepts. By
reviewing the literature and secondary data, penetration of the big international retailers in Greece was
delayed compared to the expansion in other European countries (Burt S., 2010). Though not asked, during
the interviews procedure the respondents attributed the difficulty in establishing the concept of DIY in
Greece to two basic factors; the first is that the market is more traditional and local specialists do not have
sufficient “know how” of the business and the second one is that consumers tended to seek the local
technician or professional who could do the job for them, even with higher cost (Frager E, Kotsovassilis
M, Takvorian M, & Pikri M, 2006),. Now this has changed and according to the turnover sales of the DIY
global chains that the participants represented, Greek consumers today are more educated on DIY concept,
on the offers they can get, their services and facilities. IKEA and other main DIY retailers have greatly
contributed to this. Also many of the participants refer that lately “DIY” has gained wide recognition from
International Journal of Information, Business and Management, Vol. 8, No.2, 2016
ISSN 2076-9202
271
the market and the consumers, as there are many relative magazines available and TV shows with much
advertising. DIY campaigns which are published in newspapers and on-line in the Internet make DIY
familiar and popular and lastly, many Greek wholesale suppliers have included in their product ranges
“DIY” products.
The participants in the research were also questioned regarding employment where all agreed that in
every place that a big company or store is located there is a reduction in the unemployment rate. They
also support that big multinational companies offer career opportunities, they have the knowledge to
develop their workforce and raise the standards, the qualifications and skills of employees.
The results show that despite the decline in the retail sector due to the economic crisis of 2008-2011, the
DIY market has the potentials to overcome difficulties and gain market share. The global DIY retail
chains are facing problems, but all these can be overcome by following the markets trends and today
consumer needs. Recommendations and developing suggestions are presented in the next section.
6. CONCLUSION
The purpose of the present research project was to present and describe the current status of DIY sector
in the Greek retail commerce and the influence of big DIY global retailers in the market and the consumer
behaviour. The methodology chosen for the completion of this research is based both on secondary
sources and a case study. Secondary sources include amongst others, articles, magazines, journals, on line
sources and statistical elements and a research on consumer’s behavior conducted by a consulting
company (Roche C., Ducasse P., & Liao C., 2011). Due to the lack of academic research and studies
concerning the Greek reality, the primary data which is used in parallel with the secondary one is an
empirical study investigating the case study of IKEA. The empirical study was made with the form of
interviews and distributed questionnaires to top executives and employees of DIY sector and particularly
from IKEA company.
The results of the research findings display that DIY sector in the Greek retail market has the potential
to develop further and despite the current unstable economic environment, it can benefit from the
opportunities, which derive from new market standards. Furthermore, the penetration and the influence of
global retailing companies on the Greek market was investigated and in particular the firms specializing
in DIY. The case of the global DIY giant of home improvement and furniture “IKEA” was examined, in
order to present the way an indicative representative of the subject under study operates. IKEA is an
enterprise with a worldwide presence in countries developed and under developing/ emerging and with a
big influence on the retail field and consumers’ behavior of the country or city that every time operates
Jonsson A. & Elg Ulf, 2006). IKEA is a point of reference for all multinational firms and competitors and
although it implements a similar “standardized” international strategy, it depicts remarkable adaptation
possibilities whenever is necessary. IKEA’s main message and vision is “Make a better everyday life for
the many people” and implements this on everything that is involved in (Jonsson A., 2008).. The results
of the research also showed that international DIY firms made the concept of “DIY” familiar to Greek
consumers and in a way helped them understand that they can repair, create, decorate, renovate and do
International Journal of Information, Business and Management, Vol. 8, No.2, 2016
ISSN 2076-9202
272
things themselves, cleverly and affordable. Although DIY market and DIY retailers have the potential to
survive from the declining and unstable retailing market, certain changes will need to be made, primarily
in the field of after sales service. It is an area that according to the findings of this study, consumers
consider important enough.
6.1. Limitations
The study presented certain limitations. The most important of the limitations was the lack of literature
concerning Greece. Furthermore, another limitation is the unstable economic environment within which
every member of the retail industry performs nowadays. Within this frame, consumer’s expectations
towards development and market recovery are less positive and stable. Also, the size of the sample and
the fact that the segmentation of the DIY market is not exactly the same in all countries and so data could
not be generally applied are other limitations. Despite the fact that IKEA is a DIY retailer, in the official
reports and statistics it does not listed in the DIY sector, but in the Furniture one.
6.2. Recommendations
Taking into consideration all findings, recommendations are made on the possible business
opportunities for success and development, which can be taken in advantage by the firms in DIY sector in
Greece. According to the findings of the study, consumers nowadays seek for products which are “Value
for Money”. DIY concept coincides with the above and it seems easier to be achieved. Consumers adapt
their shopping behaviour and habits, to be able to adjust to the changing economic conditions and this is a
challenge for the all firms (Koksal M. H., & Ozgul, E. 2007).In addition to the present study, also on the
survey conducted by BCG (Roche C., Ducasse P. & Liao C.2011), in the top list of consumer values are
“Health”, “Value for Money” items and “Home”. So, the firms which can apply a similar communication
harmonization with the right sequence of values can benefit compared to competitors. They are more
likely to communicate their offer to the consumer and to be perceived as those being able to satisfy
consumers’ needs.
The explosive penetration of private label products in almost all product categories is also remarkable,
as the market data indicate and the relevant researches. Consumers select private label products as a way
to reduce costs, seek better prices for their purchases from hyper markets, supermarkets and discount
stores. The loyalty of customers, who can switch freely between retailers, has been influenced among
other by the increased usage of private label, as both a store loyalty builder and a ready alternative to
branded products, reducing risk and customer’s resistance to switch brands (Steenkamp J-B. & Dekimpe
M., 1997). Customer loyalty to store brands is only possible, if they have a favorable image. Quality is a
major factor in consumer purchase decisions and as private labels have substantially narrowed the
perceived quality gap, the higher priced national brands have lost their competitive edge (Boutsouki Ch.,
Zotos Y. & Masouti Z., 2009). DIY firms have the ability to provide their own brands and gain profit and
market share.
There are also some main trends resulting from research, which could be addressed for further research
and development and could benefit DIY firms. Namely, these are: a) New values: “Conscientious” as
International Journal of Information, Business and Management, Vol. 8, No.2, 2016
ISSN 2076-9202
273
opposed to conspicuous consumption is on the rise with a marked and continued shift away from luxury
and status and toward financial prudence and stability. Consumers are also looking for products that have
healthy, safety, environmental benefits. Sustainable Development is the new trend of the years ahead. The
‘availability’ and the ‘price’ of environmentally friendly products have been identified as the most
significant issues common to India, Greece and the UK (Bhate S., 2002). b)New shopping channels: the
digital revolution is transforming shopping behavior .c) New communication and market channels created
by the Internet expansion, the spread of smart-phones and the growing use of social networking sites
posing this way new rules on trade and market. (Easy access, social media are changing how consumers
select, purchase and even use products).d) Effective external DIY marketing campaigns: An effective
external DIY marketing campaign, mixed with the financial crisis, will bring in more customers who are
looking to repair there existing home rather than hire a professional or purchase a new home. Utilizing the
Internet and You Tube, a free video-sharing website, a DIY firm may able to encourage and promote DIY
projects outside of its stores. e) Reward Programs / Loyalty cards: The loyalty card/rewards program
will allow management to collect and compile real-time quantitative data in regards to customers
purchasing behaviors, and effectiveness of promotions and sales.
REFERENCES
Ang, S. H., Leong, S. M., & Kotler, P. (2000), “The Asian Apocalypse: Crisis”, Long Range Planning, Vol.33, pp. 97-119
Aranitou V. and Sagias I., (2011), “Development of Retail Commerce: New forms of retailing”, ORGA-ESEE: Commerce & Cities, Athens
A.T. Kearney Global Retail Development Index 2011, “Retail Global Expansion: A portfolio of Opportunities”, A.T. Kearney Inc, London
Balafoutis G, (2011), “Retail & Commerce”’, PricewaterHouseCoopers IL., Athens
Bennison D., Boutsouki Chr., (1995),"Greek retailing in transition", International Journal of Retail &
Distribution Management, Vol. 23, pp.24 - 31
Bent, R. & Freathy, P (1997), "Motivating the Employee in the Independent Retail Sector", Journal of
Retailing and Consumer Services, Vol.43, pg. 201-208.
Bhate S., (2002), “One world, one environment, one vision: are we close to achieving this? An exploratory study of consumer environmental behavior across three countries”, Journal of Consumer behavior, Vol.2, Issue 6, pg.169-184
Boutsouki Ch., Zotos Y. & Masouti Z., (2009), “Consumer behaviour towards own label: monitoring the Greek experience”, Vol.9, No1, Aristotle University of Thessaloniki, School of Law and Economics, Department of Economics, Division of Business Administration, Thessaloniki
International Journal of Information, Business and Management, Vol. 8, No.2, 2016
ISSN 2076-9202
274
Burt S., Johansson U., Thelander A., (2008), “Standardized Marketing Strategies in retailing? IKEA’s marketing strategies in Sweden, UK & China”, 1st Nordic Retail & Wholesale Conference, Stockholm
Deloitte Touche Tohmachu Limited, 2011, “Global Powers of Retailing 2011”, Deloitte LLP, London
Deloitte Touche Tohmachu Limited, 2011, “Revisiting retail globalization”, Deloitte LLP, London
Euromonitor International, (2011), “DIY, Home Improvement & Garden Centres in Greece”, Retailing, Euromonitor, www.euromonitor.com
European Commission, External Trade, (2011), “Global Europe: Competing in the world”, European Commission Report
Farfan B, (2011), “Top 250 Global Powers of Retail List”, Retailers from European Countries,
Fourlis Holdings report, (2010), “Annual IKEA report”
Frager E, Kotsovassilis M, Takvorian M, Pikri M, (2006), “Greek DIY market”, Economic Mission of Athens, Greece
Hofstede F., Wedel M. & Steenkamp M., (2002), “Identifying Spatial Segments in International Markets”, Marketing Science, Vol. 21, No. 2, pp. 160-177
Kaliappan S., Alavi B., Abdullah C. & Zakaullah D., (2008), “Liberalization of Retail Sector and the Economic Impact of the Entry of Foreign Hypermarkets on Local Retailers in Klang valley, Malaysia”, International Journal of economics & Management, Vol.2, pg323-342, University Putra, Malaysia
Koksal M. H., & Ozgul, E. (2007), “The relationship between marketing strategies and performance in an economic crisis”, Marketing Intelligence & Planning, Vol.25 (4), pp.326-342.
Kotler, P. & Armstrong G., (2006), Principles of Marketing, Prentice Hall, New Jersey
Levy M. and Weitz B., (2009), “The world of retailing”, Retailing Management 7th
edition, The McGraw-Hill Companies, New York
Magonelly L., (2002), “How Ikea Designs Its Sexy Price Tags;” http://www.business2.com/articles/mag
Mpaltas, G. (2008), “Significant changes in consumers' purchasing behaviour”, Vima Online, available: http://tovima.gr, published on 12 October 2008
Metro Group, (2011)-2012, “Metro Retail Compendium 2011-2012”
Mishra, Sita, Gupta, Bindu, (2009), “Work place motivators & employees’ satisfaction: a study of retail sector in India”, Indian Journal of Industrial Relations, Shri Ram Centre, India
QuickMBA.com, (2010), “Strategic Management”’, Global Strategic Management
International Journal of Information, Business and Management, Vol. 8, No.2, 2016
ISSN 2076-9202
275
Retail business, (2011), “Greek Retail: Special Edition”, Retail Business, Vol.500, Direction Publications, Greece
Retail Business, (2012), “Retail Business Awards 2012” forum, Greece
Rinker Nina, (2011), “Industry Briefing: Germany’s DIY market”, CSI McKinsey, McKinsey’s Munich
Roche C., Ducasse P., Liao C., (2011), “Consumer Sentiment 2011 & Greek market: Navigating the New Consumer Realities”, Boston Consulting Report 2011, BCG Inc., USA
Seimanidi A., (2011), “Retail Greek commerce: the large employer under changes”, Hrima.gr-Monthly Economic Magazine, 376, Athens
Skordili S., (2004), Academic Notes: Geography of Industry, Services & Commerce 2004, Harokopio University of Athens, Geography department
Steenkamp J-B & Dekimpe M., (1997), “The increasing power of store brands: building loyalty and market share”, Long Range Planning, Vol.30, (6), pg.917-930
Tatoglu E, Demirbag M. & Kaplan G., 2003, “Motives for Retailer Internationalization to Central and Eastern Europe”, Emerging Markets Finance & Trade, Vol. 39, No.4, pg 40-57, M.E.Sharpe, Inc.
Teller C., Reutterer T., (2008). “The evolving concept of retail attractiveness: what makes retail agglomerations attractive when customers shop at them?”, Journal of Retailing and Consumers Services, Vol.15, pg127–143
Versendaal H, (2012), “Local brands try to woo consumers by advertising Greekness”, www.kathimerini.com, published on line on December 2011.
Sources from Internet:
DIY, Home Improvement and Gardening Show, http://www.diygardenshow.com/
Do It Yourself in the World, http://www.diyglobal.de/
Do it Yourself Retail, http://www.diyonline.de/
European DIY Retail Association Sales, http://www.edra-online.com/english/index.html
European Statistic Service (EUROSTAT), http://europa.eu.int/comm/eurostat
Global Retail Business, http://global retail business.com
Fediyma, 2011, “World DIY Report 2011”, Germany, http://www.fediyma.com/

International Journal of Information, Business and Management, Vol. 8, No.2, 2016
ISSN 2076-9202
276
Greek Retail, November 2005, Issue315, http://www.hrima.gr/article.asp?view=147&ref=142
Hellastat Nielsen GFK, http://www.nielsen.com/
Hellenic Statistic Service (ESYEE), http://www.statistics.gr/
http://www.hrima.gr/article.asp?view=147&ref=376
IKEA corporate site, http://www.ikea.com/cn/en
Retail Sales Report, (2011), “Greece Retail Sales”, http://www.retailresearch.org/
Naftemporiki, Rearrangement of Greek retailing map, http://www.naftemporiki.gr/news/static/09/03/03/1636094.htm
OECD (2002) GATS: The Case for Open Services Markets. http://www.ingentaconnect.com/
Content/oecd
Planet Retail, http://www.planetretail.com
Retail Commerce, Special Edition, October 2011, www.businessretail.gr
Retail Industry, About.com, http://www.retail-info.com
Wikipedia 2012, Wikimedia Foundation Inc., http://www.wikipedia.com

International Journal of Information, Business and Management, Vol. 8, No.2, 2016
ISSN 2076-9202
277
WOMEN PARTICIPATION IN INDIAN MSMES IN GLOBALIZED
ERA
RAJ KUMAR GAUTAM, Ph.D
Assistant Professor, Punjabi University
Regional Center for IT& Management,
Phase VII, Mohali, India
e-mail : [email protected]
Mobile: +91-9888605310
YOGESH KUMAR
Research Scholar, Punjabi University
Regional Center for IT& Management,
Phase VII, Mohali, India
Mobile 09041833197
ABSTRACT
Empowering women has become the key element in the development of an economy. With women
moving forward, the family moves, the village moves and the nation moves. Hence, improving the status of
women by way of their economic empowerment is highly called for. Entrepreneurial activities transform
the ideas and creativity of aspiring women into business ventures with high potential and growth. This
certainly helps in generating jobs and wealth creation, resulting into a state of well-being and increased
opportunities in the country. As more and more women are getting to know the benefits of entrepreneurial
activity, a silent renaissance is sweeping across all the sectors resulting in larger participation. In spite of the
discrimination against them, women are increasingly taking up the leadership role in economic activity.
The objective of the present paper is to study the status of women entrepreneurs, motivating factors
behind them and various problems for women entrepreneurs in India. The secondary data was collected
from reports, journals, magazines and surfing on the internet. Some of the major problems are women's
family obligations, Gender inequality, Problem of Finance and the male - female competition. The paper
concludes that the problems of women entrepreneurs can be overcome by appropriate training, incentives,
encouragement, motivation, and family’s moral support
Keywords: Women entrepreneur, Motivational factors, Challenges and problems
Introduction
Micro, Small and Medium Enterprises (MSME) sector has emerged as a highly vibrant and
dynamic sector of the Indian economy over the last five decades. MSMEs not only play crucial role in
providing large employment opportunities at comparatively lower capital cost than large industries but
also help in industrialization of rural & backward areas, thereby, reducing regional imbalances, assuring
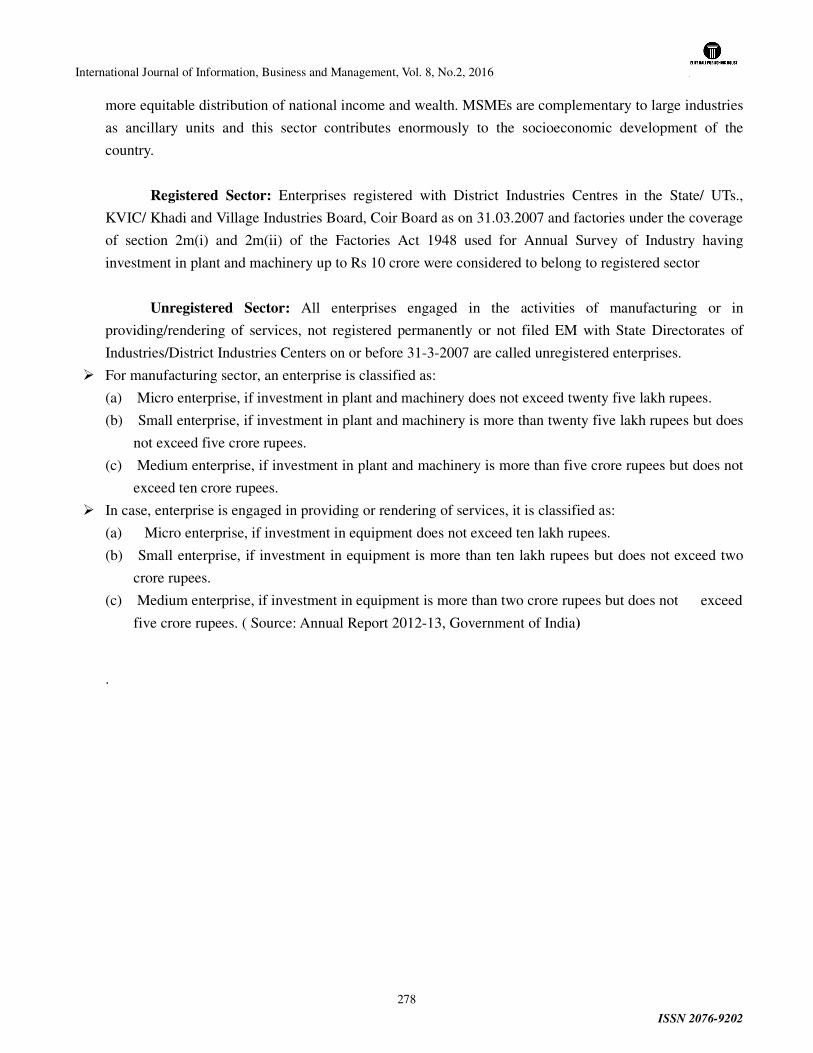
International Journal of Information, Business and Management, Vol. 8, No.2, 2016
ISSN 2076-9202
278
more equitable distribution of national income and wealth. MSMEs are complementary to large industries
as ancillary units and this sector contributes enormously to the socioeconomic development of the
country.
Registered Sector: Enterprises registered with District Industries Centres in the State/ UTs.,
KVIC/ Khadi and Village Industries Board, Coir Board as on 31.03.2007 and factories under the coverage
of section 2m(i) and 2m(ii) of the Factories Act 1948 used for Annual Survey of Industry having
investment in plant and machinery up to Rs 10 crore were considered to belong to registered sector
Unregistered Sector: All enterprises engaged in the activities of manufacturing or in
providing/rendering of services, not registered permanently or not filed EM with State Directorates of
Industries/District Industries Centers on or before 31-3-2007 are called unregistered enterprises.
� For manufacturing sector, an enterprise is classified as:
(a) Micro enterprise, if investment in plant and machinery does not exceed twenty five lakh rupees.
(b) Small enterprise, if investment in plant and machinery is more than twenty five lakh rupees but does
not exceed five crore rupees.
(c) Medium enterprise, if investment in plant and machinery is more than five crore rupees but does not
exceed ten crore rupees.
� In case, enterprise is engaged in providing or rendering of services, it is classified as:
(a) Micro enterprise, if investment in equipment does not exceed ten lakh rupees.
(b) Small enterprise, if investment in equipment is more than ten lakh rupees but does not exceed two
crore rupees.
(c) Medium enterprise, if investment in equipment is more than two crore rupees but does not exceed
five crore rupees. ( Source: Annual Report 2012-13, Government of India)
.
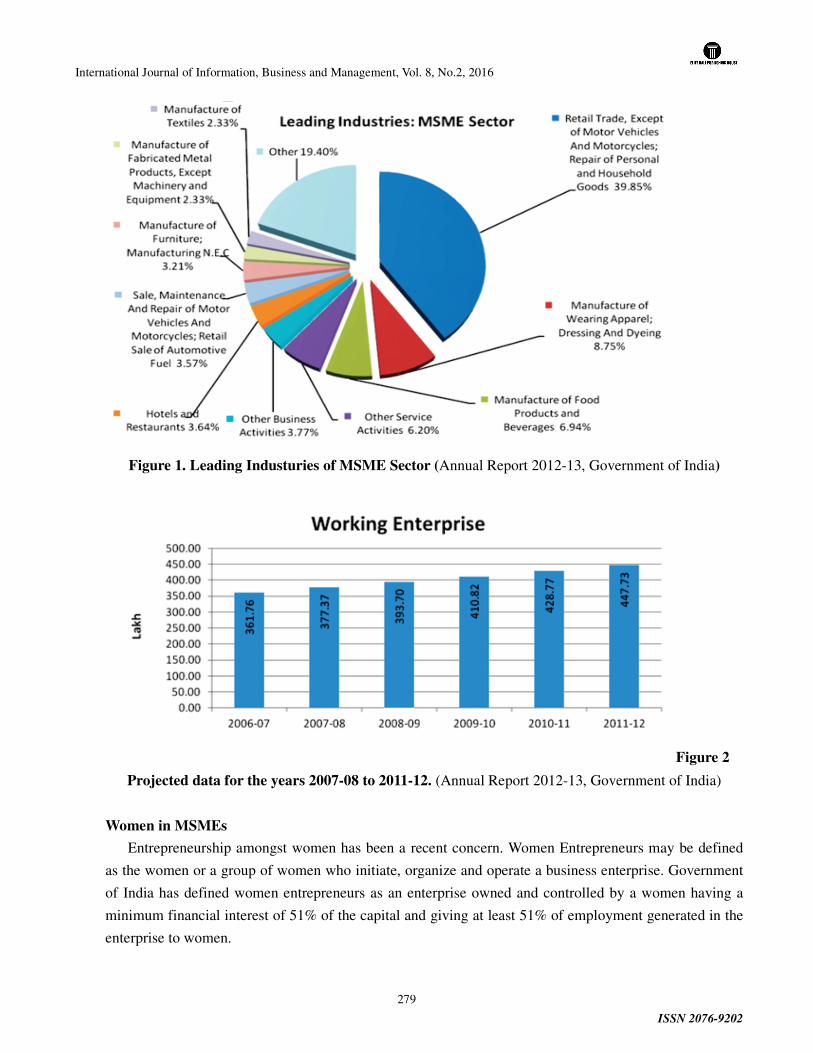
International Journal of Information, Business and Management, Vol. 8, No.2, 2016
ISSN 2076-9202
279
Figure 1. Leading Industuries of MSME Sector (Annual Report 2012-13, Government of India)
Figure 2
Projected data for the years 2007-08 to 2011-12. (Annual Report 2012-13, Government of India)
Women in MSMEs
Entrepreneurship amongst women has been a recent concern. Women Entrepreneurs may be defined
as the women or a group of women who initiate, organize and operate a business enterprise. Government
of India has defined women entrepreneurs as an enterprise owned and controlled by a women having a
minimum financial interest of 51% of the capital and giving at least 51% of employment generated in the
enterprise to women.
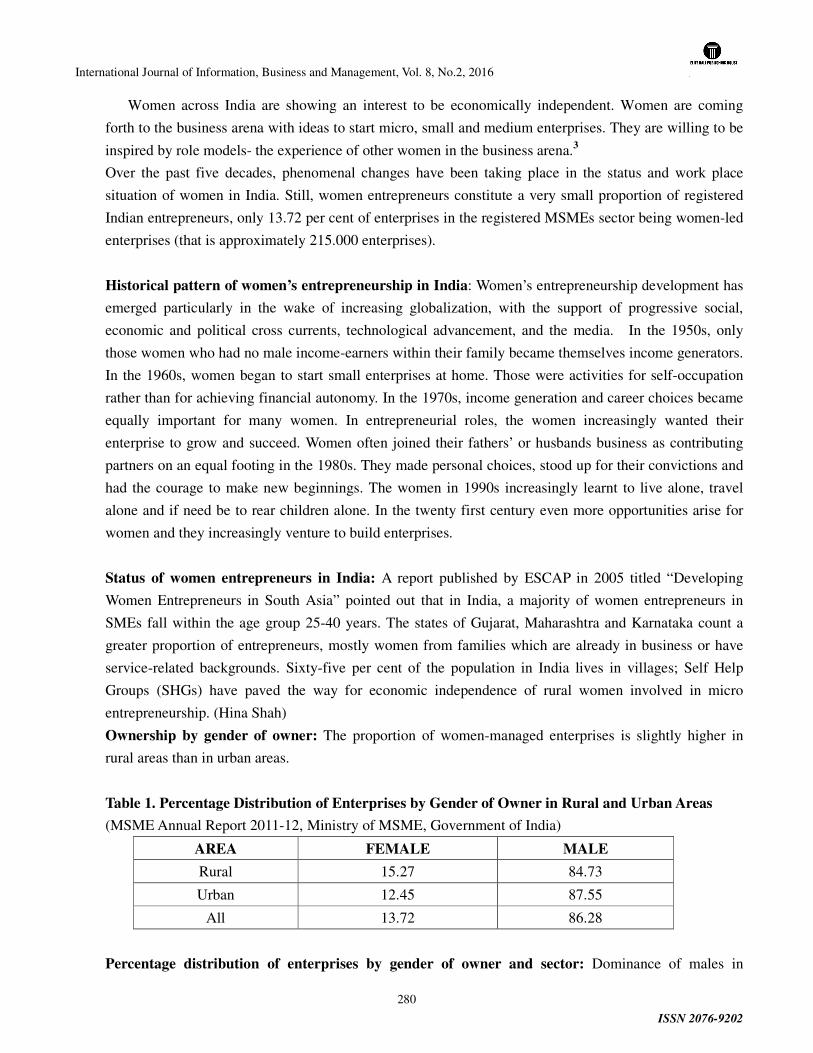
International Journal of Information, Business and Management, Vol. 8, No.2, 2016
ISSN 2076-9202
280
Women across India are showing an interest to be economically independent. Women are coming
forth to the business arena with ideas to start micro, small and medium enterprises. They are willing to be
inspired by role models- the experience of other women in the business arena.3
Over the past five decades, phenomenal changes have been taking place in the status and work place
situation of women in India. Still, women entrepreneurs constitute a very small proportion of registered
Indian entrepreneurs, only 13.72 per cent of enterprises in the registered MSMEs sector being women-led
enterprises (that is approximately 215.000 enterprises).
Historical pattern of women’s entrepreneurship in India: Women’s entrepreneurship development has
emerged particularly in the wake of increasing globalization, with the support of progressive social,
economic and political cross currents, technological advancement, and the media. In the 1950s, only
those women who had no male income-earners within their family became themselves income generators.
In the 1960s, women began to start small enterprises at home. Those were activities for self-occupation
rather than for achieving financial autonomy. In the 1970s, income generation and career choices became
equally important for many women. In entrepreneurial roles, the women increasingly wanted their
enterprise to grow and succeed. Women often joined their fathers’ or husbands business as contributing
partners on an equal footing in the 1980s. They made personal choices, stood up for their convictions and
had the courage to make new beginnings. The women in 1990s increasingly learnt to live alone, travel
alone and if need be to rear children alone. In the twenty first century even more opportunities arise for
women and they increasingly venture to build enterprises.
Status of women entrepreneurs in India: A report published by ESCAP in 2005 titled “Developing
Women Entrepreneurs in South Asia” pointed out that in India, a majority of women entrepreneurs in
SMEs fall within the age group 25-40 years. The states of Gujarat, Maharashtra and Karnataka count a
greater proportion of entrepreneurs, mostly women from families which are already in business or have
service-related backgrounds. Sixty-five per cent of the population in India lives in villages; Self Help
Groups (SHGs) have paved the way for economic independence of rural women involved in micro
entrepreneurship. (Hina Shah)
Ownership by gender of owner: The proportion of women-managed enterprises is slightly higher in
rural areas than in urban areas.
Table 1. Percentage Distribution of Enterprises by Gender of Owner in Rural and Urban Areas
(MSME Annual Report 2011-12, Ministry of MSME, Government of India)
AREA FEMALE MALE
Rural 15.27 84.73
Urban 12.45 87.55
All 13.72 86.28
Percentage distribution of enterprises by gender of owner and sector: Dominance of males in
International Journal of Information, Business and Management, Vol. 8, No.2, 2016
ISSN 2076-9202
281
ownership was prevailing in each of the three segments of MSME sector. Most of the women enterprises
are Micro Enterprises with 14 per cent share in total share of women enterprises. In Small and Medium
segment, it is only 5 per cent and 4 per cent, respectively.
Figure 3 Percentage Distributions of Enterprises by Gender of Owner and Sector
State-wise Entrepreneurship Profile: In India the number of enterprises owned by males was 13,
49,320 compared to 2, 14,650 owned by females, which shows that female only owned about 13.72 per
cent of enterprises in the country. With regards geographical spread of female entrepreneurship across
India, Tamil Nadu has highest numbers followed by Kerala, Karnataka and Gujarat. The lowest number of
women entrepreneurs, are found in Chandigadh, Dadra & Nagar Haveli and Arunachal Pradesh.
State-wise and Area-wise Entrepreneurship Profile in Percentage:
Prior to 2006, MSME sector was known as Small Scale Industries Sector (SSI) and according to 2001- 02
(3rd Census of SSI units), the number of units registered with SSI was 13.74 lakhs of which women
enterprises had a share of 10 per cent. The eastern states of India such as Manipur, Tripura, Meghalaya,
Assam have higher percentage of women enterprises out of the total number of enterprises in India,
followed by southern parts of India – Kerala, Tamil Nadu, Karnataka, Pondicherry. It is observed that
there are marginally higher percentages of women entrepreneurs in rural areas (15.27 per cent) than in
urban areas (12.45 per cent).
Type of enterprise vs. entrepreneurship profile: Out of total female enterprises (2,14,650), almost 98
per cent (2,10,660) are Micro Enterprises, 1.80 per cent are Small and only 0.05 per cent are Medium
enterprises. Thus, the trend is established that in India, the majority women are in micro enterprises
(where the investment is less than INR 25 lakhs in manufacturing industry and less than INR 10 lakhs in
service industry). An insignificant number of women are in medium and small-scale enterprises.
Nature of activity vs. entrepreneurship profile: Majority of women enterprises are in manufacturing
0
10
20
30
40
50
60
70
80
90
100
Micro Small Medium
85.81
94.94 95.79
14.19
5.06 4.21
Male
Female
International Journal of Information, Business and Management, Vol. 8, No.2, 2016
ISSN 2076-9202
282
sector (50.4 per cent) compared to 70 per cent male enterprises in the manufacturing sector. Service
enterprises account for almost 40.9 per cent of female enterprises, as compared with 12 per cent of male
enterprises. The same pattern is depicted in rural and urban areas.
According to Hina Shah, though women-managed MSMEs in India only account for 13.72 per cent of
total registered MSMEs, they have significantly contributed to the growth of the national economy.
Following are their findings:
� The majority (65 per cent) of women entrepreneurs within the sample belonged
to the age group 30 to 49 years, while 30 per cent of them were above 50 years
of age. Most women entrepreneurs surveyed were from urban areas. Some 84
per cent of them were married.
� A prior business background in the family did not appear necessary for women
to start/run a business successfully.
� Most women business owners were previously either house wives. They were
graduates or postgraduates.
� Women respondents appeared to have little concern for making profit and had
often chosen business to forge and assert their own identity. The respondents
also tend to use entrepreneurship as a tool for fulfilling career aspirations. Some
51 per cent of women devoted 25-50 hrs. Per week to their business.
The reasons frequently cited for starting a business were for the sense of self-achievement, for economic
independence, for profit making aspirations and to support their family.
(Source: MSME Annual Report 2011-12, Ministry of MSME, Government of India))
Review of Literature
The following relevant studies have been reviewed for the purpose of study:
Robita and Nandita(2011) explained the main reason of non availability of finance to women is
their inability to provide collateral as they do not have any property on their name. On the other side
women have got restricted mobility freedom and have to perform dual role one at family and other at
work which hinders the entrepreneurial growth. The technological advancement and information
technology explosion has reduced the problem of women entrepreneurs.
Siddiqui (2011) identified that major problems are women's family obligations, Gender inequality,
Problem of Finance, Low-level risk taking attitude, and the male - female competition. The problems of
women entrepreneurs can be eradicated by appropriate training, incentives, encouragement and
motivation, social recognition of their entrepreneurial abilities, and family’s moral support.
Bhatnagar et al (2012) observed that women in India start their own businesses from a desire for
self-determination and for career challenge and that they expect the corresponding respect, recognition,
and self esteem that both self-determination and challenge provide. Women entrepreneurs faced
constraints in aspects of financial, marketing production, work place facility and health problems.
Financial problems faced were non availability of long-term finance, regular and frequent need of
working capital. Poor location of shop and lack of transport facility were major marketing problems.
International Journal of Information, Business and Management, Vol. 8, No.2, 2016
ISSN 2076-9202
283
Gitabali and Shagufta (2013) observed that women have taken up the enterprise mainly to earn
money, which is required for the livelihood of their families. They have the desire to become
economically independent. Financial problems are the main problems for running an enterprise. The other
problems are lack of infrastructure particularly for marketing. Lack of proper government support was
also perceived as one of the problems. Women entrepreneurs are still facing stiff opposition. The
hindrance or objections these respondents faced are mainly because of the attitude among a large sections
of people that women are not supposed to take on such active roles.
V.Darling Selvi (2013) identified problems encountered by the women entrepreneurs range from
finances to market orientation and education. Their inability to understanding the dynamic structure of
market coupled with lack of family support and access to finances are few major reasons which restrict
the growth of their businesses. Moreover, the influence of their family members on their decisions
jeopardizes the performance of their businesses, though; their involvement is helpful in a way that allows
them to transport their products to the market and purchase of the raw material.
Agrawal and Joglekar (2013) studied that total personality of the women was changed. They
developed leadership, marketing, politeness skill from business. The financial status of their families
improved significantly after starting the small scale business. But there is an urgent need of persistent
technical training to these women to improve their overall status.
C.P. Kothawale (2013) identified problems faced by Women Entrepreneurs in setting up and running
business units are less confidence, non-availability of finance, socio-cultural disturbance, lack of
education and awareness, low level of risk taking attitude and competition from male entrepreneurs.
Women entrepreneurs get support and encouragement from family, society, Government and financial
institutions, such positive effort can open new avenues for them.
Objectives:
The study has been conducted with the following objectives:
• To analyze the factors influencing women to become entrepreneurs
• To identify the problems faced by women entrepreneurs in India
• To identify the efforts took by the Government for development of women entrepreneurs
Research methodology:
.The study is based on secondary data. Secondary data have been collected from project documents,
evaluation reports, journals, magazines and surfing on the internet. The data have also been collected
from other relevant web sites of central and state Govts and Ministry of MSME.
Discussion and Analysis
The data collected have been analyzed in three parts comprising i) problems of the women ii)
factors influencing for women entrepreneurship iii) Government efforts for women entrepreneurs
encouragements.
1. Problems of Women Entrepreneurs in India
Keeping in mind the objectives of study, state-wise data have been compared to know the
maximum and minimum participation of women in different states and their common problems. With
respect to this the data have been presented in table 1.

International Journal of Information, Business and Management, Vol. 8, No.2, 2016
ISSN 2076-9202
284
Table 1: Women Entrepreneurship Development in Select Leading States.
States No. of Registered Units No. of Women Entrepreneurs Percentage
Tamilnadu 9618 2930 30.36
U.P 7980 3180 39.84
Kerala 5487 2135 38.91
Punjab 4791 1618 33.77
Maharashtra 4339 1394 32.12
Gujarat 3872 1538 39.72
Karnataka 3822 1026 26.84
M.P 2967 842 28.38
Other States and
UTs
21920 5308 24.22
Total 64796 19971 32.82
The analysis of data in Indian states shows that UP has got the highest percentage of 39.84 in number
of women entrepreneurs followed by Gujarat which secures 39.72%. Punjab stands fourth in respect to
women entrepreneurs. Whereas state of Karnataka has the lowest women entrepreneurs, i.e., 26.84% only.
The literature review also shows that women work participation in India is 31.6% whereas in USA it is
45%, UK 43%, Canada 42%, Indonesia 40%, France 38%, Sri Lanka & Brazil both 35%. The low
participation of women in India is due to following main problems :
� Socio-cultural barriers – Women’s family and personal difficulties are sometimes a great barrier
for succeeding in business career. Very few women are able to manage both home and business
efficiently.
� Market-oriented risks – Due to tough competition in the market and lack of mobility of women
make the dependence of women entrepreneurs on middleman indispensable. Many business
women find it difficult to capture the market and make their products popular. Sometimes, women
entrepreneurs are not fully aware of the changing market scenario and hence are not able to utilize
the services of media and internet.
� Lack of confidence – Women lack confidence in their strength and competence in Indian society.
The family members and the society are reluctant to support their entrepreneurial growth.
International Journal of Information, Business and Management, Vol. 8, No.2, 2016
ISSN 2076-9202
285
However, this situation is changing among Indian women and yet to face a tremendous change to
increase the rate of growth in entrepreneurship.
� Knowledge in Business Administration – Lesser educated and untrained women in India need to
acquire the skills and knowledge in all the functional areas of business management. This alone
can enable women to excel in decision making process and develop a good business network.
� Awareness about the financial assistance – Although there are various institutions in the financial
sector which extend their maximum support in the form of incentives, loans, schemes etc. Even
then every woman entrepreneur may not be aware of all the assistance provided by the institutions.
Also, such sincere efforts taken towards women entrepreneurs do not reach the entrepreneurs in
rural and backward areas, effectively.
� Exposure to the training programs - Training programs and workshops for every type of
entrepreneur is available through the social and welfare associations, based on duration, skill and
the purpose of the training program. Such programs are really useful to new, rural and young
entrepreneurs who want to set up a small and medium scale unit on their own. But still, these
programs are not able to reach a mass level of women entrepreneurs.
� Identifying the available resources – Women are hesitant to find out the access to cater their needs in
the financial and marketing areas. In spite of the sporous growth of associations, institutions, and the
schemes from the government side, women are not enterprising and dynamic to optimize the
resources in the form of reserves, assets mankind or business volunteers.5
2.Factors which influence women to become entrepreneur:
The analysis of collected data indicates that women are encouraged to become the entrepreneurs due to
factors such as:
� Economic independence:
In India, nowadays, women are showing an interest to be economically independent. Women are
coming forth to the business arena with ideas to start micro, small and medium enterprises. They look out
to become role models through their experience in the business arena.
� Establishing Self identity:
The long said differences between a man and a woman are becoming a burden for society in the
current times. In the developing India, women are seeking opportunities to reveal their identity as stronger
and stable as compared to men.
� Need for additional income:
In many rural areas like villages and towns, women need additional money to support their family,
children and elders. Thus in rural areas there are many options of farming, handlooms etc. which can help
in starting MSMEs and further providing that extra income.
• Building confidence and Risk taking ability
Being an entrepreneur provides the factor of confidence in women. Entrepreneurship makes a woman to
take risks at medium to higher level in this high end society which is also being encouraged in the society
and by Government also.
International Journal of Information, Business and Management, Vol. 8, No.2, 2016
ISSN 2076-9202
286
� Motivation and Status Equality
Entrepreneurship through MSMEs surely motivates a woman to stand apart from the men and also
support their children and family in future.Being an entrepreneur helps a woman reach an equal status
with men in our patriarchal society.
3.Government efforts to support women MSME entrepreneurs:
Although women have played a key role in the society; their entrepreneurial ability has not been
properly viewed due to the lower status of women in the society. It is only from the Fifth Five Year Plan
(1974-78) onwards that their role has been explicitly recognized with a marked shift in the approach from
women welfare to women development and empowerment. The development of women entrepreneurship
has become an important aspect of the five year plan priorities. Several policies and programmes are
being implemented for the development of women entrepreneurship in India. In the words of president
APJ Abdul Kalam "Empowering women is a prerequisite for creating a good nation, when women are
empowered, society with stability is assured. (Annual Report 2011-12, MSME, Government of India)
Mahila Coir Yojana: The Mahila Coir Yojana is the first women oriented self employment
Scheme in the coir industry which provides self-employment opportunities to the rural women artisans in
regions producing coir fibre. The Scheme envisages distribution of motorized ratts to women artisans
after giving training for spinning coir yarn. The women spinners are trained for two months in spinning
coir yarn on motorised ratt at the Board's Training Centres. A stipend of Rs.500/- is paid to the trainee
which has been raised to Rs. 750/- per month. (Jayan V.K, 2013)
Several other schemes of the government at central and state level exist, which provide assistance
for setting up enterprises for women to make them economically independent. 13- Significant schemes
are prevalent in the states of Kerala, Tamil Nadu, Goa and Haryana for the development of women
entrepreneurs. Those women-specific schemes are: Scheme for Women Entrepreneurs to set up Industrial
Units: Kerala, Entrepreneurship Development Programme for Women: Tamil Nadu, Women's
Training-cum- Production Centres and Stipend: Haryana, Swayamsidha (Indira MahilaYojna): Haryana
and Incentives to Women Entrepreneurs Scheme, 2003: Goa.
In 2010, The National Mission for Empowerment of Women was launched by the Government of
India in order to strengthen overall processes that promote all-round development of women. The
National Resource Centre has been set up which functions as a national convergence centre for all
schemes and programmes targeting women. Some of its focus areas are skill development, micro credit,
vocational training, entrepreneurship and self-help group development. (Hina Shah, 2010)
Some of the organizations that are associated with MSMEs: Small Industries Development
Organisation (SIDO), Small Scale Industries Board (SSIB), National Small Industries Corporation Ltd.
(NSIC), Confederation of Indian Industry (CII), Federation of Indian Chamber of Commerce and Industry
(FICCI), PHD Chamber of Commerce and Industry (PHDCCI), Associated Chamber of Commerce and
Industry of India (ASSOCHAM), Federation of Indian Exporters Organisation (FIEO), World Association
for Small and Medium Enterprises (WASME), Federation of Associations of Small Industries of India
International Journal of Information, Business and Management, Vol. 8, No.2, 2016
ISSN 2076-9202
287
(FASII), Consortium of Women Entrepreneurs of India (CWEI), Laghu Udyog Bharti (LUB), Indian
Council of Small Industries (ICSI), Indian Institute of Entrepreneurship (IIE), National Institute of
Small-Industry Extension Training (NISIET), National Backward Caste Finance Development
Corporation, National Institute for Entrepreneurship and Small Business Development (NIESBUD),
Small Entrepreneurs Promotion and Training Institute (SEPTI), Small Industries Development Bank of
India (SIDBI) etc. (AmanDeep Singh, 2013)
Exhibitions for women under promotional package for micro & small enterprises: Approved by
CCEA under marketing support DC (MSME) has formulated a scheme for women entrepreneurs to
encourage small & micro manufacturing units owned by women and register in DI/DIC in their efforts at
tapping and developing overseas markets, to increase participation of representatives of small/micro
manufacturing enterprises under MSME stall at international trade fairs/exhibitions, to enhance export
from such units. Under this scheme, participation of women entrepreneurs in 25 international exhibitions
is envisaged during the 11th plan (2007-2012). (Shiji shukla, 2012).
Conclusion
Women share 50% population of India; have an important role to play as far as economic
development of country is concerned. The Government has understood the importance of women and
launched various schemes and programs for their participation in economic activities. The Indian society
is also shifting its conservative attitude to progressive attitude. So, women are getting more opportunities
not only in entrepreneurial work but also in other domains of human life keeping pace in this Globalized
Era. Women should be encouraged to avail the benefits of policy measures introduced by the Government
to promote the status and level of women entrepreneurs in the country. Increased support should be
provided by the Government to help women entrepreneurs in order to overcome the challenges faced by
them. Women entrepreneurs also require support from their family and society. They should be provided
easy financial help without putting unrealistic conditions by banks and financial institutions. If women
entrepreneurs get support and encouragement from family, society, Government and financial institutions,
such positive effort can open new ways for them and increase the marketability and profitability of
business owned by them. If the problems of women entrepreneurs are understood properly, they can
become successful entrepreneurs.
References:
• Annual Report 2012-13, Government of India, Ministry of MSMEs, www.msme.gov.in • Annual Report 2011-12, Government of India, Ministry of MSME, www.msme.gov.in • Agrawal A., Joglekar A. (2013) “Role of Women in 21st Century” Research Journal of Family,
Community and Consumer Sciences” Vol. 1, Issue 2, pp. 14-17 • Bhatnagar Ashima, Bhardwaj Broto R., Gandhi Shikha (2012) “Problems and Challenges faced by
Women Entrepreneur in India” Opinion: International Journal of Management, Vol. 2, No. 1, pp. 1-8
• Jayan V.K (2013) “Women Entrepreneurship In Msme (With special reference to Coimbatore City)” International Journal of Advanced Research, Vol. 1, Issue 4, pp. 321-325
International Journal of Information, Business and Management, Vol. 8, No.2, 2016
ISSN 2076-9202
288
• Kaneria Falgun (2012) “Women Entrepreneurs in India” Indian Journal Of Applied Research, Vol. 2, Issue 2, pp. 21-23
• Kothawale C.P. (2013) “Women Entrepreneurship Development: Problems & Prospects” Sanshodhan Kranti International Multidisciplinary Research Journal, Vol. 2, Issue 1, pp. 1-8
• Selvi V.Darling (2013) “Plight of Women Entrepreneurs in the Globalised Era” Indian Journal of Applied Research, Vol. 3,Issue : 8, pp. 122-124
• Shah Hina (2013) “Creating an Enabling Environment for Women’s Entrepreneurship in India” Economic and Social Commission for Asia and the Pacific
• Shukla Shiji, Narang Shweta, Goreja Mahak (2012) “Women Empowerment With Entrepreneurship: A Study Of Entrepreneurial Empowerment Initiatives In The Country” International Journal of Multidisciplinary Management Studies, Vol. 2, Issue 7, pp. 76-96
• Siddiqui A.B. (2012) “Problems Encountered by Women Entrepreneurs in India” International
Journal of Applied Research & Studies, Vol. 1, Issue 2, pp. 1-12 • Singh AmanDeep, Rana Manisha (2013) “Women Entrepreneurs in Micro, Small and Medium
Enterprises, International” Journal of Management and Social Sciences Research, Vol. 2, No. 8, pp. 4-8
• Sorokhaibam Robita, Laishram Nandita (2011) “Women Entrepreneurship in Manipur, North-East India” Interdisciplinary Journal of Research in Business, Vol. 1, Issue 5, pp. 46-53
• Thangjam Gitabali, Jamal Shagufta (2013) “Women Entrepreneurs in Delhi: Purpose and Problems” International Journal of Entrepreneurship & Business Environment Perspectives, Vol. 2, No. 3, pp. 596-599
International Journal of Information, Business and Management, Vol. 8, No.2, 2016
ISSN 2076-9202
289
ENABLING AND STIMULATING ENTREPRENEURSHIP EDUCATION
IN HIGHER EDUCATION INSTITUTIONS: CATALYST FOR
VENTURESOME YOUTHS AND SUSTAINABLE DEVELOPMENT IN
NIGERIA
Oluwasanya Adewale Tony
Dean, School of Management Science, DSAdegbenro ICT Polytechnic, Eruku,
Itori-Ewekoro, Ogun State, Nigeria.
P.O.BOX 507, Ota post office, Sango Ota, Ogun State, Nigeria, West Africa.
Tel: 234-8033380198, 8028233332, 8055221725
Email: [email protected]
Abstract
Entrepreneurship is increasingly being recognized as a significant conduct for bringing about a
transformation to sustainable products and processes, with numerous high-profile thinkers advocating
entrepreneurship as a panacea for many social and environmental concerns. Yet, despite the promise
entrepreneurship holds for fostering sustainable development, there remains considerable uncertainty
regarding the nature of entrepreneurship’s role in the area, and the academic discourse on sustainable
development within the mainstream entrepreneurship literature has to date been sparse. While
entrepreneurs have long been recognized as a vehicle for exploiting emerging opportunities associated with
societal need, we have little understanding of how entrepreneurs will discover and develop those
opportunities that lie beyond the pull of existing markets. Thus, while the case for entrepreneurship as a
panacea for transitioning towards sustainable development society-wide is valid, there exists major gaps
in our knowledge of whether and how this process will actually unfold. This paper focuses on:
� Factors that challenge the teaching of entrepreneurship education within the Higher Education
Institutions to engender sustainable development and venturesome youths;
� Strategies to employ in addressing these challenges. Factors that Challenge the Teaching of
Entrepreneurship Education in Higher Education Institutions;

International Journal of Information, Business and Management, Vol. 8, No.2, 2016
ISSN 2076-9202
290
� Imperatives and outcomes of entrepreneurship education and the state of entrepreneurship
education in Higher Education Institutions.
Keywords: Entrepreneurship, Entrepreneurship Education, Venturesome Youths Sustainable
Development, Higher Education Institution
1. INTRODUCTION
The world is experiencing one of the most extraordinary periods in history. The power equation
continue to shift across countries and regions while rapid changes unfold in the marketplace reshaping
both the political landscape and the interactions between governments and businesses. The financial crisis,
coupled with rising inflation and the consequent lull in global demand, has engendered significant
insecurity about the outlook of the world economy and increased anxiety about its potential implications
on the accomplishment of the Millenium Development Goals by 2015. However, it is in difficult times
when the power of collaboration bears fruit, helping us better understand the challenges we face and
encouraging us to unleash our imagination and capitalize on the opportunities ahead. Entrepreneurship
and education are two such extraordinary opportunities that need to be leveraged and interconnected if we
are to develop the human capital required for capacity and capability building country wide.
Entrepreneurship is the engine fuelling innovation, employment generation and economic growth. It is the
necessary lubricant that oils the wheel of progress economy-wide. Thus, it is only by creating an
environment where entrepreneurship can prosper and where entrepreneurs can try new ideas and
empower others can we ensure that many of the world’s issues will not go unaddressed. Equally important
is the power that education has in developing the skills that generate an entrepreneurial mindset and in
preparing future leaders for solving more complex, interlinked and fast-changing problems. Education
needs to come back to the top of the priorities of governments and the private sector and be seen as the
fundamental mechanism for attaining sustainable economic development and societal advancement. More
than ever, the world needs effective global leaders and stronger educational systems that prepare the
current and future generations of entrepreneurs, workers, teachers, managers and individuals with the
skills needed to succeed and help others. The need for entrepreneurship education started emerging in the
International Journal of Information, Business and Management, Vol. 8, No.2, 2016
ISSN 2076-9202
291
mid 1980s. This is because before this period, unemployment and poverty were not a national concern as
it is currently. However, political instability, policy shifts, policy reversals, policy somersault and
consistently inconsistent gamut of social and economic policies of successive government led to the
emergence of high level unemployment in Nigeria. In the mid 8Os, the Nigerian economy collapsed,
while youth and graduate unemployment was on the high side. There was large-scale layoff of workers
and early retirements as a result of structural adjustment policies and bad economic trends in the country.
In the face of this situation, entrepreneurship, which would have salvaged the situation, was not
encouraged.
It has been observed that tertiary education has not been p roperly included in the philosophy, of
self-reliance such us creating _a new cultural and productive environment that will promote pride in
primitive work and encourage people to take part actively in entrepreneurial activities and participate
actively in discussions and decisions affecting their general welfare while promoting new sets of attitudes
and cultural values for the attainment of’ future challenges. Oluwasanya (2013) opined that the failure
of higher education institutions to institutionalize and inculcate venture-some and enterprising
behaviour in undergraduates has led to wastages in terms of both human and natural resources. To be
enterprising is to keep your eyes open and your mind active. It is having a paradigm shift , requisite skills,
confidence, creativity, passion and possibility mentality to create and seize business opportunities so as to
translate into new venture creation and new products or services to the market. This is because the youth
and graduate from tertiary institutions are not equipped with the skills with which to exploit the natural
resources that bound in Nigeria. Sustainable development has emerged as an influential, yet
controversial concept for business and policy. There are observed awareness Nigeria-wide that a
fundamental transformation in the way society consumes natural resources and produce energy may be
required if we are to make progress in pressing environmental issues such as ecosystem degradation and
global climate change. With this in context, entrepreneurship is increasingly being dangled as the
pertinent source and solution to facilitate sustainable products and processes. Despite the promises
entrepreneurship holds in engendering sustainable development, there are some observed uncertainty as
regards the nature of entrepreneurship roles in the area of sustainability and how it may manifest. The
whole idea of entrepreneurship is about self employment which will generate employment opportunities
to others that must work with him as he cannot work alone. Therefore, it is possible to suggest that
entrepreneurship education concerns entrepreneurs, entrepreneurial /enterprising process and as an
outcome, the enterprise of whatever context or conceptual content it relates to as well as the dynamics
between them. Consequently, revising the terminology of entrepreneurship education from the
International Journal of Information, Business and Management, Vol. 8, No.2, 2016
ISSN 2076-9202
292
perspective of education, it is possible to focus the debate on its core element and identify its key
dimension as Scott el al. (1998) recommends. Taking the entrepreneurship as a point of departure, key
dimensions concern the interplay between the actor, the process and the outcome. This paper reviews
the factors and challenges inherent in the teaching of entrepreneurship education in Higher
Education Institutions. It further elucidates the strategies to employ in addressing the challenges
and enhancing the teaching of entrepreneurship education within the entire academic precinct of
the Higher Education Institutions in Nigeria.
2. Conceptual Framework
Within the first decade of Nigeria’s independence (1960 – 1970) the country was mainly agrarian; it thus
depended on agriculture both for local sustenance and foreign exchange generation. The education system
was directed at production of graduates for government employment. It thus continued graduating
students without taking cognizance of the labour
market. The matter of unemployment and poverty were not issues of national concern. The economy
though monolithic was flourishing. The public service at that time was capable of absorbing up to 70% of
the labour force. The economy progressed and was further reinforced by the oil boom of the1970’s.
However, the trend changed by 1980’s when following political instability and inconsistencies in the
socio-economic policies of governments the economy began to crumble. There was unmanageable
escalation in the rate of unemployment and poverty. As a result the country experienced collapse of
several business enterprises, high rate of retrenchment and retirement of workers. The menacing problem
of unemployment and poverty spurred the Nigerian government into developing a policy framework for
youth entrepreneurship education. This saw the birth of the National Directorate of Employment (NDE)
in 1986, and the Work For Yourself Programme (WFYP) in 1987. Both programmes were joint
programmes of training and financial support to entrepreneurs. The NDE was however more extensive
and included three core programmes namely the Youth Employment and Vocational Skills Development
Programme; the Agricultural Programmes, and the Small Scale Industries and Graduate Employment
Scheme. It was charged with a number of responsibilities including the following:
a) to create employment opportunities and thereby reduce unemployment among youths and university
graduates in the country
b) to provide an enabling atmosphere for self reliance
c) to foster entrepreneurship
Both the NDE and WFYP made impacts on the economy as they were able to empower young graduates

International Journal of Information, Business and Management, Vol. 8, No.2, 2016
ISSN 2076-9202
293
in the task of job and wealth creation through entrepreneurial thinking. However, the youths were also
confronted with the problem of non-possession of sound knowledge of entrepreneurship. In an effort to
fill this gap the NDE introduced the Entrepreneurship Development Programme (EDP) which has as its
principal function the offering of functional education for the youth to enable them to be self employed
and self reliant. This marked the beginning of policy statements encouraging the teaching of
entrepreneurship education in Nigeria. These efforts notwithstanding the problem of graduate
unemployment continued to soar high and constituted a major problem of the Nigerian nation. It could
therefore be logical to say that tertiary education in Nigeria failed to meet the employment requirements
of its teeming graduates. In order to further address this issue, the Federal Government of Nigeria
launched the National Economic Empowerment and Development Strategy (NEEDS) with the vision of
equipping youths with various skills to make them self reliant and consequently make poverty a thing of
the past in the country. In order to realize this vision, NEEDS focused on four key strategies: namely;
reorienting values, reducing poverty, creating wealth and generating employment. (National Planning
Commission, (NPC) 2005). To ensure co-ordination, it was matched with endorsement by states as well as
a commitment to the development of their own State Economic Empowerment Strategy (SEEDS) (NPC
2005). Consequently, the National Universities Commission recently introduced Entrepreneurship as a
course into the curriculum of Universities in Nigeria. The aim was to challenge and equip its graduates
with entrepreneurial skills. While the progress is impressive it is still quite limited.
A vast majority of Nigerians especially young graduates still cannot easily access entrepreneurship
education and entrepreneurship resources. Identifying the elements of entrepreneurship education starts
by looking at the terms used for it. A study conducted in 1989 by Durham University Business schools
identified different between terms in the USA, Canada ,UK and other USA and CANADA whereas the
terms ‘enterprises education’ was used in the UK and Finland, revealed difference in terms (Erkkila
2000). In order to avoid conceptual confusion Erkkila suggest that we should use a single concept of
entrepreneurial education’. Allan Gibb posits that there is a substantial synonymity between
entrepreneur and enterprising behaviours. The only major distinction that can be made is that an
entrepreneur actor is traditional associated with business activity (Gibb, 1993). In his later writing
Gibb (2001) has started to use these terms synonymously. The concept of entrepreneurship is associated
with a number of activities including the following:
a) the ability to create and build something from nothing
b) the ability of having a vision matched with focus and determination of
building an enterprise.
c) the skill for seeing an opportunity where others fail to do so.
d) the ability to build a working team to complement your own talents
and efforts
e) the ability to aggregate, marshal and control resources judiciously
f) the willingness and ability of innovativeness and creativity
g) the willingness to undertake personal and financial risks
h) the ability to engage in activities despite all odds and in fact surmounting these odds and possibly turn
International Journal of Information, Business and Management, Vol. 8, No.2, 2016
ISSN 2076-9202
294
them into your own favours.
3. Literature Review
Education is the acquisition of knowledge, the aggregate of all processes through which a person
develops ability, attitudes and other forms of behavior with positive values in the Society in which he
lives. Fafumwa (1991) describes education as all efforts, conscious and direct, incidental and indirect,
made by a given society to accomplish certain objectives that are considered desirable in terms of the
individual's own needs as the needs of the society where that education is based. But Erder (1966) regards
it as a manpower industry producing the knowledge and skills necessary for development. Education is
derived from the needs and demands of the society thus it is seen as a microscopic reflection of the total
society needed for both stability and continuity. Entrepreneurship is the ability to create and build
something from practically nothing. It is initiating, doing, achieving and building an enterprise or
organization, rather than just watching, analyzing, or describing one. It is the knack for sensing an
opportunity where others see chaos, contradiction and confusion. It is the ability to build a “founding
team” to complement your own skills and talents. It is the know-how to find, marshal and control
resources (often owned by others) and to make sure you don’t run out of money when you need it most.
Finally, it is the willingness to take calculated risks, both personal and financial, and then do everything
possible to get the odds in your favour.
Entrepreneurship refers to an individual's ability to turn ideas into action. It covers creativity,
innovation and risk taking, and the ability to plan and manage projects in order to achieve objectives.
This supports everyone in day-to-day life at home and in society, makes employees more aware of the
context of their work and better able to seize opportunities, and provides a foundation for entrepreneurs
setting up social or commercial activities.
From the foregoing, this book seeks to contribute the under-listed acronym to the term
entrepreneurship:
E:xamine needs, wants, and problems.
N:ote and narrow down the possible opportunities to one specific "best" opportunity.
T:otal commitment with high work ethics
R:eliable and passionate
E:nterprising personality and behaviour
P:roactive and pragmatic
R:elationship Management expert
E:nergetic and competitive by nature
N:ever allow reactivity or limiting belief
International Journal of Information, Business and Management, Vol. 8, No.2, 2016
ISSN 2076-9202
295
E:mphasise on key performance indicators and critical success factors of the business.
U:nderstanding of the need for commitment and high work ethics.
R:ealistic and positive accomplishment and creative destruction
S:eized by passion to make things happen positively for the business.
H:ighly focused and motivated
I:nnovator with inner drive for success.
P:ossibility mentality
Source: Oluwasanya A.T (2012)
Entrepreneurship education is a relatively new academic discipline. It is multidisciplinary in nature,
having strong emphasis in economics, covering business disciplines like management, marketing, and
finance; and closely linking with other disciplines like psychology, sociology, anthropology, teacher and
business education. It goes beyond textbooks teachings and involves a wide spectrum of life ideas
drawing practically from life experiences. Although its development is quite recent, the phenomenon has
been recognized as a key factor in economic growth of any nation. Entrepreneurship Education is
therefore that education which assists students to develop positive attitudes, innovation and skills for
self reliance, rather than depending on the government for employment, this will in-turn produce
graduates with self confidence and capacities for independent thought to discover new information
leading to economic development (Emeraton, 2008). Entrepreneurship education is the type of
education designed to change the orientation and attitude of the recipients and the process will equip
them with die skills and knowledge to enable them start and manage a business (Agu, 2006). Agreeing
with Emeraton (2008), he opined that entrepreneurship education aims at developing the requisite
entrepreneurial skills, attitudes, competencies, and disposition that will predispose individual to be a
driving force in managing a business. Akpomi (201)9) also holds the view that entrepreneurship
education focuses on developing understanding and capacity for pursuit of entrepreneurial behaviours,
skills and attitudes in widely different contexts. He continued that this type of education is open to all
and not exclusively domain of the some self acclaimed business gurus. He concluded that these
behaviours can be practiced, developed and learned therefore it is important to expose all students to
entrepreneurship education. Osuala (2010) defined entrepreneurship education as a programme or part of
a programme that prepares individuals to undertake the formation and or operation o£ small business
enterprises which also includes franchise operations for the purpose of performing all business functions
relating to a product or service with emphasis on social responsibilities, legal requirement and risks for
the sake of profit involved in the conduct of private business enterprises. From the above definition, it is
evident that entrepreneurship education could turn around the economic fortune of Nigeria by providing
jobs and reduce the unemployment rate in Nigeria hence reducing the poverty level of Nigerians. It could
also help an individual to identify investment opportunities and help them to harness untapped natural
International Journal of Information, Business and Management, Vol. 8, No.2, 2016
ISSN 2076-9202
296
resources in Nigeria in order to produce the goods and services needed in the country. These will no doubt
reduce or eliminate poverty and help to increase per capital income in the country which is one of the
cardinal points of Millennium Development Goals (MDGs). Despite controversies surrounding it,
sustainable development has emerged as an increasingly influential concept in managerial and academic
settings. Sustainability has become a mainstay of corporate strategy, with nearly every major firm having a
vice-president level executive with “sustainability” in his or her title. Most large firms now have explicit
public sustainability policy statements and claim to apply a “triple bottom line” that considers a firm’s
financial, environmental, and social performance (Elkington, 1998). All manner of waste reduction and
resource reduction and resource substitution are rewarded as symbols of good corporate citizenship
( Clelland et al. 2000). In many circles, the term “corporate sustainanbility” has become a synonym for
“corporate social responsibility”.The term "sustainable development" was first muted at the United Nations
Conference on the Human Environment in 1972 and later gained prominence by way of a report to the
United Nations by the World Commission on Environment and Development (WCED.lQ87). The definition
emerging from the report, "Sustainable development is development that meets the needs of the present
generation without compromising the ability of future generations to meet their unmet needs"
At its core is the notion that all natural systems have limits, and that human well-being requires living
within those limits. Sustainable development implies that renewable resources should be applied
whenever possible and societies could somehow have their cake and eat it too and that the opportunities
to develop in ways consistent with all three objectives (social, environment and economic) are bountiful -
the assumption being that firms and nations could utilize resources in such a way as to promote
abundance for current generations without sacrificing opportunities for the future ones. This assumption
grew out of a desire to promote equitable distribution of the benefits of economic growth, This desire
emerged from the realization that resources were growingly insufficient to allow the so-called developing
world to develop along the same lines as the first world.
International Journal of Information, Business and Management, Vol. 8, No.2, 2016
ISSN 2076-9202
297
Objectives of Entrepreneurship Education
Entrepreneurship education according to Oluwasanya (2013) is structured to achieve the following
objectives.
1. To offer functional education for the youth dial will enable them to be self-employed, self-reliance and
subsequently encourage them to drive profit and be self-independent.
2. Offer tertiary institution graduates with adequate training in risk management, creativity, innovativeness
in identifying new business opportunities and support necessary to help them establish a career in small
and medium size business
3. To inculcate the spirit of perseverance and possibility mentality in the youths and adults which will enable
them to persist in any business venture they embark on.
4. To serve as a catalyst for economic growth and development.
5. To stimulate industrial and economic growth of rural and less developed area.
6. To reduce high rate of poverty.
7. Stimulates job creation.
8. Employment generation.
9. Reduction in rural-urban migration.
10. Create smooth transition from traditional to a modem industrial economy.
Not everyone needs to become an entrepreneur to benefit from entrepreneurship education, but all
members of society need to be more entrepreneurial. The public sector, private sector, academia and
non-profit sectors all have roles to play in facilitating the development of effective ecosystems that
encourage and support the creation of innovative new ventures.

International Journal of Information, Business and Management, Vol. 8, No.2, 2016
ISSN 2076-9202
298
Challenges of Entrepreneurship Education
There are several factors that challenge the teaching of entrepreneurship education in higher education
institutions notably;
a) Nigeria's macro-economic environment is unhealthy and unstable for a virile entrepreneurship
development
b) The fear of failure by the people to take risk on entrepreneurial activities, bile an unstable and
conducive political environment drives away investor that are planning to embark on
entrepreneurial activities.
c) In addition, government programmes are not designed to promote entrepreneurship and
enterprising behaviour,
d) The level of infrastructural development provided by the government is still very low and this has
been affecting to a very high extent the level of entrepreneurial activities in the country.
e) The high rate of many business enterprises as winding up prematurely consequent upon the
employable and unemployable youths and adults idle away. It is against this backdrop that this
paper set to leek into entrepreneurship education as imperative for sustainable development in
Nigeria.
f) There should be some form of genuine school work based learning incorporated in some studies as
part of the national economic development strategies. The development of apprenticeship scheme
would give new graduates some work skills and experience.
g) Poor local public and private funds to create a small venture capital fund.

International Journal of Information, Business and Management, Vol. 8, No.2, 2016
ISSN 2076-9202
299
h) Absence of school-based enterprises where students identify potential business, plan, create and
operate small business using the school as mini-incubators.
i) Absence of venture-some or enterprising behaviour: The polytechnic, students and educators must
develop an enterprising or venture-some behaviour such as opportunity orientation, commitment
to opportunity orientation, commitment of resources etc
j) Competency of Educators: Weidman (1977) defined competency as an attitude, behaviour, skill
or understanding demonstrated by a learner at a specified level of performance. The current
situation is that most lecturers have not been trained in entrepreneurship. Consequently, they
may be unaware of the right approach to entrepreneurship teaching. Teachers should have a
better understanding of entrepreneurship education and the range of aims, methods and contents
of it. There is need to train the trainers through local and international seminars and workshops
and to disseminate understanding of different ways and methods to support the entrepreneurial
mindset.
k) There seems to be in general a gap between the teaching methods considered to be most
effective for fostering entrepreneurship education and those that are currently used. In many
cases, on the job training on entrepreneurship is provided by external organizations delivering
programmes to Higher Education Institutions. Higher Education Institution’s educators who
are not competent in entrepreneurship education may not be able to teach it. Entrepreneurship
Education is new in Higher Education Institution’s curriculum and it is obvious that most of
the lecturers may not be competent to teach it.
l) Lack of an interdisciplinary way of working on concrete projects. Opportunities are missed
when teachers prefer to focus on their own courses rather than to consult with other teachers and
propose a wider integration of different learning subjects.
m) Absence of relevant textbooks: Since entrepreneurship education is a new inclusion into Higher
Education Institution’s curriculum, there is also the problem of lack of adequate textbooks on it.
This has really challenged the teaching of the course in polytechnics and other higher education
institution.
n) Inadequate Enablers: It is quite glaring that most polytechnics and other higher education
institutions have not been able to provide adequate facilities and equipment to cope with the
increasing enrolment of students.
o) Inadequate Funding : Inadequate funding of Higher Education Institutions has often affected
the teaching and learning of Entrepreneurship. It is the major reason for inadequate facilities and
equipment in the institution.
International Journal of Information, Business and Management, Vol. 8, No.2, 2016
ISSN 2076-9202
300
p) Poor enterprise culture: Due to lack of adequate training centres and enterprises, students are faced
with the problems of getting appropriate establishment to gain experience. They end up attaching
themselves to roadside vendors and entrepreneurial ventures where they often acquire wrong
enterprising culture and skills. This is contrary to the goals of students' Industrial Work
Experience Scheme (SIWES) which is expected to provide students with opportunities of
exposure to practical experiences and relating the knowledge and skills learnt in the classroom to
the business parlance
The list is endless but it sums up the in-explainable realities of our prevailing predicaments.
Educational for Sustainable Development
Education for Sustainable Development is the focus or projection of education that seeks to equip people
towards creating a sustainable future. Stakeholders such as government, businesses, educational
institutions, media, and organizations play pertinent roles in achieving sustainable development. Each of
these sectors has a different vision of sustainable development. Some are interested in environmental
preservation and protection; some have economic development interests while other may be more
interested in social development_ According to UNESCO (2000) the way each nation, cultural group and
individual views sustainable development will depend on its own values. In many European nations,
Universities and technical colleges trained students of science, economics and business management in
skills that helps to build more sustainable societies. Programmes such as Peace Education, Human Right
Education, Environmental Education and "Youth Entrepreneur" schemes are carried out in many schools.
Hence, such initiatives help students and teachers to gain an understanding of the inter-linkages needed
for sustainable development. The emphasis has been on education that will provide life and occupational
skills that will enhance the venturesome and enterprising potentials of individual, reinforcing
self-sufficiency and improving quality of life.
Entrepreneurship Education and Sustainable Development in Nigeria.
The Nigerian government realised the need to break away from the vicious cycle of poverty,
infrastructural inadequacies, corruption and other notable gamut of social problems. It must be noted that
after 45 years of achieving colonial independence, it cannot be justified that Nigeria has attained her
optimum level of development. According to Kolawole and Omolayo (2006), many individuals have
difficulties in translating their business ideas to realities and creating new business ventures because of
lack of necessary information and skills needed to achieve their targets. To him, the university curriculum
was in the past oriented towards making graduates suitable only for white-collar jobs. This underscores
why millions of our youths and a lot of university graduates roam about the streets of the major cities and
towns in search of white-collar jobs. It is therefore necessary and expedient to position Nigerian
universities to stimulate economic growth through a deliberate agenda of production of entrepreneurial
International Journal of Information, Business and Management, Vol. 8, No.2, 2016
ISSN 2076-9202
301
graduates. In many countries, including US, Higher Education Institution’s offer entrepreneurship
education for life-long trade and many of them offer courses that enable students to meet their general
academic requirement while learning a trade. However, because of the recent challenges in world
economy Higher Education Institution’s have shifted emphasis to entrepreneurship education,
information technology and related fields. Higher Education Institutions work closely with willing
industries to establish curriculum and programmes to meet their needs. The apathy towards
entrepreneurship education is vitiating the contribution which the nation’s graduate would have made to
the economy. In Nigeria, graduates of Higher Education Institutions become highly skilled
entrepreneurs.
Vitiating Elements of Entrepreneurship Education
In the following list, the risks and obstacles are divided into three broad categories, showing the levels
at which action needs to be taken notably:
Policy framework:
• There is no dialogue and cooperation between different departments in the public
• Administration that should be responsible for entrepreneurship education policies and actions.
• There is no national strategy or plan to implement entrepreneurship education that includes all
stakeholders (public and private), so students cannot choose such training as of right.
• There is no legitimate and coherent institutional system. Initiatives are based on the efforts of
individuals, with no guarantee of continuity when there is a change of government.
• Entrepreneurship is not part of the vocational curriculum. Ministries of Education do not
endorse such education (even though Ministries of Economy/Industry and others have made
entrepreneurship a priority). There is no recognition of entrepreneurship education, and no
cooperation with relevant partners (such as business associations and NGOs).
• The purpose of VET studies is sometimes seen as being only to provide workers with technical
skills, without developing generally applicable, interpersonal and entrepreneurial skills.
• There is not enough cooperation between stakeholders at regional level.
• There are legislative or bureaucratic barriers to making such programmes widely available (for
instance, related to the taxation of student mini-compan
Support for Higher Education Institutions :
International Journal of Information, Business and Management, Vol. 8, No.2, 2016
ISSN 2076-9202
302
• Coordination is lacking, because there is no single support structure and financial resources are
fragmented.
• Funds and resources either are lacking or lack continuity.
• Information is poorly disseminated to schools.
• Institutional cooperation between the formal education system and the labour market is weak.
Obstacles and risks to Higher Education Institutions and educators:
• Support from the school management and local community is lacking.
• Teachers and the school management are reluctant to introduce entrepreneurship programmes.
• Entrepreneurship programmes are confused with management programmes.
• The teacher does not succeed in making entrepreneurship education relevant to the students.
• Teachers lack competence and knowledge. Some teachers' knowledge is only theoretical. As a
result, the programme is too theoretical (academic). Theoretical knowledge is stressed rather
than developing entrepreneurial skills.
• Teachers are not trained in entrepreneurship education.
• Career guidance and counseling is weak.
• The learning environment is not entrepreneurial.
• It is difficult to measure the outcome of entrepreneurship education, and experience in
measuring and assessing results is lacking.
• The school environment is isolated and lacks links to local entrepreneurs.
• Entrepreneurship is a separate field or course, and is not otherwise linked to or interwoven in
vocational education and training.
• Entrepreneurship is seen merely as a course that ends with a grade rather than a permanent way
of thinking or attitude.
• Time (and staff) commitment is lacking and there is increasing competition with other activities.
• Business people are not available as volunteers: it requires a lot of resources to recruit train and
support a large number of volunteers; furthermore, in today's environment, corporate
volunteering may become less prevalent.
Entrepreneurship programmes and activities differ greatly in intensity and effectiveness. There is in
general a perception that there are gaps to be filled. Some reasons for the gaps identified are as follows;
a) Entrepreneurship is not included in all parts of the higher education institution’s programmes and
curriculum;
b) Student’s participation is limited;
c) Teaching methods are ineffective;
d) The practical elements of entrepreneurship is missing;
e) Educators are not well trained and they are not fully competent;
f) Entrepreneurship is not well linked to specific training subjects or profession;

International Journal of Information, Business and Management, Vol. 8, No.2, 2016
ISSN 2076-9202
303
g) Business people and existing business owners are not rightly involved in imparting
entrepreneurship.
4. Conclusive Remarks and Recommendations
Entrepreneurship education is a carefully planned process that leads to the acquisition of entrepreneurial
capacities and competencies. It seeks to provide students with the knowledge, skills and motivation to
encourage entrepreneurial success in notable gamut of ventures. Higher Education Institution’s graduates
are expected to be prepared for teaching and self - employment. Thus entrepreneurship education needs to
be promoted within the Higher Education Institution ‘s programme. Considering the imperatives and
expediency of entrepreneurship education, the following recommendations are made:
� More Higher Education Institutions should be made to run entrepreneurship education as a
discipline like Accountancy, sociology, psychology etc. This will solve the problem of inadequate
qualified staff to teaching the course in our institutions of higher teaming in Nigeria.
� There should be synergy and cooperation between Higher Education Institutions and enterprises
although good results very often depend on the individual initiative of authorities and
facilitators.
� One of the main difficulties is involving small and micro-enterprises in higher education
institution’s activities. Small companies do not have sufficient time to dedicate to work
placements of students in the company or do not see any benefit in cooperating with schools.
� There is need to provide opportunities for youths to raise funds to enable them start up and expand
their business enterprise in a manner that will be significant to them. This may be achieved
through bursary awards and other such in school assistance to enable youths acquire savings
before they are out of school or through grants to them on graduation.
� The government should mandate financial institutions like commercial banks to produce and
issue more age-friendly loans. Such loans would have low interest rates and long duration for
repayments.

International Journal of Information, Business and Management, Vol. 8, No.2, 2016
ISSN 2076-9202
304
� Youths should be exposed to training in technology (especially new discoveries) from time to
time. This keeps them in tune with trends of the technological world and thus avoids drudgery in
their business.
� There should be efforts to reinforce in youths the concept of risk taking and patience in wealth
creation. This instills positive change of entrepreneurial attitude. They would thus develop habit of
success out of failure which is the only way to making money in the long run.
� Government and Non governmental agencies should provide enabling environment and such
environment be sustained for assurance. Such 'as infrastructural facilities, water supply, modern
information technology (ICT) among others.
� The fight against corruption and indiscipline should be continued with vigor at all levels and
sectors.
� Effective supervision and evaluation of programme implementation and funding must be ensured
on a continuous basis.
� Students Industrial work experience scheme (SIWES) should be enhanced and made more
effective.
References
1. Adiotomre, J. E. (2005) Some strategies for improving Primary Schools System for
Economic and Social Reconstruction. Educology: Current Journal of Educational Issues and
Reserches and Human Resource Development. Vol. 1(1), Pp. 34 - 43.
2. Fayolle, A. (2005), "Evaluation of Entrepreneurship Education: Behaviour Performing or
Intention Increasing". International Journal of Entrepreneurship and Small Business: Vol.
2(1) P. 89 - 98_
3. Federral Republic of Nigeria (2004) National Policy on Education Abuja. NERDC.
4. Gula, M. O. and Ewubare, M. U_ (2007), Entrepreneurship Education in Home Economics,
Warri: COEWA Publishers.

International Journal of Information, Business and Management, Vol. 8, No.2, 2016
ISSN 2076-9202
305
5. Hindle, K. (2007), Teaching Entrepreneurship at the university: from the Wrong Building to
the Right Philosophy. Handbooks of Research in Entrepreneurship Education. Vol. 1_
Cheltenham (UK):
6. Edward Edgar. Hippel, E. (2005), Democratizing Innovation: MIT Press.
7. Idibie, P. T. (2004), Organization, Teaching and Evaluation of Home Economics Curriculum
in Nigeria. Warri: COEWA Publishers.
8. Ikegulu, B. O. (1995), The Role and Responsibilities of Key Personnel in the
Implementation of Population and Family Life Programmes in Nigeria. A POP/FLE
Handbook for Classroom Teacher, Lagos: NERDC.
9. Kaka, H. J. and Agwa, S_ I. (2007), Technological Innovations in Dress and Textiles.
Conference Paper Presented at the gtn Annual HERAN Conference.
10. Lemchi, S. N. and Anyakoha, E. N. (2006), Specific Objectives for Entrepreneurship
Education in the NCE Home Economics. Journal of Home Economics Research Association
o NNggeria (HERAN). Vol. 7.
11. Luecke, R. and Katz, R. (2003), Managing Creativity and Innovation. Boston: M. A.
Harvard Business School Press.
12. Nwachukwu, C. C. (1990), The Practice of Entrepreneurship in Nigeria, Onitsha: Africa-Fep
Publisher Ltd.
13. Nwaogwugwu, C. and M.A. Ugiagbe, 2008. Entrepreneurship: Concepts of small business
management. Cape Publishers International Ltd, Abuja.
14. Nwangwu, 1g. O. (2007): Higher education lot seIf-reliance: An imperative for the Nigerian
economy. NEAP publication pg. 1-8.
15. Oduwaiye, R.O., 2005. Entrepreneurship Education in Nigerian Universities: implementation
and Way Forward. Retrieved 20 June, 2010.
16. Obunadike, J. C. (2009), Home Economics Teachers' Perception of Administration Support
for Teaching Creativity in Primary Schools in Anambra State. Journal ofHome Economics
Research. Vol. 10&11.Pp.153-161.

International Journal of Information, Business and Management, Vol. 8, No.2, 2016
ISSN 2076-9202
306
17. Olaitan, S. O. and Agusiobo, O. N. (1981), Introduction to the Teaching of Home Economics,
Toronto: Ajohn Wiley and Sons.
18. Oluwasanya A.T (2011) Entrepreneurship, Concepts, Theories, Values and Contemporary Issues
(First International Edition) Archade Printers Ijebu-ode, Ogun State.
19. Oluwasanya A.T (2014) Entrepreneurship, Concepts, Theories, Values and Contemporary Issues
(Second International Edition) Archade Printers Ijebu-ode, Ogun State.
20. Oluwasanya A.T (2014), Ayodeji. O, Oreoluwa .A, Irenikase k (2014). Dapkol and Associates,
Ilupeju- Lagos
21. Onu, V. C. (2008), Repositioning Nigeria Youths for Economic Empowerment through
Entrepreneurship Education. Journal of Home Economics Research Association of Nigeria
(HERAN). Vol. 9, Pp. 148 - 157.
International Journal of Information, Business and Management, Vol. 8, No.2, 2016
ISSN 2076-9202
307
ENTREPRENEURSHIP EDUCATION: CHALLENGES AND
IMPLICATIONS FOR EDUCATORS IN HIGHER EDUCATION
INSTITUTIONS
Oluwasanya Adewale Tony
Dean, School of Management Science, DSAdegbenro ICT Polytechnic, Eruku,
Itori-Ewekoro, Ogun State, Nigeria.
P.O.BOX 507, Ota post office, Sango Ota, Ogun State, Nigeria, West Africa.
Tel: 234-8033380198, 8028233332, 8055221725
Email: [email protected]
Abstract
The Nigerian. government seems to have woken up to the reality that the country reeds to break away
from the vicious cycle of poverty, infrastructural neglect, corruption and other social problems. The recent
challenges in world economy has stimulated awareness for the expediency of Entrepreneurship Education.
Thus, emphasis appears to be shifted to Entrepreneurship Education. The truism that potential
entrepreneurs need to be identified, trained and motivated to start their own industry units cannoy be over
emphasised. The incorporation of entrepreneurship education programmes in Higher Education
Institutions curriculum will equip students with entrepreneurial skills that will enable them create and
develop enterprises in the notable gamut of business ventures. This will in turn engender self reliance, job
creation and reduce unemployment. These institutions are into the identification, selection and training of
potential entrepreneurs.
Keywords: Entrepreneurship, Entrepreneurship Education, Educators, Higher Education Institution

International Journal of Information, Business and Management, Vol. 8, No.2, 2016
ISSN 2076-9202
308
1. INTRODUCTION
Entrepreneurship education, in its various forms, can equip people to pragmatically explore and
proactively pursue business opportunities available to them. We have seen a number of “waves” in
entrepreneurship education, starting a century developing in phases and now expanding exponentially. By
making entrepreneurship education available to undergaduates, we are preparing the next wave of
entrepreneurs to enable them to lead and shape our institutions, businesses and the economy.
Entrepreneurial programmes and modules offer students the tools to think creatively, to be an effective
problem solver, to analyse a business idea objectively and to communicate, network, lead, and evaluate
any given project. Students feel more confident about setting up their own businesses if they can test their
ideas in an educational, supportive environment. However, the benefits of entrepreneurship education are
not limited to boosting start-ups, innovative ventures and new jobs. Entrepreneurship is a competence for
everyone, helping undergraduates and youths alike to be more creative and self-confident in whatever
they undertake. This paper seeks to raise awareness about the importance of entrepreneurship education
for developing the skills to solve global challenges, increase understanding about current approaches,
build acceptance of entrepreneurship’s rightful role in education and provide a platform for action to take
the necessary next steps for mainstreaming entrepreneurship in education. It must however be noted that
high-level policy-makers and leaders from the private and academic sectors should synergise and develop
high-impact solutions through multi-stakeholder partnerships for embedding entrepreneurship education
within their countries and regions. Entrepreneurship is a global phenomenon. The future, to an even
greater degree than the past, will be driven by innovation and entrepreneurship. It is time to more
adequately develop entrepreneurial skills, attitudes and behaviours in our higher education institutions.
Considering what to learn refers to the substance of entrepreneurship education, that is the whole
phenomenon of some its part or aspects, including the process itself and considering how to learn refers to
the behavioural aspect of the actor the entrepreneurship through entrepreneur and his or her experiences,
that is, the actor learn about the entrepreneurship through entrepreneurial process. Thus, this publication
can rightly assert that the key dimensions of entrepreneurship education refer to what to learn and how to
learn, and the quality of the three element relate to the phenomena the field of entrepreneurship studies is
gathered around. These focus on such phenomena as opportunity recognition, new venture creation, risk
and acquisition, and allocation of resource in order to make thing happen in different contexts, levels and
perspectives.
2. Conceptual Framework
Entrepreneurship education refers to education and teaching given both in school and in the surrounding
society. Entrepreneurship education as a concept means growing into entrepreneurship which in turn here
means both external and internal entrepreneurship. Entrepreneurship education equips people with the
ability to seek investment opportunities. Through entrepreneurship education, success habits are
imparted as the individuals develop entrepreneurial integrity, it ensures that skills, ideas, attitudes, etc, are
International Journal of Information, Business and Management, Vol. 8, No.2, 2016
ISSN 2076-9202
309
utilized to create employment for self and others. In Nigeria and the whole world at large
entrepreneurship is being seen as a key to economic and developmental process. When people are
exposed to entrepreneurship, it is evident that they would be opened to opportunities that will enable them
to become creative and productive. This will enhance job creation and improve the standard of living of
an individual in the society. Often, it creates new job for others at the same time. Entrepreneurship
education training could be given to interested individuals both adults and students through workshops,
classes, and conferences thereby learning basic ideas of starting their own businesses and keeping it
naming. Entrepreneurial education is a specialized training given to students of vocational and technical
education to acquire the skills, ideas and managerial abilities and capacities for self-employment rather
than being employed for p The quality of input influences to a large extent the quality of output In other
words, the quality of the input of entrepreneurship education such as teachers, students and infrastructural
facilities will influence greatly, the input of the output (Olormmiolu, 2010). Entrepreneurship education
seeks to provide students with the knowledge, skills and motivation to encourage entrepreneurial success
in a variety of setting. At the tertiary level of education entrepreneurship education is perceived not only
as a career opportunity but as a way of upgrading a young person’s abilities to succeed as an employee as
well as an entrepreneur. The implication therefore is that the overall purpose of entrepreneurship
education is the development of expertise as an entrepreneur. It is the process of providing individuals
with the ability to recognize business opportunities, the insight, the zeal, the knowledge, the courage and
skills to act on them. Entrepreneurship education as part of the total educational system is the type of
education that involves the acquisition of skills, ideas and management abilities necessary for job creation.
Bechard and Toulouse, (1998) defines it as a collection of formalized teachings that informs, trains, and
educates anyone interested in business creation or small business development. It also means different
things at different levels of education. In this paper, it was therefore agreed that existing activities and
programmes qualify as education for entrepreneurship if they include at least two of the following
elements:
a) Developing those personal attributes and generally applicable (horizontal) skills that form the basis of an entrepreneurial mindset and behaviour;
b) Raising students' awareness of self-employment and entrepreneurship as possible career options; c) Work on practical enterprise projects and activities, for instance students running minicompanies; d) Providing specific business skills and knowledge of how to start and successfully run a company.
The Higher Education Institution’s curriculum and programmes should be designed to, among other goals:
� Produce highly motivated, conscientious and efficient classroom teachers for all levels of the
Nigerian educational system and,
� Provide graduates with the intellectual and professional background adequate for their assignment
and make them adaptable to changing situations (Federal Republic of Nigeria, 2004).

International Journal of Information, Business and Management, Vol. 8, No.2, 2016
ISSN 2076-9202
310
� Developing those personal attributes and generally applicable (horizontal) skills that form the basis of an entrepreneurial mindset and behaviour;
� Raising students' awareness of self-employment and entrepreneurship as possible career options; � Work on practical enterprise projects and activities, for instance students running mini-
companies; � Providing specific business skills and knowledge of how to start and successfully run an
enterprise or company.
3. Literature Review
In the words of Dirk Meyer, President and CEO, AMD “ Education is the clearest path to individual
opportunity and societal growth, and entrepreneurship education is especially vital to fuelling a more
robust global economy. Entrepreneurship is the ability to create and build something from practically
nothing. It is initiating, doing, achieving and building an enterprise or organization, rather than just
watching, analyzing, or describing one. Entrepreneurship refers to an individual's ability to turn ideas
into action. It covers creativity, innovation and risk taking, and the ability to plan and manage projects
in order to achieve objectives. Entrepreneurship education means different things to different educators.
Kourilsky, (1995) defines entrepreneurship education as opportunity, recognition, marshalling of
resources in the presence of risk and building a business venture. Often, it creates new job for others at
the same time. Entrepreneurship education training could be given to interested individuals both adults
and students through workshops, classes, and conferences thereby learning basic ideas of starting their
own businesses and keeping it naming. Entrepreneurial education is a specialized training given to
students of vocational and technical education to acquire the skills, ideas and managerial abilities and
capacities for self-employment rather than being employed for p The quality of input influences to a large
extent the quality of output In other words, the quality of the input of entrepreneurship education such as
teachers, students and infrastructural facilities will influence greatly, the input of the output (Olormmiolu,
2010). Entrepreneurship education seeks to provide students with the knowledge, skills and motivation to
encourage entrepreneurial success in a variety of setting. Entrepreneurship education equips people with
the ability to seek investment opportunities. Through entrepreneurship education, success habits are
imparted as the individuals develop entrepreneurial integrity. it ensures that skills, ideas, attitudes, etc, are
utilized to create employment for self and others. In Nigeria and the whole world at large
entrepreneurship is being seen as a key to economic and developmental process.
When people are exposed to entrepreneurship, it is evident that they would be opened to opportunities
that will enable them to become creative and productive. This will enhance job creation and improve the
standard of living of an individual in the society. An entrepreneur promotes employment rather than
seeking for an employment. Therefore, there is a need to embrace this type of education and provide all
the necessary resources needed to make functional. Entrepreneurship Education seeks to provide student
(especially those in higher education institutions) with the knowledge, skills and motivation to
encourage entrepreneurial studies in a variety of setting (European Union Commission, 2010). The
commission emphasizes that different aspects of entrepreneurship education are offered at all levels of
International Journal of Information, Business and Management, Vol. 8, No.2, 2016
ISSN 2076-9202
311
schooling from primary or secondary schools through - graduate university programmes. The growth of
entrepreneurship as a recognized profession in the United States was visible in the 1990s. In that
professional approach lies the secret benefit of entrepreneurship education, which is, to help decrease
the chances of failure by stressing a consistent and proven set of practices. In modem entrepreneurship,
the idea of professionalizing the process of entrepreneurship is another great commonality. Emeraton
(2008) described entrepreneurship education as that which deals with those attitudes ad skills that are
necessary for the individual to respond to is environment in the process of conserving, starting and
managing a business enterprise. They opined that their opinion is based on the fact that some basic
attitudes and skills are essential for an individual to respond positively to his environment ad explore its
potentials. This implies that entrepreneurship education prepares the individual to be properly equipped
to acquire saleable skills which could be used to manage his own business or that of other persons
(Oduwaiye, 2005). Entrepreneurship education should not be confused with general business or
economic studies, as its goal is to promote creativity, innovation and self-employment. Education is said
to be qualitative when the input such as students, teachers, finance, facilities and equipment and all these
are converted through teaching and learning (theory and practical) and produce a desirable output. The
output is better equipped to serve themselves and the society. Entrepreneurship education seeks to prepare
people particularly the youths: to be responsible, enterprising individual who became entrepreneurs or
entrepreneurial thinkers by immersing them in real life learning experience whereby they can take risks,
manage result and learn from the outcome (Suleiman2010). Entrepreneurship education is teaching
people that they can either take or create a job. This will enable them to be self-employed and not relying
on other job security. Entrepreneurship education is an indispensable ingredient for job creation. Sanda
(2010) asserted that Nigeria and other countries of the world are seeking to increase the entrepreneurship
capacities of their citizens with the understanding that it will contribute to economic growth and
development. Therefore, there is a need for qualitative entrepreneurship education if the recipient is to
acquire appropriate knowledge, attitude, abilities and skills that would make them to be job creators
instead of job seekers. Addressing entrepreneurship education requires working with existing education
systems to inject the necessary changes as well as launching new initiatives outside of current structures.
Entrepreneurship education can be a societal change agent, a great enabler in all sectors.
Didactics of Entrepreneurship Education
The study of teaching is called didactics. Didactics concentrates around planning and the actual teaching: it
studies the aims of teaching, the teaching process, and the results. In addition, it aims at developing a theory
of good teaching. Thus an important function of entrepreneurship education is to provide the learners with
relevant simulation models of entrepreneurship and, at the same time, to support the internal
entrepreneurship, activity, creative, and initiative of the included in the didactics of entrepreneurship
education, Some general didactics goals of entrepreneurship education are presented in the following:
• The learner understands the meaning of entrepreneurship as a part of the prosperity of national
economy
International Journal of Information, Business and Management, Vol. 8, No.2, 2016
ISSN 2076-9202
312
• Understands the controversy between nature and prosperity in entrepreneurship
• Understand the meaning of sustainable development and the importance of tolerating uncertainty in
entrepreneurship and society
• Receives information on the vocation of an entrepreneur
• Acquires the knowledge and skills relevant for choosing a career and further education suitable for
them later in life
Pedagogy of Entrepreneurship Education
In terms of entrepreneurship education’s pedagogy, it can be argued that currently it will be minimal issue
of whether entrepreneurship can be taught or not, since it was proven it can (Henry, et al, 2005; D.F.
Kuratko, 2005). However there are pressing issues involving pedagogy; (1) How should the academician
teach entrepreneurship?
(2) Does the conventional business style works in exposing students to entrepreneurship?
(3) How the perception of academicians regarding the nature of entrepreneurship can influence their
pedagogy style?
In the first issue, earlier on, Davies and Gibb (1991) argued that adoption of traditional education method
which focus mainly on theory and didactic approach were not significant in teaching entrepreneurship.
Gibb (2007) cautioned that in most entrepreneurship educations, it seems like the dominant teaching
methods are lectures, cases, projects and entrepreneur/stakeholder presentations, which may or may not be
delivered in a manner designed to stimulate entrepreneurial behavior; these teaching methods can be
anti-entrepreneurial mode because usually it was delivered in the confinement of classroom (Shepherd &
Douglas, 1996). Earlier, Gibb (1993), classified what are the major differences between business school
learning focus and entrepreneurship education/learning focus (Refer Table 1.2 below). Later, according to
Hisrich and Peters (1998) there are three components of skills to be cover in entrepreneurship education
pedagogical aspects namely technical, business management and personal entrepreneurial skills.
Meanwhile, in relation to second issue, most entrepreneurship courses are focused upon business and
business concepts. According to Gibb (2005; 2007), the concepts are hard to resist that even when they are
applied to non-business situations.
The following strategies for the attainment of the goal for the integration of entrepreneurship
education in both in Higher Education Institutions are expedient:
a. The first and most important step would involve state and school authorities adoption of a formal
Entrepreneurship Education curriculum. This curriculum could be adopted “off the shelf”
from existing ‘best practice’ products, or developed in-house.

International Journal of Information, Business and Management, Vol. 8, No.2, 2016
ISSN 2076-9202
313
b. As the curriculum is introduced into the schools, a commitment to professional development
opportunities for teachers will also be required. Many teachers will be new to the world of
entrepreneurship and require training in how to support these new courses.
c. Effective Entrepreneurship Education uses a host of new teaching enablers and techniques, such
as distance education, experiential learning, problem-based learning, the planning of specific
objectives, learning experiences, organization and integration of the learning experiences,
instructional methods and facilities and evaluation techniques for assessing the attainment of
specific objectives (Lemhi and Anyakoha, 2006).
d. Specific objectives are of utmost importance to curriculum development and implementation as
they are particularly helpful guides in selecting learning experiences, guiding learning, selecting
instructional materials and also evaluation techniques (Lemchi and Anyakoha, 2006; and
Nwanchukwus 1990). The objectives of entrepreneurship education within Higher Education
Institutions. borders on the thirty - nine specific objectives postulated by Lemchi and Anyakoha,
(2006) as enshrined in Higher Education Institution’s curriculum. The content of
entrepreneurship education in Higher Education Institutions should hing on the specific
objectives. This content should include, among others, business ownership, entrepreneurial
responsibilities, product development, record/book keeping and market segmentation (Fayolle
2005).
e. Facilities and methods of teaching entrepreneurship education should be suited to the objectives.
Hindle (2007) noted that there is no universal method of teaching entrepreneurship education.
The choice depends mainly on the objectives, contents and constraints imposed by the
Institutional context. However, methods such as demonstration, practice and drill, inquiry
methods are suggested for the teaching of entrepreneurship education in Higher Education
Institutions. Facilities available will go a long way to determine the methods of teaching
entrepreneurship education in Higher Education Institutions. The Minimum Standard
stipulated by the National Universities Commission (NUC), National Board for Technical
Education (NBTE) etc, needs to be adhered to by polytechnics throughout the federation. This
will enhance the effective implementation of the curriculum, thus equipping the student
entrepreneurship graduates with skills required to explore and excel.
f. Evaluation of entrepreneurship education is another important aspect of the teaching process.
Strategies for Addressing the Challenges and Enhancing the Teaching of Entrepreneurship Education
In order to promote entrepreneurship knowledge, attitudes and skills that can be taught within higher
education institutions, the following strategies can be employed:
a) Provide small business schools where interested students and community members can
participate.

International Journal of Information, Business and Management, Vol. 8, No.2, 2016
ISSN 2076-9202
314
b) Develop entrepreneur internship programmes matching students with locally successful
entrepreneurs with clearly established education programmes.
c) Establishing an enterprise college aimed at fostering the specific skill sets required for
entrepreneurship to serve as skill acquisition centers for the youths.
d) Creating an economic friendly political environment.
e) Improving on the government taxation on small scale businesses.
f) Innovation: Innovation is change that creates a new dimension of performance. It is creative idea
that is realized. Lucke and Katz (2003) note that Lucke innovation is the combination or synthesis
of knowledge in original, relevant, valued new products, processes or services. Innovation
typically, involves creativity but is not identical to it (Kaka and Agwa, 2007) higher education
institution’s educators need to provide an entrepreneurship education that will stimulate
knowledge, skills and attitudes of the National and higher national diploma students so that they
can be more innovative.
This will enable them introduce new ideas into the economy, formulate new goals, initiate new
methods of production, new methods of distribution or carry out new organization of an industry
(Gula and Ewubare, 2007).
g) Train the Trainers: Teachers should be given opportunity for in-service training so that they can
brace up with the changes in the curriculum. The training educators gives room for professional
growth which in turn enhances creativity and productivity. The training of educators should be
structured towards developing the specific skills required to teach entrepreneurship, The
suggested skills are:
i. Project management skills
The heart of entrepreneurship education is students setting up and running a project. Teachers require
the skills to support students throughout this process, which includes: planning and preparing the
project (setting objectives and identifying what exactly is required and how it can be carried out, etc.);
anticipating students' needs at each stage of the project; setting personal targets and goals throughout
the project; and doing the final evaluation.
ii. Pedagogical skills
The emphasis is on pedagogies that encourage learning: by doing; by exchange; by experiment; by risk
taking and `positive' mistake making; by creative problem solving; by feedback through social
interaction; by dramatizing and acting the part; by exploring role models; and by interacting with the
outside/adult world.
This involves the teacher in suggesting and guiding rather than giving instruction, asking open'
questions that do not necessarily lead to one correct answer, learning alongside the students, helping to
resolve conflicts and difficulties that may arise and persuading students to face up to things they may

International Journal of Information, Business and Management, Vol. 8, No.2, 2016
ISSN 2076-9202
315
initially resist or avoid.
iii. Personal skills
Much, of the success of the facilitation process depends upon a range of communication skills,
including that of active listening, the ability to negotiate and work in teams with other colleagues and
the ability to create a learning environment in which students can be open and frank, and feel confident
and secure. The most effective way to ensure that teacher competence in this field is adequate and up-to
date would be to make entrepreneurship a mandatory part of teacher education. It is also important to
offer further education to those teachers who have already completed their initial education.
h) Research: This is another strategy for addressing the challenges of the teaching of
entrepreneurship education. For instance, the issue of entrepreneurship education emerged as a
result of research. DSAdegbenro ICT Polytechnic’s management should endeavour to provide
recent textbooks for teachers of this programme. Teachers should update themselves through
research, seminars, workshops and conferences. This will also help to improve their competencies.
i) Entrepreneurship enablers/ Enhancement of teaching facilities and techniques: Anyakoha
(2001) stressed the need to be willing to learn and use new technologies and improve on old
methods and techniques of teaching.
The educators should explore new techniques / methods of teaching the entrepreneurship courses
so that the students can cope with the dynamic society at graduation. For instance, they should
carry out entrepreneurial practice in various areas under the supervision of their lecturers.
j) Improved school industry relationship: The polytechnic and other industries and
organisations in their precinct should have an improved working relationship, which should
enhance students` skill acquisition. When students are sent out on industrial attachment, the
polytechnic should give them the necessary orientation needed to have a good rapport with the
industry. Apprenticeship training could be seen as a good model for cooperation on different
levels: company trainers meet teachers to discuss the specific situation of apprentices, and
companies negotiate with schools to ensure coherence between the company training and the
school curriculum. In addition to regular placement periods in a company, formalized
partnerships between the higher education institutions and the company seem to be an efficient
way of cooperating on developing an entrepreneurial mindset among students, to the benefit of
all parties.
Partnerships may contain many different elements, all aimed at facilitating and increasing
cooperation which may contribute - not just indirectly but directly - to developing the student's
entrepreneurial competence. Such partnerships may, for instance, involve the following:
i. The enterprise delivers real-life, practice-related problems for use in student
assignments and projects.
International Journal of Information, Business and Management, Vol. 8, No.2, 2016
ISSN 2076-9202
316
ii. The enterprise ensures that the student gets an insight into the sector and into its own
operations by visiting the company, shadowing a manager, taking part in exhibitions,
etc.
A concrete example of a close partnership can be seen in a situation where students conclude their
education by carrying out a practical project in enterprise on which the enterprise and the school
cooperate. Taking a real problem as the point of departure, the student can demonstrate his/her
entrepreneurial skills and creative thinking by coming up with a solution or a product that meets the
enterprise's needs. Before starting, the student drafts a project description which must be approved
jointly by the enterprise and the school. This case-based final exam can be taken individually or in
groups. Despite the interest and goodwill of many teachers and entrepreneurs in engaging in
cooperation activities, there are still a number of obstacles to be overcome, such as:
� The large number of different tasks to be performed by staff of very small companies, leaving
little time for involvement with schools;
� The lack of mutual knowledge and understanding of each other's priorities and what each
� party is involved in on a day-to-day basis;
� A possible lack of trust as a result of the above;
� The differences in working times / hours of working;
� The absence of a main point of contact in the school.
� In some cases another obstacle is that teachers are not allowed to work in
other outside school.
� Teachers should be allowed flexible periods of training in companies.
There are several ways of evaluating the quality and the results of entrepreneurship programmes and
activities in higher education institutions among which are: -
• By collecting feedback from students who participated in the programme and from other
stakeholders;
� By taking impact measurements, e.g. measuring entrepreneurial competences and
entrepreneurial intentions before and after participation in the programme.
� The long-term impact can also be assessed, for instance by measuring how many students who
participated in entrepreneurship programmes or activities have become entrepreneurs later.
However, starting up a company is only one in a range of possible outcomes of entrepreneurship
education; therefore long-term impact assessment could also consider other indicators such as
entrepreneurial activities within a company (`entrepreneurship') or the quality and level of
employment.
� In fact, what is needed is coordination of research linking short-term evaluations of what
individuals experience in schools, medium-term measures of how attitudes and intentions
change and long-term assessments of the quality and level of employment and of the net result
on business start-up and survival rates.
International Journal of Information, Business and Management, Vol. 8, No.2, 2016
ISSN 2076-9202
317
Evaluation of the quality of programmes and activities should include internal procedures and
self-assessment, and external and independent auditing, and could measure:
� General entrepreneurial abilities: creativity, capability with regard to putting forward innovative
ideas, curiosity, ability to work in a team, self-confidence, leadership, proactiveness of approach,
willingness to take risks, problem-solving skills, responsibility, etc.
� Specific entrepreneurial competences: the knowledge and skills to understand what must be
done in order to set up and run a new business; the capacity to draft a good business plan; the
ability to identify opportunities; an insight into production methods, knowledge of finance, etc.
� Attitudes: how many students consider self-employment as a career option? Such abilities,
competences and attitudes should preferably be measured both before and after students'
participation in the programme. This can be done by means of:
� Assessment;
� Interviews;
� Group evaluation and focus evaluation
questionnaires;
� Tests and simulation games, etc.
The self-assessment should be carried out by three groups: students, lectures and the Higher
Education Institution’s management, in order to determine the three groups' satisfaction with the
experience. The perception of industry and employers - especially those involved in the programme
- should also be taken into account.
� Programmes and activities should be evaluated regularly as part of the programme, rather than
as a one-off exercise. The outcome of the evaluation (lessons learned) should be embedded in
the next round of activities.
� One way of assessing the long-term impact would be to find out how many students who
participated in entrepreneurship programmes or activities have become entrepreneurs 5 or 10
years later.
� This would entail either sending questionnaires to former students of entrepreneurship
programmes to assess whether they have started their own company (or whether they are
employed but use the entrepreneurial skills acquired), or getting feedback on a regular basis
from alumni-entrepreneurs through close cooperation with them. The number of alumni-
-entrepreneurs could be a good indicator, if a database allows such information to be obtained
objectively. However, in most cases this information is currently collected at the initiative of
schools through personal contact.
There are still other challenges to be overcome in assessing the effect of entrepreneurship education
programmes and activities at higher education institutions in terms of new business creation. These
relate to:
- the wide variety of objectives and methods of delivery of entrepreneurship education;

International Journal of Information, Business and Management, Vol. 8, No.2, 2016
ISSN 2076-9202
318
- the difficulty in isolating the effects of entrepreneurship education programmes from other
educational attainments and from all other factors (economic, administrative, etc.) that influence
entrepreneurship and business creation at national or regional level;
- the long chain from intervention to intended outcomes, when trying to link student
participation in entrepreneurship education in secondary school to being more likely to run a
business at age 25 or 30.
Critical Success Factors of Entrepreneurship Education in Higher Education Institutions
The following are the set of key performance indicators for effectiveness and success in teaching
entrepreneurship:
1) The programme or activity must have well-defined objectives and appropriate measures of success. It
is regularly evaluated, and receives positive feedback from students. Evaluation results are
continuously fed into the development process.
2) There is a good balance between theory and practice: the programme or activity is action oriented,
based on experience and project work. It aims to improve the students' abilities to work in a team,
develop and use networks, solve problems, and spot opportunities. Students are actively involved in
the learning process, and responsible for their own education.
3) The programme or activity must be adapted to the students' learning environment and to their specific fields of study.
4) The institution must have external links with enterprises, experienced business people and young
entrepreneurs, and with the local community. Entrepreneurs are involved in the learning process.
5) Students must be exposed to real-life work situations and encouraged to take part in extracurricular
activities. External events, activities and contests are organized.
6) Educators must have an appropriate qualification and training (both local and international) in
entrepreneurship (through experience in business and/or participation in training). They must use
up-to-date study materials and up-to date knowledge.
7) The programme or activity must be structured towards stimulating students and educators to look
beyond the borders of their school environment (e.g. by exchanging experience or ideas with other
schools, with students from other countries or with other technical backgrounds).
8) The programme or activity is part of a wider scheme: students are monitored after participation in
the programme, and are referred to the right support mechanisms if they want to start up a business.
This list does not include external factors, i.e. the overall environment in which programmes and
activities take place, such as support from public authorities.

International Journal of Information, Business and Management, Vol. 8, No.2, 2016
ISSN 2076-9202
319
Vitiating Elements of Entrepreneurship Education
In the following list, the risks and obstacles are divided into three broad categories, showing the levels
at which action needs to be taken notably:
Policy framework:
• There is no dialogue and cooperation between different departments in the public
• Administration that should be responsible for entrepreneurship education policies and actions.
• There is no national strategy or plan to implement entrepreneurship education that includes all
stakeholders (public and private), so students cannot choose such training as of right.
• There is no legitimate and coherent institutional system. Initiatives are based on the efforts of
individuals, with no guarantee of continuity when there is a change of government.
• Entrepreneurship is not part of the vocational curriculum. Ministries of Education do not
endorse such education (even though Ministries of Economy/Industry and others have made
entrepreneurship a priority). There is no recognition of entrepreneurship education, and no
cooperation with relevant partners (such as business associations and NGOs).
• The purpose of VET studies is sometimes seen as being only to provide workers with technical
skills, without developing generally applicable, interpersonal and entrepreneurial skills.
• There is not enough cooperation between stakeholders at regional level.
• There are legislative or bureaucratic barriers to making such programmes widely available (for
instance, related to the taxation of student mini-compan
Support for Higher Education Institutions :
• Coordination is lacking, because there is no single support structure and financial resources are
fragmented.
• Funds and resources either are lacking or lack continuity.
• Information is poorly disseminated to schools.
• Institutional cooperation between the formal education system and the labour market is weak.
Obstacles and risks to Higher Education Institutions and educators:
• Support from the school management and local community is lacking.
• Teachers and the school management are reluctant to introduce entrepreneurship programmes.
• Entrepreneurship programmes are confused with management programmes.
• The teacher does not succeed in making entrepreneurship education relevant to the students.
International Journal of Information, Business and Management, Vol. 8, No.2, 2016
ISSN 2076-9202
320
• Teachers lack competence and knowledge. Some teachers' knowledge is only theoretical. As a
result, the programme is too theoretical (academic). Theoretical knowledge is stressed rather
than developing entrepreneurial skills.
• Teachers are not trained in entrepreneurship education.
• Career guidance and counseling is weak.
• The learning environment is not entrepreneurial.
• It is difficult to measure the outcome of entrepreneurship education, and experience in
measuring and assessing results is lacking.
• The school environment is isolated and lacks links to local entrepreneurs.
• Entrepreneurship is a separate field or course, and is not otherwise linked to or interwoven in
vocational education and training.
• Entrepreneurship is seen merely as a course that ends with a grade rather than a permanent way
of thinking or attitude.
• Time (and staff) commitment is lacking and there is increasing competition with other activities.
• Business people are not available as volunteers: it requires a lot of resources to recruit train and
support a large number of volunteers; furthermore, in today's environment, corporate
volunteering may become less prevalent.
Entrepreneurship programmes and activities differ greatly in intensity and effectiveness. There is in
general a perception that there are gaps to be filled. Some reasons for the gaps identified are as follows;
h) Entrepreneurship is not included in all parts of the higher education institution’s programmes and
curriculum;
i) Student’s participation is limited;
j) Teaching methods are ineffective;
k) The practical elements of entrepreneurship is missing;
l) Educators are not well trained and they are not fully competent;
m) Entrepreneurship is not well linked to specific training subjects or profession;
n) Business people and existing business owners are not rightly involved in imparting
entrepreneurship.
4. Conclusive Remarks and Recommendations
The availability of qualitative entrepreneurship education is a sine qua non for the rapid development and
transformation of any nation’s economy. The world is developing at an unprecedented pace and the rate of
entrepreneurial skill gaps and unemployment is growing fast. Government should be seized by passion to
International Journal of Information, Business and Management, Vol. 8, No.2, 2016
ISSN 2076-9202
321
make things happen positively to engender entrepreneurial success. Adequate funding should be given to
entrepreneurship because it is what can bring about sustainable development in the country if Nigeria is to
achieve the Millennium Development Goals by 2015 as well as become one of the world's biggest
economies in the world by the year 2020, her entrepreneurship sector must receive adequate fund. The
traditional education is less expensive and the vocations of the family will not go into extinction.
Entrepreneurship Education differs from other business or economics education programs, and can
complement most financial literacy curricula. These programs teach youth how the economy works and
how to manage one’s own finances. Entrepreneurship educators can and should provide this economic
and financial foundation, and they also provide a much broader range of skill sets and teach young people.
Entrepreneurship education helps students build more successful careers regardless of whether they take
the “entrepreneurial leap” or become a “intrepreneurial worker” in someone else’s business. The
entrepreneurial “mindset” improves the productivity of all workers so everyone wins. In today’s economy,
successful careers require networking and flexibility that can be learned as students experience
entrepreneurship education. The ability to promote the “brand called me” is becoming an even more
important skill as the economy is more and more relying on contractors and consultants to perform the
work organizations need to complete. Students can acquire these types of fundamental techniques which
are critical component of an effective future worker in the workplaces of the world through
entrepreneurship education. A personal “locus of control” helps students engage more effectively in their
education experiences thus improving academic performance while in the education system.
Entrepreneurship education allows students the opportunity to develop skills essential for success in the
market places of the 21st Century. The following recommendations are made:
� Higher Education Institution’s entrepreneurship lecturers should be pragmatic, innovative and
committed to the teaching of entrepreneurship education.
� Opportunities for in-service training on entrepreneurship education both local and international
should be given to lecturers by the government
� Government should provide adequate fund for the provision of adequate facilities and equipment
for ion institutions.
� Government should provide sufficient grants for research while the educators should explore ways
of obtaining such research grants.
� Streamlines entrepreneurship education curriculum along the lines of practical skills acquisition in
tandem with up to date technological innovation in the world of business.
� All institutions of higher learning offering entrepreneurship education should be mandated to
establish Entrepreneurship Education Centre. This Centre should be equipped with all the modern
facilities which could enrich the students with both theoretical and practical skills acquisition.

International Journal of Information, Business and Management, Vol. 8, No.2, 2016
ISSN 2076-9202
322
� There is need to provide opportunities for youths to raise funds to enable them start up and expand
their business enterprise in a manner that will be significant to them. This may be achieved
through bursary awards and other such in school assistance to enable youths acquire savings
before they are out of school or through grants to them on graduation.
� The government should mandate financial institutions like commercial banks to produce and
issue more age-friendly loans. Such loans would have low interest rates and long duration for
repayments.
� Youths should be exposed to training in technology (especially new discoveries) from time to
time. This keeps them in tune with trends of the technological world and thus avoids drudgery in
their business.
� There should be efforts to reinforce in youths the concept of risk taking and patience in wealth
creation. This instills positive change of entrepreneurial attitude. They would thus develop habit of
success out of failure which is the only way to making money in the long run.
� Students Industrial work experience scheme (SIWES) should be enhanced and made more
effective.
� Government and Non governmental agencies should provide enabling environment and such
environment be sustained for assurance. Such 'as infrastructural facilities, water supply, modern
information technology (ICT) among others.
� The fight against corruption and indiscipline should be continued with vigor at all levels and
sectors.
� Effective supervision and evaluation of programme implementation and funding must be ensured
on a continuous basis.
� Emphasis must be on practical skills rather than on theoretical because the business world is
dynamic and there is a need for constant change.
References
International Journal of Information, Business and Management, Vol. 8, No.2, 2016
ISSN 2076-9202
323
1. Adiotomre, J. E. (2005) Some strategies for improving Primary Schools System for
Economic and Social Reconstruction. Educology: Current Journal of Educational Issues and
Reserches and Human Resource Development. Vol. 1(1), Pp. 34 - 43.
2. Fayolle, A. (2005), "Evaluation of Entrepreneurship Education: Behaviour Performing or
Intention Increasing". International Journal of Entrepreneurship and Small Business: Vol.
2(1) P. 89 - 98_
3. Federral Republic of Nigeria (2004) National Policy on Education Abuja. NERDC.
4. Gula, M. O. and Ewubare, M. U_ (2007), Entrepreneurship Education in Home Economics,
Warri: COEWA Publishers.
5. Hindle, K. (2007), Teaching Entrepreneurship at the university: from the Wrong Building to
the Right Philosophy. Handbooks of Research in Entrepreneurship Education. Vol. 1_
Cheltenham (UK):
6. Edward Edgar. Hippel, E. (2005), Democratizing Innovation: MIT Press.
7. Idibie, P. T. (2004), Organization, Teaching and Evaluation of Home Economics Curriculum
in Nigeria. Warri: COEWA Publishers.
8. Ikegulu, B. O. (1995), The Role and Responsibilities of Key Personnel in the
Implementation of Population and Family Life Programmes in Nigeria. A POP/FLE
Handbook for Classroom Teacher, Lagos: NERDC.
9. Kaka, H. J. and Agwa, S_ I. (2007), Technological Innovations in Dress and Textiles.
Conference Paper Presented at the gtn Annual HERAN Conference.
10. Lemchi, S. N. and Anyakoha, E. N. (2006), Specific Objectives for Entrepreneurship
Education in the NCE Home Economics. Journal of Home Economics Research Association
o NNggeria (HERAN). Vol. 7.
11. Luecke, R. and Katz, R. (2003), Managing Creativity and Innovation. Boston: M. A.
Harvard Business School Press.
12. Nwachukwu, C. C. (1990), The Practice of Entrepreneurship in Nigeria, Onitsha: Africa-Fep
Publisher Ltd.
13. Nwaogwugwu, C. and M.A. Ugiagbe, 2008. Entrepreneurship: Concepts of small business
management. Cape Publishers International Ltd, Abuja.
14. Nwangwu, 1g. O. (2007): Higher education lot seIf-reliance: An imperative for the Nigerian
economy. NEAP publication pg. 1-8.
15. Oduwaiye, R.O., 2005. Entrepreneurship Education in Nigerian Universities: implementation
and Way Forward. Retrieved 20 June, 2010.

International Journal of Information, Business and Management, Vol. 8, No.2, 2016
ISSN 2076-9202
324
16. Obunadike, J. C. (2009), Home Economics Teachers' Perception of Administration Support
for Teaching Creativity in Primary Schools in Anambra State. Journal ofHome Economics
Research. Vol. 10&11.Pp.153-161.
17. Olaitan, S. O. and Agusiobo, O. N. (1981), Introduction to the Teaching of Home Economics,
Toronto: Ajohn Wiley and Sons.
18. Oluwasanya A.T (2011) Entrepreneurship, Concepts, Theories, Values and Contemporary Issues
(First International Edition) Archade Printers Ijebu-ode, Ogun State.
19. Oluwasanya A.T (2014) Entrepreneurship, Concepts, Theories, Values and Contemporary Issues
(Second International Edition) Archade Printers Ijebu-ode, Ogun State.
20. Oluwasanya A.T (2014), Ayodeji. O, Oreoluwa .A, Irenikase k (2014). Dapkol and Associates,
Ilupeju- Lagos
21. Onu, V. C. (2008), Repositioning Nigeria Youths for Economic Empowerment through
Entrepreneurship Education. Journal of Home Economics Research Association of Nigeria
(HERAN). Vol. 9, Pp. 148 - 157.